Budget format template -...
83
Contact details: Elsabé Rossouw National Treasury Tel: (012) 315-5534 Electronic submissions: [email protected] mSCOA Version 6.1 Click for Instructions!
Transcript of Budget format template -...

Contact details:
Elsabé RossouwNational Treasury Tel: (012) 315-5534 Electronic submissions:
mSCOA Version 6.1
Click for Instructions!

2020
MTREF Range:
Name Votes & Sub-Votes
Preparation Instructions
Printing Instructions
Municipality Name:
Budget for MTREF starting: Budget Year:
Does this municipality have Entities?
If YES: Identify type of report:
CFO Name:
Tel:
E-Mail:
Fax:
Showing / Hiding Columns
Showing / Clearing Highlights
Rodderick Ontong
023 348 2660
023 348 4997
Hide Reference columns on all sheets
Hide Pre-audit columns on all sheets
Clear Highlights on all sheets
Important documents which provide essential assistance
MFMA Budget Circulars
Dummy Budget Guide
MBRR Budget Formats Guide
Funding Compliance Guide
MFMA Return Forms
Click to view
Click to view
Click to view
Click to view
Click to view
LGDB Export

Organisational Structure Votes Organisational Structure Sub-Votes Display Sub-VotesVote 1 - Council General Vote 1 Council General
Vote 2 - Municipal Manager 1.1 Admin 1.1 - Admin
Vote 3 - Strategic Support Services 1.2 Mayoral Office 1.2 - Mayoral Office
Vote 4 - Financial Services 1.3
Vote 5 - Community Services 1.4
Vote 6 - Technical Services 1.5
1.6
1.7
1.8
1.9
1.10
Vote 2 Municipal Manager
2.1 Office Support 2.1 - Office Support
2.2 Internal Audit 2.2 - Internal Audit
2.3 Project Management 2.3 - Project Management
2.4 Ombudsman 2.4 - Ombudsman
2.5 Enterprise Risk Management 2.5 - Enterprise Risk Management
2.6 Jobs4U 2.6 - Jobs4U
2.7
2.8
2.9
2.10
Vote 3 Strategic Support Services
3.1 Administration & Support Services 3.1 - Administration & Support Services
3.2 Human Resources 3.2 - Human Resources
3.3 Information Communication Technology 3.3 - Information Communication Technology
3.4 IDP/ PMS/ SDBIP 3.4 - IDP/ PMS/ SDBIP
3.5 Communications & Media Relations 3.5 - Communications & Media Relations
3.6 Local Economic Development 3.6 - Local Economic Development
3.7 Legal Services 3.7 - Legal Services
3.8
3.9
3.10
Vote 4 Financial Services
4.1 Administration 4.1 - Administration
4.2 Revenue 4.2 - Revenue
4.3 Financial Planning 4.3 - Financial Planning
4.4 Supply Chain Management 4.4 - Supply Chain Management
4.5
4.6
4.7
4.8
4.9
4.10
Vote 5 Community Services
5.1 Administration & Support Services 5.1 - Administration & Support Services
5.2 Human Settlements & Housing 5.2 - Human Settlements & Housing
5.3 Libraries 5.3 - Libraries
5.4 Fire Brigade & Disaster Risk Management 5.4 - Fire Brigade & Disaster Risk Management
5.5 Traffic Services 5.5 - Traffic Services
5.6 Municipal Halls and Resorts 5.6 - Municipal Halls and Resorts
5.7 Customer Care Services 5.7 - Customer Care Services
5.8 Sports and Recreation 5.8 - Sports and Recreation
5.9 Health 5.9 - Health
5.10
Vote 6 Technical Services
6.1 Public Works 6.1 - Public Works
6.2 Cemetaries 6.2 - Cemetaries
6.3 Recreational Facilities 6.3 - Recreational Facilities
6.4 Refuse Removal 6.4 - Refuse Removal
6.5 Sewerages 6.5 - Sewerages
6.6 Electricity Management 6.6 - Electricity Management
6.7 Water Management 6.7 - Water Management
6.8
6.9
6.10
Complete Votes & Sub-VotesOrganisational Structure Select Org. Structure

WC025 Breede Valley - Contact Information
A. GENERAL INFORMATION
Municipality WC025 Breede Valley
Grade 4 1 Grade in terms of the Remuneration of Public Office Bearers Act.
Province WC WESTERN CAPE
Web Address www.bvm.gov.za
e-mail Address bvm.gov.za
Postal address:
P.O. Box Private Bag X3046
City / Town Worcester
Postal Code 6849
Street address
Building Civic Building
Street No. & Name Corner of Baring- and High Street
City / Town Worcester
Postal Code 6850
General Contacts
Telephone number 023 348 2600
Fax number 023 348 3852
Speaker:
ID Number 560802 5092 086 ID Number 810409 0135 080
Title Mr Title Mrs
Name N Mercuur Name J Schneider
Telephone number 023 348 2845 Telephone number 023 348 2846
Cell number 071 535 5986 Cell number 071 589 1895
Fax number 023 348 2777 Fax number 023 348 2777
E-mail address [email protected] E-mail address [email protected]
ID Number 740227 0148 081 ID Number 910123 0259 084
Title Mrs Title Mrs
Name A Steyn Name S Koopman
Telephone number 023 348 2841 Telephone number 023 348 2842
Cell number 072 404 6248 Cell number 082 296 8796
Fax number 023 348 2777 Fax number 023 348 2777
E-mail address [email protected] E-mail address [email protected]
ID Number 510523 5040 088 ID Number 700103 0259 080
Title Mr Title Ms
Name JD Levendal Name S Lakey
Telephone number 023 348 2843 Telephone number 023 348 2844
Cell number 072 180 7812 Cell number 064 273 4889
Fax number 023 348 2777 Fax number 023 348 2777
E-mail address [email protected] E-mail address [email protected]
Municipal Manager:
ID Number 630629 5170 083 ID Number 681220 0533 083
Title Mr Title Ms
Name David McThomas Name M Mdabuli
Telephone number 023 348 2800 Telephone number 023 348 2602
Cell number 083 778 9480 Cell number 084 448 2850
Fax number 023 348 3852 Fax number 023 348 3852
E-mail address [email protected] E-mail address [email protected]
Acting Chief Financial Officer
ID Number 691218 5287 083 ID Number 750605 0029 080
Title Mr Title Mrs
Name Rodderick Ontong Name H Kamfer
Telephone number 023 348 2660 Telephone number 023 348 4994
Secretary/PA to the Municipal Manager:
B. CONTACT INFORMATION
C. POLITICAL LEADERSHIP
Secretary/PA to the Speaker:
D. MANAGEMENT LEADERSHIP
Deputy Mayor/Executive Mayor:
Secretary/PA to the Chief Financial Officer
Secretary/PA to the Mayor/Executive Mayor:
Secretary/PA to the Deputy Mayor/Executive Mayor:
Mayor/Executive Mayor:

Cell number 084 678 8816 Cell number 082 694 8146
Fax number 023 348 4997 Fax number 023 348 4997
E-mail address [email protected] E-mail address [email protected]
ID Number 711012 0059 084 ID Number 860325 5078 084
Title Mrs Title Mr
Name B Volschenk Name A Crotz
Telephone number 023 348 4992 Telephone number 023 348 4996
Cell number 082 787 5841 Cell number 076 189 0341
Fax number 023 348 4997 Fax number 023 348 4997
E-mail address [email protected] E-mail address [email protected]
ID Number 870104 0074 085 ID Number
Title Mrs Title
Name H Hansen Name
Telephone number 023 348 4968 Telephone number
Cell number 072 368 6677 Cell number
Fax number 023 348 4997 Fax number
E-mail address [email protected] E-mail address
Official responsible for submitting financial information Official responsible for submitting financial information
Official responsible for submitting financial information Official responsible for submitting financial information

Description 2013/14 2014/15 2015/16
R thousandsAudited
Outcome
Audited
Outcome
Audited
Outcome
Original
Budget
Adjusted
Budget
Full Year
Forecast
Pre-audit
outcome
Budget Year
2017/18
Budget Year
+1 2018/19
Budget Year
+2 2019/20
Financial Performance
Property rates – – – – – – – 137 679 145 526 153 676
Service charges – – – – – – – 546 299 577 438 609 774
Investment revenue – – – – – – – 10 620 11 225 11 854
Transfers recognised - operational – – – – – – – 146 572 189 947 118 836
Other own revenue – – – – – – – 103 317 109 206 115 322
Total Revenue (excluding capital transfers and
contributions)
– – – – – – – 944 486 1 033 342 1 009 461
Employee costs – – – – – – – 299 640 316 047 333 113
Remuneration of councillors – – – – – – – 16 468 17 406 18 381
Depreciation & asset impairment – – – – – – – 81 759 86 420 91 259
Finance charges – – – – – – – 26 116 27 605 29 150
Materials and bulk purchases – – – – – – – 338 621 357 922 377 966
Transfers and grants – – – – – – – 279 295 311
Other expenditure – – – – – – – 198 796 242 250 176 903
Total Expenditure – – – – – – – 961 678 1 047 945 1 027 084
Surplus/(Deficit) – – – – – – – (17 192) (14 603) (17 622)
Transfers and subsidies - capital (monetary allocations) (National / Provincial and District)– – – – – – – 78 839 114 462 –
Contributions recognised - capital & contributed assets – – – – – – – – – – Surplus/(Deficit) after capital transfers &
contributions– – – – – – – 61 647 99 859 (17 622)
Share of surplus/ (deficit) of associate – – – – – – – – – – Surplus/(Deficit) for the year – – – – – – – 61 647 99 859 (17 622)
Capital expenditure & funds sources
Capital expenditure – – – – – – – 154 660 177 041 38 921
Transfers recognised - capital – – – – – – – 78 839 114 462 –
Public contributions & donations – – – – – – – – – –
Borrowing – – – – – – – 10 500 – –
Internally generated funds – – – – – – – 65 321 62 579 38 921
Total sources of capital funds – – – – – – – 154 660 177 041 38 921
Financial position
Total current assets – – – – – – – 238 559 256 717 302 957
Total non current assets – – – – – – – 2 091 103 2 183 082 2 132 247
Total current liabilities – – – – – – – 111 189 111 080 111 585
Total non current liabilities – – – – – – – 444 029 439 977 435 350
Community wealth/Equity – – – – – – – 1 774 444 1 888 742 1 888 269
Cash flows
Net cash from (used) operating – – – – – – – 139 428 184 915 74 474
Net cash from (used) investing – – – – – – – (154 610) (176 991) (38 871)
Net cash from (used) financing – – – – – – – (17 100) (9 327) (10 310)
Cash/cash equivalents at the year end – – – – – – – 82 748 81 346 106 639
Cash backing/surplus reconciliation
Cash and investments available – – – – – – – 82 748 81 346 106 639
Application of cash and investments – – – – – – – (25 800) (50 422) (69 534)
Balance - surplus (shortfall) – – – – – – – 108 549 131 768 176 173
Asset management
Asset register summary (WDV) – – – – – – 2 047 879 2 047 879 2 140 188 2 089 665
Depreciation – – – – – – 81 759 81 759 86 420 91 259
Renewal of Existing Assets – – – – – – – 61 264 47 798 30 063
Repairs and Maintenance – – – – – – 62 469 62 469 66 030 69 728
Free services
Cost of Free Basic Services provided – – – – – – 38 649 38 649 41 002 42 956
Revenue cost of free services provided – – – – – – 37 333 37 333 39 488 41 736
Households below minimum service level
Water: – – – – – – 1 1 1 1
Sanitation/sewerage: – – – – – – 1 1 1 1
Energy: – – – – – – – – – –
Refuse: – – – – – – – – – –
2017/18 Medium Term Revenue & Expenditure
FrameworkCurrent Year 2016/17
WC025 Breede Valley - Table A1 Budget Summary
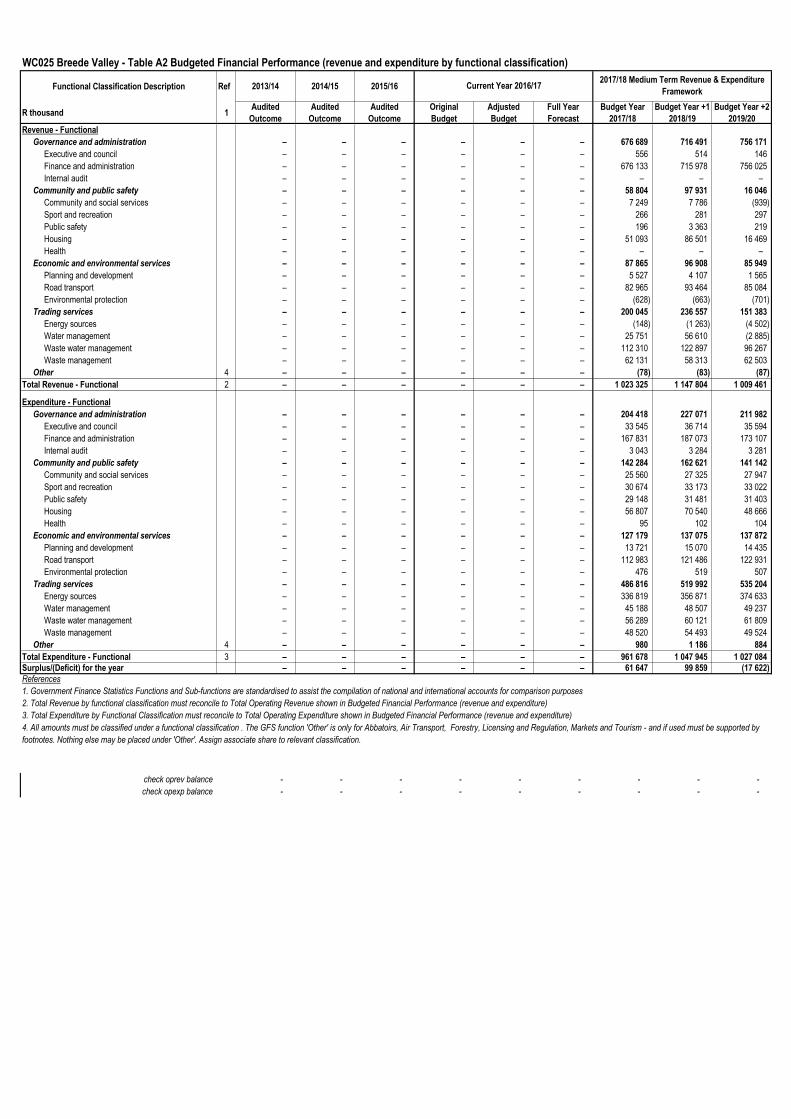
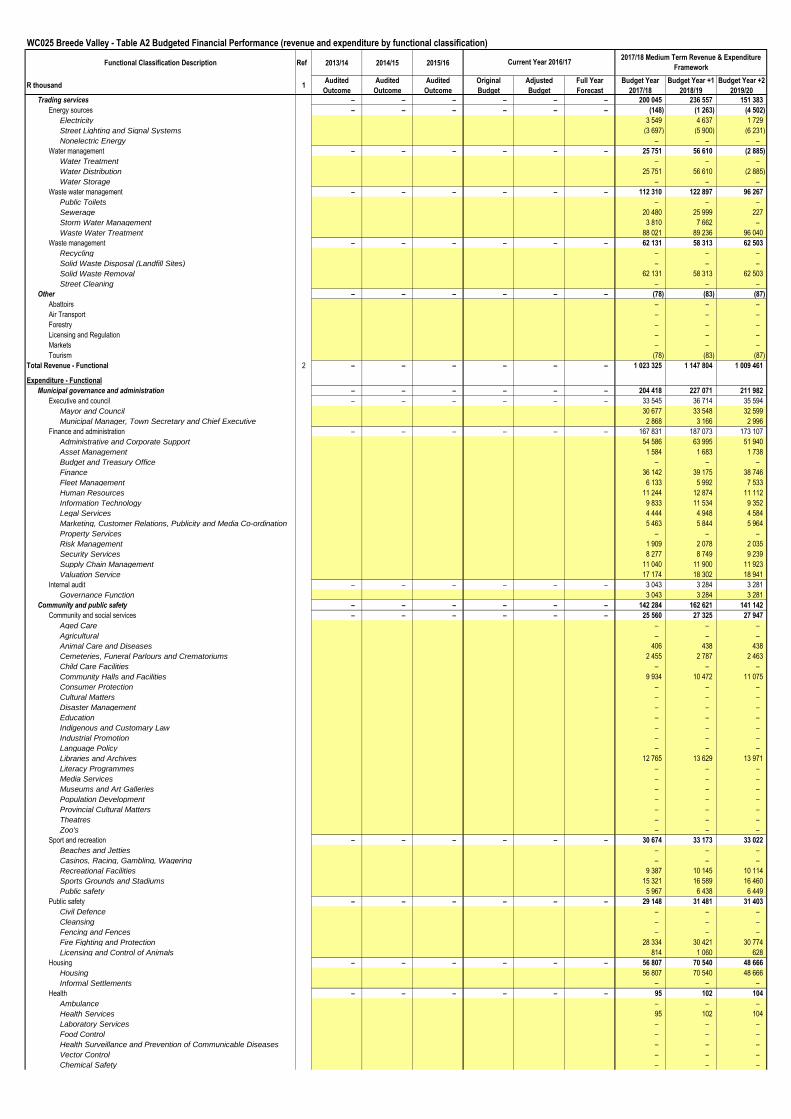
WC025 Breede Valley - Table A2 Budgeted Financial Performance (revenue and expenditure by functional classification)
Functional Classification Description Ref 2013/14 2014/15 2015/16
R thousand 1Audited
Outcome
Audited
Outcome
Audited
Outcome
Original
Budget
Adjusted
Budget
Full Year
Forecast
Budget Year
2017/18
Budget Year +1
2018/19
Budget Year +2
2019/20
Revenue - Functional
Governance and administration – – – – – – 676 689 716 491 756 171
Executive and council – – – – – – 556 514 146
Finance and administration – – – – – – 676 133 715 978 756 025
Internal audit – – – – – – – – –
Community and public safety – – – – – – 58 804 97 931 16 046
Community and social services – – – – – – 7 249 7 786 (939)
Sport and recreation – – – – – – 266 281 297
Public safety – – – – – – 196 3 363 219
Housing – – – – – – 51 093 86 501 16 469
Health – – – – – – – – –
Economic and environmental services – – – – – – 87 865 96 908 85 949
Planning and development – – – – – – 5 527 4 107 1 565
Road transport – – – – – – 82 965 93 464 85 084
Environmental protection – – – – – – (628) (663) (701)
Trading services – – – – – – 200 045 236 557 151 383
Energy sources – – – – – – (148) (1 263) (4 502)
Water management – – – – – – 25 751 56 610 (2 885)
Waste water management – – – – – – 112 310 122 897 96 267
Waste management – – – – – – 62 131 58 313 62 503
Other 4 – – – – – – (78) (83) (87)
Total Revenue - Functional 2 – – – – – – 1 023 325 1 147 804 1 009 461
Expenditure - Functional
Governance and administration – – – – – – 204 418 227 071 211 982
Executive and council – – – – – – 33 545 36 714 35 594
Finance and administration – – – – – – 167 831 187 073 173 107
Internal audit – – – – – – 3 043 3 284 3 281
Community and public safety – – – – – – 142 284 162 621 141 142
Community and social services – – – – – – 25 560 27 325 27 947
Sport and recreation – – – – – – 30 674 33 173 33 022
Public safety – – – – – – 29 148 31 481 31 403
Housing – – – – – – 56 807 70 540 48 666
Health – – – – – – 95 102 104
Economic and environmental services – – – – – – 127 179 137 075 137 872
Planning and development – – – – – – 13 721 15 070 14 435
Road transport – – – – – – 112 983 121 486 122 931
Environmental protection – – – – – – 476 519 507
Trading services – – – – – – 486 816 519 992 535 204
Energy sources – – – – – – 336 819 356 871 374 633
Water management – – – – – – 45 188 48 507 49 237
Waste water management – – – – – – 56 289 60 121 61 809
Waste management – – – – – – 48 520 54 493 49 524
Other 4 – – – – – – 980 1 186 884
Total Expenditure - Functional 3 – – – – – – 961 678 1 047 945 1 027 084
Surplus/(Deficit) for the year – – – – – – 61 647 99 859 (17 622)
References
1. Government Finance Statistics Functions and Sub-functions are standardised to assist the compilation of national and international accounts for comparison purposes
2. Total Revenue by functional classification must reconcile to Total Operating Revenue shown in Budgeted Financial Performance (revenue and expenditure)
3. Total Expenditure by Functional Classification must reconcile to Total Operating Expenditure shown in Budgeted Financial Performance (revenue and expenditure)
check oprev balance - - - - - - - - -
check opexp balance - - - - - - - - -
4. All amounts must be classified under a functional classification . The GFS function 'Other' is only for Abbatoirs, Air Transport, Forestry, Licensing and Regulation, Markets and Tourism - and if used must be supported by
footnotes. Nothing else may be placed under 'Other'. Assign associate share to relevant classification.
Current Year 2016/172017/18 Medium Term Revenue & Expenditure
Framework

WC025 Breede Valley - Table A2 Budgeted Financial Performance (revenue and expenditure by functional classification)
Functional Classification Description Ref 2013/14 2014/15 2015/16
R thousand 1Audited
Outcome
Audited
Outcome
Audited
Outcome
Original
Budget
Adjusted
Budget
Full Year
Forecast
Budget Year
2017/18
Budget Year +1
2018/19
Budget Year +2
2019/20
Revenue - Functional
Municipal governance and administration – – – – – – 676 689 716 491 756 171
Executive and council – – – – – – 556 514 146
Mayor and Council 131 139 146
Municipal Manager, Town Secretary and Chief Executive 425 375 –
Finance and administration – – – – – – 676 133 715 978 756 025
Administrative and Corporate Support 521 608 552 349 583 557
Asset Management – – –
Budget and Treasury Office – – –
Finance 3 123 3 301 3 486
Fleet Management 1 126 1 190 1 257
Human Resources 1 241 1 249 157
Information Technology 2 2 3
Legal Services – – –
Marketing, Customer Relations, Publicity and Media Co-ordination – – –
Property Services – – –
Risk Management – – –
Security Services – – –
Supply Chain Management 135 143 151
Valuation Service 148 898 157 744 167 414
Internal audit – – – – – – – – –
Governance Function – – –
Community and public safety – – – – – – 58 804 97 931 16 046
Community and social services – – – – – – 7 249 7 786 (939)
Aged Care – – –
Agricultural – – –
Animal Care and Diseases – – –
Cemeteries, Funeral Parlours and Crematoriums 745 788 832
Child Care Facilities – – –
Community Halls and Facilities (1 128) (1 092) (1 259)
Consumer Protection – – –
Cultural Matters – – –
Disaster Management – – –
Education – – –
Indigenous and Customary Law – – –
Industrial Promotion – – –
Language Policy – – –
Libraries and Archives 7 632 8 091 (512)
Literacy Programmes – – –
Media Services – – –
Museums and Art Galleries – – –
Population Development – – –
Provincial Cultural Matters – – –
Theatres – – –
Zoo's – – –
Sport and recreation – – – – – – 266 281 297
Beaches and Jetties – – –
Casinos, Racing, Gambling, Wagering – – –
Community Parks (including Nurseries) (2 277) (2 406) (2 541)
Recreational Facilities 2 915 3 081 3 253
Sports Grounds and Stadiums (372) (393) (415)
Public safety – – – – – – 196 3 363 219
Civil Defence – – –
Cleansing – – –
Control of Public Nuisances – – –
Fencing and Fences – – –
Fire Fighting and Protection 196 3 363 219
Licensing and Control of Animals – – –
Housing – – – – – – 51 093 86 501 16 469
Housing 51 093 86 501 16 469
Informal Settlements – – –
Health – – – – – – – – –
Ambulance – – –
Health Services – – –
Laboratory Services – – –
Food Control – – –
Health Surveillance and Prevention of Communicable Diseases – – –
Vector Control – – –
Chemical Safety – – –
Economic and environmental services – – – – – – 87 865 96 908 85 949
Planning and development – – – – – – 5 527 4 107 1 565
Billboards – – –
Corporate Wide Strategic Planning (IDPs, LEDs) (22) (23) (25)
Central City Improvement District – – –
Development Facilitation – – –
Economic Development/Planning – – –
Regional Planning and Development – – –
Town Planning, Building Regulations and Enforcement, and City 1 424 1 505 1 590
Project Management Unit 4 125 2 625 –
Provincial Planning – – –
Support to Local Municipalities – – –
Road transport – – – – – – 82 965 93 464 85 084
Police Forces, Traffic and Street Parking Control 73 429 77 614 81 961
Pounds – – –
Public Transport – – –
Road and Traffic Regulation 2 761 2 919 3 082
Roads 6 775 12 931 42
Taxi Ranks – – –
Environmental protection – – – – – – (628) (663) (701)
Biodiversity and Landscape (628) (663) (701)
Coastal Protection – – –
Indigenous Forests – – –
Nature Conservation – – –
Pollution Control – – –
Soil Conservation – – –
Current Year 2016/172017/18 Medium Term Revenue & Expenditure
Framework
WC025 Breede Valley - Table A2 Budgeted Financial Performance (revenue and expenditure by functional classification)
Functional Classification Description Ref 2013/14 2014/15 2015/16
R thousand 1Audited
Outcome
Audited
Outcome
Audited
Outcome
Original
Budget
Adjusted
Budget
Full Year
Forecast
Budget Year
2017/18
Budget Year +1
2018/19
Budget Year +2
2019/20
Current Year 2016/172017/18 Medium Term Revenue & Expenditure
Framework
Trading services – – – – – – 200 045 236 557 151 383
Energy sources – – – – – – (148) (1 263) (4 502)
Electricity 3 549 4 637 1 729
Street Lighting and Signal Systems (3 697) (5 900) (6 231)
Nonelectric Energy – – –
Water management – – – – – – 25 751 56 610 (2 885)
Water Treatment – – –
Water Distribution 25 751 56 610 (2 885)
Water Storage – – –
Waste water management – – – – – – 112 310 122 897 96 267
Public Toilets – – –
Sewerage 20 480 25 999 227
Storm Water Management 3 810 7 662 –
Waste Water Treatment 88 021 89 236 96 040
Waste management – – – – – – 62 131 58 313 62 503
Recycling – – –
Solid Waste Disposal (Landfill Sites) – – –
Solid Waste Removal 62 131 58 313 62 503
Street Cleaning – – –
Other – – – – – – (78) (83) (87)
Abattoirs – – –
Air Transport – – –
Forestry – – –
Licensing and Regulation – – –
Markets – – –
Tourism (78) (83) (87)
Total Revenue - Functional 2 – – – – – – 1 023 325 1 147 804 1 009 461
Expenditure - Functional
Municipal governance and administration – – – – – – 204 418 227 071 211 982
Executive and council – – – – – – 33 545 36 714 35 594
Mayor and Council 30 677 33 548 32 599
Municipal Manager, Town Secretary and Chief Executive 2 868 3 166 2 996
Finance and administration – – – – – – 167 831 187 073 173 107
Administrative and Corporate Support 54 586 63 995 51 940
Asset Management 1 584 1 683 1 738
Budget and Treasury Office – – –
Finance 36 142 39 175 38 746
Fleet Management 6 133 5 992 7 533
Human Resources 11 244 12 874 11 112
Information Technology 9 833 11 534 9 352
Legal Services 4 444 4 948 4 584
Marketing, Customer Relations, Publicity and Media Co-ordination 5 463 5 844 5 964
Property Services – – –
Risk Management 1 909 2 078 2 035
Security Services 8 277 8 749 9 239
Supply Chain Management 11 040 11 900 11 923
Valuation Service 17 174 18 302 18 941
Internal audit – – – – – – 3 043 3 284 3 281
Governance Function 3 043 3 284 3 281
Community and public safety – – – – – – 142 284 162 621 141 142
Community and social services – – – – – – 25 560 27 325 27 947
Aged Care – – –
Agricultural – – –
Animal Care and Diseases 406 438 438
Cemeteries, Funeral Parlours and Crematoriums 2 455 2 787 2 463
Child Care Facilities – – –
Community Halls and Facilities 9 934 10 472 11 075
Consumer Protection – – –
Cultural Matters – – –
Disaster Management – – –
Education – – –
Indigenous and Customary Law – – –
Industrial Promotion – – –
Language Policy – – –
Libraries and Archives 12 765 13 629 13 971
Literacy Programmes – – –
Media Services – – –
Museums and Art Galleries – – –
Population Development – – –
Provincial Cultural Matters – – –
Theatres – – –
Zoo's – – –
Sport and recreation – – – – – – 30 674 33 173 33 022
Beaches and Jetties – – –
Casinos, Racing, Gambling, Wagering – – –
Recreational Facilities 9 387 10 145 10 114
Sports Grounds and Stadiums 15 321 16 589 16 460
Public safety 5 967 6 438 6 449
Public safety – – – – – – 29 148 31 481 31 403
Civil Defence – – –
Cleansing – – –
Fencing and Fences – – –
Fire Fighting and Protection 28 334 30 421 30 774
Licensing and Control of Animals 814 1 060 628
Housing – – – – – – 56 807 70 540 48 666
Housing 56 807 70 540 48 666
Informal Settlements – – –
Health – – – – – – 95 102 104
Ambulance – – –
Health Services 95 102 104
Laboratory Services – – –
Food Control – – –
Health Surveillance and Prevention of Communicable Diseases – – –
Vector Control – – –
Chemical Safety – – –

WC025 Breede Valley - Table A2 Budgeted Financial Performance (revenue and expenditure by functional classification)
Functional Classification Description Ref 2013/14 2014/15 2015/16
R thousand 1Audited
Outcome
Audited
Outcome
Audited
Outcome
Original
Budget
Adjusted
Budget
Full Year
Forecast
Budget Year
2017/18
Budget Year +1
2018/19
Budget Year +2
2019/20
Current Year 2016/172017/18 Medium Term Revenue & Expenditure
Framework
Economic and environmental services – – – – – – 127 179 137 075 137 872
Planning and development – – – – – – 13 721 15 070 14 435
Billboards – – –
Corporate Wide Strategic Planning (IDPs, LEDs) 5 611 6 456 5 501
Central City Improvement District – – –
Development Facilitation – – –
Economic Development/Planning – – –
Regional Planning and Development – – –
Town Planning, Building Regulations and Enforcement, and City 7 338 7 795 8 083
Project Management Unit 772 819 851
Provincial Planning – – –
Support to Local Municipalities – – –
Road transport – – – – – – 112 983 121 486 122 931
Police Forces, Traffic and Street Parking Control 57 899 62 355 62 887
Pounds – – –
Public Transport – – –
Roads 17 276 18 992 18 159
Taxi Ranks 37 808 40 139 41 885
Environmental protection – – –
Environmental protection – – – – – – 476 519 507
Biodiversity and Landscape 476 519 507
Coastal Protection – – –
Indigenous Forests – – –
Nature Conservation – – –
Pollution Control – – –
Soil Conservation – – –
Trading services – – – – – – 486 816 519 992 535 204
Energy sources – – – – – – 336 819 356 871 374 633
Electricity 332 594 352 359 369 980
Street Lighting and Signal Systems 4 226 4 512 4 653
Nonelectric Energy – – –
Water management – – – – – – 45 188 48 507 49 237
Water Treatment – – –
Water Distribution 45 188 48 507 49 237
Water Storage – – –
Waste water management – – – – – – 56 289 60 121 61 809
Public Toilets 2 723 2 912 2 974
Sewerage 12 906 13 717 14 270
Storm Water Management 3 152 3 331 3 517
Waste Water Treatment 37 509 40 161 41 048
Waste management – – – – – – 48 520 54 493 49 524
Recycling – – –
Solid Waste Disposal (Landfill Sites) 18 439 20 609 19 006
Solid Waste Removal 30 081 33 884 30 518
Street Cleaning – – –
Other – – – – – – 980 1 186 884
Abattoirs – – –
Air Transport 133 142 148
Forestry – – –
Licensing and Regulation – – –
Markets – – –
Tourism 847 1 044 737
Total Expenditure - Functional 3 – – – – – – 961 678 1 047 945 1 027 084
Surplus/(Deficit) for the year – – – – – – 61 647 99 859 (17 622)
References
1. Government Finance Statistics Functions and Sub-functions are standardised to assist national and international accounts and comparison
2. Total Revenue by Functional Classification must reconcile to total operating revenue shown in Financial Performance (revenue and expenditure)
3. Total Expenditure by Functional Classification must reconcile to total operating expenditure shown in Financial Performance (revenue and expenditure)
check oprev balance - - - - - - - - -
check opexp balance - - - - - - - - -
4. All amounts must be classified under a Functional classification. The GFS function 'Other' is only for Abbatoirs, Air Transport, Forestry, Licensing and Regulation, Markets and Tourism - and if used must be supported by footnotes. Nothing else may be placed
under 'Other'. Assign associate share to relevant classification

WC025 Breede Valley - Table A3 Budgeted Financial Performance (revenue and expenditure by municipal vote)
Vote Description Ref 2013/14 2014/15 2015/16
R thousandAudited
Outcome
Audited
Outcome
Audited
Outcome
Original
Budget
Adjusted
Budget
Full Year
Forecast
Budget Year
2017/18
Budget Year +1
2018/19
Budget Year +2
2019/20
Revenue by Vote 1
Vote 1 - Council General – – – – – – 131 139 146
Vote 2 - Municipal Manager – – – – – – 4 550 3 000 –
Vote 3 - Strategic Support Services – – – – – – (64) (130) (1 299)
Vote 4 - Financial Services – – – – – – 182 639 193 873 204 662
Vote 5 - Community Services – – – – – – 138 280 181 931 104 652
Vote 6 - Technical Services – – – – – – 697 788 768 991 701 300
0 – – – – – – – – –
0 – – – – – – – – –
0 – – – – – – – – –
0 – – – – – – – – –
0 – – – – – – – – –
0 – – – – – – – – –
0 – – – – – – – – –
0 – – – – – – – – –
0 – – – – – – – – –
Total Revenue by Vote 2 – – – – – – 1 023 325 1 147 804 1 009 461
Expenditure by Vote to be appropriated 1
Vote 1 - Council General – – – – – – 29 961 31 669 33 443
Vote 2 - Municipal Manager – – – – – – 9 489 9 956 10 118
Vote 3 - Strategic Support Services – – – – – – 54 570 57 618 59 683
Vote 4 - Financial Services – – – – – – 76 795 81 202 83 732
Vote 5 - Community Services – – – – – – 208 163 252 236 190 389
Vote 6 - Technical Services – – – – – – 582 699 615 264 649 720
0 – – – – – – – – –
0 – – – – – – – – –
0 – – – – – – – – –
0 – – – – – – – – –
0 – – – – – – – – –
0 – – – – – – – – –
0 – – – – – – – – –
0 – – – – – – – – –
0 – – – – – – – – –
Total Expenditure by Vote 2 – – – – – – 961 678 1 047 945 1 027 084 Surplus/(Deficit) for the year 2 – – – – – – 61 647 99 859 (17 622)
References
1. Insert 'Vote'; e.g. department, if different to functional classification structure
2. Must reconcile to Budgeted Financial Performance (revenue and expenditure)
3. Assign share in 'associate' to relevant Vote
check Surplus/(Deficit) for the year - - - - - - - - -
Current Year 2016/172017/18 Medium Term Revenue & Expenditure
Framework

WC025 Breede Valley - Table A3 Budgeted Financial Performance (revenue and expenditure by municipal vote)A
Vote Description Ref 2013/14 2014/15 2015/16
R thousandAudited
Outcome
Audited
Outcome
Audited
Outcome
Original
Budget
Adjusted
Budget
Full Year
Forecast
Budget Year
2017/18
Budget Year +1
2018/19
Budget Year +2
2019/20
Revenue by Vote 1
Vote 1 - Council General – – – – – – 131 139 146
1.1 - Admin 131 139 146
1.2 - Mayoral Office – – –
Vote 2 - Municipal Manager – – – – – – 4 550 3 000 –
2.1 - Office Support 425 375 –
2.2 - Internal Audit – – –
2.3 - Project Management 4 125 2 625 –
2.4 - Ombudsman – – –
2.5 - Enterprise Risk Management – – –
2.6 - Jobs4U – – –
Vote 3 - Strategic Support Services – – – – – – (64) (130) (1 299)
3.1 - Administration & Support Services (1 207) (1 275) (1 347)
3.2 - Human Resources 1 241 1 249 157
3.3 - Information Communication Technology 2 2 3
3.4 - IDP/ PMS/ SDBIP (22) (23) (25)
3.5 - Communications & Media Relations – – –
3.6 - Local Economic Development (78) (83) (87)
3.7 - Legal Services – – –
Vote 4 - Financial Services – – – – – – 182 639 193 873 204 662
4.1 - Administration 30 419 32 618 33 539
4.2 - Revenue 150 677 159 624 169 400
4.3 - Financial Planning 1 506 1 592 1 681
4.4 - Supply Chain Management 37 39 42
Vote 5 - Community Services – – – – – – 138 280 181 931 104 652
5.1 - Administration & Support Services 94 94 –
5.2 - Human Settlements & Housing 51 195 86 608 16 583
5.3 - Libraries 7 632 8 091 (512)
5.4 - Fire Brigade & Disaster Risk Management 196 3 363 219
5.5 - Traffic Services 76 190 80 533 85 043
5.6 - Municipal Halls and Resorts 3 187 3 469 3 558
5.7 - Customer Care Services – – –
5.8 - Sports and Recreation (215) (227) (240)
5.9 - Health – – –
Vote 6 - Technical Services – – – – – – 697 788 768 991 701 300
6.1 - Public Works 10 560 18 574 (2 091)
6.2 - Cemetaries 745 788 832
6.3 - Recreational Facilities (2 537) (2 682) (2 832)
6.4 - Refuse Removal 62 131 58 313 62 503
6.5 - Sewerages 108 500 115 235 96 267
6.6 - Electricity Management 410 168 434 578 456 085
6.7 - Water Management 108 221 144 185 90 536
Total Revenue by Vote 2 – – – – – – 1 023 325 1 147 804 1 009 461
Current Year 2016/172017/18 Medium Term Revenue & Expenditure
Framework

WC025 Breede Valley - Table A3 Budgeted Financial Performance (revenue and expenditure by municipal vote)A
Vote Description Ref 2013/14 2014/15 2015/16
R thousandAudited
Outcome
Audited
Outcome
Audited
Outcome
Original
Budget
Adjusted
Budget
Full Year
Forecast
Budget Year
2017/18
Budget Year +1
2018/19
Budget Year +2
2019/20
Current Year 2016/172017/18 Medium Term Revenue & Expenditure
Framework
Expenditure by Vote 1
Vote 1 - Council General – – – – – – 29 961 31 669 33 443
1.1 - Admin 19 019 20 103 21 228
1.2 - Mayoral Office 10 943 11 567 12 214
Vote 2 - Municipal Manager – – – – – – 9 489 9 956 10 118
2.1 - Office Support 2 868 2 957 2 727
2.2 - Internal Audit 3 043 3 216 3 396
2.3 - Project Management 771 815 861
2.4 - Ombudsman 0 1 1
2.5 - Enterprise Risk Management 2 709 2 864 3 024
2.6 - Jobs4U 97 103 109
Vote 3 - Strategic Support Services – – – – – – 54 570 57 618 59 683
3.1 - Administration & Support Services 21 058 22 258 23 505
3.2 - Human Resources 11 244 11 823 11 323
3.3 - Information Communication Technology 9 824 10 384 10 966
3.4 - IDP/ PMS/ SDBIP 1 560 1 649 1 741
3.5 - Communications & Media Relations 2 341 2 474 2 613
3.6 - Local Economic Development 4 098 4 332 4 575
3.7 - Legal Services 4 444 4 697 4 961
Vote 4 - Financial Services – – – – – – 76 795 81 202 83 732
4.1 - Administration 12 512 13 254 11 979
4.2 - Revenue 39 142 41 373 43 690
4.3 - Financial Planning 9 873 10 435 11 020
4.4 - Supply Chain Management 15 269 16 140 17 044
Vote 5 - Community Services – – – – – – 208 163 252 236 190 389
5.1 - Administration & Support Services 9 272 9 795 10 245
5.2 - Human Settlements & Housing 56 834 92 186 21 580
5.3 - Libraries 12 765 13 493 14 249
5.4 - Fire Brigade & Disaster Risk Management 28 334 29 949 31 626
5.5 - Traffic Services 75 989 80 320 84 818
5.6 - Municipal Halls and Resorts 8 288 8 860 9 251
5.7 - Customer Care Services 3 106 3 283 3 466
5.8 - Sports and Recreation 13 481 14 249 15 047
5.9 - Health 95 101 106
Vote 6 - Technical Services – – – – – – 582 699 615 264 649 720
6.1 - Public Works 76 070 79 802 84 271
6.2 - Cemetaries 2 455 2 595 2 740
6.3 - Recreational Facilities 7 741 8 182 8 640
6.4 - Refuse Removal 51 243 54 164 57 197
6.5 - Sewerages 50 418 53 292 56 276
6.6 - Electricity Management 344 615 364 214 384 610
6.7 - Water Management 50 157 53 016 55 985
Total Expenditure by Vote 2 – – – – – – 961 678 1 047 945 1 027 084
Surplus/(Deficit) for the year 2 – – – – – – 61 647 99 859 (17 622)
References
check revenue - - - - - - - - -
check expenditure - - - - - - - - -

WC025 Breede Valley - Table A4 Budgeted Financial Performance (revenue and expenditure)
Description Ref 2013/14 2014/15 2015/16
R thousand 1Audited
Outcome
Audited
Outcome
Audited
Outcome
Original
Budget
Adjusted
Budget
Full Year
Forecast
Pre-audit
outcome
Budget Year
2017/18
Budget Year +1
2018/19
Budget Year +2
2019/20
Revenue By Source
Property rates 2 – – – – – – – 137 679 145 526 153 676
Service charges - electricity revenue 2 – – – – – – – 400 316 423 134 446 830
Service charges - water revenue 2 – – – – – – – 65 274 68 995 72 859
Service charges - sanitation revenue 2 – – – – – – – 57 393 60 664 64 061
Service charges - refuse revenue 2 – – – – – – – 41 015 43 352 45 780
Service charges - other (17 700) (18 709) (19 756)
Rental of facilities and equipment 14 492 15 318 16 176
Interest earned - external investments 10 620 11 225 11 854
Interest earned - outstanding debtors 3 009 3 181 3 359
Dividends received – – –
Fines, penalties and forfeits 67 244 71 077 75 057
Licences and permits 3 173 3 353 3 541
Agency services 7 373 7 793 8 229
Transfers and subsidies 146 572 189 947 118 836
Other revenue 2 – – – – – – – 6 900 7 294 7 702
Gains on disposal of PPE 1 126 1 190 1 257
Total Revenue (excluding capital transfers and
contributions)
– – – – – – – 944 486 1 033 342 1 009 461
Expenditure By Type
Employee related costs 2 – – – – – – – 299 640 316 047 333 113
Remuneration of councillors 16 468 17 406 18 381
Debt impairment 3 55 626 58 797 62 090
Depreciation & asset impairment 2 – – – – – – – 81 759 86 420 91 259
Finance charges 26 116 27 605 29 150
Bulk purchases 2 – – – – – – – 276 151 291 892 308 238
Other materials 8 62 469 66 030 69 728
Contracted services – – – – – – – 9 366 9 900 10 455
Transfers and subsidies – – – – – – – 279 295 311
Other expenditure 4, 5 – – – – – – – 130 678 170 249 100 870
Loss on disposal of PPE 3 125 3 304 3 489
Total Expenditure – – – – – – – 961 678 1 047 945 1 027 084
Surplus/(Deficit) – – – – – – – (17 192) (14 603) (17 622)
Transfers and subsidies - capital (monetary
allocations) (National / Provincial and District) 78 839 114 462 – Transfers and subsidies - capital (monetary
allocations) (National / Provincial Departmental
Agencies, Households, Non-profit Institutions, Private
Enterprises, Public Corporatons, Higher Educational
Institutions) 6 – – – – – – – – – –
Transfers and subsidies - capital (in-kind - all) – – – Surplus/(Deficit) after capital transfers &
contributions– – – – – – – 61 647 99 859 (17 622)
Taxation – – –
Surplus/(Deficit) after taxation – – – – – – – 61 647 99 859 (17 622)
Attributable to minorities – – – Surplus/(Deficit) attributable to municipality – – – – – – – 61 647 99 859 (17 622)
Share of surplus/ (deficit) of associate 7 – – – Surplus/(Deficit) for the year – – – – – – – 61 647 99 859 (17 622)
References
1. Classifications are revenue sources and expenditure type
2. Detail to be provided in Table SA1
3. Previously described as 'bad or doubtful debts' - amounts shown should reflect the change in the provision for debt impairment
4. Expenditure type components previously shown under repairs and maintenance should be allocated back to the originating expenditure group/item; e.g. employee costs
5. Repairs & maintenance detailed in Table A9 and Table SA34c
6. Contributions are funds provided by external organisations to assist with infrastructure development; e.g. developer contributions (detail to be provided in Table SA1)
7. Equity method ( Includes Joint Ventures)
8. All materials not part of 'bulk' e.g road making materials, pipe, cable etc.
check balance - - - - - - 0 - -
Total revenue 1 023 325 1 147 804 1 009 461
2017/18 Medium Term Revenue & Expenditure
FrameworkCurrent Year 2016/17

WC025 Breede Valley - Table A5 Budgeted Capital Expenditure by vote, functional classification and funding
Vote Description Ref 2013/14 2014/15 2015/16
R thousand 1Audited
Outcome
Audited
Outcome
Audited
Outcome
Original
Budget
Adjusted
Budget
Full Year
Forecast
Pre-audit
outcome
Budget Year
2017/18
Budget Year +1
2018/19
Budget Year +2
2019/20Capital expenditure - Vote
Multi-year expenditure to be appropriated 2
Vote 1 - Council General – – – – – – – – – –
Vote 2 - Municipal Manager – – – – – – – – – –
Vote 3 - Strategic Support Services – – – – – – – – – –
Vote 4 - Financial Services – – – – – – – – – –
Vote 5 - Community Services – – – – – – – – – –
Vote 6 - Technical Services – – – – – – – – – –
0 – – – – – – – – – –
0 – – – – – – – – – –
0 – – – – – – – – – –
0 – – – – – – – – – –
0 – – – – – – – – – –
0 – – – – – – – – – –
0 – – – – – – – – – –
0 – – – – – – – – – –
0 – – – – – – – – – –
Capital multi-year expenditure sub-total 7 – – – – – – – – – –
Single-year expenditure to be appropriated 2
Vote 1 - Council General – – – – – – – 5 – –
Vote 2 - Municipal Manager – – – – – – – 4 130 2 625 –
Vote 3 - Strategic Support Services – – – – – – – 6 320 7 913 3 813
Vote 4 - Financial Services – – – – – – – 805 800 800
Vote 5 - Community Services – – – – – – – 9 693 12 897 2 785
Vote 6 - Technical Services – – – – – – – 133 707 152 806 31 524
0 – – – – – – – – – –
0 – – – – – – – – – –
0 – – – – – – – – – –
0 – – – – – – – – – –
0 – – – – – – – – – –
0 – – – – – – – – – –
0 – – – – – – – – – –
0 – – – – – – – – – –
0 – – – – – – – – – –
Capital single-year expenditure sub-total – – – – – – – 154 660 177 041 38 921
Total Capital Expenditure - Vote – – – – – – – 154 660 177 041 38 921
Capital Expenditure - Functional
Governance and administration – – – – – – – 11 560 11 638 4 913
Executive and council 15 – –
Finance and administration 805 800 800
Internal audit 10 740 10 838 4 113
Community and public safety – – – – – – – 13 678 13 497 3 385
Community and social services 660 – 30
Sport and recreation 1 740 600 755
Public safety 11 278 12 897 2 600
Housing – – –
Health – – –
Economic and environmental services – – – – – – – 7 988 23 892 3 000
Planning and development – – –
Road transport 7 988 23 892 3 000
Environmental protection – – –
Trading services – – – – – – – 121 434 128 014 27 624
Energy sources 32 757 19 831 15 335
Water management 28 551 63 107 241
Waste water management 43 683 42 176 9 298
Waste management 16 443 2 900 2 750
Other – – –
Total Capital Expenditure - Functional 3 – – – – – – – 154 660 177 041 38 921
Funded by:
National Government 37 214 40 087 –
Provincial Government 41 625 74 375 –
District Municipality – – –
Other transfers and grants – – –
Transfers recognised - capital 4 – – – – – – – 78 839 114 462 –
Public contributions & donations 5 – – –
Borrowing 6 10 500 – –
Internally generated funds 65 321 62 579 38 921
Total Capital Funding 7 – – – – – – – 154 660 177 041 38 921
References
1. Municipalities may choose to appropriate for capital expenditure for three years or for one year (if one year appropriation projected expenditure required for yr2 and yr3).
5. Must reconcile to Budgeted Financial Performance (revenue and expenditure)
6. Include finance leases and PPP capital funding component of unitary payment - total borrowing/repayments to reconcile to changes in Table SA17
7. Total Capital Funding must balance with Total Capital Expenditure
check balance - - - - - - - - - -
2017/18 Medium Term Revenue & Expenditure
FrameworkCurrent Year 2016/17
8. Include any capitalised interest (MFMA section 46) as part of relevant capital budget
3. Capital expenditure by functional classification must reconcile to the appropriations by vote
2. Include capital component of PPP unitary payment. Note that capital transfers are only appropriated to municipalities for the budget year
4. Must reconcile to supporting table SA20 and to Budgeted Financial Performance (revenue and expenditure)

WC025 Breede Valley - Table A5 Budgeted Capital Expenditure by vote, functional classification and funding
Vote Description Ref 2013/14 2014/15 2015/16
R thousand 1Audited
Outcome
Audited
Outcome
Audited
Outcome
Original
Budget
Adjusted
Budget
Full Year
Forecast
Pre-audit
outcome
Budget Year
2017/18
Budget Year +1
2018/19
Budget Year +2
2019/20
Capital expenditure - Municipal Vote
Single-year expenditure appropriation 2
Vote 1 - Council General – – – – – – – 5 – –
1.1 - Admin – – –
1.2 - Mayoral Office 5 – –
Vote 2 - Municipal Manager – – – – – – – 4 130 2 625 –
2.1 - Office Support 5 – –
2.2 - Internal Audit – – –
2.3 - Project Management 4 125 2 625 –
2.4 - Ombudsman – – –
2.5 - Enterprise Risk Management – – –
2.6 - Jobs4U – – –
Vote 3 - Strategic Support Services – – – – – – – 6 320 7 913 3 813
3.1 - Administration & Support Services 5 – –
3.2 - Human Resources 350 – –
3.3 - Information Communication Technology 5 965 7 913 3 813
3.4 - IDP/ PMS/ SDBIP – – –
3.5 - Communications & Media Relations – – –
3.6 - Local Economic Development – – –
3.7 - Legal Services – – –
Vote 4 - Financial Services – – – – – – – 805 800 800
4.1 - Administration 5 – –
4.2 - Revenue – – –
4.3 - Financial Planning 800 800 800
4.4 - Supply Chain Management
Vote 5 - Community Services – – – – – – – 9 693 12 897 2 785
5.1 - Administration & Support Services 5 – –
5.2 - Human Settlements & Housing – – –
5.3 - Libraries 655 – 30
5.4 - Fire Brigade & Disaster Risk Management 7 893 12 897 2 600
5.5 - Traffic Services – – –
5.6 - Municipal Halls and Resorts – – –
5.7 - Customer Care Services – – –
5.8 - Sports and Recreation 1 140 – 155
5.9 - Health – – –
Vote 6 - Technical Services – – – – – – – 133 707 152 806 31 524
6.1 - Public Works 21 268 38 054 10 100
6.2 - Cemetaries – – –
6.3 - Recreational Facilities 600 600 600
6.4 - Refuse Removal 16 443 2 900 2 750
6.5 - Sewerages 34 088 28 314 2 498
6.6 - Electricity Management 32 757 19 831 15 335
6.7 - Water Management 28 551 63 107 241
– – – – – – – – – –
Capital single-year expenditure sub-total – – – – – – – 154 660 177 041 38 921
Total Capital Expenditure – – – – – – – 154 660 177 041 38 921
Current Year 2016/172017/18 Medium Term Revenue & Expenditure
Framework

WC025 Breede Valley - Table A6 Budgeted Financial Position
Description Ref 2013/14 2014/15 2015/16
R thousandAudited
Outcome
Audited
Outcome
Audited
Outcome
Original
Budget
Adjusted
Budget
Full Year
Forecast
Pre-audit
outcome
Budget Year
2017/18
Budget Year +1
2018/19
Budget Year +2
2019/20
ASSETS
Current assets
Cash 47 748 46 346 71 639
Call investment deposits 1 – – – – – – – 35 000 35 000 35 000
Consumer debtors 1 – – – – – – – 100 743 124 212 148 996
Other debtors 34 926 29 926 24 926
Current portion of long-term receivables 1 164 1 105 1 050
Inventory 2 18 978 20 127 21 346
Total current assets – – – – – – – 238 559 256 717 302 957
Non current assets
Long-term receivables 6 593 6 264 5 951
Investments – – –
Investment property 22 395 24 084 25 899
Investment in Associate – – –
Property, plant and equipment 3 – – – – – – – 2 020 629 2 111 764 2 059 968
Agricultural – – –
Biological – – –
Intangible 4 854 4 340 3 798
Other non-current assets 36 631 36 631 36 631
Total non current assets – – – – – – – 2 091 103 2 183 082 2 132 247
TOTAL ASSETS – – – – – – – 2 329 662 2 439 800 2 435 204
LIABILITIES
Current liabilities
Bank overdraft 1 – – –
Borrowing 4 – – – – – – – 9 427 10 410 11 702
Consumer deposits 4 448 4 889 5 374
Trade and other payables 4 – – – – – – – 68 073 64 786 61 653
Provisions 29 241 30 996 32 855
Total current liabilities – – – – – – – 111 189 111 080 111 585
Non current liabilities
Borrowing – – – – – – – 214 291 203 881 192 179
Provisions – – – – – – – 229 738 236 096 243 171
Total non current liabilities – – – – – – – 444 029 439 977 435 350
TOTAL LIABILITIES – – – – – – – 555 218 551 057 546 935
NET ASSETS 5 – – – – – – – 1 774 444 1 888 742 1 888 269
COMMUNITY WEALTH/EQUITY
Accumulated Surplus/(Deficit) 1 774 444 1 888 742 1 888 269
Reserves 4 – – – – – – – – – –
TOTAL COMMUNITY WEALTH/EQUITY 5 – – – – – – – 1 774 444 1 888 742 1 888 269
References
2. Include completed low cost housing to be transferred to beneficiaries within 12 months
3. Include 'Construction-work-in-progress' (disclosed separately in annual financial statements)
4. Detail to be provided in Table SA3. Includes reserves to be funded by statute.
5. Net assets must balance with Total Community Wealth/Equity
check balance - - - - - - - - - -
1. Detail to be provided in Table SA3
2017/18 Medium Term Revenue & Expenditure
FrameworkCurrent Year 2016/17
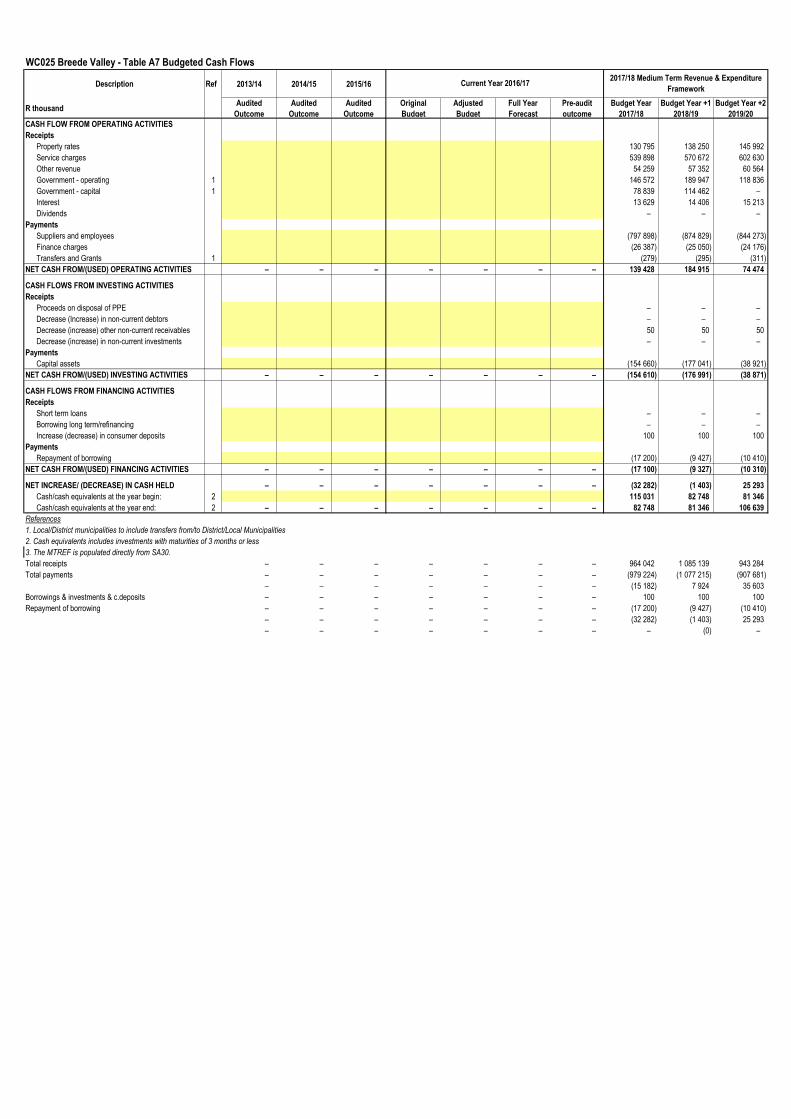
WC025 Breede Valley - Table A7 Budgeted Cash Flows
Description Ref 2013/14 2014/15 2015/16
R thousandAudited
Outcome
Audited
Outcome
Audited
Outcome
Original
Budget
Adjusted
Budget
Full Year
Forecast
Pre-audit
outcome
Budget Year
2017/18
Budget Year +1
2018/19
Budget Year +2
2019/20
CASH FLOW FROM OPERATING ACTIVITIES
Receipts
Property rates 130 795 138 250 145 992
Service charges 539 898 570 672 602 630
Other revenue 54 259 57 352 60 564
Government - operating 1 146 572 189 947 118 836
Government - capital 1 78 839 114 462 –
Interest 13 629 14 406 15 213
Dividends – – –
Payments
Suppliers and employees (797 898) (874 829) (844 273)
Finance charges (26 387) (25 050) (24 176)
Transfers and Grants 1 (279) (295) (311)
NET CASH FROM/(USED) OPERATING ACTIVITIES – – – – – – – 139 428 184 915 74 474
CASH FLOWS FROM INVESTING ACTIVITIES
Receipts
Proceeds on disposal of PPE – – –
Decrease (Increase) in non-current debtors – – –
Decrease (increase) other non-current receivables 50 50 50
Decrease (increase) in non-current investments – – –
Payments
Capital assets (154 660) (177 041) (38 921)
NET CASH FROM/(USED) INVESTING ACTIVITIES – – – – – – – (154 610) (176 991) (38 871)
CASH FLOWS FROM FINANCING ACTIVITIES
Receipts
Short term loans – – –
Borrowing long term/refinancing – – –
Increase (decrease) in consumer deposits 100 100 100
Payments
Repayment of borrowing (17 200) (9 427) (10 410)
NET CASH FROM/(USED) FINANCING ACTIVITIES – – – – – – – (17 100) (9 327) (10 310)
NET INCREASE/ (DECREASE) IN CASH HELD – – – – – – – (32 282) (1 403) 25 293
Cash/cash equivalents at the year begin: 2 115 031 82 748 81 346
Cash/cash equivalents at the year end: 2 – – – – – – – 82 748 81 346 106 639
References
1. Local/District municipalities to include transfers from/to District/Local Municipalities
2. Cash equivalents includes investments with maturities of 3 months or less
3. The MTREF is populated directly from SA30.
Total receipts – – – – – – – 964 042 1 085 139 943 284
Total payments – – – – – – – (979 224) (1 077 215) (907 681)
– – – – – – – (15 182) 7 924 35 603
Borrowings & investments & c.deposits – – – – – – – 100 100 100
Repayment of borrowing – – – – – – – (17 200) (9 427) (10 410)
– – – – – – – (32 282) (1 403) 25 293
– – – – – – – – (0) –
2017/18 Medium Term Revenue & Expenditure
FrameworkCurrent Year 2016/17

WC025 Breede Valley - Table A8 Cash backed reserves/accumulated surplus reconciliation
Description Ref 2013/14 2014/15 2015/16
R thousandAudited
Outcome
Audited
Outcome
Audited
Outcome
Original
Budget
Adjusted
Budget
Full Year
Forecast
Pre-audit
outcome
Budget Year
2017/18
Budget Year +1
2018/19
Budget Year +2
2019/20Cash and investments available
Cash/cash equivalents at the year end 1 – – – – – – – 82 748 81 346 106 639
Other current investments > 90 days – – – – – – – – – (0)
Non current assets - Investments 1 – – – – – – – – – –
Cash and investments available: – – – – – – – 82 748 81 346 106 639
Application of cash and investments
Unspent conditional transfers – – – – – – – 5 000 5 000 5 000
Unspent borrowing – – – – – – – – –
Statutory requirements 2 – – –
Other working capital requirements 3 – – – – – – – (66 997) (86 934) (107 937)
Other provisions – – –
Long term investments committed 4 – – – – – – – – – –
Reserves to be backed by cash/investments 5 36 197 31 512 33 402
Total Application of cash and investments: – – – – – – – (25 800) (50 422) (69 534)
Surplus(shortfall) – – – – – – – 108 549 131 768 176 173
References
1. Must reconcile with Budgeted Cash Flows
2. For example: VAT, taxation
3. Council approval for policy required - include sufficient working capital (e.g. allowing for a % of current debtors > 90 days as uncollectable)
4. For example: sinking fund requirements for borrowing
5. Council approval required for each reserve created and basis of cash backing of reserves
Other working capital requirements
Debtors – – – – – – – 131 185 147 912 165 866
Creditors due – – – – – – – 64 188 60 978 57 929
Total – – – – – – – 66 997 86 934 107 937
Debtors collection assumptions
Balance outstanding - debtors – – – – – – – 142 263 160 402 179 873
Estimate of debtors collection rate 0.0% 0.0% 0.0% 0.0% 0.0% 0.0% 0.0% 92.2% 92.2% 92.2%
`
Long term investments committed
Balance (Insert description; eg sinking fund)
– – – – – – – – – –
Reserves to be backed by cash/investments
Housing Development Fund – – – – – – – – – –
Capital replacement 7 242 1 062 1 126
Self-insurance 4 000 4 000 4 240
Retention 3 200 3 386 3 589
Consumer Deposit 4 160 4 401 4 665
Depreciation(Loan repayment) 14 319 15 164 16 074
Performance Bonus 156 167 177
Accrued leave 3 120 3 332 3 532
– – – – – – – 36 197 31 512 33 402
2017/18 Medium Term Revenue & Expenditure
FrameworkCurrent Year 2016/17

WC025 Breede Valley - Table A9 Asset Management
Description Ref 2013/14 2014/15 2015/16
R thousandAudited
Outcome
Audited
Outcome
Audited
Outcome
Original
Budget
Adjusted
Budget
Full Year
Forecast
Budget Year
2017/18
Budget Year +1
2018/19
Budget Year +2
2019/20
CAPITAL EXPENDITURE
Total New Assets 1 – – – – – – 91 146 127 643 7 204
Roads Infrastructure – – – – – – 8 418 12 892 500
Storm water Infrastructure – – – – – – 3 810 7 290 –
Electrical Infrastructure – – – – – – 3 976 1 831 335
Water Supply Infrastructure – – – – – – 28 551 61 595 241
Sanitation Infrastructure – – – – – – 26 738 25 964 148
Solid Waste Infrastructure – – – – – – 660 1 750 2 250
Rail Infrastructure – – – – – – – – –
Coastal Infrastructure – – – – – – – – –
Information and Communication Infrastructure – – – – – – – – –
Infrastructure – – – – – – 72 153 111 321 3 474
Community Facilities – – – – – – 5 295 12 682 600
Sport and Recreation Facilities – – – – – – 1 500 – –
Community Assets – – – – – – 6 795 12 682 600
Heritage Assets – – – – – – – – –
Revenue Generating – – – – – – – – –
Non-revenue Generating – – – – – – – – –
Investment properties – – – – – – – – –
Operational Buildings – – – – – – 1 885 1 100 1 100
Housing – – – – – – – – –
Other Assets – – – – – – 1 885 1 100 1 100
Biological or Cultivated Assets – – – – – – – – –
Servitudes – – – – – – – – –
Licences and Rights – – – – – – 350 – –
Intangible Assets – – – – – – 350 – –
Computer Equipment – – – – – – – – –
Furniture and Office Equipment – – – – – – 438 300 330
Machinery and Equipment – – – – – – 8 285 990 600
Transport Assets – – – – – – 1 240 1 250 1 100
Libraries – – – – – – – – –
Zoo's, Marine and Non-biological Animals – – – – – – – – –
Total Renewal of Existing Assets 2 – – – – – – 61 264 47 798 30 063
Roads Infrastructure – – – – – – 4 500 6 500 7 500
Storm water Infrastructure – – – – – – 1 000 – 1 000
Electrical Infrastructure – – – – – – 31 956 30 135 15 000
Water Supply Infrastructure – – – – – – 1 750 1 750 1 750
Sanitation Infrastructure – – – – – – 5 000 – –
Solid Waste Infrastructure – – – – – – 7 338 – –
Rail Infrastructure – – – – – – – – –
Coastal Infrastructure – – – – – – – – –
Information and Communication Infrastructure – – – – – – – – –
Infrastructure – – – – – – 51 544 38 385 25 250
Community Facilities – – – – – – – 200 –
Sport and Recreation Facilities – – – – – – 1 100 – –
Community Assets – – – – – – 1 100 200 –
Heritage Assets – – – – – – – – –
Revenue Generating – – – – – – – – –
Non-revenue Generating – – – – – – – – –
Investment properties – – – – – – – – –
Operational Buildings – – – – – – – – –
Housing – – – – – – – – –
Other Assets – – – – – – – – –
Biological or Cultivated Assets – – – – – – – – –
Servitudes – – – – – – – – –
Licences and Rights – – – – – – – – –
Intangible Assets – – – – – – – – –
Computer Equipment – – – – – – 2 415 4 763 813
Furniture and Office Equipment – – – – – – – – –
Machinery and Equipment – – – – – – 6 205 4 450 4 000
Transport Assets – – – – – – – – –
Libraries – – – – – – – – –
Zoo's, Marine and Non-biological Animals – – – – – – – – –
Total Upgrading of Existing Assets 6 – – – – – – 2 250 1 600 1 655
Roads Infrastructure – – – – – – – – –
Storm water Infrastructure – – – – – – – – –
Electrical Infrastructure – – – – – – – – –
Water Supply Infrastructure – – – – – – – – –
Sanitation Infrastructure – – – – – – 600 600 600
Solid Waste Infrastructure – – – – – – – – –
Rail Infrastructure – – – – – – – – –
Coastal Infrastructure – – – – – – – – –
Information and Communication Infrastructure – – – – – – – – –
Infrastructure – – – – – – 600 600 600
Community Facilities – – – – – – 650 – –
Sport and Recreation Facilities – – – – – – – – 55
Community Assets – – – – – – 650 – 55
Heritage Assets – – – – – – – – –
Revenue Generating – – – – – – – – –
Non-revenue Generating – – – – – – – – –
Current Year 2016/172017/18 Medium Term Revenue & Expenditure
Framework

WC025 Breede Valley - Table A9 Asset Management
Description Ref 2013/14 2014/15 2015/16
R thousandAudited
Outcome
Audited
Outcome
Audited
Outcome
Original
Budget
Adjusted
Budget
Full Year
Forecast
Budget Year
2017/18
Budget Year +1
2018/19
Budget Year +2
2019/20
Current Year 2016/172017/18 Medium Term Revenue & Expenditure
Framework
Investment properties – – – – – – – – –
Operational Buildings – – – – – – – – –
Housing – – – – – – – – –
Other Assets – – – – – – – – –
Biological or Cultivated Assets – – – – – – – – –
Servitudes – – – – – – – – –
Licences and Rights – – – – – – – – –
Intangible Assets – – – – – – – – –
Computer Equipment – – – – – – – – –
Furniture and Office Equipment – – – – – – – – –
Machinery and Equipment – – – – – – 1 000 1 000 1 000
Transport Assets – – – – – – – – –
Libraries – – – – – – – – –
Zoo's, Marine and Non-biological Animals – – – – – – – – –
Total Capital Expenditure 4
Roads Infrastructure – – – – – – 12 918 19 392 8 000
Storm water Infrastructure – – – – – – 4 810 7 290 1 000
Electrical Infrastructure – – – – – – 35 932 31 965 15 335
Water Supply Infrastructure – – – – – – 30 301 63 345 1 991
Sanitation Infrastructure – – – – – – 32 338 26 564 748
Solid Waste Infrastructure – – – – – – 7 998 1 750 2 250
Rail Infrastructure – – – – – – – – –
Coastal Infrastructure – – – – – – – – –
Information and Communication Infrastructure – – – – – – – – –
Infrastructure – – – – – – 124 297 150 306 29 324
Community Facilities – – – – – – 5 945 12 882 600
Sport and Recreation Facilities – – – – – – 2 600 – 55
Community Assets – – – – – – 8 545 12 882 655
Heritage Assets – – – – – – – – –
Revenue Generating – – – – – – – – –
Non-revenue Generating – – – – – – – – –
Investment properties – – – – – – – – –
Operational Buildings – – – – – – 1 885 1 100 1 100
Housing – – – – – – – – –
Other Assets – – – – – – 1 885 1 100 1 100
Biological or Cultivated Assets – – – – – – – – –
Servitudes – – – – – – – – –
Licences and Rights – – – – – – 350 – –
Intangible Assets – – – – – – 350 – –
Computer Equipment – – – – – – 2 415 4 763 813
Furniture and Office Equipment – – – – – – 438 300 330
Machinery and Equipment – – – – – – 15 490 6 440 5 600
Transport Assets – – – – – – 1 240 1 250 1 100
Libraries – – – – – – – – –
Zoo's, Marine and Non-biological Animals – – – – – – – – –
TOTAL CAPITAL EXPENDITURE - Asset class – – – – – – 154 660 177 041 38 921
ASSET REGISTER SUMMARY - PPE (WDV) 5
Roads Infrastructure 394 519 389 210 371 125
Storm water Infrastructure 49 395 56 685 57 685
Electrical Infrastructure 329 355 348 296 349 877
Water Supply Infrastructure 430 368 481 843 471 299
Sanitation Infrastructure 369 487 384 254 372 546
Solid Waste Infrastructure 8 067 (449) (9 039)
Rail Infrastructure – – –
Coastal Infrastructure – – –
Information and Communication Infrastructure 36 36 36
Infrastructure – – – – – – 1 581 227 1 659 875 1 613 528
Community Facilities 20 744 32 205 31 303
Sport and Recreation Facilities 25 535 24 554 23 574
Community Assets – – – – – – 46 279 56 759 54 877
Heritage Assets 36 631 36 631 36 631
Revenue Generating – – –
Non-revenue Generating 22 395 24 084 25 899
Investment properties – – – – – – 22 395 24 084 25 899
Operational Buildings 285 409 284 135 282 729
Housing 41 868 39 783 37 581
Other Assets – – – – – – 327 277 323 918 320 310
Biological or Cultivated Assets – – –
Servitudes – – –
Licences and Rights 4 854 4 340 3 798
Intangible Assets – – – – – – 4 854 4 340 3 798
Computer Equipment 9 974 13 656 13 326
Furniture and Office Equipment 2 215 1 677 1 121
Machinery and Equipment 23 715 27 194 29 667
Transport Assets 17 247 15 991 14 445
Libraries 12 694 12 694 12 694
Zoo's, Marine and Non-biological Animals – – –
TOTAL ASSET REGISTER SUMMARY - PPE (WDV) 5 – – – – – – 2 047 879 2 140 188 2 089 665

WC025 Breede Valley - Table A9 Asset Management
Description Ref 2013/14 2014/15 2015/16
R thousandAudited
Outcome
Audited
Outcome
Audited
Outcome
Original
Budget
Adjusted
Budget
Full Year
Forecast
Budget Year
2017/18
Budget Year +1
2018/19
Budget Year +2
2019/20
Current Year 2016/172017/18 Medium Term Revenue & Expenditure
Framework
EXPENDITURE OTHER ITEMS
Depreciation 7 – – – – – – 81 759 86 420 91 259
Repairs and Maintenance by Asset Class 3 – – – – – – 62 469 66 030 69 728
Roads Infrastructure – – – – – – 8 982 9 494 10 026
Storm water Infrastructure – – – – – – 1 887 1 995 2 106
Electrical Infrastructure – – – – – – 19 534 20 647 21 804
Water Supply Infrastructure – – – – – – 5 912 6 249 6 599
Sanitation Infrastructure – – – – – – 6 887 7 280 7 687
Solid Waste Infrastructure – – – – – – 36 38 40
Rail Infrastructure – – – – – – – – –
Coastal Infrastructure – – – – – – – – –
Information and Communication Infrastructure – – – – – – – – –
Infrastructure – – – – – – 43 238 45 702 48 262
Community Facilities – – – – – – 2 639 2 789 2 946
Sport and Recreation Facilities – – – – – – 2 107 2 227 2 352
Community Assets – – – – – – 4 746 5 016 5 297
Heritage Assets – – – – – – – – –
Revenue Generating – – – – – – – – –
Non-revenue Generating – – – – – – – – –
Investment properties – – – – – – – – –
Operational Buildings – – – – – – 3 124 3 302 3 487
Housing – – – – – – 898 950 1 003
Other Assets – – – – – – 4 023 4 252 4 490
Biological or Cultivated Assets – – – – – – – – –
Servitudes – – – – – – – – –
Licences and Rights – – – – – – – – –
Intangible Assets – – – – – – – – –
Computer Equipment – – – – – – 1 842 1 947 2 056
Furniture and Office Equipment – – – – – – 6 6 6
Machinery and Equipment – – – – – – 3 362 3 554 3 753
Transport Assets – – – – – – 5 253 5 553 5 864
Libraries – – – – – – – – –
Zoo's, Marine and Non-biological Animals – – – – – – – – –
TOTAL EXPENDITURE OTHER ITEMS – – – – – – 144 228 152 450 160 987
Renewal and upgrading of Existing Assets as % of total capex 0.0% 0.0% 0.0% 0.0% 0.0% 0.0% 41.1% 27.9% 81.5%
Renewal and upgrading of Existing Assets as % of deprecn 0.0% 0.0% 0.0% 0.0% 0.0% 0.0% 77.7% 57.2% 34.8%
R&M as a % of PPE 0.0% 0.0% 0.0% 0.0% 0.0% 0.0% 3.1% 3.1% 3.4%
Renewal and upgrading and R&M as a % of PPE 0.0% 0.0% 0.0% 0.0% 0.0% 0.0% 6.0% 5.0% 5.0%
References
1. Detail of new assets provided in Table SA34a
2. Detail of renewal of existing assets provided in Table SA34b
3. Detail of Repairs and Maintenance by Asset Class provided in Table SA34c
4. Must reconcile to total capital expenditure on Budgeted Capital Expenditure
5. Must reconcile to 'Budgeted Financial Position' (written down value)
6. Detail of upgrading of existing assets provided in Table SA34e
7. Detail of depreciation provided in Table SA34d
Check balance to A6 - - - - - - -0.00 0.00 0.00

WC025 Breede Valley - Table A10 Basic service delivery measurement
2013/14 2014/15 2015/16
Outcome Outcome OutcomeOriginal
Budget
Adjusted
Budget
Full Year
Forecast
Budget Year
2017/18
Budget Year +1
2018/19
Budget Year +2
2019/20
Household service targets 1Water:
Piped water inside dwelling – – – – – – 16 701 16 701 16 701
Piped water inside yard (but not in dwelling) – – – – – – 3 803 3 803 3 803
Using public tap (at least min.service level) 2 – – – – – – 4 989 4 989 4 989
Other water supply (at least min.service level) 4 – – – – – – – – –
Minimum Service Level and Above sub-total – – – – – – 25 493 25 493 25 493
Using public tap (< min.service level) 3 – – – – – – 924 924 924
Other water supply (< min.service level) 4 – – – – – – – – –
No water supply – – – – – – – – –
Below Minimum Service Level sub-total – – – – – – 924 924 924
Total number of households 5 – – – – – – 26 417 26 417 26 417
Sanitation/sewerage:
Flush toilet (connected to sewerage) – – – – – – 23 834 23 834 23 834
Flush toilet (with septic tank) – – – – – – 100 100 100
Chemical toilet – – – – – – 4 415 4 415 4 415
Pit toilet (ventilated) – – – – – – – – –
Other toilet provisions (> min.service level) – – – – – – – – –
Minimum Service Level and Above sub-total – – – – – – 28 349 28 349 28 349
Bucket toilet – – – – – – – – –
Other toilet provisions (< min.service level) – – – – – – – – –
No toilet provisions – – – – – – 558 558 558
Below Minimum Service Level sub-total – – – – – – 558 558 558
Total number of households 5 – – – – – – 28 907 28 907 28 907
Energy:
Electricity (at least min.service level) – – – – – – 4 451 4 451 4 451
Electricity - prepaid (min.service level) – – – – – – 20 706 20 706 20 706
Minimum Service Level and Above sub-total – – – – – – 25 157 25 157 25 157
Electricity (< min.service level) – – – – – – – – –
Electricity - prepaid (< min. service level) – – – – – – – – –
Other energy sources – – – – – – – – –
Below Minimum Service Level sub-total – – – – – – – – –
Total number of households 5 – – – – – – 25 157 25 157 25 157
Refuse:
Removed at least once a week – – – – – – 34 804 34 804 34 804
Minimum Service Level and Above sub-total – – – – – – 34 804 34 804 34 804
Removed less frequently than once a week – – – – – – – – –
Using communal refuse dump – – – – – – – – –
Using own refuse dump – – – – – – – – –
Other rubbish disposal – – – – – – – – –
No rubbish disposal – – – – – – – – –
Below Minimum Service Level sub-total – – – – – – – – –
Total number of households 5 – – – – – – 34 804 34 804 34 804
Households receiving Free Basic Service 7
Water (6 kilolitres per household per month) – – – – – – 8 000 8 000 8 000
Sanitation (free minimum level service) – – – – – – 7 750 7 750 7 750
Electricity/other energy (50kwh per household per month) – – – – – – 8 000 8 000 8 000
Refuse (removed at least once a week) – – – – – – 8 000 8 000 8 000
Cost of Free Basic Services provided - Formal Settlements (R'000) 8
Water (6 kilolitres per indigent household per month) – – – – – – 6 351 6 713 7 089
Sanitation (free sanitation service to indigent households) – – – – – – 12 098 12 787 13 503
Electricity/other energy (50kwh per indigent household per month) – – – – – – 3 642 3 850 4 065
Refuse (removed once a week for indigent households) – – – – – – 7 650 8 086 8 539
Cost of Free Basic Services provided - Informal Formal Settlements (R'000) – – – – – – 8 909 9 567 9 760
Total cost of FBS provided – – – – – – 38 649 41 002 42 956
Highest level of free service provided per household
Property rates (R value threshold) 150 000 150 000 150 000
Water (kilolitres per household per month) 10kl 10kl 10kl
Sanitation (kilolitres per household per month)
Sanitation (Rand per household per month) 246 260 276
Electricity (kwh per household per month) 50kwh 50kwh 50kwh
Refuse (average litres per week) 240L 240L 240L
Revenue cost of subsidised services provided (R'000) 9Property rates (tariff adjustment) ( impermissable values per section 17 of MPRA) 2 650 2 809 2 978
Property rates exemptions, reductions and rebates and impermissable values in excess of
section 17 of MPRA) – – – – – – 25 174 26 609 28 099
Water (in excess of 6 kilolitres per indigent household per month) – – – – – – 706 746 788
Sanitation (in excess of free sanitation service to indigent households) – – – – – – 1 344 1 421 1 500
Electricity/other energy (in excess of 50 kwh per indigent household per month) – – – – – – 405 428 452
Refuse (in excess of one removal a week for indigent households) – – – – – – 850 898 949
Municipal Housing - rental rebates 6 204 6 577 6 971
Housing - top structure subsidies 6 – – –
Other – – – Total revenue cost of subsidised services provided – – – – – – 37 333 39 488 41 736
References
1. Include services provided by another entity; e.g. Eskom
2. Stand distance <= 200m from dwelling
3. Stand distance > 200m from dwelling
4. Borehole, spring, rain-water tank etc.
5. Must agree to total number of households in municipal area (informal settlements receiving services must be included)
6. Include value of subsidy provided by municipality above provincial subsidy level
7. Show number of households receiving at least these levels of services completely free (informal settlements must be included)
8. Must reflect the cost to the municipality of providing the Free Basic Service
9. Reflect the cost to the municipality in terms of 'revenue foregone' of providing free services (note this will not equal 'Revenue Foregone' on SA1)
Current Year 2016/172017/18 Medium Term Revenue & Expenditure
FrameworkDescription Ref

WC025 Breede Valley - Supporting Table SA1 Supportinging detail to 'Budgeted Financial Performance'
2013/14 2014/15 2015/16
Audited
Outcome
Audited
Outcome
Audited
Outcome
Original
Budget
Adjusted
Budget
Full Year
Forecast
Pre-audit
outcome
Budget Year
2017/18
Budget Year
+1 2018/19
Budget Year
+2 2019/20R thousand
REVENUE ITEMS:
Property rates 6
Total Property Rates 162 853 172 135 181 775less Revenue Foregone (exemptions, reductions and
rebates and impermissable values in excess of
section 17 of MPRA) 25 174 26 609 28 099
Net Property Rates – – – – – – – 137 679 145 526 153 676
Service charges - electricity revenue 6
Total Service charges - electricity revenue 404 363 427 412 451 347less Revenue Foregone (in excess of 50 kwh per
indigent household per month) 405 428 452less Cost of Free Basis Services (50 kwh per
indigent household per month) – – – – – – 3 642 3 850 4 065
Net Service charges - electricity revenue – – – – – – – 400 316 423 134 446 830
Service charges - water revenue 6
Total Service charges - water revenue 72 331 76 454 80 735less Revenue Foregone (in excess of 6 kilolitres per
indigent household per month) 706 746 788less Cost of Free Basis Services (6 kilolitres per
indigent household per month) – – – – – – 6 351 6 713 7 089
Net Service charges - water revenue – – – – – – – 65 274 68 995 72 859
Service charges - sanitation revenue
Total Service charges - sanitation revenue 70 835 74 872 79 065less Revenue Foregone (in excess of free sanitation
service to indigent households) 1 344 1 421 1 500less Cost of Free Basis Services (free sanitation
service to indigent households) – – – – – – 12 098 12 787 13 503
Net Service charges - sanitation revenue – – – – – – – 57 393 60 664 64 061
Service charges - refuse revenue 6
Total refuse removal revenue 49 515 52 337 55 268
Total landfill revenue – – – less Revenue Foregone (in excess of one removal a
week to indigent households) 850 898 949 less Cost of Free Basis Services (removed once a
week to indigent households) – – – – – – 7 650 8 086 8 539
Net Service charges - refuse revenue – – – – – – – 41 015 43 352 45 780
Other Revenue by source
Other Revenue 6 900 7 294 7 702
3
Total 'Other' Revenue 1 – – – – – – – 6 900 7 294 7 702
EXPENDITURE ITEMS:
Employee related costs
Basic Salaries and Wages 2 187 866 197 906 208 355
Pension and UIF Contributions 33 284 35 177 37 147
Medical Aid Contributions 19 414 20 520 21 669
Overtime 11 350 11 997 12 669
Performance Bonus – – –
Motor Vehicle Allowance 8 120 8 582 9 063
Cellphone Allowance 1 056 1 116 1 179
Housing Allowances 3 198 3 381 3 570
Other benefits and allowances 29 335 31 007 32 744
Payments in lieu of leave – – –
Long service awards – – –
Post-retirement benefit obligations 4 6 018 6 361 6 717
sub-total 5 – – – – – – – 299 640 316 047 333 113
Less: Employees costs capitalised to PPE – – –
Total Employee related costs 1 – – – – – – – 299 640 316 047 333 113
Contributions recognised - capital
– – –
– – –
– – –
– – –
– – –
– – –
Total Contributions recognised - capital – – – – – – – – – –
Depreciation & asset impairment
Depreciation of Property, Plant & Equipment 81 759 86 420 91 259
Lease amortisation – – –
Capital asset impairment – – –
Depreciation resulting from revaluation of PPE 10 – – –
Total Depreciation & asset impairment 1 – – – – – – – 81 759 86 420 91 259
Bulk purchases
Electricity Bulk Purchases 273 881 289 493 305 704
Water Bulk Purchases 2 270 2 399 2 534
Total bulk purchases 1 – – – – – – – 276 151 291 892 308 238
Transfers and grants
Cash transfers and grants – – – – – – – 279 295 311
Non-cash transfers and grants – – – – – – – – – –
Total transfers and grants 1 – – – – – – – 279 295 311
Contracted services
Contracted services 9 366 9 900 10 455
sub-total 1 – – – – – – – 9 366 9 900 10 455
Allocations to organs of state:
Electricity – – –
Water – – –
Sanitation – – –
Other – – –
Total contracted services – – – – – – – 9 366 9 900 10 455
Other Expenditure By Type
Collection costs 97 102 108
Contributions to 'other' provisions 4 881 5 159 5 448
Consultant fees 9 595 10 142 10 710
Audit fees 3 430 3 626 3 829
General expenses 3 112 675 151 220 80 775
Total 'Other' Expenditure 1 – – – – – – – 130 678 170 249 100 870
Repairs and Maintenance
by Expenditure Item 8
Employee related costs – – –
Other materials 62 469 66 030 69 728
Contracted Services – – –
Other Expenditure – – –
Total Repairs and Maintenance Expenditure 9 – – – – – – – 62 469 66 030 69 728
check – – – – – – 62 239 65 787 69 471
References
1. Must reconcile with 'Budgeted Financial Performance (Revenue and Expenditure)
2. Must reconcile to supporting documentation on staff salaries
3. Insert other categories where revenue or expenditure is of a material nature (list separate items until 'General expenses' is not > 10% of Total Expenditure)
4. Expenditure to meet any 'unfunded obligations'
5 This sub-total must agree with the total on SA22, but excluding councillor and board member items
6. Include a note for each revenue item that is affected by 'revenue foregone'
7. Special consideration may have to be given to including 'goodwill arising' or 'joint venture' budgets where circumstances require this (include separately under relevant notes)
8. Repairs and Maintenance is not a GRAP item. However to facilitate transparency, municipalities must provide a breakdown of the amounts included in the relevant GRAP items that will be spent on Repairs and Maintenance.
9. Must reconcile with Repairs and Maintenance by Asset Class (Total Repairs and Maintenance) on Table SA34c.
10. Only applicable to municipalities that have adopted the 'revaluation method' in GRAP 17. The aim is to prevent overstating 'depreciation and asset impairment'
2017/18 Medium Term Revenue & Expenditure
FrameworkCurrent Year 2016/17
Description Ref

WC025 Breede Valley - Supporting Table SA2 Matrix Financial Performance Budget (revenue source/expenditure type and dept.)
Description Ref
R thousand 1
Revenue By Source
Property rates – – – 137 679 – – 137 679
Service charges - electricity revenue – – – – – 400 316 400 316
Service charges - water revenue – – – – – 65 274 65 274
Service charges - sanitation revenue – – – – – 57 393 57 393
Service charges - refuse revenue – – – – – 41 015 41 015
Service charges - other – – (1 489) (461) (6 842) (8 907) (17 700)
Rental of facilities and equipment – – 134 52 14 167 139 14 492
Interest earned - external investments – – – 10 620 – – 10 620
Interest earned - outstanding debtors – – – 1 896 1 113 – 3 009
Dividends received – – – – – – –
Fines, penalties and forfeits – – – – 66 067 1 177 67 244
Licences and permits – – – – 3 173 – 3 173
Agency services – – – – 7 373 – 7 373
Other revenue 131 – 192 4 024 (5 288) 7 841 6 900
Transfers and subsidies – 425 1 100 28 830 58 517 57 700 146 572
Gains on disposal of PPE – – – – – 1 126 1 126 Total Revenue (excluding capital transfers and
contributions) 131 425 (64) 182 639 138 280 623 074 944 486
Expenditure By Type
Employee related costs 8 559 7 478 27 281 45 455 92 911 117 956 299 640
Remuneration of councillors 16 468 – – – – – 16 468
Debt impairment – – – 13 932 38 008 3 687 55 626
Depreciation & asset impairment 17 34 1 597 323 4 695 75 092 81 759
Finance charges – – – 771 284 25 061 26 116
Bulk purchases – – – – – 276 151 276 151
Other materials 72 – 3 252 1 009 6 631 51 505 62 469
Contracted services – – 8 272 411 8 675 9 366
Transfers and subsidies 219 – – – – 60 279
Other expenditure 4 623 1 976 14 160 14 895 62 636 32 387 130 678
Loss on disposal of PPE 3 1 8 1 2 989 124 3 125
Total Expenditure 29 961 9 489 54 570 76 795 208 163 582 699 961 678
Surplus/(Deficit) (29 830) (9 064) (54 633) 105 844 (69 883) 40 375 (17 192) Transfers and subsidies - capital (monetary allocations)
(National / Provincial and District) – 4 125 – – – 74 714 78 839 Transfers and subsidies - capital (monetary allocations)
(National / Provincial Departmental Agencies,
Households, Non-profit Institutions, Private Enterprises,
Public Corporatons, Higher Educational Institutions) – – – – – – –
Transfers and subsidies - capital (in-kind - all) – – – – – – –
Surplus/(Deficit) after capital transfers &
contributions
(29 830) (4 939) (54 633) 105 844 (69 883) 115 089 61 647
References
1. Departmental columns to be based on municipal organisation structure
Vote 5 - Community
Services
Vote 6 - Technical
Services
Vote 1 - Council
General
Vote 2 - Municipal
Manager
Vote 3 - Strategic
Support Services
Vote 4 - Financial
Services
Total
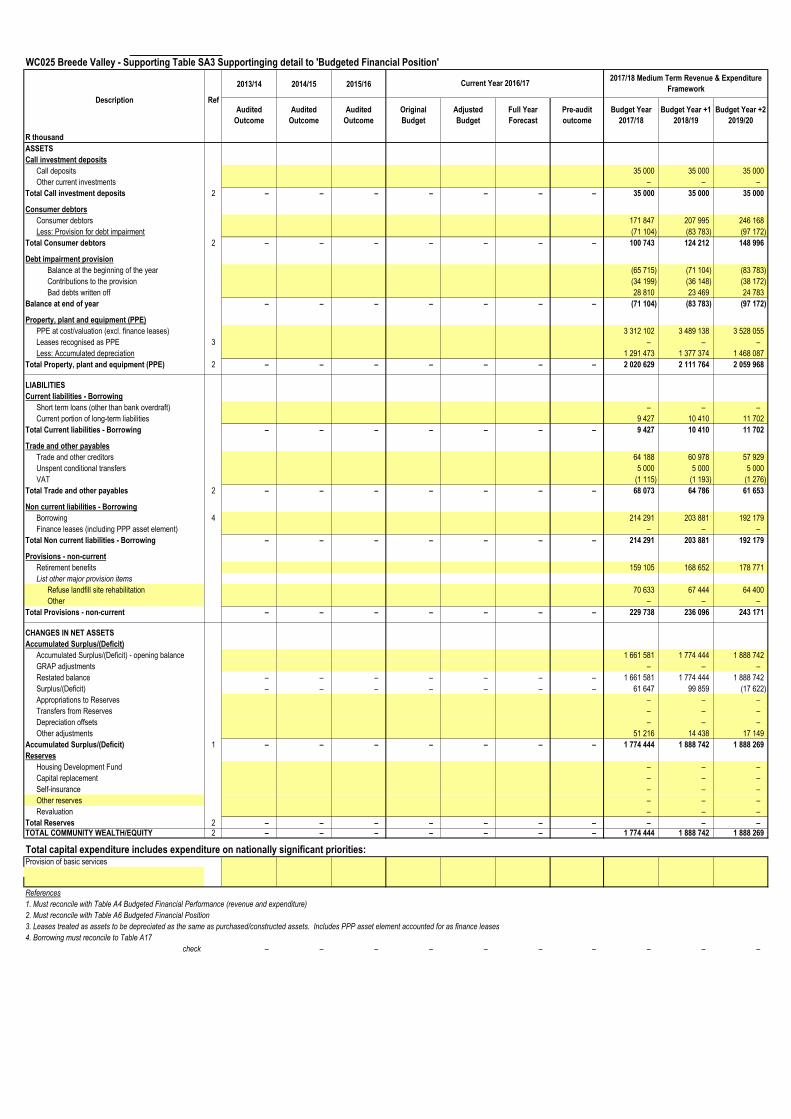
WC025 Breede Valley - Supporting Table SA3 Supportinging detail to 'Budgeted Financial Position'
2013/14 2014/15 2015/16
Audited
Outcome
Audited
Outcome
Audited
Outcome
Original
Budget
Adjusted
Budget
Full Year
Forecast
Pre-audit
outcome
Budget Year
2017/18
Budget Year +1
2018/19
Budget Year +2
2019/20
R thousand
ASSETS
Call investment deposits
Call deposits 35 000 35 000 35 000
Other current investments – – –
Total Call investment deposits 2 – – – – – – – 35 000 35 000 35 000
Consumer debtors
Consumer debtors 171 847 207 995 246 168
Less: Provision for debt impairment (71 104) (83 783) (97 172)
Total Consumer debtors 2 – – – – – – – 100 743 124 212 148 996
Debt impairment provision
Balance at the beginning of the year (65 715) (71 104) (83 783)
Contributions to the provision (34 199) (36 148) (38 172)
Bad debts written off 28 810 23 469 24 783
Balance at end of year – – – – – – – (71 104) (83 783) (97 172)
Property, plant and equipment (PPE)
PPE at cost/valuation (excl. finance leases) 3 312 102 3 489 138 3 528 055
Leases recognised as PPE 3 – – –
Less: Accumulated depreciation 1 291 473 1 377 374 1 468 087
Total Property, plant and equipment (PPE) 2 – – – – – – – 2 020 629 2 111 764 2 059 968
LIABILITIES
Current liabilities - Borrowing
Short term loans (other than bank overdraft) – – –
Current portion of long-term liabilities 9 427 10 410 11 702
Total Current liabilities - Borrowing – – – – – – – 9 427 10 410 11 702
Trade and other payables
Trade and other creditors 64 188 60 978 57 929
Unspent conditional transfers 5 000 5 000 5 000
VAT (1 115) (1 193) (1 276)
Total Trade and other payables 2 – – – – – – – 68 073 64 786 61 653
Non current liabilities - Borrowing
Borrowing 4 214 291 203 881 192 179
Finance leases (including PPP asset element) – – –
Total Non current liabilities - Borrowing – – – – – – – 214 291 203 881 192 179
Provisions - non-current
Retirement benefits 159 105 168 652 178 771
List other major provision items
Refuse landfill site rehabilitation 70 633 67 444 64 400
Other – – –
Total Provisions - non-current – – – – – – – 229 738 236 096 243 171
CHANGES IN NET ASSETS
Accumulated Surplus/(Deficit)
Accumulated Surplus/(Deficit) - opening balance 1 661 581 1 774 444 1 888 742
GRAP adjustments – – –
Restated balance – – – – – – – 1 661 581 1 774 444 1 888 742
Surplus/(Deficit) – – – – – – – 61 647 99 859 (17 622)
Appropriations to Reserves – – –
Transfers from Reserves – – –
Depreciation offsets – – –
Other adjustments 51 216 14 438 17 149
Accumulated Surplus/(Deficit) 1 – – – – – – – 1 774 444 1 888 742 1 888 269
Reserves
Housing Development Fund – – –
Capital replacement – – –
Self-insurance – – –
Other reserves – – –
Revaluation – – –
Total Reserves 2 – – – – – – – – – –
TOTAL COMMUNITY WEALTH/EQUITY 2 – – – – – – – 1 774 444 1 888 742 1 888 269
Total capital expenditure includes expenditure on nationally significant priorities:Provision of basic services
References
1. Must reconcile with Table A4 Budgeted Financial Performance (revenue and expenditure)
2. Must reconcile with Table A6 Budgeted Financial Position
3. Leases treated as assets to be depreciated as the same as purchased/constructed assets. Includes PPP asset element accounted for as finance leases
4. Borrowing must reconcile to Table A17
check – – – – – – – – – –
Description Ref
2017/18 Medium Term Revenue & Expenditure
FrameworkCurrent Year 2016/17

WC025 Breede Valley - Supporting Table SA4 Reconciliation of IDP strategic objectives and budget (revenue)
Strategic Objective Goal
Goal
Code 2013/14 2014/15 2015/16
R thousand
Audited
Outcome
Audited
Outcome
Audited
Outcome
Original
Budget
Adjusted
Budget
Full Year
Forecast
Budget Year
2017/18
Budget Year +1
2018/19
Budget Year +2
2019/20
To provide, maintain and assure basic services and social upliftment for the Breede
Valley community
Sustainable basic services to
communities 1 749 992 856 765 719 008
To create an enabling environment for employment and poverty eradication through
proactive economic development and tourism
Poverty eradication through LED
and Tourism 2 (78) (83) (87)
To ensure a safe, healthy, clean and sustainable external environment for all the
residents in the Breede Valley
Safe, healthy and clean
environment 3 77 096 84 646 86 054
Provide democratic, accountable government for local communities and encourage
involvement of communities and community organisations in the matters of local
government
Good governance and public
participation 4 12 436 11 354 (333)
Ensure a healthy and productive workforce and an effective and efficient work
environment Healthy and productive workforce 5 1 241 1 249 157
Assure a sustainable future through sound financial management, continuous revenue
growth corporate governance and risk management practices
Sound financial management,
viabiilty and risk management 6 182 639 193 873 204 662
Allocations to other priorities 2
Total Revenue (excluding capital transfers and contributions) 1 – – – – – – 1 023 325 1 147 804 1 009 461
References
1. Total revenue must reconcile to Table A4 Budgeted Financial Performance (revenue and expenditure)
2. Balance of allocations not directly linked to an IDP strategic objective
check op revenue balance – – – – – – – – –
Current Year 2016/17
2017/18 Medium Term Revenue & Expenditure
Framework
Ref
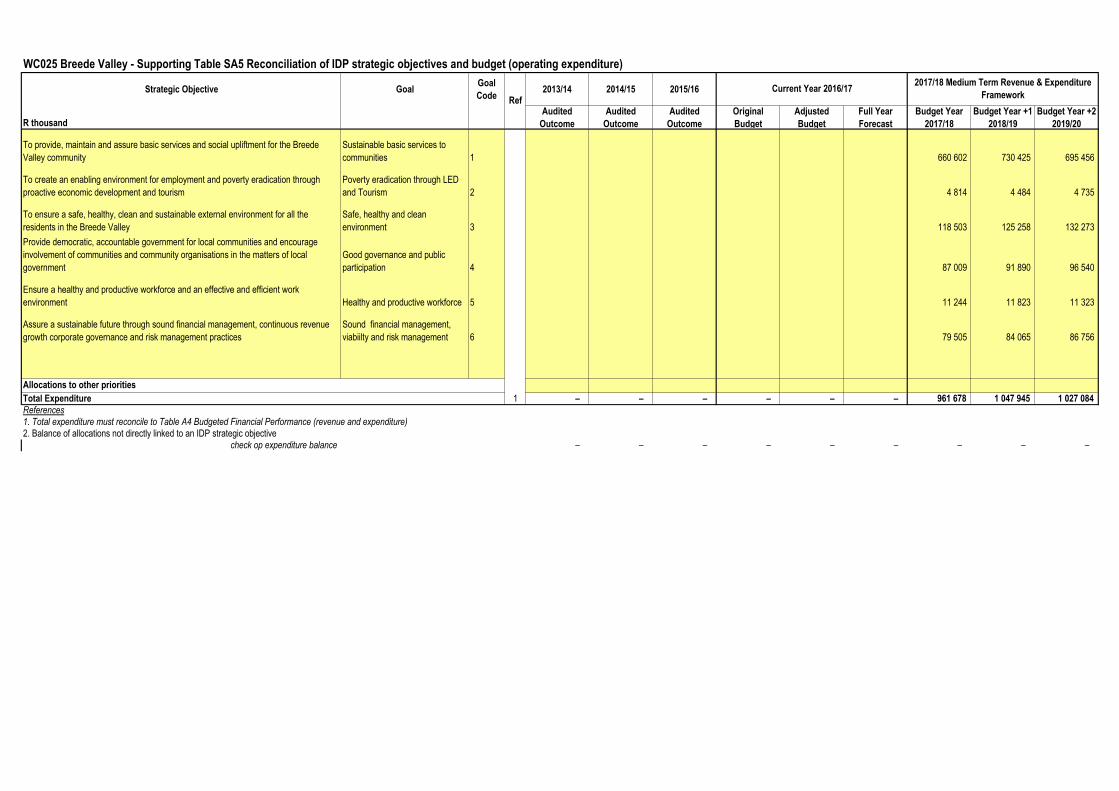
WC025 Breede Valley - Supporting Table SA5 Reconciliation of IDP strategic objectives and budget (operating expenditure)
Strategic Objective GoalGoal
Code2013/14 2014/15 2015/16
R thousand
Audited
Outcome
Audited
Outcome
Audited
Outcome
Original
Budget
Adjusted
Budget
Full Year
Forecast
Budget Year
2017/18
Budget Year +1
2018/19
Budget Year +2
2019/20
To provide, maintain and assure basic services and social upliftment for the Breede
Valley community
Sustainable basic services to
communities 1 660 602 730 425 695 456
To create an enabling environment for employment and poverty eradication through
proactive economic development and tourism
Poverty eradication through LED
and Tourism 2 4 814 4 484 4 735
To ensure a safe, healthy, clean and sustainable external environment for all the
residents in the Breede Valley
Safe, healthy and clean
environment 3 118 503 125 258 132 273
Provide democratic, accountable government for local communities and encourage
involvement of communities and community organisations in the matters of local
government
Good governance and public
participation 4 87 009 91 890 96 540
Ensure a healthy and productive workforce and an effective and efficient work
environment Healthy and productive workforce 5 11 244 11 823 11 323
Assure a sustainable future through sound financial management, continuous revenue
growth corporate governance and risk management practices
Sound financial management,
viabiilty and risk management 6 79 505 84 065 86 756
Allocations to other priorities
Total Expenditure 1 – – – – – – 961 678 1 047 945 1 027 084
References
1. Total expenditure must reconcile to Table A4 Budgeted Financial Performance (revenue and expenditure)
2. Balance of allocations not directly linked to an IDP strategic objective
check op expenditure balance – – – – – – – – –
Current Year 2016/172017/18 Medium Term Revenue & Expenditure
FrameworkRef

WC025 Breede Valley - Supporting Table SA6 Reconciliation of IDP strategic objectives and budget (capital expenditure)
Strategic Objective GoalGoal
Code2013/14 2014/15 2015/16
R thousand
Audited
Outcome
Audited
Outcome
Audited
Outcome
Original
Budget
Adjusted
Budget
Full Year
Forecast
Budget Year
2017/18
Budget Year +1
2018/19
Budget Year +2
2019/20
To provide, maintain and assure basic services and social upliftment for the Breede
Valley community
Sustainable basic services to
communities 1 134 812 152 806 31 679
To create an enabling environment for employment and poverty eradication through
proactive economic development and tourism
Poverty eradication through LED
and Tourism 2 – – –
To ensure a safe, healthy, clean and sustainable external environment for all the
residents in the Breede Valley
Safe, healthy and clean
environment 3 7 898 12 897 2 600
Provide democratic, accountable government for local communities and encourage
involvement of communities and community organisations in the matters of local
government
Good governance and public
participation 4 10 795 10 538 3 843
Ensure a healthy and productive workforce and an effective and efficient work
environment Healthy and productive workforce 5 350 – –
Assure a sustainable future through sound financial management, continuous revenue
growth corporate governance and risk management practices
Sound financial management,
viabiilty and risk management 6 805 800 800
Allocations to other priorities 3
Total Capital Expenditure 1 – – – – – – 154 660 177 041 38 921
References
1. Total capital expenditure must reconcile to Budgeted Capital Expenditure
2. Goal code must be used on Table SA36
3. Balance of allocations not directly linked to an IDP strategic objective
check capital balance – – – – – – – – –
Current Year 2016/172017/18 Medium Term Revenue & Expenditure
FrameworkRef
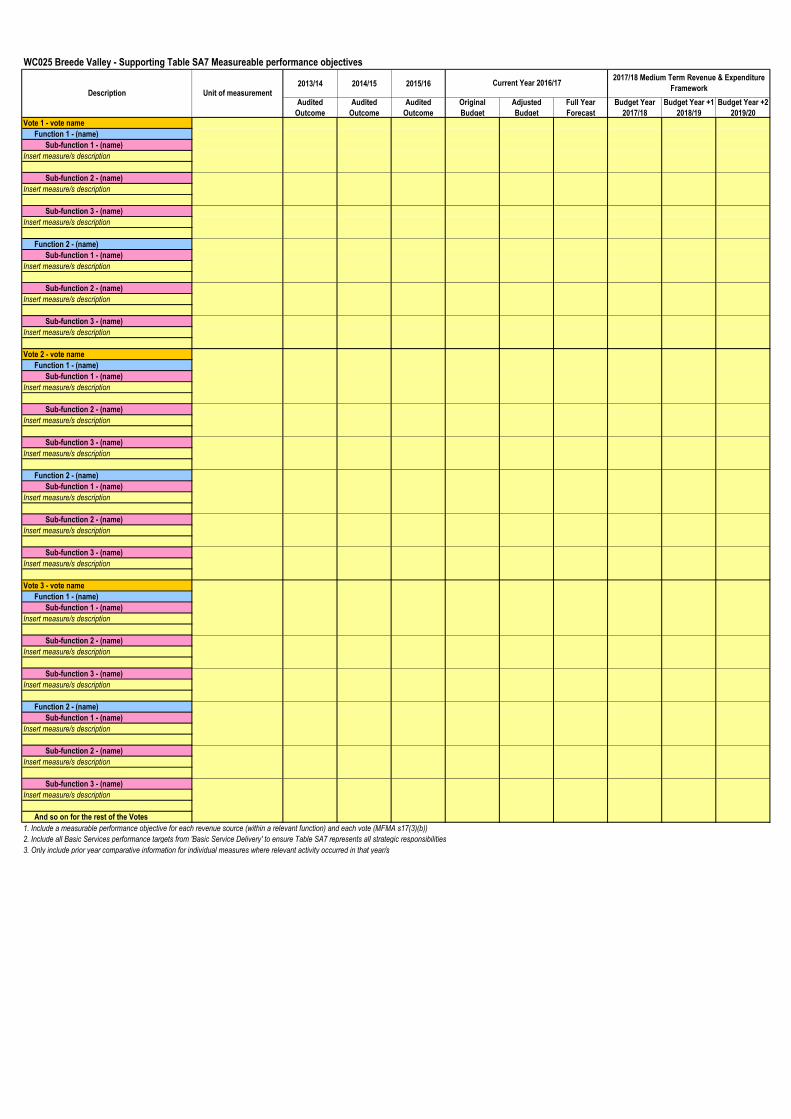
WC025 Breede Valley - Supporting Table SA7 Measureable performance objectives
2013/14 2014/15 2015/16
Audited
Outcome
Audited
Outcome
Audited
Outcome
Original
Budget
Adjusted
Budget
Full Year
Forecast
Budget Year
2017/18
Budget Year +1
2018/19
Budget Year +2
2019/20
Vote 1 - vote name
Function 1 - (name)
Sub-function 1 - (name)
Insert measure/s description
Sub-function 2 - (name)
Insert measure/s description
Sub-function 3 - (name)
Insert measure/s description
Function 2 - (name)
Sub-function 1 - (name)
Insert measure/s description
Sub-function 2 - (name)
Insert measure/s description
Sub-function 3 - (name)
Insert measure/s description
Vote 2 - vote name
Function 1 - (name)
Sub-function 1 - (name)
Insert measure/s description
Sub-function 2 - (name)
Insert measure/s description
Sub-function 3 - (name)
Insert measure/s description
Function 2 - (name)
Sub-function 1 - (name)
Insert measure/s description
Sub-function 2 - (name)
Insert measure/s description
Sub-function 3 - (name)
Insert measure/s description
Vote 3 - vote name
Function 1 - (name)
Sub-function 1 - (name)
Insert measure/s description
Sub-function 2 - (name)
Insert measure/s description
Sub-function 3 - (name)
Insert measure/s description
Function 2 - (name)
Sub-function 1 - (name)
Insert measure/s description
Sub-function 2 - (name)
Insert measure/s description
Sub-function 3 - (name)
Insert measure/s description
And so on for the rest of the Votes
2. Include all Basic Services performance targets from 'Basic Service Delivery' to ensure Table SA7 represents all strategic responsibilities
3. Only include prior year comparative information for individual measures where relevant activity occurred in that year/s
Unit of measurementDescription
Current Year 2016/172017/18 Medium Term Revenue & Expenditure
Framework
1. Include a measurable performance objective for each revenue source (within a relevant function) and each vote (MFMA s17(3)(b))
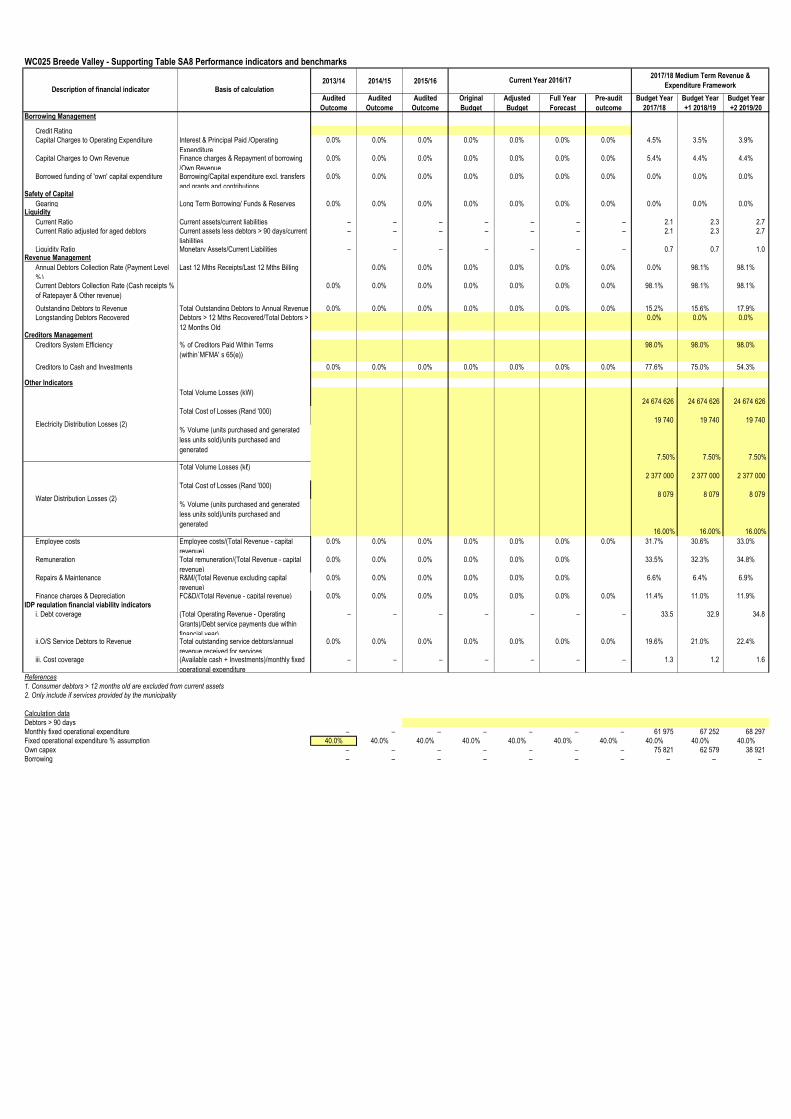
WC025 Breede Valley - Supporting Table SA8 Performance indicators and benchmarks
2013/14 2014/15 2015/16
Audited
Outcome
Audited
Outcome
Audited
Outcome
Original
Budget
Adjusted
Budget
Full Year
Forecast
Pre-audit
outcome
Budget Year
2017/18
Budget Year
+1 2018/19
Budget Year
+2 2019/20Borrowing Management
Credit Rating
Capital Charges to Operating Expenditure Interest & Principal Paid /Operating
Expenditure
0.0% 0.0% 0.0% 0.0% 0.0% 0.0% 0.0% 4.5% 3.5% 3.9%
Capital Charges to Own Revenue Finance charges & Repayment of borrowing
/Own Revenue
0.0% 0.0% 0.0% 0.0% 0.0% 0.0% 0.0% 5.4% 4.4% 4.4%
Borrowed funding of 'own' capital expenditure Borrowing/Capital expenditure excl. transfers
and grants and contributions
0.0% 0.0% 0.0% 0.0% 0.0% 0.0% 0.0% 0.0% 0.0% 0.0%
Safety of Capital
Gearing Long Term Borrowing/ Funds & Reserves 0.0% 0.0% 0.0% 0.0% 0.0% 0.0% 0.0% 0.0% 0.0% 0.0%Liquidity
Current Ratio Current assets/current liabilities – – – – – – – 2.1 2.3 2.7
Current Ratio adjusted for aged debtors Current assets less debtors > 90 days/current
liabilities
– – – – – – – 2.1 2.3 2.7
Liquidity Ratio Monetary Assets/Current Liabilities – – – – – – – 0.7 0.7 1.0 Revenue Management
Annual Debtors Collection Rate (Payment Level
%)
Last 12 Mths Receipts/Last 12 Mths Billing 0.0% 0.0% 0.0% 0.0% 0.0% 0.0% 0.0% 98.1% 98.1%
Current Debtors Collection Rate (Cash receipts %
of Ratepayer & Other revenue)
0.0% 0.0% 0.0% 0.0% 0.0% 0.0% 0.0% 98.1% 98.1% 98.1%
Outstanding Debtors to Revenue Total Outstanding Debtors to Annual Revenue 0.0% 0.0% 0.0% 0.0% 0.0% 0.0% 0.0% 15.2% 15.6% 17.9%
Longstanding Debtors Recovered Debtors > 12 Mths Recovered/Total Debtors >
12 Months Old
0.0% 0.0% 0.0%
Creditors Management
Creditors System Efficiency % of Creditors Paid Within Terms
(within`MFMA' s 65(e))
98.0% 98.0% 98.0%
Creditors to Cash and Investments 0.0% 0.0% 0.0% 0.0% 0.0% 0.0% 0.0% 77.6% 75.0% 54.3%
Other Indicators
Total Volume Losses (kW)24 674 626 24 674 626 24 674 626
Total Cost of Losses (Rand '000)19 740 19 740 19 740
% Volume (units purchased and generated
less units sold)/units purchased and
generated7.50% 7.50% 7.50%
Total Volume Losses (kℓ)2 377 000 2 377 000 2 377 000
Total Cost of Losses (Rand '000)8 079 8 079 8 079
% Volume (units purchased and generated
less units sold)/units purchased and
generated16.00% 16.00% 16.00%
Employee costs Employee costs/(Total Revenue - capital
revenue)
0.0% 0.0% 0.0% 0.0% 0.0% 0.0% 0.0% 31.7% 30.6% 33.0%
Remuneration Total remuneration/(Total Revenue - capital
revenue)
0.0% 0.0% 0.0% 0.0% 0.0% 0.0% 33.5% 32.3% 34.8%
Repairs & Maintenance R&M/(Total Revenue excluding capital
revenue)
0.0% 0.0% 0.0% 0.0% 0.0% 0.0% 6.6% 6.4% 6.9%
Finance charges & Depreciation FC&D/(Total Revenue - capital revenue) 0.0% 0.0% 0.0% 0.0% 0.0% 0.0% 0.0% 11.4% 11.0% 11.9%IDP regulation financial viability indicators
i. Debt coverage (Total Operating Revenue - Operating
Grants)/Debt service payments due within
financial year)
– – – – – – – 33.5 32.9 34.8
ii.O/S Service Debtors to Revenue Total outstanding service debtors/annual
revenue received for services
0.0% 0.0% 0.0% 0.0% 0.0% 0.0% 0.0% 19.6% 21.0% 22.4%
iii. Cost coverage (Available cash + Investments)/monthly fixed
operational expenditure
– – – – – – – 1.3 1.2 1.6
References
1. Consumer debtors > 12 months old are excluded from current assets
2. Only include if services provided by the municipality
Calculation data
Debtors > 90 days
Monthly fixed operational expenditure – – – – – – – 61 975 67 252 68 297
Fixed operational expenditure % assumption 40.0% 40.0% 40.0% 40.0% 40.0% 40.0% 40.0% 40.0% 40.0% 40.0%
Own capex – – – – – – – 75 821 62 579 38 921
Borrowing – – – – – – – – – –
Water Distribution Losses (2)
Description of financial indicator
2017/18 Medium Term Revenue &
Expenditure FrameworkBasis of calculation
Current Year 2016/17
Electricity Distribution Losses (2)
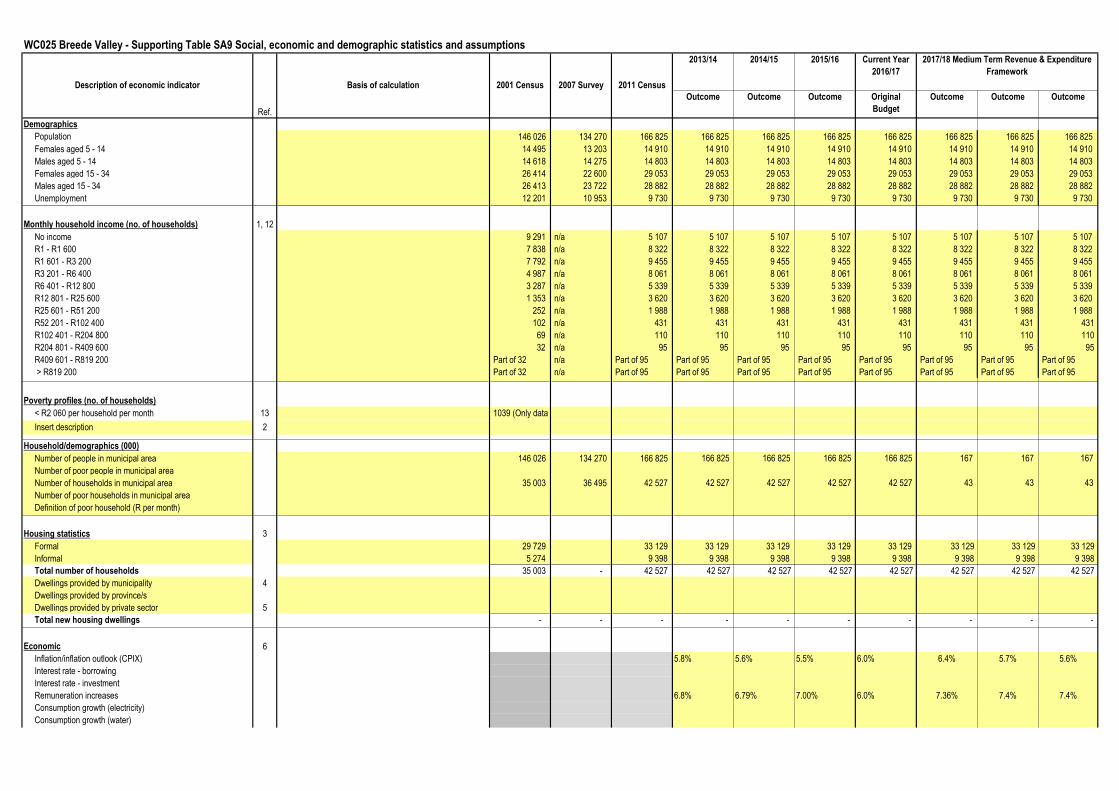
WC025 Breede Valley - Supporting Table SA9 Social, economic and demographic statistics and assumptions2013/14 2014/15 2015/16 Current Year
2016/17
Outcome Outcome Outcome Original
Budget
Outcome Outcome Outcome
Demographics
Population 146 026 134 270 166 825 166 825 166 825 166 825 166 825 166 825 166 825 166 825
Females aged 5 - 14 14 495 13 203 14 910 14 910 14 910 14 910 14 910 14 910 14 910 14 910
Males aged 5 - 14 14 618 14 275 14 803 14 803 14 803 14 803 14 803 14 803 14 803 14 803
Females aged 15 - 34 26 414 22 600 29 053 29 053 29 053 29 053 29 053 29 053 29 053 29 053
Males aged 15 - 34 26 413 23 722 28 882 28 882 28 882 28 882 28 882 28 882 28 882 28 882
Unemployment 12 201 10 953 9 730 9 730 9 730 9 730 9 730 9 730 9 730 9 730
Monthly household income (no. of households) 1, 12
No income 9 291 n/a 5 107 5 107 5 107 5 107 5 107 5 107 5 107 5 107
R1 - R1 600 7 838 n/a 8 322 8 322 8 322 8 322 8 322 8 322 8 322 8 322
R1 601 - R3 200 7 792 n/a 9 455 9 455 9 455 9 455 9 455 9 455 9 455 9 455
R3 201 - R6 400 4 987 n/a 8 061 8 061 8 061 8 061 8 061 8 061 8 061 8 061
R6 401 - R12 800 3 287 n/a 5 339 5 339 5 339 5 339 5 339 5 339 5 339 5 339
R12 801 - R25 600 1 353 n/a 3 620 3 620 3 620 3 620 3 620 3 620 3 620 3 620
R25 601 - R51 200 252 n/a 1 988 1 988 1 988 1 988 1 988 1 988 1 988 1 988
R52 201 - R102 400 102 n/a 431 431 431 431 431 431 431 431
R102 401 - R204 800 69 n/a 110 110 110 110 110 110 110 110
R204 801 - R409 600 32 n/a 95 95 95 95 95 95 95 95
R409 601 - R819 200 Part of 32 n/a Part of 95 Part of 95 Part of 95 Part of 95 Part of 95 Part of 95 Part of 95 Part of 95
> R819 200 Part of 32 n/a Part of 95 Part of 95 Part of 95 Part of 95 Part of 95 Part of 95 Part of 95 Part of 95
Poverty profiles (no. of households)
< R2 060 per household per month 13 1039 (Only data
for >R4801) Insert description 2
Household/demographics (000)
Number of people in municipal area 146 026 134 270 166 825 166 825 166 825 166 825 166 825 167 167 167
Number of poor people in municipal area
Number of households in municipal area 35 003 36 495 42 527 42 527 42 527 42 527 42 527 43 43 43
Number of poor households in municipal area
Definition of poor household (R per month)
Housing statistics 3
Formal 29 729 33 129 33 129 33 129 33 129 33 129 33 129 33 129 33 129
Informal 5 274 9 398 9 398 9 398 9 398 9 398 9 398 9 398 9 398
Total number of households 35 003 - 42 527 42 527 42 527 42 527 42 527 42 527 42 527 42 527
Dwellings provided by municipality 4
Dwellings provided by province/s
Dwellings provided by private sector 5
Total new housing dwellings - - - - - - - - - -
Economic 6
Inflation/inflation outlook (CPIX) 5.8% 5.6% 5.5% 6.0% 6.4% 5.7% 5.6%
Interest rate - borrowing
Interest rate - investment
Remuneration increases 6.8% 6.79% 7.00% 6.0% 7.36% 7.4% 7.4%
Consumption growth (electricity)
Consumption growth (water)
2017/18 Medium Term Revenue & Expenditure
Framework
Description of economic indicator
Ref.
Basis of calculation 2001 Census 2007 Survey 2011 Census
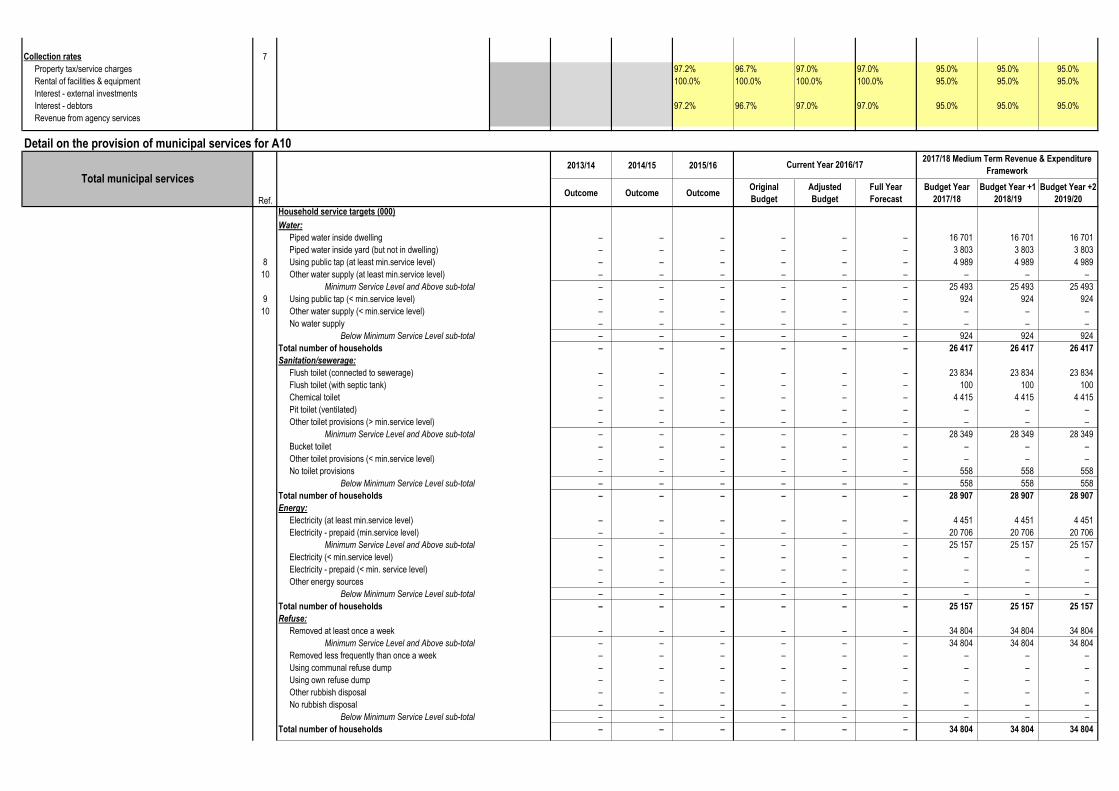
Collection rates 7
Property tax/service charges 97.2% 96.7% 97.0% 97.0% 95.0% 95.0% 95.0%
Rental of facilities & equipment 100.0% 100.0% 100.0% 100.0% 95.0% 95.0% 95.0%
Interest - external investments
Interest - debtors 97.2% 96.7% 97.0% 97.0% 95.0% 95.0% 95.0%
Revenue from agency services
Detail on the provision of municipal services for A10
2013/14 2014/15 2015/16
Ref.Outcome Outcome Outcome
Original
Budget
Adjusted
Budget
Full Year
Forecast
Budget Year
2017/18
Budget Year +1
2018/19
Budget Year +2
2019/20
Household service targets (000)
Water:
Piped water inside dwelling – – – – – – 16 701 16 701 16 701
Piped water inside yard (but not in dwelling) – – – – – – 3 803 3 803 3 803
8 Using public tap (at least min.service level) – – – – – – 4 989 4 989 4 989
10 Other water supply (at least min.service level) – – – – – – – – –
Minimum Service Level and Above sub-total – – – – – – 25 493 25 493 25 493
9 Using public tap (< min.service level) – – – – – – 924 924 924
10 Other water supply (< min.service level) – – – – – – – – –
No water supply – – – – – – – – –
Below Minimum Service Level sub-total – – – – – – 924 924 924
Total number of households – – – – – – 26 417 26 417 26 417
Sanitation/sewerage:
Flush toilet (connected to sewerage) – – – – – – 23 834 23 834 23 834
Flush toilet (with septic tank) – – – – – – 100 100 100
Chemical toilet – – – – – – 4 415 4 415 4 415
Pit toilet (ventilated) – – – – – – – – –
Other toilet provisions (> min.service level) – – – – – – – – –
Minimum Service Level and Above sub-total – – – – – – 28 349 28 349 28 349
Bucket toilet – – – – – – – – –
Other toilet provisions (< min.service level) – – – – – – – – –
No toilet provisions – – – – – – 558 558 558
Below Minimum Service Level sub-total – – – – – – 558 558 558
Total number of households – – – – – – 28 907 28 907 28 907
Energy:
Electricity (at least min.service level) – – – – – – 4 451 4 451 4 451
Electricity - prepaid (min.service level) – – – – – – 20 706 20 706 20 706
Minimum Service Level and Above sub-total – – – – – – 25 157 25 157 25 157
Electricity (< min.service level) – – – – – – – – –
Electricity - prepaid (< min. service level) – – – – – – – – –
Other energy sources – – – – – – – – –
Below Minimum Service Level sub-total – – – – – – – – –
Total number of households – – – – – – 25 157 25 157 25 157
Refuse:
Removed at least once a week – – – – – – 34 804 34 804 34 804
Minimum Service Level and Above sub-total – – – – – – 34 804 34 804 34 804
Removed less frequently than once a week – – – – – – – – –
Using communal refuse dump – – – – – – – – –
Using own refuse dump – – – – – – – – –
Other rubbish disposal – – – – – – – – –
No rubbish disposal – – – – – – – – –
Below Minimum Service Level sub-total – – – – – – – – –
Total number of households – – – – – – 34 804 34 804 34 804
Total municipal services
Current Year 2016/172017/18 Medium Term Revenue & Expenditure
Framework

2013/14 2014/15 2015/16
Ref.Outcome Outcome Outcome
Original
Budget
Adjusted
Budget
Full Year
Forecast
Budget Year
2017/18
Budget Year +1
2018/19
Budget Year +2
2019/20
Household service targets (000)
Water:
Piped water inside dwelling 16 701 16 701 16 701
Piped water inside yard (but not in dwelling) 3 803 3 803 3 803
8 Using public tap (at least min.service level) 4 989 4 989 4 989
10 Other water supply (at least min.service level) – – –
Minimum Service Level and Above sub-total – – – – – – 25 493 25 493 25 493
9 Using public tap (< min.service level) 924 924 924
10 Other water supply (< min.service level) – – –
No water supply – – –
Below Minimum Service Level sub-total – – – – – – 924 924 924
Total number of households – – – – – – 26 417 26 417 26 417
Sanitation/sewerage:
Flush toilet (connected to sewerage) 23 834 23 834 23 834
Flush toilet (with septic tank) 100 100 100
Chemical toilet 4 415 4 415 4 415
Pit toilet (ventilated) – – –
Other toilet provisions (> min.service level) – – –
Minimum Service Level and Above sub-total – – – – – – 28 349 28 349 28 349
Bucket toilet – – –
Other toilet provisions (< min.service level) – – –
No toilet provisions 558 558 558
Below Minimum Service Level sub-total – – – – – – 558 558 558
Total number of households – – – – – – 28 907 28 907 28 907
Energy:
Electricity (at least min.service level) 4 451 4 451 4 451
Electricity - prepaid (min.service level) 20 706 20 706 20 706
Minimum Service Level and Above sub-total – – – – – – 25 157 25 157 25 157
Electricity (< min.service level) – – –
Electricity - prepaid (< min. service level) – – –
Other energy sources – – –
Below Minimum Service Level sub-total – – – – – – – – –
Total number of households – – – – – – 25 157 25 157 25 157
Refuse:
Removed at least once a week 34 804 34 804 34 804
Minimum Service Level and Above sub-total – – – – – – 34 804 34 804 34 804
Removed less frequently than once a week – – –
Using communal refuse dump – – –
Using own refuse dump – – –
Other rubbish disposal – – –
No rubbish disposal – – –
Below Minimum Service Level sub-total – – – – – – – – –
Total number of households – – – – – – 34 804 34 804 34 804
Municipal in-house services
Current Year 2016/172017/18 Medium Term Revenue & Expenditure
Framework

2013/14 2014/15 2015/16
Outcome Outcome OutcomeOriginal
Budget
Adjusted
Budget
Full Year
Forecast
Budget Year
2017/18
Budget Year +1
2018/19
Budget Year +2
2019/20
Electricity Ref. Location of households for each type of FBS
List type of FBS service
Formal settlements - (50 kwh per indigent household
per month R'000) 3 642 035 3 849 631 4 065 211
Number of HH receiving this type of FBS 8 000 8 000 8 000
Informal settlements (R'000) – – –
Number of HH receiving this type of FBS – – –
Informal settlements targeted for upgrading (R'000) – – –
Number of HH receiving this type of FBS – – –
Living in informal backyard rental agreement (R'000) – – –
Number of HH receiving this type of FBS – – –
Other (R'000) – – –
Number of HH receiving this type of FBS – – –
Total cost of FBS - Electricity for informal settlements – – – – – – – – –
Water Ref. Location of households for each type of FBS
List type of FBS service
Formal settlements - (6 kilolitre per indigent household
per month R'000) 6 350 876 6 712 876 7 088 798
Number of HH receiving this type of FBS 8 000 8 000 8 000
Informal settlements (R'000) 5 874 990 6 350 876 6 350 876
Number of HH receiving this type of FBS 8 797 8 797 8 797
Informal settlements targeted for upgrading (R'000) – – –
Number of HH receiving this type of FBS – – –
Living in informal backyard rental agreement (R'000) – – –
Number of HH receiving this type of FBS – – –
Other (R'000) – – –
Number of HH receiving this type of FBS – – –
Total cost of FBS - Water for informal settlements – – – – – – 5 874 990 6 350 876 6 350 876
Sanitation Ref. Location of households for each type of FBS
List type of FBS service
Formal settlements - (free sanitation service to indigent
households) 12 097 525 12 787 084 13 503 161
Number of HH receiving this type of FBS 7 750 7 750 7 750
Informal settlements (R'000) 3 033 720 3 215 743 3 408 688
Number of HH receiving this type of FBS 8 797 8 797 8 797
Informal settlements targeted for upgrading (R'000) – – –
Number of HH receiving this type of FBS – – –
Living in informal backyard rental agreement (R'000) – – –
Number of HH receiving this type of FBS – – –
Other (R'000) – – –
Number of HH receiving this type of FBS – – –
Total cost of FBS - Sanitation for informal settlements – – – – – – 3 033 720 3 215 743 3 408 688
Refuse Removal Ref. Location of households for each type of FBS
List type of FBS service
Formal settlements - (removed once a week to indigent
households) 7 650 149 8 086 208 8 539 035
Number of HH receiving this type of FBS 8 000 8 000 8 000
Informal settlements (R'000)
Number of HH receiving this type of FBS 8 797 8 797 8 797
Informal settlements targeted for upgrading (R'000) – – –
Number of HH receiving this type of FBS – – –
Living in informal backyard rental agreement (R'000) – – –
Number of HH receiving this type of FBS – – –
Other (R'000) – – –
Number of HH receiving this type of FBS – – –
Total cost of FBS - Refuse Removal for informal settlements – – – – – – – – –
Current Year 2016/172017/18 Medium Term Revenue & Expenditure
FrameworkDetail of Free Basic Services (FBS) provided

WC025 Breede Valley Supporting Table SA10 Funding measurement
2013/14 2014/15 2015/16
Audited
Outcome
Audited
Outcome
Audited
Outcome
Original
Budget
Adjusted
Budget
Full Year
Forecast
Pre-audit
outcome
Budget Year
2017/18
Budget Year
+1 2018/19
Budget Year
+2 2019/20Funding measures
Cash/cash equivalents at the year end - R'000 18(1)b 1 – – – – – – – 82 748 81 346 106 639
Cash + investments at the yr end less applications - R'000 18(1)b 2 – – – – – – – 108 549 131 768 176 173
Cash year end/monthly employee/supplier payments 18(1)b 3 – – – – – – – 1.3 1.2 1.6
Surplus/(Deficit) excluding depreciation offsets: R'000 18(1) 4 – – – – – – – 61 647 99 859 (17 622)
Service charge rev % change - macro CPIX target exclusive 18(1)a,(2) 5 N.A. (6.0%) (6.0%) (6.0%) (6.0%) (6.0%) (6.0%) (6.0%) (0.3%) (0.4%)
Cash receipts % of Ratepayer & Other revenue 18(1)a,(2) 6 0.0% 0.0% 0.0% 0.0% 0.0% 0.0% 0.0% 92.2% 92.2% 92.2%
Debt impairment expense as a % of total billable revenue 18(1)a,(2) 7 0.0% 0.0% 0.0% 0.0% 0.0% 0.0% 0.0% 8.1% 8.1% 8.1%
Capital payments % of capital expenditure 18(1)c;19 8 0.0% 0.0% 0.0% 0.0% 0.0% 0.0% 0.0% 100.0% 100.0% 100.0%
Borrowing receipts % of capital expenditure (excl. transfers) 18(1)c 9 0.0% 0.0% 0.0% 0.0% 0.0% 0.0% 0.0% 0.0% 0.0% 0.0%
Grants % of Govt. legislated/gazetted allocations 18(1)a 10 100.0% 100.0% 100.0%
Current consumer debtors % change - incr(decr) 18(1)a 11 N.A. 0.0% 0.0% 0.0% 0.0% 0.0% 0.0% 0.0% 13.5% 12.7%
Long term receivables % change - incr(decr) 18(1)a 12 N.A. 0.0% 0.0% 0.0% 0.0% 0.0% 0.0% 0.0% (5.0%) (5.0%)
R&M % of Property Plant & Equipment 20(1)(vi) 13 0.0% 0.0% 0.0% 0.0% 0.0% 0.0% 0.0% 3.1% 3.1% 3.4%
Asset renewal % of capital budget 20(1)(vi) 14 0.0% 0.0% 0.0% 0.0% 0.0% 0.0% 0.0% 39.6% 27.0% 77.2%
References
1. Positive cash balances indicative of minimum compliance - subject to 2
2. Deduct cash and investment applications (defined) from cash balances
3. Indicative of sufficient liquidity to meet average monthly operating payments
4. Indicative of funded operational requirements
5. Indicative of adherence to macro-economic targets (prior to 2003/04 revenue not available for high capacity municipalities and later for other capacity classifications)
6. Realistic average cash collection forecasts as % of annual billed revenue
7. Realistic average increase in debt impairment (doubtful debt) provision
8. Indicative of planned capital expenditure level & cash payment timing
9. Indicative of compliance with borrowing 'only' for the capital budget - should not exceed 100% unless refinancing
10. Substantiation of National/Province allocations included in budget
11. Indicative of realistic current arrear debtor collection targets (prior to 2003/04 revenue not available for high capacity municipalities and later for other capacity classifications)
12. Indicative of realistic long term arrear debtor collection targets (prior to 2003/04 revenue not available for high capacity municipalities and later for other capacity classifications)
13. Indicative of a credible allowance for repairs & maintenance of assets - functioning assets revenue protection
14. Indicative of a credible allowance for asset renewal (requires analysis of asset renewal projects as % of total capital projects - detailed capital plan) - functioning assets revenue protection
Supporting indicators% incr total service charges (incl prop rates) 18(1)a 0.0% 0.0% 0.0% 0.0% 0.0% 0.0% 0.0% 5.7% 5.6%
% incr Property Tax 18(1)a 0.0% 0.0% 0.0% 0.0% 0.0% 0.0% 0.0% 5.7% 5.6%
% incr Service charges - electricity revenue 18(1)a 0.0% 0.0% 0.0% 0.0% 0.0% 0.0% 0.0% 5.7% 5.6%
% incr Service charges - water revenue 18(1)a 0.0% 0.0% 0.0% 0.0% 0.0% 0.0% 0.0% 5.7% 5.6%
% incr Service charges - sanitation revenue 18(1)a 0.0% 0.0% 0.0% 0.0% 0.0% 0.0% 0.0% 5.7% 5.6%
% incr Service charges - refuse revenue 18(1)a 0.0% 0.0% 0.0% 0.0% 0.0% 0.0% 0.0% 5.7% 5.6%
% incr in Service charges - other 18(1)a 0.0% 0.0% 0.0% 0.0% 0.0% 0.0% 0.0% 5.7% 5.6%
Total billable revenue 18(1)a – – – – – – – 683 977 722 964 763 450
Service charges – – – – – – – 683 977 722 964 763 450
Property rates – – – – – – – 137 679 145 526 153 676
Service charges - electricity revenue – – – – – – – 400 316 423 134 446 830
Service charges - water revenue – – – – – – – 65 274 68 995 72 859
Service charges - sanitation revenue – – – – – – – 57 393 60 664 64 061
Service charges - refuse removal – – – – – – – 41 015 43 352 45 780
Service charges - other – – – – – – – (17 700) (18 709) (19 756)
Rental of facilities and equipment – – – – – – – 14 492 15 318 16 176
Capital expenditure excluding capital grant funding – – – – – – – 75 821 62 579 38 921
Cash receipts from ratepayers 18(1)a – – – – – – – 724 952 766 274 809 185
Ratepayer & Other revenue 18(1)a – – – – – – – 786 168 830 980 877 515
Change in consumer debtors (current and non-current) – – – – – – – 143 426 18 081 19 415
Operating and Capital Grant Revenue 18(1)a – – – – – – – 225 411 304 409 118 836
Capital expenditure - total 20(1)(vi) – – – – – – – 154 660 177 041 38 921
Capital expenditure - renewal 20(1)(vi) – – – – – – 61 264 47 798 30 063
Supporting benchmarks
Growth guideline maximum 6.0% 6.0% 6.0% 6.0% 6.0% 6.0% 6.0% 6.0% 6.0% 6.0%
CPI guideline 4.3% 3.9% 4.6% 5.0% 5.0% 5.0% 5.0% 5.4% 5.6% 5.4%
DoRA operating grants total MFY 99 123 107 593 118 836
DoRA capital grants total MFY 37 214 40 087 –
Provincial operating grants 46 349 81 254 –
Provincial capital grants 41 625 74 375 –
District Municipality grants 1 100 1 100 –
Total gazetted/advised national, provincial and district grants 225 411 304 409 118 836
Average annual collection rate (arrears inclusive)
DoRA operating
Local Government Equitable Share 97 573 106 043 118 836
Local Government Financial Management Grant 1 550 1 550 –
Municipal Systems Improvement grant – – –
Expanded Public Works Programme Integrated grant – – – 99 123 107 593 118 836
DoRA capital
Municipal Infrastructure grant 35 214 37 087 –
Integrated National Electification Program 2 000 3 000 –
37 214 40 087 –
Trend
Change in consumer debtors (current and non-current) – – – – 143 426 18 081 19 415 – – –
Total Operating Revenue – – – – – – – 944 486 1 033 342 1 009 461
Total Operating Expenditure – – – – – – – 961 678 1 047 945 1 027 084
Operating Performance Surplus/(Deficit) – – – – – – – (17 192) (14 603) (17 622)
Cash and Cash Equivalents (30 June 2012) 82 748
Revenue
% Increase in Total Operating Revenue 0.0% 0.0% 0.0% 0.0% 0.0% 0.0% 0.0% 9.4% (2.3%)
% Increase in Property Rates Revenue 0.0% 0.0% 0.0% 0.0% 0.0% 0.0% 0.0% 5.7% 5.6%
% Increase in Electricity Revenue 0.0% 0.0% 0.0% 0.0% 0.0% 0.0% 0.0% 5.7% 5.6%
% Increase in Property Rates & Services Charges 0.0% 0.0% 0.0% 0.0% 0.0% 0.0% 0.0% 5.7% 5.6%
Expenditure
% Increase in Total Operating Expenditure 0.0% 0.0% 0.0% 0.0% 0.0% 0.0% 0.0% 9.0% (2.0%)
% Increase in Employee Costs 0.0% 0.0% 0.0% 0.0% 0.0% 0.0% 0.0% 5.5% 5.4%
% Increase in Electricity Bulk Purchases 0.0% 0.0% 0.0% 0.0% 0.0% 0.0% 0.0% 5.7% 5.6%
Average Cost Per Budgeted Employee Position (Remuneration) 0 0 288392.3507
Average Cost Per Councillor (Remuneration) 0 0 401653.2102
R&M % of PPE 0.0% 0.0% 0.0% 0.0% 0.0% 0.0% 3.1% 3.1% 3.4%
Asset Renewal and R&M as a % of PPE 0.0% 0.0% 0.0% 0.0% 0.0% 0.0% 6.0% 5.0% 5.0%
Debt Impairment % of Total Billable Revenue 0.0% 0.0% 0.0% 0.0% 0.0% 0.0% 0.0% 8.1% 8.1% 8.1%
Capital Revenue
Internally Funded & Other (R'000) – – – – – – – 65 321 62 579 38 921
Description
2017/18 Medium Term Revenue & Expenditure
FrameworkMFMA
sectionRef
Current Year 2016/17

WC025 Breede Valley Supporting Table SA10 Funding measurement
2013/14 2014/15 2015/16
Audited
Outcome
Audited
Outcome
Audited
Outcome
Original
Budget
Adjusted
Budget
Full Year
Forecast
Pre-audit
outcome
Budget Year
2017/18
Budget Year
+1 2018/19
Budget Year
+2 2019/20
Description
2017/18 Medium Term Revenue & Expenditure
FrameworkMFMA
sectionRef
Current Year 2016/17
Borrowing (R'000) – – – – – – – 10 500 – –
Grant Funding and Other (R'000) – – – – – – – 78 839 114 462 –
Internally Generated funds % of Non Grant Funding 0.0% 0.0% 0.0% 0.0% 0.0% 0.0% 0.0% 86.2% 100.0% 100.0%
Borrowing % of Non Grant Funding 0.0% 0.0% 0.0% 0.0% 0.0% 0.0% 0.0% 13.8% 0.0% 0.0%
Grant Funding % of Total Funding 0.0% 0.0% 0.0% 0.0% 0.0% 0.0% 0.0% 51.0% 64.7% 0.0%
Capital Expenditure
Total Capital Programme (R'000) – – – – – – – 154 660 177 041 38 921
Asset Renewal – – – – – – – 61 264 47 798 30 063
Asset Renewal % of Total Capital Expenditure 0.0% 0.0% 0.0% 0.0% 0.0% 0.0% 0.0% 39.6% 27.0% 77.2%
Cash
Cash Receipts % of Rate Payer & Other 0.0% 0.0% 0.0% 0.0% 0.0% 0.0% 0.0% 92.2% 92.2% 92.2%
Cash Coverage Ratio – – – – – – – 0 0 0
Borrowing
Credit Rating (2009/10) 0
Capital Charges to Operating 0.0% 0.0% 0.0% 0.0% 0.0% 0.0% 0.0% 4.5% 3.5% 3.9%
Borrowing Receipts % of Capital Expenditure 0.0% 0.0% 0.0% 0.0% 0.0% 0.0% 0.0% 0.0% 0.0% 0.0%
Reserves
Surplus/(Deficit) – – – – – – – 108 549 131 768 176 173
Free Services
Free Basic Services as a % of Equitable Share 0.0% 0.0% 0.0% 0.0% 0.0% 0.0% 39.6% 38.7% 36.1%Free Services as a % of Operating Revenue
(excl operational transfers) 0.0% 0.0% 0.0% 0.0% 0.0% 0.0% 4.7% 4.7% 4.7%
High Level Outcome of Funding Compliance
Total Operating Revenue – – – – – – – 944 486 1 033 342 1 009 461
Total Operating Expenditure – – – – – – – 961 678 1 047 945 1 027 084
Surplus/(Deficit) Budgeted Operating Statement – – – – – – – (17 192) (14 603) (17 622)
Surplus/(Deficit) Considering Reserves and Cash Backing – – – – – – – 108 549 131 768 176 173
MTREF Funded (1) / Unfunded (0) 15 1 1 1 1 1 1 1 1 1 1
MTREF Funded / Unfunded 15
References
15. Subject to figures provided in Schedule.

WC025 Breede Valley - Supporting Table SA11 Property rates summary
2013/14 2014/15 2015/16
Audited
Outcome
Audited
Outcome
Audited
Outcome
Original
Budget
Adjusted
Budget
Full Year
Forecast
Budget Year
2017/18
Budget Year +1
2018/19
Budget Year +2
2019/20
Valuation: 1
Date of valuation:
Financial year valuation used 2017/07/01
Municipal by-laws s6 in place? (Y/N) 2 Yes
Municipal/assistant valuer appointed? (Y/N) Yes
Municipal partnership s38 used? (Y/N) N N N
No. of assistant valuers (FTE) 3 1 1 1
No. of data collectors (FTE) 3 7 7 7
No. of internal valuers (FTE) 3 – – –
No. of external valuers (FTE) 3 1 1 1
No. of additional valuers (FTE) 4 2 2 2
Valuation appeal board established? (Y/N) Yes
Implementation time of new valuation roll (mths) 12
No. of properties 5 29 000 29 000 29 000
No. of sectional title values 5 646 646 646
No. of unreasonably difficult properties s7(2) – – –
No. of supplementary valuations 1 1 1
No. of valuation roll amendments – – –
No. of objections by rate payers 10 10 10
No. of appeals by rate payers – – –
No. of successful objections 8 5 5 5
No. of successful objections > 10% 8 1 1 1
Supplementary valuation 1 1 1
Public service infrastructure value (Rm) 5 27 27 27
Municipality owned property value (Rm) 717 717 717
Valuation reductions:
Valuation reductions-public infrastructure (Rm) – – –
Valuation reductions-nature reserves/park (Rm) – – –
Valuation reductions-mineral rights (Rm) – – –
Valuation reductions-R15,000 threshold (Rm) 292 310 328
Valuation reductions-public worship (Rm) 147 156 165
Valuation reductions-other (Rm) 159 169 179
Total valuation reductions: – – – – – – 598 634 672
Total value used for rating (Rm) 5 – – –
Total land value (Rm) 5 23 675 25 095 26 601
Total value of improvements (Rm) 5 – – –
Total market value (Rm) 5 23 675 25 095 26 601
Rating:
Residential rate used to determine rate for other
categories? (Y/N)Yes
Differential rates used? (Y/N) 5 Yes
Limit on annual rate increase (s20)? (Y/N) Yes Yes Yes
Special rating area used? (Y/N) Yes
Phasing-in properties s21 (number) 0 0 0
Rates policy accompanying budget? (Y/N) Yes
Fixed amount minimum value (R'000) 70
Non-residential prescribed ratio s19? (%) 100.0%
Rate revenue:
Rate revenue budget (R '000) 6 137 679 145 526 153 676
Rate revenue expected to collect (R'000) 6 130 795 138 250 145 992
Expected cash collection rate (%) 95.0% 95.0% 95.0%
Special rating areas (R'000) 7 1 000 1 060 1 124
Rebates, exemptions - indigent (R'000) 3 180 3 371 3 573
Rebates, exemptions - pensioners (R'000) – – –
Rebates, exemptions - bona fide farm. (R'000) – – –
Rebates, exemptions - other (R'000) 21 994 23 238 24 526
Phase-in reductions/discounts (R'000) – – –
Total rebates,exemptns,reductns,discs (R'000) – – – – – – 25 174 26 609 28 099
References
1. All numbers to be expressed as whole numbers except FTEs and Rates in the Rand
2. To give effect to rates policy
3. Full Time Equivalent (FTE) should be expressed to one decimal place and takes into account full time and part time staff
4. Required to implement new system (FTE)
5. Provide relevant information for historical comparisons. Must reconcile to the total of Table SA12
6. Current and budget year must reconcile to Table A4 Budgeted Financial Performance (revenue and expenditure)
7. Included in rate revenue budget
8. In favour of the rate-payer
Current Year 2016/172017/18 Medium Term Revenue & Expenditure
FrameworkRefDescription

WC025 Breede Valley - Supporting Table SA12a Property rates by category (current year)
Description RefResi. Indust. Bus. &
Comm.
Farm props. State-owned Muni props. Public
service infra.
Private
owned towns
Formal &
Informal
Settle.
Comm. Land State trust
land
Section
8(2)(n) (note
1)
Protect.
Areas
National
Monum/ts
Public
benefit
organs.
Mining
Props.
Current Year 2016/17
Valuation:
No. of properties
No. of sectional title property values
No. of unreasonably difficult properties s7(2)
No. of supplementary valuations
Supplementary valuation (Rm)
No. of valuation roll amendments
No. of objections by rate-payers
No. of appeals by rate-payers
No. of appeals by rate-payers finalised
No. of successful objections 5
No. of successful objections > 10% 5
Estimated no. of properties not valued
Years since last valuation (select)
Frequency of valuation (select)
Method of valuation used (select)
Base of valuation (select)
Phasing-in properties s21 (number)
Combination of rating types used? (Y/N)
Flat rate used? (Y/N)
Is balance rated by uniform rate/variable rate?
Valuation reductions:
Valuation reductions-public infrastructure (Rm)
Valuation reductions-nature reserves/park (Rm)
Valuation reductions-mineral rights (Rm)
Valuation reductions-R15,000 threshold (Rm)
Valuation reductions-public worship (Rm)
Valuation reductions-other (Rm) 2
Total valuation reductions:
Total value used for rating (Rm) 6
Total land value (Rm) 6
Total value of improvements (Rm) 6
Total market value (Rm) 6
Rating:
Average rate 3
Rate revenue budget (R '000)
Rate revenue expected to collect (R'000)
Expected cash collection rate (%) 4
Special rating areas (R'000)
Rebates, exemptions - indigent (R'000)
Rebates, exemptions - pensioners (R'000)
Rebates, exemptions - bona fide farm. (R'000)
Rebates, exemptions - other (R'000)
Phase-in reductions/discounts (R'000)
Total rebates,exemptns,reductns,discs (R'000)
References
1. Land & Assistance Act, Restitution of Land Rights, Communual Property Associations
2. Include value of additional reductions is 'free' value greater than MPRA minimum.
3. Average rate - cents in the Rand. Eg 10.26 cents in the Rand is 0.1026, expressed to 6 decimal places maximum
4. Include arrears collections
5. In favour of the rate-payer
6. Provide relevant information for historical comparisons.
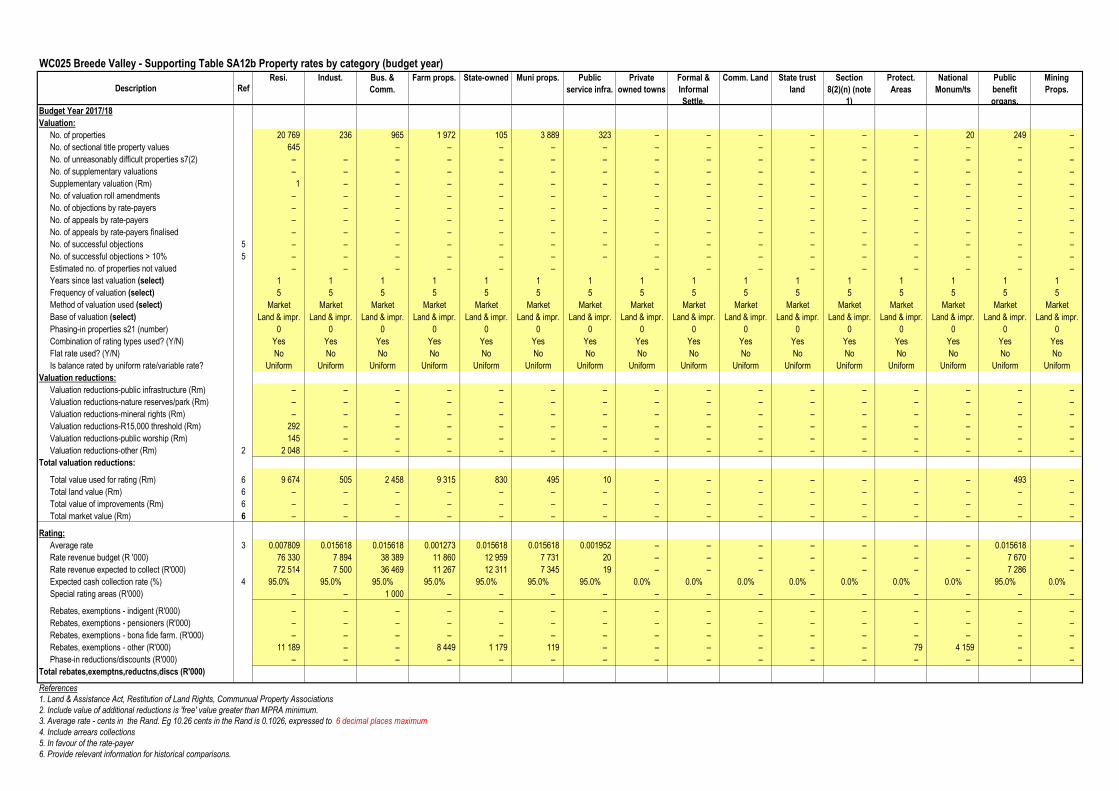
WC025 Breede Valley - Supporting Table SA12b Property rates by category (budget year)
Description RefResi. Indust. Bus. &
Comm.
Farm props. State-owned Muni props. Public
service infra.
Private
owned towns
Formal &
Informal
Settle.
Comm. Land State trust
land
Section
8(2)(n) (note
1)
Protect.
Areas
National
Monum/ts
Public
benefit
organs.
Mining
Props.
Budget Year 2017/18
Valuation:
No. of properties 20 769 236 965 1 972 105 3 889 323 – – – – – – 20 249 –
No. of sectional title property values 645 – – – – – – – – – – – – – –
No. of unreasonably difficult properties s7(2) – – – – – – – – – – – – – – – –
No. of supplementary valuations – – – – – – – – – – – – – – – –
Supplementary valuation (Rm) 1 – – – – – – – – – – – – – – –
No. of valuation roll amendments – – – – – – – – – – – – – – – –
No. of objections by rate-payers – – – – – – – – – – – – – – – –
No. of appeals by rate-payers – – – – – – – – – – – – – – – –
No. of appeals by rate-payers finalised – – – – – – – – – – – – – – – –
No. of successful objections 5 – – – – – – – – – – – – – – – –
No. of successful objections > 10% 5 – – – – – – – – – – – – – – – –
Estimated no. of properties not valued – – – – – – – – – – – – – – –
Years since last valuation (select) 1 1 1 1 1 1 1 1 1 1 1 1 1 1 1 1
Frequency of valuation (select) 5 5 5 5 5 5 5 5 5 5 5 5 5 5 5 5
Method of valuation used (select) Market Market Market Market Market Market Market Market Market Market Market Market Market Market Market Market
Base of valuation (select) Land & impr. Land & impr. Land & impr. Land & impr. Land & impr. Land & impr. Land & impr. Land & impr. Land & impr. Land & impr. Land & impr. Land & impr. Land & impr. Land & impr. Land & impr. Land & impr.
Phasing-in properties s21 (number) 0 0 0 0 0 0 0 0 0 0 0 0 0 0 0 0
Combination of rating types used? (Y/N) Yes Yes Yes Yes Yes Yes Yes Yes Yes Yes Yes Yes Yes Yes Yes Yes
Flat rate used? (Y/N) No No No No No No No No No No No No No No No No
Is balance rated by uniform rate/variable rate? Uniform Uniform Uniform Uniform Uniform Uniform Uniform Uniform Uniform Uniform Uniform Uniform Uniform Uniform Uniform Uniform
Valuation reductions:
Valuation reductions-public infrastructure (Rm) – – – – – – – – – – – – – – – –
Valuation reductions-nature reserves/park (Rm) – – – – – – – – – – – – – – – –
Valuation reductions-mineral rights (Rm) – – – – – – – – – – – – – – – –
Valuation reductions-R15,000 threshold (Rm) 292 – – – – – – – – – – – – – – –
Valuation reductions-public worship (Rm) 145 – – – – – – – – – – – – – – –
Valuation reductions-other (Rm) 2 2 048 – – – – – – – – – – – – – – –
Total valuation reductions:
Total value used for rating (Rm) 6 9 674 505 2 458 9 315 830 495 10 – – – – – – – 493 –
Total land value (Rm) 6 – – – – – – – – – – – – – – – –
Total value of improvements (Rm) 6 – – – – – – – – – – – – – – – –
Total market value (Rm) 6 – – – – – – – – – – – – – – – –
Rating:
Average rate 3 0.007809 0.015618 0.015618 0.001273 0.015618 0.015618 0.001952 – – – – – – – 0.015618 –
Rate revenue budget (R '000) 76 330 7 894 38 389 11 860 12 959 7 731 20 – – – – – – – 7 670 –
Rate revenue expected to collect (R'000) 72 514 7 500 36 469 11 267 12 311 7 345 19 – – – – – – – 7 286 –
Expected cash collection rate (%) 4 95.0% 95.0% 95.0% 95.0% 95.0% 95.0% 95.0% 0.0% 0.0% 0.0% 0.0% 0.0% 0.0% 0.0% 95.0% 0.0%
Special rating areas (R'000) – – 1 000 – – – – – – – – – – – – –
Rebates, exemptions - indigent (R'000) – – – – – – – – – – – – – – – –
Rebates, exemptions - pensioners (R'000) – – – – – – – – – – – – – – – –
Rebates, exemptions - bona fide farm. (R'000) – – – – – – – – – – – – – – – –
Rebates, exemptions - other (R'000) 11 189 – – 8 449 1 179 119 – – – – – – 79 4 159 – –
Phase-in reductions/discounts (R'000) – – – – – – – – – – – – – – – –
Total rebates,exemptns,reductns,discs (R'000)
References
1. Land & Assistance Act, Restitution of Land Rights, Communual Property Associations
2. Include value of additional reductions is 'free' value greater than MPRA minimum.
3. Average rate - cents in the Rand. Eg 10.26 cents in the Rand is 0.1026, expressed to 6 decimal places maximum
4. Include arrears collections
5. In favour of the rate-payer
6. Provide relevant information for historical comparisons.

WC025 Breede Valley - Supporting Table SA13a Service Tariffs by category
2017/18 Medium Term Revenue & Expenditure
Framework
Budget Year
2017/18
Budget Year +1
2018/19
Budget Year +2
2019/20
Property rates (rate in the Rand) 1
Residential properties 0.0078 0.0083 0.0088
Residential properties - vacant land 0.0078 0.0083 0.0088
Formal/informal settlements - - -
Small holdings - - -
Farm properties - used 0.0013 0.0013 0.0014
Farm properties - not used - - -
Industrial properties 0.0156 0.0166 0.0175
Business and commercial properties 0.0156 0.0166 0.0175
Communal land - residential - - -
Communal land - small holdings - - -
Communal land - farm property - - -
Communal land - business and commercial - - -
Communal land - other - - -
State-owned properties 0.0156 0.0166 0.0175
Municipal properties 0.0156 0.0166 0.0175
Public service infrastructure 0.0020 0.0021 0.0022
Privately owned towns serviced by the owner - - -
State trust land - - -
Restitution and redistribution properties - - -
Protected areas - - -
National monuments properties 0.0156 0.0166 0.0175
Exemptions, reductions and rebates (Rands)
Residential properties
R15 000 threshhold rebate 15 000 15 000 15 000 15 000 15 000 15 000 15 000
General residential rebate 70 000 70 000 70 000
Indigent rebate or exemption 65 000 65 000 65 000
Pensioners/social grants rebate or exemption - - -
Temporary relief rebate or exemption - - -
Bona fide farmers rebate or exemption - - -
Other rebates or exemptions 2 - - -
Water tariffs
Domestic
Basic charge/fixed fee (Rands/month) - - -
Service point - vacant land (Rands/month) - - -
Water usage - flat rate tariff (c/kl) - - -
Water usage - life line tariff (describe structure) - - -
Water usage - Block 1 (c/kl) (fill in thresholds) 6.52 6.9082 7.3227
Water usage - Block 2 (c/kl) (fill in thresholds) 6.51 6.9054 7.3197
Water usage - Block 3 (c/kl) (fill in thresholds) 8.37 8.8736 9.4060
Water usage - Block 4 (c/kl) (fill in thresholds) 11.17 11.8427 12.5532
Other 2 - - -
Waste water tariffs
Domestic
Basic charge/fixed fee (Rands/month) 245.61 260.35 275.97
Service point - vacant land (Rands/month) - - -
Waste water - flat rate tariff (c/kl) - - -
Volumetric charge - Block 1 (c/kl) (fill in structure) - - -
Volumetric charge - Block 2 (c/kl) (fill in structure) - - -
Volumetric charge - Block 3 (c/kl) (fill in structure) - - -
Volumetric charge - Block 4 (c/kl) (fill in structure) - - -
Other 2 - - -
Electricity tariffs
Domestic
Basic charge/fixed fee (Rands/month) - - -
Service point - vacant land (Rands/month) - - -
FBE (how is this targeted?) - - -
Life-line tariff - meter (describe structure) - - -
Life-line tariff - prepaid (describe structure) - - -
Flat rate tariff - meter (c/kwh) - - -
Flat rate tariff - prepaid(c/kwh) - - -
Meter - IBT Block 1 (c/kwh) (fill in thresholds) 0.86 0.9071 0.9616
Meter - IBT Block 2 (c/kwh) (fill in thresholds) 1.10 1.1663 1.2363
Meter - IBT Block 3 (c/kwh) (fill in thresholds) 1.55 1.6415 1.7400
Meter - IBT Block 4 (c/kwh) (fill in thresholds) 1.82 1.9331 2.0491
Meter - IBT Block 5 (c/kwh) (fill in thresholds)
Prepaid - IBT Block 1 (c/kwh) (fill in thresholds) 0.86 0.9071 0.9616
Prepaid - IBT Block 2 (c/kwh) (fill in thresholds) 1.10 1.1663 1.2363
Prepaid - IBT Block 3 (c/kwh) (fill in thresholds) 1.55 1.6415 1.7400
Prepaid - IBT Block 4 (c/kwh) (fill in thresholds) 1.82 1.9331 2.0491
Prepaid - IBT Block 5 (c/kwh) (fill in thresholds) - - -
Other 2 - - -
Waste management tariffs
Domestic
Street cleaning charge - - -
Basic charge/fixed fee - - -
80l bin - once a week - - -
250l bin - once a week 155 164.5756 174.4501
References
1. If properties are not rated or zero rated this must be indicated as such
2.Please provide detailed descriptions on Sheet SA13b
Current Year
2016/17Description Ref
Provide description of tariff
structure where appropriate2013/14 2014/15 2015/16
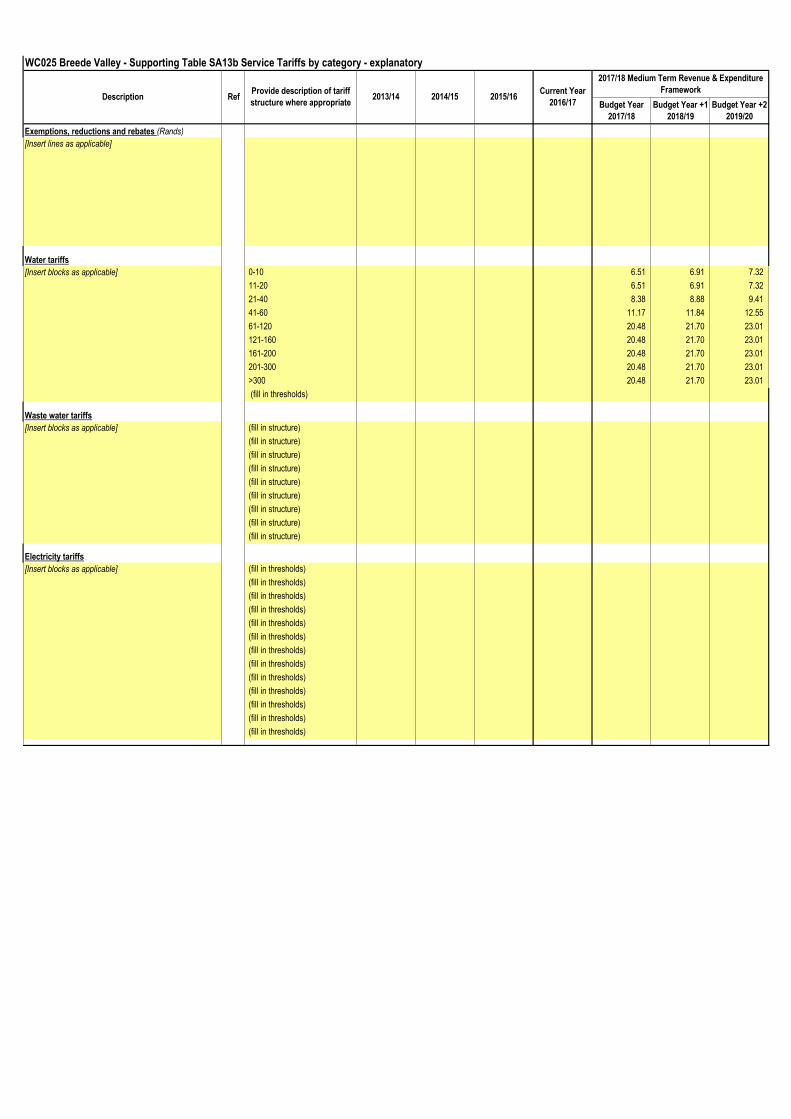
WC025 Breede Valley - Supporting Table SA13b Service Tariffs by category - explanatory
2017/18 Medium Term Revenue & Expenditure
Framework
Budget Year
2017/18
Budget Year +1
2018/19
Budget Year +2
2019/20
Exemptions, reductions and rebates (Rands)
[Insert lines as applicable]
Water tariffs
[Insert blocks as applicable] 0-10 6.51 6.91 7.32
11-20 6.51 6.91 7.32
21-40 8.38 8.88 9.41
41-60 11.17 11.84 12.55
61-120 20.48 21.70 23.01
121-160 20.48 21.70 23.01
161-200 20.48 21.70 23.01
201-300 20.48 21.70 23.01
>300 20.48 21.70 23.01
(fill in thresholds)
Waste water tariffs
[Insert blocks as applicable] (fill in structure)
(fill in structure)
(fill in structure)
(fill in structure)
(fill in structure)
(fill in structure)
(fill in structure)
(fill in structure)
(fill in structure)
Electricity tariffs
[Insert blocks as applicable] (fill in thresholds)
(fill in thresholds)
(fill in thresholds)
(fill in thresholds)
(fill in thresholds)
(fill in thresholds)
(fill in thresholds)
(fill in thresholds)
(fill in thresholds)
(fill in thresholds)
(fill in thresholds)
(fill in thresholds)
(fill in thresholds)
Description RefProvide description of tariff
structure where appropriate2013/14 2014/15
Current Year
2016/172015/16

WC025 Breede Valley - Supporting Table SA14 Household bills
2013/14 2014/15 2015/16 2017/18 Medium Term Revenue & Expenditure Framework
Audited
Outcome
Audited
Outcome
Audited
Outcome
Original
Budget
Adjusted
Budget
Full Year
Forecast
Budget Year
2017/18
Budget Year
2017/18
Budget Year +1
2018/19
Budget Year +2
2019/20Rand/cent % incr.Monthly Account for Household - 'Middle Income
Range'1
Rates and services charges:
Property rates 377.20 6.1% 400.21 424.22 449.68 Electricity: Basic levy – – Electricity: Consumption 1 452.50 2.5% 1 489.51 1 578.88 1 673.61 Water: Basic levy – – Water: Consumption 157.12 11.6% 175.33 185.85 197.00 Sanitation 230.70 6.5% 245.61 260.35 275.97 Refuse removal 145.61 6.6% 155.26 164.58 174.45 Other – – – – –
sub-total – – – 2 363.13 – – 4.3% 2 465.92 2 613.88 2 770.71 VAT on Services 279.16 3.6% 289.20 306.55 324.94
Total large household bill: – – – 2 642.29 – – 4.3% 2 755.12 2 920.43 3 095.65 % increase/-decrease – – – (100.0%) – – 6.0% 6.0%
Monthly Account for Household - 'Affordable Range'
2
Rates and services charges:
Property rates 254.53 6.1% 270.06 286.26 303.44
Electricity: Basic levy – – – – –
Electricity: Consumption 589.50 2.7% 605.17 641.48 679.97
Water: Basic levy – – – – –
Water: Consumption 117.67 13.4% 133.45 141.46 149.94
Sanitation 230.70 6.5% 245.61 260.35 275.97
Refuse removal 145.61 6.6% 155.26 164.58 174.45
Other – – – – –
sub-total – – – 1 338.01 – – 5.3% 1 409.55 1 494.12 1 583.77
VAT on Services 152.81 4.4% 159.53 169.10 179.25
Total small household bill: – – – 1 490.82 – – 5.2% 1 569.08 1 663.22 1 763.02
% increase/-decrease – – – (100.0%) – – 6.0% 6.0%
- - - -1.00 Monthly Account for Household - 'Indigent'
Household receiving free basic services
3
Rates and services charges:
Property rates 92.00 6.1% 97.61 103.47 109.67 Electricity: Basic levy – – – – – Electricity: Consumption 309.50 2.7% 317.86 336.93 357.15 Water: Basic levy – – – – – Water: Consumption 62.79 3.8% 65.15 69.06 73.20 Sanitation – – – – – Refuse removal – – – – – Other – – – – –
sub-total – – – 464.29 – – 3.5% 480.62 509.46 540.02 VAT on Services 51.92 3.3% 53.62 56.84 60.25
Total small household bill: – – – 516.21 – – 3.5% 534.24 566.30 600.27 % increase/-decrease – – – (100.0%) – – 6.0% 6.0%
References
1. Use as basis property value of R700 000, 1 000 kWh electricity and 30kl water
2. Use as basis property value of R500 000 and R700 000, 500 kWh electricity and 25kl water
3. Use as basis property value of R 300 000, 350kWh electricity and 20kl water (50 kWh electricity and 6 kl water free)
4. Note this is for a SINGLE household.
Ref
Current Year 2016/17
Description
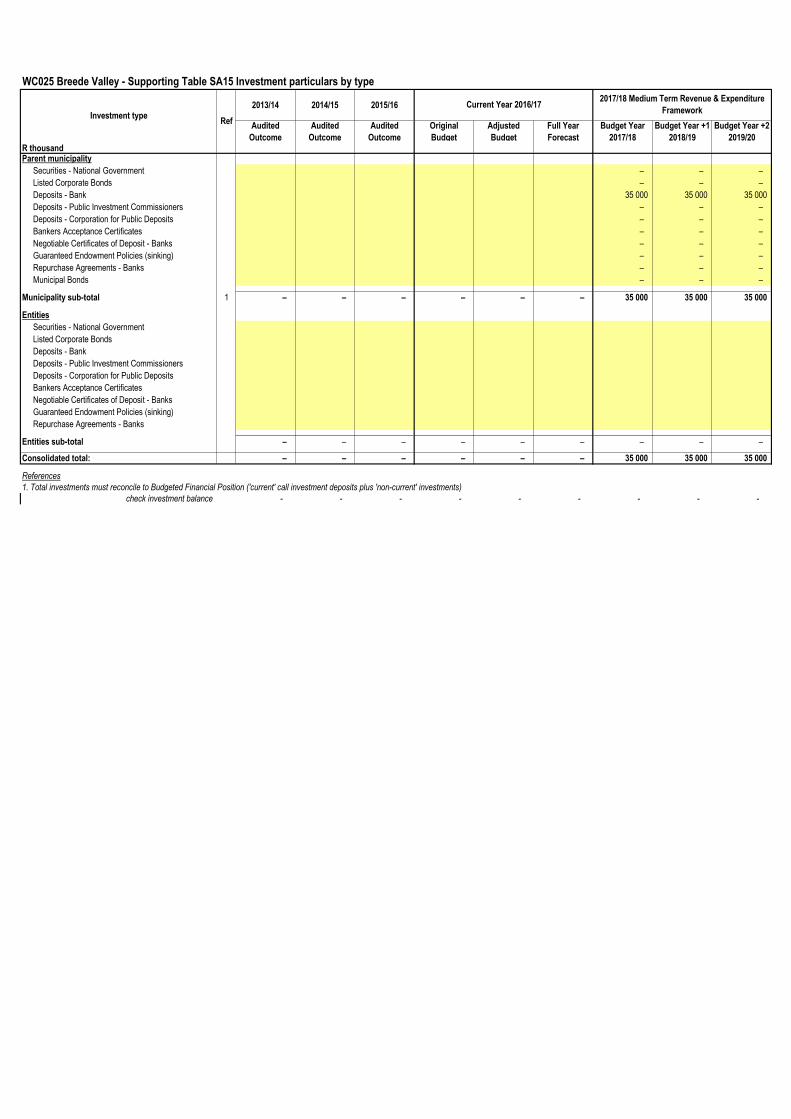
WC025 Breede Valley - Supporting Table SA15 Investment particulars by type
2013/14 2014/15 2015/16
Audited
Outcome
Audited
Outcome
Audited
Outcome
Original
Budget
Adjusted
Budget
Full Year
Forecast
Budget Year
2017/18
Budget Year +1
2018/19
Budget Year +2
2019/20R thousandParent municipality
Securities - National Government – – –
Listed Corporate Bonds – – –
Deposits - Bank 35 000 35 000 35 000
Deposits - Public Investment Commissioners – – –
Deposits - Corporation for Public Deposits – – –
Bankers Acceptance Certificates – – –
Negotiable Certificates of Deposit - Banks – – –
Guaranteed Endowment Policies (sinking) – – –
Repurchase Agreements - Banks – – –
Municipal Bonds – – –
Municipality sub-total 1 – – – – – – 35 000 35 000 35 000
Entities
Securities - National Government
Listed Corporate Bonds
Deposits - Bank
Deposits - Public Investment Commissioners
Deposits - Corporation for Public Deposits
Bankers Acceptance Certificates
Negotiable Certificates of Deposit - Banks
Guaranteed Endowment Policies (sinking)
Repurchase Agreements - Banks
Entities sub-total – – – – – – – – –
Consolidated total: – – – – – – 35 000 35 000 35 000
References
1. Total investments must reconcile to Budgeted Financial Position ('current' call investment deposits plus 'non-current' investments)
check investment balance - - - - - - - - -
Current Year 2016/172017/18 Medium Term Revenue & Expenditure
FrameworkRef
Investment type

WC025 Breede Valley - Supporting Table SA16 Investment particulars by maturity
Investments by Maturity Ref Period of InvestmentCapital Guarantee
(Yes/ No)
Variable or Fixed
interest rateInterest Rate ᶟ
Commission Paid
(Rands)Commission Recipient Opening balance Interest to be realised
Partial / Premature
Withdrawal (4)Investment Top Up Closing Balance
Name of institution & investment ID 1 Yrs/Months
Parent municipality
NEDBANK 2 Months Notice Deposit No Fixed 7.780% None None 27 March 2017 5 000 63 – – 5 063
ABSA 5 Months Notice Deposit No Fixed 7.760% None None 28 March 2017 5 000 161 – – 5 161
NEDBANK 5 Months Notice Deposit No Fixed 8.280% None None 28 March 2017 5 000 171 – – 5 171
INVESTEC 5 Months Notice Deposit No Fixed 7.900% None None 28 March 2017 5 000 163 – – 5 163
STANDARD 2 Months Notice Deposit No Fixed 7.675% None None 28 March 2017 5 000 63 – – 5 063
STANDARD 4 Months Notice Deposit No Fixed 7.900% None None 29 March 2017 5 000 131 – – 5 131
ABSA 4 Months Notice Deposit No Fixed 7.890% None None 31 March 2017 5 000 133 – – 5 133
NEDBANK 4 Months Notice Deposit No Fixed 8.100% None None 31 March 2017 5 000 136 – – 5 136
INVESTEC 5 Months Notice Deposit No Fixed 8.050% None None 24 April 2017 5 000 162 – – 5 162
NEDBANK 5 Months Notice Deposit No Fixed 8.330% None None 28 April 2017 10 000 345 – – 10 345
ABSA 3 Months Notice Deposit No Fixed 7.750% None None 28 April 2017 5 000 97 – – 5 097
STANDARD 3 Months Notice Deposit No Fixed 7.800% None None 28 April 2017 5 000 97 – – 5 097
INVESTEC 3 Months Notice Deposit No Fixed 7.800% None None 28 April 2017 5 000 97 – – 5 097
STANDARD 2 Months Notice Deposit No Fixed 7.625% None None 28 April 2017 10 000 125 – – 10 125
ABSA 5 Months Notice Deposit No Fixed 8.100% None None 02 May 2017 5 000 172 – – 5 172
STANDARD 5 Months Notice Deposit No Fixed 8.175% None None 02 May 2017 5 000 174 – – 5 174
NEDBANK 6 Months Notice Deposit No Fixed 8.580% None None 29 May 2017 5 000 214 – – 5 214
NEDBANK 4 Months Notice Deposit No Fixed 8.030% None None 29 May 2017 5 000 134 – – 5 134
INVESTEC 4 Months Notice Deposit No Fixed 7.950% None None 29 May 2017 5 000 133 – – 5 133
STANDARD 3 Months Notice Deposit No Fixed 7.750% None None 29 May 2017 5 000 97 – – 5 097
ABSA 4 Months Notice Deposit No Fixed 7.940% None None 30 May 2017 5 000 134 – – 5 134
ABSA 3 Months Notice Deposit No Fixed 7.650% None None 30 May 2017 5 000 96 – – 5 096
ABSA 6 Months Notice Deposit No Fixed 8.320% None None 01 June 2017 5 000 211 – – 5 211
INVESTEC 7 Months Notice Deposit No Fixed 8.375% None None 26 June 2017 5 000 241 – – 5 241
NEDBANK 4 Months Notice Deposit No Fixed 7.950% None None 27 June 2017 5 000 131 – – 5 131
NEDBANK 7 Months Notice Deposit No Fixed 8.630% None None 28 June 2017 5 000 251 – – 5 251
STANDARD 4 Months Notice Deposit No Fixed 7.900% None None 28 June 2017 5 000 131 – – 5 131
ABSA 4 Months Notice Deposit No Fixed 7.840% None None 30 June 2017 5 000 132 – – 5 132
NEDBANK 5 Months Notice Deposit No Fixed 8.200% None None 27 July 2017 5 000 168 – – 5 168
ABSA 5 Months Notice Deposit No Fixed 8.040% None None 31 July 2017 5 000 170 – – 5 170
INVESTEC 5 Months Notice Deposit No Fixed 7.800% None None 01 August 2017 5 000 166 – – 5 166
–
Municipality sub-total 165 000 4 698 – – 169 698
Entities
–
–
–
–
–
–
–
Entities sub-total – – – –
TOTAL INVESTMENTS AND INTEREST 1 165 000 4 698 – – 169 698
References
1. Total investments must reconcile to all items in Table SA15 for the Current Year (30 June)
2. List investments in expiry date order
3. If 'variable' is selected in column F, input interest rate range
4. Withdrawals to be entered as negative
check
Type of InvestmentExpiry date of
investment

WC025 Breede Valley - Supporting Table SA17 Borrowing
Borrowing - Categorised by type Ref 2013/14 2014/15 2015/16
R thousandAudited
Outcome
Audited
Outcome
Audited
Outcome
Original
Budget
Adjusted
Budget
Full Year
Forecast
Budget Year
2017/18
Budget Year +1
2018/19
Budget Year +2
2019/20
Parent municipality
Annuity and Bullet Loans 214 291 203 881 192 179
Long-Term Loans (non-annuity) – – –
Local registered stock – – –
Instalment Credit – – –
Financial Leases – – –
PPP liabilities – – –
Finance Granted By Cap Equipment Supplier – – –
Marketable Bonds – – –
Non-Marketable Bonds – – –
Bankers Acceptances – – –
Financial derivatives – – –
Other Securities – – –
Municipality sub-total 1 – – – – – – 214 291 203 881 192 179
Total Borrowing 1 – – – – – – 214 291 203 881 192 179
Unspent Borrowing - Categorised by type
Parent municipality
Long-Term Loans (annuity/reducing balance)
Long-Term Loans (non-annuity)
Local registered stock
Instalment Credit
Financial Leases
PPP liabilities
Finance Granted By Cap Equipment Supplier
Marketable Bonds
Non-Marketable Bonds
Bankers Acceptances
Financial derivatives
Other Securities
Municipality sub-total 1 – – – – – – – – –
Total Unspent Borrowing 1 – – – – – – – – –
References
1. Total borrowing must reconcile to Budgeted Financial Position (Borrowing - non-current)
check borrowing balance – – – – – – – – –
Current Year 2016/172017/18 Medium Term Revenue & Expenditure
Framework

WC025 Breede Valley - Supporting Table SA18 Transfers and grant receipts
Description Ref 2013/14 2014/15 2015/16
R thousandAudited
Outcome
Audited
Outcome
Audited
Outcome
Original
Budget
Adjusted
Budget
Full Year
Forecast
Budget Year
2017/18
Budget Year +1
2018/19
Budget Year +2
2019/20
RECEIPTS: 1, 2
Operating Transfers and Grants
National Government: – – – – – – 99 123 107 593 118 836
Local Government Equitable Share 97 573 106 043 118 836
Local Government Financial Management Grant 1 550 1 550 –
Municipal Systems Improvement grant – – –
Expanded Public Works Programme Integrated grant – – –
Provincial Government: – – – – – – 46 349 81 254 –
Human Settlement development Grant 37 500 71 750 –
Fin. Assistance to Mun for Maintenance and contruciton of transport infrastructure – – –
Library Services: Conditional grant 8 090 8 575 –
Community Development workers (CDW) 94 94 –
Regional Socio-Economic Project 425 375 –
Thusong service centres grant – 100 –
Financial Management Capacity Building Grant 240 360 –
District Municipality: – – – – – – – – –
Other grant providers: – – – – – – 1 100 1 100 –
Learnership SETA 500 500 –
LGWSETA 600 600 –
Total Operating Transfers and Grants 5 – – – – – – 146 572 189 947 118 836
Capital Transfers and Grants
National Government: – – – – – – 37 214 40 087 –
Municipal Infrastructure grant 35 214 37 087 –
Integrated National Electification Program 2 000 3 000 –
Provincial Government: – – – – – – 41 625 74 375 –
Human Settlement development Grant 37 500 71 750 –
Regional Socio-Economic Project 4 125 2 625 –
District Municipality: – – – – – – – – –
Other grant providers: – – – – – – – – –
Total Capital Transfers and Grants 5 – – – – – – 78 839 114 462 –
TOTAL RECEIPTS OF TRANSFERS & GRANTS – – – – – – 225 411 304 409 118 836
– – –
– – –
– – –
Current Year 2016/172017/18 Medium Term Revenue & Expenditure
Framework
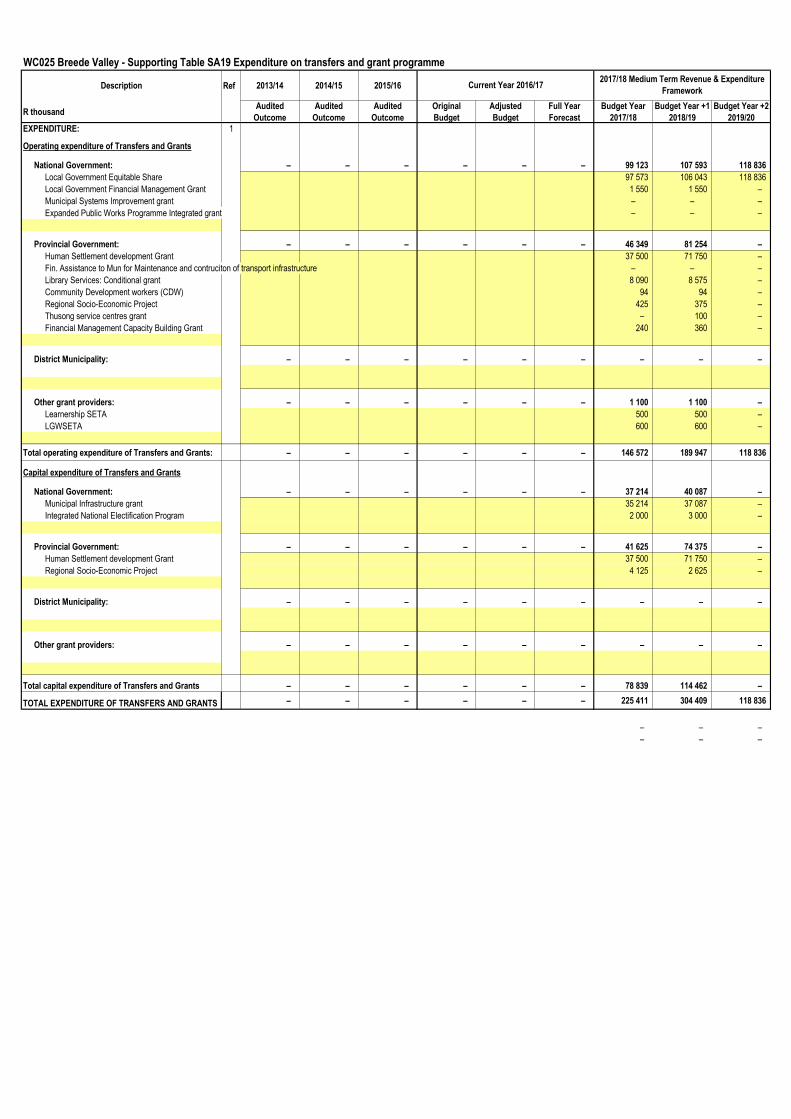
WC025 Breede Valley - Supporting Table SA19 Expenditure on transfers and grant programme
Description Ref 2013/14 2014/15 2015/16
R thousandAudited
Outcome
Audited
Outcome
Audited
Outcome
Original
Budget
Adjusted
Budget
Full Year
Forecast
Budget Year
2017/18
Budget Year +1
2018/19
Budget Year +2
2019/20
EXPENDITURE: 1
Operating expenditure of Transfers and Grants
National Government: – – – – – – 99 123 107 593 118 836
Local Government Equitable Share 97 573 106 043 118 836
Local Government Financial Management Grant 1 550 1 550 –
Municipal Systems Improvement grant – – –
Expanded Public Works Programme Integrated grant – – –
Provincial Government: – – – – – – 46 349 81 254 –
Human Settlement development Grant 37 500 71 750 –
Fin. Assistance to Mun for Maintenance and contruciton of transport infrastructure – – –
Library Services: Conditional grant 8 090 8 575 –
Community Development workers (CDW) 94 94 –
Regional Socio-Economic Project 425 375 –
Thusong service centres grant – 100 –
Financial Management Capacity Building Grant 240 360 –
District Municipality: – – – – – – – – –
Other grant providers: – – – – – – 1 100 1 100 –
Learnership SETA 500 500 –
LGWSETA 600 600 –
Total operating expenditure of Transfers and Grants: – – – – – – 146 572 189 947 118 836
Capital expenditure of Transfers and Grants
National Government: – – – – – – 37 214 40 087 –
Municipal Infrastructure grant 35 214 37 087 –
Integrated National Electification Program 2 000 3 000 –
Provincial Government: – – – – – – 41 625 74 375 –
Human Settlement development Grant 37 500 71 750 –
Regional Socio-Economic Project 4 125 2 625 –
District Municipality: – – – – – – – – –
Other grant providers: – – – – – – – – –
Total capital expenditure of Transfers and Grants – – – – – – 78 839 114 462 –
TOTAL EXPENDITURE OF TRANSFERS AND GRANTS – – – – – – 225 411 304 409 118 836
– – –
– – –
Current Year 2016/172017/18 Medium Term Revenue & Expenditure
Framework
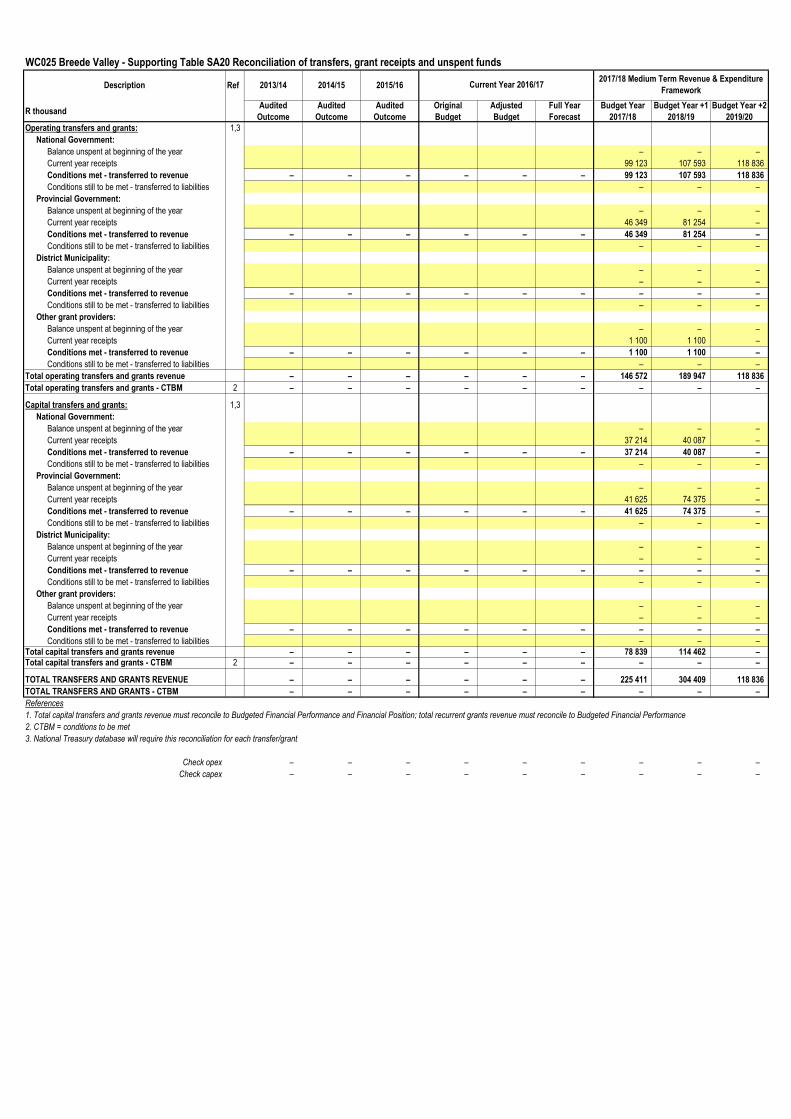
WC025 Breede Valley - Supporting Table SA20 Reconciliation of transfers, grant receipts and unspent funds
Description Ref 2013/14 2014/15 2015/16
R thousandAudited
Outcome
Audited
Outcome
Audited
Outcome
Original
Budget
Adjusted
Budget
Full Year
Forecast
Budget Year
2017/18
Budget Year +1
2018/19
Budget Year +2
2019/20
Operating transfers and grants: 1,3
National Government:
Balance unspent at beginning of the year – – –
Current year receipts 99 123 107 593 118 836
Conditions met - transferred to revenue – – – – – – 99 123 107 593 118 836
Conditions still to be met - transferred to liabilities – – –
Provincial Government:
Balance unspent at beginning of the year – – –
Current year receipts 46 349 81 254 –
Conditions met - transferred to revenue – – – – – – 46 349 81 254 –
Conditions still to be met - transferred to liabilities – – –
District Municipality:
Balance unspent at beginning of the year – – –
Current year receipts – – –
Conditions met - transferred to revenue – – – – – – – – –
Conditions still to be met - transferred to liabilities – – –
Other grant providers:
Balance unspent at beginning of the year – – –
Current year receipts 1 100 1 100 –
Conditions met - transferred to revenue – – – – – – 1 100 1 100 –
Conditions still to be met - transferred to liabilities – – –
Total operating transfers and grants revenue – – – – – – 146 572 189 947 118 836
Total operating transfers and grants - CTBM 2 – – – – – – – – –
Capital transfers and grants: 1,3
National Government:
Balance unspent at beginning of the year – – –
Current year receipts 37 214 40 087 –
Conditions met - transferred to revenue – – – – – – 37 214 40 087 –
Conditions still to be met - transferred to liabilities – – –
Provincial Government:
Balance unspent at beginning of the year – – –
Current year receipts 41 625 74 375 –
Conditions met - transferred to revenue – – – – – – 41 625 74 375 –
Conditions still to be met - transferred to liabilities – – –
District Municipality:
Balance unspent at beginning of the year – – –
Current year receipts – – –
Conditions met - transferred to revenue – – – – – – – – –
Conditions still to be met - transferred to liabilities – – –
Other grant providers:
Balance unspent at beginning of the year – – –
Current year receipts – – –
Conditions met - transferred to revenue – – – – – – – – –
Conditions still to be met - transferred to liabilities – – –
Total capital transfers and grants revenue – – – – – – 78 839 114 462 –
Total capital transfers and grants - CTBM 2 – – – – – – – – –
TOTAL TRANSFERS AND GRANTS REVENUE – – – – – – 225 411 304 409 118 836
TOTAL TRANSFERS AND GRANTS - CTBM – – – – – – – – –
References
Check opex – – – – – – – – –
Check capex – – – – – – – – –
3. National Treasury database will require this reconciliation for each transfer/grant
Current Year 2016/172017/18 Medium Term Revenue & Expenditure
Framework
1. Total capital transfers and grants revenue must reconcile to Budgeted Financial Performance and Financial Position; total recurrent grants revenue must reconcile to Budgeted Financial Performance
2. CTBM = conditions to be met

WC025 Breede Valley - Supporting Table SA21 Transfers and grants made by the municipality
Description Ref 2013/14 2014/15 2015/16
R thousandAudited
Outcome
Audited
Outcome
Audited
Outcome
Original
Budget
Adjusted
Budget
Full Year
Forecast
Pre-audit
outcome
Budget Year
2017/18
Budget Year +1
2018/19
Budget Year +2
2019/20
Cash Transfers to other municipalities
Insert description 1
Total Cash Transfers To Municipalities: – – – – – – – – – –
Cash Transfers to Entities/Other External Mechanisms
Insert description 2
Total Cash Transfers To Entities/Ems' – – – – – – – – – –
Cash Transfers to other Organs of State
Insert description 3
Total Cash Transfers To Other Organs Of State: – – – – – – – – – –
Cash Transfers to Organisations
Insert description
Total Cash Transfers To Organisations – – – – – – – – – –
Cash Transfers to Groups of Individuals
Grants in Aid - Section 67 MFMA 279 295 311
Total Cash Transfers To Groups Of Individuals: – – – – – – – 279 295 311
TOTAL CASH TRANSFERS AND GRANTS 6 – – – – – – – 279 295 311
Non-Cash Transfers to other municipalities
Insert description 1
Total Non-Cash Transfers To Municipalities: – – – – – – – – – –
Non-Cash Transfers to Entities/Other External Mechanisms
Insert description 2
Total Non-Cash Transfers To Entities/Ems' – – – – – – – – – –
Non-Cash Transfers to other Organs of State
Insert description 3
Total Non-Cash Transfers To Other Organs Of State: – – – – – – – – – –
Non-Cash Grants to Organisations
Insert description 4
Total Non-Cash Grants To Organisations – – – – – – – – – –
Groups of Individuals
Insert description 5
Total Non-Cash Grants To Groups Of Individuals: – – – – – – – – – –
TOTAL NON-CASH TRANSFERS AND GRANTS – – – – – – – – – –
TOTAL TRANSFERS AND GRANTS 6 – – – – – – – 279 295 311
References1. Insert description listed by municipal name and demarcation code of recipient2. Insert description of each entity or external mechanism (an external mechanism may be provided with resources to ensure a minimum level of service)3. Insert description of each Organ of State (e.g. transfer to electricity provider to compensate for FBS provided)4. Insert description of each other organisation (e.g. charity)5 Insert description of each other organisation (e.g. the aged, child-headed households)6. All descriptions should separate transfers for 'capital purposes' and 'operating purposes'
2017/18 Medium Term Revenue & Expenditure
FrameworkCurrent Year 2016/17
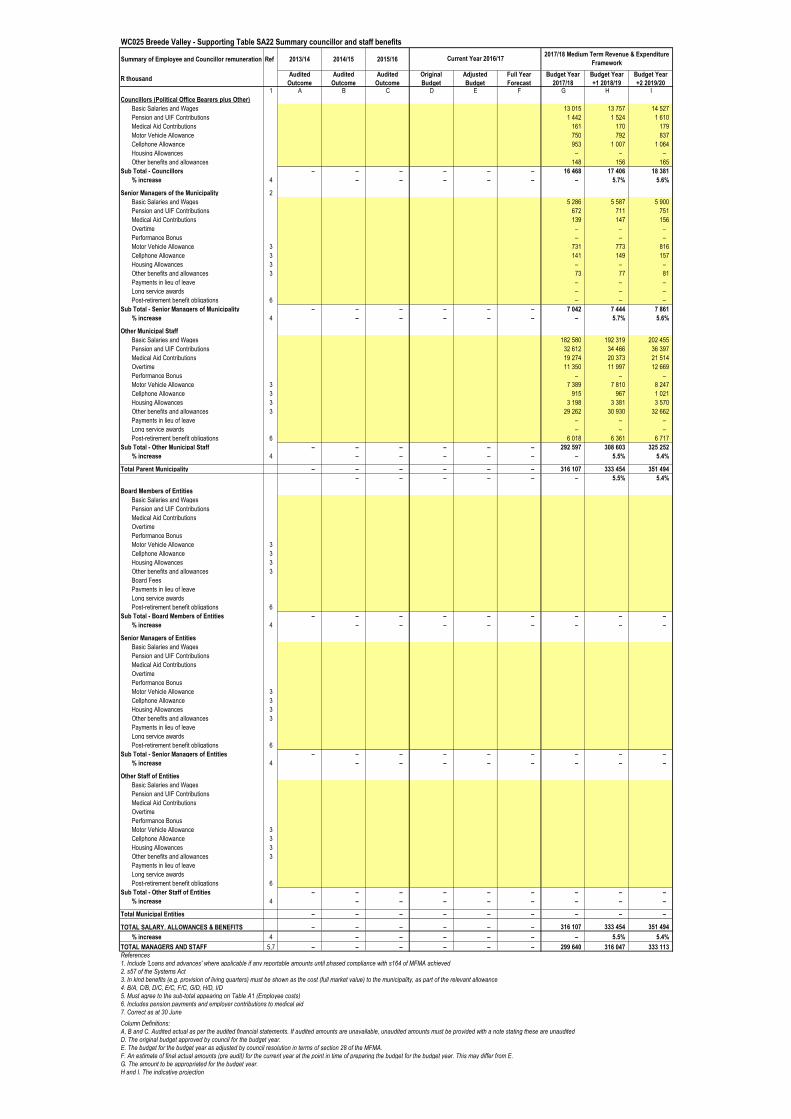
WC025 Breede Valley - Supporting Table SA22 Summary councillor and staff benefits
Summary of Employee and Councillor remuneration Ref 2013/14 2014/15 2015/16
R thousandAudited
Outcome
Audited
Outcome
Audited
Outcome
Original
Budget
Adjusted
Budget
Full Year
Forecast
Budget Year
2017/18
Budget Year
+1 2018/19
Budget Year
+2 2019/201 A B C D E F G H I
Councillors (Political Office Bearers plus Other)
Basic Salaries and Wages 13 015 13 757 14 527
Pension and UIF Contributions 1 442 1 524 1 610
Medical Aid Contributions 161 170 179
Motor Vehicle Allowance 750 792 837
Cellphone Allowance 953 1 007 1 064
Housing Allowances – – –
Other benefits and allowances 148 156 165
Sub Total - Councillors – – – – – – 16 468 17 406 18 381
% increase 4 – – – – – – 5.7% 5.6%
Senior Managers of the Municipality 2
Basic Salaries and Wages 5 286 5 587 5 900
Pension and UIF Contributions 672 711 751
Medical Aid Contributions 139 147 156
Overtime – – –
Performance Bonus – – –
Motor Vehicle Allowance 3 731 773 816
Cellphone Allowance 3 141 149 157
Housing Allowances 3 – – –
Other benefits and allowances 3 73 77 81
Payments in lieu of leave – – –
Long service awards – – –
Post-retirement benefit obligations 6 – – –
Sub Total - Senior Managers of Municipality – – – – – – 7 042 7 444 7 861
% increase 4 – – – – – – 5.7% 5.6%
Other Municipal Staff
Basic Salaries and Wages 182 580 192 319 202 455
Pension and UIF Contributions 32 612 34 466 36 397
Medical Aid Contributions 19 274 20 373 21 514
Overtime 11 350 11 997 12 669
Performance Bonus – – –
Motor Vehicle Allowance 3 7 389 7 810 8 247
Cellphone Allowance 3 915 967 1 021
Housing Allowances 3 3 198 3 381 3 570
Other benefits and allowances 3 29 262 30 930 32 662
Payments in lieu of leave – – –
Long service awards – – –
Post-retirement benefit obligations 6 6 018 6 361 6 717
Sub Total - Other Municipal Staff – – – – – – 292 597 308 603 325 252
% increase 4 – – – – – – 5.5% 5.4%
Total Parent Municipality – – – – – – 316 107 333 454 351 494
– – – – – – 5.5% 5.4%
Board Members of Entities
Basic Salaries and Wages
Pension and UIF Contributions
Medical Aid Contributions
Overtime
Performance Bonus
Motor Vehicle Allowance 3
Cellphone Allowance 3
Housing Allowances 3
Other benefits and allowances 3
Board Fees
Payments in lieu of leave
Long service awards
Post-retirement benefit obligations 6
Sub Total - Board Members of Entities – – – – – – – – –
% increase 4 – – – – – – – –
Senior Managers of Entities
Basic Salaries and Wages
Pension and UIF Contributions
Medical Aid Contributions
Overtime
Performance Bonus
Motor Vehicle Allowance 3
Cellphone Allowance 3
Housing Allowances 3
Other benefits and allowances 3
Payments in lieu of leave
Long service awards
Post-retirement benefit obligations 6
Sub Total - Senior Managers of Entities – – – – – – – – –
% increase 4 – – – – – – – –
Other Staff of Entities
Basic Salaries and Wages
Pension and UIF Contributions
Medical Aid Contributions
Overtime
Performance Bonus
Motor Vehicle Allowance 3
Cellphone Allowance 3
Housing Allowances 3
Other benefits and allowances 3
Payments in lieu of leave
Long service awards
Post-retirement benefit obligations 6
Sub Total - Other Staff of Entities – – – – – – – – –
% increase 4 – – – – – – – –
Total Municipal Entities – – – – – – – – –
TOTAL SALARY, ALLOWANCES & BENEFITS – – – – – – 316 107 333 454 351 494
% increase 4 – – – – – – 5.5% 5.4%
TOTAL MANAGERS AND STAFF 5,7 – – – – – – 299 640 316 047 333 113
References
1. Include 'Loans and advances' where applicable if any reportable amounts until phased compliance with s164 of MFMA achieved
2. s57 of the Systems Act
3. In kind benefits (e.g. provision of living quarters) must be shown as the cost (full market value) to the municipality, as part of the relevant allowance
4. B/A, C/B, D/C, E/C, F/C, G/D, H/D, I/D
5. Must agree to the sub-total appearing on Table A1 (Employee costs)
6. Includes pension payments and employer contributions to medical aid
7. Correct as at 30 June
Column Definitions:
A, B and C. Audited actual as per the audited financial statements. If audited amounts are unavailable, unaudited amounts must be provided with a note stating these are unaudited
D. The original budget approved by council for the budget year.
E. The budget for the budget year as adjusted by council resolution in terms of section 28 of the MFMA.
F. An estimate of final actual amounts (pre audit) for the current year at the point in time of preparing the budget for the budget year. This may differ from E.
G. The amount to be appropriated for the budget year.
H and I. The indicative projection
Current Year 2016/172017/18 Medium Term Revenue & Expenditure
Framework

WC025 Breede Valley - Supporting Table SA23 Salaries, allowances & benefits (political office bearers/councillors/senior managers)
Disclosure of Salaries, Allowances & Benefits 1. RefContributions In-kind benefits Total Package
Rand per annum 1. 2.
Councillors 3
Speaker 4 1 543 780 102 600 46 447 692 827
Chief Whip 1 448 080 128 786 67 910 644 776
Executive Mayor 1 629 640 115 200 110 261 855 101
Deputy Executive Mayor 1 519 780 97 800 75 247 692 827
Executive Committee 8 4 026 634 679 890 451 684 5 158 208
Total for all other councillors 29 6 847 033 478 458 1 098 552 8 424 043
Total Councillors 8 41 13 014 947 1 602 734 1 850 101 16 467 782
Senior Managers of the Municipality 5
Municipal Manager (MM) 1 1 298 659 61 171 128 576 – 1 488 406
Chief Finance Officer 1 961 031 210 490 188 868 – 1 360 389
Director: Community Services 1 1 039 865 224 814 148 837 – 1 413 516
Director: Technical Services 1 1 027 421 175 249 208 800 – 1 411 470
Director: Strategic Support Services 1 958 734 213 131 196 800 – 1 368 665
–
List of each offical with packages >= senior manager
–
–
–
–
–
–
–
–
–
–
–
–
–
Total Senior Managers of the Municipality 8,10 5 5 285 710 884 855 871 881 – 7 042 446
A Heading for Each Entity 6,7
List each member of board by designation
–
–
–
–
–
–
–
–
–
–
–
–
–
–
–
–
Total for municipal entities 8,10 – – – – – –
TOTAL COST OF COUNCILLOR, DIRECTOR and EXECUTIVE
REMUNERATION10 46 18 300 657 2 487 589 2 721 982 – 23 510 228
References
1. Pension and medical aid –
2. Total package must equal the total cost to the municipality –
3. List each political office bearer by designation. Provide a total for all other councillors
4. Political office bearer is defined in MFMA s 1: speaker, executive mayor, deputy executive mayor, member of executive committee,
mayor, deputy mayor, member of mayoral committee, the councillor designated to exercise powers and duties of mayor (MSA s 57)
5. Also list each senior manager reporting to MM by designation and each official with package >= senior manager by designation
6. List each entity where municipality has an interest and state percentage ownership and control
7. List each senior manager reporting to the CEO of an Entity by designation
8. Must reconcile to relevant section of Table SA24
9. Must reconcile to totals shown for the budget year of Table SA22
10. Correct as at 30 June
No.
AllowancesSalary Performance
Bonuses
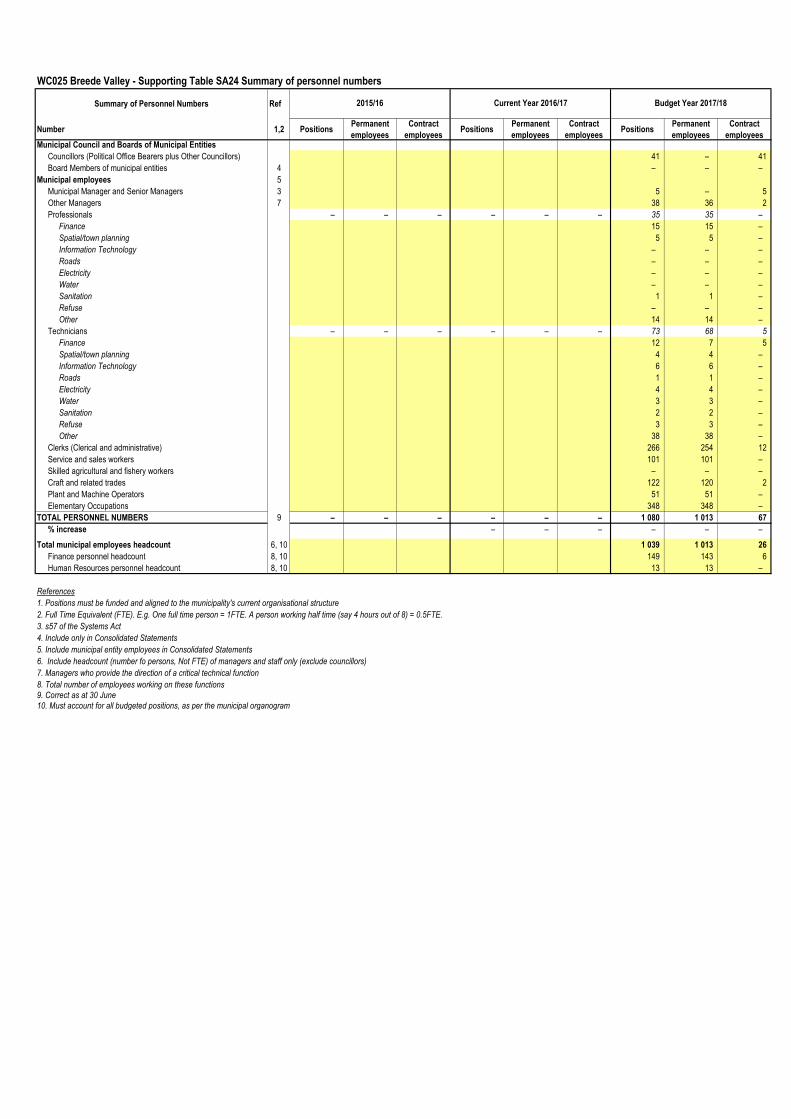
WC025 Breede Valley - Supporting Table SA24 Summary of personnel numbers
Summary of Personnel Numbers Ref
Number 1,2 PositionsPermanent
employees
Contract
employeesPositions
Permanent
employees
Contract
employeesPositions
Permanent
employees
Contract
employeesMunicipal Council and Boards of Municipal Entities
Councillors (Political Office Bearers plus Other Councillors) 41 – 41
Board Members of municipal entities 4 – – –
Municipal employees 5
Municipal Manager and Senior Managers 3 5 – 5
Other Managers 7 38 36 2
Professionals – – – – – – 35 35 –
Finance 15 15 –
Spatial/town planning 5 5 –
Information Technology – – –
Roads – – –
Electricity – – –
Water – – –
Sanitation 1 1 –
Refuse – – –
Other 14 14 –
Technicians – – – – – – 73 68 5
Finance 12 7 5
Spatial/town planning 4 4 –
Information Technology 6 6 –
Roads 1 1 –
Electricity 4 4 –
Water 3 3 –
Sanitation 2 2 –
Refuse 3 3 –
Other 38 38 –
Clerks (Clerical and administrative) 266 254 12
Service and sales workers 101 101 –
Skilled agricultural and fishery workers – – –
Craft and related trades 122 120 2
Plant and Machine Operators 51 51 –
Elementary Occupations 348 348 –
TOTAL PERSONNEL NUMBERS 9 – – – – – – 1 080 1 013 67
% increase – – – – – –
Total municipal employees headcount 6, 10 1 039 1 013 26
Finance personnel headcount 8, 10 149 143 6
Human Resources personnel headcount 8, 10 13 13 –
References
1. Positions must be funded and aligned to the municipality's current organisational structure
2. Full Time Equivalent (FTE). E.g. One full time person = 1FTE. A person working half time (say 4 hours out of 8) = 0.5FTE.
3. s57 of the Systems Act
4. Include only in Consolidated Statements
5. Include municipal entity employees in Consolidated Statements
6. Include headcount (number fo persons, Not FTE) of managers and staff only (exclude councillors)
7. Managers who provide the direction of a critical technical function
8. Total number of employees working on these functions
9. Correct as at 30 June
10. Must account for all budgeted positions, as per the municipal organogram
Current Year 2016/17 Budget Year 2017/182015/16

WC025 Breede Valley - Supporting Table SA25 Budgeted monthly revenue and expenditure
Description Ref
R thousand July August Sept. October November December January February March April May JuneBudget Year
2017/18
Budget Year +1
2018/19
Budget Year +2
2019/20Revenue By Source
Property rates 9 914 17 365 9 219 9 795 10 319 10 325 10 338 10 275 9 452 9 468 9 451 21 758 137 679 145 526 153 676
Service charges - electricity revenue 36 544 41 356 41 980 34 054 35 174 31 573 38 443 34 334 31 679 32 263 31 147 11 768 400 316 423 134 446 830
Service charges - water revenue 3 741 4 975 2 753 3 460 5 067 4 836 6 350 6 386 7 279 5 330 5 317 9 779 65 274 68 995 72 859
Service charges - sanitation revenue 7 182 4 201 4 913 3 769 5 674 6 291 6 201 5 569 5 748 5 869 5 593 (3 618) 57 393 60 664 64 061
Service charges - refuse revenue 3 617 2 494 2 909 2 326 3 561 3 538 3 563 3 228 3 253 3 325 3 203 5 998 41 015 43 352 45 780
Service charges - other (2 296) (2 494) (2 456) (2 299) (2 439) (2 363) (2 525) (2 253) (2 103) (2 294) (2 244) 8 066 (17 700) (18 709) (19 756)
Rental of facilities and equipment 1 400 1 481 1 538 1 287 1 308 1 197 1 389 1 312 1 300 1 263 1 231 (213) 14 492 15 318 16 176
Interest earned - external investments 836 1 078 835 706 815 337 1 463 998 996 577 1 448 534 10 620 11 225 11 854
Interest earned - outstanding debtors 226 240 229 345 246 252 267 234 259 267 274 168 3 009 3 181 3 359
Dividends received – – – – – – – – – – – – – – –
Fines, penalties and forfeits 2 432 2 784 3 186 2 525 4 141 1 324 3 351 1 570 3 033 3 128 3 576 36 194 67 244 71 077 75 057
Licences and permits 256 259 266 314 304 113 380 236 304 242 252 245 3 173 3 353 3 541
Agency services – 637 626 628 754 681 498 863 569 563 581 973 7 373 7 793 8 229
Transfers and subsidies 48 518 926 351 1 388 34 977 4 662 2 238 979 25 888 3 439 1 656 21 551 146 572 189 947 118 836
Other revenue 550 243 210 1 190 683 250 1 123 1 573 435 412 336 (105) 6 900 7 294 7 702
Gains on disposal of PPE – – – – – – – – 1 160 – – (35) 1 126 1 190 1 257
Total Revenue (excluding capital transfers and contributions) 112 920 75 545 66 558 59 486 100 585 63 016 73 080 65 305 89 252 63 853 61 824 113 063 944 486 1 033 342 1 009 461
Expenditure By Type
Employee related costs 19 162 22 533 24 106 23 384 23 706 25 822 24 109 28 800 23 777 22 383 21 843 40 014 299 640 316 047 333 113
Remuneration of councillors 1 313 1 313 1 313 1 313 1 313 1 313 1 313 1 874 1 380 1 939 1 313 768 16 468 17 406 18 381
Debt impairment 7 891 7 854 7 929 7 891 7 891 27 228 11 114 7 516 7 516 7 516 7 516 (52 236) 55 626 58 797 62 090
Depreciation & asset impairment 7 364 7 364 7 364 7 364 7 364 7 364 7 364 7 364 7 364 7 364 7 364 755 81 759 86 420 91 259
Finance charges 2 714 2 614 2 848 2 477 2 403 2 440 2 440 2 440 2 439 2 380 2 352 (1 432) 26 116 27 605 29 150
Bulk purchases 14 37 760 35 174 21 604 21 965 15 402 21 027 27 147 21 677 19 972 17 943 36 465 276 151 291 892 308 238
Other materials 3 062 2 403 2 266 3 934 3 778 4 569 3 757 5 191 7 288 4 767 4 964 16 491 62 469 66 030 69 728
Contracted services 37 727 828 1 649 325 968 1 269 676 812 859 864 353 9 366 9 900 10 455
Transfers and subsidies 39 39 106 39 39 39 39 250 39 39 65 (457) 279 295 311
Other expenditure 8 092 20 504 6 154 10 009 8 550 10 649 7 059 (3 029) 7 956 29 428 9 917 15 390 130 678 170 249 100 870
Loss on disposal of PPE 10 10 10 10 10 10 10 10 10 10 50 2 974 3 125 3 304 3 489
Total Expenditure 49 700 103 122 88 099 79 675 77 346 95 805 79 502 78 240 80 256 96 656 74 192 59 086 961 678 1 047 945 1 027 084
Surplus/(Deficit) 63 220 (27 576) (21 540) (20 189) 23 239 (32 789) (6 422) (12 935) 8 995 (32 803) (12 368) 53 977 (17 192) (14 603) (17 622)
Transfers and subsidies - capital (monetary
allocations) (National / Provincial and District) 6 095 5 276 5 079 4 924 5 825 5 001 5 222 5 051 5 576 5 019 4 975 20 798 78 839 114 462 –
Transfers and subsidies - capital (monetary
allocations) (National / Provincial Departmental
Agencies, Households, Non-profit Institutions, Private
Enterprises, Public Corporatons, Higher Educational
Institutions) – – – – – – – – – – – – – – –
Transfers and subsidies - capital (in-kind - all) – – – – – – – – – – – – – – –
Surplus/(Deficit) after capital transfers &
contributions69 315 (22 301) (16 462) (15 265) 29 063 (27 788) (1 201) (7 884) 14 571 (27 784) (7 393) 74 775 61 647 99 859 (17 622)
Taxation – – – – – – – – – – – – – – –
Attributable to minorities – – – – – – – – – – – – – – –
Share of surplus/ (deficit) of associate – – – – – – – – – – – – – – –
Surplus/(Deficit) 1 69 315 (22 301) (16 462) (15 265) 29 063 (27 788) (1 201) (7 884) 14 571 (27 784) (7 393) 74 775 61 647 99 859 (17 622)
References1. Surplus (Deficit) must reconcile with Budgeted Financial Performance
check - - -
Budget Year 2017/18Medium Term Revenue and Expenditure
Framework
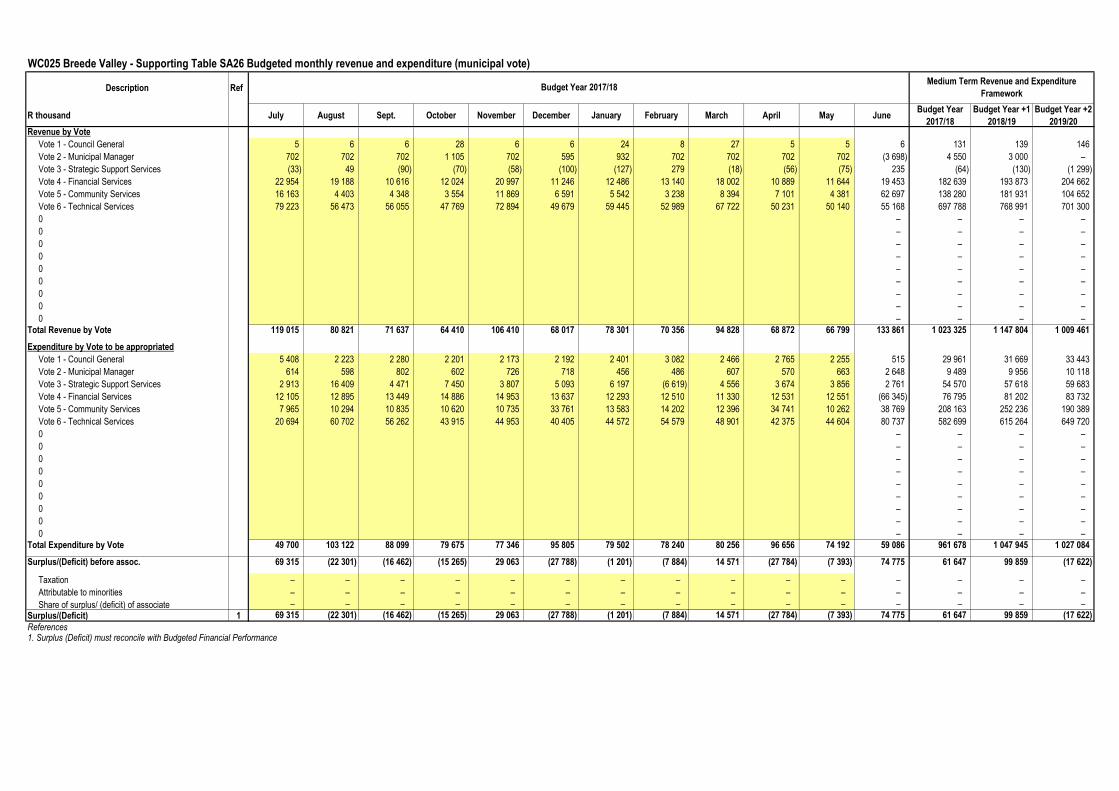
WC025 Breede Valley - Supporting Table SA26 Budgeted monthly revenue and expenditure (municipal vote)
Description Ref
R thousand July August Sept. October November December January February March April May JuneBudget Year
2017/18
Budget Year +1
2018/19
Budget Year +2
2019/20Revenue by Vote
Vote 1 - Council General 5 6 6 28 6 6 24 8 27 5 5 6 131 139 146
Vote 2 - Municipal Manager 702 702 702 1 105 702 595 932 702 702 702 702 (3 698) 4 550 3 000 –
Vote 3 - Strategic Support Services (33) 49 (90) (70) (58) (100) (127) 279 (18) (56) (75) 235 (64) (130) (1 299)
Vote 4 - Financial Services 22 954 19 188 10 616 12 024 20 997 11 246 12 486 13 140 18 002 10 889 11 644 19 453 182 639 193 873 204 662
Vote 5 - Community Services 16 163 4 403 4 348 3 554 11 869 6 591 5 542 3 238 8 394 7 101 4 381 62 697 138 280 181 931 104 652
Vote 6 - Technical Services 79 223 56 473 56 055 47 769 72 894 49 679 59 445 52 989 67 722 50 231 50 140 55 168 697 788 768 991 701 300
0 – – – –
0 – – – –
0 – – – –
0 – – – –
0 – – – –
0 – – – –
0 – – – –
0 – – – –
0 – – – –
Total Revenue by Vote 119 015 80 821 71 637 64 410 106 410 68 017 78 301 70 356 94 828 68 872 66 799 133 861 1 023 325 1 147 804 1 009 461
Expenditure by Vote to be appropriated
Vote 1 - Council General 5 408 2 223 2 280 2 201 2 173 2 192 2 401 3 082 2 466 2 765 2 255 515 29 961 31 669 33 443
Vote 2 - Municipal Manager 614 598 802 602 726 718 456 486 607 570 663 2 648 9 489 9 956 10 118
Vote 3 - Strategic Support Services 2 913 16 409 4 471 7 450 3 807 5 093 6 197 (6 619) 4 556 3 674 3 856 2 761 54 570 57 618 59 683
Vote 4 - Financial Services 12 105 12 895 13 449 14 886 14 953 13 637 12 293 12 510 11 330 12 531 12 551 (66 345) 76 795 81 202 83 732
Vote 5 - Community Services 7 965 10 294 10 835 10 620 10 735 33 761 13 583 14 202 12 396 34 741 10 262 38 769 208 163 252 236 190 389
Vote 6 - Technical Services 20 694 60 702 56 262 43 915 44 953 40 405 44 572 54 579 48 901 42 375 44 604 80 737 582 699 615 264 649 720
0 – – – –
0 – – – –
0 – – – –
0 – – – –
0 – – – –
0 – – – –
0 – – – –
0 – – – –
0 – – – –
Total Expenditure by Vote 49 700 103 122 88 099 79 675 77 346 95 805 79 502 78 240 80 256 96 656 74 192 59 086 961 678 1 047 945 1 027 084
Surplus/(Deficit) before assoc. 69 315 (22 301) (16 462) (15 265) 29 063 (27 788) (1 201) (7 884) 14 571 (27 784) (7 393) 74 775 61 647 99 859 (17 622)
Taxation – – – – – – – – – – – – – – –
Attributable to minorities – – – – – – – – – – – – – – –
Share of surplus/ (deficit) of associate – – – – – – – – – – – – – – –
Surplus/(Deficit) 1 69 315 (22 301) (16 462) (15 265) 29 063 (27 788) (1 201) (7 884) 14 571 (27 784) (7 393) 74 775 61 647 99 859 (17 622)
References1. Surplus (Deficit) must reconcile with Budgeted Financial Performance
Budget Year 2017/18Medium Term Revenue and Expenditure
Framework

WC025 Breede Valley - Supporting Table SA27 Budgeted monthly revenue and expenditure (functional classification)
Description Ref
R thousand July August Sept. October November December January February March April May JuneBudget Year
2017/18
Budget Year +1
2018/19
Budget Year +2
2019/20Revenue - Functional
Governance and administration 23 706 20 073 11 378 13 211 21 770 11 912 13 481 14 313 20 002 11 652 12 399 502 792 676 689 716 491 756 171
Executive and council 9 89 9 435 9 (98) 261 130 31 10 9 (339) 556 514 146
Finance and administration 22 951 19 181 10 606 12 010 20 989 11 222 12 476 13 131 17 985 10 880 11 635 513 066 676 133 715 978 756 025
Internal audit 745 803 763 766 772 788 743 1 051 1 986 762 755 (9 935) – – –
Community and public safety 15 800 3 163 3 148 2 375 10 480 5 524 4 378 1 810 7 395 6 073 3 332 (4 673) 58 804 97 931 16 046
Community and social services 7 946 11 69 135 (142) (97) (80) 13 16 (94) (11) (516) 7 249 7 786 (939)
Sport and recreation 208 192 328 126 159 128 852 251 198 169 33 (2 379) 266 281 297
Public safety 2 394 3 163 3 098 2 532 4 356 1 334 3 328 1 885 3 182 3 202 3 642 (31 920) 196 3 363 219
Housing 5 252 (203) (347) (418) 6 107 4 158 278 (339) 3 999 2 797 (333) 30 142 51 093 86 501 16 469
Health – – – – – – – – – – – – – – –
Economic and environmental services 288 942 858 1 609 1 140 820 2 053 1 295 1 574 959 2 367 73 959 87 865 96 908 85 949
Planning and development 111 135 119 148 123 86 161 140 116 130 135 4 125 5 527 4 107 1 565
Road transport 318 1 073 968 997 1 203 877 922 1 271 941 1 054 897 72 445 82 965 93 464 85 084
Environmental protection (141) (266) (229) 465 (187) (143) 970 (116) 518 (225) 1 336 (2 610) (628) (663) (701)
Trading services 79 227 56 651 56 262 47 222 73 026 49 769 58 398 52 943 65 866 50 194 48 708 (438 220) 200 045 236 557 151 383
Energy sources 39 649 42 420 43 178 35 201 38 175 32 539 39 692 35 173 33 695 33 074 31 959 (404 903) (148) (1 263) (4 502)
Water management 9 835 5 348 3 110 3 806 10 083 5 195 6 735 6 786 11 091 5 702 5 692 (47 631) 25 751 56 610 (2 885)
Waste water management 20 014 5 933 6 609 5 448 16 220 8 027 7 941 7 288 14 010 7 634 7 395 5 792 112 310 122 897 96 267
Waste management 9 730 2 950 3 364 2 767 8 548 4 008 4 030 3 696 7 071 3 785 3 661 8 522 62 131 58 313 62 503
Other (6) (9) (10) (7) (6) (8) (7) (5) (9) (7) (7) 3 (78) (83) (87) Total Revenue - Functional 119 015 80 821 71 637 64 410 106 410 68 017 78 301 70 356 94 828 68 872 66 799 133 861 1 023 325 1 147 804 1 009 461
Expenditure - Functional
Governance and administration 22 452 33 627 19 873 27 663 21 213 21 743 21 124 10 517 20 109 19 723 20 510 (34 137) 204 418 227 071 211 982
Executive and council 6 372 3 410 3 594 3 329 3 387 3 448 4 098 4 169 3 668 3 741 3 241 (8 910) 33 545 36 714 35 594
Finance and administration 11 476 12 144 12 671 14 142 14 242 12 963 11 524 11 814 10 599 11 825 11 924 32 506 167 831 187 073 173 107
Internal audit 4 604 18 073 3 609 10 192 3 585 5 332 5 502 (5 466) 5 842 4 157 5 346 (57 733) 3 043 3 284 3 281
Community and public safety 8 097 10 775 11 369 11 224 11 111 34 383 14 028 14 815 12 863 35 089 10 853 (32 324) 142 284 162 621 141 142
Community and social services 1 678 2 021 2 155 2 289 2 050 2 066 2 069 2 194 1 987 1 910 1 856 3 283 25 560 27 325 27 947
Sport and recreation 1 164 1 630 1 937 2 192 1 778 3 543 1 912 3 161 2 497 2 561 2 309 5 988 30 674 33 173 33 022
Public safety 3 816 5 618 5 301 4 878 5 318 24 698 8 182 5 176 5 192 4 924 4 248 (48 203) 29 148 31 481 31 403
Housing 1 406 1 468 1 901 1 822 1 933 4 040 1 827 4 227 3 147 25 644 2 400 6 991 56 807 70 540 48 666
Health 32 38 75 43 32 36 37 57 39 50 40 (383) 95 102 104
Economic and environmental services 4 711 5 355 7 001 5 917 6 339 6 216 5 358 6 677 6 009 5 761 5 835 62 001 127 179 137 075 137 872
Planning and development 827 898 1 322 1 213 1 129 1 080 1 068 1 249 730 881 918 2 405 13 721 15 070 14 435
Road transport 3 511 3 851 4 811 3 956 4 535 4 334 3 732 4 562 4 124 4 203 4 041 67 323 112 983 121 486 122 931
Environmental protection 372 607 868 748 675 802 558 866 1 155 676 875 (7 726) 476 519 507
Trading services 14 399 53 313 49 786 34 812 38 415 33 411 38 876 46 139 41 221 36 000 36 890 63 554 486 816 519 992 535 204
Energy sources 5 274 42 456 37 374 23 844 26 105 20 781 26 532 32 011 27 902 23 620 24 931 45 989 336 819 356 871 374 633
Water management 2 905 3 474 3 479 3 200 3 414 3 384 3 490 4 730 4 146 4 403 4 280 4 283 45 188 48 507 49 237
Waste water management 3 501 4 190 4 996 4 385 4 997 4 893 4 591 4 812 4 517 4 263 4 348 6 795 56 289 60 121 61 809
Waste management 2 720 3 193 3 936 3 383 3 899 4 353 4 263 4 586 4 656 3 715 3 330 6 486 48 520 54 493 49 524
Other 42 52 70 58 267 52 117 91 54 83 103 (9) 980 1 186 884
Total Expenditure - Functional 49 700 103 122 88 099 79 675 77 346 95 805 79 502 78 240 80 256 96 656 74 192 59 086 961 678 1 047 945 1 027 084
Surplus/(Deficit) before assoc. 69 315 (22 301) (16 462) (15 265) 29 063 (27 788) (1 201) (7 884) 14 571 (27 784) (7 393) 74 775 61 647 99 859 (17 622)
Share of surplus/ (deficit) of associate – – – –
Surplus/(Deficit) 1 69 315 (22 301) (16 462) (15 265) 29 063 (27 788) (1 201) (7 884) 14 571 (27 784) (7 393) 74 775 61 647 99 859 (17 622)
References1. Surplus (Deficit) must reconcile with Budeted Financial Performance
check - -0 0
Budget Year 2017/18Medium Term Revenue and Expenditure
Framework

WC025 Breede Valley - Supporting Table SA28 Budgeted monthly capital expenditure (municipal vote)
Description Ref
R thousand July August Sept. October Nov. Dec. January Feb. March April May JuneBudget Year
2017/18
Budget Year +1
2018/19
Budget Year +2
2019/20Multi-year expenditure to be appropriated 1
Vote 1 - Council General – – – –
Vote 2 - Municipal Manager – – – –
Vote 3 - Strategic Support Services – – – –
Vote 4 - Financial Services – – – –
Vote 5 - Community Services – – – –
Vote 6 - Technical Services – – – –
0 – – – –
0 – – – –
0 – – – –
0 – – – –
0 – – – –
0 – – – –
0 – – – –
0 – – – –
0 – – – –
Capital multi-year expenditure sub-total 2 – – – – – – – – – – – – – – –
Single-year expenditure to be appropriated
Vote 1 - Council General – – 5 – – – – – – – – – 5 – –
Vote 2 - Municipal Manager – – 555 295 800 460 750 500 550 – – 220 4 130 2 625 –
Vote 3 - Strategic Support Services – – 2 270 2 750 200 500 – – 300 – – 300 6 320 7 913 3 813
Vote 4 - Financial Services 40 40 45 40 80 80 80 80 80 80 80 80 805 800 800
Vote 5 - Community Services – 1 301 7 039 901 451 1 – – – – – – 9 693 12 897 2 785
Vote 6 - Technical Services 2 240 5 201 19 791 12 188 17 545 20 318 9 883 8 445 12 951 6 755 8 606 9 784 133 707 152 806 31 524
0 – – – –
0 – – – –
0 – – – –
0 – – – –
0 – – – –
0 – – – –
0 – – – –
0 – – – –
0 – – – –
Capital single-year expenditure sub-total 2 2 280 6 542 29 705 16 174 19 076 21 359 10 713 9 025 13 881 6 835 8 686 10 384 154 660 177 041 38 921
Total Capital Expenditure 2 2 280 6 542 29 705 16 174 19 076 21 359 10 713 9 025 13 881 6 835 8 686 10 384 154 660 177 041 38 921
References1. Table should be completed as either Multi-Year expenditure appropriation or Budget Year and Forward Year estimates
2. Total Capital Expenditure must reconcile to Budgeted Capital Expenditure
check - - -
Budget Year 2017/18Medium Term Revenue and Expenditure
Framework
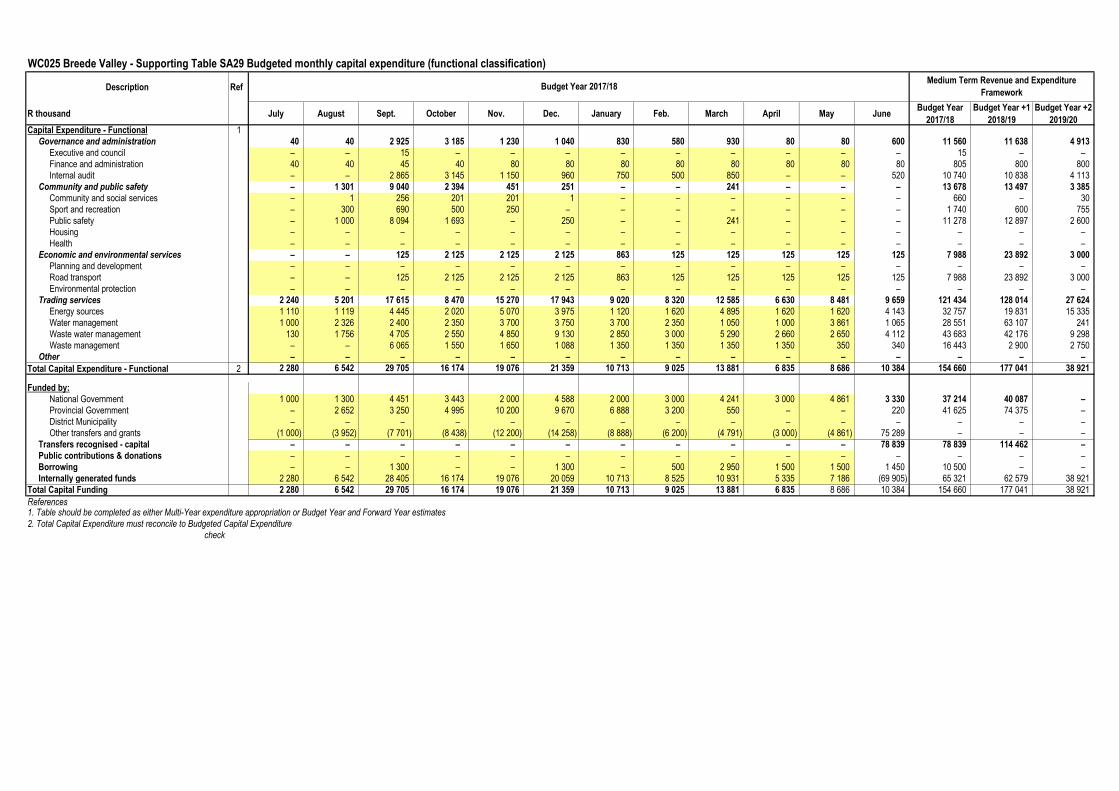
WC025 Breede Valley - Supporting Table SA29 Budgeted monthly capital expenditure (functional classification)
Description Ref
R thousand July August Sept. October Nov. Dec. January Feb. March April May JuneBudget Year
2017/18
Budget Year +1
2018/19
Budget Year +2
2019/20Capital Expenditure - Functional 1
Governance and administration 40 40 2 925 3 185 1 230 1 040 830 580 930 80 80 600 11 560 11 638 4 913
Executive and council – – 15 – – – – – – – – – 15 – –
Finance and administration 40 40 45 40 80 80 80 80 80 80 80 80 805 800 800
Internal audit – – 2 865 3 145 1 150 960 750 500 850 – – 520 10 740 10 838 4 113
Community and public safety – 1 301 9 040 2 394 451 251 – – 241 – – – 13 678 13 497 3 385
Community and social services – 1 256 201 201 1 – – – – – – 660 – 30
Sport and recreation – 300 690 500 250 – – – – – – – 1 740 600 755
Public safety – 1 000 8 094 1 693 – 250 – – 241 – – – 11 278 12 897 2 600
Housing – – – – – – – – – – – – – – –
Health – – – – – – – – – – – – – – –
Economic and environmental services – – 125 2 125 2 125 2 125 863 125 125 125 125 125 7 988 23 892 3 000
Planning and development – – – – – – – – – – – – – – –
Road transport – – 125 2 125 2 125 2 125 863 125 125 125 125 125 7 988 23 892 3 000
Environmental protection – – – – – – – – – – – – – – –
Trading services 2 240 5 201 17 615 8 470 15 270 17 943 9 020 8 320 12 585 6 630 8 481 9 659 121 434 128 014 27 624
Energy sources 1 110 1 119 4 445 2 020 5 070 3 975 1 120 1 620 4 895 1 620 1 620 4 143 32 757 19 831 15 335
Water management 1 000 2 326 2 400 2 350 3 700 3 750 3 700 2 350 1 050 1 000 3 861 1 065 28 551 63 107 241
Waste water management 130 1 756 4 705 2 550 4 850 9 130 2 850 3 000 5 290 2 660 2 650 4 112 43 683 42 176 9 298
Waste management – – 6 065 1 550 1 650 1 088 1 350 1 350 1 350 1 350 350 340 16 443 2 900 2 750
Other – – – – – – – – – – – – – – –
Total Capital Expenditure - Functional 2 2 280 6 542 29 705 16 174 19 076 21 359 10 713 9 025 13 881 6 835 8 686 10 384 154 660 177 041 38 921
Funded by:
National Government 1 000 1 300 4 451 3 443 2 000 4 588 2 000 3 000 4 241 3 000 4 861 3 330 37 214 40 087 –
Provincial Government – 2 652 3 250 4 995 10 200 9 670 6 888 3 200 550 – – 220 41 625 74 375 –
District Municipality – – – – – – – – – – – – – – –
Other transfers and grants (1 000) (3 952) (7 701) (8 438) (12 200) (14 258) (8 888) (6 200) (4 791) (3 000) (4 861) 75 289 – – –
Transfers recognised - capital – – – – – – – – – – – 78 839 78 839 114 462 –
Public contributions & donations – – – – – – – – – – – – – – –
Borrowing – – 1 300 – – 1 300 – 500 2 950 1 500 1 500 1 450 10 500 – –
Internally generated funds 2 280 6 542 28 405 16 174 19 076 20 059 10 713 8 525 10 931 5 335 7 186 (69 905) 65 321 62 579 38 921
Total Capital Funding 2 280 6 542 29 705 16 174 19 076 21 359 10 713 9 025 13 881 6 835 8 686 10 384 154 660 177 041 38 921
References1. Table should be completed as either Multi-Year expenditure appropriation or Budget Year and Forward Year estimates
2. Total Capital Expenditure must reconcile to Budgeted Capital Expenditure
check
Budget Year 2017/18Medium Term Revenue and Expenditure
Framework

WC025 Breede Valley - Supporting Table SA30 Budgeted monthly cash flow
MONTHLY CASH FLOWS
R thousand July August Sept. October November December January February March April May JuneBudget Year
2017/18
Budget Year +1
2018/19
Budget Year +2
2019/20Cash Receipts By Source 1
Property rates 9 600 14 800 11 500 10 500 10 600 10 100 10 800 10 200 10 700 10 700 10 500 10 795 130 795 138 250 145 992
Service charges - electricity revenue 31 500 33 000 34 000 33 000 33 000 31 000 31 000 32 000 31 500 31 800 32 500 33 455 387 755 409 857 432 809
Service charges - water revenue 5 000 4 900 5 500 5 050 4 950 4 720 4 950 4 920 4 850 4 980 4 980 5 183 59 983 63 402 66 953
Service charges - sanitation revenue 4 400 4 507 4 570 4 550 4 500 4 100 4 650 4 650 4 650 4 680 4 590 4 560 54 407 57 508 60 728
Service charges - refuse revenue 3 100 3 150 3 100 3 100 3 150 3 080 3 190 3 220 3 100 3 200 3 150 3 213 37 753 39 905 42 140
Service charges - other – – – – – – – – – – – – – – –
Rental of facilities and equipment 1 150 1 290 1 260 1 250 1 100 1 050 1 250 1 250 1 220 1 290 1 150 1 232 14 492 15 318 16 176
Interest earned - external investments 900 1 500 850 890 790 890 1 205 750 520 730 840 755 10 620 11 225 11 854
Interest earned - outstanding debtors 290 290 240 298 275 235 295 215 201 217 201 253 3 009 3 181 3 359
Dividends received – – – – – – – – – – – – – – –
Fines, penalties and forfeits 2 100 1 600 1 790 1 910 1 890 1 956 2 117 1 899 1 750 2 100 1 880 1 917 22 909 24 215 25 571
Licences and permits 290 240 280 300 265 285 281 245 255 245 239 247 3 173 3 353 3 541
Agency services 590 590 601 602 711 685 580 603 629 658 612 512 7 373 7 793 8 229
Transfer receipts - operational 40 659 6 349 3 894 3 000 10 403 32 521 5 994 11 995 29 412 2 097 159 90 146 572 189 947 118 836
Other revenue 532 501 445 530 589 598 510 491 502 513 589 512 6 312 6 672 7 046
Cash Receipts by Source 100 111 72 717 68 030 64 980 72 222 91 220 66 823 72 438 89 290 63 210 61 390 62 724 885 153 970 627 943 234
Other Cash Flows by Source
Transfer receipts - capital 5 986 3 000 5 000 5 063 15 740 14 826 4 031 4 551 15 642 5 000 – – 78 839 114 462 – Transfers and subsidies - capital (monetary allocations) (National /
Provincial Departmental Agencies, Households, Non-profit
Institutions, Private Enterprises, Public Corporatons, Higher
Educational Institutions) & Transfers and subsidies - capital (in-
kind - all) – – – – – – – – – – – – – – –
Proceeds on disposal of PPE – – – – – – – – – – – – – – –
Short term loans – – – – – – – – – – – – – – –
Borrowing long term/refinancing – – – – – – – – – – – – – – –
Increase (decrease) in consumer deposits 7 11 15 9 8 7 15 5 5 5 7 8 100 100 100
Decrease (Increase) in non-current debtors – – – – – – – – – – – – – – –
Decrease (increase) other non-current receivables – 5 3 5 9 0 6 2 11 6 – 3 50 50 50
Decrease (increase) in non-current investments – – – – – – – – – – – – – – –
Total Cash Receipts by Source 106 104 75 733 73 048 70 056 87 979 106 052 70 874 76 996 104 948 68 221 61 397 62 735 964 142 1 085 239 943 384
Cash Payments by Type
Employee related costs 23 400 22 900 22 950 22 500 22 650 22 500 22 350 22 073 22 150 22 115 22 500 51 552 299 640 316 047 333 113
Remuneration of councillors 1 380 1 385 1 380 1 350 1 350 1 355 1 365 1 366 1 364 1 345 1 335 1 493 16 468 17 406 18 381
Finance charges – – 13 401 – – – – – 12 986 – – (0) 26 387 25 050 24 176
Bulk purchases - Electricity 33 000 33 500 31 000 21 100 21 050 20 150 19 215 19 200 19 150 18 890 18 889 18 737 273 881 289 493 305 704
Bulk purchases - Water & Sewer 85 168 192 205 206 215 206 204 210 206 211 163 2 270 2 399 2 534
Other materials 5 450 5 990 4 900 4 988 4 895 4 442 5 018 5 012 4 992 5 250 5 980 5 552 62 469 66 030 69 728
Contracted services 658 763 844 930 695 755 896 769 845 760 725 727 9 366 9 900 10 455
Transfers and grants - other municipalities – – – – – – – – – – – – – – –
Transfers and grants - other 2 2 60 80 2 22 29 15 12 12 36 8 279 295 311
Other expenditure 10 014 9 956 10 755 10 255 9 825 10 090 9 331 9 708 8 927 9 978 9 704 25 261 133 803 173 553 104 359
Cash Payments by Type 73 989 74 663 85 483 61 408 60 673 59 529 58 410 58 347 70 635 58 555 59 380 103 493 824 564 900 174 868 760
Other Cash Flows/Payments by Type
Capital assets 2 280 6 542 29 705 16 174 19 076 21 359 10 713 9 025 13 881 6 835 8 686 10 384 154 660 177 041 38 921
Repayment of borrowing – – 8 369 – – – – – 8 831 – – – 17 200 9 427 10 410
Other Cash Flows/Payments – – – – – – – – – – – – – – –
Total Cash Payments by Type 76 269 81 206 123 557 77 582 79 749 80 888 69 123 67 372 93 347 65 390 68 066 113 877 996 424 1 086 642 918 091
NET INCREASE/(DECREASE) IN CASH HELD 29 835 (5 473) (50 509) (7 526) 8 230 25 165 1 752 9 624 11 601 2 830 (6 669) (51 142) (32 282) (1 403) 25 293
Cash/cash equivalents at the month/year begin: 115 031 144 866 139 393 88 884 81 359 89 589 114 753 116 505 126 129 137 729 140 560 133 890 115 031 82 748 81 346
Cash/cash equivalents at the month/year end: 144 866 139 393 88 884 81 359 89 589 114 753 116 505 126 129 137 729 140 560 133 890 82 748 82 748 81 346 106 639
References
Medium Term Revenue and Expenditure
FrameworkBudget Year 2017/18
1. Note that this section of Table SA 30 is deliberately not linked to Table A4 because timing differences between the invoicing of clients and receiving the cash means that the cashflow will differ from budgeted revenue, and similarly for budgeted expenditure. However for the MTREF it is now directly linked to A7.

WC025 Breede Valley - NOT REQUIRED - municipality does not have entities
Description 2013/14 2014/15 2015/16
R millionAudited
Outcome
Audited
Outcome
Audited
Outcome
Original
Budget
Adjusted
Budget
Full Year
Forecast
Budget Year
2017/18
Budget Year +1
2018/19
Budget Year +2
2019/20
Financial Performance
Property rates
Service charges
Investment revenue
Transfers recognised - operational
Other own revenue
Contributions recognised - capital & contributed assets
Total Revenue (excluding capital transfers and contributions) – – – – – – – – –
Employee costs
Remuneration of Board Members
Depreciation & asset impairment
Finance charges
Materials and bulk purchases
Transfers and grants
Other expenditure
Total Expenditure – – – – – – – – –
Surplus/(Deficit) – – – – – – – – –
Capital expenditure & funds sources
Capital expenditure
Transfers recognised - operational
Public contributions & donations
Borrowing
Internally generated funds
Total sources – – – – – – – – –
Financial position
Total current assets
Total non current assets
Total current liabilities
Total non current liabilities
Equity
Cash flows
Net cash from (used) operating
Net cash from (used) investing
Net cash from (used) financing
Cash/cash equivalents at the year end
Current Year 2016/172017/18 Medium Term Revenue & Expenditure
FrameworkRef

WC025 Breede Valley - Supporting Table SA32 List of external mechanisms
External mechanismPeriod of
agreement 1.
Monetary value
of agreement 2.
Name of organisation Number R thousand
The municipality did not budget
or entered into any agreement for
an external mechanism to provide
services on behalf of the municipality.
The municipality does not have any
entities
References
1. Total agreement period from commencement until end
2. Annual value
Service provided
Expiry date of service
delivery agreement or
contract
Yrs/
Mths
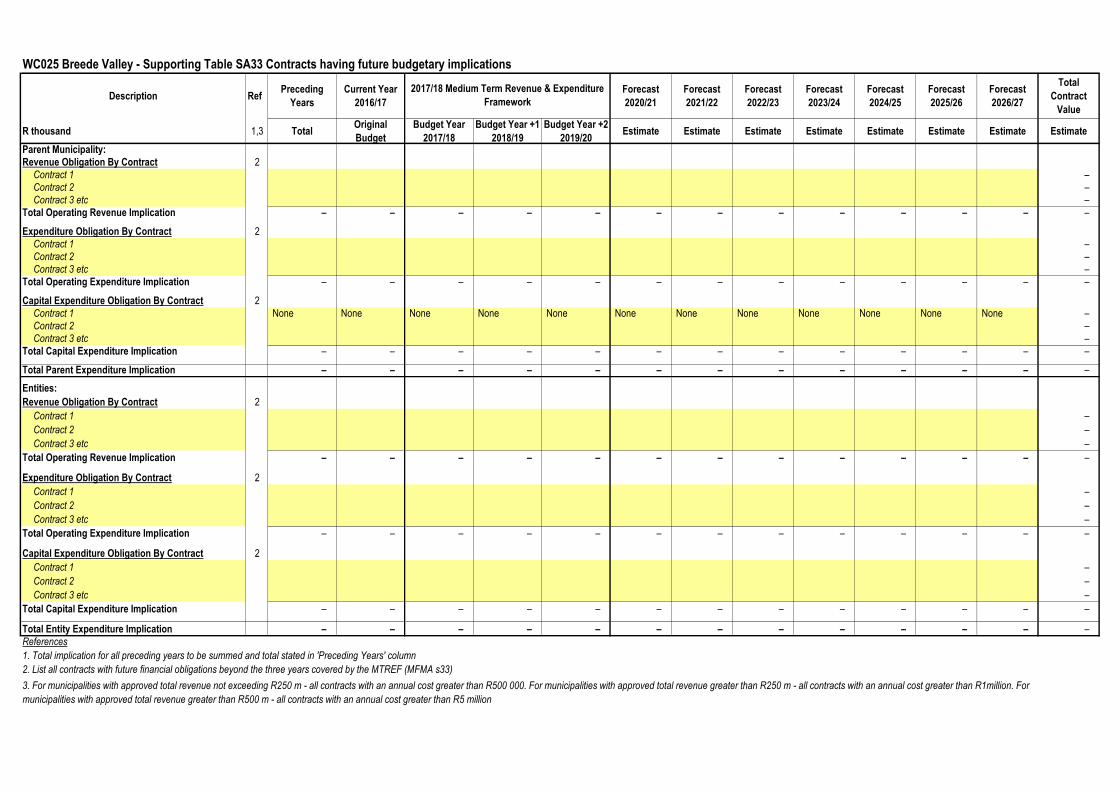
WC025 Breede Valley - Supporting Table SA33 Contracts having future budgetary implications
Description RefPreceding
Years
Current Year
2016/17
Forecast
2020/21
Forecast
2021/22
Forecast
2022/23
Forecast
2023/24
Forecast
2024/25
Forecast
2025/26
Forecast
2026/27
Total
Contract
Value
R thousand 1,3 TotalOriginal
Budget
Budget Year
2017/18
Budget Year +1
2018/19
Budget Year +2
2019/20Estimate Estimate Estimate Estimate Estimate Estimate Estimate Estimate
Parent Municipality:
Revenue Obligation By Contract 2
Contract 1 –
Contract 2 –
Contract 3 etc –
Total Operating Revenue Implication – – – – – – – – – – – – –
Expenditure Obligation By Contract 2
Contract 1 –
Contract 2 –
Contract 3 etc –
Total Operating Expenditure Implication – – – – – – – – – – – – –
Capital Expenditure Obligation By Contract 2
Contract 1 None None None None None None None None None None None None –
Contract 2 –
Contract 3 etc –
Total Capital Expenditure Implication – – – – – – – – – – – – –
Total Parent Expenditure Implication – – – – – – – – – – – – –
Entities:
Revenue Obligation By Contract 2
Contract 1 –
Contract 2 –
Contract 3 etc –
Total Operating Revenue Implication – – – – – – – – – – – – –
Expenditure Obligation By Contract 2
Contract 1 –
Contract 2 –
Contract 3 etc –
Total Operating Expenditure Implication – – – – – – – – – – – – –
Capital Expenditure Obligation By Contract 2
Contract 1 –
Contract 2 –
Contract 3 etc –
Total Capital Expenditure Implication – – – – – – – – – – – – –
Total Entity Expenditure Implication – – – – – – – – – – – – –
References
1. Total implication for all preceding years to be summed and total stated in 'Preceding Years' column
2. List all contracts with future financial obligations beyond the three years covered by the MTREF (MFMA s33)
2017/18 Medium Term Revenue & Expenditure
Framework
3. For municipalities with approved total revenue not exceeding R250 m - all contracts with an annual cost greater than R500 000. For municipalities with approved total revenue greater than R250 m - all contracts with an annual cost greater than R1million. For
municipalities with approved total revenue greater than R500 m - all contracts with an annual cost greater than R5 million
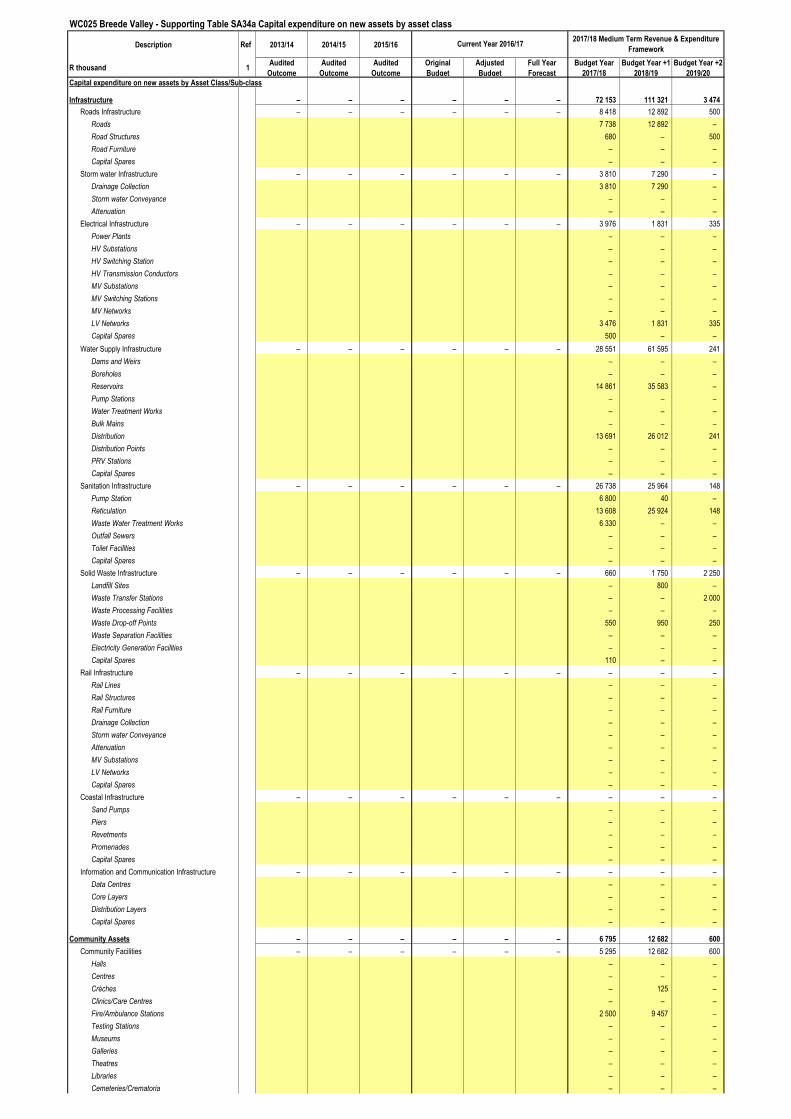
WC025 Breede Valley - Supporting Table SA34a Capital expenditure on new assets by asset class
Description Ref 2013/14 2014/15 2015/16
R thousand 1Audited
Outcome
Audited
Outcome
Audited
Outcome
Original
Budget
Adjusted
Budget
Full Year
Forecast
Budget Year
2017/18
Budget Year +1
2018/19
Budget Year +2
2019/20
Capital expenditure on new assets by Asset Class/Sub-class
Infrastructure – – – – – – 72 153 111 321 3 474
Roads Infrastructure – – – – – – 8 418 12 892 500
Roads 7 738 12 892 –
Road Structures 680 – 500
Road Furniture – – –
Capital Spares – – –
Storm water Infrastructure – – – – – – 3 810 7 290 –
Drainage Collection 3 810 7 290 –
Storm water Conveyance – – –
Attenuation – – –
Electrical Infrastructure – – – – – – 3 976 1 831 335
Power Plants – – –
HV Substations – – –
HV Switching Station – – –
HV Transmission Conductors – – –
MV Substations – – –
MV Switching Stations – – –
MV Networks – – –
LV Networks 3 476 1 831 335
Capital Spares 500 – –
Water Supply Infrastructure – – – – – – 28 551 61 595 241
Dams and Weirs – – –
Boreholes – – –
Reservoirs 14 861 35 583 –
Pump Stations – – –
Water Treatment Works – – –
Bulk Mains – – –
Distribution 13 691 26 012 241
Distribution Points – – –
PRV Stations – – –
Capital Spares – – –
Sanitation Infrastructure – – – – – – 26 738 25 964 148
Pump Station 6 800 40 –
Reticulation 13 608 25 924 148
Waste Water Treatment Works 6 330 – –
Outfall Sewers – – –
Toilet Facilities – – –
Capital Spares – – –
Solid Waste Infrastructure – – – – – – 660 1 750 2 250
Landfill Sites – 800 –
Waste Transfer Stations – – 2 000
Waste Processing Facilities – – –
Waste Drop-off Points 550 950 250
Waste Separation Facilities – – –
Electricity Generation Facilities – – –
Capital Spares 110 – –
Rail Infrastructure – – – – – – – – –
Rail Lines – – –
Rail Structures – – –
Rail Furniture – – –
Drainage Collection – – –
Storm water Conveyance – – –
Attenuation – – –
MV Substations – – –
LV Networks – – –
Capital Spares – – –
Coastal Infrastructure – – – – – – – – –
Sand Pumps – – –
Piers – – –
Revetments – – –
Promenades – – –
Capital Spares – – –
Information and Communication Infrastructure – – – – – – – – –
Data Centres – – –
Core Layers – – –
Distribution Layers – – –
Capital Spares – – –
Community Assets – – – – – – 6 795 12 682 600
Community Facilities – – – – – – 5 295 12 682 600
Halls – – –
Centres – – –
Crèches – 125 –
Clinics/Care Centres – – –
Fire/Ambulance Stations 2 500 9 457 –
Testing Stations – – –
Museums – – –
Galleries – – –
Theatres – – –
Libraries – – –
Cemeteries/Crematoria – – –
Current Year 2016/172017/18 Medium Term Revenue & Expenditure
Framework

WC025 Breede Valley - Supporting Table SA34a Capital expenditure on new assets by asset class
Description Ref 2013/14 2014/15 2015/16
R thousand 1Audited
Outcome
Audited
Outcome
Audited
Outcome
Original
Budget
Adjusted
Budget
Full Year
Forecast
Budget Year
2017/18
Budget Year +1
2018/19
Budget Year +2
2019/20
Current Year 2016/172017/18 Medium Term Revenue & Expenditure
Framework
Police – – –
Purls – – –
Public Open Space 2 195 1 100 600
Nature Reserves – – –
Public Ablution Facilities – – –
Markets 600 2 000 –
Stalls – – –
Abattoirs – – –
Airports – – –
Taxi Ranks/Bus Terminals – – –
Capital Spares – – –
Sport and Recreation Facilities – – – – – – 1 500 – –
Indoor Facilities – – –
Outdoor Facilities 1 500 – –
Capital Spares – – –
Heritage assets – – – – – – – – –
Monuments – – –
Historic Buildings – – –
Works of Art – – –
Conservation Areas – – –
Other Heritage – – –
Investment properties – – – – – – – – –
Revenue Generating – – – – – – – – –
Improved Property – – –
Unimproved Property – – –
Non-revenue Generating – – – – – – – – –
Improved Property – – –
Unimproved Property – – –
Other assets – – – – – – 1 885 1 100 1 100
Operational Buildings – – – – – – 1 885 1 100 1 100
Municipal Offices 1 885 1 100 1 100
Pay/Enquiry Points – – –
Building Plan Offices – – –
Workshops – – –
Yards – – –
Stores – – –
Laboratories – – –
Training Centres – – –
Manufacturing Plant – – –
Depots – – –
Capital Spares – – –
Housing – – – – – – – – –
Staff Housing – – –
Social Housing – – –
Capital Spares – – –
Biological or Cultivated Assets – – – – – – – – –
Biological or Cultivated Assets – – –
Intangible Assets – – – – – – 350 – –
Servitudes – – –
Licences and Rights – – – – – – 350 – –
Water Rights – – –
Effluent Licenses – – –
Solid Waste Licenses – – –
Computer Software and Applications 350 – –
Load Settlement Software Applications – – –
Unspecified – – –
Computer Equipment – – – – – – – – –
Computer Equipment – – –
Furniture and Office Equipment – – – – – – 438 300 330
Furniture and Office Equipment 438 300 330
Machinery and Equipment – – – – – – 8 285 990 600
Machinery and Equipment 8 285 990 600
Transport Assets – – – – – – 1 240 1 250 1 100
Transport Assets 1 240 1 250 1 100
Libraries – – – – – – – – –
Libraries – – –
Zoo's, Marine and Non-biological Animals – – – – – – – – –
Zoo's, Marine and Non-biological Animals – – –
Total Capital Expenditure on new assets 1 – – – – – – 91 146 127 643 7 204
check balance - - - - - - - - -

WC025 Breede Valley - Supporting Table SA34b Capital expenditure on the renewal of existing assets by asset class
Description Ref 2013/14 2014/15 2015/16
R thousand 1Audited
Outcome
Audited
Outcome
Audited
Outcome
Original
Budget
Adjusted
Budget
Full Year
Forecast
Budget Year
2017/18
Budget Year +1
2018/19
Budget Year +2
2019/20
Capital expenditure on renewal of existing assets by Asset Class/Sub-class
Infrastructure – – – – – – 51 544 38 385 25 250
Roads Infrastructure – – – – – – 4 500 6 500 7 500
Roads 4 500 6 500 7 500
Road Structures – – –
Road Furniture – – –
Capital Spares – – –
Storm water Infrastructure – – – – – – 1 000 – 1 000
Drainage Collection 1 000 – 1 000
Storm water Conveyance – – –
Attenuation – – –
Electrical Infrastructure – – – – – – 31 956 30 135 15 000
Power Plants – – –
HV Substations – – –
HV Switching Station – – –
HV Transmission Conductors – – –
MV Substations – – –
MV Switching Stations – – –
MV Networks – – –
LV Networks 31 956 30 135 15 000
Capital Spares – – –
Water Supply Infrastructure – – – – – – 1 750 1 750 1 750
Dams and Weirs – – –
Boreholes – – –
Reservoirs – – –
Pump Stations – – –
Water Treatment Works – – –
Bulk Mains – – –
Distribution 1 750 1 750 1 750
Distribution Points – – –
PRV Stations – – –
Capital Spares – – –
Sanitation Infrastructure – – – – – – 5 000 – –
Pump Station – – –
Reticulation 5 000 – –
Waste Water Treatment Works – – –
Outfall Sewers – – –
Toilet Facilities – – –
Capital Spares – – –
Solid Waste Infrastructure – – – – – – 7 338 – –
Landfill Sites – – –
Waste Transfer Stations – – –
Waste Processing Facilities 7 338 – –
Waste Drop-off Points – – –
Waste Separation Facilities – – –
Electricity Generation Facilities – – –
Capital Spares – – –
Rail Infrastructure – – – – – – – – –
Rail Lines – – –
Rail Structures – – –
Rail Furniture – – –
Drainage Collection – – –
Storm water Conveyance – – –
Attenuation – – –
MV Substations – – –
LV Networks – – –
Capital Spares – – –
Coastal Infrastructure – – – – – – – – –
Sand Pumps – – –
Piers – – –
Revetments – – –
Promenades – – –
Capital Spares – – –
Information and Communication Infrastructure – – – – – – – – –
Data Centres – – –
Core Layers – – –
Distribution Layers – – –
Capital Spares – – –
Community Assets – – – – – – 1 100 200 –
Community Facilities – – – – – – – 200 –
Halls – – –
Centres – – –
Crèches – – –
Clinics/Care Centres – – –
Fire/Ambulance Stations – – –
Testing Stations – 200 –
Museums – – –
Galleries – – –
Theatres – – –
Libraries – – –
Cemeteries/Crematoria – – –
Police – – –
Current Year 2016/172017/18 Medium Term Revenue & Expenditure
Framework
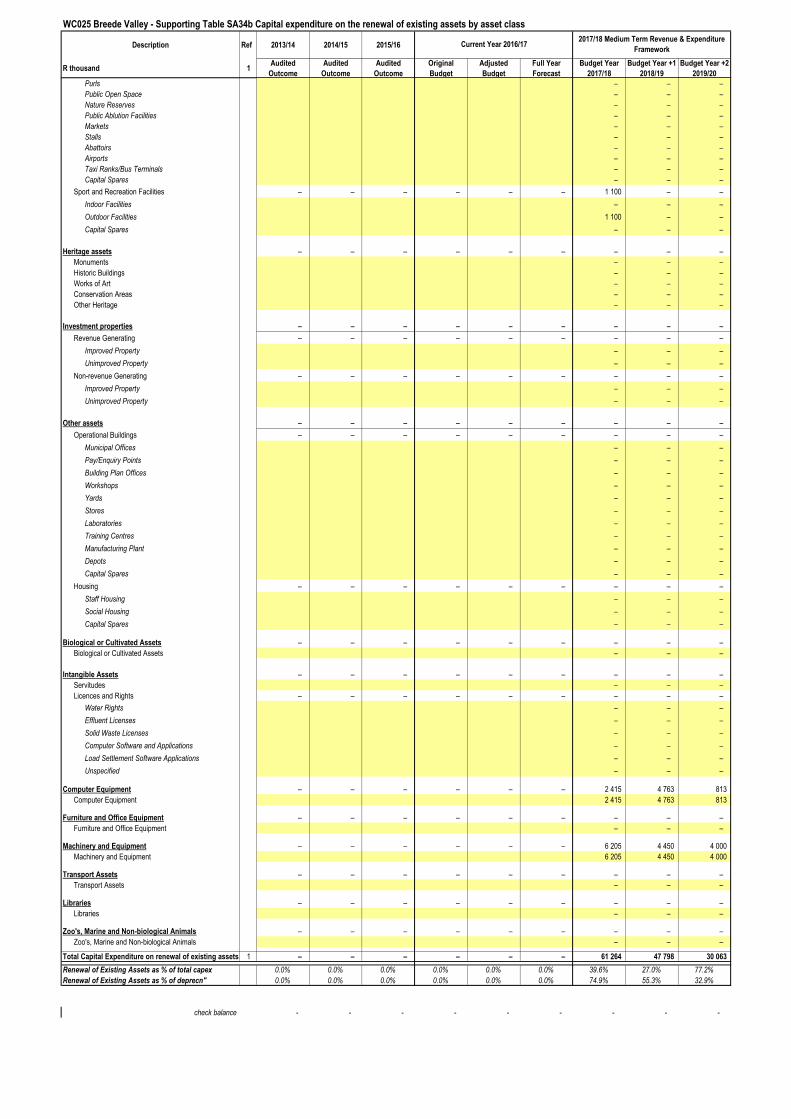
WC025 Breede Valley - Supporting Table SA34b Capital expenditure on the renewal of existing assets by asset class
Description Ref 2013/14 2014/15 2015/16
R thousand 1Audited
Outcome
Audited
Outcome
Audited
Outcome
Original
Budget
Adjusted
Budget
Full Year
Forecast
Budget Year
2017/18
Budget Year +1
2018/19
Budget Year +2
2019/20
Current Year 2016/172017/18 Medium Term Revenue & Expenditure
Framework
Purls – – –
Public Open Space – – –
Nature Reserves – – –
Public Ablution Facilities – – –
Markets – – –
Stalls – – –
Abattoirs – – –
Airports – – –
Taxi Ranks/Bus Terminals – – –
Capital Spares – – –
Sport and Recreation Facilities – – – – – – 1 100 – –
Indoor Facilities – – –
Outdoor Facilities 1 100 – –
Capital Spares – – –
Heritage assets – – – – – – – – –
Monuments – – –
Historic Buildings – – –
Works of Art – – –
Conservation Areas – – –
Other Heritage – – –
Investment properties – – – – – – – – –
Revenue Generating – – – – – – – – –
Improved Property – – –
Unimproved Property – – –
Non-revenue Generating – – – – – – – – –
Improved Property – – –
Unimproved Property – – –
Other assets – – – – – – – – –
Operational Buildings – – – – – – – – –
Municipal Offices – – –
Pay/Enquiry Points – – –
Building Plan Offices – – –
Workshops – – –
Yards – – –
Stores – – –
Laboratories – – –
Training Centres – – –
Manufacturing Plant – – –
Depots – – –
Capital Spares – – –
Housing – – – – – – – – –
Staff Housing – – –
Social Housing – – –
Capital Spares – – –
Biological or Cultivated Assets – – – – – – – – –
Biological or Cultivated Assets – – –
Intangible Assets – – – – – – – – –
Servitudes – – –
Licences and Rights – – – – – – – – –
Water Rights – – –
Effluent Licenses – – –
Solid Waste Licenses – – –
Computer Software and Applications – – –
Load Settlement Software Applications – – –
Unspecified – – –
Computer Equipment – – – – – – 2 415 4 763 813
Computer Equipment 2 415 4 763 813
Furniture and Office Equipment – – – – – – – – –
Furniture and Office Equipment – – –
Machinery and Equipment – – – – – – 6 205 4 450 4 000
Machinery and Equipment 6 205 4 450 4 000
Transport Assets – – – – – – – – –
Transport Assets – – –
Libraries – – – – – – – – –
Libraries – – –
Zoo's, Marine and Non-biological Animals – – – – – – – – –
Zoo's, Marine and Non-biological Animals – – –
Total Capital Expenditure on renewal of existing assets 1 – – – – – – 61 264 47 798 30 063
Renewal of Existing Assets as % of total capex 0.0% 0.0% 0.0% 0.0% 0.0% 0.0% 39.6% 27.0% 77.2%
Renewal of Existing Assets as % of deprecn" 0.0% 0.0% 0.0% 0.0% 0.0% 0.0% 74.9% 55.3% 32.9%
check balance - - - - - - - - -

WC025 Breede Valley - Supporting Table SA34c Repairs and maintenance expenditure by asset class
Description Ref 2013/14 2014/15 2015/16
R thousand 1Audited
Outcome
Audited
Outcome
Audited
Outcome
Original
Budget
Adjusted
Budget
Full Year
Forecast
Budget Year
2017/18
Budget Year +1
2018/19
Budget Year +2
2019/20
Repairs and maintenance expenditure by Asset Class/Sub-class
Infrastructure – – – – – – 43 238 45 702 48 262
Roads Infrastructure – – – – – – 8 982 9 494 10 026
Roads 3 391 3 585 3 785
Road Structures 4 686 4 953 5 230
Road Furniture 905 956 1 010
Capital Spares – – –
Storm water Infrastructure – – – – – – 1 887 1 995 2 106
Drainage Collection 1 887 1 995 2 106
Storm water Conveyance – – –
Attenuation – – –
Electrical Infrastructure – – – – – – 19 534 20 647 21 804
Power Plants – – –
HV Substations – – –
HV Switching Station – – –
HV Transmission Conductors – – –
MV Substations – – –
MV Switching Stations 1 336 1 412 1 491
MV Networks 4 204 4 444 4 693
LV Networks 13 994 14 792 15 620
Capital Spares – – –
Water Supply Infrastructure – – – – – – 5 912 6 249 6 599
Dams and Weirs 896 947 1 000
Boreholes – – –
Reservoirs 19 20 21
Pump Stations 14 14 15
Water Treatment Works 62 65 69
Bulk Mains 550 581 614
Distribution 4 372 4 621 4 880
Distribution Points – – –
PRV Stations – – –
Capital Spares – – –
Sanitation Infrastructure – – – – – – 6 887 7 280 7 687
Pump Station 664 702 741
Reticulation 2 875 3 038 3 209
Waste Water Treatment Works 3 305 3 493 3 689
Outfall Sewers 8 8 9
Toilet Facilities 36 38 40
Capital Spares – – –
Solid Waste Infrastructure – – – – – – 36 38 40
Landfill Sites – – –
Waste Transfer Stations 36 38 40
Waste Processing Facilities – – –
Waste Drop-off Points – – –
Waste Separation Facilities – – –
Electricity Generation Facilities – – –
Capital Spares – – –
Rail Infrastructure – – – – – – – – –
Rail Lines – – –
Rail Structures – – –
Rail Furniture – – –
Drainage Collection – – –
Storm water Conveyance – – –
Attenuation – – –
MV Substations – – –
LV Networks – – –
Capital Spares – – –
Coastal Infrastructure – – – – – – – – –
Sand Pumps – – –
Piers – – –
Revetments – – –
Promenades – – –
Capital Spares – – –
Information and Communication Infrastructure – – – – – – – – –
Data Centres – – –
Core Layers – – –
Distribution Layers – – –
Capital Spares – – –
Community Assets – – – – – – 4 746 5 016 5 297
Community Facilities – – – – – – 2 639 2 789 2 946
Halls 95 100 106
Centres 231 244 257
Crèches – – –
Clinics/Care Centres – – –
Fire/Ambulance Stations 50 52 55
Testing Stations – – –
Museums – – –
Galleries – – –
Theatres – – –
Libraries 297 314 332
Cemeteries/Crematoria 280 296 313
Police – – –
Current Year 2016/172017/18 Medium Term Revenue & Expenditure
Framework

WC025 Breede Valley - Supporting Table SA34c Repairs and maintenance expenditure by asset class
Description Ref 2013/14 2014/15 2015/16
R thousand 1Audited
Outcome
Audited
Outcome
Audited
Outcome
Original
Budget
Adjusted
Budget
Full Year
Forecast
Budget Year
2017/18
Budget Year +1
2018/19
Budget Year +2
2019/20
Current Year 2016/172017/18 Medium Term Revenue & Expenditure
Framework
Purls – – –
Public Open Space 1 558 1 647 1 739
Nature Reserves 0 0 0
Public Ablution Facilities – – –
Markets – – –
Stalls – – –
Abattoirs – – –
Airports 129 136 144
Taxi Ranks/Bus Terminals – – –
Capital Spares – – –
Sport and Recreation Facilities – – – – – – 2 107 2 227 2 352
Indoor Facilities 813 860 908
Outdoor Facilities 1 294 1 367 1 444
Capital Spares – – –
Heritage assets – – – – – – – – –
Monuments – – –
Historic Buildings – – –
Works of Art – – –
Conservation Areas – – –
Other Heritage – – –
Investment properties – – – – – – – – –
Revenue Generating – – – – – – – – –
Improved Property – – –
Unimproved Property – – –
Non-revenue Generating – – – – – – – – –
Improved Property – – –
Unimproved Property – – –
Other assets – – – – – – 4 023 4 252 4 490
Operational Buildings – – – – – – 3 124 3 302 3 487
Municipal Offices 2 947 3 115 3 290
Pay/Enquiry Points – – –
Building Plan Offices – – –
Workshops 66 69 73
Yards – – –
Stores 111 118 124
Laboratories – – –
Training Centres – – –
Manufacturing Plant – – –
Depots – – –
Capital Spares – – –
Housing – – – – – – 898 950 1 003
Staff Housing – – –
Social Housing 898 950 1 003
Capital Spares – – –
Biological or Cultivated Assets – – – – – – – – –
Biological or Cultivated Assets – – –
Intangible Assets – – – – – – – – –
Servitudes – – –
Licences and Rights – – – – – – – – –
Water Rights – – –
Effluent Licenses – – –
Solid Waste Licenses – – –
Computer Software and Applications – – –
Load Settlement Software Applications – – –
Unspecified – – –
Computer Equipment – – – – – – 1 842 1 947 2 056
Computer Equipment 1 842 1 947 2 056
Furniture and Office Equipment – – – – – – 6 6 6
Furniture and Office Equipment 6 6 6
Machinery and Equipment – – – – – – 3 362 3 554 3 753
Machinery and Equipment 3 362 3 554 3 753
Transport Assets – – – – – – 5 253 5 553 5 864
Transport Assets 5 253 5 553 5 864
Libraries – – – – – – – – –
Libraries – – –
Zoo's, Marine and Non-biological Animals – – – – – – – – –
Zoo's, Marine and Non-biological Animals – – –
Total Repairs and Maintenance Expenditure 1 – – – – – – 62 469 66 030 69 728
R&M as a % of PPE 0.0% 0.0% 0.0% 0.0% 0.0% 0.0% 0.0% 3.3% 3.3%
R&M as % Operating Expenditure 0.0% 0.0% 0.0% 0.0% 0.0% 0.0% 0.0% 6.9% 6.7%
check balance – – – – – – – – –

WC025 Breede Valley - Supporting Table SA34d Depreciation by asset class
Description Ref 2013/14 2014/15 2015/16
R thousand 1Audited
Outcome
Audited
Outcome
Audited
Outcome
Original
Budget
Adjusted
Budget
Full Year
Forecast
Budget Year
2017/18
Budget Year +1
2018/19
Budget Year +2
2019/20
Depreciation by Asset Class/Sub-class
Infrastructure – – – – – – 67 793 71 658 75 671
Roads Infrastructure – – – – – – 23 369 24 701 26 085
Roads 21 531 22 759 24 033
Road Structures 1 838 1 943 2 052
Road Furniture – – –
Capital Spares – – –
Storm water Infrastructure – – – – – – – – –
Drainage Collection – – –
Storm water Conveyance – – –
Attenuation – – –
Electrical Infrastructure – – – – – – 12 322 13 024 13 754
Power Plants – – –
HV Substations – – –
HV Switching Station – – –
HV Transmission Conductors – – –
MV Substations 2 817 2 978 3 145
MV Switching Stations – – –
MV Networks 1 117 1 180 1 246
LV Networks – – –
Capital Spares 8 388 8 866 9 362
Water Supply Infrastructure – – – – – – 11 230 11 870 12 535
Dams and Weirs 1 451 1 534 1 620
Boreholes – – –
Reservoirs 862 911 962
Pump Stations 303 321 338
Water Treatment Works 1 208 1 277 1 348
Bulk Mains – – –
Distribution 7 406 7 828 8 266
Distribution Points – – –
PRV Stations – – –
Capital Spares – – –
Sanitation Infrastructure – – – – – – 11 160 11 796 12 457
Pump Station 19 20 21
Reticulation 2 809 2 969 3 135
Waste Water Treatment Works 8 232 8 701 9 188
Outfall Sewers 100 106 112
Toilet Facilities – – –
Capital Spares – – –
Solid Waste Infrastructure – – – – – – 9 712 10 266 10 841
Landfill Sites 8 634 9 127 9 638
Waste Transfer Stations 65 69 73
Waste Processing Facilities 1 012 1 070 1 130
Waste Drop-off Points – – –
Waste Separation Facilities – – –
Electricity Generation Facilities – – –
Capital Spares – – –
Rail Infrastructure – – – – – – – – –
Rail Lines – – –
Rail Structures – – –
Rail Furniture – – –
Drainage Collection – – –
Storm water Conveyance – – –
Attenuation – – –
MV Substations – – –
LV Networks – – –
Capital Spares – – –
Coastal Infrastructure – – – – – – – – –
Sand Pumps – – –
Piers – – –
Revetments – – –
Promenades – – –
Capital Spares – – –
Information and Communication Infrastructure – – – – – – – – –
Data Centres – – –
Core Layers – – –
Distribution Layers – – –
Capital Spares – – –
Community Assets – – – – – – 2 273 2 402 2 537
Community Facilities – – – – – – 1 345 1 422 1 501
Halls – – –
Centres 187 198 209
Crèches – – –
Clinics/Care Centres 75 80 84
Fire/Ambulance Stations 179 189 200
Testing Stations 20 22 23
Museums 13 14 15
Galleries – – –
Theatres – – –
Libraries 400 423 447
Cemeteries/Crematoria 197 208 220
Current Year 2016/172017/18 Medium Term Revenue & Expenditure
Framework

WC025 Breede Valley - Supporting Table SA34d Depreciation by asset class
Description Ref 2013/14 2014/15 2015/16
R thousand 1Audited
Outcome
Audited
Outcome
Audited
Outcome
Original
Budget
Adjusted
Budget
Full Year
Forecast
Budget Year
2017/18
Budget Year +1
2018/19
Budget Year +2
2019/20
Current Year 2016/172017/18 Medium Term Revenue & Expenditure
Framework
Police – – –
Purls – – –
Public Open Space 155 163 172
Nature Reserves – – –
Public Ablution Facilities 44 46 49
Markets – – –
Stalls – – –
Abattoirs – – –
Airports 0 0 0
Taxi Ranks/Bus Terminals 74 78 82
Capital Spares – – –
Sport and Recreation Facilities – – – – – – 928 981 1 036
Indoor Facilities 73 78 82
Outdoor Facilities 855 903 954
Capital Spares – – –
Heritage assets – – – – – – – – –
Monuments – – –
Historic Buildings – – –
Works of Art – – –
Conservation Areas – – –
Other Heritage – – –
Investment properties – – – – – – – – –
Revenue Generating – – – – – – – – –
Improved Property – – –
Unimproved Property – – –
Non-revenue Generating – – – – – – – – –
Improved Property – – –
Unimproved Property – – –
Other assets – – – – – – 4 218 4 459 4 708
Operational Buildings – – – – – – 2 246 2 374 2 507
Municipal Offices 1 306 1 380 1 457
Pay/Enquiry Points – – –
Building Plan Offices – – –
Workshops 18 19 20
Yards – – –
Stores – – –
Laboratories – – –
Training Centres – – –
Manufacturing Plant – – –
Depots – – –
Capital Spares 923 975 1 030
Housing – – – – – – 1 972 2 085 2 202
Staff Housing – – –
Social Housing 1 972 2 085 2 202
Capital Spares – – –
Biological or Cultivated Assets – – – – – – 4 4 4
Biological or Cultivated Assets 4 4 4
Intangible Assets – – – – – – 486 514 542
Servitudes 40 42 45
Licences and Rights – – – – – – 446 471 498
Water Rights – – –
Effluent Licenses – – –
Solid Waste Licenses – – –
Computer Software and Applications 445 471 497
Load Settlement Software Applications – – –
Unspecified 1 1 1
Computer Equipment – – – – – – 1 023 1 081 1 142
Computer Equipment 1 023 1 081 1 142
Furniture and Office Equipment – – – – – – 794 839 886
Furniture and Office Equipment 794 839 886
Machinery and Equipment – – – – – – 2 798 2 957 3 123
Machinery and Equipment 2 798 2 957 3 123
Transport Assets – – – – – – 2 371 2 506 2 646
Transport Assets 2 371 2 506 2 646
Libraries – – – – – – – – –
Libraries – – –
Zoo's, Marine and Non-biological Animals – – – – – – – – –
Zoo's, Marine and Non-biological Animals – – –
Total Depreciation 1 – – – – – – 81 759 86 420 91 259
Check – – – – – – – – –

WC025 Breede Valley - Supporting Table SA34e Capital expenditure on the upgrading of existing assets by asset class
Description Ref 2013/14 2014/15 2015/16
R thousand 1Audited
Outcome
Audited
Outcome
Audited
Outcome
Original
Budget
Adjusted
Budget
Full Year
Forecast
Budget Year
2017/18
Budget Year +1
2018/19
Budget Year +2
2019/20
Capital expenditure on upgrading of existing assets by Asset Class/Sub-class
Infrastructure – – – – – – 600 600 600
Roads Infrastructure – – – – – – – – –
Roads – – –
Road Structures – – –
Road Furniture – – –
Capital Spares – – –
Storm water Infrastructure – – – – – – – – –
Drainage Collection – – –
Storm water Conveyance – – –
Attenuation – – –
Electrical Infrastructure – – – – – – – – –
Power Plants – – –
HV Substations – – –
HV Switching Station – – –
HV Transmission Conductors – – –
MV Substations – – –
MV Switching Stations – – –
MV Networks – – –
LV Networks – – –
Capital Spares – – –
Water Supply Infrastructure – – – – – – – – –
Dams and Weirs – – –
Boreholes – – –
Reservoirs – – –
Pump Stations – – –
Water Treatment Works – – –
Bulk Mains – – –
Distribution – – –
Distribution Points – – –
PRV Stations – – –
Capital Spares – – –
Sanitation Infrastructure – – – – – – 600 600 600
Pump Station – – –
Reticulation 600 600 600
Waste Water Treatment Works – – –
Outfall Sewers – – –
Toilet Facilities – – –
Capital Spares – – –
Solid Waste Infrastructure – – – – – – – – –
Landfill Sites – – –
Waste Transfer Stations – – –
Waste Processing Facilities – – –
Waste Drop-off Points – – –
Waste Separation Facilities – – –
Electricity Generation Facilities – – –
Capital Spares – – –
Rail Infrastructure – – – – – – – – –
Rail Lines – – –
Rail Structures – – –
Rail Furniture – – –
Drainage Collection – – –
Storm water Conveyance – – –
Attenuation – – –
MV Substations – – –
LV Networks – – –
Capital Spares – – –
Coastal Infrastructure – – – – – – – – –
Sand Pumps – – –
Piers – – –
Revetments – – –
Promenades – – –
Capital Spares – – –
Information and Communication Infrastructure – – – – – – – – –
Data Centres – – –
Core Layers – – –
Distribution Layers – – –
Capital Spares – – –
Community Assets – – – – – – 650 – 55
Community Facilities – – – – – – 650 – –
Halls – – –
Centres – – –
Crèches – – –
Clinics/Care Centres – – –
Fire/Ambulance Stations – – –
Testing Stations – – –
Museums – – –
Galleries – – –
Theatres – – –
Libraries 650 – –
Cemeteries/Crematoria – – –
Police – – –
Current Year 2016/172017/18 Medium Term Revenue & Expenditure
Framework

WC025 Breede Valley - Supporting Table SA34e Capital expenditure on the upgrading of existing assets by asset class
Description Ref 2013/14 2014/15 2015/16
R thousand 1Audited
Outcome
Audited
Outcome
Audited
Outcome
Original
Budget
Adjusted
Budget
Full Year
Forecast
Budget Year
2017/18
Budget Year +1
2018/19
Budget Year +2
2019/20
Current Year 2016/172017/18 Medium Term Revenue & Expenditure
Framework
Purls – – –
Public Open Space – – –
Nature Reserves – – –
Public Ablution Facilities – – –
Markets – – –
Stalls – – –
Abattoirs – – –
Airports – – –
Taxi Ranks/Bus Terminals – – –
Capital Spares – – –
Sport and Recreation Facilities – – – – – – – – 55
Indoor Facilities – – –
Outdoor Facilities – – 55
Capital Spares – – –
Heritage assets – – – – – – – – –
Monuments – – –
Historic Buildings – – –
Works of Art – – –
Conservation Areas – – –
Other Heritage – – –
Investment properties – – – – – – – – –
Revenue Generating – – – – – – – – –
Improved Property – – –
Unimproved Property – – –
Non-revenue Generating – – – – – – – – –
Improved Property – – –
Unimproved Property – – –
Other assets – – – – – – – – –
Operational Buildings – – – – – – – – –
Municipal Offices – – –
Pay/Enquiry Points – – –
Building Plan Offices – – –
Workshops – – –
Yards – – –
Stores – – –
Laboratories – – –
Training Centres – – –
Manufacturing Plant – – –
Depots – – –
Capital Spares – – –
Housing – – – – – – – – –
Staff Housing – – –
Social Housing – – –
Capital Spares – – –
Biological or Cultivated Assets – – – – – – – – –
Biological or Cultivated Assets – – –
Intangible Assets – – – – – – – – –
Servitudes – – –
Licences and Rights – – – – – – – – –
Water Rights – – –
Effluent Licenses – – –
Solid Waste Licenses – – –
Computer Software and Applications – – –
Load Settlement Software Applications – – –
Unspecified – – –
Computer Equipment – – – – – – – – –
Computer Equipment – – –
Furniture and Office Equipment – – – – – – – – –
Furniture and Office Equipment – – –
Machinery and Equipment – – – – – – 1 000 1 000 1 000
Machinery and Equipment 1 000 1 000 1 000
Transport Assets – – – – – – – – –
Transport Assets – – –
Libraries – – – – – – – – –
Libraries – – –
Zoo's, Marine and Non-biological Animals – – – – – – – – –
Zoo's, Marine and Non-biological Animals – – –
Total Capital Expenditure on upgrading of existing assets 1 – – – – – – 2 250 1 600 1 655
Upgrading of Existing Assets as % of total capex 0.0% 0.0% 0.0% 0.0% 0.0% 0.0% 1.5% 0.9% 4.3%
Upgrading of Existing Assets as % of deprecn" 0.0% 0.0% 0.0% 0.0% 0.0% 0.0% 2.8% 1.9% 1.8%
check balance - - - - - - - - -
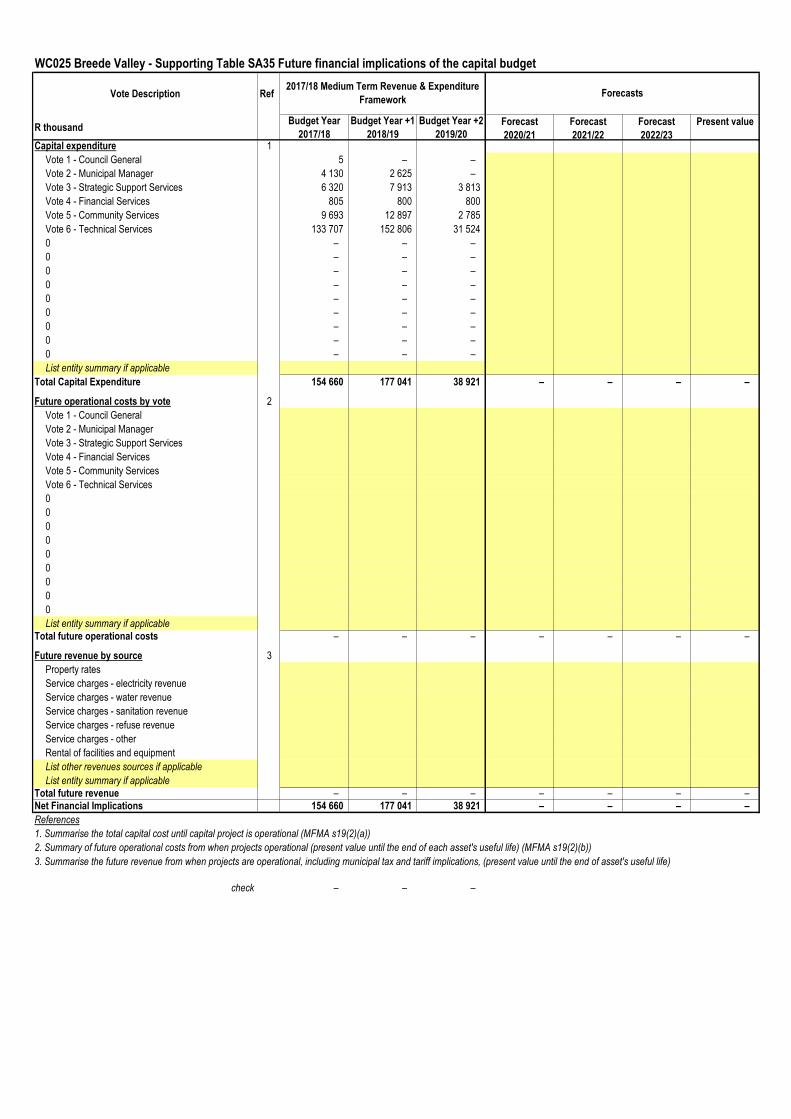
WC025 Breede Valley - Supporting Table SA35 Future financial implications of the capital budget
Vote Description Ref
R thousandBudget Year
2017/18
Budget Year +1
2018/19
Budget Year +2
2019/20
Forecast
2020/21
Forecast
2021/22
Forecast
2022/23
Present value
Capital expenditure 1
Vote 1 - Council General 5 – –
Vote 2 - Municipal Manager 4 130 2 625 –
Vote 3 - Strategic Support Services 6 320 7 913 3 813
Vote 4 - Financial Services 805 800 800
Vote 5 - Community Services 9 693 12 897 2 785
Vote 6 - Technical Services 133 707 152 806 31 524
0 – – –
0 – – –
0 – – –
0 – – –
0 – – –
0 – – –
0 – – –
0 – – –
0 – – –
List entity summary if applicable
Total Capital Expenditure 154 660 177 041 38 921 – – – –
Future operational costs by vote 2
Vote 1 - Council General
Vote 2 - Municipal Manager
Vote 3 - Strategic Support Services
Vote 4 - Financial Services
Vote 5 - Community Services
Vote 6 - Technical Services
0
0
0
0
0
0
0
0
0
List entity summary if applicable
Total future operational costs – – – – – – –
Future revenue by source 3
Property rates
Service charges - electricity revenue
Service charges - water revenue
Service charges - sanitation revenue
Service charges - refuse revenue
Service charges - other
Rental of facilities and equipment
List other revenues sources if applicable
List entity summary if applicable
Total future revenue – – – – – – –
Net Financial Implications 154 660 177 041 38 921 – – – –
References
1. Summarise the total capital cost until capital project is operational (MFMA s19(2)(a))
2. Summary of future operational costs from when projects operational (present value until the end of each asset's useful life) (MFMA s19(2)(b))
3. Summarise the future revenue from when projects are operational, including municipal tax and tariff implications, (present value until the end of asset's useful life)
check – – –
Forecasts2017/18 Medium Term Revenue & Expenditure
Framework

74
WC025 Breede Valley - Supporting Table SA36 Detailed capital budget
Municipal Vote/Capital
projectRef Individually Approved
(Yes/No)
Asset Class Asset Sub-Class GPS co-ordinates
R thousand 4 6 3 3 5
Audited
Outcome
2015/16
Current Year
2016/17
Full Year
Forecast
Budget Year
2017/18
Budget Year +1
2018/19
Budget Year +2
2019/20Ward location New or renewal
Parent municipality:
List all capital projects grouped by Municipal Vote
Worcester WwTW
Technical Services 6905 Beltpresses ( 3 of plus 1 standby) 2 Yes Sanitation Infrastructure Waste Water Treatment Works 19°26'59"E33°39'47"S 6 330 6 330 – – 5, 6,7, 8, 9, 10, 11, 12, 13, 14, 15, 16, 17, 17New
– – –
Klipvlakte/ Transhex Residential Development (13 000 erven) – – –
Technical Services 6912 New Sewer Pump Station & Rising Main (MIG number 236184) 2 Yes Sanitation Infrastructure Pump Station 19°29'5"E33°39'34"S 6 800 6 800 – – 8 New
Technical Services 1536 New High Mast Lighting - Worcester: Trans Hex Housing Development Ph1 2 Yes Electrical Infrastructure LV Networks 19°29'5"E33°39'34"S 741 741 – – 8 New
Technical Services 1536 New High Mast Lighting - Worcester: Zweletemba Housing Project 2 Yes Electrical Infrastructure LV Networks 19°29'5"E33°39'34"S 8 8 – – 8 New
– – –
Reservoirs – – –
Technical Services 8412 Langerug 2 Yes Water Supply Infrastructure Reservoirs 19°25'25"E33°38'42"S 43 004 14 861 28 144 – 5, 6,7, 8, 9, 10, 11, 12, 13, 14, 15, 16, 17, 18New
Technical Services 8412 Pre-loads 2 Yes Water Supply Infrastructure Reservoirs 19°26'31"E33°37'20"S 7 440 – 7 440 – 5, 6,7, 8, 9, 10, 11, 12, 13, 14, 15, 16, 17, 18New
– – –
Transhex Sewer Pumpstation and rising main – – –
Technical Services 6912 Sewer pumpstation and rising main (MIG Conter funding) 2 Yes Sanitation Infrastructure Pump Station 19°29'5"E33°39'34"S 40 – 40 – 10 New
– – –
Surfacing of Roads – – –
Technical Services 1539 Breede Valley: Roads 2 Yes Roads Infrastructure Roads BVM 1 000 1 000 – – 1 to 21 New
Technical Services 1539 Rebuilding roads (Leipold) 2 Yes Roads Infrastructure Roads 19°27'47"E33°38'42"S 500 – – 500 1 to 21 Repl
Technical Services 1539 Paving of sidewalks 2 Yes Roads Infrastructure Roads BVM 750 250 – 500 1 to 21 New
– – –
Resealing of Roads – – –
Technical Services 1539 Resealing of Municipal Roads - Rawsonville 2 Yes Roads Infrastructure Roads BVM 1 000 – – 1 000 1 to 21 Repl
Technical Services 1539 Resealing of Municipal Roads - Worcester 2 Yes Roads Infrastructure Roads BVM 11 000 3 500 4 000 3 500 1 to 21 Repl
Technical Services 1539 Resealing of Municipal Roads - De Doorns 2 Yes Roads Infrastructure Roads BVM 4 000 1 000 1 500 1 500 2, 3, 4 Repl
Technical Services 1539 Resealing of Municipal Roads - Touws River 2 Yes Roads Infrastructure Roads BVM 2 000 – 1 000 1 000 1 Repl
– – –
Networks – – –
Technical Services 6912 Replacement of Sewer Network (Roll-over) 2 Yes Sanitation Infrastructure Reticulation BVM 5 000 5 000 – – 1 to 21 Repl
Technical Services 1533 Stormwater improvements 2 Yes Storm water Infrastructure Storm water Conveyance BVM 2 000 1 000 – 1 000 1 to 21 Repl
Technical Services 6906 Sewerage improvements 2 Yes Sanitation Infrastructure Reticulation BVM 1 800 600 600 600 1 to 21 Repl
Technical Services 6906 Replacement of water pipes 2 Yes Water Supply Infrastructure Distribution BVM 5 250 1 750 1 750 1 750 1 to 21 Repl
– – –
Electricity (8112) – – –
Technical Services 8112 Electrical Reticulation 2 Yes Electrical Infrastructure LV Networks BVM 5 000 2 000 3 000 – 1 to 21 New
Technical Services 8112 Refurbishment of electrical system 2 Yes Electrical Infrastructure HV Switching Station BVM 45 000 15 000 15 000 15 000 1 to 21 Repl
– – –
Refuse Removal (6603) – – –
Technical Services 6603 Worcester : Material Recovery Facility (MIG Form ID 237066) 2 Yes Solid Waste Infrastructure Waste Processing Facilities 19°28'10"E33°40'46"S 7 338 7 338 – – 2, 3, 4 New
– – –
AREA CLEANING – – –
WORCESTER – – –
Technical Services 6603 Street Refuse Bins 2 Yes Machinery and Equipment Unspecified BVM 100 50 50 – 1 to 21 New
Technical Services 6603 Tools & Equipment 2 Yes Machinery and Equipment Unspecified BVM 15 15 – – 1 to 21 New
DE DOORNS – – –
Technical Services 6603 Street refuse bins 2 Yes Machinery and Equipment Unspecified BVM 70 70 – – 2, 3, 4 New
Technical Services 6603 Tools & Equipment 2 Yes Machinery and Equipment Unspecified BVM 15 15 – – 2, 3, 4 New
TOUWSRIVER – – –
Technical Services 6603 Street Refuse bins 2 Yes Machinery and Equipment Unspecified BVM 50 50 – – 1 New
Technical Services 6603 Tools & Equipment 2 Yes Machinery and Equipment Unspecified BVM 15 15 – – 1 New
– – –
SOLID WASTE MANAGEMENT – – –
WORCESTER – – –
Technical Services 6603 Refuce Compactor Truck (19m³) x 6 2 Yes Transport Assets Unspecified BVM 1 750 1 750 – – 1 to 21 New
Technical Services 6603 New LDV with canopy (0,5 ton) 2 Yes Transport Assets Unspecified BVM 140 140 – – 1 to 21 New
Technical Services 6603 Truck (Double Cab, 4 Ton) 2 Yes Transport Assets Unspecified BVM 800 800 – – 1 to 21 New
Technical Services 6603 New LDV with canopy (1 ton) 2 Yes Transport Assets Unspecified BVM 500 500 – – 1 to 21 New
Technical Services 6603 Tractor 2 Yes Transport Assets Unspecified BVM 350 350 – – 1 to 21 New
Project information
Program/Project descriptionProject
number
IDP Goal
code
2
Prior year outcomes
Total Project
Estimate
2017/18 Medium Term Revenue & Expenditure
Framework

75
WC025 Breede Valley - Supporting Table SA36 Detailed capital budget
Municipal Vote/Capital
projectRef Individually Approved
(Yes/No)
Asset Class Asset Sub-Class GPS co-ordinates
R thousand 4 6 3 3 5
Audited
Outcome
2015/16
Current Year
2016/17
Full Year
Forecast
Budget Year
2017/18
Budget Year +1
2018/19
Budget Year +2
2019/20Ward location New or renewal
Project information
Program/Project descriptionProject
number
IDP Goal
code
2
Prior year outcomes
Total Project
Estimate
2017/18 Medium Term Revenue & Expenditure
Framework
Technical Services 6603 Notice boards (Recycling) 2 Yes Machinery and Equipment Unspecified BVM 50 50 – – 1 to 21 New
Technical Services 6603 Mini drop off facilities 2 Yes Solid Waste Infrastructure Waste Drop-off Points BVM 750 250 250 250 1 to 21 New
Technical Services 6603 Equipment - Large 2 Yes Machinery and Equipment Unspecified BVM 400 400 – – 1 to 21 New
Technical Services 6603 Small Plant 2 Yes Machinery and Equipment Unspecified BVM 250 250 – – 1 to 21 New
Technical Services 6603 Satellite Station : Rawsonville (MIG Counter Funding) 2 Yes Solid Waste Infrastructure Waste Transfer Stations BVM 800 – 800 – 19, 20 New
Technical Services 6603 Wheeliebins 2 Yes Machinery and Equipment Unspecified BVM 1 500 500 500 500 1 to 21 New
DE DOORNS – – –
Technical Services 6603 Material Recovery Facility & TRANSFER STATION (MIG Counter funding) 2 Yes Solid Waste Infrastructure Waste Processing Facilities 19°39'15"E33°28'39"S 5 240 3 240 – 2 000 2, 3, 4 New
Technical Services 6603 Mini drop off facilities 2 Yes Solid Waste Infrastructure Waste Drop-off Points BVM 650 150 500 – 2, 3, 4 New
Technical Services 6603 Notice Boards 2 Yes Machinery and Equipment Unspecified BVM 30 30 – – 2, 3, 4 New
Technical Services 6603 Street refuse bins 2 Yes Machinery and Equipment Unspecified BVM 150 150 – – 2, 3, 4 New
TOUWSRIVER – – –
Technical Services 6603 Mini drop off facility (4) 2 Yes Solid Waste Infrastructure Waste Drop-off Points BVM 150 150 – – 1 New
Technical Services 6603 Notice Boards 2 Yes Machinery and Equipment Unspecified BVM 30 30 – – 1 New
Technical Services 6603 Street refuse bins 2 Yes Machinery and Equipment Unspecified BVM 150 150 – – 1 New
– – –
Ward 1 – – –
Technical Services 6603 Mini drop off facilities 2 Yes Solid Waste Infrastructure Waste Drop-off Points BVM 200 – 200 – 1 New
Technical Services 6603 Wheelie bins 2 Yes Machinery and Equipment Unspecified BVM 350 – 350 – 1 New
– – –
Ward 2 – – –
Technical Services 1539 Bus route 2 Yes Roads Infrastructure Roads 19°40'36"E33°29'5"S 10 000 – 10 000 – 2 New
Technical Services 6603 Mini drop off facilities 2 Yes Solid Waste Infrastructure Waste Drop-off Points BVM 250 – 250 – 2 New
Technical Services 1533 New Retention Ponds - De Doorns: South of N1 (MIG Number 202347) 2 Yes Storm water Infrastructure Drainage Collection BVM 373 – 373 – 2 New
Technical Services 1536 New High Mast Lighting - De Doorns (MIG number 153221) 2 Yes Electrical Infrastructure LV Networks BVM 843 843 – – 2 New
– – –
Ward 3 – – –
Technical Services 8412 De Doorns water purification Works: DAF Unit - (MIG Form ID 236361) 2 Yes Water Supply Infrastructure Water Treatment Works 19°40'0E33°29'10"S 1 512 – 1 512 – 2, 3, 4 Repl
Technical Services 1536 New High Mast Lighting - De Doorns: Sunny Side Orchards (MIG number 211786) 2 Yes Electrical Infrastructure LV Networks BVM 293 293 – – 4 New
Technical Services 8112 Replace 11 Kv cable from Rumosa to Voortrekkerweg (1 500 m @ 185 mm Al PILC ) 2 Yes Electrical Infrastructure Waste Drop-off Points BVM 4 630 4 630 – – 3 Repl
– – –
Ward 6 – – –
Technical Services 1536 High Mast Lighting - Tuin Dorp - Keyter street 2 Yes Electrical Infrastructure LV Networks BVM 500 500 – – 6 New
– – –
Ward 8 – – –
Technical Services 8112 Replace 11 Kv cable from Mc Allistor to Field Sub (1 600 m @ 185 mm Al PILC ) 2 Yes Electrical Infrastructure Waste Drop-off Points BVM 5 450 5 450 – – 8 Repl
– – –
Ward 9 – – –
Technical Services 8112 Fencing of Electrical Boxes 2 Yes Electrical Infrastructure LV Networks BVM 100 100 – – 9 New
Technical Services 8112 Increase Network Capacity (3 x 630 Kva Mini Substation) Network Overloaded 2 Yes Electrical Infrastructure LV Networks – – – 9 New
– – –
Ward 11 – – –
Technical Services 8112 Fencing of Electrical Boxes 2 Yes Electrical Infrastructure LV Networks BVM 100 100 – – 11 New
– – –
Ward 12 – – –
Technical Services 1536 Stronger Lights - High Mast Lighting Avian Park 2 Yes Electrical Infrastructure LV Networks BVM 500 500 – – 12 Repl
Technical Services 5151 Development of Parks 2 Yes Sport and Recreation Facilities Public Open Space BVM 600 600 – – 12 New
– – –
Ward 13 – – –
Technical Services 8112 Fencing of Electrical Boxes 2 Yes Electrical Infrastructure LV Networks BVM 100 100 – – 13 New
Technical Services 5151 Development of Parks 2 Yes Sport and Recreation Facilities Public Open Space BVM 600 – 600 – 13 New
– – –
Ward 14 – – –
Technical Services 8112 Fencing of Electrical Boxes 2 Yes Electrical Infrastructure LV Networks BVM 100 100 – – 14 New
Technical Services 5151 Development of Parks 2 Yes Sport and Recreation Facilities Public Open Space BVM 600 – – 600 14 New
– – –
Ward 15 – – –
Technical Services 8112 Fencing of De Vos Street Substation 2 Yes Electrical Infrastructure LV Networks BVM 100 100 – – 15 New
– – –
Ward 18 – – –

76
WC025 Breede Valley - Supporting Table SA36 Detailed capital budget
Municipal Vote/Capital
projectRef Individually Approved
(Yes/No)
Asset Class Asset Sub-Class GPS co-ordinates
R thousand 4 6 3 3 5
Audited
Outcome
2015/16
Current Year
2016/17
Full Year
Forecast
Budget Year
2017/18
Budget Year +1
2018/19
Budget Year +2
2019/20Ward location New or renewal
Project information
Program/Project descriptionProject
number
IDP Goal
code
2
Prior year outcomes
Total Project
Estimate
2017/18 Medium Term Revenue & Expenditure
Framework
Technical Services 1536 High Mast Lighting - Njila street and Mandela Square 2 Yes Electrical Infrastructure LV Networks BVM 500 500 – –
– – –
Equipment - Electrical – – –
Technical Services 8112 Cable and fault Locater 2 Yes Electrical Infrastructure Unspecified BVM 345 345 – – 1 to 21 New
Technical Services 8112 Heavy Duty SWB 4x4 Truck c/w Hydraulic Crane & Aerial Platform 2 Yes Electrical Infrastructure Unspecified BVM 2 850 2 850 1 to 21 New
Technical Services 8112 Quality of Supply - Loggers & Monitoring System (NRS 048) 2 Yes Electrical Infrastructure Unspecified BVM 255 255 1 to 21 New
Technical Services 1503 Furniture and Equipment 2 Yes Machinery and Equipment Unspecified BVM 900 300 300 300 1 to 21 New
– – –
SERVICE CONNECTIONS (Depending on Public Contr) – – –
Technical Services 6912 Sewer Connections 2 Yes Sanitation Infrastructure Reticulation BVM 419 132 139 148 1 to 21 New
Technical Services 8112 Electricity Connections 2 Yes Electrical Infrastructure LV Networks BVM 948 298 316 335 1 to 21 New
Technical Services 8412 Water Connections 2 Yes Water Supply Infrastructure Reticulation BVM 683 215 228 241 1 to 21 New
– – –
Technical Services 8112 Electricity Network Extensions (Depending on Public Contr) 2 Yes Electrical Infrastructure LV Networks BVM 2 944 1 429 1 515 – 1 to 21 New
– – –
MUNICIPAL MANAGER
Admin -0603
Municipal Manager 603 Furniture and Equipment 5 Yes Furniture and Office Equipment Unspecified BVM 5 5 1 to 21 New
–
Project Management -0615 –
Municipal Manager 615 Pedestrian walkways - Avian Park, Riverview ,Roodewal 5 Yes Roads Infrastructure Roads BVM 1 500 1 500 – 9 - 14 & 21 New
Municipal Manager 615 Upgrading of playparks - Avian Park, Riverview, Roodewal ,Zwelethemba 5 Yes Sport and Recreation Facilities Public Open Space BVM 500 – 500 – 9 - 14 & 21 New
Municipal Manager 615 Speed bumps - Avianpark 5 Yes Roads Infrastructure Roads BVM 110 110 – – 12 & 21 New
Municipal Manager 615 Grassed play area for children in Pigeon Street 5 Yes Sport and Recreation Facilities Public Open Space BVM 95 95 – – 12 New
Municipal Manager 615 Speed bumps - Riverview/Victoriapark 5 Yes Roads Infrastructure Roads BVM 110 110 – – 11, 13 & 14 New
Municipal Manager 615 Rugby/soccer pitch - Riverview 5 Yes Sport and Recreation Facilities Outdoor Facilities 19°26'30E33°39'34"S 1 500 1 500 – – 10 New
Municipal Manager 615 Speed bumps - Roodewal/ Hexpark 5 Yes Roads Infrastructure Roads BVM 110 110 – – 9 & 10 New
Municipal Manager 615 Speed bumps - Zweletemba 5 Yes Roads Infrastructure Roads BVM 100 100 – – 8, 16 - 18 New
Municipal Manager 615 Shared Economic Infrastructure Facility for informal traders in Zweletemba 5 Yes Community Facilities Markets 19°27'52E33°38'56S 2 600 600 2 000 – 16 - 18 New
Municipal Manager 615 ECD projects at Zwelethemba library 5 Yes Community Facilities Libraries 19°29'39"E33°38'50"S 125 – 125 – 18 New
–
COMMUNITY SERVICES –
ADMIN - 0903 –
Community Services 903 Furniture & Equipment 4 Yes Furniture and Office Equipment Unspecified BVM 5 5 – 1 to 21 New
–
Unallocated DoRA projects - TRANSHEX –
Community Services 8412 Water Reticulation 2 Yes Water Supply Infrastructure Reticulation BVM 39 260 13 476 25 784 – 1 to 21 New
Community Services 6912 Sewer Reticulation 2 Yes Sanitation Infrastructure Reticulation BVM 39 260 13 476 25 784 – 1 to 21 New
Community Services 1539 Roads 2 Yes Roads Infrastructure Roads BVM 19 630 6 738 12 892 – 1 to 21 New
Community Services 1533 Stormwater 2 Yes Storm water Infrastructure Storm water Conveyance BVM 11 100 3 810 7 290 – 1 to 21 New
– –
SWIMMING BATH: De La Bat - 5118 –
Community Services 5118 Upgrade of filters and pump 2 Yes Sport and Recreation Facilities Outdoor Facilities 19°26'56"E33°38'7"S 600 600 7 Repl
–
SWIMMING BATH: Grey Street - 5121 –
Community Services 5121 Upgrade of basket rooms 2 Yes Sport and Recreation Facilities Outdoor Facilities 19°27'10"E33°38'47"S 500 500 – Repl
CUSTOMER CARE SERVICES - 0623 –
Community Services 623 Access control : Rawsonville 5 Yes Operational Buildings Municipal Offices 19°18'49"E33°41'6"S 35 35 – New
NEKKIES - 6315 / 6318 – –
Community Services 6315 Sit-on lawn mower 2 Yes Machinery and Equipment Unspecified 19°25'17"E33°41'12"S 100 – – 100 New
Community Services 6315 Upgrade: security gate & offices & Chalets 2 Yes Community Facilities Unspecified 19°25'17"E33°41'12"S 1 400 – 700 700 New
Community Services 6315 Security & CCTV safety cameras 2 Yes Machinery and Equipment Unspecified 19°25'17"E33°41'12"S 150 150 – New
Community Services 6315 Equipment & small items for resorts 2 Yes Machinery and Equipment Unspecified 19°25'17"E33°41'12"S 100 100 – New
SPORT: De Wet - 5148 – –
Community Services 5148 Water Cannon 2 Yes Machinery and Equipment Unspecified 19°30'57"E33°36'12"S 55 – – 55 1 New
– –
SPORT: De Doorns West - 5145 – –
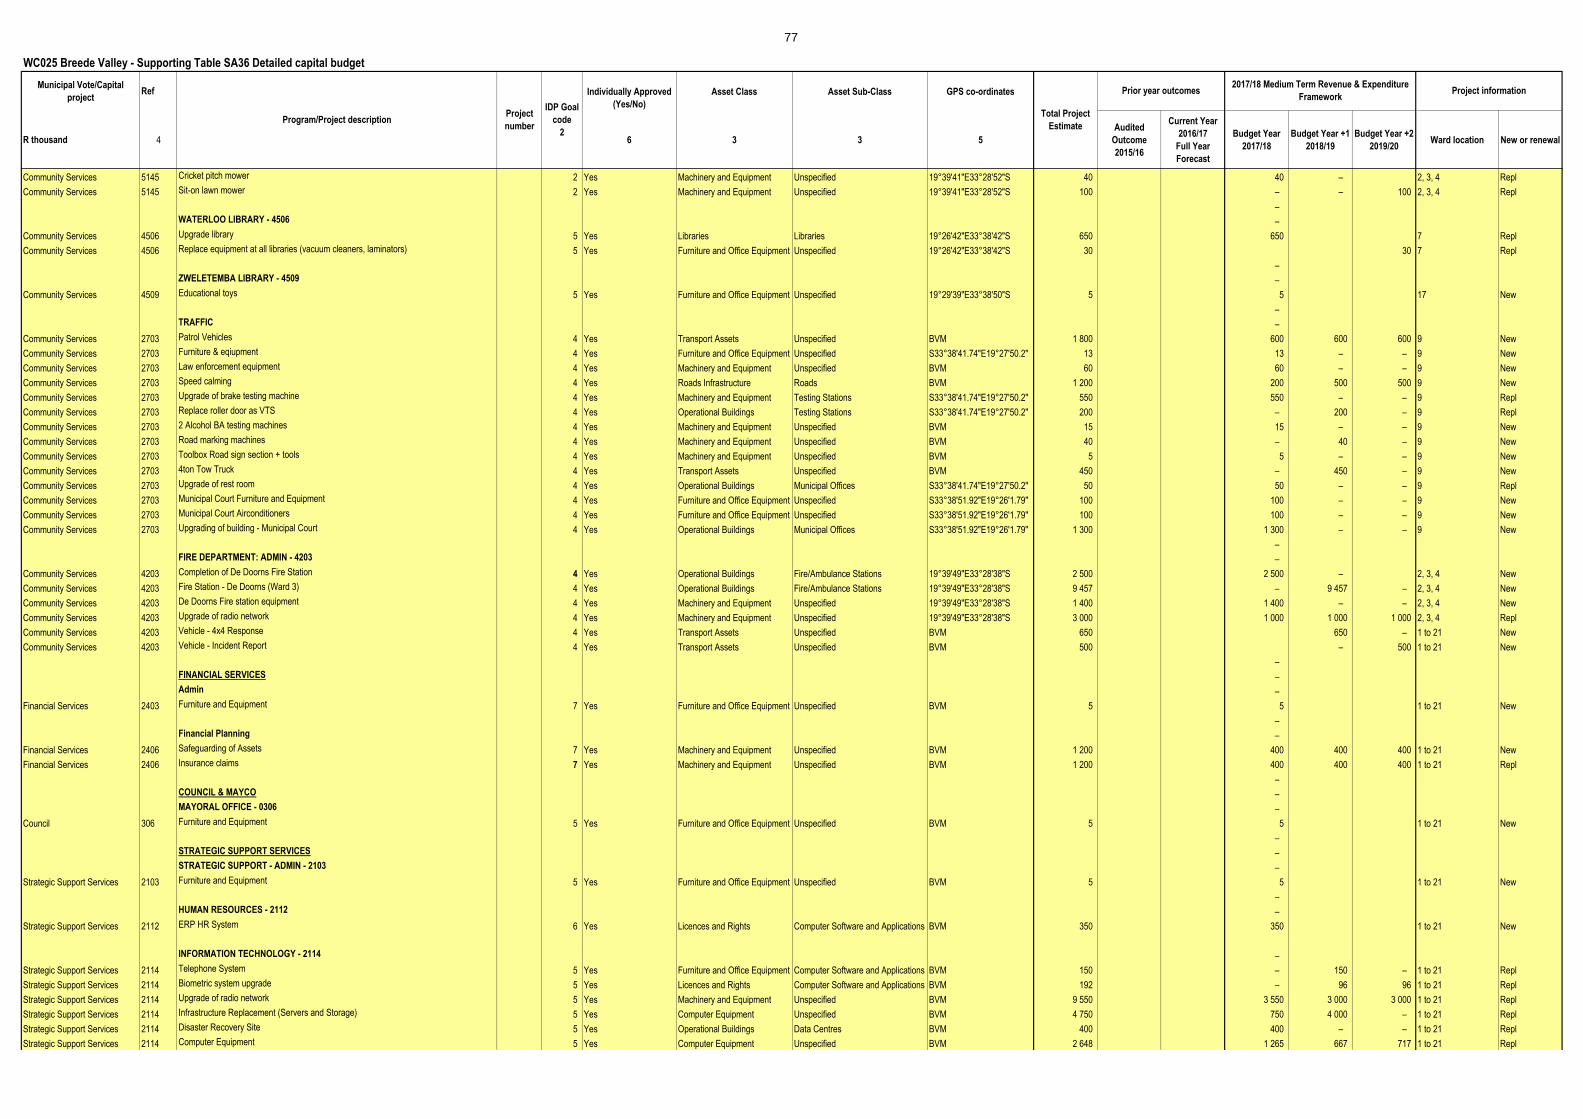
77
WC025 Breede Valley - Supporting Table SA36 Detailed capital budget
Municipal Vote/Capital
projectRef Individually Approved
(Yes/No)
Asset Class Asset Sub-Class GPS co-ordinates
R thousand 4 6 3 3 5
Audited
Outcome
2015/16
Current Year
2016/17
Full Year
Forecast
Budget Year
2017/18
Budget Year +1
2018/19
Budget Year +2
2019/20Ward location New or renewal
Project information
Program/Project descriptionProject
number
IDP Goal
code
2
Prior year outcomes
Total Project
Estimate
2017/18 Medium Term Revenue & Expenditure
Framework
Community Services 5145 Cricket pitch mower 2 Yes Machinery and Equipment Unspecified 19°39'41"E33°28'52"S 40 40 – 2, 3, 4 Repl
Community Services 5145 Sit-on lawn mower 2 Yes Machinery and Equipment Unspecified 19°39'41"E33°28'52"S 100 – – 100 2, 3, 4 Repl
–
WATERLOO LIBRARY - 4506 –
Community Services 4506 Upgrade library 5 Yes Libraries Libraries 19°26'42"E33°38'42"S 650 650 7 Repl
Community Services 4506 Replace equipment at all libraries (vacuum cleaners, laminators) 5 Yes Furniture and Office Equipment Unspecified 19°26'42"E33°38'42"S 30 30 7 Repl
–
ZWELETEMBA LIBRARY - 4509 –
Community Services 4509 Educational toys 5 Yes Furniture and Office Equipment Unspecified 19°29'39"E33°38'50"S 5 5 17 New
–
TRAFFIC –
Community Services 2703 Patrol Vehicles 4 Yes Transport Assets Unspecified BVM 1 800 600 600 600 9 New
Community Services 2703 Furniture & eqiupment 4 Yes Furniture and Office Equipment Unspecified S33°38′41.74″E19°27′50.2″ 13 13 – – 9 New
Community Services 2703 Law enforcement equipment 4 Yes Machinery and Equipment Unspecified BVM 60 60 – – 9 New
Community Services 2703 Speed calming 4 Yes Roads Infrastructure Roads BVM 1 200 200 500 500 9 New
Community Services 2703 Upgrade of brake testing machine 4 Yes Machinery and Equipment Testing Stations S33°38′41.74″E19°27′50.2″ 550 550 – – 9 Repl
Community Services 2703 Replace roller door as VTS 4 Yes Operational Buildings Testing Stations S33°38′41.74″E19°27′50.2″ 200 – 200 – 9 Repl
Community Services 2703 2 Alcohol BA testing machines 4 Yes Machinery and Equipment Unspecified BVM 15 15 – – 9 New
Community Services 2703 Road marking machines 4 Yes Machinery and Equipment Unspecified BVM 40 – 40 – 9 New
Community Services 2703 Toolbox Road sign section + tools 4 Yes Machinery and Equipment Unspecified BVM 5 5 – – 9 New
Community Services 2703 4ton Tow Truck 4 Yes Transport Assets Unspecified BVM 450 – 450 – 9 New
Community Services 2703 Upgrade of rest room 4 Yes Operational Buildings Municipal Offices S33°38′41.74″E19°27′50.2″ 50 50 – – 9 Repl
Community Services 2703 Municipal Court Furniture and Equipment 4 Yes Furniture and Office Equipment Unspecified S33°38′51.92″E19°26′1.79″ 100 100 – – 9 New
Community Services 2703 Municipal Court Airconditioners 4 Yes Furniture and Office Equipment Unspecified S33°38′51.92″E19°26′1.79″ 100 100 – – 9 New
Community Services 2703 Upgrading of building - Municipal Court 4 Yes Operational Buildings Municipal Offices S33°38′51.92″E19°26′1.79″ 1 300 1 300 – – 9 New
–
FIRE DEPARTMENT: ADMIN - 4203 –
Community Services 4203 Completion of De Doorns Fire Station 4 Yes Operational Buildings Fire/Ambulance Stations 19°39'49"E33°28'38"S 2 500 2 500 – 2, 3, 4 New
Community Services 4203 Fire Station - De Doorns (Ward 3) 4 Yes Operational Buildings Fire/Ambulance Stations 19°39'49"E33°28'38"S 9 457 – 9 457 – 2, 3, 4 New
Community Services 4203 De Doorns Fire station equipment 4 Yes Machinery and Equipment Unspecified 19°39'49"E33°28'38"S 1 400 1 400 – – 2, 3, 4 New
Community Services 4203 Upgrade of radio network 4 Yes Machinery and Equipment Unspecified 19°39'49"E33°28'38"S 3 000 1 000 1 000 1 000 2, 3, 4 Repl
Community Services 4203 Vehicle - 4x4 Response 4 Yes Transport Assets Unspecified BVM 650 650 – 1 to 21 New
Community Services 4203 Vehicle - Incident Report 4 Yes Transport Assets Unspecified BVM 500 – 500 1 to 21 New
–
FINANCIAL SERVICES –
Admin –
Financial Services 2403 Furniture and Equipment 7 Yes Furniture and Office Equipment Unspecified BVM 5 5 1 to 21 New
–
Financial Planning –
Financial Services 2406 Safeguarding of Assets 7 Yes Machinery and Equipment Unspecified BVM 1 200 400 400 400 1 to 21 New
Financial Services 2406 Insurance claims 7 Yes Machinery and Equipment Unspecified BVM 1 200 400 400 400 1 to 21 Repl
–
COUNCIL & MAYCO –
MAYORAL OFFICE - 0306 –
Council 306 Furniture and Equipment 5 Yes Furniture and Office Equipment Unspecified BVM 5 5 1 to 21 New
–
STRATEGIC SUPPORT SERVICES –
STRATEGIC SUPPORT - ADMIN - 2103 –
Strategic Support Services 2103 Furniture and Equipment 5 Yes Furniture and Office Equipment Unspecified BVM 5 5 1 to 21 New
–
HUMAN RESOURCES - 2112 –
Strategic Support Services 2112 ERP HR System 6 Yes Licences and Rights Computer Software and Applications BVM 350 350 1 to 21 New
INFORMATION TECHNOLOGY - 2114 –
Strategic Support Services 2114 Telephone System 5 Yes Furniture and Office Equipment Computer Software and Applications BVM 150 – 150 – 1 to 21 Repl
Strategic Support Services 2114 Biometric system upgrade 5 Yes Licences and Rights Computer Software and Applications BVM 192 – 96 96 1 to 21 Repl
Strategic Support Services 2114 Upgrade of radio network 5 Yes Machinery and Equipment Unspecified BVM 9 550 3 550 3 000 3 000 1 to 21 Repl
Strategic Support Services 2114 Infrastructure Replacement (Servers and Storage) 5 Yes Computer Equipment Unspecified BVM 4 750 750 4 000 – 1 to 21 Repl
Strategic Support Services 2114 Disaster Recovery Site 5 Yes Operational Buildings Data Centres BVM 400 400 – – 1 to 21 Repl
Strategic Support Services 2114 Computer Equipment 5 Yes Computer Equipment Unspecified BVM 2 648 1 265 667 717 1 to 21 Repl

78
WC025 Breede Valley - Supporting Table SA36 Detailed capital budget
Municipal Vote/Capital
projectRef Individually Approved
(Yes/No)
Asset Class Asset Sub-Class GPS co-ordinates
R thousand 4 6 3 3 5
Audited
Outcome
2015/16
Current Year
2016/17
Full Year
Forecast
Budget Year
2017/18
Budget Year +1
2018/19
Budget Year +2
2019/20Ward location New or renewal
Project information
Program/Project descriptionProject
number
IDP Goal
code
2
Prior year outcomes
Total Project
Estimate
2017/18 Medium Term Revenue & Expenditure
Framework
Parent Capital expenditure 1 154 660 177 041 38 921
Entities:
List all capital projects grouped by Entity
Entity A
Water project A
Entity B
Electricity project B
Entity Capital expenditure – – – – –
Total Capital expenditure – – 154 660 177 041 38 921
References
1. Must reconcile with Budgeted Capital Expenditure
2. As per Table SA6
3. As per Table SA34
4. Projects that fall above the threshold values applicable to the municipality as identified in regulation 13 of the Municipal Budget and Reporting Regulations must be listed individually. Other projects by programme by Vote
5. Correct to seconds. Provide a logical starting point on networked infrastructure.
6. Distinguish projects approved in terms of MFMA section 19(1)(b) and MRRR Regulation 13 Check – (0) –

WC025 Breede Valley - Supporting Table SA37 Projects delayed from previous financial year/s
Ref.
1,2Original
Budget
Full Year
Forecast
Budget Year
2017/18
Budget Year +1
2018/19
Budget Year +2
2019/20
R thousand Year
Parent municipality:
List all capital projects grouped by Municipal Vote Examples Examples
None
Entities:
List all capital projects grouped by Municipal Entity
Entity Name
Project name
References
1. List all projects with planned completion dates in current year that have been re-budgeted in the MTREF
2. Refer MFMA s30
3. As per Table SA34
4. Correct to seconds. Provide a logical starting point on networked infrastructure.
Municipal Vote/Capital project
Previous target
year to
complete
Current Year 2016/172017/18 Medium Term Revenue & Expenditure
Framework
Project nameProject
number
Asset Sub-Class
3
Asset Class
3
GPS co-ordinates
4

80
WC025 Breede Valley - Supporting Table SA38 Consolidated detailed operational projects
Municipal Vote/Operational
projectRef Individually Approved
(Yes/No)
Asset Class Asset Sub-Class GPS co-ordinates Project information
R thousand 4 6 5
Audited
Outcome
2015/16
Current Year
2016/17
Full Year
Forecast
Budget Year
2017/18
Budget Year +1
2018/19
Budget Year +2
2019/20Ward location
Parent municipality:
List all operational projects grouped by Municipal Vote
Municipal Running Cost Municipal Running Cost OP_0001 No Unspecified BVM 44 576 47 043 49 281 All Wards
Typical Work Streams TWS - Communication & Public Participation - Newsletters OP_0002 No Unspecified BVM – – – All Wards
Typical Work Streams TWS - Comm. Development - Elderly OP_0003 No Unspecified BVM 304 321 339 All Wards
Typical Work Streams TWS - Comm. Development - Gender Development OP_0004 No Unspecified BVM 95 100 106 All Wards
Maintenance Maint. - Non-infr. - CP - Computer Equipment OP_0005 No Computer Equipment Unspecified BVM 593 626 662 All Wards
Maintenance Maint. - Non-infr. - CP - Other Assets - Oper. Buildings - Mun. Offices - Buildings - OP_0006 No Operational Buildings Municipal Offices BVM (642) (679) (717) All Wards
Typical Work Streams TWS - Communication & Public Participation - By-laws Promulgation OP_0007 No Unspecified BVM 15 16 17 All Wards
Maintenance Maint. - Non-infr. - CP - Furniture & Office Equipment OP_0008 No Furniture and Office Equipment Unspecified BVM 2 2 2 All Wards
Typical Work Streams TWS - Comm. Development - Comm. Development Initiatives OP_0009 No Unspecified BVM 5 081 5 450 6 251 All Wards
Typical Work Streams TWS - Comm. Development - Comm. Initiatives OP_0010 No Unspecified BVM 572 604 638 All Wards
Municipal Running Cost Municipal Running Cost OP_0011 No Unspecified BVM (95 038) (101 226) (108 210) All Wards
Typical Work Streams TWS - Strategic Management & Governance - Risk Management OP_0012 No Unspecified BVM 245 259 274 All Wards
Typical Work Streams TWS - Capacity Building Training & Development - Capacity Building Unemployed OP_0013 No Unspecified BVM 82 87 92 All Wards
Municipal Running Cost Municipal Running Cost OP_0014 No Unspecified BVM 4 144 3 776 3 987 All Wards
Municipal Running Cost Municipal Running Cost OP_0015 No Unspecified BVM 43 535 46 020 48 597 All Wards
Municipal Running Cost Municipal Running Cost OP_0016 No Unspecified BVM (47 758) (52 244) (59 183) All Wards
Maintenance Maint. - Non-infr. - CP - Other Assets - Oper. Buildings - Mun. Offices - Buildings - OP_0017 No Operational Buildings Municipal Offices BVM 2 203 2 329 2 459 All Wards
Maintenance Maint. - Non-infr. - CP - Computer Equipment OP_0018 No Computer Equipment Unspecified BVM 736 778 821 All Wards
Maintenance Maint. - Non-infr. - CP - Furniture & Office Equipment OP_0019 No Furniture and Office Equipment Unspecified BVM 3 3 4 All Wards
Maintenance Maint. - Non-infr. - CP - Other Assets - Oper. Buildings - Mun. Offices - Land - OP_0020 No Operational Buildings Municipal Offices BVM 13 14 14 All Wards
Typical Work Streams TWS - Expanded Public Works Programme - Project OP_0021 No Unspecified BVM 1 888 1 995 2 107 All Wards
Municipal Running Cost Municipal Running Cost OP_0022 No Unspecified BVM 4 990 5 274 5 570 All Wards
Typical Work Streams TWS - HR - HR Management OP_0023 No Unspecified BVM (2 203) (2 266) (1 231) All Wards
Typical Work Streams TWS - HR - Employee Assistance Programme OP_0024 No Unspecified BVM 1 100 1 100 – All Wards
Typical Work Streams TWS - HR - Staff Rehabilitation OP_0025 No Unspecified BVM – – – All Wards
Typical Work Streams TWS - Functions & Events - Events & Organisations OP_0026 No Unspecified BVM 245 259 273 All Wards
Maintenance Maint. - Non-infr. - CP - Other Assets - Oper. Buildings - Mun. Offices - Buildings - OP_0027 No Operational Buildings Municipal Offices BVM 8 9 9 All Wards
Maintenance Maint. - Non-infr. - CP - Computer Equipment OP_0028 No Computer Equipment Unspecified BVM – – – All Wards
Typical Work Streams TWS - Communication & Public Participation - Budget Road Show Public Participation OP_0029 No Unspecified BVM 200 211 223 All Wards
Maintenance Maint. - Non-infr. - CP - Other Assets - Oper. Buildings - Mun. Offices - Buildings - OP_0030 No Operational Buildings Municipal Offices BVM 227 240 253 All Wards
Maintenance Maint. - Non-infr. - CP - Other Assets - Oper. Buildings - Mun. Offices - Land - OP_0031 No Operational Buildings Municipal Offices BVM 2 2 2 All Wards
Typical Work Streams TWS - Expanded Public Works Programme - Project OP_0032 No Unspecified BVM 90 95 100 All Wards
Typical Work Streams TWS - Financial Management Grant - Interns Compensation OP_0033 No Unspecified BVM 590 600 – All Wards
Maintenance Maint. - Non-infr. - CP - Computer Equipment OP_0034 No Computer Equipment Unspecified BVM 514 543 573 All Wards
Maintenance Maint. - Non-infr. - CP - Other Assets - Oper. Buildings - Mun. Offices - Buildings - OP_0035 No Operational Buildings Municipal Offices BVM 443 468 495 All Wards
Typical Work Streams TWS - Communication & Public Participation - By-laws Promulgation OP_0036 No Unspecified BVM – – – All Wards
Typical Work Streams TWS - Expanded Public Works Programme - Project OP_0037 No Unspecified BVM 99 104 110 All Wards
Maintenance Maint. - Non-infr. - CP - Furniture & Office Equipment OP_0038 No Furniture and Office Equipment Unspecified BVM 1 1 1 All Wards
Maintenance Maint. - Non-infr. - CP - Other Assets - Oper. Buildings - Mun. Offices - Land - OP_0039 No Operational Buildings Municipal Offices BVM 14 15 15 All Wards
Maintenance Maint. - Non-infr. - CP - Other Assets - Oper. Buildings - Mun. Offices - External Facilities - OP_0040 No Operational Buildings Municipal Offices BVM 2 2 2 All Wards
Typical Work Streams TWS - Property Rates Act Implementation - Interim Valuations OP_0041 No Unspecified BVM 478 505 534 All Wards
Typical Work Streams TWS - Property Rates Act Implementation - Valuation OP_0042 No Unspecified BVM – – – All Wards
Maintenance Maint. - Non-infr. - CP - Other Assets - Oper. Buildings - Mun. Offices - Buildings - OP_0043 No Operational Buildings Municipal Offices BVM 379 401 424 All Wards
Typical Work Streams TWS - Capacity Building Training & Development - Capacity Building Unemployed OP_0044 No Unspecified BVM 94 94 – All Wards
Typical Work Streams TWS - Communication & Public Participation - Public Participation Meeting OP_0045 No Unspecified BVM 318 336 355 All Wards
Typical Work Streams TWS - Comm. Development - Housing Projects OP_0046 No Unspecified BVM 2 078 1 814 1 023 All Wards
Maintenance Maint. - Non-infr. - CP - Machinery & Equipment OP_0047 No Machinery and Equipment Unspecified BVM 2 194 2 319 2 449 All Wards
Maintenance Maint. - Non-infr. - CP - Other Assets - Housing - Social Housing - Buildings - OP_0048 No Housing Social Housing BVM 898 950 1 003 All Wards
Typical Work Streams TWS - Expanded Public Works Programme - Project OP_0049 No Unspecified BVM 284 300 317 All Wards
Typical Work Streams TWS - Communication & Public Participation - Newsletters OP_0050 No Unspecified BVM 3 – – All Wards
Typical Work Streams TWS - Communication & Public Participation - By-laws Promulgation OP_0051 No Unspecified BVM 45 47 50 All Wards
Maintenance Maint. - Non-infr. - CP - Machinery & Equipment OP_0052 No Machinery and Equipment Unspecified BVM 138 146 154 All Wards
Maintenance Maint. - infr. - CP - Roads infr. - Road Furniture - Traffic Signs OP_0053 No Roads Infrastructure Road Furniture BVM 1 019 1 077 1 137 All Wards
Maintenance Maint. - Non-infr. - CP - Comm. Assets - Comm. Facilities - Fire/Ambulance Stations - Buildings - OP_0054 No Community Facilities Fire/Ambulance Stations BVM 50 52 55 All Wards
Maintenance Maint. - Non-infr. - CP - Computer Equipment OP_0055 No Computer Equipment Unspecified BVM – – – All Wards
Typical Work Streams TWS - Comm. Development - Library Programmes OP_0056 No Unspecified BVM (7 070) (7 497) 1 138 All Wards
Program/Project descriptionProject
number
IDP
Goal
code
2
Total Project
Estimate
Prior year outcomes2017/18 Medium Term Revenue & Expenditure
Framework
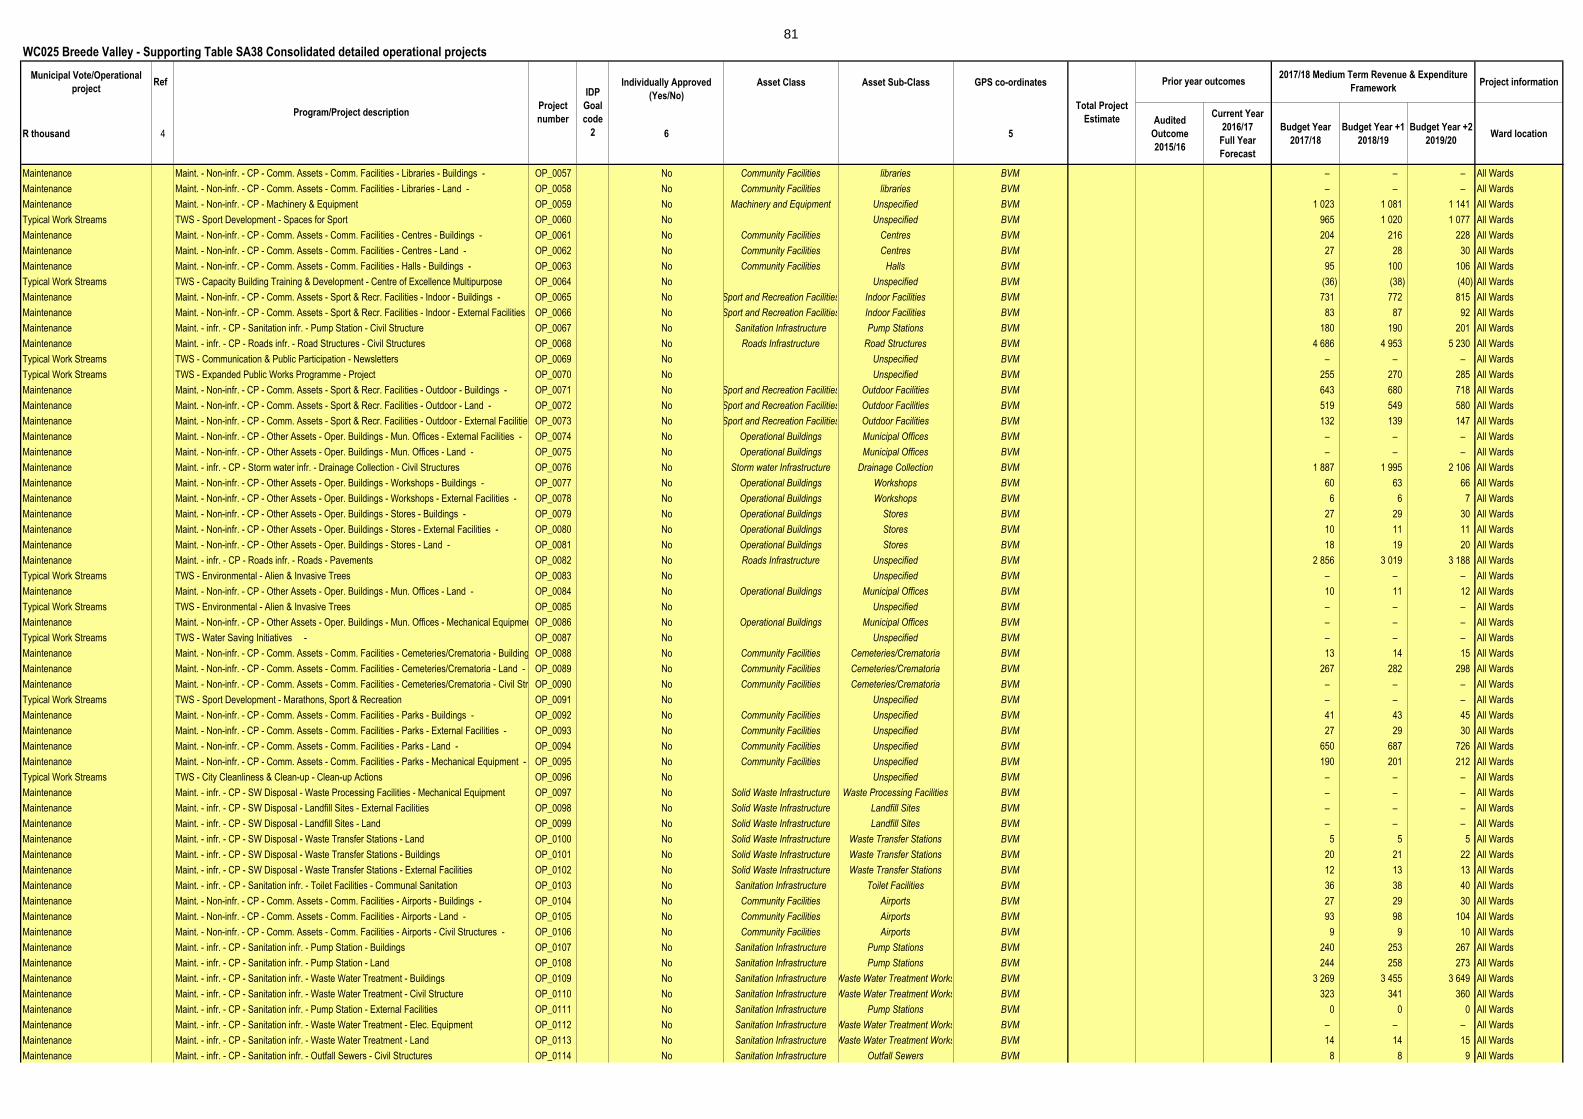
81
WC025 Breede Valley - Supporting Table SA38 Consolidated detailed operational projects
Municipal Vote/Operational
projectRef Individually Approved
(Yes/No)
Asset Class Asset Sub-Class GPS co-ordinates Project information
R thousand 4 6 5
Audited
Outcome
2015/16
Current Year
2016/17
Full Year
Forecast
Budget Year
2017/18
Budget Year +1
2018/19
Budget Year +2
2019/20Ward location
Program/Project descriptionProject
number
IDP
Goal
code
2
Total Project
Estimate
Prior year outcomes2017/18 Medium Term Revenue & Expenditure
Framework
Maintenance Maint. - Non-infr. - CP - Comm. Assets - Comm. Facilities - Libraries - Buildings - OP_0057 No Community Facilities libraries BVM – – – All Wards
Maintenance Maint. - Non-infr. - CP - Comm. Assets - Comm. Facilities - Libraries - Land - OP_0058 No Community Facilities libraries BVM – – – All Wards
Maintenance Maint. - Non-infr. - CP - Machinery & Equipment OP_0059 No Machinery and Equipment Unspecified BVM 1 023 1 081 1 141 All Wards
Typical Work Streams TWS - Sport Development - Spaces for Sport OP_0060 No Unspecified BVM 965 1 020 1 077 All Wards
Maintenance Maint. - Non-infr. - CP - Comm. Assets - Comm. Facilities - Centres - Buildings - OP_0061 No Community Facilities Centres BVM 204 216 228 All Wards
Maintenance Maint. - Non-infr. - CP - Comm. Assets - Comm. Facilities - Centres - Land - OP_0062 No Community Facilities Centres BVM 27 28 30 All Wards
Maintenance Maint. - Non-infr. - CP - Comm. Assets - Comm. Facilities - Halls - Buildings - OP_0063 No Community Facilities Halls BVM 95 100 106 All Wards
Typical Work Streams TWS - Capacity Building Training & Development - Centre of Excellence Multipurpose OP_0064 No Unspecified BVM (36) (38) (40) All Wards
Maintenance Maint. - Non-infr. - CP - Comm. Assets - Sport & Recr. Facilities - Indoor - Buildings - OP_0065 No Sport and Recreation Facilities Indoor Facilities BVM 731 772 815 All Wards
Maintenance Maint. - Non-infr. - CP - Comm. Assets - Sport & Recr. Facilities - Indoor - External Facilities - OP_0066 No Sport and Recreation Facilities Indoor Facilities BVM 83 87 92 All Wards
Maintenance Maint. - infr. - CP - Sanitation infr. - Pump Station - Civil Structure OP_0067 No Sanitation Infrastructure Pump Stations BVM 180 190 201 All Wards
Maintenance Maint. - infr. - CP - Roads infr. - Road Structures - Civil Structures OP_0068 No Roads Infrastructure Road Structures BVM 4 686 4 953 5 230 All Wards
Typical Work Streams TWS - Communication & Public Participation - Newsletters OP_0069 No Unspecified BVM – – – All Wards
Typical Work Streams TWS - Expanded Public Works Programme - Project OP_0070 No Unspecified BVM 255 270 285 All Wards
Maintenance Maint. - Non-infr. - CP - Comm. Assets - Sport & Recr. Facilities - Outdoor - Buildings - OP_0071 No Sport and Recreation Facilities Outdoor Facilities BVM 643 680 718 All Wards
Maintenance Maint. - Non-infr. - CP - Comm. Assets - Sport & Recr. Facilities - Outdoor - Land - OP_0072 No Sport and Recreation Facilities Outdoor Facilities BVM 519 549 580 All Wards
Maintenance Maint. - Non-infr. - CP - Comm. Assets - Sport & Recr. Facilities - Outdoor - External Facilities - OP_0073 No Sport and Recreation Facilities Outdoor Facilities BVM 132 139 147 All Wards
Maintenance Maint. - Non-infr. - CP - Other Assets - Oper. Buildings - Mun. Offices - External Facilities - OP_0074 No Operational Buildings Municipal Offices BVM – – – All Wards
Maintenance Maint. - Non-infr. - CP - Other Assets - Oper. Buildings - Mun. Offices - Land - OP_0075 No Operational Buildings Municipal Offices BVM – – – All Wards
Maintenance Maint. - infr. - CP - Storm water infr. - Drainage Collection - Civil Structures OP_0076 No Storm water Infrastructure Drainage Collection BVM 1 887 1 995 2 106 All Wards
Maintenance Maint. - Non-infr. - CP - Other Assets - Oper. Buildings - Workshops - Buildings - OP_0077 No Operational Buildings Workshops BVM 60 63 66 All Wards
Maintenance Maint. - Non-infr. - CP - Other Assets - Oper. Buildings - Workshops - External Facilities - OP_0078 No Operational Buildings Workshops BVM 6 6 7 All Wards
Maintenance Maint. - Non-infr. - CP - Other Assets - Oper. Buildings - Stores - Buildings - OP_0079 No Operational Buildings Stores BVM 27 29 30 All Wards
Maintenance Maint. - Non-infr. - CP - Other Assets - Oper. Buildings - Stores - External Facilities - OP_0080 No Operational Buildings Stores BVM 10 11 11 All Wards
Maintenance Maint. - Non-infr. - CP - Other Assets - Oper. Buildings - Stores - Land - OP_0081 No Operational Buildings Stores BVM 18 19 20 All Wards
Maintenance Maint. - infr. - CP - Roads infr. - Roads - Pavements OP_0082 No Roads Infrastructure Unspecified BVM 2 856 3 019 3 188 All Wards
Typical Work Streams TWS - Environmental - Alien & Invasive Trees OP_0083 No Unspecified BVM – – – All Wards
Maintenance Maint. - Non-infr. - CP - Other Assets - Oper. Buildings - Mun. Offices - Land - OP_0084 No Operational Buildings Municipal Offices BVM 10 11 12 All Wards
Typical Work Streams TWS - Environmental - Alien & Invasive Trees OP_0085 No Unspecified BVM – – – All Wards
Maintenance Maint. - Non-infr. - CP - Other Assets - Oper. Buildings - Mun. Offices - Mechanical Equipment - OP_0086 No Operational Buildings Municipal Offices BVM – – – All Wards
Typical Work Streams TWS - Water Saving Initiatives - OP_0087 No Unspecified BVM – – – All Wards
Maintenance Maint. - Non-infr. - CP - Comm. Assets - Comm. Facilities - Cemeteries/Crematoria - Buildings - OP_0088 No Community Facilities Cemeteries/Crematoria BVM 13 14 15 All Wards
Maintenance Maint. - Non-infr. - CP - Comm. Assets - Comm. Facilities - Cemeteries/Crematoria - Land - OP_0089 No Community Facilities Cemeteries/Crematoria BVM 267 282 298 All Wards
Maintenance Maint. - Non-infr. - CP - Comm. Assets - Comm. Facilities - Cemeteries/Crematoria - Civil Structures - OP_0090 No Community Facilities Cemeteries/Crematoria BVM – – – All Wards
Typical Work Streams TWS - Sport Development - Marathons, Sport & Recreation OP_0091 No Unspecified BVM – – – All Wards
Maintenance Maint. - Non-infr. - CP - Comm. Assets - Comm. Facilities - Parks - Buildings - OP_0092 No Community Facilities Unspecified BVM 41 43 45 All Wards
Maintenance Maint. - Non-infr. - CP - Comm. Assets - Comm. Facilities - Parks - External Facilities - OP_0093 No Community Facilities Unspecified BVM 27 29 30 All Wards
Maintenance Maint. - Non-infr. - CP - Comm. Assets - Comm. Facilities - Parks - Land - OP_0094 No Community Facilities Unspecified BVM 650 687 726 All Wards
Maintenance Maint. - Non-infr. - CP - Comm. Assets - Comm. Facilities - Parks - Mechanical Equipment - OP_0095 No Community Facilities Unspecified BVM 190 201 212 All Wards
Typical Work Streams TWS - City Cleanliness & Clean-up - Clean-up Actions OP_0096 No Unspecified BVM – – – All Wards
Maintenance Maint. - infr. - CP - SW Disposal - Waste Processing Facilities - Mechanical Equipment OP_0097 No Solid Waste Infrastructure Waste Processing Facilities BVM – – – All Wards
Maintenance Maint. - infr. - CP - SW Disposal - Landfill Sites - External Facilities OP_0098 No Solid Waste Infrastructure Landfill Sites BVM – – – All Wards
Maintenance Maint. - infr. - CP - SW Disposal - Landfill Sites - Land OP_0099 No Solid Waste Infrastructure Landfill Sites BVM – – – All Wards
Maintenance Maint. - infr. - CP - SW Disposal - Waste Transfer Stations - Land OP_0100 No Solid Waste Infrastructure Waste Transfer Stations BVM 5 5 5 All Wards
Maintenance Maint. - infr. - CP - SW Disposal - Waste Transfer Stations - Buildings OP_0101 No Solid Waste Infrastructure Waste Transfer Stations BVM 20 21 22 All Wards
Maintenance Maint. - infr. - CP - SW Disposal - Waste Transfer Stations - External Facilities OP_0102 No Solid Waste Infrastructure Waste Transfer Stations BVM 12 13 13 All Wards
Maintenance Maint. - infr. - CP - Sanitation infr. - Toilet Facilities - Communal Sanitation OP_0103 No Sanitation Infrastructure Toilet Facilities BVM 36 38 40 All Wards
Maintenance Maint. - Non-infr. - CP - Comm. Assets - Comm. Facilities - Airports - Buildings - OP_0104 No Community Facilities Airports BVM 27 29 30 All Wards
Maintenance Maint. - Non-infr. - CP - Comm. Assets - Comm. Facilities - Airports - Land - OP_0105 No Community Facilities Airports BVM 93 98 104 All Wards
Maintenance Maint. - Non-infr. - CP - Comm. Assets - Comm. Facilities - Airports - Civil Structures - OP_0106 No Community Facilities Airports BVM 9 9 10 All Wards
Maintenance Maint. - infr. - CP - Sanitation infr. - Pump Station - Buildings OP_0107 No Sanitation Infrastructure Pump Stations BVM 240 253 267 All Wards
Maintenance Maint. - infr. - CP - Sanitation infr. - Pump Station - Land OP_0108 No Sanitation Infrastructure Pump Stations BVM 244 258 273 All Wards
Maintenance Maint. - infr. - CP - Sanitation infr. - Waste Water Treatment - Buildings OP_0109 No Sanitation Infrastructure Waste Water Treatment Works BVM 3 269 3 455 3 649 All Wards
Maintenance Maint. - infr. - CP - Sanitation infr. - Waste Water Treatment - Civil Structure OP_0110 No Sanitation Infrastructure Waste Water Treatment Works BVM 323 341 360 All Wards
Maintenance Maint. - infr. - CP - Sanitation infr. - Pump Station - External Facilities OP_0111 No Sanitation Infrastructure Pump Stations BVM 0 0 0 All Wards
Maintenance Maint. - infr. - CP - Sanitation infr. - Waste Water Treatment - Elec. Equipment OP_0112 No Sanitation Infrastructure Waste Water Treatment Works BVM – – – All Wards
Maintenance Maint. - infr. - CP - Sanitation infr. - Waste Water Treatment - Land OP_0113 No Sanitation Infrastructure Waste Water Treatment Works BVM 14 14 15 All Wards
Maintenance Maint. - infr. - CP - Sanitation infr. - Outfall Sewers - Civil Structures OP_0114 No Sanitation Infrastructure Outfall Sewers BVM 8 8 9 All Wards

82
WC025 Breede Valley - Supporting Table SA38 Consolidated detailed operational projects
Municipal Vote/Operational
projectRef Individually Approved
(Yes/No)
Asset Class Asset Sub-Class GPS co-ordinates Project information
R thousand 4 6 5
Audited
Outcome
2015/16
Current Year
2016/17
Full Year
Forecast
Budget Year
2017/18
Budget Year +1
2018/19
Budget Year +2
2019/20Ward location
Program/Project descriptionProject
number
IDP
Goal
code
2
Total Project
Estimate
Prior year outcomes2017/18 Medium Term Revenue & Expenditure
Framework
Maintenance Maint. - infr. - CP - Sanitation infr. - Waste Water Treatment - Pipe Work OP_0115 No Sanitation Infrastructure Waste Water Treatment Works BVM (301) (318) (335) All Wards
Maintenance Maint. - infr. - CP - Sanitation infr. - Reticulation - Municipal Service Connection OP_0116 No Sanitation Infrastructure Reticulation BVM – – – All Wards
Maintenance Maint. - infr. - CP - Elec. infr. - LV Networks - Public Lighting OP_0117 No Electrical Infrastructure LV Networks BVM 3 154 3 334 3 520 All Wards
Maintenance Maint. - infr. - CP - Elec. infr. - MV Switching Stations - Buildings OP_0118 No Electrical Infrastructure MV Switching Stations BVM 241 255 269 All Wards
Maintenance Maint. - infr. - CP - Elec. infr. - MV Switching Stations - External Facilities OP_0119 No Electrical Infrastructure MV Switching Stations BVM 132 139 147 All Wards
Maintenance Maint. - infr. - CP - Elec. infr. - MV Networks - MV Mini-substations OP_0120 No Electrical Infrastructure MV Networks BVM 5 504 5 817 6 143 All Wards
Maintenance Maint. - infr. - CP - Elec. infr. - LV Networks - Electricity Meters OP_0121 No Electrical Infrastructure LV Networks BVM 6 693 7 075 7 471 All Wards
Maintenance Maint. - infr. - CP - Elec. infr. - MV Switching Stations - Civil Structure OP_0122 No Electrical Infrastructure MV Networks BVM 963 1 018 1 075 All Wards
Maintenance Maint. - infr. - CP - Roads infr. - Road Furniture - Traffic Signs OP_0123 No Roads Infrastructure Road Furniture BVM 421 445 470 All Wards
Maintenance Maint. - infr. - CP - Elec. infr. - LV Networks - Municipal Service Connections OP_0124 No Electrical Infrastructure LV Networks BVM 2 847 3 010 3 178 All Wards
Maintenance Maint. - infr. - CP - Water Supply infr. - Pump Station - External Facilities OP_0125 No Water Supply Infrastructure Pump Stations BVM – – – All Wards
Maintenance Maint. - infr. - CP - Water Supply infr. - Pump Station - Land OP_0126 No Water Supply Infrastructure Pump Stations BVM 4 4 4 All Wards
Maintenance Maint. - infr. - CP - Water Supply infr. - Pump Station - Mechanical Equipment OP_0127 No Water Supply Infrastructure Pump Stations BVM – – – All Wards
Maintenance Maint. - infr. - CP - Water Supply infr. - Dams & Weirs - Civil Structure OP_0128 No Water Supply Infrastructure Dams and Weirs BVM 654 691 730 All Wards
Maintenance Maint. - infr. - CP - Water Supply infr. - Distribution - Municipal Service Connections OP_0129 No Water Supply Infrastructure Distribution BVM 1 032 1 091 1 152 All Wards
Maintenance Maint. - infr. - CP - Water Supply infr. - Distribution - Pipe Work OP_0130 No Water Supply Infrastructure Distribution BVM 3 340 3 531 3 728 All Wards
Maintenance Maint. - infr. - CP - Water Supply infr. - Pump Station - Buildings OP_0131 No Water Supply Infrastructure Pump Stations BVM 10 11 11 All Wards
Maintenance Maint. - infr. - CP - Water Supply infr. - Dams & Weirs - Buildings OP_0132 No Water Supply Infrastructure Dams and Weirs BVM 154 162 172 All Wards
Maintenance Maint. - infr. - CP - Water Supply infr. - Dams & Weirs - Land OP_0133 No Water Supply Infrastructure Dams and Weirs BVM 88 93 98 All Wards
Maintenance Maint. - infr. - CP - Water Supply infr. - Bulk Mains - Pipe Work OP_0134 No Water Supply Infrastructure Bulk Mains BVM 550 581 614 All Wards
Maintenance Maint. - infr. - CP - Water Supply infr. - Reservoirs - Buildings OP_0135 No Water Supply Infrastructure Reservoirs BVM 19 20 21 All Wards
Maintenance Maint. - infr. - CP - Water Supply infr. - Dams & Weirs - Mechanical Equipment OP_0136 No Water Supply Infrastructure Dams and Weirs BVM – – – All Wards
Maintenance Maint. - infr. - CP - Water Supply infr. - Bulk Mains - Elec. Equipment OP_0137 No Water Supply Infrastructure Bulk Mains BVM – – – All Wards
Maintenance Maint. - infr. - CP - Water Supply infr. - Water Treatment - Buildings OP_0138 No Water Supply Infrastructure Water Treatment Works BVM 62 65 69 All Wards
Maintenance Maint. - Non-infr. - CP - Other Assets - Oper. Buildings - Workshops - Land - OP_0139 No Operational Buildings Workshops BVM – – – All Wards
Typical Work Streams TWS - Asset Protection - Vehicle Management System OP_0140 No Unspecified BVM 6 966 7 363 7 775 All Wards
Maintenance Maint. - Non-infra. - CP - Machinery and Equipment - - - - - - OP_0141 No Machinery and Equipment Unspecified BVM 3 3 3 All Wards
Typical Work Streams TWS - Functions and Events - Events and Organisations - - - - - - - - OP_0142 No Unspecified BVM 300 317 335 All Wards
Typical Work Streams TWS - Functions and Events - Events and Organisations - - - - - - - - OP_0143 No Unspecified BVM 76 80 85 All Wards
Maintenance Maint. - Non-infra. - CP - Machinery and Equipment - - - - - - OP_0144 No Machinery and Equipment Unspecified BVM 5 5 6 All Wards
Maintenance Maint. - Non-infra. - CP - Other Assets - Oper. Buildings - Stores - Buildings - - - OP_0145 No Operational Buildings Stores BVM 56 59 63 All Wards
Maintenance Maint. - Non-infra. - CP - Comm. Assets - Comm. Facilities - Libraries - Buildings - - - OP_0146 No Community Facilities libraries BVM 257 272 287 All Wards
Maintenance Maint. - Non-infra. - CP - Comm. Assets - Comm. Facilities - Libraries - Land - - - OP_0147 No Community Facilities libraries BVM 40 42 44 All Wards
Maintenance Maint. - Non-infra. - CP - Comm. Assets - Comm. Facilities - Libraries - Buildings - - - OP_0148 No Community Facilities libraries BVM – – – All Wards
Typical Work Streams TWS - Sport Development - Spaces for Sport - - - - - - - - OP_0149 No Unspecified BVM – – – All Wards
Maintenance Maint. - Non-infra. - CP - Comm. Assets - Comm. Facilities - Public Open Space - External Facilities - - - OP_0150 No Community Facilities Public Open Space BVM 450 476 502 All Wards
Maintenance Maint. - Non-infra. - CP - Comm. Assets - Comm. Facilities - Parks - Mechanical Equipment - - - OP_0151 No Community Facilities Unspecified BVM 1 1 1 All Wards
Maintenance Maint. - Non-infra. - CP - Comm. Assets - Comm. Facilities - Public Open Space - External Facilities - - - OP_0152 No Community Facilities Public Open Space BVM – – – All Wards
Maintenance Maint. - Non-infra. - CP - Other Assets - Oper. Buildings - Municipal Offices - External Facilities - - - OP_0153 No Operational Buildings Municipal Offices BVM 313 331 350 All Wards
Maintenance Maint. - infra. - CP - Sanitation infra. - Reticulation - Pipe Work - - - - OP_0154 No Sanitation Infrastructure Reticulation BVM 2 875 3 038 3 208 All Wards
Maintenance Maint. - Non-infra. - CP - Transport Assets - - - - - - OP_0155 No Transport Assets Unspecified BVM 5 253 5 553 5 863 All Wards
Maintenance Maint. - Non-infra. - CP - Comm. Assets - Comm. Facilities - Public Open Space - External Facilities - - - OP_0156 No Community Facilities Public Open Space BVM 200 211 223 All Wards
Parent operational expenditure 1 30 102 28 249 32 032
Entities:
List all operational projects grouped by Entity
Entity A
Water project A
Entity B
Electricity project B
Entity Operational expenditure – – – – –
Total Operational expenditure – – 30 102 28 249 32 032

FORM
BSD
BSD
BSD