Budget for Children in the Union Budget 2012-13
22
1 Budget for Children (BfC) in the Union Budget 2012-13 Mr Finance Minister, what have you got for me this year? Photo Credit: Sreedeep
-
Upload
haq-centre-for-child-rights -
Category
Government & Nonprofit
-
view
188 -
download
1
Transcript of Budget for Children in the Union Budget 2012-13
1
Budget for Children (BfC) in the Union Budget 2012-13
Mr Finance
Minister, what
have you got for
me this year?
Photo Credit: Sreedeep
2
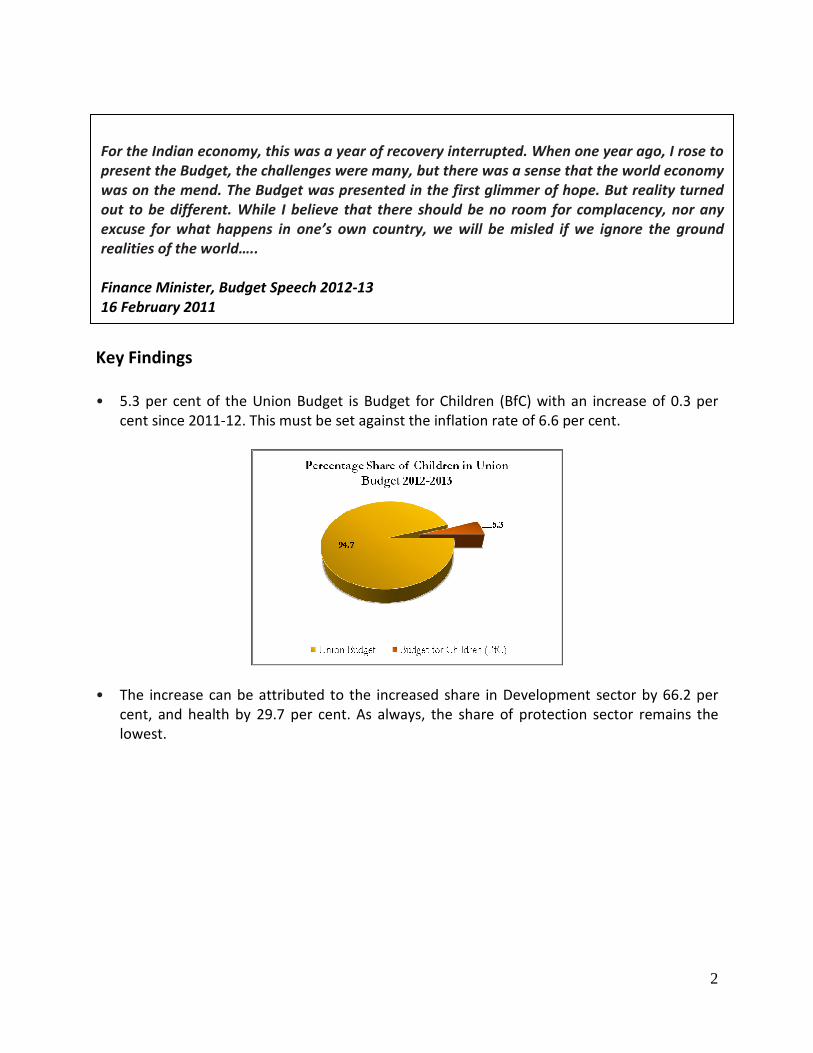
Key Findings
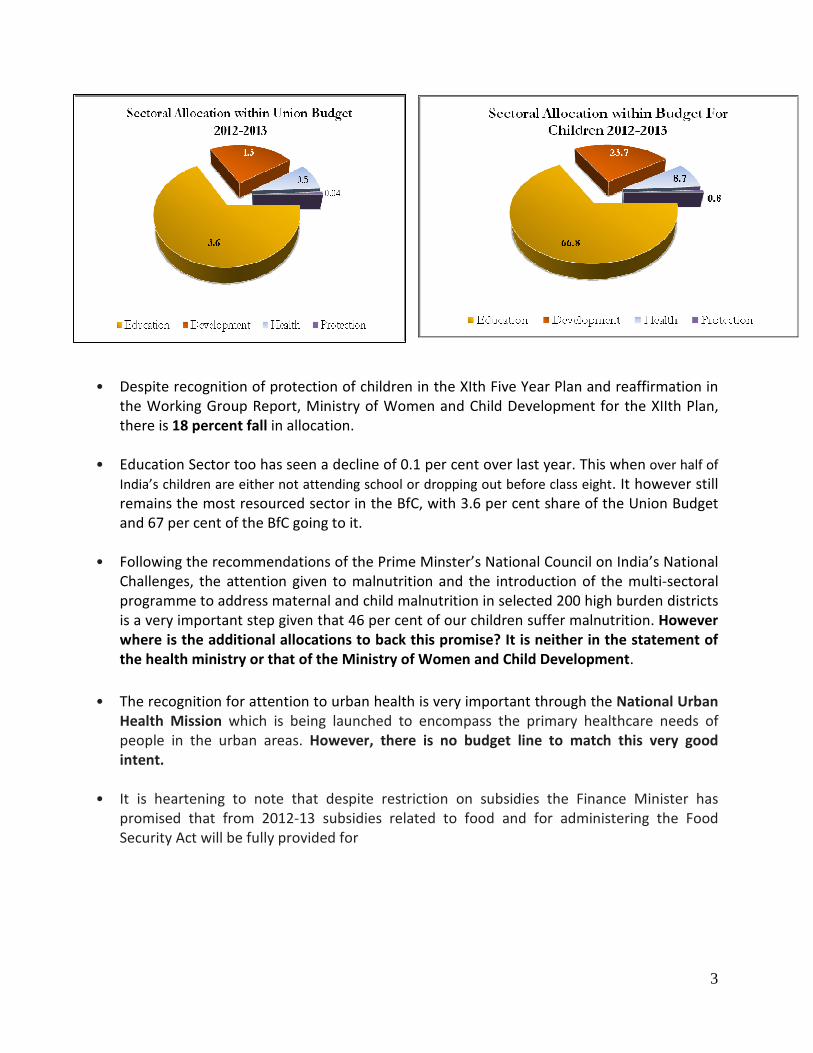
• 5.3 per cent of the Union Budget is Budget for Children (BfC) with an increase of 0.3 per
cent since 2011-12. This must be set against the inflation rate of 6.6 per cent.
• The increase can be attributed to the increased share in Development sector by 66.2 per
cent, and health by 29.7 per cent. As always, the share of protection sector remains the
lowest.
For the Indian economy, this was a year of recovery interrupted. When one year ago, I rose to
present the Budget, the challenges were many, but there was a sense that the world economy
was on the mend. The Budget was presented in the first glimmer of hope. But reality turned
out to be different. While I believe that there should be no room for complacency, nor any
excuse for what happens in one’s own country, we will be misled if we ignore the ground
realities of the world…..
Finance Minister, Budget Speech 2012-13
16 February 2011
3
• Despite recognition of protection of children in the XIth Five Year Plan and reaffirmation in
the Working Group Report, Ministry of Women and Child Development for the XIIth Plan,
there is 18 percent fall in allocation.
• Education Sector too has seen a decline of 0.1 per cent over last year. This when over half of
India’s children are either not attending school or dropping out before class eight. It however still
remains the most resourced sector in the BfC, with 3.6 per cent share of the Union Budget
and 67 per cent of the BfC going to it.
• Following the recommendations of the Prime Minster’s National Council on India’s National
Challenges, the attention given to malnutrition and the introduction of the multi-sectoral
programme to address maternal and child malnutrition in selected 200 high burden districts
is a very important step given that 46 per cent of our children suffer malnutrition. However
where is the additional allocations to back this promise? It is neither in the statement of
the health ministry or that of the Ministry of Women and Child Development.
• The recognition for attention to urban health is very important through the National Urban
Health Mission which is being launched to encompass the primary healthcare needs of
people in the urban areas. However, there is no budget line to match this very good
intent.
• It is heartening to note that despite restriction on subsidies the Finance Minister has
promised that from 2012-13 subsidies related to food and for administering the Food
Security Act will be fully provided for
4
Sectorwise Allocation for Children in the Union Budget 2011-12
Protection Sector in BfC
Key Findings
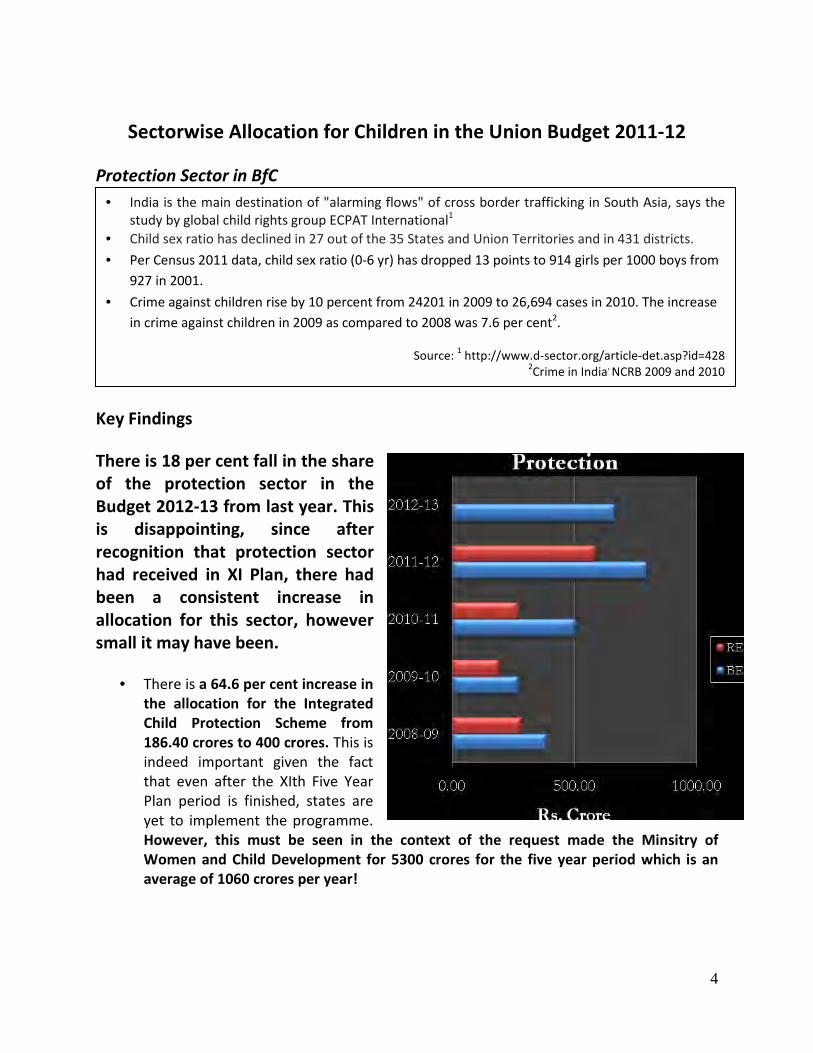
There is 18 per cent fall in the share
of the protection sector in the
Budget 2012-13 from last year. This
is disappointing, since after
recognition that protection sector
had received in XI Plan, there had
been a consistent increase in
allocation for this sector, however
small it may have been.
• There is a 64.6 per cent increase in
the allocation for the Integrated
Child Protection Scheme from
186.40 crores to 400 crores. This is
indeed important given the fact
that even after the XIth Five Year
Plan period is finished, states are
yet to implement the programme.
However, this must be seen in the context of the request made the Minsitry of
Women and Child Development for 5300 crores for the five year period which is an
average of 1060 crores per year!
• India is the main destination of "alarming flows" of cross border trafficking in South Asia, says the
study by global child rights group ECPAT International1
• Child sex ratio has declined in 27 out of the 35 States and Union Territories and in 431 districts.
• Per Census 2011 data, child sex ratio (0-6 yr) has dropped 13 points to 914 girls per 1000 boys from
927 in 2001.
• Crime against children rise by 10 percent from 24201 in 2009 to 26,694 cases in 2010. The increase
in crime against children in 2009 as compared to 2008 was 7.6 per cent2.
Source: 1 http://www.d-sector.org/article-det.asp?id=428
2Crime in India
, NCRB 2009 and 2010
5
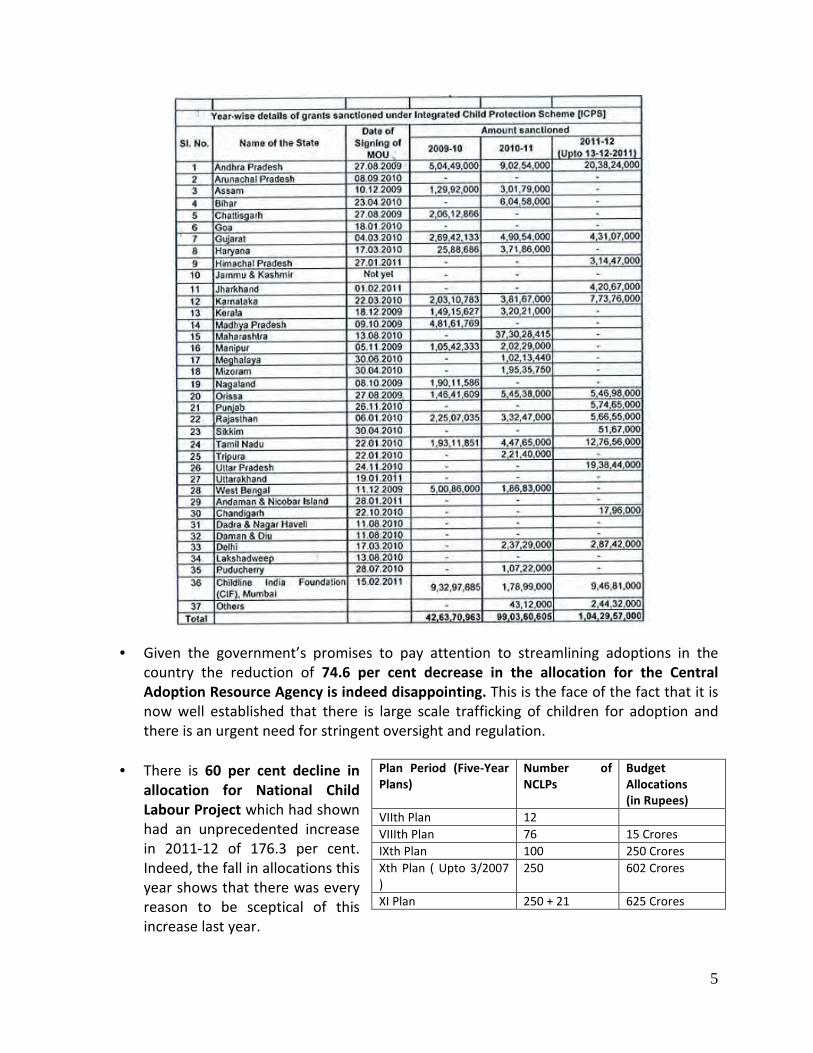
• Given the government’s promises to pay attention to streamlining adoptions in the
country the reduction of 74.6 per cent decrease in the allocation for the Central
Adoption Resource Agency is indeed disappointing. This is the face of the fact that it is
now well established that there is large scale trafficking of children for adoption and
there is an urgent need for stringent oversight and regulation.
• There is 60 per cent decline in
allocation for National Child
Labour Project which had shown
had an unprecedented increase
in 2011-12 of 176.3 per cent.
Indeed, the fall in allocations this
year shows that there was every
reason to be sceptical of this
increase last year.
Plan Period (Five-Year
Plans)
Number of
NCLPs
Budget
Allocations
(in Rupees)
VIIth Plan 12
VIIIth Plan 76 15 Crores
IXth Plan 100 250 Crores
Xth Plan ( Upto 3/2007
)
250 602 Crores
XI Plan 250 + 21 625 Crores
6
How is it proposed that the recommendations of the Working Group on Child Labour,
Ministry of Labour and Employment will be even minimally met, or is it once again lip
service to the largest number of working children in the world who are in this country?
• Extension of NCLP Scheme in other districts based on the child labour data of
Census 2011.
• Formation of State Project Society under the Chairpersonship of Principal
Secretary/ Secretary (Labour) for implementation of NCLP scheme.
• Alignment of NCLP Scheme with RTE Act, 2009.
• Creation of National Level Monitoring Committee
• Creation of State Level Monitoring- two tier monitoring committees at state level
will be more effective. (a) Core Committees on child labour under chief secretary
and (b) State monitoring committee under state labour Secretary
• Residential schools for migrant child labour.
• Enhancement of Honorarium of Staff/ teachers of NCLP society/ schools
• Enhancement of Stipend of school children
• Enhancement of rent for school buildings.
• Award scheme to motivate the project officials.
• Awareness generation.
• Vocational training for adolescents after completion of study in NCLP Schools.
• Creation of National Monitoring Cell and State level monitoring cell.
• Tracking and monitoring of child labour.
• 21 new (Indus) projects have been inducted in NCLP schemes and now schemes is
in operation into 271 districts
• 3,30, 000 children have been mainstreamed during 11th
five year plan
• Honorarium of project society staff and schools has been increased w.e.f. 01-04-
2011
7
Development Sector in BfC
Key findings
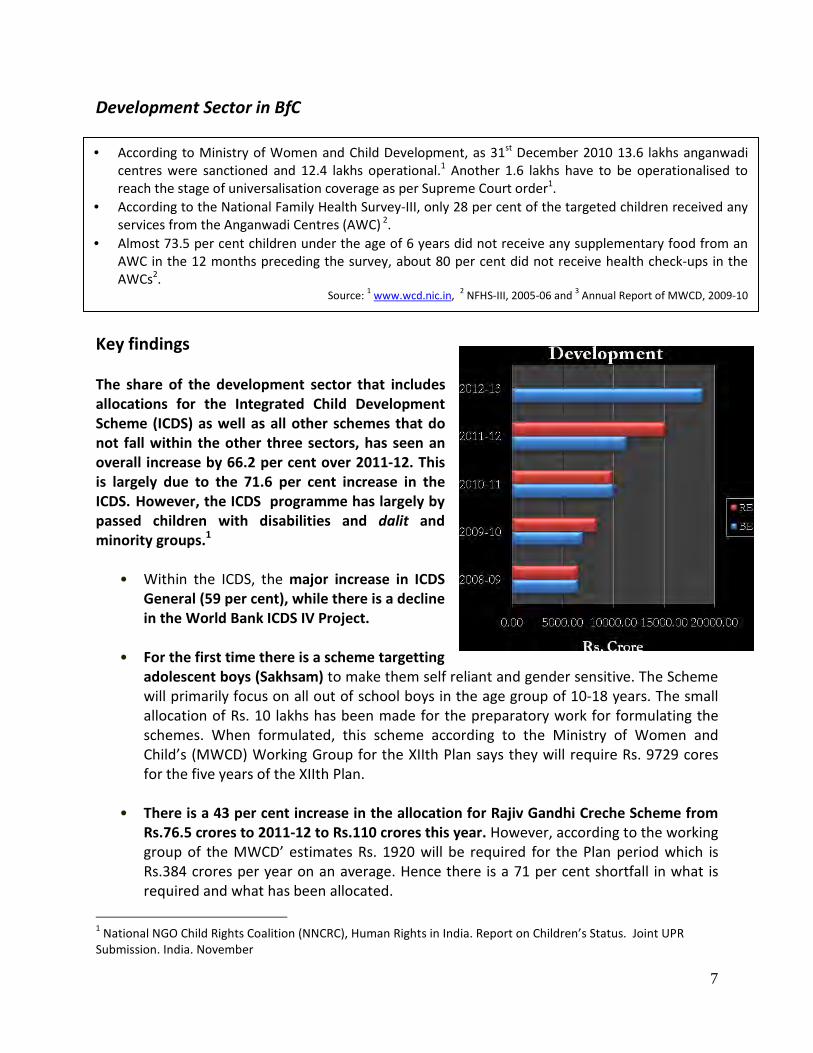
The share of the development sector that includes
allocations for the Integrated Child Development
Scheme (ICDS) as well as all other schemes that do
not fall within the other three sectors, has seen an
overall increase by 66.2 per cent over 2011-12. This
is largely due to the 71.6 per cent increase in the
ICDS. However, the ICDS programme has largely by
passed children with disabilities and dalit and
minority groups.1
• Within the ICDS, the major increase in ICDS
General (59 per cent), while there is a decline
in the World Bank ICDS IV Project.
• For the first time there is a scheme targetting
adolescent boys (Sakhsam) to make them self reliant and gender sensitive. The Scheme
will primarily focus on all out of school boys in the age group of 10-18 years. The small
allocation of Rs. 10 lakhs has been made for the preparatory work for formulating the
schemes. When formulated, this scheme according to the Ministry of Women and
Child’s (MWCD) Working Group for the XIIth Plan says they will require Rs. 9729 cores
for the five years of the XIIth Plan.
• There is a 43 per cent increase in the allocation for Rajiv Gandhi Creche Scheme from
Rs.76.5 crores to 2011-12 to Rs.110 crores this year. However, according to the working
group of the MWCD’ estimates Rs. 1920 will be required for the Plan period which is
Rs.384 crores per year on an average. Hence there is a 71 per cent shortfall in what is
required and what has been allocated.
1 National NGO Child Rights Coalition (NNCRC), Human Rights in India. Report on Children’s Status. Joint UPR
Submission. India. November
• According to Ministry of Women and Child Development, as 31st
December 2010 13.6 lakhs anganwadi
centres were sanctioned and 12.4 lakhs operational.1 Another 1.6 lakhs have to be operationalised to
reach the stage of universalisation coverage as per Supreme Court order1.
• According to the National Family Health Survey-III, only 28 per cent of the targeted children received any
services from the Anganwadi Centres (AWC) 2
.
• Almost 73.5 per cent children under the age of 6 years did not receive any supplementary food from an
AWC in the 12 months preceding the survey, about 80 per cent did not receive health check-ups in the
AWCs2.
Source: 1 www.wcd.nic.in,
2 NFHS-III, 2005-06 and
3 Annual Report of MWCD, 2009-10
8
They say persistence pays. I am happy to inform Hon’ble
Members that no new case of polio was reported in the
last one year. By modernising existing units and setting
up a new integrated vaccine unit near Chennai, the
Government will achieve vaccine security and keep the
pressure on disease eradication and prevention.
Finance Minister in Budget Speech 2011-12
Health Sector in BfC
Key Findings
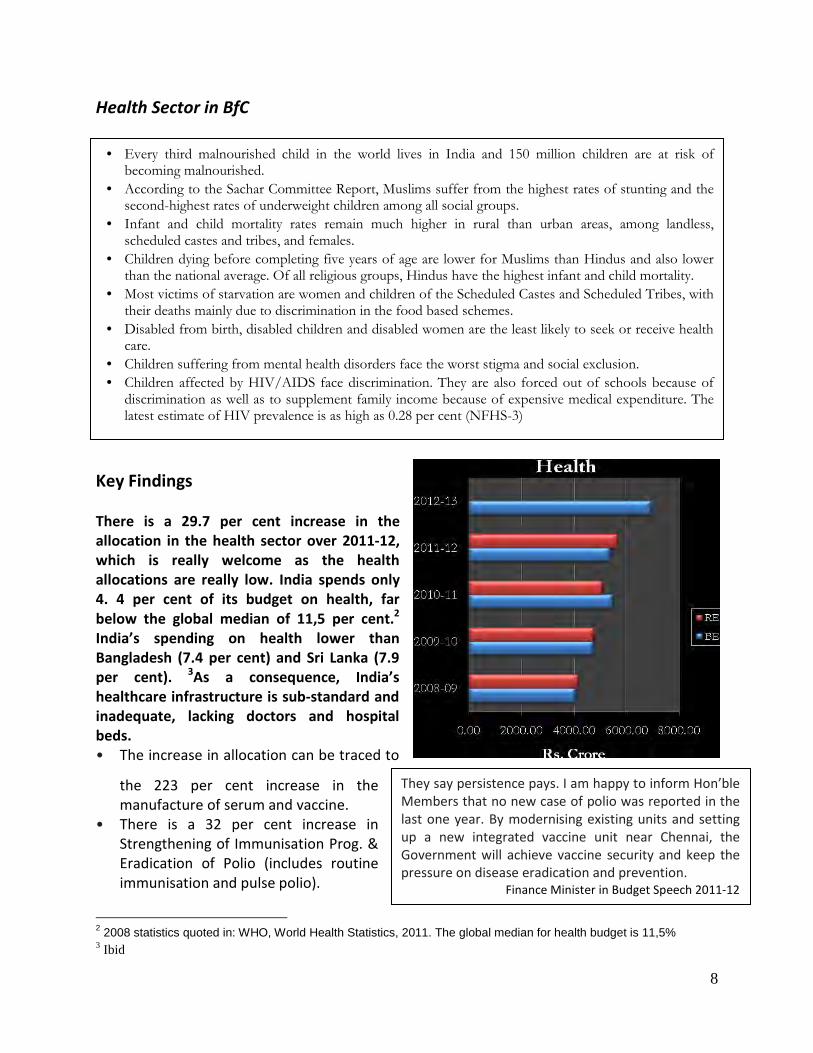
There is a 29.7 per cent increase in the
allocation in the health sector over 2011-12,
which is really welcome as the health
allocations are really low. India spends only
4. 4 per cent of its budget on health, far
below the global median of 11,5 per cent.2
India’s spending on health lower than
Bangladesh (7.4 per cent) and Sri Lanka (7.9
per cent). 3As a consequence, India’s
healthcare infrastructure is sub-standard and
inadequate, lacking doctors and hospital
beds.
• The increase in allocation can be traced to
the 223 per cent increase in the
manufacture of serum and vaccine.
• There is a 32 per cent increase in
Strengthening of Immunisation Prog. &
Eradication of Polio (includes routine
immunisation and pulse polio).
2 2008 statistics quoted in: WHO, World Health Statistics, 2011. The global median for health budget is 11,5% 3 Ibid
• Every third malnourished child in the world lives in India and 150 million children are at risk of becoming malnourished.
• According to the Sachar Committee Report, Muslims suffer from the highest rates of stunting and the second-highest rates of underweight children among all social groups.
• Infant and child mortality rates remain much higher in rural than urban areas, among landless, scheduled castes and tribes, and females.
• Children dying before completing five years of age are lower for Muslims than Hindus and also lower than the national average. Of all religious groups, Hindus have the highest infant and child mortality.
• Most victims of starvation are women and children of the Scheduled Castes and Scheduled Tribes, with their deaths mainly due to discrimination in the food based schemes.
• Disabled from birth, disabled children and disabled women are the least likely to seek or receive health care.
• Children suffering from mental health disorders face the worst stigma and social exclusion.
• Children affected by HIV/AIDS face discrimination. They are also forced out of schools because of discrimination as well as to supplement family income because of expensive medical expenditure. The latest estimate of HIV prevalence is as high as 0.28 per cent (NFHS-3)
9
Education Sector in BfC
Key Findings
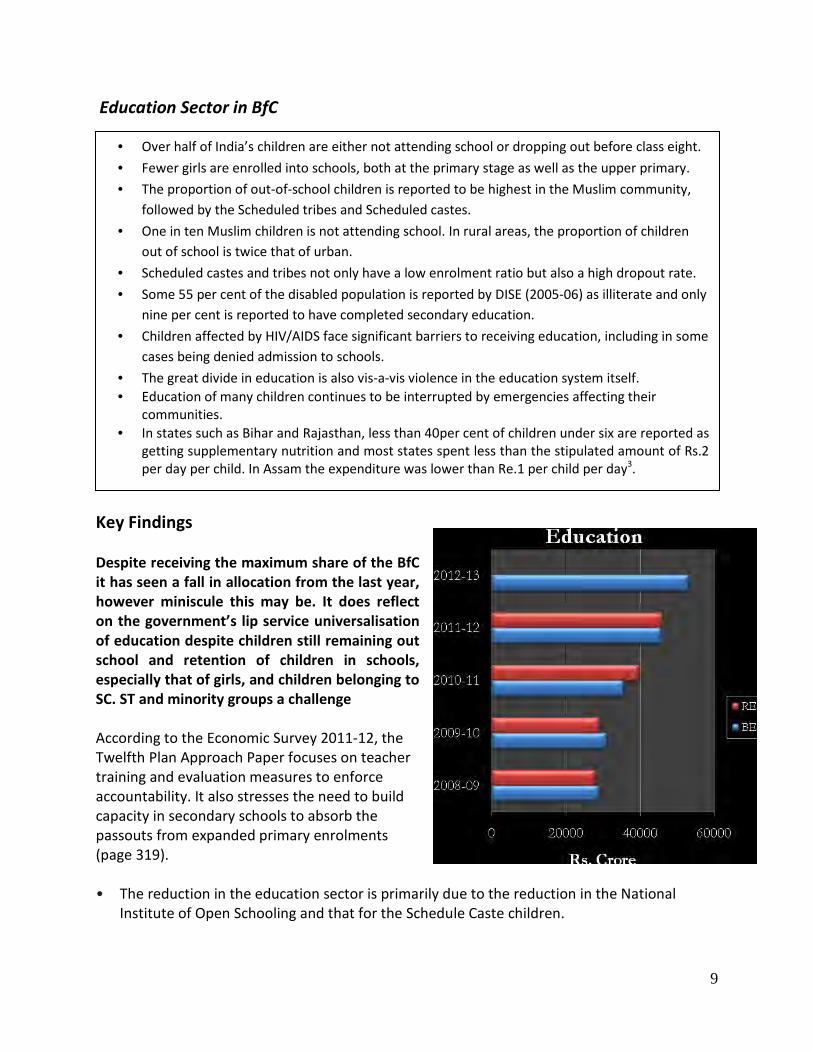
Despite receiving the maximum share of the BfC
it has seen a fall in allocation from the last year,
however miniscule this may be. It does reflect
on the government’s lip service universalisation
of education despite children still remaining out
school and retention of children in schools,
especially that of girls, and children belonging to
SC. ST and minority groups a challenge
According to the Economic Survey 2011-12, the
Twelfth Plan Approach Paper focuses on teacher
training and evaluation measures to enforce
accountability. It also stresses the need to build
capacity in secondary schools to absorb the
passouts from expanded primary enrolments
(page 319).
• The reduction in the education sector is primarily due to the reduction in the National
Institute of Open Schooling and that for the Schedule Caste children.
• Over half of India’s children are either not attending school or dropping out before class eight.
• Fewer girls are enrolled into schools, both at the primary stage as well as the upper primary.
• The proportion of out-of-school children is reported to be highest in the Muslim community,
followed by the Scheduled tribes and Scheduled castes.
• One in ten Muslim children is not attending school. In rural areas, the proportion of children
out of school is twice that of urban.
• Scheduled castes and tribes not only have a low enrolment ratio but also a high dropout rate.
• Some 55 per cent of the disabled population is reported by DISE (2005-06) as illiterate and only
nine per cent is reported to have completed secondary education.
• Children affected by HIV/AIDS face significant barriers to receiving education, including in some
cases being denied admission to schools.
• The great divide in education is also vis-a-vis violence in the education system itself.
• Education of many children continues to be interrupted by emergencies affecting their
communities.
• In states such as Bihar and Rajasthan, less than 40per cent of children under six are reported as
getting supplementary nutrition and most states spent less than the stipulated amount of Rs.2
per day per child. In Assam the expenditure was lower than Re.1 per child per day3.
10
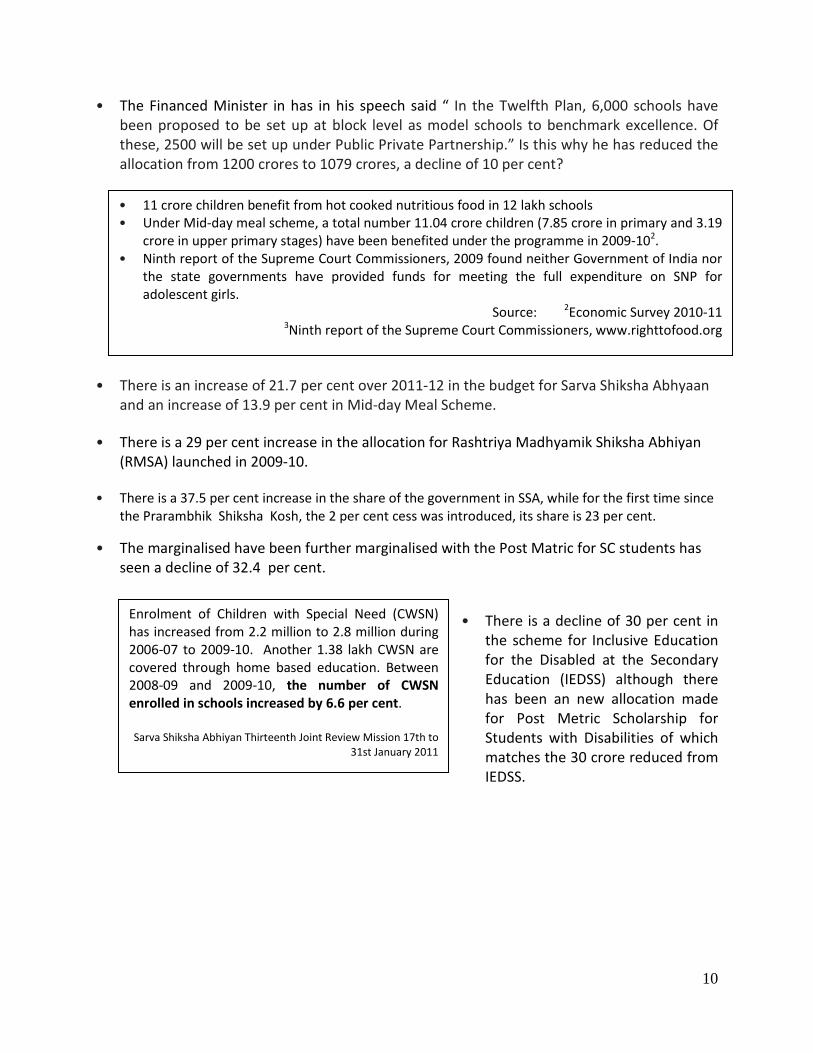
Enrolment of Children with Special Need (CWSN)
has increased from 2.2 million to 2.8 million during
2006-07 to 2009-10. Another 1.38 lakh CWSN are
covered through home based education. Between
2008-09 and 2009-10, the number of CWSN
enrolled in schools increased by 6.6 per cent.
Sarva Shiksha Abhiyan Thirteenth Joint Review Mission 17th to
31st January 2011
• The Financed Minister in has in his speech said “ In the Twelfth Plan, 6,000 schools have
been proposed to be set up at block level as model schools to benchmark excellence. Of
these, 2500 will be set up under Public Private Partnership.” Is this why he has reduced the
allocation from 1200 crores to 1079 crores, a decline of 10 per cent?
• There is an increase of 21.7 per cent over 2011-12 in the budget for Sarva Shiksha Abhyaan
and an increase of 13.9 per cent in Mid-day Meal Scheme.
• There is a 29 per cent increase in the allocation for Rashtriya Madhyamik Shiksha Abhiyan
(RMSA) launched in 2009-10.
• There is a 37.5 per cent increase in the share of the government in SSA, while for the first time since
the Prarambhik Shiksha Kosh, the 2 per cent cess was introduced, its share is 23 per cent.
• The marginalised have been further marginalised with the Post Matric for SC students has
seen a decline of 32.4 per cent.
• There is a decline of 30 per cent in
the scheme for Inclusive Education
for the Disabled at the Secondary
Education (IEDSS) although there
has been an new allocation made
for Post Metric Scholarship for
Students with Disabilities of which
matches the 30 crore reduced from
IEDSS.
• 11 crore children benefit from hot cooked nutritious food in 12 lakh schools
• Under Mid-day meal scheme, a total number 11.04 crore children (7.85 crore in primary and 3.19
crore in upper primary stages) have been benefited under the programme in 2009-102.
• Ninth report of the Supreme Court Commissioners, 2009 found neither Government of India nor
the state governments have provided funds for meeting the full expenditure on SNP for
adolescent girls.
Source: 2Economic Survey 2010-11
3Ninth report of the Supreme Court Commissioners, www.righttofood.org
11
Conclusion This year’s budget can be seen in isolation. It has to be seen in the context of requirements of
the XIIth Five Year Plan and the unfulfilled commitments of the XII th Five Year Plan. “ We are
about to enter the first year of the Twelfth Five Year Plan which aims at “faster, sustainable and
more inclusive growth” , said the Finance Minister. Perhaps what he should have also added is
the need for inclusive development.
There remain many states and communities that need further attention when we are speaking
of inclusive development. Given the performance of the states on various child rights indicators
presented in the table below (child rights index developed by HAQ), it becomes imperative to
focus on improving the implementation of policies, laws, programmes and plans. This implies:
(a) Better outreach based on identification of states that lag behind as also groups of
children who remain untouched in both rural and urban areas.
(b) A continuum in the outreach to ensure that children’s concerns at all ages 0-18 are
addressed.
(c) Reduction in the gap between sanctioned and operational projects.
(d) Consolidation of existing interventions
(e) Improved quality of services and prevention of leakages of funds and resources.
(f) Legal and policy reform to establish effective justice delivery mechanisms and
procedures
(g) Setting up required structures for implementation
(h) Strengthening existing structures through investment of human and financial resources
(i) Training and capacity building of personnel
(j) Mergers and restructuring of centrally sponsored schemes, where required
(k) Investing in new areas of programmatic intervention based on a needs assessment and
situational analysis
(l) Building a caring community for children
(m) Restructuring and mergers where required at the centre, in the states and between the centre
and the states
(n) Convergence in the outreach
12
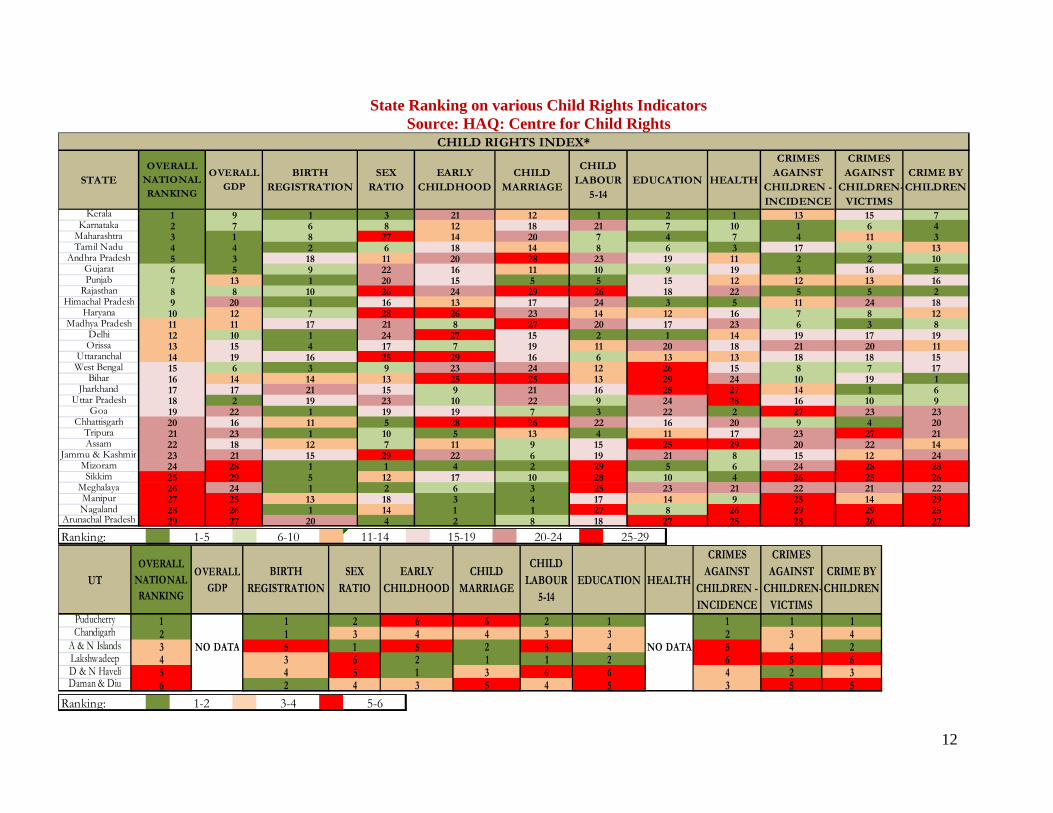
State Ranking on various Child Rights Indicators Source: HAQ: Centre for Child Rights
Kerala 1 9 1 3 21 12 1 2 1 13 15 7
Karnataka 2 7 6 8 12 18 21 7 10 1 6 4
Maharashtra 3 1 8 27 14 20 7 4 7 4 11 3
Tamil Nadu 4 4 2 6 18 14 8 6 3 17 9 13
Andhra Pradesh 5 3 18 11 20 28 23 19 11 2 2 10
Gujarat 6 5 9 22 16 11 10 9 19 3 16 5
Punjab 7 13 1 20 15 5 5 15 12 12 13 16
Rajasthan 8 8 10 26 24 29 26 18 22 5 5 2
Himachal Pradesh 9 20 1 16 13 17 24 3 5 11 24 18
Haryana 10 12 7 28 26 23 14 12 16 7 8 12
Madhya Pradesh 11 11 17 21 8 27 20 17 23 6 3 8
Delhi 12 10 1 24 27 15 2 1 14 19 17 19
Orissa 13 15 4 17 7 19 11 20 18 21 20 11
Uttaranchal 14 19 16 25 29 16 6 13 13 18 18 15
West Bengal 15 6 3 9 23 24 12 26 15 8 7 17
Bihar 16 14 14 13 25 25 13 29 24 10 19 1
Jharkhand 17 17 21 15 9 21 16 28 27 14 1 6
Uttar Pradesh 18 2 19 23 10 22 9 24 28 16 10 9
Goa 19 22 1 19 19 7 3 22 2 27 23 23
Chhattisgarh 20 16 11 5 28 26 22 16 20 9 4 20
Tripura 21 23 1 10 5 13 4 11 17 23 27 21
Assam 22 18 12 7 11 9 15 25 29 20 22 14
Jammu & Kashmir 23 21 15 29 22 6 19 21 8 15 12 24
Mizoram 24 28 1 1 4 2 29 5 6 24 28 28
Sikkim 25 29 5 12 17 10 28 10 4 26 25 26
Meghalaya 26 24 1 2 6 3 25 23 21 22 21 22
Manipur 27 25 13 18 3 4 17 14 9 25 14 29
Nagaland 28 26 1 14 1 1 27 8 26 29 29 25
Arunachal Pradesh 29 27 20 4 2 8 18 27 25 28 26 27
CHILD
LABOUR
5-14
EDUCATION HEALTH
CRIMES
AGAINST
CHILDREN -
INCIDENCE
CRIMES
AGAINST
CHILDREN-
VICTIMS
CRIME BY
CHILDREN
OVERALL
NATIONAL
RANKING
STATEOVERALL
GDP
CHILD RIGHTS INDEX*
BIRTH
REGISTRATION
SEX
RATIO
EARLY
CHILDHOOD
CHILD
MARRIAGE
Ranking: 1-5 6-10 11-14 15-19 20-24 25-29
Puducherry 1 1 2 6 6 2 1 1 1 1
Chandigarh 2 1 3 4 4 3 3 2 3 4
A & N Islands 3 NO DATA 5 1 5 2 5 4 NO DATA 5 4 2
Lakshwadeep 4 3 6 2 1 1 2 6 5 6
D & N Haveli 5 4 5 1 3 6 6 4 2 3
Daman & Diu 6 2 4 3 5 4 5 3 5 5
CRIMES
AGAINST
CHILDREN-
VICTIMS
CRIME BY
CHILDREN
EARLY
CHILDHOOD
CHILD
MARRIAGE
CHILD
LABOUR
5-14
EDUCATION HEALTH
CRIMES
AGAINST
CHILDREN -
INCIDENCE
UT
OVERALL
NATIONAL
RANKING
OVERALL
GDP
BIRTH
REGISTRATION
SEX
RATIO
Ranking: 1-2 3-4 5-6
13
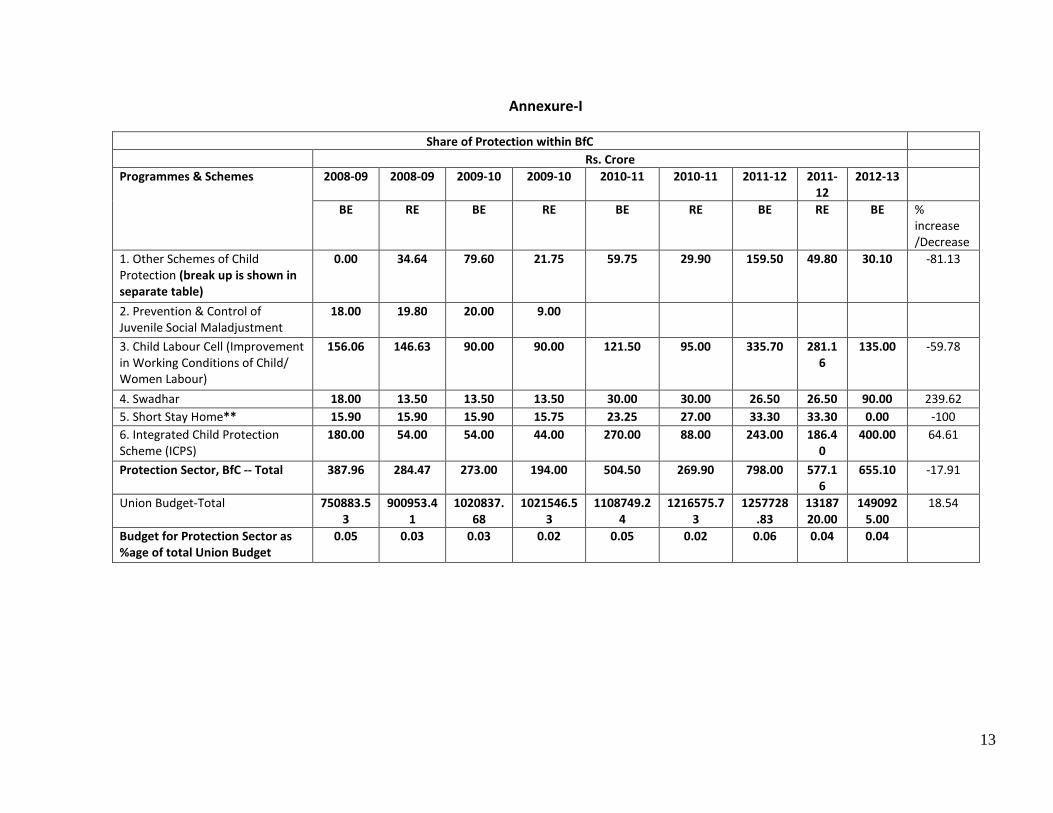
Annexure-I
Share of Protection within BfC
Rs. Crore
Programmes & Schemes 2008-09 2008-09 2009-10 2009-10 2010-11 2010-11 2011-12 2011-
12
2012-13
BE RE BE RE BE RE BE RE BE %
increase
/Decrease
1. Other Schemes of Child
Protection (break up is shown in
separate table)
0.00 34.64 79.60 21.75 59.75 29.90 159.50 49.80 30.10 -81.13
2. Prevention & Control of
Juvenile Social Maladjustment
18.00 19.80 20.00 9.00
3. Child Labour Cell (Improvement
in Working Conditions of Child/
Women Labour)
156.06 146.63 90.00 90.00 121.50 95.00 335.70 281.1
6
135.00 -59.78
4. Swadhar 18.00 13.50 13.50 13.50 30.00 30.00 26.50 26.50 90.00 239.62
5. Short Stay Home** 15.90 15.90 15.90 15.75 23.25 27.00 33.30 33.30 0.00 -100
6. Integrated Child Protection
Scheme (ICPS)
180.00 54.00 54.00 44.00 270.00 88.00 243.00 186.4
0
400.00 64.61
Protection Sector, BfC -- Total 387.96 284.47 273.00 194.00 504.50 269.90 798.00 577.1
6
655.10 -17.91
Union Budget-Total 750883.5
3
900953.4
1
1020837.
68
1021546.5
3
1108749.2
4
1216575.7
3
1257728
.83
13187
20.00
149092
5.00
18.54
Budget for Protection Sector as
%age of total Union Budget
0.05 0.03 0.03 0.02 0.05 0.02 0.06 0.04 0.04

14
Other Schemes on Protection
Rs. Crore
2008-09 2008-09 2009-
10
2009-10 2010-
11
2010-
11
2011-
12
2011-
12
2012-13
BE RE BE RE BE RE BE RE BE % increase
/Decrease
Integrated Scheme for Street children 9.00 11.25 9.00 4.50
Scheme for welfare of working
children and children in need of care
and protection
6.30.00 7.65 6.30 9.00 11.25 11.25 9.00 9.00 9.00 0
Shishu Griha Scheme (erstwhile
Homes for infant and young children
for promotion of in country adoption)
2.70 2.52 2.70 1.80
Central Adoption Resource Agency* 3.80 3.16 3.80 1.79 3.30 3.15 8.30 8.30 2.10 -74.7
Scheme for Rescue of Victims of
Trafficking
9.00 5.40 4.50 4.50 9.00 6.30 9.00 0.00 0.00 -100
Relief to & Rehabilitation of Rape
Victims
36.20 4.66 53.30 0.16 36.20 9.20 133.20 32.50 19.00 -85.74
Total – Other Schemes on Child
Protection
34.64 79.60 21.75 59.75 29.90 159.50 49.80 30.10 -81.13
15
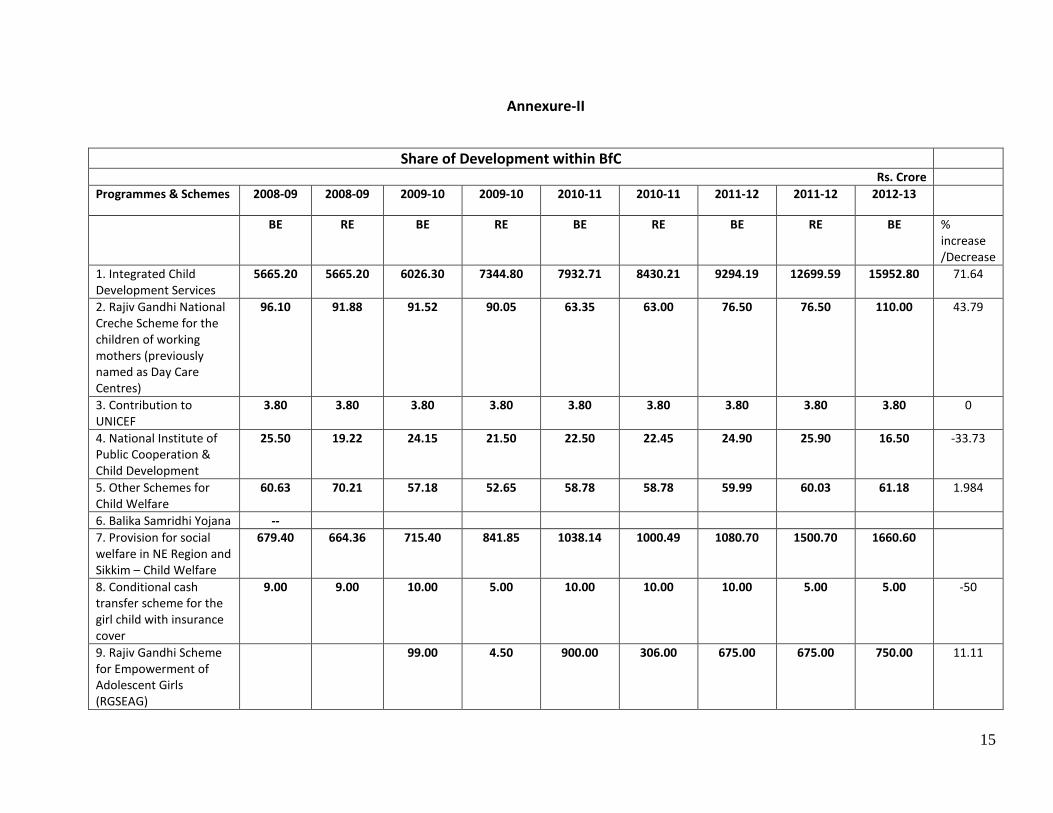
Annexure-II
Share of Development within BfC
Rs. Crore
Programmes & Schemes 2008-09 2008-09 2009-10 2009-10 2010-11 2010-11 2011-12 2011-12 2012-13
BE RE BE RE BE RE BE RE BE %
increase
/Decrease
1. Integrated Child
Development Services
5665.20 5665.20 6026.30 7344.80 7932.71 8430.21 9294.19 12699.59 15952.80 71.64
2. Rajiv Gandhi National
Creche Scheme for the
children of working
mothers (previously
named as Day Care
Centres)
96.10 91.88 91.52 90.05 63.35 63.00 76.50 76.50 110.00 43.79
3. Contribution to
UNICEF
3.80 3.80 3.80 3.80 3.80 3.80 3.80 3.80 3.80 0
4. National Institute of
Public Cooperation &
Child Development
25.50 19.22 24.15 21.50 22.50 22.45 24.90 25.90 16.50 -33.73
5. Other Schemes for
Child Welfare
60.63 70.21 57.18 52.65 58.78 58.78 59.99 60.03 61.18 1.984
6. Balika Samridhi Yojana --
7. Provision for social
welfare in NE Region and
Sikkim – Child Welfare
679.40 664.36 715.40 841.85 1038.14 1000.49 1080.70 1500.70 1660.60
8. Conditional cash
transfer scheme for the
girl child with insurance
cover
9.00 9.00 10.00 5.00 10.00 10.00 10.00 5.00 5.00 -50
9. Rajiv Gandhi Scheme
for Empowerment of
Adolescent Girls
(RGSEAG)
99.00 4.50 900.00 306.00 675.00 675.00 750.00 11.11
16
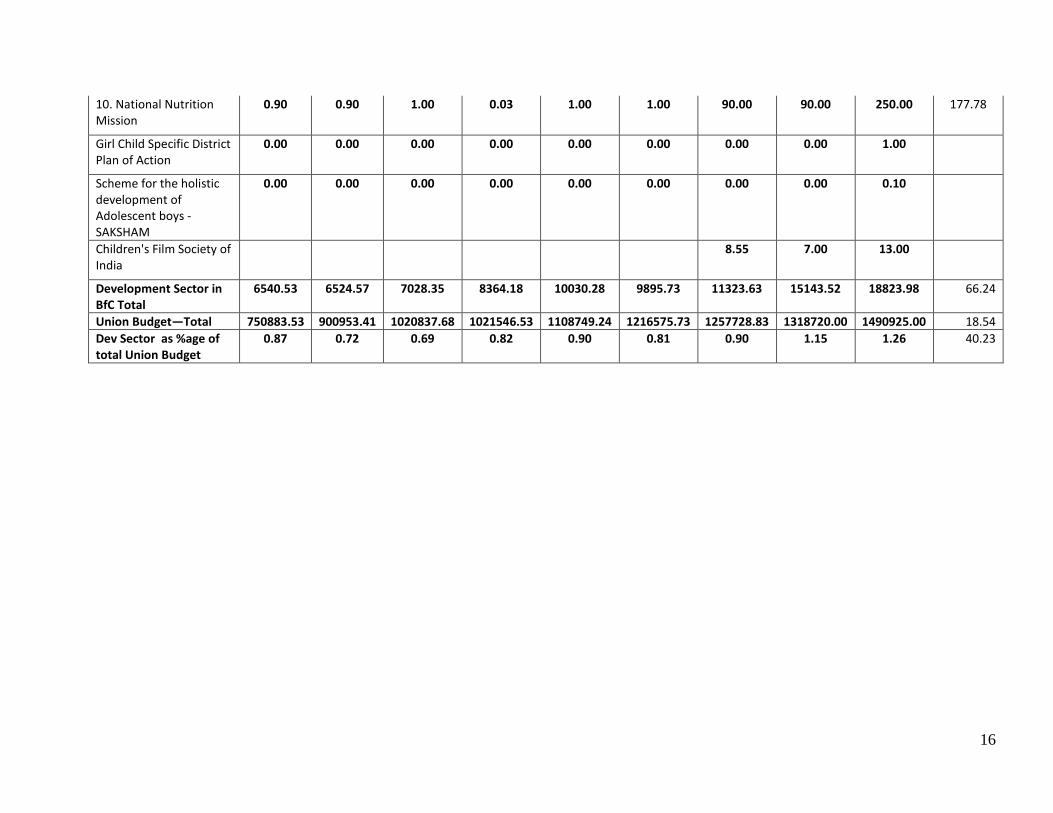
10. National Nutrition
Mission
0.90 0.90 1.00 0.03 1.00 1.00 90.00 90.00 250.00 177.78
Girl Child Specific District
Plan of Action
0.00 0.00 0.00 0.00 0.00 0.00 0.00 0.00 1.00
Scheme for the holistic
development of
Adolescent boys -
SAKSHAM
0.00 0.00 0.00 0.00 0.00 0.00 0.00 0.00 0.10
Children's Film Society of
India
8.55 7.00 13.00
Development Sector in
BfC Total
6540.53 6524.57 7028.35 8364.18 10030.28 9895.73 11323.63 15143.52 18823.98 66.24
Union Budget—Total 750883.53 900953.41 1020837.68 1021546.53 1108749.24 1216575.73 1257728.83 1318720.00 1490925.00 18.54
Dev Sector as %age of
total Union Budget
0.87 0.72 0.69 0.82 0.90 0.81 0.90 1.15 1.26 40.23
17
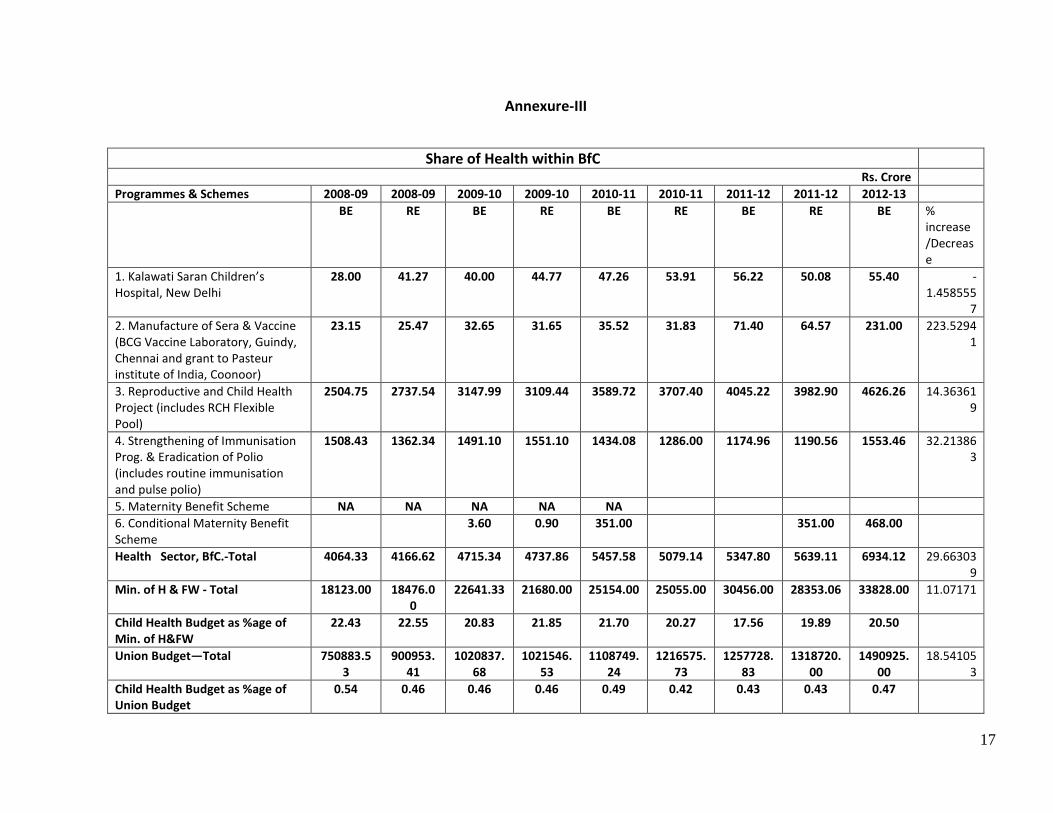
Annexure-III
Share of Health within BfC
Rs. Crore
Programmes & Schemes 2008-09 2008-09 2009-10 2009-10 2010-11 2010-11 2011-12 2011-12 2012-13
BE RE BE RE BE RE BE RE BE %
increase
/Decreas
e
1. Kalawati Saran Children’s
Hospital, New Delhi
28.00 41.27 40.00 44.77 47.26 53.91 56.22 50.08 55.40 -
1.458555
7
2. Manufacture of Sera & Vaccine
(BCG Vaccine Laboratory, Guindy,
Chennai and grant to Pasteur
institute of India, Coonoor)
23.15 25.47 32.65 31.65 35.52 31.83 71.40 64.57 231.00 223.5294
1
3. Reproductive and Child Health
Project (includes RCH Flexible
Pool)
2504.75 2737.54 3147.99 3109.44 3589.72 3707.40 4045.22 3982.90 4626.26 14.36361
9
4. Strengthening of Immunisation
Prog. & Eradication of Polio
(includes routine immunisation
and pulse polio)
1508.43 1362.34 1491.10 1551.10 1434.08 1286.00 1174.96 1190.56 1553.46 32.21386
3
5. Maternity Benefit Scheme NA NA NA NA NA
6. Conditional Maternity Benefit
Scheme
3.60 0.90 351.00 351.00 468.00
Health Sector, BfC.-Total 4064.33 4166.62 4715.34 4737.86 5457.58 5079.14 5347.80 5639.11 6934.12 29.66303
9
Min. of H & FW - Total 18123.00 18476.0
0
22641.33 21680.00 25154.00 25055.00 30456.00 28353.06 33828.00 11.07171
Child Health Budget as %age of
Min. of H&FW
22.43 22.55 20.83 21.85 21.70 20.27 17.56 19.89 20.50
Union Budget—Total 750883.5
3
900953.
41
1020837.
68
1021546.
53
1108749.
24
1216575.
73
1257728.
83
1318720.
00
1490925.
00
18.54105
3
Child Health Budget as %age of
Union Budget
0.54 0.46 0.46 0.46 0.49 0.42 0.43 0.43 0.47
18
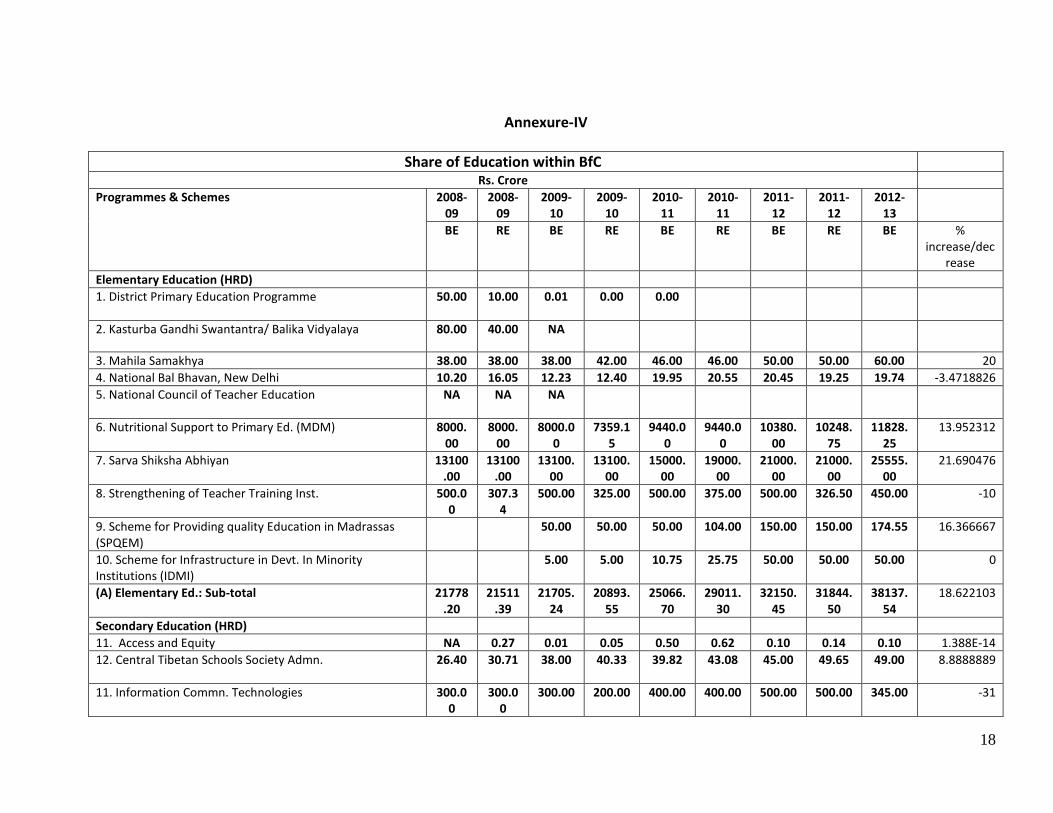
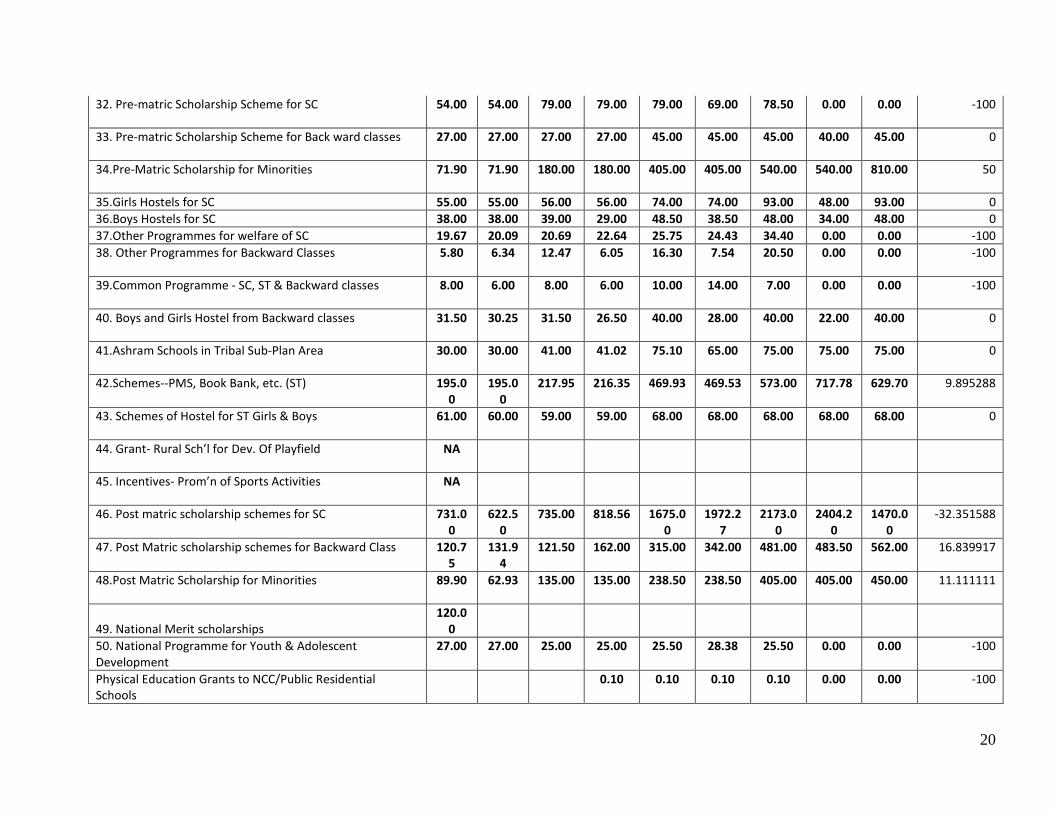
Annexure-IV
Share of Education within BfC
Rs. Crore
Programmes & Schemes 2008-
09
2008-
09
2009-
10
2009-
10
2010-
11
2010-
11
2011-
12
2011-
12
2012-
13
BE RE BE RE BE RE BE RE BE %
increase/dec
rease
Elementary Education (HRD)
1. District Primary Education Programme 50.00 10.00 0.01 0.00 0.00
2. Kasturba Gandhi Swantantra/ Balika Vidyalaya 80.00 40.00 NA
3. Mahila Samakhya 38.00 38.00 38.00 42.00 46.00 46.00 50.00 50.00 60.00 20
4. National Bal Bhavan, New Delhi 10.20 16.05 12.23 12.40 19.95 20.55 20.45 19.25 19.74 -3.4718826
5. National Council of Teacher Education NA NA NA
6. Nutritional Support to Primary Ed. (MDM) 8000.
00
8000.
00
8000.0
0
7359.1
5
9440.0
0
9440.0
0
10380.
00
10248.
75
11828.
25
13.952312
7. Sarva Shiksha Abhiyan 13100
.00
13100
.00
13100.
00
13100.
00
15000.
00
19000.
00
21000.
00
21000.
00
25555.
00
21.690476
8. Strengthening of Teacher Training Inst. 500.0
0
307.3
4
500.00 325.00 500.00 375.00 500.00 326.50 450.00 -10
9. Scheme for Providing quality Education in Madrassas
(SPQEM)
50.00 50.00 50.00 104.00 150.00 150.00 174.55 16.366667
10. Scheme for Infrastructure in Devt. In Minority
Institutions (IDMI)
5.00 5.00 10.75 25.75 50.00 50.00 50.00 0
(A) Elementary Ed.: Sub-total 21778
.20
21511
.39
21705.
24
20893.
55
25066.
70
29011.
30
32150.
45
31844.
50
38137.
54
18.622103
Secondary Education (HRD)
11. Access and Equity NA 0.27 0.01 0.05 0.50 0.62 0.10 0.14 0.10 1.388E-14
12. Central Tibetan Schools Society Admn. 26.40 30.71 38.00 40.33 39.82 43.08 45.00 49.65 49.00 8.8888889
11. Information Commn. Technologies 300.0
0
300.0
0
300.00 200.00 400.00 400.00 500.00 500.00 345.00 -31
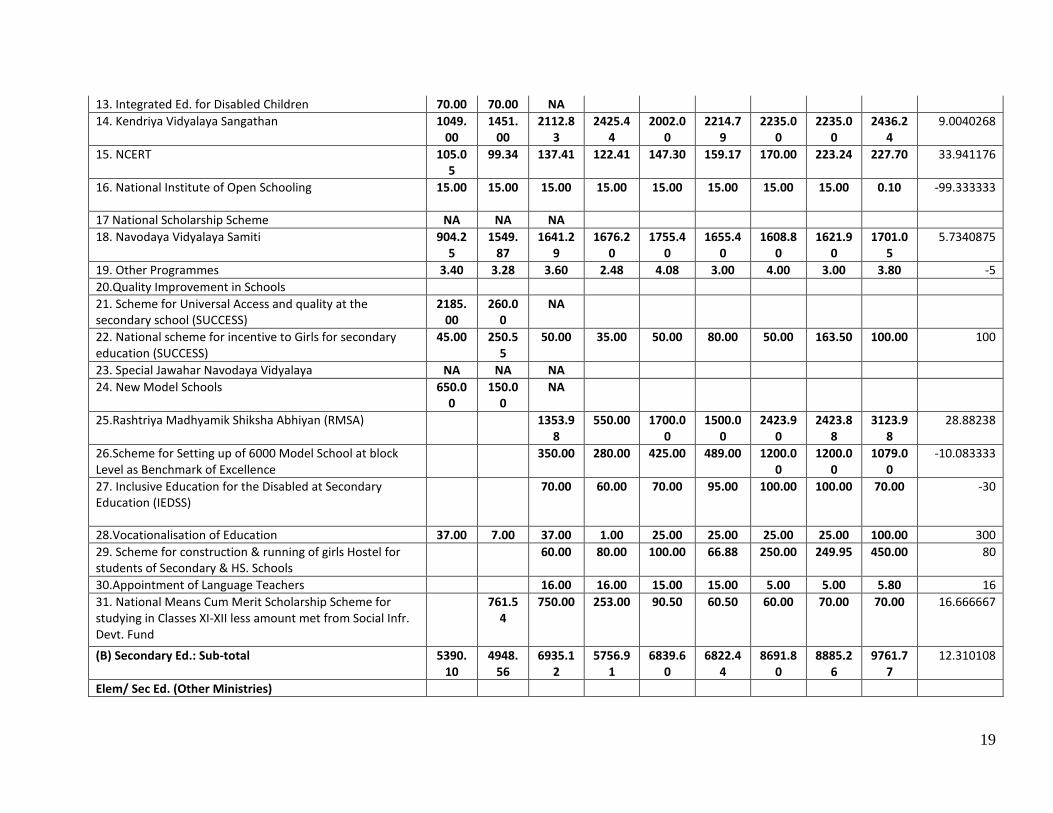
19
13. Integrated Ed. for Disabled Children 70.00 70.00 NA
14. Kendriya Vidyalaya Sangathan 1049.
00
1451.
00
2112.8
3
2425.4
4
2002.0
0
2214.7
9
2235.0
0
2235.0
0
2436.2
4
9.0040268
15. NCERT 105.0
5
99.34 137.41 122.41 147.30 159.17 170.00 223.24 227.70 33.941176
16. National Institute of Open Schooling 15.00 15.00 15.00 15.00 15.00 15.00 15.00 15.00 0.10 -99.333333
17 National Scholarship Scheme NA NA NA
18. Navodaya Vidyalaya Samiti 904.2
5
1549.
87
1641.2
9
1676.2
0
1755.4
0
1655.4
0
1608.8
0
1621.9
0
1701.0
5
5.7340875
19. Other Programmes 3.40 3.28 3.60 2.48 4.08 3.00 4.00 3.00 3.80 -5
20.Quality Improvement in Schools
21. Scheme for Universal Access and quality at the
secondary school (SUCCESS)
2185.
00
260.0
0
NA
22. National scheme for incentive to Girls for secondary
education (SUCCESS)
45.00 250.5
5
50.00 35.00 50.00 80.00 50.00 163.50 100.00 100
23. Special Jawahar Navodaya Vidyalaya NA NA NA
24. New Model Schools 650.0
0
150.0
0
NA
25.Rashtriya Madhyamik Shiksha Abhiyan (RMSA) 1353.9
8
550.00 1700.0
0
1500.0
0
2423.9
0
2423.8
8
3123.9
8
28.88238
26.Scheme for Setting up of 6000 Model School at block
Level as Benchmark of Excellence
350.00 280.00 425.00 489.00 1200.0
0
1200.0
0
1079.0
0
-10.083333
27. Inclusive Education for the Disabled at Secondary
Education (IEDSS)
70.00 60.00 70.00 95.00 100.00 100.00 70.00 -30
28.Vocationalisation of Education 37.00 7.00 37.00 1.00 25.00 25.00 25.00 25.00 100.00 300
29. Scheme for construction & running of girls Hostel for
students of Secondary & HS. Schools
60.00 80.00 100.00 66.88 250.00 249.95 450.00 80
30.Appointment of Language Teachers 16.00 16.00 15.00 15.00 5.00 5.00 5.80 16
31. National Means Cum Merit Scholarship Scheme for
studying in Classes XI-XII less amount met from Social Infr.
Devt. Fund
761.5
4
750.00 253.00 90.50 60.50 60.00 70.00 70.00 16.666667
(B) Secondary Ed.: Sub-total 5390.
10
4948.
56
6935.1
2
5756.9
1
6839.6
0
6822.4
4
8691.8
0
8885.2
6
9761.7
7
12.310108
Elem/ Sec Ed. (Other Ministries)
20
32. Pre-matric Scholarship Scheme for SC 54.00 54.00 79.00 79.00 79.00 69.00 78.50 0.00 0.00 -100
33. Pre-matric Scholarship Scheme for Back ward classes 27.00 27.00 27.00 27.00 45.00 45.00 45.00 40.00 45.00 0
34.Pre-Matric Scholarship for Minorities 71.90 71.90 180.00 180.00 405.00 405.00 540.00 540.00 810.00 50
35.Girls Hostels for SC 55.00 55.00 56.00 56.00 74.00 74.00 93.00 48.00 93.00 0
36.Boys Hostels for SC 38.00 38.00 39.00 29.00 48.50 38.50 48.00 34.00 48.00 0
37.Other Programmes for welfare of SC 19.67 20.09 20.69 22.64 25.75 24.43 34.40 0.00 0.00 -100
38. Other Programmes for Backward Classes 5.80 6.34 12.47 6.05 16.30 7.54 20.50 0.00 0.00 -100
39.Common Programme - SC, ST & Backward classes 8.00 6.00 8.00 6.00 10.00 14.00 7.00 0.00 0.00 -100
40. Boys and Girls Hostel from Backward classes 31.50 30.25 31.50 26.50 40.00 28.00 40.00 22.00 40.00 0
41.Ashram Schools in Tribal Sub-Plan Area 30.00 30.00 41.00 41.02 75.10 65.00 75.00 75.00 75.00 0
42.Schemes--PMS, Book Bank, etc. (ST) 195.0
0
195.0
0
217.95 216.35 469.93 469.53 573.00 717.78 629.70 9.895288
43. Schemes of Hostel for ST Girls & Boys 61.00 60.00 59.00 59.00 68.00 68.00 68.00 68.00 68.00 0
44. Grant- Rural Sch’l for Dev. Of Playfield NA
45. Incentives- Prom’n of Sports Activities NA
46. Post matric scholarship schemes for SC 731.0
0
622.5
0
735.00 818.56 1675.0
0
1972.2
7
2173.0
0
2404.2
0
1470.0
0
-32.351588
47. Post Matric scholarship schemes for Backward Class 120.7
5
131.9
4
121.50 162.00 315.00 342.00 481.00 483.50 562.00 16.839917
48.Post Matric Scholarship for Minorities 89.90 62.93 135.00 135.00 238.50 238.50 405.00 405.00 450.00 11.111111
49. National Merit scholarships
120.0
0
50. National Programme for Youth & Adolescent
Development
27.00 27.00 25.00 25.00 25.50 28.38 25.50 0.00 0.00 -100
Physical Education Grants to NCC/Public Residential
Schools
0.10 0.10 0.10 0.10 0.00 0.00 -100
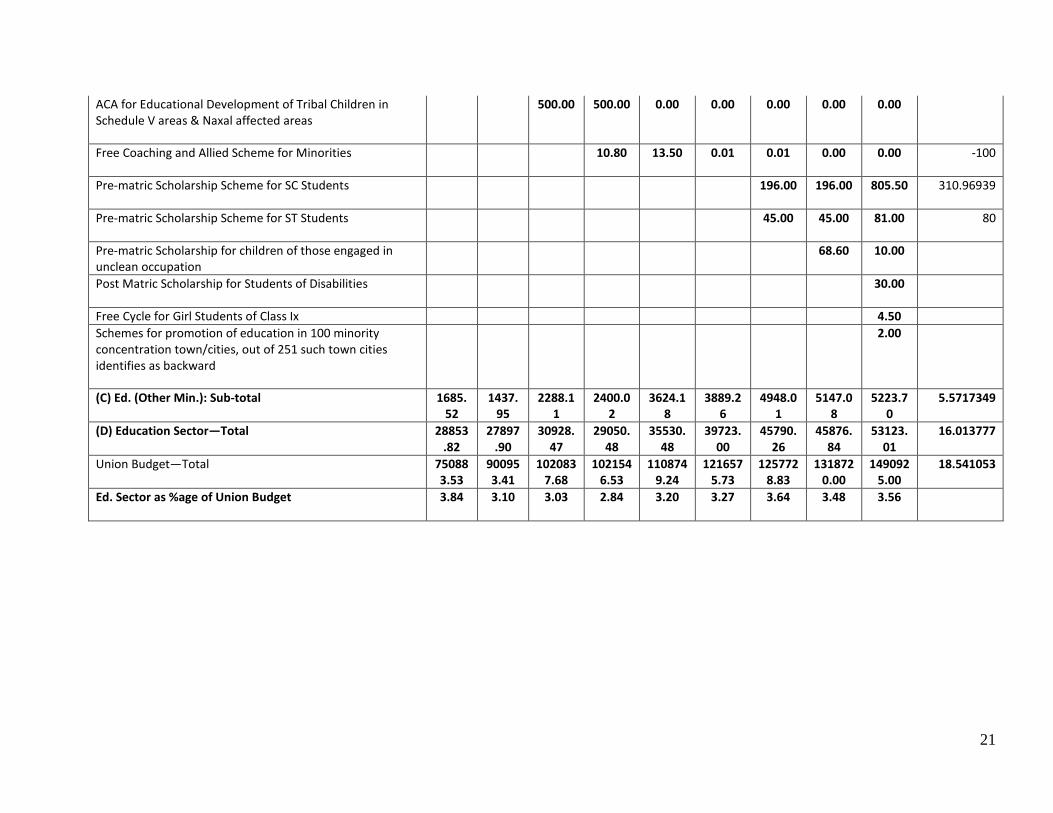
21
ACA for Educational Development of Tribal Children in
Schedule V areas & Naxal affected areas
500.00 500.00 0.00 0.00 0.00 0.00 0.00
Free Coaching and Allied Scheme for Minorities 10.80 13.50 0.01 0.01 0.00 0.00 -100
Pre-matric Scholarship Scheme for SC Students 196.00 196.00 805.50 310.96939
Pre-matric Scholarship Scheme for ST Students 45.00 45.00 81.00 80
Pre-matric Scholarship for children of those engaged in
unclean occupation
68.60 10.00
Post Matric Scholarship for Students of Disabilities 30.00
Free Cycle for Girl Students of Class Ix 4.50
Schemes for promotion of education in 100 minority
concentration town/cities, out of 251 such town cities
identifies as backward
2.00
(C) Ed. (Other Min.): Sub-total 1685.
52
1437.
95
2288.1
1
2400.0
2
3624.1
8
3889.2
6
4948.0
1
5147.0
8
5223.7
0
5.5717349
(D) Education Sector—Total 28853
.82
27897
.90
30928.
47
29050.
48
35530.
48
39723.
00
45790.
26
45876.
84
53123.
01
16.013777
Union Budget—Total 75088
3.53
90095
3.41
102083
7.68
102154
6.53
110874
9.24
121657
5.73
125772
8.83
131872
0.00
149092
5.00
18.541053
Ed. Sector as %age of Union Budget 3.84 3.10 3.03 2.84 3.20 3.27 3.64 3.48 3.56

22