BUDGET DECREASE FROM PROTRACTED RELIEF AND RECOVERY ...
17
1 BUDGET DECREASE FROM PROTRACTED RELIEF AND RECOVERY OPERATION (PRRO) 200532 – BR902 Title of the project “Nutrition Support for children and Women “ Start date: 01 July 2013 End date: 30 June 2015 Reduction period: N/A New end date: N/A Cost (United States dollars) Current Budget Decrease Revised Budget Food Transfer 136,945,056 (46,788,485) 90,156,570 C&V Transfer - - - NATURE OF THE DECREASE 1. The Democratic People’s Republic of Korea (DPRK), with its population of 24.76 million, continues to face challenges in achieving sustained food security and nutrition. According to the International Food Policy Research Institute (IFPRI), DPRK’s Global Hunger Index (GHI) for 2013 was 18.0. While this is an improvement over its GHI in 2009, at 18.4, and GHI in 2010, at 19.4, the country’s hunger level is still considered as significant. 1 2. On 1 July 2013, WFP commenced the implementation of a US$200 million PRRO (200532 Nutrition Support to Children and Women) for two years. The operation is a continuation of the previous PRRO (200114) with nutrition as the main driver. Donor support for humanitarian activities continues to be negatively affected by security and political issues on the Korean Peninsula. As a consequence, WFP’s operation continues to be severely under- funded. While the previous operation, PRRO 200114, faced a shortfall of 43 percent, the current PRRO faces a shortfall of 76 percent (as of 7 May 2014). 3. Given the severe shortage of resources, and subsequent pipeline breaks, WFP attempted to continue reaching vulnerable populations—albeit with significant reductions in rations. Given the severity of resource shortfalls, this strategy is neither desirable nor sustainable. In this context, this budget revision seeks to: 1 IFPRI. 2013. Global Hunger Index. IFPRI Publications: Washington D.C. Cost (United States dollars) Current Budget Decrease /Increase Revised Budget Food and Related Costs 174,740,250 ( 60,103,971) 114,636,279 Cash and Vouchers and Related Costs - - - Capacity Development & Augmentation - - - DSC 12,079,031 1,818,368 13,897,399 ISC 13,077,350 (4,079,992) 8,997,358 Total cost to WFP 199,896,631 ( 62,365,595) 137,531,036
Transcript of BUDGET DECREASE FROM PROTRACTED RELIEF AND RECOVERY ...
1
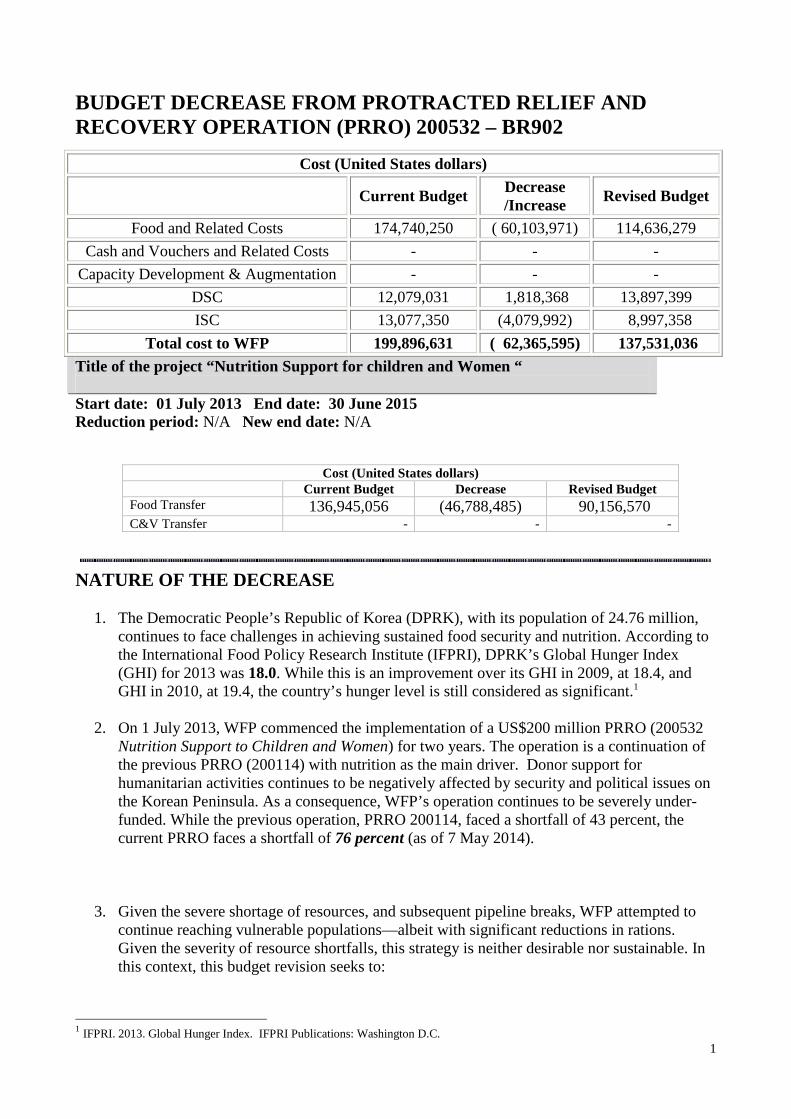
BUDGET DECREASE FROM PROTRACTED RELIEF AND RECOVERY OPERATION (PRRO) 200532 – BR902
Title of the project “Nutrition Support for children and Women “
Start date: 01 July 2013 End date: 30 June 2015 Reduction period: N/A New end date: N/A
Cost (United States dollars) Current Budget Decrease Revised Budget
Food Transfer 136,945,056 (46,788,485) 90,156,570 C&V Transfer - - -
NATURE OF THE DECREASE
1. The Democratic People’s Republic of Korea (DPRK), with its population of 24.76 million, continues to face challenges in achieving sustained food security and nutrition. According to the International Food Policy Research Institute (IFPRI), DPRK’s Global Hunger Index (GHI) for 2013 was 18.0. While this is an improvement over its GHI in 2009, at 18.4, and GHI in 2010, at 19.4, the country’s hunger level is still considered as significant.1
2. On 1 July 2013, WFP commenced the implementation of a US$200 million PRRO (200532 Nutrition Support to Children and Women) for two years. The operation is a continuation of the previous PRRO (200114) with nutrition as the main driver. Donor support for humanitarian activities continues to be negatively affected by security and political issues on the Korean Peninsula. As a consequence, WFP’s operation continues to be severely under-funded. While the previous operation, PRRO 200114, faced a shortfall of 43 percent, the current PRRO faces a shortfall of 76 percent (as of 7 May 2014).
3. Given the severe shortage of resources, and subsequent pipeline breaks, WFP attempted to continue reaching vulnerable populations—albeit with significant reductions in rations. Given the severity of resource shortfalls, this strategy is neither desirable nor sustainable. In this context, this budget revision seeks to:
1 IFPRI. 2013. Global Hunger Index. IFPRI Publications: Washington D.C.
Cost (United States dollars)
Current Budget Decrease /Increase Revised Budget
Food and Related Costs 174,740,250 ( 60,103,971) 114,636,279 Cash and Vouchers and Related Costs - - -
Capacity Development & Augmentation - - - DSC 12,079,031 1,818,368 13,897,399 ISC 13,077,350 (4,079,992) 8,997,358
Total cost to WFP 199,896,631 ( 62,365,595) 137,531,036
2
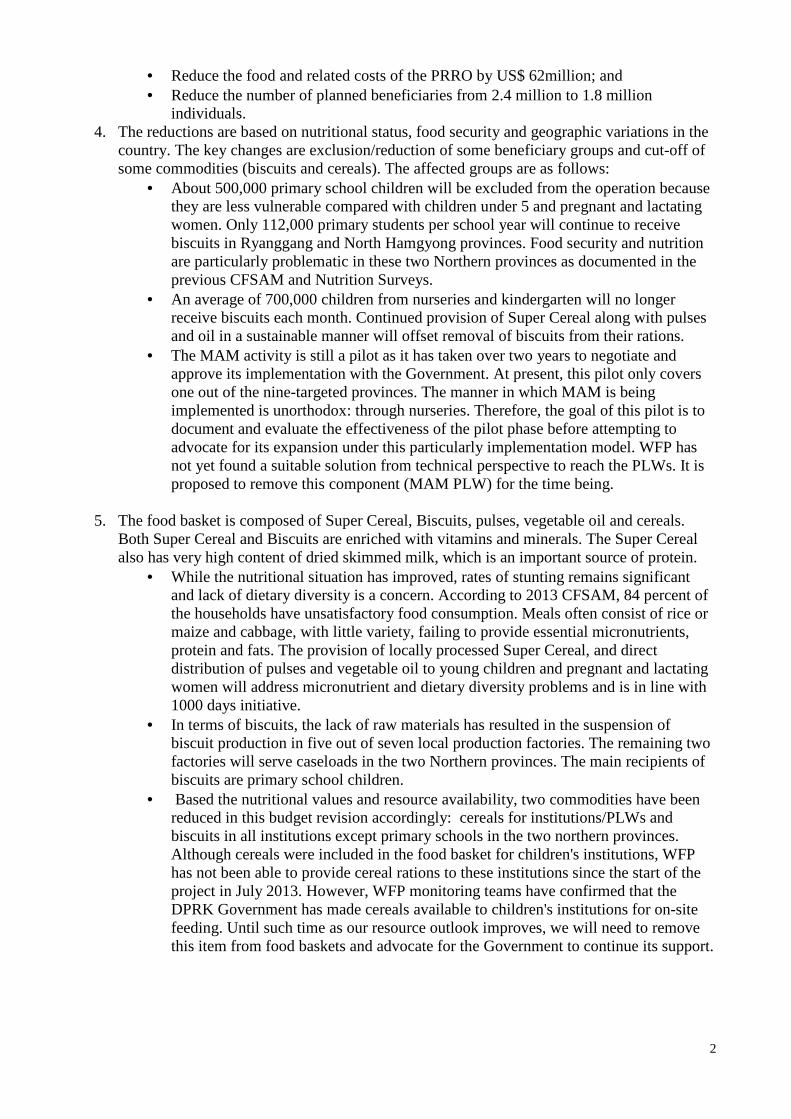
• Reduce the food and related costs of the PRRO by US$ 62million; and • Reduce the number of planned beneficiaries from 2.4 million to 1.8 million
individuals. 4. The reductions are based on nutritional status, food security and geographic variations in the
country. The key changes are exclusion/reduction of some beneficiary groups and cut-off of some commodities (biscuits and cereals). The affected groups are as follows:
• About 500,000 primary school children will be excluded from the operation because they are less vulnerable compared with children under 5 and pregnant and lactating women. Only 112,000 primary students per school year will continue to receive biscuits in Ryanggang and North Hamgyong provinces. Food security and nutrition are particularly problematic in these two Northern provinces as documented in the previous CFSAM and Nutrition Surveys.
• An average of 700,000 children from nurseries and kindergarten will no longer receive biscuits each month. Continued provision of Super Cereal along with pulses and oil in a sustainable manner will offset removal of biscuits from their rations.
• The MAM activity is still a pilot as it has taken over two years to negotiate and approve its implementation with the Government. At present, this pilot only covers one out of the nine-targeted provinces. The manner in which MAM is being implemented is unorthodox: through nurseries. Therefore, the goal of this pilot is to document and evaluate the effectiveness of the pilot phase before attempting to advocate for its expansion under this particularly implementation model. WFP has not yet found a suitable solution from technical perspective to reach the PLWs. It is proposed to remove this component (MAM PLW) for the time being.
5. The food basket is composed of Super Cereal, Biscuits, pulses, vegetable oil and cereals. Both Super Cereal and Biscuits are enriched with vitamins and minerals. The Super Cereal also has very high content of dried skimmed milk, which is an important source of protein.
• While the nutritional situation has improved, rates of stunting remains significant and lack of dietary diversity is a concern. According to 2013 CFSAM, 84 percent of the households have unsatisfactory food consumption. Meals often consist of rice or maize and cabbage, with little variety, failing to provide essential micronutrients, protein and fats. The provision of locally processed Super Cereal, and direct distribution of pulses and vegetable oil to young children and pregnant and lactating women will address micronutrient and dietary diversity problems and is in line with 1000 days initiative.
• In terms of biscuits, the lack of raw materials has resulted in the suspension of biscuit production in five out of seven local production factories. The remaining two factories will serve caseloads in the two Northern provinces. The main recipients of biscuits are primary school children.
• Based the nutritional values and resource availability, two commodities have been reduced in this budget revision accordingly: cereals for institutions/PLWs and biscuits in all institutions except primary schools in the two northern provinces. Although cereals were included in the food basket for children's institutions, WFP has not been able to provide cereal rations to these institutions since the start of the project in July 2013. However, WFP monitoring teams have confirmed that the DPRK Government has made cereals available to children's institutions for on-site feeding. Until such time as our resource outlook improves, we will need to remove this item from food baskets and advocate for the Government to continue its support.
3
JUSTIFICATION FOR BUDGET DECREASE
Summary of Existing Project Activities
6. In agreement with the Government and in line with the United Nations Strategic Framework and Strategic Objective 2 (Support or restore food security and nutrition and establish and rebuild livelihoods in fragile settings and following emergencies), WFP currently implements a two-year PRRO 200532 - “Nutrition Support to Children and Women” which began on July 1, 2013. This project builds on experience from previous operations in DPRK, aims to:
• Reduce hunger and undernutrition among children and women by providing nutrition
support to improve dietary diversity through school and preschool meals and targeted nutrition support;
• Support the Government in reducing hunger and undernutrition through local production of fortified blended food (FBF); and
• Restore and rebuild livelihoods to enhance food security through food for community development (FFCD) interventions.
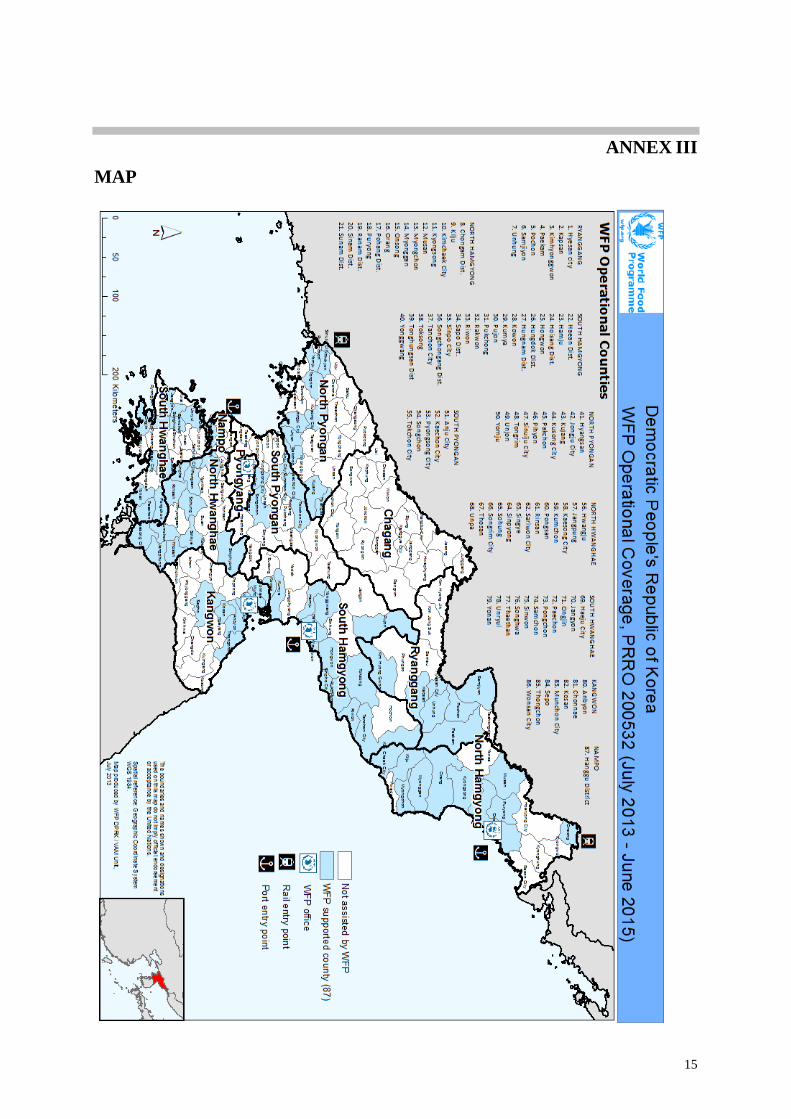
7. In total, 2.4 million children and women in 87 counties located in 9 of the 10 provinces have
been targeted with rations composed of Super Cereals, pulses, oil and cereals – some groups also receive nutritious biscuits in their rations or as the only nutrition transfer. The operation also supports the Government in preparing for and responding to natural disasters.
8. Resource shortfalls have led to critical pipeline breaks in the latter half of 2013 and into
2014—resulting in operational changes and significant challenges in meeting the objectives of the PRRO. The first major change relates to the local production of fortified blended food. In partnership with the DPRK Government, WFP imports the raw materials that are used by 14 factories to produce Super Cereal and fortified biscuits. The latter are then distributed to targeted populations under different activities.
9. In the first quarter of 2014, a total of 5,737mt of fortified food was produced during the
quarter (on average 1,912mt per month). Of this total, 38 percent was fortified biscuits and 62 percent, Super Cereal. Production levels were only 43 percent of the total requirement. As the resource situation has not improved, WFP suspended production of biscuits in five out of seven factories in order to focus on the production of Super Cereal. Current food stocks will allow WFP to produce Super Cereal for distribution until August 2014.
10. Reduced commodity levels have meant that WFP has only reached 68 percent of its planned
caseload for January-March 2014. WFP reached a monthly average of slightly over 1.1 million beneficiaries during this first quarter. Moreover, the rations provided to these beneficiaries were only 30 percent of total entitlements. In some cases, entire caseloads have been dropped. The suspension of biscuit production has removed 500,000 primary school children from receiving WFP’s assistance in all regions except two northern provinces: Ryanggang and North Hamgyong.
11. DPRK is prone to floods (July/August) and drought/dry spells (April-June), which cause
damage to crops. Floods also bring significant damage annually on irrigation infrastructures and have high impact on the population. In collaboration with the Government, WFP initiated five food-for-community-development projects in spring 2014, involving in embankment and river excavation. In the case of localized natural disasters (mainly floods), WFP DPRK responds to the emergency by distributing cereals from the small amount of available stocks replenished usually by the CERF under the Rapid Response window. This
4
year, however, WFP does not have the requisite stocks to respond immediately. Mainly this is due to significant resource shortfalls and will not only affect WFP's ability to respond to natural disasters, but also to the bulk of its beneficiary caseload: women and children who are normally provided with locally produced supercereals and biscuits and complemented with oil and pulses.
12. The planned pilot programme on the treatment of moderate acute malnutrition (MAM) has only partially been implemented; while the recommendations made by 2013 Crop and Food Security Assessment Mission (CFSAM) to switch to rice soya blend product cannot be pursued. The switch to Rice Soya Blend needs big investment in changing the production lines. WFP has no resources for such a change, neither does the Government.
13. Nutrition programmes focused on pregnant and lactating women (PLWs), in particular, have
faced supply problems. PLWs are entitled to receive mixed food (Super Cereal, pulses, and oil) from WFP from the second trimester of pregnancy until 6 months after childbirth, depending on the availability of commodities. In March 2014, PLWs did not receive any rations due to production constraints of Super Cereals and shortages of other commodities such as oil and pulses. In February 2014, only 54 percent of the planned PLW caseload received Super Cereal for, on average, only 23 days.
Purpose of Budget Decrease
14. It is important to acknowledge that the current approach is not sustainable. Continuously cutting rations and reducing number feeding days could compromise the positive achievements made over previous years and have a negative impact on beneficiaries. Given the extent and continuation of the poor funding situation for the operation, a more systematic targeting and further prioritization of the existing resources is warranted.
15. Given the alarming resourcing situation, WFP convened key donors to a meeting in Rome on August 5, 2014 to request additional support and to explain that if funding fails to materialize WFP may have no option other than to suspend its operations in DPRK. The funding situation and future resource outlook will be reviewed by October 15, 2014 to determine the way forward. Meanwhile WFP is preparing a contingency plan for the closure of in-country operations including the use of any remaining stocks and winding down of operations over a period of a few months.
16. This budget revision incorporates a reduction in the number of people to be assisted under
the PRRO from 2.4 million to 1.8 million in 87 counties within 9 provinces for 2014-2015. In turn, an increase in the DSC is required to ensure the appropriate level of oversight needed to ensure that resources be used effectively.
5
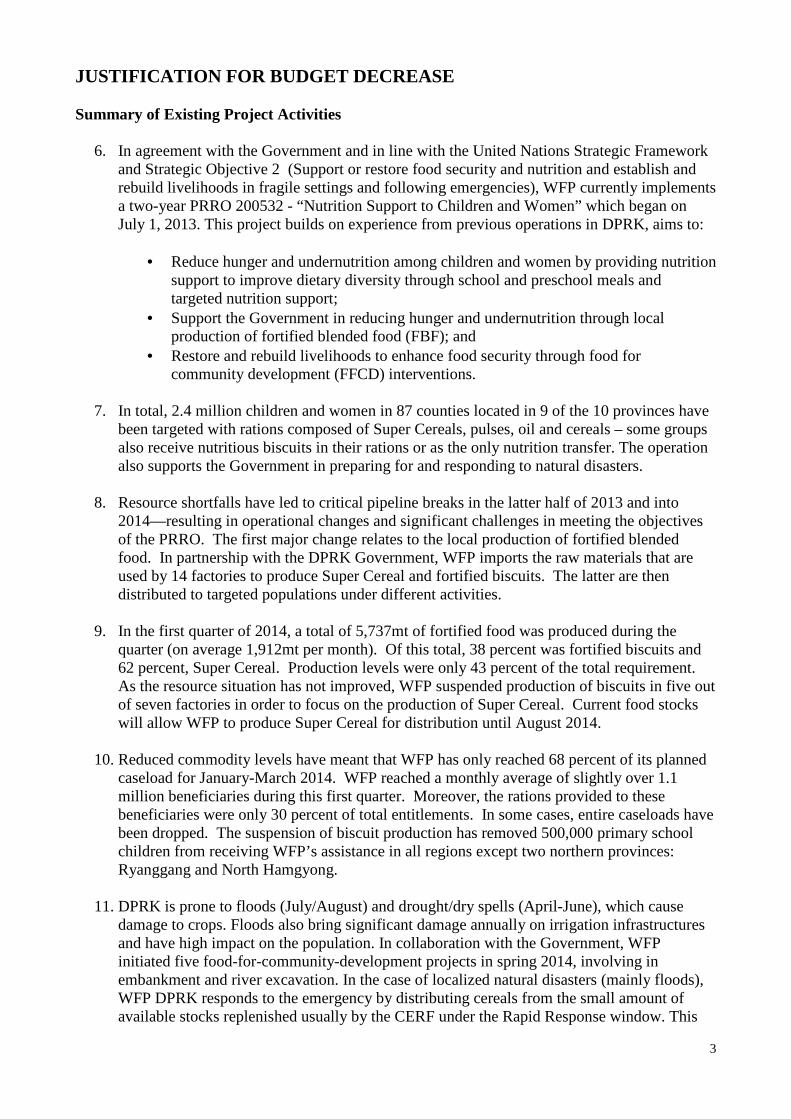
Men/Boys Women/Girls Total Men/Boys Women/Girls Total Men/Boys Women/Girls Total
Infant homes (0-4 years) 2,000 2,000 4,000 0 0 0 2,000 2,000 4,000
Children’s Centers ( 5-6 years) 2,000 2,000 4,000 0 0 0 2,000 2,000 4,000
Boarding schools ( 7-16 years) 4,000 4,000 8,000 0 0 0 4,000 4,000 8,000
Nurseries (6 months-4 years) 385,000 400,000 785,000 0 0 0 385,000 400,000 785,000
Kindergartens (5-6 years) 261,000 271,000 532,000 6,900 7,100 14,000 267,900 278,100 546,000
School meals Primary Schools (7-10 years) 460,000 478,000 938,000 (377 300) (392 700) (770 000) 82,700 85,300 168,000
Targeted Nutrition Support (Prevention)
Pregnant and lactating w omen 490,000 490,000 0 0 0 490,000 490,000
Sick children in hospital ( 6 months-16 years)
56,000 59,000 115,000 0 0 0 56,000 59,000 115,000
Malnorished Children 106,000 110,000 216,000 (88 000) (92 000) (180 000) 18,000 18,000 36,000
Malnorished pregnant and lactating Women
72,000 72,000 (72 000) (72 000) 0 0
FFCD FFCD participants and household memebres
157,000 163,000 320,000 (94 080) (97 920) (192 000) 62,920 65,080 128,000
1,433,000 2,051,000 3,484,000 (552 480) (647 520) (1 200 000) 880,520 1,403,480 2,284,000
944,000 1,449,000 2,393,000 (311 000) (309 000) (620 000) 633,000 1,140,000 1,773,000
Targeted Nutrition Support (Treatement)
TOTAL
Total Ajusted ( excluding overlap)
Activity [or Component] Category of beneficiaries
Current Decrease/ Increase Revised
Pre School meals ( prevention)
TABLE 1: BENEFICIARIES BY ACTIVITY [OR COMPONENT]
* Increased number of kindergarten children according to the updated Global Implementation Plan in 87 operational counties.
TABLE 2: REVISED DAILY FOOD RATION/TRANSFER BY ACTIVITY [OR COMPONENT] (g/person/day)
School and Preschool
meals
Infant homes, Children
Centers,Boarding schools,
School and Preschool meals
Nurseries
School and Preschool meals
Kindergartens
School and Preschool
meals
Primary School
Targeted Nutrition Support
Sick children
Targeted Nutrition Support
Malnourished Children
Targeted Nutrition Support
Pregnant and Lactating Women
FFCD
Revised Revised Revised Revised Revised Revised Revised Revised
CMB/CSM 100 100 100 100 100 100
RMB 100
Biscuits 60
Beans 50 50 50 50 167
Oil 25 25 25 25 56
Cereals 667
TOTAL
Total kcal/day
811 811 811 270 1,198 390 1,572
% kcal from protein
16.7% 16.7% 16.7% 10.7% 16.4% 15.9% 19.5%
% kcal from fat
48% 48% 48% 30% 38% 17% 55.8%
Number of feeding days per year or per month (as
365 300 250 250 365 365 365 120
6
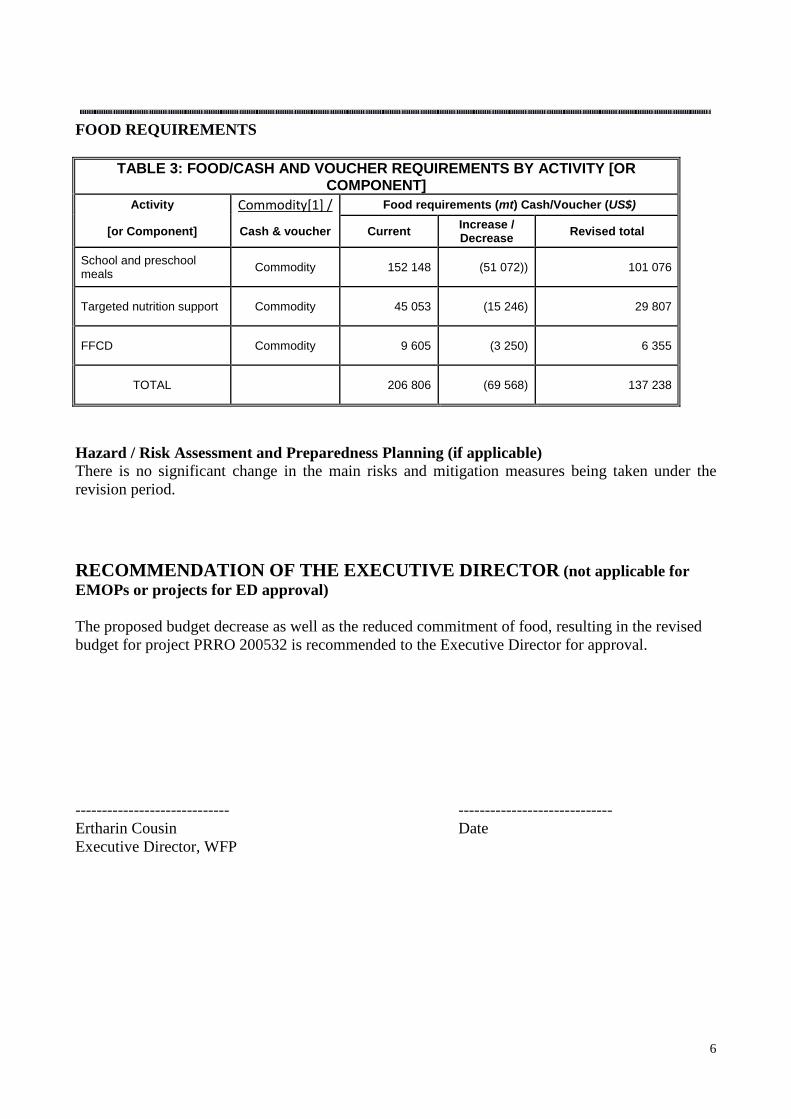
FOOD REQUIREMENTS
TABLE 3: FOOD/CASH AND VOUCHER REQUIREMENTS BY ACTIVITY [OR COMPONENT]
Activity ������������ Food requirements (mt) Cash/Voucher (US$)
[or Component] Cash & voucher Current Increase / Decrease Revised total
School and preschool meals Commodity 152 148 (51 072)) 101 076
Targeted nutrition support Commodity 45 053 (15 246) 29 807
FFCD Commodity 9 605 (3 250) 6 355
TOTAL 206 806 (69 568) 137 238
Hazard / Risk Assessment and Preparedness Planning (if applicable) There is no significant change in the main risks and mitigation measures being taken under the revision period.
RECOMMENDATION OF THE EXECUTIVE DIRECTOR (not applicable for EMOPs or projects for ED approval) The proposed budget decrease as well as the reduced commitment of food, resulting in the revised budget for project PRRO 200532 is recommended to the Executive Director for approval.
----------------------------- ----------------------------- Ertharin Cousin Date Executive Director, WFP
7
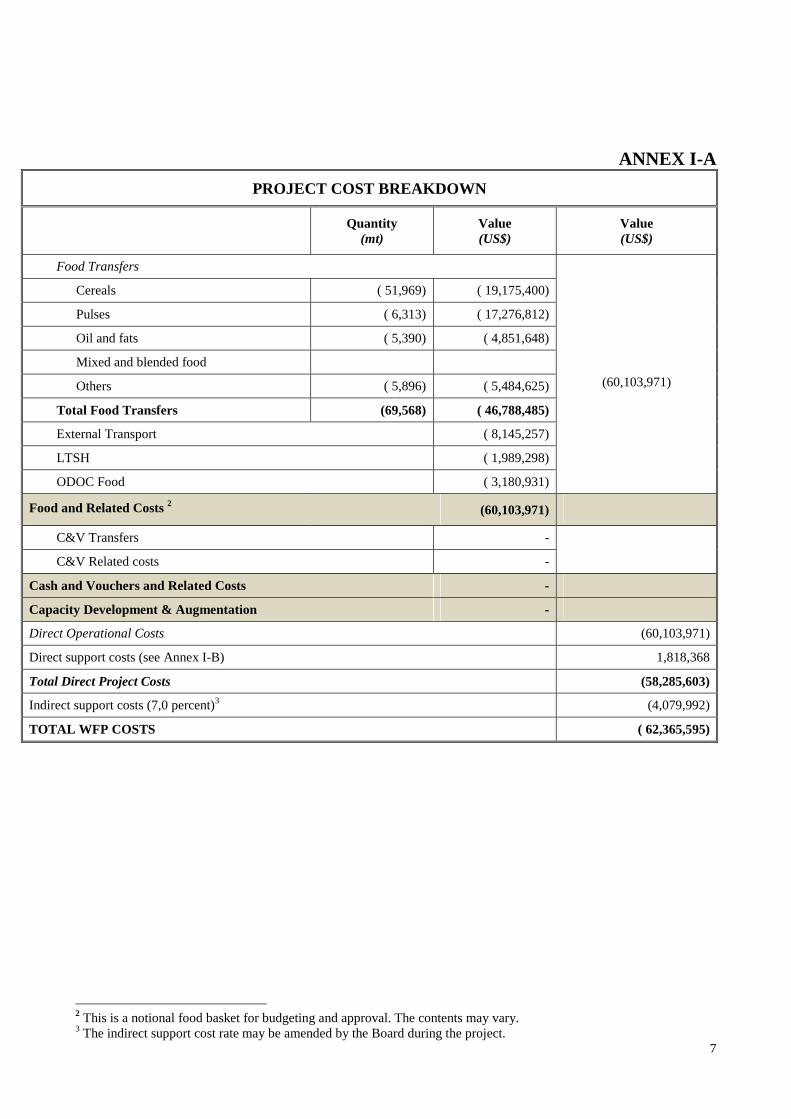
ANNEX I-A PROJECT COST BREAKDOWN
Quantity (mt)
Value (US$)
Value (US$)
Food Transfers
Cereals ( 51,969) ( 19,175,400)
Pulses ( 6,313) ( 17,276,812)
Oil and fats ( 5,390) ( 4,851,648)
Mixed and blended food
Others ( 5,896) ( 5,484,625)
Total Food Transfers (69,568) ( 46,788,485)
External Transport ( 8,145,257)
LTSH ( 1,989,298)
ODOC Food ( 3,180,931)
(60,103,971)
Food and Related Costs 2 (60,103,971)
C&V Transfers -
C&V Related costs -
Cash and Vouchers and Related Costs -
Capacity Development & Augmentation -
Direct Operational Costs (60,103,971)
Direct support costs (see Annex I-B) 1,818,368
Total Direct Project Costs (58,285,603)
Indirect support costs (7,0 percent)3 (4,079,992)
TOTAL WFP COSTS ( 62,365,595)
2 This is a notional food basket for budgeting and approval. The contents may vary. 3 The indirect support cost rate may be amended by the Board during the project.
8
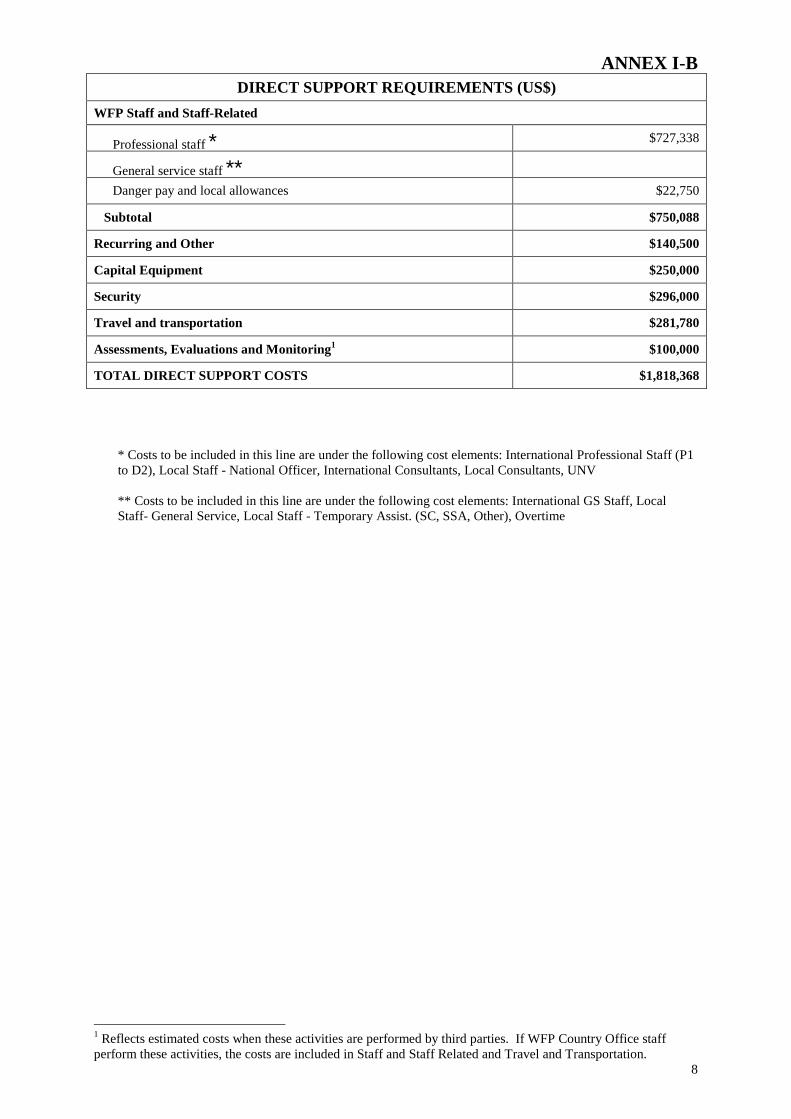
ANNEX I-B
* Costs to be included in this line are under the following cost elements: International Professional Staff (P1 to D2), Local Staff - National Officer, International Consultants, Local Consultants, UNV
** Costs to be included in this line are under the following cost elements: International GS Staff, Local Staff- General Service, Local Staff - Temporary Assist. (SC, SSA, Other), Overtime
1 Reflects estimated costs when these activities are performed by third parties. If WFP Country Office staff perform these activities, the costs are included in Staff and Staff Related and Travel and Transportation.
DIRECT SUPPORT REQUIREMENTS (US$) WFP Staff and Staff-Related
Professional staff * $727,338
General service staff **Danger pay and local allowances $22,750
Subtotal $750,088
Recurring and Other $140,500
Capital Equipment $250,000
Security $296,000
Travel and transportation $281,780
Assessments, Evaluations and Monitoring1 $100,000
TOTAL DIRECT SUPPORT COSTS $1,818,368
9
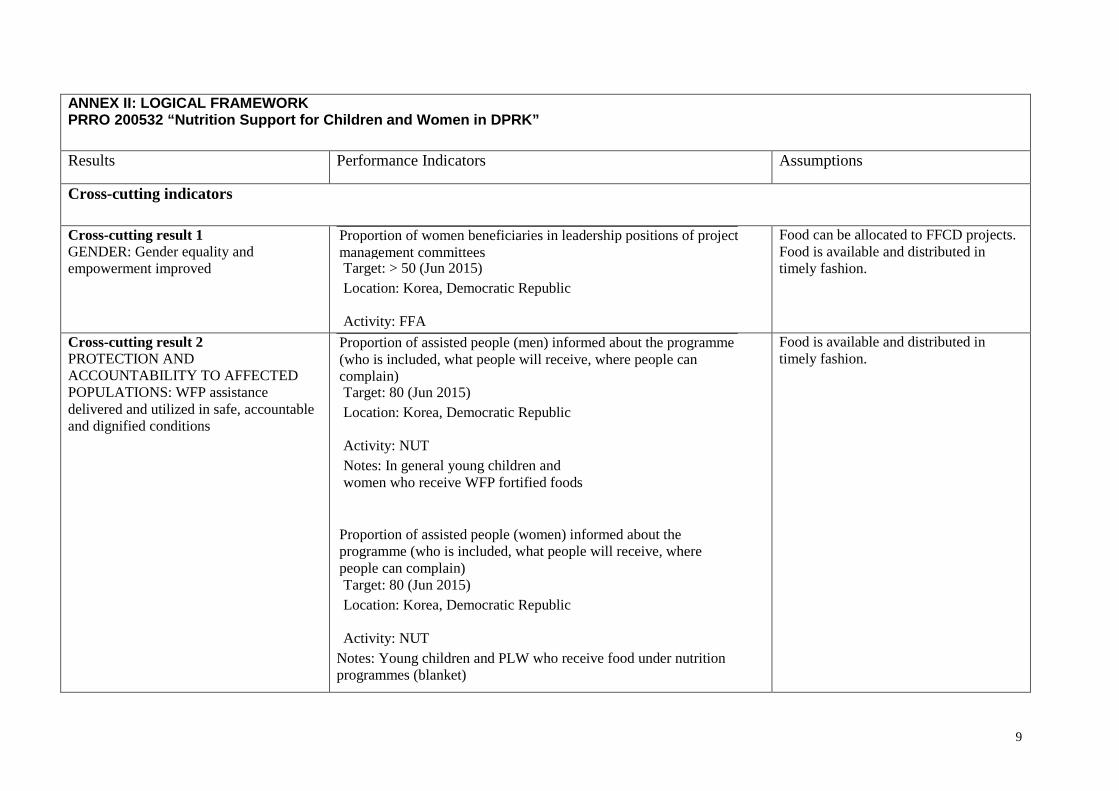
ANNEX II: LOGICAL FRAMEWORKPRRO 200532 “Nutrition Support for Children and Women in DPRK”
Results Performance Indicators Assumptions
Cross-cutting indicators
Cross-cutting result 1GENDER: Gender equality andempowerment improved
Proportion of women beneficiaries in leadership positions of projectmanagement committeesTarget: > 50 (Jun 2015)
i i bliLocation: Korea, Democratic Republic
Activity: FFA
Food can be allocated to FFCD projects.Food is available and distributed intimely fashion.
Cross-cutting result 2PROTECTION ANDACCOUNTABILITY TO AFFECTEDPOPULATIONS: WFP assistancedelivered and utilized in safe, accountableand dignified conditions
Proportion of assisted people (men) informed about the programme(who is included, what people will receive, where people cancomplain)Target: 80 (Jun 2015)Location: Korea, Democratic Republic
Activity: NUTNotes: In general young children andwomen who receive WFP fortified foods
Proportion of assisted people (women) informed about theprogramme (who is included, what people will receive, wherepeople can complain)Target: 80 (Jun 2015)Location: Korea, Democratic Republic
Activity: NUTNotes: Young children and PLW who receive food under nutritionprogrammes (blanket)
Food is available and distributed intimely fashion.
10
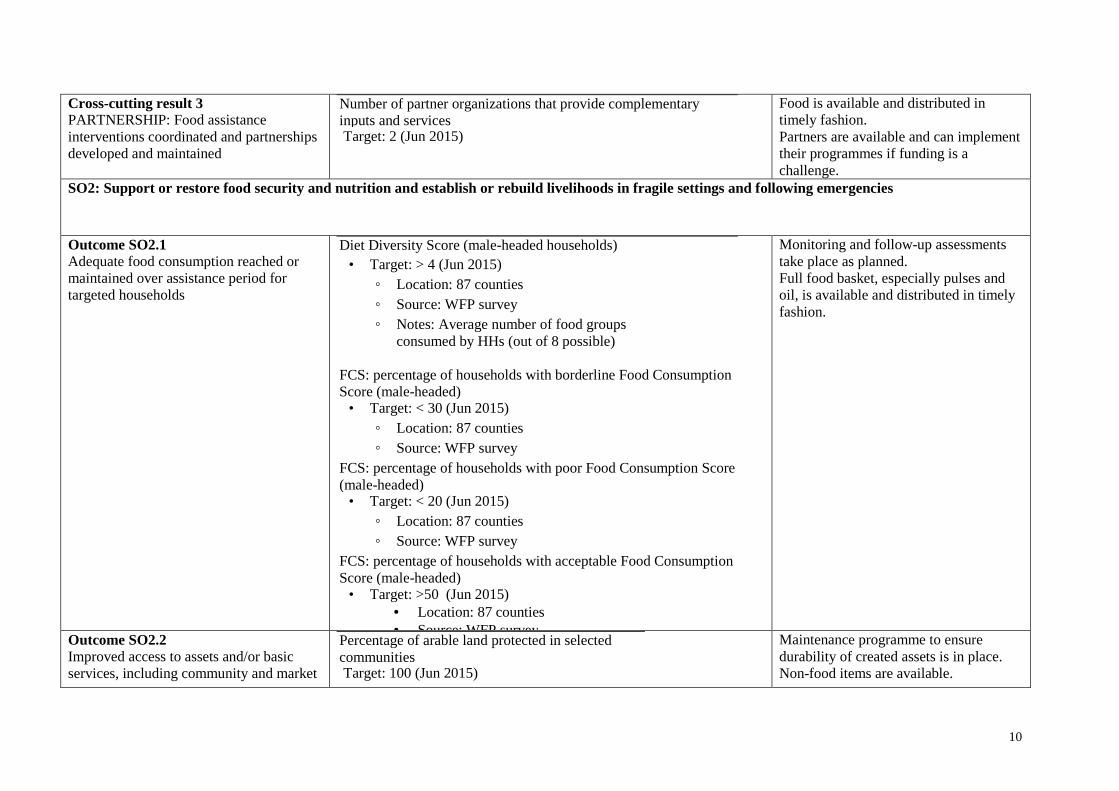
Cross-cutting result 3PARTNERSHIP: Food assistanceinterventions coordinated and partnershipsdeveloped and maintained
Number of partner organizations that provide complementaryinputs and servicesTarget: 2 (Jun 2015)
Food is available and distributed intimely fashion.Partners are available and can implementtheir programmes if funding is achallenge.
SO2: Support or restore food security and nutrition and establish or rebuild livelihoods in fragile settings and following emergencies
Outcome SO2.1Adequate food consumption reached ormaintained over assistance period fortargeted households
Diet Diversity Score (male-headed households)• Target: > 4 (Jun 2015)
◦ Location: 87 counties◦ Source: WFP survey◦ Notes: Average number of food groups
consumed by HHs (out of 8 possible)
FCS: percentage of households with borderline Food ConsumptionScore (male-headed)
• Target: < 30 (Jun 2015)◦ Location: 87 counties◦ Source: WFP survey
FCS: percentage of households with poor Food Consumption Score(male-headed)
• Target: < 20 (Jun 2015)◦ Location: 87 counties◦ Source: WFP survey
FCS: percentage of households with acceptable Food ConsumptionScore (male-headed)
• Target: >50 (Jun 2015)• Location: 87 counties• Source: WFP survey
Monitoring and follow-up assessmentstake place as planned.Full food basket, especially pulses andoil, is available and distributed in timelyfashion.
Outcome SO2.2Improved access to assets and/or basicservices, including community and market
Percentage of arable land protected in selectedcommunitiesTarget: 100 (Jun 2015)
Maintenance programme to ensuredurability of created assets is in place.Non-food items are available.
11
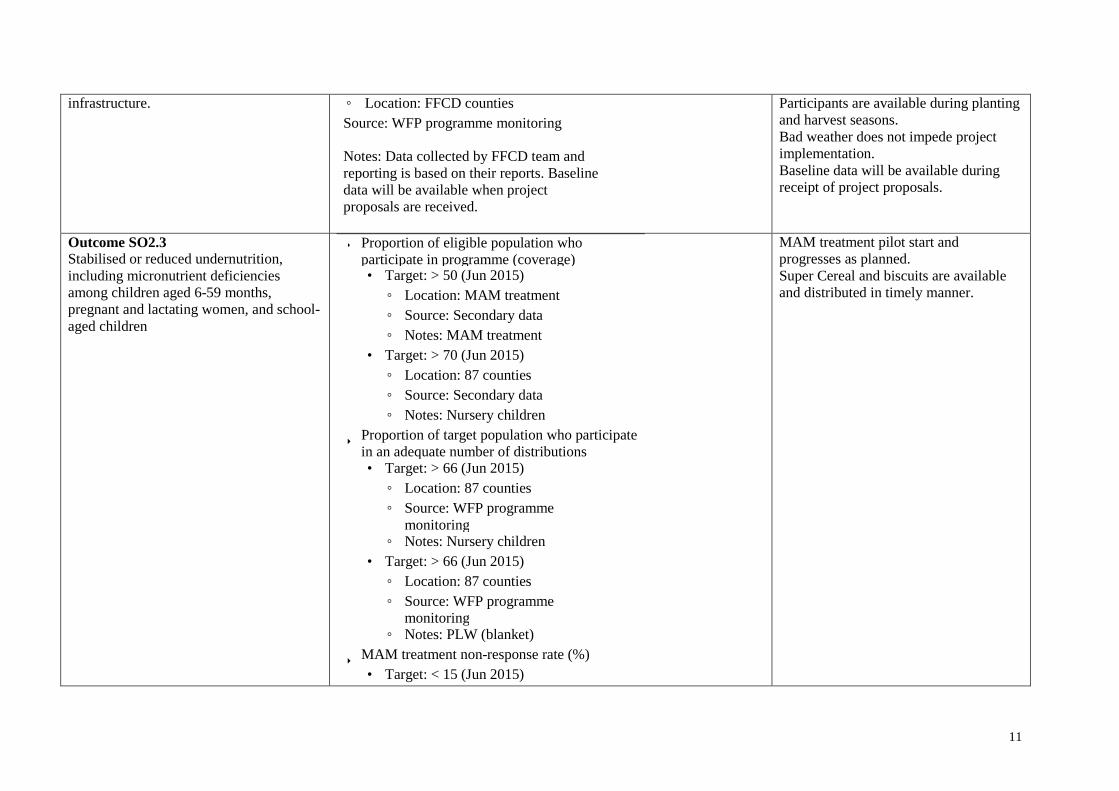
infrastructure. ◦ Location: FFCD countiesSource: WFP programme monitoring
Notes: Data collected by FFCD team andreporting is based on their reports. Baselinedata will be available when projectproposals are received.
Participants are available during plantingand harvest seasons.Bad weather does not impede projectimplementation.Baseline data will be available duringreceipt of project proposals.
Outcome SO2.3Stabilised or reduced undernutrition,including micronutrient deficienciesamong children aged 6-59 months,pregnant and lactating women, and school-aged children
� Proportion of eligible population whoparticipate in programme (coverage)• Target: > 50 (Jun 2015)◦ Location: MAM treatment
i◦ Source: Secondary data◦ Notes: MAM treatment
• Target: > 70 (Jun 2015)◦ Location: 87 counties◦ Source: Secondary data◦ Notes: Nursery children
bl k� Proportion of target population who participatein an adequate number of distributions• Target: > 66 (Jun 2015)◦ Location: 87 counties◦ Source: WFP programme
monitoring◦ Notes: Nursery children
bl k• Target: > 66 (Jun 2015)◦ Location: 87 counties◦ Source: WFP programme
monitoring◦ Notes: PLW (blanket)
� MAM treatment non-response rate (%)• Target: < 15 (Jun 2015)
MAM treatment pilot start andprogresses as planned.Super Cereal and biscuits are availableand distributed in timely manner.
12
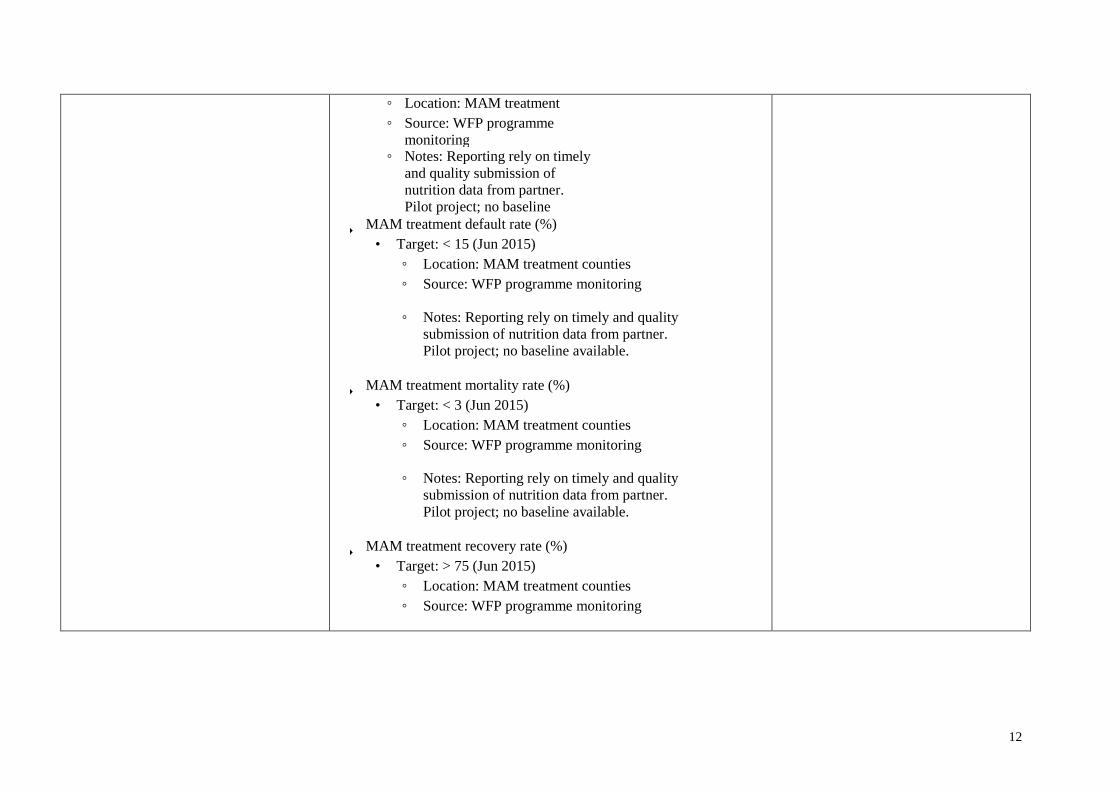
◦ Location: MAM treatmenti◦ Source: WFP programme
monitoring◦ Notes: Reporting rely on timely
and quality submission ofnutrition data from partner.Pilot project; no baseline
� MAM treatment default rate (%)• Target: < 15 (Jun 2015)
◦ Location: MAM treatment counties◦ Source: WFP programme monitoring
◦ Notes: Reporting rely on timely and qualitysubmission of nutrition data from partner.Pilot project; no baseline available.
� MAM treatment mortality rate (%)• Target: < 3 (Jun 2015)
◦ Location: MAM treatment counties◦ Source: WFP programme monitoring
◦ Notes: Reporting rely on timely and qualitysubmission of nutrition data from partner.Pilot project; no baseline available.
� MAM treatment recovery rate (%)• Target: > 75 (Jun 2015)
◦ Location: MAM treatment counties◦ Source: WFP programme monitoring
13
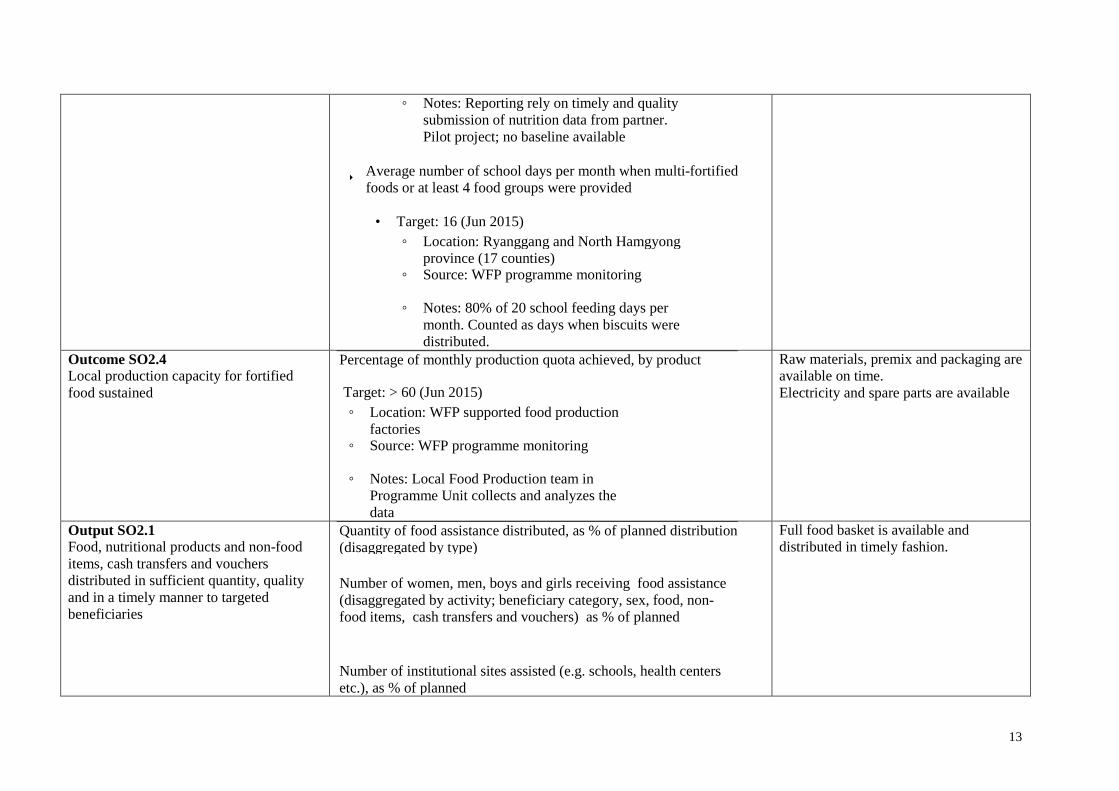
◦ Notes: Reporting rely on timely and qualitysubmission of nutrition data from partner.Pilot project; no baseline available
� Average number of school days per month when multi-fortifiedfoods or at least 4 food groups were provided
• Target: 16 (Jun 2015)◦ Location: Ryanggang and North Hamgyong
province (17 counties)◦ Source: WFP programme monitoring
◦ Notes: 80% of 20 school feeding days permonth. Counted as days when biscuits weredistributed.
Outcome SO2.4Local production capacity for fortifiedfood sustained
Percentage of monthly production quota achieved, by product
Target: > 60 (Jun 2015)◦ Location: WFP supported food production
factories◦ Source: WFP programme monitoring
◦ Notes: Local Food Production team inProgramme Unit collects and analyzes thedata
Raw materials, premix and packaging areavailable on time.Electricity and spare parts are available
Output SO2.1Food, nutritional products and non-fooditems, cash transfers and vouchersdistributed in sufficient quantity, qualityand in a timely manner to targetedbeneficiaries
Quantity of food assistance distributed, as % of planned distribution(disaggregated by type)
Number of women, men, boys and girls receiving food assistance(disaggregated by activity; beneficiary category, sex, food, non-food items, cash transfers and vouchers) as % of planned
Number of institutional sites assisted (e.g. schools, health centersetc.), as % of planned
Full food basket is available anddistributed in timely fashion.
14
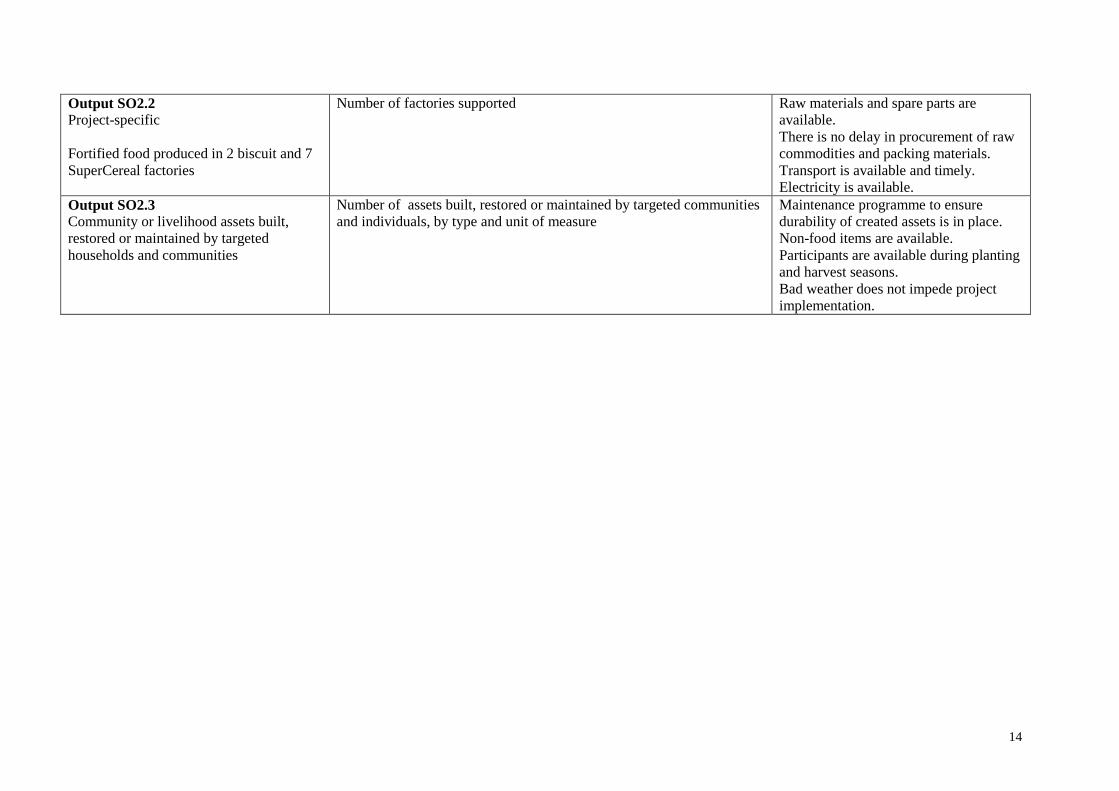
Output SO2.2Project-specific
Fortified food produced in 2 biscuit and 7SuperCereal factories
Number of factories supported Raw materials and spare parts areavailable.There is no delay in procurement of rawcommodities and packing materials.Transport is available and timely.Electricity is available.
Output SO2.3Community or livelihood assets built,restored or maintained by targetedhouseholds and communities
Number of assets built, restored or maintained by targeted communitiesand individuals, by type and unit of measure
Maintenance programme to ensuredurability of created assets is in place.Non-food items are available.Participants are available during plantingand harvest seasons.Bad weather does not impede projectimplementation.
15
ANNEX III MAP

16
17
ANNEX IV – LIST OF ACRONYMS CFSAM Crop and Food Security Assessment Mission CMB Cereal Milk Blend CSB Corn Soya Blend CSM Corn Soya Milk Blend DPRK Democratic People’s Republic of Korea FAO Food and Agriculture Organization of the United Nations FBF Fortified Blended Food FFCD Food for Community Development GHI Global Hunger Index GIP Global Implementation Plan IMR Infant Mortality Rate LFP Local Food Production LOU Letter of Understanding LTSH Landside Transport Storage and Handling MAM Management of Acute Malnutrition MT Metric Tonnes NCC National Coordinating Committee NFI Non Food Items ODOC Other Direct Operational Costs PLW Pregnant and Lactating Women PRRO Protracted Relief and Recovery Operation US$ United States Dollar WFP World Food Programme
ANNEX V - LTSH-matrixANNEX VI - Project Budget PlanANNEX VII - Project Statistics ANNEX VIII - Project Budget Estimate