Budget Brief Ethiopia - UNICEF...This budget brief is focused on analysing the education budget and...
11
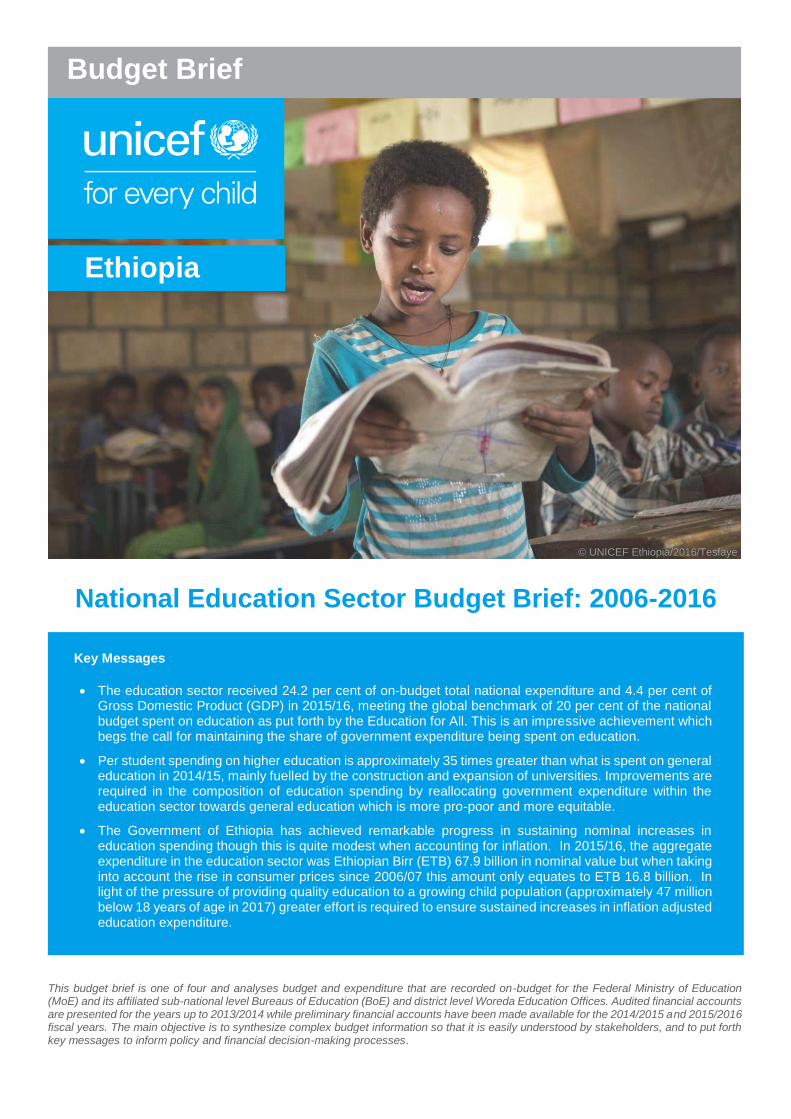
National Education Sector Budget Brief: 2006-2016 This budget brief is one of four and analyses budget and expenditure that are recorded on-budget for the Federal Ministry of Education (MoE) and its affiliated sub-national level Bureaus of Education (BoE) and district level Woreda Education Offices. Audited financial accounts are presented for the years up to 2013/2014 while preliminary financial accounts have been made available for the 2014/2015 and 2015/2016 fiscal years. The main objective is to synthesize complex budget information so that it is easily understood by stakeholders, and to put forth key messages to inform policy and financial decision-making processes. Budget Brief Ethiopia © UNICEF Ethiopia/2016/Tesfaye Key Messages The education sector received 24.2 per cent of on-budget total national expenditure and 4.4 per cent of Gross Domestic Product (GDP) in 2015/16, meeting the global benchmark of 20 per cent of the national budget spent on education as put forth by the Education for All. This is an impressive achievement which begs the call for maintaining the share of government expenditure being spent on education. Per student spending on higher education is approximately 35 times greater than what is spent on general education in 2014/15, mainly fuelled by the construction and expansion of universities. Improvements are required in the composition of education spending by reallocating government expenditure within the education sector towards general education which is more pro-poor and more equitable. The Government of Ethiopia has achieved remarkable progress in sustaining nominal increases in education spending though this is quite modest when accounting for inflation. In 2015/16, the aggregate expenditure in the education sector was Ethiopian Birr (ETB) 67.9 billion in nominal value but when taking into account the rise in consumer prices since 2006/07 this amount only equates to ETB 16.8 billion. In light of the pressure of providing quality education to a growing child population (approximately 47 million below 18 years of age in 2017) greater effort is required to ensure sustained increases in inflation adjusted education expenditure.
Transcript of Budget Brief Ethiopia - UNICEF...This budget brief is focused on analysing the education budget and...
National Education Sector Budget Brief: 2006-2016
This budget brief is one of four and analyses budget and expenditure that are recorded on-budget for the Federal Ministry of Education (MoE) and its affiliated sub-national level Bureaus of Education (BoE) and district level Woreda Education Offices. Audited financial accounts are presented for the years up to 2013/2014 while preliminary financial accounts have been made available for the 2014/2015 and 2015/2016 fiscal years. The main objective is to synthesize complex budget information so that it is easily understood by stakeholders, and to put forth key messages to inform policy and financial decision-making processes.
Budget Brief
Ethiopia
© UNICEF Ethiopia/2016/Tesfaye
Key Messages
The education sector received 24.2 per cent of on-budget total national expenditure and 4.4 per cent of Gross Domestic Product (GDP) in 2015/16, meeting the global benchmark of 20 per cent of the national budget spent on education as put forth by the Education for All. This is an impressive achievement which begs the call for maintaining the share of government expenditure being spent on education.
Per student spending on higher education is approximately 35 times greater than what is spent on general education in 2014/15, mainly fuelled by the construction and expansion of universities. Improvements are required in the composition of education spending by reallocating government expenditure within the education sector towards general education which is more pro-poor and more equitable.
The Government of Ethiopia has achieved remarkable progress in sustaining nominal increases in education spending though this is quite modest when accounting for inflation. In 2015/16, the aggregate expenditure in the education sector was Ethiopian Birr (ETB) 67.9 billion in nominal value but when taking into account the rise in consumer prices since 2006/07 this amount only equates to ETB 16.8 billion. In light of the pressure of providing quality education to a growing child population (approximately 47 million below 18 years of age in 2017) greater effort is required to ensure sustained increases in inflation adjusted education expenditure.

2
Key Messages Continued
National education expenditure is predominantly recurrent expenditure amounting to 62.6 per cent of total education spending on average over the past decade, out of which teachers’ salaries account for the greatest proportion leaving insufficient financing for investments in the other inputs essential for children and young people’s academic success, such as the maintenance of infrastructure, the provision of curriculum materials, teacher development, etc. Improvement in budget allocation needs to be made within the education sector so as to not forsake these essential elements that if unattended to will compromise gains in education outcomes.
Early Childhood Education (ECE) is currently heavily under resourced. Investments in holistic ECE should increase as ECE is a cost-effective way to enhance long term educational outcomes and to reduce educational inequities.
ECE is currently missing as a separate line item in public finance data making it difficult to measure and track how much is being spent on ECE. A separate budget line for ECE should be introduced in the state budget.
Significant financing of the education sector is directed through off-budget channels making it challenging to track and record how much is being spent on education. There is a need to shift off-budget financing of the education sector to on-budget records in order to better track, plan, execute, monitor and direct funding towards sustainable financing of the education sector.
Further evidence generation is required to better understand and document education financing, for example by conducting Public Expenditure Tracking Surveys to assess leakages and wastages in the education sector, which can contribute to additional efficiency gains.
© UNICEF Ethiopia/2013/Ose © UNICEF Ethiopia/2013/Ose
3
1. Overview of the Education Sector
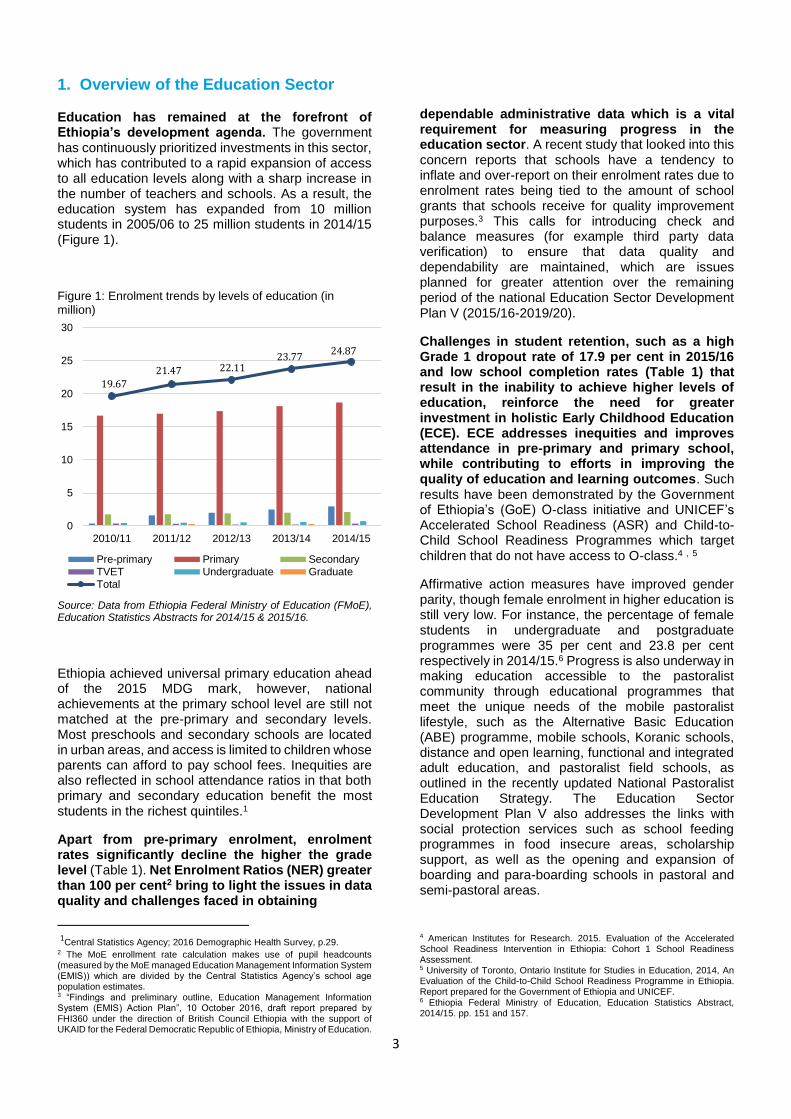
Education has remained at the forefront of Ethiopia’s development agenda. The government has continuously prioritized investments in this sector, which has contributed to a rapid expansion of access to all education levels along with a sharp increase in the number of teachers and schools. As a result, the education system has expanded from 10 million students in 2005/06 to 25 million students in 2014/15 (Figure 1).
Figure 1: Enrolment trends by levels of education (in million)
Source: Data from Ethiopia Federal Ministry of Education (FMoE), Education Statistics Abstracts for 2014/15 & 2015/16.
Ethiopia achieved universal primary education ahead of the 2015 MDG mark, however, national achievements at the primary school level are still not matched at the pre-primary and secondary levels. Most preschools and secondary schools are located in urban areas, and access is limited to children whose parents can afford to pay school fees. Inequities are also reflected in school attendance ratios in that both primary and secondary education benefit the most students in the richest quintiles.1
Apart from pre-primary enrolment, enrolment rates significantly decline the higher the grade level (Table 1). Net Enrolment Ratios (NER) greater than 100 per cent2 bring to light the issues in data quality and challenges faced in obtaining
1Central Statistics Agency; 2016 Demographic Health Survey, p.29.
2 The MoE enrollment rate calculation makes use of pupil headcounts (measured by the MoE managed Education Management Information System (EMIS)) which are divided by the Central Statistics Agency’s school age population estimates. 3 “Findings and preliminary outline, Education Management Information System (EMIS) Action Plan”, 10 October 2016, draft report prepared by FHI360 under the direction of British Council Ethiopia with the support of UKAID for the Federal Democratic Republic of Ethiopia, Ministry of Education.
dependable administrative data which is a vital requirement for measuring progress in the education sector. A recent study that looked into this concern reports that schools have a tendency to inflate and over-report on their enrolment rates due to enrolment rates being tied to the amount of school grants that schools receive for quality improvement purposes.3 This calls for introducing check and balance measures (for example third party data verification) to ensure that data quality and dependability are maintained, which are issues planned for greater attention over the remaining period of the national Education Sector Development Plan V (2015/16-2019/20).
Challenges in student retention, such as a high Grade 1 dropout rate of 17.9 per cent in 2015/16 and low school completion rates (Table 1) that result in the inability to achieve higher levels of education, reinforce the need for greater investment in holistic Early Childhood Education (ECE). ECE addresses inequities and improves attendance in pre-primary and primary school, while contributing to efforts in improving the quality of education and learning outcomes. Such results have been demonstrated by the Government of Ethiopia’s (GoE) O-class initiative and UNICEF’s Accelerated School Readiness (ASR) and Child-to-Child School Readiness Programmes which target children that do not have access to O-class.4 , 5
Affirmative action measures have improved gender parity, though female enrolment in higher education is still very low. For instance, the percentage of female students in undergraduate and postgraduate programmes were 35 per cent and 23.8 per cent respectively in 2014/15.6 Progress is also underway in making education accessible to the pastoralist community through educational programmes that meet the unique needs of the mobile pastoralist lifestyle, such as the Alternative Basic Education (ABE) programme, mobile schools, Koranic schools, distance and open learning, functional and integrated adult education, and pastoralist field schools, as outlined in the recently updated National Pastoralist Education Strategy. The Education Sector Development Plan V also addresses the links with social protection services such as school feeding programmes in food insecure areas, scholarship support, as well as the opening and expansion of boarding and para-boarding schools in pastoral and semi-pastoral areas.
4 American Institutes for Research. 2015. Evaluation of the Accelerated School Readiness Intervention in Ethiopia: Cohort 1 School Readiness Assessment. 5 University of Toronto, Ontario Institute for Studies in Education, 2014, An Evaluation of the Child-to-Child School Readiness Programme in Ethiopia. Report prepared for the Government of Ethiopia and UNICEF. 6 Ethiopia Federal Ministry of Education, Education Statistics Abstract, 2014/15. pp. 151 and 157.
19.6721.47 22.11
23.7724.87
0
5
10
15
20
25
30
2010/11 2011/12 2012/13 2013/14 2014/15
Pre-primary Primary SecondaryTVET Undergraduate GraduateTotal

4
Table 1: Selected education outcome indicators
Key indicators 2009/10 2015/16
(NER) (pre-primary), % 4.8 48.1
NER (Grade (G) 1-4), % Male Female
86.6 88.2 84.9
118.4 123.8 112.9
NER (G5-8), % Male Female
46.4 46.0 46.9
56.7 57.3 56.0
NER (G9-10), % Male Female
16.4 16.8 16.1
23.7 23.0 24.4
NER (G11-12), % Male Female
----- ----- -----
7.4 7.5 7.3
Dropout rate (G1), % 28.1 17.9
Completion rate (G5), % Male Female
75.6 77.5 73.7
71.2 72.8 69.4
Completion rate (G8), % Male Female
47.8 51.0 44.5
54.3 55.3 55.3
Student-Teacher Ratio (G1-8) 51 46
Student-Section Ratio (G1-8) 57 55
Gender Parity Index (GPI), % Primary (G1-8) Lower Secondary (G9-10 Upper Secondary (G11-12)
0.9 0.8
0.56
0.91 0.94 0.87
Source: Ethiopia Federal Ministry of Education; Education Statistics Abstracts for 2014/15 & 2015/16.
Despite noted achievements in access to education, challenges in the quality of education remain. A 2010 study on early grade reading assessment provides findings that there were a significant percentage of illiterate children among children who had attended school for two or three years, and reading comprehension scores were also very low with more than 50 per cent of children in most of the regions under study unable to answer a simple comprehension question.7 Other results from a recent national learning and assessment study show that the national average score for Grade 4 students in four subjects (namely English, reading, mathematics and environmental science) was 44.7 per cent, while the national average score for Grade 8 students in five subjects (namely English, mathematics, physics, chemistry and biology) was 41.1 per cent, both levels scoring less than the minimum expected score of 50 per cent.8
The MoE is addressing quality issues in the education sector through its Second Quality Improvement Programme (GEQIP II), though a long road ahead awaits. This will require huge effort and substantial
7 USAID. 2010. Ethiopia Early Grade Reading Assessment. Data Analysis Report: Language and Early Learning.
financial investments to effectively address concerns in the quality of education.
2. National Education Spending
This budget brief is focused on analysing the education budget and expenditures that are recorded on-budget and reported by MoFEC. The education sector accounts for the largest proportion of the GoE’s spending at 24.2 per cent of total expenditure in 2015/16 reflecting the strong commitment of the GoE to educational development (Figure 2). However, it should be noted that due to linkages across sectors, spending in sectors such as health and road construction (especially rural roads) has spillover effects that positively affect education outcomes. For instance, healthier children are more likely to have higher school attendance rates, while rural roads facilitate access to education services.
8 National Educational Assessment and Examinations Agency. November
2016. Ethiopian Fifth National Learning Assessment of Grades Four and
Eight Students. First Draft.
Box 1: Policy and strategy documents for education
Growth and Transformation Plan, GTP-II, (2015/16-2019/20) which builds on former national development plans such as GTP-I (2010/11-2014/15).
National Education and Training Policy, 1994.
Education Sector Development Plan V (2015/16-2019/20), which builds on four former Education Sector Development Plans (ESDPs) implemented between 1997/98 and 2014/15.
National Pastoralist Education Strategy, 2008 and updated and validated in 2016.
National Quality Minimum Service Standards for Primary Schools.
National Girls’ Education and Gender Equality Strategy, 2013.
Code of Conduct on School-Related Gender Based Violence (SRGBV), 2013.
Education Sector Knowledge Management Strategy, 2015.
Communications for Development (C4D) in Education Strategy, 2015.
National Social Protection Strategy, 2016 (2016-2019).
National Social Protection Action Plan, 2017, (2017-2021), Regional Social Protection Action Plans for Amhara, Oromia, SNNP and Tigray regions.
5
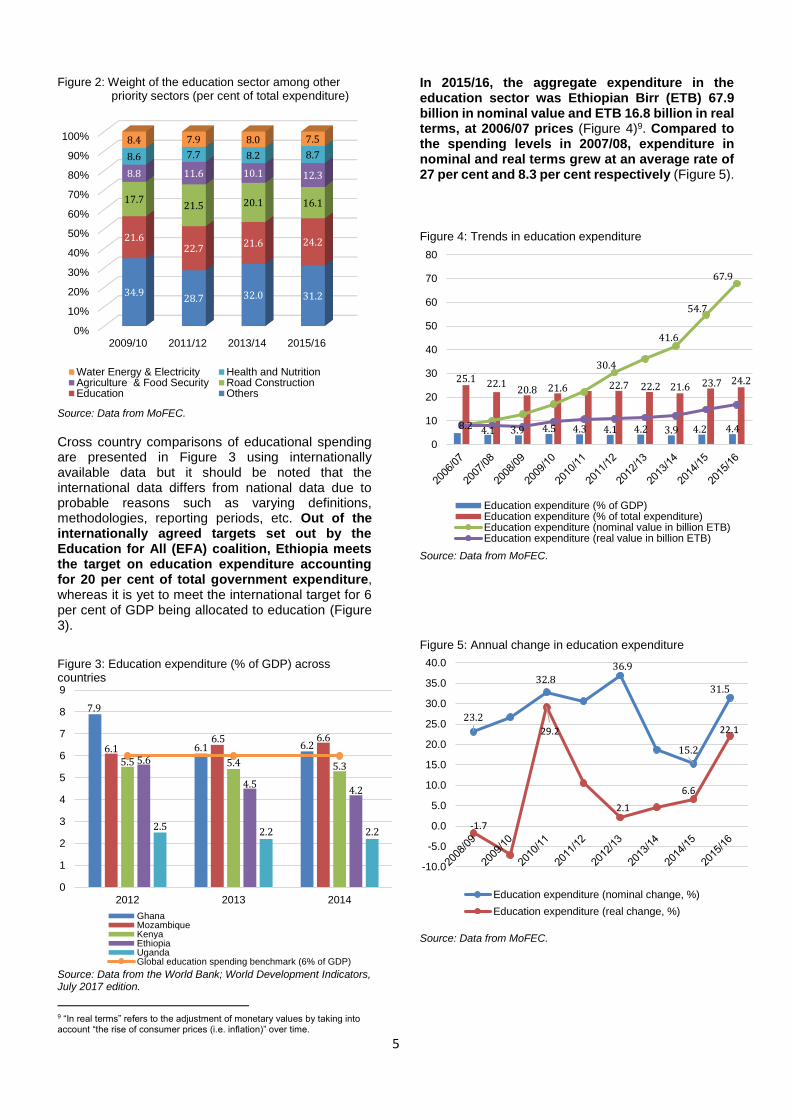
Figure 2: Weight of the education sector among other priority sectors (per cent of total expenditure)
Source: Data from MoFEC.
Cross country comparisons of educational spending are presented in Figure 3 using internationally available data but it should be noted that the international data differs from national data due to probable reasons such as varying definitions, methodologies, reporting periods, etc. Out of the internationally agreed targets set out by the Education for All (EFA) coalition, Ethiopia meets the target on education expenditure accounting for 20 per cent of total government expenditure, whereas it is yet to meet the international target for 6 per cent of GDP being allocated to education (Figure 3).
Figure 3: Education expenditure (% of GDP) across countries
Source: Data from the World Bank; World Development Indicators, July 2017 edition.
9 “In real terms” refers to the adjustment of monetary values by taking into account “the rise of consumer prices (i.e. inflation)” over time.
In 2015/16, the aggregate expenditure in the education sector was Ethiopian Birr (ETB) 67.9 billion in nominal value and ETB 16.8 billion in real terms, at 2006/07 prices (Figure 4)9. Compared to the spending levels in 2007/08, expenditure in nominal and real terms grew at an average rate of 27 per cent and 8.3 per cent respectively (Figure 5).
Figure 4: Trends in education expenditure
Source: Data from MoFEC.
Figure 5: Annual change in education expenditure
Source: Data from MoFEC.
0%
10%
20%
30%
40%
50%
60%
70%
80%
90%
100%
2009/10 2011/12 2013/14 2015/16
34.928.7 32.0 31.2
21.622.7
21.6 24.2
17.721.5 20.1 16.1
8.8 11.6 10.1 12.3
8.6 7.7 8.2 8.7
8.4 7.9 8.0 7.5
Water Energy & Electricity Health and NutritionAgriculture & Food Security Road ConstructionEducation Others
7.9
6.1 6.26.16.5 6.6
5.5 5.4 5.35.6
4.54.2
2.52.2 2.2
0
1
2
3
4
5
6
7
8
9
2012 2013 2014
GhanaMozambiqueKenyaEthiopiaUgandaGlobal education spending benchmark (6% of GDP)
4.1 3.9 4.5 4.3 4.1 4.2 3.9 4.2 4.4
25.1 22.120.8 21.6 22.7 22.2 21.6 23.7 24.2
8.2
30.4
41.6
54.7
67.9
0
10
20
30
40
50
60
70
80
Education expenditure (% of GDP)Education expenditure (% of total expenditure)Education expenditure (nominal value in billion ETB)Education expenditure (real value in billion ETB)
23.2
32.836.9
15.2
31.5
-1.7
29.2
2.1
6.6
22.1
-10.0
-5.0
0.0
5.0
10.0
15.0
20.0
25.0
30.0
35.0
40.0
Education expenditure (nominal change, %)
Education expenditure (real change, %)
6
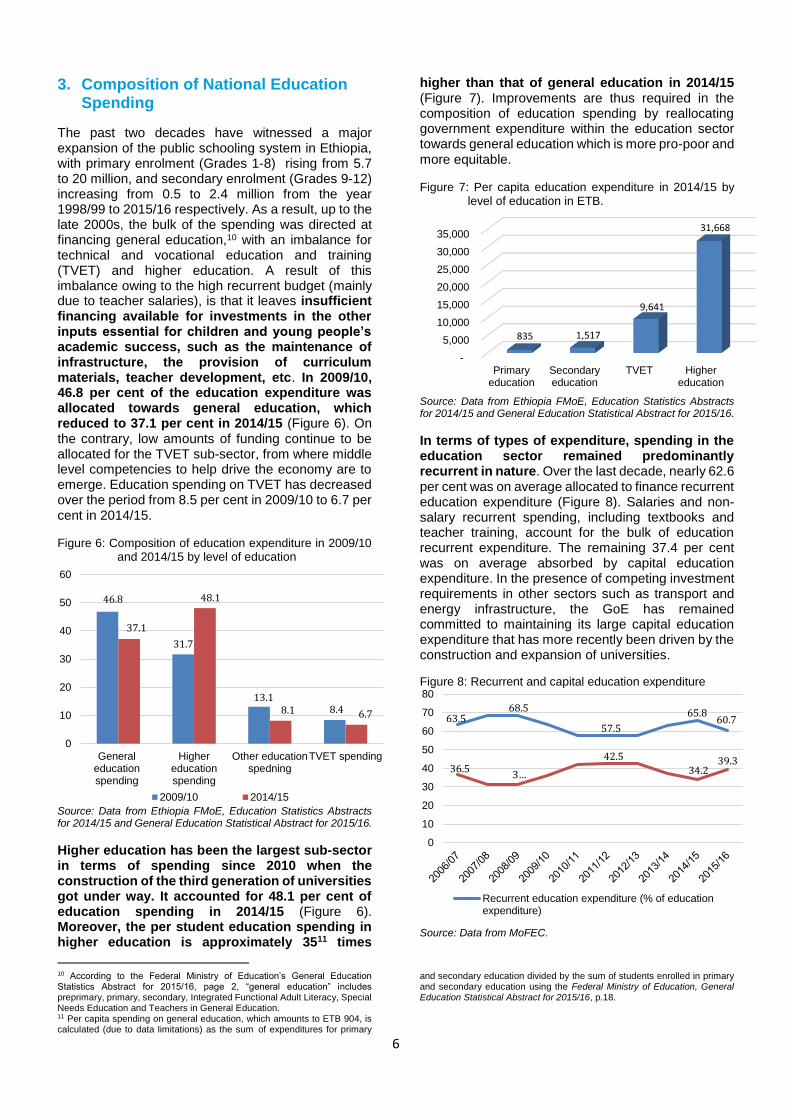
3. Composition of National Education Spending
The past two decades have witnessed a major expansion of the public schooling system in Ethiopia, with primary enrolment (Grades 1-8) rising from 5.7 to 20 million, and secondary enrolment (Grades 9-12) increasing from 0.5 to 2.4 million from the year 1998/99 to 2015/16 respectively. As a result, up to the late 2000s, the bulk of the spending was directed at financing general education,10 with an imbalance for technical and vocational education and training (TVET) and higher education. A result of this imbalance owing to the high recurrent budget (mainly due to teacher salaries), is that it leaves insufficient financing available for investments in the other inputs essential for children and young people’s academic success, such as the maintenance of infrastructure, the provision of curriculum materials, teacher development, etc. In 2009/10, 46.8 per cent of the education expenditure was allocated towards general education, which reduced to 37.1 per cent in 2014/15 (Figure 6). On the contrary, low amounts of funding continue to be allocated for the TVET sub-sector, from where middle level competencies to help drive the economy are to emerge. Education spending on TVET has decreased over the period from 8.5 per cent in 2009/10 to 6.7 per cent in 2014/15.
Figure 6: Composition of education expenditure in 2009/10 and 2014/15 by level of education
Source: Data from Ethiopia FMoE, Education Statistics Abstracts for 2014/15 and General Education Statistical Abstract for 2015/16.
Higher education has been the largest sub-sector in terms of spending since 2010 when the construction of the third generation of universities got under way. It accounted for 48.1 per cent of education spending in 2014/15 (Figure 6). Moreover, the per student education spending in higher education is approximately 3511 times
10 According to the Federal Ministry of Education’s General Education Statistics Abstract for 2015/16, page 2, “general education” includes preprimary, primary, secondary, Integrated Functional Adult Literacy, Special Needs Education and Teachers in General Education. 11 Per capita spending on general education, which amounts to ETB 904, is calculated (due to data limitations) as the sum of expenditures for primary
higher than that of general education in 2014/15 (Figure 7). Improvements are thus required in the composition of education spending by reallocating government expenditure within the education sector towards general education which is more pro-poor and more equitable.
Figure 7: Per capita education expenditure in 2014/15 by level of education in ETB.
Source: Data from Ethiopia FMoE, Education Statistics Abstracts for 2014/15 and General Education Statistical Abstract for 2015/16.
In terms of types of expenditure, spending in the education sector remained predominantly recurrent in nature. Over the last decade, nearly 62.6 per cent was on average allocated to finance recurrent education expenditure (Figure 8). Salaries and non-salary recurrent spending, including textbooks and teacher training, account for the bulk of education recurrent expenditure. The remaining 37.4 per cent was on average absorbed by capital education expenditure. In the presence of competing investment requirements in other sectors such as transport and energy infrastructure, the GoE has remained committed to maintaining its large capital education expenditure that has more recently been driven by the construction and expansion of universities.
Figure 8: Recurrent and capital education expenditure
Source: Data from MoFEC.
and secondary education divided by the sum of students enrolled in primary and secondary education using the Federal Ministry of Education, General Education Statistical Abstract for 2015/16, p.18.
46.8
31.7
13.18.4
37.1
48.1
8.1 6.7
0
10
20
30
40
50
60
Generaleducationspending
Highereducationspending
Other educationspedning
TVET spending
2009/10 2014/15
-
5,000
10,000
15,000
20,000
25,000
30,000
35,000
Primaryeducation
Secondaryeducation
TVET Highereducation
835 1,517
9,641
31,668
63.568.5
57.5
65.860.7
36.53…
42.5
34.239.3
0
10
20
30
40
50
60
70
80
Recurrent education expenditure (% of educationexpenditure)

7
Following fiscal decentralization in Ethiopia, regional and local governments undertake planning and resource mobilization for the education sector. As a result, over the last decade, more than half of the national education spending was administered by regional and local governments (Figure 9). This demonstrates the government’s effort in promoting universal access to primary education at the grassroots level, and the implementation of targeted interventions to close the existing regional, gender and urban-rural enrolment differentials to achieve universal primary education across the board. Improvements in access to primary schools with innovations such as mobile schools are helping to reach disadvantaged groups and children living in remote rural areas.
Figure 9: Federal versus regional education expenditure (% of total education expenditure)
Source: Data from MoFEC.
At the federal level, nearly 64 per cent of the federal education expenditure is directed to finance capital education expenditure (Figure 10). And approximately 19 per cent of the federal education capital expenditure is financed from external sources and allocated for the construction and expansion of higher education. This is due to the fact that the construction and expansion of universities is the responsibility of the federal Government while regional governments are responsible for the management of lower tier education sub-sectors.
Figure 10: Federal recurrent and capital education expenditure (% of federal education expenditure)
Source: Data from MoFEC.
At the regional level however the composition is different. The bulk of regional governments’ education expenditure is allocated to finance recurrent education expenditure (Figure 11). Salaries, textbooks and teachers’ training account for a substantial part of regional recurrent education spending, while capital spending at the regional level has stagnated, reflecting the policy to mobilize communities’ contribution for primary school construction and expansion.
Figure 11: Regional recurrent and capital education expenditure (% of regional education spending)
Source: Data from MoFEC.
40.8
53.0
59.2
47.0
40
45
50
55
60
Federal education expenditure
Regional education expenditure
74.562.6 62.7 67 68.9 67.7 64.9 59.8 54.1 59.7
25.537.4 37.3 33 31.1 32.3 35.1 40.2 45.9 40.3
0%
10%
20%
30%
40%
50%
60%
70%
80%
90%
100%
Federal recurrent education expenditure
Federal capital education expenditure
92.1 90.1 91.8 87.5 86.3 83.6 80.5 83.7 84.2 83.8
7.9 9.9 8.2 12.5 13.7 16.4 19.5 16.3 15.8 16.2
0%
10%
20%
30%
40%
50%
60%
70%
80%
90%
100%
Regional capital education expenditure
Regional recurrent education expenditure

8
4. Budget Execution Rates
In Ethiopia, the education sector budget execution rate (measured as actual expenditure as a per cent of adjusted budget) has been rising in recent years, though gaps remain (Table 2). Budget execution rates greater than 100 per cent may signify challenges in the unpredictability of external aid. The gaps in budget execution can be partially explained either by absorptive capacity or allocative efficiency issues, or both, which warrants further investigation. Efficiency gains can be improved by enhancing sector coordination and planning, addressing the quality and capacity of the education sector workforce as well as the quality of education service delivery to reduce wastage and optimally utilize current expenditures on the education sector. Further evidence generation to better understand and document education financing, for example by conducting Public Expenditure Tracking Surveys to assess leakages and wastages in the education sector, can contribute to additional efficiency gains.
Table 2: Federal government education expenditure
execution rate (per cent)
2006/07
2008/09
2010/11
2012/13
2013/14
2014/ 15
Total education spending
84.5
71.9
117
89.5
88.3
95.4
Recurrent education spending
86.5
92.5
90.3
94.5
94
96.1
Capital education spending
83.8
63.5
135
87
84.8
94.9
Source: Data from MoFEC (information for sub-national levels of government has not been made available). Note: Percentages greater than 100 per cent may signify challenges in the unpredictability of external aid.
5. Sources of Education Sector Financing
The national education system is financed through domestic funds from the state budget, external funds received from bilateral and multilateral donors, private sector investments and household contributions. A portion of external financing to the education sector is directed through off-budget channels, the amounts of which are challenging to track. Hence this budget brief is limited to analysing on-budget finances, and leaves out significant financial resources channelled to the education sector through off-budget donor resources, private sector investments and households’ contributions. Information on the sources of on-budget education sector financing has been made available only for federal capital expenditures. Regarding on-budget
financing, domestic resources cover the majority of the federal education capital expenditure, while donor contributions (on-budget) to the federal Government capital education expenditure have been rising from ETB 0.5 billion in 2006/07 to ETB 3.4 billion in 2012/13 and amounting to ETB 1.9 billion in 2014/15 (Figure 12).
Figure 12: Sources of federal capital education expenditure (in billion Birr)
Source: Data from MoFEC.
2.1 2 2.9 4.2
6.4
8.18.5
10.7
12.3
0.5 0.6
0.470.8
1.6
2.43.4
1.1
1.9
0
2
4
6
8
10
12
14
16
External source
Domestic source
Federal capital education expenditure (real value)
9
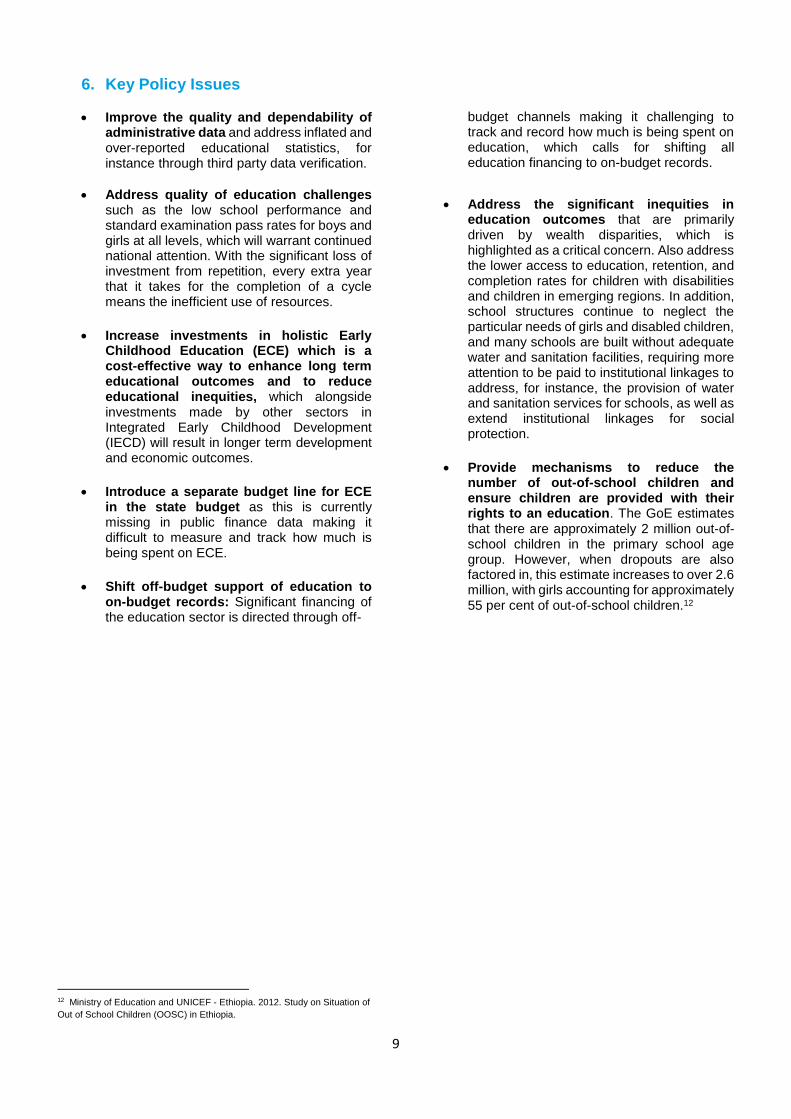
6. Key Policy Issues
Improve the quality and dependability of administrative data and address inflated and over-reported educational statistics, for instance through third party data verification.
Address quality of education challenges such as the low school performance and standard examination pass rates for boys and girls at all levels, which will warrant continued national attention. With the significant loss of investment from repetition, every extra year that it takes for the completion of a cycle means the inefficient use of resources.
Increase investments in holistic Early Childhood Education (ECE) which is a cost-effective way to enhance long term educational outcomes and to reduce educational inequities, which alongside investments made by other sectors in Integrated Early Childhood Development (IECD) will result in longer term development and economic outcomes.
Introduce a separate budget line for ECE in the state budget as this is currently missing in public finance data making it difficult to measure and track how much is being spent on ECE.
Shift off-budget support of education to on-budget records: Significant financing of the education sector is directed through off-
budget channels making it challenging to track and record how much is being spent on education, which calls for shifting all education financing to on-budget records.
Address the significant inequities in education outcomes that are primarily driven by wealth disparities, which is highlighted as a critical concern. Also address the lower access to education, retention, and completion rates for children with disabilities and children in emerging regions. In addition, school structures continue to neglect the particular needs of girls and disabled children, and many schools are built without adequate water and sanitation facilities, requiring more attention to be paid to institutional linkages to address, for instance, the provision of water and sanitation services for schools, as well as extend institutional linkages for social protection.
Provide mechanisms to reduce the number of out-of-school children and ensure children are provided with their rights to an education. The GoE estimates that there are approximately 2 million out-of-school children in the primary school age group. However, when dropouts are also factored in, this estimate increases to over 2.6 million, with girls accounting for approximately 55 per cent of out-of-school children.12
12 Ministry of Education and UNICEF - Ethiopia. 2012. Study on Situation of
Out of School Children (OOSC) in Ethiopia.
10
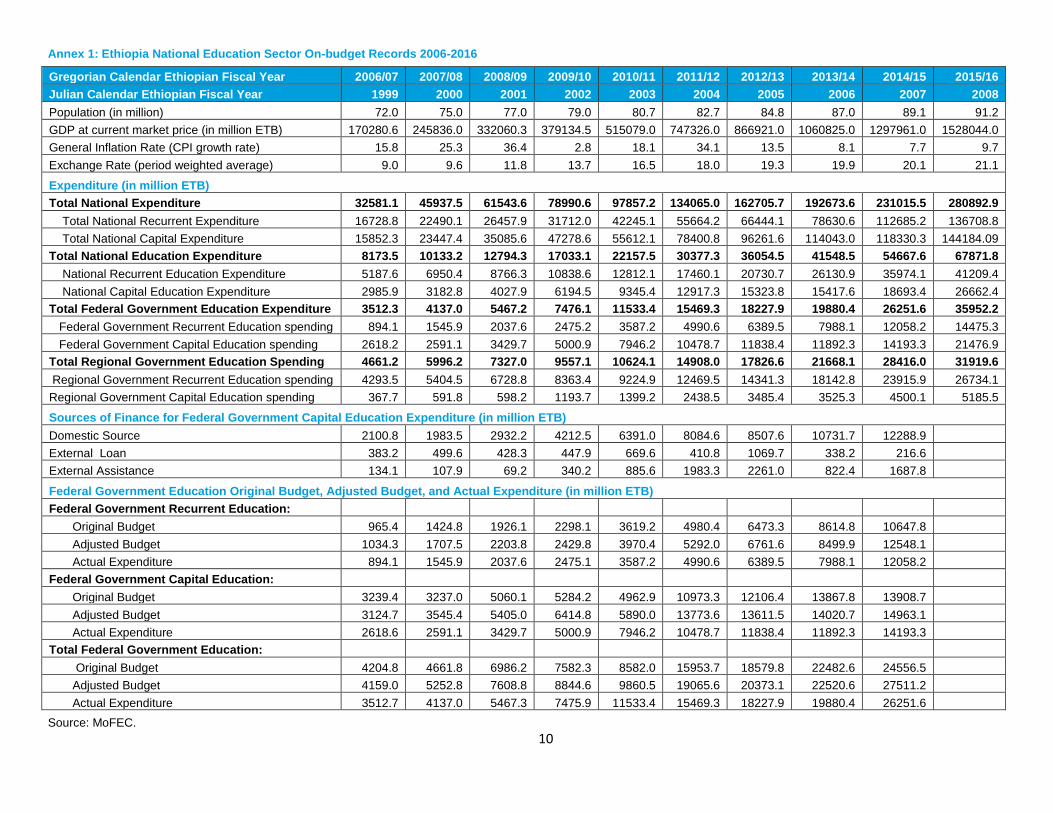
Annex 1: Ethiopia National Education Sector On-budget Records 2006-2016
Gregorian Calendar Ethiopian Fiscal Year 2006/07 2007/08 2008/09 2009/10 2010/11 2011/12 2012/13 2013/14 2014/15 2015/16
Julian Calendar Ethiopian Fiscal Year 1999 2000 2001 2002 2003 2004 2005 2006 2007 2008
Population (in million) 72.0 75.0 77.0 79.0 80.7 82.7 84.8 87.0 89.1 91.2
GDP at current market price (in million ETB) 170280.6 245836.0 332060.3 379134.5 515079.0 747326.0 866921.0 1060825.0 1297961.0 1528044.0
General Inflation Rate (CPI growth rate) 15.8 25.3 36.4 2.8 18.1 34.1 13.5 8.1 7.7 9.7
Exchange Rate (period weighted average) 9.0 9.6 11.8 13.7 16.5 18.0 19.3 19.9 20.1 21.1
Expenditure (in million ETB)
Total National Expenditure 32581.1 45937.5 61543.6 78990.6 97857.2 134065.0 162705.7 192673.6 231015.5 280892.9
Total National Recurrent Expenditure 16728.8 22490.1 26457.9 31712.0 42245.1 55664.2 66444.1 78630.6 112685.2 136708.8
Total National Capital Expenditure 15852.3 23447.4 35085.6 47278.6 55612.1 78400.8 96261.6 114043.0 118330.3 144184.09
Total National Education Expenditure 8173.5 10133.2 12794.3 17033.1 22157.5 30377.3 36054.5 41548.5 54667.6 67871.8
National Recurrent Education Expenditure 5187.6 6950.4 8766.3 10838.6 12812.1 17460.1 20730.7 26130.9 35974.1 41209.4
National Capital Education Expenditure 2985.9 3182.8 4027.9 6194.5 9345.4 12917.3 15323.8 15417.6 18693.4 26662.4
Total Federal Government Education Expenditure 3512.3 4137.0 5467.2 7476.1 11533.4 15469.3 18227.9 19880.4 26251.6 35952.2
Federal Government Recurrent Education spending 894.1 1545.9 2037.6 2475.2 3587.2 4990.6 6389.5 7988.1 12058.2 14475.3
Federal Government Capital Education spending 2618.2 2591.1 3429.7 5000.9 7946.2 10478.7 11838.4 11892.3 14193.3 21476.9
Total Regional Government Education Spending 4661.2 5996.2 7327.0 9557.1 10624.1 14908.0 17826.6 21668.1 28416.0 31919.6
Regional Government Recurrent Education spending 4293.5 5404.5 6728.8 8363.4 9224.9 12469.5 14341.3 18142.8 23915.9 26734.1
Regional Government Capital Education spending 367.7 591.8 598.2 1193.7 1399.2 2438.5 3485.4 3525.3 4500.1 5185.5
Sources of Finance for Federal Government Capital Education Expenditure (in million ETB)
Domestic Source 2100.8 1983.5 2932.2 4212.5 6391.0 8084.6 8507.6 10731.7 12288.9
External Loan 383.2 499.6 428.3 447.9 669.6 410.8 1069.7 338.2 216.6
External Assistance 134.1 107.9 69.2 340.2 885.6 1983.3 2261.0 822.4 1687.8
Federal Government Education Original Budget, Adjusted Budget, and Actual Expenditure (in million ETB)
Federal Government Recurrent Education:
Original Budget 965.4 1424.8 1926.1 2298.1 3619.2 4980.4 6473.3 8614.8 10647.8
Adjusted Budget 1034.3 1707.5 2203.8 2429.8 3970.4 5292.0 6761.6 8499.9 12548.1
Actual Expenditure 894.1 1545.9 2037.6 2475.1 3587.2 4990.6 6389.5 7988.1 12058.2
Federal Government Capital Education:
Original Budget 3239.4 3237.0 5060.1 5284.2 4962.9 10973.3 12106.4 13867.8 13908.7
Adjusted Budget 3124.7 3545.4 5405.0 6414.8 5890.0 13773.6 13611.5 14020.7 14963.1
Actual Expenditure 2618.6 2591.1 3429.7 5000.9 7946.2 10478.7 11838.4 11892.3 14193.3
Total Federal Government Education:
Original Budget 4204.8 4661.8 6986.2 7582.3 8582.0 15953.7 18579.8 22482.6 24556.5
Adjusted Budget 4159.0 5252.8 7608.8 8844.6 9860.5 19065.6 20373.1 22520.6 27511.2
Actual Expenditure 3512.7 4137.0 5467.3 7475.9 11533.4 15469.3 18227.9 19880.4 26251.6
Source: MoFEC.
11
This budget brief was written by Zeleka Paulos (Social Policy Specialist, UNICEF Ethiopia) and Ademe Zeyede
(Consultant, UNICEF Ethiopia) under the guidance of Remy Pigois (Chief Social Policy and Evidence for Social
Inclusion, UNICEF Ethiopia). The content has benefited from information and documentation provided by
Shumye Molla (Education Specialist, UNICEF Ethiopia). The provision of MoFEC budget and expenditure data
and explanations presented for MoFEC data related questions by Ato Fantahun Belew (Technical Expert,
MoFEC) is highly appreciated. This budget brief has been reviewed by Emmanuelle Abrioux (Chief of Education,
UNICEF Ethiopia), Jean Dupraz (Social Policy Regional Adviser, Eastern and Southern Africa Regional Office
(ESARO)) and Matthew Cummins (Social Policy Specialist, ESARO).
© United Nations Children’s Fund (UNICEF), Ethiopia 2017 Permission is required to reproduce any part of this publication. Permission will be freely granted to educational or non-profit organizations. To request permission and for any other information on the publication, please contact: UNICEF Ethiopia P.O. Box 1169, Addis Ababa, Ethiopia Telephone: +251 11 518 4000 E-mail: [email protected]
© UNICEF Ethiopia/2014/Ose