![Japan Pharma Outlook 2027 · Launch portfolio will add $11.4bn over 2017-27 [JPN] Core and expiry portfolio will lose $4.8bn over 2017-27 [JPN] Japan Pharma: Global Revenue Growth](https://static.fdocuments.net/doc/165x107/5ed1683e103edb27a1224f84/japan-pharma-outlook-2027-launch-portfolio-will-add-114bn-over-2017-27-jpn-core.jpg)
Budget Allocation for a Successful Bio-Pharma Product Launch
23
Page | 1 Winning Necessary Resources for a Successful Product Launch Best Practices, LLC Strategic Benchmarking Research & Analysis
-
Upload
best-practices-llc -
Category
Marketing
-
view
249 -
download
2
Transcript of Budget Allocation for a Successful Bio-Pharma Product Launch

Page | 1
Winning Necessary Resources for a Successful Product Launch
Best Practices, LLC Strategic Benchmarking Research & Analysis

Page | 2
Executive Summary
Page | 3
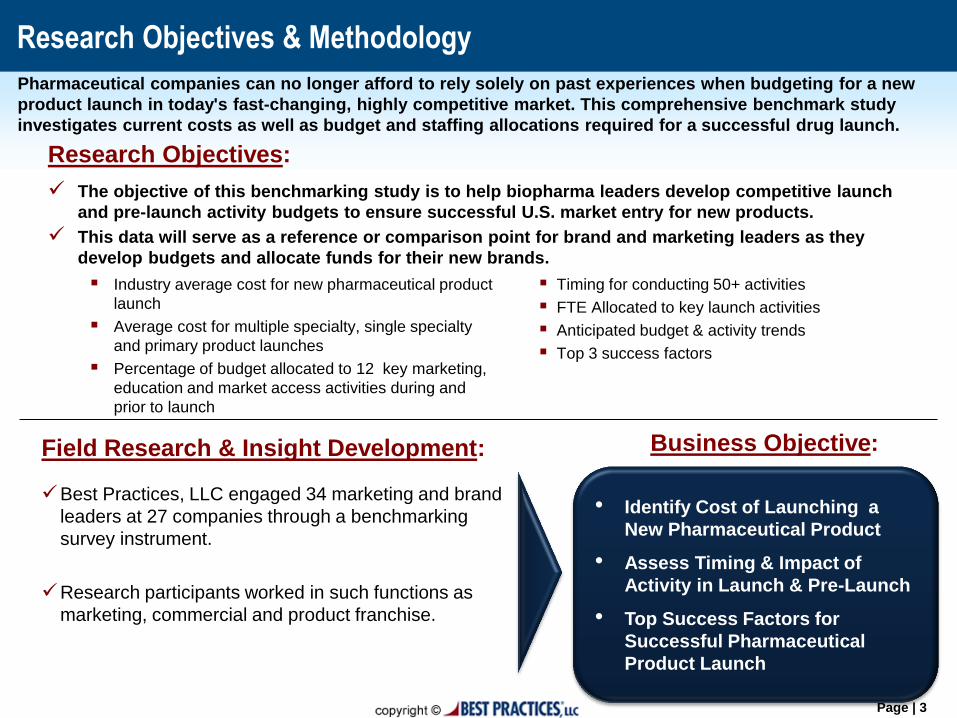
Field Research & Insight Development:
Best Practices, LLC engaged 34 marketing and brand
leaders at 27 companies through a benchmarking
survey instrument.
Research participants worked in such functions as
marketing, commercial and product franchise.
• Identify Cost of Launching a
New Pharmaceutical Product
• Assess Timing & Impact of
Activity in Launch & Pre-Launch
• Top Success Factors for
Successful Pharmaceutical
Product Launch
Research Objectives & Methodology
Research Objectives:
The objective of this benchmarking study is to help biopharma leaders develop competitive launch
and pre-launch activity budgets to ensure successful U.S. market entry for new products.
This data will serve as a reference or comparison point for brand and marketing leaders as they
develop budgets and allocate funds for their new brands.
Business Objective:
Pharmaceutical companies can no longer afford to rely solely on past experiences when budgeting for a new
product launch in today's fast-changing, highly competitive market. This comprehensive benchmark study
investigates current costs as well as budget and staffing allocations required for a successful drug launch.
Timing for conducting 50+ activities
FTE Allocated to key launch activities
Anticipated budget & activity trends
Top 3 success factors
Industry average cost for new pharmaceutical product
launch
Average cost for multiple specialty, single specialty
and primary product launches
Percentage of budget allocated to 12 key marketing,
education and market access activities during and
prior to launch
Page | 4
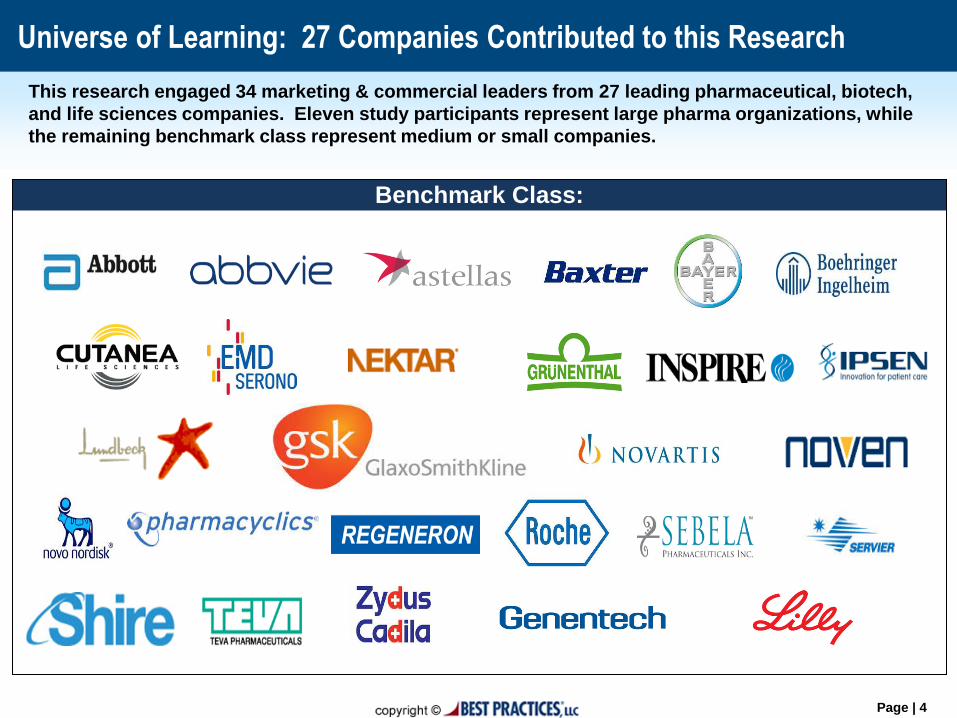
Universe of Learning: 27 Companies Contributed to this Research
This research engaged 34 marketing & commercial leaders from 27 leading pharmaceutical, biotech,
and life sciences companies. Eleven study participants represent large pharma organizations, while
the remaining benchmark class represent medium or small companies.
Benchmark Class:
Page | 5
Executive VP /Vice
President
Senior Director
Director
Manager
Others
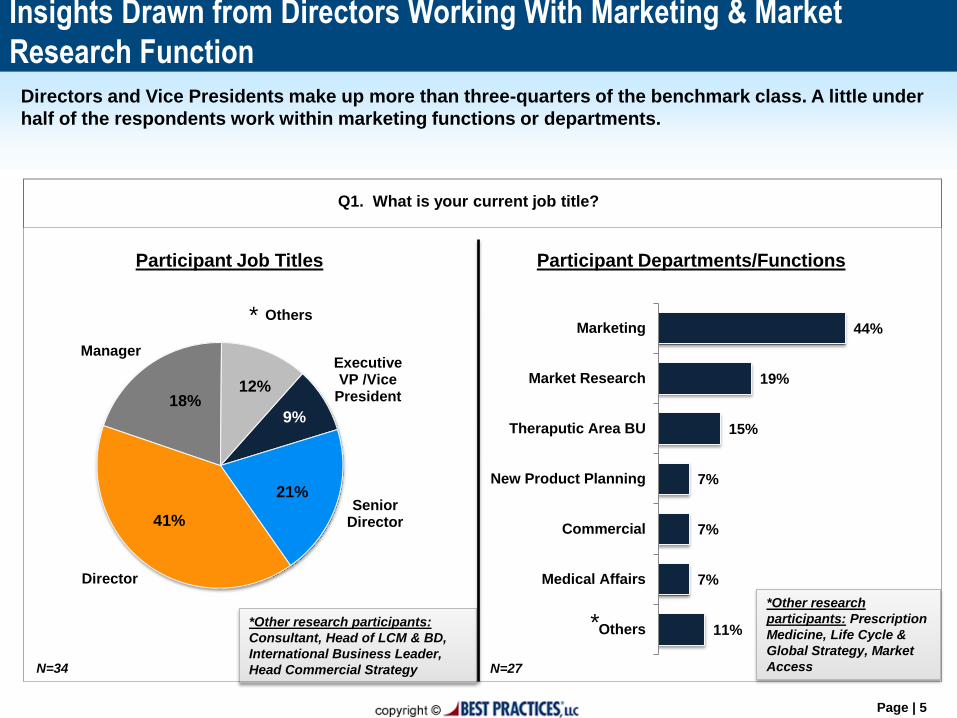
Directors and Vice Presidents make up more than three-quarters of the benchmark class. A little under
half of the respondents work within marketing functions or departments.
Insights Drawn from Directors Working With Marketing & Market
Research Function
Q1. What is your current job title?
N=34
*Other research participants:
Consultant, Head of LCM & BD,
International Business Leader,
Head Commercial Strategy
*
Participant Job Titles Participant Departments/Functions
11%
7%
7%
7%
15%
19%
44%
Others
Medical Affairs
Commercial
New Product Planning
Theraputic Area BU
Market Research
Marketing
* *Other research
participants: Prescription
Medicine, Life Cycle &
Global Strategy, Market
Access N=27
41%
18%
21%
12%
9%

Page | 6
Launch Investment
Benchmarks
Research Protocol for Participants
Focus all responses on a single product launched recently into the U.S. market.
Provide total investment for launch activities during four budget years leading up to launch.
Total investment is defined as: The total U.S. investment for pre-launch/launch activities in a given budget year. Includes all resources invested in promotional (marketing), educational and market access activities. Excludes only clinical trial costs.
Launch Year: The budget year in which the product was launched.
Launch Years -1, -2 and -3: The budget years one, two and three years
prior to the Launch Year.
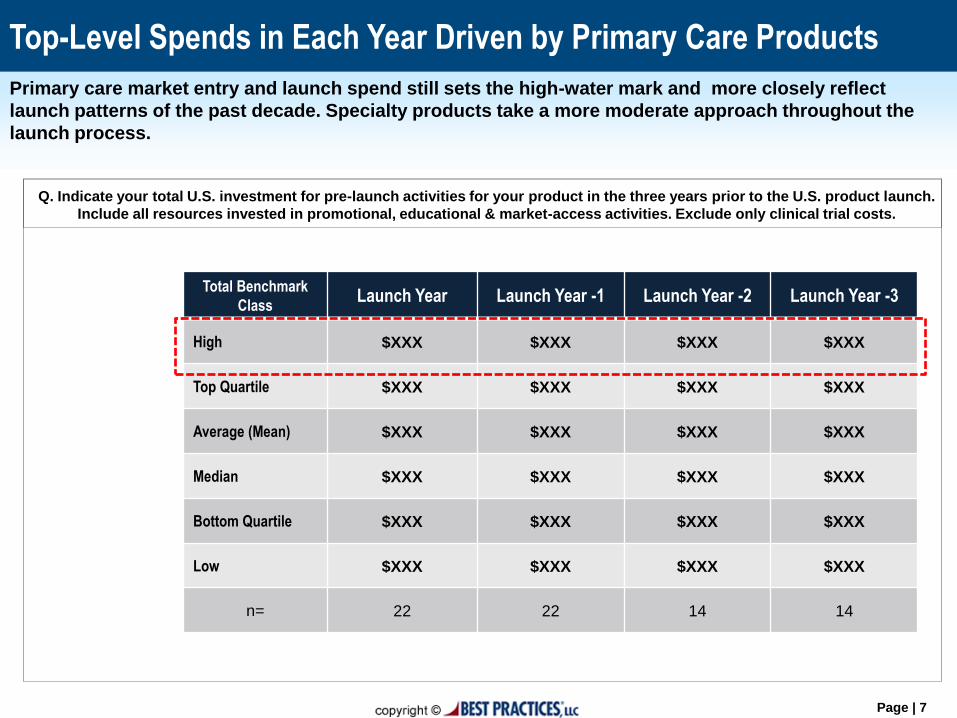
Page | 7
Primary care market entry and launch spend still sets the high-water mark and more closely reflect
launch patterns of the past decade. Specialty products take a more moderate approach throughout the
launch process.
Top-Level Spends in Each Year Driven by Primary Care Products
Q. Indicate your total U.S. investment for pre-launch activities for your product in the three years prior to the U.S. product launch.
Include all resources invested in promotional, educational & market-access activities. Exclude only clinical trial costs.
Total Benchmark
Class Launch Year Launch Year -1 Launch Year -2 Launch Year -3
High $XXX $XXX $XXX $XXX
Top Quartile $XXX $XXX $XXX $XXX
Average (Mean) $XXX $XXX $XXX $XXX
Median $XXX $XXX $XXX $XXX
Bottom Quartile $XXX $XXX $XXX $XXX
Low $XXX $XXX $XXX $XXX
n= 22 22 14 14

Page | 8
Single Specialty care launches mirror the overall investment patterns reflected in the full benchmark
class with spend trending upward each year.
Single Specialty Launch Year Investment Averages $XX Million
Q. Indicate your total U.S. investment for pre-launch activities for your product in the three years prior to the U.S. product launch.
Include all resources invested in promotional, educational & market-access activities. Exclude only clinical trial costs.
N=39
Single Specialty Launch Year Launch Year -1 Launch Year -2 Launch Year -3
High $XXX $XXX $XXX $XXX
Top Quartile $XXX $XXX $XXX $XXX
Average (Mean) $XXX $XXX $XXX $XXX
Median $XXX $XXX $XXX $XXX
Bottom Quartile $XXX $XXX $XXX $XXX
Low $XXX $XXX $XXX $XXX
n= 12 12 8 7

Page | 9
Multiple specialty segment investments oscillate between $ 27 million and $ 2 million in the launch
year. Compared to launch year , launch year – 1 investment for this segment is higher by 61%.
Multiple Specialty Segment Launch Year Investment Averages $XX Million
Q. Indicate your total U.S. investment for pre-launch activities for your product in the three years prior to the U.S. product launch.
Include all resources invested in promotional, educational & market-access activities. Exclude only clinical trial costs.
N=39
Multiple Specialty Launch Year Launch Year -1
High $XXX $XXX
Top Quartile $XXX $XXX
Average (Mean) $XXX $XXX
Median $XXX $XXX
Bottom Quartile $XXX $XXX
Low $XXX $XXX
n= 3 3

Page | 10
Compared to other care areas companies invest highest in primary and specialty segment. Year on year,
the investments in this segment jump by 51%, 166% and 137% respectively in year – 2, year – 1 and
launch year.
Primary Care/Specialty Launch Year Investments Averages $XXX Million
Q. Indicate your total U.S. investment for pre-launch activities for your product in the three years prior to the U.S. product launch.
Include all resources invested in promotional, educational & market-access activities. Exclude only clinical trial costs.
N=39
Both Specialty And
Primary Care
Physicians Launch Year Launch Year -1 Launch Year -2 Launch Year -3
High $XXX $XXX $XXX $XXX
Top Quartile $XXX $XXX $XXX $XXX
Average (Mean) $XXX $XXX $XXX $XXX
Median $XXX $XXX $XXX $XXX
Bottom Quartile $XXX $XXX $XXX $XXX
Low $XXX $XXX $XXX $XXX
n= 6 6 4 5
Page | 11
Investment Data by
Product Segment
Data is segmented by:
Projected Peak Annual Revenue
Type of Drug
Product Launch Year
Product Market Entry Position
Therapeutic Areas – Oncology, Respiratory, Diabetes,
Cardiovascular

Page | 12
Peak-year revenue is one of the key metrics that helps companies determine corresponding market entry
budgets. Eighteen percent of respondents expect to achieve a peak revenue of more than $1 billion, while
36% of respondents foresee earning less than $250 million upon product launch. By contrast, in the 2011
study, 25% of companies projected more than a billion dollar in peak year revenue.
In Competitive Market, Predicted Peak Revenues Lower Than in the Past
Q10. What was the projected peak annual revenue for your product before launch?
N=33
Peak Annual Revenue Projection:
Under $250 M
$251 M-$500 M
$501 M-$750 M
$751 M to $1 B
$1.01 B - $1.5 B
$1.51 B - $2 B, 3%
More than $2 B
* *
*Source: Best Practices, LLC’s 2011 Product Launch Spend Study
36%
18%
15%
12% 6%
9%
Page | 13
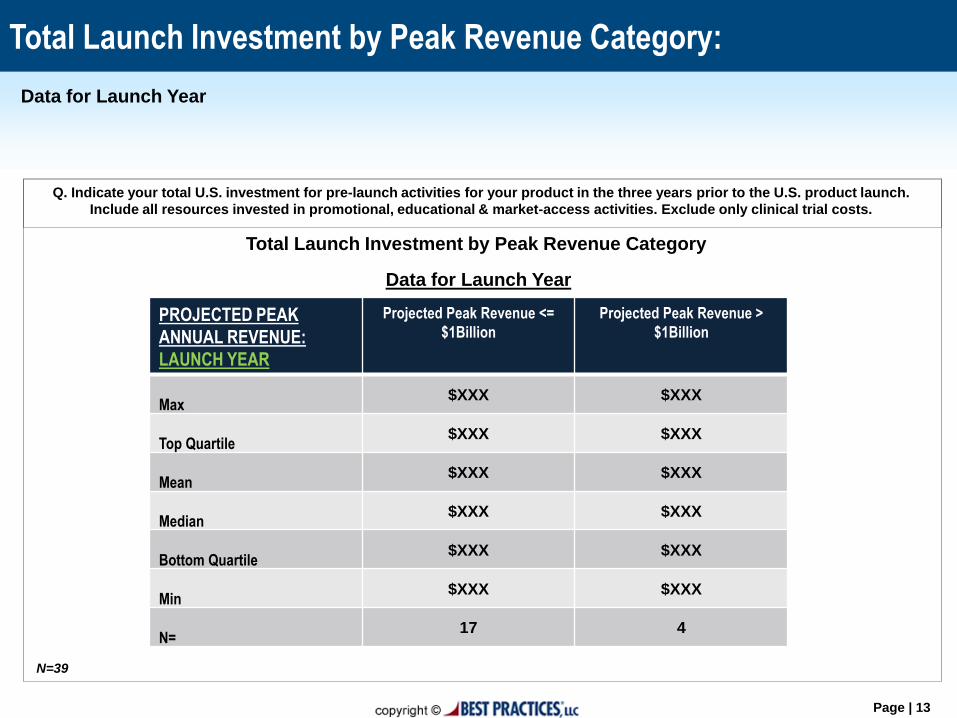
Data for Launch Year
Total Launch Investment by Peak Revenue Category:
N=39
Total Launch Investment by Peak Revenue Category
Data for Launch Year
PROJECTED PEAK
ANNUAL REVENUE:
LAUNCH YEAR
Projected Peak Revenue <=
$1Billion
Projected Peak Revenue >
$1Billion
Max $XXX $XXX
Top Quartile $XXX $XXX
Mean $XXX $XXX
Median $XXX $XXX
Bottom Quartile $XXX $XXX
Min $XXX $XXX
N= 17 4
Q. Indicate your total U.S. investment for pre-launch activities for your product in the three years prior to the U.S. product launch.
Include all resources invested in promotional, educational & market-access activities. Exclude only clinical trial costs.
Page | 14
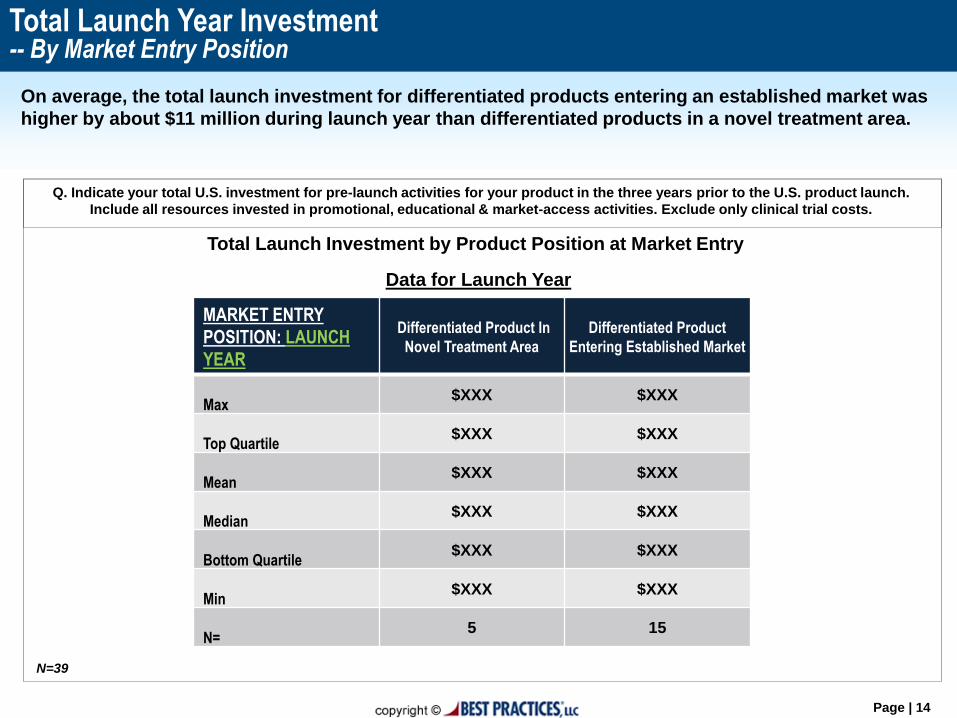
On average, the total launch investment for differentiated products entering an established market was
higher by about $11 million during launch year than differentiated products in a novel treatment area.
Total Launch Year Investment -- By Market Entry Position
N=39
Q. Indicate your total U.S. investment for pre-launch activities for your product in the three years prior to the U.S. product launch.
Include all resources invested in promotional, educational & market-access activities. Exclude only clinical trial costs.
MARKET ENTRY
POSITION: LAUNCH
YEAR
Differentiated Product In
Novel Treatment Area
Differentiated Product
Entering Established Market
Max $XXX $XXX
Top Quartile $XXX $XXX
Mean $XXX $XXX
Median $XXX $XXX
Bottom Quartile $XXX $XXX
Min $XXX $XXX
N= 5 15
Data for Launch Year
Total Launch Investment by Product Position at Market Entry

Page | 15
During launch year -1, the average investment for differentiated products entering an established market
is significantly higher than differentiated products in a novel treatment area.
Total Launch Year -1 Investment -- By Market Entry Position
N=39
Q. Indicate your total U.S. investment for pre-launch activities for your product in the three years prior to the U.S. product launch.
Include all resources invested in promotional, educational & market-access activities. Exclude only clinical trial costs.
MARKET ENTRY
POSITION: LAUNCH
YEAR-1
Differentiated Product In
Novel Treatment Area
Differentiated Product
Entering Established Market
Max $XXX $XXX
Top Quartile $XXX $XXX
Mean $XXX $XXX
Median $XXX $XXX
Bottom Quartile $XXX $XXX
Min $XXX $XXX
N= 4 13
Data for Launch Year-1
Total Launch Investment by Product Position at Market Entry

Page | 16
Launch year -2 breaks the trend with a higher investment for differentiated products in novel treatment
area.
Total Launch Year -2 Investment -- By Market Entry Position
N=39
MARKET ENTRY
POSITION: LAUNCH
YEAR-2
Differentiated Product In Novel
Treatment Area
Differentiated Product Entering
Established Market
Max $XXX $XXX
Top Quartile $XXX $XXX
Mean $XXX $XXX
Median $XXX $XXX
Bottom Quartile $XXX $XXX
Min $XXX $XXX
N= 4 8
Data for Launch Year-2
Q. Indicate your total U.S. investment for pre-launch activities for your product in the three years prior to the U.S. product launch.
Include all resources invested in promotional, educational & market-access activities. Exclude only clinical trial costs.
Total Launch Investment by Product Position at Market Entry
Page | 17
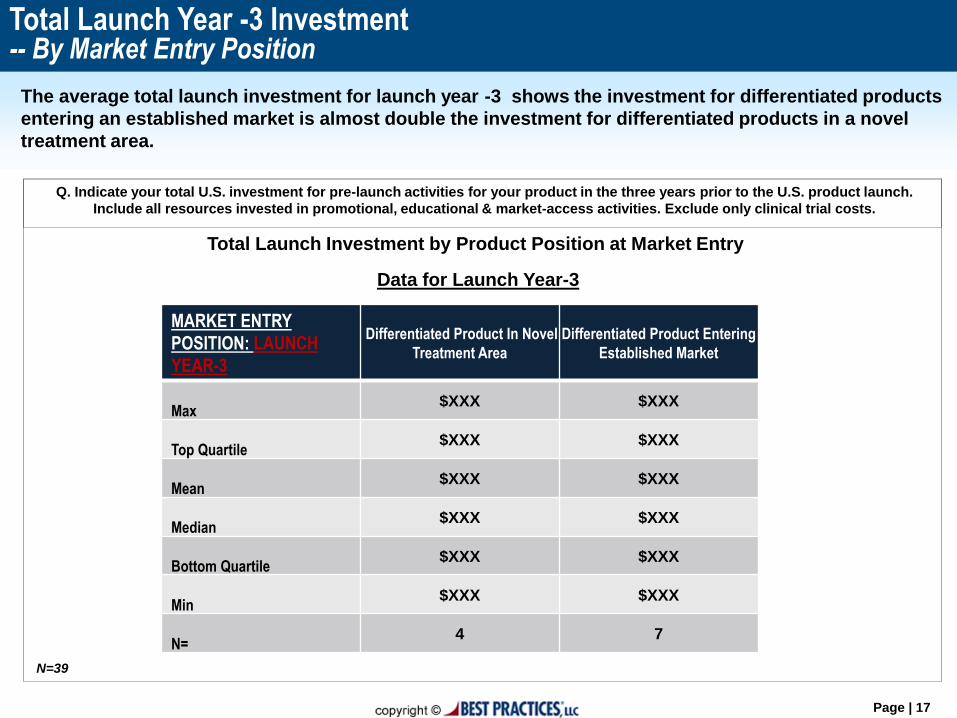
The average total launch investment for launch year -3 shows the investment for differentiated products
entering an established market is almost double the investment for differentiated products in a novel
treatment area.
Total Launch Year -3 Investment -- By Market Entry Position
N=39
MARKET ENTRY
POSITION: LAUNCH
YEAR-3
Differentiated Product In Novel
Treatment Area
Differentiated Product Entering
Established Market
Max $XXX $XXX
Top Quartile $XXX $XXX
Mean $XXX $XXX
Median $XXX $XXX
Bottom Quartile $XXX $XXX
Min $XXX $XXX
N= 4 7
Data for Launch Year-3
Q. Indicate your total U.S. investment for pre-launch activities for your product in the three years prior to the U.S. product launch.
Include all resources invested in promotional, educational & market-access activities. Exclude only clinical trial costs.
Total Launch Investment by Product Position at Market Entry
Page | 18
Launch Activities
Benchmark partners were asked to indicate which launch
activities they fund within each of the following categories
during the last four budget years leading up to launch.
Agency Fees (excluding DTC)
Direct to Consumer & Advertising Expenses
Health Economics/Outcomes Research
Launch Meeting/Kickoff
Managed Markets/Market Access
Market Research/Analytics (excluding DTC)
Medical Affairs
Patient Education/Assistance
Physician Education
Sales Force Preparation
Other

Page | 19
Public relation activities start from year – 3 and continue throughout the pre-launch and peaks at launch.
Promotional advertising starts in year – 2 and peaks at year – 1, while communication starts as early as
year – 3 and peaks at year – 2.
Public Relations Budgeted for Pre-Launch & Launch
Q. Please check all of the listed activities that were included in your product's Year -3, Year -2, Year -1 and Launch Year
budgets.
AGENCY FEES (excluding DTC)
11%
16%
79%
84%
84%
Other
Retainers
Communications/Publications
Promotional/ Advertising
Public Relations
Pre-launch Launch Year
Year-3 Year-2 Year-1
50% 60% 65%
30% 60% 94%
80% 90% 82%
10% 20% 18%
10% 20% 18%
N=10 N=10 N=17 N=19
*Others: Website/Social Media platform Development(4), Strategy(2),
Competitive Landscape, market access and HEOR
*
=most frequent
activity per year
Page | 20
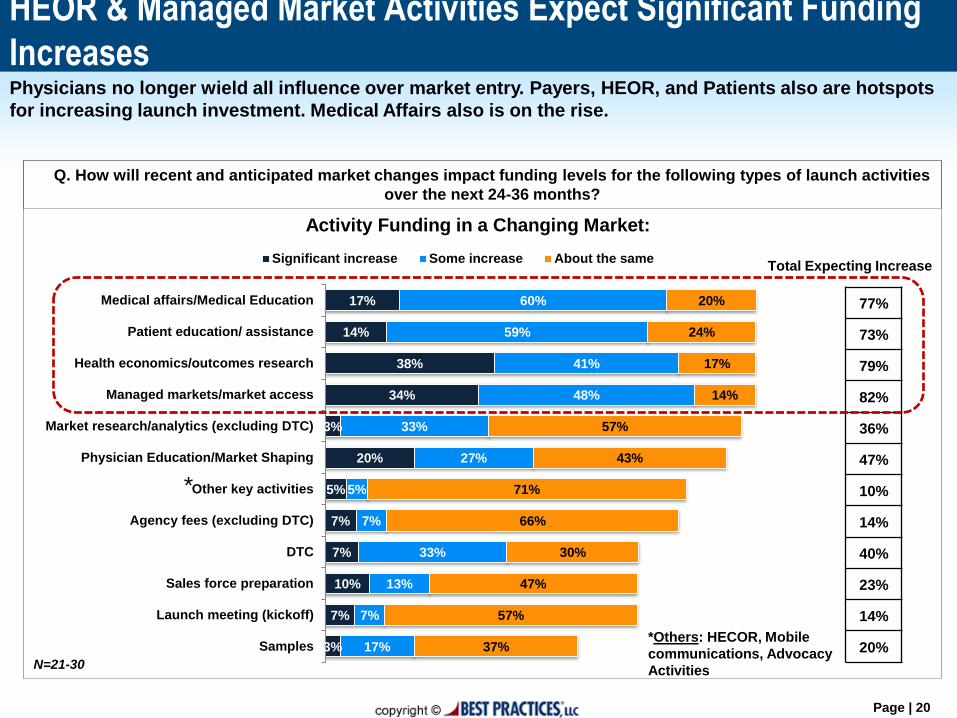
Physicians no longer wield all influence over market entry. Payers, HEOR, and Patients also are hotspots
for increasing launch investment. Medical Affairs also is on the rise.
HEOR & Managed Market Activities Expect Significant Funding
Increases
Q. How will recent and anticipated market changes impact funding levels for the following types of launch activities
over the next 24-36 months?
Activity Funding in a Changing Market:
3%
7%
10%
7%
7%
5%
20%
3%
34%
38%
14%
17%
17%
7%
13%
33%
7%
5%
27%
33%
48%
41%
59%
60%
37%
57%
47%
30%
66%
71%
43%
57%
14%
17%
24%
20%
Samples
Launch meeting (kickoff)
Sales force preparation
DTC
Agency fees (excluding DTC)
Other key activities
Physician Education/Market Shaping
Market research/analytics (excluding DTC)
Managed markets/market access
Health economics/outcomes research
Patient education/ assistance
Medical affairs/Medical Education
Significant increase Some increase About the same
77%
73%
79%
82%
36%
47%
10%
14%
40%
23%
14%
20%
Total Expecting Increase
N=21-30
*Others: HECOR, Mobile
communications, Advocacy
Activities
*
Page | 21
Launch Investment Allocation
Participants indicated their total U.S. investment for pre-launch activities for their
respective product in four different budget years: Launch Year, Year -1, Year -2, and
Year -3.
Budget numbers provided include all resources invested in promotional,
educational & market-access activities, excluding only clinical trial costs.
Slides in this section exhibit average, top quartile and bottom quartile allocated for
activities in 12 categories for the Launch Year and the three years preceding launch.
Data is provided for the full benchmark class. In addition, data is provided for the
following benchmark class segments: drug type, launch year, market entry position,
peak annual revenue projection, targeted physicians and therapeutic area.

Page | 22
Total Benchmark Class:
Launch Year & Launch Year -1
Investment Allocation by Activity Category (1)
Activity Category
Launch Year Year -1
Top Quartile Average Low Top Quartile Average Bottom
Quartile
Agency Fees - excluding
DTC $XXX $XXX $XXX $XXX $XXX $XXX
DTC Expenses $XXX $XXX $XXX $XXX $XXX $XXX
Health Economics/
Outcomes Research $XXX $XXX $XXX $XXX $XXX $XXX
Managed Markets/ Market
Access $XXX $XXX $XXX $XXX $XXX $XXX
Market Research/
Analytics - excluding DTC $XXX $XXX $XXX $XXX $XXX $XXX
Medical Affairs/Medical
Education $XXX $XXX $XXX $XXX $XXX $XXX
Patient Education/
Assistance $XXX $XXX $XXX $XXX $XXX $XXX
Physician
Education/Market
Shaping $XXX $XXX $XXX $XXX $XXX $XXX
Sales Force Preparation $XXX $XXX $XXX $XXX $XXX $XXX
All Other $XXX $XXX $XXX $XXX $XXX $XXX
Samples $XXX $XXX $XXX $XXX $XXX $XXX
Launch Meeting (kickoff) $XXX $XXX $XXX $XXX $XXX $XXX
N=20 N=20
Yellow highlights indicate highest three spend areas
for each year. Red circles indicate activities for which
Year -1 spend exceeds Launch Year investment.

Page | 23
Best Practices®, LLC is an internationally recognized thought leader in the field of best practice
benchmarking®. We are a research, consulting, benchmark database, publishing and advisory firm that
conducts work based on the simple yet profound principle that organizations can chart a course to superior
economic performance by leveraging the best business practices, operating tactics and winning strategies of
world-class companies.
6350 Quadrangle Drive, Suite 200
Chapel Hill, NC 27517
(Phone): 919-403-0251
www.best-in-class.com
Learn More About Our Company: