Budget allocation and Performance Tracking at Local Government … · 2019-09-10 · Budget...
32
Budget allocation and Performance Tracking at Local Government Report Case Study of Mayuge and Kabale districts Study carried out by Eastern and Southern Africa Small Scale Farmers’ Forum (ESAFF – Uganda) January 2015
Transcript of Budget allocation and Performance Tracking at Local Government … · 2019-09-10 · Budget...

Budget allocation and Performance Tracking at
Local Government Report Case Study of Mayuge and Kabale districts
Study carried out by
Eastern and Southern Africa Small Scale Farmers’ Forum
(ESAFF – Uganda)
January 2015
ii
LIST OF ACRONYMS AU African Union BFP Budget Framework Paper CAADP Comprehensive Africa Agriculture Development Program CAO Chief Administrative Officer CSOs Civil Society Organisations DISP Development Strategy and Investment Plan ESAFF Eastern and Southern Africa Small Scale Farmers’ Forum EU European Union FGD Focus Group Discussion FY Financial Year GDP Gross Domestic Product GoU Government of Uganda LC Local Council LG Local Government MLG Ministry of Local Government MAAIF Ministry of Agriculture of Agriculture Animal Industry and Fisheries MFPED Ministry of Finance Planning and Economic Development MTEF Medium-term Expenditure Framework NAADS National Agriculture Advisory Services NARO National Agricultural Research Organization NDP National Development Plan NGOs Non-Governmental Organisations NSAa Non State Actors PEAP Poverty Eradication Action Plan PETS Public Expenditure Tracking Survey PMA Plan for Modernisation of Agriculture SBFP Sector Budget Framework Paper SSFs Small Scale farmers SWAp Sector Wide Approach SWG Sector Working Group UBOS Uganda Bureau of Statistics UGX Uganda Shilling

iii
TABLE OF CONTENT
LIST OF TABLES.................................................................................................................................. v
LIST OF FIGURES ................................................................................................................................ v
ACKNOWLEDGEMENT ...................................................................................................................... vi
EXECUTIVE SUMMARY .................................................................................................................... vii
1. INTRODUCTION ........................................................................................................................ 1
1.1 Uganda’s Agriculture sector .................................................................................................. 1
1.2 Background of the study ....................................................................................................... 1
1.3 Rationale of the study ........................................................................................................... 1
1.4 Objectives of the study .......................................................................................................... 2
1.5 Scope of the study ................................................................................................................. 2
1.6 Brief background of Kabale and Mayuge district ................................................................. 2
1.7 Methodology .......................................................................................................................... 3
1.7.1 Literature Review ........................................................................................................... 3
1.7.2 Community meetings ..................................................................................................... 3
1.7.3 Focus Group Discussions (FGDs) ................................................................................... 3
1.7.4 Field Visits ....................................................................................................................... 3
1.7.5 PETS ................................................................................................................................. 3
2. THE BUDGET PROCESS IN LOCAL GOVERNMENT ...................................................................... 4
2.1 Introduction ........................................................................................................................... 4
2.2 The budget process in local government ............................................................................. 4
3. ANALYSIS OF DISTRICT AGRICULTURE BUDGET ......................................................................... 7
3.1 Relating the national and district financing for agriculture ................................................. 7
3.2 Budget analysis for Kabale district from FY 2011/12 to FY 2014/15 .................................. 8
3.2.1 Analysis of budget allocation by departments ............................................................. 8
3.2.2 Trends in budget allocation to the department in Kabale district .............................. 9
3.2.3 Distribution of the budget allocated to Production and Marketing department ..... 10
3.3 Budget analysis for Mayuge district from FY 2011/12 to FY 2014/15 .............................. 11
3.3.1 Analysis of budget allocation by departments ........................................................... 11
3.3.2 Trends in budget allocation to the department in Mayuge district .............................. 12
3.3.3 Distribution of the budget allocated to Production and Marketing department ..... 12
3.4 Comparing Kabale and Mayuge Districts’ Production and Marketing budgets ............... 13
4. FINDINGS OF THE TRACKING/MONITORING OF SERVICE DELIVERY ........................................ 15
4.1 Findings from Kabale district on particular projects .......................................................... 15
4.1.1 Nyamera road project in Kabale district ..................................................................... 15
4.1.2 NAADS Project on Extension services in Kabale district ............................................. 16

iv
4.2 Findings from Mayuge district on particular projects........................................................ 16
4.2.1 Installation of culverts on Wante to Namakakale road in Namakakale swamp ....... 16
4.2.2 Construction of spring well in Namakakale village ..................................................... 18
4.2.3 Distribution of banana sackers under NAADS ............................................................ 19
5. CHALLENGES, CONCLUSION AND RECOMMENDATION .......................................................... 21
5.1 Challenges of the study ....................................................................................................... 21
5.2 Conclusion ............................................................................................................................ 21
5.3 Lessons learnt ...................................................................................................................... 22
5.4 Recommendations ............................................................................................................... 22
5.4.1 National government ................................................................................................... 22
5.4.2 Local government ......................................................................................................... 22
5.4.3 Non State Actors .......................................................................................................... 23
5.4.4 Small scale farmers ...................................................................................................... 23
REFERENCES .................................................................................................................................. 23

v
LIST OF TABLES
Table 1: Kabale District Budget Allocations 2011/12 - 2014/15 (‘000) by department .................... 8
Table 2: Kabale district Production and Marketing Budget 2011/12 – 2014/15 (‘000) .................. 10
Table 3: Sector and department allocation in Mayuge District 2011/12 - 2014/15 ....................... 11
Table 4: Mayuge district Production and Marketing Budget 2011/12 – 2014/15 (‘000)................ 12
LIST OF FIGURES
Figure 1: Kabale district allocations FY 2011/12 - 2014/15 (‘000) ..................................................... 9
Figure 2: Production & Marketing Budget for Kabale ('000) .............................................................. 9
Figure 3: Production & Marketing budget for Kabale - Recurrent Vs Development ('000) ............ 10
Figure 4: Percentage share of Recurrent and development budget ............................................... 11
Figure 5: Mayuge District Budget allocations ('000) ......................................................................... 12
Figure 6: Production & Marketing Budget - recurrent Vs development ('000) ............................... 13
Figure 7: Comparison between Mayuge and Kabale production and marketing budget ('000) .... 13

vi
ACKNOWLEDGEMENT
ESAFF Uganda is pleased to present to you the main report from Public Expenditure Tracking Study carried out in Uganda. This report synthesizes findings from a study aimed at reviewing Government expenditures in Mayuge and Kabale districts under the Agriculture sector and other related sectors. The study was conducted by ESAFF Uganda with support from European Union (EU) through ESAFF Regional office. ESAFF Uganda wishes to acknowledge the support received from Local Government leaders and staff especially from lower local governments. ESAFF Uganda also gratefully appreciates SSFs who were on the PETS teams in the two districts. Special thanks go out to all partners who gave input to the report and the staff of ESAFF Uganda who read the report to make sure it reflected the real issues on the ground. This report wouldn’t be possible without support from experts who gave technical support to ESAFF staff through the development of the report.

vii
EXECUTIVE SUMMARY
The formation of ESAFF in 2002 was a direct response to the need to create a forum where Small Scale Farmers (SSFs) are able to deliberate on and voice their concerns. ESAFF Uganda is a small scale farmer-led movement formed to facilitate processes through which smallholder farmers’ development concerns can be solicited, articulated and ultimately addressed through local and national policies and programmes. ESAFF Uganda works to enhance the SSFs ability to make informed decisions and participate meaningfully in development processes through capacity building, advocacy, research and institutional development. ESAFF Uganda with support from EU through ESAFF Regional office commissioned a study to explore the details behind district local government’s budgetary allocations to the agricultural sector. The Public Expenditure Tracking Surveys (PETS) was initiated on funding related to agriculture sector to enable stakeholders prioritise expenditure to sustain aggregate rural development. This study was to analyse local government investment in agriculture and conduct PETS on resources that were planned for the agriculture and related sectors. The study was carried out in Mayuge and Kabale districts. The methodology used in this study included literature review, focus group discussions, interviews, community meetings, field visits and PETS. The budget process in Kabale and Mayuge districts mirrors the process at the national level. The budget process starts in September when the Local Government Budget committee agrees with the rules, conditions and flexibility of the planning and budgetary process and ends in June with the reading and approval of budget. From Mayuge district, findings on the budget process revealed that village members in the communities visited didn’t have any knowledge about the budgets for government projects. Small scale farmers from Kabale district revealed that most of their efforts to get budget information during the budget process and after always went in vain because most technocrats protect public information not to be accessed by the public which contravenes with the Access to information Act, 2005. Government of Uganda in endorsing the Maputo and Malabo declarations committed to funding agriculture sector by at least 10% of the national budget. The study revealed that government has still failed to allocate at least 10% of its budget to agriculture. The funding isn’t even close to the DSIP projection, for example in Financial Year 2014/15 the sector received Shs 440 billion compared to Shs 559.6 billion projected in the DSIP, thus leading to a funding gap of Shs 119.6 billion. A big percentage (60%) of the limited funds allocated to the sector end up in the government agencies like NAADS and the MAAIF headquarters despite the fact that Local Governments implement majority of the sector activities. The study further revealed that Kabale district in 2014/15 invested only 3.03% of their total budget to production and marketing despite the fact that it had invested more than 5% in their previous financial year. Findings also show that Mayuge district invested only 2.8% of their total budget in 2014/15 financial year in production and marketing department. The results from Kabale and Mayuge district budget allocations to production and marketing department show that Kabale district is investing more in the department.

viii
Small scale farmers also carried out PETS on government expenditure in the agriculture sector and sectors related to agriculture like rural roads. SSFs in Kabale district tracked road projects like the Nyamera road project which was implemented by EBRP investment and found out that some parts of the road had no culverts while some had them but were poorly made and maintenance was also poor in accordance with the standards stated in the plan. Despite the failure to access some information from the districts, SSFs still concluded that with the clear evidence from other SSFs and community members, there were a lot of irregularities in the program. Small scale farmers from Mayuge district also discovered that the local government has irregularly spent public funds on projects like Installation of culverts on Wante to Namakakale road along Namakakale swamp where it was found through observation that there was poor construction of the culverts and the right procedures were not followed. Review of other projects like the construction of spring well in Namakakale village also show that the spring well wasn’t constructed well as it was meant rather a hole with dirty water was dug for people to collect from, no further construction done. The PETS study was relevant as it helped to track the allocation and usage of government funds. The main recommendations from the study include mandatory access to budget information as it is a right of small scale farmers, increase of funding to the sector or departments, bridging the gap between small scale farmers and the local leaders, involvement of small scale farmers in the process. The study acts as a valuable source of information on the Uganda Government investment in agriculture. It is also an excellent resource for civil society and other stakeholders in implementing agriculture budget and policy related advocacy work.

1
1. INTRODUCTION 1.1 Uganda’s Agriculture sector Uganda’s Vision 2040 envisions ’a transformed Ugandan society from a peasant to a modern and prosperous country within 30 years’ and moves to transform the agriculture sector with a focus on growing industries and services. The aspiration is to transform the sector from subsistence to commercial, making agriculture more profitable, competitive and sustainable to provide income and food security. The agriculture sector employs over 85 of the population with a dominance of small holder farmers and encompassing; crops, livestock and fisheries, remains fundamental to the economy with an estimated 23.9% contribution to GDP nationally. The sector historically boasted of an impressive growth trend, averaging a 3.8% annual growth until 2005. However, overall growth in output has recently averaged at 1.3% (1.4% in 2012) falling from a record high of 7.9% in 2000 and slightly recovering to 2.6% in 2009. This rate of growth falls below the average population growth rate of 3.2% implying a declining per capita agricultural GDP rate. This has led to reduced food security and further caused cash crop production to decline from 7.3% to 1.7%. 1.2 Background of the study The provision of efficient agriculture services has been an important focus for government and the donor community in Uganda. The Government’s vision for the agriculture sector is to transform the sector from a peasantry farming system to commercial agriculture through improved productivity and production. In Uganda, 80% of the population depends on agricultural production while in the rural areas more than 85% of the total population depend on agriculture as the main source of livelihood either as pure subsistence or with little commercial farming, making it the most important sector of the economy. Given agriculture’s major role in the rural economy, it has significant potential to provide medium-term solutions to the current problems of poverty in Uganda. According to policy documents relating to agriculture, government is committed to developing the agriculture sector but still there are some short comings in those commitments. SSFs identified a need to get involved in tracking government expenditure in the sector since they are one of the stakeholders. 1.3 Rationale of the study It is well known that citizens of Uganda including SSFs have a role to play in holding governments accountable. The Public Expenditure Tracking Surveys (PETS) was initiated on funding related to agriculture sector to enable stakeholders prioritise expenditure to sustain aggregate and rural development. Public Expenditure Tracking Surveys (PETS) was launched in order to expose the anomalies in the process of flow of funds and to gauge the degree to which funds trickle down to their intended beneficiaries. There was need to contribute to improved policy formulation so as to better align future expenditure to the priorities in the agriculture sector and also to make a case for the appropriate level of funding for the subsector as well as contributing to a larger public expenditure review to ascertain the absorption capacity at district level. The role of PETS was to create linkage between public spending and development outcomes, the factors responsible for the emergence of

2
inefficiencies in the system, and the role of the culture of accountability and transparency. 1.4 Objectives of the study The overall objective of this study was to analyse local government investment in agriculture and conduct PETS on resources that were planned for the agriculture and related sectors. The study also set out to:
1. Find out how much of the resources reach the beneficiary on a given identified project;
2. Analyse the performance of the agriculture sector in the district; 3. Analyse the process of participation of small scale farmers in the budgetary process
and satisfaction of SSFs with the services provided by government; and 4. Develop policy recommendations to address indentified challenge.
1.5 Scope of the study The districts of Mayuge and Kabale were randomly selected as case studies. The study focused on establishing planned and actual expenditure, and how much was finally spent under each programme. The study focused on allocations related to the agriculture sector. In each district two projects under the 2013/14 financial year budget were identified and monitored. The study examined how much resources reached the intended beneficiaries. In order to obtain results, the study focussed on the types of resources received at the district and their respective programmes. Data collection was done by small scale farmers. Most of the information used in the study was collected by small scale farmers from the villages that were randomly selected. Documents reviewed were collected by small scale farmers from the district leaders and technical officers. 1.6 Brief background of Kabale and Mayuge district Mayuge district is located in the eastern region of Uganda with a total area of 4638.5 sq km, open water 3,556.0 sp km and protected area 260.3 sp km. Mayuge district is sub divided into 12 sub counties and one town council and these sub counties form 3 constituencies. There are 68 parishes and 385 villages in the district. Mayuge district is relatively flat with high ridges and isolated hills, adulating low lands and perch vents. There are two peak rainfall seasons in a year that is April - June and August- November. These two are interspersed with a longer dry season December- March and short one July - August. These seasons enable farmers to have at least two growing seasons. The population is estimated at 464,082 people. According to the 2002 population and housing census, Mayuge district had a total population of 324,674 compared to 216,849 in 1991 showing a 3.5 percent growth rate. The population of Mayuge district is predominantly rural. Kabale district lies in the south west of Uganda. The district has three rural communities including Ndorwa, Rubanda and Rukiga with only Kabale municipality as the urban community. The 3 rural communities are divided into 19 sub-counties while the municipality has three divisions. In total Kabale district is compressed of three rural counties, one municipality, 139 parishes and 1,442 villages. It is estimated that 91 percent of the population in Kabale district stay in rural area. Kabale district has a total area of 1827 square kilometres out of which arable land area is 1695 square kilometre. About 75 percent of

3
arable land is largely owned according to customary law, however some lands held by freehold and leasehold. Agriculture is the main economic activity in Kabale district with about 86 percent producing at subsistence level. 1.7 Methodology Before commencement of the study, an inception meeting and training workshop were organized to enlighten the purpose of the study and train small scale farmers on how to conduct PETS at village level. The different methods used during this study include; 1.7.1 Literature Review The study involved comprehensive review of documents from the District and Sub-County Local Governments. Different documents including; district plans, budgets, reports and contracts were reviewed. 1.7.2 Community meetings Small scale farmers organised village meetings in each of the four villages sampled to build support for the study and also collect data from the community. Community meetings were influential in giving evidence on planned projects. 1.7.3 Focus Group Discussions (FGDs) In this approach, the small scale farmers and district leaders were asked about the specific projects which were being implemented in the villages. It was adopted because of its effective feedback mechanism which is immediate and its suitability to the community. FGDs were organized in 4 sub-counties in the two districts. They were mainly organized to enable small scale farmers verify information got. 1.7.4 Field Visits Field visits to villages where the selected projects were implemented were done. In some villages, visits were made to water source points, demonstration sites and roads. Field visits were mainly observatory and, where possible, interviews were conducted. These visits were also meant to verify the accuracy of the information provided by the political leaders and technical officials. 1.7.5 PETS This is one of the tools used to determine how much of the resources planned and released reached the intended levels. This involved tracking of resources allocated to the two districts. Data on allocation were mainly collected from district local governments and the internet (from government website) while other related information was collected from small scale farmers through interviews. Interviews with the technical leaders provided an independent voice and an opportunity to verify information. During the interview, a questionnaire was used.

4
2. THE BUDGET PROCESS IN LOCAL GOVERNMENT
2.1 Introduction It is well known that agriculture and agribusiness is a priority to government to create jobs, improve productivity and expand exports in the medium term. The Government of Uganda’s target for the agricultural sector is: “To transform two million (50%) subsistence agricultural households to market oriented production through sustainable commodity value chains by 2020”. The budget process and the involvement of stakeholder in the process would play a great role in achieving this vision. 2.2 The budget process in local government The budget process in Kabale and Mayuge district mirrors the process at the national level. The local budget process follows the logic of four stages. It starts in September when the Local Government Budget committee agrees with the rules, conditions and flexibility of the planning and budgetary process and ends in June when the reading and approval of budget takes place in the council and the approved budget to be signed by chairperson and submitted to MFPED/MLG/LGFC & Auditor General. National priorities, resources and inter sector allocations that have been decided at the national budget conference in October are communicated to the local governments. At the Regional Local Government Framework Paper Workshop recurrent and development grants ceilings are communicated to the local governments, alongside changes to sector policies and guidelines. The purpose for the Regional Local Government Framework Paper Workshops held in late October is to disseminate government priorities for the next financial year, disseminate the indicative planning figures for central government transfers to local governments, as well as identify and discuss policy issues which affect the operations of local governments. After the priorities have been identified, the budget desk prepares the local government budget call in early November which is then sent out to all heads of department and lower local governments. This includes a draft activity and time schedule for the entire budget process and also the indicative budget allocations for the lower local governments. Within one week of the Regional Local Government Framework Paper Workshop in early November, the Budget Desk prepares a Local Government Budget Call and circulates it to all stakeholders involved in the budget preparation. The heads of departments and lower local governments start to prepare budget framework papers, reviewing performance and priorities planning and budgeting for future programmes. These draft inputs to budget framework paper are presented to central sector committees. The planner and district technical planning committee prepares a draft district development plan with a detailed work plan as well as the budgets for each and every activity the local government intends to undertake. In December, a draft budget framework paper and development plan is presented to the Executive Committee for examination before presenting at the budget conference. The budget conference is attended by the full council, Civil Society Organizations (CSOs), general public and the media. During the budget conference input can be given on the budget which would be incorporated into the BFP by the Budget Desk. Subsequently, the Executive Committee approves the budget framework paper and drafts the budget. It is then ready for submission to the MFPED in December. From January to March the MFPED with line ministries examines the local government budget framework paper and the draft budgets. It

5
gives comments and revises grant ceilings and communicates back to the local governments. After incorporation of comments and changes from the central government, the budget is then presented to the sector committees for review of the final annual work plan and budget and for final inputs. Beginning of June a final draft budget is ready to be read and adopted by council as stipulated by the Act. This is then signed by the chairperson and submitted to central government before the 15th of June of every year. From Mayuge district, findings on the budget process revealed that village members in the communities visited didn’t have any knowledge about the budget for government projects being implemented in their respective villages, this is as a result of sub-county officials not displaying budget information on the notice boards like the case of Wairasa sub county which doesn’t put quarterly releases on the notice boards. Small scale farmers also didn’t know the difference between the roles of the local leaders and technical persons. Some small scale farmers stated that the technical officers didn’t go to the grassroots to check on the projects being implemented by different service providers. Most sub-counties didn’t have functional development strategic plans. According to the local leaders, the budget progress in Mayuge district has been very participatory. They stated that the process starts at the village level, then parish, sub-county and the district levels respectively, involving different categories of people including small scale farmers, traders, opinion leaders, politicians, cultural and religious leaders, civil society organizations among others. Local leaders also stated that the sub-county and district budgets are pinned on the notice boards at the sub-county, however, findings revealed that some sub-counties at times don’t pin budget information at the notices boards and at times when they are pinned they are removed after a short period. Findings also showed that the biggest challenge with small scale farmers is that they do not follow up with the responsible officials to ensure that their issues are incorporated into the budgets before they are approved hence making their efforts infertile. Notwithstanding, the small scale farmers do not take the initiative to read the approved budgets because many of them are semi-illiterate hence there is failure to understand the contents of the budget. This explains the limited capacity to interpret and analyze the budgets since most small scale farmers. Most of the small scale farmers who were visited live far away from their sub-county and district offices which make it hard for them to access their respective budgets. Small scale farmers from Kabale district revealed that most of their efforts to get budget information during budget process and after always went in vain because most technocrats protect public information not to be accessed by the public which contravenes with the Access to information Act, 2005. This was also witnessed during the PETS process where some local government officials failed to avail some important information for the study for example; quarterly releases, approved plans, procurement documents among others. Despite the fact that officials emphasised that the budget process is participatory, results from village meetings and other discussions at both sub-counties and districts revealed that most small scale farmers had never participated in the process. Some farmers from Mayuge

6
district had been involved in the budget process though they also testified that apart from attending meetings, most of their views are not incorporated into budget framework paper; they had never attended any budget conference beyond their village consultation meetings. Some councillors in Mayuge district view the budget process to be top bottom approach since they have very limited input into it. It is evident that majority of the small scale farmers get to know about the budget only during the national budget speech and/or reading of the district development plans. Furthermore, most small scale farmers perceive budget speech as reading out basic commodity prices, thus does not relate to government investment in the agricultural sector. With regard to the planning, the analysis of the various work plans revealed a wide variation in the identification and prioritization of the needs of the people by central government and districts.
7
3. ANALYSIS OF DISTRICT AGRICULTURE BUDGET
3.1 Relating the national and district financing for agriculture The agriculture sector plays a key role in household food security and income; hence, local governments invest heavily in this sector. The production and marketing department of Kabale and Mayuge districts handle matters of agriculture. The department has different sectors like production office, crop, livestock, fisheries and commercial services. The support for the department comes from government through NAADS, MAAIF/PMG, local revenues and other donor projects. The production and marketing department gets its mandate from 1995 constitution, vision 2040, NDP, DSIP and PMG. Despite the fact that the agriculture sector has a Development Strategy and Investment Plan (DSIP), its implementation has been hampered by inadequate funding and poor linkage between Ministry of Agriculture Animal Industry and Fisheries (MAAIF) headquarters and Local Governments (LGs). For instance, in Financial Year 2014/15 the sector received Shs 440 billion compared to Shs 559.6 billion projected in the DSIP, thus leading to a funding gap of Shs 119.6 billion. The agriculture sector remains among the lowly ranked funded sectors in the national budget. Agriculture sector has not received more than 5 percent share of the national budget since 2009/10 hence there is total disrespect to the Malabo declaration of 10% Allocation of the National budget to the Agriculture sector. The one other issue to note is the fact that 60 percent of the sector budget is allocated to central government agencies and the headquarters despite the fact that Local governments implement majority of the sector activities considering the fact that districts continue to face serious problems in raising local revenues to support the agriculture sector. Most local governments depend on Central Government (CG) transfers. Findings from analysis of district budget for Kabale showed that only 2.1 percent of the budget in 2013/14 financial year was funded by local revenue while 96.2 percent was funded by the central government. Only 6.8 percent allocation to the department of production and marketing which handles agriculture related issues. Apart from NAADS, there is virtually no other government funding for agriculture at Local Government levels yet NAADS program mainly focuses on advisory services, and provision of inputs; other agriculture departments/facets such as value chains, pests and diseases control, post-harvest handling and marketing are largely underfunded. Generally sub-counties allocate more funds in their budgets towards agriculture compared to the central and district governments. Over half of the entire sub-county budget is spent on agriculture related programmes. This may be because of the fact that the sub-county is the front-line service delivery organ of government. The biggest challenge is that the actual amounts are too meagre to create meaningful impact on the agricultural improvement and development in the county.

8
3.2 Budget analysis for Kabale district from FY 2011/12 to FY 2014/15 3.2.1 Analysis of budget allocation by departments Table 1: Kabale District Budget Allocations 2011/12 - 2014/15 (‘000) by department
2011/12 2012/13 2013/14 2014/15
Administration 829,823 1,610,623 1,822, 639 2,152, 034
Multi sectoral transfers to LLGs
1,464,129 0
Finance 265,229 629,476 647,740 713,814
Statutory Bodies 1,137,624 1,588,211 1,735, 878 1,508,565
Production and Marketing
2,486,317 2,904,495 3,143, 996 1,391,010
Health 4,893,270 4,763,879 6,450,002 6,748,312
Education 19,909,088 22,833,321 25,070,194 28,449,426
Roads and Engineering
2,800,122 1,208,135 1,214,171 1,857,618
Water 525,211 633,931 951,173 1,099,639
Natural Resources 473,898 222,216 198,578 307,956
Community Based Services
264,418 616,514 690,283 1,144,659
Planning 81,830 136,497 152,094 160,608
Internal Audit 38,691 80,681 82,947 96, 681
Grand Total 35,169,721 37,196,103 42,159,694 45,630,324
Table 1 looks at budgetary allocation by sector from FY 2011/12 to 2014/15. Examining the composition of total Kabale district local government allocations reflects that the top two prioritized sectors over the years are education and health. It should be noted that the district’s total budget has been increasing steadily from FY 2011/12 to 2014/15. The production and marketing department which handles agriculture related issues has been the third most funded department overall. Although there had been an increase in the allocation to the production and marketing sector between FY 2011/12 and 2012/13, in 2014/15, the sector budget dropped by 55%. The drop in the budget is attributed to prioritization of other things by the government. As a result of the above, the sector experienced significant funding decline in 2014/15.
9
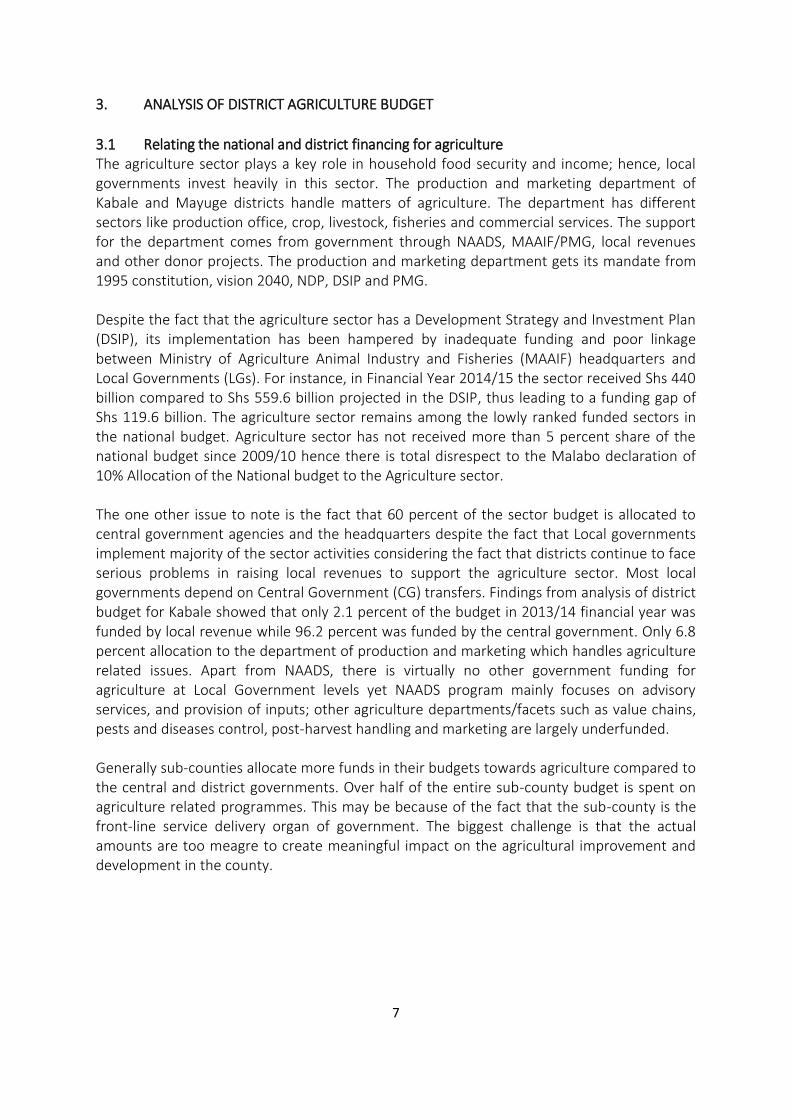
3.2.2 Trends in budget allocation to production and marketing department in Kabale district Figure 1: Kabale district allocations FY 2011/12 - 2014/15 (‘000)
According to Figure 1, the budgetary allocations to the production and marketing department over the 3 years (2011/12 to 2013/14) have fluctuated between 7% and 8% which is still low considering the fact that agriculture employs a majority of the people in Kabale district and such it deserves a lion’s share of the budget to fasten economic development and more job creation. In FY 2014/15 the production and marketing department witnessed a great declined of the allocation to the department (3.4%) which was less than half for the previous FYs. Considering the current poor performance of some sub-sectors in the production and marketing department coupled with climatic variability and the increasing population growth, one would have expected an increased allocation to the department.
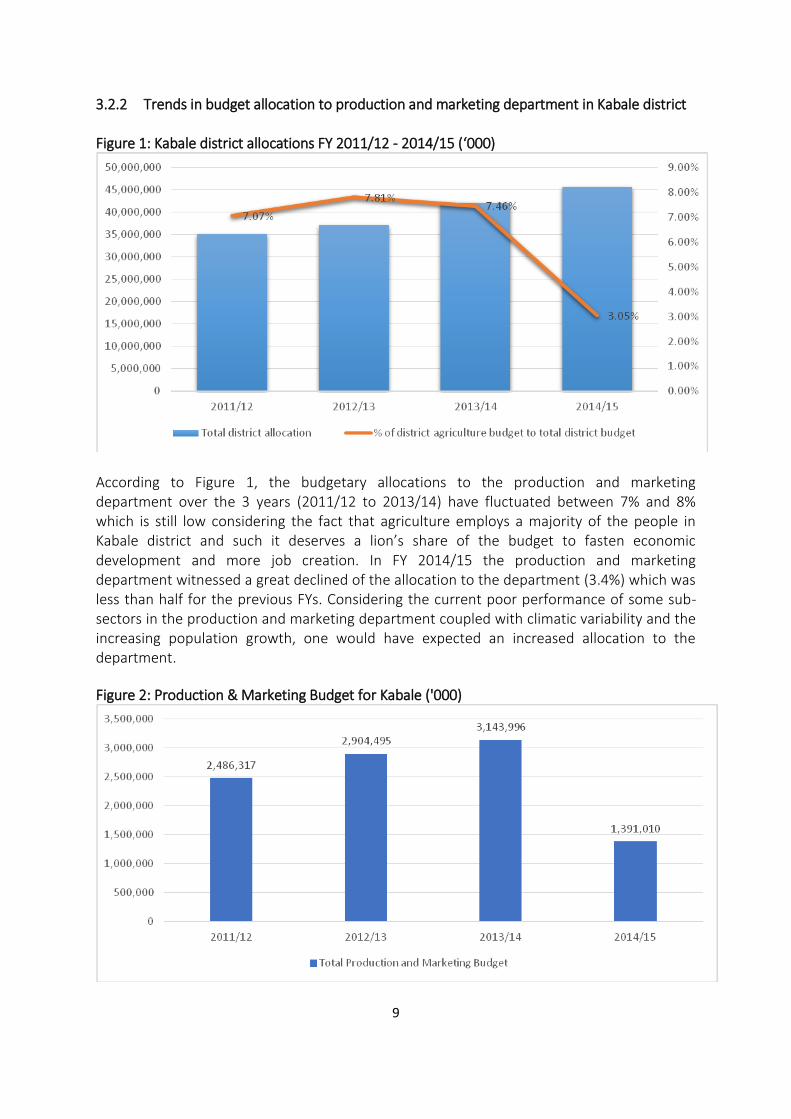
Figure 2: Production & Marketing Budget for Kabale ('000)

10
3.2.3 Distribution of the budget allocated to Production and Marketing department
Table 2: Kabale district Production and Marketing Budget 2011/12 – 2014/15 (‘000)
2011/12 2012/13 2013/14 2014/15
Recurrent 195,427 337,930 903,857 865,413
wage 102,500 228,962 744,219 721,004
Non-wage 92,927 108,968 159,638 144,409
GoU Development 2,290,890 2,566,565 2,240,139 525,597
Total 2,486,317 2,904,495 3,143,996 1,391,010
Table 2 shows the sources of funds allocated to district production and marketing budget. Development funds take the largest amount of the total department budget. It should however be noted that most of the development funds are from donor aid. Comparing the FYs under this study, FY 2014/5 presents the lowest allocation to the department with recurrent taking the largest amount followed by wages. This shows that in FY 2014/15 fewer services were to reach small scale farmers. Figure 3: Production & Marketing budget for Kabale - Recurrent Vs Development ('000)

11
Figure 4: Percentage share of Recurrent and development budget in production and marketing
Figure 4 presents the share of recurrent and development budget under the production and marketing department. It shows a continuous increase in the recurrent budget reflected by gradual decrease in the development budget. During the FY 2014/15 development budget made only 37.8% of the budget to production and marketing department which is way below compared to other years. 3.3 Budget analysis for Mayuge district from FY 2011/12 to FY 2014/15 3.3.1 Analysis of budget allocation by departments Table 3: Department allocation in Mayuge District 2011/12 - 2014/15
2011/12 2012/13 2013/14 2014/15
Administration 596,560 1,573,940 1,074,574 1,196,462
Multi sectoral transfers to LLGs
1,033,766 0 0 0
Finance 187,436 449,754 575,606 640,310
Statutory Bodies 544,002 670,426 782,893 840,342
Production and Marketing
2,120,915 2,317,006 1,926,135 886,833
Health 2,002,667 2,344,602 3,566,410 3,291,519
Education 10,456,151 11,314,198 12,989,108 16,127,374
Roads and Engineering
2,081,700 2,540,378 6,121,310 6,341,164
Water 616,999 751,237 794,214 804,190
Natural Resources 148,853 197,109 245,614 203,720
Community Based Services
532,538 514,469 451,457 460,321
Planning 191,378 463,542 285,334 1,124,650
Internal Audit 45,330 54,702 55,269 67,189
Grand Total 20,558,295 23,191,363 28,867,926 31,984,073
12
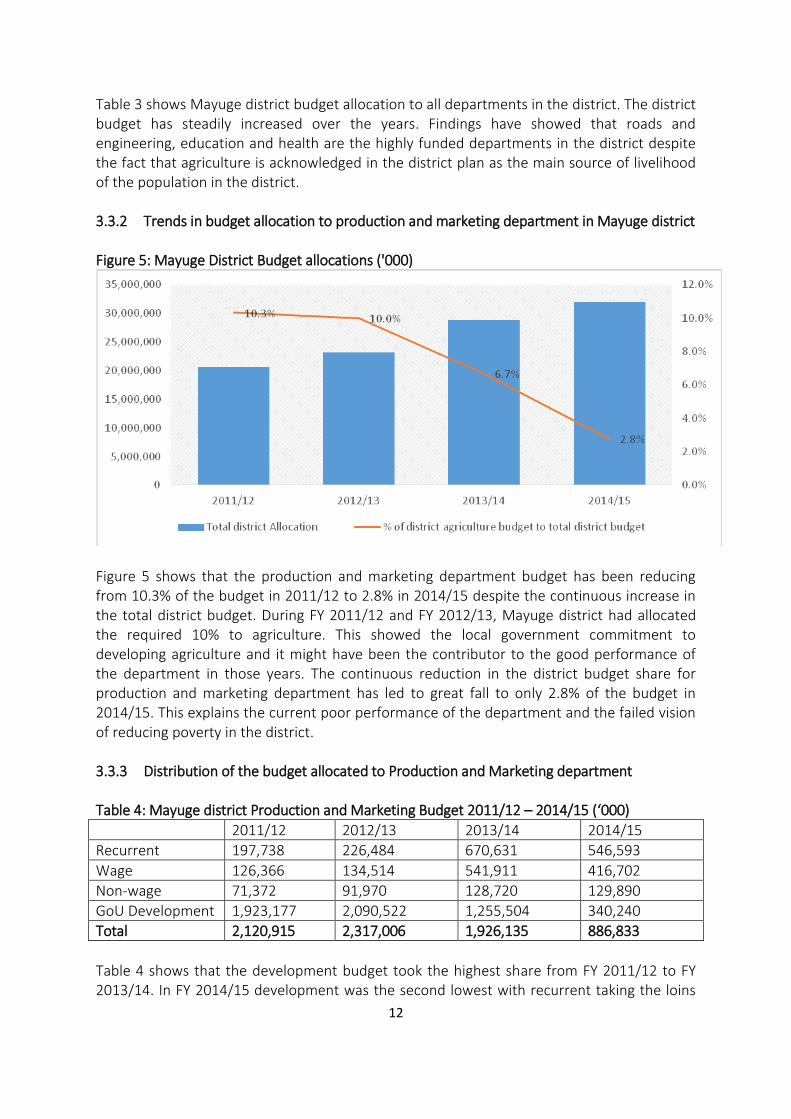
Table 3 shows Mayuge district budget allocation to all departments in the district. The district budget has steadily increased over the years. Findings have showed that roads and engineering, education and health are the highly funded departments in the district despite the fact that agriculture is acknowledged in the district plan as the main source of livelihood of the population in the district. 3.3.2 Trends in budget allocation to production and marketing department in Mayuge district Figure 5: Mayuge District Budget allocations ('000)
Figure 5 shows that the production and marketing department budget has been reducing from 10.3% of the budget in 2011/12 to 2.8% in 2014/15 despite the continuous increase in the total district budget. During FY 2011/12 and FY 2012/13, Mayuge district had allocated the required 10% to agriculture. This showed the local government commitment to developing agriculture and it might have been the contributor to the good performance of the department in those years. The continuous reduction in the district budget share for production and marketing department has led to great fall to only 2.8% of the budget in 2014/15. This explains the current poor performance of the department and the failed vision of reducing poverty in the district. 3.3.3 Distribution of the budget allocated to Production and Marketing department Table 4: Mayuge district Production and Marketing Budget 2011/12 – 2014/15 (‘000)
2011/12 2012/13 2013/14 2014/15
Recurrent 197,738 226,484 670,631 546,593
Wage 126,366 134,514 541,911 416,702
Non-wage 71,372 91,970 128,720 129,890
GoU Development 1,923,177 2,090,522 1,255,504 340,240
Total 2,120,915 2,317,006 1,926,135 886,833
Table 4 shows that the development budget took the highest share from FY 2011/12 to FY 2013/14. In FY 2014/15 development was the second lowest with recurrent taking the loins

13
share. It is worth being noted that wages are also taking a relatively large amount even with the current challenge of under staffing in the department. Figure 6: Production & Marketing Budget - recurrent Vs development ('000)
Figure 6 further shows that part from FY 2014/15, most of the budget allocations were for development purposes. During FY 2013/14, the district allocated 670,631 million to recurrent expenditure which was the highest compared to other years. Development expenditures received the highest allocation in FY 2012/13. 3.4 Comparing Kabale and Mayuge Districts’ Production and Marketing budgets Figure 7: Comparison between Mayuge and Kabale production and marketing budget ('000)

14
This comparison is based on the fact that Mayuge and Kabale district were selected randomly for the study. Figure 7 reveals that Kabale district has invested more in the production and marketing department compared to Mayuge district; this may also explain the better performance in agriculture. The high budget allocation is also partly because Kabale district is a rural-urban district with a number of urban facilities and Mayuge is a rural district characterized with poverty and poor infrastructures.
15
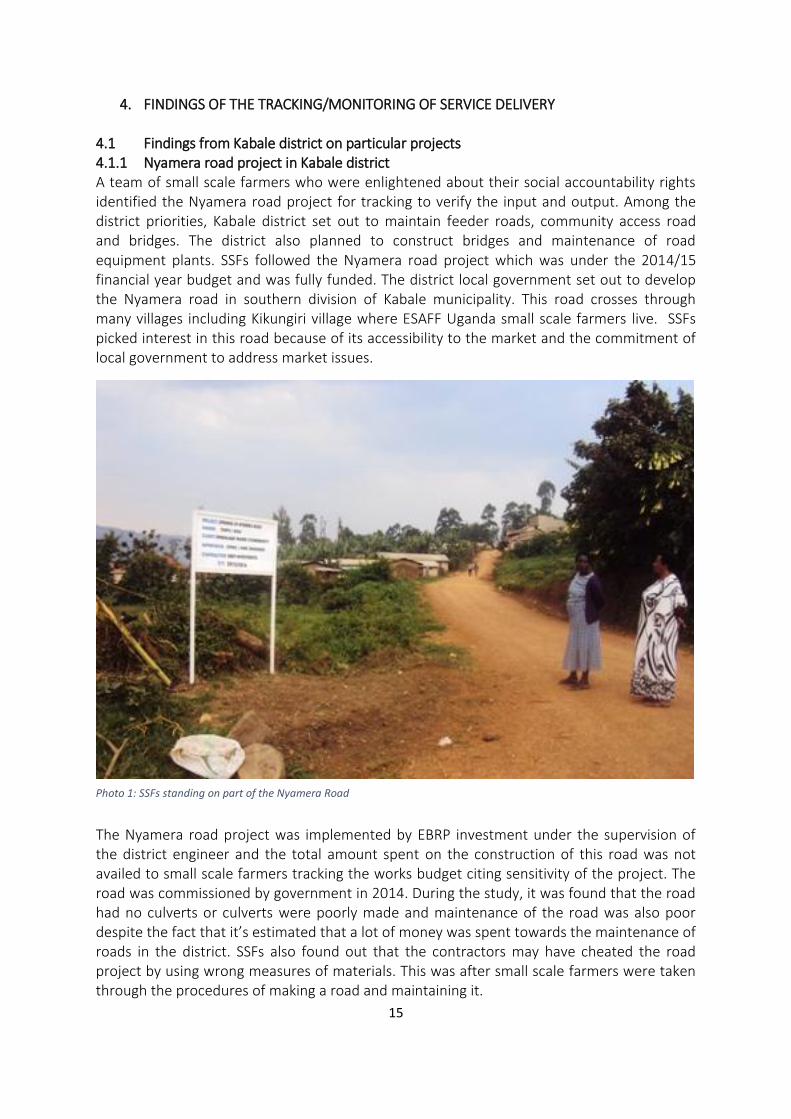
4. FINDINGS OF THE TRACKING/MONITORING OF SERVICE DELIVERY 4.1 Findings from Kabale district on particular projects 4.1.1 Nyamera road project in Kabale district A team of small scale farmers who were enlightened about their social accountability rights identified the Nyamera road project for tracking to verify the input and output. Among the district priorities, Kabale district set out to maintain feeder roads, community access road and bridges. The district also planned to construct bridges and maintenance of road equipment plants. SSFs followed the Nyamera road project which was under the 2014/15 financial year budget and was fully funded. The district local government set out to develop the Nyamera road in southern division of Kabale municipality. This road crosses through many villages including Kikungiri village where ESAFF Uganda small scale farmers live. SSFs picked interest in this road because of its accessibility to the market and the commitment of local government to address market issues.
The Nyamera road project was implemented by EBRP investment under the supervision of the district engineer and the total amount spent on the construction of this road was not availed to small scale farmers tracking the works budget citing sensitivity of the project. The road was commissioned by government in 2014. During the study, it was found that the road had no culverts or culverts were poorly made and maintenance of the road was also poor despite the fact that it’s estimated that a lot of money was spent towards the maintenance of roads in the district. SSFs also found out that the contractors may have cheated the road project by using wrong measures of materials. This was after small scale farmers were taken through the procedures of making a road and maintaining it.
Photo 1: SSFs standing on part of the Nyamera Road

16
In regards to this road, some key issues that would verify most of the findings by small scale farmers like bidding process, project documents, procurement among others were not provided. In some instances small scale farmers were asked to go back the next day until they got frustrated and abandoned the pursuit for this information. This made small scale farmers assume that there may have been a lot of unclear issues in the implementation of the project. 4.1.2 NAADS Project on Extension services in Kabale district Kabale district local government allocated some funds to the NAADS program in the district. In particular, shillings 100,000 UGX was allocated to each small scale farmer to receive seeds, fertilizers and hoes. During the time of the survey, it was found that SSFs received between 10 – 30kg of bean seeds which was worthy only 20,000 UGX. Findings also showed that extension workers aren’t available as most small scale farmers testified of not ever seeing any extension worker throughout the year. It was also pointed out that some extension workers ask for money to provide the services that is already paid for by the tax payer. Small scale farmers who were on the ESAFF PETS team failed to get most of the information relating to the procurement and implementation of this project. One farmer reported being told that the information they were asking for was confidential despite the fact that the Access to information Act gives small scale farmers power to request for all public information including budget information. This affected the result of the process as some information collected from village members and other small scale farmers couldn’t be verified. It should be noted that after analysing the challenges of NAADS in different districts, government transformed NAADS and the army (Uganda People’s Defence Forces [UPDF]) was put in charge of distributing the NAADS inputs in the country. We are yet to assess the changes brought by this policy shift from use of professional extension service providers to army officials. 4.2 Findings from Mayuge district on particular projects 4.2.1 Installation of culverts on Wante to Namakakale road in Namakakale swamp Small scale farmers in Namakakale village, Imanyiro sub county Mayuge district formed a PETS team to track local government expenditure on installation of culverts along Namakakale swamp. These culverts were to help improve transport for trade and reduce floods in the village as well as making the village accessible. It was reported that the community was paid 500,000 to lay the culverts without contracting a company as a method of community led development. But the community members did not acknowledge anywhere as having received this money meaning that transparency and accountability looked faulty or more money was released for work and the policy makers gave it out as an appreciation. The district bought the culverts and then delivered them to the village. It was observed that the village local council one was in-charge of the project. Information flow is still a challenge at sub-county and village level as local leaders and technical officers are adamant (not interested/willing) in sharing information with

17
communities though some leaders like councillors didn’t have any budget information to share. There was a testimony from a councillor who confessed to have not known about the development despite the fact that she is part of the council that approves work plans. Findings also revealed that the construction of the culverts was allocated 9,300,000/= and only 8,878,608/= was spent on the project under the LGMSD fund. The observation of the state of the culverts show that there was poor construction and the right procedures were not followed. Community members also expressed dissatisfaction with the way the construction was done acknowledging that there has been very little effort to maintain the culverts.
Community members also revealed that Kakira Sugar Works under the corporate social responsibility programme was grading the road though deducting 500 Uganda shillings per tonne of sugarcane from each out grower and yet they are tax payers meaning there was double taxation and fault with the Kakira Sugar Works social responsibility. Accessing documents to get proof about this work was futile as the policy makers at that sub-county did little to assist community members who were tracking the budget. The Senior Assistant secretary kept dodging the offices and giving false promises to be able to give the community information that was required.
Photo 2: PETS team for Mayuge district standing at the poorly constructed Culverts on Wante road
18
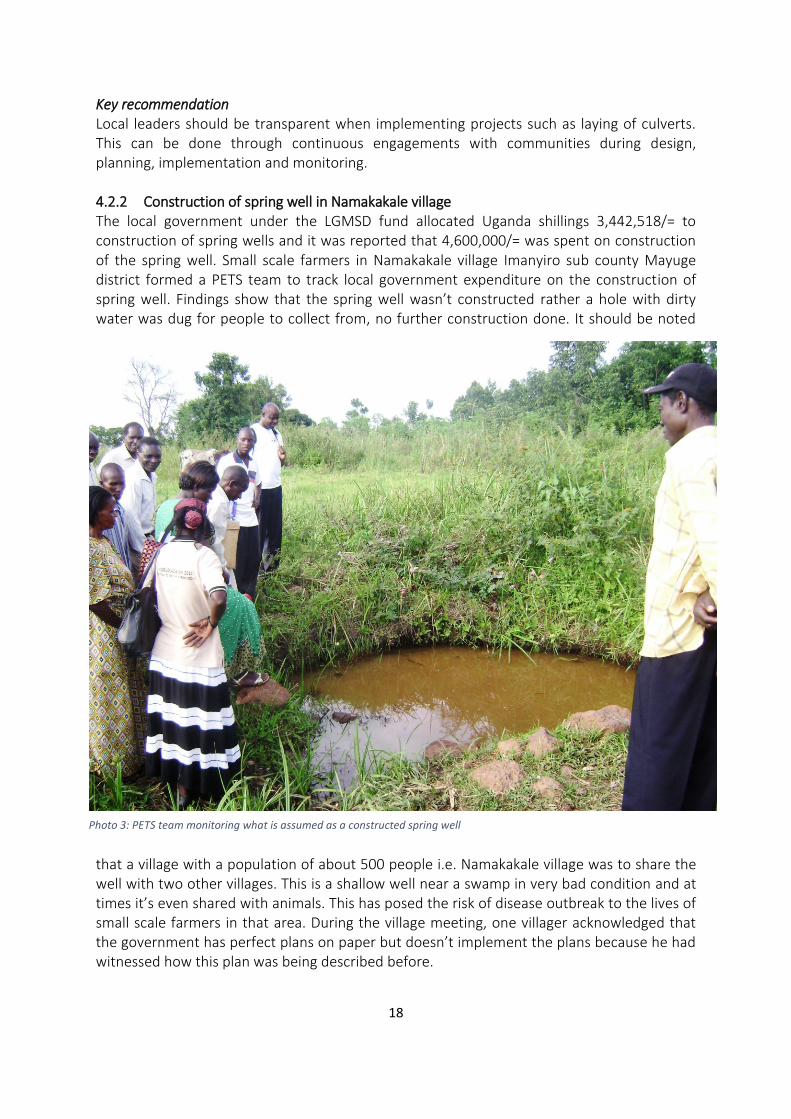
Key recommendation Local leaders should be transparent when implementing projects such as laying of culverts. This can be done through continuous engagements with communities during design, planning, implementation and monitoring. 4.2.2 Construction of spring well in Namakakale village The local government under the LGMSD fund allocated Uganda shillings 3,442,518/= to construction of spring wells and it was reported that 4,600,000/= was spent on construction of the spring well. Small scale farmers in Namakakale village Imanyiro sub county Mayuge district formed a PETS team to track local government expenditure on the construction of spring well. Findings show that the spring well wasn’t constructed rather a hole with dirty water was dug for people to collect from, no further construction done. It should be noted
that a village with a population of about 500 people i.e. Namakakale village was to share the well with two other villages. This is a shallow well near a swamp in very bad condition and at times it’s even shared with animals. This has posed the risk of disease outbreak to the lives of small scale farmers in that area. During the village meeting, one villager acknowledged that the government has perfect plans on paper but doesn’t implement the plans because he had witnessed how this plan was being described before.
Photo 3: PETS team monitoring what is assumed as a constructed spring well

19
Findings also revealed that local leaders don’t care about communities because few leaders could stand for the community as some played the blame game. Technical officers from Imanyiro Sub County were not willing to share information with small scale farmers; this gave an impression of mismanagement of funds with fear to be exposed. Though in the code of conduct and ethics for the Uganda public service (2004) part 4.5 about customer care from clause (i) to (iv) it spells out very well what a public officer must do. This was left in shelves and only applies for their superior bosses. It is also addressed very well in the Access to Information Act 2005 which was enacted by parliament and the constitution of Uganda 1995 this gives powers and mandates all citizens to have access to public information. Key recommendations There is need to involve beneficiaries in the development, implementation and monitoring of projects since some local leaders who represent communities do not report back to them as the case is supposed to be. Information sharing on government projects should be mandatory and communities should always be informed about all projects being implemented in their respective areas. This can be done through community radios, use of community notice boards, village meetings among others. 4.2.3 Distribution of banana sackers under NAADS Small scale farmers in Bukoli village, Wairasa Sub County tracked the distribution of the banana sackers. Findings show that the banana sackers were to be distributed in each village. The sub county of Wairasa has 23 villages. In Bukoli village, 17 farmer groups were indentified and only one farmer would benefit from each group and each farmer was allocated 100,000 UGX in form of banana sackers. The banana sackers were being distributed by NAADS officers at sub county level. Findings show that about 50 banana sackers were distributed to each farmer. Further investigation revealed that 100,000/= can buy 70 banana sackers which could be distributed to more than one small scale farmer. During focus group discussions, it was revealed that some SSFs didn’t know that banana sackers were being distributed. During the discussion one farmer said that the sackers were given to him in a wrong period of the season and were delivered in the night. According to the plan, banana sackers were to be delivered at the beginning of the season. It was assumed that small scale farmers receiving banana sackers were also to receive hoes but this didn’t happen with most of the small scale farmers. The quality of the banana sackers distributed was also questionable. NAADS program has been described as successful mainly in the area of farmer empowerment and adoption of improved technologies. During the discussions, it was identified that the biggest challenge with NAADS is, it is largely donor funded and centrally controlled hence influencing the way the programs are being implemented. A good example is the two occasions when the President suspended the funding of NAADS activities in the districts this affected many small scale farmers who were already benefiting from the NAADS program. The chairman and councillors of Wairasa Sub-county did also give a helping hand to the community members who were tracking the budget especially to be able to access information from the sub county. Though the technical people at the sub county were present they refused to release documents which they termed sensitive like the

20
procurement, contracts, quarterly releases, budget framework etc. Findings still revealed that the quarterly release and other document are not displayed at their notice board as stipulated by the law. Lastly the whole sub county failed to show evidence of having the five year development work plan. Key recommendations Improve accountability and transparency through mandatory display of NAADS releases and expenditures on accessible public notice boards. Improve on timely distribution of inputs and aligning the distribution of inputs with the planting season. Improve transparency in the procurement process to reduce complaints from beneficiaries. This can be done through having community representation on the procurement committee.
Photo 4: Photo of one SSFs garden in Wairasa sub-county with poor banana suckers received from NAADS

21
5. CHALLENGES, CONCLUSION AND RECOMMENDATION 5.1 Challenges of the study Limited access to information from both the district and sub-county leaders in both districts, it is imperative to note that despite the enactment of the Access to Information Act in 2005, both districts and sub-county leaders have continued to deny citizens their right to access information. Small scale farmers faced a lot of difficulties in accessing the required information and majority of the information was not got. A good example was in Mayuge district when the District councillor promised to lead SSFs to the CAO but he kept delaying the process until the time of writing this report. There was no involvement of the district and sub-county leaders during the design of the project. This explains why some district and sub-county leaders thought small scale farmers were from government anti-corruption bodies hence the hiding of very vital information relevant to this study. Some small scale farmers didn’t feel comfortable to contact their respective district and sub-county leaders despite the training on how to collect data. This affected the data collection process greatly. Timing of the PET study. The study was conducted in December and January and this made it hard for small scale farmers to access some of the required offices. For example; in Mayuge it was hard for small scale farmers to secure an appointment with the district chairperson and other district leaders. Difficulties in the transport system due to the geographical nature of Kabale with hills and narrow roads; and Mayuge have marram roads with a lot of dust. This slowed the data collection process as some of the SSFs suffered from dust related illnesses like flu. 5.2 Conclusion The PET study was relevant as it helped to track the allocation and usage of government funds. It was found out that the government has not adhered to the Malabo declaration target of allocating at least 10% of the National budget to the Agriculture sector hence the need for continuous advocacy. The study exposed some anomalies encountered in the procurement and implementation of government aided activities like the Installation of culverts on road along Namakakale swamp and the distribution of banana sackers under NAADS. The PET study was able to improve on the relationship between district/sub-county leaders with the small scale farmers for example some small scale farmers were able to create friendship with some district and sub-county leaders and this has facilitated their lobbying skills. In addition, for PETS to be effective there is need to sensitize and build capacity of small scale farmers to be able to monitor government programs and track the implementation of the district and sub-county budgets respectively. Both the civil society and the government needs

22
to devise means of sensitising the citizens on their respectively roles in the budget process, implementation and monitoring of government programs. 5.3 Lessons learnt The government of Uganda hasn’t adhered to the Maputo and Malabo declaration and CAADP targets of allocating 10% of the National budget to the Agriculture sector and working towards an annual Agriculture sector growth rate of 6%. Clear communication from the central government to the districts and lower local governments is still very poor. Sometimes the central government communicates to the lower governments through newspapers yet some districts don’t receive papers for the same day. The district production and marketing department is still largely underdeveloped with potential for significant growth and development. The department has continued to be a local government priority over the years though it has been given less attention. Quarterly allocations aren’t distributed on time and there is no linkage between the central and lower local governments. Mayuge district strategy focuses on ensuring food security as opposed to creating market surplus for agro-processing and exports which in turn can boost the Agricultural sector in the district. 5.4 Recommendations 5.4.1 National government The government needs to enhance its linkages with LGs through recruiting more staff particularly extension workers at the sub county level in a bid to address the inadequate staffing and empowering the District Production offices. Government needs to ensure that the DSIP is effectively implemented by harmonizing its budget estimates with the Medium term Framework (MTEF) and annual budgets. Government needs to develop client’s charters between the service providers and communities/ beneficiaries. Need to develop an approach to planning and review of the Agricultural policy to address current needs of SSFs. 5.4.2 Local government Considering that a majority of the rural population derive their livelihood from agriculture. The local government should allocate more resources to production and marketing department far beyond the Maputo/Malabo commitment of 10% of the national budget. Local Government both district and sub-counties need to improve on their planning and budgeting process through involving the key stakeholders such as small scale farmers.

23
Districts should increase public engagement in budget formulation, execution and evaluation through awareness creation and deliberate invitations to participate in the budget process. This will help to foster good governance in the respective districts. Local government needs to increase access to budget information through display of budget information on public notices boards, or announcements on radios and other local media where possible. The foregoing will tame corruption in the sector and increase service delivery efficiency. Need to develop a participatory approach to budgeting by consulting widely with critical stakeholders in the sector, especially the small scale farmers to seek their input into budgets in the agricultural sector at both National and lower levels. Small scale farmer groups and the media should take practical steps to engage members of
their respective districts and sub-county councils so that they can effectively engage the
budget during council meetings and make their inputs.
Need to promote budget transparency and accountability 5.4.3 Non State Actors The Non-state actors need to conceptualize the various policies and plans as well as the budget process to meaningfully engage government to increase budgetary allocation to agriculture sector. 5.4.4 Small scale farmers Small scale farmer organizations need to form a coalition and partner with the private sector foundation to explore opportunities for policy advocacy. There is need to build capacity of more small scale farmers to be able to track the budget of the district and ensure more participation in the budget process from village to district level. Small scale farmer groups and the media should take practical steps to engage members of their respective districts and sub-county councils so that they can effectively engage the budget during council meetings and make their inputs. Small scale farmers should prepare and present shadow budgets for their respective sub counties that represent their needs.
24
REFERENCES AU (2003) Assembly of the African Union Second Ordinary Session 10 - 12 July 2003 Maputo, Mozambique Assembly/Au/Decl.4- 11 (Ii) Declarations. GoU (2010) National Development Plan 2010/211-2014/2015. 418 pp. MFPED (2013) Uganda National Budget 2013/2014. MFPED (2014) National Budget Framework Paper FY 2010/11 – FY 2014/2015: Incorporating The Medium Term Macroeconomic Plan, Programmes for Social and Economic Development, and The Indicative Revenue and Expenditure Framework. 548 pp. Malabo Declaration on Agriculture (2014)