Buckling of bars and frames
69
TMR4205 Buckling and Ultimate Strength of Marine Structures Chapter 2: Buckling of Bars and Frames by Professor Jørgen Amdahl MTS-2010.02.21
Transcript of Buckling of bars and frames

TMR4205 Buckling and Ultimate Strength of Marine Structures
Chapter 2: Buckling of Bars and Frames
by
Professor Jørgen Amdahl
MTS-2010.02.21
TMR4205 Buckling and Ultimate Strength of Marine Structures 2. Buckling of Bars and Frames Page 2 of 69 CONTENTS
2. BUCKLING OF BARS AND FRAMES................................................................. 3
2.1 Buckling of Pin-Ended Column........................................................................................................................ 3
2.2 The Effect of Initial Imperfections ................................................................................................................... 7 2.2.1 Alternative Calculation of the Effect of Geometric Imperfection ......................................................... 8
2.3 The Influence of Lateral Load .......................................................................................................................... 9
2.4 Design of Beam-Columns................................................................................................................................. 12 2.4.1 Capacity of Columns............................................................................................................................. 12
2.5 Capacity of Beam-Columns............................................................................................................................. 16
2.6 Capacity of Beam-Columns according to ISO19902/Norsok N-004........................................................... 23 2.6.1 Local buckling ...................................................................................................................................... 23
2.6.1.1 Axial compression....................................................................................................................... 23 2.6.1.2 Bending........................................................................................................................................ 24 2.6.1.3 Hoop buckling ............................................................................................................................. 26
2.6.2 Column buckling ................................................................................................................................. 29 2.6.2.1 Interaction axial compression – local buckling .......................................................................... 30 2.6.2.2 Interaction axial compression – local buckling – hydrostatic pressure ..................................... 30 2.6.2.3 Interaction bending – hydrostatic pressure ................................................................................. 31
2.6.3 Failure of beam column accounting for local buckling and hydrostatic pressure ...................... 32
2.7 Buckling of Frames .......................................................................................................................................... 34 2.7.1 DnV Classification Note 30.1............................................................................................................... 34
2.8 Stiffness Matrix for a Beam With Axial Force ............................................................................................. 37
2.9 Torsional Buckling ........................................................................................................................................... 52 2.9.1 Fundamentals of Torsion (ref. Statics of Marine Structures) .............................................................. 52 2.9.2 Torsional Buckling................................................................................................................................ 55 2.9.3 Restrained Torsional Buckling (Ref. T. Soreide 5.65) ....................................................................... 61 2.9.4 Lateral-Torsional Buckling................................................................................................................... 64 2.9.5 Restrained lateral torsional buckling .................................................................................................... 67

TMR4205 Buckling and Ultimate Strength of Marine Structures 2. Buckling of Bars and Frames Page 3 of 69
2. BUCKLING OF BARS AND FRAMES
2.1Buckling of Pin-Ended Column
The pin-ended column, shown in Figure 2.1, is subjected to a compressive axial load.
M i
xl
y
z, w
N Nxw
Figure 2.1 Pin-Ended Column Under Axial Compression.
Considering a section at a distance x from the origin, the following moments act
,wEIM
xwNM
xxi
e
:moment Internal
:moment Externaly z (2.1)
Equilibrium yields,
0
, 0i e
xx
M M
EI w Nw
(2.2)
or,
0, where2 2xx
Nw w , k k
EI (2.3)
The solution to equation (4.3) is given by
sin cosw A kx B kx (2.4) where A and B are the constants determined from the boundary conditions. In this case,
0 0 0
0 sin 0
w B
w l A kl
For nontrivial solution, we must have
, 1,2,......kl n n
which implies that the smallest value of k is at n = 1, and is given as kl
. This yields

TMR4205 Buckling and Ultimate Strength of Marine Structures 2. Buckling of Bars and Frames Page 4 of 69
2
2cr E
EIN N N
l
(2.5)
When the column is loaded it will, initially, remain stable. However, when it is loaded beyond the buckling load it becomes unstable. The slightest deviation from the straight configuration will force the column to buckle. The point at which this occurs is often termed as bifurcation point, (see Figure 2.2). After buckling the deformation remains undetermined. Linear buckling theory does not yield information about the post buckling load-deflection relationship.
0 0.8
1.8
1.0
Stable path
Bifurcation pointPost-buckling path
Unstable path
Large deflection solution
wo/l
N/NE
Figure 2.2 Linear And Non-linear Buckling Solution.
ds
dx dyφ
φd
x
w
Figure 2.3 Exact Definition of Curvature.
In order to make the derivations valid for finite deflection a more accurate curvature expression must be introduced. That will be done using Figure 2.3. The exact definition of curvature reads
1 d = =
ds
(2.6)

TMR4205 Buckling and Ultimate Strength of Marine Structures 2. Buckling of Bars and Frames Page 5 of 69 where d is the change in angle, and ds is the arc length. Using Figure 2.3 we can write,
2 2 2ds dx dw (2.7)
tandw
dx (2.8)
d dx
dx ds
(2.9)
12 2
1ds dw
dx dx
(2.10)
Further, by taking the derivative of Equation (4.8), we obtain
cos
2
2 2
1 wd d dxdx
(2.11)
which implies that,
2
costan
2 22
2 2 2
2
2
d w 1 wd d dx 1dx dx
1 wd
dw dx1
dx
(2.12)
Hence, the exact curvature expression is
2
2
32 2
1
d wdx
dwdx
(2.13)
For small deflections, this expression approaches the linear expression, given as
2
2
wd
dx (2.14)
If the exact curvature expression is introduced in Equation (4.2), the differential equation becomes
3
22 21 0xx xw w w, ,k (2.15)
The exact solution for the above equation has been presented by Timoshenko. An approximate solution is given by
8
22o
E
N w = 1 + lN
(2.16)
TMR4205 Buckling and Ultimate Strength of Marine Structures 2. Buckling of Bars and Frames Page 6 of 69 This solution is traced in Figure 2.2. The capacity increases for large deflections. It is a fairly easy task to calculate the buckling length for other idealized boundary conditions. In all cases it is found convenient to relate the buckling strength of the actual compressed member with length l to the buckling strength of an equivalent pin-ended member with length le. The length le is termed the effective length of the actual member. The critical load of the actual member can now be written as
2
2cre
EIN
l
(2.17)
The ratio between the effective length and actual member length is denoted by K so that
el Kl (2.18)
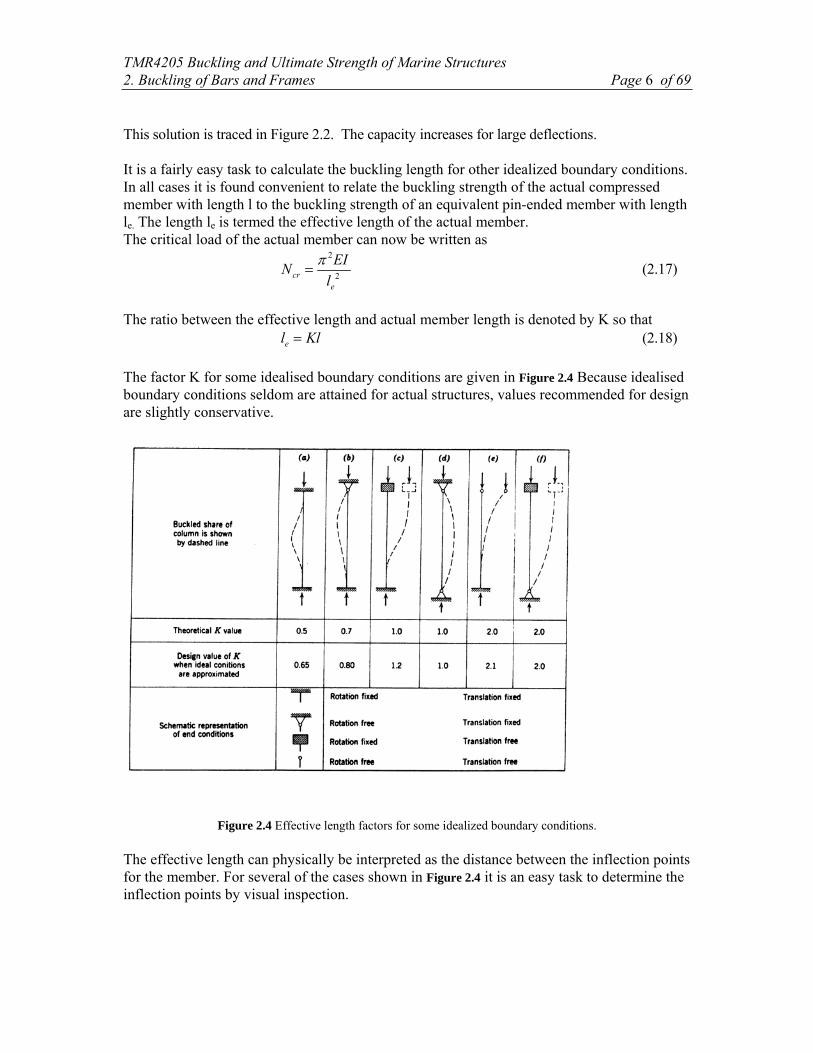
The factor K for some idealised boundary conditions are given in Figure 2.4 Because idealised boundary conditions seldom are attained for actual structures, values recommended for design are slightly conservative.
Figure 2.4 Effective length factors for some idealized boundary conditions. The effective length can physically be interpreted as the distance between the inflection points for the member. For several of the cases shown in Figure 2.4 it is an easy task to determine the inflection points by visual inspection.

TMR4205 Buckling and Ultimate Strength of Marine Structures 2. Buckling of Bars and Frames Page 7 of 69 2.2The Effect of Initial Imperfections
In a real structure, geometric imperfections always exist. Their effect on the critical load is discussed next by considering Figure 2.5.
0i
w0
w x
l
y
z, w
N N
Figure 2.5 A Column With Initial Imperfection.
Assume that the initial imperfection can be described by Equation (4.19) and the total deformation given by Equation (4.20),
sini oi
xw w
l
(2.19)
sino
xw w
l
(2.20)
Then, the critical load can be derived by means of energy methods. Using the effective curvature, the strain energy and the potential energy can be expressed, respectively, as
l 42 2
o oixx i xx
0
2l
2 2 2 2o oix i x
0
11U EI w, w , dx EI w w
2 l 22
1 1H N w, w , dx N w w
2 2 l 2
(2.21)
The critical load is obtained from the principle of minimum potential energy, 0U H ,
which gives,
w
w1Nw
wwEIN
w22
N2
ww2EI
o
oiE
o
oio2
ooio
0
2
1
2
124
(2.22)
or, 1
1o oi
E
w w N
N
(2.23)
where the second term can be considered as an amplification factor. In this case there is not such a true buckling problem. The column starts to deflect immediately.

TMR4205 Buckling and Ultimate Strength of Marine Structures 2. Buckling of Bars and Frames Page 8 of 69 The capacity is always smaller than NE (which is approached asymptotically), Figure 2.6. The larger the initial imperfection the more non-linear the response becomes.
wo
N
N E
1
wo wo
Increasing woi
Figure 2.6 Load-Displacement Relationship for Initially Imperfect Column.
2.2.1 Alternative Calculation of the Effect of Geometric Imperfection
External moment: eM N w x
Internal moment: , ,i xx i xxM EI w w
Equilibrium yields,
2
, , 0
, ,
xx i xx
xx i xx
EI w w Nw
w k w w
(2.24)
The total solution to Equation (4.24) is given by the sum of the homogeneous solution, wh, and the particular solution, wp.
Homogeneous solution:
sin 0
for
0 otherwise.
h
E
w A kl
kl N N
A
Particular solution:
Assume sini io
xw w
l
, then the particular solution can be written as
sinp
xCw
l
(2.25)

TMR4205 Buckling and Ultimate Strength of Marine Structures 2. Buckling of Bars and Frames Page 9 of 69 where the constant, C, is determined from Equation (4.24) by
2 2
2ioC Ck w
l l
(2.26)
which gives,
2
2
1
1io io
E
lC w wNNNl EI
(2.27)
The term 1
1E
N
N
can be interpreted as an amplification factor.
Then, the total solution (for N < NE) can be written as,
1sin
1iop
E
xw w wN
N
(2.28)
1 and the bending moment
1sin
1io
E
xM Nw Nw N
N
(2.29)
is amplified accordingly. The deformations start to grow immediately when imperfections are present. The axial force approaches NE asymptotically for large deformations.
2.3The Influence of Lateral Load
Consider the beam shown in Figure 2.7, which is subjected to a lateral load of sinusoidal distribution.
0πq = q sin( x/l)
x
l
z, w
N N
Figure 2.7 A Beam-Column with Lateral Load.

TMR4205 Buckling and Ultimate Strength of Marine Structures 2. Buckling of Bars and Frames Page 10 of 69 Previously, the differential equation was established considering moment equilibrium as,
, 0e
i
xxM
M
EI w Nw
(2.30)
If this equation is differentiated twice, an equilibrium equation with respect to an equivalent lateral load is obtained,
0xxxx xxEI w Nw, , (2.31)
This lateral force must balance the true lateral force, i.e.
sin
sin
xxxx xx o
2 oxxxx xx
xEIw Nw q, ,
lxq
w w, ,kEI l
(2.32)
The total solution is given by h pw w w . The homogeneous solution, wh, is as for a pure axial
force, and the particular solution is assumed to be
sinp
xCw
l
(2.33)
which, when inserted to Equation (4.33), gives
4 2
2 oqC Ck
l l EI
(2.34)
4
1 1
1 1
oo
E E
lqC wN NEI
N N
(2.35)
where wo is the deformation at mid-span when N = 0. The bending moment can be determined from equilibrium considerations or from the relationship:
EE
xx
N
NM
N
Nl
qEIwM
1
1
1
1, 0
2
0
We find the same amplification factor for sinusoidal lateral loading as the one obtained for sinusoidal initial imperfection. This is always the case if the first order moment has exactly the same shape as the second order (additional bending moment). In all other cases, this is not exactly correct. In most cases, however, the amplification factor may be used with good accuracy for more general load cases. This is shown for some simple load cases in Figure 2.8, and given in Table

TMR4205 Buckling and Ultimate Strength of Marine Structures 2. Buckling of Bars and Frames Page 11 of 69 2.1. The actual buckling length has to be used in assessing the amplification factor. The amplification factor,
1
1E
N
N
(2.36)
is always good for a maximum deflection (~2-3% deviation), but is somewhat poorer for maximum bending moment. Despite this it is widely used. Although the discrepancy can be significant for large axial force, it should be recalled that the total stress is dominated by the mean compressive stress, so that the discrepancy for the total stress becomes significantly smaller.
0 0.4 0.8 1
N/N
0
2
4
6
8
Am
plif
icat
ion
Fact
or
E
Load Cases 1-4,and 1/(1-N/N )E
0 0.4 0.8 1
N/N
0
2
4
6
8
Am
plif
icat
ion
Fact
or
E
Load Cases 2and 1/(1-N/N )E
Load Case 1 & 3
Load Case 4
(a) Amplification Factors for Mid-span Deflection. (b) Amplification Factors for Mid-span Moment.
Figure 2.8 True versus Simplified Amplification Factor for Some Load and Boundary Conditions.
Table 2.1 True Amplification Factors For Some Load Cases.
Load case 1 2 3 4
2 2
2
2
kla
N
EI l
N N
P
L
N N
q
N N
P
N Nq
maxwf 2
3 tan1
a
a a
2
4
24 11
5 cos 2
a
a a
3
24tan
2 2
a a
a
3
24tan
2 2
a a
a
mf tan a
a
2
2 11
cosa a
tan22
a
a
2
2 11
cosa a

TMR4205 Buckling and Ultimate Strength of Marine Structures 2. Buckling of Bars and Frames Page 12 of 69 2.4Design of Beam-Columns
2.4.1 Capacity of Columns
So far, the elastic buckling behaviour has been assumed. For typical column geometries, however, yielding will take place before buckling occurs. It is very difficult to take this into account in a rigorous way. Instead, semi-empirical formulas are resorted to. The capacity is then expressed as a function of column slenderness or reduced slenderness. Such curves implicitly take the followings into account:-
elasto-plastic material behaviour initial distortions (within reasonable tolerance limits) residual stresses from fabrication cross-sectional shape deviation from nominal cross-sectional dimensions variation of yield stress over cross-section.
The elastic Euler buckling stress can be written as
2 2 2
E 2 2k k
EI EiAl l
(2.37)
where the radius of gyration, i, and the slenderness, , are expressed as
and kI li =
A i (2.38)
Hence, the slenderness, uniquely, defines the Euler stress
2
E 2
E
(2.39)
The slenderness that gives E Y is denoted as Y, i.e.
2
Y 2Y
E
(2.40)
Normalizing the Euler stress, there is obtained
2
2
1E Y
Y
(2.41)
where is the reduced slenderness. The normalized Euler stress is plotted in Figure 2.9. It is seen that the Euler stress exceeds the
yield stress for a reduced slenderness ratio of 1< . This is unreasonable, therefore a transition curve must be introduced as indicated. The transition curve, which is generally on the basis of experiments and numerical analyses, may vary from one code to another.

TMR4205 Buckling and Ultimate Strength of Marine Structures 2. Buckling of Bars and Frames Page 13 of 69
E
Y
1.0
0.5
1.0 2inelastic elastic
Euler
Transition curve
Proportionality limit
Figure 2.9 Normalized Buckling Stress. SSRC (Structural Stability Research Council), (AISC, API) Tubular columns.
Johnson-Ostenfeld correction:-
cr E 1
2E
Y
1
1cr YE Y4
1
2E
Y
This can also be written as,
2
12cr
Y
211
4cr
Y
2
ECCS (European Convention for Constructional Steelwork), (NS, DNV)
The ECCS design curve is based on the first yield criterion for a column with a sinusoidal imperfection. The total stress is composed of one contribution from pure axial compression and one from bending due to initial imperfection with amplification.
1
1
x iox Y
x
E
AwW
(2.42)
where x is the axial stress, A is the cross-sectional area, wio is the initial imperfection, W is the elastic modulus, and Y is the yield stress. This expression can also be formulated as

TMR4205 Buckling and Ultimate Strength of Marine Structures 2. Buckling of Bars and Frames Page 14 of 69
0
2
11
1
x x i
xY Y
Y
Aw
W
(2.43)
Based on a large number of tests, numerical simulations and curve fitting, ECCS substituted the term
io o
Aw
W (2.44)
where and o are the coefficients depending on the cross-sectional shape and the fabrication
method. They represent both the real imperfections and the residual stresses. governs the degree of reduction compared to the Euler buckling curve, and o represents the cut-off limit by
which the critical stress is equal to the yield stress. The factors are determined such that the initial stress shall fit the results of numerical simulation and experiments. Equation (4.43) may be solved with respect to the critical stress.
2 2
2
20
11
2
cr
Y
where
(2.45)
The various design curves are shown in Figure 2.10. . They can be calculated numerically by using the coefficients given in Table 2.2. A somewhat simpler expression is obtained if the nominator and denominator in Equation
(4.45) are multiplied with the term 22 . Then the critical stress can be expressed as
2 2
1cr
Y
(2.46)
Remark:
By rearranging Equation (4.43), the equivalent imperfection can also be formulated as
o
o
Yio
z
i
Elw 1
1 (2.47)
where zo is the distance from the neutral axis to the extreme fibre of the cross-section and i is the radius of gyration. For a thin-walled tube with Y = 250 MPa, the expression becomes
0 0015 1i ow = .l
(2.48)
Hence, the equivalent imperfection approaches asymptotically 0.0015 times the member length. This coincides also with the typical tolerance requirements for member out-of-straightness given in the codes.
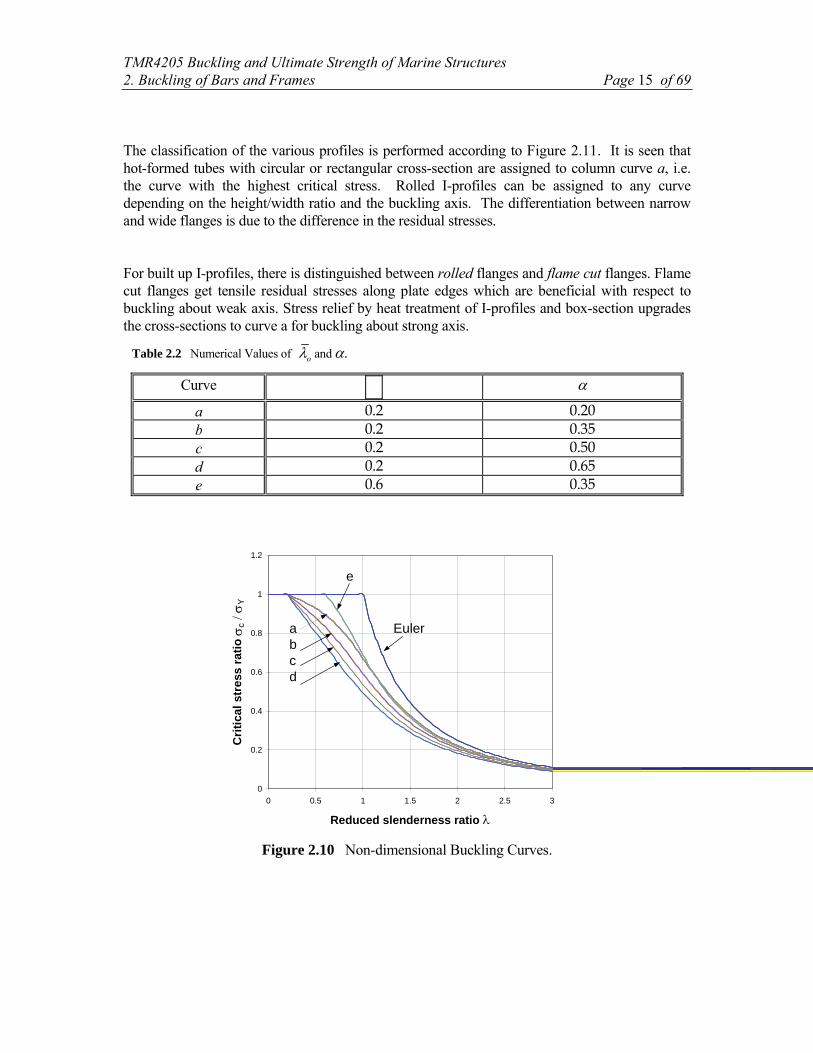
TMR4205 Buckling and Ultimate Strength of Marine Structures 2. Buckling of Bars and Frames Page 15 of 69 The classification of the various profiles is performed according to Figure 2.11. It is seen that hot-formed tubes with circular or rectangular cross-section are assigned to column curve a, i.e. the curve with the highest critical stress. Rolled I-profiles can be assigned to any curve depending on the height/width ratio and the buckling axis. The differentiation between narrow and wide flanges is due to the difference in the residual stresses. For built up I-profiles, there is distinguished between rolled flanges and flame cut flanges. Flame cut flanges get tensile residual stresses along plate edges which are beneficial with respect to buckling about weak axis. Stress relief by heat treatment of I-profiles and box-section upgrades the cross-sections to curve a for buckling about strong axis.
Table 2.2 Numerical Values of o and .
Curve
a 0.2 0.20 b 0.2 0.35 c 0.2 0.50 d 0.2 0.65 e 0.6 0.35
0
0.2
0.4
0.6
0.8
1
1.2
0 0.5 1 1.5 2 2.5 3
Reduced slenderness ratio
Cri
tica
l st
ress
ra
tio
c
Y
abcd
e
Euler
Figure 2.10 Non-dimensional Buckling Curves.

TMR4205 Buckling and Ultimate Strength of Marine Structures 2. Buckling of Bars and Frames Page 16 of 69
Figure 2.11 Column selection Chart.
2.5Capacity of Beam-Columns
Beam-columns are characterized by simultaneous action of axial force and lateral load. The capacity under combined loading is often presented in the form of interaction diagrams. For pure axial compression the critical load should be equal to the buckling force, and for pure bending the bending moment should approach the plastic bending moment, Mp, or first yield moment, MY, (provided that local buckling does not take place). For design purposes a linear interaction is very often used.
1or
max
Y pcr
N M N M M
(2.49)
where Ncr is the characteristic buckling strength from the column curve, and Mmax is the maximum moment including amplification due to axial compression.

TMR4205 Buckling and Ultimate Strength of Marine Structures 2. Buckling of Bars and Frames Page 17 of 69
N
N p
M
Mp
l/i=0
2040
60
1
1 Figure 2.12 Interaction Diagram for Beam Columns.
N N
Mo Mo
Figure 2.13 Beam Column with Constant Moment. For the beam-column shown in Figure 2.13, the exact amplification factor is given by
1
cos2
max o
E
MMN
N
(2.50)
Using Taylor’s expansion, we can write
22 41 1
cos 12 2 2 24 2
1 for
E E E
EE
N N N
N N N
N N N
N
(2.51)
implying that the expression for the maximum bending moment can be rewritten as
1
1max o
E
M M N
N
(2.52)
Then, the interaction equation will appear as
1o
crY
E
N MNN 1 MN
(2.53)
For other non-symmetric bending moments it is not straight-forward to determine the exact location of the critical section. Instead, Mo is substituted by an equivalent moment, Meq = CMMo.

TMR4205 Buckling and Ultimate Strength of Marine Structures 2. Buckling of Bars and Frames Page 18 of 69
2
1
1
0.6 0.4 , 0.4
oM
crY
E
M
N C M NN 1 MN
M CM
(2.54)
where 1 oM M , is the larger end moment. On stress form,
1
1x M b
cr YE
WCZ
(2.55)
where W and Z are the elastic and plastic section modulus, respectively. The variation of CM is shown in Figure 2.14, and for other load conditions, they are given in the codes (e.g. AISC).
CM
M1 M1M2 M2
1
1.0
0.4
- 1 0 1
N N
M /M2 Figure 2.14 Variation of CM Coefficients.
It should also be checked that the state of force does not violate the plastic interaction function for combined loading. AISC
11.18 pp
N M
N M for I-profiles
cos 02p p
M N
NM
for thin-walled tubes.
where p YN A , is the plastic axial force.
ECCS - NPD A fictitious eccentricity, e* ( wio), is introduced. It represents the combined effect of imperfections, residual stresses, etc. and is determined such that the extreme case of pure column buckling is included, (i.e. N Ncr for Mo = 0). A first yield criterion is used.
*
11
cr cr
Yp cr E
eN NNN N M
(2.56)

TMR4205 Buckling and Ultimate Strength of Marine Structures 2. Buckling of Bars and Frames Page 19 of 69
* 1 1
1 1
1 1
Ycr cr
p E cr
p Ycr
cr E p
Y cr
cr E
N N M eN N N
N N M N N N
W
A
(2.57)
Remark: This is an alternative way of determining the equivalent imperfection, (cfr. Equation (4.48)), but here the critical stress, cr, is determined for a given slenderness. For combined axial force and bending moment the critical force, Nc, is obtained from the following interaction formula,
*
1oc c M
pY Y
E E
eN N C MN NN 1 1M MN N
(2.58)
where the two first terms represent a contribution from buckling due to a pure axial force and the third term is the bending contribution. The limiting bending moment is, in this case, assumed to be the first yield moment, MY. Alternatively, this can be expressed in terms of the critical stress, c, as
1 1
*
1 1 1 1 1c Y cr c c M o c
Y cr E Y E Y E
b Y
C
(2.59)
The expression in the large bracket, b*/Y, can be considered to be an equivalent design bending
stress accounting for out-of-straightness and residual stresses. The above equation can be used for axial compression and end moments (frame action). For members subjected to combined lateral load, end moments and axial compression force, the bending stress distribution can be sketched as shown in Figure 2.15.
b1 b2
b2*
b3
Figure 2.15 Bending Stress Distribution. Here,

TMR4205 Buckling and Ultimate Strength of Marine Structures 2. Buckling of Bars and Frames Page 20 of 69 b1 : bending stress from end moments at end 1 b2 : total bending stress at midsection b3 : bending stress from end moments at end 2 b2
* : bending stress from lateral load, calculated for simply supported ends. The total stress at mid-section is
31*
22 5.0 bbbb (2.60)
The equivalent bending stress for buckling control, according to AISC, is taken as
*1 32 0.6 0.4eq b bb (2.61)
The latter two terms are those associated with the end moments only. By combining Equations 4.60 and 4.61, we obtain
2 1 30.1eq b b b (2.62)
NPD uses a slightly more conservative formula to account for the possibility that the maximum stress may occur outside the mid-section, (see Figure 2.16)
*2 0.7 0.3eq b 1 3 (2.63)
This yields the following equation,
2 1 30.2eq b b b (2.64)
Where the above formula yields conservative results, more accurate formulas from NS can be used in some cases. Therefore, the final NPD formula reads
1 11
1 1
*eqc b
c cY Y Y
E E
(2.65)

TMR4205 Buckling and Ultimate Strength of Marine Structures 2. Buckling of Bars and Frames Page 21 of 69
M1 M1M2 M2
σ /σ3 1
σ /σ1eq
AISC
1.0
0.4
- 1 0 1
N N
NPD
Figure 2.16 Equivalent Stress.
In a practical check, partial safety factors are included and bending about two axes is considered. The final design equation reads
2 21 11
*
min1 1 1
z
c c Ycc b by bxmk
E Ey E m
(2.66)
where,
m = 1.15 : material coefficient. mk > 1.0 : for structures sensitive to geometric imperfections or residual stresses,
(e.g. for isolated beam-columns is 1.10, shell structure mk( )). mk = 1.0 : for frames; when the design load effects are based on the elastic frame analysis connections are moment resistant.
= minimum : is the smaller of the Euler bending stresses about y- and z-axes.
Hence, a quadratic interaction is used for bending about the two axes and different magnification factors are employed. This differs somewhat from the DNV procedure described below. If the cross-section is susceptible to local buckling on the compression side before attaining yield, the yield stress in Equation 4.66 should be replaced by the critical stress for local buckling. Local buckling of cylindrical shells is considered in Chapter 9. DNV-Classification Note 30.1 The following interaction formula is adopted, (allowable stress design).
c b
ccrbcr
E
(1 )
(2.67)
1.311.5
m
Fm F
(2.68)

TMR4205 Buckling and Ultimate Strength of Marine Structures 2. Buckling of Bars and Frames Page 22 of 69 where is the usage factor, and is a factor accounting for redistribution capabilities in the same manner as mk in the NPD formula ( 4.67). b is the maximum bending stress considered in the design check and it depends on the boundary conditions:-- For members braced against joint translation, b is the maximum bending stress within l/3 of the mid-span, while for members not braced against joint translation, b is the overall maximum bending stress.
l/3l
b
b
b
b
b
(a) Members braced against joint translations.
(b) Members with possibilities of joint
translations.
Figure 2.17 Maximum Bending Stress for Different Boundary Conditions.
bcr is the characteristic buckling stress for bending. For bending about weak axes and for bending of stocky members about the strong axis, bcr = Y. For more slender members subjected to bending about the strong axis and not sufficiently restrained against buckling about the weak axis, failure may occur in the form of lateral-torsional buckling. In this case, the critical stress, bcr, should be replaced by the critical stress for lateral-torsional buckling, V, (see Section 2.9.4 The amplification factor is always calculated for weak axis bending, irrespective of whether the actual bending stress, b, refers to strong axis or weak axis bending. For doubly symmetrical H- and I-shaped and rectangular box sections subjected to simultaneous axial compression and bending about two-axis, DNV specifies a linear interaction formula,
1 1
byc bz
c ccrbcr Y
E E
(2.69)
where the suffices y and z relate to strong axis- and weak axis-bending, respectively. Note that the same amplification factor is used in both directions (E relates to weak axis buckling). For a sidesway prevented case, yielding must be checked at the point of maximum bending, if it occurs outside l/3 of mid-span.

TMR4205 Buckling and Ultimate Strength of Marine Structures 2. Buckling of Bars and Frames Page 23 of 69
2.6 Capacity of Beam-Columns according to ISO19902/Norsok N-004
According to ISO 19902 /7/ brace members in offshore structures are checked with respect to:
1) Local buckling of thin-walled members 2) Beam-column failure 3) Tension failure
There is significant interaction between different failure modes. This interaction must be accounted for. In addition, for deep water platforms, the resistance will be influenced by the effect of hydrostatic pressure.
2.6.1 Local buckling
2.6.1.1 Axial compression
Short tubular members subjected to axial compression will fail either by material yielding or local buckling, depending on the diameter-to-thickness (D/t) ratio. Tubular members with low D/t ratios are generally not subject to local buckling under axial compression and can be designed on the basis of material yielding, i.e., the local buckling stress may be considered equal to the yield strength. However, as the D/t ratio increases, the elastic local buckling strength decreases, and the tubular should be checked for local buckling.
The local elastic buckling strength for shells subjected to axial compression is
xe x
tf C E
r (2.70)
in which t is wall thickness of the member and r is the radius (refer section. Theoretically Cx should be equal to 0.6 (refer Chapter 5. However, shells are very sensitive to imperfections. In order to comply with tolerance limits for fabrication, a reduced value of Cx = 0.3 is used.
In the elasto-plastic range the characteristic local buckling resistance is determined from:
2
1 0 0 412
1 047 0 274 0 412 1 382
1 382
cl
y
cl
y
cl ce
f. .
f
f. . . .
f
f f .
(2.71)
in which y
xe
f
f

TMR4205 Buckling and Ultimate Strength of Marine Structures 2. Buckling of Bars and Frames Page 24 of 69 A comparison between test data and the characteristic local buckling strength equation, is shown in Figure 2.18. The developed equations have a bias of 1.065, the standard deviation of 0.073, and the coefficient of variation of 0.068.
The elastic local buckling stress represents one-half of the theoretical local buckling stress computed using classical small-deflection theory. The reduction accounts for the detrimental effect of geometric imperfections. Based on the test data the reduction is considered to be conservative for cylinders with t 6 mm and D/t < 120. Offshore platform members typically fall within these dimensional limits. For thinner cylinders and cylinders with higher D/t ratios, larger imperfection reduction factors may be required. Reference is made to Section 5: Buckling of Cylindrical Shells
Figure 2.18 Local buckling strength of cylinders subjected to axial compression – comparison of design curve and tests data (from ISO 19902)
2.6.1.2 Bending
The behaviour of tubular members subjected to bending can be grouped into three categories, refer Figure 2.19;
i. High rotational capacity; the bending moment may attain the fully plastic bending moment and maintain this level significant rotation. The failure mode is ductile, exhibiting very gradual decay of the resistance - A2(24)
ii. Intermediate rotational capacity; the bending moment may still attain the fully plastic bending moment, but cannot maintain this level for significant rotation. The failure mode is semi-ductile failure mode, exhibiting gradual strength decay - A5(48).
iii. Low rotational capacity; the maximum bending moment may be no more than the yield moment or even less. Little post-ultimate ductility exists, the resistance exhibits a rapid decay - A8(96).

TMR4205 Buckling and Ultimate Strength of Marine Structures 2. Buckling of Bars and Frames Page 25 of 69
Figure 2.19 Typical normalized moment-rotation curves for cylinders for various D/t-ratios (MPS is plastic bending moment)
The governing parameter for the bending ultimate bending moment resistance is the “slenderness” parameter:
2yeq
f=
tE
D
(2.72)
The resistance is defined by the following set of equations for the three categories:
m
y
f Z
f W 0.0517yf D
Et (2.73)
1 13 2 58 ym
y
f Df Z. .
f Et W
0.0517 0.1034yf D
Et (2.74)
0 94 0 76 ym
y
f Df Z. .
f Et W
0.1034 120y yf D f
Et E (2.75)
where
W = elastic section modulus
= 4 4( 2 )
32
D D t
D
Z = plastic section modulus
= 3 31( 2 )
6D D t

TMR4205 Buckling and Ultimate Strength of Marine Structures 2. Buckling of Bars and Frames Page 26 of 69
For 0.170y
cle
f
f the tubular is a class 4 cross section and may behave as a shell, refer Section
5.
Note that the allowable bending stress may exceed the yield strength. This is because the stresses are determined by elastic analysis and elastic section modulus. As plastic bending may be accepted, it is necessary to use an equivalent bending stress which exceeds the yield stress.
The allowable bending stress according to ISO19902/Norsok N-004 is plotted in Figure 2.20 versus the slenderness along with results from experiments. The design curve represents a lower fractile in the distribution of the test results. On the average the tests results are 10% higher than the design curve. The bending stress corresponding to first yield and fully plastic bending moment for a thin-walled section are indicated.
Figure 2.20 Normalised allowable bending stress for cylinders - comparison of test data and design equations (from ISO19902)
2.6.1.3 Hoop buckling
Closed, unstiffened cylinders subjected to hydrostatic pressure will experience compressive stresses in the axial and ring direction, respectively. Simple equilibrium considerations show that the ring stress is twice the magnitude of the axial stress.
Plastic thin-walled
Yield

TMR4205 Buckling and Ultimate Strength of Marine Structures 2. Buckling of Bars and Frames Page 27 of 69
2x
pr
t (2.76)
h
pr
t (2.77)
Ring stiffeners affect the ring stresses at the position of the rings. If distance between the rings is smaller than a certain value, the ring stress midway between the rings is also affected. Otherwise it may be taken equal to the stress for an un-stiffened tube. Reference is made to section 5.
The longitudinal stress does not cause contribute to elastic buckling. This is explained as once the tubular should deform laterally, the increase/decrease of wall surface will cause the hydrostatic pressure to restore the tube. However, both stress components will affect elasto-plastic column buckling through the material part.
Figure 2.21 Stresses in closed, unstiffened circular cross-sections for external hydrostatic pressure
The compressive stresses make the tubular susceptible to elastic or inelastic local buckling of the shell wall between the restraints. Once initiated, the collapse will tend to flatten the member from one end to the other.
Ring-stiffened members are subject to local buckling of the shell wall between rings, while the rings remain essentially circular. However, the rings may rotate or warp out of their plane. Ring-stiffened tubular members are also subject to general instability, which occurs when the rings and shell wall buckle simultaneously at the critical load. It is desirable to provide rings with sufficient residual strength to prevent general instability. Reference is made to Section 5, Buckling of Cylindrical Shells
As shown in Section 5.4.4 long cylinders fail by ovalisation with with 2 waves in the circumferential direction, i.e. n = 2. The elastic hoop buckling strength, fhe, is given by
2t
0.275Ehefr
(2.78)
Hoop stress from external
hydrostatic pressure h=pr/2t
h Axial stress from capped end forces x=0.5 h q,Sd
p

TMR4205 Buckling and Ultimate Strength of Marine Structures 2. Buckling of Bars and Frames Page 28 of 69 This may also be written as
t
2he hf C ED
(2.79)
where Ch = 0.55t/D. In order to account for possible out-of roundness up to 1 percent, the elastic hoop buckling stress is taken as 0.8 of the theoretical value from classical small deflection theory. This gives, Ch=0.44t/D.
The out-of roundness in % is defined as
nom
minmax
D0.01
DD (2.80)
where Dmax and Dmin are the maximum and minimum of any measured diameter at a cross section and Dnom the nominal diameter.
For shorter cylinders the Ch value increases. In the ISO code Ch is expressed as functions of the parameter defined as
0 72L D
. ZD t
21 9Z . (2.81)
where Z is the Batdorf parameter, refer Section 5, and L is length of tubular between stiffening rings, diaphragms, or end connections
Ch = 0.44 t/D for 1.6D/t = 0.44 t/D + 0.21 (D/t)3/4 for 0.825D/t < 1.6D/t = 0.737/( - 0.579) for 1.5 < 0.825D/t = 0.80 for < 1.5
For short cylinders, the buckling coefficient is equal to 80% of the buckling coefficient of a plane, wide plate, i.e 0.80 x 1= 0.80.
The elastic buckling stress is modified for plasticity as follows:
0 8
1 0 64
0 70 64 1 35
1 35
h
y
h.
y
h he
f.
f
f .. .
f
f f .
(2.82)
where y
he
f
f
For ring-stiffened members, Eq. 2.82 gives the hoop buckling strength of the shell wall between the rings.
The design curve for hoop buckling strength is compared with test results in Figure 2.22. The bias is 14% with a coefficient of variation of 0.12.

TMR4205 Buckling and Ultimate Strength of Marine Structures 2. Buckling of Bars and Frames Page 29 of 69
Figure 2.22 Hoop buckling strength of fabricated cylinders subjected to hydrostatic pressure- test data compared with design equation (from ISO19902)
For members with out-of-roundness greater than 1 %, but less than 3 %, a reduced elastic hoop buckling strength, fhe, should be determined (Ref. /3/). The characteristic hoop buckling strength, fh, is then determined using a reduced elastic buckling strength
0.8
fαf he
he (2.83)
in which
= geometric imperfection factor
= max min1 0.2 1 0.20.01 nom
D DOOR
D
2.6.2 Column buckling
The characteristic axial compressive resistance for tubular member is determined on the basis of Johnson-Ostenfeldt expression. For large slendernesses the critical stress is equal to the Euler buckling stress, except for a 10% reduction
c2
y
f 0.9for 1.34
f
(2.84)
where
2
2,yE
E
f EIf
f k A
k is the effective buckling length factor.
For stockier members modification for plasticity is carried out using the conventional Johnson-Ostenfeldt correction with a 10% increase:

TMR4205 Buckling and Ultimate Strength of Marine Structures 2. Buckling of Bars and Frames Page 30 of 69
21.0 0.28 for 1.34c
y
f
f (2.85)
2.6.2.1 Interaction axial compression – local buckling
Interaction between local wall buckling and column buckling is simply carried out by replacing the yield stress fy in the column equations with the local buckling resistance fcl given in Section 2.6.1.1
2.6.2.2 Interaction axial compression – local buckling – hydrostatic pressure
Hydrostatic pressure causes a hoop stress x = pr/t and axial stress x = pr/2t in closed cylinders. This presence of these stresses reduces the stress available for elasto-plastic column buckling. The column buckling stress, fch , which accounts for the effect of hydrostatic pressure is calculated through the following interaction equation:
The following interaction is adopted: 2
21 0
1
ch c x ch x x x
cl cl cl cl cl cl cl
f f f 2, λ 1.34 (1 )
f f f f f f f
(2.86)
where fcl is the equivalent yield stress accounting for local buckling and fc is the basic column buckling strength .
Solved with respect to fch this becomes:
1
2 2 x
cl
1 2 2[ 1.12 ], λ 1.34 (1 )
2 fch x x
cl cl cl
f
f f f
(2.87)
where 21 0.28λ
For reduced slendernesses exceeding the above value there is no reduction due to hydrostatic pressure.
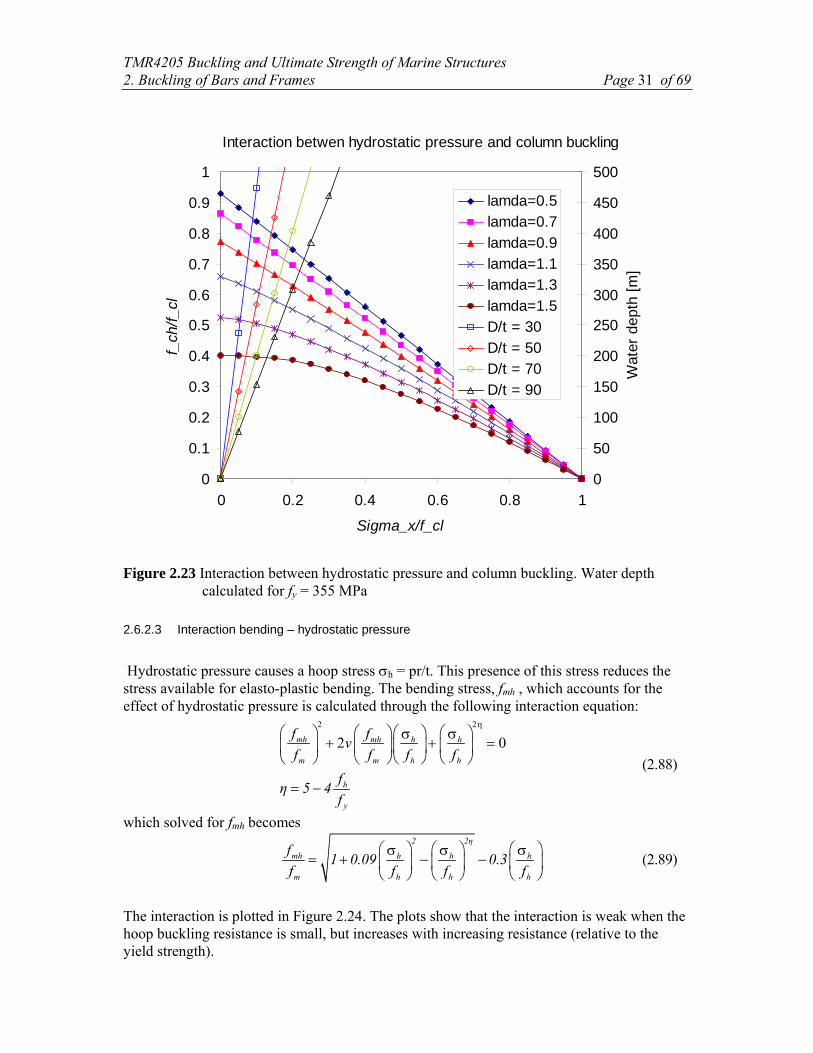
The interaction relationships are plotted in Figure 2.23 for various column slendernesses. It appears that the interaction is fairly linear for stocky members, but slightly convex for slender members.
In the same diagram the water depth corresponding to the normalised capped end stress is shown for various D/t-ratios for a yield stress of 355 MPa. In practice it is the “left” part of the interaction diagram which is activated. This implies that the effect of hydrostatic pressure is largest on stocky columns, but gradually reduces for slender columns . It has almost no effect for reduced slenderness equal to 1.5.
TMR4205 Buckling and Ultimate Strength of Marine Structures 2. Buckling of Bars and Frames Page 31 of 69
Interaction betwen hydrostatic pressure and column buckling
0
0.1
0.2
0.3
0.4
0.5
0.6
0.7
0.8
0.9
1
0 0.2 0.4 0.6 0.8 1
Sigma_x/f_cl
f_ch
/f_c
l
0
50
100
150
200
250
300
350
400
450
500
Wat
er d
epth
[m
]
lamda=0.5
lamda=0.7
lamda=0.9
lamda=1.1
lamda=1.3
lamda=1.5
D/t = 30
D/t = 50
D/t = 70
D/t = 90
Figure 2.23 Interaction between hydrostatic pressure and column buckling. Water depth calculated for fy = 355 MPa
2.6.2.3 Interaction bending – hydrostatic pressure
Hydrostatic pressure causes a hoop stress h = pr/t. This presence of this stress reduces the stress available for elasto-plastic bending. The bending stress, fmh , which accounts for the effect of hydrostatic pressure is calculated through the following interaction equation:
2 2
2 0mh mh h h
m m h h
h
y
f fv
f f f f
fη 5 4
f
(2.88)
which solved for fmh becomes 2 2η
mh h h h
m h h h
f1 0.09 0.3
f f f f
(2.89)
The interaction is plotted in Figure 2.24. The plots show that the interaction is weak when the hoop buckling resistance is small, but increases with increasing resistance (relative to the yield strength).

TMR4205 Buckling and Ultimate Strength of Marine Structures 2. Buckling of Bars and Frames Page 32 of 69 Figure 2.25 shows that the reduction in bending strength starts to become significant for typical D/t-ratios when the water depth is larger than 100 m.
0
0.2
0.4
0.6
0.8
1
1.2
0 0.2 0.4 0.6 0.8 1 1.2
Sigma_p/f_h
f_m
h/f_
m
f_h/f_y =0.2
f_h/f_y =0.4f_h/f_y =0.6
f_h/f_y =0.8
Figure 2.24 Interaction between local bending strength and hydrostatic pressure
0
50
100
150
200
250
300
20 30 40 50 60 70 80 90 100
Diameter/thickness
Wat
erd
epth
(m
)
100 %10 %
5 %
2 %
Figure 2.25 Reduction in bending strength as a function of water depth and D/t-ratio
2.6.3 Failure of beam column accounting for local buckling and hydrostatic pressure
Two checks must be performed:
i. Beam column failure (Perry-Robertson type formulation)

TMR4205 Buckling and Ultimate Strength of Marine Structures 2. Buckling of Bars and Frames Page 33 of 69
0.52 2
11.0
1 1
my mya mz mz
a ach mh
Ey Ez
C C
f ff f
(2.90)
The first term represents the utilisation with respect to column buckling. a is the net axial stress (capped end stress x = pr/2t is not included). The effect of the capped end stress is included through interaction in the resistance to column buckling, fch. The second term represents the utilisation with respect to bending. The bending term includes the magnification factor. The allowable bending stress includes the effectt of hoop stress caused by hydrostatic pressure.
ii. Local buckling failure
2 2
1.0my mza x
cl mhf f
(2.91)
The local buckling check is based on linear interaction between axial compression and bending. The denominator in the first term is the local buckling resistance without hydrostatic pressure. The effect of hydrostatic pressure is accounted for in the load effect (nominator) term. Note that the bending stress shall not be magnified in this check.

TMR4205 Buckling and Ultimate Strength of Marine Structures 2. Buckling of Bars and Frames Page 34 of 69
2.7Buckling of Frames
So far, buckling of individual beam-columns with idealized boundary conditions have been considered. In practice, however, a given component is an integral part of a complete frame system. The interaction formulas developed for individual beam-columns are also used for braces in frames. The system analysis is reduced to a determination of the effective buckling lengths of the individual components. The effective buckling length is determined from the alignment charts. Their use is based on the following assumptions:-
elastic behaviour, all columns buckle simultaneously,
the relative utilization of all members, , is equal.
2.7.1 DnV Classification Note 30.1
Within the system, the individual components are distinguished between the compression members (columns) and the bending members providing restraint, and denoted, respectively, by the subscripts c and b. Then, the following factor, which measures the relative stiffness between the compression and the restraining members, is defined.
c
c
b
b
I
G I
(2.92)
where l is the member length, and I is the moment of inertia. is a rotational factor depending on the boundary constraint of the restraining member at far end. It is distinguished between sidesway prevented case and sidesway permitted case, (see Figure 2.28). The factors are easily derived from simple beam theory accounting for actual boundary conditions .
Beam bending
Joint flexibilityNode
Cj
Cb
Figure 2.26 Joint Flexibility.

TMR4205 Buckling and Ultimate Strength of Marine Structures 2. Buckling of Bars and Frames Page 35 of 69 Depending upon the geometry of the joint, all restraining beams may not be considered as perfectly rigid. Accordingly the stiffness of these members will be reduced. The stiffness of the resisting beams, Cb, and the joint, Cj, can be considered as two springs in series, (see Figure 2.26). Hence, the flexibilities can be added so that
*
1 1 1
b jC C C (2.93)
yielding, * 1
1b b
b
j
C C CCC
(2.94)
The -factor, which represents the softening of the beam stiffness due to joint flexibility, is introduced into the G-factor,
c
c
b
b
I
GI
(2.95)
and the factor Cb is defined as follows
2 : base case for sidesway prevented
6 : base case for sidesway permitted.
b
b
b
EIl
CEI
l
(2.96)
The joint rotational stiffness Cj is given by parametric equations. For a T-joint subjected to in-plane bending the stiffness is calculated according to the following formula:
2.35 1.530.43 0.01
r
R
j
TC ERH
R
(2.97)
For out-of-plane bending the following relationship is used
'2.45 1.6
30.216 1.59 0.02
r
R
j
r TC ERH
R R
(2.98)
These expressions are valid for
0.33 0.8 10 30r R
andR T
(2.99)
For other joints it is conservative to use the above relations to assess local shell stiffness for buckling control

TMR4205 Buckling and Ultimate Strength of Marine Structures 2. Buckling of Bars and Frames Page 36 of 69 For other joints it is conservative to use the above relations to assess local shell stiffness for buckling control
The parameters in the formulas are defined in Figure 2.27.
Figure 2.27 Joint geometry parameters
N N
k = 2EI/l
= 1
N
k = 4EI/l
= 2
N
k = 3EI/l
= 3/2
(a) Sidesway Prevented.
N N
k = 6EI/l
= 1
N
k = 4EI/l
= 2/3
N
k = 3EI/l
= 1/2
(b) Sidesway Permitted.
Figure 2.28 Definition of -factors.
The determination of the effective buckling length is based upon the G-factor calculated at each end of the considered member. Then a straight line is drawn between the values on the g-factor axis. Then the effective buckling length factor can be read as the intersection of this line with the K-axis. In the example shown in Figure 2.29, GA=5 and GB = 0.5 yields K=0.8 in the sidesawy prevented case.

TMR4205 Buckling and Ultimate Strength of Marine Structures 2. Buckling of Bars and Frames Page 37 of 69
G-factor end a G-factor end b
Buckling length factor
Figure 2.29 Alignment charts for evaluation of buckling length factor
2.8Stiffness Matrix for a Beam With Axial Force
Consider the beam shown in Figure 2.30. The internal moment at any section, X = x, and the external moment acting on the beam are given, respectively, as
(2.100)
Hence, equilibrium yields
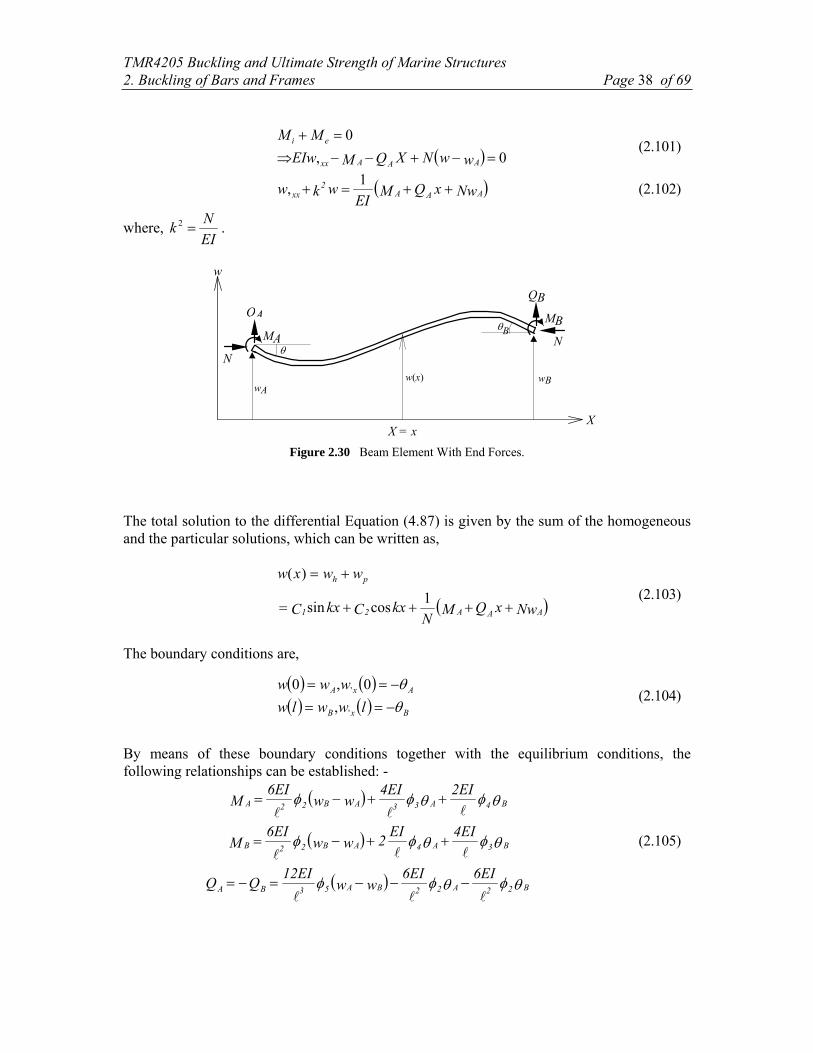
TMR4205 Buckling and Ultimate Strength of Marine Structures 2. Buckling of Bars and Frames Page 38 of 69
0,
0
wwNXQMEIw
MM
AAAxx
ei (2.101)
NwxQMEI
wkw AAA2
xx 1
, (2.102)
where, EI
Nk 2 .
B
NN
QA
MA
QB
MB
w
X
w(x)wA
wB
X = x
Figure 2.30 Beam Element With End Forces. The total solution to the differential Equation (4.87) is given by the sum of the homogeneous and the particular solutions, which can be written as,
NwxQMN
kxCkxC
wwxw
AAA21
ph
1cossin
)(
(2.103)
The boundary conditions are,
BxB
AxA
lwwlw
www
'
'
,
0,0 (2.104)
By means of these boundary conditions together with the equilibrium conditions, the following relationships can be established: -
B22A22BA53BA
B3A4AB22B
B4A33AB22A
6EI6EIww
12EIQQ
4EIEI2ww
6EIM
2EI4EIww
6EIM
(2.105)

TMR4205 Buckling and Ultimate Strength of Marine Structures 2. Buckling of Bars and Frames Page 39 of 69 which can be written in a matrix form as,
B
B
A
A
3
2253
4223
22532253
B
B
A
A
w
w
4EI
6EI12EI
2EI6EI4EI
6EI
12EI
6EI
12EI
=
M
Q
M
Q
(2.106)
where the -factors depend on whether the beam is in tension or compression,
Compression Tension
215
214
213
1
2
2
1
2
3
2
14
3
4
1
3
1
1
tan
215
214
213
1
2
2
1
2
3
2
14
3
4
1
3
1
1
tanh
l
EIN
N
N
2 2
2
EE
,
It is seen that each term in the matrix is identical to the linear term (for pure bending) except for the -functions, which contain the influence of axial force. These functions are expressed in terms of the axial force normalized versus the Euler buckling force. The Euler buckling force is a characteristic force independent of the actual boundary conditions for the element. The -functions are sketched in the diagram shown in Figure 2.31. For zero axial force they all become equal to unity, as they should. When the axial force increases, all stability functions decrease, except for 4. For certain values of they change sign. This represents the potential instability points for the element. For negative axial force (tension), the stability functions increase. Therefore, the element becomes stiffer when it is subjected to tension. For certain values of the axial force the displacements may increase infinitely with no change in the external forces (end moments and shear forces), i.e.
0KVS (2.107) In that case, the nontrivial solution is given by 0K , which means that the determinant of
the stiffness matrix, K, should be equal to zero.

TMR4205 Buckling and Ultimate Strength of Marine Structures 2. Buckling of Bars and Frames Page 40 of 69 The critical load for several well-known cases may be derived by considering subsets of the matrix given in Equation (4.91).
-6
-5
-4
-3
-2
-1
0
1
2
3
4
5
-5 -4 -3 -2 -1 0 1 2 3 4 5
Axial force E
- v
alue
Figure 2.31 Stability Functions.
Example 1.
Consider a simply supported beam shown in Figure 2.32. The boundary conditions are 0 BA ww . Then,
34
43
2
22EI
K
43 2
1;0,0 2
4234K
From Figure 2.31, this is seen to occur for ENN .
l
N NA B
Figure 2.32 A simply Supported Beam.

TMR4205 Buckling and Ultimate Strength of Marine Structures 2. Buckling of Bars and Frames Page 41 of 69 Example 2.
l
N A B
0 BBA ww
Figure 2.33
3
4EI
K
ENN 2For,0 K
This means that 7.02
1k .
Example 3.
l
N
A B
0 BBw
Figure 2.34
32
2
25
3 23-
362EI
K 09120 2
22
532 llK
ENN 25.0912 2253
Example 4.
l
N
A B
0 BABw
Figure 2.35
53
12EI
K ENN For00 5K
From the above examples, it is seen that the stiffness matrix contains all the necessary information to predict the critical load, with respect to buckling, depending on the boundary conditions. Example 5.
Buckling of a Member with Rotational Springs. Consider the beam shown in Figure 2.36 which is subjected to end compression. It is assumed that the adjacent structure restrains the beam against rotation. This restraint is represented by the rotational spring with stiffness, c

TMR4205 Buckling and Ultimate Strength of Marine Structures 2. Buckling of Bars and Frames Page 42 of 69
N NA B = -
EIc c
A B
EIc
Figure 2.36 Buckling of a Column with Rotational End Restraint.
The internal moment at end A is given by
A43
B4A3iA
2
14EI
2EI4EI
M
Further,
143 2
1
2
1
Hence,
A1iA
EI2M
The spring moment,
AAeA
EICM
Equilibrium yields,
A1eA
iA
2
12EIM MMM
The stiffness becomes singular for,
11 2or 02
1 f
This indicates buckling. The solution for different values of is shown in Figure 2.37.
The solution to the buckling problem for various types of flexible boundary conditions have been prepared in diagrams as shown in Figure 2.37. The solution to the problem considered above can be found in the lower left diagram. It is seen that a rotational spring with stiffness equal to the bending stiffness of the beam raises the critical load by 37 %.

TMR4205 Buckling and Ultimate Strength of Marine Structures 2. Buckling of Bars and Frames Page 43 of 69
1
P PE
2
1.37 2.441.67 2.120
-1
-2
-3
1 2 3 = 1
= 2
= 4
= 6
+1
Figure 2.37 Solution to Buckling of a Column with Rotational End Restraint.
Figure 2.38 Effective Length For Some Cases Of Elastic Restraint. In general, the solution of the buckling problem for a beam leads to a non-linear equation. This must be solved by iterative procedures. For structural problems, a combined incremental- iterative procedure based on the Newton-Raphson method is often used. The Newton-Raphson method solves the equation,
0xf (2.108)
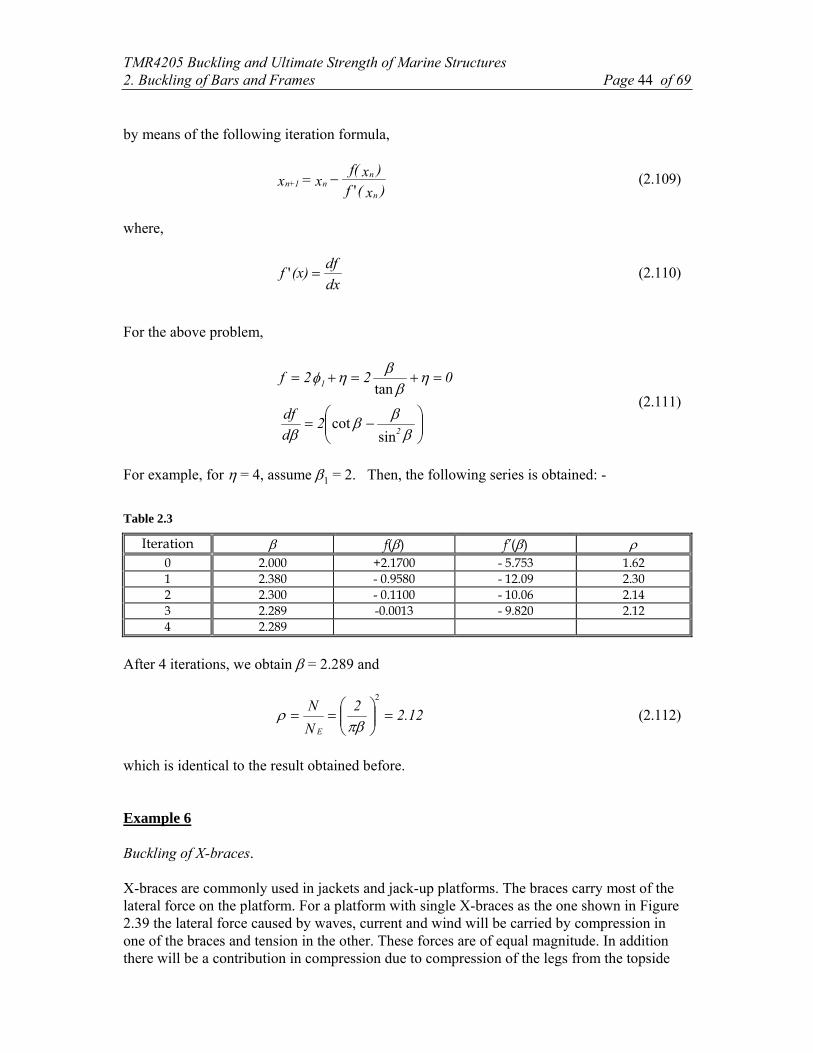
TMR4205 Buckling and Ultimate Strength of Marine Structures 2. Buckling of Bars and Frames Page 44 of 69 by means of the following iteration formula,
)x(f
)xf(xx
n
nn1+n
' (2.109)
where,
dx
df(x)f ' (2.110)
For the above problem,
sincot
tan
2
1
2d
df
022f
(2.111)
For example, for = 4, assume 1 = 2. Then, the following series is obtained: -
Table 2.3
Iteration f() f’() 0 2.000 +2.1700 - 5.753 1.62 1 2.380 - 0.9580 - 12.09 2.30 2 2.300 - 0.1100 - 10.06 2.14 3 2.289 -0.0013 - 9.820 2.12 4 2.289
After 4 iterations, we obtain = 2.289 and
2.122
N
N
E
2
(2.112)
which is identical to the result obtained before. Example 6 Buckling of X-braces. X-braces are commonly used in jackets and jack-up platforms. The braces carry most of the lateral force on the platform. For a platform with single X-braces as the one shown in Figure 2.39 the lateral force caused by waves, current and wind will be carried by compression in one of the braces and tension in the other. These forces are of equal magnitude. In addition there will be a contribution in compression due to compression of the legs from the topside

TMR4205 Buckling and Ultimate Strength of Marine Structures 2. Buckling of Bars and Frames Page 45 of 69 weight. Consequently the total force in the compressive brace will be larger than the force in the tension brace. If the environmental forces are assumed to come in from the left in Figure 2.39 force N1 will be in compression and force N2 will be in tension.
N1N2
N1 N2Waveswindcurrent
l
Figure 2.39 Buckling of X-braces in jacket
Out-of-plane buckling is critical. There is interaction between the two braces because the tension brace acts as a support for the compression brace. With reference to Figure 2.40 this support is modelled as an equivalent spring with stiffness KN2. In addition, the legs and any
other braces framing into the ends of the X-braces provide a rotational restraint, which is modelled by a rotational spring with stiffness C. For simplicity it is assumed equal at all four supports. Remark:
For out-of-plane bending the rotational resistance of the adjacent members will consist of one contribution from bending and one contribution from torsion. The total stiffness is found by vectorial summation of these stiffnesses. For a thin-walled tube the stiffness in torsion and bending may be taken as

TMR4205 Buckling and Ultimate Strength of Marine Structures 2. Buckling of Bars and Frames Page 46 of 69
CaEI
l
E r t
l
CEI
l
E r t
lC
bending
torsiont
bending
3
32
2 1
1
1
The compression brace may fail in two modes as shown in Figure 2.40: symmetric buckling symmetric buckling.
Figure 2.40 Out-of-plane buckling modes for braces
If the tension brace is not sufficiently strong the symmetric buckling mode governs. At some limiting value Klim, the tension brace resists lateral deflection and the buckling mode changes
into the asymmetric mode.
Figure 2.41. Model for determination of tension brace spring stiffness
The effective spring stiffness of the tension brace can be determined by means of the model shown in Figure 2.41. For symmetry reasons only one half of the system needs to be analyzed. Using Equation (4.91) the stiffness of the left half of the tension brace system can be written as
2
0
212
26
26
24
253222
22223
NB
A
B
A
QwNl
EIN
l
EI
Nl
EICN
l
EI
Q
M
(2.113)
Using the first equation the rotation at end A can be eliminated so that the following
N1 N 1 C C
KN2 > Klim
Asymmetric mode N 1 N1 C C
K N2
Symmetric mode
N 2 N 2
C C
A B /2
A w B

TMR4205 Buckling and Ultimate Strength of Marine Structures 2. Buckling of Bars and Frames Page 47 of 69 expression is obtained for the contact force between the two braces
BNBN wKw
lEI
CN
NNl
EIQ
22
8
1
4
396
23
222253
(2.114)
The expression in the bracket represents the stiffness of the tension brace as felt by the compression brace. It is seen that for N1 = 0 it condenses into the well-known relationship for
a beam with a concentrated load at mid-span : BN wl
EIQ
30 4822
.
Symmetric buckling:
Figure 2.42. Analysis model for symmetric buckling
The governing equations for the left half of the column read:
Kv
B
A
NB
A
wKNl
EIN
l
EI
Nl
EICN
l
EI
Q
M
2253122
12213
212
26
26
24
(2.115)
The critical load is obtained when the determinant becomes singular or:
02
362
122
4 212
2
15313 2
N
l
EIKN
l
EICN
l
EIN (2.116)
03
8
1
4
3
lEI8
C4 2
2
23
222251513
lEI
CN
NNNN (2.117)
Asymmetric buckling:
N1N1
C C
KN2
Symmetric mode A wB
/2

TMR4205 Buckling and Ultimate Strength of Marine Structures 2. Buckling of Bars and Frames Page 48 of 69
N1 N1
C C
l/2
A B
Figure 2.43. Analysis model for asymmetric buckling
In this case the right end of the half beam is pinned so that the critical load is obtained when
0
24
22
22
24
det
1314
1413
Nl
EIN
l
EI
Nl
EICN
l
EI
(2.118)
or
0
28
4 2141313
NN
l
EIC
N (2.119)
This is the same problem studied by means of G-functions for non-sway mode. It corresponds to a case with zero rotational stiffness at right end. The critical loads as given by Equations (4.102) and (4.104) may easily be solved by means of an iterative procedure, e.g. bi-section method. The solutions for symmetric and asymmetric buckling are shown in Figure 2.44 as a function of the non-dimensional rotation stiffness
lEI
C . The symmetric mode depends upon the axial force in the tension brace, so that
N2/N1 is introduced as a parameter (N2 is positive in compression, negative in tension). The
left axis with = 0 corresponds to pinned ends, the right axis with 100/ = 0 corresponds to fixed ends. Some of the calculated results are easily recognised. For pinned ends and N2/N1= 1 both
braces are in compression and there is no stiffening effect from N2. The curve applies to a
single brace, hence K = 1 for pinned conditions and K = 0.5 for fixed ends. For N2/N1 = 0 the
bending energy is doubled, hence the effective length is reduced by a factor of 21 to
71.021 K for pinned ends to 35.025.0 K for fixed ends. By increasing tensile force, N2, the stiffness of the tension brace increases due to the rapid
increase of the stability function 5 in tension, confer Figure 2.31. Consequently, the effective
length for the compression brace is reduced. However, the decrease in the effective length for

TMR4205 Buckling and Ultimate Strength of Marine Structures 2. Buckling of Bars and Frames Page 49 of 69 symmetric buckling is limited by the onset of asymmetric buckling, when the tension brace becomes too strong to be displaced. While symmetric buckling governs regardless of the rotation stiffness when N2 = 0, asymmetric buckling is always the governing if N2 < -0.6

0
0.2
0.4
0.6
0.8
1
1.2
0 2 4 6 8 10 8 6 4 2 0
Rotational end restraint 100/
K-f
acto
r 1.0
0.5
0.2 0-0.2
-0.5
-1.0
Asymmetric mode
Symmetric modeN2/N1 =
Pinned ends Clamped ends
Figure 2.44 Buckling factor versus rotational end restraint for X-braces
For typical X-braces the force distribution is such that the asymmetric buckling mode will be the governing failure mode. Depending upon the rotational restraint the effective K-factor should therefor be in the range of 0.5 to 0.35, or 1.0 to 0.7 if the longer segment of X-brace (here:half brace) is used. Based on results from experimental investigations a factor of 0.8 is supported. For braces without lateral support, for example compression braces in K-braced frames, experimental observations advocate a factor of 0.7. The effective length factors, K, and moment reduction factors, CM, for jackets members recommended by API (also proposed as ISO-standard) in lieu of rational analysis are listed in Table 2.4.

TMR4205 Buckling and Ultimate Strength of Marine Structures 2. Buckling of Bars and Frames Page 51 of 69
Table 2.4. Effective length and moment reduction factors for jacket members according to API regulations.
Structural element K CM
Superstructure Legs Braced Portal (unbraced)
1.0 K
0.85 0.85
Jacket Legs & Piling Grouted Composite Section Ungrouted Jacket Legs Ungrouted Piling Between Shim Points
1.0 1.0 1.0
(c) (c) (b)
Jacket Braces Primary Diagonals and Horizontals K-braces X-braces (longer segment length)
0.7 0.7 0.8
(b) or (c)
(c) (c)
Secondary Horizontals 0.7 (c)
(b) For members with no transverse loading :
)85.0,4.0(,4.06.01
2 MM CM
MC
K : From alignment charts (c) For members with transverse loading:
stressecompressivdesignf
eappropriatasForFF
F
fC
c
ezeye
e
cM
4.00.1,85.0min

TMR4205 Buckling and Ultimate Strength of Marine Structures 2. Buckling of Bars and Frames Page 52 of 69
2.9Torsional Buckling
Previously, flexural (column) buckling has been considered. However, for short bars, with open thin-walled sections, where the torsional rigidity is low, failure may occur as pure twisting or by a combination of bending and twisting. This depends on the location of the shear centre (S.C) relative to the centre of gravity (C.G). If SC and CG do not coincide, a combined flexural-torsional buckling will occur, (see Figure 2.45).
SC
CG
(a) Torsional Buckling.
CGSC
(b) Flexural-torsional Buckling.
Figure 2.45 Deformations During; (a)Torsional, and, (b)Flexural-Torsional Buckling.
2.9.1 Fundamentals of Torsion (ref. Statics of Marine Structures)
St. Venant Torsion The expression for St.Venant torsion is given by,
dx
dGIT t
(2.120)
where G is the shear modulus, It is the torsional moment of inertia, and is the torsion angle. All cross-sections free to warp, i.e. no stress due to restrained warping. Closed sections
t
T
T
Figure 2.46 Torsion of a Closed Section.

TMR4205 Buckling and Ultimate Strength of Marine Structures 2. Buckling of Bars and Frames Page 53 of 69
The torsional moment of inertia is given by,
t
dsF4
I2
t (2.121)
where F is the enclosed area. For a tubular section, the torsional moment of inertia will be
tr
t
r2r4
I2
t3
2
2
(2.122)
Open sections The torsional moment of inertia for open sections is given by,
tbI iit3
3
1 (2.123)
where bi and ti are the width and thickness of the subpoints of which the section is composed.
1. Free Warping of Open Sections
TT
tbi
i
Figure 2.47 Free Warping of an Open Section. 2. Torsion With Restrained Warping
y
zx
A
A
T
Q
M
z
y, v x
Q
Q
h/2
h/2

TMR4205 Buckling and Ultimate Strength of Marine Structures 2. Buckling of Bars and Frames Page 54 of 69
Section A-A
Figure 2.48 Torsion With Restrained Warping.
Section A-A represents a section with warping.
The beam shown in Figure 2.48 is subjected to a torsional moment, T, at the right end and is restrained against torsion at the left end. It is seen that the torsion of the profile induces a bending moment in the flanges. Considering the top flange, this bending moment is given by,
,v EIM xxff (2.124)
where,
btI fff3
12
1 (2.125)
is the in-plane bending stiffness of the top flange. With the sign convention used, the shear force can be written as,
,vEIdx
dMQ xxxff (2.126)
Now, with reference to Figure 2.48, the lateral deflection of the top flange, v, is related to the torsional angle, , for small rotations through
2
hv (2.127)
Hence,
,EI2
hQ xxxff (2.128)
The resisting moment on the beam, from restrained warping, to the right of section A-A is,
,EI2hQhT xxxf
2
fw (2.129)
The resisting moment from Saint-Venant torsion is,
xtGIT , (2.130)
Then, the following equilibrium condition must be satisfied,
xxxwxt
w
EIGIT
TTT
,,
0
(2.131)
where the warping stiffness, Iw, has been introduced,

TMR4205 Buckling and Ultimate Strength of Marine Structures 2. Buckling of Bars and Frames Page 55 of 69
I2h
I f
2
w (2.132)
The solution to Equation (4.116) is presented in the lecture notes “Statikk for Marine Konstruksjon”.
2.9.2 Torsional Buckling
Figure 2.49 shows an arbitrary thin-walled cross-section of a beam in a deformed configuration. The shear centre and the centre of gravity do not coincide. The deformations are a combination of bending about two axis, (v- and w-axes), and torsion . The reference system is located with the origin at the shear centre, and y- and z-axes along the principal axes of the cross-section.
z
SC
CGzo
yo
y
P(y, z)
SC
CG
Pz'
y'w
v
Figure 2.49 Torsional Buckling.
The strain energy is given by
l l l l
xxxxwxtxxzxxy dxEIdxGIdxvEIdxwEIU0 0 0 0
222 ,,2
1,
2
1,
2
1,
2
1 (2.133)
where the last term represents the strain energy in warping. Using integration by parts, we can write
l
2xxxxxx
ll
xxxxxxx
l
dx,dx,,,,dx,,00
00
(2.134)
on the condition that either ,xx or ,x vanish at the integration boundaries. This is usually the case for frequently occurring support conditions. To establish the potential energy of the external load, it is necessary to consider the potential of each fibre in the cross-section. The deformation components of a point P(y, z) are given by,
ywz)w(y,
zvz)v(y,
(2.135)
where v and w are the displacement components of the shear centre, and is the rotation

TMR4205 Buckling and Ultimate Strength of Marine Structures 2. Buckling of Bars and Frames Page 56 of 69 angle. Then, the potential energy of the external load is,
dAdxyywwzzvv
dAdxzywzyvH
l
A
xxxxxxxxx
l
A
xxx
0
222222
0
22
,,,2,,,,2,2
1
,,,,2
1
(2.136)
Here,
IdAzyAyydAAzzdA p22
Ao
A
o
A
and;; (2.137)
where yo and zo are the coordinates of the centre of gravity, CG, and Ip is the polar moment of
inertia. Therefore, the potential energy of the external load can be written as,
dx,,wy2,,vz2,i,w,v2
NH xxoxxo
2x
2p
2x
2x
0
(2.138)
where,
AI
ip
p (2.139)
is the polar radius of inertia about the shear centre. Example Consider a simply supported column having a fork type of support as shown in Figure 2.50.
Warping free - torsionally fixed����������������
��������������������
Figure 2.50 A simply Supported Column.
Boundary conditions:
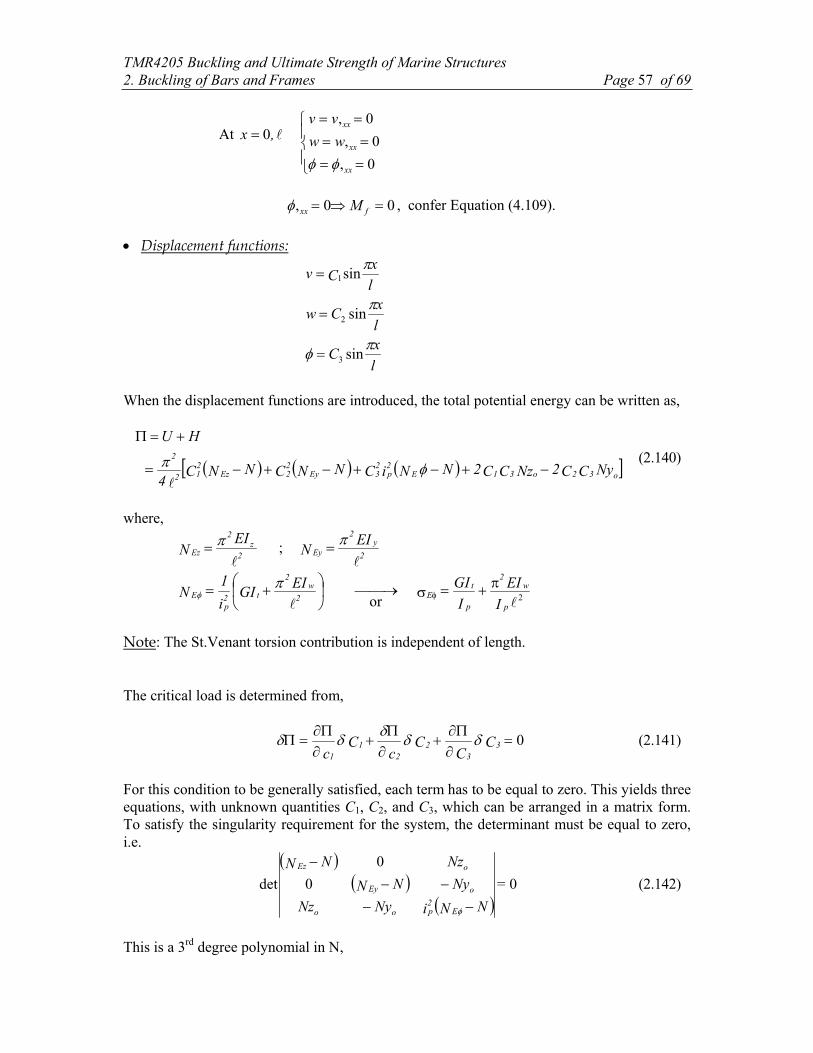
TMR4205 Buckling and Ultimate Strength of Marine Structures 2. Buckling of Bars and Frames Page 57 of 69
At ,x 0
0,
0,
0,
xx
xx
xx
ww
vv
00, fxx M , confer Equation (4.109).
Displacement functions:
l
xC
l
xCw
l
xCv
sin
sin
sin
3
2
1
When the displacement functions are introduced, the total potential energy can be written as,
NyCC2NzCC2NNiCNNCNNC4
HU
o32o31E2p
23Ey
22Ez
212
2
(2.140)
where,
2
z2
Ez
EIN
;
2
y2
EyEI
N
2
w2
t2p
EEI
GIi
1N
or
2I
EI
I
GI
p
w2
p
tE
Note: The St.Venant torsion contribution is independent of length. The critical load is determined from,
0
CC
Cc
Cc
33
22
11
(2.141)
For this condition to be generally satisfied, each term has to be equal to zero. This yields three equations, with unknown quantities C1, C2, and C3, which can be arranged in a matrix form. To satisfy the singularity requirement for the system, the determinant must be equal to zero, i.e.
00
0
det =
NNiNyNz
NyNN
NzNN
E2poo
oEy
oEz
(2.142)
This is a 3rd degree polynomial in N,

TMR4205 Buckling and Ultimate Strength of Marine Structures 2. Buckling of Bars and Frames Page 58 of 69
0i
zNNNi
yNNN NNNNNN 2p
2o
2
Ey2p
2o
2
EzEEyEz (2.143)
The roots yield the critical values for N. Special Cases: Double symmetric cross-section;
0
0
NNNNNN
zy
EEyEz
oo
(2.144)
Therefore EzNN , EyNN , and ENN are the uncoupled critical values.
Double symmetric cross-sections buckle in either of the two bending modes, or by torsion about the shear centre. A combined torsional/bending buckling does not occur. The buckling mode is governed by the lower value of NEz, Ney, and NE.
ANN ,NN EEEzEyE (2.145)
reduced slenderness,
E
Y (2.146)
k determined from the column curve for torsional buckling.
Flexural-Torsional Buckling of Single symmetric cross-section; (Confer DnV Classification note 2.3.3)
CG
z
y
zy
o
o
= 0= 0
SC
y0
0
i
yNNNNNNN 2p
2o
2
EEyEz (2.147)
Figure 2.51 A Channel Section.
Consider a channel section shown in Figure 2.51. The possible solutions are,

TMR4205 Buckling and Ultimate Strength of Marine Structures 2. Buckling of Bars and Frames Page 59 of 69 1.) 0 EzNN Buckling about z-axis, (weak axis buckling).
2.) 0i
yNNNNN 2p
2o
2
EEy Coupled torsional-strong axis buckling.
The solution is given by
NkN4NNNN
2k
1N EyEEyEEyEEy
2 (2.148)
where, 2
1
i
yk
p
o (2.149)
Single symmetric cross-sections may buckle either in the symmetry plane, or by a combination of bending and torsion about the strong axis.. The actual mode depends on the initial distortions and the cross-sectional dimensions. Equation 2) above may alternatively be expressed by the following interaction function:
0111
E
Ey
Ey
Ey
E
Ey
Ey
Ey
N
N
N
Nk
N
N
N
N (2.150)
Various combinations of Ey
Ey
N
N and
E
Ey
N
Nsatsifying this interaction function are plotted in
Figure 2.52 for various values of the k parameter.The line EyE NN splits the area into two
domains and the diagram is symmetric about this line: Below the line the torsional buckling strength is larger than the strong axis buckling strength, above the line the weak axis buckling strength is greater than the torsional buckling strength. The figure shows the influence of interaction. If the torsional buckling strength and the strong axis buckling strength differ considerably, the interaction is moderate (see e.g. the intersection with the line EyE NN 4 . It is seen that the maximum reduction amounts to 50% and is
obtained for k = 0 and EyE NN . For k-values in the range of 0.7-0.9 the reduction caused
by interaction is fairly small if the relative buckling strength for torsion and strong axis buckling is larger than two.

TMR4205 Buckling and Ultimate Strength of Marine Structures 2. Buckling of Bars and Frames Page 60 of 69
0
0.1
0.2
0.3
0.4
0.5
0.6
0.7
0.8
0.9
1
0 0.2 0.4 0.6 0.8 1
NEy/NEy
NE
y N
E
k =1.0
0.9 0.8 0.7
0.5 0.3
0.NE =NEy
NEy=2NE
NE =2NEy
NE = 4NEy
NEy=4NE
Figure 2.52 Interaction for flexural-torsional buckling
The flexural buckling strength increases with reduced buckling length, whereas the St.Venant contribution to the torsional buckling strength is independent of the buckling length. Hence, relatively speaking, short members are more prone to torsional buckling. This is shown for channel sections in Figure 2.53, where the relative buckling strength for strong axis and – torsional buckling strength is depicted. The same buckling length is assumed for strong axis buckling and warping. The figure shows also the k-factor for the various profiles. It is observed that fairly equal buckling strengths is possible over some interval, which implies that interaction should be considered. However, as the moment of inertia about the weak axis for most profiles is several times smaller than that about the strong axis, weak axis buckling will be critical, unless the profile is supported such that the weak axis buckling length is smaller.

TMR4205 Buckling and Ultimate Strength of Marine Structures 2. Buckling of Bars and Frames Page 61 of 69
0
0.5
1
1.5
2
2.5
3
3.5
4
0 0.5 1 1.5 2 2.5 3
Reduced slenderness ratio-strong axis buckling
Rel
ativ
e bu
ckli
ng s
tres
s:
E/ E
z or
Ez/ E
200x80x4 k=0,77
200x80x6 k=0.77
160x50x4 k=0.85
160x70x5 k=0.73
100x60x4 k=0.57
100x60x6 k=0.57
100x100x4 k=0.34
Torsionally weak Flexurally weak
Figure 2.53 Relative buckling strength for strong axis – and torsional buckling of channel sections. Yield stress: 250 MPa.
C G
z
y
y0C3
C2
y0 (1+C2/(y0C3)
C3
(this figure is not referenced at present)
2.9.3 Restrained Torsional Buckling (Ref. T. Soreide 5.65)
Fixed axis of rotation: Consider an example of a stiffener-plate in a ship as shown in Figure 2.7. The shear centre is located at the intersection between the web and the flange. In this case the stiffener is forced to rotate about the web toe when it undergoes torsional buckling. The displacement of the shear centre is given by,
0 = w
h= v (2.151)
and the displacement of any arbitrary point is given by,

TMR4205 Buckling and Ultimate Strength of Marine Structures 2. Buckling of Bars and Frames Page 62 of 69
yzy,w
zh zvz y,v
(2.152)
SC
z, w
y,v
φ
Figure 2.54 Stiffened Panel.
The potential energy of the external load can then be written as,
dxiN2
1dx,I
2
1
dx,dAyzh2
1H
x
0
pxpx
0
xA
x
0
222
222
,
(2.153)
where the polar moment of inertia, Ip, is evaluated about the weld toe,
dAyzhdArIA
2
A
p 22 (2.154)
Using the same boundary conditions as before, the displacement shape functions are given by,
xC
w
xCh
xCv
sin
0
sinsin
3
31
(2.155)
By comparing with the general (4.125), it can easily be seen that the following total potential energy is obtained,
01
CNNiNh4
HU 23E
2pEz
22
2
(2.156)
which yields,
i
NhNNN
2p
Ez2
EE (2.157)
For L-profiles, the shear centre is located at the web/top flange intersection. This yields a

TMR4205 Buckling and Ultimate Strength of Marine Structures 2. Buckling of Bars and Frames Page 63 of 69 negligible warping stiffness. Hence,
GIi
1N t2
pE (2.158)
(see the general equation in Section 2.9.2). Therefore, the critical load comes out to be,
I
IEh
I
GIA
N
p
z2
2
2
p
tEE
(2.159)
From Figure 2.54 it is seen that the plate has to rotate when the stiffener rotate about the web toe. If the plate is little utilised with respect to buckling it is reasonable to assume that it exerts some restraint on the rotation. Hence, the critical stress will be increased compared to equation 2.159.On the other hand, if the plate fails first this is likely to speed up torsional buckling. These phenomena are still not understood in detail, but in NORSOK N-004 the effect is accounted for by multiplying the St. Venant contribution with a factor so that
2 2zt
E 2p p
GI Eh I
I I
(2.160)
is given by
0.2C
0.23Cβ
(2.161)
η1t
t
s
hC
3
w
(2.162)
where h is the web height of the stiffener, s is the stiffener spacing, t is plate thickness and tw is web thickness. is the utilisation with respect to local buckling of the plate.
For the L-profile shown in Figure 2.55, the following relationships hold true:-
wwfftwfp AtAtIAAhI 222
3
1and
3
1
(2.163)
Therefore,
1 12 2 2
f zww fE 2
ww f wf
t t EI GA A3 h AtA A A
3
(2.164)
where,
AA
eAy
AA
AA ebA
12
1
yeAyAbt12
1I
fw
f
wf
wf2f
2f
2f
2w
3fz
For, (2.165)

TMR4205 Buckling and Ultimate Strength of Marine Structures 2. Buckling of Bars and Frames Page 64 of 69
b
h
t f
e
e = eccentricity of top flange centroid
A w
A f
tw
Figure 2.55 Definition of Geometrical Parameters.
In obtaining the critical stress due to non-linear material behaviour, column curve e is used, refer Section 2.4.1. Restrained lateral-flexural buckling strength is equal to the yield strength if
6.0or
8.2
E
yYE (2.166)
If the restrained torsional buckling strength of the stiffener is less than the yield strength, this is taken into account by replacing the yield strength with the torsional buckling strength in the design equations for stiffened plates and shells, Refer Section 3 and Section 5.
2.9.4 Lateral-Torsional Buckling
A beam which is subjected to bending about its strong axis and not sufficiently supported against deformation about the weak axis, may fail by lateral-torsional buckling. That is a combination of weak-axis bending and torsion as illustrated in Figure 2.56. It is seen that if the top flange is subjected to compression, the destabilising effect of the compression forces is larger than the stabilising effect of the tensile forces (in the bottom flange) due to larger lateral deformation. In the following, it is assumed that the bending moment, M0=Iy/z0 is constant along the beam. Further, the cross-section is symmetric about the weak axis.

TMR4205 Buckling and Ultimate Strength of Marine Structures 2. Buckling of Bars and Frames Page 65 of 69
Mo
Mo
A
A
o +
-
zo
SC
CG
ys
y
z, zs
Figure 2.56 Lateral-Torsional Buckling Of Unsymmetric I-Beam.
For the subsequent calculation it is convenient to change to a centre of gravity based coordinate system (y, z) instead of a shear centre based coordinate system (ys, zs). The displacement of an arbitrary point is then given by the following relationship,
yzyw
zzvzyv c
0,
, (2.167)
where v is the displacement of the shear centre and zc is the distance form the centre of gravity (CG) to the shear centre (SC). The axial stress for an arbitrary point is given by
zIM
y
o (2.168)
(Note: Compressive stress is defined positive) Taking into account the linear variation of the axial stress, the potential energy of the external load takes the following form,
l
A
xccxxcx
y
o
l
A
xxcxy
o
dxdA,zyzzzzz,,vzzzzv I
M
dxdA,y,zz,vI
zMH
0
2222322
0
22
222
1
2
1
(2.169)
Terms which depend on z only, disappears during area integration. Further,
IdAz y 2 (2.170)
Therefore, Equation (4.150) is reduced to,
dxzIdAyzdAzvII
MH
l
xcyxxyy
o 0
223 ,2,,22
1 (2.171)
which can also be written as,

TMR4205 Buckling and Ultimate Strength of Marine Structures 2. Buckling of Bars and Frames Page 66 of 69
dx,,,vMHl
xxxo 0
222
1 (2.172)
where the cross-sectional parameter, , is defined by
zdAyzdAzI
cAA
y
23
2
1 (2.173)
For the present cross-section the following relationship applies:
zcAIzdAyz 2 (2.174)
where Iz is the moment of inertia about the weak axis. The strain energy in this case can be written as,
dx,EIdx,GI,vEIU xxw
l
0
xt
l
0
xxz
l
0
222
2
1
2
1
2
1 (2.175)
The following displacement functions apply,
l
xC
wl
xCv
sin
0
sin
3
1
(2.176)
Comparing with Equation (4.125), it can easily be seen that the total potential energy comes out to be
MCCMNiCNCl4
HU oop EEz 3122
3212
2
22
(2.177)
The principle of minimum potential energy,
0 (2.178) yields
02
det 2
MNiM
MN
op Eo
oE
(2.179)
which implies that,
02 22 NNiMNM Ezp EoEzo (2.180)

TMR4205 Buckling and Ultimate Strength of Marine Structures 2. Buckling of Bars and Frames Page 67 of 69 with a solution,
CNM 22Ezo (2.181)
where,
I12Il
I
I
N
NiC
z
T2
z
W
Ez
p E2
2
(2.182)
Combining equations 4.160-4.162 the buckling mode (eigenmode) is given as
13
221
C
CC (2.183)
If the top flange is in tension the bending stress reverses sign and the solution takes the following form
CNM 22Ezo (2.184)
and the buckling mode becomes
2 21
3 1
C C
C
(2.185)
For double symmetrical section it is easily seen that = 0. This yields the following critical stress
CIl
zEI
I
zM
y2
oz2
y
oooEV
(2.186)
Elasto-plastic buckling is obtained from curve e according to ECCS (refer Section 2.4.1), where the reduced slenderness is calculated as,
EV
YV (2.187)
Lateral torsional buckling is not governing if 6.0 V
, YEV . If 6.0 V the critical
stress is obtained from column curve e.
2.9.5 Restrained lateral torsional buckling
If the top flange is restrained against lateral displacement (the top flange may for example be a part of a continuous plate field) the beam will buckle about the web toe at the plate flange. The bending and torsional deformation is coupled such that the lateral displacement at the plate flange is zero. This yields the following displacement functions:

TMR4205 Buckling and Ultimate Strength of Marine Structures 2. Buckling of Bars and Frames Page 68 of 69
l
xC
wl
xCzzzzv cc
sin
0
sin
3
300
(2.188)
Introducing these displacement functions into the load potential the following critical load is obtained
2202
1CzzNM cEzo
(2.189)
where the parameter now is defined as
023
2
1zdAyzdAz
I AAy
(2.190)
i.e. the distance to the plate flange, z0, replaces the distance to the shear centre, zc. Literature /1/ Eurocode 3: design of steel strucxtures . Part1.1 General rules and rules for buildings DD ENV 1993-1-1 /2/ Larsen, P. K.: Dimensjonering av stålkonstruksjoner, Tapit 1990 /3/ Det Norske Veritas: Classification note 30.1: Buckling Strength Analysis, 1992 and 1995. /4/ NORSOK Standard N-004: Design of Steel Structures, NST, 1998. /5/ Norwegian Petroleum Directorate - Regulations relating to loadbearing structures, NPD 1993 /6/ American Institute of Steel Construction (AISC), Manual of Steel Construction- Load and resistance Factor design, Vol1, 2nd ed., 1994 /7/ ISO 19902:2007 Petroleum and natural gas industries -- Fixed steel offshore structures

TMR4205 Buckling and Ultimate Strength of Marine Structures 2. Buckling of Bars and Frames Page 69 of 69 INDEX
A
allowable stress · 21 amplification factor · 7, 9, 10, 11, 17, 22
B
Beam Columns · 17 bifurcation
point · 4
C
column buckling · 18 column curve · 15, 16, 58, 64, 67 critical stress · 14, 15, 19, 21, 22, 63, 64, 67
D
determinant · 39, 47, 57
E
effective buckling length · 34, 36 elasto-plastic material · 12 equivalent bending stress · 20 equivalent imperfection · 14, 19 equivalent spring · 45 Equivalent Stress · 21 Euler buckling stress · 12
F
flexural-torsional buckling · 52
H
homogeneous solution to differential equation · 8, 10, 38
I
Imperfection geometric · 8
initial distortions · 12, 59 interaction formula · 19, 21, 22
J
joint flexibility effect of - buckling · 35
L
lateral-torsional buckling · 22, 64
N
nontrivial solution to differential equation · 3, 39
O
out-of-straightness · 14, 19
P
particular solution differential equation · 8, 10
potential energy · 7, 55, 56, 57, 62, 65, 66
R
reduced slenderness ratio · 12 residual stresses
imperfection · 12
S
section modulus · 18 sidesway
prevented /permitted buckling · 22, 34 Stiffness Matrix · 37 strain energy · 7, 55, 66
T
Torsional Buckling · 52, 55, 58, 61, 64, 65 transition curve · 12
W
warping · 52, 54, 55, 63