BTG Pactual 9th Latin American CEO Conference · Itaú CorpBanca BTG Pactual 9th Latin American CEO...
60
Itaú CorpBanca BTG Pactual 9 th Latin American CEO Conference October, 2018 October 10 – 11, 2018 | New York
Transcript of BTG Pactual 9th Latin American CEO Conference · Itaú CorpBanca BTG Pactual 9th Latin American CEO...

Itaú CorpBanca
BTG Pactual
9th Latin American CEO Conference
October, 2018
October 10 – 11, 2018 | New York

| 2 |
Disclaimer
• This presentation is not an offer for sale of securities. This material has been prepared solely for informational purposes and is not to be construed as a solicitation or an offer to buy or sell any securities and
should not be treated as giving investment advice. No representation or warranty, either express or implied, is provided in relation to the accuracy, completeness or reliability of the information contained herein.
Any opinions expressed in this material are subject to change without notice and neither Itaú Corpbanca (the “Bank”) nor any other person is under obligation to update or keep current the information contained
herein. The information contained herein does not purport to be complete and is subject to qualifications and assumptions, and neither the Bank nor any agent can give any representations as to the accuracy
thereof. The Bank and its respective affiliates, agents, directors, partners and employees accept no liability whatsoever for any loss or damage of any kind arising out of the use of all or any part of this material
• Certain statements in this presentation may be considered forward-looking statements. Forward-looking information is often, but not always, identified by the use of words such as “anticipate,” “believe,” “expect,”
“plan,” “intend,” “forecast,” “target,” “project,” “may,” “will,” “should,” “could,” “estimate,” “predict” or similar words suggesting future outcomes or language suggesting an outlook. These forward-looking statements
include, but are not limited to, statements regarding expected benefits and synergies from the merger of Banco Itaú Chile with and into CorpBanca, the integration process of both banks, anticipated future
financial and operating performance and results, including estimates for growth, as well as risks and benefits of changes in the laws of the countries we operate
• These statements are based on the current expectations of the Bank’s management. There are risks and uncertainties that could cause actual results to differ materially from the forward-looking statements
included in this communication. For example, (1) problems that may arise in successfully integrating the businesses of Banco Itaú Chile and CorpBanca, which may result in the combined company not operating
as effectively and efficiently as expected; (2) the combined company may be unable to achieve cost-cutting synergies or it may take longer than expected to achieve those synergies; (3) the credit ratings of the
combined company or its subsidiaries may be different from what the Bank or its controlling shareholders expect; (4) the industry may be subject to future regulatory or legislative actions that could adversely
affect the Bank; and (5) the Bank may be adversely affected by other economic, business, and/or competitive factors
• Forward-looking statements and information are based on current beliefs as well as assumptions made by and information currently available to the Bank’s management. Although management considers these
assumptions to be reasonable based on information currently available to it, they may prove to be incorrect. By their very nature, forward-looking statements involve inherent risks and uncertainties, both general
and specific, and risks that predictions, forecasts, projections and other forward-looking statements will not be achieved
• We caution readers not to place undue reliance on these statements as a number of important factors could cause the actual results to differ materially from the beliefs, plans, objectives, expectations and
anticipations, estimates and intentions expressed in such forward-looking statements. More information on potential factors that could affect Itaú CorpBanca’s financial results is included from time to time in the
“Risk Factors” section of Itaú CorpBanca’s Annual Report on Form 20-F for the fiscal year ended December 31, 2017, filed with the U.S. Securities and Exchange Commission (the “SEC”). Furthermore, any
forward-looking statement contained in this presentation speaks only as of the date hereof and Itaú CorpBanca does not undertake any obligation to update publicly or to revise any of the included forward-
looking statements, whether as a result of new information, future events or otherwise. The forward-looking statements contained in this presentation are expressly qualified by this cautionary statement
• This presentation may not be reproduced in any manner whatsoever. Any reproduction of this document in whole or in part is unauthorized. Failure to comply with this directive may result in a violation of the
U.S. Securities Act of 1933, as amended, or the applicable laws of other jurisdiction
• The information contained herein should not be relied upon by any person. Furthermore, you should consult with own legal, regulatory, tax, business, investment, financial and accounting advisers to the extent
that you deem it necessary, and make your own investment, hedging and trading decision based upon your own judgment and advice from such advisers as you deem necessary and not upon any view
expressed in this material
• The Bank is an issuer in Chile of securities registered and regulated by the Superintendencia de Bancos e Instituciones Financieras, or “SBIF.” Shares of our common stock are traded on the Bolsa de Comercio
de Santiago—Bolsa de Valores, or the Santiago Stock Exchange, the Bolsa Electrónica de Chile— Bolsa de Valores, or Electronic Stock Exchange, and the Bolsa de Corredores—Bolsa de Valores, or the
Valparaiso Stock Exchange, which we jointly refer to as the “Chilean Stock Exchanges,” under the symbol “ITAUCORP.” The Bank’s American Depositary Shares are traded on the New York Stock Exchange
under the symbol “ITCB.” Accordingly, we are currently required to file quarterly and annual reports in Spanish and issue hechos esenciales o relevantes (notices of essential or material events) to the SBIF and
the Comisión para el Mercado Financiero, the Chilean Commission for the Financial Market, or “CMF,” and provide copies of such reports and notices to the Chilean Stock Exchanges and the SEC. All such
reports are available at www.sbif.cl, www.cmf.cl, www.sec.gov and itau.cl/investor-relations.

Agenda1. Investment Case
2. Financials
3. Integration Milestones
4. Appendix

| 4 |
Itaú CorpBanca | Investment Case
1 As of June 30, 2018. Source: Economatica
2 – Rankings based on gross loans as reported to the Superintendencia de Bancos e Instituciones Financieras (SBIF), excluding loans from Itaú CorpBanca Colombia, and Superintendencia Financiera de Colombia (SFC).
Source: Company financials.
Solid Macroeconomic Fundamentals and Expanding Banking Sector
Chile is one of the most developed economies in Latin America, sustained by solid macroeconomic fundamentals
Chile has one of the best sovereign ratings and among the lowest CDS spreads in Latin America
Colombia is also an attractive market with a diversify economy
The Chilean and the Colombian banking sectors have achieved high profitability and healthy assets quality with effective regulatory oversight
LatAm Banking Sector has potential to achieve further growth, particularly in the underpenetrated retail segments
Solid
Macroeconomic
Fundamentals
Unique control and support from a leading institution
Itaú Unibanco is the largest private financial institution in Brazil and a premier LatAm franchise
Itaú CorpBanca benefits from the strength of a ~US$67.6 BN1 market cap partner in its existing markets while enhancing
opportunities for growth abroad
Opportunity to leverage Itaú Unibanco’s strong global client relationships successful managing model
Itaú CorpBanca will be able to expand its banking products’ offering through segmentation and digitalization
Emergence of a leading banking platform in Chile and Colombia
Greater scale and resources to grow and compete more effectively in Chile and Colombia
Enhanced footprint in Chile and Colombia create a platform to expand in the region, particularly into Peru and Central America
4th largest private bank in Chile and 6th largest banking group in Colombia by total loans2
2
1
3
4Itaú CorpBanca will have a stronger financial profile and greater earnings power
Estimated pre-tax cost synergies between US$88MM and US$107MM approximately per year on a fully phased-in basis and
total one-time pre-tax integration costs of approximately US$85MM to occur during the first 3 years
Improved funding profile and substantial potential for revenue synergies
Additional cross-selling opportunities
Improved capital position opens room for further loan growth
Unique Control
and
Support
Banking Platform
with Larger Scale
Positive Impact
to Itaú CorpBanca

| 5 |
Itaú CorpBanca | Investment Case
1 As of June 30, 2018. Source: Economatica
2 – Rankings based on gross loans as reported to the Superintendencia de Bancos e Instituciones Financieras (SBIF), excluding loans from Itaú CorpBanca Colombia, and Superintendencia Financiera de Colombia (SFC).
Source: Company financials.
Solid Macroeconomic Fundamentals and Expanding Banking Sector
Chile is one of the most developed economies in Latin America, sustained by solid macroeconomic fundamentals
Chile has one of the best sovereign ratings and among the lowest CDS spreads in Latin America
Colombia is also an attractive market with a diversify economy
The Chilean and the Colombian banking sectors have achieved high profitability and healthy assets quality with effective regulatory oversight
LatAm Banking Sector has potential to achieve further growth, particularly in the underpenetrated retail segments
Solid
Macroeconomic
Fundamentals
Unique control and support from a leading institution
Itaú Unibanco is the largest private financial institution in Brazil and a premier LatAm franchise
Itaú CorpBanca benefits from the strength of a ~US$67.6 BN1 market cap partner in its existing markets while enhancing
opportunities for growth abroad
Opportunity to leverage Itaú Unibanco’s strong global client relationships successful managing model
Itaú CorpBanca will be able to expand its banking products’ offering through segmentation and digitalization
Emergence of a leading banking platform in Chile and Colombia
Greater scale and resources to grow and compete more effectively in Chile and Colombia
Enhanced footprint in Chile and Colombia create a platform to expand in the region, particularly into Peru and Central America
4th largest private bank in Chile and 6th largest banking group in Colombia by total loans2
2
1
3
4Itaú CorpBanca will have a stronger financial profile and greater earnings power
Estimated pre-tax cost synergies between US$88MM and US$107MM approximately per year on a fully phased-in basis and
total one-time pre-tax integration costs of approximately US$85MM to occur during the first 3 years
Improved funding profile and substantial potential for revenue synergies
Additional cross-selling opportunities
Improved capital position opens room for further loan growth
Unique Control
and
Support
Banking Platform
with Larger Scale
Positive Impact
to Itaú CorpBanca

| 6 |
Global Macroeconomic Backdrop1
GDP Growth (%) Interest Rates (EOP) - %
Inflation (CPI) - %
Source: Central Bank of Chile and Central Bank of Colombia. Itaú CorpBanca’s projections
5,8 6,1
5,3
4,0
1,9 2,3
1,3 1,5
3,83,5
4,0
6,6
4,0
4,94,4
3,1
2,0 1,8
2,5
3,2
2010 2011 2012 2013 2014 2015 2016 2017 2018(e) 2019(e)
Chile Colombia
3,3
5,3 5,0 4,5
3,0 3,5 3,5
2,5 2,8
3,8
3,0
4,8 4,3
3,3
4,5
5,8
7,5
4,8 4,3 4,5
2010 2011 2012 2013 2014 2015 2016 2017 2018(e) 2019(e)
Chile Colombia
3,0
4,4
1,5
3,0
4,6 4,4
2,72,3
2,8 3,03,2 3,7
2,4 1,9
3,7
6,8
5,8
4,1
3,2 3,0
2010 2011 2012 2013 2014 2015 2016 2017 2018(e) 2019(e)
Chile Colombia
0,20
0,21
0,22
0,23
0,24
0,25
0,26
0,27
580
600
620
640
660
680
700
720
740
710 CLP/COPCLP/USD
Exchange rates – CLP/USD & CLP/COP

| 7 |
Itaú CorpBanca | Investment Case
1 As of June 30, 2018. Source: Economatica
2 – Rankings based on gross loans as reported to the Superintendencia de Bancos e Instituciones Financieras (SBIF), excluding loans from Itaú CorpBanca Colombia, and Superintendencia Financiera de Colombia (SFC).
Source: Company financials.
Solid Macroeconomic Fundamentals and Expanding Banking Sector
Chile is one of the most developed economies in Latin America, sustained by solid macroeconomic fundamentals
Chile has one of the best sovereign ratings and among the lowest CDS spreads in Latin America
Colombia is also an attractive market with a diversify economy
The Chilean and the Colombian banking sectors have achieved high profitability and healthy assets quality with effective regulatory oversight
LatAm Banking Sector has potential to achieve further growth, particularly in the underpenetrated retail segments
Solid
Macroeconomic
Fundamentals
Unique control and support from a leading institution
Itaú Unibanco is the largest private financial institution in Brazil and a premier LatAm franchise
Itaú CorpBanca benefits from the strength of a ~US$67.6 BN1 market cap partner in its existing markets while enhancing
opportunities for growth abroad
Opportunity to leverage Itaú Unibanco’s strong global client relationships successful managing model
Itaú CorpBanca will be able to expand its banking products’ offering through segmentation and digitalization
Emergence of a leading banking platform in Chile and Colombia
Greater scale and resources to grow and compete more effectively in Chile and Colombia
Enhanced footprint in Chile and Colombia create a platform to expand in the region, particularly into Peru and Central America
4th largest private bank in Chile and 6th largest banking group in Colombia by total loans2
2
1
3
4Itaú CorpBanca will have a stronger financial profile and greater earnings power
Estimated pre-tax cost synergies between US$88MM and US$107MM approximately per year on a fully phased-in basis and
total one-time pre-tax integration costs of approximately US$85MM to occur during the first 3 years
Improved funding profile and substantial potential for revenue synergies
Additional cross-selling opportunities
Improved capital position opens room for further loan growth
Unique Control
and
Support
Banking Platform
with Larger Scale
Positive Impact
to Itaú CorpBanca

| 8 |
Itaú Unibanco | At a Glance2
Leading position in Brazil
• US$ 67.6 billion market cap 1
• 99,914 employees in Brazil and abroad
• 4,904 branches and CSBs in Brazil and abroad
• 47,650 ATMs in Brazil and abroad
• Around 48 million clients in the Retail Bank
• Brazilian multinational bank
• Major provider of finance for the expansion of Brazilian companies
• In 2017 Itaú Unibanco was elected the The Best Company in People Management (by “Valor Carreira” magazine)
and also recognized as a pro-ethics company (Pró-Ética), an initiative between the Office of the Comptroller
General 2 with the private sector, which encourages the voluntary adoption of integrity measures and corruption
prevention in the business sector, being the only financial institution among the companies approved.
Global Footprint of Brazil’s Top Private Sector Bank | as of June 30, 2018
Financial Highlights and RatiosAs of and for the quarter ended June 2018
1 As of June 30 2018. Source: Economatica; 2 Controladoria-Geral da União (CGU).
Highlights
Total Assets BRL 1,543 Bn
Total Loans 1 BRL 623.3 Bn
Stockholders’ Equity BRL 121.8 Bn
Recurring Net Income 2017 2 (*) BRL 24.9 Bn
Recurring Net Income 2Q18 3 BRL 6.4 Bn
Long Term Foreign Currency Moody´s: Ba3
(Itaú Unibanco Holding) Fitch: BB
S&P: BB-
Financial Ratios
Recurring ROE 2017 4 (*) 21.8%
Recurring ROE 2Q18 5 21.6%
Efficiency Ratio 2017 6 (*) 46.4%
Efficiency Ratio 2Q18 6 47.1%
Liquidity Coverage Ratio 169%
Tier I Capital 15.1%
(*) Includes the consolidation of Citibank in the 4Q17.(1) Includes financial guarantees provided and corporate securities. (2) Represents Net Income adjusted for certain non recurring events described in the 4Q17 MD&A – Executive Summary.
(3) Represents Net Income adjusted for certain non recurring events described in the 2Q18
MD&A – Executive Summary.
(4) Calculated using Recurring Net Income / Average Equity. For annualized calculation
method, please refer to Historical Series Spreadsheet.
(5) Calculated using Recurring Net Income / Average Equity. For annualized calculation
method, please refer to the 2Q18 MD&A – Executive Summary.
(6) See “Efficiency Ratio” slides in this presentation for criteria.

| 9 |
Itaú Unibanco | Joint Ventures and Partnerships with Retailers2
HighlightsJVs and Partnerships
• Focus on credit card instruments
• Long term agreements
• Alignment of incentives
• Brazilian market leader in credit card transactions.
• Qualification of the client base: proprietary channel x partnerships
• Credit card business comprises:
• Issuance of cards
• Acquiring: REDE
• JVs and partnership with retailers
• Own brand: Hiper
• Approximately 58.0 million card accounts (2Q18)
• 31.1 million credit card accounts
• 26.9 million debit card accounts
• R$ 108.9 billion in card transactions (2Q18)
• R$ 81.7 billion in credit card transactions
• R$ 27.2 billion in debit card transactions
• High growth potential in credit card usage in Brazil.
Highlights

| 10 |
Itaú Unibanco | Capital Ratios2
1 The impact of 0.6% represents AT1 issued; 2 Includes deductions of Goodwill, Intangible Assets (generated before and after October 2013), Tax Credits from Temporary Differences and Tax Loss Carryforwards, Pension Fund Assets, Equity Investments in Financial Institutions, Insurance and
similar companies, the increase of the multiplier of the amounts of market risk, operational risk and certain credit risk accounts. This multiplier, which was 10.8% in 2017, is at 11.6 nowadays, will be 12.5 in 2019; 3 Based on preliminary information; 4 Includes a 10 basis points impact from the
exchange rate variation over the Additional Tier I Capital perpetual notes.
Full application of Basel III rules │ June 30, 2018
Net Income, RWA,
Tax Assets and OtherAT1 issued
Mar-18 4
Tier I Capital
Dec-17 2Investment in XP 3 Tier I Capital
Jun-18
Tier I Capital
Jun-18
Tier I Capital
Dec-17
Additional dividends
and IOC
Common Equity Tier I (CET I) Additional Tier I (AT1)
16.1%-1.8%-0.8%
13.5% 13.8% 14.2%0.3%
0.4%1

| 11 |
Itaú Unibanco | Efficiency Ratio and Risk-Adjusted Efficiency Ratio2
Note: Includes the consolidation of Citibank as of 4Q17.

| 12 |
Itaú Unibanco | Information Technology: Digital Transformation2
1 Individuals accounts.
| 13 |
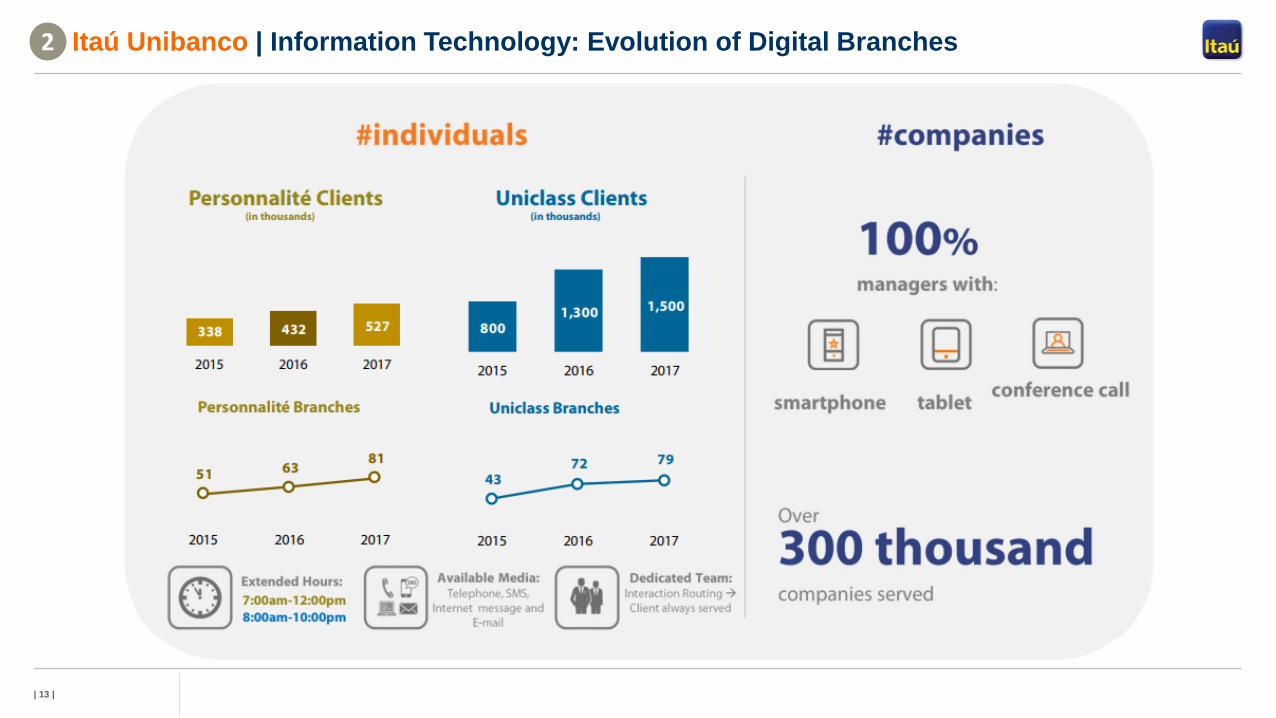
Itaú Unibanco | Information Technology: Evolution of Digital Branches2

| 14 |
Itaú CorpBanca | Investment Case
1 As of June 30, 2018. Source: Economatica
2 – Rankings based on gross loans as reported to the Superintendencia de Bancos e Instituciones Financieras (SBIF), excluding loans from Itaú CorpBanca Colombia, and Superintendencia Financiera de Colombia (SFC).
Source: Company financials.
Solid Macroeconomic Fundamentals and Expanding Banking Sector
Chile is one of the most developed economies in Latin America, sustained by solid macroeconomic fundamentals
Chile has one of the best sovereign ratings and among the lowest CDS spreads in Latin America
Colombia is also an attractive market with a diversify economy
The Chilean and the Colombian banking sectors have achieved high profitability and healthy assets quality with effective regulatory oversight
LatAm Banking Sector has potential to achieve further growth, particularly in the underpenetrated retail segments
Solid
Macroeconomic
Fundamentals
Unique control and support from a leading institution
Itaú Unibanco is the largest private financial institution in Brazil and a premier LatAm franchise
Itaú CorpBanca benefits from the strength of a ~US$67.6 BN1 market cap partner in its existing markets while enhancing
opportunities for growth abroad
Opportunity to leverage Itaú Unibanco’s strong global client relationships successful managing model
Itaú CorpBanca will be able to expand its banking products’ offering through segmentation and digitalization
Emergence of a leading banking platform in Chile and Colombia
Greater scale and resources to grow and compete more effectively in Chile and Colombia
Enhanced footprint in Chile and Colombia create a platform to expand in the region, particularly into Peru and Central America
4th largest private bank in Chile and 6th largest banking group in Colombia by total loans2
2
1
3
4Itaú CorpBanca will have a stronger financial profile and greater earnings power
Estimated pre-tax cost synergies between US$88MM and US$107MM approximately per year on a fully phased-in basis and
total one-time pre-tax integration costs of approximately US$85MM to occur during the first 3 years
Improved funding profile and substantial potential for revenue synergies
Additional cross-selling opportunities
Improved capital position opens room for further loan growth
Unique Control
and
Support
Banking Platform
with Larger Scale
Positive Impact
to Itaú CorpBanca

| 15 |
Itaú CorpBanca | Our Vision3
To be the leading bank in sustainable performance and customer satisfaction
1. Implement a customer satisfaction-oriented culture, that is business-driven, through a simplified operational structure
2. Maximize shareholder returns, aiming at firm-wide growth
3. We aspire to be the preferred bank for top talents at every level
• Attract and retain committed professionals with high ethical standards and strong organizational pride
• Shared leadership, conquered through talent and commitment to excellence, focused on meritocracy
4. Create an atmosphere that inspires creativity, entrepreneurialism and the exchange of ideas
5. Pursue a cutting-edge technology, striving to best serve our client needs, ultimately creating value
6. Uphold the highest ethical standards in the relationship with clients, employees, regulators, society and the markets

| 16 |
Itaú CorpBanca | Our Way3
We seek to create a culture based on seven attitudes that define our identity and identify us in the way
we do business. Each one of them represents the core of what we focus on as institution.
1. It´s only good for us if it’s good for the client
We are people providing service to people, with passion and excellence. We work with the client and for the client –because they are the main reason behind why we
do what we do.
2. We’re passionate about performance
Generating sustainable results is in our DNA. The continuous challenge of seeking leadership in performance has brought us to where we are –and will continue
guiding our company towards our objectives.
3. People mean everything to us
Everything we do is carried out by people. Talented people who enjoy working in a collaborative atmosphere, based on meritocracy and high performance.
4. The best argument is the one that matters
We encourage a challenging work environment, which is open to questioning and constructive discussion. For us, the hierarchy which counts is the hierarchy of the
best idea.
5. Simple. Always
We believe that simplicity is the best path to efficiency. That’s why we strive not to mistake depth for complexity, and simplicity for simplism.
6. We think and act like owners
We always think like business owners, leading by example and putting collective objectives before personal ambition.
7. Ethics are non-negotiable
We do what is right, without using shortcuts or devious ways to do business. We exercise leadership in a transparent and responsible way, fully committed to society
and the best governance and management practices.

| 17 |
Itaú CorpBanca | Highlights3
We are the 4th largest private bank in Chile and the 6th 1 banking group in Colombia
Regional footprint & main indicators 2 3
10.5% 2 4.9% 4Market Share
US$ 24.8 bn US$ 7.5 bnLoans 2 US$ 32.4 bn
5,822 5 3,533 6Headcount 2 9,355
200 163 Branches 2 363
US$ 34.5 bn US$ 10.4 bnAssets 2 US$ 44.9 bn
US$ 97 mn US$ 2 mn Recurring Net Income 2Q18 US$ 99 mn
16.9% 1.6% Recurring RoTAE 2Q18 7 13.7%
1 Ranking for assets and loans consider Grupo Aval as the combination of Banco de Bogotá, Occidente, Popular, AV Villas; 2 Consolidated information as of June 30, 2018; 3 Figures were converted at an exchange rate of 653.02 CLP/USD; 4Consolidated information as of May 31, 2018; 5 Includes headcount of our New York branch and since 1Q’18 also from our RepOffices in Lima and Madrid; 6 Includes headcount of Itaú (Panamá); 7 Tangible Equity: Shareholders equity net of goodwill, intangibles from business combination and related deferred tax liabilities.
Sources: Itaú CorpBanca, SBIF and SFC.

| 18 |
Itaú CorpBanca | Increases Relevance Across Latin America3
Itaú CorpBanca is currently the 4th largest private bank in Chile. The merger positions Itaú CorpBanca and Itaú LatAm as the 10th and
4th largest bank in terms of assets within South America (ex-Brazil)
4
(US$ Bn)
US$ Bn US$ Bn
Bradesco3
7. Banco del Estado de Chile
Caixa
Santander
9. Sotiabank
Banco do Brasil
8. BBVA
Citibank
1
2
3
4
5
6
7
8
9
15
Banco del Estado de Chile
Scotiabank
5. BCI
Santander
BBVA
Itaú LatAm6
1
2
3
5
6
7 Grupo Aval
Bancolombia
Itaú CorpBanca4
9
8
Itaú CorpBanca represents 24%
of Itaú Unibanco’s consolidated
loan portfolio7
Itaú Unibanco2
10Itaú CorpBanca4
Banco de Chile
1 Data as of March 31, 2018. Includes Brasil, México, Colombia, Chile, Argentina, Paraguay, Perú and Uruguay; 2 Includes Brasil, México, Argentina, Perú, Uruguay, Paraguay, Chile y Colombia; 3 In September 30, 2016 Bradesco begins to consolidate HSBC Brasil in its publication; 4 Includes Chile y Colombia (Itaú CorpBanca Chile with
~US$37MMM in assets); 5 Data as of March 31, 2018. Includes Colombia, Chile, Argentina, Paraguay, Perú and Uruguay; 6 Includes Colombia, Chile, Argentina, Paraguay, Perú and Uruguay; 7– Considering the consolidated loan portfolios of Itaú Unibanco and Itaú CorpBanca reported in their respective 2Q’18 MD&As and a R$ 3.8617 / US$ and a Ch$
653.02 / US$ foreign exchange rates as of 30.06.2018; 8– As of June 30, 2018, Itaú Unibanco held a 36.06% equity stake in Itaú CorpBanca but as the controlling shareholder, fully consolidates Itaú CorpBanca’s Financial Statements.
Source: Central Banks, local regulators, companies filings, Itaú CorpBanca.
430
461
375
98
385
80
376
194
61
48
Banks by Assets in Latin America1
55
55
61
55
48
85
86
61
58
52
Loan portfolio as of Jun.18
Banks by Assets in South America (ex-Brazil)5

| 19 |
Itaú CorpBanca | Shareholders Structure After Merger3
1 – For Itaú CorpBanca and BCI consider shareholders equity net of goodwill and intangibles from business combination.
US$ 5.4 BnMarket Cap. (Aug 7, 2018)
Buy: 2
Hold: 7
Sell: 2
Sell-side rating:
Shareholders & Stock Market
Source: Bloomberg and sell-side reports.
Price-to-Book1

| 20 |
Itaú CorpBanca | Outstanding YTD share price performance among LatAm Banks 3
Notes: 1 Excludes Scotiabank Chile (former BBVA Chile) since it has no transactions except the tender offer that Scotiabank Canada launched to take control of BBVA Chile; 2 Price performance over share local currency prices.
Source: Bloomberg. Data as of July 24, 2018.
5,0%
5,6%
6,7%
7,2%
7,9%
10,0%
10,6%
11,5%
12,1%
12,2%
12,9%
12,9%
14,5%
15,3%
16,3%
17,1%
18,4%
21,5%
22,6%
24,5%
25,3%
44,8%
SM-CHILE SA-B
BANCO DO BRASIL S.A.
BANCO DE CHILE
BANCO DE CREDITO E INVERSION
REGIONAL SAB DE CV
INTERCORP FINANCIAL SER INC
BANCO SANTANDER MEXICO-B
ITAU UNIBANCO HOLDING S-PREF
BANCO SANTANDER BRASIL-UNIT
BG FINANCIAL GROUP SA
INTERBANK-COMUN
CREDICORP LTD
BANCO SANTANDER CHILE
BBVA BANCO CONTINENTAL SA-CO
BANCO DE CREDITO DEL PERU-C
BANCOLOMBIA SA
SCOTIABANK PERU-COMMON
ITAU CORPBANCA
GRUPO FINANCIERO BANORTE-O
BANCO DAVIVIENDA SA
BANCO DEL BAJIO SA
POPULAR INC
BANCO DE CREDITO E INVERSION
BANCO SANTANDER CHILE
ITAÚ CORPBANCA
BANCO DE CHILE
Mid & Large Cap LatAm Banks1 2

| 21 |
Itaú CorpBanca | Strong and Integrated Corporate Governance3
Board Chile
Wholesale
Milton Maluhy
Treasury Marketing &
Products
IT Human
ResourcesRetailCRO Legal
Álvaro Pimentel
Treasury
Derek
Sassoon
CRO
Juan Ignacio
Castro• Credit Risk:
Frederico Quaggio
IT
Bernardo
Alba
Legal & General
Secretary
Dolly
Murcia
Human
Resources
María Lucía
Ospina
Wholesale
Jorge
Villa
Communications &
Institutional Relations
Carolina
Velasco
Operations
Liliana
Suárez
Retail
Hernando
Osorio
Chairman
Milton Maluhy
Matrix reporting to CEO Colombia and
functional reporting to ITCB
Functional reporting to CEO Colombia
and matrix reporting to ITCB for
coordination of specific themes
Board Colombia
Board Colombia
Roberto Brigard Holguín
Luis Fernando Martínez Lema
Carmiña Ferro Iriarte
Rafael Pardo Soto
Juan Echeverría González
Gabriel Moura
Rogério Braga
Mónica Aparicio Smith
Chairman
Milton Maluhy
Colombia
Pedro
Silva
Mauricio
Baeza
Rogério
BragaÁlvaro
Pimentel
Christian
TauberJulián
Acuña
Marcela
JiménezCristián
Toro
Luis
Rodrigues
Itaú CorpBanca Colombia CEO
Itaú Corpbanca CEO
Board Chile1 2
Chairman
Jorge Andrés Saieh Guzmán
Ricardo Villela Marino
Eduardo Mazzilli de Vassimon
Boris Buvinic Guerovich
Andrés Bucher Cepeda
Pedro Samhan Escandar
Fernando Concha Ureta
Jorge Selume Zaror
Fernando Aguad Dagach
Gustavo Arriagada Morales
Bernard Pasquier
1 Itaú Unibanco and CorpGroup appoint the majority of the members of the board of directors; 2 Pursuant to the Shareholders Agreement, the Directors appointed by Itaú Unibanco and CorpGroup shall vote together as a single block according to Itaú
Unibanco’s recommendation.
Audit Committee
CAE
Emerson Bastián
Franchise,
Products & Digital
Luciana
Hildebrandi
CFO
Gabriel
Moura
CFO
María Cristina
Vandame
Operations
Jorge
Novis

| 22 |
Itaú CorpBanca | Competitive Environment3
1 As of June 30, 2018; 2 As of May 31, 2018.Sources: SBIF and SFC.
2,9%
5,7%
6,5%
8,2%
13,8%
20,2%
16,2%
17,1%
3,3%
6,4%
7,3%
10,5%
14,1%
14,9%
17,1%
18,8%
Peer-F
Peer-D
Peer-E
Itaú CorpBanca
Peer-C
Estado
Peer-A
Peer-B
Loans Total Deposits
2,4%
4,6%
5,6%
12,0%
13,4%
23,0%
26,6%
2,9%
4,9%
5,2%
10,5%
15,0%
25,6%
25,7%
Peer-F
Itaú CorpBancaColombia
Peer-E
Peer-D
Peer-C
Peer-B
Peer-A
Loans Total Deposits
Market Share Colombia2Market Share Chile1

| 23 |
Itaú CorpBanca | Investment Case
1 As of June 30, 2018. Source: Economatica
2 – Rankings based on gross loans as reported to the Superintendencia de Bancos e Instituciones Financieras (SBIF), excluding loans from Itaú CorpBanca Colombia, and Superintendencia Financiera de Colombia (SFC).
Source: Company financials.
Solid Macroeconomic Fundamentals and Expanding Banking Sector
Chile is one of the most developed economies in Latin America, sustained by solid macroeconomic fundamentals
Chile has one of the best sovereign ratings and among the lowest CDS spreads in Latin America
Colombia is also an attractive market with a diversify economy
The Chilean and the Colombian banking sectors have achieved high profitability and healthy assets quality with effective regulatory oversight
LatAm Banking Sector has potential to achieve further growth, particularly in the underpenetrated retail segments
Solid
Macroeconomic
Fundamentals
Unique control and support from a leading institution
Itaú Unibanco is the largest private financial institution in Brazil and a premier LatAm franchise
Itaú CorpBanca benefits from the strength of a ~US$67.6 BN1 market cap partner in its existing markets while enhancing
opportunities for growth abroad
Opportunity to leverage Itaú Unibanco’s strong global client relationships successful managing model
Itaú CorpBanca will be able to expand its banking products’ offering through segmentation and digitalization
Emergence of a leading banking platform in Chile and Colombia
Greater scale and resources to grow and compete more effectively in Chile and Colombia
Enhanced footprint in Chile and Colombia create a platform to expand in the region, particularly into Peru and Central America
4th largest private bank in Chile and 6th largest banking group in Colombia by total loans2
2
1
3
4Itaú CorpBanca will have a stronger financial profile and greater earnings power
Estimated pre-tax cost synergies between US$88MM and US$107MM approximately per year on a fully phased-in basis and
total one-time pre-tax integration costs of approximately US$85MM to occur during the first 3 years
Improved funding profile and substantial potential for revenue synergies
Additional cross-selling opportunities
Improved capital position opens room for further loan growth
Unique Control
and
Support
Banking Platform
with Larger Scale
Positive Impact
to Itaú CorpBanca

| 24 |
Itaú CorpBanca | Business Mix4
1 Yearly average gross loans; 2 Loan interests by segments;Source: SBIF; Itaú CorpBanca; Team Analysis.
Loans breakdown by segment¹LTM Jun 2018, Ch$ Bn
13.7
6.7
13.9
6.4
Total
5.3 5.5
5.6 5.7
ItaúCorpbanca
AverageTop 3
Interest Rates
25,690
Consumer
Commercial
15,59024,877
Mortgage
27,924
∆ 30 bp
38 bp por mix
Peer-A Peer-B Peer-C
Current rate w/ top 3 mix 6.8
6.7
Current 6.4
Top 3
6.4Top 3 rates w/ current mix
Mix difference explains most es the Yield
gap with the Top 3
100% =2
55.3%51.0%
64.5%
29.1%32.7%
23.9%
15.7% 16.3%11.6%
66.8%
23.3%
9.9%

| 25 |
Itaú CorpBanca | Current Scale Allows for Better Segmentation4
IndividualsBy monthly income(CLP MM)
CompaniesBy annual sales
(USD MM)
Investments > USD 1MM
Over $2.5
From $0.6 to $2.5
Up to $0.6
Private Bank
Personal Bank
Itaú Branches
Condell
Over $100
From $8 to $100
From $1 to $8
From $0.1 to $1
Corporate
Large
Middle
Very Small and Small
Wh
ole
sale
Ba
nk
ing
Re
tail
Ba
nk
ing

| 26 |
Fully implemented segmentation model with well defined identity and value proposition, aimed at optimizing service
level, satisfaction and profitability per client.
Branch profile in Chile
22 Itaú Personal Bank
122 Itaú Sucursales
55 Condell (Consumer Finance)
Itaú Personal Bank Itaú Sucursales
Itaú CorpBanca | Individuals Segmentation Overview4

| 27 |
Itaú CorpBanca | Business Mix: An Opportunity for a Digital Strategy4
The merger doubles the footprint of the new bank
Top players have a large branch network, with significant expenses related
Itaú CorpBanca departs from the previous peer group
Branches3 4Branches3 4
Market Share1 by Total Loans2
1 As of June 30, 2018 except for CorpBanca and BIC whose market shares are as of March 31, 2016; 2 Total loans includes commercial, consumer and mortgage loans; 3 As of May 31, 2018; 4 Itaú CorpBanca branches include BancoCondell.
Note: Figures do not include foreign operations of Chilean banks (ItaúCorpBanca Colombia and National Bank of Florida)
Market Share1 by Consumer Loans

| 28 |
Continuous improvement of
the look and feel of our digital
channels.
Review and improvement of benefits and
offers linked to stronger transactionality
and relationship.
Advancing with roll-out of new digital
services and offerings. Executing a
well defined pipeline of digital
solutions.
Itaú CorpBanca | Client Experience, Digital Banking and Value Offer 4

| 29 |
Increasing transactions
Higher adoption of our App
146more CLIENTS since Apr’16
# sales of retail installment loans
Itaú CorpBanca | Increasing Digital Transactions4
91%
22%
9%
78%
Apr'16 Jun'18
Sales through traditional channels Sales through Digital Channels (Internet + App)

| 30 |
7.5%
DEC 2014
7.4%
MAR 2015
7.2%
MAR 2016
7.0%
MAR 2017
7.1%
JUN 2017
7.4%
SEP 2017
7.7%
DEC 2017
12-months installment loans growth: Itau vs. Financial System
Installment Loans market share
Itaú CorpBanca | Business Growth in Retail 4
8.0%
MAR 2018
5,8%
9,1%
1,7%
23,4%
abr-16 jun-16 sep-16 dic-16 mar-17 jun-17 sep-17 dic-17 mar-18 jun-18
Financial System Itaú CorpBanca
JUN 2018
7.9%

| 31 |
Itaú CorpBanca | Funding Mix4
Total Funding BreakdownInterest Rates
29,847 19,459
Debt Issued
33,024
Others1
100%31,837
Checking accounts
and deposits
2.7
2.0
3.1
2.7
Total
0.2 0.3
4.3 4.6
Itaú Corpbanca
0.8 0.8
Average Top 3
∆ 67 bp
45 bp por mix
Peer-A Peer-B Peer-C
Top 3 rates w/ current mix 2.4
Top 3
Current
Current rate w/ top 3 mix
Non-interest bearing liabilities are the main
reason for the gap when compared to the
3 players
Time Deposits
1 Others: Repurchases contracts, financial derivatives, bank obligations, letters of credit, other financial obligations, taxes, differed taxes, provisions, other liabilities.
LTM Jun 2018, Ch$ Bn
14.0% 17.2% 19.1% 20.6%
22.3%22.1% 16.5%
27.6%
34.4%
37.3%
34.9%
39.7%
29.3%23.4%
29.5%
12.1%
2,7
2,0
2,2

| 32 |
Itaú CorpBanca | Debt Spread Evolution4
Itaú CorpBanca has presented a noticeable convergence to peers
Spread vs.Peers1: 30-day (annualized) Spread vs.Peers1: 5-year (annualized)
1 – Average of top 3 peers in Chile. As of August 14, 2018; 2 – As of July 9, 2018.
Bonds in CLP & UF (expressed in USD MM) Spread vs.Peers1
Bonds issued in Chile LTM2
8 bp7 bp 5 bp 5 bp
7 bp5 bp
4 bp
9 bp
2 bp
6 bp
126 126
42 46
154
84 103
210
108 84
04-0
4-2
017
04-0
4-2
017
08-2
5-2
017
09-2
5-2
017
10-1
7-2
017
02-0
6-2
018
02-2
1-2
018
03-1
4-2
018
04-1
3-2
018
06-0
5-2
018
0
0,5
1
1,5
2
2,5
3
3,5
4
4,5
oct
-11
ene-
12
abr-
12
jul-
12
oct
-12
ene-
13
abr-
13
jul-
13
oct
-13
ene-
14
abr-
14
jul-
14
oct
-14
ene-
15
abr-
15
jul-
15
oct
-15
ene-
16
abr-
16
jul-
16
oct
-16
ene-
17
abr-
17
jul-
17
oct
-17
ene-
18
abr-
18
jul-
18
Chile Santander BCI CorpBanca Itaú
-0,25
0,00
0,25
0,50
0,75
1,00
1,25
1,50
1,75
2,00
2,25
2,50
2,75
jul-
11
oct
-11
ene-
12
abr-
12
jul-
12
oct
-12
ene-
13
abr-
13
jul-
13
oct
-13
ene-
14
abr-
14
jul-
14
oct
-14
ene-
15
abr-
15
jul-
15
oct
-15
ene-
16
abr-
16
jul-
16
oct
-16
ene-
17
abr-
17
jul-
17
oct
-17
ene-
18
abr-
18
jul-
18
Chile Santander BCI Itaú Corpbanca

| 33 |
Itaú CorpBanca | Rating upgrades in 2016 contribute to further reduction in cost of funds4
Source: Itaú CorpBanca, Moody’s, S&P
Current International Ratings
Moody's S&P
Financial
Capacity
Rating Scale Rating Scale
LT ST LT ST
Extremely
strongAaa
P-1
AAA
A-1+Very
strong
Aa1 AA+
Aa2 AA
Aa3 AA-
Strong
A1 A+
A-1
A2 A
A3
P-2
A-
A-2
Adequate
Baa1 BBB+
Baa2
P-3
BBB
A-3
Baa3 BBB-
+3n +1n
Timeline S&P
2007 2008 2009 2010 2011 2012 2013 2014 2015 2016 2017 2018
A+ A+
A
A
A
A
A-A-A-
BBB+
BBB BBB
BBB+
A
A+
BBB+
A+

Agenda1. Investment Case
2. Financials
3. Integration Milestones
4. Appendix

| 35 |
Financials | Financial Information
The financial information included in this section is based in our managerial model that we adjust for non-recurring events, for the amortization of intangibles arising
from business combination, and for the tax effect of the hedge of our investment in Colombia. At the same time, we adjust the Managerial Income Statement with
additional reclassifications of P&L lines in order to provide a better clarity of our performance. Please refer to pages 9 and 10 of our Management Discussion &
Analysis Report (“MD&A Report”) for further details, available at itau.cl/investor-relations.

| 36 |
Financials | Managerial Recurring Net Income (Reconciliation)
Non-Recurring Events(a) Restructuring costs: One-time integration costs.
(b) Transactions costs: Costs related to the closing of the merger between Banco Itaú Chile and CorpBanca, such as investment banks, legal advisors, auditors and other related expenses.
(c) SBIF fine: Fine imposed by the SBIF which, as instructed by the regulator, was accounted for as an expense impacting 2015 Net Income and once the Supreme Court ruled in our favor we
proceeded to reverse such expense impacting 2017 Net Income.
(d) Amortization of Intangibles from business combinations: Amortization of intangibles generated through business combination, such as costumer relationships.
(e) Accounting adjustments: Adjustments in light of new internal accounting estimates.
(f) Sale / revaluation of investments in companies: the fiscal effect of the sale of SMU Corp in 2017.
in million of Chilean Pesos 2Q'18 1Q'18 2Q'17 6M'18 6M'17
Net Income Attributable to Shareholders (Accounting) 57,937 42,760 64,607 100,697 89,021
(-) Non-Recurring Events 6,987 7,390 -15,088 14,377 -13,164
(a) Restructuring costs - 588 893 588 2,259
(b) Transaction costs 1,376 1,439 2,815 -
(c) SBIF fine - - -21,765 - -21,765
(d) Amortization of intangibles from business combinations 8,626 8,510 8,692 17,136 17,381
(e) Accounting adjustments - - - - -2,267
(f) Sale / revaluation of investments in companies - - - - -3,145
Tax effects -3,014 -3,147 -2,909 -6,162 -5,627
Recurring Net Income Attributable to Shareholders (Managerial) 64,924 50,150 49,519 115,074 75,857

| 37 |
Financials | Recurring RoTE / Recurring RoTA1
RoTE / RoTA – Consolidated
RoTE / RoTA – Chile
0.8%
10.7%6.0%
-9.7%
5.3%
0.0%
0.7%0.4%
-0.7%
0.4%
1Q'16 2Q'16 3Q'16 4Q'16 1Q'17
Annualized Recurring Return on Average Equity (quarterly) Annualized Recurring Return on Average Assets (quarterly)
1 – Excludes Goodwill and intangibles assets from business combination, net of associated deferred tax liabilities.
0,8%
11,8%
6,7%
-10,8%
5,9%
10,8%
0,7%
-3,8%
10,8%13,7%
0,0%
0,7%0,4%
-0,7%0,4%
0,7%
0,0%
-0,3%0,7%
0,9%
1Q'16 2Q'16 3Q'16 4Q'16 1Q'17 2Q'17 3Q'17 4Q'17 1Q'18 2Q'18
2,7%
15,8%12,5%
-7,1%
9,9%13,4%
1,6%
-1,4%
13,9%16,9%
0,1%
1,0% 0,8%
-0,5%
0,7%0,9%
0,1%
-0,1%
1,0%1,2%
1Q'16 2Q'16 3Q'16 4Q'16 1Q'17 2Q'17 3Q'17 4Q'17 1Q'18 2Q'18

| 38 |
Financials | Income Statement
in million of Chilean Pesos 2Q'18 1Q'18 % $ 2Q'17 % $ 1S'18 1S'17 % $
Net interest income 144,135 134,088 7.5% 10,047 132,603 8.7% 11,532 278,222 261,910 6.2% 16,313
Net fee and commission income 35,221 39,629 -11.1% -4,408 30,762 14.5% 4,459 74,850 66,503 12.6% 8,347
Total financial transactions, net 24,126 23,344 3.3% 782 8,361 188.6% 15,765 47,471 29,015 63.6% 18,455
Other operating income, net -5,946 821 -824.3% -6,767 964 -716.6% -6,910 -5,125 -2,813 82.2% -2,312
Net operating profit before credit & counterparty losses 197,536 197,882 -0.2% -346 172,690 14.4% 24,846 395,418 354,615 11.5% 40,803
Result from loan losses, net -33,980 -30,705 10.7% -3,275 -37,528 -9.5% 3,548 -64,685 -76,583 -15.5% 11,899
CVA (ratings and collaterals effects) 7,981 352 n.m. 7,629 21,147 -62.3% -13,167 8,333 15,681 -46.9% -7,349
Net operating profit 171,537 167,529 2.4% 4,007 156,309 9.7% 15,227 339,066 293,713 15.4% 45,353
Operating expenses -101,012 -105,527 -4.3% 4,515 -98,927 2.1% -2,085 -206,538 -199,736 3.4% -6,802
Operating income 70,525 62,003 13.7% 8,522 57,382 22.9% 13,143 132,528 93,976 41.0% 38,551
Income from investments in other companies 221 25 784.0% 196 264 -16.3% -43 246 264 -6.8% -18
Income before taxes 70,746 62,028 14.1% 8,718 57,646 22.7% 13,100 132,774 94,240 40.9% 38,533
Income tax expense -7,421 -10,637 -30.2% 3,216 -9,469 -21.6% 2,048 -18,057 -11,782 53.3% -6,275
Net income attributable to shareholders 63,343 51,380 23.3% 11,963 48,208 31.4% 15,135 114,724 82,435 39.2% 32,288
Change Change Change

| 39 |
Financials | Loan Portfolio
Δ +1.1%
Market share Total Loans (Ch$ Tn)
Δ +1.9%
11,2 11,0 10,7 10,6 10,8
3,5 3,5 3,6 3,7 3,8
1,4 1,4 1,5 1,6 1,6
16,0 16,0 15,9 15,9 16,2
2Q'17 3Q'17 4Q'17 1Q'18 2Q'18
Commercial Mortgage Consumer
ITCB in Chile Financial System
1.1% 7.8%
-3.2% 7.0%
8.2% 9.2%
17.9% 8.3%
D% Loans 2Q'18/2Q'17
11.2% 11.0% 10.8% 10.6% 10.5%
13.6%13.3%
12.9%12.6%
12.3%
8.3% 8.3% 8.3% 8.3% 8.2%
7.2% 7.3%7.7% 7.7% 7.8%
2Q'17 3Q'17 4Q'17 1Q'18 2Q'18
Total Commercial Mortgage Consumer

| 40 |
Financials | Net provision for credit & counterparty risks
Net provision for credit & counterparty risks ratios (annualized)Net provision for credit & counterparty risks (Ch$ Bn)
39,1 37,5
61,5
90,3
30,7 34,0
5,5
(21,1)
8,8
17,9
(0,4) (8,0)
44,5 16,4
70,3
108,2
30,4 26,0
1Q'17 2Q'17 3Q'17 4Q'17 1Q'18 2Q'18
Result from loan losses, net CVA (ratings and collaterals effects)
1.1%
0.4%
1.8%
2.7%
0.8%0.6%
1Q'17 2Q'17 3Q'17 4Q'17 1Q'18 2Q'18
Provision for Credit & Counterparty risk / Average Loans

| 41 |
Financials | Credit Quality
CommercialTotal Loans
ConsumerMortgage
1.6% 1.6% 1.6% 1.6% 1.8% 1.8% 1.9%2.5% 2.6% 2.7% 2.8% 3.0% 3.0% 3.2%22% 22% 22% 21%
33% 31% 28%14% 13% 14% 13% 19% 18% 17%
12% 12% 10% 12% 18% 17% 17%
1Q'15 2Q'15 3Q'15 4Q'15 1Q'16 2Q'16 3Q'16
NPL90(%) Cartera deteriorada (%) NPL90 Coverage NPL90 Converage (Chilean Financial System) Cobertura Cartera Deteriorada Cartera Deteriorada coverage (Chilean Financial System)
1.4% 1.4% 1.6% 1.8% 1.8% 1.9% 2.1% 2.2% 2.1%
3.8% 4.3%4.9% 4.7% 4.7% 5.2% 5.7% 6.1% 5.8%
128% 133% 133%121% 126% 124% 119% 113% 114%
48% 45% 42% 46% 47% 44% 44% 41% 42%
50% 50% 49% 48% 48% 48% 48% 47% 47%
140% 138% 136%126%
136% 134% 130% 127% 125%
2Q'16 3Q'16 4Q'16 1Q'17 2Q'17 3Q'17 4Q'17 1Q'18 2Q'18
1.3% 1.2% 1.3% 1.5% 1.6% 1.7% 2.2% 2.4% 2.3%
4.1% 4.5% 5.3% 5.0% 5.1% 5.9% 6.2% 6.7% 6.2%
147%162%
168%
147% 152% 147%124% 112% 112%
47% 44% 41% 45% 47% 42% 43% 40% 42%
54% 54% 52% 51% 51% 50% 50% 48% 49%
170% 165%
166%
148% 154% 148% 142% 137% 135%
2Q'16 3Q'16 4Q'16 1Q'17 2Q'17 3Q'17 4Q'17 1Q'18 2Q'18
1.8% 1.9% 2.2% 2.4% 2.4% 2.4% 2.1% 1.9% 1.8%
31%
28%25% 25%
23% 22%26% 26% 25%
37% 36% 35% 34%36% 38% 36% 35% 34%
2Q'16 3Q'16 4Q'16 1Q'17 2Q'17 3Q'17 4Q'17 1Q'18 2Q'18
1.8% 1.8% 2.1% 2.1% 1.9% 2.0% 1.9% 1.8% 1.5%
249% 237% 231% 245%274% 277%
310%342%
385%
313% 320% 310%287% 303% 306%
298% 314% 306%
2Q'16 3Q'16 4Q'16 1Q'17 2Q'17 3Q'17 4Q'17 1Q'18 2Q'18
Note: ‘Cartera deteriorada’ includes low-end of the substandard portfolio and the impairment portfolio, according to SBIF criteria.

| 42 |
Financials | Income Statement
1 – Considers the elimination of foreign exchange variation, which is obtained by the application of the foreign exchange rate of June 30th, 2018 to all periods analyzed.
in million of Chilean Pesos - constant currency1 2Q'18 1Q'18 % $ 2Q'17 % $ 1S'18 1S'17 % $
Net interest income 72.823 67.161 8,4% 5.663 55.597 31,0% 17.227 139.984 108.867 28,6% 31.117
Net fee and commission income 8.300 6.468 28,3% 1.831 9.921 -16,3% -1.621 14.768 19.829 -25,5% -5.061
Total financial transactions, net 3.098 5.483 -43,5% -2.385 23.414 -86,8% -20.316 8.582 41.590 -79,4% -33.008
Other operating income, net -533 -204 161,1% -329 -1.775 -70,0% 1.242 -737 -5.200 -85,8% 4.463
Net operating profit before loan losses 83.688 78.908 6,1% 4.780 87.156 -4,0% -3.467 162.597 165.085 -1,5% -2.488
Result from loan losses -32.380 -30.757 5,3% -1.623 -31.322 3,4% -1.058 -63.137 -68.654 -8,0% 5.517
Net operating profit 51.309 48.151 6,6% 3.157 55.834 -8,1% -4.525 99.460 96.431 3,1% 3.029
Operating expenses -50.093 -50.404 -0,6% 311 -51.160 -2,1% 1.067 -100.498 -100.761 -0,3% 263
Operating income 1.215 -2.253 -153,9% 3.468 4.673 -74,0% -3.458 -1.038 -4.330 -76,0% 3.292
Income from investments in other companies -8 1.288 -100,6% -1.296 679 -101,2% -687 1.280 862 48,4% 417
Income before taxes 1.207 -965 -225,1% 2.172 5.352 -77,4% -4.145 242 -3.468 -107,0% 3.710
Income tax expense 3.014 4.744 -36,5% -1.730 2.692 12,0% 322 7.758 7.307 6,2% 452
Net income 4.221 3.779 11,7% 442 8.044 -47,5% -3.823 8.000 3.839 108,4% 4.162
(-) Minority Interests -1.419 -1.268 11,8% -150 -2.711 -47,7% 1.292 -2.687 -1.283 109,4% -1.404
(-) Cost of hedge positions for Colombia -1.168 -3.665 -68,1% 2.497 -4.136 -71,8% 2.968 -4.833 -9.266 -47,8% 4.434
Net income attributable to shareholders 1.634 -1.154 -241,7% 2.788 1.198 36,4% 437 481 -6.711 -107,2% 7.191
Currency conversion effects -53 -77 112 -130 133
Net income attributable to shareholders (nominal currency) 1.581 -1.231 -228,5% 2.812 1.310 20,7% 271 350 -6.578 -105,3% 6.928
Change Change Change

| 43 |
Financials | Synergies Update: Compared Evolution of Total Expenses
15.6%
7.4%
19.1%
8.1%
16.1%
5.3%
1.4%3.0%
18.9%
3.0%
8.1% 8.4%
16.3%
8.3%
4.5% 5.3%
2010 2011 2012 2013 2014 2015 2016 2017
Itaú CorpBanca Chile Chilean Financial System
Average: 11.9% ; 10.5%
Average: 2.2% ; 4.9%
Adjusted Total Expenses annualized growth (%)
In billion of Chilean pesos 2009 2010 2011 2012 2013 2014 2015 2016 2017
Total Expenses - Itaú CorpBanca1 220 255 275 402 545 732 736 801 766
(-) Itaú CorpBanca Colombia - - - (74) (191) (290) (253) (253) (274)
Total Expenses - Itaú CorpBanca Chile 220 255 275 328 354 441 483 548 492
(-) credit risk-related provisions2 (3) (4) (4) (6) (4) (4) (2) (11) (9)
(-) Non-recurring expenses - - - - - (32) (54) (83) (9)
(-) Depreciation and Amortization3 (10) (12) (14) (16) (20) (22) (24) (45) (52)
Adjusted Total Expenses - Itaú CorpBanca Chile 207 239 257 306 331 384 404 410 422
Yearly growth rate 15.6% 7.4% 19.1% 8.1% 16.1% 5.3% 1.4% 3.0%
Adjusted Total Expenses - Chilean Financial System 2,254 2,680 2,761 2,983 3,233 3,760 4,073 4,255 4,482
Yearly growth rate 18.9% 3.0% 8.1% 8.4% 16.3% 8.3% 4.5% 5.3%
1 – Includes commissions expenses, personnel expenses, administrative expenses, depreciation and amortization, impairment charges and other operational expenses. All data is Proforma
2 – Consisting of provisions for assets received in lieau of payment and provisions for Country risk. 3 – Includes the amortization of intangibles generated through business combinations which are
classified as a non-recurring expense on the MD&A.
| 44 |
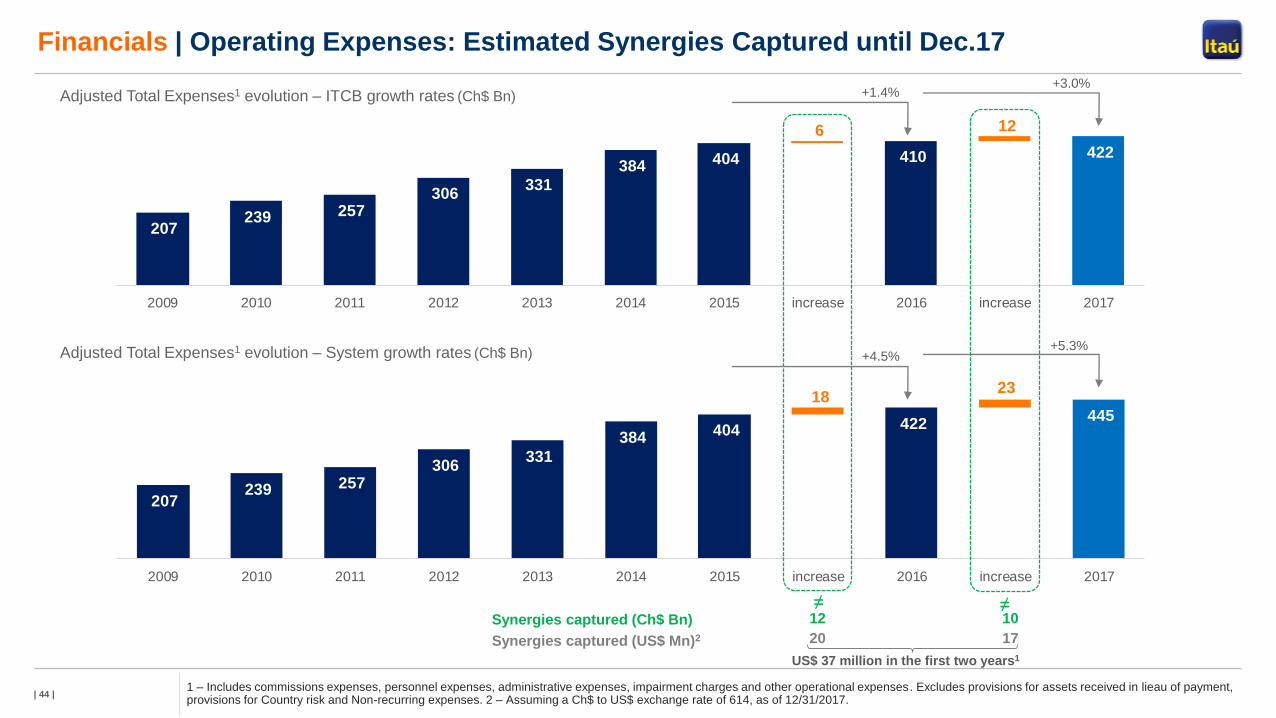
Financials | Operating Expenses: Estimated Synergies Captured until Dec.17
1 – Includes commissions expenses, personnel expenses, administrative expenses, impairment charges and other operational expenses. Excludes provisions for assets received in lieau of payment, provisions for Country risk and Non-recurring expenses. 2 – Assuming a Ch$ to US$ exchange rate of 614, as of 12/31/2017.
207 239 257
306 331
384 404 410 422
6 12
2009 2010 2011 2012 2013 2014 2015 increase 2016 increase 2017
207 239 257
306 331
384 404 422 445
18 23
2009 2010 2011 2012 2013 2014 2015 increase 2016 increase 2017
Synergies captured (Ch$ Bn)≠
Synergies captured (US$ Mn)2
12 10
20 17
US$ 37 million in the first two years1
Adjusted Total Expenses1 evolution – ITCB growth rates (Ch$ Bn)
Adjusted Total Expenses1 evolution – System growth rates (Ch$ Bn)
≠
+1.4%+3.0%
+4.5%+5.3%

| 45 |
Financials | Liquidity Risk
Regulatory Liquidity: Mismatch vs. Peers in Chile
Ch$ BnLímit
Capital
Básico¹
Total gap -
30 days
Total gap -
90 days
Total gap -
30 days
Total gap -
90 days
Peer-A 100% 3,168 1,298 2,153 41% 34%
Peer-B 100% 2,965 2,058 3,470 69% 59%
Peer-C 100% 2,813 1,400 2,865 50% 51%
Estado 100% 1,659 1,292 2,384 78% 72%
Itaú CorpBanca (Chile only) 100% 3,271 1,073 1,698 33% 26%
Itaú CorpBanca has lowest maturity mismatches compared with peers
• Liquidity: high liquidity standards are an important driver of
our balance sheet management both in Chile and in
Colombia.
BIS III Liquidity Framework – LCR2
1 – According to SBIF BIS I definitions. 2 – LCR: Liquidity Coverage Ratio calculated according to BIS III rules. Regulatory LCR ratios are still under construction in Chile.
Source: Quarterly liquidity status report as of June 30, 2018 for each bank available in the corresponding websites.
26%34%
59%
72%
51%
Itaú CorpBanca(Chile only)
Peer -A Peer -B Peer-C Estado
139.2%
124,8%
70%
90%
110%
130%
150%
170%
190%
210%
LCR CH Límite LCR
| 46 |
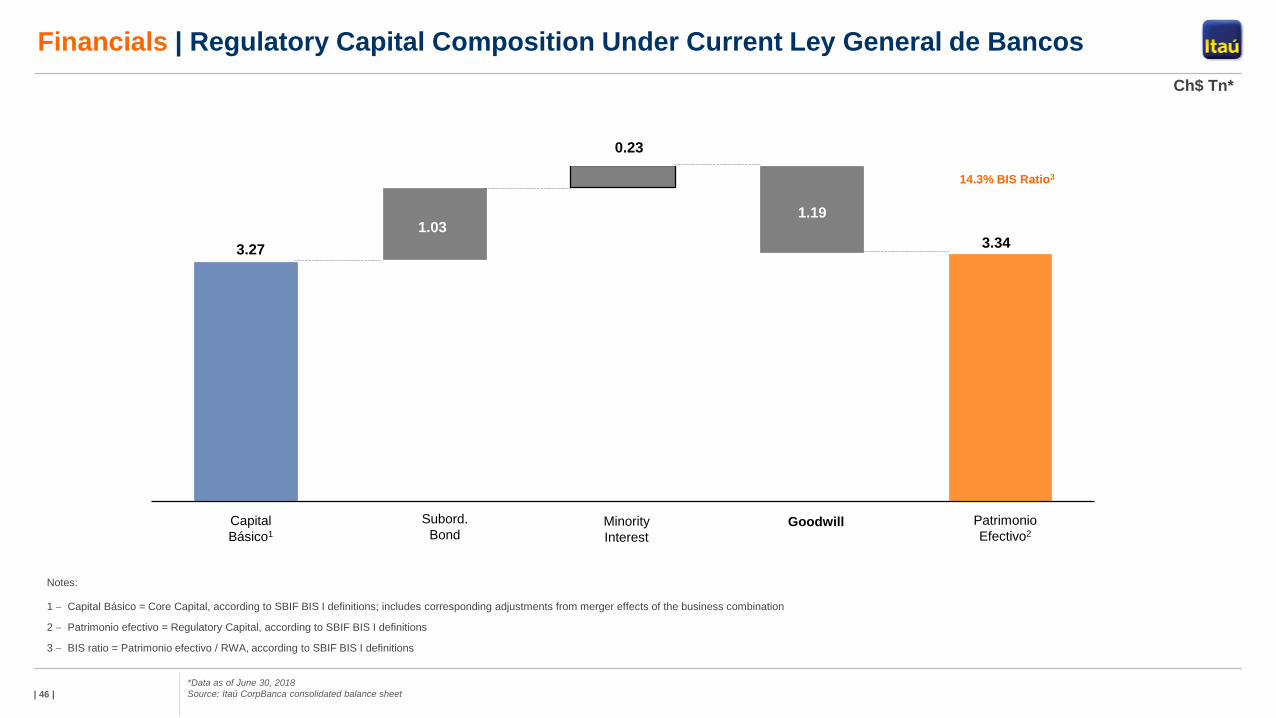
Financials | Regulatory Capital Composition Under Current Ley General de Bancos
Notes:
1 Capital Básico = Core Capital, according to SBIF BIS I definitions; includes corresponding adjustments from merger effects of the business combination
2 Patrimonio efectivo = Regulatory Capital, according to SBIF BIS I definitions
3 BIS ratio = Patrimonio efectivo / RWA, according to SBIF BIS I definitions
Ch$ Tn*
1.03
Capital
Básico1
Subord.
BondMinority
Interest
Patrimonio
Efectivo2
Goodwill
*Data as of June 30, 2018
Source: Itaú CorpBanca consolidated balance sheet
3.27
0.23
3.34
14.3% BIS Ratio3
1.19

| 47 |
Financials | Current Regulatory Capital Ratio & Estimated BIS III Capital Ratio
Current regulatory capital ratio evolution (LGB) Estimated1 BIS III capital ratio (new LGB)
14.3% 14.3%
18 bp 9 bp -32 bp 0 bp
Mar.18 Capital Basico SubordinatedBonds
RWA Other Jun.18
Tier I
Tier II
9.9%
7.3%
-2.6%
+ / -
Regulatory Capital
Ratio (Jun.18)
Other Intangible Assets
/ Net Deferred Taxes
Net effect of changes
in RWA
Estimated Fully Loaded
BIS III Capital
4.4%3.6%
-0.8%
14.3%
10.9%
1 – Reflects our best estimate for the impact of the implementation of the new Banking Law in Chile. The actual impact depends on definitions still to be set by the Comision para el Mercado
Financiero (CMF).
Agenda1. Investment Case
2. Financials
3. Integration Milestones
4. Appendix

| 49 |
Integration Milestones | Itaú CorpBanca’s Integration Process Timeline
2018 20172016
Merger Transition Construction
• Team building: senior and middle
management
• Corporate Governance, risk management
framework and other policies
• Balance sheet and liquidity strenghtening
• Full focus on client satisfaction
• Focus on increasing and sustainable results
• Completing technological integration and
advancing with digital agenda
• Strengthening our culture throughout the
organization
• Completion of retail migration and client
segmentation in Chile
• Initial roll out of Digital initiatives
• Resuming business growth in retail
• Introduction of Itaú Brand in the
Colombian retail Market

| 50 |
Integration Milestones | Next Steps
Chile
• Full focus on client satisfaction
• Focus on increasing and sustainable results
• Advance the technological integration and digital agenda
• Strengthen our culture throughout the organization
Colombia
• Complete branch and client migration
• Complete the technological integration
• Implement retail and wholesale business strategies
• Strengthen our culture throughout the organization

Agenda1. Investment Case
2. Financials
3. Integration Milestones
4. Appendix

| 52 |
Financials | Average Tangible Equity Breakdown
All other Assets: Ch$ 27,597
Ch$ 21,030
Ch $6,567
All other Liabilities: Ch$ 25,518
Ch$ 19,533
Ch$ 5,986
Asociado a Intangibles PPA: Ch$ 40
Minority Interest ex GW and PPA
Intangibles: Ch$ 188
Assets: 29,081
Liabilities: 25,609
Minority Interest: 223
2Q’18 Average Balance (Ch$ Tn)
Managerial Tangible Equity: Ch$ 1,890
Ch$ 1,497
Ch$ 393
Shareholders’ Equity: 3,248
Managerial Tang. Equity:
Recurring Results:
Recurring RoTE:
Ch$ 1,890 Ch$ 1,497 Ch$ 393
Ch$ 64.9 Ch$ 63.3 Ch$ 1.6
÷ ÷ ÷
13.7% 16.9% 1.6%
= = =
Goodwill: Ch$ 1,184
Ch$ 941
Ch$ 243
Intangibles from PPA: Ch$ 304
Ch$ 151
Ch$ 152
Deferred taxes asociated with
intangibles from PPA: Ch$ 91
Ch$ 40
Ch$ 51
Asociated w/ PPA Intangibles: Ch$ 35
GW and PPA Intangibles: Ch$ 1,358
Ch$ 1,047
Ch$ 311

| 53 |
Itaú CorpBanca | Transaction in Colombia
Itaú CorpBanca Colombia acquired assets and liabilities of Itaú BBA Colombia
Current Structure in Colombia
Itaú
CorpBanca
Itaú CorpBanca
Colombia
On June 16, 2017 Itaú CorpBanca Colombia acquired Itaú
BBA Colombia assets and liabilities1
Postponement of the date for Itaú CorpBanca to purchase
the 12.36% stake of CorpGroup in Itaú CorpBanca
Colombia:
‐ The postponement date to purchase is until January 28, 2022
‐ The purchase price has not changed (US$ 3.5367 per share2)
‐ Itaú CorpBanca will carry out commercially reasonable efforts to
register an listing Itaú CorpBanca Colombia in the Colombian Stock
Exchange (CSE)
‐ The rational is to create a liquidity mechanism for minorities to sell the
stake in the company
CorpGroupHelm
Corporation
Other
Minorities
Itaú BBA Colombia
(asset and liabilities)
66.28% 12.36% 20.82% 0.54%
Acquisition
1 Itaú Corpbanca Colombia S.A. paid Ch$33,205 million to Itaú BBA Colombia S.A Corporación Financiera.2 This amount accrues interest from (and including) August 4, 2015 until (but excluding) the payment date at an annual interest rate equal to Libor plus 2.7%.

| 54 |
• Working on implementing businesses
strategies for wholesale and retail
• As well as advancing with our
corporate culture agenda
22 May’17Feb – Apr’17
Internal Campaign
Brand Introduction
Launch campaign
• “Queremos Conocer”
May – Dec’17 Dec’17
Year end
• “Gracias por recibirnos”
Itaú CorpBanca Colombia | “Itaú” brand successfully introduced in the retail market in 2017
1Q’18 2018
Transition100% of clients and
branches under the
Itaú brand and core
system

| 55 |
Our Bank | Itaú CorpBanca History

| 56 |
Global Macroeconomic Outlook
2011 2012 2013 2014 2015 2016 2017 2018F 2019F
GDP Growth (%) - World Economy
World 4.2 3.5 3.5 3.6 3.4 3.2 3.8 3.9 3.7
USA 1.6 2.2 1.7 2.6 2.9 1.5 2.3 2.7 2.3
Euro Zone 1.7 -0.8 -0.2 1.4 2.0 1.8 2.5 2.3 2.0
China 9.5 7.9 7.9 7.2 6.8 6.7 6.9 6.5 6.1
Japan -0.1 1.5 2.0 0.0 1.4 0.9 1.7 1.2 1.3
GDP Growth (%) - Latam
Brazil 4.0 1.9 3.0 0.5 -3.5 -3.5 1.0 1.3 2.0
Chile 6.1 5.3 4.0 1.8 2.3 1.3 1.5 3.8 3.5
Colombia 6.6 3.9 4.6 4.7 3.0 2.0 1.8 2.5 3.2
Mexico 4.0 3.6 1.4 2.8 3.3 2.9 2.0 2.3 2.0
Peru 6.5 6.0 5.8 2.4 3.3 4.0 2.5 4.0 4.0
Inflation (eop, %)
Brazil (IPCA) 6.5 5.8 5.9 6.4 10.7 6.3 2.9 4.1 4.2
Chile 4.4 1.5 3.0 4.6 4.4 2.7 2.3 2.8 3.0
Colombia 3.7 2.4 1.9 3.7 6.8 5.8 4.1 3.2 3.0
Mexico 3.8 3.6 4.0 4.1 2.1 3.4 6.8 4.0 3.5
Peru 4.7 2.6 2.9 3.2 4.4 3.2 1.4 2.2 2.6
Monetary Policy Rate (eop, %)
Brazil 11.00 7.25 10.00 11.75 14.25 13.75 7.00 6.50 8.00
Chile 5.25 5.00 4.50 3.00 3.50 3.50 2.50 2.75 3.75
Colombia 4.75 4.25 3.25 4.50 5.75 7.50 4.75 4.25 4.50
Mexico 4.50 4.50 3.50 3.00 3.25 5.75 7.25 8.00 6.75
Peru 4.25 4.25 4.00 3.50 3.75 4.25 3.25 2.75 3.25
Unemployment Rate (avg, %)
Brazil - 7.4 7.1 6.8 8.5 11.5 12.7 12.4 12.2
Chile 7.1 6.4 5.9 6.4 6.2 6.5 6.7 6.6 6.5
Colombia 10.8 10.4 9.6 9.1 8.9 9.2 9.4 9.4 9.2
Mexico 5.2 4.9 4.9 4.8 4.4 3.9 3.4 3.4 3.5
Peru 7.7 7.0 5.9 6.0 6.4 6.7 6.9 6.8 6.4

| 57 |
4,5
2,6 2,8
1,1
2,4
3,7
2,6
7,8 7,1
-1,4
3,0
4,4
1,5
3,0
4,6 4,4
2,72,3
2,8 3,0
-2
0
2
4
6
8
10
00 05 10 15
Inflation Policy Rate
Chile | Macroeconomic Outlook
GDP Growth | % (YoY) Per Capita GDP | US$ Thousand
Unemployment rate | % Inflation and Policy Rate | %
5,1
3,32,7
3,8
7,0
6,25,7
5,2
3,5
-1,6
5,86,1
5,3
4,0
1,82,3
1,3 1,5
3,83,5
-2
-1
0
1
2
3
4
5
6
7
8
00 05 10 15
9,7 9,9 9,89,5
10,0
9,3
8,0
7,0
7,8
10,8
8,3
7,2
6,56,0
6,3 6,36,5 6,7 6,6 6,5
4
5
6
7
8
9
10
11
12
00 05 10 15
5,14,6 4,5 4,8
6,2
7,6
9,510,5 10,7 10,6
12,9
14,215,3 15,6
14,413,3
14,015,2
16,417,2
0
2
4
6
8
10
12
14
16
18
00 05 10 15

| 58 |
Chile | Macroeconomic Outlook
International Reserves | % of GDP
Central Government Fiscal Balance | % of GDP
-1,2 -1,5-0,8 -1,1
2,6
1,5
4,64,1
-3,2
1,71,3
-1,7
-4,0 -4,2
-1,7 -2,0 -1,4 -1,5-1.3
-2.0
-5
-4
-3
-2
-1
0
1
2
3
4
5
00 05 10 15
Current Account Balance | % of GDP
19,420,2
21,920,8
16,1
13,812,6
9,8
13,214,2
12,6
17,115,6 14,9
15,7 16,2 15,9
14,113,2 13,0
0
5
10
15
20
25
00 05 10 15
-0,6 -0,5-1,2
-0,4
2,1
4,4
7,37,8
3,9
-4,4
-0,5
1,30,6
-0,6-1,6
-2,1-2,7 -2,8
-1,6 -1,5
-6
-4
-2
0
2
4
6
8
00 05 10 15
6,8 5,3 3,7 3,0 2,3 1,9 2,3 2,5 3,0 3,0 3,4 3,9 4,3 5,2 7,8
49,8
39,0
33,229,5 29,7
34,538,8 36,4
38,242,9
46,1
55,2
62,9 60,4 57,2
0
10
20
30
40
50
60
70
03 09 15
Privado Publico
External Debt | % of GDP

| 59 |
Colombia | Macroeconomic Outlook
GDP Growth | % (YoY) Per Capita GDP | US$ Thousand
Unemployment rate | % Inflation and Policy Rate | %
2,9
1,7
2,5
3,9
5,3
4,7
6,8 6,8
3,5
1,7
4,0
6,6
3,9
4,6 4,7
3,0
2,0 1,8
2,5
3,2
0
1
2
3
4
5
6
7
8
00 05 10 15
13,3
15,015,6
14,113,7
11,8 12,0
11,2 11,312,0 11,8
10,810,4
9,69,1 8,9 9,2 9,4 9,4 9,2
5
7
9
11
13
15
17
00 05 10 15
2,5 2,4 2,4 2,32,8
3,43,7
4,75,3 5,2
6,3
7,3
8,0 8,1 8,0
6,15,8
6,46,8 6,9
0
1
2
3
4
5
6
7
8
9
00 05 10 15
8,7
7,67,0
6,55,5
4,9 4,5
5,7
7,7
2,0
3,2 3,72,4
1,9
3,7
6,8
5,8
4,1
3,2 3,0
0
5
10
15
00 05 10 15Inflation Policy Rate
| 60 |
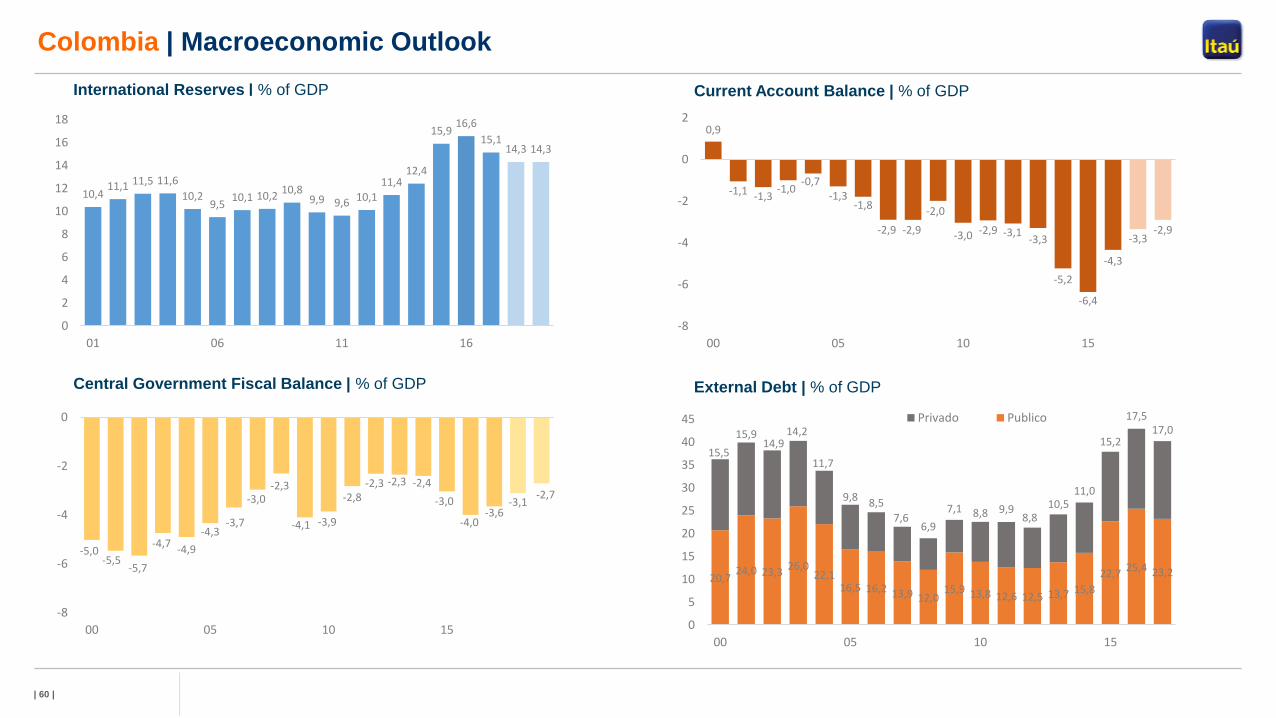
Colombia | Macroeconomic Outlook
International Reserves | % of GDP
10,411,1 11,5 11,6
10,29,5
10,1 10,210,8
9,9 9,6 10,111,4
12,4
15,916,6
15,114,3 14,3
0
2
4
6
8
10
12
14
16
18
01 06 11 16
-5,0-5,5
-5,7
-4,7-4,9
-4,3-3,7
-3,0-2,3
-4,1 -3,9
-2,8-2,3 -2,3 -2,4
-3,0
-4,0-3,6
-3,1-2,7
-8
-6
-4
-2
0
00 05 10 15
0,9
-1,1 -1,3-1,0
-0,7-1,3
-1,8
-2,9 -2,9
-2,0
-3,0 -2,9 -3,1-3,3
-5,2
-6,4
-4,3
-3,3-2,9
-8
-6
-4
-2
0
2
00 05 10 15
20,724,0 23,3
26,022,1
16,5 16,2 13,9 12,015,9 13,8 12,6 12,5 13,7 15,8
22,725,4 23,2
15,5
15,914,9
14,2
11,7
9,8 8,5
7,66,9
7,1 8,8 9,98,8
10,511,0
15,2
17,517,0
0
5
10
15
20
25
30
35
40
45
00 05 10 15
Privado Publico
External Debt | % of GDP
Current Account Balance | % of GDP
Central Government Fiscal Balance | % of GDP