
BT Monthly Markets Chart Pack – October 2008 An overview of movements in global financial markets.
18
BT Monthly Markets Chart Pack – October 2008 An overview of movements in global financial markets
-
Upload
celeste-hudnall -
Category
Documents
-
view
221 -
download
4
Transcript of BT Monthly Markets Chart Pack – October 2008 An overview of movements in global financial markets.

BT Monthly Markets Chart Pack – October 2008
An overview of movements in global financial markets

2
Global share markets hammered in October...
Moves by US and other governments to prevent a collapse of their respective financial systems weren’t enough to appease investors already hurt by big losses in September.
In the US, stocks closed the month 16.9% lower, while bourses in the UK (-10.7%), Europe (-14.7%) and Japan (-23.8%) also finished well in the red.

3
Global shares measured by the MSCI World ex-Australia (net dividends) Index in A$.Source: BT Financial Group, MSCI
Impact of major market events on global shares since 1986
…but continue to perform well over the long-term, despite some major market events
700
1,200
1,700
2,200
2,700
3,200
3,700
4,200
4,700
5,200
5,700
6,200
Oct-86 Oct-88 Oct-90 Oct-92 Oct-94 Oct-96 Oct-98 Oct-00 Oct-02 Oct-04 Oct-06 Oct-08
Jan 91Gulf War
Feb 94Bond Market Crash
Aug 97Asian Currency Crisis
Jul 98Russian Bond Crisis
Jul 01Tech Wreck
Sep 01Attack on Twin Towers
Jun 07US Sub-prime Crisis
Oct 87Wall Streetcrash
Nov 89Fall of the Berlin Wall Mar 03
Troops enter Iraq

4
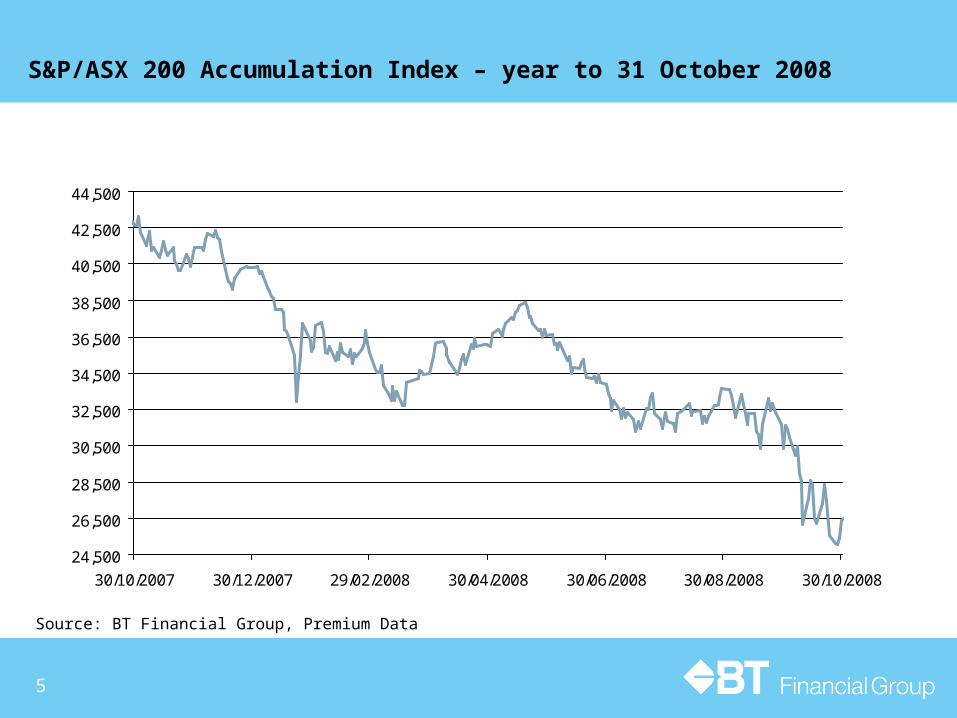
The Australian share market fared a little better …
The S&P/ASX 200 Accumulation Index closed the month 12.6% lower.
The fall came largely on the back of a poor lead from the US and weaker commodity prices, which really hurt our big mining stocks.
5
Source: BT Financial Group, Premium Data
S&P/ASX 200 Accumulation Index – year to 31 October 2008
24,500
26,500
28,500
30,500
32,500
34,500
36,500
38,500
40,500
42,500
44,500
30/10/2007 30/12/2007 29/02/2008 30/04/2008 30/06/2008 30/08/2008 30/10/2008

6
Key Australian economic news – October
The Reserve Bank cut interest rates by 1.00% in October and again by 0.75% at its early November meeting in a bid to improve the flow of credit to consumers and businesses.
Australia’s international trade balance was in surplus by $1.364 billion in August. It followed a deficit of $697 million in July and came on the back of strong growth in exports and falling imports.
The Westpac/Melbourne Institute consumer sentiment index fell 10.2pts to 82.0 in October, with all five component indices falling in the month. Of these, ‘economic conditions in the next 12 months’ registered the worse decline while ‘employment expectations’ also slipped sharply.
Newspaper job ads gained 0.7% in the month of September, while Internet-based job ads registered a second consecutive monthly decline, down 1.5%.
Source: BT Financial Group

7
The Australian dollar hit hard in October
The Australian dollar (A$) fell 15.8% against the US dollar (US$) in October thanks to weaker commodity prices and a resurgent US$. With commodity prices likely to remain under pressure in the near-term and the RBA expected to cut interest rates again this year, it’s likely that the A$ will fluctuate around current levels as we move into 2009.
At the end of October:
A$1 bought US$0.6676 -15.8%
€0.5248 -6.7%
¥65.72 -21.9%
Source: BT Financial Group

8
Currency markets – A$ per US dollar
Source: BT Financial Group. Figures at 31 October 2008.
0.6500
0.6800
0.7100
0.7400
0.7700
0.8000
0.8300
0.8600
0.8900
0.9200
0.9500
0.9800
Oct-03 Apr-04 Oct-04 Apr-05 Oct-05 Apr-06 Oct-06 Apr-07 Oct-07 Apr-08 Oct-08
The Australian dollar versus the US dollar…

9
Currency markets – A$ per Euro
the Euro…
0.5200
0.5350
0.5500
0.5650
0.5800
0.5950
0.6100
0.6250
0.6400
0.6550
Oct-03 Apr-04 Oct-04 Apr-05 Oct-05 Apr-06 Oct-06 Apr-07 Oct-07 Apr-08 Oct-08
Source: BT Financial Group. Figures at 31 October 2008.

10
and the Yen
65
70
75
80
85
90
95
100
105
110
Oct-03 Apr-04 Oct-04 Apr-05 Oct-05 Apr-06 Oct-06 Apr-07 Oct-07 Apr-08 Oct-08
Currency markets – A$ per Yen
Source: BT Financial Group. Figures at 31 October 2008.

11
Official world interest rate movements – October
In Australia, the Reserve Bank cut the official cash rate a further 0.75% (to 5.25%) at its early November meeting. Elsewhere (in October), the European Central Bank, the Bank of England and the US Federal Reserve all cut their benchmark interest rates, while the Bank of Japan left theirs’ on hold.
Current rate Last movedDirection of last move
Australia 5.25% Nov 2008
US 1.00% Oct 2008
Europe (ECB) 3.75% Oct 2008
Japan 0.50% Feb 2007
United Kingdom 4.50% Oct 2008
Source: BT Financial Group

12
Source: BT Financial Group
31 October 2008
Global share market returns
1 year 3 years (pa) 5 years (pa)
Global
S&P 500 Index (US) -37.47% -7.07% -1.61%
Nasdaq (US Tech.) -39.81% -6.72% -2.29%
Nikkei 225 (Japan) -48.76% -14.26% -4.07%
Hang Seng (Hong Kong) -55.45% -0.98% 2.76%
DAX (Germany) -37.80% 0.40% 6.44%
CAC (France) -40.37% -7.71% 0.67%
FTSE 100 (UK) -34.88% -6.28% 0.42%
Australia
S&P/ASX 200 Accum. Ind. -37.79% 0.73% 8.69%
S&P/ASX Small Ordinaries -53.27% -6.54% 3.60%
S&P/ASX 300 Listed Prop. -56.36% -12.60% -0.68%

13
Short-term asset class performance
Source: S&P/ASX 300 Accumulation Index, MSCI World ex-Australia (net dividends) Index in A$, S&P/ASX 300 Property Index, UBS Composite 0+ years index, Citigroup World Government Bond, Unhedged in A$
1-year rolling returns to 31 October 2008 (%) Best performing asset class for the year
2008 2007 2006 2005 2004 2003 2002 2001 2000 1999 1998 1997 1996 1995 1994 1993
Australian cash
7.80 6.61 5.90 5.71 5.54 4.88 4.67 5.61 6.07 4.94 5.14 5.98 7.68 7.87 5.05 5.61
Australian bonds
10.59 3.62 4.40 5.18 7.17 4.15 4.24 11.67 7.60 -0.61 9.65 13.23 14.56 16.60 -6.11 17.58
Australian property
-56.36 18.48 29.13 12.25 28.99 6.35 10.23 21.22 12.55 -0.27 19.19 17.16 14.33 8.87 0.24 25.42
Australian shares
-38.29 30.46 26.33 22.67 20.56 12.52 -2.64 3.38 19.07 14.79 10.02 9.27 17.55 6.68 -0.93 50.84
International bonds
43.39 -8.63 1.49 -1.78 5.17 -10.60 -0.76 11.82 16.74 -4.75 27.49 15.45 1.06 12.37 -6.99 16.93
International shares
-17.66
-0.24 16.95 13.00 7.35 -3.48 -22.89 -23.79 24.42 22.15 30.76 31.83 11.54 6.87 -3.43 32.36

14
Source: S&P/ASX 300 Accumulation Index, MSCI World ex-Australia (net dividends) Index in A$, S&P/ASX 300 Property Index, UBS Composite 0+ years index, Citigroup World Government Bond, Unhedged in A$
1-year returns to 31 October 2008 (%)
Short-term asset class performance (cont’d)
-17.7
43.4
-38.3
-56.4
10.6
-0.2
-8.6
30.5
18.5
3.6
31 October 2007
31 October 2008
Australian bonds
Listed property
Australian shares
Global bonds
Global shares

15
Long-term asset class performance
Note: Accumulated returns based on $1,000 invested in December 1984Source: S&P/ASX 300 Accumulation Index, MSCI World ex-Australia (net dividends) Index in A$, S&P/ASX 300 Property Index, UBS Composite 0+ years index, Citigroup World Government Bond, Unhedged in A$
31 October 2008
Australian bonds
Listed property
Australian shares
Cash
Global shares

16
Source: BT Financial Group. West Texas Intermediate oil price at 31 October 2008.
Oil prices – US$ per barrel
Oil prices fell again in October as demand evaporated in line with the slowing global economy
$0
$15
$30
$45
$60
$75
$90
$105
$120
$135
$150
88 89 90 91 92 93 94 95 96 97 98 99 00 01 02 03 04 05 06 07 08

17
Summary
The underlying strength of the Australian economy, relative to its global counterparts, looks set to continue in the near-term. Admittedly, we are beginning to feel the knock-on effects of a slowdown that’s impacted countries like the US and the UK.
The RBA’s decision to lower the official cash rate in October and again in November highlights the Bank’s concern that the economy is heading into recession.
In line with this view, there’s a chance the RBA will cut rates again in December.
The Australian dollar has fallen 23.8% so far this year. With commodity prices likely to remain under pressure in the near-term and a possible rate cut in December, we think it will continue to trade around current levels as we move into 2009.
Gains in share markets are likely to remain under pressure in the near-term.
18
This presentation has been prepared by BT Financial Group Limited (ABN 63 002 916 458) ‘BT’ and is for general information only. Every effort has been made to ensure that it is accurate, however it is not intended to be a complete description of the matters described. The presentation has been prepared without taking into account any personal objectives, financial situation or needs. It does not contain and is not to be taken as containing any securities advice or securities recommendation. Furthermore, it is not intended that it be relied on by recipients for the purpose of making investment decisions and is not a replacement of the requirement for individual research or professional tax advice. BT does not give any warranty as to the accuracy, reliability or completeness of information which is contained in this presentation. Except insofar as liability under any statute cannot be excluded, BT and its directors, employees and consultants do not accept any liability for any error or omission in this presentation or for any resulting loss or damage suffered by the recipient or any other person. Unless otherwise noted, BT is the source of all charts; and all performance figures are calculated using exit to exit prices and assume reinvestment of income, take into account all fees and charges but exclude the entry fee. It is important to note that past performance is not a reliable indicator of future performance.
This document was accompanied by an oral presentation, and is not a complete record of the discussion held.
No part of this presentation should be used elsewhere without prior consent from the author.
For more information, please call BT Customer Relations on 132 135 8:00am to 6:30pm (Sydney time)


![BT Reflex family bro [111013] · for both horizontal travel and vertical fork movements. The advanced 360° steering system on all BT Reflex trucks allows exceptional manoeuvrability.](https://static.fdocuments.net/doc/165x107/5fc6819518a7484f536b8969/bt-reflex-family-bro-111013-for-both-horizontal-travel-and-vertical-fork-movements.jpg)
