BSc Research thesis_2010
49
1 | Page ANALYSIS OF THE IMPACT OF FARM MECHANISATION ON PRODUCTIVITY. A CASE OF CHIPINGE RESETTLED FARMERS. BY MAKATE CLIFTON R076606B A RESEARCH PROJECT SUBMITTED IN PARTIAL FULFILMENT OF THE REQUIREMENTS OF A BSC HONOURS DEGREE IN AGRICULTURE SURPERVISOR: DR. SIZIBA AUGUST, 2010 Department of Agricultural economics and extension Faculty of Agriculture University of Zimbabwe P.O.BOX MP167 Mount Pleasant Harare ZIMBABWE
-
Upload
clifton-makate -
Category
Documents
-
view
131 -
download
1
Transcript of BSc Research thesis_2010

1 | P a g e
ANALYSIS OF THE IMPACT OF FARM MECHANISATION ON
PRODUCTIVITY. A CASE OF CHIPINGE RESETTLED FARMERS.
BY MAKATE CLIFTON R076606B
A RESEARCH PROJECT SUBMITTED IN PARTIAL FULFILMENT OF THE
REQUIREMENTS OF A BSC HONOURS DEGREE IN AGRICULTURE
SURPERVISOR: DR. SIZIBA
AUGUST, 2010
Department of Agricultural economics and extension
Faculty of Agriculture
University of Zimbabwe
P.O.BOX MP167
Mount Pleasant
Harare
ZIMBABWE
2 | P a g e
Contents Chapter 1: Overview of the study .......................................................................................... 5
1.1 Introduction ......................................................................................................................... 5 1.2 Background to the problem .............................................................................................. 6
1.3 Problem statement ............................................................................................................ 7 1.4 Research Objectives ......................................................................................................... 8
1.5 Research Questions.......................................................................................................... 8 1.6 Research Hypothesis ........................................................................................................ 8 1.7 Justification of study .......................................................................................................... 9
Chapter 2: Literature Review ................................................................................................ 10
2.1 Introduction ....................................................................................................................... 10
2.2 Background and insights to agricultural mechanisation ............................................ 10 2.3 Overview of farm mechanization in Zimbabwe ........................................................... 11 2.4 Farm mechanization meaning and scope.................................................................... 12
2.5 Why mechanize agriculture in Zimbabwe or the whole of Africa? .......................... 13 2.6 Meaning and measures of agricultural productivity................................................... 14
2.6.1 Labour productivity- ................................................................................................. 14 2.6.2 Multi-factor productivity ........................................................................................... 15
2.7 Farm mechanization and productivity, production, labour and income. (Empirical
evidence) ................................................................................................................................. 15 2.8 Increasing agricultural productivity is central to reducing poverty -Technology’s
Role .......................................................................................................................................... 18 2.9 Other benefits attached to farm mechanization .......................................................... 19 2.10 What influences the adoption of new technology by farmers? .............................. 19
2.10.1 Secure output markets .......................................................................................... 20 2.10.2 Effective input supply systems, including credit ................................................ 20
2.10.3 Supporting infrastructure – particularly irrigation .............................................. 21 2.11 How does new agricultural technology benefit the poor? ....................................... 22
2.11.1 The impact on employment .................................................................................. 22
2.11.2 Food prices ............................................................................................................. 23 2.11.3 Nutrition and food utilization ................................................................................. 24
2.11.4 Access to land and other resources.................................................................... 25 2.11.5 Gender issues......................................................................................................... 25 2.11.6 Sustainability issues .............................................................................................. 25
2.11.7 Biodiversity .............................................................................................................. 26 2.12 But have the poor benefited from new agricultural technology? ............................ 26
Chapter 3: Research Methods .............................................................................................. 28
3.1 Introduction ....................................................................................................................... 28 3.2 Data collection (Secondary data source) ..................................................................... 28
3.3 Study area selection and description ........................................................................... 28 3.4 Conceptual framework .................................................................................................... 29
3.4.1 Introduction................................................................................................................ 29 3.4.2 Illustration of the conceptual framework ............................................................... 29
3.5 Theoretical framework .................................................................................................... 30
3.6 Analytical framework ....................................................................................................... 31 3.7 Regression analysis ........................................................................................................ 31

3 | P a g e
3.8 Correlation analysis ......................................................................................................... 33 3.9 Analytical techniques ...................................................................................................... 33
CHAPTER 4: DATA ANALYSIS AND RESULTS ............................................................... 34
4.1 Introduction ....................................................................................................................... 34
4.1.1 Household characteristics ....................................................................................... 34 4.1.2 Gender and marital status of farmers ................................................................... 35 4.1.3 Levels of education and household head occupation ........................................ 35
4.1.4 household sizes ........................................................................................................ 36 4.2 Farm characteristics ........................................................................................................ 37
4.2.1 Farm size ................................................................................................................... 37 4.2.2 livestock ownership .................................................................................................. 37 4.2.3 Agricultural implements ........................................................................................... 38
4.2.4 Sources of income for the households ................................................................. 39 4.2.5 labour sources of households ................................................................................ 39
4.3 Regression and correlation analysis............................................................................. 40 4.3.1 Capital equipment intensity and productivity ....................................................... 40 4.3.2 Insights from the analysis ....................................................................................... 41
4.3.3 Mechanization and labour use on the farm. ......................................................... 41 4.4 Factors hindering effective use of farming implements amongst the resettled
farmers in chipinge district. ................................................................................................... 42 4.4.1 Lack of manpower .................................................................................................... 42 4.4.2 Weaknesses in draught animals ............................................................................ 43
4.4.3 Lack of access to credit facilities ........................................................................... 43 4.4.4 Relief and nature of surface ................................................................................... 43
4.4.5 Lack of effective extension services...................................................................... 43 CHAPTER 5: CONCLUSIONS AND POLICY RECOMMENDATIONS ........................... 44
5.1 Introduction ....................................................................................................................... 44
5.2 Impact of farm mechanization on productivity............................................................. 44 5.3 Impact of farm mechanization on employment of labour .......................................... 44
5.4 Policy recommendations ................................................................................................ 45 Bibliography .............................................................................................................................. 47
List of Figures Figure 4.1 Marital status of households...................................................................................................................................35 Figure 4.2 Correlation between labor use and capital ..........................................................................................................42
List of Tables Table 2.1 Provincial allocations of farming equipment procured by RBZ, 10 January 2007.........................................12 Table 2.2 Comparison of basic measures of partial productivity. ......................................................................................15 Table 2.3: Irrigation in Africa and Asia, 1961/1963 – 1997/1999 .......................................................................................21

4 | P a g e
Source FAO 2003 ......................................................................................................................................................................22 Table 3.1Types and sources of change in agricultural output .............................................................................................29 Table 3.2.Research Analytical Framework...............................................................................................................................31 Table 3.3 Independent Variables ...............................................................................................................................................32 Table 4.1 Age distribution of households ................................................................................................................................34 Table 4.2 Educational status of households ............................................................................................................................36 Table 4.3 Land ownership by the farmers ...............................................................................................................................37 Table 4.4 Livestock ownership (means) ...................................................................................................................................37 Table 4.5 Agricultural implements owned..............................................................................................................................38 Table 4.6 Farmers’ sources of labour .......................................................................................................................................39 Table 4.7 Results of the linear regression model ...................................................................................................................40 Table 4.8 Farm mechanization level and yield means ..........................................................................................................41

5 | P a g e
Chapter 1: Overview of the study
1.1 Introduction
The Zimbabwean economy, like most other African countries, is primarily agricultural.
Agriculture provides employment to a large portion of the Zimbabwean population, with
most of its people earning their livelihoods from it. The sector has expanded immensely
since Zimbabwe’s attainment of independence in 1980. It has contributed approximately
15 to20 % of the Gross Domestic Product (GDP) and about 40% of the total foreign
currency earnings in Zimbabwe (Rukuni and Muir 1994).
With the growth and commercialisation of the agricultural community in the world,
various agricultural communities have been adopting modern agricultural equipment in
order to maintain competitive advantage in the industry. The main objective for such
capital equipment adoption has been linked to the need for productivity enhancement
through efficiency and timeliness of operations and by reducing the drudgery of the
human beings and draught animals in these communities. This increase in productivity
is believed to translate into increased farm profits for the farmers and overall profitability
of the farming business.
Agricultural mechanisation has therefore grown to be a strategy adopted by almost all
farming communities in the world including Zimbabwe as well. It is believed to increase
land and labour productivity. Machinery however works as complementary input
required for achieving higher land productivity for example, through the introduction of
pump sets, or faster turning around times to achieve higher cropping intensities. The
underlying assumption being that mechanisation alone cannot increase productivity.
Mechanization is also believed to be a necessary component in farming systems
adaptation, cropping practises adaptation as well as influencing the total area of land
farmers can put under crops.. It therefore plays a vital role as a necessary component
for supplying the needed impetus and input towards agricultural development and

6 | P a g e
modernization.
According to Adrians (1989) agricultural mechanization embraces the use of tools,
implements, and machines for agricultural land developments, crop production,
harvesting, and preparation for storage and on farm processing. It includes three main
sources; human, animal and mechanical. The manufacture, distribution, repair,
maintenance, management, and utilization of agricultural implements are covered under
this discipline as well. Kline (1969) defines agricultural mechanization as any
mechanical means that can be used in the process of agricultural production.
1.2 Background to the problem
Following the land reform program of the year 2000 there has been a decline in output
of major crops such as maize, wheat and soya beans, just to name a few. Newly
resettled farmers were facing challenges in increasing their land under crop cultivation,
farm productivity and hence their total farm output. This was mainly due to the fact that
the newly resettled farmers could not have the adequate financial resources to acquire
the needed implements and other capital resources to improve their farming operations.
In addition, the balance of payment pressures sustained by the government of
Zimbabwe since early 2000 and the isolation of the country by some players in the
international community lead to unavailability of critical strategic inputs and some
commodities which contributed to low agricultural output and hence moving towards
food insecurity of the nation, This was worsened by the fact that most lines of credit
from financial institutions had dried up and the government had to rely on non-
traditional sources of financing through the Reserve Bank of Zimbabwe (RBZ) to
procure strategic imports (Gono, 2007).The government through Reserve Bank then
acquired a variety of specialized agricultural equipment through the mechanisation
program in a bid to intensify efforts towards promoting the newly resettled farmers and
to complement the land reform’s objectives. The main objective of such an initiative was
to equip the poor resource farmers so that they can raise productivity of their farmland
for the benefit of the nation. The equipment included combine harvesters, tractors, and

7 | P a g e
various other farm implements which were delivered to farmers across the country to be
used in production. In a bid to equip indigenous farmers the government launched the
program with a target to built a fleet of at least 50 000 tractors and other equipment in a
program which was expected to run until 2010.The RBZ also embarked on a drive to
create jobs through a massive project to set up institutions throughout the country that
manufacture animal drawn implements.
1.3 Problem statement
Lack of modern farm implements among resettled farmers in communal areas of
Zimbabwe has been a major threat towards optimal crop production, increased
agricultural productivity, intensifying crop production, increased farmer incentives and
adoption of better farming methods. Inadequate tillage implements, boom sprayers,
planters, harvesters, fertilizer spreaders among other farm implements have to some
extent contributed to low agricultural productivity and thus food insecurity in Zimbabwe.
Finance, a critical component in procuring the much needed farming implements has
also been a major challenge to the newly resettled farmers hampering their efforts to
raise productivity levels as well as profitability.
Over the past few years there has been growth in outmigration of the economically
active population in search of greener pastures in neighbouring countries and abroad.
This has caused shortages in labour in the country’s primary secondary and tertiary
industries with agriculture being one of the greatly affected industries. Moreover, the
growth of the demand in agricultural commodities for food and feed has caused
increased pressure on the land as a resource in competing for space for the different
types of crops to grow. This has emerged as a big problem in Zimbabwe since some
crops are being preferred to be grown at the expense of others regardless of their need
to the society. Low productivity amongst the farmers, shortages in labour poor farming
methods and low cropping intensities have however been identified as the major
problems with the agricultural community in Zimbabwe. It is not clear whether dwindling

8 | P a g e
levels in agricultural productivity have been due to lack of mechanization or some other
factors as highlighted above. It therefore remains to be examined to ascertain whether
farm mechanization has any impact on farm productivity. Precisely stated, this study
seeks to analyze the impact of farm mechanization focusing on Chipinge resettled
farmers.
1.4 Research Objectives
To determine whether the use of farm equipment by the resettled farmers had an
impact on farm productivity.
To determine the correlations between labour use on a farm and capital
equipment use.
To identify the factors limiting effective use of farm machinery amongst the
resettled farmers in Chipinge district.
1.5 Research Questions
Does the use of farm equipment have a significant contribution towards
increasing farm productivity amongst the resettled farmers in Chipinge district?
Do capital/ mechanization move together with quantities of labour used on a
farm?
What are the factors hindering effective use of farm machinery amongst the
resettled farmers in Chipinge district.
1.6 Research Hypothesis
Productivity is positively related to the use of capital equipment among the
resettled farmers in Chipinge district.
Labour use on a farm is negatively related to the level of mechanization i.e. as
the use of farm machinery increases labour use decreases.

9 | P a g e
1.7 Justification of study
The analysis of the impact of farm mechanization on productivity still remains an object
of empirical research. Research has concentrated much on developed countries with
very little of that research trickling down to developing countries. In the Zimbabwean
context, this study will be highly useful as it will yield possible policy recommendations
that can be used by development planners, policy makers, implementers and
beneficiaries participating in development projects. In addition, this study will also
review the actual impacts and contributions of farm mechanization to the livelihoods of
communal rural farmers in Chipinge district and also help similar projects elsewhere in
the country. And more importantly the study will reveal the possible support services in
terms of skills and education required by the different farming communities in order to
maximise benefit from the use of farm machinery for example setting of tractor servicing
and Driver training centres in communal areas.

10 | P a g e
Chapter 2: Literature Review
2.1 Introduction
This chapter is a summary of all literature that was reviewed from studies done on the
impacts of farm mechanization on production, productivity, incomes, cropping intensity
labour employment and many other related variables in Zimbabwe and around the
world. Literature reviewed includes the meaning and scope of farm mechanization,
related researches and findings on farm mechanization, the reasons for mechanizing
agriculture in Zimbabwe and or Africa, the need for mechanization and its role in
agricultural development and some of the factors that affect adoption of improved farm
machinery into present farming systems by most communal farmers and other benefits
attached to farm mechanization. This section will also include the meaning and
measures of agricultural productivity, the role of technology in enhancing productivity
and the benefits of technology to the poor, factors influencing adoption of technology by
farmers.
2.2 Background and insights to agricultural mechanisation
In the past agricultural mechanization in developing countries has been much criticized
because it often failed to be effective, and was blamed for exacerbating rural
unemployment and causing other adverse social effects. This was largely the result
from experiences during the 1960s until the early 1980s when large quantities of
tractors were supplied to developing countries either as a gift from donors, or on very
advantageous loan terms. In particular projects which were designed to provide tractor
services through government agencies had a miserable record. These projects proved
not sustainable because of the intrinsic inefficiencies of government-run businesses. An
overvalued foreign exchange rate and low real interest rates made agricultural
machinery artificially cheap as compared with labor and draft animals.
These experiences often combined with a very narrow perception and lack of
knowledge about mechanization, namely the one sided promotion of tractors and other
capital-intensive mechanical power technology, has caused the aid community to

11 | P a g e
largely turn its back on mechanization. At the same time there are many examples were
mechanization has been very successful, contributing to increased food production,
productivity and advancement of rural economies. For example, privately owned
shallow tube wells for irrigation in South Asia, axial flow threshers in Southeast Asia,
single-axle tractors in Thailand, and various forms of farm mechanization in many parts
of China.
The introduction of agricultural technology, including mechanization, is a complex
process. The formulation of an Agricultural Mechanization Strategy (AMS) requires
comprehensive knowledge of many aspects of agriculture in its broadest sense. An
AMS will very much depend on country specific characteristics of the economy, its level
of development, and the agriculture sector. This means that the formulation process for
an AMS cannot be prescribed in a simple set of guidelines. Preferably mechanization
technology should be considered in the context of an overall (agriculture) technology
strategy.
2.3 Overview of farm mechanization in Zimbabwe
In Zimbabwe the government through the Reserve bank of Zimbabwe (RBZ) has since
embarked on mechanizing the farming community by importing various farming
implements from China and Japan with the aim of restoring productivity levels and
guarding the nation against adverse effects associated with food insecurity. The
initiative has seen a variety of farming implements being distributed across the country
including tractors, disc harrows, combine harvesters, ploughs, boom sprayers, fertilizer
spreaders, planters, scortchcarts and other electric equipment such as generators.
Deliveries of the equipment has since started and was on provincial basis and
commensurate with the farming activities in particular provinces. Selection criteria of
beneficiaries was based on productivity which was evidenced by transcripts of deliveries
to the Grain Marketing Board (GMB), Cotton marketing companies, tobacco marketing
companies and horticultural farmers. Once farmers were identified the RBZ through the
ministry of Agriculture facilitated the release of the equipment to farmers. To ensure

12 | P a g e
optimal use of the rather scarce resource at the moment the production contracts
stipulated that after farmer has completed farming on his or her piece of land, the
equipment was to be availed for hire by neighboring farmers. Deliveries were made as
follows (referring to phase one of the mechanization programme January 2007):
Table 2.1 Provincial allocations of farming equipment procured by RBZ, 10 January 2007
Province Tractors Disc
harrows
Combine
harvesters
Ploughs Boom
sprayers
Fertilizer
spreaders
Planters
Mash east 75 75 4 75 23 19 9
Masvingo 35 35 2 35 23 19 9
Mash west 75 75 5 75 23 19 13
Mat north 35 35 2 35 14 10 9
Mat sout 35 35 3 35 22 19 9
Manicaland 35 35 2 35 21 18 9
Mash centr 75 75 4 75 29 28 13
Midlands 35 35 2 35 22 18 9
Maguta 100 100 10 100 _ _ 20
Total 500 500 34 500 175 150 100
Source: RBZ publications (2007)
Phases two three and four have already been implemented in the same manner as was
the phase one, the different phases are only adding to the numbers of implements in the
different provinces without changes in the types of equipment given to farmers.
2.4 Farm mechanization meaning and scope
Improved farm implements and machinery are used for different farm operations to increase productivity of land and labour through timeliness of operations, efficient use of inputs, and improvement in duality of produce, safety and comfort of farmers and reduction in loss of produce and drudgery of the farmer. It is for increasing production and productivity, comfort and safety, return and

13 | P a g e
profitability to farmer by timeliness of operations, saving in labour requirements increase in land productivity and reduction in human drudgery.
2.5 Why mechanize agriculture in Zimbabwe or the whole of Africa?
Most governments as well as individual farmers’ efforts over the past ninety years have
been directed in one way or another at mechanizing agriculture in Africa. These efforts
have in many cases been augmented by the donor community assistance. The main
thrust of these efforts has been aimed at replacing the cutlass and hoe cultivation with
draught animals, small tractors or large tractors. It would seem there are 5 major
reasons for this: first to increase the productivity of labour, second to increase the land
under cultivation, third to improve the quality of farming operations, fourth to reduce the
drudgery and hence make agriculture more attractive, and finally the need for timely
completion of certain key agricultural operations due to the limitations imposed by the
weather. One or all of the above reasons have been used to justify agricultural
mechanization projects and programs on the African continent. These reasons have
been used for both the large scale agriculture, as well as for smallholder and the
peasant subsistence farmers.
The first reason, increasing the productivity of labour is quite obvious, farming carried
out using the hand tool technology with entire reliance on human muscle power is in
most cases quite inefficient. A family using this type of technology can rarely till more
than one hectare especially in the tropics (Boshoff and Minto (1975), Mrema (1981,
1983), Nuuba and Kaul (1986)). There is a physiological limit to what a normal human
being can do in agriculture using the hand tool technology. Draught animals and internal
combustion engines do significantly increase the output of human energy expended in
agriculture. Mechanization has been a major factor in the development of agriculture in
industrialized countries, and it employs a high place value in connection with the
intensification of agricultural production in developing countries. Indeed, the number of
tractors and combines in service often serves as a measure of the modernity or
progressiveness of a country’s agriculture (Sievers (1983), Binswanger (1984), and
Farington (1984). One of the main reasons for increasing a farm’s degree of

14 | P a g e
mechanization has always been and still to raise its labour productivity, i.e. to achieve a
higher output and or better income per man hour of work. In doing so, the farmer
substitutes capital in place of scarce/expensive manual labour. Increasing the degree of
mechanization, for example, buying a tractor, substitute’s capital for labour. Numerous
pertinent studies for example Abercrombie (1973), McInerny and Donaldson (1973),
Binswanger (1978), Bergmann and Mai (1984), have documented this effect familiar in
industrialized countries.
2.6 Meaning and measures of agricultural productivity
Agricultural productivity is a measure of the ratio of agricultural outputs to agricultural
inputs. Economists usually asses’ agricultural productivity by measuring the production
of an agricultural good for example the yield of a crop and by estimating its value on the
market thus knowing the potential for profits. While individual products are usually
measured by weight, their varying densities make measuring overall agricultural output
difficult. Therefore output is usually measured as the market value of final output which
excludes intermediate products for example corn feed used in the meat industry. This
output may then be compared to many different types of inputs such as labour and land
(yield) these are partial measures of productivity. Agricultural productivity can be
measured by what is termed Total Factor Productivity (TFP). This method of calculating
agricultural productivity compares an index of outputs to index of inputs. This measure
of agricultural productivity was established to remedy the shortcomings of the partial
measures of productivity notably that it is often hard to identify the factors that cause
them to change. Changes in TFP are usually attributed to technological improvements.
2.6.1 Labour productivity-
labour productivity is typically measured as a ratio of output per labour hour.
Productivity may be conceived of as metric of the technical or engineering efficiency of
production. As such the emphasis is on quantitative metrics of inputs and sometimes
output. Productivity is distinct from metrics of allocative efficiency, which take into
account both the monetary value (price) of what is produced and the costs of inputs

15 | P a g e
used, and also distinct from metrics of profitability which addresses the difference
between the revenues obtained from output and the expenses associated with
consumption of inputs.(Courbois & Temple 1975; Gallop 1979; Kurosawa 1975; Pineda
1990; Saari 2006 ).
2.6.2 Multi-factor productivity
This is the ratio of real value of output to the combined input of labour and capital.
Sometimes this measure is referred to as total factor productivity. In principle multifactor
productivity is a better indicator of efficiency. It measures how effectively and efficiently
the main factors of production labour and capital combine to generate output. However
in some circumstances robust measures of capital input can be hard to find (Saari
2006). Labour productivity and multifactor productivity both increase over the long-term.
Usually the growth in labour productivity exceeds the growth in multifactor productivity,
reflecting the influence of relatively rapid growth of capital on labour productivity.
Table 2.2 Comparison of basic measures of partial productivity.
TYPE OF MEASURE VARIABLES TO BE
MEASURED
VARIABLES EXCLUDED
Physical Quantity Quality and distribution
Fixed price value Quantity and quality Distribution
Nominal price value Quality, & quantity, distribution
None
Source (Saari, 2006)
2.7 Farm mechanization and productivity, production, labour and income. (Empirical evidence)
The cornerstone for economic progress for Zimbabwe lies in the development of its
natural resources and manpower (Rukuni et, al; 2006). The role of mechanization in
agricultural development is seen as the employment of traditional capital in the
production or, in a neural sense to increase total labour employed in the production
function without being a substitute of any factor. The addition of power only increases
productivity in combination with other inputs, thus role of mechanization must be seen in
relation to the role of other factors in the production function

16 | P a g e
Farm mechanization reduces the human drudgery and enhances agricultural
productivity. For example during the post green revolution the impact of farm
mechanization on agricultural production and productivity was well recognized in India.
Depending on the use of other inputs such as irrigation, high yielding seed varieties,
chemical fertilizers, and pesticides different states in India have attained different levels
of mechanization, consequently the agricultural production and productivity has
witnessed 3 to 4 fold increase. Geoffrey C. Mrema (1990). Studies have been
conducted by various organizations and individuals highlighting the impact of farm
mechanization on farm production and productivity. Singh and Singh (1972) concluded
that tractorising farms gave higher yields of wheat, paddy rice and sugarcane and
produced a higher overall gross output per hectare than non tractorised farms. The
National Council of Applied Economic Research (NCAER) New Delhi (1973) compared
the values of annual farm output per hectare of net sown area, under different levels of
mechanization. The output per hectare was found to increase as the level of
mechanization increased from irrigated non mechanized farms to tube well, tractor
thresher farms. Moreover, Madras (1975) found that tractor owned farms obtained
increased productivity of paddy sugarcane and groundnuts by 4.1 to 28.3%, 13.1 to
34.2%, and 9.8 to 54.8% with an average value of 15.8%, 23.2%, and 31.8%
respectively. Pathak et al (1978) conducted surveys on 5 different categories of farms in
Ludhiana District of Punjab to asses the effect of power sources on production and
productivity. The yield of paddy, maize was reported to be higher on tractor farms than
on bullock farms. The use of tractors enhanced agricultural productivity due to better
seed bed preparation, timeliness of operations and precision in distribution and
placement of seed, and fertilizer owing to the use of the seed cum fertilizer drills.
Available evidence suggests that mechanization helps in overall increase in
employment of human labour. Gipe Poona (1967) concluded that tractorisation
generates greater demand for labour by facilitating more intensive cultivation thus there
was no significant displacement of human labour after tractorisation. USAID, New Delhi
(1970-71) conducted a study to assess the impact of tractorisation. It was concluded

17 | P a g e
that the adoption of high yielding varieties accompanied by use of chemical fertilizers
and enhanced cropping intensity led to higher demand for labour. Permanent labour on
tractor holdings showed a decline of the tune of 2.2% compared to the conventional
level. The employment of casual male labour showed an increase of 38.5%. in respect
of labour employment the increase was even higher at 80%. A tractor on average
displaced 4 bullocks. Moreover, AECR, Viswa Bharati (1973-74) conducted a study on a
sample of 60 farms in Shabad District of Bihar India. It revealed that the displacement of
human labour in terms of value of all inputs was 11.6% in the case of farm owning
tractors and 5.1% in the case of farm using tractors. The maintenance of tractors by the
first category of farms led to the additional employment of labour which more or less
compensated for displacement of labour in farming operations.
Different studies conducted on farm mechanization indicated that net human labour
displacement in agricultural operations was not significant and it was more than
compensated by increased demand for human labour due to multiple cropping, greater
intensity of cultivation and higher yields. On the other hand the demand for non-farm
labour for manufacturer, services, distribution, repair and maintenance as well as other
complementary functions increased substantially and helped in relieving rural
unemployment to some extent. Mechanization in agriculture provides indirect
employment to skilled & unskilled persons engaged in operation, repair and
maintenance of farm equipment. NCAER(1980) assed the employment in the
manufacture distribution, repair and servicing of tractors based on sample survey of
private repair shop, in general, generated employment of 22.2 man days per tractor per
year.
Mechanization generates many non-farming subsidiary activities among the farming
households. On one hand additional employment is created in the manufacture of farm
machinery, distribution of equipment and spare parts, fuel lubricants, repairing servicing
etc. On the other hand many subsidiary activities like dairying and poultry keeping got
generated. NCAER (1980) showed that tractorised farms reduced their draught animal
stock and increased their milk stock. Tractor owners and tractor users had 82% and

18 | P a g e
25% more milk cattle respectively as compared to bullock farms. A tractor owner was
able to increase his household income by undertaking supplementary activities such as
dairying and provision of custom hiring. Moreover farm mechanization helps greatly in
the farming community in the overall economic upliftment. A research by AECR (1970-
71) revealed that gross farm income was higher on mechanized farms than on non-
mechanized farms. Gross crop output per cultivated hectare was reported to be higher
for tractor operated farms as compared to non tractorised farm
2.8 Increasing agricultural productivity is central to reducing poverty -Technology’s Role
Agriculture plays a unique role in reducing poverty. Partly this reflects the sheer
numbers of poor people engaged in it. Around 75% of those surviving on less than
US$1 a day - the internationally agreed definition of absolute poverty – live in rural
Areas (IFAD, 2001) and agriculture is an important livelihood source. It is estimated that
70% of sub-Saharan Africa's labor force and 67% of South Asia’s works in Agriculture
(Maxwell, 2001). But the argument in favor of agriculture as the poverty- alleviating
sector par Excellence rests on more than population statistics. Improvements in
agricultural productivity has a powerful knock-on effect to the rest of the economy
through job creation in neighboring sectors such as food processing and input supply as
well as directly in farming; increasing the supply of affordable food; and stimulating and
supporting wider economic growth and development.To the extent that technology
raises agricultural productivity, it should be the major factor in creating these positive
effects. Thirtle et al., (2003) explored the relationship between agricultural productivity
and poverty. They drew on observations between 1985 and 1993 in 48 developing
countries and found that a 1% improvement in crop yields reduced the proportion of
people living on less than US$1 per day by between 0.6 and 1.2%. No other sector has
demonstrated such a comparably high impact on poverty. Thus, Lipton (2001) argues
that no other sector than agriculture offers the same possibilities to create employment
and lift people out of poverty. Indeed, the adoption of new technologies and subsequent
increases in agricultural productivity in different parts of the world explain, in large part,

19 | P a g e
the regional differences in the reduction of poverty over the last few decades. Nkamleu
et al. (2003) calculate changes in agricultural productivity in 10 countries in sub-
Saharan African countries between 1972 and 1999. In contrast with significant progress
in Asia, Nkamleu et al found that, on average, total factor productivity decreased in that
period by 0.2% annually. They suggest that, whilst efficiency was constant,
technological change was the main cause of the failure of total factor productivity to
increase.
2.9 Other benefits attached to farm mechanization
Mechanization raises the potential for multiple cropping. That is raising three or more
crops in communal areas and the rest of the farmers requires additional power and
improved technology to increase operational efficiency and hence production.
Agricultural mechanization also makes significant contribution in enhancing cropping
intensity. A researcher by the name Chopra (1974) carried out a study on a sample of
Punjab farms. He made a comparison of tractor owning farms in terms of the situation
before and after the introduction of tractors. The cropping intensity was reported to be
higher after the introduction of tractors. Intensified annual production can be made
possible by farm mechanization. Agriculturalists think in terms of production for as many
days as possible. The objective of modern agriculture is to produce as much
food/hectare and is economically feasible with the help of appropriate technology.
Moreover finding solutions to environmental problems in agriculture requires improved
agricultural tools and machinery, for example for soil tillage and pesticide application the
latter also addressing health concerns, similarly machines are required to assist with
post harvest loss reduction and on farm processing. Thus it is now recognized that
agricultural mechanization is crucial in the fight against hunger and poverty and at the
same time to address environmental and health concerns.
2.10 What influences the adoption of new technology by farmers?

20 | P a g e
A range of factors appear to have been critical in determining the rate at which farmers
have innovated new ideas and so been able to raise productivity for the benefit of
growth and the pace of poverty reduction.
2.10.1 Secure output markets
Farmers will innovate to increase subsistence production, but as innovation generally
implies some type of investment (in cash, labor or learning) the chances of farmers
investing and innovating are greatly enhanced by the existence of secure markets. As
the evidence shows, it is difficult to overestimate the importance of reliable output
markets as an incentive to new technology adoption. Dorward et al. (2004) argue that a
key feature of many successful early Green Revolution environments was government’s
role in stabilizing output prices, a function which has been progressively dismantled in
Africa where innovation has been limited. Wiggins’ (2000) survey of African case
studies found a number of success stories that contradict the general pessimism about
African agriculture, but virtually everyone was associated with well-functioning output
markets. In Malawi, Orr and Orr (2002) argue that unreliable maize markets lock many
farmers into inefficiently producing as much of their own grain needs as possible, rather
than innovating with new crops in which they may well have a comparative advantage.
2.10.2 Effective input supply systems, including credit
While there is danger in relying too heavily on “technology on the shelf”, effective input
supply systems are essential, particularly when technological change or advance
depends on purchased inputs. Inadequate formal seed supply systems have been
shown to dampen, or even preclude the diffusion of new crop varieties (Tripp, 2001).
Increasing fertilizer use has long been plagued by difficulties in providing the right
products in affordable pack sizes (Omamo and Mose, 2001). Establishing the systems
to provide those inputs is, however, one of the major challenges for many technologies,
and not merely the conventional seed-and chemical technologies. Delivery of tissue
culture banana plantlets in Africa requires the development of a network of intermediary

21 | P a g e
nurseries (Wambugu and Kiome, 2001). Nurseries are also crucial for the spread of
many agro forestry technologies, and efforts at encouraging farmer groups to take on
this role have largely failed (Bohringer and Ayuk, 2003). The delivery of veterinary
technologies depends largely on the delivery role of the private sector (Leonard, 1983).
But an operational system of input provision is often ineffective in the absence of
effective credit systems. Previous experiences with state-subsidized credit provision
have received much justified criticism (Adams and Vogel, 1990) and new approaches
are being considered, including linking input supply and output procurement (Dorward et
al., 1998).
2.10.3 Supporting infrastructure – particularly irrigation
The presence of supporting infrastructure is fundamental to effective innovation on new
technology and was a major factor in Asia’s successful Green Revolution. Roads are
critical to supporting input and output marketing (Dorward et al., 2004), but the
expansion of irrigation probably constituted the most important element of supportive
investment. The expansion of irrigation in developing countries has been greatest where
attaining increasing agricultural output through land expansion has been difficult and so
gains are made by intensification. Thus, both South and East Asia have a much higher
use of irrigated land use compared to Africa (Table 1). By 2030, it is projected that
about 80% of future production gains will be made from intensification (in part
dependent on irrigation) with a much smaller proportion through land expansion (de
Haen et al., 2003).
Table 2.3: Irrigation in Africa and Asia, 1961/1963 – 1997/1999
Irrigated land in use(million hectares)
1961/1963 1979/1981 1997/1999
East Asia
40
59
71
South Asia
37
56
81

22 | P a g e
Sub-Saharan Africa 3 4 5
Source FAO 2003
2.11 How does new agricultural technology benefit the poor?
A number of factors influence the extent to which the poor benefit from changes in
agricultural productivity through the adoption of new technology. These are discussed
below, beginning with the two most important factors – impacts on employment and
food prices.
2.11.1 The impact on employment
Employment on the farms of others is of critical importance to the livelihoods of the
poor. This is not just true for the classically landless; employment is also a vitally
important way for many farmers to supplement their incomes. The impact of new
technology on labor markets – specifically its impact on the demand for labor and wage
rates - is of great importance to the poor. Most evidence on this issue comes from the
Asian Green Revolution experience and, while often technology-specific, a number of
general principles emerge with respect to the impact of new technology on the demand
for labor and wage rates. In terms of the impact on the demand for labor:
• the adoption of high yielding rice and wheat varieties generally increased demand for
labor due to the higher harvesting and threshing requirements associated with their
greater yields
• the majority of additional labor used was hired rather than family labor (Lipton and
Longhurst, 1989). This is particularly important for the poorest
• increased labor demand was greatest when new varieties were introduced into high
potential areas and often associated with an increase in cropping intensity. The impact
was less pronounced when in low potential areas. (David and Otsuka,1994; Lipton and
Longhurst, 1989). The impact on wage rates is more difficult to determine because
there are numerous causal, and on occasion counteracting, factors.
Some conclusions can be drawn though, including that:
23 | P a g e
• Generally wages appear to have increased (IFPRI, 2002)
• labor saving technology has probably dampened the rate of wage increases, although
this does not mean that wages have fallen because of the adoption of new technology.
Lipton and Longhurst (1989), show that while a doubling of yields increased wages by
40% early in the Green Revolution, a similar yield increase 20 years later resulted in
only a 10-15% increase in wages due to mechanization. Bautista (1997) describes
disappointing increases in the demand for agricultural labor in the Philippines, explained
in part by subsidized farm mechanization
• In some cases, e.g. herbicide adoption in rice systems (Naylor, 1994), the introduction
of labor-saving technology has been a response to rising rural wage rates caused by
growth in non-farm wage rates
• Even where wage increases have been modest, the adoption of new technology has
frequently increased the number of employment days, and on occasion, facilitated the
introduction of contracts for casual laborers (Leaf, 1983).
2.11.2 Food prices
For the poor, the price of food is critically important given the relatively larger proportion
of their income generally spent on it. A relative lowering of food prices – particularly of
staples - allows the poor to eat more and possibly better which has a positive impact on
nutrition, health and food security. But cheaper food also releases income which can be
spent on other goods and services with immediate positive benefits to the poor such as
improved shelter or access to key services such as health and education. This release
of income also creates demand for goods and services which can have a powerful
multiplier effect on the wider economy. In many developing countries - and for the
developing world as a whole - increases in the production of staple foods have
comfortably outstripped population growth since the mid-1960s when the Green
Revolution began to be adopted widely. Only in Sub- Saharan Africa have food supplies
grown slower than population during the last thirty years. Given this significant increase
in per capita supply, and the relatively low elasticity of demand for basic foods, the real
world market prices of the major traded grains have steadily fallen since the early
1950s. At the individual country level, increased production of food grains can have a

24 | P a g e
dramatic effect on prices. This is of great benefit to the poor, both in urban and rural
areas, where many people buy, as well as grow their own food. (De Janvry and
Sadoulet, 2002; Jayne et al., 1999). But increasing production can also be a double-
edged sword if it reduces prices to the extent that producer incomes fall.
However, where productivity increases due to technology match or even outpace the
corresponding fall in prices, both net consumers and net producers can benefit.
Bangladesh provides an excellent example of this. Between 1980 and 2000, production
of rice and wheat increased from below 15 to over 25.7 million tonnes, increasing per
capita availability over the same period from 425 to 510 grams per day, despite
population increasing over the same period from 90 to 191 million people. Real
wholesale prices in Dhaka markets of rice and wheat have consequently fallen
dramatically, with the price of rice falling from just over Taka 20 to around Taka 11 per
kg in two decades. But despite declining market prices, farmers have successfully
increased their production, yields and incomes - rice yields have risen from an average
of 2 tonnes to over 3.4 tonnes per hectare by the early 2000s – through the use of new
varieties, fertilizer and, above all an expansion of irrigation. These improvements have
allowed farmers to cut their unit costs of production and so offset the impact of falling
prices on their incomes. It also appears that smaller farmers have not been excluded
from this technology.
2.11.3 Nutrition and food utilization
There are numerous examples of how agricultural technology has benefited the
nutritional status of poor households. These include:
• Improved varieties with increased vitamin content that contribute to the reduction of
human disease;
• Post-harvest fortification of crops to reduce vitamin deficiencies;
• Longer cropping seasons to regulate food supply and reduce the number of months
that households go hungry; and
• Improved storage and processing to extend the shelf-life of food and reduce waste.

25 | P a g e
2.11.4 Access to land and other resources
The extent to which agricultural technology can benefit poor people clearly relates to
existing inequalities in land and access to other resources. There are various
explanations of why poor people stay poor that are couched in terms of the allocation of
land and other resources. There is concern that technologies may exasperate inequality
in access to productive resources. One major criticism of the early Green Revolution
was the fact that early adopters tended to be larger (richer) farmers. (Indeed, a large
proportion of subsidies for Indian farmers continue to go to richer farmers (Gulati &
Narayanan, 2003)). These farmers were able to take greater risks and gain economies
of scale from applying new technologies to larger land holdings. Evidence suggests
that, subsequently, smaller farmers caught up and, in some cases, took better
advantage of the new technology (Lanjouw and Stern, 1998; Hazell and Ramasamy,
1991). Nevertheless, it is widely accepted that, initially at least, technology is an unlikely
way to overcome major inequalities in access to basic resources, especially land.
2.11.5 Gender issues
Gender-related effects of technology change are often important in determining the
impact of adoption on poverty. Technology generation has tended to favor crops
traditionally grown by men, who frequently have greater access to labor, markets, credit
and other inputs than women to a degree that may impact negatively on the intra-
household distribution of income and consumption (Doss, 2001). Addressing these
challenges goes well beyond technology design, as male dominated societal rules and
norms, and a complex household environment of ‘joint decisions, multiple objectives
and mutual dependence’ (Bonnard and Scherr, 1994) make it difficult to target, or
predict the gender-related outcomes of technology development. Simply targeting
technology to women’s crops is not necessarily the answer. (von Braun and Webb,
1989).
2.11.6 Sustainability issues
Whilst new technologies are important for poverty reduction, if not carefully managed,

26 | P a g e
they can create additional demand on resources which may simply not be sustainable in
the future. The most obvious example of this is water, for example the lowering of water
tables and loss of aquifer water, but other resources, including biodiversity and
chemicals, are also discussed.
2.11.7 Biodiversity
Technological advance is often blamed for the loss of biodiversity, but the issues here
are complex. Agricultural expansion generally has caused habitat destruction and, at
the local level, productivity increases can attract new farmers to the agricultural frontier
by making farming more profitable. But yield increases achieved through new
technology have curbed deforestation and the cultivation of marginal lands. If world crop
yields had remained at their 1960 levels, another 800 million hectares of land
(equivalent to the Amazon River basin) would have had to be brought into cultivation to
meet current demand (Ausbel, 1996). Modern crop varieties have frequently displaced
many local varieties. But the relationship of these changes to overall genetic diversity is
difficult to unravel. Recent work shows that the uptake of wheat MVs has not lowered
genetic diversity (Smale, 1997) as farmers often adopt a new crop variety and grow it
alongside their traditional varieties.
2.12 But have the poor benefited from new agricultural technology?
For many the key question remains: to what extent, and in what circumstances, have
poor people benefited from new agricultural technologies or have the benefits been
confined to the better off? Assessing this “distributional” impact of new technology is
difficult, not least as the uptake of innovations is inevitably skewed with the better-off
usually being “early adopters.” Propositions regarding distributional impact should
therefore be carefully specified, and any assessment of ultimate impact should not be
based on the adoption pattern seen in the early years after technology release. (Rogers,
1994). Among the most useful (but rarest) assessments of technology’s impact on
poverty are those that follow farming communities’ experiences over a longer-term
period (Lanjouw and Stern, 1998; Hazell and Ramasamy, 1991). These studies tend to

27 | P a g e
show that the poor have benefited from new technologies, principally through increased
employment opportunities and higher wage rates.
On the other side, a review by Freebairn (1995) of over 300 other studies related to the
Green Revolution revealed a general increase in inequality between regions as a result
of technology uptake. This conclusion however, requires qualification. First, it is
inevitable that technological advance will lead to an adopting area becoming relatively
better off compared with a non-adopting area. This simply underlines the importance of
balancing investment in technology generation between marginal and favored
environments. Secondly, the review itself identified the difficulties in separating the
impact of technological change from concomitant changes in population, policies or land
tenure. Rigg (1989), identified a similar issue: many negative assessments of the
poverty impact of the early Green Revolution are examples of ‘guilt by association’ – the
technology was seen as responsible for increasing inequality which was primarily the
result of other factors including: farm concentration, urban migration, and so on, which
accompanied technology dissemination.
Most of the evidence about the poverty reducing effect of agricultural technology comes
from Asia. In Africa there are far fewer examples of where agricultural technology has
benefited poor people. However, evidence from Zimbabwe reveals a Post-
independence Green Revolution amongst smallholders which had a very Significant
impact on poverty. This was achieved through the introduction of hybrid Maize,
expanded access to credit, guaranteed prices and marketing subsidies. The Outcome
was a doubling of maize production between 1980 and 1986 (Eicher, 1995).
28 | P a g e
Chapter 3: Research Methods
3.1 Introduction
This chapter includes a discussion of the methods that were used in gathering
necessary data that were used to determine the impact of farm mechanisation on maize
yield, impact on farm labour use and on the area put under crop cultivation by the newly
resettled farmers in Chipinge district. It also covers the description of the study area
from where data were collected. The section also includes the methods that were used
in data analysis and the econometric models that were used in data treatment and
analysis.
3.2 Data collection (Secondary data source)
Secondary data obtained from the African institute of Agrarian studies (AIAS) was used
in this study. It was once primary data that were used in a related study carried out in
2009 by the same institution. The data obtained from AIAS referred to newly resettled
farmers in Chipinge district with most of the farmers being beneficiaries of the
agricultural mechanisation programme by the government of Zimbabwe. The set of data
contained variables that were very useful and relevant in making conclusions on the
study.
3.3 Study area selection and description
Chipinge lies in natural region one and receives annual rainfall that is above 1000mm
per year. The area is characterised by a diverse of farming activities practised covering
cereal crop production, market gardening, coffee and various other cropping activities.
The maize crop is one of the major crops grown by the newly resettled farmers in the
district. The area was selected by the researcher mainly due to the fact that the
researcher is quite familiar with the area and bears some background knowledge of the
area. Moreover resettled farmers in the area were some of the beneficiaries of the farm
mechanisation programme launched by the government of Zimbabwe a few years ago.

29 | P a g e
3.4 Conceptual framework
3.4.1 Introduction
This conceptual framework outlines the types and sources of change in agricultural
output and the role of agricultural productivity in bringing the change. It will further
outline the necessary inputs such as labour capital equipment and the various other
inputs such as seed fertiliser. It further outlines the factors that affect agricultural
productivity.
Table 3.1Types and sources of change in agricultural output
CHANGES IN AGRIC
OUTPUTS
= CHANGES IN AGRIC
INPUTS
+ AGRIC PRODUCTIVITY
(Conventional market measured outputs)
Crops
Livestock
(Conventional market measured inputs)
Intermediate inputs
Fertilizer Pesticides Energy
Feed & seed livestock
(Changes in outputs not accounted for by the
changes in inputs)
Sources are: Agricultural research & development
Extension Education Infrastructure
Government programs Mechanization
3.4.2 Illustration of the conceptual framework
Agricultural productivity will be shown by the out per acre. Other than other value
measures productivity will be shown by the physical measure which is output, that is
maize yield. Variable to be measured is output and the variables to be excluded include
quality and distribution. Partial productivity results will be assumed to be true indicators
of total productivity. The term partial productivity illustrates well the fact that total
productivity is only measured partially-or approximately (Saari 2006)

30 | P a g e
3.5 Theoretical framework
Agricultural productivity levels can be determined by a comparative analysis of the
productivity levels of different crops on the farm. This can be difficult for those farmers
who have not been farming for the past seasons, which is the case for most of the fast
track farmers. In this case it is therefore important to carry out inter-farm comparative
analysis in order to establish other factors other than input availability, which can
influence output. The major assumption is that capital alone without other inputs and the
ancillary services such as extension farmer education including research and
development cannot increase productivity.
Yield per hectare that is productivity can be modelled in a linear multiple regression
model of the form nn XXXY .......22110
Where Y is the yield per hectare and α0 to αN are the regression coefficients and the X1
to XN representing the various explanatory variables expected to explain change in the
dependent variable.

31 | P a g e
3.6 Analytical framework
Table 3.2.Research Analytical Framework
Research question
Objectives Hypothesis Variables under
study
Data analysis
Does the use of farm equipment have a significant
contribution towards
increasing farm productivity amongst the
resettled farmers in Chipinge
district?
To determine whether the use of farm
equipment by the resettled
farmers had an impact on farm productivity.
Capital intensity positively affects farm productivity
in Chipinge District.
Maize yield, capital
intensity.
Regression analysis and comparison of
the yield means of farmers with
different levels of mechanization.
Does the levels of mechanization
move together with the use of
labor on a farm
To determine the correlations
between the level of
mechanization labor use
Labor use on a farm is
negatively related to the
level of mechanization. farm machinery
Quantities
of labor and
capital,
Correlation analysis
3.7 Regression analysis
Hypothesis one
To test whether capital intensity has a significant contribution on farm productivity. In
this study, the linear multiple regression model was used. The dependent variable was
maize yield with the assumption that maize productivity will be a true approximate of
total farm productivity. Table 3.3 below shows the independent variables used in the
linear regression model.

32 | P a g e
Table 3.3 Independent Variables
Variable
Abbreviation
Variable description
Effect on productivity
Sex
Age
Agric training Marital status
Education level attained
Total labour
Capital intensity Draught power
SEX
AGE
AGTRAIN
MSTUS
EDU
LABOR
CAPTAL
DRGHT
Sex of plot owner
Age of plot owner
Formal agric training attained
Marital status
Highest education
level attained Total labour
Capital intensity
Number of cattle and donkeys owned
_
+
+
+
+
+
+
+
The regression model used in this study is presented as follows;
DRGHT
CAPTALLABOREDUMSTUSAGTRAINAGESEXY
8
76543210
Where Y is the dependent stochastic variable maize yield, α1 to α8 are the regression
coefficients and α0 is the constant or intercept
µ is the error term and it represents the unexplained variation in the dependent variable.
Problems associated with multiple regressions such as autocorrelation,

33 | P a g e
heteroscedasticity and multicollinearity were corrected in the Shazame stastical
package.
3.8 Correlation analysis
Hypothesis two
In order to determine the correlations between capital and labour use, correlation
analysis was applied in this study. This type of analysis was carried out to see whether
capital in this sense mechanization move together with number of workers employed
permanently or temporarily on a farm. Correlation analysis generates a single value, the
correlation coefficient, that shows how much the two variables move together usually
symbolised by the letter r. This coefficient r ranges from a value of zero indicating no
correlation to a plus or minus one indicating a perfect linear relationship. The plus or
minus sign indicates the direction of the relationship. For example if the value of r is
positive the two variables capital and labour use move in the same direction and if its
negative then the two variables move in the opposite direction. To indicate the actual
proportion of the shared variance the coefficient of determination r2 was computed.
3.9 Analytical techniques
STATA, EXCEL and SPSS were the major analytical packages used in this analysis.
Significance tests were conducted to ascertain valid conclusions and to ascertain the
stationarity of the data. After specifying the econometric model, T tests were conducted
for this analysis, causality tests and Cointegration tests were also conducted to
establish the relationships between variables.

34 | P a g e
CHAPTER 4: DATA ANALYSIS AND RESULTS
4.1 Introduction
This section presents a description of the socioeconomic characteristics of the studied
resettled farmers. Socioeconomic characteristics to a large extent influences the
farmers productive capacity, his ability to assimilate information and hence the overall
performance of the farmer. Characteristics considered in the study include gender, age
distribution of farm owners, levels of education and farm characteristics.
4.1.1 Household characteristics
Table 4.1 Age distribution of households
AGE BRACKET PERCENTAGE (%)
Less than 30 3
31 to 50 years 35
51 to 70 years 40
0ver 70 years 22
Mean age 51 years
(Source survey data 2010)
Table 4.1 above indicates that in general the population had very few young people who
are under 30 years of age. A large portion of farmers were found to be in the age
bracket of 51 to 70 years of age.

35 | P a g e
4.1.2 Gender and marital status of farmers
Gender of the household head has been shown to be a critical variable influencing
choice and adoption of technologies among communal households (Zilberman, 1993,
Young, et al, 1998). As such it was found it expedient to identify the gender composition
of the households under review. Gender wise the population had 20.1 % female farmers
and 79.9% male farmers. Figure 4.1 below illustrates the marital status of households.
Figure 4.1 Marital status of households
4.1.3 Levels of education and household head occupation
Education influences the extent or the capacity to which an individual assimilates
information about agricultural machinery use. It is a human capital variable that has

36 | P a g e
been shown to be critical in the choice and efficient use of agricultural technology (Dinar
and Yaron, 1990). In the survey farmers were asked to give information regarding their
levels of education and the results are shown in the table below
Table 4.2 Educational status of households
LEVEL OF EDUCATION PERCENTAGE (%)
Advanced level 3.7
No formal education 6.5
Ordinary level 32.5
Primary level 23.2
Standard six 10.5
Tertiary 8.2
ZJC 15.3
Total 100
(Source survey data 2010)
In this survey farmers were asked to give the highest level of education attained.
Farmers were also further requested to give their occupational statuses. As shown in
table 4.2 above over 90% of the farmers attained at least primary and secondary
education which shows high literacy levels within the Chipinge farming community.
4.1.4 household sizes
A household typically consists of individuals residing together for at least three months
of the year (smith, 1995). Household size is used as a proxy for labour availability for
households. However it is important to differentiate between effective labour and
children. The mean size of household was 4.53 with a minimum of one and a maximum
of ten members per household.

37 | P a g e
4.2 Farm characteristics
4.2.1 Farm size
Farm size describes the total land holdings of a household and is important in decisions
regarding the use of technologies (Adesina, 1993). The mean of plot size was found to
be 24.2 acres. Since not all of the land will be under cultivation, respondents were also
asked about the amount under cultivation. The amount of land under cultivation on
average was found to be 8.01 acres.
Table 4.3 Land ownership by the farmers
MEAN SIZE (acres)
Total amount of land owned 24.2
Total amount of land cropped 8.01
(Source survey data 2010)
4.2.2 livestock ownership
In the communal areas of Zimbabwe, livestock are important in two aspects. Firstly
cattle and donkeys are critical for draught power purposes and secondly as household
wealth (Blackie, 1984). In the survey farmers were requested to give the numbers and
types of livestock owned.
Table 4.4 Livestock ownership (means)
LIVESTOCK TYPE MEAN/household
Cattle 12.1
Donkeys 3.5
Chicken 18.0
Turkeys 3.6
Pigs 0.22
goats 5.77

38 | P a g e
sheep 0.77
rabbits 0.30
(Source survey data 2010)
4.2.3 Agricultural implements
Agricultural implements are essential in the process of agricultural production in
communal areas as they are inputs of farm activities. They are believed to reduce the
drudgery of farming activities and also to increase farm productivity.
Table 4.5 Agricultural implements owned
NAME OF IMPLEMENT MEAN PERCENTAGE (%)
Ploughs 1.72 97.1
Cultivators 1.22 80
Harrows 1.29 74.3
Oxcart 1 90
Tractors 0.4 2.9
Wheel barrow 1.04 80
Hoes 10.1 100
Combine harvester 0 0.5
Axes 2.45 95
Ridger 1.5 40
Adequacy of
implements
66%
(Source survey data 2010)
In terms of the basic agricultural implements such as ploughs, cultivators, harrows, ox
carts, hoes tractors, ridgers, wheel barrows, at least 80% of the population did own one
or more. Respondents were further asked about the adequacy of the above elements
and how the farmers dealt with the problem of shortage. At least two thirds (66%) said

39 | P a g e
that their implements were adequate. However those farmers who indicated shortage
took advantage of existing social networks and either borrowed from relatives or friends
within their community and some hired tractor services from the nearest District
Development Fund (DDF). About 25.7% of the farmers borrowed from relatives, 5.3%
borrowed from friends, and about 10% borrowed tractors services from the DDF .
4.2.4 Sources of income for the households
Households were asked to give information regarding the various sources of income
available to them. Most farmers could not give approximate figures of the contribution of
each source per year per household. However ranking the sources showed that about
80% of the income sources came from retained farm earnings, the sale of livestock,
gardening and sale of agricultural crops to mention but a few. Other sources of income
included remittances, small businesses credit /loans and formal employment.
4.2.5 labour sources of households
Labour is an essential input on the farm as it has profound effects on farm productivity.
Labour is needed mainly for planting weeding and harvesting. Respondents were asked
to give information about their various sources of labour.
Table 4.6 Farmers’ sources of labour
CATEGORY OF LABOUR PERCENTAGE (%)
Casual labour 31.5
Family labour 51.5
Casual and family 17
(Source survey data 2010)
Half of the respondents used exclusively family labour for productive activities. About
17% used a combination of both hired and family labour whilst 305 used hired labour
exclusively as shown in table 4.6 above.

40 | P a g e
4.3 Regression and correlation analysis
4.3.1 Capital equipment intensity and productivity
In this section, findings relating to the relationships between farm productivity and
capital equipment intensity are presented. Productivity here was measured by the yield
of maize per hectare (10000m2)
The regression model applied to the study produced the results presented in table 4.7
below;
Table 4.7 Results of the linear regression model
VARIABLE OLS Coefficient Significant t
Sex 0.379 0.383
Age -265.950 0.441
Education -433.880 0.562
Formal training 297.007 0.248
Marital status 340.301 0.046**
Labour -105.156 0.873
Capital intensity 766.828 0.070*
Draught power 179.950 0.002***
Constant -2625.013 _
R-squared 0.712 _
Adjusted R-squared 0.6534 _
F value 8.226 0.0011***
Durbin Watson test statistic 2.156
Notes: ***significant at 1%, **significant at 5%, * significant at 10%
The R-squared value for the regression equation was found to be 0.712 showing that
the model’s predictor variables accounted for 71% of the total variation in maize
yield/productivity. Adjusted R-squared was 0.6524. The F value for the significance of
whole regression equation is greater than the tabulated F and hence the equation is

41 | P a g e
significant at 1% level. Capital intensity showed to have a positive effect on the yield of
maize shown by a regression coefficient of positive 766.828 in the estimated model,
significant at 10%. Draught power and marital status variables were also significant in
the model.
Table 4.8 Farm mechanization level and yield means
MECHANIZATION LEVEL PERCENTAGE OF
FARMERS IN CATEGOR
MAIZE YIELD
MEAN/HACTARE(TONNES)
Highly mechanized 4.5 1.85
Medium 31 1.72
Low 64.4 0.85
(Source survey data 2010)
By comparing also the maize yield means at different levels of capital intensity
(mechanization level) yield averages of maize were found to increase as capital
intensified as shown in table 4.8 above.
4.3.2 Insights from the analysis
The results obtained from the study show that mechanization have a significant impact
on productivity amongst farming communities in Chipinge district. The other variables
also having a significant contribution to productivity in the estimated model were draught
power and marital status of the household head. Household, labour and education had
a negative impact on productivity but sot significant.
4.3.3 Mechanization and labour use on the farm.
Results from the correlation analysis showed a correlation coefficient r of 0.457 and by
raising the r to the power of 2, the coefficient of determination was found to be 0.208849
showing that capital and labour are positively correlated though the relationship is a
weak one. Precisely stated, the two variables share about 20.88% of the variance.
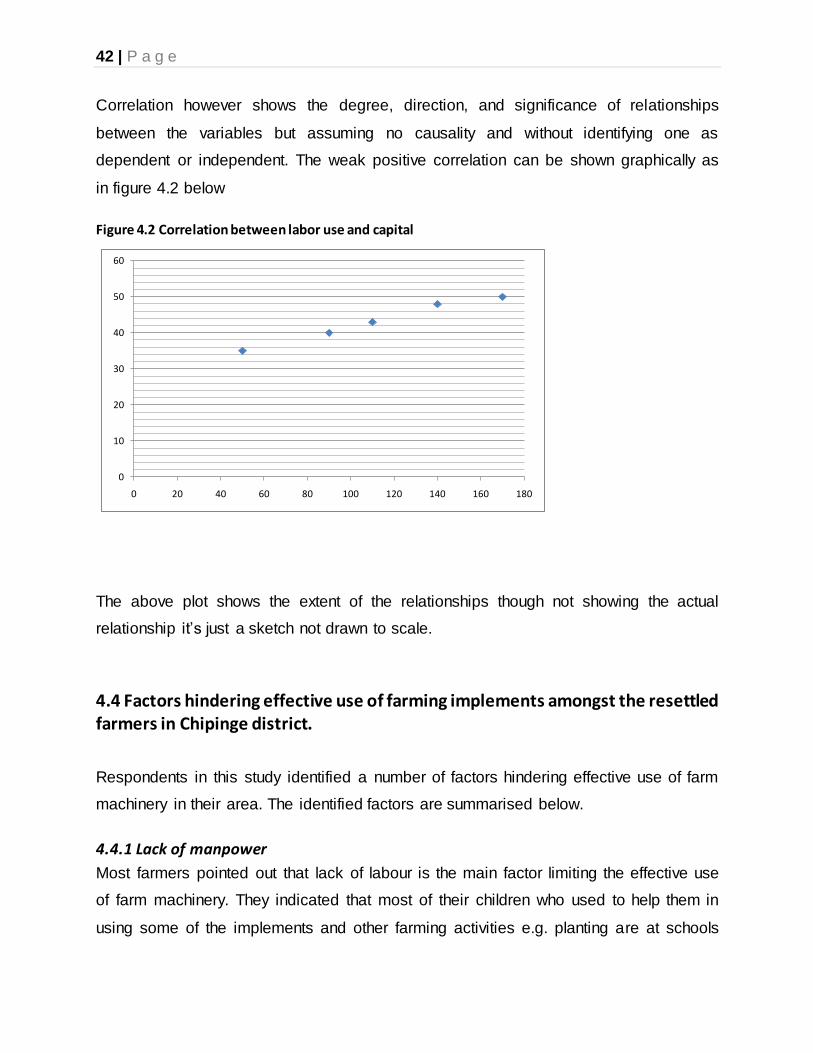
42 | P a g e
Correlation however shows the degree, direction, and significance of relationships
between the variables but assuming no causality and without identifying one as
dependent or independent. The weak positive correlation can be shown graphically as
in figure 4.2 below
Figure 4.2 Correlation between labor use and capital
0
10
20
30
40
50
60
0 20 40 60 80 100 120 140 160 180
The above plot shows the extent of the relationships though not showing the actual
relationship it’s just a sketch not drawn to scale.
4.4 Factors hindering effective use of farming implements amongst the resettled farmers in Chipinge district.
Respondents in this study identified a number of factors hindering effective use of farm
machinery in their area. The identified factors are summarised below.
4.4.1 Lack of manpower
Most farmers pointed out that lack of labour is the main factor limiting the effective use
of farm machinery. They indicated that most of their children who used to help them in
using some of the implements and other farming activities e.g. planting are at schools

43 | P a g e
and other institutions were they are now employed. Therefore it is difficult to effectively
use the implements they have due to lack of labour.
4.4.2 Weaknesses in draught animals
According to the result of the survey, 50% of the farmers indicated that they could not
effectively use ploughs and most of the animal drawn implements due to weaknesses
with the draught animals such as animal diseases and inadequate grazing.
Weaknesses in their draught power especially donkeys results in more labour hours in
cultivating big fields.
4.4.3 Lack of access to credit facilities
Results indicated that lack of financial resources to buy the complementary inputs such
as seed and fertiliser were a major challenge in trying to maximise benefit even with the
much needed implements on their farms. Some farmers could not use the equipment
due to lack of credit to buy fuel for the engine powered implements.
4.4.4 Relief and nature of surface
In certain areas relief was noted as a factor hindering effective use of farm machinery
especially the tractors and the animal drawn scortchcarts. Some areas could not receive
tractor services due to inaccessibility of the areas as they had some hills and steep
landscape. In addition some farms were noted to have some rocky surfaces which
again limited the effective use of the implements especially areas around Chirinda farms
(survey 2010).
4.4.5 Lack of effective extension services
Some of the farmers pointed out that they could not get the best of advice and help from
extension workers in their respective areas on time relating to the use of some kind of
implements especially knapsack sprayers due to a shortage of extension workers. The
pool of the extension workers were observed to be outnumbered by the pool of the
farmers in need of their services. With this farmers blamed extension services as one of
the factors hindering them to effectively utilise their capital equipment.

44 | P a g e
CHAPTER 5: CONCLUSIONS AND POLICY
RECOMMENDATIONS
5.1 Introduction
This section presents the conclusions drawn from the analysis done. Policy implications
and recommendations arising from the analysis are also discussed.
5.2 Impact of farm mechanization on productivity
Basing on the regression analysis we failed to reject the hypothesis that mechanization
increases productivity at 5% level and hence concluded that mechanization increases
productivity on a farm. The regression coefficient for capital was found to be 766.828
and significant at 10% which shows that capital intensity had a significant contribution
towards productivity. Timeliness of farming operations and efficiency in performing
farming activities like ploughing and harvesting were found to be the major reasons
leading to increased productivity. The results of this study are consistent with other
studies that were carried out during the post green revolution period in India1.
5.3 Impact of farm mechanization on employment of labour
The hypothesis that capital is inversely related to labour use on a farm was rejected at
the 5 % significance level as the results clearly show that they instead move together in
a positive direction. The correlation coefficient of 0.457 was found and it was the basis
for rejecting the initial hypothesis. Such results imply that as capital
equipment/mechanization increases, the use of labour on a farm tends to increase as
well. This was true for farming communities in the Chipinge district studied.
The increase in labour use as the level of mechanization increases was attributed to the
intensification of production that farmers were now adopting with the availability of
1 1 See Singh and Singh (1972), Aggarwal (1983) for further details.

45 | P a g e
various capital equipment. The use of some engine powered machinery such as tractors
resulted in an increase in labour as the machines need maintenance and drivers. GIPE
Poona (1967) concluded that use of machinery especially tractors generated greater
demand for labour by facilitating more intensive cultivation. Thus there was no
significant displacement of human labour after tractorisation.
5.4 Policy recommendations
From the study farm mechanisation was found to be effective in enhancing farm
productivity and reducing the drudgery of the farming community. From a sustainability
point of view it is recommended that the rate of mechanising agriculture in Zimbabwe
especially to the just resettled farmers both communal and commercial be continued as
a means of improving productivity on the farms. With the aim of restoring the status of
the country being the Bread Basket of Southern Africa mechanization remains a
positive move in reviving agricultural production taking note that production can be
increased by either putting more land under cultivation or increasing the productivity of
the land already under cultivation which is mostly possible with mechanization.
Mechanization is however demand driven: it is the farmer who will decide what machine
to buy or use, from whom to buy and how to use it (FAO 1997). Experience has shown
that mechanization must be left to the private sector as much as possible. Government
should not be actively involved in the manufacture, import, distribution, and repair of
agricultural machinery and its operations but provide the incentives for private sector
response.
It has also been shown that a lot of factors are hindering effective use of the various
farming implements that maybe at their disposal. With this in mind it is also
recommended that farmers be advised to seek training in agricultural colleges in order
to make proper use of the implements at their disposal. It is also recommended that
Government reduce the ratio of farmer to extension worker by deploying more extension
workers that will assist farmers in maximising benefits associated with the use of farm
equipment.

46 | P a g e
Mechanization alone cannot increase productivity and or production. It is a
complementary input that works best with other inputs such as fertiliser, pesticides,
irrigation and high yielding seed varieties. Most resettled farmers lack adequate credit
facilities to buy other inputs as mentioned and therefore it is highly recommended that
reliable credit facilities with less stringent conditions for acquiring loans be made
available to farmers to ease inputs acquisition problems. Moreover subsidising inputs
for the farmers is also another possible channel that the government should follow to
make sure that the farming community brings production to full swing.
47 | P a g e
Bibliography
1. Adesina A (1994) pesticides use and policy in West Africa: an overview. In:
S.Agne;G; G. Fleischer; H Waibel (eds.) Proceeding of the Gottingen workshop
on pesticides polices, February-4 March 1994, Gottingen, Germany.
2. Adams, D. and R. Vogel (1990) ‘Rural financial markets in developing countries’
in C.
3. Ausbel, J.H. (1996) Can technology spares the earth? American Scientist 84:
166-178.
4. Binswanger, H (1984) Agricultural Mechanization: A comparative historical
perspective. Staff working paper No. 673. Washington, D.C. World Bank.
5. Boshoff, W.H. & Minto, S.L. (1974) Energy requirements and labor Bottlenecks
and their influence on the choice of improved equipment.institute for
development studies, University of Nairobi, Kenya
6. Bonnard, P. and S. Scherr (1994) within gender differences in tree management:
Is gender distinction a reliable concept? Agro forestry Systems 25: 71-93
7. Bohringer, A. and Ayuk, E. (2003) Farmer nurseries as a catalyst for developing
sustainable land use systems in southern Africa. Agricultural Systems 77: 187-
201.
8. Blake and Howard, (1984) Ranking different management scenarios: Case of
dairy farming technologies, jornal of agricultural economics, vol. 32. Pp. 19-23
9. C Kline (1969). Agricultural mechanizationin equatorial Africa. Institute of
international agriculture research report No 9. Michigan state University , East
Lansing
10. De Janvry, A. and Sadoulet, E. (2002) World poverty and the role of agricultural
technology: Direct and indirect effects. Journal of Development Studies 38: 1-26.
11. Eicher and J. Staatz (eds.) Agricultural Development in the Third World.
Baltimore: Johns Hopkins University Press.
12. Eicher, C. (1995) ‘Zimbabwe’s maize-based Green Revolution: Preconditions for

48 | P a g e
replication’ World Development 23
13. FAO (2003) World Agriculture towards 2015/2030: An FAO Perspective, London:
Earthscan.
14. Freebairn, D. (1995) Did the Green Revolution concentrate incomes? A
quantitative study of research reports. World Development 23: 265-79
15. Geoffrey C. Mrema (1990) Agricultural mechanisation policies & strategies in
Africa, Botswana college of agriculture university of Botswana
16. GIPE. (1967) Study on tractor Cultivation in Shahd Taluka, Dhulia District,
Maharashtra. Report by Gokhale Institute of politics and Economics, Poona.
17. Gono G (2007). A summary of the reserve bank of zimbabwe’s strategic imports
program 2004-2006 suplement to the january 2007 monetary review statement.
18. Gulati. And Narayanan, S. (2003) The Subsidy Syndrome in Indian Agriculture,
Oxford University Press, New Delhi.
19. IFAD (2001) Rural Poverty Report 2001. Oxford, UK: Oxford University Press.
20. IFPRI (2002) Green Revolution: Curse or Blessing? Washington DC:
International Food Policy Research Institute.
21. Lanjouw, P. and N. Stern (1998) Economic Development in Palanpur over Five
Decades. Oxford, UK: Clarendon Press.
22. Leonard, D. (1993) Structural reform of the veterinary profession in Africa and the
New Institutional Economics. Development and Change 24:227-267.
23. Lipton, M. with R. Longhurst (1989) New Seeds and Poor People. Baltimore,
Massachusetts, USA: Johns Hopkins University Press.
24. Maxwell, S. (2001) Agricultural issues in food security. In: S. Devereux and S.
Maxwell (eds),
25. Naylor, R. (1994) Herbicide use in Asian rice production. World Development 22:
55-70.
26. NCAER, (1973) Implications of tractorization on farm employement, productivity
and income. National Council of Applied Economic Research, New Dehli
27. Nkamleu, G., Gokowski, J. and Kazianger, H. (2003) ‘Explaining the failure of
agricultural production in sub-Saharan Africa’ Paper presented at the 25th
International Conference of Agricultural Economists, August 16-22, 2003,
49 | P a g e
Durban, South Africa.
28. Omamo, S. and L. Mose (2001) Fertilizer trade under market liberalization:
Preliminary evidence from Kenya. Food Policy 26:1-10. Orr, A. and S. Orr (2002)
Agriculture and Micro-enterprises in Malawi’s Rural South. AgREN Paper 119.
London, UK: Overseas Development Institute (ODI)
29. Pingali P (1987). Agricultural mechanization and the evolution of farming
systems in sub- saharan Africa . Johns Hopkins University Press
30. Rigg, J. (1989) The new rice technology and agrarian change. Guilt by
association? Progress in Human Geography 13: 374-99.
31. Saari. S (2006). Productivity Theory and Measurement in Business. Productivity
Handbook. Mido oy pp.22
32. Singh, C.P; SR Verma and K.S. Tandon (1984) “status of agricultural
mechanization in India: In Moens and Siepman (editors) developement of
agricultural machinery industry in developing countries.
33. Singh, L.R. & R.V. (1975) Impact of farm mechanization on human and Bullock
labor use in two regions of U.P. Pant University of agriculture and technology
34. Smith D(1990) insect control and the balance of nature, Scientific american
journal vol. 488 pp 120-122..
35. . Thirtle, Colin, Lin Lin & Jennifer Piesse (2003) ‘The impact of research-led
agricultural productivity growth on poverty reduction in Africa, Asia and Latin
America’, World Development,
36. Tripp, R. (2001) Seed Provision and Agricultural Development. Oxford, UK:
James Currey
37. Wambugu, F. and R. Kiome (2001) The Benefits of Biotechnology for Small-
Scale Banana Producers in Kenya. ISAAA Briefs 22. Ithaca, New York, USA:
International Service for the Acquisition of Agro biotechnology Applications
(ISAAA).
38. Wiggins, S. (2000) Interpreting changes from the 1970s to the 1990s in African
agriculture through village studies. World Development 28: 631-662