Bruce V. Johnson, P.E. Bridge Section 355 Capitol Street...
36
500 Fifth Street, NW Phone: 202 334 2934 Washington, DC 20001 Fax: 202 334 2003 www.TRB.org June 29, 2005 Bruce V. Johnson, P.E. State Bridge Engineer Bridge Section Oregon Department of Transportation 355 Capitol Street NE, Room 301 Salem, OR 97301 Dear Mr. Johnson: This letter is the final report of the Transportation Research Board’s (TRB’s) Committee for Review of the Oregon Department of Transportation Study on Bridge Shear, Project Number SAIS-P-04-02-A. The report contains the committee’s unanimous findings and conclusions. Project Background The Oregon Department of Transportation (ODOT) 1 has reported that the reinforced concrete girders of many of the highway bridges under its responsibility are exhibiting substantial cracking. The vast majority of the cracked bridges of concern were constructed between 1946 and 1962. The cracks tend to have wide spacing, many have large angles of inclination with respect to the girder axis at locations away from the supports, and many have reduced angles of inclination relative to the beam axis near the girder supports. The exact causes of these cracks have not been determined. It has been indicated that these bridges were built in accordance with design standards and practices in effect at the time. Many of those have since been changed. Furthermore, ODOT had deferred some bridge maintenance because of budget constraints. Reinforced concrete bridges built at that time were designed by a method that resulted in less shear reinforcement than is required by current methods. On the basis of improved understanding of shear behavior, the American Association of State Highway Officials (AASHO) significantly revised the design methodology of its Standard Specifications for 1 See Attachment 1, Definitions and Acronyms.
Transcript of Bruce V. Johnson, P.E. Bridge Section 355 Capitol Street...

500 Fifth Street, NW Phone: 202 334 2934 Washington, DC 20001 Fax: 202 334 2003 www.TRB.org
June 29, 2005
Bruce V. Johnson, P.E. State Bridge Engineer Bridge Section Oregon Department of Transportation 355 Capitol Street NE, Room 301 Salem, OR 97301 Dear Mr. Johnson:
This letter is the final report of the Transportation Research Board’s (TRB’s) Committee for Review of the Oregon Department of Transportation Study on Bridge Shear, Project Number SAIS-P-04-02-A. The report contains the committee’s unanimous findings and conclusions. Project Background The Oregon Department of Transportation (ODOT)1 has reported that the reinforced concrete girders of many of the highway bridges under its responsibility are exhibiting substantial cracking. The vast majority of the cracked bridges of concern were constructed between 1946 and 1962. The cracks tend to have wide spacing, many have large angles of inclination with respect to the girder axis at locations away from the supports, and many have reduced angles of inclination relative to the beam axis near the girder supports. The exact causes of these cracks have not been determined. It has been indicated that these bridges were built in accordance with design standards and practices in effect at the time. Many of those have since been changed. Furthermore, ODOT had deferred some bridge maintenance because of budget constraints. Reinforced concrete bridges built at that time were designed by a method that resulted in less shear reinforcement than is required by current methods. On the basis of improved understanding of shear behavior, the American Association of State Highway Officials (AASHO) significantly revised the design methodology of its Standard Specifications for
1 See Attachment 1, Definitions and Acronyms.

2
Highway Bridges in the period between its seventh and eighth editions (1957 and 1961) (AASHO 1957; AASHO 1961).1 Reinforced concrete bridges designed today could have 50% more shear reinforcing steel in some of the areas that are cracked in Oregon�s 1950s-era bridges. Widespread observations that cracks near the mid-height of large girders were often substantially wider than at the level of flexural reinforcement also resulted in use of skin reinforcement that was not generally present in bridge girders in the 1950s and 1960s. In addition, construction materials were changing significantly. The AASHO bridge design specifications did not require modern deformed reinforcing bars until 1949, and specific bond provisions for deformed bars were not introduced until 1953. Attention to proper anchorage and development of flexural reinforcement was sketchy. The design of a highway bridge depends on the weight of the bridge and the static and dynamic loads imparted by the vehicles that cross it. Since these bridges were designed, the volume of truck traffic in Oregon has grown several-fold, and the federally defined maximum allowable five-axle truck-trailer weight has increased from 72,000 to 80,000 pounds. As a result of Oregon�s observation, the Federal Highway Administration (FHWA) surveyed other states to determine whether they were experiencing similar problems with their reinforced concrete deck girder bridges. FHWA concluded from this survey that the type of cracking observed in Oregon is not unusual, but the large number of bridges in Oregon with such cracks is exceptional. In consideration of public safety, ODOT imposed truck and axle weight restrictions on these bridges while considering appropriate strategies to manage the situation. In addition, ODOT commissioned a study by Oregon State University (OSU) to help the state�s bridge engineers determine the load-carrying capacity of bridges with cracked girders. The objectives of the OSU study were to • Assess the field performance of typical reinforced concrete deck girder bridges with cracks under both in-service and controlled loads, • Develop models to enable ODOT to estimate the remaining life of these cracked bridges, and • Develop new or modify existing analytical methods for predicting their load-carrying capacity. The study included instrumentation of several existing bridges as well as extensive laboratory tests. The results of the OSU study are contained principally in two reports2 that were issued by ODOT: • Remaining Life of Reinforced Concrete Beams with Diagonal-Tension Cracks (Higgins, Yim, et al. 2004) (SPR 341) and
1 References are given in Attachment 6. 2 Electronic copies of these reports have been placed in the Public Access File in the project office at National Academies. Contact the Public Access Records Office at [email protected] to make an inquiry or to schedule an appointment to view or acquire copies of these reports or other project materials that are available to the public. In addition, electronic copies of both reports are available at http://www.odot.state.or.us/tddresearch.

3
• Assessment Methodology for Diagonally Cracked Reinforced Concrete Deck Girders (Higgins, Miller, et al. 2004) (SPR 350). FHWA, as part of its annual review of the state�s compliance with the National Bridge Inspection Standards, requested a review of the results of the OSU study by an independent panel of experts. ODOT contracted with the National Research Council�s TRB for advice on the appropriateness and soundness of the evaluation data, evaluation techniques, and resulting recommendations of the OSU study. TRB was engaged to conduct an independent peer review of the OSU study and examine its findings in determining the load-carrying capacity and remaining life of concrete bridge girders with shear cracking. Specifically, ODOT requested TRB to form a committee of experts to review the completed OSU study and to address the following questions:
1. Did OSU deliver the products specified in the objectives for the study? 2. Are the analysis methods developed by OSU appropriate, and do they follow sound
engineering principles? 3. Are there any �fatal flaws,� and did the study miss significant items? 4. What technical issues would bar implementation of the developed methods? 5. Are the methods developed by OSU more or less conservative than current ODOT
analysis of cracked bridges? 6. What additional work is needed?
TRB formed a committee of six experts3 according to National Research Council (NRC) procedures. The committee met in Salem, Oregon, in December 2004 to initiate its review and in College Station, Texas, in February 2005 for follow-up discussions. An integral part of the first meeting was a visit to the sites of some of the cracked bridges, where close-up examinations of the cracking patterns and spacings were conducted. Public working sessions with representatives of ODOT, OSU, and FHWA were key elements of both meetings. In addition, a telephone interview was conducted at the College Station meeting with a member of the general public who responded to the invitation for public comment on the NRC website. Further communication among the committee members was conducted by e-mail and telephone conference calls. The committee�s summary replies to the ODOT questions are as follows: 1. Did OSU deliver the products specified in the objectives for the study?
Assess field performance of typical reinforced concrete deck girder bridges under both in-service and controlled loading.
3 See committee roster in Attachment 7. Dan M. Frangopol was appointed a member between the first and second meetings. Biographical information about committee members is provided at http://www4.nas.edu/webcr.nsf/CommitteeDisplay/SAIS-P-04-02-A?OpenDocument

4
OSU carried out studies with high-quality field instrumentation on several bridges that provided a good assessment of their ability to carry live load. In particular, careful monitoring of selected web reinforcement indicated that stirrup stress ranges were low and stirrup fatigue should not be a problem.4 Develop models to enable ODOT to estimate the remaining life of these cracked bridges. OSU field instrumentation and laboratory tests indicated that web reinforcement fatigue should not be a problem. However, the assessment methodology focused on shear�moment interaction and current traffic loadings. It did not have any time-based function to reflect or predict future deterioration. The methodology did not emphasize the use of nondestructive evaluation or invasive materials sampling to enhance assessment of bridge remaining life. Develop new or modify existing analytical methods for predicting their load-carrying capacity. OSU investigators attempted to develop a general reliability assessment procedure. This analysis brought together weigh-in-motion (WIM) data and permit vehicle characteristics with a sophisticated analysis to determine structural loading demands across the bridges. It then compared these loading effects with shear�bending moment interaction predictions of capacity. These predicted capacities reflected statistical variations in girder strength based on OSU test results of girders of similar proportions but with modern materials. While the committee found a number of shortcomings in details, it recognized the great effort put into the study. The committee believes that the methodology developed cannot be used for determination of bridge serviceability or safety but might be useful in prioritization of bridges for further rating, examination, and repair. Overall, ODOT obtained a great deal of highly useful documentation and information from OSU, and ODOT officials told the committee that they believed that OSU had satisfied their expectations.
2. Are the analysis methods developed by OSU appropriate, and do they follow
sound engineering principles?
The committee believes that the OSU analysis, field studies, and laboratory tests that conclusively indicated fatigue of web reinforcement not to be a problem were convincing and followed sound principles. On the other hand, while the very ambitious attempt to develop a comprehensive reliability-based assessment methodology had some desirable components, there were several serious omissions and flaws. It did not include many essential components of basic American Association of State Highway and Transportation Officials (AASHTO) standards for load rating and design, such as load factors and resistance factors, did not
4 Bolded sentences and paragraphs are statements that are given particular emphasis.

5
treat loads and resistances as time-dependent variables, and did not provide clear guidance for assessing the effects of reinforcement details.
3. Are there any �fatal flaws,� and did the study miss significant items?
• A major deficiency was the lack of a systematic investigation of in situ materials properties, reinforcing bar deformations and anchorage details, and in situ materials variations for use in statistical predictions. Another was little emphasis on field evaluation of structures using nondestructive evaluations and materials sampling.
• Both ODOT and OSU investigators seemed to focus on �shear cracking� and shear strength while failing to consider the interaction of bond and shear and to provide methodologies for determining the effect of reinforcement detailing, including the lack of skin reinforcement, on crack formation and propagation. A conclusive explanation of the cause and mechanics of cracking in the bridges was not given.
• The proposed assessment methodology omitted any consideration of time effects on loads and resistances. The methodology also ignored the state of the art in national design and assessment standards requiring the use of load factors and resistance factors to provide adequate margins of safety and performance.
• The study never provided convincing explanations for the high inclination angles (measured from the longitudinal axis of the girder) and the wide spacing of the cracks at the service limit state. The crack formation differs appreciably from that shown at the ultimate limit state in most of the laboratory tests with fixed loading.
• The overemphasis on moment�shear interaction using complex computerized analyses such as Modified Compression Field Theory (MCFT) and Response-2000 (R2K) failed to provide clear assessment recommendations for inputting reinforcement details considering development lengths and led to serious discrepancies noted in spot checks by the committee.
4. What technical issues would bar implementation of the developed methods?
As outlined previously, lack of consideration of time-dependent effects, lack of proper treatment of reinforcement anchorage and development, and omission of load factors and resistance factors would prevent immediate use of the proposed assessment methodology.
5. Are the methods developed by OSU more or less conservative than current
ODOT analysis of cracked bridges?
Assuming that ODOT�s current analysis conforms to national load rating standards, the proposed OSU assessment methodology would probably be less conservative. However, it is not easy to provide a clear answer to this question, since there are several

6
uncertainties and time-dependent factors that are not considered and their combined effect cannot be evaluated without performing a much more complex reliability analysis.
6. What additional work is needed?
• Provision of a clear methodology for determination of actual material properties [strengths, coefficients of variation (COVs), biases] and reinforcement details in a bridge to be evaluated.
• Provision of recommendations for determining the effect of bar details such as hooks, cutoff bars, and, where applicable, bars without modern deformations.
• Validation of the laboratory tests and the proposed assessment methodology by testing one or two highly deteriorated bridges to failure in the field (or by transporting girders to a laboratory) to determine their performance and residual strength.
• If laboratory tests are to be used to assess prototype girder capacity, a few validation tests with test specimen flange widths comparable with effective flange widths of bridge girders should be conducted.
• Provision of clearly stated changes and deviations from AASHTO load rating procedures.
• Inclusion of time-dependent effects in the assessment methodology. The following discussions of the SPR 341 problem background, field testing, laboratory testing, anchorage details, load rating, and other aspects of the assessment methodology are intended to amplify on these replies. SPR 341 Problem Background Although copies of this report (Higgins, Yim, et al. 2004) were not originally given to the committee and the report was not specifically mentioned in the contract between ODOT and TRB, the committee found it necessary to review the report to understand the overall scope of the project. Copies were provided at the committee�s meeting in December 2004. According to the report, the ODOT concrete bridge inventory from 1900 to 2001 showed that 1,536 bridges fit into the category of multibeam girder bridges, of which 493 were identified by ODOT as having inclined cracks. The year of construction of 479 of the cracked bridges (97%) was between 1946 and 1962. Among this group, 442 were the focus of the ODOT study. The report termed these bridges as �shear-cracked,� although many crack patterns exhibited by the bridges (see Figures 1 and 2 for typical cases) showed a preponderance of cracks with relatively large inclinations with respect to the girder axes, suggesting to the committee that direct tension from sources such as thermal restraint or anchorage-related problems may have also been major contributing causes. A fairly extensive correlation of the degree of cracking (Crack Stages 1, 2, and 3) with important structural parameters such as span lengths, girder spacing, girder width, stirrup spacing, and so forth was presented. Unfortunately, no definitions of Crack Stages 1, 2, and 3 were given in SPR

7
341. They were furnished to the committee later by ODOT (see Figure 3) and referred to crack density, dispersion, and location within spans. No crack width data were presented on those forms or tabulated in SPR 341. Higher crack stages were associated most frequently with longer span length, wider girder spacing, thinner or deeper diaphragms, and larger girder widths. The committee noted that the pattern of cracking shown on the assessment form of Figure 3 placed much more emphasis on diagonal cracks than on vertical cracks, while the crack patterns sketched in Figures 1 and 2 showed many vertical or near-vertical cracks that may be associated with longitudinal restraint, anchorage problems, or lack of skin reinforcement in these fairly large girders. Often, the widths of near-vertical cracks were quite large (see Girder No. 1 in Figure 2). The finite element analysis results reported in SPR 341 indicated substantial effects of temperature decrease and of temperature gradients that might have contributed to the cracking. In reinforced concrete bridges, shear resistance is contributed by a factor representing the cracking shear capacity without web reinforcement (Vc) and a factor representing the shear capacity contributed by web reinforcement working as part of a truss model (Vs). The total capacity is Vn = Vc + Vs. In the ODOT bridge database, bridges with larger girders and longer spans tend to be at higher crack stages. This is probably because a higher proportion of Vn is contributed by the Vc term in such girders. It is well known that the American Concrete Institute (ACI) Building Code and the AASHO bridge design specifications greatly overestimated the Vc term prior to 1963, the period of design and construction of many of the troubled bridges. In addition, during the 1946 to 1962 period the reinforcing bar deformation requirements changed significantly. The 1944 AASHO bridge specifications had no specific requirements for bar deformations. The ASTM A305 requirement for minimum lug heights, maximum lug spacings, and bearing-to-shear ratios was not introduced into the AASHO specification until 1949 and probably took several years to implement into construction. Thus, early bridges in the 1946�1962 era may have reinforcing bars with relatively poor anchorage characteristics that would weaken their capacity to resist inclined cracking. A dramatic reduction in the extension of flexural reinforcement beyond the regions where it was required for flexure was made in the 1944 specifications. This is one reason why the bridges built earlier than 1946 may have less significant cracking. In general, the OSU study seems to have focused strongly on shear cracking while ignoring the possibility that very similar vertical and inclined cracking might be due to poor bond or anchorage of reinforcement. The crack maps of Figure 1 indicate the major width cracks to be near dead load point of inflection (PI) locations where bars are cut off. The same is true of the maximum stress range location measured during field monitoring of ambient traffic on the Willamette River Bridge, as shown in Figure 10.2 on page 72 of SPR 341. This field evidence points toward anchorage problems. Part II of SPR 341 summarizes the dramatic changes that took place in the AASHO design specifications during the period of interest (1947�1962). Beams with web reinforcement such as these shear-cracked girders had large increases in allowable shear stresses. More important, the AASHO Vc term was probably 50% higher than what would be recommended on the basis of

8
Figure 1: Example diagonal cracks and crack and stirrup mapping (Figure 9.1 of SPR 341).

9
Figure 2: 15 Mile Creek Bridge crack, stirrup, and instrumentation locations on Span 5 eastbound (Figure 2.33a of SPR 350).

10
Figure 3: ODOT cracked bridge assessment form.

11
current knowledge. The committee believes that significant inclined cracking problems were �built in� to these girders by overly liberal Vc allowances, a general lack of understanding of reinforcement anchorage, and possibly insufficient bar deformations. The changes of the AASHO code provisions would have contributed to design deficiencies, as judged by the present standards, but among all the changes the large reduction in the anchorage requirement at the points of bar cutoff should be a major concern. An anchorage failure would lead to sudden loss of ductility and structural integrity. In addition to the statistical information, summary of AASHO specifications, and crack maps, SPR 341 contains important information on field tests of the Willamette River Bridge that will be addressed in the next section. Field Testing Four in-service bridges dating from 1950 to 1960 were instrumented and tested. They were two-lane bridges, typically four girders wide. Spans were 48 to 60 feet. Simple spans as well as two- and three-span continuous units were included. Girders were typically 13 inches wide by 48 inches overall depth, often with thickening or deepening at interior supports of continuous spans. Both girders and cap beams were instrumented. Crack maps for girders and cap beams were prepared for the four bridges. Crack widths of 0.008 inch and larger were recorded. The crack maps indicated that some cracks are quite wide, up to 0.025 inch and occasionally even larger. However, visible signs of corrosion of the reinforcement (rust stains, spalling of cover) are not evident. The cracks are widely spaced, with a typical spacing of 3 feet or more. The cracks are highly inclined, typically at an angle of 60 to 90 degrees relative to the axis of the girders. The committee is not surprised that many cracks are wider than the theoretical �threshold� width of 0.013 inch. That threshold value is based on short-term laboratory tests measured at the level of the flexural reinforcement, not on long-term loading and exposure and measured at mid-depth of the girder. The sides of the girders are not provided with distributed longitudinal �skin� reinforcement, as required by modern codes. Without such reinforcement, cracks at mid-depth of girder may be up to three times as wide as cracks at the level of the reinforcement. In addition, inclined shear-type cracks are inherently wider than flexural cracks, because the shear reinforcement is not perpendicular to the crack. Laboratory data on crack width show significant scatter�perhaps ±50%. As pointed out previously, the wide cracks at wide spacing could be caused by a deficiency in bond or anchorage, which would lead to fewer wider cracks. It is a major deficiency of the study that no attempt was made to conduct systematic investigations of the bar deformations. Finally, the high inclination angle and wide spacing of the cracks are not fully explained. Appendix B of SPR 350 attempts to explain this as a result of moving loads, but Figure 6.4 of Appendix B is only partially convincing. Another shortcoming of the field investigation is that little is said about properties of the materials in the bridges tested in the field. Page 93 of SPR 341 makes only a brief reference to

12
core tests of the concrete. Stirrups were assumed to be �intermediate grade,� as it was then known, at a yield stress of 40 ksi. Although the assumptions of material properties are not unreasonable, it would have been beneficial to take and test additional samples of the materials in the test bridges. It would also be useful to know with certainty whether the reinforcement had the modern A305 deformations, as opposed to being smooth or having earlier, less effective deformations. This applies to the flexural reinforcement as well as to the stirrups. Yield and fatigue tests from coupons removed from bars in structures would be valuable. In general, the committee was extremely disappointed that the proposed methodology for assessing capacity had so little emphasis on use of nondestructive evaluation and invasive testing procedures to assess current conditions and evaluate present material properties in the cracked bridges. A total of approximately 100 stirrups in the four bridges were instrumented with strain gauges of short gauge length. In addition, approximately 24 linear variable differential transformer (LVDT) gauges were installed to measure changes in crack width. The LVDTs measured motion in a direction perpendicular to the crack, whereas the strain gauges measured stresses in the vertical direction of the stirrups. The bridges were loaded with test trucks of known axle loads placed in various locations and driven at various speeds. The test trucks and loadings did not meet or exceed permit loads. Vast amounts of field test data were gathered and reported in SPR 341 and SPR 350. The stirrup data are consistent and show a low level of live load stress in the stirrups for the given load spectrum. Pages 101�106 of SPR 350 present a fatigue analysis based on the measured stirrup stresses. The analysis shows that high-cycle fatigue5 is not even close to being a problem in the stirrups. The committee believes that this is an extremely important finding that would not have been possible without the extensive measurement and testing done on this project. The reduction of the data carried out to find the percentage of live load shear resisted by the stirrups has led to confusing and contradictory results. On page 83 of SPR 341, it is concluded that 58% of the live load shear was resisted by the stirrups. But Table 2.9d on page 113 of SPR 350 shows that the stirrups resisted from 10.5% to 34.4% of the live load shear. This wide variation causes statements about the percent of live load shear resisted by the stirrups to be somewhat meaningless. The fraction of shear resisted by the stirrups appears to be quite variable. The first sentence on page 80 of SPR 341 states, �Distribution of shear across the four girders � was inferred from the measured stirrup strains.� Without a known relationship between beam shear and stirrup strain, this inference cannot be made. The committee believes that the information in SPR 341 and SPR 350 concerning shear distribution to the girders in these bridges should not be used as a justification for a less conservative distribution of shear than that specified by national bridge standards. Page 118 of SPR 350 and page 83 of SPR 341 discuss the dead load and combined load stress in the stirrups. It is assumed that the percentage of the dead load shear resisted by the stirrups is the 5 High-cycle fatigue refers to stress ranges and loadings simulating millions of passages of fatigue design vehicles.

13
same as that for live load. The wide variation in the percentage resisted by live load makes this assumption unrealistic. Even without that variation, the committee would question the use of the same percentage for dead load and live load. Other than determination of material properties and characteristics, the committee believes that the collection of the data from the in-service bridges was well planned and well executed. The measurements of stirrup stresses under load and the nature of ambient traffic loads were especially valuable. Laboratory Testing6 An extensive laboratory testing program was conducted to evaluate the behavior of large, lightly reinforced concrete girders, intended to simulate the reinforced concrete deck girder bridges of 1950s vintage. It is clear that the work was executed with great care, and detailed information is presented. Some aspects of the laboratory study were valuable and pioneering, such as the moving load experiments detailed in Appendix B of SPR 350. The test program included 44 test girders of the same size but with differing reinforcement details selected to represent the SPR 341 database. Girder flange widths were substantially less than the effective flange widths in the actual bridges. Average concrete strength at test was around 30% higher than the original concrete strength specified for the bridges. All reinforcement was modern deformed bars with higher yield points than the specified minimums in the bridges. Few cores and no coupons were used to verify the prototype material ranges. Most girders were tested with fixed-point loading, although a highly creative subseries simulated the effects of moving load. Detailed documentation was presented concerning cracking, crack deformations, steel strains, and other structural parameters. The testing was carried out well. Initial diagonal cracking occurred at average concrete shear stress similar to that specified for service load by AASHO in the 1944�1973 period. The tests showed conclusively that high-cycle fatigue failures of the stirrups are unlikely. The committee believes that this is extremely important as long as ODOT continues to limit overloads. The committee could not conclusively determine whether low-cycle fatigue under elevated loads is an issue because of the lack of sampling and testing of the actual material properties, as discussed previously. Considerable reserve strength between first diagonal cracking and failure was observed. However, the committee cautions that this may not be true in the field because of the improved materials used in the laboratory test specimens. Of major concern to the committee was the fact that the crack patterns at ultimate limit state of the test specimens with stationary load differed greatly from the crack patterns at service limit state in the bridges in the field. This raises the question of how well the laboratory tests reflect field conditions. Lack of a clear understanding of the mechanism 6 See Attachment 2 for an expanded discussion of laboratory testing.

14
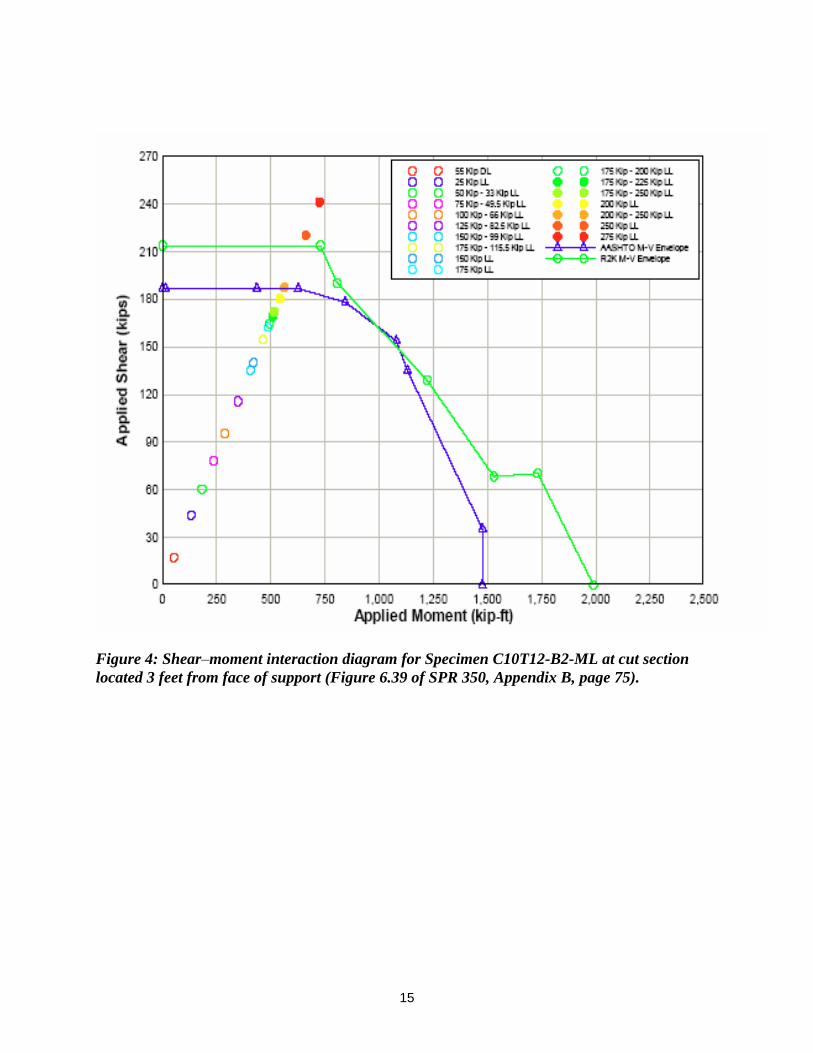
responsible for the often steep cracking in the field is a significant concern. The laboratory test results were compared with three analytical models: ACI, R2K, and MCFT. The authors of the reports did not clearly indicate that the ACI method is thought of as a 5% fractile (lower bound) model, while R2K and MCFT are best fit (mean) models. Good agreement was generally found, with ACI being more conservative. The committee believes it extremely desirable that the laboratory tests be validated by testing one or two highly deteriorated bridges to failure in the field or by testing major components from an existing bridge in a laboratory. Anchorage Details The committee found serious deficiencies in spot checks of the analytical results for several specimens presented in SPR 350. Such deficiencies greatly damaged the committee�s confidence in relying on the heavily computerized OSU methodology for determining the remaining strength in the girders. The authors of SPR 350 make frequent use of interaction diagrams showing the relation between shear and moment at various cut sections along the span of a girder. An example is shown in Figure 4. This figure indicates the relationship between shear and moment for a given specimen at a section 3 feet from the face of a support. It indicates that for 0 kips applied shear, the moment capacity would be about 1,480 kip-feet according to the AASHTO specifications MCFT and about 2,000 kip-feet as predicted by the sophisticated computer program R2K. This 35% discrepancy in a relatively simple computation (the pure moment capacity of a girder cross section) is totally unacceptable and is not characteristic of these two analytical procedures. They have been shown to be good predictors of the shear and moment capacity of concrete girders. These differences raised basic questions about the accuracy of the input to these programs. Much more seriously, the predicted pure moment capacity of the same girder cross section 3 feet from the support is shown in Figure 5 as 760 kip-feet or only 51% or 38%, respectively, of the OSU-provided values obtained by MCFT or R2K. The values shown in Figure 5 are based on consideration of the amount of reinforcement actually present and developed in the short distance from the support. Committee calculations indicated Figure 5 to be reasonable. Apparently, this tailoring of the available flexural steel was not correctly considered in the MCFT or R2K programming. This serious discrepancy destroys the committee�s confidence in the reliability of the interpretation of the results when reinforcement development is an important factor. Such complex approaches as proposed by OSU are not recommended for load rating methods for bridges with highly varied reinforcement detailing. Consideration of reinforcement anchorage and development is an essential component of any assessment methodology. While it is included in Steps 8 and 10 of the methodology for field data collection listed in SPR 350, Appendix C-4, page 4, it is not sufficiently detailed for application. Certainly, one factor should be a determination of the adequacy of reinforcement deformations in bridges built before ASTM A305�type deformations were universally adopted. Other factors include the determination of effective cross-sectional area of reinforcement at a
15
Figure 4: Shear�moment interaction diagram for Specimen C10T12-B2-ML at cut section located 3 feet from face of support (Figure 6.39 of SPR 350, Appendix B, page 75).

16
Figure 5: ACI 318-02 moment capacities and dowel steel cross-sectional area at simply supported ends of the Springfield Bridge and Specimen C10T12-B2-ML (Figure 3.7 of SPR 350, Appendix B, page 18).

17
section; reinforcement development; and consideration of the effects of hooks, cutoff bars, and, if applicable, bars without modern deformations. Satisfying National Standards for Load Rating7 The committee is extremely concerned that the reliability-based assessment methodology presented in Chapter 5 of SPR 350 does not include many aspects that are essential components of basic AASHTO standards for load rating and design. As a result of discussions with the committee at its meetings, ODOT staff and the OSU authors indicated that they recognized that the assessment methodology presented in Chapter 5 might be better used for prioritization of repairs than as an assessment of adequacy. However, the charge to this committee is to review the report as submitted, and therefore the following comments refer to the adequacy of the SPR 350 method as an assessment methodology. OSU�s assessment methodology (shown graphically in Figure 6) uses a reliability index (β), a standard deviation determined from the variance in the experimental program of the girder tests (σ), the AASHTO 99 (MCFT)8 nominal capacities for shear and moment, and a series of load effects that incorporate rating vehicles and WIM9 traffic data. In Figure 6, a sloping line is shown projected from the controlling load effect (greatest combination of shear and moment at a section as determined from analysis of the unfactored load on the bridge). The slope of this line represents the rate at which the load effects would increase if all axle weights were increased at a constant value. Where this line intersects the average moment-shear interaction curve (based on AASHTO-MCFT nominal capacity increased by the average overstrength found in the experimental girder tests) is taken as the midpoint for the normal distribution curve shown. The difference between this midpoint and the controlling load effect is measured in multiples of the standard deviation as determined in the girder tests. This gives the value of (β), that the OSU investigators initially claimed could be related to probability of failure. No load factors or resistance factors are explicitly included and the average strength is greater than the AASHTO-MCFT nominal strength. However, OSU�s brief period of traffic data collection did not gather a true record of the in-service loadings of an unrestricted mix of truck traffic. The limited traffic record, combined with a load factor of 1.0, will yield an unconservative assessment rating. The use of reliability-based principles by the OSU research team is impressive as a research contribution. However, a number of serious questions and omissions concerning the methodology presented are detailed in Attachment 3, and the committee believes that the methodology is not ready for immediate implementation. Major concerns of the committee include failure of the methodology to treat loads and resistances as time-dependent variables, to quantify the effect of cracking on reliability, to address the development of the reinforcement, to explain crack development in the field, and to consider objective and subjective uncertainties including imperfect modeling.
7 See Attachment 4 for an expanded discussion of the general approach to satisfy national standards for load rating. 8 Legend inside Figure 6 indicates nominal capacity is based on AASHTO 99 while SPR 350, p. 35 indicates nominal capacity is based on AASHTO LRFD 2003. 9 See Attachment 5 for an expanded discussion of the methodology for application of WIM data and MCFT and Response-2000.

18
Figure 6: Illustration of how the reliability index is calculated (Figure 5.29 of SPR 350).

19
The assessment methodology as presented relies on statistical scatter of resistance determined largely from the laboratory tests. It is questionable whether such measures of scatter are representative of the variations associated with the uncertainties characterizing the aging bridges in the field. Any assessment methodology to determine the adequacy of and suggest ways to remedy deficiencies in the existing bridges must be in harmony with the established national standards for load rating. Certainly, means and methods can differ, but the overall process must ensure a level of safety at least commensurate with that specified by the Guide Manual for Condition Evaluation and Load and Resistance Factor Rating (LRFR) of Highway Bridges (AASHTO 2003). An expanded discussion of the key elements that should be considered in developing reliability indices for load rating is given in Attachment 3. If the basis for the decision process is to follow AASHTO specifications, load and resistance factors must be used. The values assigned to these factors must be derived on the basis of all the uncertainties in resistance and loading. Both objective and subjective uncertainties must be included. The objective uncertainties must include inherent randomness, and the subjective uncertainties must include imperfect modeling and estimation. Imperfect modeling is an important aspect of this project. Predictions concerning the performance of damaged bridges made on the basis of limited experimental results may be inaccurate. It is believed that for these particular bridges the uncertainties associated with such predictions may be significant. Evaluation of Some Aspects of Assessment Methodology10 Detailed comments on the OSU assessment methodology are given in Attachment 5. They indicate a number of deficiencies. It is clear from the current national standards for load rating that determination of strength capacity should include consideration of φc (condition factor) and φs (systems factor), as well as the φ factor that is the resistance factor specified by LRFD for the various actions. The committee is highly concerned that the proposed OSU assessment methodology does not explicitly include these factors and does not give ODOT guidance on how they could be included. Similarly, the assessment methodology proposed in Chapter 5 does not address the load factors, γ, required to extend proper consideration for rogue overweight trucks, future increases in legal limits, and such time-dependent factors. These omissions are serious shortcomings of the methodology. The committee was also concerned that the assessment methodology did not consider the possible effects of corrosion of reinforcement as a variable with time and spatial location. Comments made by governmental representatives at open committee meetings indicated that some believed corrosion would not be a problem at all. Others indicated that the low incidence of apparent corrosion to date may not be indicative of the future. It was indicated that in some mountainous regions deicing chemicals were now being used, and entry of chlorides into cracks
10 See Attachment 3 for an expanded discussion of OSU�s methodology recommendations.

20
might begin corrosion. This indicates the need to consider time and spatial variability effects carefully in any assessment technology. The use of reliability-based principles by the OSU research team is impressive. ODOT should be commended for funding such a monumental research program. The reliability index concept must be carefully utilized. In normal operating procedures the use of reliability indices to raise or lower weight restrictions has not been justified. It is recommended that ODOT require the research team to provide a summary of recommendations clearly indicating changes and deviations from the AASHTO load rating procedures in use by ODOT and FHWA, as well as specifications for the proposal. The summary will help future readers, engineers, and citizens understand through a clear paper trail how and why bridges will be strengthened, replaced, or left as they are. This section should be a �live� document that could be updated as future OSU/ODOT research becomes available. In conclusion, I want to express my thanks and the thanks of the members of the committee and its staff for the cooperation that you and the other members of the ODOT staff extended to us during this project. Sincerely,
John E. Breen, P.E. Chairman, TRB Committee for Review of the Oregon Department of Transportation Study on Bridge Shear, Project Number SAIS-P-04-02-A Attachments 1. Definitions and Acronyms 2. Expanded Discussion of Laboratory Testing 3. Expanded Discussion of OSU�s Methodology Recommendations 4. Expanded Discussion of the General Approach to Satisfy National Standards for Load Rating 5. Expanded Discussion of the Methodology for Application of WIM Data and MCFT and
Response-2000 6. References 7. Roster of the Committee for Review of the Oregon Department of Transportation Study on
Bridge Shear

21
Attachment 1
DEFINITIONS AND ACRONYMS Various documents and codes offer terminologies that are standardized across the nation. The following definitions and brief descriptions are provided for convenience: AASHO: American Association of State Highway Officials (old name of AASHTO). AASHTO: American Association of State Highway and Transportation Officials. ACI: American Concrete Institute. Bias: The ratio of mean to nominal value of a random variable. Bridge management system (BMS): A system designed to optimize the use of available resources for the inspection, maintenance, rehabilitation, and replacement of bridges. Calibration: A process of adjusting the parameters in a new standard to achieve approximately the same reliability as in a current standard or specification or to achieve a target reliability index. Condition rating: The result of the assessment of the functional capability and the physical condition of bridge components by considering the extent of deterioration and other defects. COV: Coefficient of variation, an attribute of a distribution: its standard deviation divided by its mean. COVR: Coefficient of variation of resistance (= σR/λR). FHWA: Federal Highway Administration. fc': Compressive strength of concrete. fy: Yield strength of reinforcing steel. Inventory level rating: Generally corresponds to the rating at the design level of reliability for new bridges in the LRFD Bridge Design Specifications but reflects the existing bridge and material conditions with regard to deterioration and loss of section. kip: 1,000 pounds. ksi: Kips per square inch. Load factor (γ): A multiplier accounting for the variability of loads, the lack of accuracy in

22
analysis, and the probability of simultaneous occurrence of different loads. Load rating: The determination of the live load�carrying capacity of a bridge. LRFD: Load and resistance factor design, a bridge design method that incorporates state-of-the-art analysis and design methodologies with load and resistance factors that are based on the known variability of applied loads and material properties and are calibrated from actual bridge statistics to ensure a uniform level of safety. LRFR: Load and resistance factor rating, a rating system for bridges contained in AASHTO�s Guide Manual for Condition Evaluation and Load Resistance Factor Rating (LRFR) of Highway Bridges. MCEB: AASHTO Manual for Condition Evaluation of Bridges (1994). MCFT: Modified Compression Field Theory, first developed in 1986 to predict the nonlinear behavior of cracked reinforced concrete membrane elements and later incorporated into the AASHTO LRFD Bridge Design Specifications. National Bridge Inspection Standards (NBIS): Federal regulations establishing requirements for inspection procedures, frequency of inspections, qualifications of personnel, inspection reports, and preparation and maintenance of bridge inventory records. The NBIS apply to all structures defined as bridges located on or over all public roads. NCHRP: National Cooperative Highway Research Program. Nominal resistance: Resistance of a component or connection to load effects, based on its geometry, permissible stresses, or specified strength of materials. NRC: National Research Council, a private, nonprofit institution that is the principal operating agency of the National Academies in providing services to the government, the public, and the scientific and engineering communities. ODOT: Oregon Department of Transportation. Operating level rating: Absolute maximum load level to which a structure may be subjected for limited passages of the load. Generally corresponds to the rating at the Operating level of reliability in past load rating practice. OSU: Oregon State University. PI: Point of inflection, the longitudinal station on a deflecting beam where the curve of its longitudinal axis changes its direction of curvature. Posting: Signing a bridge for load restriction.

23
psi: Pounds per square inch. R: a random variable representing the resistance; resistance distribution. Reliability index: A computed quantity defining the relative safety of a structural element or structure expressed as the number of standard deviations that the mean of the margin of safety falls in the safe side. Resistance factor (φ): A multiplier accounting for the variability of material properties, structural dimensions, and workmanship, and for the uncertainty in the prediction of resistance. Response-2000 (R2K): A computer program that calculates the strength and ductility of a reinforced concrete cross section subjected to shear, moment, and axial load. All three loads are considered simultaneously to find the full load deformation response based on the MCFT. RF: Rating factor. Strength limit state: Safety limit state relating to strength and stability. Target reliability: A desired level of reliability (safety) in a proposed evaluation. TRB: Transportation Research Board. Vc: Cracking shear capacity. Vn: Nominal shear capacity. Vs: Shear capacity contributed by the web reinforcement working as part of a truss model. β: Safety or reliability index. βT: Target reliability index. γ: Load factor; a multiplier accounting for the variability of loads, the lack of accuracy in analysis, and the probability of simultaneous occurrence of different loads. λ: Normal mean of the bias values. λR: Normal mean of the bias values for the resistance. vc: Shear stress of concrete. σR: Standard deviation of the resistance R. φ: Resistance factor; a multiplier accounting for the variability of material properties, structural dimensions, and workmanship, and for the uncertainty in the prediction of resistance.

24
Attachment 2
EXPANDED DISCUSSION OF LABORATORY TESTING
The test program included 44 test girders of identical size and cross-sectional shape, but with different reinforcement details selected on the basis of the bridge database cited in SPR 341. Each test girder was built from a precast rectangular beam 14 inches wide and 42 inches deep, topped by a composite flange slab 36 inches wide and 6 inches thick, representing a portion of the bridge deck. Details of the Jasper Bridge in Report SPR 350 indicate the decks to be composite with the longitudinal girders and having the stirrups anchored in the deck. Thus the girders should work as T-beams and the flange could contribute to shear capacity. The committee noted that the flange width of the test girder was considerably less than the effective flange width of a prototype girder in the field. The reduced flange width could have affected the behavior and shear capacity of the test girder. If the laboratory results are to be used as the basis for assessing prototype girders in the bridges, it would be advisable to conduct a few validation tests with specimens that have a flange width consistent with the effective flange widths of the girders in the bridges. During the fabrication of the test girders, attempts were made to develop concrete mixtures that would replicate the concrete strength (3,300 psi) originally specified for the bridges. However, the 28-day concrete strength of the test girders was 3,790 psi, more than 10% higher than the target strength. At the time of test, the concrete strength of the test girders ranged from 3,290 to 5,495 psi, with an average of 4,330 psi and a standard deviation of 540 psi. Thus, the test girders had concrete strengths well above the original design strength. Similar disparities exist with regard to the properties of the reinforcement. According to the original design specifications, all reinforcement used in the prototype girders was intermediate grade with a minimum yield stress of 40 ksi and a tensile strength between 70 and 90 ksi. No verification was made of the actual deformations of the reinforcing bars in the prototypes. Since some of the bridges were built before modern deformations were required, the bars used in the test girders may have substantially better anchorage characteristics than those in some of the actual bridges. However, for the test girders, all stirrups were made from #4 bars of Grade 40 (fy = 50.7 ksi), and the flexural reinforcements used #11 bars of Grade 60 (fy = 71.2 ksi) and #6 bars of Grade 60 (fy = 63.7 ksi). Other miscellaneous reinforcement used #4 bars of Grade 60 (fy = 64.4 ksi). Unfortunately, concrete cores were taken only from one bridge in the field that indicated an average compressive strength of 4,500 psi with a standard deviation of 1,065 psi. There was no reported attempt to secure reinforcement samples in the field to determine the properties of in-service reinforcement, especially the flexural reinforcement�s deformation characteristics and the yield stress of prototype stirrups. In all likelihood, the concrete and reinforcement used in the test girders were stronger than the corresponding materials in the prototype bridges. This argues for conservative interpretation of the test results.

25
While it should be valid to use these material properties to evaluate the accuracy of analytical models for strength assessment of the test girders, application of such techniques to the actual bridges must carefully consider the anchorage details and characteristics of the reinforcement. During the test, extensive instrumentation was used for measurements of concrete and steel strains, diagonal crack widths and displacements, and member rotations and displacements. Test parameters included two types of test specimens (T and inverted T), different stirrup spacing, anchorage and flexural bar cutoff details, and debonded stirrups. Different types of loading were used, including static (for control tests), low-cycle fatigue (LCF),11 high-cycle fatigue after initial diagonal cracking, and simulated moving load. Specimens with a 6-inch stirrup spacing performed exceedingly well under both static and LCF loadings. Three specimens failed under static load in flexure rather than in shear. One specimen under LCF loading survived the test without failure. Two other specimens under LCF loading failed in shear only after the stirrups were intentionally cut to simulate loss of stirrups. On the other hand, specimens with 10-inch or wider stirrup spacing failed mostly in shear, and a few in shear combined with flexural reinforcement anchorage failure, particularly when the specimens were tested as inverted T-beams. The test results confirm design deficiencies due to large stirrup spacing and insufficient anchorage of flexural reinforcement. On the basis of all the static control tests, initial diagonal cracking occurred at an average concrete shear stress of Vc = 1.4 √fc'. For fc' in the range of 3,000 to 5,000 psi, 1.4 √fc' is nearly equal to 0.02 fc', which is the specified allowable shear stress according to the AASHTO codes in use from 1944 to 1973 for beams without web reinforcement and unanchored longitudinal bars. Neither low- nor high-cycle fatigue caused any damaging effect to the strength of the test girders unless the load levels for the fatigue cycles were considerably higher than what could be expected in the field. Bond slip at the stirrup�concrete interface was observed under high-cycle fatigue. However, tests on specimens with fully debonded stirrups showed only a slight reduction in capacity in comparison with similar specimens with fully bonded stirrups. The careful instrumentation of stirrup strains in the test girders subjected to both low- and high-cycle fatigue confirmed field measurements indicating that fatigue failure of the stirrups is unlikely. For all test specimens, the maximum applied shear Vapp in each case exceeded the shear corresponding to the diagonal cracking Vcr by a substantial margin, more than 200% in most cases. This suggests that considerable reserve strength exists in each test girder after the initial diagonal cracking occurs. This may not be true, however, for the bridges in the field because the materials used in the test specimens were considerably stronger than those used in the field. A major reservation of the committee with regard to the interpretation of the test results concerns the assessment methodology. The OSU report correctly points out (on page B-91) that there are three useful procedures: 11 Low-cycle fatigue refers to very elevated stress ranges (near ultimate capacity) repeated tens or hundreds of times.

26
• ACI 318-02 or ACI, • Response 2000 or R2K, and • AASHTO LRFD or Modified Compression Field Theory (MCFT).
However, it is not clearly recognized in the report that the general goal of these methods is not the same. The ACI 318-02 procedure is supposed to give a conservative capacity evaluation similar to a 5% fractile. When it was first adopted, it was thought to be an approximate lower bound. On the other hand, both R2K and MCFT are intended to be reasonably accurate predictors of the nominal capacity and thus would give a mean capacity evaluation similar to a 50% fractile. These are substantially different. The recorded crack patterns of the test specimens with stationary load (Figure 3.12 and Appendix A3 of SPR 350) are typical of what would be observed in the laboratory for shear and flexural failures. However, compared with the crack patterns mapped in the field (Figures 2.6a�2.6d, 2.18a�2.18g, and 2.33a�2.33e), there are substantial differences. This calls into question how well the laboratory tests with carefully prepared specimens represent the conditions of the in-service bridge girders. SPR 350 correctly points out that laboratory tests with stationary load, whether static or cyclic, produce constant shear-to-moment ratios. This type of loading differs from that experienced by actual bridge girders, which are subjected both to stationary dead loads and to moving loads due to traffic. To examine the effects of moving load, five specimens were constructed. The specimens reflected the design details of the Springfield Bridge, one of the four bridges tested in the field. The results of the moving load test series were compared with the predictions of three analytical models that are based on stationary load: ACI, R2K, and MCFT. The comparisons indicate that R2K might overpredict the shear�moment capacity of the test girders at times, while MCFT provided a conservative estimate and the ACI value was overly conservative, as would be expected for a 5% fractile predictor. SPR 350 acknowledges that the crack patterns of the test girder produced by stationary loading are distinctly different from the crack patterns observed in the field and suggests that cracks on girder specimens subjected to moving loads would become more vertically oriented and more widely spaced, as found in the bridge girders in the field. However, the suggestion is not substantiated by the experimental evidence from the moving load tests. The experimental evidence shown by the laboratory tests is at the ultimate limit state, whereas what is observed in the field is at service limit state. The obvious difference between the crack patterns observed in the field and that produced in the laboratory testing remains a major concern to the committee. Without a clear understanding of the mechanism responsible for the occurrence and propagation of the vertical and inclined cracks in the bridges, it is questionable whether the laboratory tests are reproducing the field conditions with enough accuracy. The committee believes that it would be desirable to validate the laboratory tests by testing one or two highly deteriorated bridges in the field (or by removing girders from such a bridge for laboratory testing) to assess their performance and residual strength.

27
Attachment 3
EXPANDED DISCUSSION OF OSU�S METHODOLOGY RECOMMENDATIONS
Before the OSU analysis is used, careful consideration must be given to the choice of an appropriate beta (β) and phi (φ). In discussions with the committee, the OSU research team indicated that the main use for its beta calculation with an accompanying phi = 1.0 is for a prioritization system. The national codified approaches are based on large populations of data, as illustrated in SPR 350, Figure 5.29, and yield phi values less than 1.0. According to Allen (2004), various sources of uncertainty can be approximated by a single bias term (λ) and a single coefficient of variation (COV). Complex techniques are used for this combination of data, but they can be simplified as shown below. λR = λ1 × λ2 × λ3
23
22
21R COVCOVCOVCOV ++=
The above technique was also discussed by Allen et al. (2004), who state that �other sources of uncertainty�. could be used to modify the total coefficient of variation ... for the dataset.� These are necessary in considering the massive population of data captured by OSU. Allen also advises that combining some spatial and systematic error �is generally conservative in nature.� Another reference to this is his caution that laboratory specimens do not have �the same size� or �the same frequency�; therefore ODOT should be cautious in using these results. Moses (2001) cautions that ratings based on betas must be appropriately managed. The authority should maintain consistency between any risk-based evaluation methodologies and the LRFD specification. This must be completed only after the OSU methodology is adjusted to account for the different failure modes at a given time in the future. Specifically time-dependent variation (i.e., reliability index profiles) must be developed for the cracked structures. Before the OSU SPR 350 methodologies can be applied by ODOT, the following main concerns must be addressed:
1. The methodology assumes load as a deterministic discrete value. Bridge loading must be treated as a random variable. 2. The methodology uses an annual reliability index as the main indicator of structural performance. This is clearly a serious limitation, since structural reliability is time dependent and for deteriorating bridges is decreasing with time. Consequently, the results presented on the basis of an annual reliability index are not conservative. 3. The time-dependent aspect of load and resistance is not explicitly taken into account (see also Item 2). Load is generally increasing with time and resistance is decreasing. The

28
effects of other environmental factors such as corrosion and temperature are not considered. Concepts and methods of probability are the proper bases for reliability-based assessment and service life prediction of deteriorating structures. There are extensive studies on reliability-based assessment and service life prediction of deteriorating structures. Most of these studies were published during the past decade. 4. The effect of diagonal-tension cracks on the reliability is not clearly quantified. 5. As mentioned in the report (page 293), because of the actual shape of the loading history the controlling load effect for capacity may be some intermediate value between the extremes (i.e., maximum shear versus corresponding moment, or maximum moment versus corresponding shear). This was acknowledged but not investigated. For this reason, the results presented may not be conservative. 6. The differences between the moment�shear interaction diagrams obtained by AASHTO-MCFT interaction and Response-2000 are extremely large in the regions of low shear and high moment. The committee noted major discrepancies between methods of computing moments that suggested that development of reinforcement may not have been consistently treated in inputs to computerized analyses. This aspect must be further investigated. 7. The methodology for calculating the reliability index is based on several simplified assumptions (normal distributions, deterministic loading, constant standard deviation of the interaction diagram in all points, perfect correlation between shear and moment, among others). Some of these assumptions could be conservative and others not conservative. It is not clear whether the overall contributions of these simplified assumptions produce a much lower or higher reliability than the reliability index computed. This is a major concern. 8. It is not clear that the laboratory tests are reproducing the field conditions with enough accuracy. To investigate this aspect, the mechanism responsible for the occurrence and propagation of the vertical and inclined cracks in the Oregon bridges must be better understood. 9. Rating factors and reliability indices are not perfectly correlated. In fact this correlation can be low. This was demonstrated in several recent studies. Since the information provided in Chapter 5 has potential use for risk ranking as a bridge management tool, careful consideration should be given in establishing the basis for the decision process.
If the basis for the decision process is to follow AASHTO specifications, load and resistance factors must be used and the corresponding γ and φ must be derived. These factors must be based on all uncertainties in resistance and loading. Both objective and subjective uncertainties must be included. The objective uncertainties must include inherent randomness, and the subjective uncertainties must include imperfect modeling and estimation. Imperfect modeling (traffic, strength, and deterioration due to environment and fatigue) is an important aspect of this project. Predictions concerning the performance of damaged bridges made on the basis of limited experimental results may be inaccurate. It is believed that for these particular bridges the uncertainties associated with such predictions may be significant. If the basis for the decision-making process is the reliability index, both objective and subjective uncertainties must be included in deriving the index. All the concerns listed above must be addressed, and subjective uncertainties must be included. In addition, the target reliability index must take into account economic and other constraints.

29
The use of reliability-based principles by the OSU research team is impressive as a research contribution but is not ready for immediate implementation. ODOT should be commended for funding such a monumental research program. The use of betas must be carefully scrutinized. In normal operating procedures the use of betas to raise or lower weight restrictions has not been justified. It is recommended that ODOT require the research team to provide a summary of recommendations clearly indicating changes and deviations from the AASHTO load rating procedures in use by ODOT and FHWA. This summary will help future readers, engineers, and citizens understand through a clear paper trail how and why bridges will be weight-restricted, strengthened, replaced, or left as they are. This section should be a �live� document that can be updated as future OSU/ODOT research becomes available.

30
Attachment 4
EXPANDED DISCUSSION OF THE GENERAL APPROACH TO SATISFY NATIONAL STANDARDS FOR LOAD RATING
The U.S. bridge engineering profession is currently moving from one bridge design specification, the AASHTO Standard Specifications for Highway Bridges (AASHO 1957; AASHO 1961; AASHTO 2002), to a newer, more sophisticated one, the AASHTO LRFD Bridge Design Specifications (AASHTO 2004). The Federal Highway Administration and AASHTO decided that all federal-aid bridge designs after October 2007 must be in accord with the latter specification. �LRFD� stands for load and resistance factor design. The newer specification is quite similar to the old, with the exception that the load and resistance factors used in the new code are more rationally derived. The theories of structural reliability are used to calibrate the load factors, γ�s, and resistance factors, φ�s, of the LRFD specifications, to yield an appropriate level of safety associated with the target reliability index, βT. The target reliability indices are chosen on the basis of the levels of safety inherent in past successful practice represented by the Standard Specifications. The Standard Specifications are not calibrated to yield consistent reliability or safety because the principles used today to accomplish this calibration were not available when it was developed. The various load and resistance factors were chosen on the basis of experience with the goal of yielding adequate safety. Bridge components designed in accordance with the Standard Specifications, while safe, are not uniformly safe. In other words, the inherent reliability indices do not cluster around a single value but represent a wide range. By using modern reliability methods to assess and study these inherent reliability indices, more consistent target reliability indices can be chosen. Recent studies (Moses and Verma 1987; Moses 2001; Liu et al. 2001; Paikowsky et al. 2004) suggest that the target reliability index for redundant and nonredundant members must be different. Taken together, the load factors, γ�s, and resistance factors, φ�s, of the LRFD Bridge Design Specifications provide a consistent level of safety. If either the load factors or the resistance factors are changed, the reliability index changes. Thus, the load factors or the resistance factors alone have little significance. Only within the context of each other do they have meaning and produce a certain reliability index. For example, the LRFD load factor of 1.25 for dead load has no particular significance by itself. However, comparing this factor with the LRFD load factor of 1.75 for live load suggests that the uncertainty of the live load is much greater than that associated with the dead load. Thus, for load factors more uncertainty means a higher load factor, while for resistance factors more uncertainty means a lower resistance factor. The theories of structural reliability can also be used to compare designs. If the load factors are held constant, resistance factors greater than the code-specified values produce reliability indices lower than those inherent in the code and subsequently yield lower safety. Conversely, resistance factors lower than the code-specified values yield greater safety. The consequence of failure or exceeding set criteria must also be considered before the selection of a beta for each bridge component. In concrete design, the selection of a βT for a more ductile flexural failure versus a more brittle shear failure has been and will continue to be the subject of much debate.

31
Code recommendations to date are LRFD (Inventory) with a beta of 3.5 and LRFR (Operating) with a beta of 2.5 (see AASHTO 2003, Section 6.1.3). The Guide Manual for Condition Evaluation and Load and Resistance Factor Rating (LRFR) of Highway Bridges (AASHTO 2003) states its purpose in Section 1.1 as follows:
This Manual serves as a standard and provides uniformity in the procedures and policies for determining the physical condition, maintenance needs, and load capacity of the nation�s highway bridges.
The scope is stated as follows:
This Manual has been developed to assist Bridge Owners by establishing inspection procedures and evaluation practices that meet the National Bridge Inspection Standards (NBIS). The manual has been divided into nine sections, with each section representing a distinct phase of an overall bridge inspection and evaluation program.
After the initial deployment of the combined guidelines in 1989, researchers began to further study and refine the load and resistance factors so as to achieve uniform reliability. The initially selected load factors and capacity reduction factors were a starting point that has allowed the natural migration into a reliability-based approach with data points for individual materials and construction techniques. Load and resistance factors, as specified in the LRFR and LRFD codes, were developed to achieve a uniform reliability index, regardless of material type or fabrication methods. Researchers and code writers will continue to refine these factors as more statistical data from load tests and measurements are collected and recorded. The LRFR methodology includes load factors for design load rating, legal load rating, and permit load levels. The nominal resistance is determined in accordance with the LRFD code for all three types of load, which account for different densities of truck traffic. The condition factor (φc) and safety factor (φs) are reduction multipliers that are then applied to the LRFD resistance factor to account for unique conditions. The OSU research included efforts to confirm the LRFD nominal resistance methodology, but the proposed OSU methodology does not explicitly include these φ factors. The LRFR methodology includes an alternative analysis incorporating the use of the allowable stress and the load factor utilizing the Standard Specifications for Highway Bridges (AASHTO 2002). These alternative load rating methods are based on previous bridge inspection and evaluation experience summarized and revised in a series of NCHRP studies, AASHTO manuals, and FHWA publications between 1985 and 2005 (see Estes and Frangopol 2005; AASHTO 1989; AASHTO 1994; AASHTO 2003; Moses and Verma 1987).

32
Attachment 5
EXPANDED DISCUSSION OF THE METHODOLOGY FOR APPLICATION OF WIM DATA AND MCFT AND RESPONSE-2000
During the meetings held with ODOT personnel and the OSU research team, the question of the use of appropriate resistance factors (φ) was discussed. The section of this letter report titled �Laboratory Testing� discusses the modeling techniques and indicates examples of the bias and mean associated with various parameters. This issue must be considered when an authority or jurisdiction is required to comply with FHWA bridge inspection and reporting rules, as discussed in the section of this report titled �Satisfying National Standards for Load Rating.� The committee believes that several issues, in addition to those specified in the body of this report, must be addressed by ODOT before the methodology can be utilized. The reliability analysis procedure should be reviewed to ensure inclusion of a proper statistical evaluation for the bias and coefficient of variation (COV) of the beam resistance and the design loading utilized. Determination of these statistical parameters is necessary to ensure that the required reliability index is achieved in the evaluation of the existing bridges. The determination of the overall structural reliability index is also interdependent not only with the statistical evaluation of corresponding resistance and design loading but also with the use of appropriate load factors and resistance factors. SPR 350 indicates that an Oregon-specific load spectrum could be used to evaluate the existing bridges on the basis of data collected from truck traffic and experimental testing. Utilization of collected data for the design loading would require a statistical analysis to determine the appropriate bias and COV for this loading for use in the reliability analysis. The third paragraph on page 275 of the report states:
Therefore, in the following reliability assessment of 1950�s vintage conventionally reinforced concrete deck girder bridges, MCFT is used to predict capacity, and the load demand used in the analysis will be Oregon-specific. Note that instead of treating load as a random quantity using a statistical distribution (which is the goal for future work) it is treated as a discrete value in this reliability analysis using MCFT. The key to the study is that random quantities will be characterized consistently using statistical measures of central tendency (mean) and dispersion (standard deviation) between all examined bridge sections and β will be treated in a truly relative sense.
The above quotation is difficult to understand because there is little explanation of the loading OSU has used in the adjacent lanes. This traffic simulation model may not be based on codified procedures and therefore could yield a lower reliability than specified in the AASHTO load rating procedures.

33
The fourth paragraph on the same page states:
The information collected for the load and resistance has potential use for risk ranking as a bridge management tool. Risk ranking allows the comparison of bridges by evaluating bridges with a conditional probability (developed by Stewart and Val (1999)) that reflects relative frequency of overloads, years in service, inspection information, and consequence of failure (where the consequence of failure is similar for all bridges considered so risk-ranking is appropriate) (Stewart, et al., 2002). Thus, risk ranking is an area for possible application of the load spectrum developed herein.
The committee believes that a method that has potential for relative risk ranking may not be appropriate as an assessment methodology. Some consideration should also be given to overload vehicles not captured in the study and to future design load needs. Table 5.1 of SPR 350 should be clarified as to what statistical analysis is being conducted at any time during the assessment process. In addition, any statistical analysis based on experimentally collected data should incorporate the bias and COV of the experimental procedure to produce a combined bias and COV for the design loading. The bridges were designed and constructed in the 1950s with the materials and construction technology available at the time. The experimental data in Table 6.1 (page B-91) provides a statistical analysis of the measured beam shear tested using a moving load pattern versus the predicted shear capacity from the ACI, R2K, and MCFT methods. The results from the beam shear test data and design loading should be incorporated in a closed-form solution for the appropriate φ factor to be used with the selected shear capacity method. The closed-form equation for computing φ is Equation 10 in NCHRP Report 507 (Paikowsky et al. 2004). A parametric study was conducted on the basis of the statistical data from Table 6.1 (page B-91) for the resistance bias and COV. Resistance bias and COV should also be combined with the bias and COV of the experimental method used in determining the measured applied loads. For the design load parameters, the LRFD load factors, bias, and COV have been used, since they are well documented (Akgul and Frangopol 2004). On the basis of these input parameters, the appropriate φ factors to be used with each of the shear capacity equations for a reliability index of 2.5 and 3.5 are shown in the table below.
Inventory Level Rating : Phi Factors Operating Level Rating: Phi Factors Beta = 3.5 (LRFD) Beta = 2.5 (LRFR)
LF for DL = 1.25 LF for LL = 1.75
LF for DL = 1.25 LF for LL = 1.35
Method 1 3 5 1 3 5 ACI 0.776 0.736 0.722 0.842 0.854 0.859 R2K 0.593 0.562 0.551 0.643 0.652 0.655 MCFT 0.683 0.648 0.636 0.743 0.754 0.758

34
The φ values computed for a reliability index of 3.5 (corresponding to LRFD) are significantly lower than the φ values given in the LRFD code. This suggests that the use of the codified φ values may be unconservative for evaluating the existing beams on the basis of the experimentally determined shear resistances of the tested beam sections described in Section 6 of Appendix B. Appropriate φ factors for the assessment model used in evaluating these beams should be determined from a statistically based approach to ensure that a given structural reliability can be achieved. The proposed assessment methodology provides no guidance on this very important subject.
Phi Factor for Shear Design of Reinforced Concrete Beams Phi ACI 318-02 (LFD) .75 (Page 9.3.2.3) AASHTO 2002 (LFD) .85 (Page 174) AASHTO 2004 (LRFD) .90 (Page 5-23)
As one reviews the data, the state of engineering at the time must be considered. These 1950s-vintage bridges were designed and constructed to comply with the AASHO allowable stress design. In the 1970s the load factor design (LFD) bridge code was adopted. The LFD code is based on ultimate strength with serviceability and fatigue checks. The member capacity requirements are determined by dividing the factored design load by a performance factor that is less than 1. Even the earliest ACI load factor codes required capacity to increase as the performance factor decreased. Moses (2001) cautions that ratings based on betas must be appropriately managed. ODOT should maintain consistency between any risk-based evaluation methodologies and the LRFD specification. This must be completed only after the OSU methodology is adjusted to account for the different failure modes at a given time in the future. Specifically time-dependent variation (i.e., reliability index profiles) must be developed for the cracked structures.

35
Attachment 6
REFERENCES AASHO. 1957. Standard Specifications for Highway Bridges, 7th ed. Washington, D.C. AASHO. 1961. Standard Specifications for Highway Bridges, 8th ed. Washington, D.C. AASHTO. 1989. Guide Specification for Strength Evaluation of Existing Steel and Concrete
Bridges. Washington, D.C. AASHTO. 1994. Manual for Condition Evaluation of Bridges, 2nd ed. Washington, D.C.
(Revised 1995, 1996, 1998, 2000.) AASHTO. 2002. Standard Specifications for Highway Bridges, 17th ed. Washington, D.C. AASHTO. 2003. Guide Manual for Condition Evaluation and Load and Resistance Factor
Rating (LRFR) of Highway Bridges. Washington, D.C. AASHTO. 2004. AASHTO LRFD Bridge Design Specifications, U.S. Units, 3rd ed. Washington,
D.C. Akgul, F., and D. M. Frangopol. 2004. Bridge Rating and Reliability Correlation:
Comprehensive Study for Different Bridge Types. Journal of Structural Engineering, Vol. 130, No. 7, pp. 1063�1074.
Allen, T. 2004. Development of Resistance Factors and Downdrag Load Factors for AASHTO LRFD Section 10 for the Strength Limit State. Unpublished. Presented to the AASHTO Highway Subcommittee on Bridges and Structures, March 12.
Allen, T. M., A. S. Nowak, and R. J. Bathurst. 2004. Calibration to Determine Load and Resistance Factors for Geotechnical and Structural Design. Unpublished TRB Circular, Dec.
Estes, A. C., and D. M. Frangopol. 2005. Life-Cycle Evaluation and Condition Assessment of Structures. Chapter 36 in Structural Engineering Handbook, 2nd ed. (W-F. Chen and E. M. Lui, eds.), CRC Press, pp. 36-1�36-51.
Higgins, C., T. H. Miller, D. V. Rosowsky, S. C. Yim, T. Potisuk, T. K. Daniels, B. S. Nicholas, M. J. Robelo, A.-Y. Lee, and R. W. Forrest. 2004. Assessment Methodology for Diagonally Cracked Reinforced Concrete Deck Girders. FHWA-OR-RD-05-04, Final Report, SPR 350, SR 500-091, Oct.
Higgins, C., S. C. Yim, T. H. Miller, M. J. Robelo, and T. Potisuk. 2004. Remaining Life of Reinforced Concrete Beams with Diagonal-Tension Cracks. FHWA-OR-RD-04-12, Final Report, SPR 341, April.
Liu, W. D., A. Neuenhoffer, M. Ghosn, and F. Moses. 2001. NCHRP Report 458: Redundancy in Highway Bridge Substructures. TRB, National Research Council, Washington, D.C.
Moses, F. 2001. NCHRP Report 454: Calibration of Load Factors for LRFR Bridge Evaluation. TRB, National Research Council, Washington, D.C.
Moses, F., and D. Verma. 1987. NCHRP Report 301: Load Capacity Evaluation of Existing Bridges. TRB, National Research Council, Washington, D.C.
Paikowsky, S. G., B. Birgisson, M. McVay, T. Nguyen, C. Kuo, G. Baecher, B. Ayyub, K. Stenersen, K. O�Malley, L. Chernauskas, and M. O�Neill. 2004. NCHRP Report 507: Load and Resistance Factor Design (LRFD) for Deep Foundations. TRB, National Research Council, Washington, D.C.

36
Attachment 7
ROSTER OF THE COMMITTEE FOR REVIEW OF THE OREGON DEPARTMENT OF TRANSPORTATION STUDY ON BRIDGE SHEAR
Chairman John E. Breen, P.E. Nasser I. Al-Rashid Chair in Civil Engineering Ferguson Structural Engineering Laboratory University of Texas at Austin Members Dan M. Frangopol, P.E. (Belgium, Romania) Professor of Civil Engineering Department of Civil, Environmental, and Architectural Engineering University of Colorado, Boulder Robert F. Mast, P.E. Senior Principal BERGER/ABAM Engineers, Inc., Federal Way, Washington William N. Nickas, P.E. State Structures Design Engineer Florida Department of Transportation, Tallahassee James E. Roberts, P.E. Consulting Engineer Imbsen and Associates, Sacramento, California Paul Zia, P.E. Distinguished University Professor Emeritus Department of Civil, Construction, and Environmental Engineering North Carolina State University, Raleigh