Bruce Cohen, PhD Massachusetts Department of Public Health Bureau of Health Information, Statistics,...
45
Bruce Cohen, PhD Massachusetts Department of Public Health Bureau of Health Information, Statistics, Research, and Evaluation Division of Research and Epidemiology Registry of Vital Records and Statistics April 2009 Massachusetts Deaths 2007
-
Upload
thomasine-sherman -
Category
Documents
-
view
218 -
download
0
Transcript of Bruce Cohen, PhD Massachusetts Department of Public Health Bureau of Health Information, Statistics,...

Bruce Cohen, PhD
Massachusetts Department of Public Health Bureau of Health Information, Statistics,
Research, and Evaluation
Division of Research and EpidemiologyRegistry of Vital Records and Statistics
April 2009
Massachusetts Deaths 2007

Source: Massachusetts Department of Public Health, Bureau of Health Information, Statistics, Research, and Evaluation
Infectious Disease
Cancer
Heart Disease
Injuries0%
10%
20%
30%
40%
50%
60%
18
42
18
48
18
54
18
60
18
66
18
72
18
78
18
84
18
90
18
96
19
02
19
08
19
14
19
20
19
26
19
32
19
38
19
44
19
50
19
56
19
62
19
68
19
74
19
80
19
86
19
92
19
98
20
07
Pe
rce
nt
of
To
tal D
ea
ths
Causes of Death Massachusetts: 1842-2007

Source: Massachusetts Department of Public Health, Bureau of Health Information, Statistics, Research, and Evaluation
Outline
• Highlights
• Selected Causes of Death-Cancer-Heart Disease-Diabetes-HIV/AIDS-Injury
• Race, Education and Mortality• Applications of Mortality Data• Summary

HIGHLIGHTS

Source: Massachusetts Department of Public Health, Bureau of Health Information, Statistics, Research, and Evaluation
On An Average Day in Massachusetts
52,690Total deaths in 2007
144 DEATHS
36 Cancer
6 CLRD
8 Injury
35 Heart Disease
1 Infant death
5 Alzheimer’s
7 Stroke
3 Diabetes

Source: Massachusetts Department of Public Health, Bureau of Health Information, Statistics, Research, and Evaluation
80.2
47.3
78.1
40
50
60
70
80
90
1900 1910 1920 1930 1940 1950 1960 1970 1980 1987 1997 1998 1999 2000 2001 2002 2003 2004 2005 2006 2007
Lif
e E
xp
ec
tan
cy
in
Ye
ars
Life Expectancy at BirthMassachusetts vs. U.S.1: 1900-2007
Massachusetts
United States
1 2007 U.S. data was not available at the time of this release, 2006 U.S. data used.
Source: Massachusetts Department of Public Health, Bureau of Health Information, Statistics, Research, and Evaluation
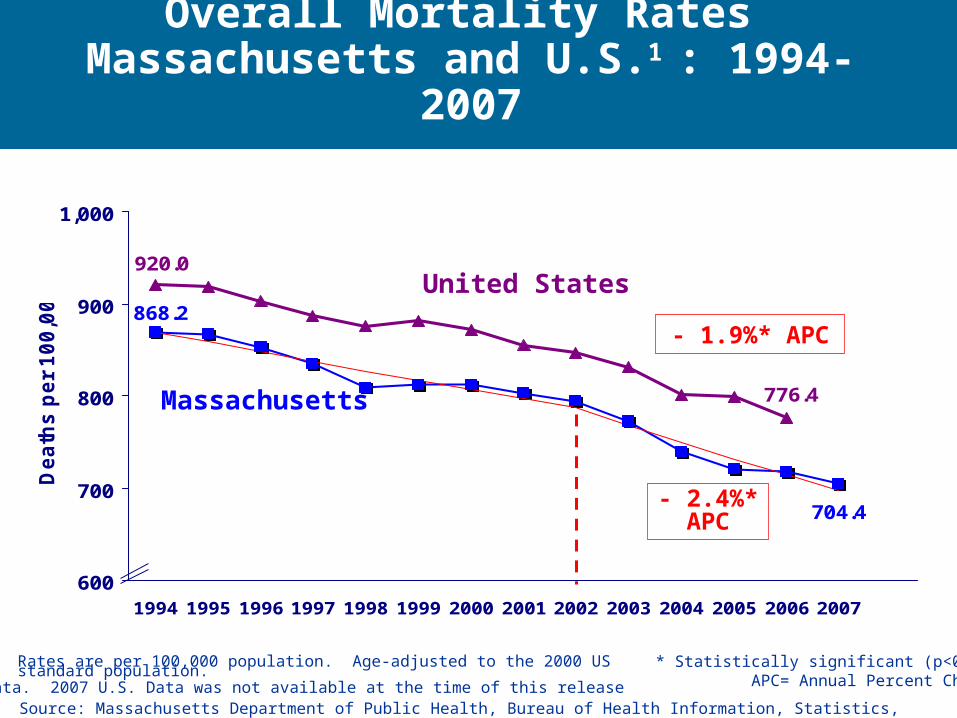
704.4
868.2
776.4
920.0
600
700
800
900
1,000
1994 1995 1996 1997 1998 1999 2000 2001 2002 2003 2004 2005 2006 2007
De
ath
s p
er
10
0,0
00
1 2006 Data. 2007 U.S. Data was not available at the time of this release
Massachusetts
United States
Overall Mortality Rates Massachusetts and U.S.1 : 1994-2007
Rates are per 100,000 population. Age-adjusted to the 2000 US standard population.
- 1.9%* APC
- 2.4%* APC
* Statistically significant (p<0.05)APC= Annual Percent Change

Source: Massachusetts Department of Public Health, Bureau of Health Information, Statistics, Research, and Evaluation
-52%
-29% -29% -27%
-17%
-1%
25%
-9%
-70%
-50%
-30%
-10%
10%
30%
50%
Percentage Difference in Mortality Rates Massachusetts vs. U.S.1: 2007
% d
iffer
ence
Rates are per 100,000 population. Age-adjusted to the 2000 US standard population. *Statistically Significant (p ≤ .05)
Cancer* Overall*
HeartDisease*
Diabetes* Homicide*
Nephritis*
InfantMortality*Suicide*
Higher than US
Lower than US
1 2006 Data. 2007 U.S. Data was not available at the time of this release

Source: Massachusetts Department of Public Health, Bureau of Health Information, Statistics, Research, and Evaluation
Leading Causes of Death Massachusetts: 2007
Heart Disease 24.2%
Cancer 24.6%
Other 23.4%
Stroke 5.1% Injury
5.6%
Chronic Lower Respiratory
Disease 4.4%
Pneumonia & Influenza
2.9%
Alzheimer’s 3.2%
Nephritis 2.6%
Diabetes 2.3%
Septicemia 1.7%
In 2007:•12,961 cancer deaths•12,735 heart disease deaths

Source: Massachusetts Department of Public Health, Bureau of Health Information, Statistics, Research, and Evaluation
Ranking of Leading Causes of Death by Race and EthnicityMassachusetts: 2007
1 Non-Hispanic, 2 Chronic Lower Respiratory Disease Note: The lower the number the higher the rank
White1
(N=48,.518)
Black1
(N=2,211)
Asian1
(N=610)
Hispanic(N=1,264)
Cancer 1 1 1 1
Heart Disease 2 2 2 2
Stroke 3 6 3 5
CLRD2 4 9 6 16
Unintentional Injuries 5 5 5 3
Alzheimer’s Disease 6 14 14 15
Influenza & Pneumonia 7 15 4 17
Nephritis 8 3 8 9
Diabetes 9 4 7 4
HIV/AIDS 29 8 -- 8
Homicide 30 7 21 7

Source: Massachusetts Department of Public Health, Bureau of Health Information, Statistics, Research, and Evaluation
% of Total in Total Age Leading Cause Age Group Deaths
1-14 Injuries 32% 128
15-24 Injuries 72% 505
25-44 Injuries 44% 2,023
45-64 Cancer 37% 8,560
65-74 Cancer 40% 7,494
75-84 Cancer 27% 14,781
85+ Heart Disease 30% 18,816
Leading Causes of Death by Age Massachusetts: 2007

Source: Massachusetts Department of Public Health, Bureau of Health Information, Statistics, Research, and Evaluation
Changes in Mortality RatesMassachusetts: 2000 and 2007
Rates are per 100,000 population. Age-adjusted to the 2000 US standard population.
* Statistically different than 2000 rate (p<0.05)
Cause
Rate
% Change2000 2007
Cancer 206.1 179.0 * 13%Heart Disease 216.7 166.0 * 23%Stroke 50.9 35.0 * 31%Chronic Lower Respiratory Disease
41.8
31.5 * 25%
All Injuries 35.9 42.5 * 18%Alzheimer’s Disease 19.5 20.9 7%
Nephritis 17.6 17.9 2%
Diabetes 19.6 16.5 * 16%All Diabetes-related 61.5 52.9 * 14%

SELECTED CAUSES OF DEATH

Source: Massachusetts Department of Public Health, Bureau of Health Information, Statistics, Research, and Evaluation
Cancer Mortality Rates Massachusetts and U.S. : 1994-20071
179.0
226.0
180.8
212.4
150
200
250
1994 1995 1996 1997 1998 1999 2000 2001 2002 2003 2004 2005 2006 2007
Year
Dea
ths
per
100
,000
Massachusetts
United States
Rates are per 100,000 population. Age-adjusted to the 2000 US standard population1 2006 Data. 2007 U.S. Data was not available at the time of this release

Source: Massachusetts Department of Public Health, Bureau of Health Information, Statistics, Research, and Evaluation
Female Breast Cancer Mortality Rates Massachusetts: 1994-2007
20.4
35.4
15
20
25
30
35
40
1994 1995 1996 1997 1998 1999 2000 2001 2002 2003 2004 2005 2006 2007
Dea
ths
per
100
,000
Rates are per 100,000 population. Age-adjusted to the 2000 US standard population * Statistically significant (p<0.05)APC= Annual Percent Change
- 4%* APC

Source: Massachusetts Department of Public Health, Bureau of Health Information, Statistics, Research, and Evaluation
166.0
261.5
199.4
300.2
130
150
170
190
210
230
250
270
290
310
1994 1995 1996 1997 1998 1999 2000 2001 2002 2003 2004 2005 2006 2007
Dea
ths
per
100
,000
Rates are per 100,000 population. Age-adjusted to the 2000 US standard population
Massachusetts
United States
Heart Disease Mortality Rates Massachusetts and U.S.: 1994-20071
1 2006 Data. 2007 U.S. Data was not available at the time of this release * Statistically significant (p<0.05)
APC= Annual Percent Change

Source: Massachusetts Department of Public Health, Bureau of Health Information, Statistics, Research, and Evaluation
202456
742995
6,112
1,9131,804
6,622
150556
30779
1,750
3,780
0
1,000
2,000
3,000
4,000
5,000
6,000
7,000
< 45 45-54 55-64 65-74 75-84 85+ Total
Ages
Nu
mb
er o
f D
eath
s
Males Females
Number of Heart Disease Deathsby Age and Gender
Massachusetts: 2007

Source: Massachusetts Department of Public Health, Bureau of Health Information, Statistics, Research, and Evaluation
Diabetes-Related DeathsMassachusetts: 2007
Underlying Cause (Disease or injury which
initiated the train of events leading directly to death, or
the circumstances of the accident or violence which produced the fatal injury)1
N=1,216
Contributing Cause (Looking at all other 15
conditions mentioned on death certificates)
N=2,683
All Diabetes-relatedN=3,899
1 World Health Organization. International Statistical Classification of Diseases and Related Health Problems, Tenth Revision. 2d ed. Geneva: World Health Organization. 2004.

Source: Massachusetts Department of Public Health, Bureau of Health Information, Statistics, Research, and Evaluation
Diabetes Mortality Rates by Race and EthnicityMassachusetts: 2007
15.5
37.4
28.2
16.5
9.9
0
10
20
30
40
Whites Blacks Asians Hispanics Total
Dea
ths
per
100
,000
Rates are per 100,000 population. Age-adjusted to the 2000 US standard population
N=1,041 N=96 N=15 N=62 N=1,216
* Statistically different than state rate (p<0.05)
*
*
*

Source: Massachusetts Department of Public Health, Bureau of Health Information, Statistics, Research, and Evaluation
143
277
648
998
241
0
200
400
600
800
1,000
1,200
1987 1988 1989 1990 1991 1992 1993 1994 1995 1996 1997 1998 1999 2000 2001 2002 2003 2004 2005 2006 2007
Nu
mb
er
of
De
ath
sNumber of HIV/AIDS Deaths Massachusetts: 1987-2007
Highly Active Antiretroviral Therapy
HAART

Source: Massachusetts Department of Public Health, Bureau of Health Information, Statistics, Research, and Evaluation
Percent of HIV/AIDS Deaths by Age GroupMassachusetts: 1994-2007
27%
80%
73%
20%
0%
10%
20%
30%
40%
50%
60%
70%
80%
90%
100%
1994 1995 1996 1997 1998 1999 2000 2001 2002 2003 2004 2005 2006 2007
Per
cen
t o
f H
IV/A
IDS
Dea
ths
45+ years
Less than 45 years

Injury Deaths

Source: Massachusetts Department of Public Health, Bureau of Health Information, Statistics, Research, and Evaluation
Causes of Injury Deaths Massachusetts: 2007
Poisonings 33%
Total Injuries = 2,967
Firearm 8%
Other18%
Motor Vehicle-related 15%
Suffocation, Hanging or Strangulation
11%
Falls 16%
66% Opioids
18% Alcohol
16% Other (gases, vapor, NSAIDS, etc)

Source: Massachusetts Department of Public Health, Bureau of Health Information, Statistics, Research, and Evaluation
363
487449
574
475
544
637 637
0
250
500
750
1,000
2000 2001 2002 2003 2004 2005 2006 2007
Year
Nu
mb
er
of
de
ath
sNumber of Poisoning Deaths Where Opioids Are Mentioned
Massachusetts: 2000-2007

Source: Massachusetts Department of Public Health, Bureau of Health Information, Statistics, Research, and Evaluation
15.8
42.3
22.1
43.0
0
10
20
30
40
50
1994 1995 1996 1997 1998 1999 2000 2001 2002 2003 2004 2005 2006 2007
Ag
es 6
5+,
Dea
ths
per
100
,000
Rates are per 100,000 population ages 65+.
Unintentional Fall Mortality RatesPersons Ages 65+
Massachusetts and U.S.: 1994-2007
Massachusetts
United States1
1 Available from URL: www.cdc.gov/ncipc/wisqars

Source: Massachusetts Department of Public Health, Bureau of Health Information, Statistics, Research, and Evaluation
(183 homicides)
Firearm (n=113)Cut/Pierce
(n=33)
Other (n=37)
(504 suicides)
Poisoning (n=117)
Hanging (n=220)
Firearm (n=112)
Other(n=55)
N= 687 deaths
Suicide (n=504)
Homicide (n=183)
Intentional Injury Deaths by Cause Massachusetts: 2007

Source: Massachusetts Department of Public Health, Bureau of Health Information, Statistics, Research, and Evaluation
48
7
34
116
0
141
159
43
1613
24
0
20
40
60
80
100
120
140
160
15-24 25-44 45-64 65-74 75-84 85+
Nu
mb
er o
f D
eath
s
Female Male
Suicides by Gender and by Age Massachusetts: 2007

Source: Massachusetts Department of Public Health, Bureau of Health Information, Statistics, Research, and Evaluation
7.58.1
13.6
12.4
3.5 3.0
0
2
4
6
8
10
12
14
16
1994 1995 1996 1997 1998 1999 2000 2001 2002 2003 2004 2005 2006 2007
Dea
ths
per
100
,000
Rates are per 100,000 population. Age-adjusted to the 2000 US standard population.
Suicide Rates by GenderMassachusetts: 1994-2007
* Statistically significant (p<0.05)APC= Annual Percent Change
Females
Males
Massachusetts
- 3%* APC
Source: Massachusetts Department of Public Health, Bureau of Health Information, Statistics, Research, and Evaluation
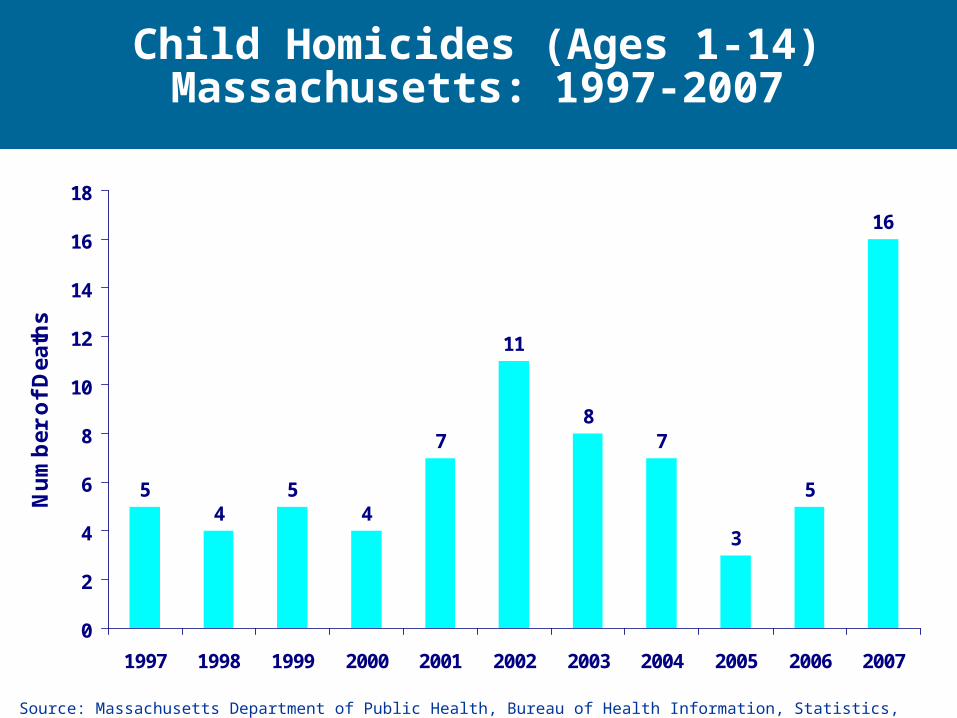
54
54
7
11
87
3
5
16
0
2
4
6
8
10
12
14
16
18
1997 1998 1999 2000 2001 2002 2003 2004 2005 2006 2007
Nu
mb
er o
f D
eath
sChild Homicides (Ages 1-14)Massachusetts: 1997-2007

Race, Education, and Mortality

Source: Massachusetts Department of Public Health, Bureau of Health Information, Statistics, Research, and Evaluation
Mortality Rates by Education and Race/Ethnicity, Adults 25-64 Years1
Massachusetts: 2007
727.3
467.7
181.0
358.5
231.0
533.7
0
200
400
600
800
Whites Blacks Hispanics
Dea
ths
per
100
,000
High School or Less
13+ Education
Rates are per 100,000 population. Age-adjusted to the 2000 US standard population 1Uses 2000 Population Estimates
* Statistically higher than those with 13+ yrs of education (p<0..05)
*
*
*

Source: Massachusetts Department of Public Health, Bureau of Health Information, Statistics, Research, and Evaluation
Mortality Rates by Race/EthnicityAdults 25-64 Years1 with 13+Years of Education
Massachusetts: 2007
181.0
358.5
231.0
0
200
400
600
Whites Blacks Hispanics
Dea
ths
per
100
,000
Rates are per 100,000 population. Age-adjusted to the 2000 US standard population 1Uses 2000 Population Estimates
* Statistically higher than the rate for whites (p<0..05)
*
Applications of Mortality Data

Source: Massachusetts Department of Public Health, Bureau of Health Information, Statistics, Research, and Evaluation
Premature Mortality Rate (PMR)1
• Definition– deaths before age 75, age-adjusted to the 2000 US
standard population under 75 years of age
• Focus– two-thirds of deaths to persons ages 75+
– majority of deaths to persons age 75+ are due to chronic conditions associated with aging
– deaths to persons less than 75 years may be preventable
• Value– excellent measure to reflect the health status of a population
– used as a health status indicator that can be used to focus prevention initiatives and target programs
1 Age-adjusted to the 2000 US standard population under 75 years of age.

Source: Massachusetts Department of Public Health, Bureau of Health Information, Statistics, Research, and Evaluation
Premature Mortality Rates by Race and Hispanic Ethnicity
Massachusetts: 2007
295.4277.4
141.3
428.3
293.5
0
200
400
600
Whites Blacks Asians Hispanics Total
Dea
ths
per
100
,000
Rates are per 100,000 population. Age-adjusted to the 2000 US standard population persons ages 0-74
*
*
(*) Statistically different from State (p ≤.05)

Source: Massachusetts Department of Public Health, Bureau of Health Information, Statistics, Research, and Evaluation
Rates per 100,000 population under 75 years of age; age-adjusted to the 2000 US standard population.
CHNA PMR1. Community Health Network of Berkshire = 331.02. Upper Valley Health Web-Franklin County = 303.53. Partnership for Health in Hampshire County = 319.14. The Community Health Connection = 384.35. Community Health Network of Southern Worcester County = 335.96. Community Partners for Health = 290.27. Community Health Network of Greater Metro West = 238.68. Community Wellness Coalition = 355.69. Fitchburg/Gardner Community Health Network = 322.610. Greater Lowell Community Health Network = 350.911. Greater Lawrence Community Health Network = 281.912. Greater Haverhill Community Health Network = 331.313. Community Health Network North = 267.4
14. North Shore Community Health Network = 316.515. Greater Woburn/Concord/Littleton Community Health Network = 192.016. North Suburban Health Alliance = 285.617. Greater Cambridge/Somerville Community Health Network = 232.718. West Suburban Health Network = 210.619. Alliance for Community Health = 358.420. Blue Hills Community Health Alliance = 298.421. Hampshire County Partnership = 351.522. Greater Brockton Community Health Network = 366.623. South Shore Community Partners in Prevention = 284.924. Greater Attleboro-Taunton Health & Education Response = 35425. Partners for a Healthier Community = 378.926. Greater New Bedford Health & Human Services Coalition = 343.527. Cape Cod & Islands Community Health Network = 295.9
1
45
8
24
26
12
10
22
21
25
19
2 9
3
6
27
23
20
1311
1416
7
15
18
17
Rates are per 100,000 persons under 75 years of age, age-adjusted to the 2000 US standard population and are calculated using MDPHpopulation estimates for 2005, which are the most up-to-date estimates available at the sub-state level by age groups.
2007 PMR by CHNA
Significantly higher than state rate
Not significantly different from state rate
Significantly lower than state rate
Massachusetts PMR= 295.4
Premature Mortality Rates (PMR) by Community Health Network Area (CHNA)
Massachusetts: 2007

Source: Massachusetts Department of Public Health, Bureau of Health Information, Statistics, Research, and Evaluation
Mortality Amenable to Health Care
Definition: Deaths for persons ages 0-74 from certain causes that should not occur in the presence of timely and effective health care1,2
Value: A useful tool to assess
Performance of health care systems and
Track changes over time1
1 Nolte E and McKee CM. Measuring The Health of Nations: Updating An Earlier Analysis. Health Affairs 2008; Vol 27, Number 1: 58-71; Jan/Feb 2008.2 Nolte E and McKee CM . Does Health Care Save Lives? Avoidable Mortality Revisited. The Nullfield Trust. 2004. London, England

Source: Massachusetts Department of Public Health, Bureau of Health Information, Statistics, Research, and Evaluation
Mortality Causes Amenable to Health Care
Causes considered as amenable to health care:
– Amenable to secondary prevention • where screening and treatment are effective;
– for example colorectal, breast, cervical, and skin cancer
– Amenable to improved treatment and medical care:• that require direct medical and/or surgical intervention
– for example appendicitis and hypertension
• that rely on efficient medical care delivery– accurate and timely diagnosis, transport, and treatment
• that respond to antibiotic treatments and immunizations– infectious diseases

Source: Massachusetts Department of Public Health, Bureau of Health Information, Statistics, Research, and Evaluation
Percent Deaths Amenable to Health Care Massachusetts: 2007
10%
90% 72%
28%
All Deaths Deaths to Persons Ages 0-74
Amenable Deaths
Amenable Deaths

Source: Massachusetts Department of Public Health, Bureau of Health Information, Statistics, Research, and Evaluation
Mortality Rates for Causes Amenable to Health Care by Race/Ethnicity
Massachusetts: 2000 and 2007
105.4
142.9
40.6
103.6
64.5
82.180.5
53.1
122.9
80.8
0
40
80
120
160
Whites Blacks Asians Hispanics Total
Dea
ths
per
100
,000
2000 2007
Rates are per 100,000 population. Age-adjusted to the 2000 US standard population persons ages 0-74
** **
** Statistically lower than 2000 rate (p<0.05)

SUMMARY

Source: Massachusetts Department of Public Health, Bureau of Health Information, Statistics, Research, and Evaluation
Summary
The Massachusetts death rate was the lowest on record
Life expectancy reached an all-time high
Massachusetts continues to compare favorably with the
U.S.
Cancer remained the leading cause of death followed by
heart disease. As in previous years, cancer and heart
disease accounted for almost half of all deaths
Death rates for chronic lower respiratory disease, overall
cancer, and female breast cancer declined from 2006

Source: Massachusetts Department of Public Health, Bureau of Health Information, Statistics, Research, and Evaluation
Summary (continued)
Lowest annual number of HIV/AIDS deaths in Massachusetts
Almost ¾ of HIV/AIDS deaths occurred among persons 45+ years
Poisoning deaths, the leading cause of injury deaths, were stable from 2006 to 2007
Two out of 3 poisoning deaths were associated with opioids
Suicide rates had leveled off since 2002 but increased for men from 2006 to 2007
Continued increasing trend in unintentional fall-related deaths

Source: Massachusetts Department of Public Health, Bureau of Health Information, Statistics, Research, and Evaluation
Disparities Persist:
• The cancer death rate for men was 46% higher than the rate for women
• Blacks had the highest premature mortality rate, 1.5 times the rate of whites
• The death rate for those with less education was almost 3 times higher than the rate for those with more education
• Springfield, Lowell, Fall River, Taunton, Worcester, and New Bedford had the highest premature mortality rates
Summary (continued)

Source: Massachusetts Department of Public Health, Bureau of Health Information, Statistics, Research, and Evaluation
How to Access the Death Report and Data
To access the 2007 Report:
•Hard Copies: (617) 740-2670
•TDD/TTY: (617) 624-6001
•DPH Website:
http:// mass.gov/dph/bhsre/resep/resep.htm#birth
To access Death data via MassCHIP (DPH’s Internet based public health information service):
•Website: http://masschip.state.ma.us
•Telephone: 1-888-MASCHIP (Mass only)
(617) 624-5629