Brownian Dynamics Theory for Predicting Internal …...Brownian Dynamics Theory for Predicting...
13
Brownian Dynamics Theory for Predicting Internal and External Blockages of Tetraethylammonium in the KcsA Potassium Channel Matthew Hoyles,* Vikram Krishnamurthy, y May Siksik, y and Shin-Ho Chung* *Research School of Biological Sciences, The Australian National University, Canberra, Australia; and y Department of Electrical Engineering, The University of British Columbia, Vancouver, British Columbia, Canada ABSTRACT The theory of Brownian dynamics is used to model permeation and the blocking of KcsA potassium channels by tetraethylammonium (TEA). A novel Brownian dynamics simulation algorithm is implemented that comprises two free energy profiles; one profile is seen by the potassium ions and the other by the TEA molecules whose shape is approximated by a sphere. Our simulations reveal that internally applied TEA blocks the passage of K 1 ions by physically occluding the pore. A TEA molecule in the external reservoir encounters an attractive energy-well created by four tyrosine residues at position 82, in addition to all other attractive and repulsive forces impinging on it. Using Brownian dynamics, we investigate how deep the energy-well needs to be to reproduce the experimentally determined inhibitory constant k i for the TEA blockade of KcsA or the mutant Shaker T449Y. The one-dimensional free energy profile obtained from molecular dynamics is first converted into a one- dimensional potential energy profile, and is then transformed into a three-dimensional free energy profile in Brownian dynamics by adding the short-range potential from the channel walls. When converted, the free energy profile calculated from molecular dynamics gives a well-depth of ;10 kT. We systematically alter the depths of the profiles, and then use Brownian dynamics simulations to numerically determine the current versus TEA-concentration curves. We show that the sequence of binding and unbinding events of the TEA molecule to the binding pocket can be modeled by a first-order Markov process. The Brownian dynamics simulations also reveal that the probability of a TEA molecule binding to the binding pocket in KcsA potassium channels increases exponentially with TEA concentration and depends also on the applied potential and the K 1 concentration in the simulation assembly. INTRODUCTION Tetraethylammonium (TEA) has long known to be a potent blocker of potassium currents flowing across the cell mem- brane. TEA has been widely used to separate different com- ponents of the membrane currents and to probe the dynamics of ion permeation across potassium channels. Many potas- sium channels are blocked by TEA molecules applied to the internal (1) and external sides of the membrane (2,3). Dif- ferent K 1 channels display different sensitivity to external TEA. For example, the inhibitory constant k i for the Shaker K 1 channel is 27 mM, but its TEA affinity increases dras- tically when the threonine residue at position 449 is sub- stituted with the tyrosine or phenylalanine residue (3,4). In KcsA and Kv2.1, where four tyrosine residues (at position 82 or 380), located just external to the selectivity filter, form a binding pocket for TEA, the current is halved when its concentration reaches between 1.7 and 4.5 mM (5–8). The external TEA affinity in KcsA is drastically reduced when tyrosine at position 82 is substituted with nonaromatic resi- dues, such as cysteine or threonine (5). The precise mechanism that influences TEA potency in different chan- nels and the structural basis of the forces that stabilize a TEA molecule in the outer vestibule are not fully understood. The one-dimensional free energy profile computed using molecular dynamics shows that a TEA molecule sees a shallow attractive potential well as it enters the binding pocket (9,10). This well extends ;6A ˚ in the direction normal to the membrane, and its deepest position, located outside of the selectivity filter, is ;4.45 kcal/mol or 7.5 kT (1 kcal/mol equals 1.69 kT at 298°C) (9). From steric consid- erations, it is postulated that the stabilizing effects between the aromatic rings of the tyrosine residues and a TEA molecule arise from hydration rather than electrostatic forces (9,10). On the other hand, using the nonsense suppression method in the mutant Shaker, Ahern et al. (11) provide ex- perimental and computational evidence supporting the idea that external TEA blockade in Shaker arises, in large part, from a cation-p electron interaction between the aromatic ring of the tyrosine residues at position 449 and a quaternary ammonium ion. The picture emerging from these studies is that in the KcsA and Shaker potassium channels, a TEA molecule physically occludes the pore when it is sequestered by four tyrosine residues located just external to the selectivity filter. In the Kv2.1 channel, which is a slowly inactivating delayed rectifier responsible for repolarization of the action potential, evidence suggests that current block by external TEA may hinge on several other factors. For example, TEA is ineffective in blocking Na 1 currents flowing across this channel, in the absence of K 1 (6). The substitution of the doi: 10.1529/biophysj.107.115139 Submitted June 13, 2007, and accepted for publication August 28, 2007. Address reprint requests to Shin-Ho Chung, E-mail: shin-ho.chung@anu. edu.au. Editor: Gregory A. Voth. Ó 2008 by the Biophysical Society 0006-3495/08/01/366/13 $2.00 366 Biophysical Journal Volume 94 January 2008 366–378
Transcript of Brownian Dynamics Theory for Predicting Internal …...Brownian Dynamics Theory for Predicting...
Brownian Dynamics Theory for Predicting Internal and ExternalBlockages of Tetraethylammonium in the KcsA Potassium Channel
Matthew Hoyles,* Vikram Krishnamurthy,y May Siksik,y and Shin-Ho Chung**Research School of Biological Sciences, The Australian National University, Canberra, Australia; and yDepartment of Electrical Engineering,The University of British Columbia, Vancouver, British Columbia, Canada
ABSTRACT The theory of Brownian dynamics is used to model permeation and the blocking of KcsA potassium channels bytetraethylammonium (TEA). A novel Brownian dynamics simulation algorithm is implemented that comprises two free energyprofiles; one profile is seen by the potassium ions and the other by the TEA molecules whose shape is approximated by asphere. Our simulations reveal that internally applied TEA blocks the passage of K1 ions by physically occluding the pore. ATEA molecule in the external reservoir encounters an attractive energy-well created by four tyrosine residues at position 82, inaddition to all other attractive and repulsive forces impinging on it. Using Brownian dynamics, we investigate how deep theenergy-well needs to be to reproduce the experimentally determined inhibitory constant ki for the TEA blockade of KcsA or themutant Shaker T449Y. The one-dimensional free energy profile obtained from molecular dynamics is first converted into a one-dimensional potential energy profile, and is then transformed into a three-dimensional free energy profile in Brownian dynamicsby adding the short-range potential from the channel walls. When converted, the free energy profile calculated from moleculardynamics gives a well-depth of ;10 kT. We systematically alter the depths of the profiles, and then use Brownian dynamicssimulations to numerically determine the current versus TEA-concentration curves. We show that the sequence of binding andunbinding events of the TEA molecule to the binding pocket can be modeled by a first-order Markov process. The Browniandynamics simulations also reveal that the probability of a TEA molecule binding to the binding pocket in KcsA potassiumchannels increases exponentially with TEA concentration and depends also on the applied potential and the K1 concentrationin the simulation assembly.
INTRODUCTION
Tetraethylammonium (TEA) has long known to be a potentblocker of potassium currents flowing across the cell mem-brane. TEA has been widely used to separate different com-ponents of the membrane currents and to probe the dynamicsof ion permeation across potassium channels. Many potas-sium channels are blocked by TEA molecules applied to theinternal (1) and external sides of the membrane (2,3). Dif-ferent K1 channels display different sensitivity to externalTEA. For example, the inhibitory constant ki for the ShakerK1 channel is 27 mM, but its TEA affinity increases dras-tically when the threonine residue at position 449 is sub-stituted with the tyrosine or phenylalanine residue (3,4). InKcsA and Kv2.1, where four tyrosine residues (at position82 or 380), located just external to the selectivity filter, forma binding pocket for TEA, the current is halved when itsconcentration reaches between 1.7 and 4.5 mM (5–8). Theexternal TEA affinity in KcsA is drastically reduced whentyrosine at position 82 is substituted with nonaromatic resi-dues, such as cysteine or threonine (5). The precisemechanism that influences TEA potency in different chan-nels and the structural basis of the forces that stabilize a TEAmolecule in the outer vestibule are not fully understood.
The one-dimensional free energy profile computed usingmolecular dynamics shows that a TEA molecule sees ashallow attractive potential well as it enters the bindingpocket (9,10). This well extends ;6 A in the directionnormal to the membrane, and its deepest position, locatedoutside of the selectivity filter, is;4.45 kcal/mol or 7.5 kT (1kcal/mol equals 1.69 kT at 298!C) (9). From steric consid-erations, it is postulated that the stabilizing effects betweenthe aromatic rings of the tyrosine residues and a TEAmolecule arise from hydration rather than electrostatic forces(9,10). On the other hand, using the nonsense suppressionmethod in the mutant Shaker, Ahern et al. (11) provide ex-perimental and computational evidence supporting the ideathat external TEA blockade in Shaker arises, in large part,from a cation-p electron interaction between the aromaticring of the tyrosine residues at position 449 and a quaternaryammonium ion.The picture emerging from these studies is that in the
KcsA and Shaker potassium channels, a TEA moleculephysically occludes the pore when it is sequestered by fourtyrosine residues located just external to the selectivity filter.In the Kv2.1 channel, which is a slowly inactivating delayedrectifier responsible for repolarization of the action potential,evidence suggests that current block by external TEA mayhinge on several other factors. For example, TEA isineffective in blocking Na1 currents flowing across thischannel, in the absence of K1 (6). The substitution of the
doi: 10.1529/biophysj.107.115139
Submitted June 13, 2007, and accepted for publication August 28, 2007.
Address reprint requests to Shin-Ho Chung, E-mail: shin-ho.chung@anu.
edu.au.
Editor: Gregory A. Voth.
" 2008 by the Biophysical Society0006-3495/08/01/366/13 $2.00
366 Biophysical Journal Volume 94 January 2008 366–378
tyrosine residues at position 380 (corresponding to position449 in Shaker) with cysteines has relatively small effect onTEA block; this mutation shifts the inhibitory constant from3 to 9 mM (12). Thus, the stabilization of TEA in the externalvestibule is influenced by, among other factors, the confor-mation of the vestibule, the electrostatic milieu near thebinding pocket, and the occupancy state of the selectivityfilter. It is possible that, in the course of a prolongedactivation of the channel, TEA efficacy undergoes dynamicchanges, as does the conformation of the external vestibule(13,14) and of the selectivity filter (15).The aim of this article is to show that Brownian dynamics
(BD) simulations can reveal further insights into the action ofinternally and externally applied TEA on the permeationdynamics. The BD simulations are run for a period longenough to study the effects of TEA in the simulation assem-bly on the conductance properties of the KcsA K1 channel.The ability to run simulations over a period long enough todetermine statistically consistent estimates of the currentflow across ion channels is a distinct advantage of BD overmolecular dynamics. This is achieved by making two ap-proximations. First, BD assumes a fixed protein structure, sothat the explicit dynamics of protein molecules are notsimulated. Second, in BD, the dynamics of water moleculesare not simulated. Instead, the net effect of incessant col-lisions between water molecules and ions, or water mole-cules and TEA molecules, are represented as frictional andrandom forces. These random forces are modeled as Brown-ian motion based on a functional central limit theoremapproximation. This means that the hydration structure ofmolecules in the simulation assembly, or the attractive inter-action between molecules via hydration forces, are not takeninto account.The forces arising from the interaction between a charged
TEA molecule and the quadrupolar moment of the aromaticring are computed from the three-dimensional free energyprofile a TEA molecule encounters as it moves from theouter vestibule toward the selectivity filter of the KcsAchannel. As described in Appendix 1, the one-dimensionalfree energy profile, taken from molecular dynamics calcu-lations (9), is converted into a one-dimensional potentialenergy profile to be used in BD simulations. The shape of theone-dimensional potential energy profile for TEA remainsvirtually identical to that of the one-dimensional free energyprofile but its depth increases slightly once these conversionsare made.With this modification of the free energy profile, we carry
out BD simulations of the KcsA potassium channel with KClions and TEA molecules both present. In this novel BDalgorithm, the motion of TEA is influenced by the electro-static, random, and frictional forces, as well as the attractiveforce arising from its interaction with four tyrosine residuesjust outside of the selectivity filter. This free energy profile,invisible to other charged particles in the simulation as-sembly, is in turn modulated by the locations of resident K1
ions in the selectivity filter. With these simulation techniques,we uncover several additional insights into the mechanismsof internal and external TEA blockade. First, we reproducethe macroscopically observed binding affinity of TEA throughthe fundamental processes operating in electrolyte solutions.By constructing the current-TEA-concentration curves usingdifferent energy profiles with different well-depths, we areable to determine the binding energy between TEA and thechannel to account for the experimentally observed inhib-itory constant ki. Second, we show how the inhibitory con-stant is pronouncedly influenced by the applied membranepotential and ionic concentrations of K1 ions in the reser-voirs. Such dynamic interactions arising from the presence ofmany particles cannot be revealed from a static profile ofpotential of mean force. Third, with the BD simulationtechnique, we have been able to investigate the kinetics ofTEA binding and unbinding. We show that they follow afirst-order Markovian process, and construct the transitionprobability matrices at various applied potentials and ligandconcentrations. The opening and closing of a single channelis governed by a Markovian process (16,17). Within eachbrief open episode in the presence of TEA, the channel isblocked and unblocked at a fast timescale, according toanother Markovian process. Finally, we show how thechannel is blocked by TEA applied to the internal side of themembrane.
METHODS
Channel models
The channel structure we use for this study is the same as that used in
previous BD simulations of the KcsA potassium channel (18). The modelchannel is based on the crystal structure of Doyle et al. (19) with the pore
expanded at the internal end of the channel using a cylindrical repulsive
potential in molecular dynamics to have a radius of 5 A. As described
previously, the selectivity filter is also expanded slightly such that theminimum radius is 1.4 A. The full charges of !e and1e are assigned to D80
and R64 located at the extracellular aspect of the channel, whereas a partial
charge of !0.5e and 10.5e is assigned to the ionized pair, E118 and R117,guarding the intracellular gate. One unpaired arginine residue (Arg27) and
the two pairs of ionizable residues, namely, Glu51/Arg52 and Glu71/Arg89,
are kept neutral, for the reasons detailed in Chung et al. (23). For this study,
we selected this model, among several other permeable forms of KcsA (see,for example, (18)), as it more accurately replicates the experimental data,
such as the observed current-voltage-concentration profiles.
Brownian dynamics
The algorithm for performing BD simulations is conceptually simple. The
position and velocity of each individual ion in and around the ion channelevolves according to a continuous time stochastic dynamical system. The
position xit and velocity vit of the ith ion at time t with mass m and charge q
located at a given position are determined by the force acting on it and are
computed by integrating the equation of motion, known as the Langevinequation, a stochastic version of Newton’s equation of motion. Thus,
xðiÞt ¼ xðiÞ
0 1Z t
0
vðiÞt dt; (1)
Tetraethylammonium in KcsA K1 Channel 367
Biophysical Journal 94(2) 366–378
mvðiÞt ¼ mvðiÞ
0 !Z t
0
mgðxðiÞt Þv
ðiÞt dt1
Z t
0
FðiÞl ðxtÞdt
1Z t
0
bðxðiÞt Þdw
ðiÞt : (2)
Here, mg is the frictional coefficient and the process fwðiÞt g denotes a three-
dimensional zero-mean Brownian motion, which is component-wiseindependent. The constant b is related to the friction coefficient by
b2ðxðiÞt Þ ¼ 2mgðxðiÞt ÞkT: Here, l denotes experimental conditions, such as
external applied voltage and ionic concentrations, and Fl denotes systematic
electrostatic forces. Thus, there are two main sources of the forcesinfluencing the motion of ions that result in the channel current. These are
the stochastic force and electric force. The former arises from the effects of
incessant collisions between ions and water molecules. As a result of such
bombardments, the motion of an ion is retarded by the friction term, and itundergoes random fluctuations from an equilibrium position via the
Brownian motion term. The Langevin equation is often presented as
mdvðiÞ
t
dt¼ !mgðxðiÞ
t ÞvðiÞt 1FðiÞ
l ðxtÞ1 bðxðiÞt Þe
ðiÞt ; (3)
where eðiÞt denotes continuous-time white noise.
Ions are initially assigned random positions with a specified mean
concentration and Boltzmann-distributed velocities within cylindrical res-ervoirs of 30 A radius attached to either end of the channel that mimic the
intracellular and extracellular space. We calculate the total force acting on
each ion in the assembly and then determine new positions for the ions ashort time later using an algorithm described elsewhere (20–22). A multiple
time-step algorithm is used, where a time-step of Dt¼ 100 fs is employed in
the reservoirs and 2 fs in the channel where the forces change more rapidly.
The electrostatic forces Fl acting upon the ions are calculated by solvingPoisson’s equation using a boundary element method (24). To do this we
assign a dielectric constant of ep ¼ 2 to the protein and membrane and ew ¼60 to the water inside the channel as in previous BD studies of the KcsA
channel (18). Since calculating the electric forces at every step in thesimulation is very time-consuming, we store precalculated electric fields and
potentials due to one- and two-ion configurations in a system of lookup
tables and interpolate values for the given ion positions from these during thesimulation (21).
For this purpose, the total electric potential fi encountered by a charged
particle i (including TEA molecules) is decomposed into four components:
fi ¼ fX;i 1fS;i 1 +j 6¼i
ðfI;ij 1fC;ijÞ: (4)
The four terms on the right-hand side of Eq. 4 are, respectively, the external
potential due to the applied field and fixed charges in the protein and chargesinduced by these, the self-potential due to the surface charges induced by the
ion i on the channel boundary, the image potential due to the charged
induced by the ion j, and the Coulomb potential due to the ion j. The first
three potential terms are stored in, respectively, three-, two-, and five-dimensional tables.
The short-range forces are used to keep the ions and TEA molecules in
the simulation assembly and also to mimic other interactions between
charged particles that are not included in the Coulomb interaction. Toprevent charged particles from leaving the system, a hard-wall potential is
activated when they are within one ionic radius of the reservoir boundaries.
Thus, a particle colliding with the boundary of the reservoir is elasticallyscattered. For the ion- or TEA-wall interactionUIW, we use the 1/r9 repulsivepotential
UIWðrÞ ¼ F0
9
ðRi 1RwÞ10
ðRcðzÞ1Rw ! aÞ9; (5)
where Ri is the radius of ions or TEA, Rw is the radius of the atoms lining the
protein wall, Rc(z) is the radius of the channel as a function of the z
coordinate, and a is the ion’s (or TEA molecule’s) distance from the z axis.We use F0 ¼ 2 3 10!10 N in Eq. 5, which is estimated from the ST2 water
model used in molecular dynamics (25). At short-ranges, the Coulomb
interaction between two charged particles is modified by adding a potentialUSR, which replicates effects of the electron clouds and hydration. Molecular
dynamics simulations show that the hydration forces between two charged
particles add further structure to the 1/r9 repulsive potential due to the
overlap of electron clouds in the form of damped oscillation (26,27). Thisadditional potential is incorporated in our Brownian dynamics such that the
radial distribution functions derived from BD simulations replicate those
found in molecular dynamics simulations. For further details of the im-plementation of short-range forces, see Corry et al. (28).
Tetraethylammonium in the BD algorithm
Ideally, each TEA molecule should be represented as a rigid oblate shape, a
spheroid generated by the revolution of an ellipse, with the long and short
axes equal to 4.6 and 2.3 A. For this study, we use a simple, spherical model
of TEA with the radius of either 2.3 A (for externally applied TEA) or 3.4 A(for internally applied TEA). The molecular weight and diffusion coefficients
used for the spherical TEA model are, respectively, 130.25 and 0.87 3 10!9
m2 s!1 (29).Crouzy et al. (9) calculated a free energy profile encountered by a TEA
molecule as it moves from the external reservoir toward the selectivity filter
(Fig. 1, top). To convert this one-dimensional free energy profile, calculated
using CHARMM, to a three-dimensional free energy profile that can beincorporated into the BD algorithm, we first fit an analytical function to the
FIGURE 1 Model potassium channel. (Top) Two of the four subunits of
the full experimentally determined KcsA protein are represented as ribbons.
Water molecules are shown in gold. The circled region of the protein,
containing the selectivity filter is enlarged on the right-hand side and shownin a stick-and-ball model, together with three water molecules and 2 K1 ions
(gold). In simulations, each TEA molecule in the external reservoir is
represented as a sphere with radius of 2.3 A, and that in the internal reservoir
as a sphere with radius of 3.2 A. (Bottom) The one-dimensional free energyprofile obtained by Crouzy et al. (9) replotted (open circles). The digitizeddata points are fitted with three analytical functions (solid line). The origin ofthe profile is at the center of the mass of the selectivity filter.
368 Hoyles et al.
Biophysical Journal 94(2) 366–378
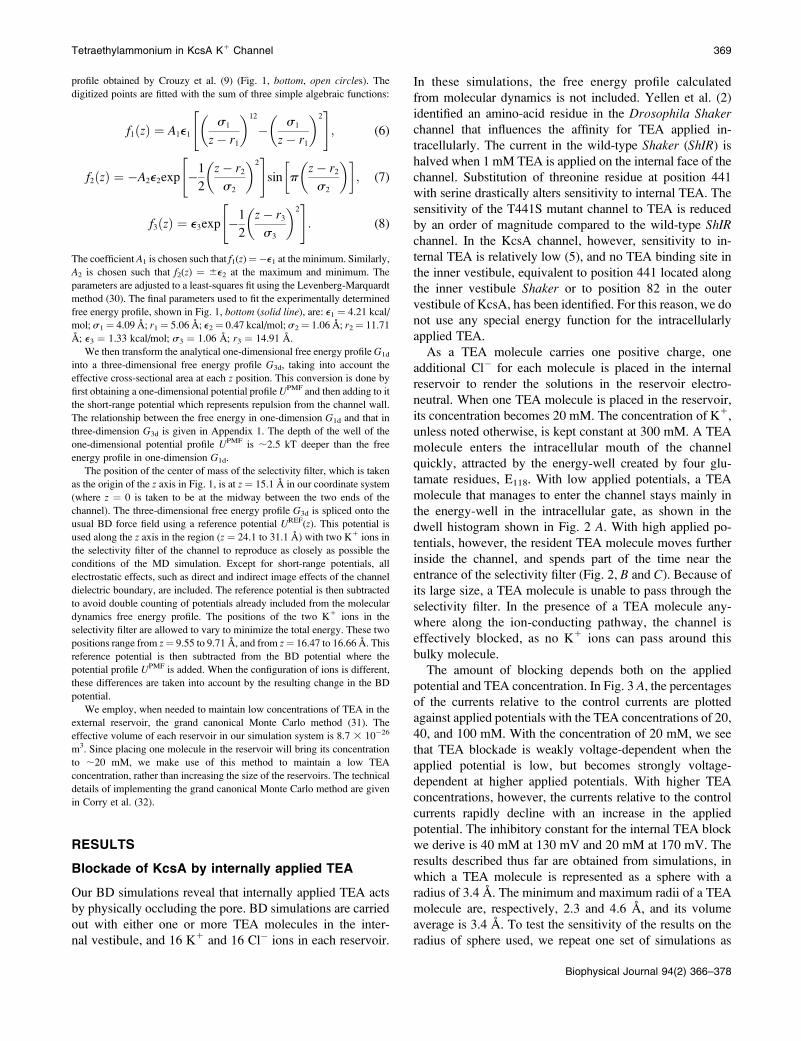
profile obtained by Crouzy et al. (9) (Fig. 1, bottom, open circles). Thedigitized points are fitted with the sum of three simple algebraic functions:
f1ðzÞ ¼ A1e1s1
z! r1
! "12
! s1
z! r1
! "2" #
; (6)
f2ðzÞ ¼ !A2e2exp !1
2
z! r2s2
! "2" #
sin pz! r2s2
! "# $; (7)
f3ðzÞ ¼ e3exp !1
2
z! r3s3
! "2" #
: (8)
The coefficient A1 is chosen such that f1(z)¼!e1 at the minimum. Similarly,A2 is chosen such that f2(z) ¼ 6e2 at the maximum and minimum. The
parameters are adjusted to a least-squares fit using the Levenberg-Marquardt
method (30). The final parameters used to fit the experimentally determined
free energy profile, shown in Fig. 1, bottom (solid line), are: e1 ¼ 4.21 kcal/mol; s1¼ 4.09 A; r1¼ 5.06 A; e2¼ 0.47 kcal/mol; s2¼ 1.06 A; r2¼ 11.71
A; e3 ¼ 1.33 kcal/mol; s3 ¼ 1.06 A; r3 ¼ 14.91 A.
We then transform the analytical one-dimensional free energy profile G1d
into a three-dimensional free energy profile G3d, taking into account theeffective cross-sectional area at each z position. This conversion is done by
first obtaining a one-dimensional potential profileUPMF and then adding to it
the short-range potential which represents repulsion from the channel wall.The relationship between the free energy in one-dimension G1d and that in
three-dimension G3d is given in Appendix 1. The depth of the well of the
one-dimensional potential profile UPMF is ;2.5 kT deeper than the free
energy profile in one-dimension G1d.The position of the center of mass of the selectivity filter, which is taken
as the origin of the z axis in Fig. 1, is at z ¼ 15.1 A in our coordinate system
(where z ¼ 0 is taken to be at the midway between the two ends of the
channel). The three-dimensional free energy profile G3d is spliced onto theusual BD force field using a reference potential UREF(z). This potential isused along the z axis in the region (z ¼ 24.1 to 31.1 A) with two K1 ions in
the selectivity filter of the channel to reproduce as closely as possible the
conditions of the MD simulation. Except for short-range potentials, allelectrostatic effects, such as direct and indirect image effects of the channel
dielectric boundary, are included. The reference potential is then subtracted
to avoid double counting of potentials already included from the moleculardynamics free energy profile. The positions of the two K1 ions in the
selectivity filter are allowed to vary to minimize the total energy. These two
positions range from z¼ 9.55 to 9.71 A, and from z¼ 16.47 to 16.66 A. This
reference potential is then subtracted from the BD potential where thepotential profile UPMF is added. When the configuration of ions is different,
these differences are taken into account by the resulting change in the BD
potential.
We employ, when needed to maintain low concentrations of TEA in theexternal reservoir, the grand canonical Monte Carlo method (31). The
effective volume of each reservoir in our simulation system is 8.7 3 10!26
m3. Since placing one molecule in the reservoir will bring its concentrationto ;20 mM, we make use of this method to maintain a low TEA
concentration, rather than increasing the size of the reservoirs. The technical
details of implementing the grand canonical Monte Carlo method are given
in Corry et al. (32).
RESULTS
Blockade of KcsA by internally applied TEA
Our BD simulations reveal that internally applied TEA actsby physically occluding the pore. BD simulations are carriedout with either one or more TEA molecules in the inter-nal vestibule, and 16 K1 and 16 Cl! ions in each reservoir.
In these simulations, the free energy profile calculatedfrom molecular dynamics is not included. Yellen et al. (2)identified an amino-acid residue in the Drosophila Shakerchannel that influences the affinity for TEA applied in-tracellularly. The current in the wild-type Shaker (ShIR) ishalved when 1 mM TEA is applied on the internal face of thechannel. Substitution of threonine residue at position 441with serine drastically alters sensitivity to internal TEA. Thesensitivity of the T441S mutant channel to TEA is reducedby an order of magnitude compared to the wild-type ShIRchannel. In the KcsA channel, however, sensitivity to in-ternal TEA is relatively low (5), and no TEA binding site inthe inner vestibule, equivalent to position 441 located alongthe inner vestibule Shaker or to position 82 in the outervestibule of KcsA, has been identified. For this reason, we donot use any special energy function for the intracellularlyapplied TEA.As a TEA molecule carries one positive charge, one
additional Cl! for each molecule is placed in the internalreservoir to render the solutions in the reservoir electro-neutral. When one TEA molecule is placed in the reservoir,its concentration becomes 20 mM. The concentration of K1,unless noted otherwise, is kept constant at 300 mM. A TEAmolecule enters the intracellular mouth of the channelquickly, attracted by the energy-well created by four glu-tamate residues, E118. With low applied potentials, a TEAmolecule that manages to enter the channel stays mainly inthe energy-well in the intracellular gate, as shown in thedwell histogram shown in Fig. 2 A. With high applied po-tentials, however, the resident TEA molecule moves furtherinside the channel, and spends part of the time near theentrance of the selectivity filter (Fig. 2, B and C). Because ofits large size, a TEA molecule is unable to pass through theselectivity filter. In the presence of a TEA molecule any-where along the ion-conducting pathway, the channel iseffectively blocked, as no K1 ions can pass around thisbulky molecule.The amount of blocking depends both on the applied
potential and TEA concentration. In Fig. 3 A, the percentagesof the currents relative to the control currents are plottedagainst applied potentials with the TEA concentrations of 20,40, and 100 mM. With the concentration of 20 mM, we seethat TEA blockade is weakly voltage-dependent when theapplied potential is low, but becomes strongly voltage-dependent at higher applied potentials. With higher TEAconcentrations, however, the currents relative to the controlcurrents rapidly decline with an increase in the appliedpotential. The inhibitory constant for the internal TEA blockwe derive is 40 mM at 130 mV and 20 mM at 170 mV. Theresults described thus far are obtained from simulations, inwhich a TEA molecule is represented as a sphere with aradius of 3.4 A. The minimum and maximum radii of a TEAmolecule are, respectively, 2.3 and 4.6 A, and its volumeaverage is 3.4 A. To test the sensitivity of the results on theradius of sphere used, we repeat one set of simulations as
Tetraethylammonium in KcsA K1 Channel 369
Biophysical Journal 94(2) 366–378
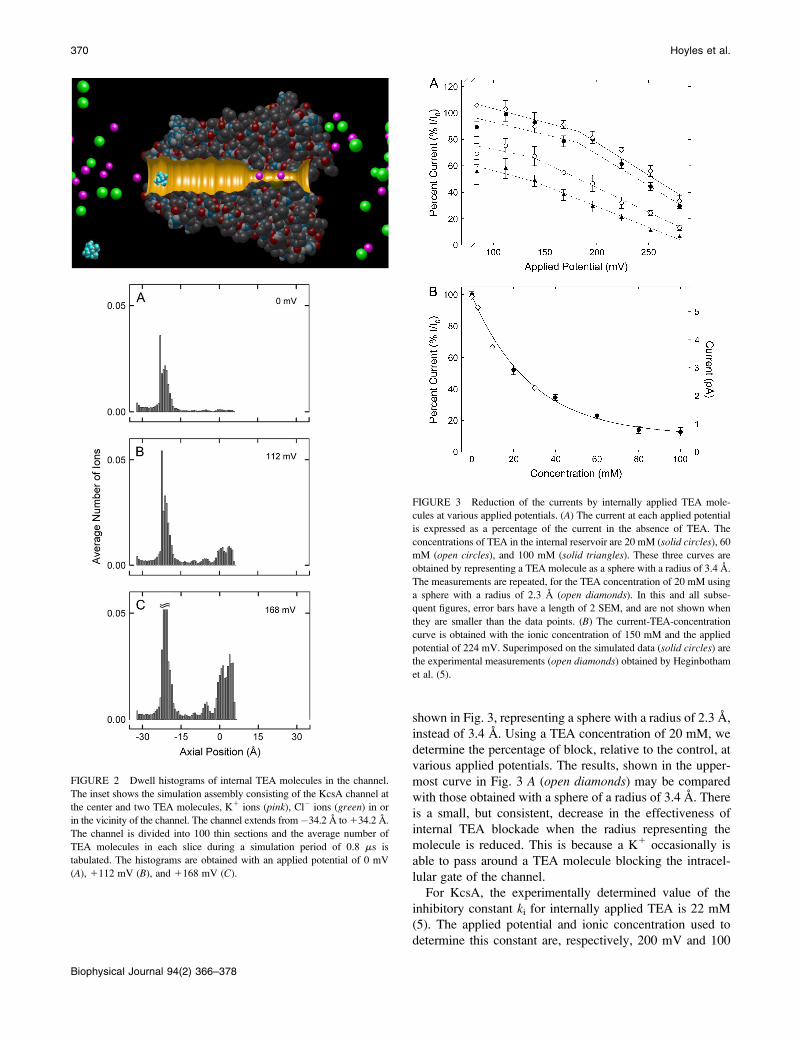
shown in Fig. 3, representing a sphere with a radius of 2.3 A,instead of 3.4 A. Using a TEA concentration of 20 mM, wedetermine the percentage of block, relative to the control, atvarious applied potentials. The results, shown in the upper-most curve in Fig. 3 A (open diamonds) may be comparedwith those obtained with a sphere of a radius of 3.4 A. Thereis a small, but consistent, decrease in the effectiveness ofinternal TEA blockade when the radius representing themolecule is reduced. This is because a K1 occasionally isable to pass around a TEA molecule blocking the intracel-lular gate of the channel.For KcsA, the experimentally determined value of the
inhibitory constant ki for internally applied TEA is 22 mM(5). The applied potential and ionic concentration used todetermine this constant are, respectively, 200 mV and 100
FIGURE 2 Dwell histograms of internal TEA molecules in the channel.
The inset shows the simulation assembly consisting of the KcsA channel atthe center and two TEA molecules, K1 ions (pink), Cl! ions (green) in or
in the vicinity of the channel. The channel extends from!34.2 A to134.2 A.
The channel is divided into 100 thin sections and the average number of
TEA molecules in each slice during a simulation period of 0.8 ms istabulated. The histograms are obtained with an applied potential of 0 mV
(A), 1112 mV (B), and 1168 mV (C).
FIGURE 3 Reduction of the currents by internally applied TEA mole-cules at various applied potentials. (A) The current at each applied potential
is expressed as a percentage of the current in the absence of TEA. The
concentrations of TEA in the internal reservoir are 20 mM (solid circles), 60mM (open circles), and 100 mM (solid triangles). These three curves are
obtained by representing a TEA molecule as a sphere with a radius of 3.4 A.
The measurements are repeated, for the TEA concentration of 20 mM using
a sphere with a radius of 2.3 A (open diamonds). In this and all subse-quent figures, error bars have a length of 2 SEM, and are not shown when
they are smaller than the data points. (B) The current-TEA-concentration
curve is obtained with the ionic concentration of 150 mM and the applied
potential of 224 mV. Superimposed on the simulated data (solid circles) arethe experimental measurements (open diamonds) obtained by Heginbotham
et al. (5).
370 Hoyles et al.
Biophysical Journal 94(2) 366–378
mM. To check how closely our results match the experi-mental observations, we construct a current-TEA-concen-tration for the ionic concentration curve, using the K1
concentration of 150 mM and the applied potential of 224mV. The experimental measurements (open diamonds) aresuperimposed on the curve derived from BD simulations(solid circles) in Fig. 3 B.
Blockade of KcsA by externally applied TEA
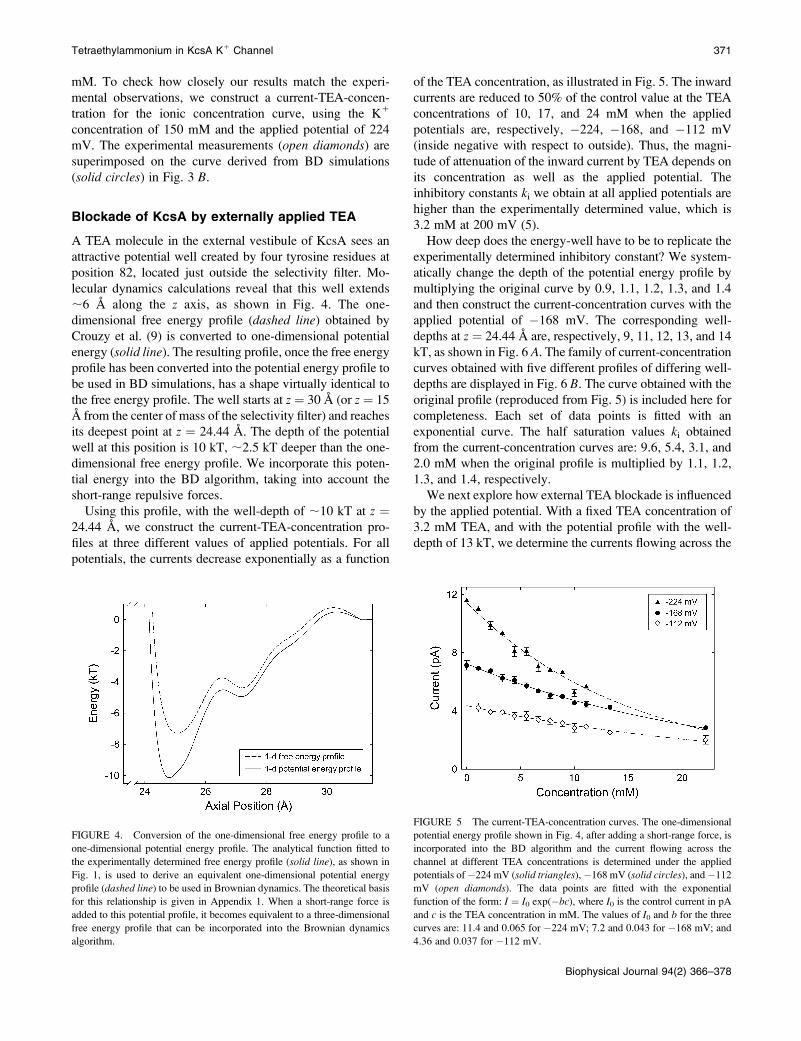
A TEA molecule in the external vestibule of KcsA sees anattractive potential well created by four tyrosine residues atposition 82, located just outside the selectivity filter. Mo-lecular dynamics calculations reveal that this well extends;6 A along the z axis, as shown in Fig. 4. The one-dimensional free energy profile (dashed line) obtained byCrouzy et al. (9) is converted to one-dimensional potentialenergy (solid line). The resulting profile, once the free energyprofile has been converted into the potential energy profile tobe used in BD simulations, has a shape virtually identical tothe free energy profile. The well starts at z ¼ 30 A (or z ¼ 15A from the center of mass of the selectivity filter) and reachesits deepest point at z ¼ 24.44 A. The depth of the potentialwell at this position is 10 kT, ;2.5 kT deeper than the one-dimensional free energy profile. We incorporate this poten-tial energy into the BD algorithm, taking into account theshort-range repulsive forces.Using this profile, with the well-depth of ;10 kT at z ¼
24.44 A, we construct the current-TEA-concentration pro-files at three different values of applied potentials. For allpotentials, the currents decrease exponentially as a function
of the TEA concentration, as illustrated in Fig. 5. The inwardcurrents are reduced to 50% of the control value at the TEAconcentrations of 10, 17, and 24 mM when the appliedpotentials are, respectively, !224, !168, and !112 mV(inside negative with respect to outside). Thus, the magni-tude of attenuation of the inward current by TEA depends onits concentration as well as the applied potential. Theinhibitory constants ki we obtain at all applied potentials arehigher than the experimentally determined value, which is3.2 mM at 200 mV (5).How deep does the energy-well have to be to replicate the
experimentally determined inhibitory constant? We system-atically change the depth of the potential energy profile bymultiplying the original curve by 0.9, 1.1, 1.2, 1.3, and 1.4and then construct the current-concentration curves with theapplied potential of !168 mV. The corresponding well-depths at z ¼ 24.44 A are, respectively, 9, 11, 12, 13, and 14kT, as shown in Fig. 6 A. The family of current-concentrationcurves obtained with five different profiles of differing well-depths are displayed in Fig. 6 B. The curve obtained with theoriginal profile (reproduced from Fig. 5) is included here forcompleteness. Each set of data points is fitted with anexponential curve. The half saturation values ki obtainedfrom the current-concentration curves are: 9.6, 5.4, 3.1, and2.0 mM when the original profile is multiplied by 1.1, 1.2,1.3, and 1.4, respectively.We next explore how external TEA blockade is influenced
by the applied potential. With a fixed TEA concentration of3.2 mM TEA, and with the potential profile with the well-depth of 13 kT, we determine the currents flowing across the
FIGURE 4. Conversion of the one-dimensional free energy profile to a
one-dimensional potential energy profile. The analytical function fitted to
the experimentally determined free energy profile (solid line), as shown in
Fig. 1, is used to derive an equivalent one-dimensional potential energyprofile (dashed line) to be used in Brownian dynamics. The theoretical basis
for this relationship is given in Appendix 1. When a short-range force is
added to this potential profile, it becomes equivalent to a three-dimensional
free energy profile that can be incorporated into the Brownian dynamicsalgorithm.
FIGURE 5 The current-TEA-concentration curves. The one-dimensionalpotential energy profile shown in Fig. 4, after adding a short-range force, is
incorporated into the BD algorithm and the current flowing across the
channel at different TEA concentrations is determined under the appliedpotentials of!224 mV (solid triangles),!168 mV (solid circles), and!112
mV (open diamonds). The data points are fitted with the exponential
function of the form: I ¼ I0 exp(!bc), where I0 is the control current in pA
and c is the TEA concentration in mM. The values of I0 and b for the threecurves are: 11.4 and 0.065 for !224 mV; 7.2 and 0.043 for !168 mV; and
4.36 and 0.037 for !112 mV.
Tetraethylammonium in KcsA K1 Channel 371
Biophysical Journal 94(2) 366–378
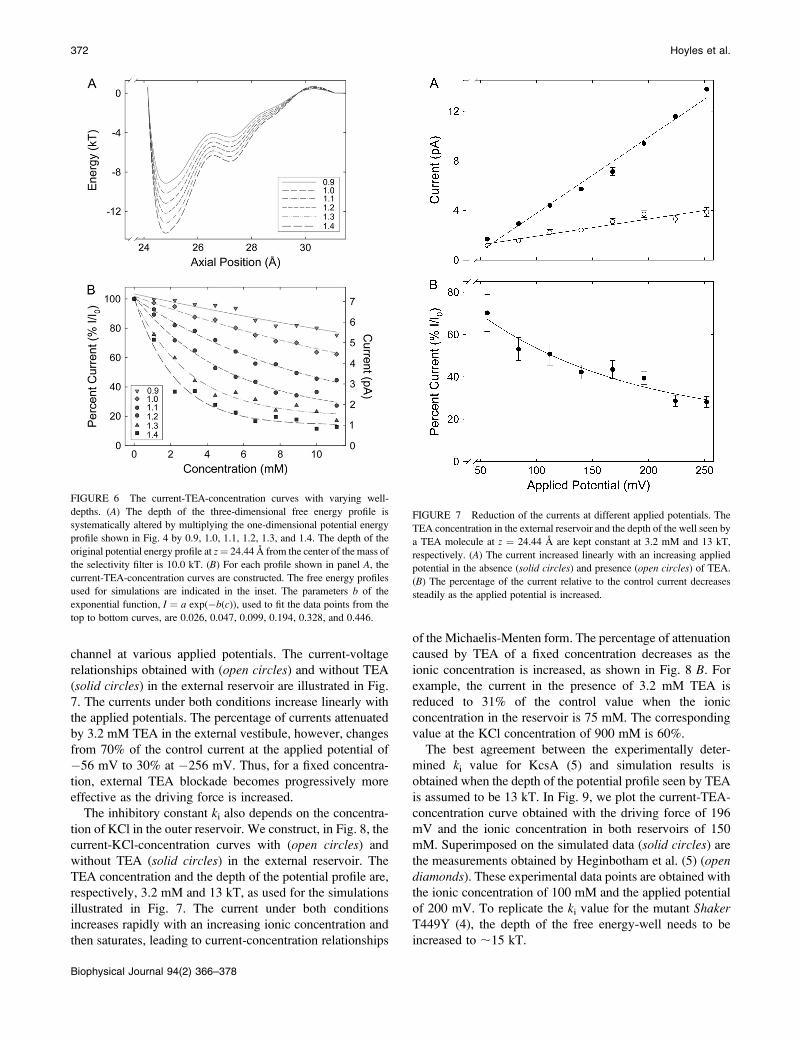
channel at various applied potentials. The current-voltagerelationships obtained with (open circles) and without TEA(solid circles) in the external reservoir are illustrated in Fig.7. The currents under both conditions increase linearly withthe applied potentials. The percentage of currents attenuatedby 3.2 mM TEA in the external vestibule, however, changesfrom 70% of the control current at the applied potential of!56 mV to 30% at !256 mV. Thus, for a fixed concentra-tion, external TEA blockade becomes progressively moreeffective as the driving force is increased.The inhibitory constant ki also depends on the concentra-
tion of KCl in the outer reservoir. We construct, in Fig. 8, thecurrent-KCl-concentration curves with (open circles) andwithout TEA (solid circles) in the external reservoir. TheTEA concentration and the depth of the potential profile are,respectively, 3.2 mM and 13 kT, as used for the simulationsillustrated in Fig. 7. The current under both conditionsincreases rapidly with an increasing ionic concentration andthen saturates, leading to current-concentration relationships
of the Michaelis-Menten form. The percentage of attenuationcaused by TEA of a fixed concentration decreases as theionic concentration is increased, as shown in Fig. 8 B. Forexample, the current in the presence of 3.2 mM TEA isreduced to 31% of the control value when the ionicconcentration in the reservoir is 75 mM. The correspondingvalue at the KCl concentration of 900 mM is 60%.The best agreement between the experimentally deter-
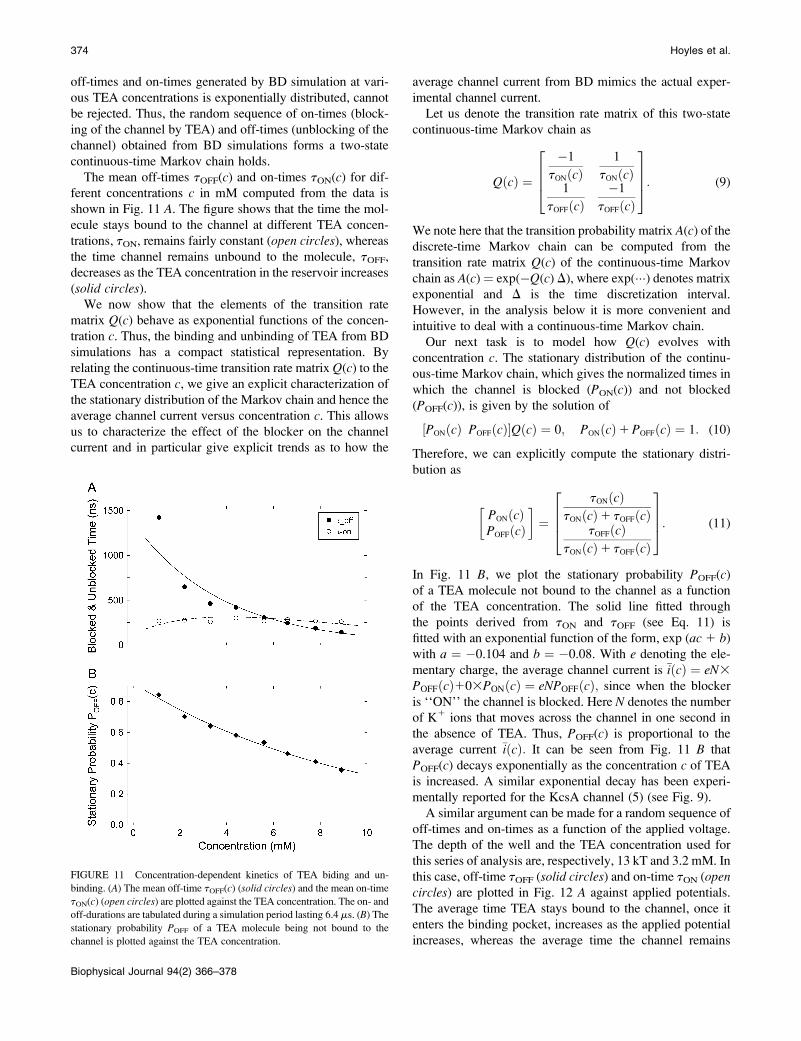
mined ki value for KcsA (5) and simulation results isobtained when the depth of the potential profile seen by TEAis assumed to be 13 kT. In Fig. 9, we plot the current-TEA-concentration curve obtained with the driving force of 196mV and the ionic concentration in both reservoirs of 150mM. Superimposed on the simulated data (solid circles) arethe measurements obtained by Heginbotham et al. (5) (opendiamonds). These experimental data points are obtained withthe ionic concentration of 100 mM and the applied potentialof 200 mV. To replicate the ki value for the mutant ShakerT449Y (4), the depth of the free energy-well needs to beincreased to ;15 kT.
FIGURE 6 The current-TEA-concentration curves with varying well-
depths. (A) The depth of the three-dimensional free energy profile is
systematically altered by multiplying the one-dimensional potential energyprofile shown in Fig. 4 by 0.9, 1.0, 1.1, 1.2, 1.3, and 1.4. The depth of the
original potential energy profile at z¼ 24.44 A from the center of the mass of
the selectivity filter is 10.0 kT. (B) For each profile shown in panel A, thecurrent-TEA-concentration curves are constructed. The free energy profilesused for simulations are indicated in the inset. The parameters b of the
exponential function, I ¼ a exp(!b(c)), used to fit the data points from the
top to bottom curves, are 0.026, 0.047, 0.099, 0.194, 0.328, and 0.446.
FIGURE 7 Reduction of the currents at different applied potentials. The
TEA concentration in the external reservoir and the depth of the well seen by
a TEA molecule at z ¼ 24.44 A are kept constant at 3.2 mM and 13 kT,
respectively. (A) The current increased linearly with an increasing appliedpotential in the absence (solid circles) and presence (open circles) of TEA.(B) The percentage of the current relative to the control current decreases
steadily as the applied potential is increased.
372 Hoyles et al.
Biophysical Journal 94(2) 366–378
Kinetics of TEA binding and unbinding
The results from BD simulations show that externallyapplied TEA binds to the binding pocket located justexterior to the selectivity filter and becomes unboundaccording to a first order Markovian process. We tabulatethe time the channel is not blocked by a TEA molecule (off-time) and the time the binding pocket is occupied by a TEAmolecule (on-time). A short segment of the on-time and off-time sample path generated from BD simulations isillustrated in Fig. 10. When bound, a TEA moleculeeffectively blocks the passage of K1 ions. Conductionevents occur only when no TEA is in the binding pocket, asindicated with downward marks in Fig. 10. With a 3.2 mMTEA concentration, the channel is blocked and unblockednearly 300 times in 100 ms, which is usually one digitizinginterval of patch-clamp recordings.To characterize the binding and unbinding processes, we
carry out a set of simulations at eight different TEAconcentrations under the applied potential of 168 mV and
calculate the mean off-time and on-time at each concentra-tion. The depth of the well and ionic concentration used forthese simulations are 12.0 kT and 300 mM, respectively. Therandom sequence of off-times and on-times generated fromthe BD simulation can be statistically modeled as a first-order two-state continuous-time Markov process with atransition rate matrix denoted Q(c) as a function of the TEAconcentration c. We statistically validate whether or not thebinding or unbinding process obeys a first-order, continuous-time, Markov process. One way to demonstrate this wouldbe to construct an interval histogram, which will be dis-tributed as a single exponential function if the process is afirst-order Markovian. That is, the random sequences of on-times or off-times denoted t for a given concentration c havean exponential probability distribution function of the form1-exp(!t/tON(c)) and 1-exp(!t/tOFF(c)), respectively. Here,we use the well-known Anderson-Darling statistical test (33)to determine whether the small number of random sequenceof on- and off-intervals we obtained from BD simulationscan be modeled by an exponential distribution. By usingthe Anderson-Darling test with a standard significance levelof 5%, we find that the hypothesis that the sequence of
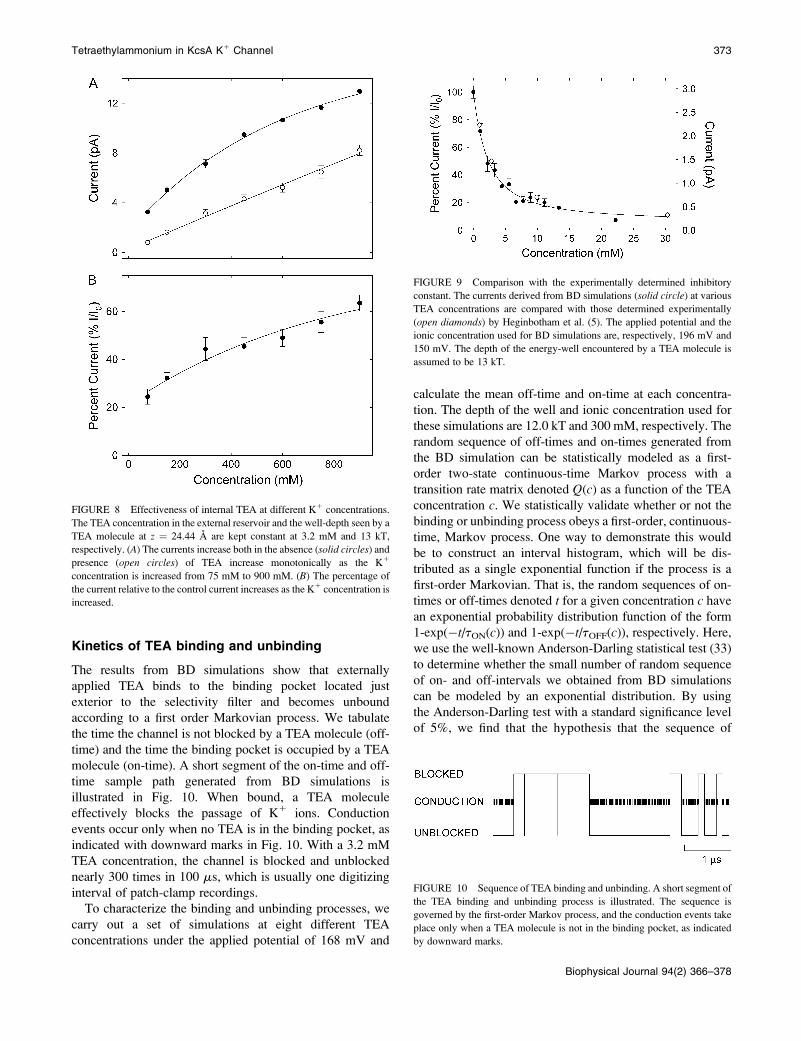
FIGURE 8 Effectiveness of internal TEA at different K1 concentrations.
The TEA concentration in the external reservoir and the well-depth seen by a
TEA molecule at z ¼ 24.44 A are kept constant at 3.2 mM and 13 kT,respectively. (A) The currents increase both in the absence (solid circles) andpresence (open circles) of TEA increase monotonically as the K1
concentration is increased from 75 mM to 900 mM. (B) The percentage ofthe current relative to the control current increases as the K1 concentration isincreased.
FIGURE 9 Comparison with the experimentally determined inhibitoryconstant. The currents derived from BD simulations (solid circle) at variousTEA concentrations are compared with those determined experimentally
(open diamonds) by Heginbotham et al. (5). The applied potential and theionic concentration used for BD simulations are, respectively, 196 mV and
150 mV. The depth of the energy-well encountered by a TEA molecule is
assumed to be 13 kT.
FIGURE 10 Sequence of TEA binding and unbinding. A short segment of
the TEA binding and unbinding process is illustrated. The sequence is
governed by the first-order Markov process, and the conduction events take
place only when a TEA molecule is not in the binding pocket, as indicatedby downward marks.
Tetraethylammonium in KcsA K1 Channel 373
Biophysical Journal 94(2) 366–378
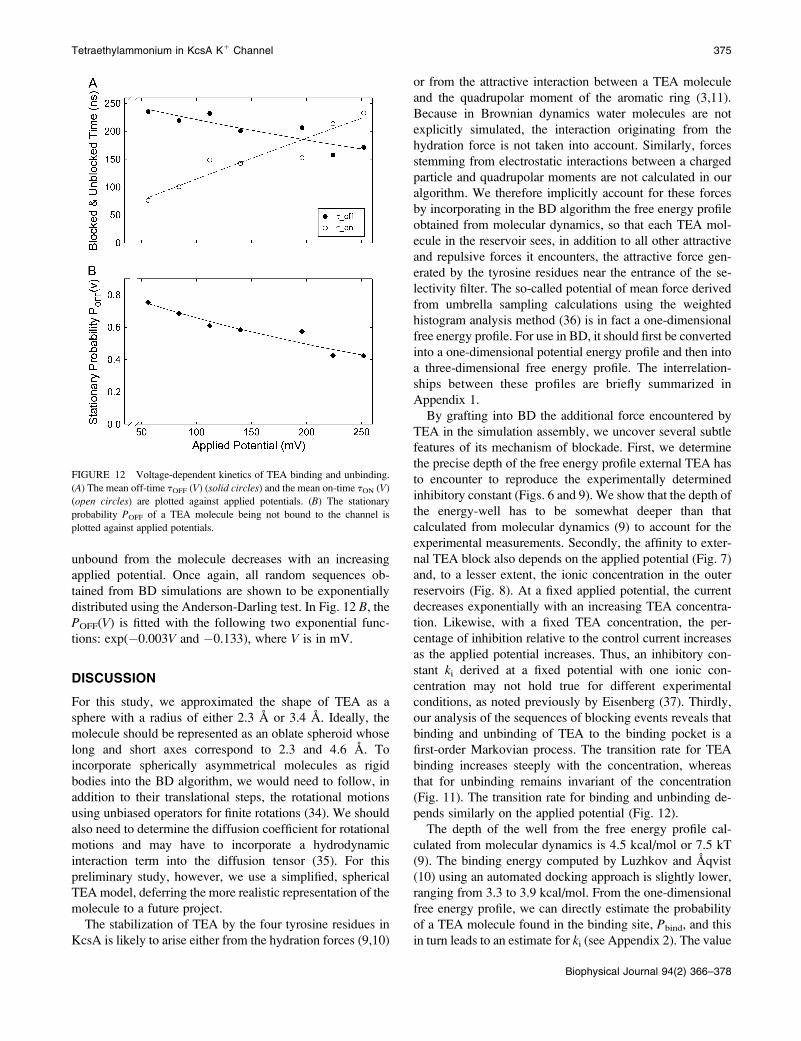
off-times and on-times generated by BD simulation at vari-ous TEA concentrations is exponentially distributed, cannotbe rejected. Thus, the random sequence of on-times (block-ing of the channel by TEA) and off-times (unblocking of thechannel) obtained from BD simulations forms a two-statecontinuous-time Markov chain holds.The mean off-times tOFF(c) and on-times tON(c) for dif-
ferent concentrations c in mM computed from the data isshown in Fig. 11 A. The figure shows that the time the mol-ecule stays bound to the channel at different TEA concen-trations, tON, remains fairly constant (open circles), whereasthe time channel remains unbound to the molecule, tOFF,decreases as the TEA concentration in the reservoir increases(solid circles).We now show that the elements of the transition rate
matrix Q(c) behave as exponential functions of the concen-tration c. Thus, the binding and unbinding of TEA from BDsimulations has a compact statistical representation. Byrelating the continuous-time transition rate matrix Q(c) to theTEA concentration c, we give an explicit characterization ofthe stationary distribution of the Markov chain and hence theaverage channel current versus concentration c. This allowsus to characterize the effect of the blocker on the channelcurrent and in particular give explicit trends as to how the
average channel current from BD mimics the actual exper-imental channel current.Let us denote the transition rate matrix of this two-state
continuous-time Markov chain as
QðcÞ ¼
!1
tONðcÞ1
tONðcÞ1
tOFFðcÞ!1
tOFFðcÞ
2
664
3
775: (9)
We note here that the transition probability matrix A(c) of thediscrete-time Markov chain can be computed from thetransition rate matrix Q(c) of the continuous-time Markovchain as A(c)¼ exp(!Q(c) D), where exp(%%%) denotes matrixexponential and D is the time discretization interval.However, in the analysis below it is more convenient andintuitive to deal with a continuous-time Markov chain.Our next task is to model how Q(c) evolves with
concentration c. The stationary distribution of the continu-ous-time Markov chain, which gives the normalized times inwhich the channel is blocked (PON(c)) and not blocked(POFF(c)), is given by the solution of
½PONðcÞ POFFðcÞ'QðcÞ ¼ 0; PONðcÞ1POFFðcÞ ¼ 1: (10)
Therefore, we can explicitly compute the stationary distri-bution as
PONðcÞPOFFðcÞ
# $¼
tONðcÞtONðcÞ1 tOFFðcÞ
tOFFðcÞtONðcÞ1 tOFFðcÞ
2
664
3
775: (11)
In Fig. 11 B, we plot the stationary probability POFF(c)of a TEA molecule not bound to the channel as a functionof the TEA concentration. The solid line fitted throughthe points derived from tON and tOFF (see Eq. 11) isfitted with an exponential function of the form, exp (ac 1 b)with a ¼ !0.104 and b ¼ !0.08. With e denoting the ele-mentary charge, the average channel current is !iðcÞ ¼ eN3POFFðcÞ103PONðcÞ ¼ eNPOFFðcÞ; since when the blockeris ‘‘ON’’ the channel is blocked. Here N denotes the numberof K1 ions that moves across the channel in one second inthe absence of TEA. Thus, POFF(c) is proportional to theaverage current !iðcÞ: It can be seen from Fig. 11 B thatPOFF(c) decays exponentially as the concentration c of TEAis increased. A similar exponential decay has been experi-mentally reported for the KcsA channel (5) (see Fig. 9).A similar argument can be made for a random sequence of
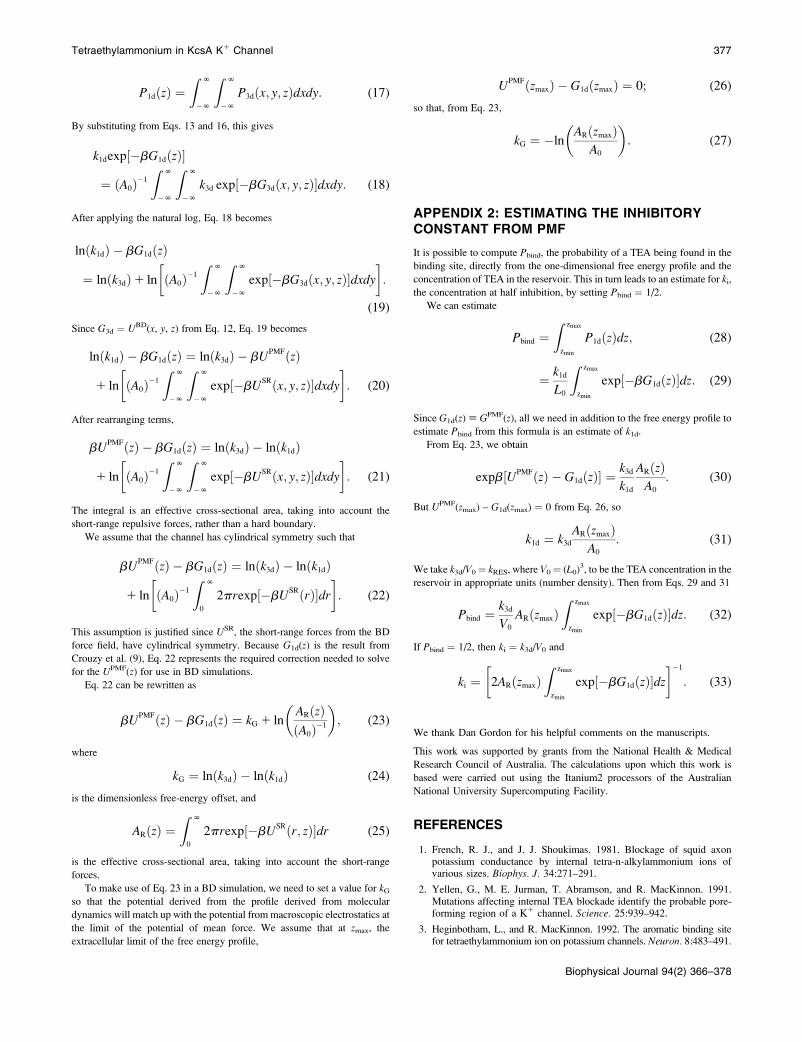
off-times and on-times as a function of the applied voltage.The depth of the well and the TEA concentration used forthis series of analysis are, respectively, 13 kT and 3.2 mM. Inthis case, off-time tOFF (solid circles) and on-time tON (opencircles) are plotted in Fig. 12 A against applied potentials.The average time TEA stays bound to the channel, once itenters the binding pocket, increases as the applied potentialincreases, whereas the average time the channel remains
FIGURE 11 Concentration-dependent kinetics of TEA biding and un-
binding. (A) The mean off-time tOFF(c) (solid circles) and the mean on-time
tON(c) (open circles) are plotted against the TEA concentration. The on- andoff-durations are tabulated during a simulation period lasting 6.4 ms. (B) Thestationary probability POFF of a TEA molecule being not bound to the
channel is plotted against the TEA concentration.
374 Hoyles et al.
Biophysical Journal 94(2) 366–378
unbound from the molecule decreases with an increasingapplied potential. Once again, all random sequences ob-tained from BD simulations are shown to be exponentiallydistributed using the Anderson-Darling test. In Fig. 12 B, thePOFF(V) is fitted with the following two exponential func-tions: exp(!0.003V and !0.133), where V is in mV.
DISCUSSION
For this study, we approximated the shape of TEA as asphere with a radius of either 2.3 A or 3.4 A. Ideally, themolecule should be represented as an oblate spheroid whoselong and short axes correspond to 2.3 and 4.6 A. Toincorporate spherically asymmetrical molecules as rigidbodies into the BD algorithm, we would need to follow, inaddition to their translational steps, the rotational motionsusing unbiased operators for finite rotations (34). We shouldalso need to determine the diffusion coefficient for rotationalmotions and may have to incorporate a hydrodynamicinteraction term into the diffusion tensor (35). For thispreliminary study, however, we use a simplified, sphericalTEA model, deferring the more realistic representation of themolecule to a future project.The stabilization of TEA by the four tyrosine residues in
KcsA is likely to arise either from the hydration forces (9,10)
or from the attractive interaction between a TEA moleculeand the quadrupolar moment of the aromatic ring (3,11).Because in Brownian dynamics water molecules are notexplicitly simulated, the interaction originating from thehydration force is not taken into account. Similarly, forcesstemming from electrostatic interactions between a chargedparticle and quadrupolar moments are not calculated in ouralgorithm. We therefore implicitly account for these forcesby incorporating in the BD algorithm the free energy profileobtained from molecular dynamics, so that each TEA mol-ecule in the reservoir sees, in addition to all other attractiveand repulsive forces it encounters, the attractive force gen-erated by the tyrosine residues near the entrance of the se-lectivity filter. The so-called potential of mean force derivedfrom umbrella sampling calculations using the weightedhistogram analysis method (36) is in fact a one-dimensionalfree energy profile. For use in BD, it should first be convertedinto a one-dimensional potential energy profile and then intoa three-dimensional free energy profile. The interrelation-ships between these profiles are briefly summarized inAppendix 1.By grafting into BD the additional force encountered by
TEA in the simulation assembly, we uncover several subtlefeatures of its mechanism of blockade. First, we determinethe precise depth of the free energy profile external TEA hasto encounter to reproduce the experimentally determinedinhibitory constant (Figs. 6 and 9). We show that the depth ofthe energy-well has to be somewhat deeper than thatcalculated from molecular dynamics (9) to account for theexperimental measurements. Secondly, the affinity to exter-nal TEA block also depends on the applied potential (Fig. 7)and, to a lesser extent, the ionic concentration in the outerreservoirs (Fig. 8). At a fixed applied potential, the currentdecreases exponentially with an increasing TEA concentra-tion. Likewise, with a fixed TEA concentration, the per-centage of inhibition relative to the control current increasesas the applied potential increases. Thus, an inhibitory con-stant ki derived at a fixed potential with one ionic con-centration may not hold true for different experimentalconditions, as noted previously by Eisenberg (37). Thirdly,our analysis of the sequences of blocking events reveals thatbinding and unbinding of TEA to the binding pocket is afirst-order Markovian process. The transition rate for TEAbinding increases steeply with the concentration, whereasthat for unbinding remains invariant of the concentration(Fig. 11). The transition rate for binding and unbinding de-pends similarly on the applied potential (Fig. 12).The depth of the well from the free energy profile cal-
culated from molecular dynamics is 4.5 kcal/mol or 7.5 kT(9). The binding energy computed by Luzhkov and Aqvist(10) using an automated docking approach is slightly lower,ranging from 3.3 to 3.9 kcal/mol. From the one-dimensionalfree energy profile, we can directly estimate the probabilityof a TEA molecule found in the binding site, Pbind, and thisin turn leads to an estimate for ki (see Appendix 2). The value
FIGURE 12 Voltage-dependent kinetics of TEA binding and unbinding.
(A) The mean off-time tOFF (V) (solid circles) and the mean on-time tON (V)(open circles) are plotted against applied potentials. (B) The stationary
probability POFF of a TEA molecule being not bound to the channel is
plotted against applied potentials.
Tetraethylammonium in KcsA K1 Channel 375
Biophysical Journal 94(2) 366–378

of the inhibitory constant with no applied potential estimatedfrom the free energy profile of Crouzy et al. (9) is 23 mM.When the applied potential is increased from 0 mVA to 200mV, the value of ki shifts by 2.1 mM. Although the freeenergy profile obtained from molecular dynamics is unableto account for other subtle features of the dynamics of TEAblockade, it nevertheless provides an order-of-magnitudeestimate of the inhibitory constant. More importantly, such aprofile gives valuable information about the general shape ofthe three-dimensional free energy profile that needs to beincorporated into the Brownian dynamics algorithm. It ispossible that the depth of the free energy profile calculatedfrom molecular dynamics may become deeper once all fourtyrosine residues are repositioned such that a TEA moleculein the binding site would interact with the faces of thearomatic side chains. Such an en face orientation is neededfor the favorable cation-p electron interaction (11).Yellen et al. (2) noted that internal TEA blocks a mutant
Shaker channel, ShIR, at a submillimolar concentration.When threonine residues at position 441 are replaced withserines, the sensitivity to internally applied TEA is reducedby an order of magnitude. It thus appears that the Shaker K1
channel possesses an internal TEA binding pocket similar tothat found in the external vestibule. In contrast, the inhibitoryconstant for internally applied TEA for the KcsA K1 channelis 22 mM (5). This value is close to the results of our sim-ulation (Fig. 3). The suppression of the currents by internalTEA in our simulations is caused by the occlusion of the ionconducting pathway. The blocking molecule penetratesdeeper inside of the pore as the applied potential is increased,thus making the effectiveness of blockade highly voltage-dependent (Fig. 2).By making several simplifying assumptions, we have been
able to deduce many of the salient features of internal andexternal TEA blockade in the KcsA K1 channel. Here wehave exploited the capability of BD to measure the currentflowing across a biological ion channel to study how inter-nally or externally applied TEA interacts with the permeationdynamics. By carrying out BD simulations in the KcsApotassium channels with TEA ions in KCl solutions, weshow how the inward and outward currents change with anincreasing concentration of TEA in the simulation assembly.From a series of such current-concentration curves con-structed from different energy profiles with varying well-depths, we are able to infer the depth of the energy-well aTEA molecule needs to see to replicate the experimentallydetermined inhibitory constant for the TEA block. We alsodemonstrate that the attenuation of currents by TEA is de-pendent on other factors, such as the applied potential andionic concentrations of potassium ions in the reservoirs.Moreover, by tabulating how long a TEA molecule staysbound in the binding site, we reveal the dynamics of bindingand unbinding processes taking place in a fast timescale. Thetechnique we introduce here can be fruitfully utilized inexamining other K1 channel models whose atomic coordi-
nates are not yet determined. Any homology model of a K1
channel constructed must account for its current-voltage-concentration profiles as well as the effects of quaternaryammonium ions on channel currents.
APPENDIX 1: ONE-DIMENSIONAL ANDTHREE-DIMENSIONAL FREE ENERGY PROFILES
The aim below is to determine the relationship between the three-
dimensional potential model that can be used in BD and the one-dimensionalfree energy profile obtained by using molecular dynamics calculations (9). In
BD, we model the three-dimensional potential as
UBDðx; y; zÞ ¼ UPMFðzÞ1USRðx; y; zÞ; (12)
where UPMF(z) is an arbitrary one-dimensional potential, and USR(x, y, z)models the short-range forces due to the channel walls. We wish to
determine the potential UPMF(z) so that the one-dimensional energy profile
corresponding to Eq. 12 is equal to the one-dimensional free energy profiledetermined by molecular dynamics. As the free energy profile already
includes an entropic component, we need to calculate the equivalent entropic
component in BD. To do this, we must find the probability that the TEA
resides within each cross-sectional area of the KcsA channel.We start with the one-dimensional free energy profile obtained by using
molecular dynamics. In one dimension, and at equilibrium, the probability of
finding an ion per unit length is
P1dðzÞ ¼k1dL0
exp½!bG1dðzÞ'; (13)
where G1d(z) ¼ GPMF(z) is the free energy in one dimension taken from
Crouzy et al. (9), and b¼ 1/kT. Here, k1d is a normalization constant, and L0is a reference length.
Even though profiles generated by WHAM analysis of moleculardynamics simulations are described as potentials of mean force, the nature of
the analysis means that they reflect the probability of finding an ion at
positions along the reaction coordinate, rather than the average (systematic)
force along the reaction coordinate. In other words, they are free energyprofiles, not potential energy profiles, and include an entropic component
which depends on the effective cross-sectional area,
GPMFðzÞ ¼ UPMFðzÞ ! TSPMFðzÞ; (14)
where UPMF(z) is the potential energy, T is the absolute temperature, and
!TSPMF is the entropic component of the free energy.
In the case of hard boundaries, this entropic component is given by
TSPMFðzÞ ¼ b!1lnðAPMFðzÞ=A0Þ; (15)
where APMF(z) is the cross-sectional area at each z position and A0 ¼ (L0)2 is
a reference area. A larger area gives a larger entropy which leads to a smallerfree energy and a greater probability (per unit length) of occupancy by an
ion.
Now consider the three-dimensional potential model that can be used in
BD. The probability of finding the TEA molecule per unit volume for anygiven cross section is
P3dðx; y; zÞ ¼k3dðL0Þ3
exp½!bG3dðx; y; zÞ'; (16)
where G3d ¼ UBD(x, y, z) is the free energy in three dimensions and k3d is anormalization constant. Again, this is only valid at equilibrium, but the
process of TEA binding and unbinding occurs at equilibrium.The one-dimensional and three-dimensional probabilities can be related
using
376 Hoyles et al.
Biophysical Journal 94(2) 366–378
P1dðzÞ ¼Z N
!N
Z N
!N
P3dðx; y; zÞdxdy: (17)
By substituting from Eqs. 13 and 16, this gives
k1dexp½!bG1dðzÞ'
¼ ðA0Þ!1
Z N
!N
Z N
!N
k3d exp½!bG3dðx; y; zÞ'dxdy: (18)
After applying the natural log, Eq. 18 becomes
lnðk1dÞ ! bG1dðzÞ
¼ lnðk3dÞ1 ln ðA0Þ!1
Z N
!N
Z N
!N
exp½!bG3dðx; y; zÞ'dxdy# $
:
(19)
Since G3d ¼ UBD(x, y, z) from Eq. 12, Eq. 19 becomes
lnðk1dÞ ! bG1dðzÞ ¼ lnðk3dÞ ! bUPMFðzÞ
1 ln ðA0Þ!1
Z N
!N
Z N
!N
exp½!bUSRðx; y; zÞ'dxdy# $
: (20)
After rearranging terms,
bUPMFðzÞ ! bG1dðzÞ ¼ lnðk3dÞ ! lnðk1dÞ
1 ln ðA0Þ!1
Z N
!N
Z N
!N
exp½!bUSRðx; y; zÞ'dxdy# $
: (21)
The integral is an effective cross-sectional area, taking into account the
short-range repulsive forces, rather than a hard boundary.
We assume that the channel has cylindrical symmetry such that
bUPMFðzÞ ! bG1dðzÞ ¼ lnðk3dÞ ! lnðk1dÞ
1 ln ðA0Þ!1
Z N
0
2prexp½!bUSRðrÞ'dr# $
: (22)
This assumption is justified since USR, the short-range forces from the BD
force field, have cylindrical symmetry. Because G1d(z) is the result fromCrouzy et al. (9), Eq. 22 represents the required correction needed to solve
for the UPMF(z) for use in BD simulations.
Eq. 22 can be rewritten as
bUPMFðzÞ ! bG1dðzÞ ¼ kG 1 lnARðzÞðA0Þ!1
! "; (23)
where
kG ¼ lnðk3dÞ ! lnðk1dÞ (24)
is the dimensionless free-energy offset, and
ARðzÞ ¼Z N
0
2prexp½!bUSRðr; zÞ'dr (25)
is the effective cross-sectional area, taking into account the short-range
forces.
To make use of Eq. 23 in a BD simulation, we need to set a value for kGso that the potential derived from the profile derived from moleculardynamics will match up with the potential from macroscopic electrostatics at
the limit of the potential of mean force. We assume that at zmax, the
extracellular limit of the free energy profile,
UPMFðzmaxÞ ! G1dðzmaxÞ ¼ 0; (26)
so that, from Eq. 23,
kG ¼ !lnARðzmaxÞ
A0
! ": (27)
APPENDIX 2: ESTIMATING THE INHIBITORYCONSTANT FROM PMF
It is possible to compute Pbind, the probability of a TEA being found in the
binding site, directly from the one-dimensional free energy profile and theconcentration of TEA in the reservoir. This in turn leads to an estimate for ki,the concentration at half inhibition, by setting Pbind ¼ 1/2.
We can estimate
Pbind ¼Z zmax
zmin
P1dðzÞdz; (28)
¼ k1dL0
Z zmax
zmin
exp½!bG1dðzÞ'dz: (29)
Since G1d(z)[ GPMF(z), all we need in addition to the free energy profile toestimate Pbind from this formula is an estimate of k1d.
From Eq. 23, we obtain
expb½UPMFðzÞ ! G1dðzÞ' ¼k3dk1d
ARðzÞA0
: (30)
But UPMF(zmax) – G1d(zmax) ¼ 0 from Eq. 26, so
k1d ¼ k3dARðzmaxÞ
A0
: (31)
We take k3d/V0¼ kRES, where V0¼ (L0)3, to be the TEA concentration in the
reservoir in appropriate units (number density). Then from Eqs. 29 and 31
Pbind ¼k3dV0
ARðzmaxÞZ zmax
zmin
exp½!bG1dðzÞ'dz: (32)
If Pbind ¼ 1/2, then ki ¼ k3d/V0 and
ki ¼ 2ARðzmaxÞZ zmax
zmin
exp½!bG1dðzÞ'dz# $!1
: (33)
We thank Dan Gordon for his helpful comments on the manuscripts.
This work was supported by grants from the National Health & Medical
Research Council of Australia. The calculations upon which this work is
based were carried out using the Itanium2 processors of the Australian
National University Supercomputing Facility.
REFERENCES
1. French, R. J., and J. J. Shoukimas. 1981. Blockage of squid axonpotassium conductance by internal tetra-n-alkylammonium ions ofvarious sizes. Biophys. J. 34:271–291.
2. Yellen, G., M. E. Jurman, T. Abramson, and R. MacKinnon. 1991.Mutations affecting internal TEA blockade identify the probable pore-forming region of a K1 channel. Science. 25:939–942.
3. Heginbotham, L., and R. MacKinnon. 1992. The aromatic binding sitefor tetraethylammonium ion on potassium channels. Neuron. 8:483–491.
Tetraethylammonium in KcsA K1 Channel 377
Biophysical Journal 94(2) 366–378
4. MacKinnon, R., and G. Yellen. 1990. Mutations affecting TEAblockade and ion permeation in voltage-activated K1 channels.Science. 250:276–279.
5. Heginbotham, L., M. LeMasurier, L. Kolmakova-Partensky, and C.Miller. 1999. Single Streptomyces lividans K1 channels: Functionalasymmetries and sidedness of proton activation. J. Gen. Physiol. 114:551–559.
6. Ikeda, S. R., and S. J. Korn. 1995. Influence of permeating ions onpotassium channel block by external tetraethylammonium. J. Physiol.486:267–272.
7. Immke, D., M. J. Wood, L. Kiss, and S. J. Korn. 1999. Potassium-dependent changes in the conformation of the Kv2.1 potassium channelpore. J. Gen. Physiol. 113:819–836.
8. Meuser, D., H. Splitt, R. Wagner, and H. Schrempf. 1999. Exploringthe open pore of the potassium channel from Streptomyces lividans.FEBS Lett. 462:447–452.
9. Crouzy, S., S. Berneche, and B. Roux. 2001. Extracellular blockade ofK1 channels by TEA: results from molecular dynamics simulations ofthe KcsA channel. J. Gen. Physiol. 118:207–217.
10. Luzhkov, V. B., and J. Aqvist. 2001. Mechanisms of tetraethylammo-nium ion block in the KcsA potassium channel. FEBS Lett. 495:191–196.
11. Ahern, C. A., A. L. Eastwood, H. A. Lester, D. A. Dougherty, and R.Horn. 2006. A cation-p interaction between extracellular TEA and anaromatic residue in potassium channels. J. Gen. Physiol. 128:649–657.
12. Consiglio, J., P. Andalib, and S. J. Korn. 2003. Influence of poreresidues on permeation properties in the Kv2.1 potassium channel.Evidence for a selective functional interaction of K1 with the outervestibule. J. Gen. Physiol. 121:111–124.
13. Cha, A., and F. Bezanilla. 1997. Characterizing voltage-dependentconformational changes in the Shaker K1 channel with fluorescence.Neuron. 19:1127–1140.
14. Yellen, G., D. Sodickson, T.-Y. Chen, and M. E. Jurman. 1994. Anengineered cysteine in the external mouth of a K1 channel allowsinactivation to be modulated by metal binding. Biophys. J. 66:1068–1075.
15. Kiss, L., and S. J. Korn. 1998. Modulation of C-type inactivation byK1 at the potassium channel selectivity filter. Biophys. J. 74:1840–1849.
16. Chung, S. H., J. B. Moore, L. Xia, L. S. Premkumar, and P. W. Gage.1990. Characterization of single channel currents using digital signalprocessing techniques based on hidden Markov models. Philos. Trans.R. Soc. Lond. B Biol. Sci. B329:256–285.
17. Chung, S. H., V. Krishnamurthy, and J. B. Moore. 1991. Adaptiveprocessing techniques based on hidden Markov models for character-izing very small channel currents in noise and deterministic interfer-ences. Philos. Trans. R. Soc. Lond. B Biol. Sci. B334:243–284.
18. Chung, S. H., T. W. Allen, and S. Kuyucak. 2002. Conducting-stateproperties of the KcsA potassium channel from molecular andBrownian dynamics simulations. Biophys. J. 82:628–645.
19. Doyle, D. A., J. M. Cabral, R. A. Pfuetzner, A. Kuo, J. M. Gulbis, S. L.Cohen, B. T. Chait, and R. MacKinnon. 1998. The structure of the
potassium channel: molecular basis of K1 conduction and selectivity.Science. 280:69–77.
20. Li, S. C., M. Hoyles, S. Kuyucak, and S. H. Chung. 1998. Browniandynamics study of ion transport in the vestibule of membrane channels.Biophys. J. 74:37–47.
21. Hoyles, M., S. Kuyucak, and S. H. Chung. 1998. Computer simulationof ion conductance in membrane channels. Phys. Rev. E58:3654–3661.
22. Chung, S. H., T. Allen, M. Hoyles, and S. Kuyucak. 1999. Permeationof ions across the potassium channels: Brownian dynamics studies.Biophys. J. 80:2517–2533.
23. Chung, S. H., T. W. Allen, and S. Kuyucak. 2002. Modeling diverserange of potassium channels with Brownian dynamics. Biophys. J.83:263–277.
24. Hoyles, M., S. Kuyucak, and S. H. Chung. 1996. Energy barrierpresented to ions by the vestibule of the biological membrane channel.Biophys. J. 70:1628–1642.
25. Stillinger, F. H., and A. Rahman. 1974. Improved simulation of liquidwater by molecular dynamics. J. Chem. Phys. 60:1545–1557.
26. Guardia, E., R. Rey, and J. A. Padro. 1991. Potential of mean force byconstrained molecular dynamics: a sodium chloride ion-pair in water.Chem. Phys. 155:187–195.
27. Guardia, E., R. Rey, and J. A. Padro. 1991. Na1-Na1 and Cl!-Cl! ionpairs in water: mean force potentials by constrained molecular dy-namics. J. Chem. Phys. 95:2823–2831.
28. Corry, B., T. W. Allen, S. Kuyucak, and S. H. Chung. 2001.Mechanisms of permeation and selectivity in calcium channels.Biophys. J. 80:195–214.
29. Hille, B. 2001. Ion Channels of Excitable Membranes. SinauerAssociates, Sunderland, MA.
30. Press, W. H., B. P. Flannery, S. A. Teukolsky, and W. T. Vetterling.1993. Numerical Recipes. Cambridge University Press, New York.
31. Im, W., S. Seefeld, and B. Roux. 2000. A grand canonical MonteCarlo-Brownian dynamics algorithm for simulating ion channels.Biophys. J. 79:788–801.
32. Corry, B., M. Hoyles, T. W. Allen, M. Walker, S. Kuyucak, and S. H.Chung. 2002. Reservoir boundaries in Brownian dynamics simulationsof ion channels. Biophys. J. 82:1975–1984.
33. Anderson, T. W., and D. A. Darling. 1952. Asymptotic theory ofcertain ‘‘goodness-of-fit’’ criteria based on stochastic process. Ann.Math. Stat. 23:193–212.
34. Beard, D. A., and T. Schlick. 2003. Unbiased rotational moves forrigid-body dynamics. Biophys. J. 85:2973–2976.
35. Ermak, D. L., and J. A. McCammon. 1978. Brownian dynamics withhydrodynamic interactions. J. Chem. Phys. 69:1352–1360.
36. Kumar, S., D. Bouzida, R. H. Swendsen, P. A. Kollman, and J. M.Rosenberg. 1992. The weighted histogram analysis method for free-energy calculations on biomolecules. I. The method. J. Comput. Chem.13:1011–1021.
37. Eisenberg, R. S. 1996. Computing the field in proteins and channels.J. Membr. Biol. 150:1–25.
378 Hoyles et al.
Biophysical Journal 94(2) 366–378


![Brownian Motion[1]](https://static.fdocuments.net/doc/165x107/577d35e21a28ab3a6b91ad47/brownian-motion1.jpg)