Brown Co. Shut Down Period
26
Bates College SCAB Walter Lawrance Papers Muskie Archives and Special Collections Library 10-1975 Brown Co. Shut Down Period Walter A. Lawrance Bates College Follow this and additional works at: hp://scarab.bates.edu/lawrance Part of the Earth Sciences Commons , and the Environmental Sciences Commons is Article is brought to you for free and open access by the Muskie Archives and Special Collections Library at SCAB. It has been accepted for inclusion in Walter Lawrance Papers by an authorized administrator of SCAB. For more information, please contact [email protected]. Recommended Citation Walter A. Lawrance Androscoggin River Studies irty ree Year Annual Report, October, 1975, Androscoggin River Studies, Box 7, Folder 2, Walter A. Lawrance Papers, Edmund S. Muskie Archives and Special Collections Library, Bates College, Lewiston, Maine.
Transcript of Brown Co. Shut Down Period

Bates CollegeSCARAB
Walter Lawrance Papers Muskie Archives and Special Collections Library
10-1975
Brown Co. Shut Down PeriodWalter A. LawranceBates College
Follow this and additional works at: http://scarab.bates.edu/lawrance
Part of the Earth Sciences Commons, and the Environmental Sciences Commons
This Article is brought to you for free and open access by the Muskie Archives and Special Collections Library at SCARAB. It has been accepted forinclusion in Walter Lawrance Papers by an authorized administrator of SCARAB. For more information, please contact [email protected].
Recommended CitationWalter A. Lawrance Androscoggin River Studies Thirty Three Year Annual Report, October, 1975, Androscoggin River Studies, Box 7,Folder 2, Walter A. Lawrance Papers, Edmund S. Muskie Archives and Special Collections Library, Bates College, Lewiston, Maine.

ANDROSCOGGIN RIVER AND POOL
BROWN COMPANY ' SHUT- DOWN ' PERIOD
and
RIVER WATER QUALITY
by
Walter A. Lawrance
Lewiston, Maine August twenty-three
1975
ANDROSCOGGIN RIVER AND POOL
BRmVN COM~ANY, 'DO'dN PERIOD'
June 2~ to July 15-16, 1975
Introduction Early in June Brown Company informed the
writer that their mills would be closed from
about June twenty-ei~ht to July fifteen 1975 . Plans were then
made to obtain water samples and conduct the usual tests and
measurements to provide data to evaluate changes in water quality
and the influence of bottom deposits in certain areas from Berlin ,
New Hampshire to Lewiston, !Jiaine .
Oxford Paper Company's Rumford mills were closed July three
and four and during this period there were no significant pollu
tion discharges to the river. The outflow valve at International
Paper Company's secondary lagoons at Jay was closed July three ,
four and five (mid-day). This report covers the period June
twenty-three to July twenty-eight; August two for the southern end
of the Pool . For comparisons the baRe period for all sampling
stations on the river and Pool is June twenty-three to twenty-seven
incluRive. Daily data for all sampling stations will be included
in the Annual Report for 1975 .
A. BERLIN, NE\'l . HM,1PS HIRE TO Rm1FORD tV. B. ) t !v1AINE
1 . BERLIN, N.H. River water entering the Berlin area contains
natural pollution usually less than one ppm
B.O.D.5 and dissolved oxygen usually above gO% saturation .

2
Location Period D. O. B. O. D. & Dates ppm lbs/day ppm lbs/day
Berlin Base Period 7. 9 76700 0 . 8 7220 6/23-276/30- 7/3 \'leek One 7 . 5 74930 1.0 10410 7/7-10 Week Two 7. 6 74590 0 . 5 5370 7/14-17 vleek Three 7. 9 81260 0.8 8230 7/21- 24 Week Four 7.5 75360 0 . 6 5600
Daily averages for the four week period, June 30 to July 24 ,
were B.0 . D. 5 0 . 7 ppm, 7400 lbs/day; Dis~olved Oxygen 7. 6 ppm,
76500 lbs/day; pH 6 . 6; Flow 1956 cfs, and Temperature 22 . 40 C.
2. GORHAl·~ IN. H.
Location Period D. O. B. O. D. & Dates ppm lbs/day ppm lbs/day
Gorham Base Period 5. 6 54270 9 . 7 94190 6/23-276/3Q-7/4 Week One 7. 2 71830 3. 7 36940 7/7-11 Week Two 7 . 2 71990 2 . 1 21120 7/14-18 Week Three 7.0 76040 4 . 7 49000 7/21-25 Week Four 5. 3 54750 8.1 R2850
During the first week of the 'shut-down' the average B. 0 . D. 5
pollution load in the river decreased about 57200 lbs/day (94l90
36940), and the dissolved oxygen increased 17500 lbs/day . An
additional reduction of l5g00 lbs/day of B.0.D.5 was recorded
during the second week; a total decrease of 73000 lbs/day when
compared to the base load . The dissolved oxygen present was sub
stantially the same during both weeks at 80% plus of saturation .
However , a daily loss of 5700 lbs . was recorded as the water
passed from Bridge Street to Gorham sampling station .
An estimate of the amount of B.0 . D. 5 contributed to the river
in the Bridge Street-Gorham stretch during two weeks of the shut
down may be made as follows:
3
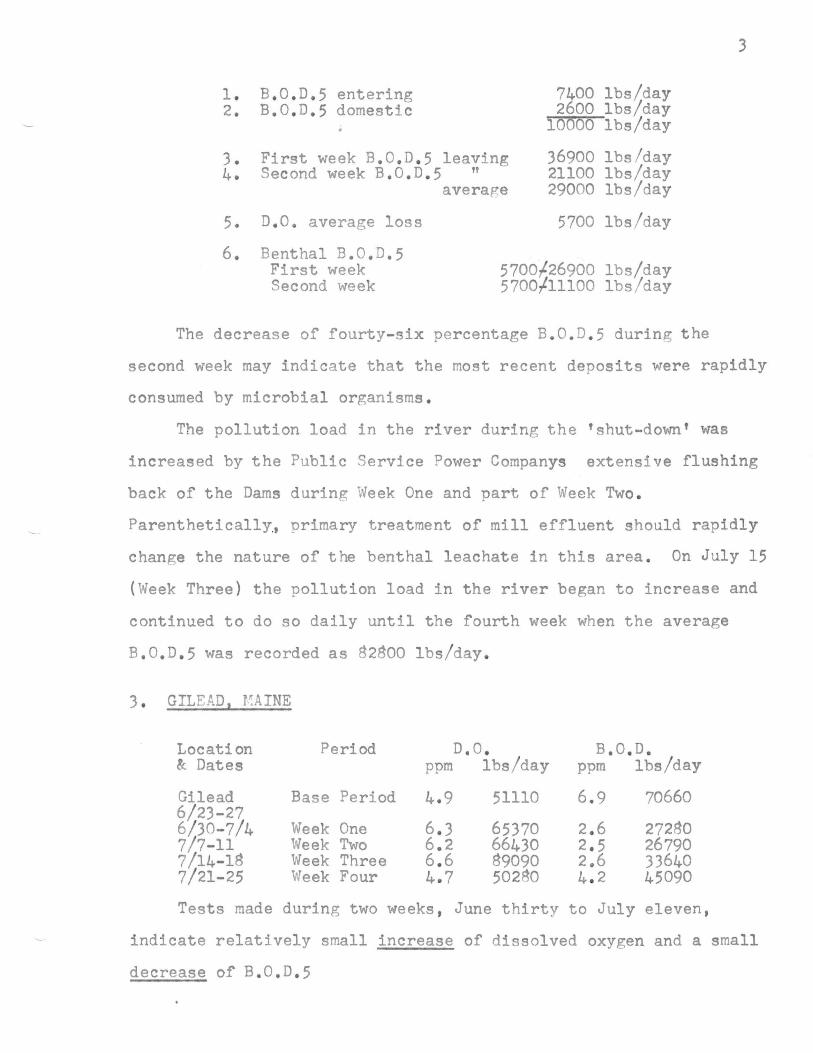
1 . B. 0 . D.5 entering 7400 lbs!day 2. B.0 . D.5 domestic 2600 lbs/day
10000 lbs/day
3 . First week B.0.D.5 leaving 36900 lbs/day 4. Second week B.0 . D. 5 " 21100 lbs!day
average 29000 lbs/day
5. D. O. average loss 5700 lbs/day
6. Benthal B.0.D.5 First week 5700f.26900 lbs!daySecond week 5700flllOO lbs!day
The decrease of fourty-six percentage B.0.D . 5 during the
second week may indicate that the most recent deposits were rapidly
consumed by microbial organisms .
The pollution load in the river during the 'shut-down' was
increased by the Public Service Power Companys extensive flushing
back of the Dams during Week One and part of Week Two .
Parenthetically., primary treatment of mill effluent should rapidly
change the nature of the benthal leachate in this area . On July 15
(Week Three) the pollution load in the river began to increase and
continued to do so daily until the fourth week when the average
B.0.D . 5 was recorded as g2g00 lbs/day .
3 . GILEAD I f·r:AINE
Location Period D. O. B. O. D. &. Dates ppm lbs/day ppm lbs/day
Gilead Base Period 4 . 9 51110 6 . 9 70660 6/23-276/30-7/4 Week One 6 . 3 65370 2. 6 272g0 7/7-11 Week Two 6 . 2 66430 2. 5 26790 7/l4-lg Week Three 6 . 6 g9090 2 . 6 33640 7/21-25 \'leek Four 4 . 7 502g0 4. 2 45090
Tests made during two weeks, June thirty to July eleven ,
indicate relatively small increase of dissolved oxygen and a small
decrease of B. 0 . D. 5

4
Water passing through the Gorham-Gilead stretch during Week
One, the B. 0 . D. 5 decreased 9660 lbs/day but in Week Two an increase
of 5670 lbs/day was recorded . For both weeks the net loss of
B.0 . D. 5 was about 4000 lbs/day, the Dissolved Oxygen loss averaged
5700 lbs/day. These statistics appear to indicate that bottom
deposits in this area were not as active as those in the Bridge
Street-Gorham sector .
Pollution Loads arriving at Gilead in Weeks Three and Four
were more uniform than those at Gorham . Flows were about 24%
higher in Week Three than those reported for the other three periods .
kl rates for the Gorham-Gilead sector were :
Base Period 0 . 21 Auwust 1974 0~'9First Week 0 . 23 1973 0 . 33 Second Week 1972 0 . 44 " Third Week 0.40 " 1971 0 . 46 Fourth Week 0 . 46 " 1970 0 . 43
kl for the Base Period (before shut - down) and the Week One
are approximately the same but the rates for Weeks Three and Four
(after start-up) are much higher and are about the same as those
calculated for this sector for August in previous years . Water
temperatures , flows concentrations of dissolved oxygen or bio
chemical oxygen demand in this series of tests , do not appear to
be an important cause of the variation in the kl rate . A change
in the concentration or type of nutrients may have been a control
ling factor .
5
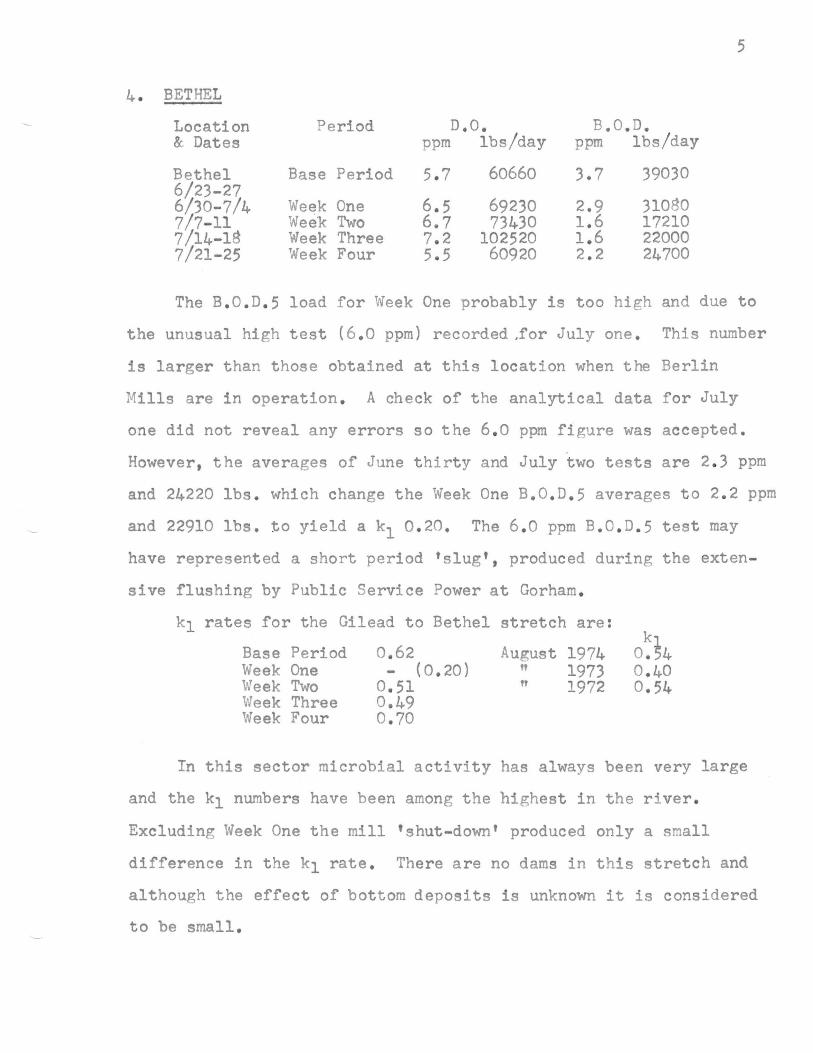
4 . BETHEL
Location Period D. O. B. O. D. &. Dates ppm lbs/day ppm 1bs/day
Bethel Base Period 5. 7 60660 3.7 39030 6/23-27 6/JO-7/4 Week One 6 . 5 69230 2. 9 3l0S0 7/7- 11 Week Two 6.7 73430 1 . 6 17210 7/l4-1S Week Three 7. 2 102520 1 . 6 22000 7/21-25 Week Four 5. 5 60920 2. 2 24700
The B. 0 . D. 5 load for Week One probably is too high and due to
the unusual high test (6 . 0 ppm) recorded ,for July one. This number
is larger than those obtained at this location when the Berlin
Mills are in operation . A check of the analytical data for July
one did not reveal any errors so the 6 . 0 ppm figure was accepted .
However . the averages of June thirty and July two tests are 2. 3 ppm
and 24220 lbs . which change the Week One B.0 . D. 5 averages to 2. 2 ppm
and 22910 lbs . to yield a kl 0 . 20 , The 6 , 0 ppm B. 0 . D. 5 test may
have represented a short period 'slug ', produced during the exten
sive flushing by Public Service Power at Gorham .
kl rates for the Gilead to Bethel stretch are :
Base Period 0 . 62 August 1974 0:~4 Week One (0 . 20) 1973 0 . 40 " ft\veek Two 0 . 51 1972 0 . 54 Week Three 0.49 Week Four 0 . 70
In this sector microbial activity has always been very large
and the kl numbers have been among the highest in the river .
Excluding \'1eek One the mill t shut- down t produced only a small
difference in the kl rate . There are no dams in this stretch and
although the effect of bottom deposits is unknown it is considered
to be small .
6
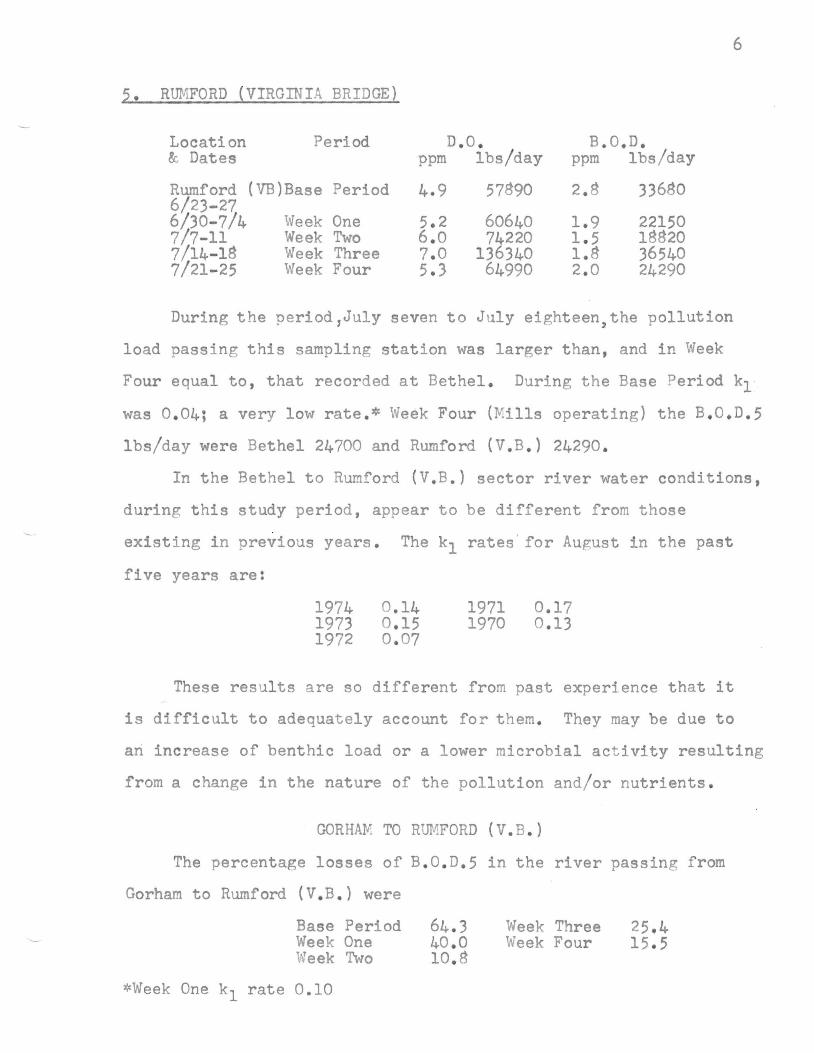
5, RUMFORD (VIRGINIA BRIDGE)
Location Period D. O. B. O.D . &. Dates ppm 1bs/day ppm 1bs/day
Rumford (VB)Base Period 4 . 9 57890 2. 8 33680 6/23-276/30-7/4 Week One 5. 2 60640 1 . 9 22150 7/7-11 Week Two 6 . 0 74220 1 . 5 18820 7/14- 18 Week Three 7. 0 136340 1. 8 36540 7/21- 25 Week Four 5 . 3 64990 2. 0 24290
During the period ,July seven to July eighteen,the pollution
load passing this sampling station was larger than , and in Week
Four equal to , that recorded at Bethel . During the Base Period kl
was 0 . 04; a very low rate . * Week Four (Mills operating) the B. 0 . D. 5
1bs/day were Bethel 24700 and Rumford (V.B . ) 24290 .
In the Bethel to Rumford (V , B. ) sector river water conditions,
during this study period, appear to be different from those
existing in previous years . The k1 rates ' for August in the past
five years are:
1974 0.14 1971 0 . 17 1973 0 . 15 1970 0 . 13 1972 0 . 07
These results are so different from past experience that it
is difficult to adequately account for them . They may be due to
an increase of benthic load or a lower microbial activity resulting
from a change in the nature of the pollution and/or nutrients .
GORHAM TO R~~FORD (V . B. )
The percentage losses of B. 0. D. 5 in the river passing from
Gorham to Rumford (V. B. ) were
Base Period Week One \lJeek Two
64 . 3 40 . 0 10. 8
Week Three Week Four
25 . 4 15 . 5
*Week One kl rate 0.10
7
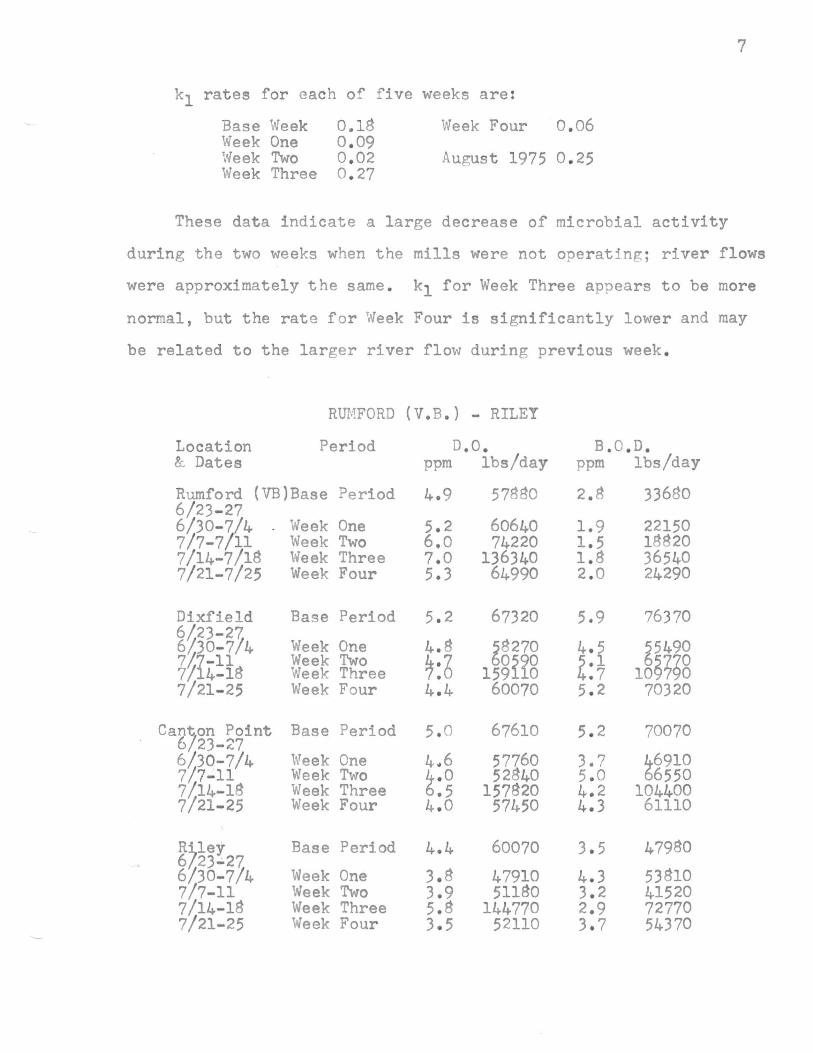
kl rates for each of five weeks are :
Base Week O.lS Week Four 0 . 06 Week One 0 . 09 Week Two 0 . 02 August 1975 0 . 25 Week Three 0 . 27
These data indicate a large decrease of microbial activity
during the two weeks when the mills were not operating; river flows
were approximately the same . kl for Week Three appears to be more
normal, but the rate for Week Four is significantly lower and may
be related to the larger river flow during previous week .
RUMFORD (V. B. ) - RILEY
Location Period D. O. B. O. D. &. Dates ppm lbs/day ppm lbs/day
Rumford (VB)Base Period 6/23- 27 6/30 7/4 V{eek One 7/ 7- 7/ 11 \'1eek Two 7/l4-7/1S Week Three 7/21-7/25 Week Four
4 . 9
5. 2 6.0 7 . 0 5. 3
57SS0
60640 74220
136340 64990
2. 8
1 . 9 1 . 5 1 . S 2. 0
336S0
22150 l8S20 36540 24290
Dixfield Base Period 5. 2 67320 5.9 76370 6%23- 2/6 30- 7 4 7~i-l1S7 4- 1 7/21 25
Week One Week Two Week Three Week Four
4. S
~ : 6 4. 4
lS270 15~1ig60070
4 . 5 , . 1 . 7 5. 2
g5490 10~~~g
70320
Canjon Point 6 23-27
Base Period 5. 0 67610 5. 2 70070
6/.30-7/47/'7-117/.14-lS7/21- 25
\\Teek One Week Two Week Three Week Four
4 . 6 ~ . O
. 5 4 . 0
57760 52840
157820 57450
3.7 5.0 4. 2 4. 3
~69l06550
104400 61110
Rlley6 23..;.27 6/.30- 7/47/7-117/14 18 7/21-25
Base Period
Week One Week Two Week Three Week Four
4. 4
3. 8 3. 9 5. 8 3. 5
60070
47910 5llS0
144770 52110
3. 5
4 . 3 3. 2 2. 9 3. 7
47980
53810 41520 72770 54370
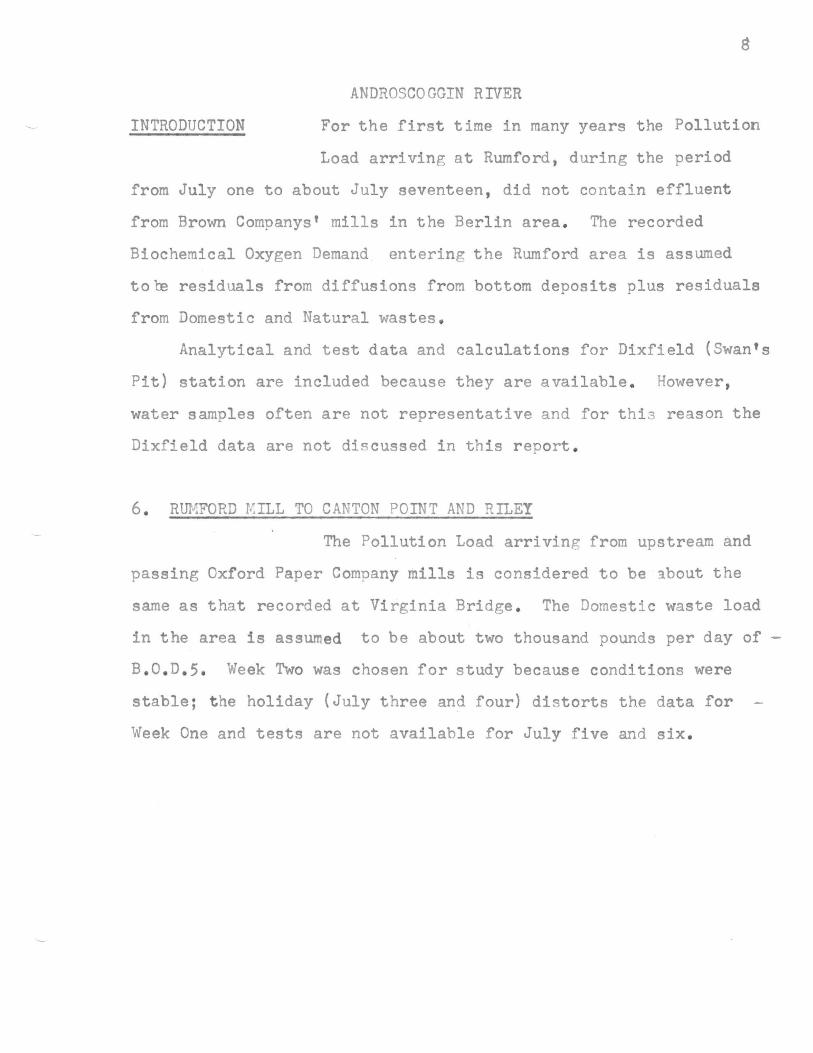
ANDROSCOGGIN RIVER
INTRODUCTION For the first time in many years the Pollution
Load arriving at Rumford, during the period
from July one to about July seventeen, did not contain effluent
from Brown Companyst mills in the Berlin area . The recorded
Biochemical Oxygen Demand entering the Rumford area is assumed
to 1:e residuals from diffusions from bottom deposits plus residuals
from Domestic and Natural wastes .
Analytical and test data and calculations for Dixfield (Swan t s
Pit) station are included because they are available . However ,
water samples often are not representative and for thia reason the
Dixfield data are not discussed in this report .
6 . RUlv!FORD rl,. ILL TO CANTON POINT AND RILEY
The Pollution Load arriving from upstream and
passing Oxford Paper Company mills is considered to be ~bout the
same as that recorded at Virginia Bridge . The Domestic waste load
in the area is assumed to be about two thousand pounds per day of
B. O. D. 5. Week Two was chosen for study because conditions were
stable; the holiday (July three and four) distorts the data for
Week One and tests are not available for July five and six .

9
Rumford 1-1111 area B. 0 . D. 5 lSSOO lbs/dayDomestic B. 0 . D. 5 2000 " " 20S00 n "
Canton Point B. 0 . D. 5 66550 lbs/dayLoss Mill to C. P. (estm) 26~20 " " 92 70 " "
Less 20S00 " " Oxford Paper Company 72170 " " Pollution to River
Week Two kl 0 . 25 lbs/day
Rumford Mill area 20S00 lbs/day
Riley Dam B. 0.D . 5 41520 " " Loss ~ill to Riley Dam (estm) ~1~20 " " 92-70 " " Less 20S00 " " Oxford Paper Company 72170 " " Pollution to River
Week Two August 1974
The same kl rate was assumed for both Rumford- Canton , and
Rumford-Riley stretches of the river, during Week Two .
Brown Company shut-down and smaller B. 0 . D. 5 did not appreciably
change the microbial oxidation rate (kl ) in the Rumford- Riley
sector. The available dissolved oxygen was considerably more
than the five day biochemical demand at all times during the period
studied and no change of temperature , there does not seem to be
any reason why a change of rate should be expected .
The large increase of dissolved oxygen during Week Three is
due to local heavy precipitation which resulted in a sixty-three
percentage increase of flow at Rumford and a fifty- four percentage
increase at Riley Darn .
During the five week period, which includes a week of pro
duction , the seventeen day 'shut-down ' , and almost two weeks of
production by Brown Company, the kl rate in the Rumford Mill- Riley

10
Dam stretch did not apprecibly change .
The quantity and extent of bottom deposits in this sector are
unknown, however they are present for an unknown distance upstream
from Riley Dam .
RILEY - CHISHOLM - LIVERMORE FALLS
Location Period D. O. B. 0. D. 5 &. Dates ppm Ibs/day ppm Ibs/day
Riley Base Period 4.4 60075 3 . 5 47980 6/23-276/30- 7/4 First Week 3. 8 47910 4. 3 53810 7/7-11 Second Week 3. 9 51180 3. 2 41520 7/14-18 Third Week 5. 8 144770 2. 9 72770 7/21- 25 Fourth \\'eek 3. 5 52110 3. 7 54370
Jay Base Period 6 . 5 89915 3. 9 53825 6/23-276/30-7/4 First Week 6 . 2 78370 3. 6 45360 7/7-11 Second Week 5. 8 76960 3. 3 42850 7/14-18 Third Week 7 . 4 188310 3. 3 85330 7/21-25 Fourth Week 5. 9 87300 3.1 45490
Chisholm Base Period 5. 7 79288 5. 6 78410 (Otis)6/23-276/30-714 First \\'eek S1230 4 . 3 550006 . ~ 7/7-11 Second Week 5. 75160 5. 3 68970 7/14-18 Third Week 7. 1 180230 4. 6 112960 7/21- 25 Fourth Week 5. 5 81030 3. 7 55380
Livermore Base Period 6 . 7 92920 5. 8 80770 Falls ~23-27 6/30-7 4 First Week 6 . 5 82550 4 . 7 60580 7/7- 11 Second Week 6 . 6 87660 5. 5 78890 7/14-18 Third Week 7. 8 197890 4. 5 117350 7/21-25 Fourth Week 6 . 5 95740 3. 7 55180
INTRODUCTION Statistics for the Riley-Otis sector include
dissolved oxygen and upstream pollution (B . 0 . D. 5)
and the effluent from the secondary lagoons at Jay . Otis to
Livennore Falls statistics include data f rom upstream and the Otis
Mill . Aeration at Riley Dam during the four weeks, June thirty to
July twenty-five , produced an average increase of 35680 lbs/day of

11
dissolved oxygen . Minimum available oxygen at Livermore Falls for
the same period was 5. 1 ppm and the daily average 6 , 8 ppm .
Statistics obtained from water sampled at Jay are included
but are not discussed, because they are at times not considered
to be representative of the river water passing this station .
RILEY TO LIVERMORE FALLS
BIOCHE~;jICAL OXYGEN DE1J:AND Five Day 200 C lbs/day
Period Riley to Jay Jay to Otis Riley to Otis
Base Period .J 5840 ~24590 ~30430 Week One - 8450 f.. 9640 ;,t. 1190 Week Two I-. 1330 1-.26120 ~27450 Week Three f12560 1-.24630 f.40l90 \'leek Four - 8880 f 9890 :;. 1010
These statistical variations are very large and are almost
impossible to interpret . From July three , 8:00 a . m, to July 5.
1:00 p . m. ~ay) the secondary lagoon valve was closed and no
effluent from the mill entered the river . The average two day
pollution load B. 0. D. 5 at Riley was 61050 lbs/day , at Otis for the
same period was 50610 lbs/day , a loss of 17. 2% and a kl 0 . 12.
However,due to sampling time at Otis the July three B. 0 . D. 5 does
not include the effect of the shut-down at Jay on July three .
Data obtained July four at Riley was 71097 lbs/day and 52017 lbs/day
at Otis; a loss of 26 . 9% and a kl 0 . 18 . ronfortunately no samples
were taken on July five.) For what it is worth, (probably very
little) . Weeks One, Two and Four the average B.0 . D. 5 increase, Riley .
to Otis , is ~9880 lbs/day , assuming a 26 . 9% loss the average
increase for the period was 9880~2660 or 12540 lbs/day , which may
indicate the extent of the outflow from the secondary lagoons .

12
Week Three is not included because of the sudden increase of
river flows which forced large volumes of polluted water through
the area , and later replaced in Week Four with a lower pollution
load.
OTIS TO LIVER!·~ORE FALLS
BIOCHEr~ICAL OXYGEN DE~!AND Five day 200 C lbs/day
Period Otis (into) Livermore Falls Change
Base Period 78410 80770 ,[2360
Week One 55000 60580 ~5580 Week Two Week Three
68970 112960
78890 117350
/..9920f4390
\V'eek Four 55380 55180 - 200
Week Two appears to be representative of stable conditions .
Week One includes holiday period at both mills, Jay and Otis .
Week Three results are distorted by a ninety percentage increase
of flow, and the reports for Week Four are not typical .
OTIS MILL
Week Two July 7-11 incl.
Chisholm (into) B.0.D . 5 total 68970 Ibs/dayLivermore Falls B.0.D.5 total 78890 " "
Increase 9920" "
Loss Otis to Livermore Falls estm. 2080 " " Otis Pollution Load to river 12000""
The distance from the sampling station at the Otis ~ill
intake to Livermore Falls is approximately one mile, and it is
assumed that the samples are representative of the pollution loads .

13
ANDROSCOGGIN POOL
LIVERMORE FALLS TO DEER RIPS DAM
Introduction Sampling stations in this area are (Livermore
Falls), North Turner Bridge , Mile 9 . 25
(limited) , Turner Center Bridge, Mile 6 . 0 (limited), Mile 4. 25 ,
Mile 2. 5 and Deer Rips Dam .
The objectives for this sector are (1) to determine the effects
of the Brown Company shut-down upon the conditions existing in the
Androscoggin Pool and (2) to obtain additional information on
benthal demands, and on the Time of Passage through the Pool .
Interpretation of the data is complicated by the sudden rapid
rise of inflow July 13 to 18 inclusive which crested at 7070 cfs
on July 15 . River flows did not vary during Week One; Week Two
flows were about two hundred cfs larger than the previous week .
The smallest pollution load recorded at North Turner was
25640 1bs/day Sunday, July six, when the water from Berlin and
Rumford areas which had not received pollution from the mills was
entering into the Pool .
Saturday July five 32390 Ibs/day B.0 . D. 5 Sunday July six 25640 " " " Monday July seven 28490 " " "
River water passing through the Berlin area on June 28 arrived at
North Turner sometime on July four .

14
BIOCHD~ ICAL OXYGEN DEMAND Five day 200 C Ibs/day
Period Livermore Falls North Turner Decrease kl
Base Period g0770 41440 -39330 0 . 39 Week One 605g0 30gg0 -29700 0 . 32 \'leek Two 7gg90 30990 -47900 0 .. 54 Week Three 117350 46750 -70600 0 . 64 Week Four 551g0 33120 -22060 0 . 33
Average (5) 7g550 36640 -41910 0 . 44
kl rates are very high and the average for the five week
period (0 . 44) is three times larger than the 0 . 15 recorded for
August 1974, but is approximately the same as those calculated for
August 1973 (0 . 46) and 1972, (0 . 41).
First consideration of the statistics appeared to only indicate
a return to a more 'normal' kl rate but about July thirty an algae
problem arose in the southern end of the Pool which may be related
to the same causal factors as the rapid reduction of B.0.D . 5 in the
Livermore Falls-North Turner sector. (cf Special preliminary
statement at the end of this Report . )
NORTH TURNER - TURNER CENTER BRIDGES
Location Period D. O. B.0.D. 5 & Dates ppm lbs/day ppm lbs/day
North Turner Base Period 5.6 79070 2. 9 41440 Bridge 6/23 - 2g 6%10-7/6 Week One 5. 7 ~2g30 2 . ~ 30gg07 - 12 Week Two 5.7 1500 2. 30990" 7/14-19 Week Three 7.1 191660 l.g 46750 7/21- 26 Week Four 5. 6 g5090 2. 2 33120
Mile 9. 25 July 3-6 Incl . 4.7 59760 2.6 32190 July 7-12 Incl . 5. 2 2. 4 337g0l4§90 2.1July 22-26 " 4. 6 9 90 31450
Turner C,nter Base Period 4 . 0 609g0 2. 6 3g920Bridge 6 23 - 2g 6~~0-7/6 Week One 2. 1 2g7207 -12 Week Two j : ~ ~~~ig 2. 0 29590 7/14- 19 Week Three 6 . 3 179570 1 . 7 4g520 7/21- 27 Week Four 4.0 64360 l.g 29070

15
A limited number of water samples were obtained at Y.ile 9 . 25,
upstream from the point where the Nezinscot river enters the Pool .
The data \>lere collected for a study of the effect of the inflow
from the Nezinscot to be included in the Annual Report for 1975.
BIOCHEt-'l ICAL OXYGEN DD1AND
Period North Turner Turner Center Change
Base Period 41440 lbs/day 38920 lbs/day -2520
Week One 30SS0 28720 tf -2160" " " \'leek Two 30990 29590 tf -1400" " " Week Three 46750 48520 It ,[1770" " " Week Four 33120 29070 ft -4050" " "
At Turner Center the smallest pollution load recorded during this
Saturday July five B.0 . D.5 28620 Sunday July six B.O.D.5 22780 rt.onday July seven B.O.D.5 29680
study was 22784. lbs/day . The time coincided with the Oxford Paper
Company's holiday 'shut-down' with that of Brown Company's 'shut
down' and International's 'shut-off'. Berlin area 'low' polluted
water was passing this station from about July five to July twenty .
The small reduction of pollution between these two stations
and the large loss of dissolved oxygen indicate sub~tantial benthic
demands . During the stable Week Two, dissolved oxygen decrease
was 22690 lbs/day accompanied with a very small loss of 1400 lbs/day
of B. 0.D . 5
'Floaters' and gassing although somewhat less noticeable were
almost always present during the period of this project .
kl calculated for the five week average but not corrected for
the Nezinscot river inflow etc . is 0 . 22, the 1974 August kl is 0 .35
(corrected) The average daily inflow for the period June 30 to
July 26 was about 300 cfs.

16
TURNER CENTER TO MILE 4 . 25
Water samples were taken at Mile six from July seven to July
twenty- seven to obtain data for the Benthal contribution to the
River in this area; an analysis of the results will be reported
later .
Location Period D. O. B. O. D. 5 & Dates ppm Ibs/day ppm Ibs/dau
Mile 6 7/3-6 Week One 3. 1 40780 2. 1 27350 7!7- 13 \'leek Two 3. 5 57090 2. 0 31280 7/14- 19 Week Three 6 . 0 172190 1 . 6 43570 7/21- 27 \'leek Four 3. 4 54740 1 . 7 27140
DISSOLVED OXYGEN AND BIOCHE~!~ICAL OXYGEN DEMAND
TURNER CENTER TO 11: ILE 4. 25
Period D. O. Decrease B. 0 . D. 5 Change Ibs/day 1bs/day
Base Period -24320 - 2200 Week One - 25060 - 1680 Week Two -24010 ,[3390Week Three -19050 -4270 Week Four - 19680 -1140
Benthal in this area is active during the warm weather and
especially during June and July. 'Floaters ' are usually present
and gas is evolved in a large area at rUle five , however, this year
a considerable decrease of activity has occurred . The large de
crease of measured dissolved oxygen and a relatively small decrease ,
of B. 0 . D. 5, still indicate a substantial benthal contribution to
the pollution load in this area . During Week Two the average B. 0 .D.5
was 3390 lbs/day larger at Mile 4 . 25 than that recorded for Turner
Center . This daily increase occurred concurrently with a decrease
22300 lbs . of dissolved oxygen .

17
The pollution t1ow' during the four weeks was again July six .
Saturday July five B. O. D. S 27270 lbs Sunday July six B.0.D.5 19000 " Monday July seVen B. 0.D . 5 20606 "
MILE 4. 25 TO MILE 2. 50
Location Period D. O. B,,0 . D. 5 & Dates ppm 1bs/day ppm 1bs/day
~U1e 4. 25 Base Period 2. 3 36660 2.4 36720 6!23-2g6/30- 7/6 Week One 1 . 6 21010 2. 0 27040 7/7-13 Week Two 2.1 34g00 2.0 329g07/14-19 Week Three 5. 4 153140 1 . 6 44250 7/21-27 Week Four 2. 7 446g0 1 . g 27930
Mile 2. 5 Base Period 1.5 23090 2.1 32930 6!23- 2g 6/30-7/6 Week One 0 . 7 9g50 1 . 6 21900 7/7-7/13 Week Two 0 . 6 10170 1.5 24270 7/14-7/19 Week Three 3. 9 9g260 1 . 4 37460 7/21- 27 Week Four 2. 2 366g0 1 . 4 22430 7!2g-g/2 Week Five O. g 11300 1 . 6 21970
Deer Rips Dam Base Period 2.0 30650 1 . 5 21610 6!23-2g6/30-7/6 Week One 0 . 6 Sl10 1 . 4 19540 7/'7-13 \~eek Two 0 . 5 glg0 1. 4 22970 7/14-19 Week Three 91510 1 . 3 370303 . ~ 7/21-27 Week Four 2. 43330 1. 0 156g07!2g-g/2 Week Five 1 . 4 19170 1.1 14620
This area contains the largest accumulations of bottom de
posits in the Pool and they are very active from late in May to
about the end of July and less active to about September fifteen .
Gassing 1s always visible, 'floaters' were numerous but were smaller
than those observed in previous years .

DISSOLVED OXYGEN AND BIOCHEr,nCAL OXYGEN Df1.!AND
MILE 4 . 25 TO MILE 2. 5
Period D. O. decrease B. 0.D . 5 decrease
Base Period -13570 lbs/day -3790 lbs/dayWeek One -11160" " -2110 " " Week Two - 24360 " " -~710 " " Week Three -54880 - 6790" " " " Week Four -8000 - 5500" " " "
The benthic contribution to the pollution load is evident
from the large dissolved oxygen losses and the small net loss of
biochemical oxygen demand . Examination of the daily data to
discover any evidence of an appreciable decrease of pollution load ,
due to the Brown Company's 'shut-down', revealed that excluding
Week Three the pollution at Mile 2. 5 was not significantly different
until Weeks Four and Five . Berlin water leaving on June twenty
eight should have arrived at Mile 2. 5 about July ten and the 'shut
down ' period effect should have been observed to about July twenty
six. The relatively large flows July twelve to eighteen created
unstable conditions during Week Three . Significant reductions of
B. 0.D . 5 were recorded for Weeks Four and Five at Mile 2. 5 and again
at Deer Rips Dam. A portion of these reductions are due to the
aftermath effects of B.0.D . 5 removal during Week Three . The rapid
increase of flow at North Turner began on July 12 and a few hours
later the ' hydraulic effect' arrived at Gulf Island Dam which
increased the flow and B.O . D. removal in the southern end of the
Pool . When the water from North Turner did arrive at the dam the
diluted pollution had a lower biochemical oxygen demand .
The smallest B. 0 . D. 5 load at !~:i1e 2.5 was recorded July eight .
The three day statistics are of interest because of the large

19
decrease and subsequent increase.
Monday July seven B.0.D.5 20610 lbs. Tuesday July eight B.0.D.5 13750 ft
Wednesday July nine B.0.D.5 2S240 "
r,ULE 2. 5 TO DEER RIPS DAM
Upstream Industrial pollution is in the last stages of oxida
tion when the river water passes Deer Rips . However, when the
flow is tlow' and temperatures are high the bentha1 demand reduces
the available oxygen so it , plus industrial residuals, may give
rise to odor forming conditions . This year from July three to
July eleven, Hydrogen Sulfide was observed in low concentrations
at Gulf Island Dam.
DISSOLVED OXYGEN AND BIOCHEKICAL DEHAND
Period D. O. Change B.0.D . 5 Decrease
Base Period !-7560 lbs!day -11320 lbs!day
Week One -1760 6390" " " " Week Two -1990 " " - 1300 ft " Week Three -6750 430" " " " Week Four ~6650 " " - 6740 " " Week Five f.7870 ft - 7350" " " The improvement recorded in Week Four probably is due, in part,
to the flushing of soluble pollution during Week Three aided by a
small (1500 1bs . ? B.0.D.5) reduction relatable to the 'shut-down'.
Statistics for Week Five are included to record here the low pol
lution load passing rl.i1e 2.5 and Deer Rips Dam.
Theoretical calculation of the probable reduction of a pollu
tion load originating in the Berlin area and later passing Deer
Rips Dam under summer temperatures in river and Pool indicate that
about 65% should be oxidized between Gorham and Rumford (V.B.) and
about 95% of the remainder should be oxidized between Rumford (V.B.)
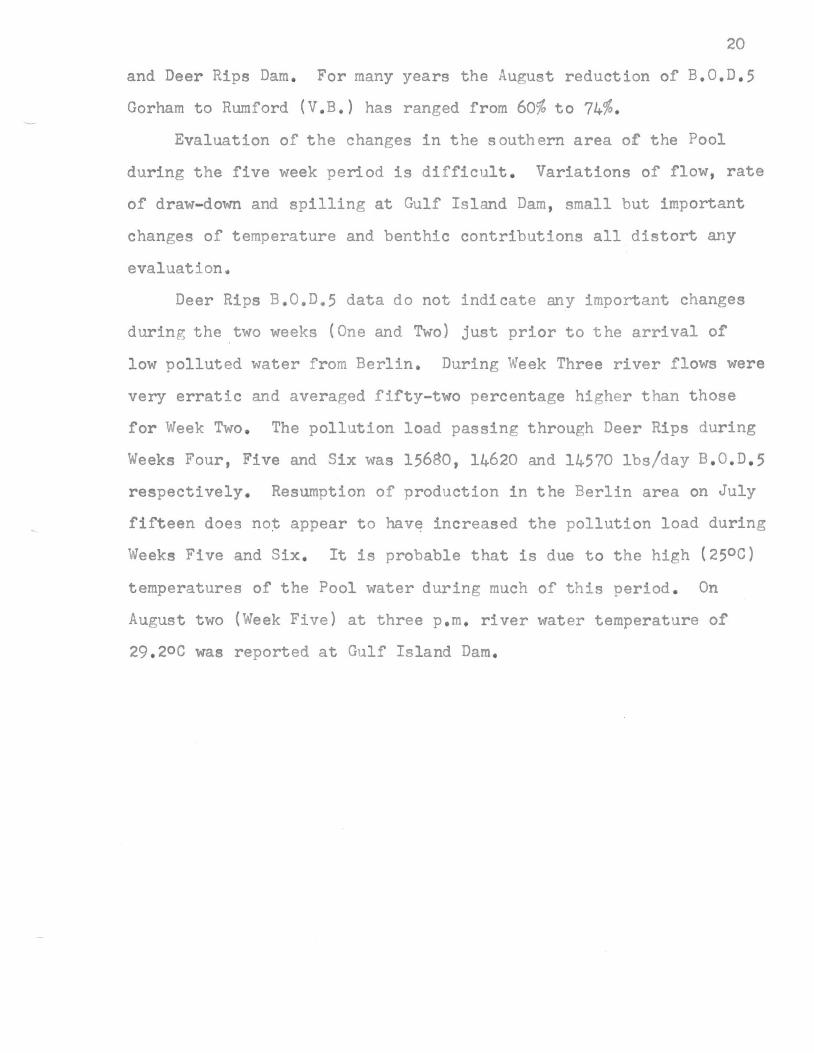
20
and Deer Rips Dam . For many years the August reduction of B.0.D . 5
Gorham to Rumford (V . B.) has ranged from 60% to 74%.
Evaluation of the changes in the southern area of the Pool
during the five week period is difficult . Variations of flow, rate
of draw-down and spilling at Gulf Island Dam, small but important
changes of temperature and benthic contributions all distort any
evaluation.
Deer Rips B.0.D.5 data do not indicate any important changes
during the two weeks (One and Two) just prior to the arrival of
low polluted water from Berlin. During Week Three river flows were
very erratic and averaged fifty-two percentage higher than those
for Week Two . The pollution load passing through Deer Rips during
Weeks Four, Five and Six was 15680, 14620 and 14570 lbs/day B. 0.D . 5
respectively. Resumption of production in the Berlin area on July
fifteen does not appear to hav~ increased the pollution load during
Weeks Five and Six . It is probable that is due to the high (250C)
temperatures of the Pool water during much of this period . On
August two (Week Five) at three p.m . river water temperature of
29 . 20C was reported at Gulf Island Dam.

21
ANDROSCOGGIN RIVER AND POOL
June 23 to August 2 , 1975
SUMMARY
1 . BERLIN, NEW HA?l.PSHIRE TO RtJ1.1FORD (V. B. ), ~~AINE
a . The measured average B. 0 . D.5 increase from Bridge Street , Berlin to Gorham was 24700 1bs/day during two weeks of the 'shut-down'. When corrected for incoming and domestic oxygen demands the average is reduced to about 14700 1bs/day which must have originated in the bottom deposits of the river .
b . Microbial Activity
Location Base Per. Wk1 Wk 2 \t/k 3 Wk4
Gorham- Gilead Sub- Norm Sub- Norm Normal r~ormal Gilead-Bethel Normal Normal Normal Normal Bethel- Rumford Sub-Norm Gorham-Rumford Normal Sub-Norm Sub-Norm Normal Normal
c . Gorham to Rumford (V . B. )
Percentage reduction of B. 0 . D. 5: Base Period 64 . 3; Week One, 40 . 0; Week Two, 10 . S; Week Three 25 . 4; Week Four, 15 . 5
2. Rm.~FORD (V . B.) TO RILEY DAM
Pollution to the river from the Rumford ~il1s during Week Two was calculated as about 72000 1bs. B. 0 . D. 5 oer day . ~ of reduction of Oxford Paper Company's wastes in this sector was not appreCiably changed during Brown Company 's 'shut-down'. cf Week Two data .
3 . RILEY DAM TO LIVEm.·:ORE FALLS.
On July four the k1 rate Riley to Otis was O.lS when the outflow from Jay lagoon was zero. The average B. 0 . D.5 increase for Weeks One , Two and Four , indicate that the outflow from the secondary lagoons was about 12500 1bs . perday . Pollution from Otis Mill for the week July seven to eleven inclusive is calculated as 13000 1bs. per day .
22
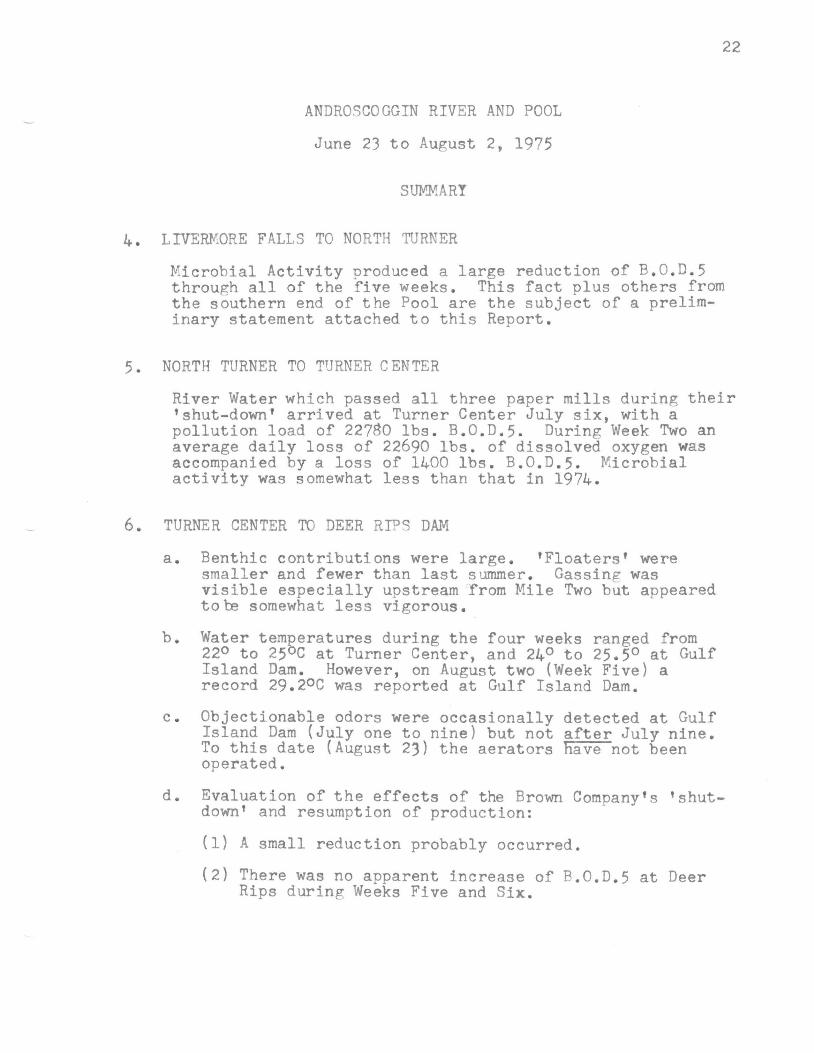
ANDROSCOGGIN RIVER AND POOL
June 23 to August 2, 1975
SUMMARY
4. LIVERMORE FALLS TO NORTH TURNER
Microbial Activity produced a large reduction of B.0.D.5 through all of the five weeks. This fact plus others from the southern end of the Pool are the subject of a preliminary statement attached to this Report.
5. NORTH TURNER TO TURNER CENTER
River Water which passed all three paper mills during their 'shut-down' arrived at Turner Center July six, with a pollution load of 22780 Ibs. B.0.D.5. During Week Two an average daily loss of 22690 Ibs. of dissolved oxygen was accompanied by a loss of 1400 Ibs. B.0.D.5. Microbial activity was somewhat less than that in 1974.
6. TURNER CENTER TO DEER RIPS DAM
a. Benthic contributions were large. 'Floaters' were smaller and fewer than last summer. Gassing was visible especially upstream from Mile Two but appearedtobe somewhat less vigorous.
b. Water temperatures during the four weeks ranged from 220 to 250C at Turner Center, and 240 to 25.50 at Gulf Island Dam. However, on August two (Week Five) a record 29.20C was reported at Gulf Island Dam.
c. Objectionable odors were occasionally detected at Gulf Island Dam (July one to nine) but not after July nine. To this date (August 23) the aerators have not been operated.
d. Evaluation of the effects of the Brown Company's 'shutdown' and resumption of production:
(1) A small reduction probably occurred.
(2) There was no apparent increase of B.0.D.5 at Deer Rips during Weeks Five and Six.

ANDROSCOGGIN POOL
ALGAE
Preliminary Statement
The high k1 rates which were calcul ated for the Livermore
Falls - North Turner stretch, for the five week period June twenty
three to July twenty-six although three t o four times larger than
that for August 1974, was considered to be a return to k1 rates
recorded for 1973 and 1972 . However, blue-green algae were
observed, Wednesday July thirty, in the river water at the upstrea
side of Gulf Island Dam. During the next several days observatior.
indicated that the algae were increasing in this area and had
extended upstream to Mile 2. 5 on August six and to Eile 4 . 25 on
August ten .
The writer considered that these two conditions, high k1 rate
and growth of algae may be due to above normal temperatures and
an increase of Nitrogen and Phosphorus nutrients .
The Algae problem was described during a telephone conversa
tion with Mr. Tom Linder , (International Paper Company), on Frida)
Au~ust fifteen and arrangements were made for a Joint observation
from a boat on Monday, August eighteen . The observations may be
summarized:
1 . At Gulf Island Dam only a small amount of algae were observed . Wind was southerly and all three turbines were operating .
2. In the area around the boat dock, Mile 1.7, the algae were a 1i~ht yellowish green color and completely covered the area in the adjacent cove .
3 . From ~1i1e 0 . 5 to Mile 2. 5 algae were very numerous from the surface to a depth of about twelve inches . Water samples revealed them suspended throughoutthe glass containers as very small greenish co1onief

4 . From Mile 2. 5 to Mile 4 . 25 gassing was not as extensive as that recorded in 1974, but ' floaters· were absent . Algae were somewhat more abundant at Mile Three to Four but a decreasing gradient was noticed to I·~ile 4 . 25 where very few algae were present.
5. Mile 4.25 to Mile Six and Bay Thirteen water samplesdid not contain any visLble algae.
Daily observation made to date (August twenty-three) indicate
practically no visible change except an increase at Gulf Island
Dam when the wind is northerly and one or more turbines are not
operating . Observations are being continued .
Mr . Linder has made arrangements for analyses of water
sample~ taken from four locations, to be made at the International
Paper Companies Tuxedo Park, N. Y. laboratories . Quantitative
determinations will be made for Kjeldahl nitrogen , Ammonia nitrogen
and total Phosphorus .
A complete report will be made at a later date.