Brookfield Operating Manual DV-III Ultra
122
BROOKFIELD DV-III ULTRA PROGRAMMABLE RHEOMETER Operating Instructions Manual No. M/98-211-B0104 Please record the Model and Serial Number of your viscometer. Having this information readily available will help us to assist you should there be any questions regarding your instrument. Model No. ______________________ Serial No. ______________________ Use of this instrument in a manner not specified by Brookfield may result in incorrect readings or instrument failure. Please read this manual prior to using the instrument. BROOKFIELD ENGINEERING LABORATORIES, INC. 11 Commerce Boulevard, Middleboro, MA 02346-1031 USA SPECIALISTS IN THE MEASUREMENT AND CONTROL OF VISCOSITY TEL 508-946-6200 FAX 508-946-6262 or 800-628-8139 (USA excluding MA) INTERNET www.brookfieldengineering.com
-
Upload
georgiadisg -
Category
Documents
-
view
534 -
download
67
description
Valve selection
Transcript of Brookfield Operating Manual DV-III Ultra
Brookfield Engineering Laboratories, Inc. Page 1 Manual No. M/98-211-B0104
BROOKFIELD DV-III ULTRA
PROGRAMMABLE RHEOMETER
Operating Instructions
Manual No. M/98-211-B0104
Please record the Model and Serial Number of your viscometer.Having this information readily available will help us to assist youshould there be any questions regarding your instrument.
Model No. ______________________
Serial No. ______________________
Use of this instrument in a manner not specified by Brookfield mayresult in incorrect readings or instrument failure. Please read thismanual prior to using the instrument.
BROOKFIELD ENGINEERING LABORATORIES, INC.11 Commerce Boulevard, Middleboro, MA 02346-1031 USA
SPECIALISTS IN THE
MEASUREMENT AND
CONTROL OF VISCOSITY
TEL 508-946-6200FAX 508-946-6262
or 800-628-8139 (USA excluding MA)INTERNET www.brookfieldengineering.com
Brookfield Engineering Laboratories, Inc. Page 2 Manual No. M/98-211-B0104
Contents
I. INTRODUCTION ............................................................................................................. 3I.1 Torque Measurement ....................................................................................................................... 3I.2 Viscosity Units of Measurement ...................................................................................................... 3I.3 Yield Stress Measurement ............................................................................................................... 4I.4 Components ..................................................................................................................................... 6I.5 Utilities ............................................................................................................................................. 7I.6 Specifications ................................................................................................................................... 7I.7 Safety Symbols and Precautions ...................................................................................................... 8I.8 Data Retention ................................................................................................................................. 8I.9 Set-Up .............................................................................................................................................. 9I.10 Connections ................................................................................................................................... 12I.11 Key Functions ................................................................................................................................ 13
II. GETTING STARTED ......................................................................................................15II.1 Autozero ......................................................................................................................................... 15II.2 Rheometer Display ........................................................................................................................ 16II.3 Spindle Entry ................................................................................................................................. 18II.4 Direct Speed Entry ......................................................................................................................... 19II.5 External Control ............................................................................................................................. 20
III. MAKING VISCOSITY AND YIELD MEASUREMENTS .................................................22III.1 Quick Start ..................................................................................................................................... 22III.2 Preparations for Making Measurements ........................................................................................ 23III.3 Selecting a Spindle/Speed .............................................................................................................. 23III.4 Multiple Data Points ...................................................................................................................... 24
IV. PROGRAMMING THE DV-III ULTRA AND DATA COLLECTIONMETHODS/ANALYSIS ...................................................................................................25IV.1 Programming Concepts .................................................................................................................. 25IV.2 DV-III Speed/Time Pair Programs for Making Viscosity Measurements ...................................... 26IV.3 Bevis Programs for Making Viscosity Measurements ................................................................... 38IV.4 Choosing the Best Data Collection Method for Viscosity Tests .................................................... 46IV.5 Data Analysis for Viscosity Tests ................................................................................................... 47IV.6 Yield Stress Test Programs and Test Examples ............................................................................. 50
V. OPTIONS ........................................................................................................................77V.1 Set Up ............................................................................................................................................ 77V.2 Print ................................................................................................................................................ 78V.3 Alarms ............................................................................................................................................ 78V.4 Set Temperature ............................................................................................................................. 79V.5 Data ................................................................................................................................................ 79V.6 Timed Data Collection ................................................................................................................... 81
APPENDIX A - Cone/Plate Rheometer Set-Up ...................................................................................... 83APPENDIX B - Viscosity Ranges ........................................................................................................... 87APPENDIX C - Variables in Viscosity Measurements ........................................................................... 92APPENDIX D1 - Spindle and Model Codes for Viscosity Tests .............................................................. 94APPENDIX D2 - Spindle Codes and Speeds for Yield Tests .................................................................... 98APPENDIX E - Calibration Procedures ................................................................................................ 102APPENDIX F - VS-27Y Clamp Assembly ........................................................................................... 109APPENDIX G - DVE-50 Probe Clip..................................................................................................... 110APPENDIX H - DV-III Ultra to Computer Command Set ................................................................... 111APPENDIX I - Fault Diagnosis and Troubleshooting ......................................................................... 115APPENDIX J - Warranty Repair and Service ...................................................................................... 119
Brookfield Engineering Laboratories, Inc. Page 3 Manual No. M/98-211-B0104
I. INTRODUCTION
The Brookfield DV-III Ultra Programmable Rheometer measures fluid parameters of Shear Stressand Viscosity at given Shear Rates. Viscosity is a measure of a fluid’s resistance to flow. You willfind a detailed description of the mathematics of viscosity in the Brookfield publication “MoreSolutions to Sticky Problems”, a copy of which was included with your DV-III Ultra.
The principle of operation of the DV-III Ultra is to drive a spindle (which is immersed in the test fluid)through a calibrated spring. The viscous drag of the fluid against the spindle is measured by the springdeflection. Spring deflection is measured with a rotary transducer. The viscosity measurement rangeof the DV-III Ultra (in centipoise or cP) is determined by the rotational speed of the spindle, the sizeand shape of the spindle, the container the spindle is rotating in, and the full scale torque of thecalibrated spring.
The DV-III Ultra can also measure yield stress (in Pascals or Pa). See Section I.3 for moreinformation on yield stress.
I.1 Torque Measurement
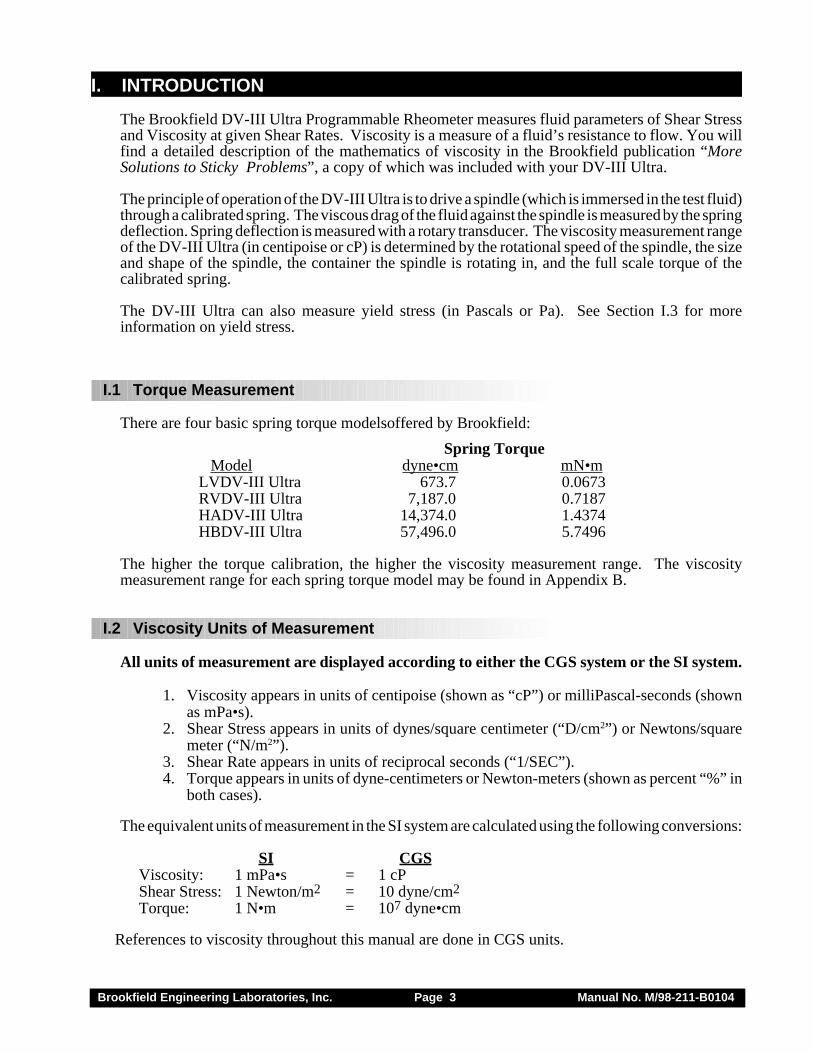
There are four basic spring torque modelsoffered by Brookfield:
Spring TorqueModel dyne•cm mN•m
LVDV-III Ultra 673.7 0.0673RVDV-III Ultra 7,187.0 0.7187HADV-III Ultra 14,374.0 1.4374HBDV-III Ultra 57,496.0 5.7496
The higher the torque calibration, the higher the viscosity measurement range. The viscositymeasurement range for each spring torque model may be found in Appendix B.
I.2 Viscosity Units of Measurement
All units of measurement are displayed according to either the CGS system or the SI system.
1. Viscosity appears in units of centipoise (shown as “cP”) or milliPascal-seconds (shownas mPa•s).
2. Shear Stress appears in units of dynes/square centimeter (“D/cm2”) or Newtons/squaremeter (“N/m2”).
3. Shear Rate appears in units of reciprocal seconds (“1/SEC”).4. Torque appears in units of dyne-centimeters or Newton-meters (shown as percent “%” in
both cases).
The equivalent units of measurement in the SI system are calculated using the following conversions:
SI CGSViscosity: 1 mPa•s = 1 cPShear Stress: 1 Newton/m2 = 10 dyne/cm2
Torque: 1 N•m = 107 dyne•cm
References to viscosity throughout this manual are done in CGS units.
Brookfield Engineering Laboratories, Inc. Page 4 Manual No. M/98-211-B0104
I.3 Yield Stress Measurement
Another feature now available in the DV-III Ultra Rheometer is the yield stress test.
The yield point is the point at which a material begins to flow. The associated properties are the yieldstress and yield strain. The yield stress is the critical shear stress, applied to the sample, at which thematerial begins to flow as a liquid. The yield strain is the deformation in the material, resulting fromthe applied stress prior to the start of flow.
Many materials are designed to have a yield point, so that the behavior of their products satisfiesvarious customer needs. Foods often have yield points. Ketchup in particular must flow out of abottle when shaken or squeezed, but then solidify on the targeted food such as french fries. Shakingor squeezing the bottle stresses the ketchup so that it flows; after the ketchup settles on the fries, itsstructure rebuilds so the ketchup “sits” in place rather than flowing off the fries like water. Puddingshave yield points, as well. The “body” of the pudding appeals to consumers – it is solid at rest, yetit’s easily spooned out of its cup and is easy to eat. Thus, the yield behavior of many foods contributesto the food texture that we like.
Many paints have low yield stresses. Many latex house paints, for example, are easily stirred orpoured. Brushing or spraying provides enough stress so that the paint flows easily and smoothly overa painted wall. However, a thin layer of applied paint (if a good one!), allowed to rest undisturbedon the surface, regains its structure quickly so that there is very little unsightly “dripping” afterwards.The smooth appearance of the painted surface is very appealing to the homeowner.
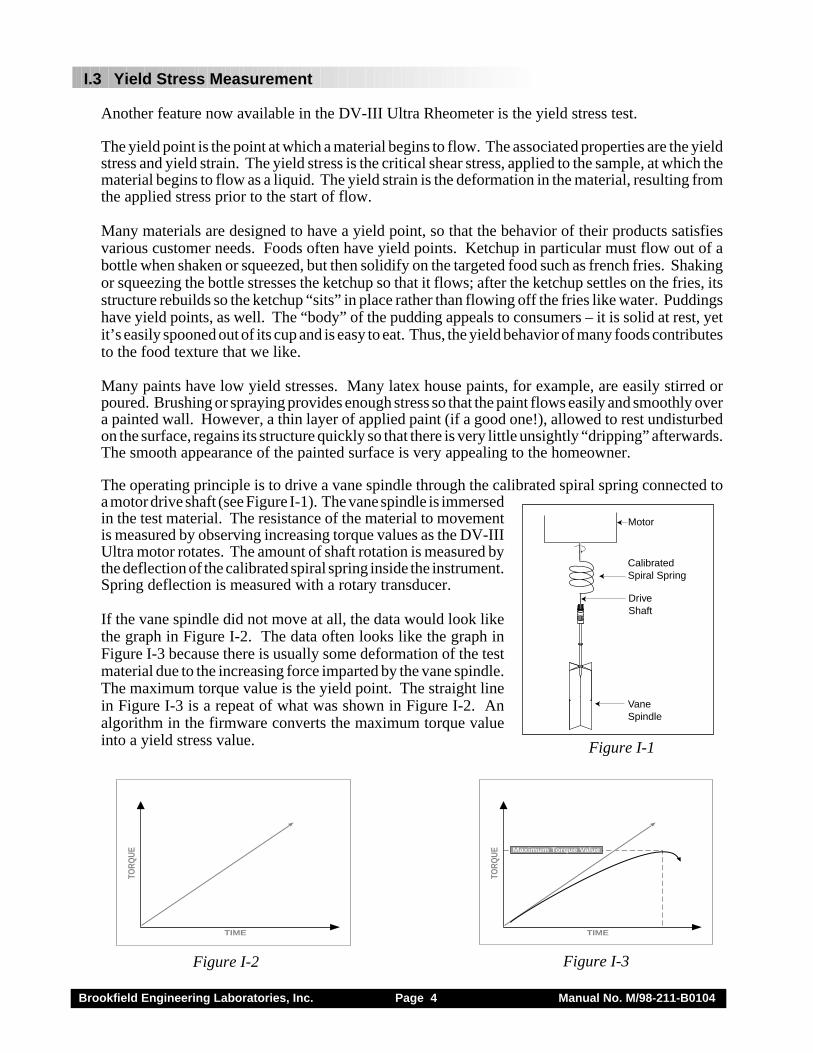
The operating principle is to drive a vane spindle through the calibrated spiral spring connected toa motor drive shaft (see Figure I-1). The vane spindle is immersedin the test material. The resistance of the material to movementis measured by observing increasing torque values as the DV-IIIUltra motor rotates. The amount of shaft rotation is measured bythe deflection of the calibrated spiral spring inside the instrument.Spring deflection is measured with a rotary transducer.
If the vane spindle did not move at all, the data would look likethe graph in Figure I-2. The data often looks like the graph inFigure I-3 because there is usually some deformation of the testmaterial due to the increasing force imparted by the vane spindle.The maximum torque value is the yield point. The straight linein Figure I-3 is a repeat of what was shown in Figure I-2. Analgorithm in the firmware converts the maximum torque valueinto a yield stress value.
Motor
CalibratedSpiral Spring
DriveShaft
VaneSpindle
Figure I-1
TIME
TORQ
UE
Figure I-2
Maximum Torque Value
TIME
TORQ
UE
Figure I-3

Brookfield Engineering Laboratories, Inc. Page 5 Manual No. M/98-211-B0104
The shear stress measurement range of the DV-III Ultra (in Pascals) is determined by the size and shapeof the vane spindle and the full scale torque range of the calibrated spring.
Brookfield Engineering Laboratories, Inc. Page 6 Manual No. M/98-211-B0104
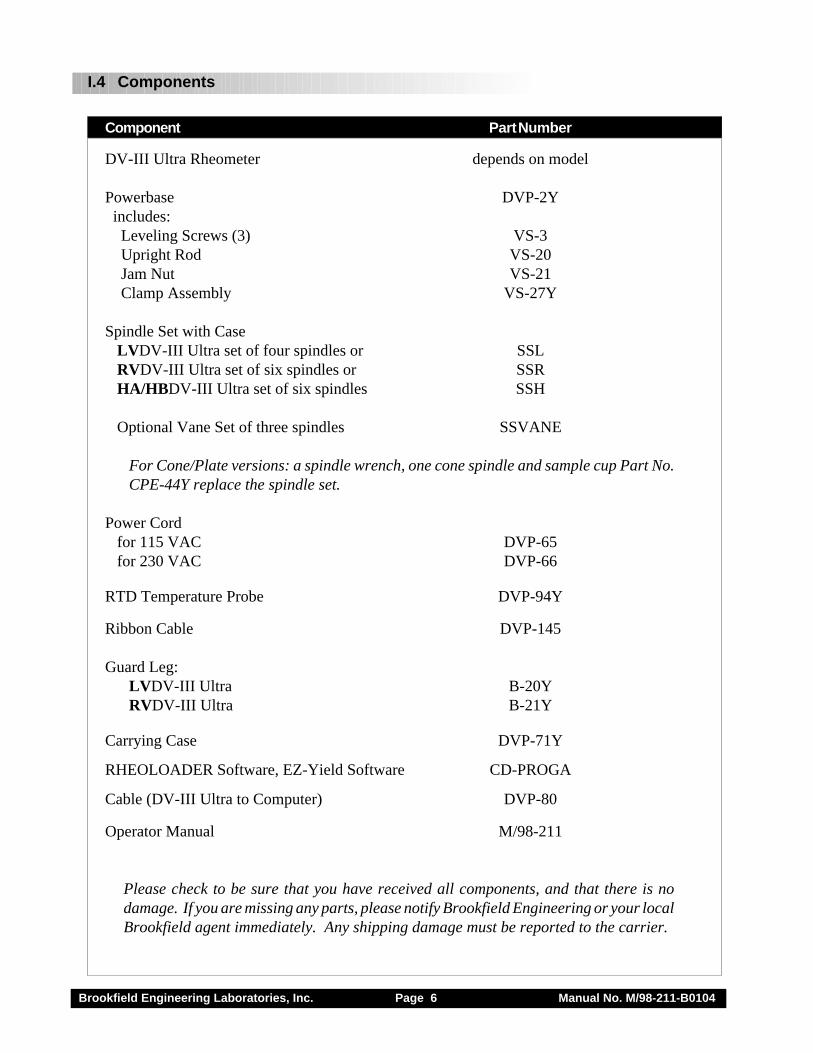
I.4 Components
Component Part Number
DV-III Ultra Rheometer depends on model
Powerbase DVP-2Y includes: Leveling Screws (3) VS-3 Upright Rod VS-20 Jam Nut VS-21 Clamp Assembly VS-27Y
Spindle Set with Case LVDV-III Ultra set of four spindles or SSL RVDV-III Ultra set of six spindles or SSR HA/HBDV-III Ultra set of six spindles SSH
Optional Vane Set of three spindles SSVANE
For Cone/Plate versions: a spindle wrench, one cone spindle and sample cup Part No.CPE-44Y replace the spindle set.
Power Cord for 115 VAC DVP-65 for 230 VAC DVP-66
RTD Temperature Probe DVP-94Y
Ribbon Cable DVP-145
Guard Leg:LVDV-III Ultra B-20YRVDV-III Ultra B-21Y
Carrying Case DVP-71Y
RHEOLOADER Software, EZ-Yield Software CD-PROGA
Cable (DV-III Ultra to Computer) DVP-80
Operator Manual M/98-211
Please check to be sure that you have received all components, and that there is nodamage. If you are missing any parts, please notify Brookfield Engineering or your localBrookfield agent immediately. Any shipping damage must be reported to the carrier.
Brookfield Engineering Laboratories, Inc. Page 7 Manual No. M/98-211-B0104
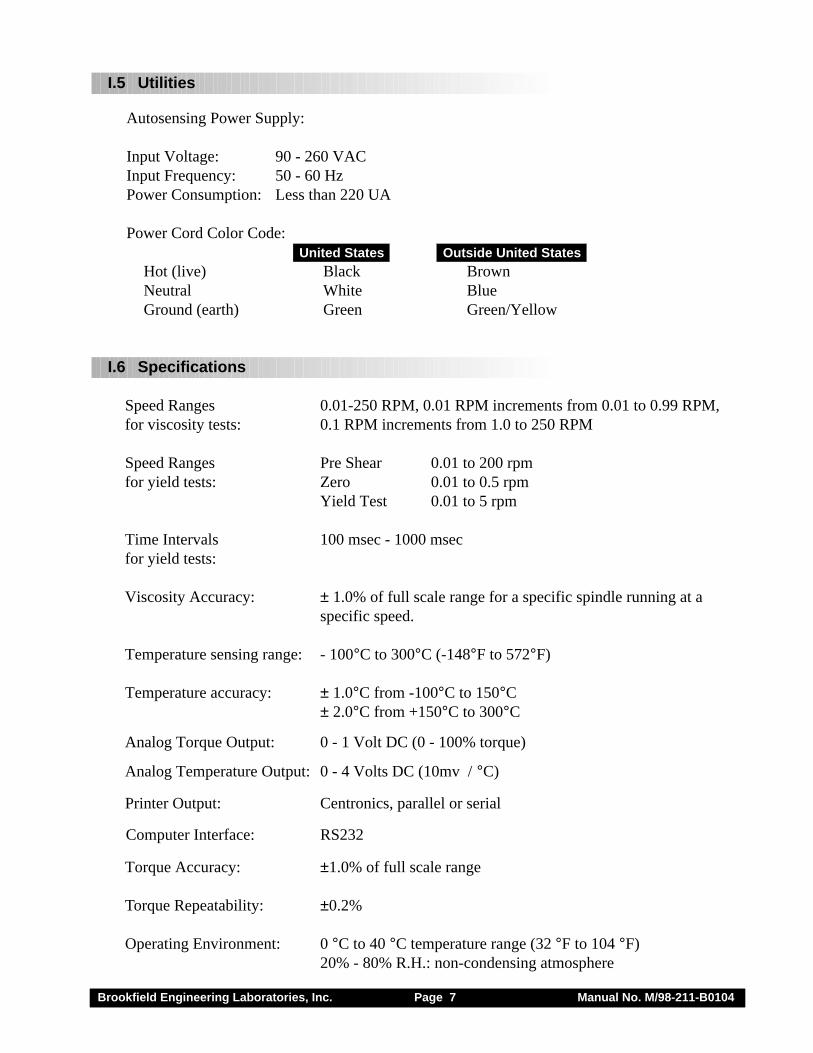
I.5 Utilities
Autosensing Power Supply:
Input Voltage: 90 - 260 VACInput Frequency: 50 - 60 HzPower Consumption: Less than 220 UA
Power Cord Color Code:United States Outside United States
Hot (live) Black BrownNeutral White BlueGround (earth) Green Green/Yellow
I.6 Specifications
Speed Ranges 0.01-250 RPM, 0.01 RPM increments from 0.01 to 0.99 RPM,for viscosity tests: 0.1 RPM increments from 1.0 to 250 RPM
Speed Ranges Pre Shear 0.01 to 200 rpmfor yield tests: Zero 0.01 to 0.5 rpm
Yield Test 0.01 to 5 rpm
Time Intervals 100 msec - 1000 msecfor yield tests:
Viscosity Accuracy: ± 1.0% of full scale range for a specific spindle running at aspecific speed.
Temperature sensing range: - 100°C to 300°C (-148°F to 572°F)
Temperature accuracy: ± 1.0°C from -100°C to 150°C± 2.0°C from +150°C to 300°C
Analog Torque Output: 0 - 1 Volt DC (0 - 100% torque)
Analog Temperature Output: 0 - 4 Volts DC (10mv / °C)
Printer Output: Centronics, parallel or serial
Computer Interface: RS232
Torque Accuracy: ±1.0% of full scale range
Torque Repeatability: ±0.2%
Operating Environment: 0 °C to 40 °C temperature range (32 °F to 104 °F)20% - 80% R.H.: non-condensing atmosphere
Brookfield Engineering Laboratories, Inc. Page 8 Manual No. M/98-211-B0104
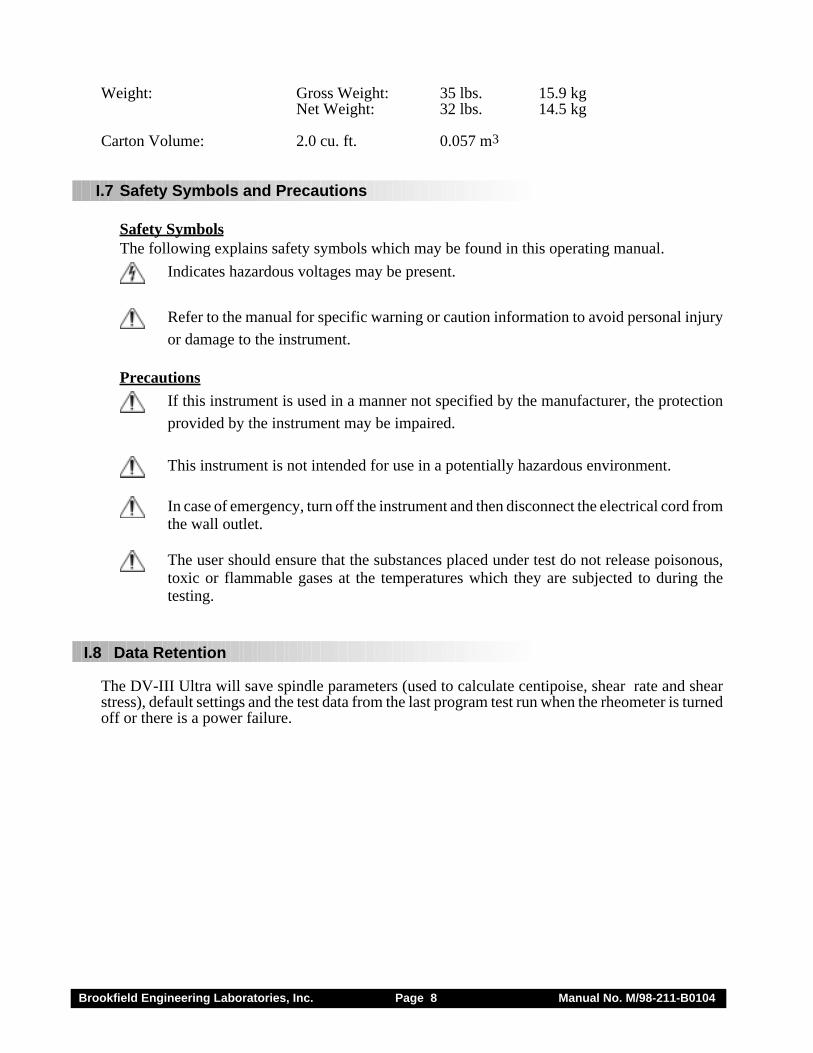
Weight: Gross Weight: 35 lbs. 15.9 kgNet Weight: 32 lbs. 14.5 kg
Carton Volume: 2.0 cu. ft. 0.057 m3
I.7 Safety Symbols and Precautions
Safety SymbolsThe following explains safety symbols which may be found in this operating manual.
Indicates hazardous voltages may be present.
Refer to the manual for specific warning or caution information to avoid personal injury
or damage to the instrument.
Precautions
If this instrument is used in a manner not specified by the manufacturer, the protection
provided by the instrument may be impaired.
This instrument is not intended for use in a potentially hazardous environment.
In case of emergency, turn off the instrument and then disconnect the electrical cord fromthe wall outlet.
The user should ensure that the substances placed under test do not release poisonous,toxic or flammable gases at the temperatures which they are subjected to during thetesting.
I.8 Data Retention
The DV-III Ultra will save spindle parameters (used to calculate centipoise, shear rate and shearstress), default settings and the test data from the last program test run when the rheometer is turnedoff or there is a power failure.
Brookfield Engineering Laboratories, Inc. Page 9 Manual No. M/98-211-B0104
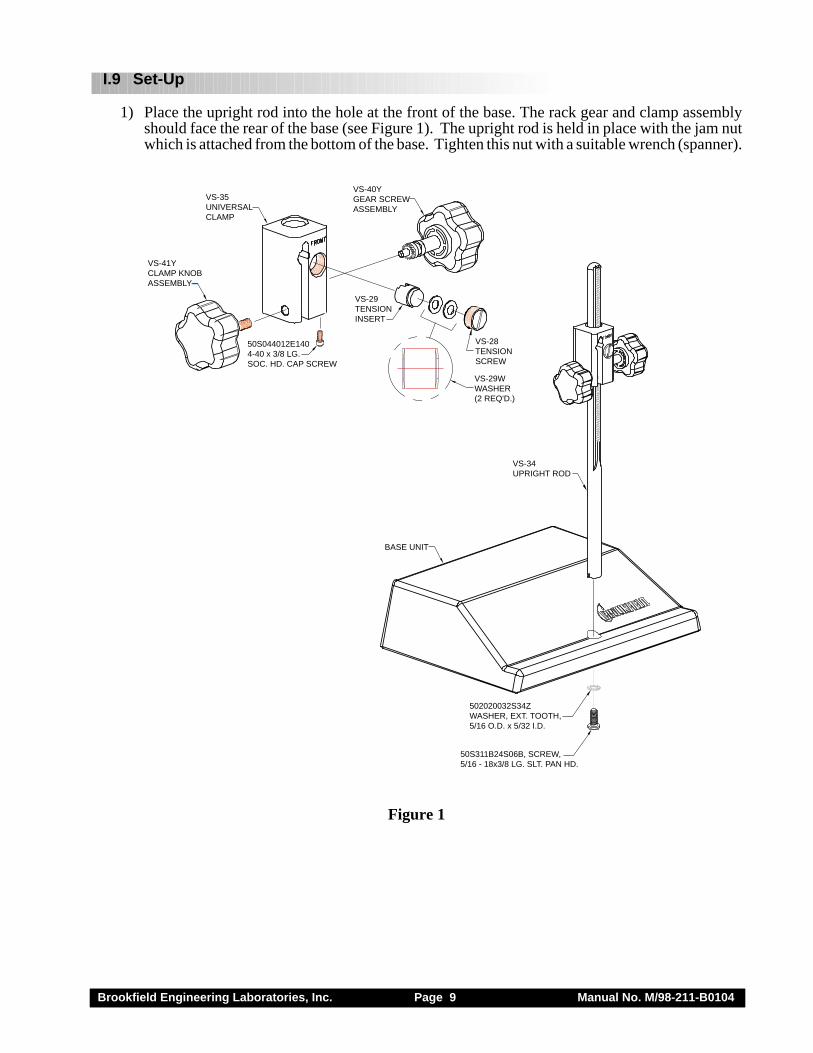
BASE UNIT
VS-41YCLAMP KNOB ASSEMBLY
50S044012E1404-40 x 3/8 LG.SOC. HD. CAP SCREW
VS-35UNIVERSAL CLAMP
VS-40YGEAR SCREWASSEMBLY
VS-29TENSIONINSERT
VS-28TENSIONSCREW
VS-29WWASHER(2 REQ'D.)
VS-34UPRIGHT ROD
502020032S34ZWASHER, EXT. TOOTH,5/16 O.D. x 5/32 I.D.
50S311B24S06B, SCREW,5/16 - 18x3/8 LG. SLT. PAN HD.
I.9 Set-Up
1) Place the upright rod into the hole at the front of the base. The rack gear and clamp assemblyshould face the rear of the base (see Figure 1). The upright rod is held in place with the jam nutwhich is attached from the bottom of the base. Tighten this nut with a suitable wrench (spanner).
Figure 1
Brookfield Engineering Laboratories, Inc. Page 10 Manual No. M/98-211-B0104
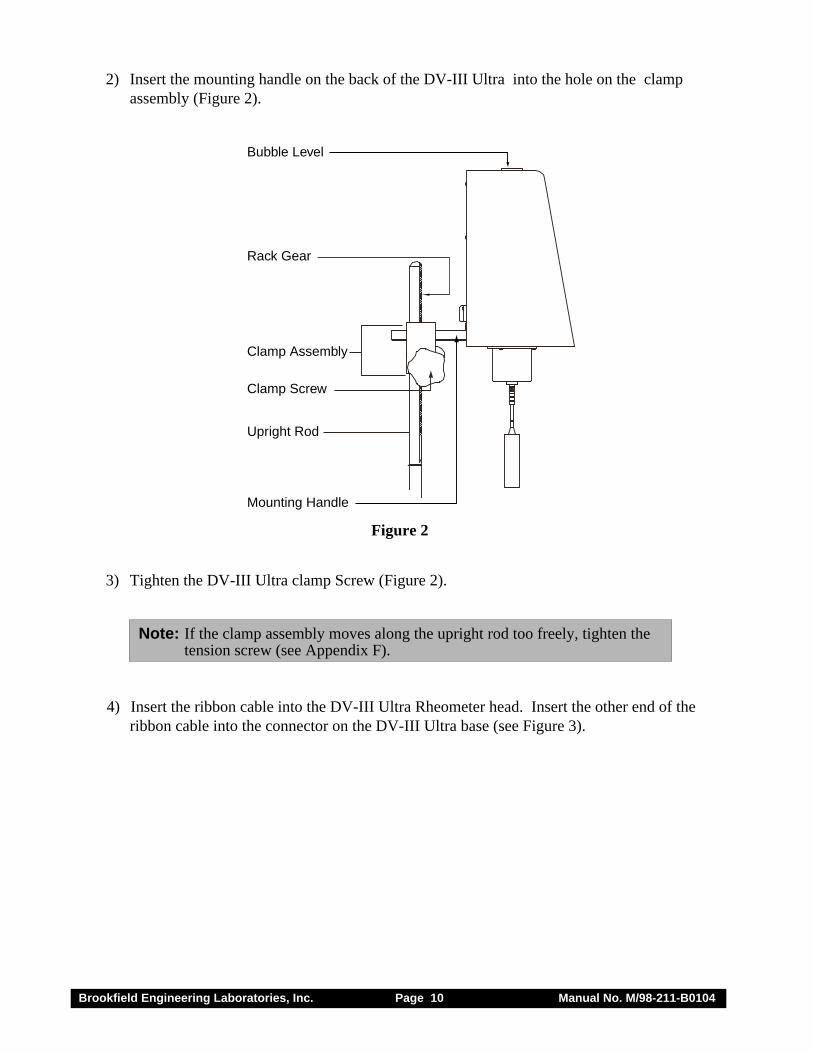
2) Insert the mounting handle on the back of the DV-III Ultra into the hole on the clampassembly (Figure 2).
Figure 2
3) Tighten the DV-III Ultra clamp Screw (Figure 2).
Note: If the clamp assembly moves along the upright rod too freely, tighten thetension screw (see Appendix F).
4) Insert the ribbon cable into the DV-III Ultra Rheometer head. Insert the other end of theribbon cable into the connector on the DV-III Ultra base (see Figure 3).
Bubble Level
Rack Gear
Clamp Assembly
Clamp Screw
Upright Rod
Mounting Handle
Brookfield Engineering Laboratories, Inc. Page 11 Manual No. M/98-211-B0104
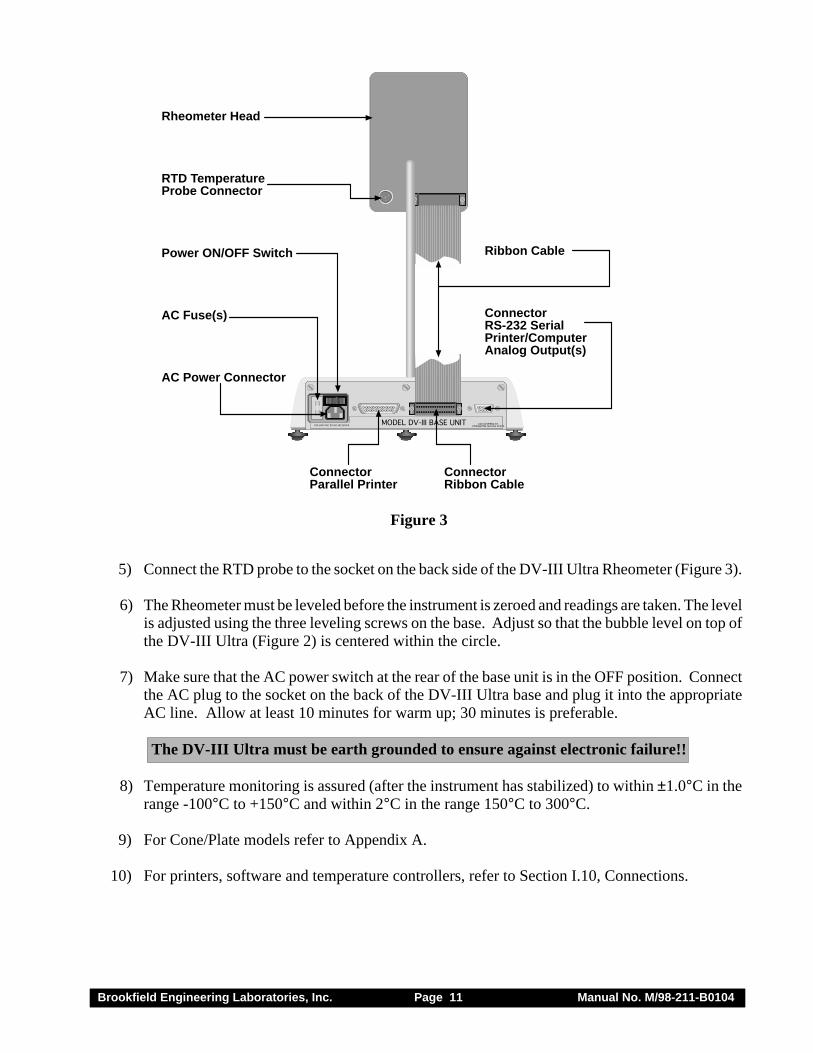
Figure 3
5) Connect the RTD probe to the socket on the back side of the DV-III Ultra Rheometer (Figure 3).
6) The Rheometer must be leveled before the instrument is zeroed and readings are taken. The levelis adjusted using the three leveling screws on the base. Adjust so that the bubble level on top ofthe DV-III Ultra (Figure 2) is centered within the circle.
7) Make sure that the AC power switch at the rear of the base unit is in the OFF position. Connectthe AC plug to the socket on the back of the DV-III Ultra base and plug it into the appropriateAC line. Allow at least 10 minutes for warm up; 30 minutes is preferable.
The DV-III Ultra must be earth grounded to ensure against electronic failure!!
8) Temperature monitoring is assured (after the instrument has stabilized) to within ±1.0°C in therange -100°C to +150°C and within 2°C in the range 150°C to 300°C.
9) For Cone/Plate models refer to Appendix A.
10) For printers, software and temperature controllers, refer to Section I.10, Connections.
100-240 VAC 50/60 HZ 220VA MODEL DV-III BASE UNIT 240 CUSTHING ST.STOUGHTON, MA USA 02072
Rheometer Head
RTD TemperatureProbe Connector
Power ON/OFF Switch
AC Fuse(s)
AC Power Connector
Connector ConnectorParallel Printer Ribbon Cable
Ribbon Cable
ConnectorRS-232 SerialPrinter/ComputerAnalog Output(s)
Brookfield Engineering Laboratories, Inc. Page 12 Manual No. M/98-211-B0104
I.10 Connections
The DV-III Ultra Rheometer is capable of communicating with several external devices to enhanceoperation. The cables and connections required for proper communication are detailed below.
� RHEOLOADER AND EZ-YIELD SOFTWARE
DVP-80 cable is used to connect the RS232 serial port on the DV-III Ultra base to Com Port 1 orCom Port 2 on the computer. Some PCs may also have Com Port 3 and Com Port 4. This cableis supplied with the DV-III Ultra.
� RHEOCALC SOFTWARE
DVP-80 cable is used to connect the RS232 serial port on the DV-III Ultra base to Com Port 1 orCom Port 2 on the computer. This cable is supplied with the RHEOCALC software.
� PARALLEL PRINTER
CAP-86 cable is used to connect the 25-pin parallel port on the DV-III Ultra base with the Centronicsport on the printer.
� SERIAL PRINTER
DVP-81 cable is used to connect the 9-pin serial port on the DV-III Ultra with the 25-pin serial porton a printer.
� THERMOSEL CONTROLLER, MODEL HT-106TC-200/TC-500/TC-201P/TC-501P BATH, MODEL HT-107
DVP-141 cable is used to connect the serial port on the DV-III Ultra base to the serial port on thecontroller. This cable is supplied with the controller/bath.
Be sure that the controller temperature probe is properly located in the control device (Thermoselor bath) and connected to the controller.
Notes: 1. The controller may alternately communicate with Rheocalc V 2.0 orhigher software. In this configuration, the controller is connected to thecomputer through either Com Port 1 or Com Port 2. The DV-III Ultra isalso connected to a computer Com Port.
2. The controller must also be connected to the control device (Thermosel orbath) with the appropriate load cable.
� STRIP CHART RECORDER
DVP-96Y cable is used to connect the serial port on the DV-III Ultra to the input block of the stripchart recorder. This cable is supplied with a Brookfield strip chart recorder.
Brookfield Engineering Laboratories, Inc. Page 13 Manual No. M/98-211-B0104
I.11 Key Functions
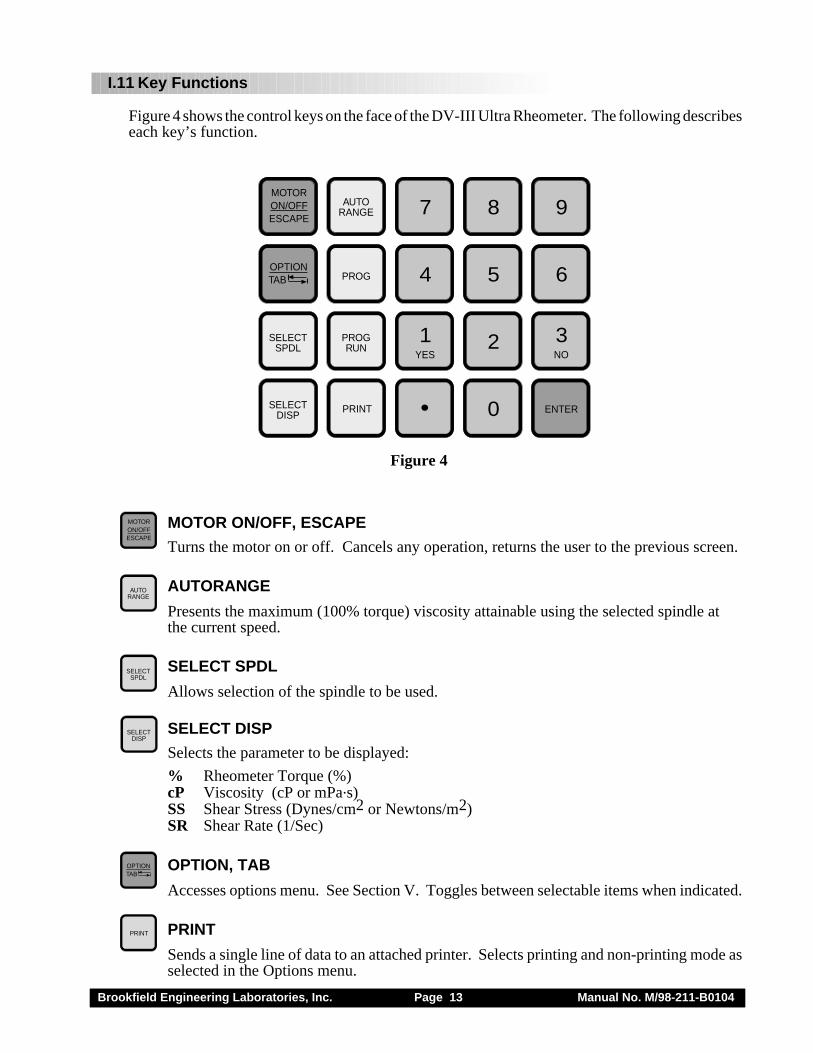
Figure 4 shows the control keys on the face of the DV-III Ultra Rheometer. The following describeseach key’s function.
Figure 4
MOTOR ON/OFF, ESCAPE
Turns the motor on or off. Cancels any operation, returns the user to the previous screen.
AUTORANGE
Presents the maximum (100% torque) viscosity attainable using the selected spindle atthe current speed.
SELECT SPDL
Allows selection of the spindle to be used.
SELECT DISP
Selects the parameter to be displayed:
% Rheometer Torque (%)cP Viscosity (cP or mPa.s)SS Shear Stress (Dynes/cm2 or Newtons/m2)SR Shear Rate (1/Sec)
OPTION, TAB
Accesses options menu. See Section V. Toggles between selectable items when indicated.
Sends a single line of data to an attached printer. Selects printing and non-printing mode asselected in the Options menu.
OPTION TAB
ENTER
YES NO
SELECTDISP
1
7 8 9
4 5 6
32
0.
SELECTSPDL
PROGRUN
MOTORON/OFFESCAPE
PROG
AUTORANGE
MOTORON/OFFESCAPE
SELECTSPDL
SELECTDISP
OPTION TAB
AUTORANGE
Brookfield Engineering Laboratories, Inc. Page 14 Manual No. M/98-211-B0104
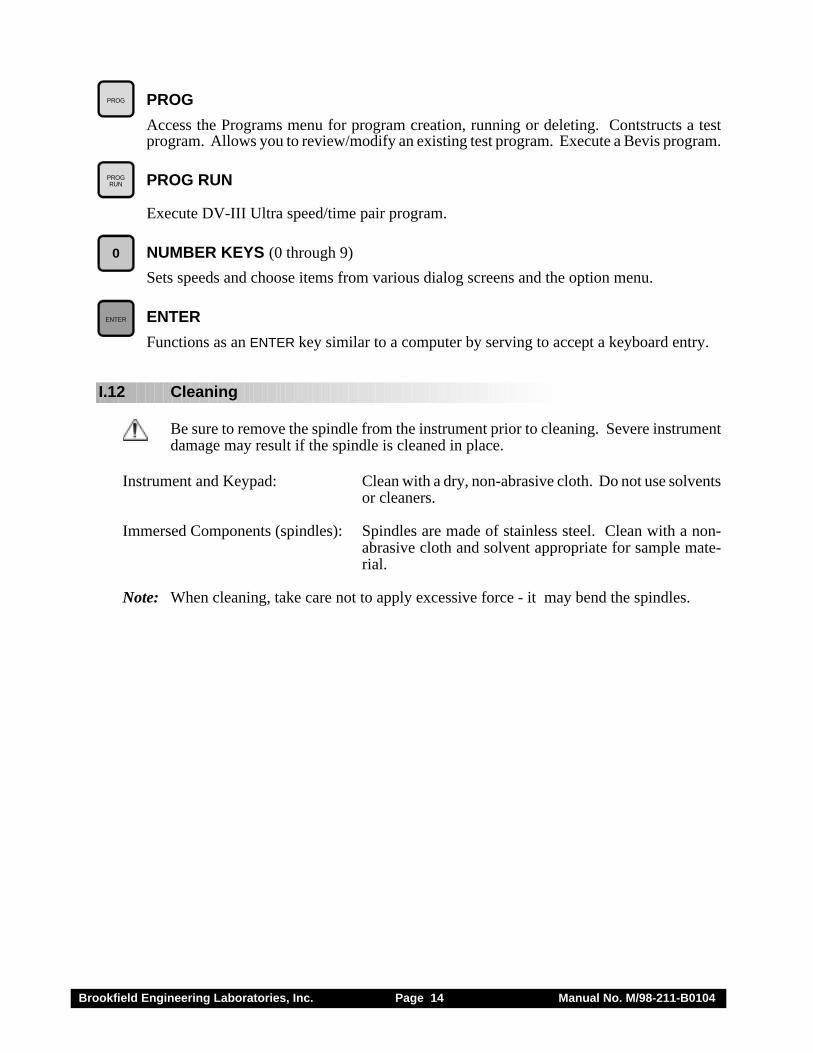
PROG
Access the Programs menu for program creation, running or deleting. Contstructs a testprogram. Allows you to review/modify an existing test program. Execute a Bevis program.
PROG RUN
Execute DV-III Ultra speed/time pair program.
NUMBER KEYS (0 through 9)
Sets speeds and choose items from various dialog screens and the option menu.
ENTER
Functions as an ENTER key similar to a computer by serving to accept a keyboard entry.
I.12 Cleaning
Be sure to remove the spindle from the instrument prior to cleaning. Severe instrumentdamage may result if the spindle is cleaned in place.
Instrument and Keypad: Clean with a dry, non-abrasive cloth. Do not use solventsor cleaners.
Immersed Components (spindles): Spindles are made of stainless steel. Clean with a non-abrasive cloth and solvent appropriate for sample mate-rial.
Note: When cleaning, take care not to apply excessive force - it may bend the spindles.
PROG
PROGRUN
0
ENTER
Brookfield Engineering Laboratories, Inc. Page 15 Manual No. M/98-211-B0104
II. GETTING STARTED
II.1 Autozero
Before readings may be taken, the Rheometer must be autozeroed. This is done each time the powerswitch is turned on. The Rheometer will guide you through the procedure, as follows:
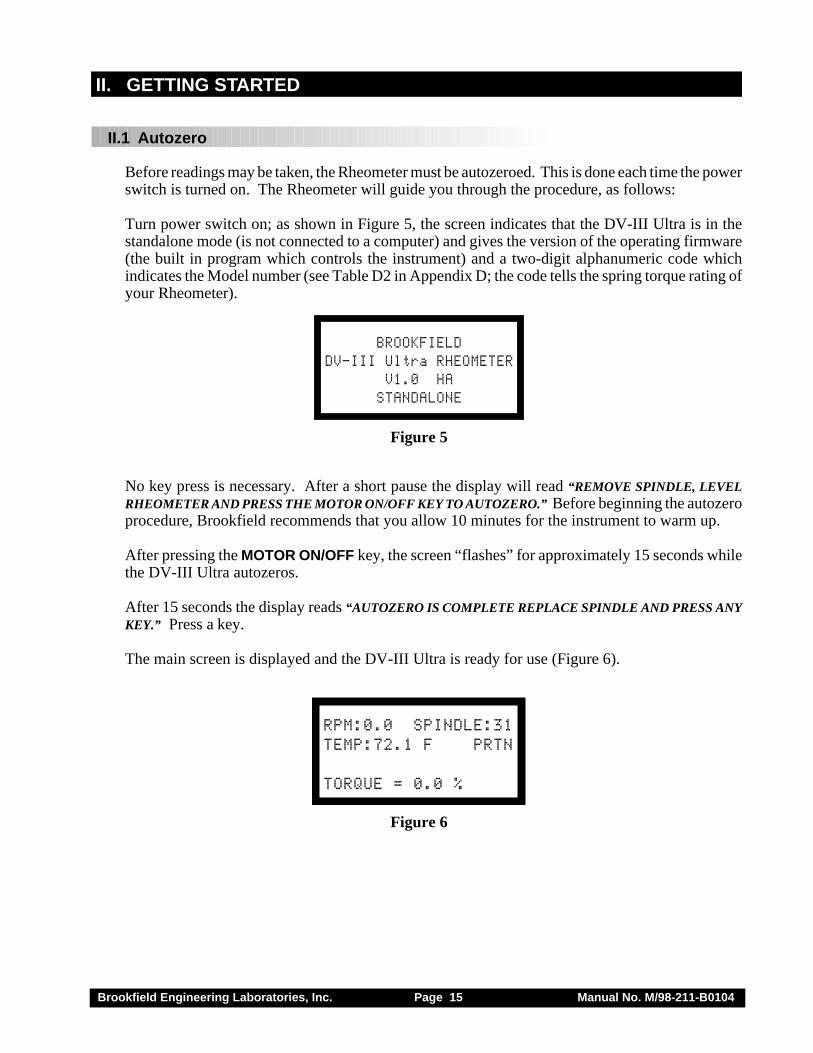
Turn power switch on; as shown in Figure 5, the screen indicates that the DV-III Ultra is in thestandalone mode (is not connected to a computer) and gives the version of the operating firmware(the built in program which controls the instrument) and a two-digit alphanumeric code whichindicates the Model number (see Table D2 in Appendix D; the code tells the spring torque rating ofyour Rheometer).
BROOKFIELDDV-III Ultra RHEOMETER
V1.0 HASTANDALONE
Figure 5
No key press is necessary. After a short pause the display will read “REMOVE SPINDLE, LEVELRHEOMETER AND PRESS THE MOTOR ON/OFF KEY TO AUTOZERO.” Before beginning the autozeroprocedure, Brookfield recommends that you allow 10 minutes for the instrument to warm up.
After pressing the MOTOR ON/OFF key, the screen “flashes” for approximately 15 seconds whilethe DV-III Ultra autozeros.
After 15 seconds the display reads “AUTOZERO IS COMPLETE REPLACE SPINDLE AND PRESS ANYKEY.” Press a key.
The main screen is displayed and the DV-III Ultra is ready for use (Figure 6).
RPM:0.0 SPINDLE:31TEMP:72.1 F PRTN
TORQUE = 0.0 %
Figure 6
Brookfield Engineering Laboratories, Inc. Page 16 Manual No. M/98-211-B0104
II.2 Rheometer Display
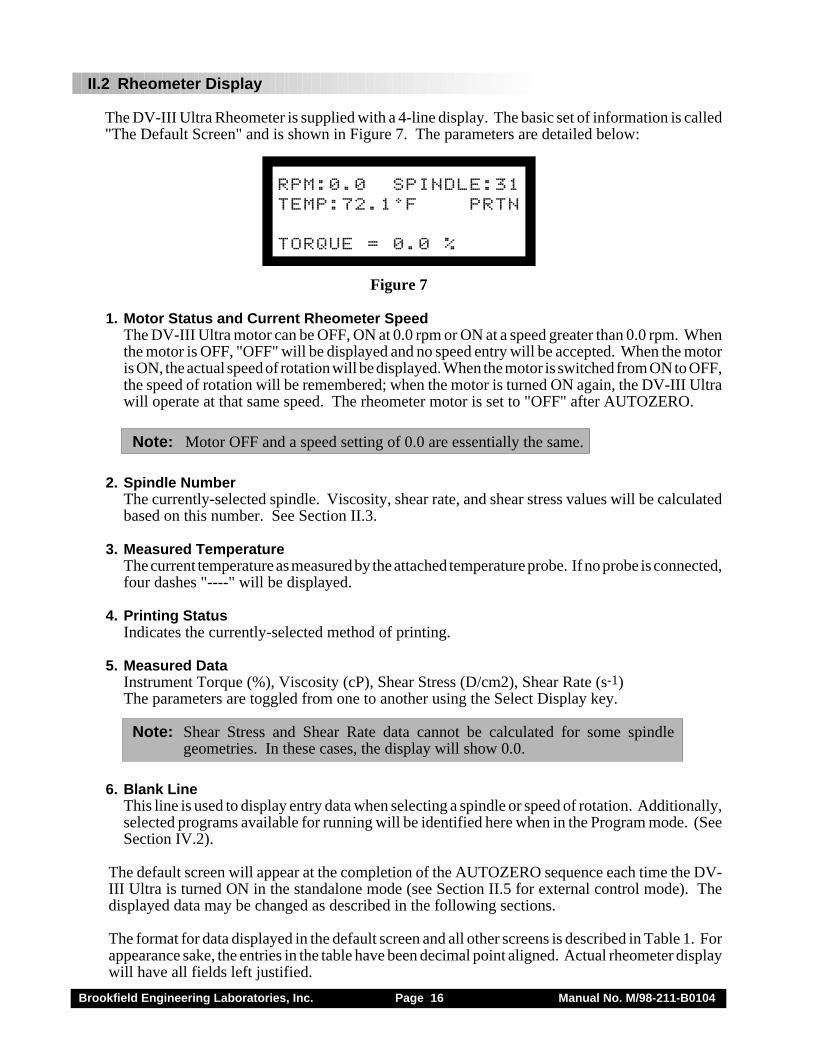
The DV-III Ultra Rheometer is supplied with a 4-line display. The basic set of information is called"The Default Screen" and is shown in Figure 7. The parameters are detailed below:
RPM:0.0 SPINDLE:31TEMP:72.1°F PRTN
TORQUE = 0.0 %
Figure 7
1. Motor Status and Current Rheometer SpeedThe DV-III Ultra motor can be OFF, ON at 0.0 rpm or ON at a speed greater than 0.0 rpm. Whenthe motor is OFF, "OFF" will be displayed and no speed entry will be accepted. When the motoris ON, the actual speed of rotation will be displayed. When the motor is switched from ON to OFF,the speed of rotation will be remembered; when the motor is turned ON again, the DV-III Ultrawill operate at that same speed. The rheometer motor is set to "OFF" after AUTOZERO.
Note: Motor OFF and a speed setting of 0.0 are essentially the same.
2. Spindle NumberThe currently-selected spindle. Viscosity, shear rate, and shear stress values will be calculatedbased on this number. See Section II.3.
3. Measured TemperatureThe current temperature as measured by the attached temperature probe. If no probe is connected,four dashes "----" will be displayed.
4. Printing StatusIndicates the currently-selected method of printing.
5. Measured DataInstrument Torque (%), Viscosity (cP), Shear Stress (D/cm2), Shear Rate (s-1)The parameters are toggled from one to another using the Select Display key.
Note: Shear Stress and Shear Rate data cannot be calculated for some spindlegeometries. In these cases, the display will show 0.0.
6. Blank LineThis line is used to display entry data when selecting a spindle or speed of rotation. Additionally,selected programs available for running will be identified here when in the Program mode. (SeeSection IV.2).
The default screen will appear at the completion of the AUTOZERO sequence each time the DV-III Ultra is turned ON in the standalone mode (see Section II.5 for external control mode). Thedisplayed data may be changed as described in the following sections.
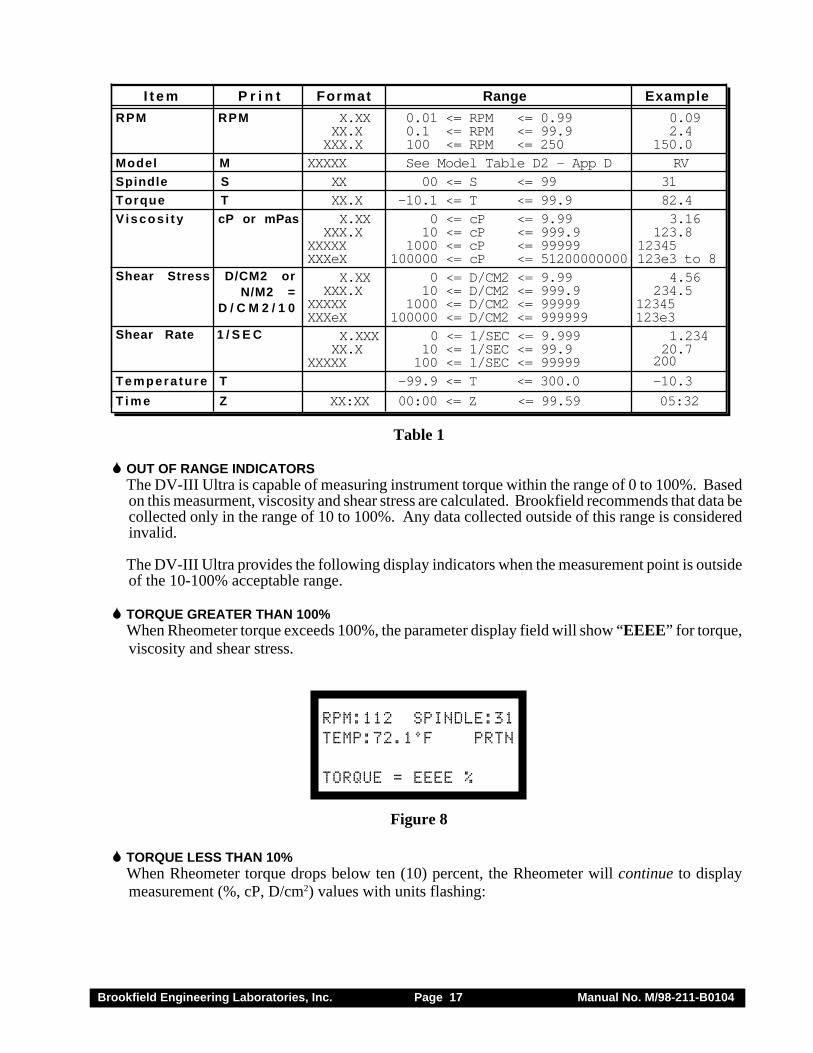
The format for data displayed in the default screen and all other screens is described in Table 1. Forappearance sake, the entries in the table have been decimal point aligned. Actual rheometer displaywill have all fields left justified.
Brookfield Engineering Laboratories, Inc. Page 17 Manual No. M/98-211-B0104
T i m e
XXX.X
M
S
T
Model
Spindle
Torque
Viscos i ty
Shear Stress
cP or mPas
D/CM2 orN/M2 =
D / C M 2 / 1 0
XXXXXXX
X.XXXXX.X
XXXXX
XX.X0 <= cP <= 9.9910 <= cP <= 999.9
1000 <= cP <= 99999
00 <= S <= 99-10.1 <= T <= 99.9
See Model Table D2 - App D
12345
RV3182.43.16
123.8
XXXeX 100000 <= cP <= 51200000000 123e3 to 84.56
12345
0 <= D/CM2 <= 9.99X.XXXXX.X
XXXXX10 <= D/CM2 <= 999.9
1000 <= D/CM2 <= 99999234.5
Shear Rate 1 / S E C
Tempera ture T -99.9 <= T <= 300.0 -10.3
X.XXX 0 <= 1/SEC <= 9.999XX.X
XXXXX10 <= 1/SEC <= 99.9100 <= 1/SEC <= 99999
1.23420.7200
0.01 <= RPM <= 0.99RPMRPM
I t e m P r i n t Format ExampleRange
0.09X.XXXX.X 0.1 <= RPM <= 99.9 2.4
XXX.X 100 <= RPM <= 250 150.0
XXXeX 100000 <= D/CM2 <= 999999 123e3
Z XX:XX 00:00 <= Z <= 99.59 05:32T i m e
Table 1
� OUT OF RANGE INDICATORSThe DV-III Ultra is capable of measuring instrument torque within the range of 0 to 100%. Basedon this measurment, viscosity and shear stress are calculated. Brookfield recommends that data becollected only in the range of 10 to 100%. Any data collected outside of this range is consideredinvalid.
The DV-III Ultra provides the following display indicators when the measurement point is outsideof the 10-100% acceptable range.
� TORQUE GREATER THAN 100%When Rheometer torque exceeds 100%, the parameter display field will show “EEEE” for torque,viscosity and shear stress.
RPM:112 SPINDLE:31TEMP:72.1°F PRTN
TORQUE = EEEE %
Figure 8
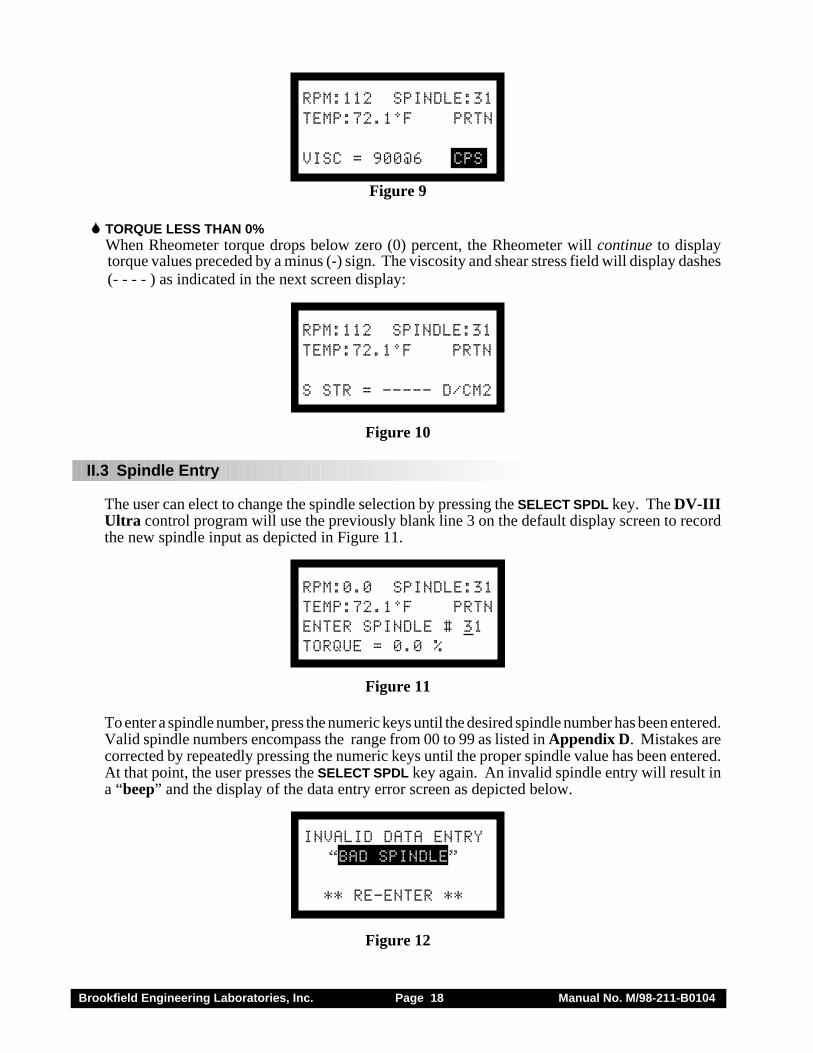
� TORQUE LESS THAN 10%When Rheometer torque drops below ten (10) percent, the Rheometer will continue to displaymeasurement (%, cP, D/cm2) values with units flashing:
Brookfield Engineering Laboratories, Inc. Page 18 Manual No. M/98-211-B0104
RPM:112 SPINDLE:31TEMP:72.1°F PRTN
VISC = 900@6 CPS
Figure 9
� TORQUE LESS THAN 0%When Rheometer torque drops below zero (0) percent, the Rheometer will continue to displaytorque values preceded by a minus (-) sign. The viscosity and shear stress field will display dashes(- - - - ) as indicated in the next screen display:
RPM:112 SPINDLE:31TEMP:72.1°F PRTN
S STR = ----- D/CM2
Figure 10
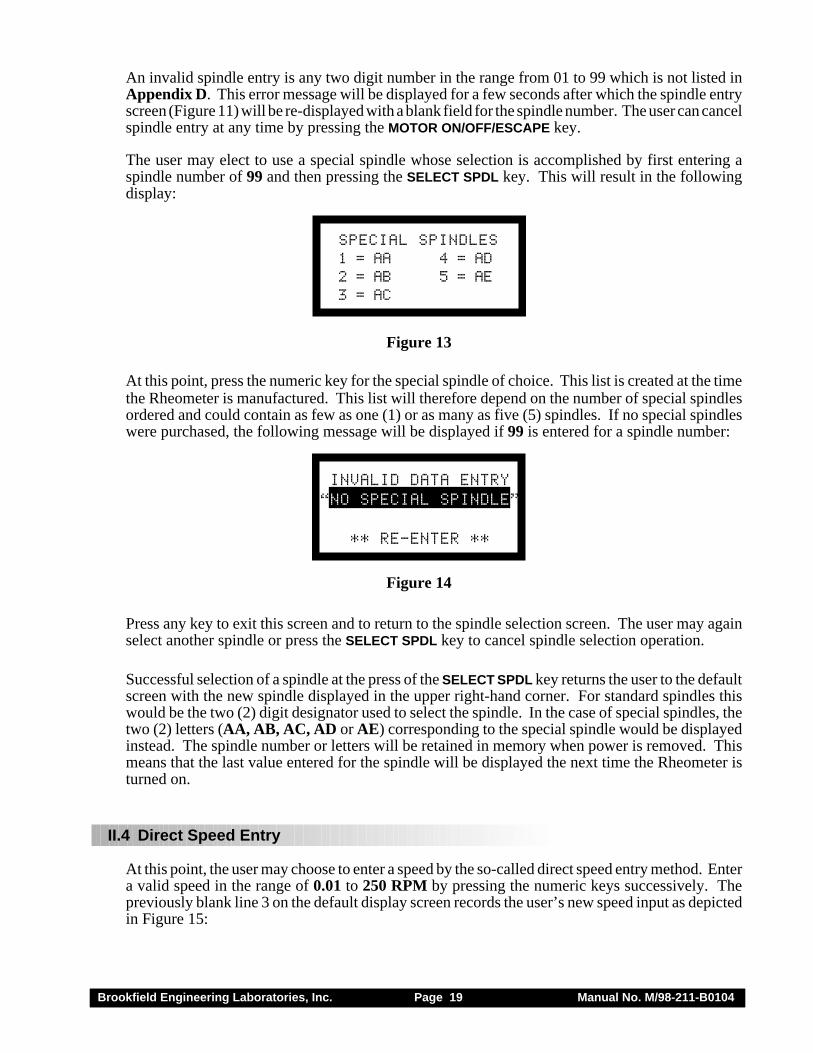
II.3 Spindle Entry
The user can elect to change the spindle selection by pressing the SELECT SPDL key. The DV-IIIUltra control program will use the previously blank line 3 on the default display screen to recordthe new spindle input as depicted in Figure 11.
RPM:0.0 SPINDLE:31TEMP:72.1°F PRTNENTER SPINDLE # 31TORQUE = 0.0 %
Figure 11
To enter a spindle number, press the numeric keys until the desired spindle number has been entered.Valid spindle numbers encompass the range from 00 to 99 as listed in Appendix D. Mistakes arecorrected by repeatedly pressing the numeric keys until the proper spindle value has been entered.At that point, the user presses the SELECT SPDL key again. An invalid spindle entry will result ina “beep” and the display of the data entry error screen as depicted below.
INVALID DATA ENTRY“BAD SPINDLE”
** RE-ENTER **
Figure 12
Brookfield Engineering Laboratories, Inc. Page 19 Manual No. M/98-211-B0104
An invalid spindle entry is any two digit number in the range from 01 to 99 which is not listed inAppendix D. This error message will be displayed for a few seconds after which the spindle entryscreen (Figure 11) will be re-displayed with a blank field for the spindle number. The user can cancelspindle entry at any time by pressing the MOTOR ON/OFF/ESCAPE key.
The user may elect to use a special spindle whose selection is accomplished by first entering aspindle number of 99 and then pressing the SELECT SPDL key. This will result in the followingdisplay:
SPECIAL SPINDLES1 = AA 4 = AD2 = AB 5 = AE3 = AC
Figure 13
At this point, press the numeric key for the special spindle of choice. This list is created at the timethe Rheometer is manufactured. This list will therefore depend on the number of special spindlesordered and could contain as few as one (1) or as many as five (5) spindles. If no special spindleswere purchased, the following message will be displayed if 99 is entered for a spindle number:
INVALID DATA ENTRY“NO SPECIAL SPINDLE”
** RE-ENTER **
Figure 14
Press any key to exit this screen and to return to the spindle selection screen. The user may againselect another spindle or press the SELECT SPDL key to cancel spindle selection operation.
Successful selection of a spindle at the press of the SELECT SPDL key returns the user to the defaultscreen with the new spindle displayed in the upper right-hand corner. For standard spindles thiswould be the two (2) digit designator used to select the spindle. In the case of special spindles, thetwo (2) letters (AA, AB, AC, AD or AE) corresponding to the special spindle would be displayedinstead. The spindle number or letters will be retained in memory when power is removed. Thismeans that the last value entered for the spindle will be displayed the next time the Rheometer isturned on.
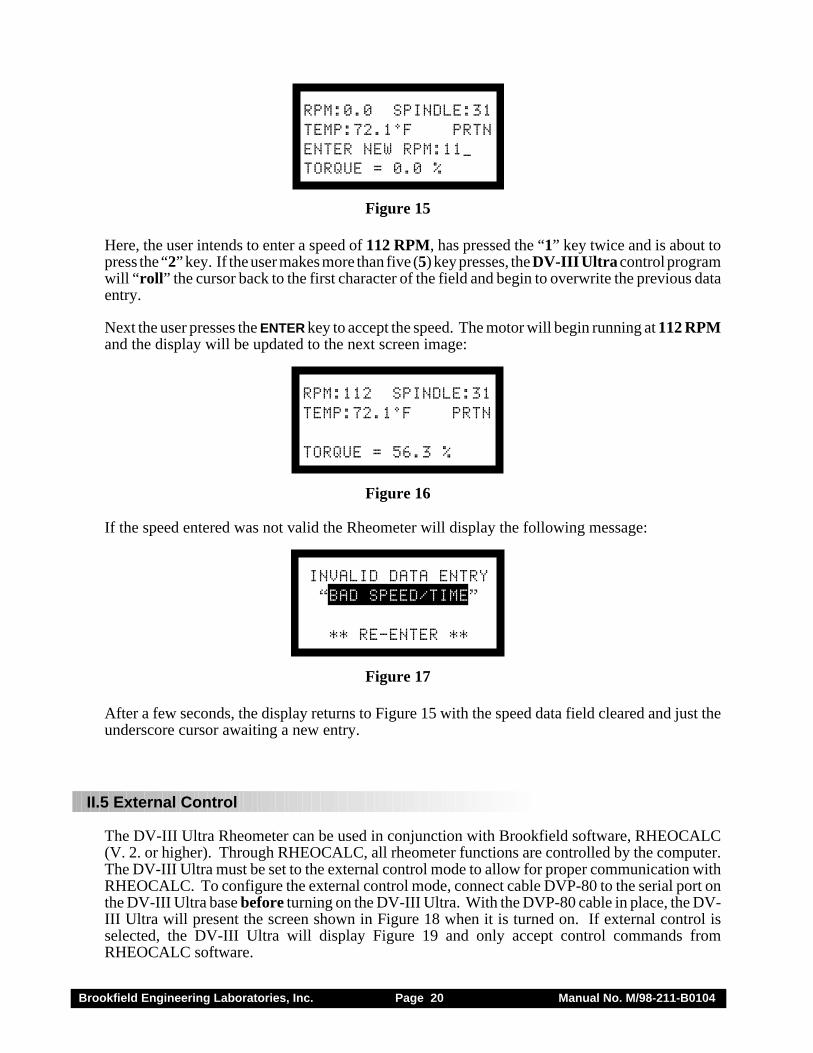
II.4 Direct Speed Entry
At this point, the user may choose to enter a speed by the so-called direct speed entry method. Entera valid speed in the range of 0.01 to 250 RPM by pressing the numeric keys successively. Thepreviously blank line 3 on the default display screen records the user’s new speed input as depictedin Figure 15:
Brookfield Engineering Laboratories, Inc. Page 20 Manual No. M/98-211-B0104
RPM:0.0 SPINDLE:31TEMP:72.1°F PRTNENTER NEW RPM:11_TORQUE = 0.0 %
Figure 15
Here, the user intends to enter a speed of 112 RPM, has pressed the “1” key twice and is about topress the “2” key. If the user makes more than five (5) key presses, the DV-III Ultra control programwill “roll” the cursor back to the first character of the field and begin to overwrite the previous dataentry.
Next the user presses the ENTER key to accept the speed. The motor will begin running at 112 RPMand the display will be updated to the next screen image:
RPM:112 SPINDLE:31TEMP:72.1°F PRTN
TORQUE = 56.3 %
Figure 16
If the speed entered was not valid the Rheometer will display the following message:
INVALID DATA ENTRY“BAD SPEED/TIME”
** RE-ENTER **
Figure 17
After a few seconds, the display returns to Figure 15 with the speed data field cleared and just theunderscore cursor awaiting a new entry.
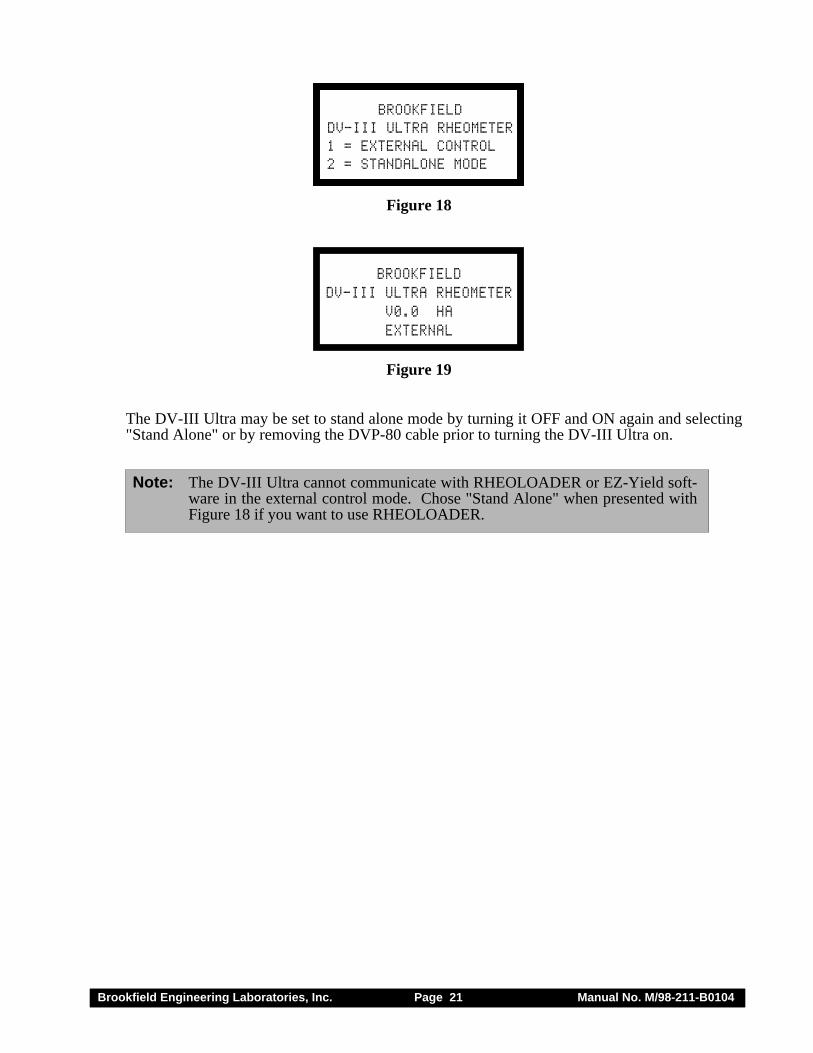
II.5 External Control
The DV-III Ultra Rheometer can be used in conjunction with Brookfield software, RHEOCALC(V. 2. or higher). Through RHEOCALC, all rheometer functions are controlled by the computer.The DV-III Ultra must be set to the external control mode to allow for proper communication withRHEOCALC. To configure the external control mode, connect cable DVP-80 to the serial port onthe DV-III Ultra base before turning on the DV-III Ultra. With the DVP-80 cable in place, the DV-III Ultra will present the screen shown in Figure 18 when it is turned on. If external control isselected, the DV-III Ultra will display Figure 19 and only accept control commands fromRHEOCALC software.
Brookfield Engineering Laboratories, Inc. Page 21 Manual No. M/98-211-B0104
BROOKFIELDDV-III ULTRA RHEOMETER1 = EXTERNAL CONTROL2 = STANDALONE MODE
Figure 18
BROOKFIELDDV-III ULTRA RHEOMETER
V0.0 HAEXTERNAL
Figure 19
The DV-III Ultra may be set to stand alone mode by turning it OFF and ON again and selecting"Stand Alone" or by removing the DVP-80 cable prior to turning the DV-III Ultra on.
Note: The DV-III Ultra cannot communicate with RHEOLOADER or EZ-Yield soft-ware in the external control mode. Chose "Stand Alone" when presented withFigure 18 if you want to use RHEOLOADER.
Brookfield Engineering Laboratories, Inc. Page 22 Manual No. M/98-211-B0104
III. MAKING VISCOSITY AND YIELD MEASUREMENTS
III.1 Quick Start
Viscosity Measurement
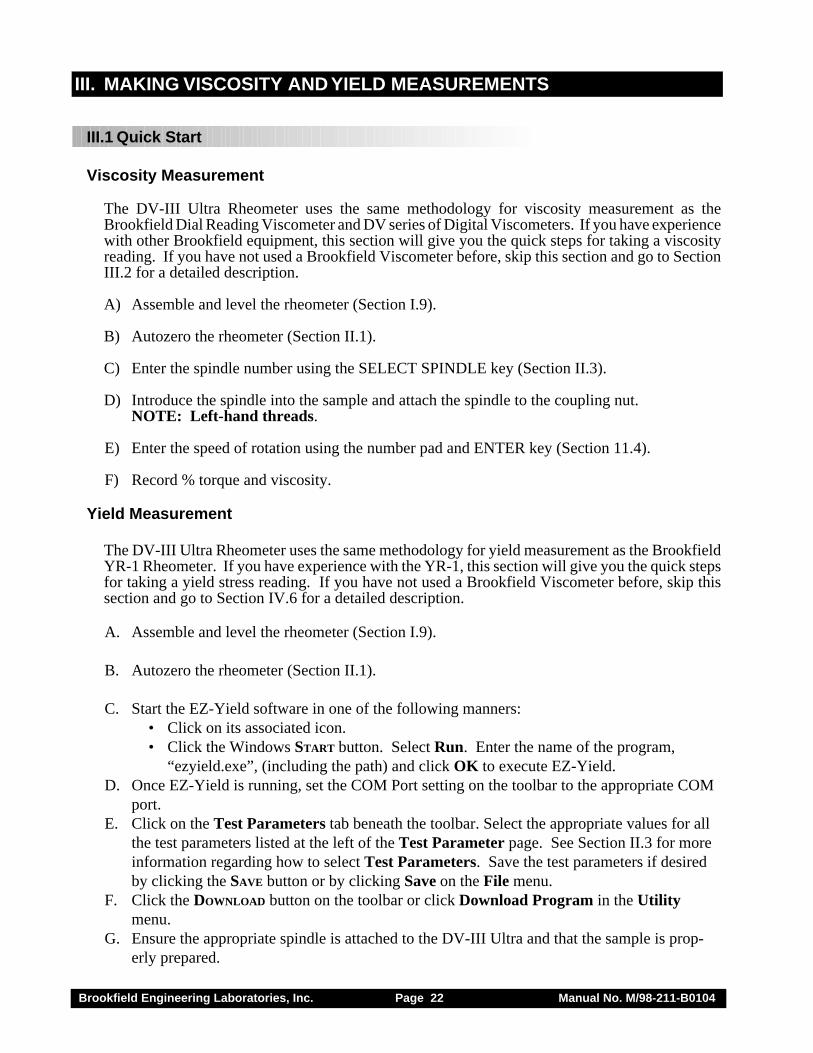
The DV-III Ultra Rheometer uses the same methodology for viscosity measurement as theBrookfield Dial Reading Viscometer and DV series of Digital Viscometers. If you have experiencewith other Brookfield equipment, this section will give you the quick steps for taking a viscosityreading. If you have not used a Brookfield Viscometer before, skip this section and go to SectionIII.2 for a detailed description.
A) Assemble and level the rheometer (Section I.9).
B) Autozero the rheometer (Section II.1).
C) Enter the spindle number using the SELECT SPINDLE key (Section II.3).
D) Introduce the spindle into the sample and attach the spindle to the coupling nut.NOTE: Left-hand threads.
E) Enter the speed of rotation using the number pad and ENTER key (Section 11.4).
F) Record % torque and viscosity.
Yield Measurement
The DV-III Ultra Rheometer uses the same methodology for yield measurement as the BrookfieldYR-1 Rheometer. If you have experience with the YR-1, this section will give you the quick stepsfor taking a yield stress reading. If you have not used a Brookfield Viscometer before, skip thissection and go to Section IV.6 for a detailed description.
A. Assemble and level the rheometer (Section I.9).
B. Autozero the rheometer (Section II.1).
C. Start the EZ-Yield software in one of the following manners: • Click on its associated icon. • Click the Windows START button. Select Run. Enter the name of the program,
“ezyield.exe”, (including the path) and click OK to execute EZ-Yield.D. Once EZ-Yield is running, set the COM Port setting on the toolbar to the appropriate COM
port.E. Click on the Test Parameters tab beneath the toolbar. Select the appropriate values for all
the test parameters listed at the left of the Test Parameter page. See Section II.3 for moreinformation regarding how to select Test Parameters. Save the test parameters if desiredby clicking the SAVE button or by clicking Save on the File menu.
F. Click the DOWNLOAD button on the toolbar or click Download Program in the Utilitymenu.
G. Ensure the appropriate spindle is attached to the DV-III Ultra and that the sample is prop-erly prepared.
Brookfield Engineering Laboratories, Inc. Page 23 Manual No. M/98-211-B0104
H. Click the down arrow on the RUN button or click Run Program on the Utility menu. Selectthe program number you wish to run - in this case, the program number specified in the list oftest parameters.
I. After a few seconds, the Graphs page is automatically displayed, signaling that the test hasbegun. Once all the optional preparation steps are complete, the YR-1 begins sending data tothe EZ-Yield software and displaying it on the graph and in the data table on the Data page.
J. When the test is complete, a dialog box appears asking you to save the data just acquired.
III.2 Preparations for Making Measurements
A) RHEOMETER: The DV-III Ultra should be turned on, leveled and autozeroed. The level isadjusted using the three feet on the bottom of the base and confirmed using the bubble on thetop of the head. Adjust the feet until bubble is inside the center target. Set the level prior toautozero and check the level prior to each measurement.
Proper level is essential for correct operation of the DV-III Ultra.
B) SAMPLE: The fluid to be measured (sample) must be in a container. The standard spindlessupplied with the DV-III Ultra (LV(1-4), RV(2-7), or HA/HB(2-7)) are designed to be used witha 600 ml low form Griffin beaker (or equivalent container with a diameter of 8.25cm). The sameapplies to the optional RV1, HA/HB1, and Vane spindles. Many other spindle systems aresupplied from Brookfield with specific sample chambers such as the Small Sample Adapter, ULAdapter and Thermosel.
Brookfield recommends that you use the appropriate container for the selected spindle. Youmay choose to use an alternate container for convenience, however, this may have an effect onthe measured viscosity. The DV-III Ultra is calibrated considering the specified container.Alternate containers will provide results that are repeatable but not "true."
The LV (1-4) and RV (1-7) are designed to be used with the guardleg attached. Measurementsmade without the guardleg will provide repeatable results but may not provide "true" results.
When comparing data with others, be sure to specify the sample container and presence/absence of the guardleg.
Many samples must be controlled to a specific temperature for viscosity measurement. Whenconditioning a sample for temperature, be sure to temperature control the container and spindleas well as the sample.
Please see our publication, "More Solutions to Sticky Problems", for more detail relating tosample preparation.
III.3 Selecting a Spindle/Speed
The DV-III Ultra has the capability of measuring viscosity over an extremely wide range (forexample, the RVDV-III+ can measure fluids within the range of 100-40,000,000 cP) (seeAppendix B). This range is achieved through the use of several spindles over many speeds.When measuring yield stress with vane spindles, a broad measurement range is also possiblethrough the choice of multiple spindles.
The process of selecting a spindle and speed for an unknown fluid is normally trial and error.An appropriate selection will result in measurements made between 10-100 on theinstrument % torque scale. Two general rules will help in the trial and error process.
Brookfield Engineering Laboratories, Inc. Page 24 Manual No. M/98-211-B0104
1) Viscosity range is inversely proportional to the size of the spindle.2) Viscosity range is inversely proportional to the rotational speed.
In other words: to measure high viscosity, choose a small spindle and/or a slow speed. If thechosen spindle/speed results in a reading above 100%, then reduce the speed or choose a smallerspindle.
Experimentation may reveal that several spindle/speed combinations will produce satisfactoryresults between 10-100%. When this circumstance occurs, any of the spindles may be selected.
Non-Newtonian fluid behavior can result in the measured viscosity and yield stress changing ifthe spindle and/or speed is changed. See our publication, "More Solutions to Sticky Problems,"for more detail.
When viscosity and/or yield stress data must be compared, be sure to use the same testmethodology: namely the same instrument, spindle, speed, container, temperature andtest time.
III.4 Multiple Data Points
The majority of viscosity and yield stress measurements are made at the quality control level andoften consist of a single data point. The test is conducted with one spindle at one speed. Thedata point is a useful bench mark for the go/no-go decision in a production setting. The DV-IIIUltra can be used for single point measurement.
Many fluids exhibit a characteristic change in viscosity and yield stress with a change in appliedforce. This non-Newtonian flow behavior is commonly seen in paints, coatings and foodproducts as a decrease in viscosity as shear rate increases or an increase in yield stress asrotational speed increases. This behavior cannot be detected or evaluated with the single pointmeasurement.
Non-Newtonian flow is analyzed through the collection of viscosity data over a range of shearrates and the generation of a graph of viscosity versus shear rate (a rheogram). The same appliesto yield stress determination by analyzing torque vs. time behavior at different rotational speeds.This information will allow for a more complete characterization of a fluid and may help informulating and production of the product. The DV-III Ultra is capable of collecting multipledata points for comprehensive analysis of flow behavior. See Section IV on Programming andAnalysis.
More information on flow behavior, shear rate and rheograms is available in our publication,"More Solutions to Sticky Problems."
Brookfield Engineering Laboratories, Inc. Page 25 Manual No. M/98-211-B0104
IV. PROGRAMMING THE DV-III ULTRA AND DATA COLLECTION METHODS/ANALYSIS
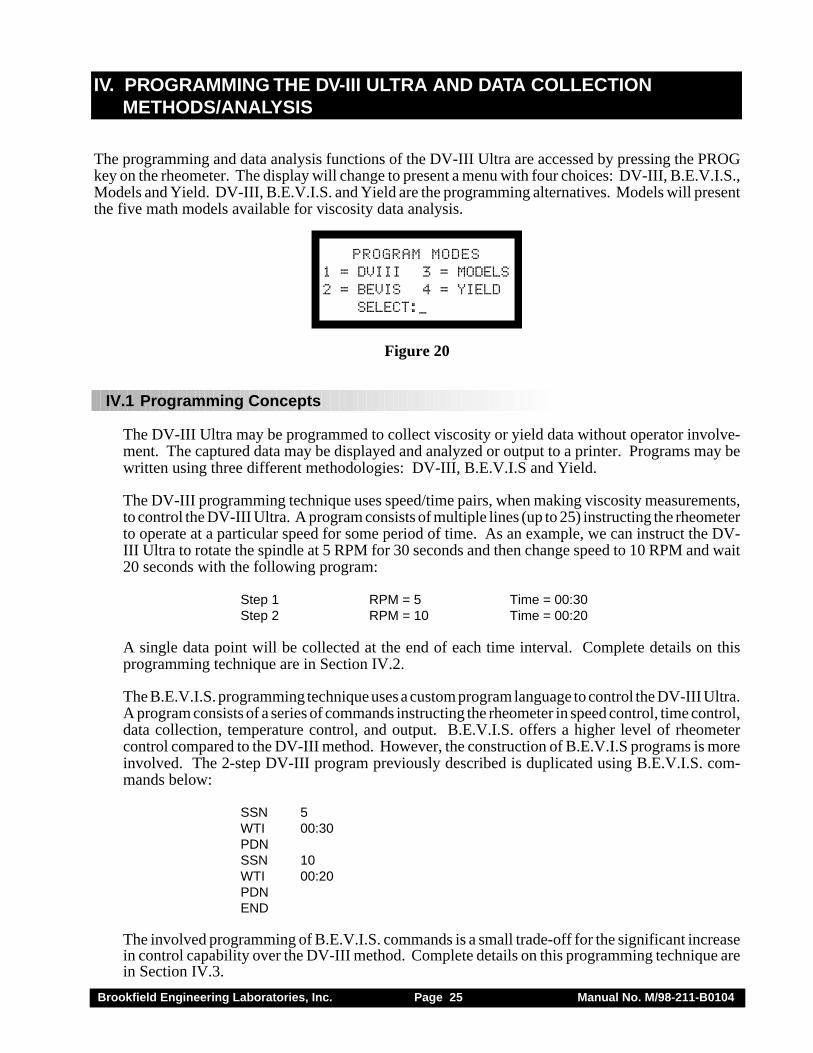
The programming and data analysis functions of the DV-III Ultra are accessed by pressing the PROGkey on the rheometer. The display will change to present a menu with four choices: DV-III, B.E.V.I.S.,Models and Yield. DV-III, B.E.V.I.S. and Yield are the programming alternatives. Models will presentthe five math models available for viscosity data analysis.
PROGRAM MODES1 = DVIII 3 = MODELS2 = BEVIS 4 = YIELD SELECT:_
Figure 20
IV.1 Programming Concepts
The DV-III Ultra may be programmed to collect viscosity or yield data without operator involve-ment. The captured data may be displayed and analyzed or output to a printer. Programs may bewritten using three different methodologies: DV-III, B.E.V.I.S and Yield.
The DV-III programming technique uses speed/time pairs, when making viscosity measurements,to control the DV-III Ultra. A program consists of multiple lines (up to 25) instructing the rheometerto operate at a particular speed for some period of time. As an example, we can instruct the DV-III Ultra to rotate the spindle at 5 RPM for 30 seconds and then change speed to 10 RPM and wait20 seconds with the following program:
Step 1 RPM = 5 Time = 00:30Step 2 RPM = 10 Time = 00:20
A single data point will be collected at the end of each time interval. Complete details on thisprogramming technique are in Section IV.2.
The B.E.V.I.S. programming technique uses a custom program language to control the DV-III Ultra.A program consists of a series of commands instructing the rheometer in speed control, time control,data collection, temperature control, and output. B.E.V.I.S. offers a higher level of rheometercontrol compared to the DV-III method. However, the construction of B.E.V.I.S programs is moreinvolved. The 2-step DV-III program previously described is duplicated using B.E.V.I.S. com-mands below:
SSN 5WTI 00:30PDNSSN 10WTI 00:20PDNEND
The involved programming of B.E.V.I.S. commands is a small trade-off for the significant increasein control capability over the DV-III method. Complete details on this programming technique arein Section IV.3.
Brookfield Engineering Laboratories, Inc. Page 26 Manual No. M/98-211-B0104
The yield programming technique uses three control parameters to run yield tests on the DV-IIIUltra: speed control, time control and torque change between successive data points. Completedetails on this programming technique are in Section IV.4.
IV.2 DV-III Speed/Time Pair Programs for Making Viscosity Measurements
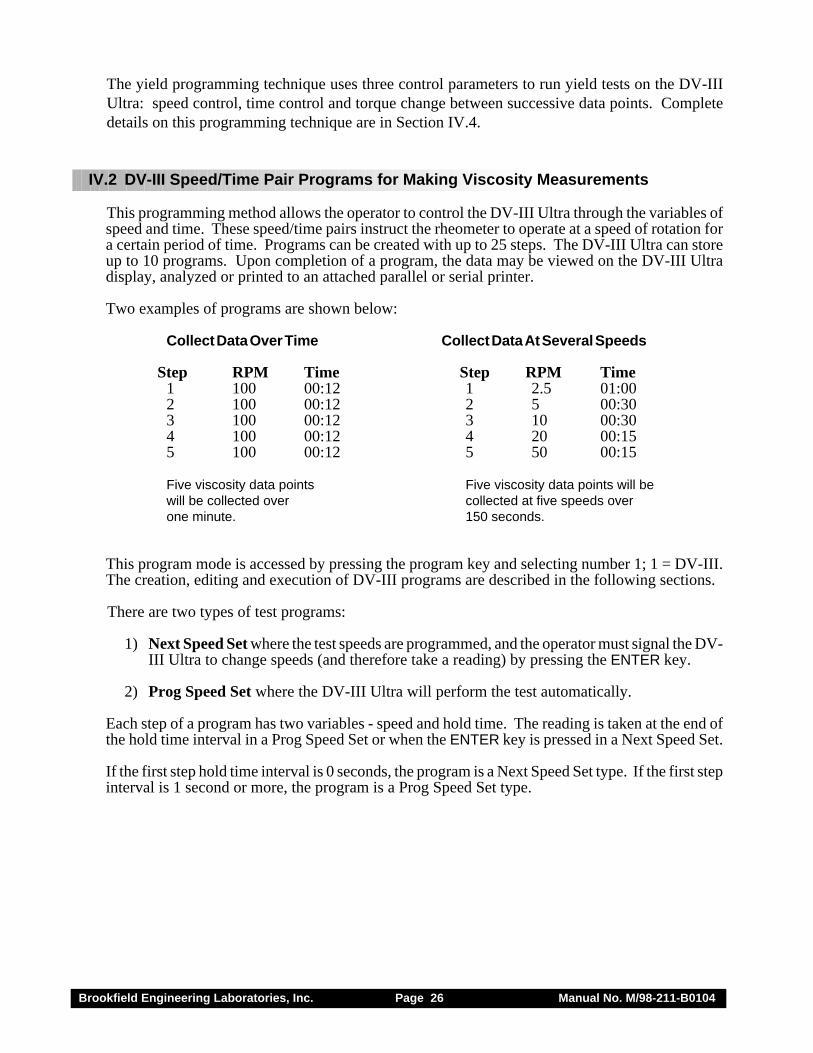
This programming method allows the operator to control the DV-III Ultra through the variables ofspeed and time. These speed/time pairs instruct the rheometer to operate at a speed of rotation fora certain period of time. Programs can be created with up to 25 steps. The DV-III Ultra can storeup to 10 programs. Upon completion of a program, the data may be viewed on the DV-III Ultradisplay, analyzed or printed to an attached parallel or serial printer.
Two examples of programs are shown below:
Collect Data Over Time Collect Data At Several Speeds
Step RPM Time Step RPM Time1 100 00:12 1 2.5 01:002 100 00:12 2 5 00:303 100 00:12 3 10 00:304 100 00:12 4 20 00:155 100 00:12 5 50 00:15
Five viscosity data points Five viscosity data points will bewill be collected over collected at five speeds overone minute. 150 seconds.
This program mode is accessed by pressing the program key and selecting number 1; 1 = DV-III.The creation, editing and execution of DV-III programs are described in the following sections.
There are two types of test programs:
1) Next Speed Set where the test speeds are programmed, and the operator must signal the DV-III Ultra to change speeds (and therefore take a reading) by pressing the ENTER key.
2) Prog Speed Set where the DV-III Ultra will perform the test automatically.
Each step of a program has two variables - speed and hold time. The reading is taken at the end ofthe hold time interval in a Prog Speed Set or when the ENTER key is pressed in a Next Speed Set.
If the first step hold time interval is 0 seconds, the program is a Next Speed Set type. If the first stepinterval is 1 second or more, the program is a Prog Speed Set type.
Brookfield Engineering Laboratories, Inc. Page 27 Manual No. M/98-211-B0104
� SPEED SET SELECTION AND PROGRAMMING
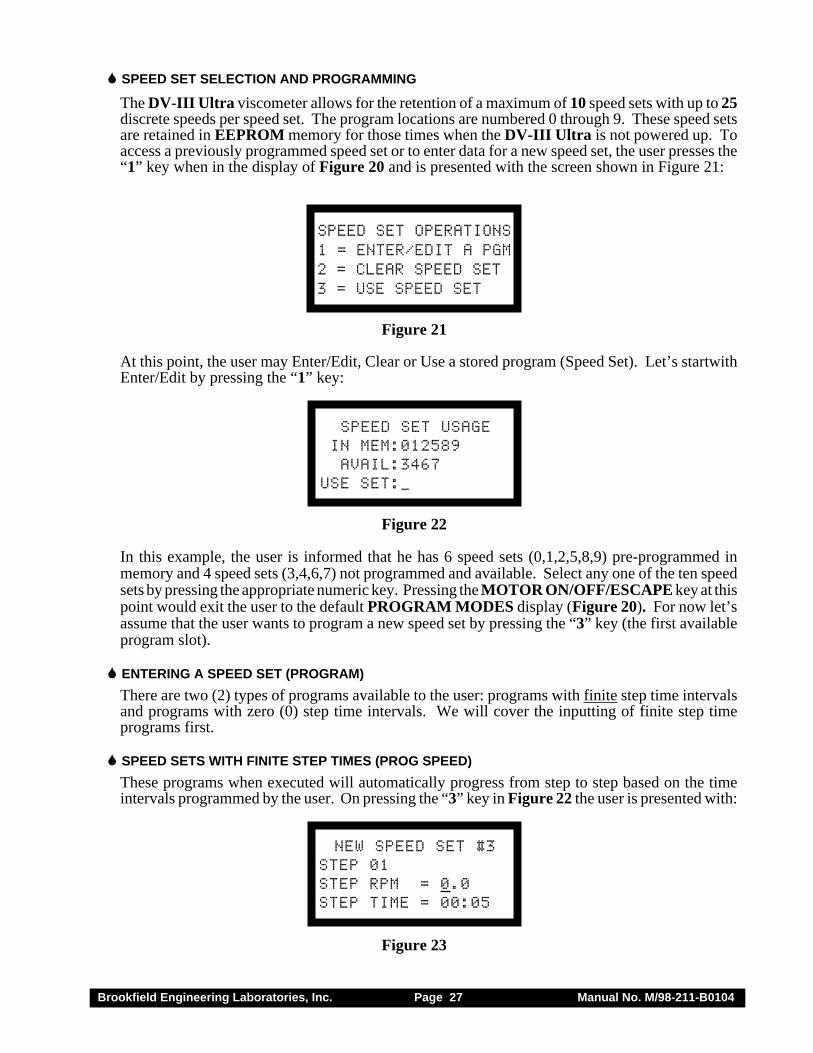
The DV-III Ultra viscometer allows for the retention of a maximum of 10 speed sets with up to 25discrete speeds per speed set. The program locations are numbered 0 through 9. These speed setsare retained in EEPROM memory for those times when the DV-III Ultra is not powered up. Toaccess a previously programmed speed set or to enter data for a new speed set, the user presses the“1” key when in the display of Figure 20 and is presented with the screen shown in Figure 21:
SPEED SET OPERATIONS1 = ENTER/EDIT A PGM2 = CLEAR SPEED SET3 = USE SPEED SET
Figure 21
At this point, the user may Enter/Edit, Clear or Use a stored program (Speed Set). Let’s startwithEnter/Edit by pressing the “1” key:
SPEED SET USAGE IN MEM:012589 AVAIL:3467USE SET:_
Figure 22
In this example, the user is informed that he has 6 speed sets (0,1,2,5,8,9) pre-programmed inmemory and 4 speed sets (3,4,6,7) not programmed and available. Select any one of the ten speedsets by pressing the appropriate numeric key. Pressing the MOTOR ON/OFF/ESCAPE key at thispoint would exit the user to the default PROGRAM MODES display (Figure 20). For now let’sassume that the user wants to program a new speed set by pressing the “3” key (the first availableprogram slot).
� ENTERING A SPEED SET (PROGRAM)
There are two (2) types of programs available to the user: programs with finite step time intervalsand programs with zero (0) step time intervals. We will cover the inputting of finite step timeprograms first.
� SPEED SETS WITH FINITE STEP TIMES (PROG SPEED)
These programs when executed will automatically progress from step to step based on the timeintervals programmed by the user. On pressing the “3” key in Figure 22 the user is presented with:
NEW SPEED SET #3STEP 01STEP RPM = 0.0STEP TIME = 00:05
Figure 23
Brookfield Engineering Laboratories, Inc. Page 28 Manual No. M/98-211-B0104
This screen reminds the user of the speed set that he has selected to program and then allows himto change either the speed or time interval or both for that step.
Note: The time interval on entry to this screen will always be set to 00:05 seconds as thedefault value. The user may of course change it to any valid time of his choice.Whenever you change time interval, that new time becomes the default interval untilit is again changed by the user. Also, note that zero (0) times are not allowed forprogram steps after the first step for Finite Step programs.
The OPTION/TAB key is used for moving from input field to input field and the ENTER key to acceptthe current input for a step. On entry to this screen, the underscore cursor would be flashing (asshown) under the first digit of the step RPM. Use the numeric keys to make changes to the step speed,repeating the input as many times as required until satisfied.
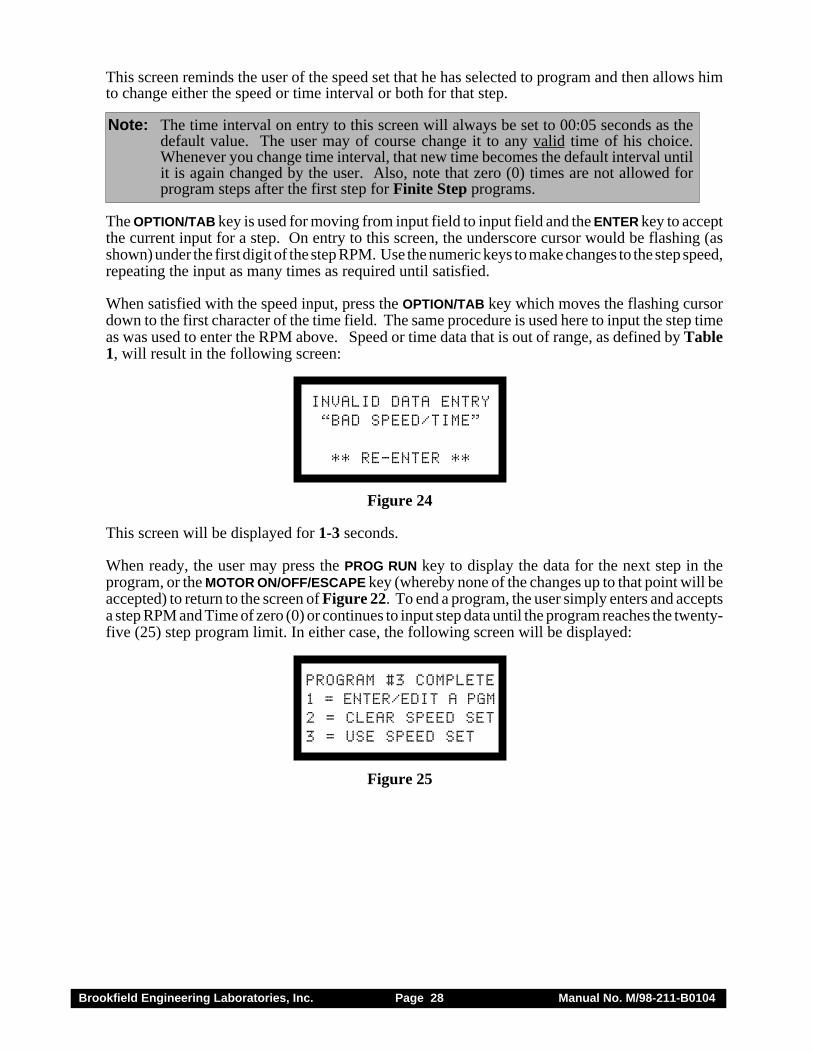
When satisfied with the speed input, press the OPTION/TAB key which moves the flashing cursordown to the first character of the time field. The same procedure is used here to input the step timeas was used to enter the RPM above. Speed or time data that is out of range, as defined by Table1, will result in the following screen:
INVALID DATA ENTRY“BAD SPEED/TIME”
** RE-ENTER **
Figure 24
This screen will be displayed for 1-3 seconds.
When ready, the user may press the PROG RUN key to display the data for the next step in theprogram, or the MOTOR ON/OFF/ESCAPE key (whereby none of the changes up to that point will beaccepted) to return to the screen of Figure 22. To end a program, the user simply enters and acceptsa step RPM and Time of zero (0) or continues to input step data until the program reaches the twenty-five (25) step program limit. In either case, the following screen will be displayed:
PROGRAM #3 COMPLETE1 = ENTER/EDIT A PGM2 = CLEAR SPEED SET3 = USE SPEED SET
Figure 25
Brookfield Engineering Laboratories, Inc. Page 29 Manual No. M/98-211-B0104
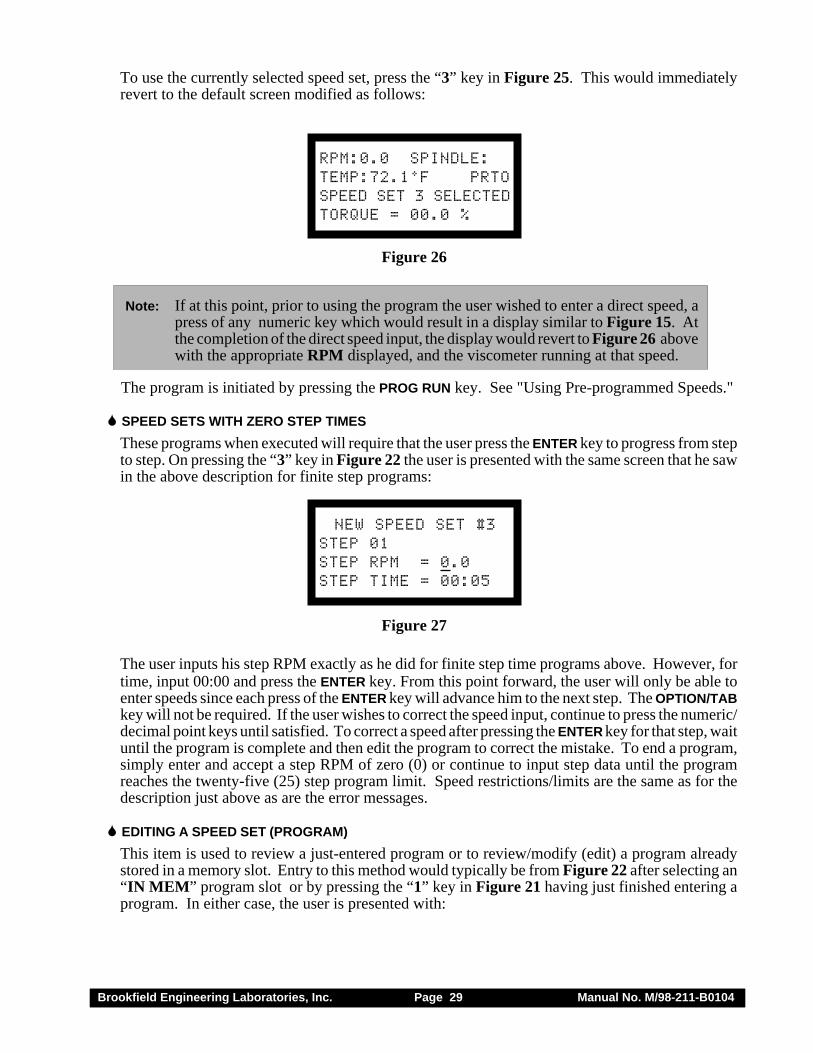
To use the currently selected speed set, press the “3” key in Figure 25. This would immediatelyrevert to the default screen modified as follows:
RPM:0.0 SPINDLE:TEMP:72.1°F PRTOSPEED SET 3 SELECTEDTORQUE = 00.0 %
Figure 26
Note: If at this point, prior to using the program the user wished to enter a direct speed, apress of any numeric key which would result in a display similar to Figure 15. Atthe completion of the direct speed input, the display would revert to Figure 26 abovewith the appropriate RPM displayed, and the viscometer running at that speed.
The program is initiated by pressing the PROG RUN key. See "Using Pre-programmed Speeds."
� SPEED SETS WITH ZERO STEP TIMES
These programs when executed will require that the user press the ENTER key to progress from stepto step. On pressing the “3” key in Figure 22 the user is presented with the same screen that he sawin the above description for finite step programs:
NEW SPEED SET #3STEP 01STEP RPM = 0.0STEP TIME = 00:05
Figure 27
The user inputs his step RPM exactly as he did for finite step time programs above. However, fortime, input 00:00 and press the ENTER key. From this point forward, the user will only be able toenter speeds since each press of the ENTER key will advance him to the next step. The OPTION/TABkey will not be required. If the user wishes to correct the speed input, continue to press the numeric/decimal point keys until satisfied. To correct a speed after pressing the ENTER key for that step, waituntil the program is complete and then edit the program to correct the mistake. To end a program,simply enter and accept a step RPM of zero (0) or continue to input step data until the programreaches the twenty-five (25) step program limit. Speed restrictions/limits are the same as for thedescription just above as are the error messages.
� EDITING A SPEED SET (PROGRAM)
This item is used to review a just-entered program or to review/modify (edit) a program alreadystored in a memory slot. Entry to this method would typically be from Figure 22 after selecting an“IN MEM” program slot or by pressing the “1” key in Figure 21 having just finished entering aprogram. In either case, the user is presented with:
Brookfield Engineering Laboratories, Inc. Page 30 Manual No. M/98-211-B0104
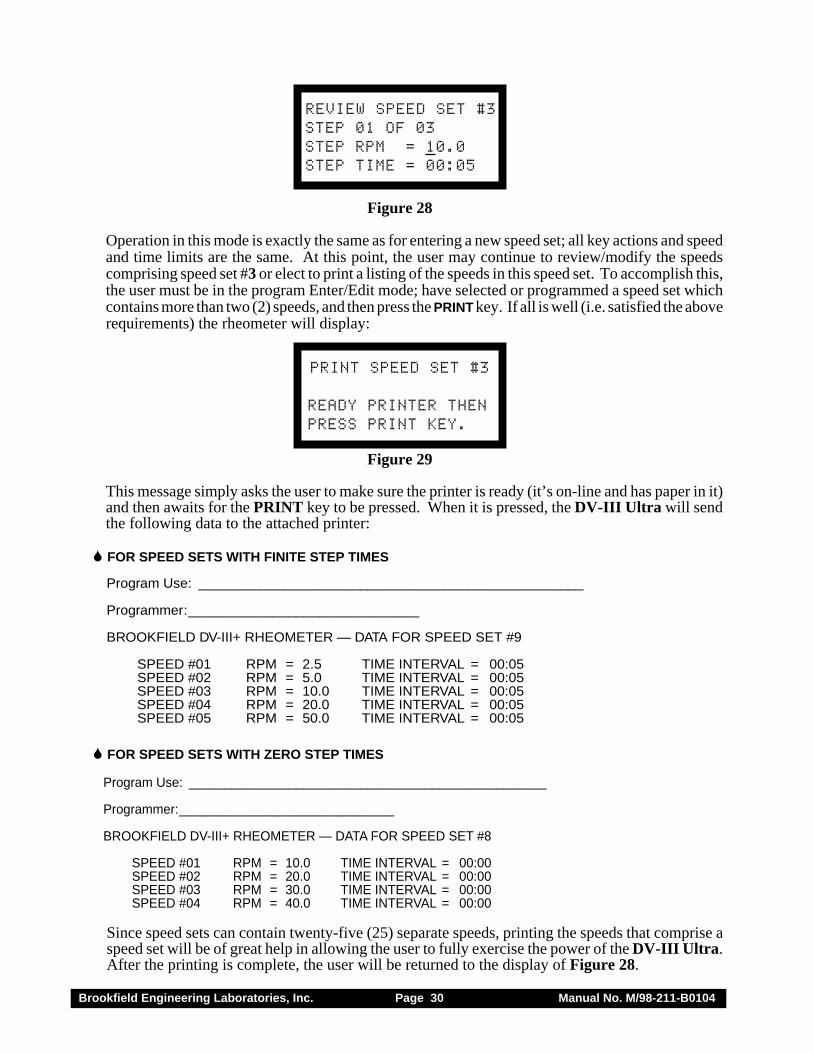
REVIEW SPEED SET #3STEP 01 OF 03STEP RPM = 10.0STEP TIME = 00:05
Figure 28
Operation in this mode is exactly the same as for entering a new speed set; all key actions and speedand time limits are the same. At this point, the user may continue to review/modify the speedscomprising speed set #3 or elect to print a listing of the speeds in this speed set. To accomplish this,the user must be in the program Enter/Edit mode; have selected or programmed a speed set whichcontains more than two (2) speeds, and then press the PRINT key. If all is well (i.e. satisfied the aboverequirements) the rheometer will display:
PRINT SPEED SET #3
READY PRINTER THENPRESS PRINT KEY.
Figure 29
This message simply asks the user to make sure the printer is ready (it’s on-line and has paper in it)and then awaits for the PRINT key to be pressed. When it is pressed, the DV-III Ultra will sendthe following data to the attached printer:
� FOR SPEED SETS WITH FINITE STEP TIMES
Program Use: __________________________________________________
Programmer:______________________________
BROOKFIELD DV-III+ RHEOMETER — DATA FOR SPEED SET #9
SPEED #01 RPM = 2.5 TIME INTERVAL = 00:05SPEED #02 RPM = 5.0 TIME INTERVAL = 00:05SPEED #03 RPM = 10.0 TIME INTERVAL = 00:05SPEED #04 RPM = 20.0 TIME INTERVAL = 00:05SPEED #05 RPM = 50.0 TIME INTERVAL = 00:05
� FOR SPEED SETS WITH ZERO STEP TIMES
Program Use: __________________________________________________
Programmer:______________________________
BROOKFIELD DV-III+ RHEOMETER — DATA FOR SPEED SET #8
SPEED #01 RPM = 10.0 TIME INTERVAL = 00:00SPEED #02 RPM = 20.0 TIME INTERVAL = 00:00SPEED #03 RPM = 30.0 TIME INTERVAL = 00:00SPEED #04 RPM = 40.0 TIME INTERVAL = 00:00
Since speed sets can contain twenty-five (25) separate speeds, printing the speeds that comprise aspeed set will be of great help in allowing the user to fully exercise the power of the DV-III Ultra.After the printing is complete, the user will be returned to the display of Figure 28.
Brookfield Engineering Laboratories, Inc. Page 31 Manual No. M/98-211-B0104
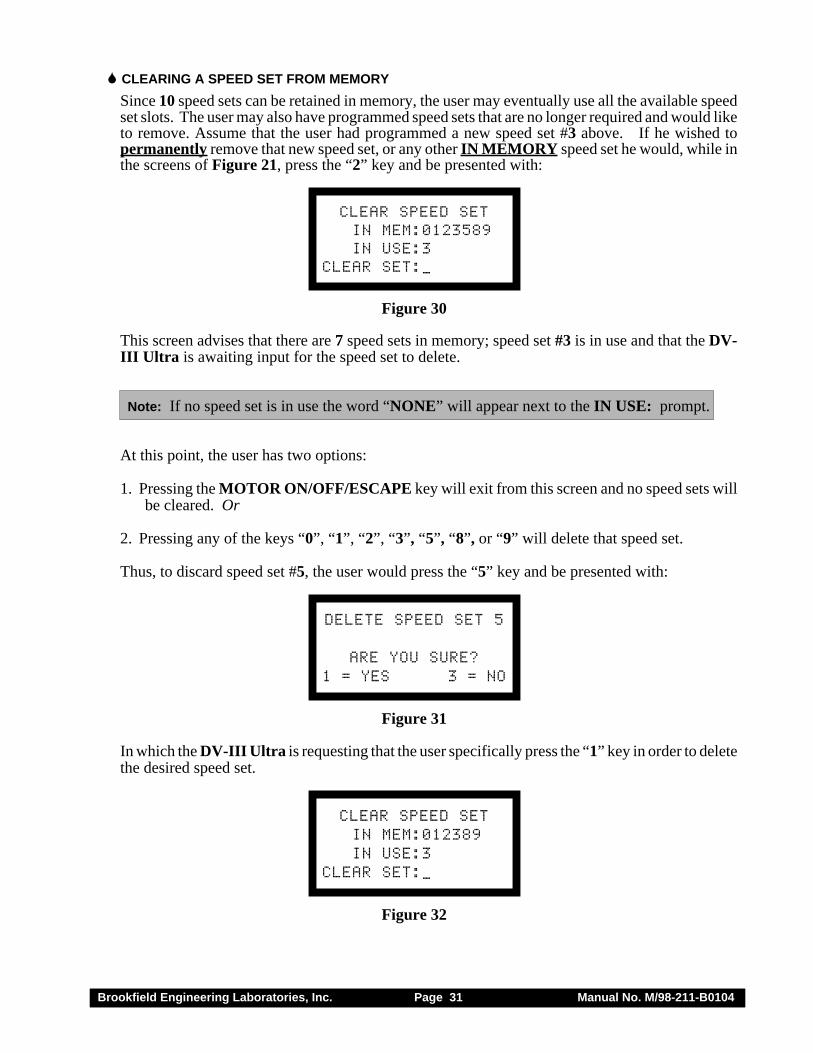
� CLEARING A SPEED SET FROM MEMORY
Since 10 speed sets can be retained in memory, the user may eventually use all the available speedset slots. The user may also have programmed speed sets that are no longer required and would liketo remove. Assume that the user had programmed a new speed set #3 above. If he wished topermanently remove that new speed set, or any other IN MEMORY speed set he would, while inthe screens of Figure 21, press the “2” key and be presented with:
CLEAR SPEED SET IN MEM:0123589 IN USE:3CLEAR SET:_
Figure 30
This screen advises that there are 7 speed sets in memory; speed set #3 is in use and that the DV-III Ultra is awaiting input for the speed set to delete.
Note: If no speed set is in use the word “NONE” will appear next to the IN USE: prompt.
At this point, the user has two options:
1. Pressing the MOTOR ON/OFF/ESCAPE key will exit from this screen and no speed sets willbe cleared. Or
2. Pressing any of the keys “0”, “1”, “2”, “3”, “5”, “8”, or “9” will delete that speed set.
Thus, to discard speed set #5, the user would press the “5” key and be presented with:
DELETE SPEED SET 5
ARE YOU SURE?1 = YES 3 = NO
Figure 31
In which the DV-III Ultra is requesting that the user specifically press the “1” key in order to deletethe desired speed set.
CLEAR SPEED SET IN MEM:012389 IN USE:3CLEAR SET:_
Figure 32
Brookfield Engineering Laboratories, Inc. Page 32 Manual No. M/98-211-B0104
Pressing the “3” key will cause the DV-III Ultra to take no action will return the user to the CLEARSPEED SET opening screen, Figure 30. Any attempt to delete an in-use speed (“3” for instance)will cause the DV-III Ultra to issue a “beep” “beep” with no action being taken. Thus no active(i.e. selected for use) program can be deleted from this screen.
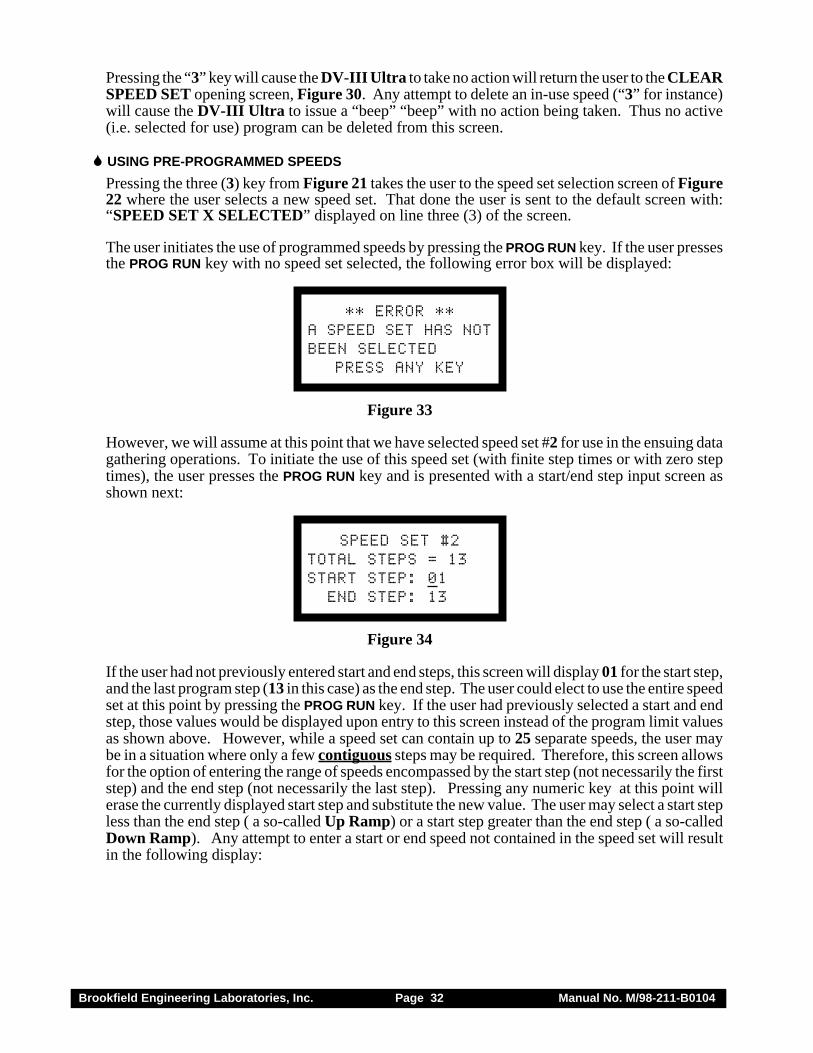
� USING PRE-PROGRAMMED SPEEDS
Pressing the three (3) key from Figure 21 takes the user to the speed set selection screen of Figure22 where the user selects a new speed set. That done the user is sent to the default screen with:“SPEED SET X SELECTED” displayed on line three (3) of the screen.
The user initiates the use of programmed speeds by pressing the PROG RUN key. If the user pressesthe PROG RUN key with no speed set selected, the following error box will be displayed:
** ERROR **A SPEED SET HAS NOTBEEN SELECTED
PRESS ANY KEY
Figure 33
However, we will assume at this point that we have selected speed set #2 for use in the ensuing datagathering operations. To initiate the use of this speed set (with finite step times or with zero steptimes), the user presses the PROG RUN key and is presented with a start/end step input screen asshown next:
SPEED SET #2TOTAL STEPS = 13START STEP: 01 END STEP: 13
Figure 34
If the user had not previously entered start and end steps, this screen will display 01 for the start step,and the last program step (13 in this case) as the end step. The user could elect to use the entire speedset at this point by pressing the PROG RUN key. If the user had previously selected a start and endstep, those values would be displayed upon entry to this screen instead of the program limit valuesas shown above. However, while a speed set can contain up to 25 separate speeds, the user maybe in a situation where only a few contiguous steps may be required. Therefore, this screen allowsfor the option of entering the range of speeds encompassed by the start step (not necessarily the firststep) and the end step (not necessarily the last step). Pressing any numeric key at this point willerase the currently displayed start step and substitute the new value. The user may select a start stepless than the end step ( a so-called Up Ramp) or a start step greater than the end step ( a so-calledDown Ramp). Any attempt to enter a start or end speed not contained in the speed set will resultin the following display:
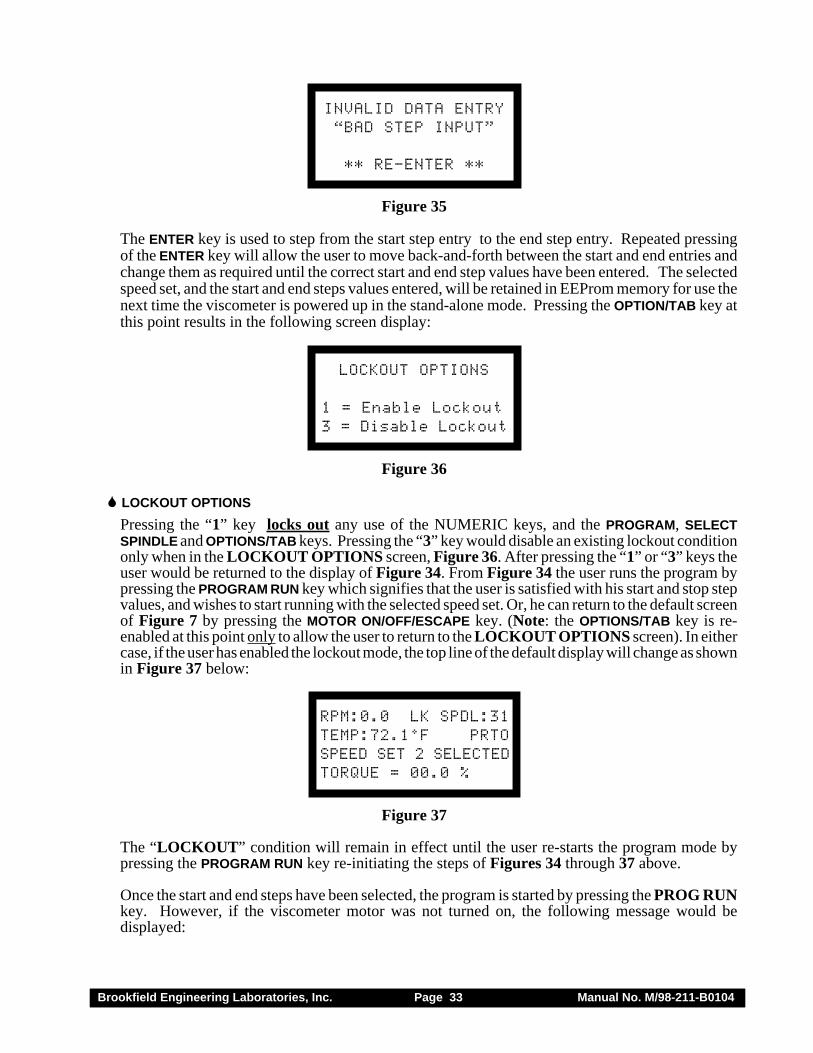
Brookfield Engineering Laboratories, Inc. Page 33 Manual No. M/98-211-B0104
INVALID DATA ENTRY“BAD STEP INPUT”
** RE-ENTER **
Figure 35
The ENTER key is used to step from the start step entry to the end step entry. Repeated pressingof the ENTER key will allow the user to move back-and-forth between the start and end entries andchange them as required until the correct start and end step values have been entered. The selectedspeed set, and the start and end steps values entered, will be retained in EEProm memory for use thenext time the viscometer is powered up in the stand-alone mode. Pressing the OPTION/TAB key atthis point results in the following screen display:
LOCKOUT OPTIONS
1 = Enable Lockout3 = Disable Lockout
Figure 36
� LOCKOUT OPTIONS
Pressing the “1” key locks out any use of the NUMERIC keys, and the PROGRAM, SELECTSPINDLE and OPTIONS/TAB keys. Pressing the “3” key would disable an existing lockout conditiononly when in the LOCKOUT OPTIONS screen, Figure 36. After pressing the “1” or “3” keys theuser would be returned to the display of Figure 34. From Figure 34 the user runs the program bypressing the PROGRAM RUN key which signifies that the user is satisfied with his start and stop stepvalues, and wishes to start running with the selected speed set. Or, he can return to the default screenof Figure 7 by pressing the MOTOR ON/OFF/ESCAPE key. (Note: the OPTIONS/TAB key is re-enabled at this point only to allow the user to return to the LOCKOUT OPTIONS screen). In eithercase, if the user has enabled the lockout mode, the top line of the default display will change as shownin Figure 37 below:
RPM:0.0 LK SPDL:31TEMP:72.1°F PRTOSPEED SET 2 SELECTEDTORQUE = 00.0 %
Figure 37
The “LOCKOUT” condition will remain in effect until the user re-starts the program mode bypressing the PROGRAM RUN key re-initiating the steps of Figures 34 through 37 above.
Once the start and end steps have been selected, the program is started by pressing the PROG RUNkey. However, if the viscometer motor was not turned on, the following message would bedisplayed:
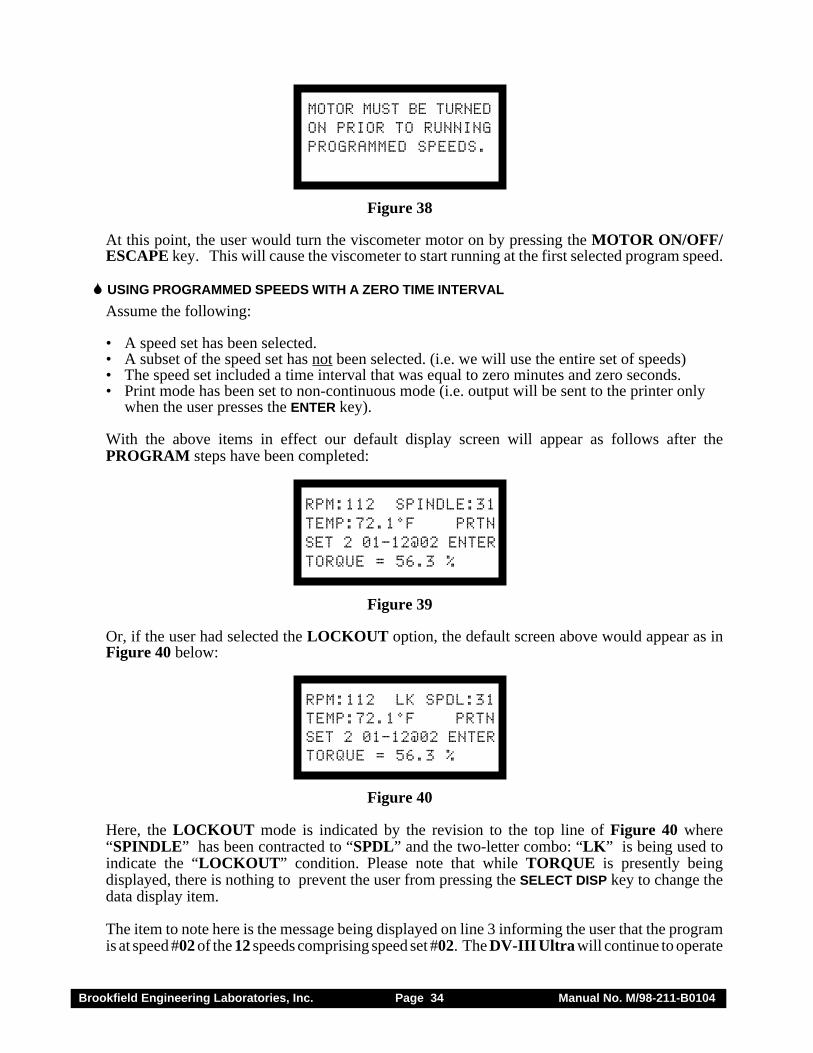
Brookfield Engineering Laboratories, Inc. Page 34 Manual No. M/98-211-B0104
MOTOR MUST BE TURNEDON PRIOR TO RUNNINGPROGRAMMED SPEEDS.
Figure 38
At this point, the user would turn the viscometer motor on by pressing the MOTOR ON/OFF/ESCAPE key. This will cause the viscometer to start running at the first selected program speed.
� USING PROGRAMMED SPEEDS WITH A ZERO TIME INTERVAL
Assume the following:
• A speed set has been selected.• A subset of the speed set has not been selected. (i.e. we will use the entire set of speeds)• The speed set included a time interval that was equal to zero minutes and zero seconds.• Print mode has been set to non-continuous mode (i.e. output will be sent to the printer only
when the user presses the ENTER key).
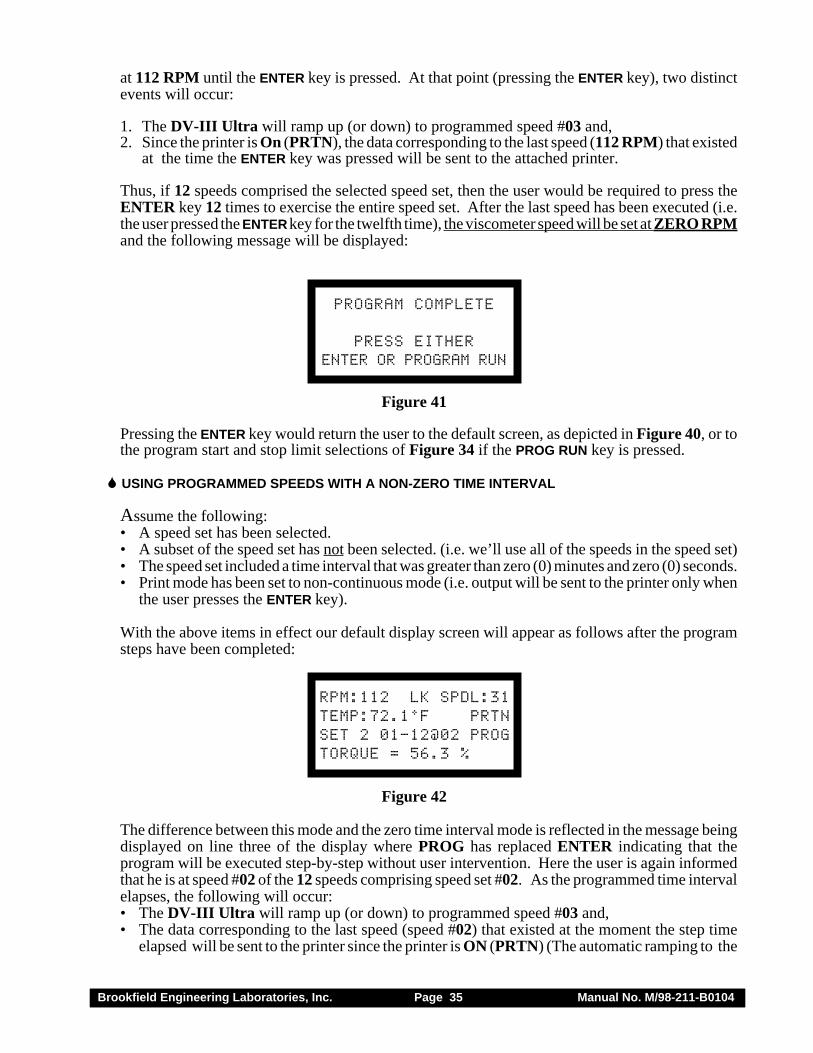
With the above items in effect our default display screen will appear as follows after thePROGRAM steps have been completed:
RPM:112 SPINDLE:31TEMP:72.1°F PRTNSET 2 01-12@02 ENTERTORQUE = 56.3 %
Figure 39
Or, if the user had selected the LOCKOUT option, the default screen above would appear as inFigure 40 below:
RPM:112 LK SPDL:31TEMP:72.1°F PRTNSET 2 01-12@02 ENTERTORQUE = 56.3 %
Figure 40
Here, the LOCKOUT mode is indicated by the revision to the top line of Figure 40 where“SPINDLE” has been contracted to “SPDL” and the two-letter combo: “LK” is being used toindicate the “LOCKOUT” condition. Please note that while TORQUE is presently beingdisplayed, there is nothing to prevent the user from pressing the SELECT DISP key to change thedata display item.
The item to note here is the message being displayed on line 3 informing the user that the programis at speed #02 of the 12 speeds comprising speed set #02. The DV-III Ultra will continue to operate
Brookfield Engineering Laboratories, Inc. Page 35 Manual No. M/98-211-B0104
at 112 RPM until the ENTER key is pressed. At that point (pressing the ENTER key), two distinctevents will occur:
1. The DV-III Ultra will ramp up (or down) to programmed speed #03 and,2. Since the printer is On (PRTN), the data corresponding to the last speed (112 RPM) that existed
at the time the ENTER key was pressed will be sent to the attached printer.
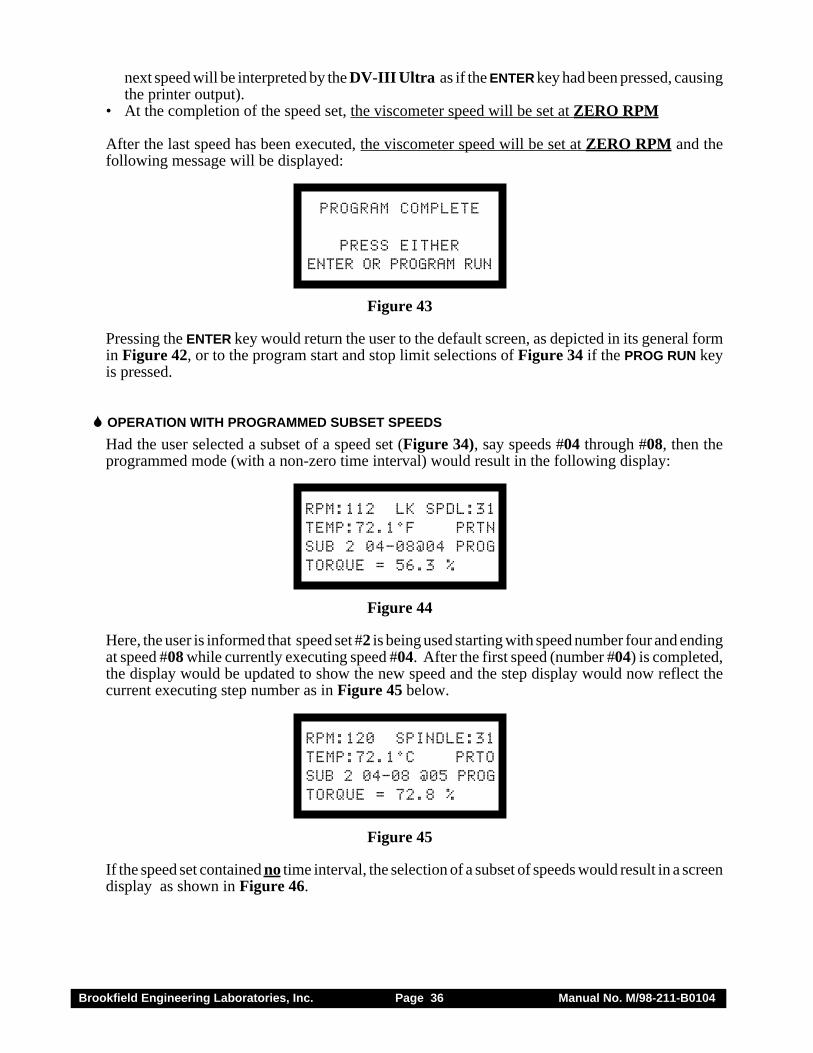
Thus, if 12 speeds comprised the selected speed set, then the user would be required to press theENTER key 12 times to exercise the entire speed set. After the last speed has been executed (i.e.the user pressed the ENTER key for the twelfth time), the viscometer speed will be set at ZERO RPMand the following message will be displayed:
PROGRAM COMPLETE
PRESS EITHERENTER OR PROGRAM RUN
Figure 41
Pressing the ENTER key would return the user to the default screen, as depicted in Figure 40, or tothe program start and stop limit selections of Figure 34 if the PROG RUN key is pressed.
� USING PROGRAMMED SPEEDS WITH A NON-ZERO TIME INTERVAL
Assume the following:• A speed set has been selected.• A subset of the speed set has not been selected. (i.e. we’ll use all of the speeds in the speed set)• The speed set included a time interval that was greater than zero (0) minutes and zero (0) seconds.• Print mode has been set to non-continuous mode (i.e. output will be sent to the printer only when
the user presses the ENTER key).
With the above items in effect our default display screen will appear as follows after the programsteps have been completed:
RPM:112 LK SPDL:31TEMP:72.1°F PRTNSET 2 01-12@02 PROGTORQUE = 56.3 %
Figure 42
The difference between this mode and the zero time interval mode is reflected in the message beingdisplayed on line three of the display where PROG has replaced ENTER indicating that theprogram will be executed step-by-step without user intervention. Here the user is again informedthat he is at speed #02 of the 12 speeds comprising speed set #02. As the programmed time intervalelapses, the following will occur:• The DV-III Ultra will ramp up (or down) to programmed speed #03 and,• The data corresponding to the last speed (speed #02) that existed at the moment the step time
elapsed will be sent to the printer since the printer is ON (PRTN) (The automatic ramping to the
Brookfield Engineering Laboratories, Inc. Page 36 Manual No. M/98-211-B0104
next speed will be interpreted by the DV-III Ultra as if the ENTER key had been pressed, causingthe printer output).
• At the completion of the speed set, the viscometer speed will be set at ZERO RPM
After the last speed has been executed, the viscometer speed will be set at ZERO RPM and thefollowing message will be displayed:
PROGRAM COMPLETE
PRESS EITHERENTER OR PROGRAM RUN
Figure 43
Pressing the ENTER key would return the user to the default screen, as depicted in its general formin Figure 42, or to the program start and stop limit selections of Figure 34 if the PROG RUN keyis pressed.
� OPERATION WITH PROGRAMMED SUBSET SPEEDS
Had the user selected a subset of a speed set (Figure 34), say speeds #04 through #08, then theprogrammed mode (with a non-zero time interval) would result in the following display:
RPM:112 LK SPDL:31TEMP:72.1°F PRTNSUB 2 04-08@04 PROGTORQUE = 56.3 %
Figure 44
Here, the user is informed that speed set #2 is being used starting with speed number four and endingat speed #08 while currently executing speed #04. After the first speed (number #04) is completed,the display would be updated to show the new speed and the step display would now reflect thecurrent executing step number as in Figure 45 below.
RPM:120 SPINDLE:31TEMP:72.1°C PRTOSUB 2 04-08 @05 PROGTORQUE = 72.8 %
Figure 45
If the speed set contained no time interval, the selection of a subset of speeds would result in a screendisplay as shown in Figure 46.
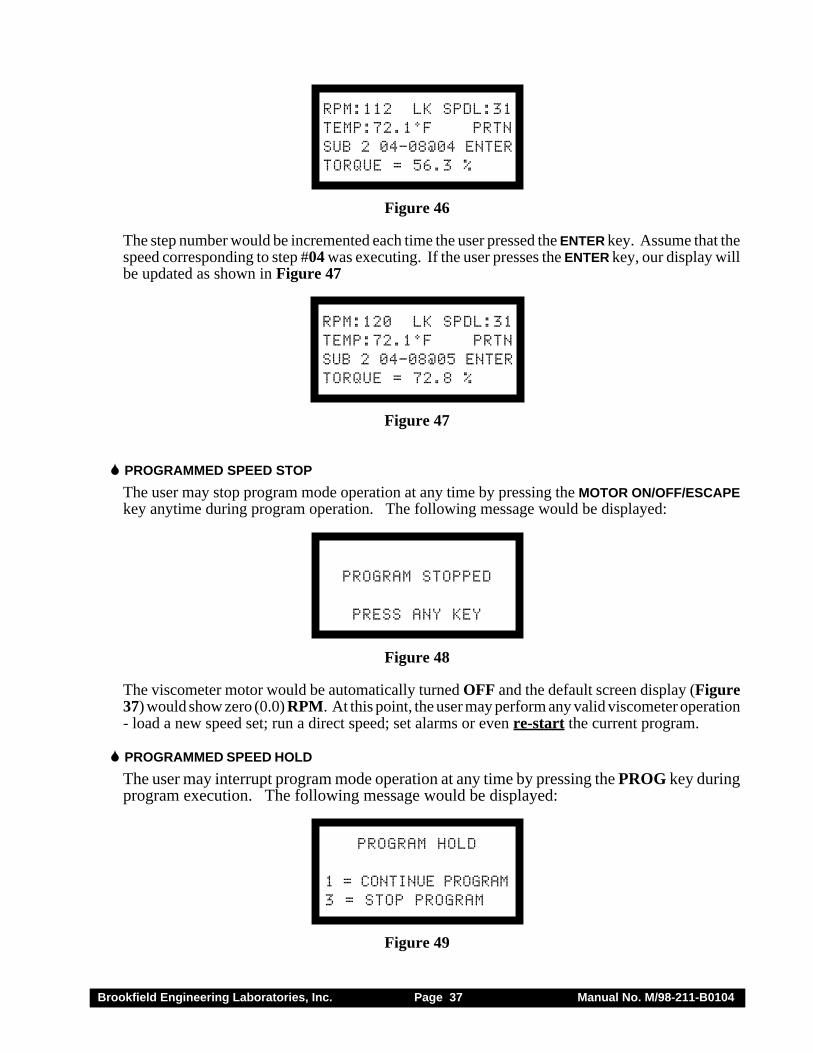
Brookfield Engineering Laboratories, Inc. Page 37 Manual No. M/98-211-B0104
RPM:112 LK SPDL:31TEMP:72.1°F PRTNSUB 2 04-08@04 ENTERTORQUE = 56.3 %
Figure 46
The step number would be incremented each time the user pressed the ENTER key. Assume that thespeed corresponding to step #04 was executing. If the user presses the ENTER key, our display willbe updated as shown in Figure 47
RPM:120 LK SPDL:31TEMP:72.1°F PRTNSUB 2 04-08@05 ENTERTORQUE = 72.8 %
Figure 47
� PROGRAMMED SPEED STOP
The user may stop program mode operation at any time by pressing the MOTOR ON/OFF/ESCAPEkey anytime during program operation. The following message would be displayed:
PROGRAM STOPPED
PRESS ANY KEY
Figure 48
The viscometer motor would be automatically turned OFF and the default screen display (Figure37) would show zero (0.0) RPM. At this point, the user may perform any valid viscometer operation- load a new speed set; run a direct speed; set alarms or even re-start the current program.
� PROGRAMMED SPEED HOLD
The user may interrupt program mode operation at any time by pressing the PROG key duringprogram execution. The following message would be displayed:
PROGRAM HOLD
1 = CONTINUE PROGRAM3 = STOP PROGRAM
Figure 49
Brookfield Engineering Laboratories, Inc. Page 38 Manual No. M/98-211-B0104
The viscometer motor would be automatically turned OFF and the DV-III+ would be awaiting userkey input. If the user presses the “1” key, the DV-III Ultra will continue executing the currentprogram, picking up from whichever RPM (and time, if applicable) it had been interrupted.However, if the user had pressed the “3” key, operation would be identical to that described abovefor Programmed Speed Stop mode.
IV.3 Bevis Programs for Making Viscosity Measurements
The B.E.V.I.S. Programming Method allows the operator to control the DV-III Ultra throughthe variables of speed, temperature and time while providing for independent data collection.Programs can include up to 25 commands with a maximum data count of 800. The DV-III Ultracan store up to 10 programs. Upon completion of the program the data may be viewed on theDV-III Ultra display, analyzed or printed to an attached parallel or serial printer.
B.E.V.I.S. programs are created on a PC using Rheoloader software (supplied with the DV-IIIUltra). The programs are "loaded" onto the DV-III Ultra. Loaded programs cannot be deleted,but can be overwritten.
IV.3.1 Setting Up Bevis Programs
B.E.V.I.S. (Brookfield Engineering Viscometers Instruction Set) is a scripting language developedat Brookfield Engineering Laboratories that allows for the creation of flexible programs to controlour line of Rheometers. In the case of the DV-III Ultra Rheometer, programs are created then loadedinto the Rheometer using the RheoLoader software.
Some features of the scripting language are:• Repeatedly run the same program for quality control purposes.• Wait for a prevailing condition before continuing with the program (i.e. torque value, a
temperature value, a key press, etc.).• Run the Rheometer at any of the speeds in the Custom Speed menu.• Display messages to the screen or an attached printer to aid in operator usability.• An internal clock that keeps time between each printed data line (this time is displayed as the last
parameter on each printed line) providing a consistent time base for the collected data.
Brookfield Engineering Laboratories, Inc. Page 39 Manual No. M/98-211-B0104
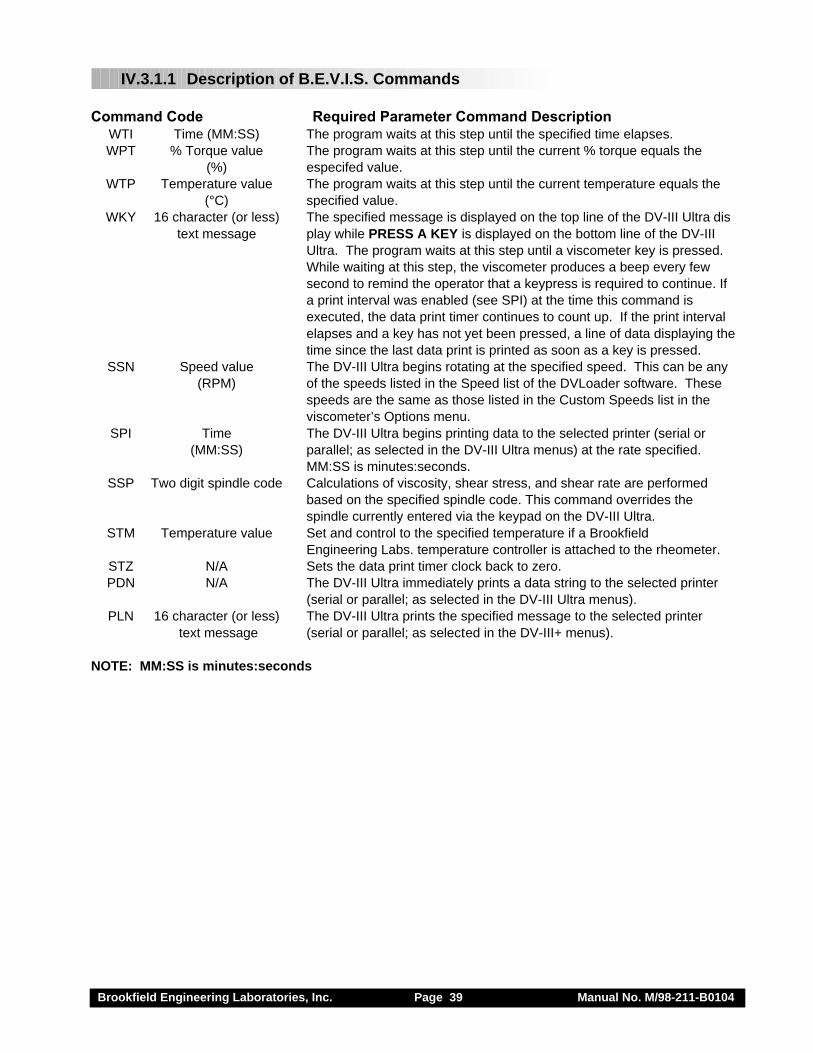
IV.3.1.1 Description of B.E.V.I.S. Commands
Command Code Required Parameter Command Description
WTI Time (MM:SS) The program waits at this step until the specified time elapses.WPT % Torque value The program waits at this step until the current % torque equals the
(%) especifed value.WTP Temperature value The program waits at this step until the current temperature equals the
(°C) specified value.WKY 16 character (or less) The specified message is displayed on the top line of the DV-III Ultra dis
text message play while PRESS A KEY is displayed on the bottom line of the DV-IIIUltra. The program waits at this step until a viscometer key is pressed.While waiting at this step, the viscometer produces a beep every fewsecond to remind the operator that a keypress is required to continue. Ifa print interval was enabled (see SPI) at the time this command isexecuted, the data print timer continues to count up. If the print intervalelapses and a key has not yet been pressed, a line of data displaying thetime since the last data print is printed as soon as a key is pressed.
SSN Speed value The DV-III Ultra begins rotating at the specified speed. This can be any(RPM) of the speeds listed in the Speed list of the DVLoader software. These
speeds are the same as those listed in the Custom Speeds list in theviscometer’s Options menu.
SPI Time The DV-III Ultra begins printing data to the selected printer (serial or(MM:SS) parallel; as selected in the DV-III Ultra menus) at the rate specified.
MM:SS is minutes:seconds.SSP Two digit spindle code Calculations of viscosity, shear stress, and shear rate are performed
based on the specified spindle code. This command overrides thespindle currently entered via the keypad on the DV-III Ultra.
STM Temperature value Set and control to the specified temperature if a BrookfieldEngineering Labs. temperature controller is attached to the rheometer.
STZ N/A Sets the data print timer clock back to zero.PDN N/A The DV-III Ultra immediately prints a data string to the selected printer
(serial or parallel; as selected in the DV-III Ultra menus).PLN 16 character (or less) The DV-III Ultra prints the specified message to the selected printer
text message (serial or parallel; as selected in the DV-III+ menus).
NOTE: MM:SS is minutes:seconds
Brookfield Engineering Laboratories, Inc. Page 40 Manual No. M/98-211-B0104
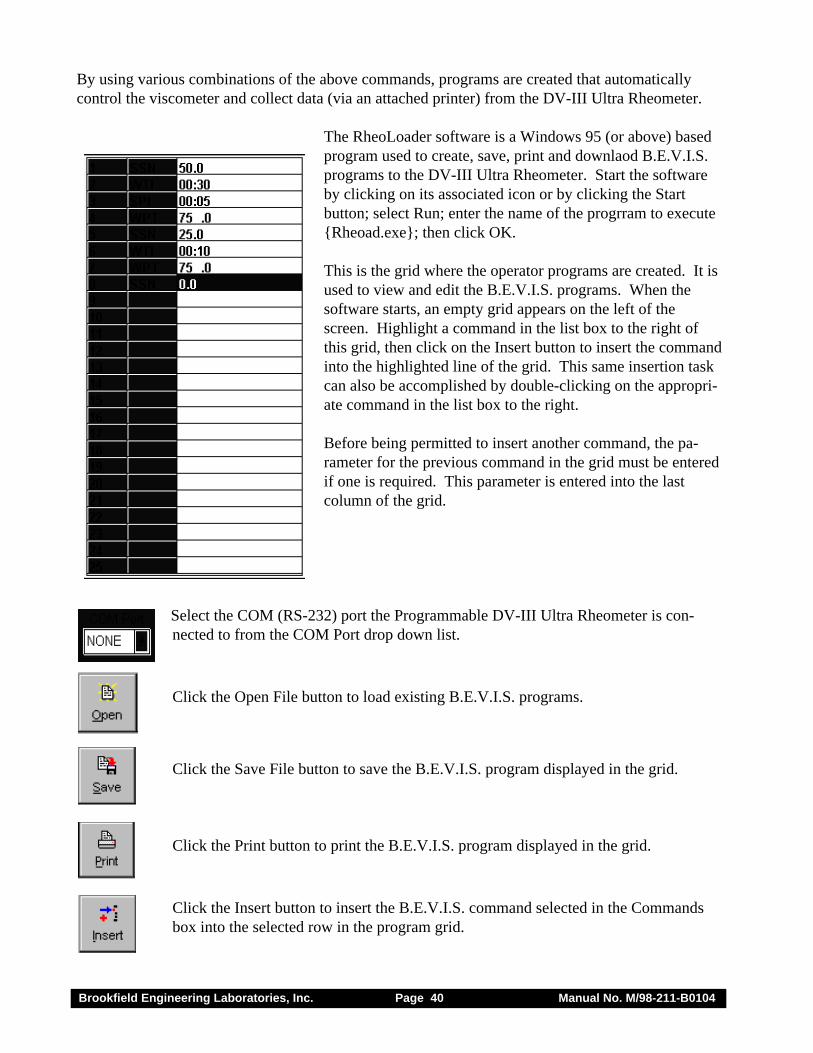
By using various combinations of the above commands, programs are created that automaticallycontrol the viscometer and collect data (via an attached printer) from the DV-III Ultra Rheometer.
The RheoLoader software is a Windows 95 (or above) basedprogram used to create, save, print and downlaod B.E.V.I.S.programs to the DV-III Ultra Rheometer. Start the softwareby clicking on its associated icon or by clicking the Startbutton; select Run; enter the name of the progrram to execute{Rheoad.exe}; then click OK.
This is the grid where the operator programs are created. It isused to view and edit the B.E.V.I.S. programs. When thesoftware starts, an empty grid appears on the left of thescreen. Highlight a command in the list box to the right ofthis grid, then click on the Insert button to insert the commandinto the highlighted line of the grid. This same insertion taskcan also be accomplished by double-clicking on the appropri-ate command in the list box to the right.
Before being permitted to insert another command, the pa-rameter for the previous command in the grid must be enteredif one is required. This parameter is entered into the lastcolumn of the grid.
Select the COM (RS-232) port the Programmable DV-III Ultra Rheometer is con-nected to from the COM Port drop down list.
Click the Open File button to load existing B.E.V.I.S. programs.
Click the Save File button to save the B.E.V.I.S. program displayed in the grid.
Click the Print button to print the B.E.V.I.S. program displayed in the grid.
Click the Insert button to insert the B.E.V.I.S. command selected in the Commandsbox into the selected row in the program grid.

Brookfield Engineering Laboratories, Inc. Page 41 Manual No. M/98-211-B0104
Click the Delete button to delete the command in the selected row of the programgrid.
Click the Up button to move the command in the selected row of the program grid upone row.
Click the Down button to move the command in the selected row of the program griddown one row.
Click the Clear button to clear the grid of all commands. Once cleared, the com-mands cannot be retrieved.
This list box displayed the commands available for creatingprograms. As previously stated, clicking on the Insertbutton inserts the highlighted command (WTI in this case)into the selected line in the program grid. Double-clickingon a line in this list box also inserts the command into thegrid.
The icons to the left of the command descriptions indicatethe type of command:
A command to wait for a condition.
A command to set a program parameter.
A command to send information to an attachedprinter.
Before downloading a program to the Rheometer, ensure the following have been checked:• The appropriate cable (BEL Part No. DVP-80) is connected between the selected COM port
of the PC and the Rheometer.
• The DV-III Ultra is at the download screen: OPTIONS/DOWNLOAD A PROGRAM/LOAD TOSLOT#x where x is slot 1,2,3, or 4.
• With the LOAD TO SLOT #x screen displayed, choose a store slot using the DV-III Ultra arrowkeys, then press the ENTER/AUTORANGE key on the Rheometer. If after five seconds, theRheometer cannot communicate with the RheoLoader program, the B.E.V.I.S. ERROR NOPC ATTACHED message is displayed. If a connection is established, the Download buttonon the PC software becomes enabled, and the DV-III Ultra screen displays DOWNLOAD-
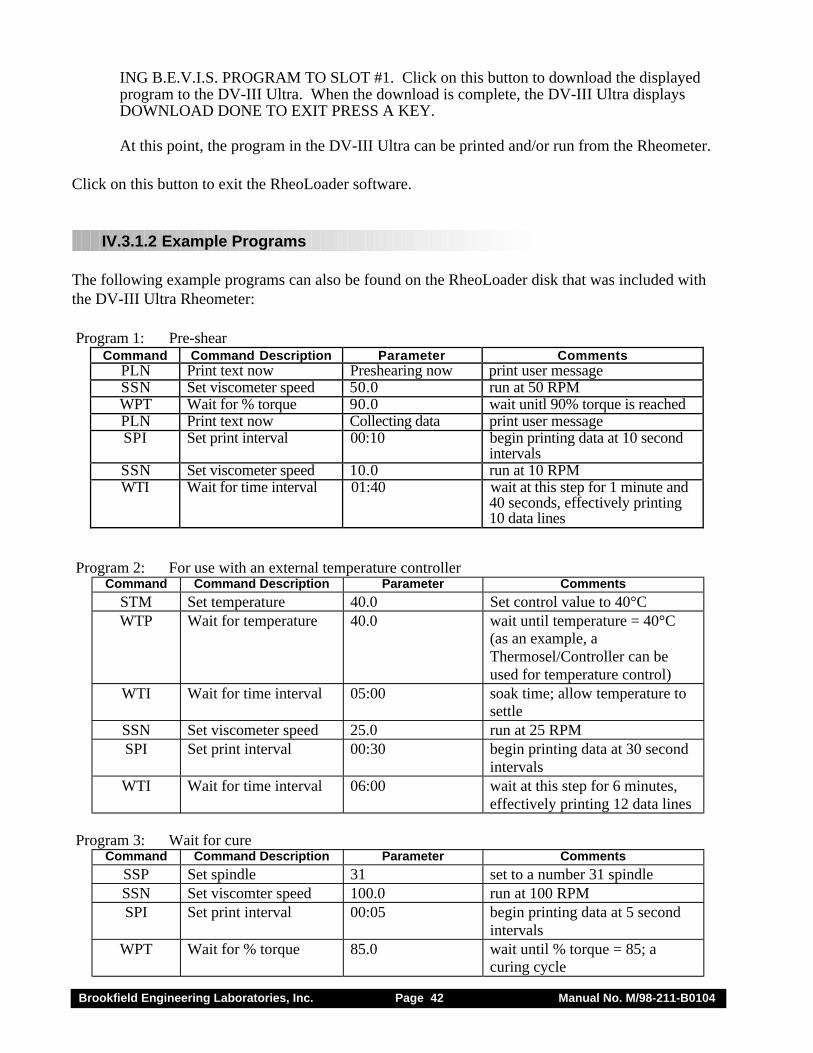
Brookfield Engineering Laboratories, Inc. Page 42 Manual No. M/98-211-B0104
ING B.E.V.I.S. PROGRAM TO SLOT #1. Click on this button to download the displayedprogram to the DV-III Ultra. When the download is complete, the DV-III Ultra displaysDOWNLOAD DONE TO EXIT PRESS A KEY.
At this point, the program in the DV-III Ultra can be printed and/or run from the Rheometer.
Click on this button to exit the RheoLoader software.
IV.3.1.2 Example Programs
The following example programs can also be found on the RheoLoader disk that was included withthe DV-III Ultra Rheometer:
Program 1: Pre-shearCommand Command Description Parameter Comments
PLN Print text now Preshearing now print user messageSSN Set viscometer speed 50.0 run at 50 RPMWPT Wait for % torque 90.0 wait unitl 90% torque is reachedPLN Print text now Collecting data print user messageSPI Set print interval 00:10 begin printing data at 10 second
intervalsSSN Set viscometer speed 10.0 run at 10 RPMWTI Wait for time interval 01:40 wait at this step for 1 minute and
40 seconds, effectively printing10 data lines
Program 2: For use with an external temperature controllerCommand Command Description Parameter Comments
STM Set temperature 40.0 Set control value to 40°CWTP Wait for temperature 40.0 wait until temperature = 40°C
(as an example, aThermosel/Controller can beused for temperature control)
WTI Wait for time interval 05:00 soak time; allow temperature tosettle
SSN Set viscometer speed 25.0 run at 25 RPMSPI Set print interval 00:30 begin printing data at 30 second
intervalsWTI Wait for time interval 06:00 wait at this step for 6 minutes,
effectively printing 12 data lines
Program 3: Wait for cureCommand Command Description Parameter Comments
SSP Set spindle 31 set to a number 31 spindleSSN Set viscomter speed 100.0 run at 100 RPMSPI Set print interval 00:05 begin printing data at 5 second
intervalsWPT Wait for % torque 85.0 wait until % torque = 85; a
curing cycle
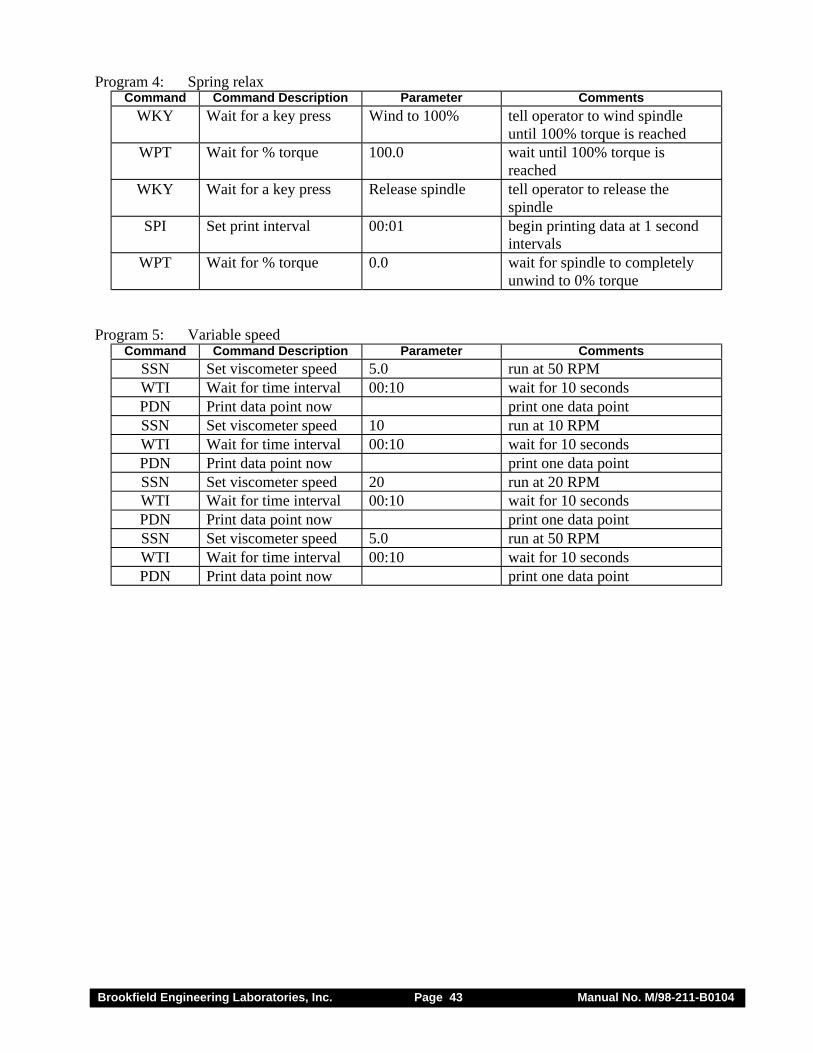
Brookfield Engineering Laboratories, Inc. Page 43 Manual No. M/98-211-B0104
Program 4: Spring relaxCommand Command Description Parameter Comments
WKY Wait for a key press Wind to 100% tell operator to wind spindleuntil 100% torque is reached
WPT Wait for % torque 100.0 wait until 100% torque isreached
WKY Wait for a key press Release spindle tell operator to release thespindle
SPI Set print interval 00:01 begin printing data at 1 secondintervals
WPT Wait for % torque 0.0 wait for spindle to completelyunwind to 0% torque
Program 5: Variable speedCommand Command Description Parameter Comments
SSN Set viscometer speed 5.0 run at 50 RPMWTI Wait for time interval 00:10 wait for 10 secondsPDN Print data point now print one data pointSSN Set viscometer speed 10 run at 10 RPMWTI Wait for time interval 00:10 wait for 10 secondsPDN Print data point now print one data pointSSN Set viscometer speed 20 run at 20 RPMWTI Wait for time interval 00:10 wait for 10 secondsPDN Print data point now print one data pointSSN Set viscometer speed 5.0 run at 50 RPMWTI Wait for time interval 00:10 wait for 10 secondsPDN Print data point now print one data point
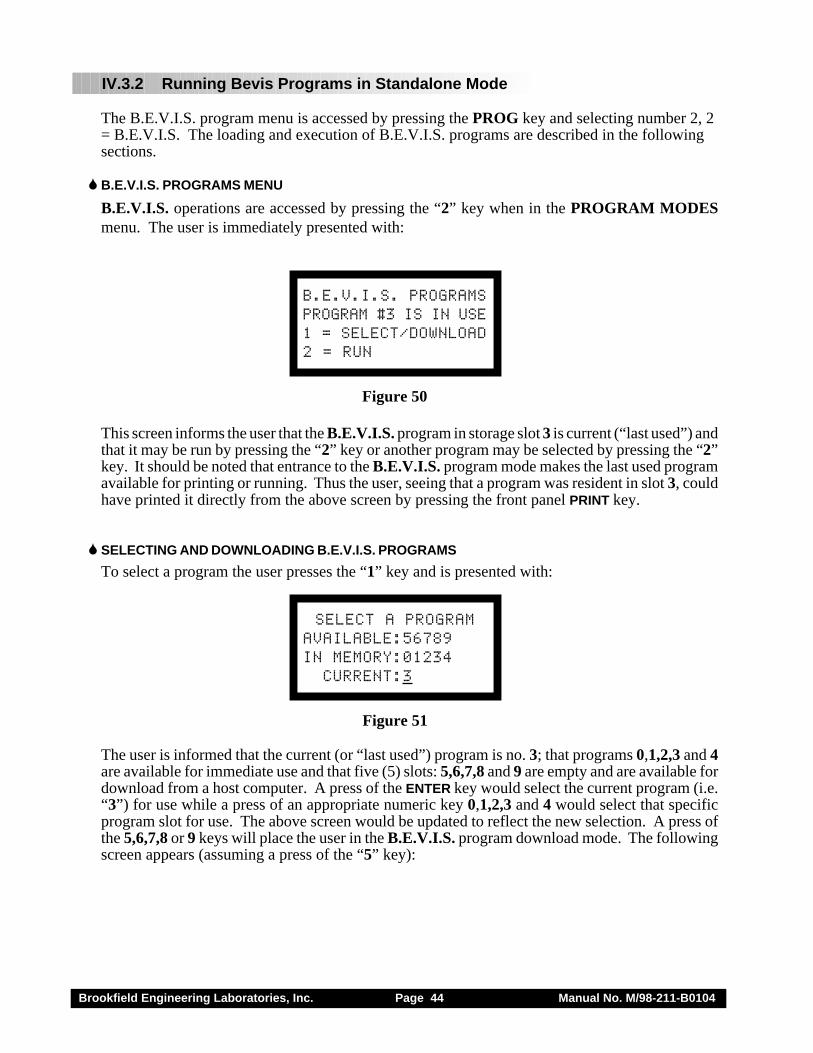
Brookfield Engineering Laboratories, Inc. Page 44 Manual No. M/98-211-B0104
IV.3.2 Running Bevis Programs in Standalone Mode
The B.E.V.I.S. program menu is accessed by pressing the PROG key and selecting number 2, 2= B.E.V.I.S. The loading and execution of B.E.V.I.S. programs are described in the followingsections.
�B.E.V.I.S. PROGRAMS MENU
B.E.V.I.S. operations are accessed by pressing the “2” key when in the PROGRAM MODESmenu. The user is immediately presented with:
B.E.V.I.S. PROGRAMSPROGRAM #3 IS IN USE1 = SELECT/DOWNLOAD2 = RUN
Figure 50
This screen informs the user that the B.E.V.I.S. program in storage slot 3 is current (“last used”) andthat it may be run by pressing the “2” key or another program may be selected by pressing the “2”key. It should be noted that entrance to the B.E.V.I.S. program mode makes the last used programavailable for printing or running. Thus the user, seeing that a program was resident in slot 3, couldhave printed it directly from the above screen by pressing the front panel PRINT key.
� SELECTING AND DOWNLOADING B.E.V.I.S. PROGRAMS
To select a program the user presses the “1” key and is presented with:
SELECT A PROGRAMAVAILABLE:56789IN MEMORY:01234 CURRENT:3
Figure 51
The user is informed that the current (or “last used”) program is no. 3; that programs 0,1,2,3 and 4are available for immediate use and that five (5) slots: 5,6,7,8 and 9 are empty and are available fordownload from a host computer. A press of the ENTER key would select the current program (i.e.“3”) for use while a press of an appropriate numeric key 0,1,2,3 and 4 would select that specificprogram slot for use. The above screen would be updated to reflect the new selection. A press ofthe 5,6,7,8 or 9 keys will place the user in the B.E.V.I.S. program download mode. The followingscreen appears (assuming a press of the “5” key):
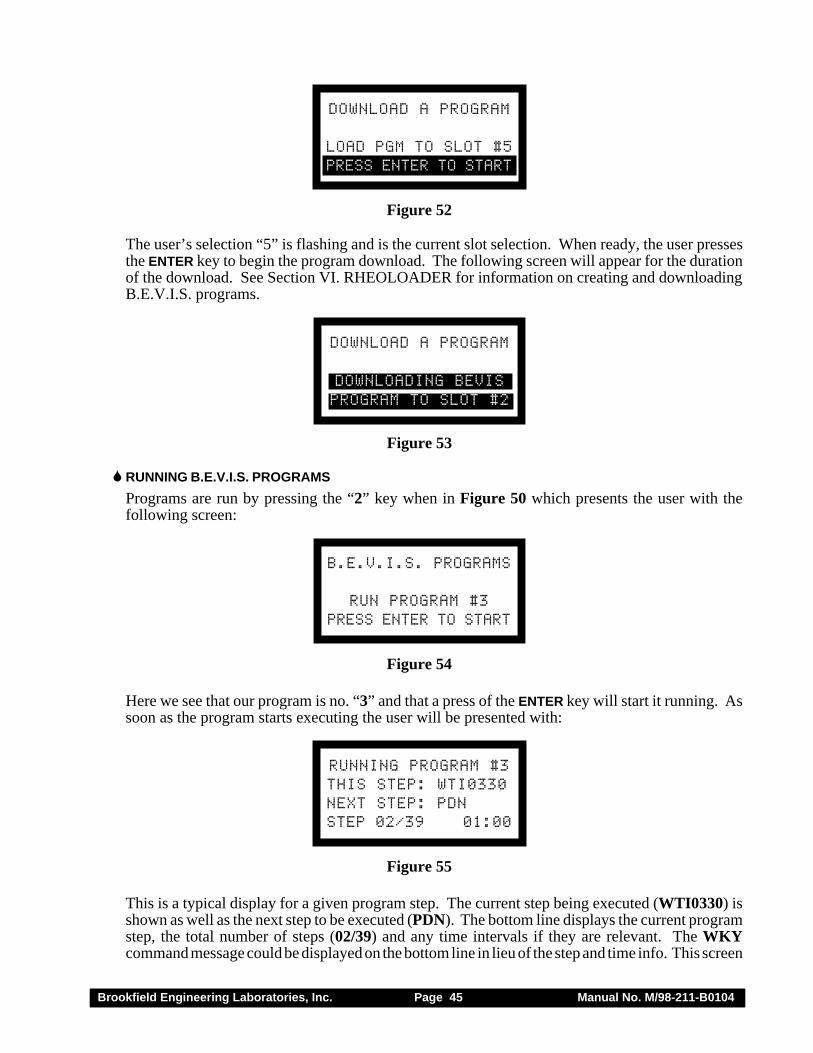
Brookfield Engineering Laboratories, Inc. Page 45 Manual No. M/98-211-B0104
DOWNLOAD A PROGRAM
LOAD PGM TO SLOT #5PRESS ENTER TO START
Figure 52
The user’s selection “5” is flashing and is the current slot selection. When ready, the user pressesthe ENTER key to begin the program download. The following screen will appear for the durationof the download. See Section VI. RHEOLOADER for information on creating and downloadingB.E.V.I.S. programs.
DOWNLOAD A PROGRAM
DOWNLOADING BEVISPROGRAM TO SLOT #2
Figure 53
� RUNNING B.E.V.I.S. PROGRAMS
Programs are run by pressing the “2” key when in Figure 50 which presents the user with thefollowing screen:
B.E.V.I.S. PROGRAMS
RUN PROGRAM #3PRESS ENTER TO START
Figure 54
Here we see that our program is no. “3” and that a press of the ENTER key will start it running. Assoon as the program starts executing the user will be presented with:
RUNNING PROGRAM #3THIS STEP: WTI0330NEXT STEP: PDNSTEP 02/39 01:00
Figure 55
This is a typical display for a given program step. The current step being executed (WTI0330) isshown as well as the next step to be executed (PDN). The bottom line displays the current programstep, the total number of steps (02/39) and any time intervals if they are relevant. The WKYcommand message could be displayed on the bottom line in lieu of the step and time info. This screen
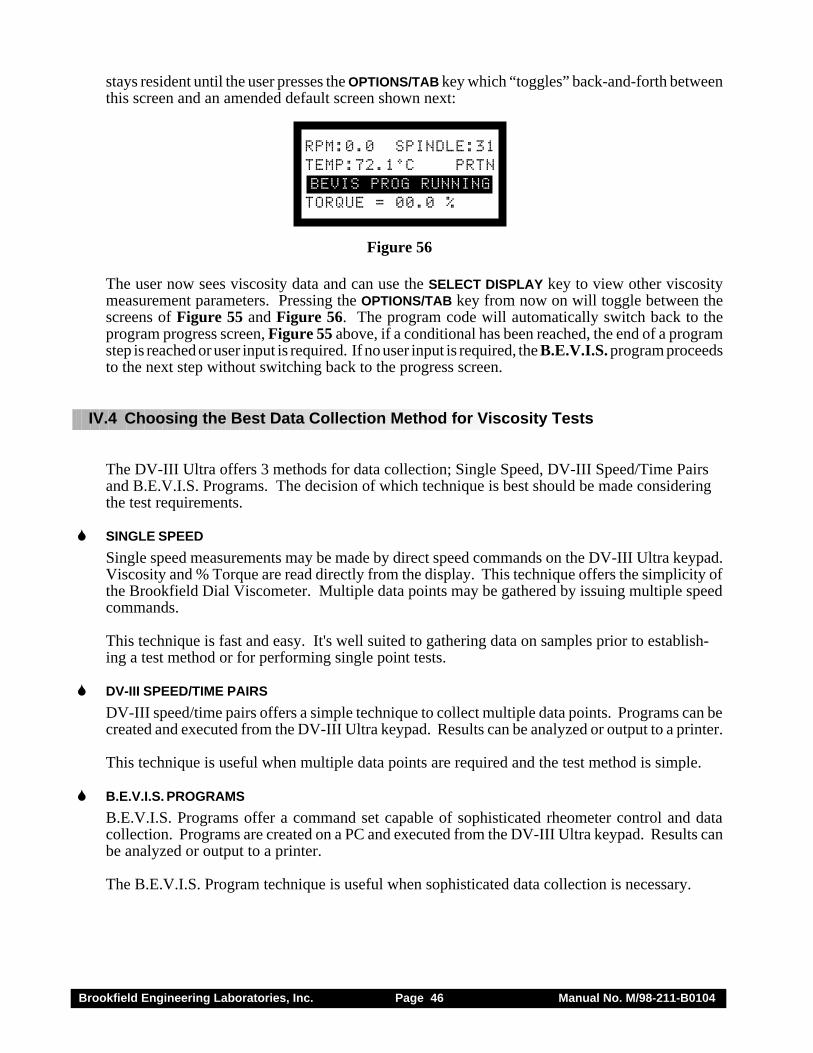
Brookfield Engineering Laboratories, Inc. Page 46 Manual No. M/98-211-B0104
stays resident until the user presses the OPTIONS/TAB key which “toggles” back-and-forth betweenthis screen and an amended default screen shown next:
RPM:0.0 SPINDLE:31TEMP:72.1°C PRTNBEVIS PROG RUNNINGTORQUE = 00.0 %
Figure 56
The user now sees viscosity data and can use the SELECT DISPLAY key to view other viscositymeasurement parameters. Pressing the OPTIONS/TAB key from now on will toggle between thescreens of Figure 55 and Figure 56. The program code will automatically switch back to theprogram progress screen, Figure 55 above, if a conditional has been reached, the end of a programstep is reached or user input is required. If no user input is required, the B.E.V.I.S. program proceedsto the next step without switching back to the progress screen.
IV.4 Choosing the Best Data Collection Method for Viscosity Tests
The DV-III Ultra offers 3 methods for data collection; Single Speed, DV-III Speed/Time Pairsand B.E.V.I.S. Programs. The decision of which technique is best should be made consideringthe test requirements.
� SINGLE SPEED
Single speed measurements may be made by direct speed commands on the DV-III Ultra keypad.Viscosity and % Torque are read directly from the display. This technique offers the simplicity ofthe Brookfield Dial Viscometer. Multiple data points may be gathered by issuing multiple speedcommands.
This technique is fast and easy. It's well suited to gathering data on samples prior to establish-ing a test method or for performing single point tests.
� DV-III SPEED/TIME PAIRS
DV-III speed/time pairs offers a simple technique to collect multiple data points. Programs can becreated and executed from the DV-III Ultra keypad. Results can be analyzed or output to a printer.
This technique is useful when multiple data points are required and the test method is simple.
� B.E.V.I.S. PROGRAMS
B.E.V.I.S. Programs offer a command set capable of sophisticated rheometer control and datacollection. Programs are created on a PC and executed from the DV-III Ultra keypad. Results canbe analyzed or output to a printer.
The B.E.V.I.S. Program technique is useful when sophisticated data collection is necessary.
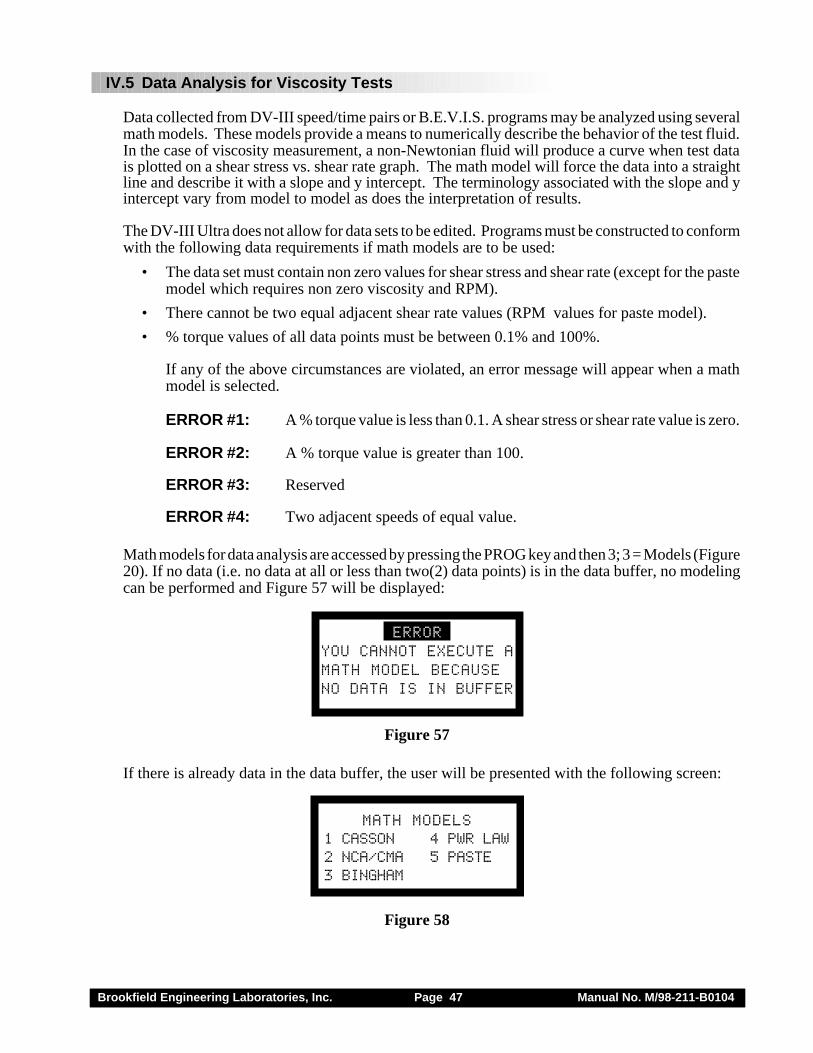
Brookfield Engineering Laboratories, Inc. Page 47 Manual No. M/98-211-B0104
IV.5 Data Analysis for Viscosity Tests
Data collected from DV-III speed/time pairs or B.E.V.I.S. programs may be analyzed using severalmath models. These models provide a means to numerically describe the behavior of the test fluid.In the case of viscosity measurement, a non-Newtonian fluid will produce a curve when test datais plotted on a shear stress vs. shear rate graph. The math model will force the data into a straightline and describe it with a slope and y intercept. The terminology associated with the slope and yintercept vary from model to model as does the interpretation of results.
The DV-III Ultra does not allow for data sets to be edited. Programs must be constructed to conformwith the following data requirements if math models are to be used:
• The data set must contain non zero values for shear stress and shear rate (except for the pastemodel which requires non zero viscosity and RPM).
• There cannot be two equal adjacent shear rate values (RPM values for paste model).
• % torque values of all data points must be between 0.1% and 100%.
If any of the above circumstances are violated, an error message will appear when a mathmodel is selected.
ERROR #1: A % torque value is less than 0.1. A shear stress or shear rate value is zero.
ERROR #2: A % torque value is greater than 100.
ERROR #3: Reserved
ERROR #4: Two adjacent speeds of equal value.
Math models for data analysis are accessed by pressing the PROG key and then 3; 3 = Models (Figure20). If no data (i.e. no data at all or less than two(2) data points) is in the data buffer, no modelingcan be performed and Figure 57 will be displayed:
ERRORYOU CANNOT EXECUTE AMATH MODEL BECAUSENO DATA IS IN BUFFER
Figure 57
If there is already data in the data buffer, the user will be presented with the following screen:
MATH MODELS1 CASSON 4 PWR LAW2 NCA/CMA 5 PASTE3 BINGHAM
Figure 58
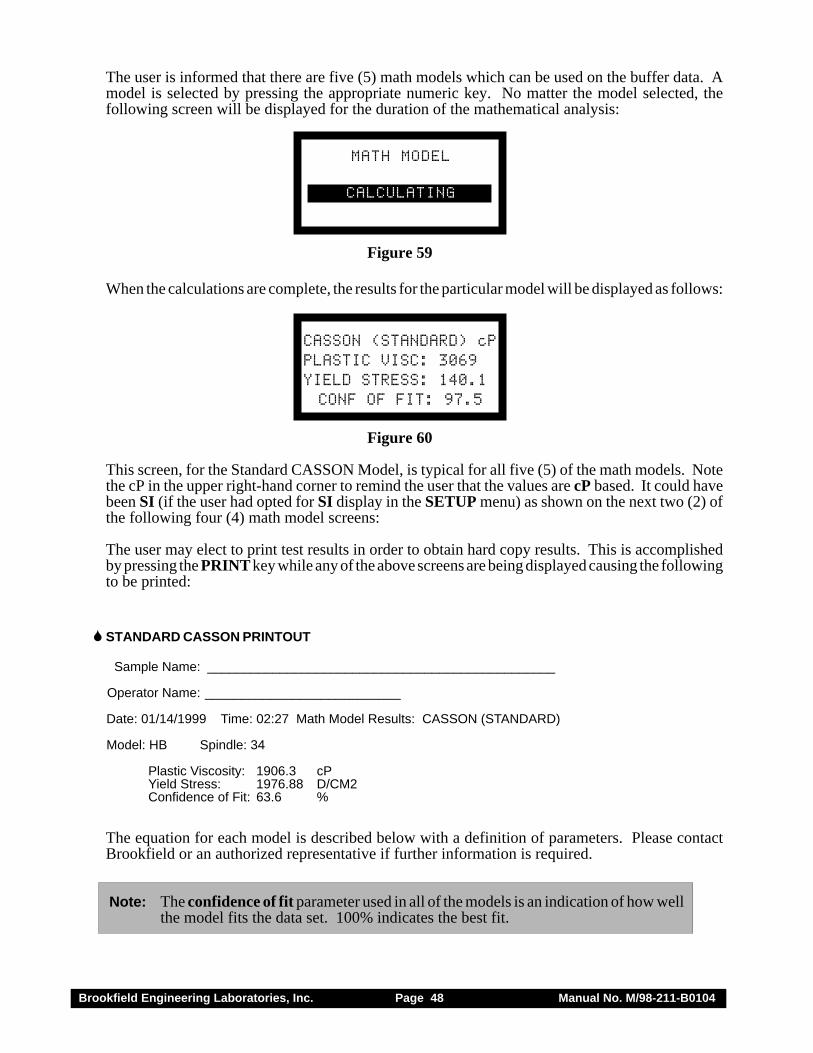
Brookfield Engineering Laboratories, Inc. Page 48 Manual No. M/98-211-B0104
The user is informed that there are five (5) math models which can be used on the buffer data. Amodel is selected by pressing the appropriate numeric key. No matter the model selected, thefollowing screen will be displayed for the duration of the mathematical analysis:
MATH MODEL
CALCULATING
Figure 59
When the calculations are complete, the results for the particular model will be displayed as follows:
CASSON (STANDARD) cPPLASTIC VISC: 3069YIELD STRESS: 140.1CONF OF FIT: 97.5
Figure 60
This screen, for the Standard CASSON Model, is typical for all five (5) of the math models. Notethe cP in the upper right-hand corner to remind the user that the values are cP based. It could havebeen SI (if the user had opted for SI display in the SETUP menu) as shown on the next two (2) ofthe following four (4) math model screens:
The user may elect to print test results in order to obtain hard copy results. This is accomplishedby pressing the PRINT key while any of the above screens are being displayed causing the followingto be printed:
� STANDARD CASSON PRINTOUT
Sample Name: ________________________________________________
Operator Name: ___________________________
Date: 01/14/1999 Time: 02:27 Math Model Results: CASSON (STANDARD)
Model: HB Spindle: 34
Plastic Viscosity: 1906.3 cPYield Stress: 1976.88 D/CM2Confidence of Fit: 63.6 %
The equation for each model is described below with a definition of parameters. Please contactBrookfield or an authorized representative if further information is required.
Note: The confidence of fit parameter used in all of the models is an indication of how wellthe model fits the data set. 100% indicates the best fit.

Brookfield Engineering Laboratories, Inc. Page 49 Manual No. M/98-211-B0104
1. Casson (Standard)
The Standard Casson equation is: √τ = √τo + √ηD where:τo = Shear Stressτo = Yield Stress (stress at zero shear rate)ηD= Plastic ViscosityD = Shear Rate
The calculated parameters for this model are:Plastic Viscosity (cP or mPa•s)Yield Stress (Dynes/cm2 or N/m2)Confidence of Fit (%)
The Standard Casson method is a direct implementation of the original Casson equation.
2. NCA/CMA Casson (Chocolate)
This Casson method is derived from the standard set forth by the National ConfectionersAssociation (NCA) and the Chocolate Manufacturers Assocation (CMA). Although based on theoriginal Casson equation, this implementation has been tailored by the NCA and CMAspecifically to applications involving chocolate.
The Chocolate Casson equation is: (1+a)√τ = 2√τo + (1+a) √ηD where:
τo = Shear Stressτo = Yield Stress (stress at zero shear rate)ηD= Plastic ViscosityD = Shear Ratea = spindle (or bob) radius/ inner cup radius
The calculated parameters for this model are:Plastic Viscosity (cP or mPa•s)Yield Stress (Dynes/cm2 or N/m2)Confidence of Fit (%)
3. Bingham Plastic
The Bingham equation is: τ = τo + ηD where:τo = Shear Stressτo = Yield Stress (stress at zero shear rate)ηD= Plastic ViscosityD = Shear Rate
The calculated parameters for this model are:Plastic Viscosity (cP or mPa•s)Yield Stress (Dynes/cm2 or N/m2)Confidence of Fit (%)
4. Power Law
The Power Law equation is τ = kDn where:
τo = Shear StressD = Yield Stress (stress at zero shear rate)kR = Plastic Viscosityn = Shear Rate
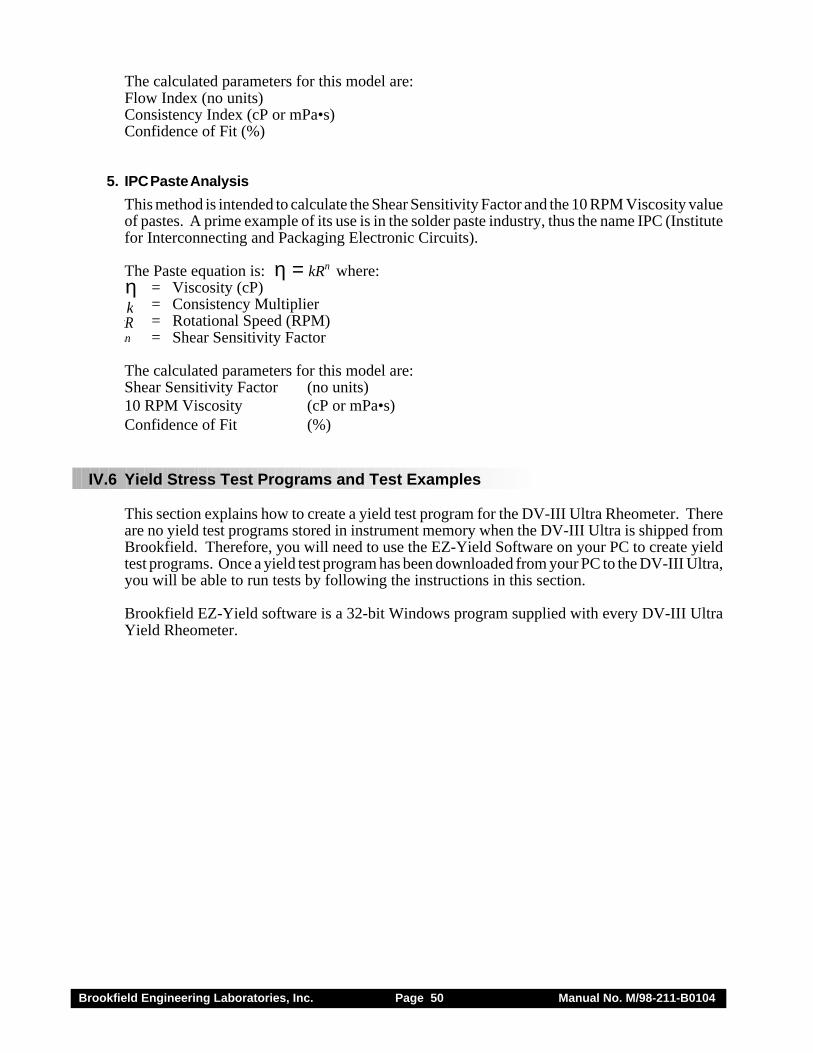
Brookfield Engineering Laboratories, Inc. Page 50 Manual No. M/98-211-B0104
The calculated parameters for this model are:Flow Index (no units)Consistency Index (cP or mPa•s)Confidence of Fit (%)
5. IPC Paste Analysis
This method is intended to calculate the Shear Sensitivity Factor and the 10 RPM Viscosity valueof pastes. A prime example of its use is in the solder paste industry, thus the name IPC (Institutefor Interconnecting and Packaging Electronic Circuits).
The Paste equation is: η = kRn where:η = Viscosity (cP)kR = Consistency Multiplier
kR = Rotational Speed (RPM)
Rn = Shear Sensitivity Factor
The calculated parameters for this model are:Shear Sensitivity Factor (no units)10 RPM Viscosity (cP or mPa•s)Confidence of Fit (%)
IV.6 Yield Stress Test Programs and Test Examples
This section explains how to create a yield test program for the DV-III Ultra Rheometer. Thereare no yield test programs stored in instrument memory when the DV-III Ultra is shipped fromBrookfield. Therefore, you will need to use the EZ-Yield Software on your PC to create yieldtest programs. Once a yield test program has been downloaded from your PC to the DV-III Ultra,you will be able to run tests by following the instructions in this section.
Brookfield EZ-Yield software is a 32-bit Windows program supplied with every DV-III UltraYield Rheometer.
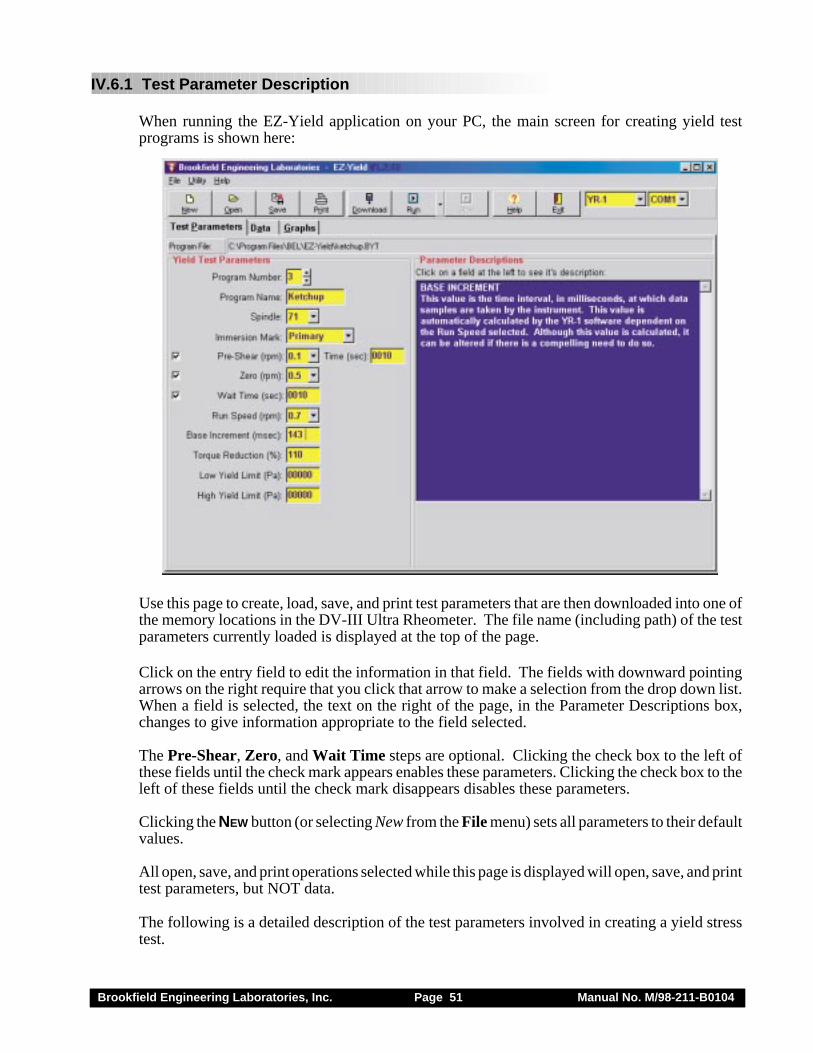
Brookfield Engineering Laboratories, Inc. Page 51 Manual No. M/98-211-B0104
IV.6.1 Test Parameter Description
When running the EZ-Yield application on your PC, the main screen for creating yield testprograms is shown here:
Use this page to create, load, save, and print test parameters that are then downloaded into one ofthe memory locations in the DV-III Ultra Rheometer. The file name (including path) of the testparameters currently loaded is displayed at the top of the page.
Click on the entry field to edit the information in that field. The fields with downward pointingarrows on the right require that you click that arrow to make a selection from the drop down list.When a field is selected, the text on the right of the page, in the Parameter Descriptions box,changes to give information appropriate to the field selected.
The Pre-Shear, Zero, and Wait Time steps are optional. Clicking the check box to the left ofthese fields until the check mark appears enables these parameters. Clicking the check box to theleft of these fields until the check mark disappears disables these parameters.
Clicking the NEW button (or selecting New from the File menu) sets all parameters to their defaultvalues.
All open, save, and print operations selected while this page is displayed will open, save, and printtest parameters, but NOT data.
The following is a detailed description of the test parameters involved in creating a yield stresstest.
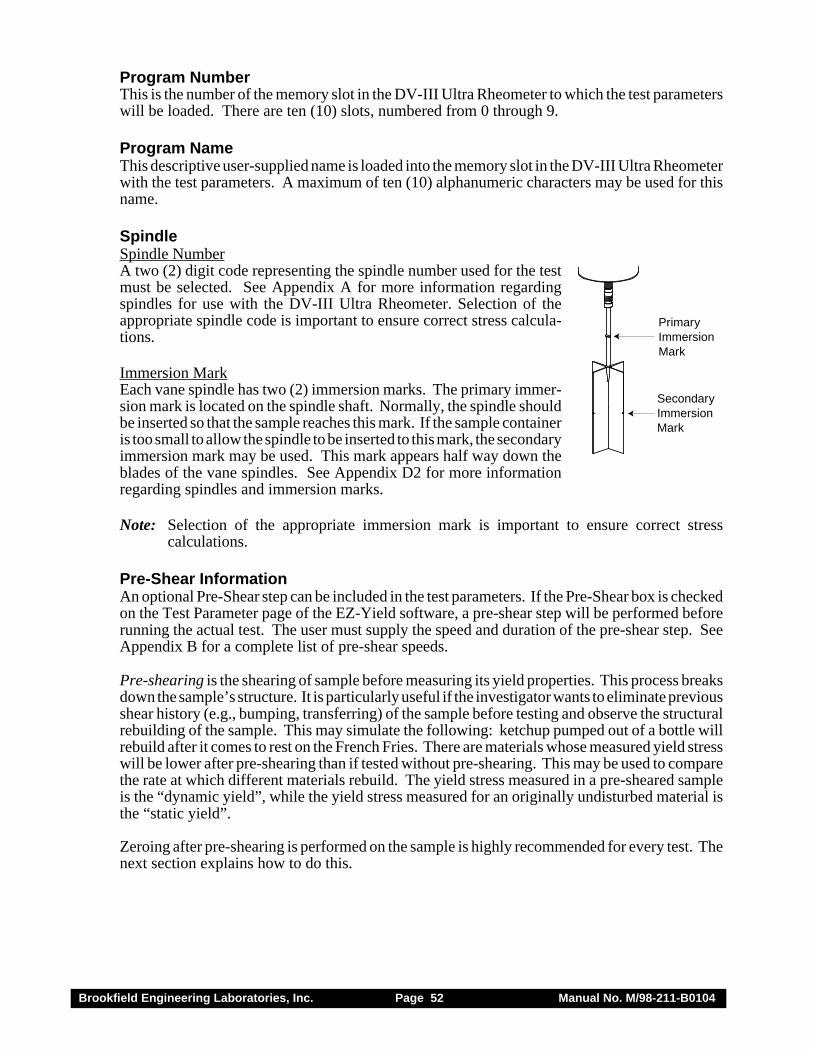
Brookfield Engineering Laboratories, Inc. Page 52 Manual No. M/98-211-B0104
Program NumberThis is the number of the memory slot in the DV-III Ultra Rheometer to which the test parameterswill be loaded. There are ten (10) slots, numbered from 0 through 9.
Program NameThis descriptive user-supplied name is loaded into the memory slot in the DV-III Ultra Rheometerwith the test parameters. A maximum of ten (10) alphanumeric characters may be used for thisname.
SpindleSpindle NumberA two (2) digit code representing the spindle number used for the testmust be selected. See Appendix A for more information regardingspindles for use with the DV-III Ultra Rheometer. Selection of theappropriate spindle code is important to ensure correct stress calcula-tions.
Immersion MarkEach vane spindle has two (2) immersion marks. The primary immer-sion mark is located on the spindle shaft. Normally, the spindle shouldbe inserted so that the sample reaches this mark. If the sample containeris too small to allow the spindle to be inserted to this mark, the secondaryimmersion mark may be used. This mark appears half way down theblades of the vane spindles. See Appendix D2 for more informationregarding spindles and immersion marks.
Note: Selection of the appropriate immersion mark is important to ensure correct stresscalculations.
Pre-Shear InformationAn optional Pre-Shear step can be included in the test parameters. If the Pre-Shear box is checkedon the Test Parameter page of the EZ-Yield software, a pre-shear step will be performed beforerunning the actual test. The user must supply the speed and duration of the pre-shear step. SeeAppendix B for a complete list of pre-shear speeds.
Pre-shearing is the shearing of sample before measuring its yield properties. This process breaksdown the sample’s structure. It is particularly useful if the investigator wants to eliminate previousshear history (e.g., bumping, transferring) of the sample before testing and observe the structuralrebuilding of the sample. This may simulate the following: ketchup pumped out of a bottle willrebuild after it comes to rest on the French Fries. There are materials whose measured yield stresswill be lower after pre-shearing than if tested without pre-shearing. This may be used to comparethe rate at which different materials rebuild. The yield stress measured in a pre-sheared sampleis the “dynamic yield”, while the yield stress measured for an originally undisturbed material isthe “static yield”.
Zeroing after pre-shearing is performed on the sample is highly recommended for every test. Thenext section explains how to do this.
PrimaryImmersion Mark
SecondaryImmersion Mark
Brookfield Engineering Laboratories, Inc. Page 53 Manual No. M/98-211-B0104
ZeroAn optional, but highly recommended, torque Zero step can be included in the test parameters.If the Zero box is checked on the Test Parameter page of the EZ-Yield software, the rheometerwill rotate the motor in the appropriate direction until 0% torque is achieved.
This may be necessary because the spindle sometimes twists a small amount during insertion intothe sample. This results in a small, although possibly significant, torque applied to the sample.Slow zeroing speeds are used to eliminate this initial torque and minimize effects on the sample’sstructure before the test is started.
Zeroing is an essential step after preshearing.
This gives a consistent starting point for each test. A speed for the step must be supplied in theappropriate box. Faster speeds achieve a “zero” quicker but may cause a more variable startingpoint. See Appendix D2 for a complete list of zero step speeds.
Wait TimeAn optional Wait step can be included in the test parameters. If the Wait Time box is checked onthe Test Parameters page of the EZ-Yield software, there will be a time delay after zeroing beforethe actual test run begins. During this delay, the motor shaft will be at zero (0) RPM.
Wait Time is the time the sample is allowed to rest between the completion of zeroing and the startof the yield measurement. Some samples rebuild structure more slowly than others after shearing,such as during handling, pouring sample into a beaker, etc. Certain low-viscosity paints may alsohave a low yield stress. Waiting 30 seconds, for example, after immersing the spindle may allowthe sample to rebuild, producing a more consistent test method.
Run SpeedRun Speed is the motor speed for the DV-III Ultra at which the material is tested. It is commonfor materials to appear stiffer when tested at higher speeds. That is, the slope of the stress-vs.-strain curve increases with increasing speed. This is because the material structure has less timein which to react to dissipate the applied stress. Increasing the speed will, in most cases, increasethe yield stress measured by the instrument. Most yield tests are conducted at relatively lowspeeds (<1 rpm) to minimize any inertial effects when using vane spindles. See Appendix D2 fora complete list of run speeds.
Base IncrementBase Increment is the amount of time in milliseconds between data points used for taking torque(stress) readings. The software automatically calculates base increment values. Smaller baseincrement values are used during faster speed tests to ensure that data are taken fast enough toproperly determine the yield point. Larger base increment values are used during slower speedtests because these tests are expected to take longer and the longer time between data points helpsprevent typical data files from becoming very large. However, the user may still wish to set thisvalue to suit the required need after some familiarity is gained with the material being tested.
The % torque data are used to determine when a yield point is reached. The rigid line incrementaltorque value is automatically calculated by the EZ-Yield software and depends on the Run Speedselected. Although this value is calculated, it can be altered if there is a compelling need to doso. If the Base Increment has been manually altered for any reason, selecting a new Run Speedautomatically resets the Base Increment to its optimum value.
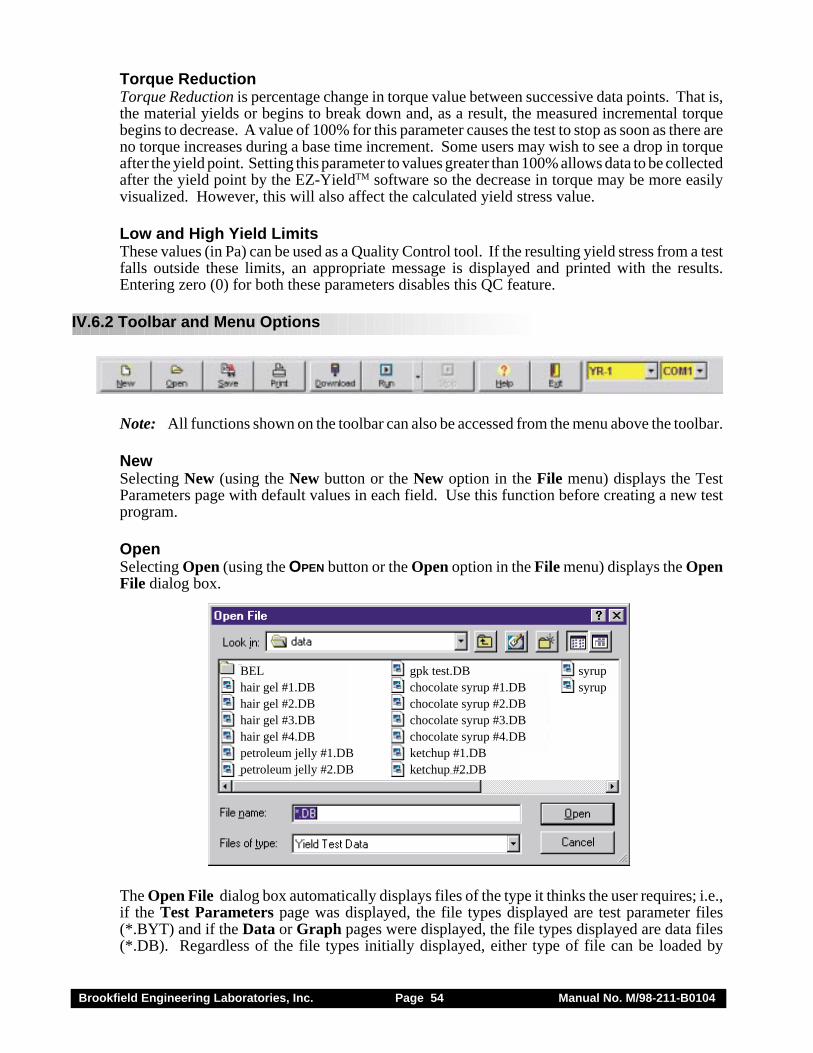
Brookfield Engineering Laboratories, Inc. Page 54 Manual No. M/98-211-B0104
Torque ReductionTorque Reduction is percentage change in torque value between successive data points. That is,the material yields or begins to break down and, as a result, the measured incremental torquebegins to decrease. A value of 100% for this parameter causes the test to stop as soon as there areno torque increases during a base time increment. Some users may wish to see a drop in torqueafter the yield point. Setting this parameter to values greater than 100% allows data to be collectedafter the yield point by the EZ-YieldTM software so the decrease in torque may be more easilyvisualized. However, this will also affect the calculated yield stress value.
Low and High Yield LimitsThese values (in Pa) can be used as a Quality Control tool. If the resulting yield stress from a testfalls outside these limits, an appropriate message is displayed and printed with the results.Entering zero (0) for both these parameters disables this QC feature.
IV.6.2 Toolbar and Menu Options
Note: All functions shown on the toolbar can also be accessed from the menu above the toolbar.
NewSelecting New (using the New button or the New option in the File menu) displays the TestParameters page with default values in each field. Use this function before creating a new testprogram.
OpenSelecting Open (using the OPEN button or the Open option in the File menu) displays the OpenFile dialog box.
BEL gpk test.DB syrup hair gel #1.DB chocolate syrup #1.DB syruphair gel #2.DB chocolate syrup #2.DBhair gel #3.DB chocolate syrup #3.DBhair gel #4.DB chocolate syrup #4.DBpetroleum jelly #1.DB ketchup #1.DBpetroleum jelly #2.DB ketchup #2.DB
The Open File dialog box automatically displays files of the type it thinks the user requires; i.e.,if the Test Parameters page was displayed, the file types displayed are test parameter files(*.BYT) and if the Data or Graph pages were displayed, the file types displayed are data files(*.DB). Regardless of the file types initially displayed, either type of file can be loaded by
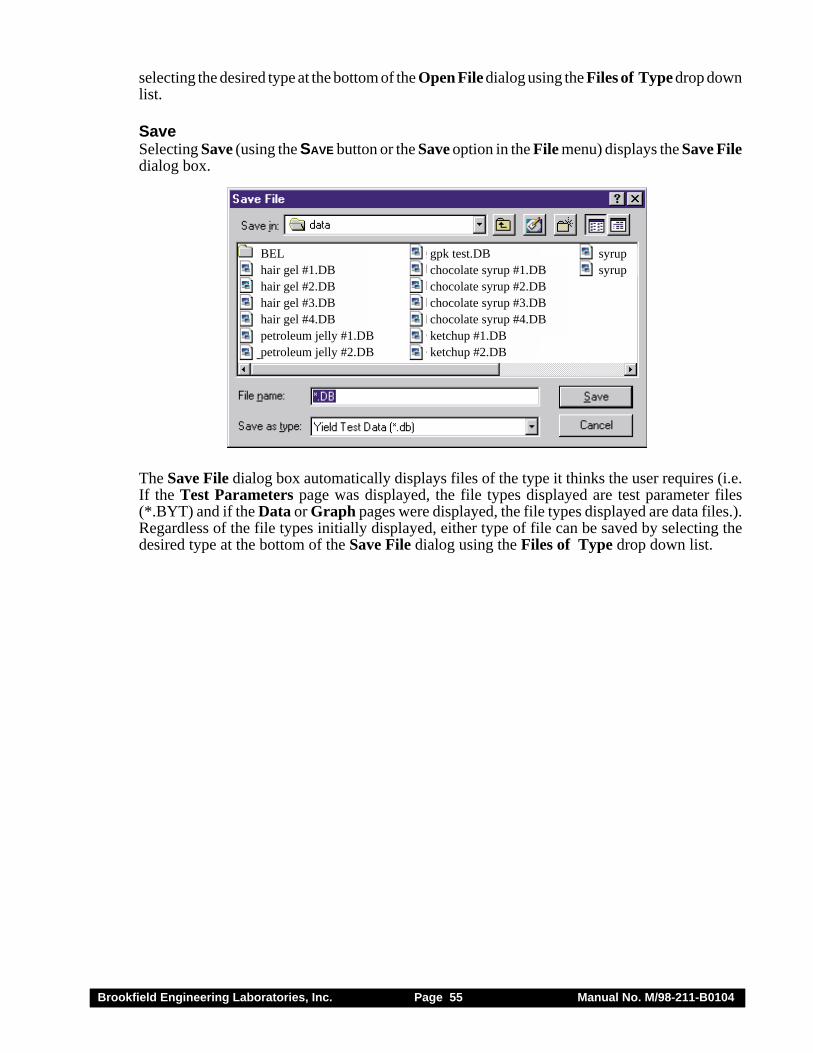
Brookfield Engineering Laboratories, Inc. Page 55 Manual No. M/98-211-B0104
selecting the desired type at the bottom of the Open File dialog using the Files of Type drop downlist.
SaveSelecting Save (using the SAVE button or the Save option in the File menu) displays the Save Filedialog box.
BEL gpk test.DB syrup hair gel #1.DB chocolate syrup #1.DB syruphair gel #2.DB chocolate syrup #2.DBhair gel #3.DB chocolate syrup #3.DBhair gel #4.DB chocolate syrup #4.DBpetroleum jelly #1.DB ketchup #1.DBpetroleum jelly #2.DB ketchup #2.DB
The Save File dialog box automatically displays files of the type it thinks the user requires (i.e.If the Test Parameters page was displayed, the file types displayed are test parameter files(*.BYT) and if the Data or Graph pages were displayed, the file types displayed are data files.).Regardless of the file types initially displayed, either type of file can be saved by selecting thedesired type at the bottom of the Save File dialog using the Files of Type drop down list.
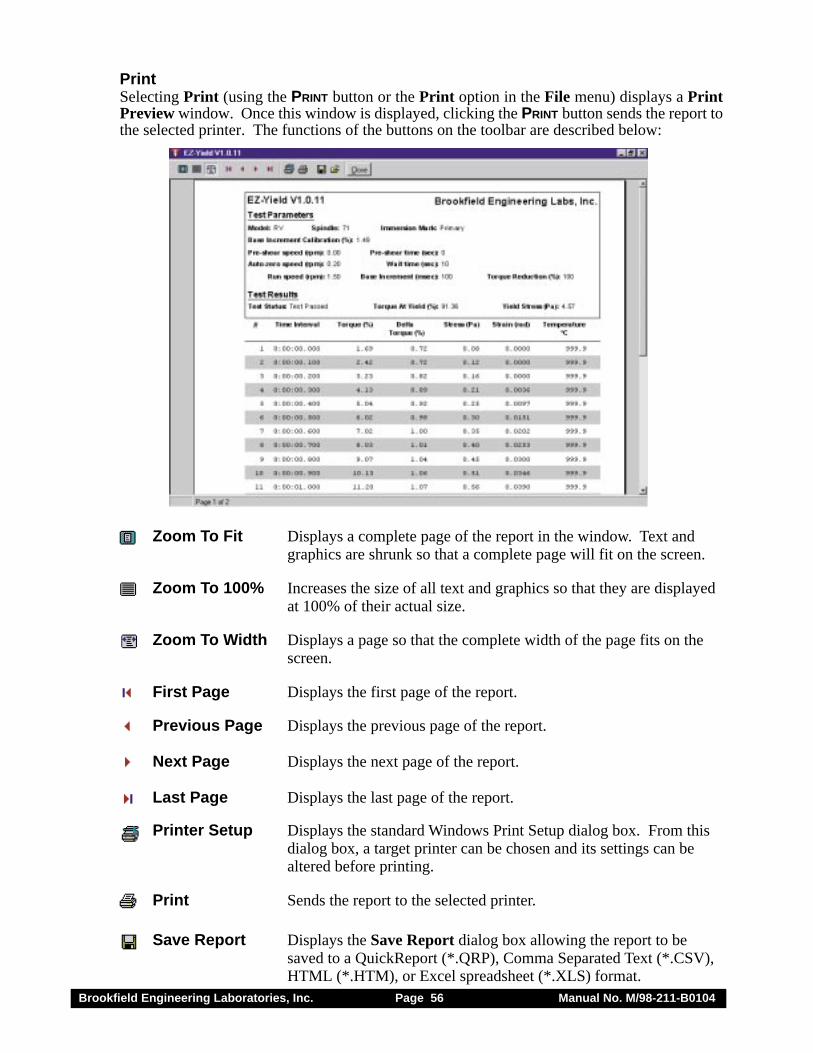
Brookfield Engineering Laboratories, Inc. Page 56 Manual No. M/98-211-B0104
PrintSelecting Print (using the PRINT button or the Print option in the File menu) displays a PrintPreview window. Once this window is displayed, clicking the PRINT button sends the report tothe selected printer. The functions of the buttons on the toolbar are described below:
Zoom To Fit Displays a complete page of the report in the window. Text andgraphics are shrunk so that a complete page will fit on the screen.
Zoom To 100% Increases the size of all text and graphics so that they are displayedat 100% of their actual size.
Zoom To Width Displays a page so that the complete width of the page fits on thescreen.
First Page Displays the first page of the report.
Previous Page Displays the previous page of the report.
Next Page Displays the next page of the report.
Last Page Displays the last page of the report.
Printer Setup Displays the standard Windows Print Setup dialog box. From thisdialog box, a target printer can be chosen and its settings can bealtered before printing.
Print Sends the report to the selected printer.
Save Report Displays the Save Report dialog box allowing the report to besaved to a QuickReport (*.QRP), Comma Separated Text (*.CSV),HTML (*.HTM), or Excel spreadsheet (*.XLS) format.
Brookfield Engineering Laboratories, Inc. Page 57 Manual No. M/98-211-B0104
Load Report Previously saved reports can be loaded into the Print Report Pre-view window. Only reports saved to the QuickReport (*.QRP)format can be reloaded.
DownloadSelecting Download (using the Download button or the Download Program option in theUtility menu) sends the parameters displayed on the Test Parameters page to the specified memorylocation in the DV-III Ultra Rheometer. After a few seconds, a dialog box appears indicating thatthe rheometer received the parameters.
If no dialog box appears, see Appendix I - Troubleshooting - to help determine why theparameters were not received by the rheometer.
RunSelecting Run and a program number (using the Run button or the Run Program option in theUtility menu) directs the DV-III Ultra Rheometer to run the selected program.
Note: The program numbers refer to the memory locations in the DV-III Ultra Rheometer.
After a few seconds, the DV-III Ultra tells EZ-Yield that the test has begun. Once all optionalpreparation steps have been performed by the rheometer, EZ-Yield begins to receive data as thetest runs. If the On-Line Plotting option is selected in EZ-Yield, the Graph page is automaticallydisplayed as soon as the first data point is received. Data are plotted as received, while beingdisplayed in the Data/Results section of the Data page.
If the rheometer is running the test and no data appears, see Appendix I - Troubleshooting - tohelp determine why EZ-Yield is not receiving the data. When the test is complete, a dialog boxis displayed asking you to save the freshly collected data and results.
HelpSelecting Help (using the Help button or the Help option on the menu) displays the on-line helpsystem.
ExitSelecting Exit (using the Exit button or the Exit option on the File menu) exits the EZ-Yieldsoftware. If test parameters or data have not yet been saved, a dialog box appears informing youof this fact and giving you the opportunity to save the pertinent information.
COM PortSelect the COM Port on the host PC (sometimes referred to as a serial port or an RS-232 port) towhich the DV-III Ultra Rheometer is attached. COM1 through COM4 may be selected. SelectingNONE disconnects the rheometer from the host PC.
Note: Simply selecting the COM port is only part of what is needed for a valid connectionbetween the rheometer and the host PC. Ensure that the appropriate cable is in use(Brookfield part # DVP-80) and that it is connected properly. See Appendix H -Communications - for more information regarding the DV-III Ultra to host PCconnection.
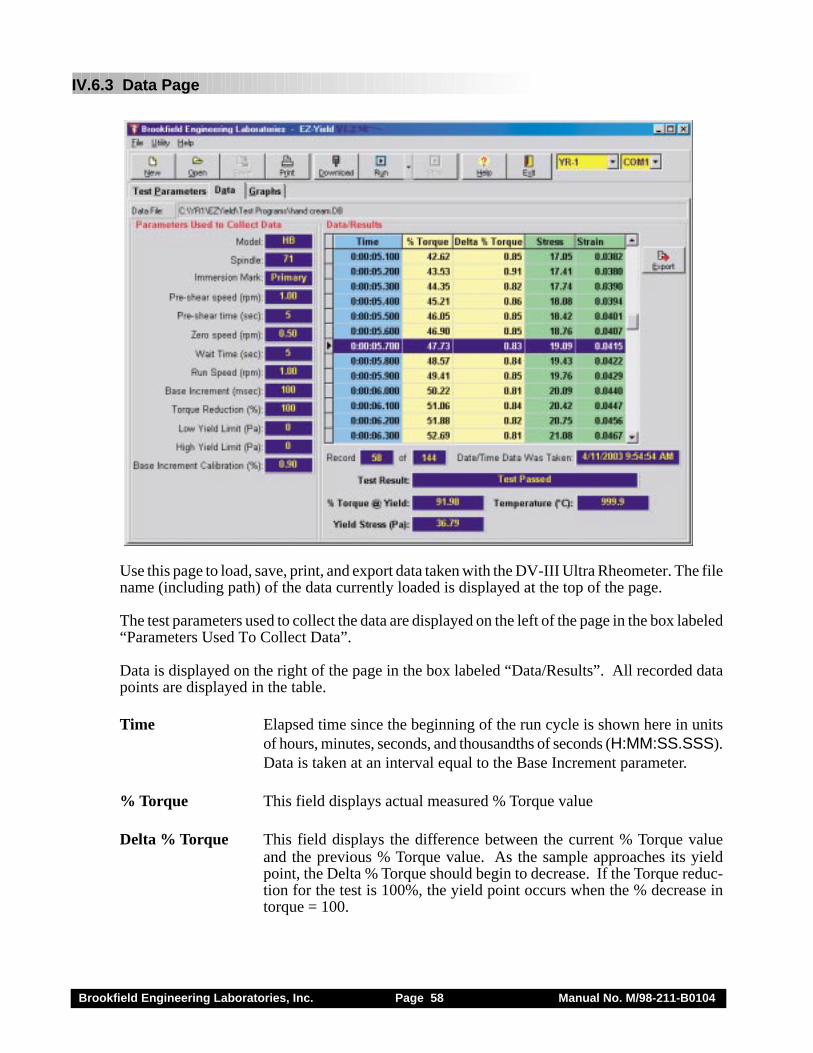
Brookfield Engineering Laboratories, Inc. Page 58 Manual No. M/98-211-B0104
IV.6.3 Data Page
Use this page to load, save, print, and export data taken with the DV-III Ultra Rheometer. The filename (including path) of the data currently loaded is displayed at the top of the page.
The test parameters used to collect the data are displayed on the left of the page in the box labeled“Parameters Used To Collect Data”.
Data is displayed on the right of the page in the box labeled “Data/Results”. All recorded datapoints are displayed in the table.
Time Elapsed time since the beginning of the run cycle is shown here in unitsof hours, minutes, seconds, and thousandths of seconds (H:MM:SS.SSS).Data is taken at an interval equal to the Base Increment parameter.
% Torque This field displays actual measured % Torque value
Delta % Torque This field displays the difference between the current % Torque valueand the previous % Torque value. As the sample approaches its yieldpoint, the Delta % Torque should begin to decrease. If the Torque reduc-tion for the test is 100%, the yield point occurs when the % decrease intorque = 100.
Brookfield Engineering Laboratories, Inc. Page 59 Manual No. M/98-211-B0104
Stress This field displays the calculated stress for each data point. The finalStress value (i.e. the Stress at the yield point) is the resultant yield stress.See Appendix D - Calculations - for the equation used to calculate stress.
Strain This field displays the Apparent Strain placed on the sample for each datapoint. The Apparent Strain is the angular distance that the spindle rotatesin the sample. See Appendix D2 - Spindle Codes and Speeds for YieldTests - for the equation used to calculate strain.
The following are displayed in the line immediately below the Data/Results table:
1. The number of the highlighted record2. The total number of data records3. The date and time that the highlighted record was taken.
The test results are displayed below that line.
Test Result There are five (5) possible test results:1. Test Passed2. Test Failed due to an Under-Range condition3. Test Failed due to an Over-Range condition4. Test Failed due to a User-Limit violation5. Test Failed due to a user cancellation
See Section IV.6.6.3 - Test Results - for more information regarding these possible results.
Temperature The temperature recorded at the conclusion of the test is displayed here in°C.
% Torque @ Yield The %Torque value at the yield point is displayed here.
Yield Stress The stress at the yield point is displayed here in Pascals (Pa).
Clicking the EXPORT button displays the Print Preview window. From the Print Previewwindow, the SAVE REPORT button can be clicked to allow you to save the report to various otherfile formats.
Note: The Save Report dialog box allows reports to be saved to in QuickReport (*.QRP),Comma Separated Text (*.CSV), HTML (*.HTM), and Excel spreadsheet (*.XLS)formats.
See Section IV.6.6.2 - Printing a Program - for more information regarding this window.
All open, save, and print operations selected while this page is displayed will open, save, and printdata, but NOT test parameters.
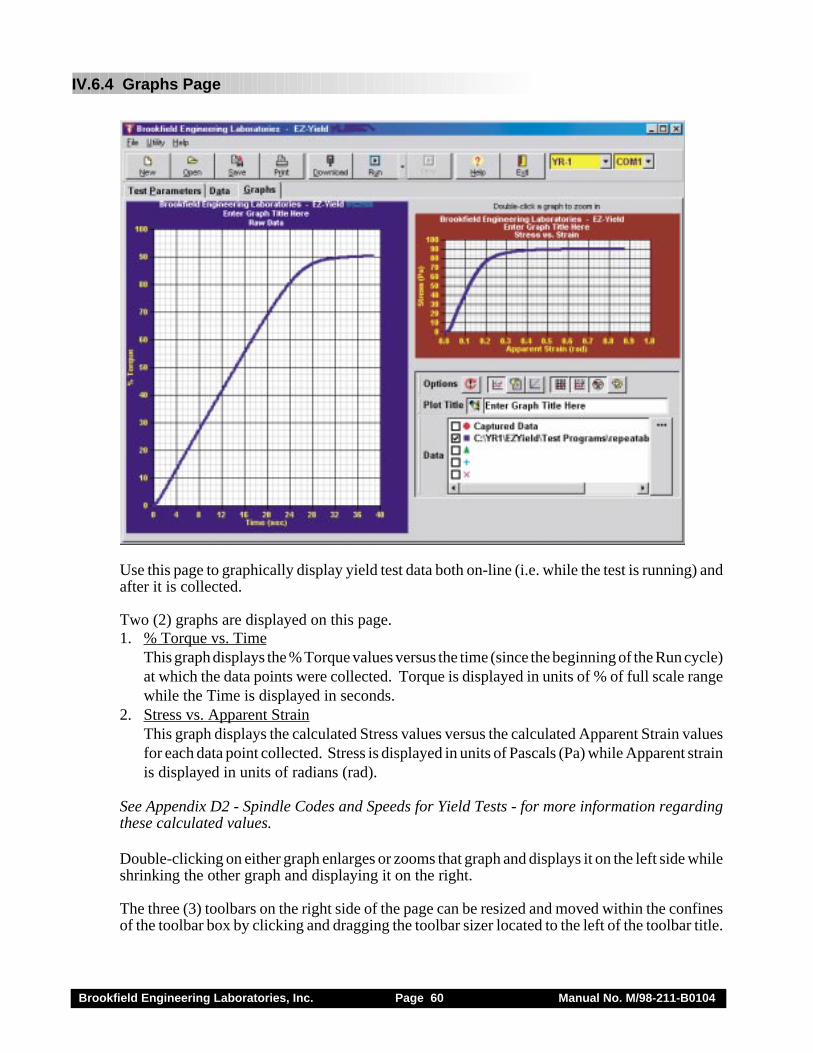
Brookfield Engineering Laboratories, Inc. Page 60 Manual No. M/98-211-B0104
IV.6.4 Graphs Page
Use this page to graphically display yield test data both on-line (i.e. while the test is running) andafter it is collected.
Two (2) graphs are displayed on this page.1. % Torque vs. Time
This graph displays the % Torque values versus the time (since the beginning of the Run cycle)at which the data points were collected. Torque is displayed in units of % of full scale rangewhile the Time is displayed in seconds.
2. Stress vs. Apparent StrainThis graph displays the calculated Stress values versus the calculated Apparent Strain valuesfor each data point collected. Stress is displayed in units of Pascals (Pa) while Apparent strainis displayed in units of radians (rad).
See Appendix D2 - Spindle Codes and Speeds for Yield Tests - for more information regardingthese calculated values.
Double-clicking on either graph enlarges or zooms that graph and displays it on the left side whileshrinking the other graph and displaying it on the right.
The three (3) toolbars on the right side of the page can be resized and moved within the confinesof the toolbar box by clicking and dragging the toolbar sizer located to the left of the toolbar title.
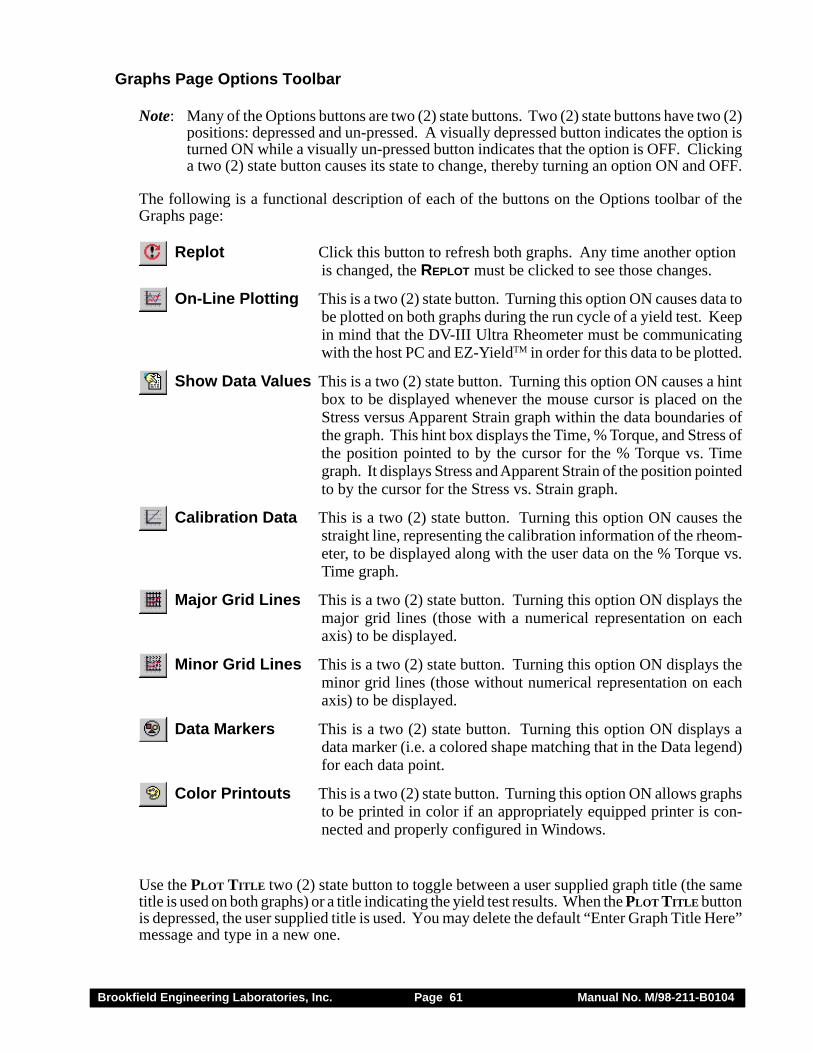
Brookfield Engineering Laboratories, Inc. Page 61 Manual No. M/98-211-B0104
Graphs Page Options Toolbar
Note: Many of the Options buttons are two (2) state buttons. Two (2) state buttons have two (2)positions: depressed and un-pressed. A visually depressed button indicates the option isturned ON while a visually un-pressed button indicates that the option is OFF. Clickinga two (2) state button causes its state to change, thereby turning an option ON and OFF.
The following is a functional description of each of the buttons on the Options toolbar of theGraphs page:
Replot Click this button to refresh both graphs. Any time another optionis changed, the REPLOT must be clicked to see those changes.
On-Line Plotting This is a two (2) state button. Turning this option ON causes data tobe plotted on both graphs during the run cycle of a yield test. Keepin mind that the DV-III Ultra Rheometer must be communicatingwith the host PC and EZ-YieldTM in order for this data to be plotted.
Show Data Values This is a two (2) state button. Turning this option ON causes a hintbox to be displayed whenever the mouse cursor is placed on theStress versus Apparent Strain graph within the data boundaries ofthe graph. This hint box displays the Time, % Torque, and Stress ofthe position pointed to by the cursor for the % Torque vs. Timegraph. It displays Stress and Apparent Strain of the position pointedto by the cursor for the Stress vs. Strain graph.
Calibration Data This is a two (2) state button. Turning this option ON causes thestraight line, representing the calibration information of the rheom-eter, to be displayed along with the user data on the % Torque vs.Time graph.
Major Grid Lines This is a two (2) state button. Turning this option ON displays themajor grid lines (those with a numerical representation on eachaxis) to be displayed.
Minor Grid Lines This is a two (2) state button. Turning this option ON displays theminor grid lines (those without numerical representation on eachaxis) to be displayed.
Data Markers This is a two (2) state button. Turning this option ON displays adata marker (i.e. a colored shape matching that in the Data legend)for each data point.
Color Printouts This is a two (2) state button. Turning this option ON allows graphsto be printed in color if an appropriately equipped printer is con-nected and properly configured in Windows.
Use the PLOT TITLE two (2) state button to toggle between a user supplied graph title (the sametitle is used on both graphs) or a title indicating the yield test results. When the PLOT TITLE buttonis depressed, the user supplied title is used. You may delete the default “Enter Graph Title Here”message and type in a new one.
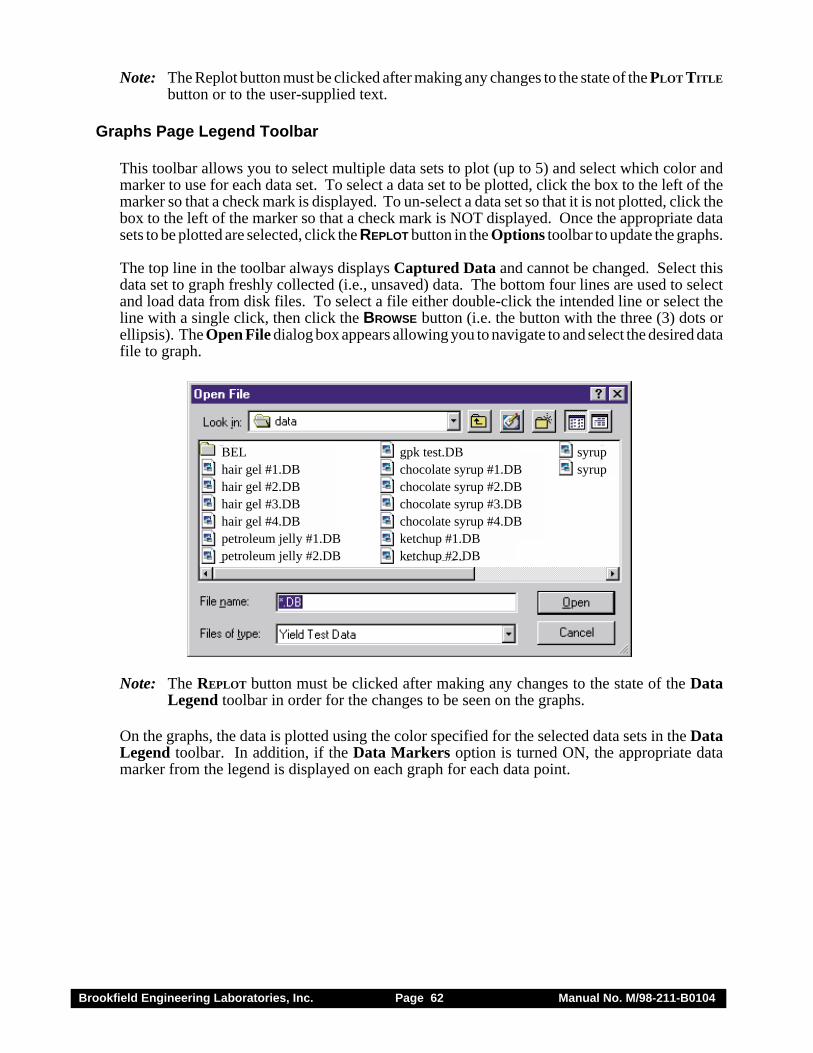
Brookfield Engineering Laboratories, Inc. Page 62 Manual No. M/98-211-B0104
Note: The Replot button must be clicked after making any changes to the state of the PLOT TITLE
button or to the user-supplied text.
Graphs Page Legend Toolbar
This toolbar allows you to select multiple data sets to plot (up to 5) and select which color andmarker to use for each data set. To select a data set to be plotted, click the box to the left of themarker so that a check mark is displayed. To un-select a data set so that it is not plotted, click thebox to the left of the marker so that a check mark is NOT displayed. Once the appropriate datasets to be plotted are selected, click the REPLOT button in the Options toolbar to update the graphs.
The top line in the toolbar always displays Captured Data and cannot be changed. Select thisdata set to graph freshly collected (i.e., unsaved) data. The bottom four lines are used to selectand load data from disk files. To select a file either double-click the intended line or select theline with a single click, then click the BROWSE button (i.e. the button with the three (3) dots orellipsis). The Open File dialog box appears allowing you to navigate to and select the desired datafile to graph.
BEL gpk test.DB syrup hair gel #1.DB chocolate syrup #1.DB syruphair gel #2.DB chocolate syrup #2.DBhair gel #3.DB chocolate syrup #3.DBhair gel #4.DB chocolate syrup #4.DBpetroleum jelly #1.DB ketchup #1.DBpetroleum jelly #2.DB ketchup #2.DB
Note: The REPLOT button must be clicked after making any changes to the state of the DataLegend toolbar in order for the changes to be seen on the graphs.
On the graphs, the data is plotted using the color specified for the selected data sets in the DataLegend toolbar. In addition, if the Data Markers option is turned ON, the appropriate datamarker from the legend is displayed on each graph for each data point.
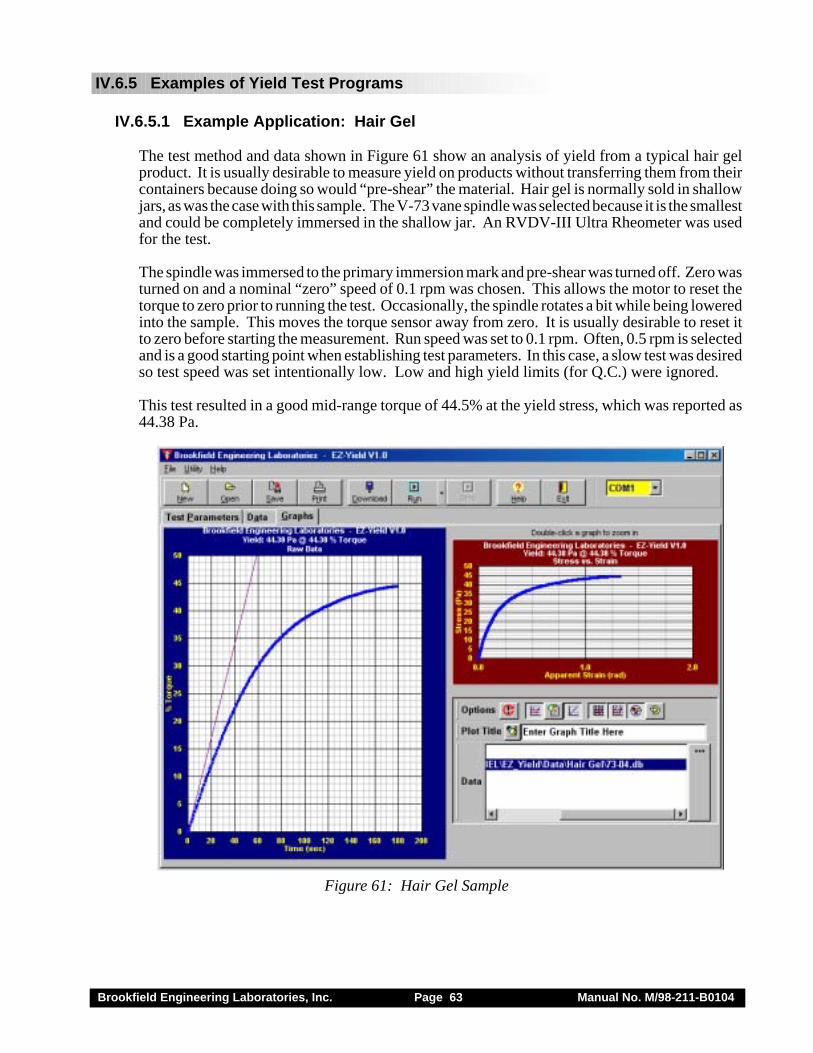
Brookfield Engineering Laboratories, Inc. Page 63 Manual No. M/98-211-B0104
IV.6.5 Examples of Yield Test Programs
IV.6.5.1 Example Application: Hair Gel
The test method and data shown in Figure 61 show an analysis of yield from a typical hair gelproduct. It is usually desirable to measure yield on products without transferring them from theircontainers because doing so would “pre-shear” the material. Hair gel is normally sold in shallowjars, as was the case with this sample. The V-73 vane spindle was selected because it is the smallestand could be completely immersed in the shallow jar. An RVDV-III Ultra Rheometer was usedfor the test.
The spindle was immersed to the primary immersion mark and pre-shear was turned off. Zero wasturned on and a nominal “zero” speed of 0.1 rpm was chosen. This allows the motor to reset thetorque to zero prior to running the test. Occasionally, the spindle rotates a bit while being loweredinto the sample. This moves the torque sensor away from zero. It is usually desirable to reset itto zero before starting the measurement. Run speed was set to 0.1 rpm. Often, 0.5 rpm is selectedand is a good starting point when establishing test parameters. In this case, a slow test was desiredso test speed was set intentionally low. Low and high yield limits (for Q.C.) were ignored.
This test resulted in a good mid-range torque of 44.5% at the yield stress, which was reported as44.38 Pa.
Figure 61: Hair Gel Sample
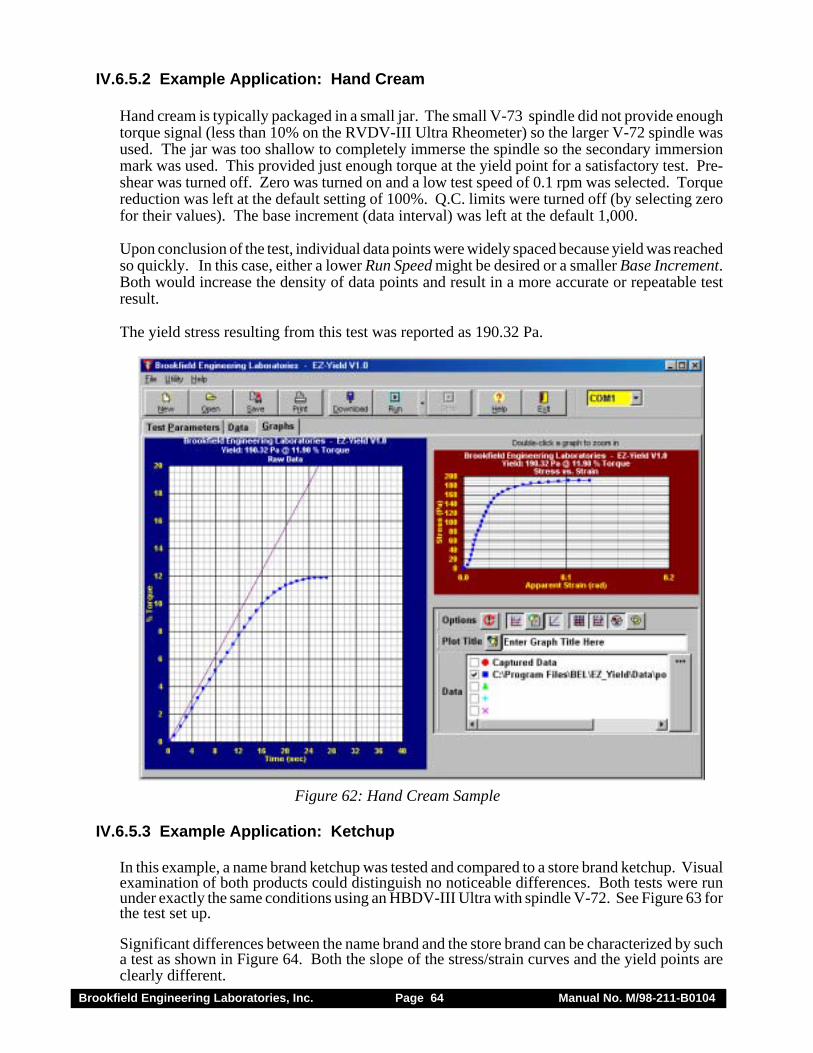
Brookfield Engineering Laboratories, Inc. Page 64 Manual No. M/98-211-B0104
IV.6.5.2 Example Application: Hand Cream
Hand cream is typically packaged in a small jar. The small V-73 spindle did not provide enoughtorque signal (less than 10% on the RVDV-III Ultra Rheometer) so the larger V-72 spindle wasused. The jar was too shallow to completely immerse the spindle so the secondary immersionmark was used. This provided just enough torque at the yield point for a satisfactory test. Pre-shear was turned off. Zero was turned on and a low test speed of 0.1 rpm was selected. Torquereduction was left at the default setting of 100%. Q.C. limits were turned off (by selecting zerofor their values). The base increment (data interval) was left at the default 1,000.
Upon conclusion of the test, individual data points were widely spaced because yield was reachedso quickly. In this case, either a lower Run Speed might be desired or a smaller Base Increment.Both would increase the density of data points and result in a more accurate or repeatable testresult.
The yield stress resulting from this test was reported as 190.32 Pa.
Figure 62: Hand Cream Sample
IV.6.5.3 Example Application: Ketchup
In this example, a name brand ketchup was tested and compared to a store brand ketchup. Visualexamination of both products could distinguish no noticeable differences. Both tests were rununder exactly the same conditions using an HBDV-III Ultra with spindle V-72. See Figure 63 forthe test set up.
Significant differences between the name brand and the store brand can be characterized by sucha test as shown in Figure 64. Both the slope of the stress/strain curves and the yield points areclearly different.
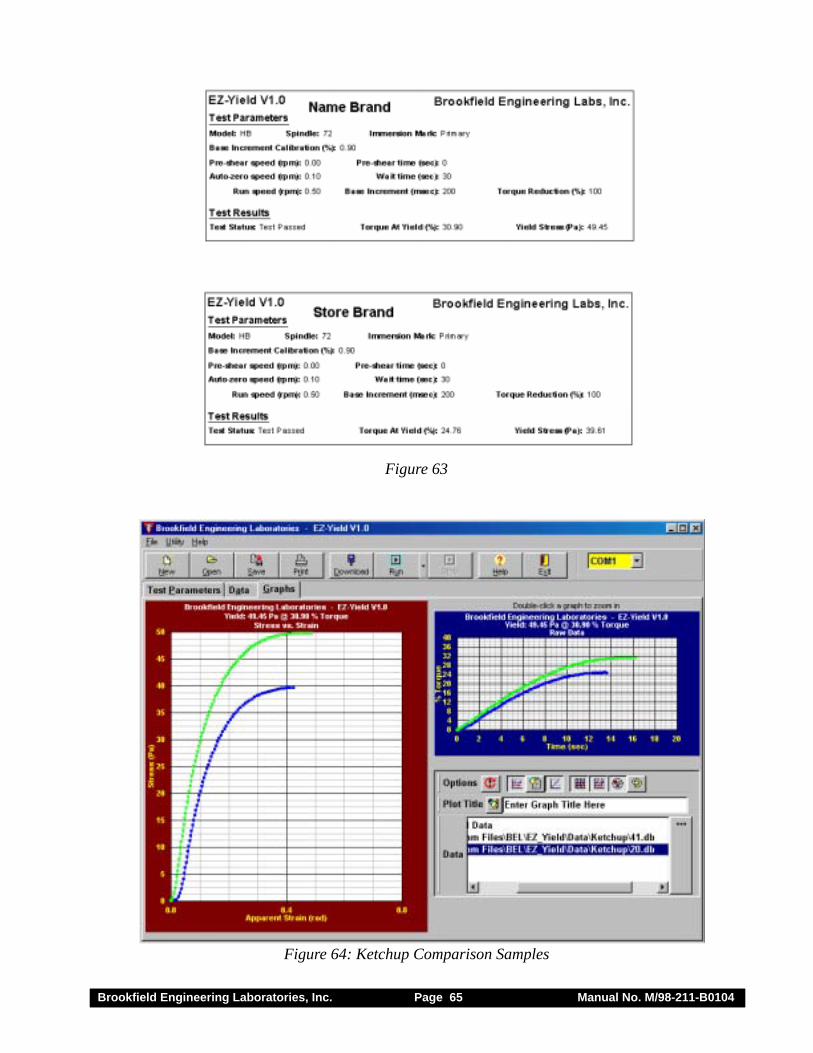
Brookfield Engineering Laboratories, Inc. Page 65 Manual No. M/98-211-B0104
Figure 63
Figure 64: Ketchup Comparison Samples
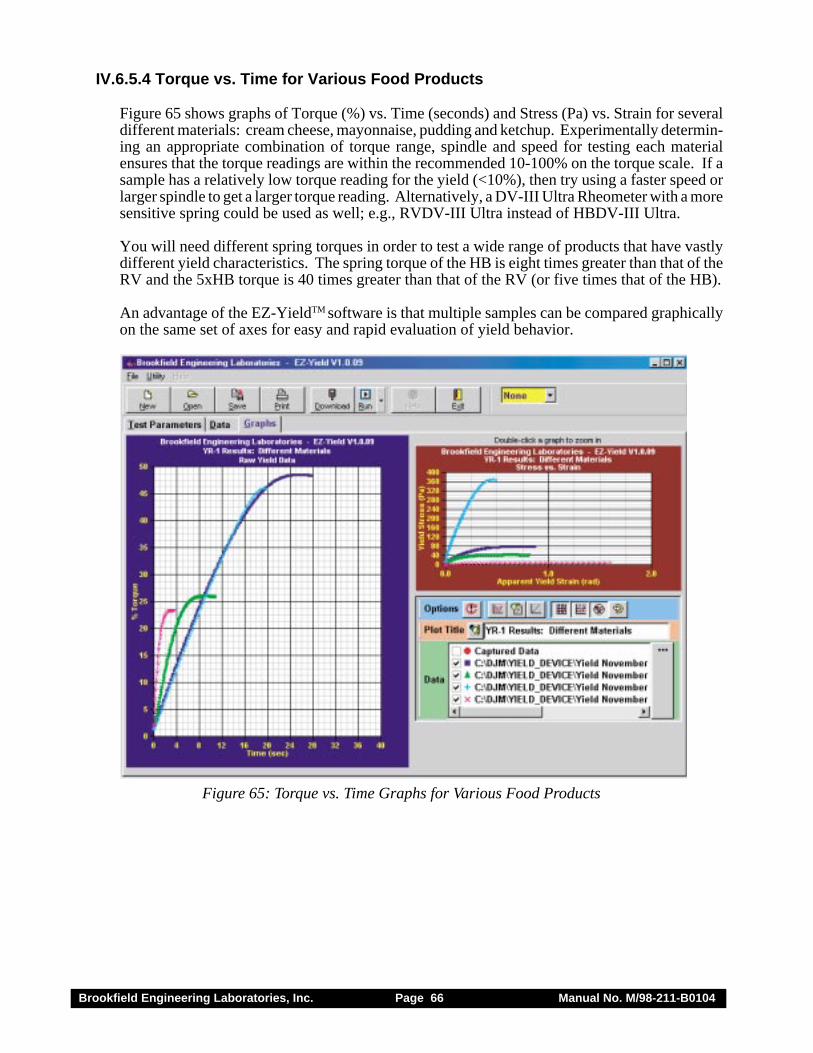
Brookfield Engineering Laboratories, Inc. Page 66 Manual No. M/98-211-B0104
IV.6.5.4 Torque vs. Time for Various Food Products
Figure 65 shows graphs of Torque (%) vs. Time (seconds) and Stress (Pa) vs. Strain for severaldifferent materials: cream cheese, mayonnaise, pudding and ketchup. Experimentally determin-ing an appropriate combination of torque range, spindle and speed for testing each materialensures that the torque readings are within the recommended 10-100% on the torque scale. If asample has a relatively low torque reading for the yield (<10%), then try using a faster speed orlarger spindle to get a larger torque reading. Alternatively, a DV-III Ultra Rheometer with a moresensitive spring could be used as well; e.g., RVDV-III Ultra instead of HBDV-III Ultra.
You will need different spring torques in order to test a wide range of products that have vastlydifferent yield characteristics. The spring torque of the HB is eight times greater than that of theRV and the 5xHB torque is 40 times greater than that of the RV (or five times that of the HB).
An advantage of the EZ-YieldTM software is that multiple samples can be compared graphicallyon the same set of axes for easy and rapid evaluation of yield behavior.
Figure 65: Torque vs. Time Graphs for Various Food Products
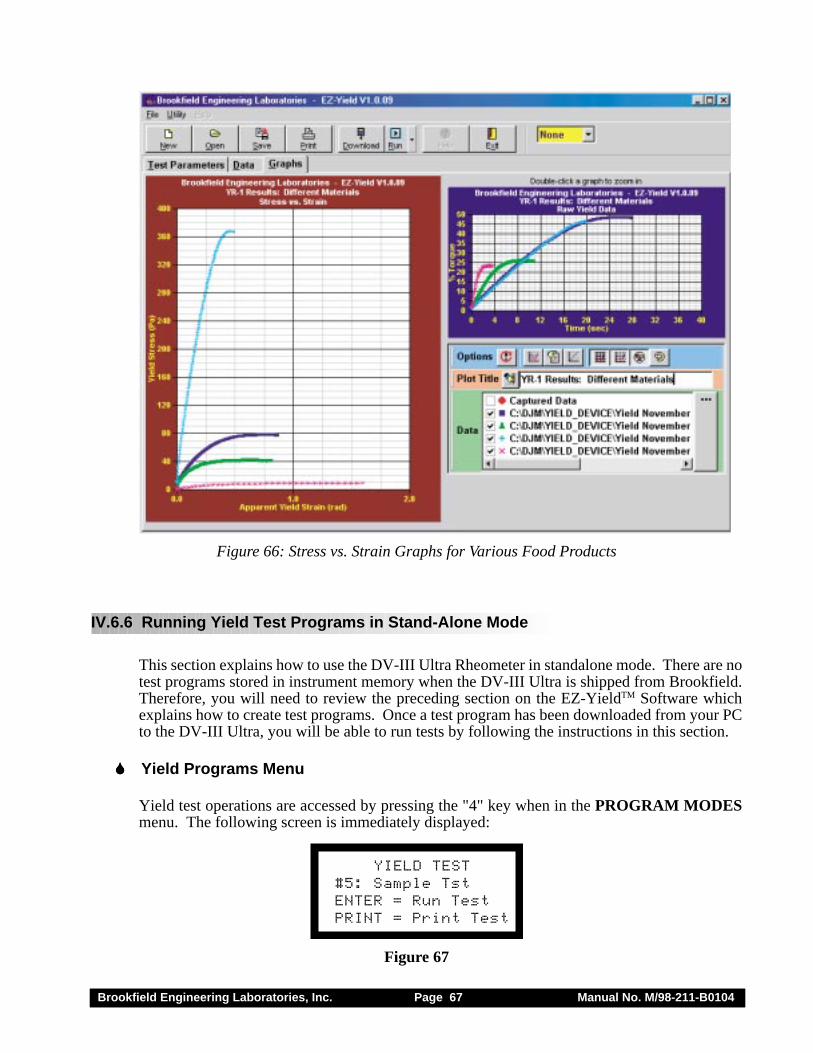
Brookfield Engineering Laboratories, Inc. Page 67 Manual No. M/98-211-B0104
Figure 66: Stress vs. Strain Graphs for Various Food Products
IV.6.6 Running Yield Test Programs in Stand-Alone Mode
This section explains how to use the DV-III Ultra Rheometer in standalone mode. There are notest programs stored in instrument memory when the DV-III Ultra is shipped from Brookfield.Therefore, you will need to review the preceding section on the EZ-YieldTM Software whichexplains how to create test programs. Once a test program has been downloaded from your PCto the DV-III Ultra, you will be able to run tests by following the instructions in this section.
� � � � � Yield Programs Menu
Yield test operations are accessed by pressing the "4" key when in the PROGRAM MODESmenu. The following screen is immediately displayed:
YIELD TEST#5: Sample TstENTER = Run TestPRINT = Print Test
Figure 67
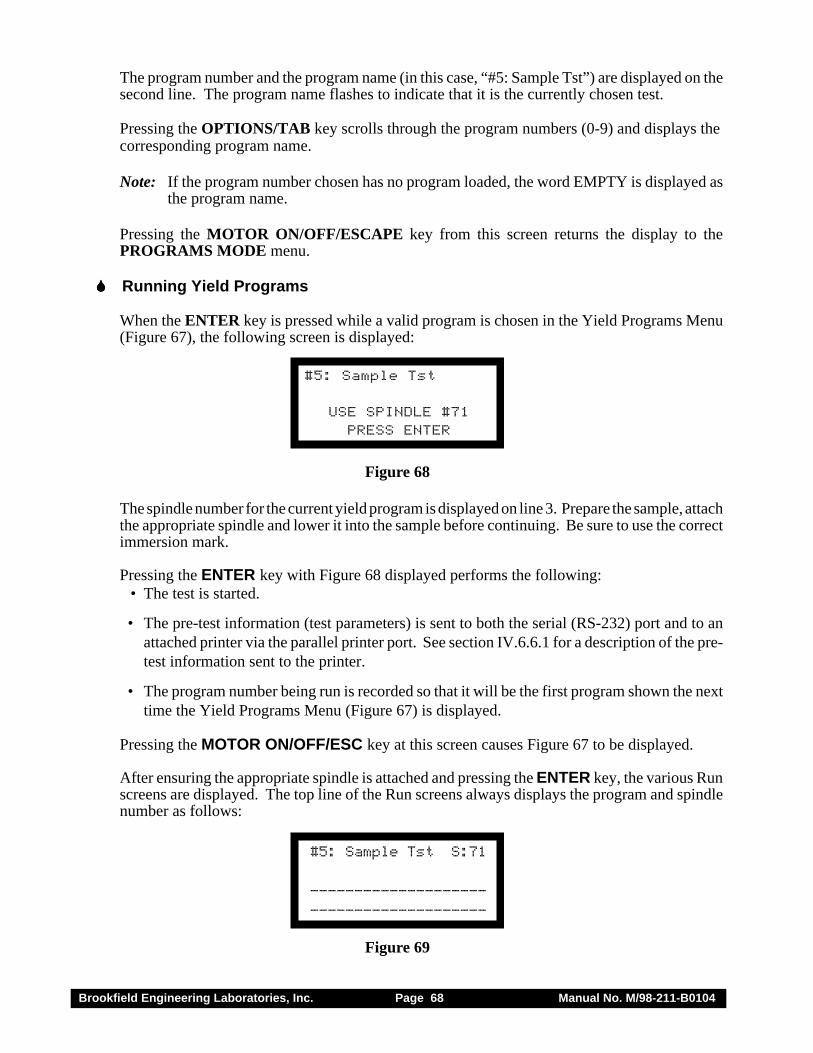
Brookfield Engineering Laboratories, Inc. Page 68 Manual No. M/98-211-B0104
The program number and the program name (in this case, “#5: Sample Tst”) are displayed on thesecond line. The program name flashes to indicate that it is the currently chosen test.
Pressing the OPTIONS/TAB key scrolls through the program numbers (0-9) and displays thecorresponding program name.
Note: If the program number chosen has no program loaded, the word EMPTY is displayed asthe program name.
Pressing the MOTOR ON/OFF/ESCAPE key from this screen returns the display to thePROGRAMS MODE menu.
� � � � � Running Yield Programs
When the ENTER key is pressed while a valid program is chosen in the Yield Programs Menu(Figure 67), the following screen is displayed:
#5: Sample Tst
USE SPINDLE #71PRESS ENTER
Figure 68
The spindle number for the current yield program is displayed on line 3. Prepare the sample, attachthe appropriate spindle and lower it into the sample before continuing. Be sure to use the correctimmersion mark.
Pressing the ENTER key with Figure 68 displayed performs the following: • The test is started.
• The pre-test information (test parameters) is sent to both the serial (RS-232) port and to anattached printer via the parallel printer port. See section IV.6.6.1 for a description of the pre-test information sent to the printer.
• The program number being run is recorded so that it will be the first program shown the nexttime the Yield Programs Menu (Figure 67) is displayed.
Pressing the MOTOR ON/OFF/ESC key at this screen causes Figure 67 to be displayed.
After ensuring the appropriate spindle is attached and pressing the ENTER key, the various Runscreens are displayed. The top line of the Run screens always displays the program and spindlenumber as follows:
#5: Sample Tst S:71
----------------------------------------
Figure 69
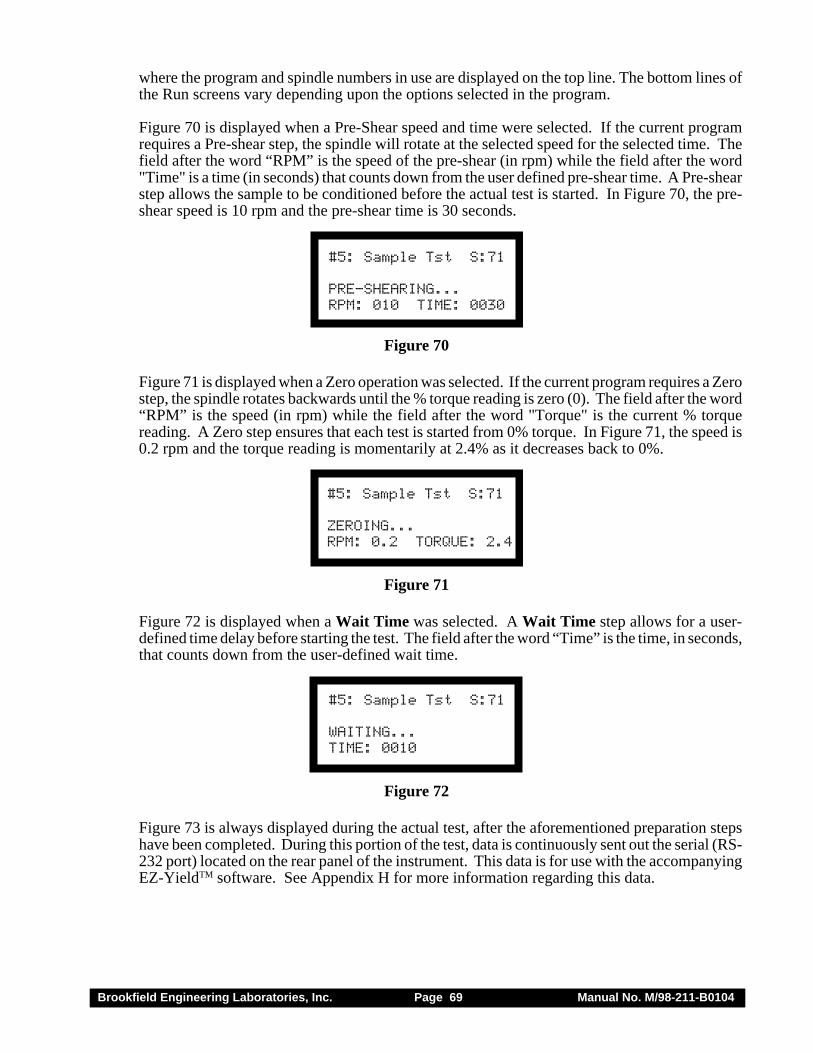
Brookfield Engineering Laboratories, Inc. Page 69 Manual No. M/98-211-B0104
where the program and spindle numbers in use are displayed on the top line. The bottom lines ofthe Run screens vary depending upon the options selected in the program.
Figure 70 is displayed when a Pre-Shear speed and time were selected. If the current programrequires a Pre-shear step, the spindle will rotate at the selected speed for the selected time. Thefield after the word “RPM” is the speed of the pre-shear (in rpm) while the field after the word"Time" is a time (in seconds) that counts down from the user defined pre-shear time. A Pre-shearstep allows the sample to be conditioned before the actual test is started. In Figure 70, the pre-shear speed is 10 rpm and the pre-shear time is 30 seconds.
#5: Sample Tst S:71
PRE-SHEARING...RPM: 010 TIME: 0030
Figure 70
Figure 71 is displayed when a Zero operation was selected. If the current program requires a Zerostep, the spindle rotates backwards until the % torque reading is zero (0). The field after the word“RPM” is the speed (in rpm) while the field after the word "Torque" is the current % torquereading. A Zero step ensures that each test is started from 0% torque. In Figure 71, the speed is0.2 rpm and the torque reading is momentarily at 2.4% as it decreases back to 0%.
#5: Sample Tst S:71
ZEROING...RPM: 0.2 TORQUE: 2.4
Figure 71
Figure 72 is displayed when a Wait Time was selected. A Wait Time step allows for a user-defined time delay before starting the test. The field after the word “Time” is the time, in seconds,that counts down from the user-defined wait time.
#5: Sample Tst S:71
WAITING...TIME: 0010
Figure 72
Figure 73 is always displayed during the actual test, after the aforementioned preparation stepshave been completed. During this portion of the test, data is continuously sent out the serial (RS-232 port) located on the rear panel of the instrument. This data is for use with the accompanyingEZ-YieldTM software. See Appendix H for more information regarding this data.
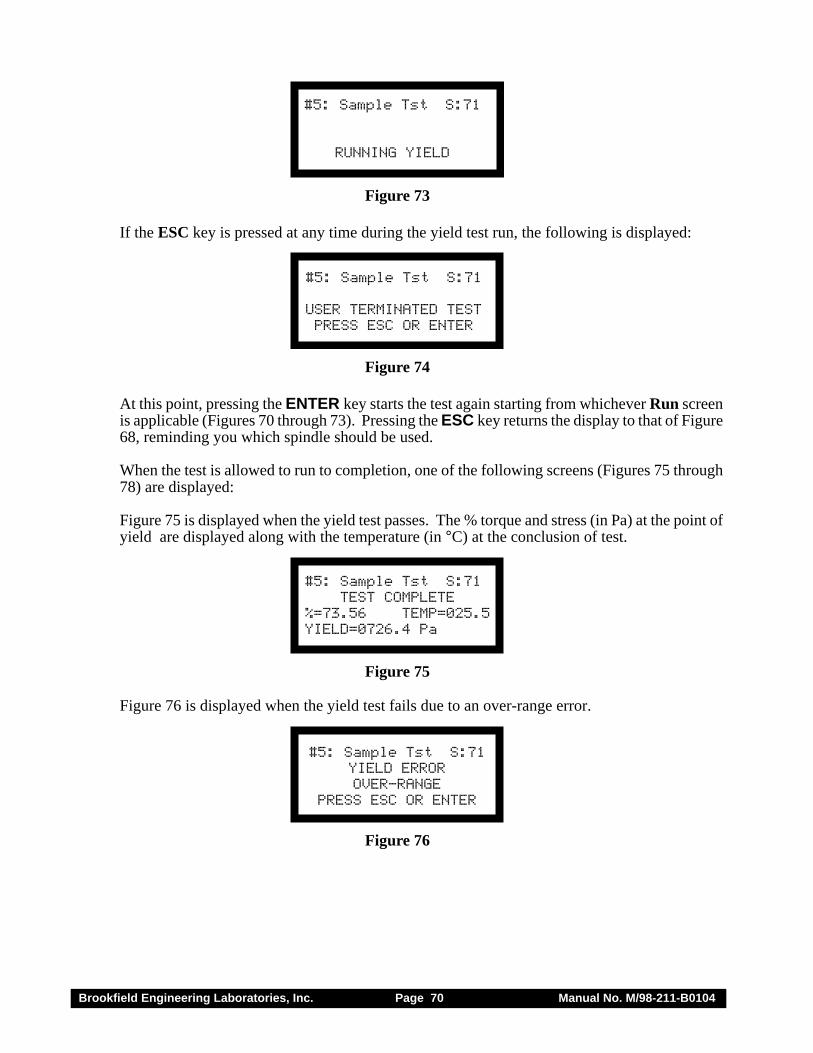
Brookfield Engineering Laboratories, Inc. Page 70 Manual No. M/98-211-B0104
#5: Sample Tst S:71
RUNNING YIELD
Figure 73
If the ESC key is pressed at any time during the yield test run, the following is displayed:
#5: Sample Tst S:71
USER TERMINATED TESTPRESS ESC OR ENTER
Figure 74
At this point, pressing the ENTER key starts the test again starting from whichever Run screenis applicable (Figures 70 through 73). Pressing the ESC key returns the display to that of Figure68, reminding you which spindle should be used.
When the test is allowed to run to completion, one of the following screens (Figures 75 through78) are displayed:
Figure 75 is displayed when the yield test passes. The % torque and stress (in Pa) at the point ofyield are displayed along with the temperature (in °C) at the conclusion of test.
#5: Sample Tst S:71TEST COMPLETE
%=73.56 TEMP=025.5YIELD=0726.4 Pa
Figure 75
Figure 76 is displayed when the yield test fails due to an over-range error.
#5: Sample Tst S:71YIELD ERROROVER-RANGE
PRESS ESC OR ENTER
Figure 76
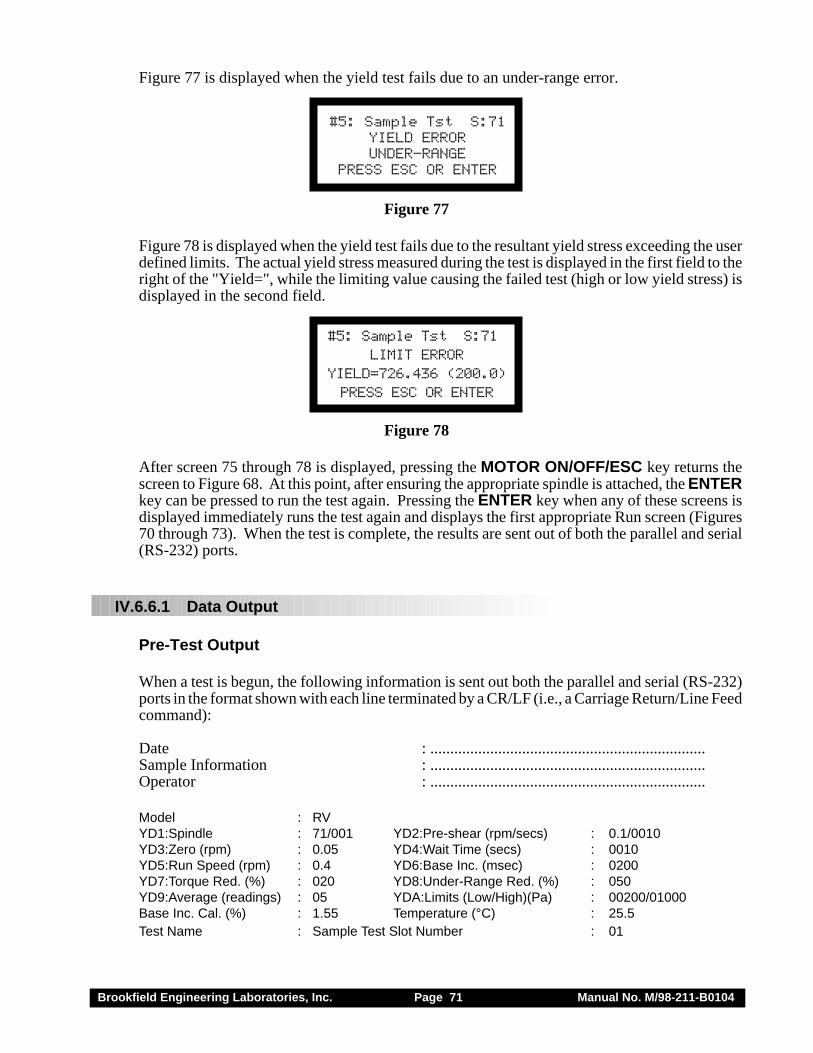
Brookfield Engineering Laboratories, Inc. Page 71 Manual No. M/98-211-B0104
Figure 77 is displayed when the yield test fails due to an under-range error.
#5: Sample Tst S:71YIELD ERRORUNDER-RANGE
PRESS ESC OR ENTER
Figure 77
Figure 78 is displayed when the yield test fails due to the resultant yield stress exceeding the userdefined limits. The actual yield stress measured during the test is displayed in the first field to theright of the "Yield=", while the limiting value causing the failed test (high or low yield stress) isdisplayed in the second field.
#5: Sample Tst S:71LIMIT ERROR
YIELD=726.436 (200.0)PRESS ESC OR ENTER
Figure 78
After screen 75 through 78 is displayed, pressing the MOTOR ON/OFF/ESC key returns thescreen to Figure 68. At this point, after ensuring the appropriate spindle is attached, the ENTERkey can be pressed to run the test again. Pressing the ENTER key when any of these screens isdisplayed immediately runs the test again and displays the first appropriate Run screen (Figures70 through 73). When the test is complete, the results are sent out of both the parallel and serial(RS-232) ports.
IV.6.6.1 Data Output
Pre-Test Output
When a test is begun, the following information is sent out both the parallel and serial (RS-232)ports in the format shown with each line terminated by a CR/LF (i.e., a Carriage Return/Line Feedcommand):
Date : .....................................................................Sample Information : .....................................................................Operator : .....................................................................
Model : RVYD1:Spindle : 71/001 YD2:Pre-shear (rpm/secs) : 0.1/0010YD3:Zero (rpm) : 0.05 YD4:Wait Time (secs) : 0010YD5:Run Speed (rpm) : 0.4 YD6:Base Inc. (msec) : 0200YD7:Torque Red. (%) : 020 YD8:Under-Range Red. (%) : 050YD9:Average (readings) : 05 YDA:Limits (Low/High)(Pa) : 00200/01000Base Inc. Cal. (%) : 1.55 Temperature (°C) : 25.5Test Name : Sample Test Slot Number : 01
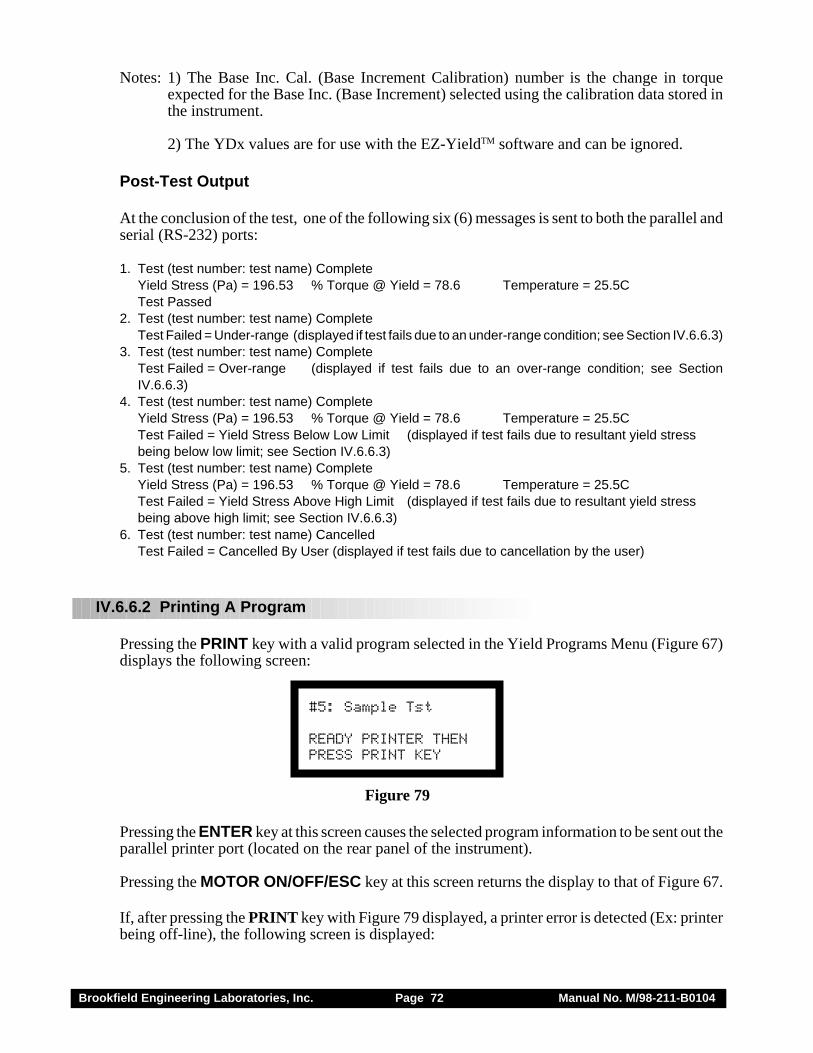
Brookfield Engineering Laboratories, Inc. Page 72 Manual No. M/98-211-B0104
Notes: 1) The Base Inc. Cal. (Base Increment Calibration) number is the change in torqueexpected for the Base Inc. (Base Increment) selected using the calibration data stored inthe instrument.
2) The YDx values are for use with the EZ-YieldTM software and can be ignored.
Post-Test Output
At the conclusion of the test, one of the following six (6) messages is sent to both the parallel andserial (RS-232) ports:
1. Test (test number: test name) CompleteYield Stress (Pa) = 196.53 % Torque @ Yield = 78.6 Temperature = 25.5CTest Passed
2. Test (test number: test name) CompleteTest Failed = Under-range (displayed if test fails due to an under-range condition; see Section IV.6.6.3)
3. Test (test number: test name) CompleteTest Failed = Over-range (displayed if test fails due to an over-range condition; see SectionIV.6.6.3)
4. Test (test number: test name) CompleteYield Stress (Pa) = 196.53 % Torque @ Yield = 78.6 Temperature = 25.5CTest Failed = Yield Stress Below Low Limit (displayed if test fails due to resultant yield stressbeing below low limit; see Section IV.6.6.3)
5. Test (test number: test name) CompleteYield Stress (Pa) = 196.53 % Torque @ Yield = 78.6 Temperature = 25.5CTest Failed = Yield Stress Above High Limit (displayed if test fails due to resultant yield stressbeing above high limit; see Section IV.6.6.3)
6. Test (test number: test name) CancelledTest Failed = Cancelled By User (displayed if test fails due to cancellation by the user)
IV.6.6.2 Printing A Program
Pressing the PRINT key with a valid program selected in the Yield Programs Menu (Figure 67)displays the following screen:
#5: Sample Tst
READY PRINTER THENPRESS PRINT KEY
Figure 79
Pressing the ENTER key at this screen causes the selected program information to be sent out theparallel printer port (located on the rear panel of the instrument).
Pressing the MOTOR ON/OFF/ESC key at this screen returns the display to that of Figure 67.
If, after pressing the PRINT key with Figure 79 displayed, a printer error is detected (Ex: printerbeing off-line), the following screen is displayed:
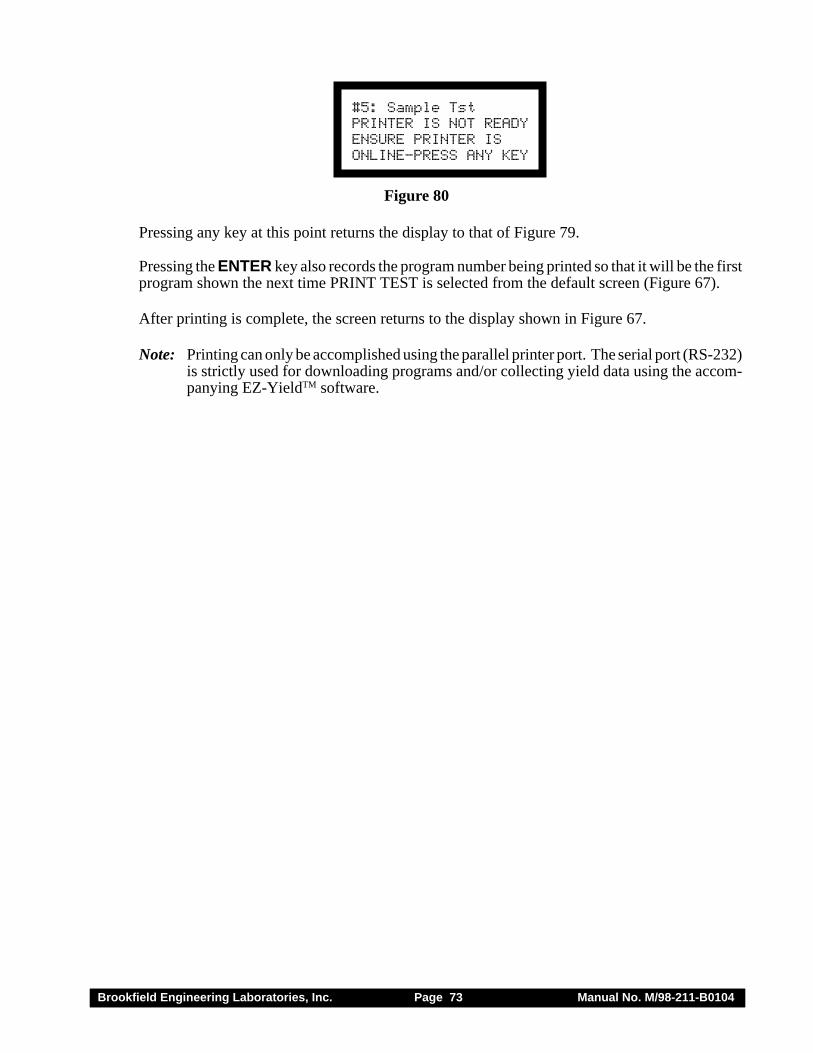
Brookfield Engineering Laboratories, Inc. Page 73 Manual No. M/98-211-B0104
#5: Sample TstPRINTER IS NOT READYENSURE PRINTER ISONLINE-PRESS ANY KEY
Figure 80
Pressing any key at this point returns the display to that of Figure 79.
Pressing the ENTER key also records the program number being printed so that it will be the firstprogram shown the next time PRINT TEST is selected from the default screen (Figure 67).
After printing is complete, the screen returns to the display shown in Figure 67.
Note: Printing can only be accomplished using the parallel printer port. The serial port (RS-232)is strictly used for downloading programs and/or collecting yield data using the accom-panying EZ-YieldTM software.
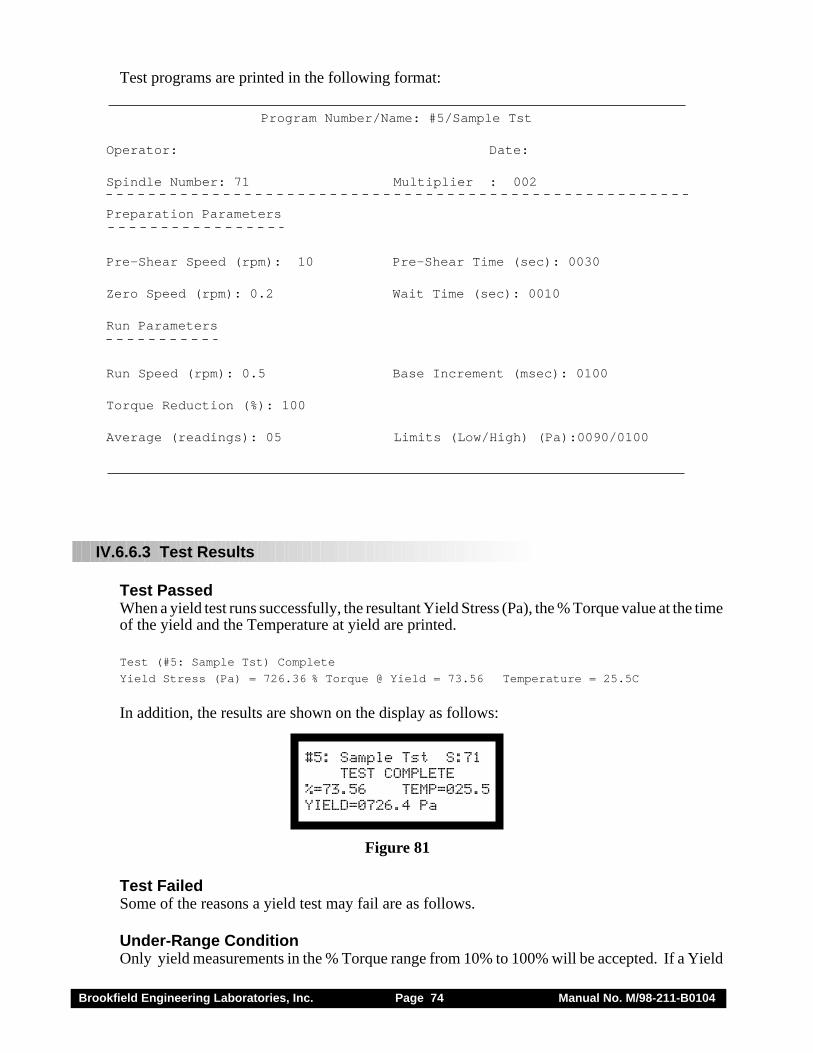
Brookfield Engineering Laboratories, Inc. Page 74 Manual No. M/98-211-B0104
Test programs are printed in the following format:
Program Number/Name: #5/Sample Tst
Operator: Date:
Spindle Number: 71 Multiplier : 002
Preparation Parameters
Pre-Shear Speed (rpm): 10 Pre-Shear Time (sec): 0030
Zero Speed (rpm): 0.2 Wait Time (sec): 0010
Run Parameters
Run Speed (rpm): 0.5 Base Increment (msec): 0100
Torque Reduction (%): 100
Average (readings): 05 Limits (Low/High) (Pa):0090/0100
IV.6.6.3 Test Results
Test PassedWhen a yield test runs successfully, the resultant Yield Stress (Pa), the % Torque value at the timeof the yield and the Temperature at yield are printed.
Test (#5: Sample Tst) Complete
Yield Stress (Pa) = 726.36 % Torque @ Yield = 73.56 Temperature = 25.5C
In addition, the results are shown on the display as follows:
#5: Sample Tst S:71TEST COMPLETE
%=73.56 TEMP=025.5YIELD=0726.4 Pa
Figure 81
Test FailedSome of the reasons a yield test may fail are as follows.
Under-Range ConditionOnly yield measurements in the % Torque range from 10% to 100% will be accepted. If a Yield
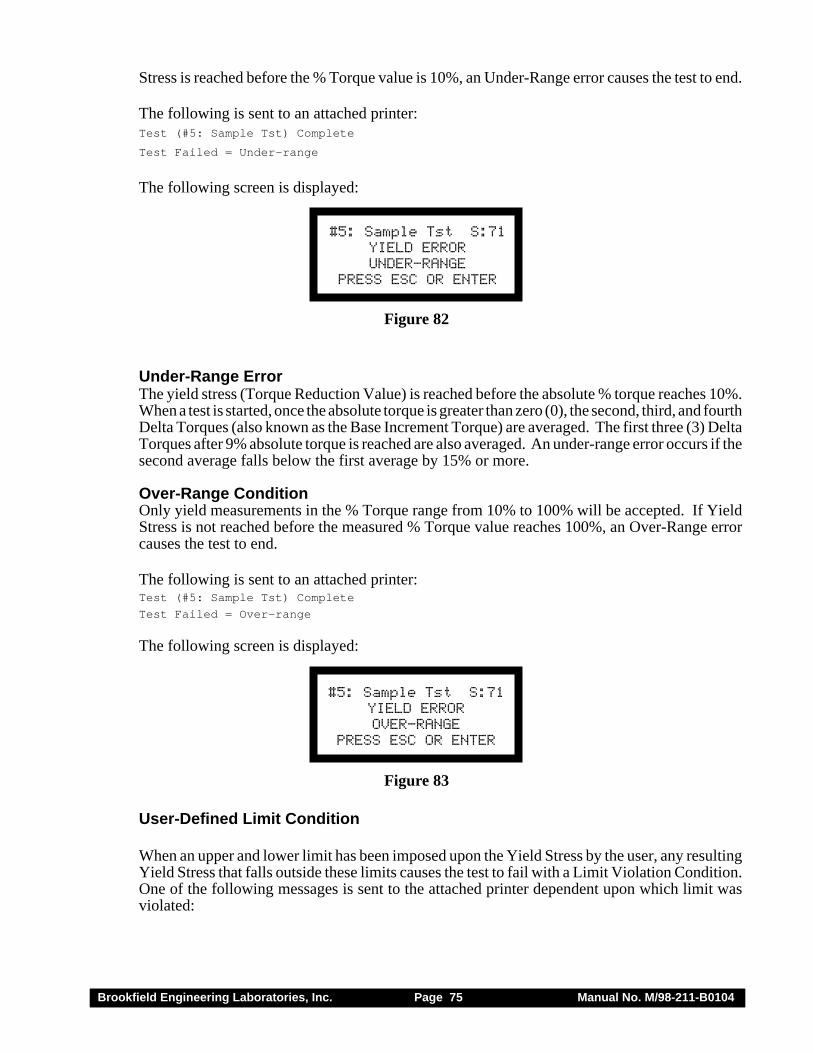
Brookfield Engineering Laboratories, Inc. Page 75 Manual No. M/98-211-B0104
Stress is reached before the % Torque value is 10%, an Under-Range error causes the test to end.
The following is sent to an attached printer:Test (#5: Sample Tst) Complete
Test Failed = Under-range
The following screen is displayed:
#5: Sample Tst S:71YIELD ERRORUNDER-RANGE
PRESS ESC OR ENTER
Figure 82
Under-Range ErrorThe yield stress (Torque Reduction Value) is reached before the absolute % torque reaches 10%.When a test is started, once the absolute torque is greater than zero (0), the second, third, and fourthDelta Torques (also known as the Base Increment Torque) are averaged. The first three (3) DeltaTorques after 9% absolute torque is reached are also averaged. An under-range error occurs if thesecond average falls below the first average by 15% or more.
Over-Range ConditionOnly yield measurements in the % Torque range from 10% to 100% will be accepted. If YieldStress is not reached before the measured % Torque value reaches 100%, an Over-Range errorcauses the test to end.
The following is sent to an attached printer:Test (#5: Sample Tst) Complete
Test Failed = Over-range
The following screen is displayed:
#5: Sample Tst S:71YIELD ERROROVER-RANGE
PRESS ESC OR ENTER
Figure 83
User-Defined Limit Condition
When an upper and lower limit has been imposed upon the Yield Stress by the user, any resultingYield Stress that falls outside these limits causes the test to fail with a Limit Violation Condition.One of the following messages is sent to the attached printer dependent upon which limit wasviolated:
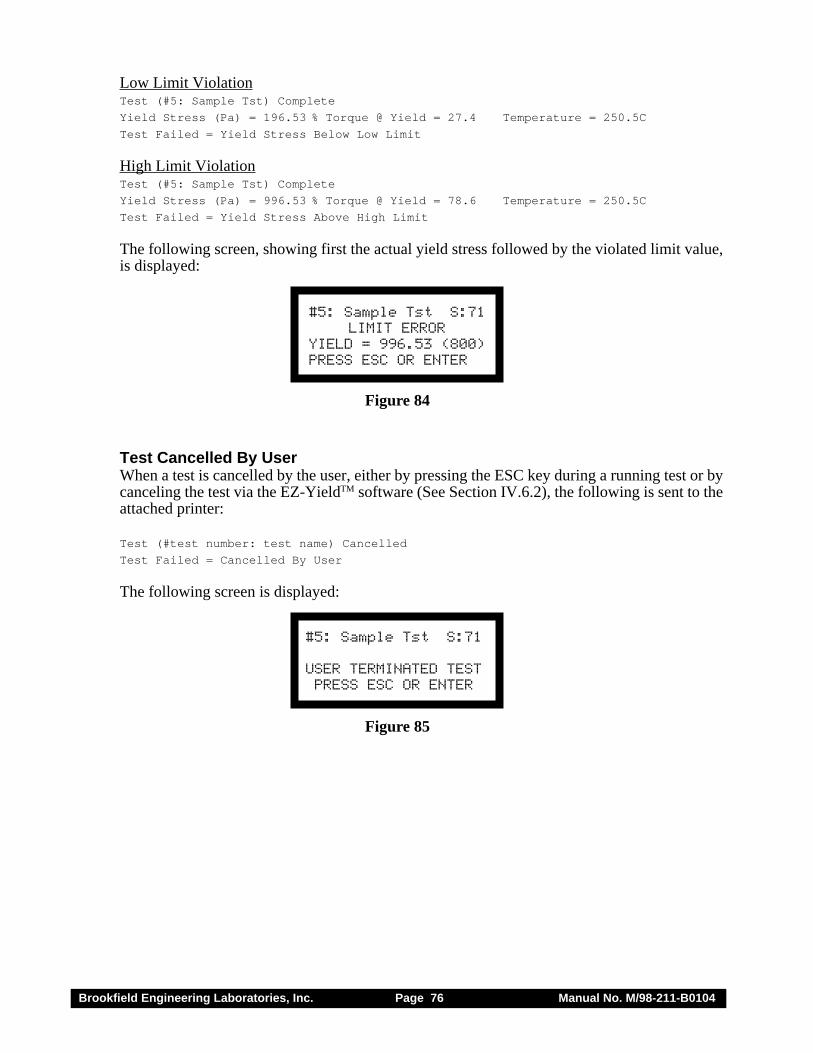
Brookfield Engineering Laboratories, Inc. Page 76 Manual No. M/98-211-B0104
Low Limit ViolationTest (#5: Sample Tst) Complete
Yield Stress (Pa) = 196.53 % Torque @ Yield = 27.4 Temperature = 250.5C
Test Failed = Yield Stress Below Low Limit
High Limit ViolationTest (#5: Sample Tst) Complete
Yield Stress (Pa) = 996.53 % Torque @ Yield = 78.6 Temperature = 250.5C
Test Failed = Yield Stress Above High Limit
The following screen, showing first the actual yield stress followed by the violated limit value,is displayed:
#5: Sample Tst S:71LIMIT ERROR
YIELD = 996.53 (800)PRESS ESC OR ENTER
Figure 84
Test Cancelled By UserWhen a test is cancelled by the user, either by pressing the ESC key during a running test or bycanceling the test via the EZ-YieldTM software (See Section IV.6.2), the following is sent to theattached printer:
Test (#test number: test name) Cancelled
Test Failed = Cancelled By User
The following screen is displayed:
#5: Sample Tst S:71
USER TERMINATED TESTPRESS ESC OR ENTER
Figure 85
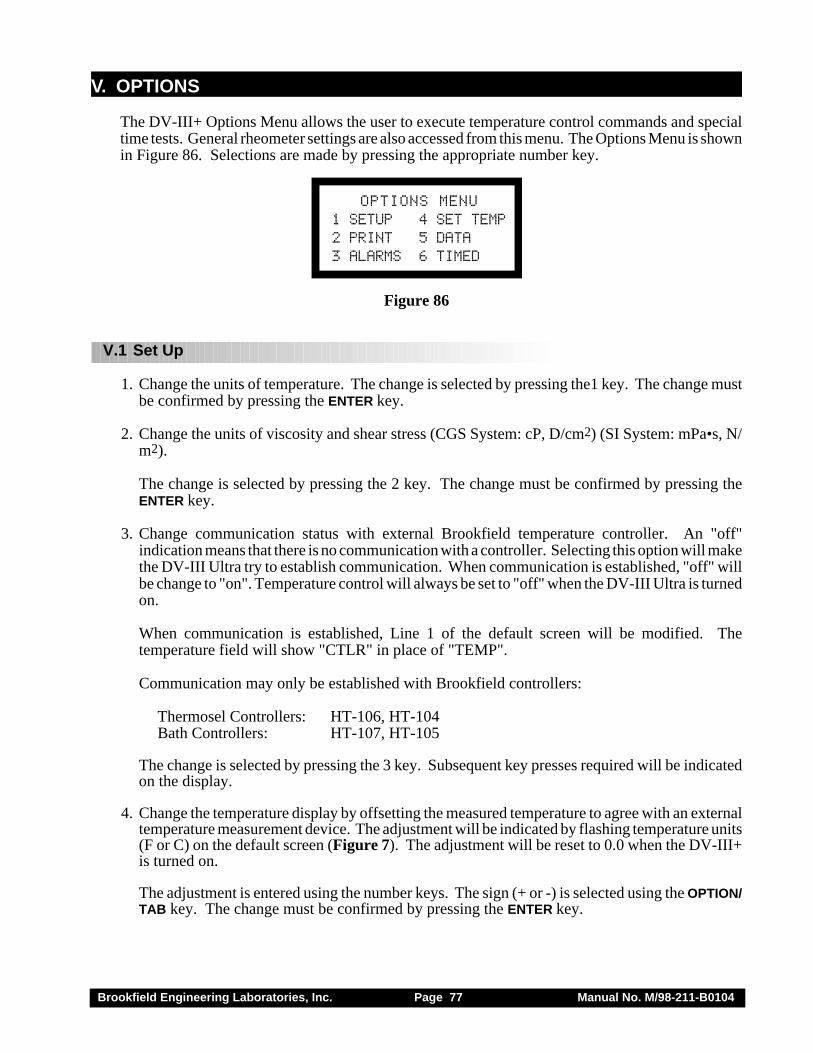
Brookfield Engineering Laboratories, Inc. Page 77 Manual No. M/98-211-B0104
V. OPTIONS
The DV-III+ Options Menu allows the user to execute temperature control commands and specialtime tests. General rheometer settings are also accessed from this menu. The Options Menu is shownin Figure 86. Selections are made by pressing the appropriate number key.
OPTIONS MENU1 SETUP 4 SET TEMP2 PRINT 5 DATA3 ALARMS 6 TIMED
Figure 86
V.1 Set Up
1. Change the units of temperature. The change is selected by pressing the1 key. The change mustbe confirmed by pressing the ENTER key.
2. Change the units of viscosity and shear stress (CGS System: cP, D/cm2) (SI System: mPa•s, N/m2).
The change is selected by pressing the 2 key. The change must be confirmed by pressing theENTER key.
3. Change communication status with external Brookfield temperature controller. An "off"indication means that there is no communication with a controller. Selecting this option will makethe DV-III Ultra try to establish communication. When communication is established, "off" willbe change to "on". Temperature control will always be set to "off" when the DV-III Ultra is turnedon.
When communication is established, Line 1 of the default screen will be modified. Thetemperature field will show "CTLR" in place of "TEMP".
Communication may only be established with Brookfield controllers:
Thermosel Controllers: HT-106, HT-104Bath Controllers: HT-107, HT-105
The change is selected by pressing the 3 key. Subsequent key presses required will be indicatedon the display.
4. Change the temperature display by offsetting the measured temperature to agree with an externaltemperature measurement device. The adjustment will be indicated by flashing temperature units(F or C) on the default screen (Figure 7). The adjustment will be reset to 0.0 when the DV-III+is turned on.
The adjustment is entered using the number keys. The sign (+ or -) is selected using the OPTION/TAB key. The change must be confirmed by pressing the ENTER key.
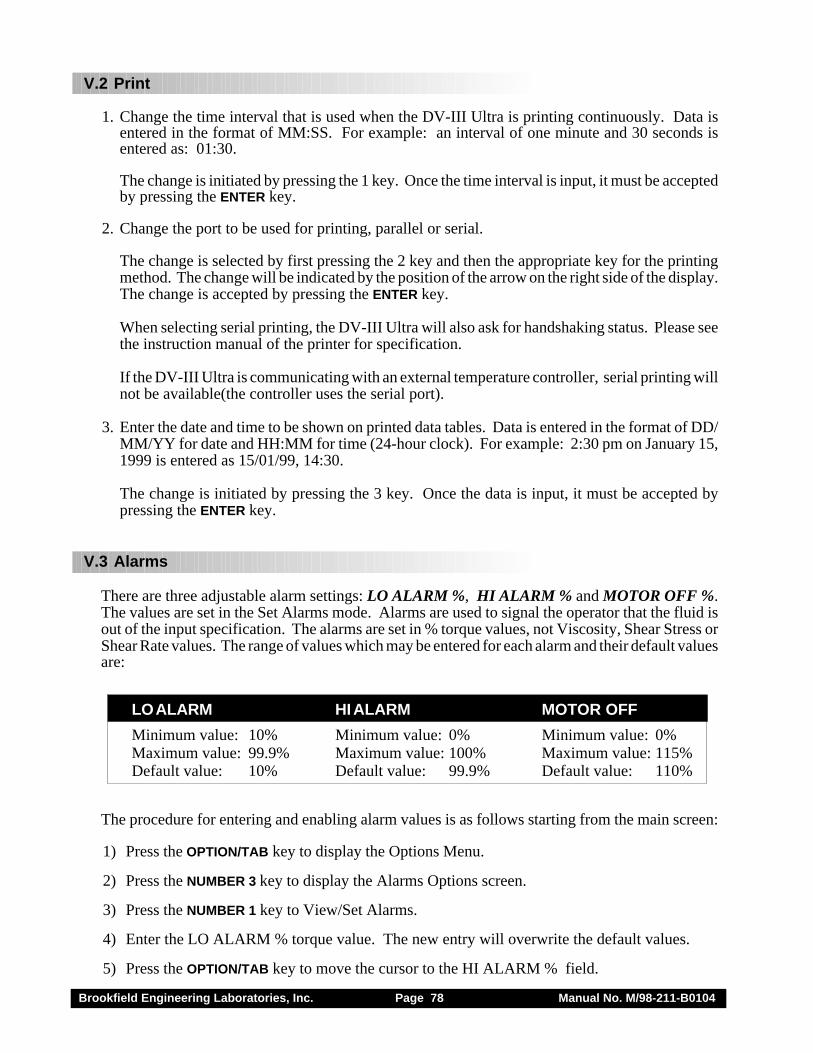
Brookfield Engineering Laboratories, Inc. Page 78 Manual No. M/98-211-B0104
V.2 Print
1. Change the time interval that is used when the DV-III Ultra is printing continuously. Data isentered in the format of MM:SS. For example: an interval of one minute and 30 seconds isentered as: 01:30.
The change is initiated by pressing the 1 key. Once the time interval is input, it must be acceptedby pressing the ENTER key.
2. Change the port to be used for printing, parallel or serial.
The change is selected by first pressing the 2 key and then the appropriate key for the printingmethod. The change will be indicated by the position of the arrow on the right side of the display.The change is accepted by pressing the ENTER key.
When selecting serial printing, the DV-III Ultra will also ask for handshaking status. Please seethe instruction manual of the printer for specification.
If the DV-III Ultra is communicating with an external temperature controller, serial printing willnot be available(the controller uses the serial port).
3. Enter the date and time to be shown on printed data tables. Data is entered in the format of DD/MM/YY for date and HH:MM for time (24-hour clock). For example: 2:30 pm on January 15,1999 is entered as 15/01/99, 14:30.
The change is initiated by pressing the 3 key. Once the data is input, it must be accepted bypressing the ENTER key.
V.3 Alarms
There are three adjustable alarm settings: LO ALARM %, HI ALARM % and MOTOR OFF %.The values are set in the Set Alarms mode. Alarms are used to signal the operator that the fluid isout of the input specification. The alarms are set in % torque values, not Viscosity, Shear Stress orShear Rate values. The range of values which may be entered for each alarm and their default valuesare:
LO ALARM HI ALARM MOTOR OFF
Minimum value: 10% Minimum value: 0% Minimum value: 0%Maximum value: 99.9% Maximum value: 100% Maximum value: 115%Default value: 10% Default value: 99.9% Default value: 110%
The procedure for entering and enabling alarm values is as follows starting from the main screen:
1) Press the OPTION/TAB key to display the Options Menu.
2) Press the NUMBER 3 key to display the Alarms Options screen.
3) Press the NUMBER 1 key to View/Set Alarms.
4) Enter the LO ALARM % torque value. The new entry will overwrite the default values.
5) Press the OPTION/TAB key to move the cursor to the HI ALARM % field.
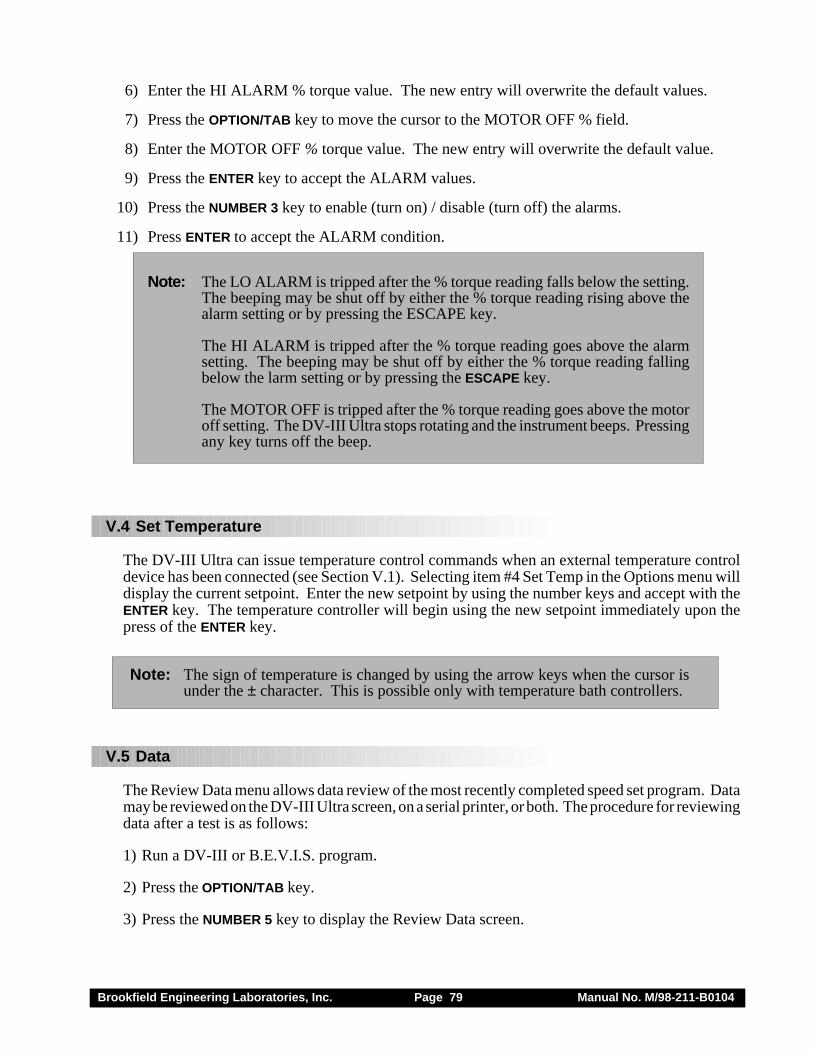
Brookfield Engineering Laboratories, Inc. Page 79 Manual No. M/98-211-B0104
6) Enter the HI ALARM % torque value. The new entry will overwrite the default values.
7) Press the OPTION/TAB key to move the cursor to the MOTOR OFF % field.
8) Enter the MOTOR OFF % torque value. The new entry will overwrite the default value.
9) Press the ENTER key to accept the ALARM values.
10) Press the NUMBER 3 key to enable (turn on) / disable (turn off) the alarms.
11) Press ENTER to accept the ALARM condition.
Note: The LO ALARM is tripped after the % torque reading falls below the setting.The beeping may be shut off by either the % torque reading rising above thealarm setting or by pressing the ESCAPE key.
The HI ALARM is tripped after the % torque reading goes above the alarmsetting. The beeping may be shut off by either the % torque reading fallingbelow the larm setting or by pressing the ESCAPE key.
The MOTOR OFF is tripped after the % torque reading goes above the motoroff setting. The DV-III Ultra stops rotating and the instrument beeps. Pressingany key turns off the beep.
V.4 Set Temperature
The DV-III Ultra can issue temperature control commands when an external temperature controldevice has been connected (see Section V.1). Selecting item #4 Set Temp in the Options menu willdisplay the current setpoint. Enter the new setpoint by using the number keys and accept with theENTER key. The temperature controller will begin using the new setpoint immediately upon thepress of the ENTER key.
Note: The sign of temperature is changed by using the arrow keys when the cursor isunder the ± character. This is possible only with temperature bath controllers.
V.5 Data
The Review Data menu allows data review of the most recently completed speed set program. Datamay be reviewed on the DV-III Ultra screen, on a serial printer, or both. The procedure for reviewingdata after a test is as follows:
1) Run a DV-III or B.E.V.I.S. program.
2) Press the OPTION/TAB key.
3) Press the NUMBER 5 key to display the Review Data screen.
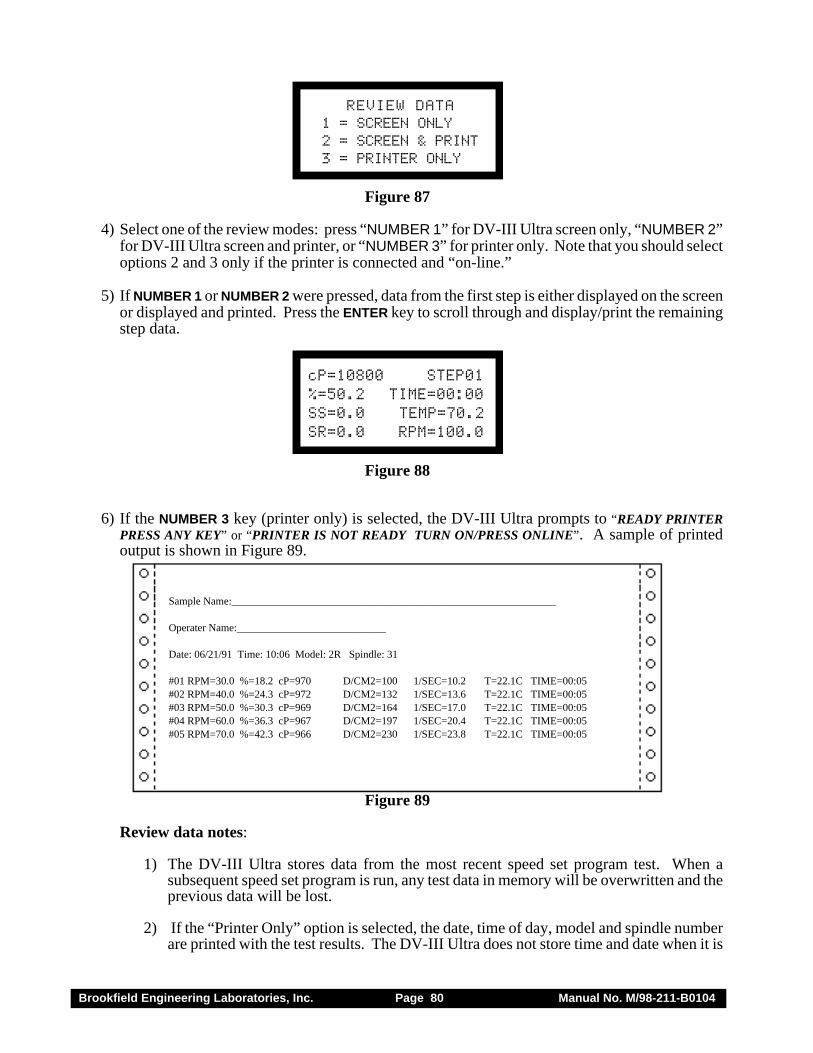
Brookfield Engineering Laboratories, Inc. Page 80 Manual No. M/98-211-B0104
REVIEW DATA1 = SCREEN ONLY2 = SCREEN & PRINT3 = PRINTER ONLY
Figure 87
4) Select one of the review modes: press “NUMBER 1” for DV-III Ultra screen only, “NUMBER 2”for DV-III Ultra screen and printer, or “NUMBER 3” for printer only. Note that you should selectoptions 2 and 3 only if the printer is connected and “on-line.”
5) If NUMBER 1 or NUMBER 2 were pressed, data from the first step is either displayed on the screenor displayed and printed. Press the ENTER key to scroll through and display/print the remainingstep data.
cP=10800 STEP01%=50.2 TIME=00:00SS=0.0 TEMP=70.2SR=0.0 RPM=100.0
Figure 88
6) If the NUMBER 3 key (printer only) is selected, the DV-III Ultra prompts to “READY PRINTERPRESS ANY KEY” or “PRINTER IS NOT READY TURN ON/PRESS ONLINE”. A sample of printedoutput is shown in Figure 89.
Sample Name:_____________________________________________________________
Operater Name:____________________________
Date: 06/21/91 Time: 10:06 Model: 2R Spindle: 31
#01 RPM=30.0 %=18.2 cP=970 D/CM2=100 1/SEC=10.2 T=22.1C TIME=00:05#02 RPM=40.0 %=24.3 cP=972 D/CM2=132 1/SEC=13.6 T=22.1C TIME=00:05#03 RPM=50.0 %=30.3 cP=969 D/CM2=164 1/SEC=17.0 T=22.1C TIME=00:05#04 RPM=60.0 %=36.3 cP=967 D/CM2=197 1/SEC=20.4 T=22.1C TIME=00:05#05 RPM=70.0 %=42.3 cP=966 D/CM2=230 1/SEC=23.8 T=22.1C TIME=00:05
Figure 89
Review data notes:
1) The DV-III Ultra stores data from the most recent speed set program test. When asubsequent speed set program is run, any test data in memory will be overwritten and theprevious data will be lost.
2) If the “Printer Only” option is selected, the date, time of day, model and spindle numberare printed with the test results. The DV-III Ultra does not store time and date when it is
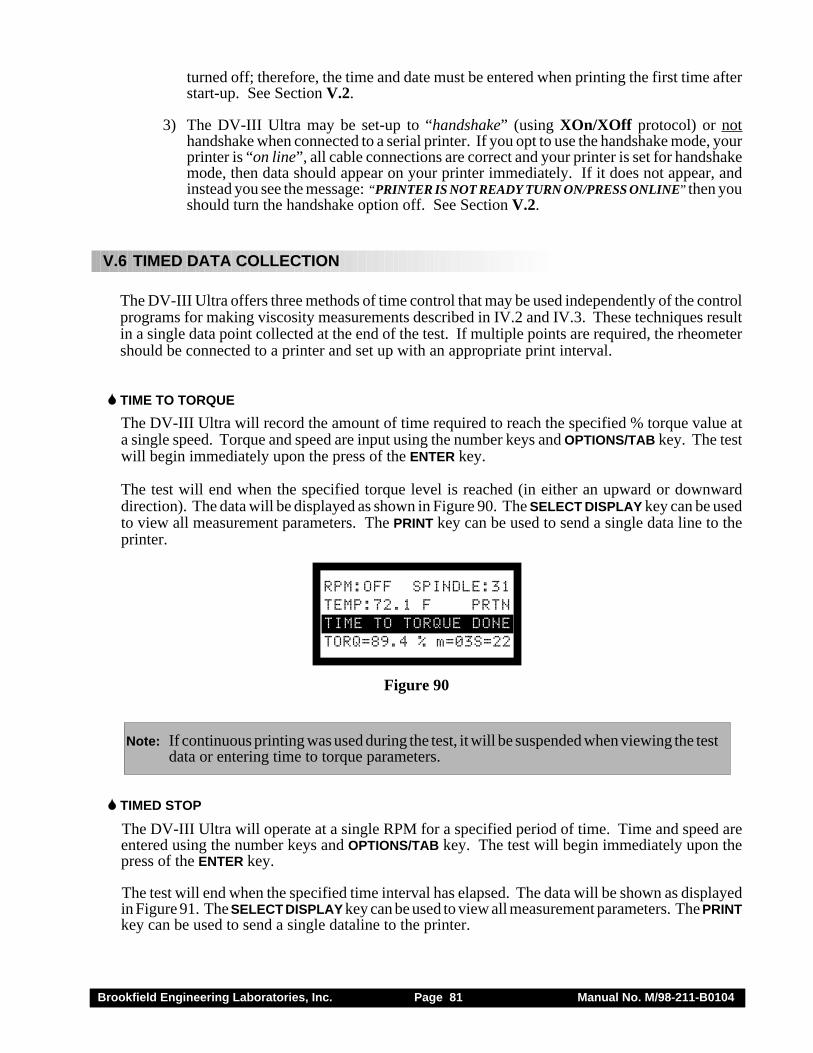
Brookfield Engineering Laboratories, Inc. Page 81 Manual No. M/98-211-B0104
turned off; therefore, the time and date must be entered when printing the first time afterstart-up. See Section V.2.
3) The DV-III Ultra may be set-up to “handshake” (using XOn/XOff protocol) or nothandshake when connected to a serial printer. If you opt to use the handshake mode, yourprinter is “on line”, all cable connections are correct and your printer is set for handshakemode, then data should appear on your printer immediately. If it does not appear, andinstead you see the message: “PRINTER IS NOT READY TURN ON/PRESS ONLINE” then youshould turn the handshake option off. See Section V.2.
V.6 TIMED DATA COLLECTION
The DV-III Ultra offers three methods of time control that may be used independently of the controlprograms for making viscosity measurements described in IV.2 and IV.3. These techniques resultin a single data point collected at the end of the test. If multiple points are required, the rheometershould be connected to a printer and set up with an appropriate print interval.
� TIME TO TORQUE
The DV-III Ultra will record the amount of time required to reach the specified % torque value ata single speed. Torque and speed are input using the number keys and OPTIONS/TAB key. The testwill begin immediately upon the press of the ENTER key.
The test will end when the specified torque level is reached (in either an upward or downwarddirection). The data will be displayed as shown in Figure 90. The SELECT DISPLAY key can be usedto view all measurement parameters. The PRINT key can be used to send a single data line to theprinter.
RPM:OFF SPINDLE:31TEMP:72.1 F PRTNTIME TO TORQUE DONETORQ=89.4 % m=03S=22
Figure 90
Note: If continuous printing was used during the test, it will be suspended when viewing the testdata or entering time to torque parameters.
� TIMED STOP
The DV-III Ultra will operate at a single RPM for a specified period of time. Time and speed areentered using the number keys and OPTIONS/TAB key. The test will begin immediately upon thepress of the ENTER key.
The test will end when the specified time interval has elapsed. The data will be shown as displayedin Figure 91. The SELECT DISPLAY key can be used to view all measurement parameters. The PRINTkey can be used to send a single dataline to the printer.
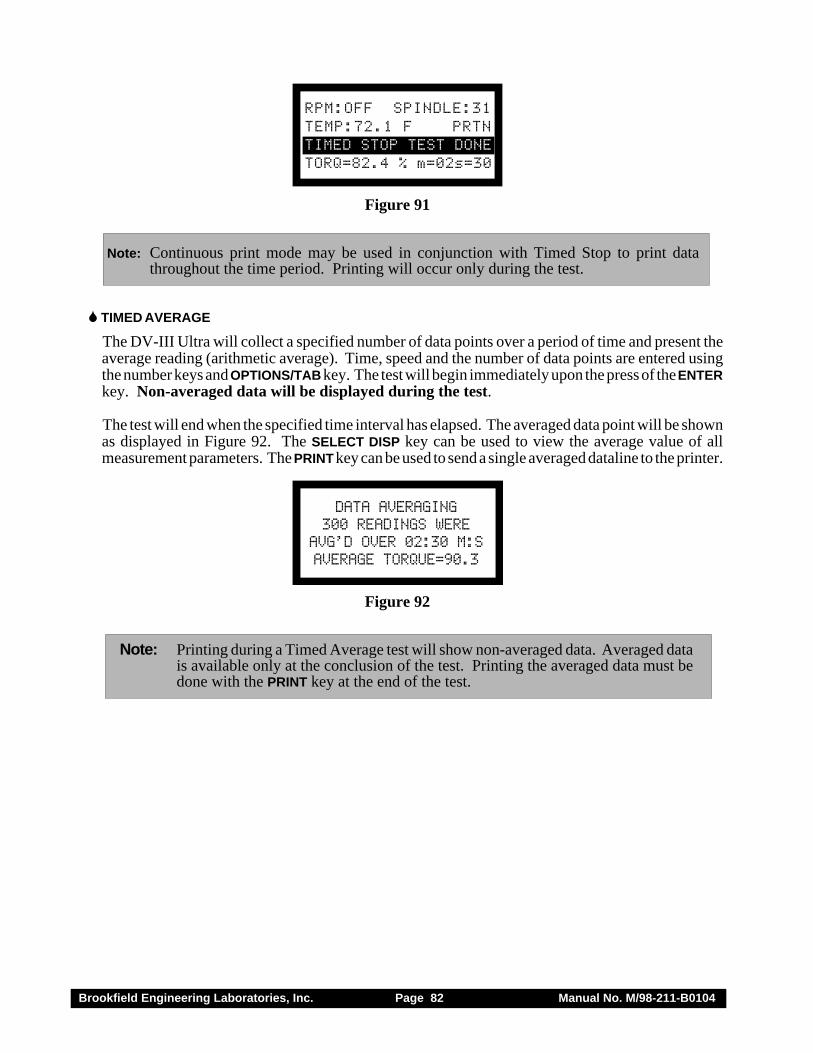
Brookfield Engineering Laboratories, Inc. Page 82 Manual No. M/98-211-B0104
RPM:OFF SPINDLE:31TEMP:72.1 F PRTNTIMED STOP TEST DONETORQ=82.4 % m=02s=30
Figure 91
Note: Continuous print mode may be used in conjunction with Timed Stop to print datathroughout the time period. Printing will occur only during the test.
� TIMED AVERAGE
The DV-III Ultra will collect a specified number of data points over a period of time and present theaverage reading (arithmetic average). Time, speed and the number of data points are entered usingthe number keys and OPTIONS/TAB key. The test will begin immediately upon the press of the ENTERkey. Non-averaged data will be displayed during the test.
The test will end when the specified time interval has elapsed. The averaged data point will be shownas displayed in Figure 92. The SELECT DISP key can be used to view the average value of allmeasurement parameters. The PRINT key can be used to send a single averaged dataline to the printer.
DATA AVERAGING300 READINGS WERE
AVG’D OVER 02:30 M:SAVERAGE TORQUE=90.3
Figure 92
Note: Printing during a Timed Average test will show non-averaged data. Averaged datais available only at the conclusion of the test. Printing the averaged data must bedone with the PRINT key at the end of the test.
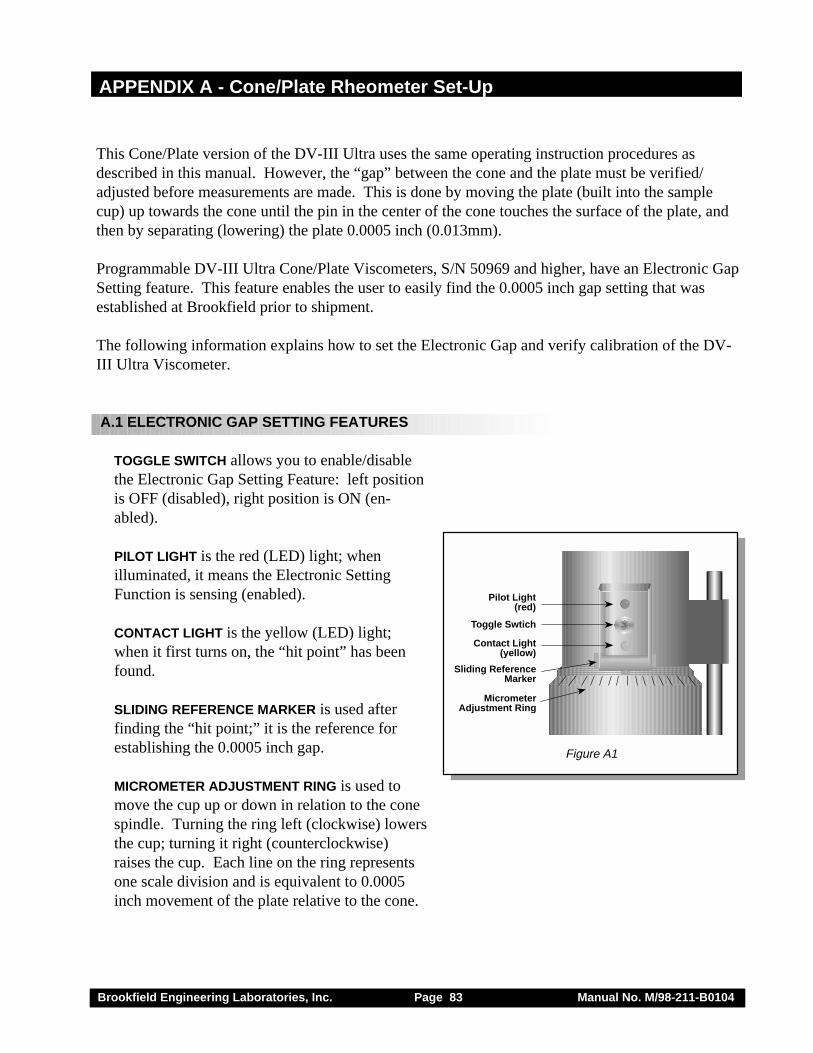
Brookfield Engineering Laboratories, Inc. Page 83 Manual No. M/98-211-B0104
This Cone/Plate version of the DV-III Ultra uses the same operating instruction procedures asdescribed in this manual. However, the “gap” between the cone and the plate must be verified/adjusted before measurements are made. This is done by moving the plate (built into the samplecup) up towards the cone until the pin in the center of the cone touches the surface of the plate, andthen by separating (lowering) the plate 0.0005 inch (0.013mm).
Programmable DV-III Ultra Cone/Plate Viscometers, S/N 50969 and higher, have an Electronic GapSetting feature. This feature enables the user to easily find the 0.0005 inch gap setting that wasestablished at Brookfield prior to shipment.
The following information explains how to set the Electronic Gap and verify calibration of the DV-III Ultra Viscometer.
A.1 ELECTRONIC GAP SETTING FEATURES
TOGGLE SWITCH allows you to enable/disablethe Electronic Gap Setting Feature: left positionis OFF (disabled), right position is ON (en-abled).
PILOT LIGHT is the red (LED) light; whenilluminated, it means the Electronic SettingFunction is sensing (enabled).
CONTACT LIGHT is the yellow (LED) light;when it first turns on, the “hit point” has beenfound.
SLIDING REFERENCE MARKER is used afterfinding the “hit point;” it is the reference forestablishing the 0.0005 inch gap.
MICROMETER ADJUSTMENT RING is used tomove the cup up or down in relation to the conespindle. Turning the ring left (clockwise) lowersthe cup; turning it right (counterclockwise)raises the cup. Each line on the ring representsone scale division and is equivalent to 0.0005inch movement of the plate relative to the cone.
APPENDIX A - Cone/Plate Rheometer Set-Up
Pilot Light(red)
Toggle Swtich
Contact Light(yellow)
Sliding ReferenceMarker
MicrometerAdjustment Ring
Figure A1
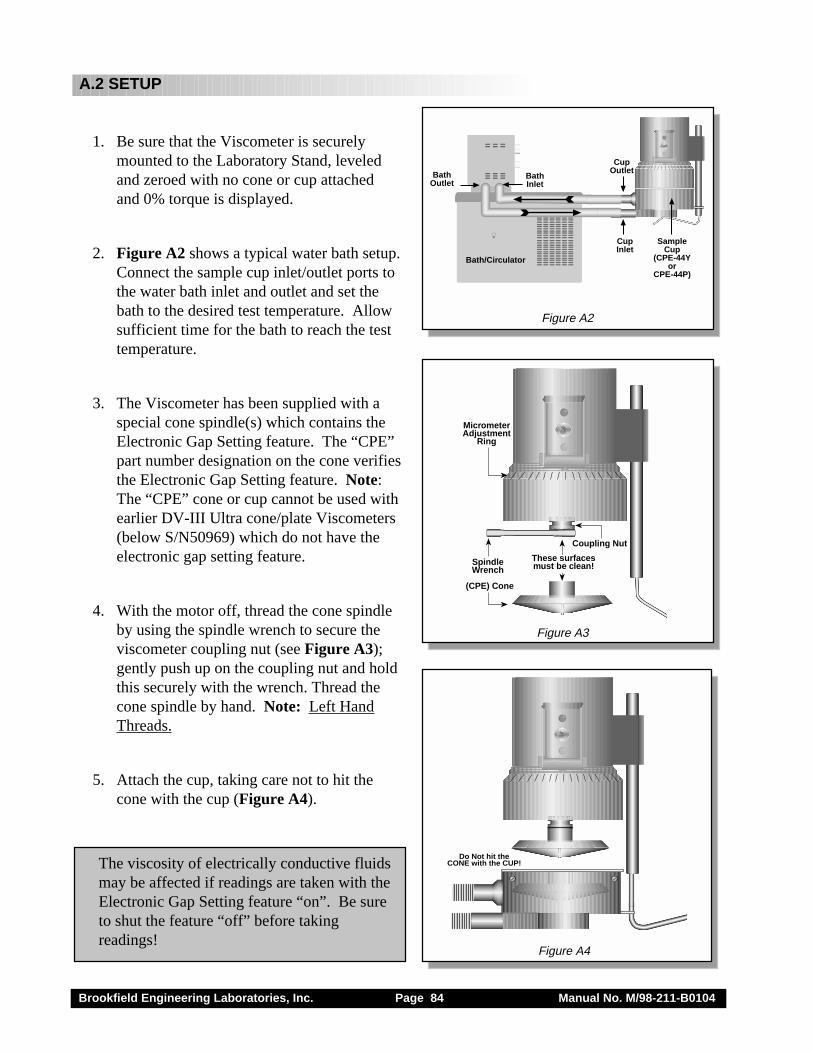
Brookfield Engineering Laboratories, Inc. Page 84 Manual No. M/98-211-B0104
Bath/Circulator
BathInlet
BathOutlet
SampleCup
(CPE-44Yor
CPE-44P)
CupOutlet
CupInlet
Figure A2
Figure A3
SpindleWrench
(CPE) Cone
These surfacesmust be clean!
Coupling Nut
MicrometerAdjustment
Ring
Do Not hit theCONE with the CUP!
Figure A4
A.2 SETUP
1. Be sure that the Viscometer is securelymounted to the Laboratory Stand, leveledand zeroed with no cone or cup attachedand 0% torque is displayed.
2. Figure A2 shows a typical water bath setup.Connect the sample cup inlet/outlet ports tothe water bath inlet and outlet and set thebath to the desired test temperature. Allowsufficient time for the bath to reach the testtemperature.
3. The Viscometer has been supplied with aspecial cone spindle(s) which contains theElectronic Gap Setting feature. The “CPE”part number designation on the cone verifiesthe Electronic Gap Setting feature. Note:The “CPE” cone or cup cannot be used withearlier DV-III Ultra cone/plate Viscometers(below S/N50969) which do not have theelectronic gap setting feature.
4. With the motor off, thread the cone spindleby using the spindle wrench to secure theviscometer coupling nut (see Figure A3);gently push up on the coupling nut and holdthis securely with the wrench. Thread thecone spindle by hand. Note: Left HandThreads.
5. Attach the cup, taking care not to hit thecone with the cup (Figure A4).
The viscosity of electrically conductive fluidsmay be affected if readings are taken with theElectronic Gap Setting feature “on”. Be sureto shut the feature “off” before takingreadings!
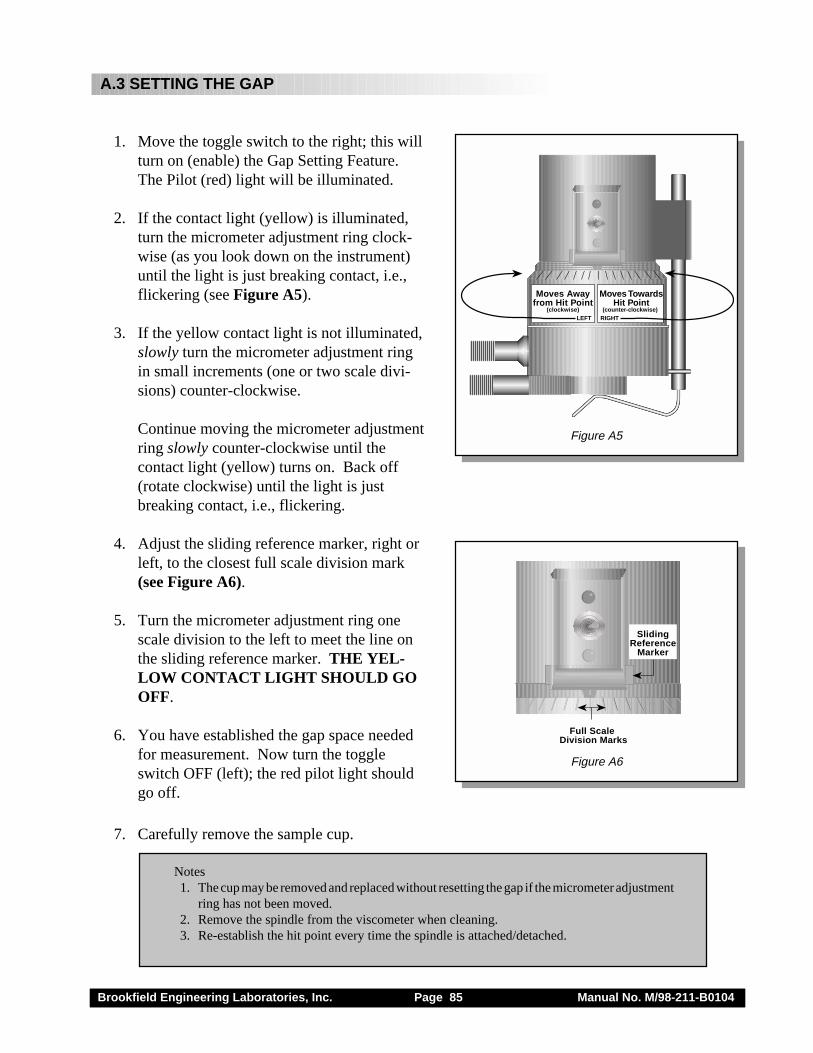
Brookfield Engineering Laboratories, Inc. Page 85 Manual No. M/98-211-B0104
A.3 SETTING THE GAP
1. Move the toggle switch to the right; this willturn on (enable) the Gap Setting Feature.The Pilot (red) light will be illuminated.
2. If the contact light (yellow) is illuminated,turn the micrometer adjustment ring clock-wise (as you look down on the instrument)until the light is just breaking contact, i.e.,flickering (see Figure A5).
3. If the yellow contact light is not illuminated,slowly turn the micrometer adjustment ringin small increments (one or two scale divi-sions) counter-clockwise.
Continue moving the micrometer adjustmentring slowly counter-clockwise until thecontact light (yellow) turns on. Back off(rotate clockwise) until the light is justbreaking contact, i.e., flickering.
4. Adjust the sliding reference marker, right orleft, to the closest full scale division mark(see Figure A6).
5. Turn the micrometer adjustment ring onescale division to the left to meet the line onthe sliding reference marker. THE YEL-LOW CONTACT LIGHT SHOULD GOOFF.
6. You have established the gap space neededfor measurement. Now turn the toggleswitch OFF (left); the red pilot light shouldgo off.
7. Carefully remove the sample cup.
Moves Awayfrom Hit Point
(clockwise) LEFTx
Moves Towards Hit Point
(counter-clockwise) RIGHT
Full Scale Division Marks
SlidingReference
Marker
Figure A5
Figure A6
Notes1. The cup may be removed and replaced without resetting the gap if the micrometer adjustment
ring has not been moved.2. Remove the spindle from the viscometer when cleaning.3. Re-establish the hit point every time the spindle is attached/detached.
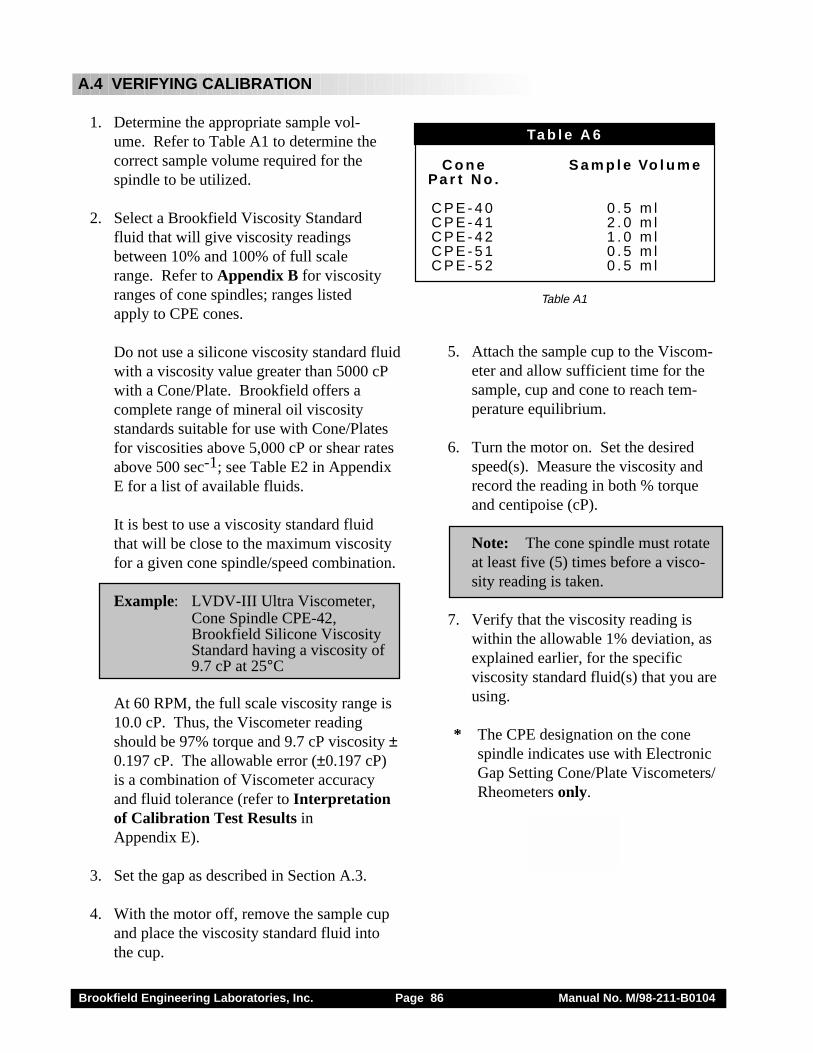
Brookfield Engineering Laboratories, Inc. Page 86 Manual No. M/98-211-B0104
C o n e S a m p l e Vo l u m ePa r t N o .
C P E - 4 0 0 . 5 m lC P E - 4 1 2 . 0 m lC P E - 4 2 1 . 0 m lC P E - 5 1 0 . 5 m lC P E - 5 2 0 . 5 m l
Ta b l e A 6
5. Attach the sample cup to the Viscom-eter and allow sufficient time for thesample, cup and cone to reach tem-perature equilibrium.
6. Turn the motor on. Set the desiredspeed(s). Measure the viscosity andrecord the reading in both % torqueand centipoise (cP).
Note: The cone spindle must rotateat least five (5) times before a visco-sity reading is taken.
7. Verify that the viscosity reading iswithin the allowable 1% deviation, asexplained earlier, for the specificviscosity standard fluid(s) that you areusing.
* The CPE designation on the conespindle indicates use with ElectronicGap Setting Cone/Plate Viscometers/Rheometers only.
A.4 VERIFYING CALIBRATION
1. Determine the appropriate sample vol-ume. Refer to Table A1 to determine thecorrect sample volume required for thespindle to be utilized.
2. Select a Brookfield Viscosity Standardfluid that will give viscosity readingsbetween 10% and 100% of full scalerange. Refer to Appendix B for viscosityranges of cone spindles; ranges listedapply to CPE cones.
Do not use a silicone viscosity standard fluidwith a viscosity value greater than 5000 cPwith a Cone/Plate. Brookfield offers acomplete range of mineral oil viscositystandards suitable for use with Cone/Platesfor viscosities above 5,000 cP or shear ratesabove 500 sec-1; see Table E2 in AppendixE for a list of available fluids.
It is best to use a viscosity standard fluidthat will be close to the maximum viscosityfor a given cone spindle/speed combination.
Example: LVDV-III Ultra Viscometer,Cone Spindle CPE-42,Brookfield Silicone ViscosityStandard having a viscosity of9.7 cP at 25°C
At 60 RPM, the full scale viscosity range is10.0 cP. Thus, the Viscometer readingshould be 97% torque and 9.7 cP viscosity ±0.197 cP. The allowable error (±0.197 cP)is a combination of Viscometer accuracyand fluid tolerance (refer to Interpretationof Calibration Test Results inAppendix E).
3. Set the gap as described in Section A.3.
4. With the motor off, remove the sample cupand place the viscosity standard fluid intothe cup.
Table A1
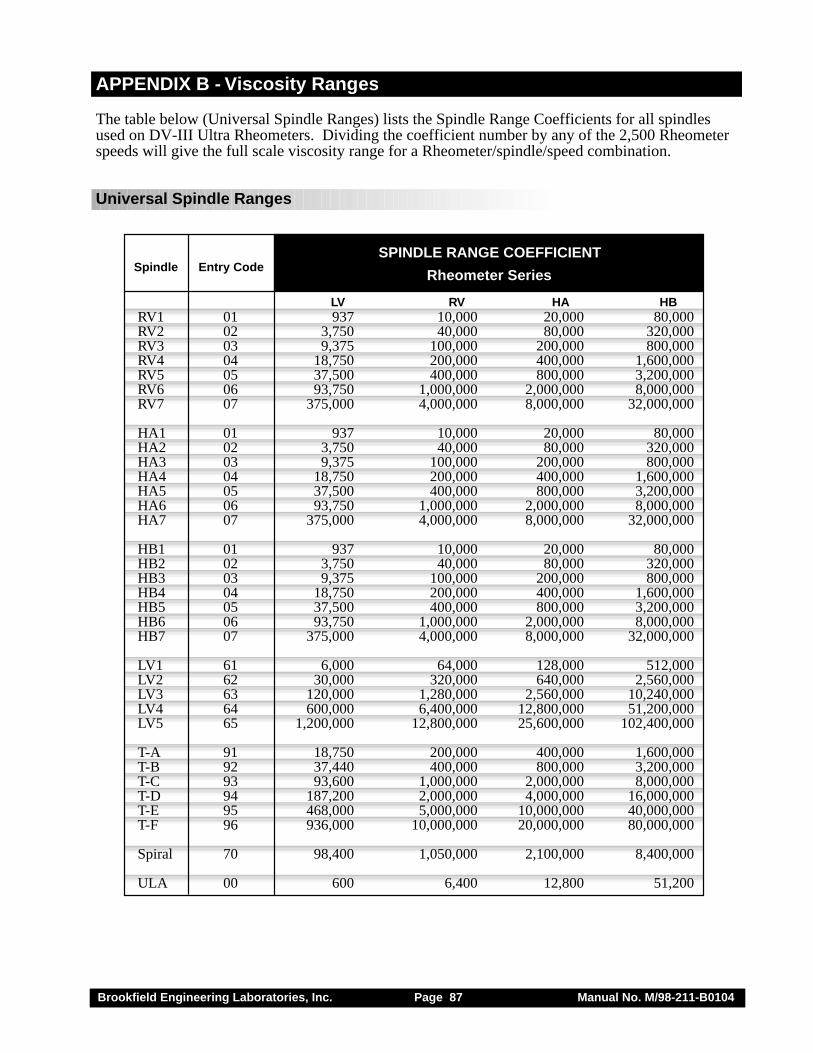
Brookfield Engineering Laboratories, Inc. Page 87 Manual No. M/98-211-B0104
APPENDIX B - Viscosity Ranges
The table below (Universal Spindle Ranges) lists the Spindle Range Coefficients for all spindlesused on DV-III Ultra Rheometers. Dividing the coefficient number by any of the 2,500 Rheometerspeeds will give the full scale viscosity range for a Rheometer/spindle/speed combination.
Universal Spindle Ranges
RV1 01 937 10,000 20,000 80,000RV2 02 3,750 40,000 80,000 320,000RV3 03 9,375 100,000 200,000 800,000RV4 04 18,750 200,000 400,000 1,600,000RV5 05 37,500 400,000 800,000 3,200,000RV6 06 93,750 1,000,000 2,000,000 8,000,000RV7 07 375,000 4,000,000 8,000,000 32,000,000
HA1 01 937 10,000 20,000 80,000HA2 02 3,750 40,000 80,000 320,000HA3 03 9,375 100,000 200,000 800,000HA4 04 18,750 200,000 400,000 1,600,000HA5 05 37,500 400,000 800,000 3,200,000HA6 06 93,750 1,000,000 2,000,000 8,000,000HA7 07 375,000 4,000,000 8,000,000 32,000,000
HB1 01 937 10,000 20,000 80,000HB2 02 3,750 40,000 80,000 320,000HB3 03 9,375 100,000 200,000 800,000HB4 04 18,750 200,000 400,000 1,600,000HB5 05 37,500 400,000 800,000 3,200,000HB6 06 93,750 1,000,000 2,000,000 8,000,000HB7 07 375,000 4,000,000 8,000,000 32,000,000
LV1 61 6,000 64,000 128,000 512,000LV2 62 30,000 320,000 640,000 2,560,000LV3 63 120,000 1,280,000 2,560,000 10,240,000LV4 64 600,000 6,400,000 12,800,000 51,200,000LV5 65 1,200,000 12,800,000 25,600,000 102,400,000
T-A 91 18,750 200,000 400,000 1,600,000T-B 92 37,440 400,000 800,000 3,200,000T-C 93 93,600 1,000,000 2,000,000 8,000,000T-D 94 187,200 2,000,000 4,000,000 16,000,000T-E 95 468,000 5,000,000 10,000,000 40,000,000T-F 96 936,000 10,000,000 20,000,000 80,000,000
Spiral 70 98,400 1,050,000 2,100,000 8,400,000
ULA 00 600 6,400 12,800 51,200
Spindle Entry Code
LV RV HA HB
SPINDLE RANGE COEFFICIENT
Rheometer Series
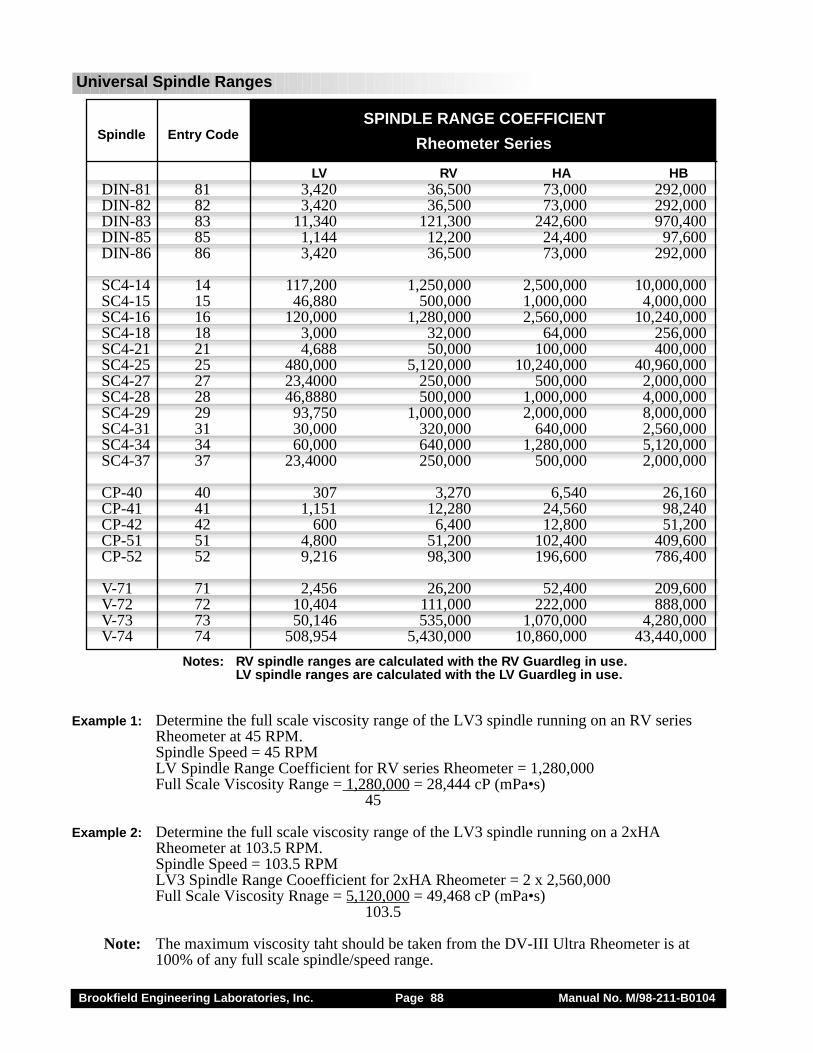
Brookfield Engineering Laboratories, Inc. Page 88 Manual No. M/98-211-B0104
Universal Spindle Ranges
Example 1: Determine the full scale viscosity range of the LV3 spindle running on an RV seriesRheometer at 45 RPM.Spindle Speed = 45 RPMLV Spindle Range Coefficient for RV series Rheometer = 1,280,000Full Scale Viscosity Range = 1,280,000 = 28,444 cP (mPa•s)
45
Example 2: Determine the full scale viscosity range of the LV3 spindle running on a 2xHARheometer at 103.5 RPM.Spindle Speed = 103.5 RPMLV3 Spindle Range Cooefficient for 2xHA Rheometer = 2 x 2,560,000Full Scale Viscosity Rnage = 5,120,000 = 49,468 cP (mPa•s)
103.5
Note: The maximum viscosity taht should be taken from the DV-III Ultra Rheometer is at100% of any full scale spindle/speed range.
DIN-81 81 3,420 36,500 73,000 292,000DIN-82 82 3,420 36,500 73,000 292,000DIN-83 83 11,340 121,300 242,600 970,400DIN-85 85 1,144 12,200 24,400 97,600DIN-86 86 3,420 36,500 73,000 292,000
SC4-14 14 117,200 1,250,000 2,500,000 10,000,000SC4-15 15 46,880 500,000 1,000,000 4,000,000SC4-16 16 120,000 1,280,000 2,560,000 10,240,000SC4-18 18 3,000 32,000 64,000 256,000SC4-21 21 4,688 50,000 100,000 400,000SC4-25 25 480,000 5,120,000 10,240,000 40,960,000SC4-27 27 23,4000 250,000 500,000 2,000,000SC4-28 28 46,8880 500,000 1,000,000 4,000,000SC4-29 29 93,750 1,000,000 2,000,000 8,000,000SC4-31 31 30,000 320,000 640,000 2,560,000SC4-34 34 60,000 640,000 1,280,000 5,120,000SC4-37 37 23,4000 250,000 500,000 2,000,000
CP-40 40 307 3,270 6,540 26,160CP-41 41 1,151 12,280 24,560 98,240CP-42 42 600 6,400 12,800 51,200CP-51 51 4,800 51,200 102,400 409,600CP-52 52 9,216 98,300 196,600 786,400
V-71 71 2,456 26,200 52,400 209,600V-72 72 10,404 111,000 222,000 888,000V-73 73 50,146 535,000 1,070,000 4,280,000V-74 74 508,954 5,430,000 10,860,000 43,440,000
Spindle Entry Code
LV RV HA HB
SPINDLE RANGE COEFFICIENT
Rheometer Series
Notes: RV spindle ranges are calculated with the RV Guardleg in use.LV spindle ranges are calculated with the LV Guardleg in use.
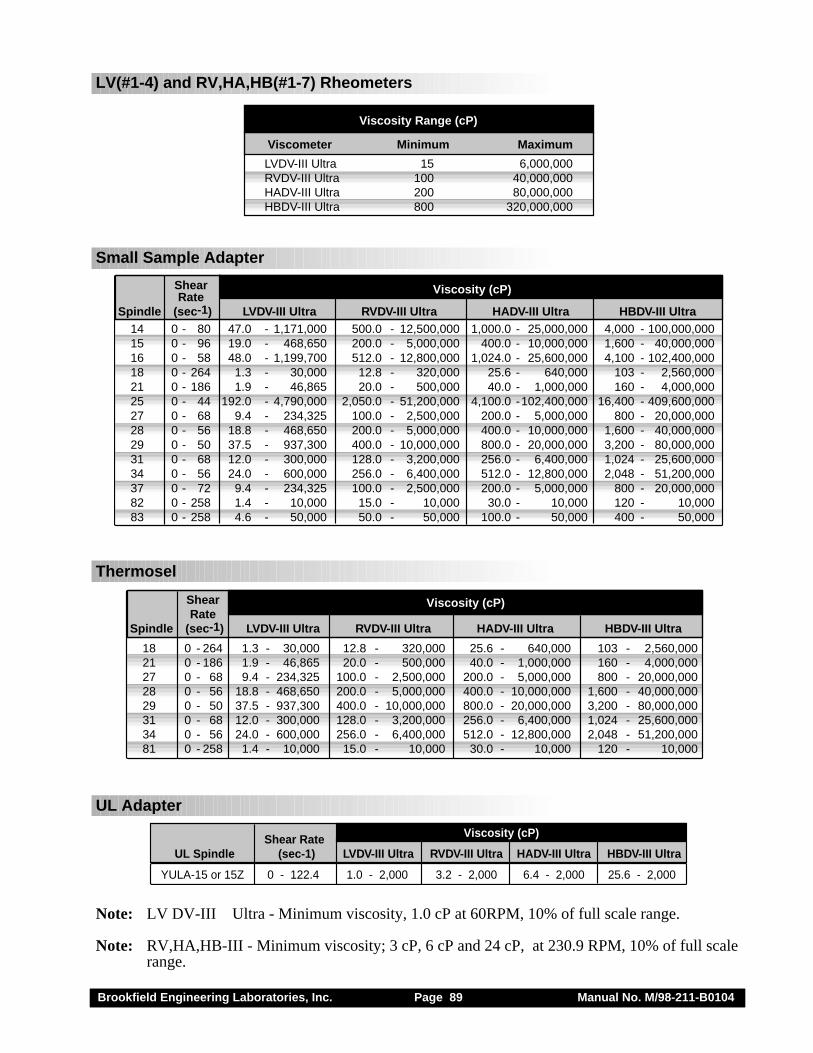
Brookfield Engineering Laboratories, Inc. Page 89 Manual No. M/98-211-B0104
LV(#1-4) and RV,HA,HB(#1-7) Rheometers
Viscosity Range (cP)
Viscometer Minimum Maximum
LVDV-III Ultra 15 6,000,000 RVDV-III Ultra 100 40,000,000 HADV-III Ultra 200 80,000,000 HBDV-III Ultra 800 320,000,000
Small Sample Adapter
ShearRate
Spindle (sec-1) LVDV-III Ultra RVDV-III Ultra HADV-III Ultra HBDV-III Ultra14 0 - 80 47.0 - 1,171,000 500.0 - 12,500,000 1,000.0 - 25,000,000 4,000 - 100,000,00015 0 - 96 19.0 - 468,650 200.0 - 5,000,000 400.0 - 10,000,000 1,600 - 40,000,00016 0 - 58 48.0 - 1,199,700 512.0 - 12,800,000 1,024.0 - 25,600,000 4,100 - 102,400,00018 0 - 264 1.3 - 30,000 12.8 - 320,000 25.6 - 640,000 103 - 2,560,00021 0 - 186 1.9 - 46,865 20.0 - 500,000 40.0 - 1,000,000 160 - 4,000,00025 0 - 44 192.0 - 4,790,000 2,050.0 - 51,200,000 4,100.0 -102,400,000 16,400 - 409,600,00027 0 - 68 9.4 - 234,325 100.0 - 2,500,000 200.0 - 5,000,000 800 - 20,000,00028 0 - 56 18.8 - 468,650 200.0 - 5,000,000 400.0 - 10,000,000 1,600 - 40,000,00029 0 - 50 37.5 - 937,300 400.0 - 10,000,000 800.0 - 20,000,000 3,200 - 80,000,00031 0 - 68 12.0 - 300,000 128.0 - 3,200,000 256.0 - 6,400,000 1,024 - 25,600,00034 0 - 56 24.0 - 600,000 256.0 - 6,400,000 512.0 - 12,800,000 2,048 - 51,200,00037 0 - 72 9.4 - 234,325 100.0 - 2,500,000 200.0 - 5,000,000 800 - 20,000,00082 0 - 258 1.4 - 10,000 15.0 - 10,000 30.0 - 10,000 120 - 10,00083 0 - 258 4.6 - 50,000 50.0 - 50,000 100.0 - 50,000 400 - 50,000
Viscosity (cP)
Thermosel
18 0 - 264 1.3 - 30,000 12.8 - 320,000 25.6 - 640,000 103 - 2,560,00021 0 - 186 1.9 - 46,865 20.0 - 500,000 40.0 - 1,000,000 160 - 4,000,00027 0 - 68 9.4 - 234,325 100.0 - 2,500,000 200.0 - 5,000,000 800 - 20,000,00028 0 - 56 18.8 - 468,650 200.0 - 5,000,000 400.0 - 10,000,000 1,600 - 40,000,00029 0 - 50 37.5 - 937,300 400.0 - 10,000,000 800.0 - 20,000,000 3,200 - 80,000,00031 0 - 68 12.0 - 300,000 128.0 - 3,200,000 256.0 - 6,400,000 1,024 - 25,600,00034 0 - 56 24.0 - 600,000 256.0 - 6,400,000 512.0 - 12,800,000 2,048 - 51,200,00081 0 - 258 1.4 - 10,000 15.0 - 10,000 30.0 - 10,000 120 - 10,000
ShearRate
Spindle (sec-1) LVDV-III Ultra RVDV-III Ultra HADV-III Ultra HBDV-III Ultra
Viscosity (cP)
UL Adapter
Viscosity (cP)Shear RateUL Spindle (sec-1) LVDV-III Ultra RVDV-III Ultra HADV-III Ultra HBDV-III Ultra
YULA-15 or 15Z 0 - 122.4 1.0 - 2,000 3.2 - 2,000 6.4 - 2,000 25.6 - 2,000
Note: LV DV-III Ultra - Minimum viscosity, 1.0 cP at 60RPM, 10% of full scale range.
Note: RV,HA,HB-III - Minimum viscosity; 3 cP, 6 cP and 24 cP, at 230.9 RPM, 10% of full scalerange.
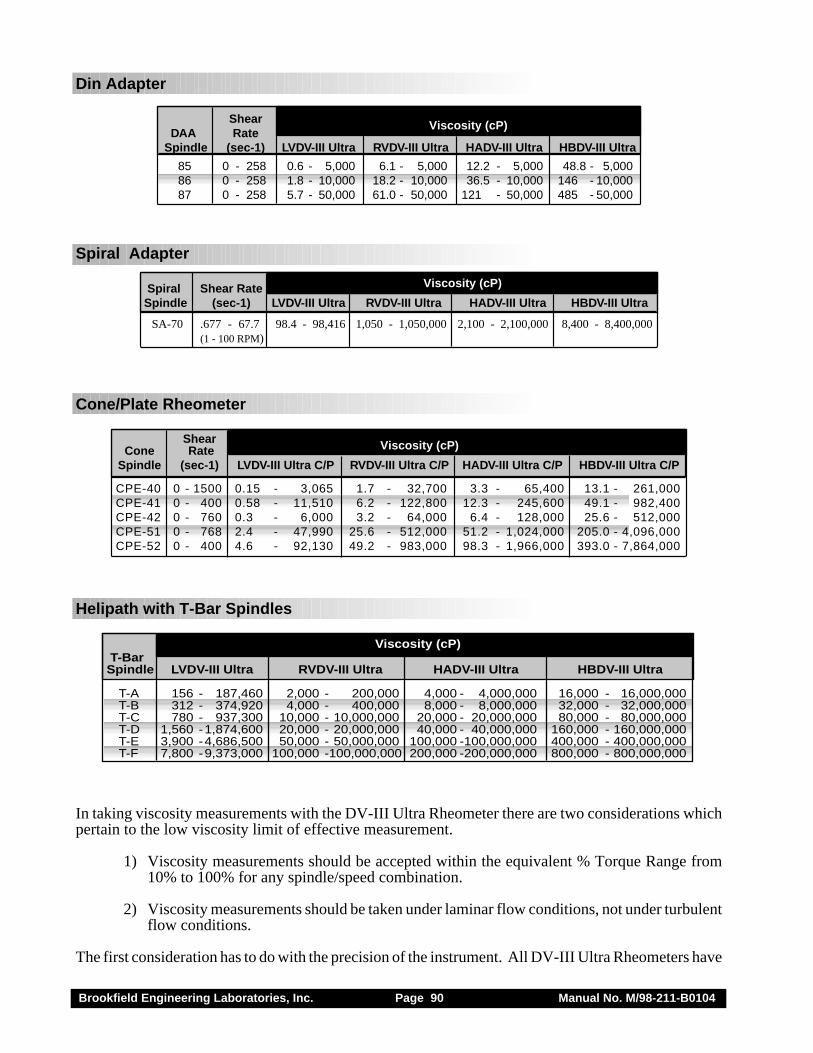
Brookfield Engineering Laboratories, Inc. Page 90 Manual No. M/98-211-B0104
Din Adapter
ShearDAA Rate
Spindle (sec-1) LVDV-III Ultra RVDV-III Ultra HADV-III Ultra HBDV-III Ultra
Viscosity (cP)
85 0 - 258 0.6 - 5,000 6.1 - 5,000 12.2 - 5,000 48.8 - 5,00086 0 - 258 1.8 - 10,000 18.2 - 10,000 36.5 - 10,000 146 - 10,00087 0 - 258 5.7 - 50,000 61.0 - 50,000 121 - 50,000 485 - 50,000
Spiral Adapter
Spiral Shear RateSpindle (sec-1) LVDV-III Ultra RVDV-III Ultra HADV-III Ultra HBDV-III Ultra
SA-70 .677 - 67.7 98.4 - 98,416 1,050 - 1,050,000 2,100 - 2,100,000 8,400 - 8,400,000(1 - 100 RPM)
Viscosity (cP)
Cone/Plate Rheometer
Shear Cone Rate Spindle (sec-1) LVDV-III Ultra C/P RVDV-III Ultra C/P HADV-III Ultra C/P HBDV-III Ultra C/P
Viscosity (cP)
CPE-40 0 - 1500 0.15 - 3,065 1.7 - 32,700 3.3 - 65,400 13.1 - 261,000CPE-41 0 - 400 0.58 - 11,510 6.2 - 122,800 12.3 - 245,600 49.1 - 982,400CPE-42 0 - 760 0.3 - 6,000 3.2 - 64,000 6.4 - 128,000 25.6 - 512,000CPE-51 0 - 768 2.4 - 47,990 25.6 - 512,000 51.2 - 1,024,000 205.0 - 4,096,000CPE-52 0 - 400 4.6 - 92,130 49.2 - 983,000 98.3 - 1,966,000 393.0 - 7,864,000
Helipath with T-Bar Spindles
T-Bar Spindle LVDV-III Ultra RVDV-III Ultra HADV-III Ultra HBDV-III Ultra
T-A 156 - 187,460 2,000 - 200,000 4,000 - 4,000,000 16,000 - 16,000,000T-B 312 - 374,920 4,000 - 400,000 8,000 - 8,000,000 32,000 - 32,000,000T-C 780 - 937,300 10,000 - 10,000,000 20,000 - 20,000,000 80,000 - 80,000,000T-D 1,560 -1,874,600 20,000 - 20,000,000 40,000 - 40,000,000 160,000 - 160,000,000T-E 3,900 -4,686,500 50,000 - 50,000,000 100,000 -100,000,000 400,000 - 400,000,000T-F 7,800 -9,373,000 100,000 -100,000,000 200,000 -200,000,000 800,000 - 800,000,000
Viscosity (cP)
In taking viscosity measurements with the DV-III Ultra Rheometer there are two considerations whichpertain to the low viscosity limit of effective measurement.
1) Viscosity measurements should be accepted within the equivalent % Torque Range from10% to 100% for any spindle/speed combination.
2) Viscosity measurements should be taken under laminar flow conditions, not under turbulentflow conditions.
The first consideration has to do with the precision of the instrument. All DV-III Ultra Rheometers have
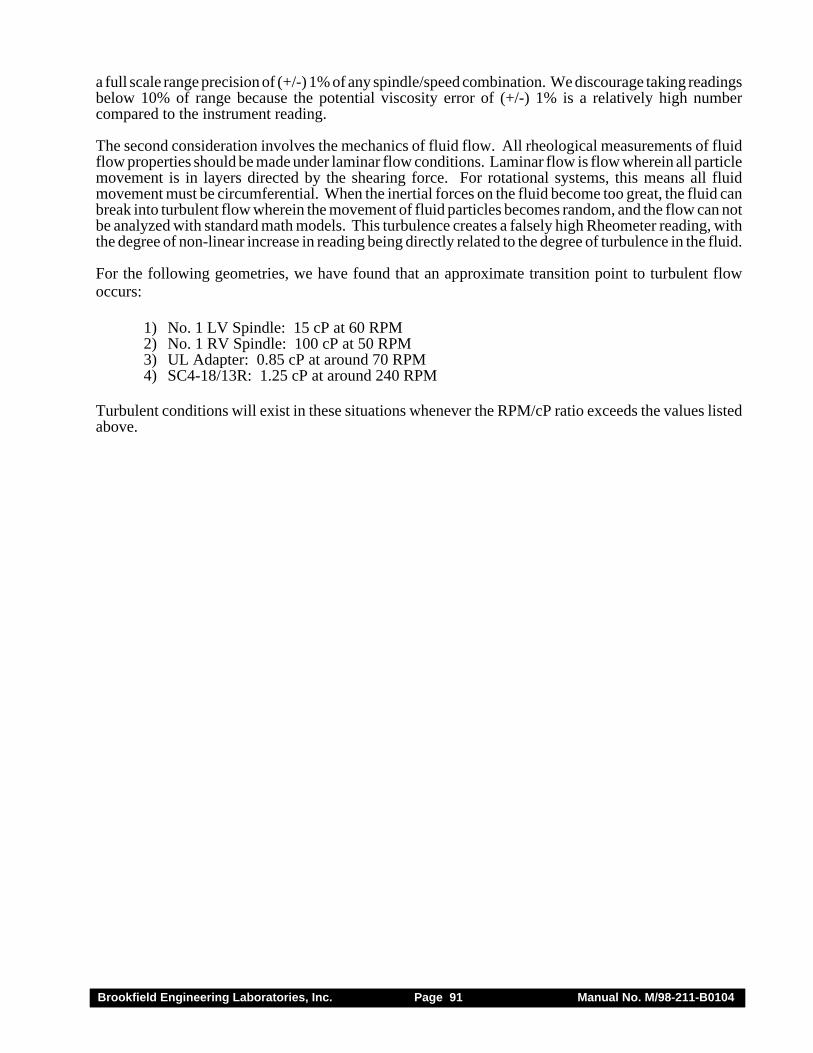
Brookfield Engineering Laboratories, Inc. Page 91 Manual No. M/98-211-B0104
a full scale range precision of (+/-) 1% of any spindle/speed combination. We discourage taking readingsbelow 10% of range because the potential viscosity error of (+/-) 1% is a relatively high numbercompared to the instrument reading.
The second consideration involves the mechanics of fluid flow. All rheological measurements of fluidflow properties should be made under laminar flow conditions. Laminar flow is flow wherein all particlemovement is in layers directed by the shearing force. For rotational systems, this means all fluidmovement must be circumferential. When the inertial forces on the fluid become too great, the fluid canbreak into turbulent flow wherein the movement of fluid particles becomes random, and the flow can notbe analyzed with standard math models. This turbulence creates a falsely high Rheometer reading, withthe degree of non-linear increase in reading being directly related to the degree of turbulence in the fluid.
For the following geometries, we have found that an approximate transition point to turbulent flowoccurs:
1) No. 1 LV Spindle: 15 cP at 60 RPM2) No. 1 RV Spindle: 100 cP at 50 RPM3) UL Adapter: 0.85 cP at around 70 RPM4) SC4-18/13R: 1.25 cP at around 240 RPM
Turbulent conditions will exist in these situations whenever the RPM/cP ratio exceeds the values listedabove.
Brookfield Engineering Laboratories, Inc. Page 92 Manual No. M/98-211-B0104
APPENDIX C - Variables in Viscosity Measurements
As with any instrument, there are variables that can affect a viscosity measurement. These variables maybe related to the instrument (Rheometer) or the test fluid. Variables related to the test fluid deal with therheological properties of the fluid, while instrument variables would include the Rheometer design andthe spindle geometry system utilized.
RHEOLOGICAL PROPERTIES
Fluids have different rheological characteristics that can be described by Rheometer measurements.We can then work with these fluids to suit our lab or process conditions.
There are two categories of fluids:
Newtonian - These fluids have the same viscosity at different Shear Rates (differentRPM’s) and are called Newtonian over the Shear Rate range they aremeasured.
Non-Newtonian - These fluids have different viscosities at different shear rates (differentRPM’s). They fall into two groups:
1) Time Independent non-Newtonian2) Time Dependent non-Newtonian
The time dependency is the time they are held at a given Shear Rate (RPM).They are non-Newtonian, and when you change the Rheometer spindlespeed, you get a different viscosity.
Time Independent
Pseudoplastic - A pseudoplastic material displays a decrease in viscosity with an increasein shear rate, and is also known as “shear thinning”. If you take Rheometerreadings from a low to a high RPM and then back to the low RPM, and thereadings fall upon themselves, the material is time independent pseudoplasticand shear thinning.
Time Dependent
Thixotropic - A thixotropic material has decreasing viscosity under constant shear rate. Ifyou set a Rheometer at a constant speed, recording viscosity (cP) values overtime and find that the viscosity (cP) values decrease with time, the materialis thixotropic.
Brookfield publication, “More Solutions to Sticky Problems” includes a more detailed discussion ofrheological properties and non-Newtonian behavior.
Rheometer Related Variables
Most fluid viscosities are found to be non-Newtonian. They are Shear Rate dependent on themeasurement conditions. The specifications of the Rheometer spindle and chamber geometry will affectthe viscosity readings. If one reading is taken at 25 rpm, and a second at 50 rpm, the two viscosity (cP)values produced will be different because the readings were made at different shear rates. The faster thespindle speed, the higher the shear rate.
The shear rate of a given measurement is determined by: the rotational speed of the spindle, the size andshape of the spindle, the size and shape of the container used, and therefore, the distance between thecontainer wall and the spindle surface.

Brookfield Engineering Laboratories, Inc. Page 93 Manual No. M/98-211-B0104
A repeatable viscosity test should control or specify the following:
1) Test temperature2) Sample container size (or spindle/chamber geometry)3) Sample volume4) Rheometer model5) Spindle used (if using LVDV-III Ultra(#1-4) or RVDV-III Ultra(#1-7) attach the guard leg)6) Test speed or speeds (or the shear rate)7) Length of time or number of spindle revolutions to record viscosity.
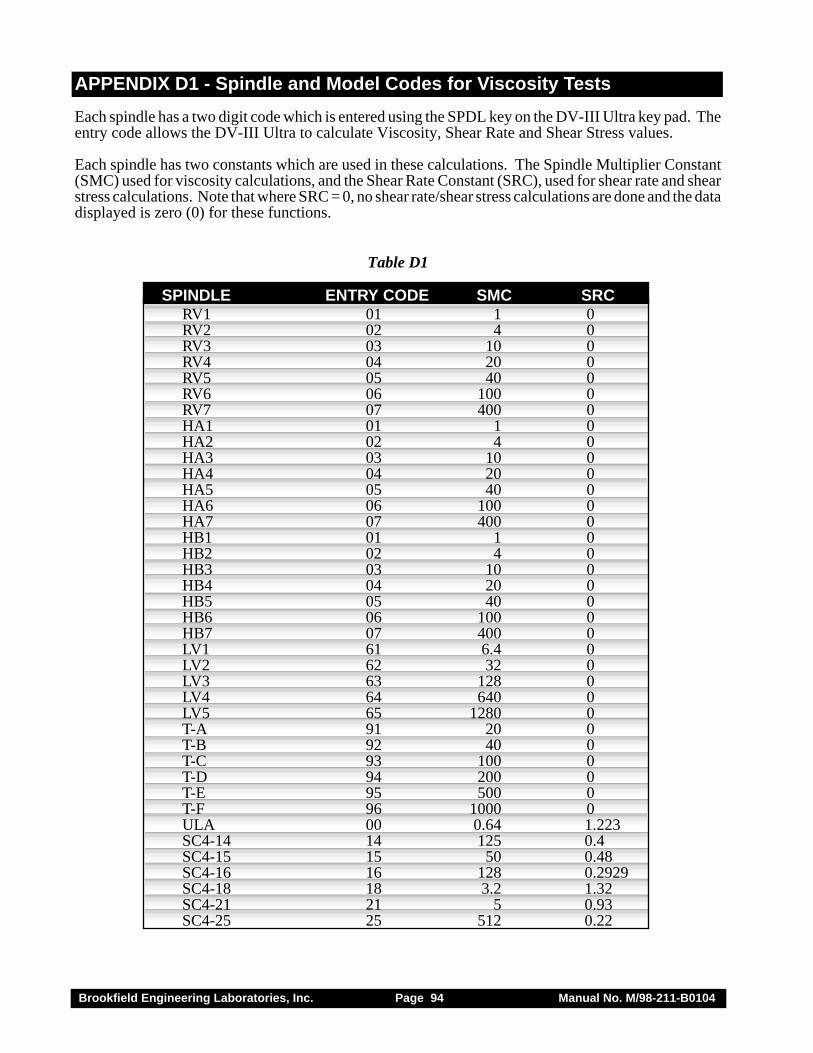
Brookfield Engineering Laboratories, Inc. Page 94 Manual No. M/98-211-B0104
APPENDIX D1 - Spindle and Model Codes for Viscosity Tests
Each spindle has a two digit code which is entered using the SPDL key on the DV-III Ultra key pad. Theentry code allows the DV-III Ultra to calculate Viscosity, Shear Rate and Shear Stress values.
Each spindle has two constants which are used in these calculations. The Spindle Multiplier Constant(SMC) used for viscosity calculations, and the Shear Rate Constant (SRC), used for shear rate and shearstress calculations. Note that where SRC = 0, no shear rate/shear stress calculations are done and the datadisplayed is zero (0) for these functions.
Table D1
RV1 01 1 0RV2 02 4 0RV3 03 10 0RV4 04 20 0RV5 05 40 0RV6 06 100 0RV7 07 400 0HA1 01 1 0HA2 02 4 0HA3 03 10 0HA4 04 20 0HA5 05 40 0HA6 06 100 0HA7 07 400 0HB1 01 1 0HB2 02 4 0HB3 03 10 0HB4 04 20 0HB5 05 40 0HB6 06 100 0HB7 07 400 0LV1 61 6.4 0LV2 62 32 0LV3 63 128 0LV4 64 640 0LV5 65 1280 0T-A 91 20 0T-B 92 40 0T-C 93 100 0T-D 94 200 0T-E 95 500 0T-F 96 1000 0ULA 00 0.64 1.223SC4-14 14 125 0.4SC4-15 15 50 0.48SC4-16 16 128 0.2929SC4-18 18 3.2 1.32SC4-21 21 5 0.93SC4-25 25 512 0.22
SPINDLE ENTRY CODE SMC SRC
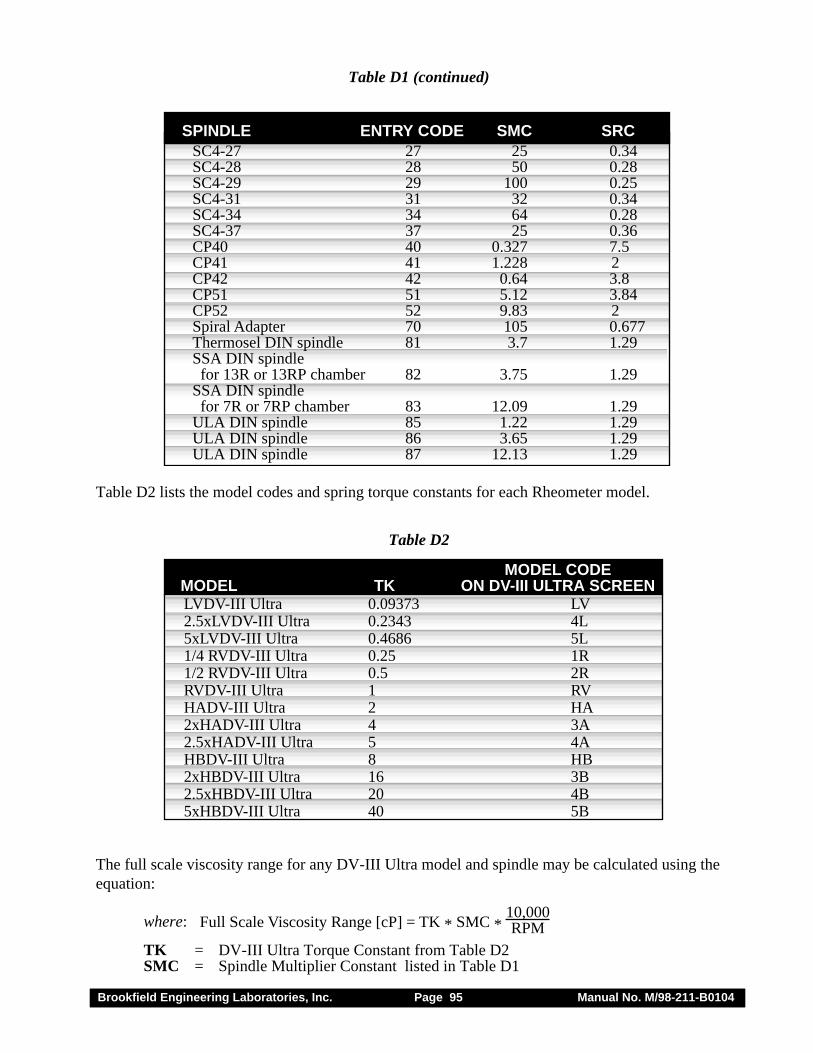
Brookfield Engineering Laboratories, Inc. Page 95 Manual No. M/98-211-B0104
Table D1 (continued)
Table D2 lists the model codes and spring torque constants for each Rheometer model.
Table D2
The full scale viscosity range for any DV-III Ultra model and spindle may be calculated using theequation:
where: Full Scale Viscosity Range [cP] = TK * SMC *10,000RPM
TK = DV-III Ultra Torque Constant from Table D2SMC = Spindle Multiplier Constant listed in Table D1
SC4-27 27 25 0.34SC4-28 28 50 0.28SC4-29 29 100 0.25SC4-31 31 32 0.34SC4-34 34 64 0.28SC4-37 37 25 0.36CP40 40 0.327 7.5CP41 41 1.228 2CP42 42 0.64 3.8CP51 51 5.12 3.84CP52 52 9.83 2Spiral Adapter 70 105 0.677Thermosel DIN spindle 81 3.7 1.29SSA DIN spindle
for 13R or 13RP chamber 82 3.75 1.29SSA DIN spindle
for 7R or 7RP chamber 83 12.09 1.29ULA DIN spindle 85 1.22 1.29ULA DIN spindle 86 3.65 1.29ULA DIN spindle 87 12.13 1.29
SPINDLE ENTRY CODE SMC SRC
LVDV-III Ultra 0.09373 LV 2.5xLVDV-III Ultra 0.2343 4L 5xLVDV-III Ultra 0.4686 5L 1/4 RVDV-III Ultra 0.25 1R 1/2 RVDV-III Ultra 0.5 2R RVDV-III Ultra 1 RV HADV-III Ultra 2 HA 2xHADV-III Ultra 4 3A 2.5xHADV-III Ultra 5 4A HBDV-III Ultra 8 HB 2xHBDV-III Ultra 16 3B 2.5xHBDV-III Ultra 20 4B 5xHBDV-III Ultra 40 5B
MODEL TKMODEL CODE
ON DV-III ULTRA SCREEN
Brookfield Engineering Laboratories, Inc. Page 96 Manual No. M/98-211-B0104
The Shear Rate calculation is:
Shear Rate (1/sec) = SRC * RPM
where:
SRC = Shear Rate Constant from Table D1
Using Non-standard spindles with DV-III Ultra and RHEOCALC Software
Spindle Entry 99 allows entry of spindle constants which the DV-III Ultra will use to calculateViscosity, Shear Rate and Shear Stress for spindles in boundary conditions other than the 600mlbeaker or specified chamber.
The spindles must conform to geometries that allow for mathematical calculations of Shear Rate andShear Stress i.e. coaxial cylinder.
Two constants are required:
a) SMC (Spindle Multiplier Constant) which is used to calculate cP value.
b) SRC (Shear Rate Constant) which is used to calculate Shear Rate and Shear Stress.
If SRC=0 (Example, LV #1-4, RV,HA,HB #1-7 spindles), Shear Rate and Shear Stress values arenot calculated and can not be displayed.
The SMC value for a spindle may be calculated as follows:
a) For new spindle conditions you calculate the SMC using a Newtonian fluid of knownviscosity (Brookfield Viscosity Standard). This is done in the container with the newdimensions at the controlled temperature specified for the viscosity standard fluid.
b) The new full scale viscosity range is calculated for a selected RPM:
R1 = 100 nY
where:
R1 = The new full scale viscosity rangen = The viscosity (in cP) of the Newtonian fluidY = The Torque % reading at the selected RPM
c) The SMC Value is then calculated:
SMC = [Full Scale Viscosity Range (cP)] * [Selected RPM]
TK * 10,000
where:
TK = DV-III Ultra Torque Constant from Table D2
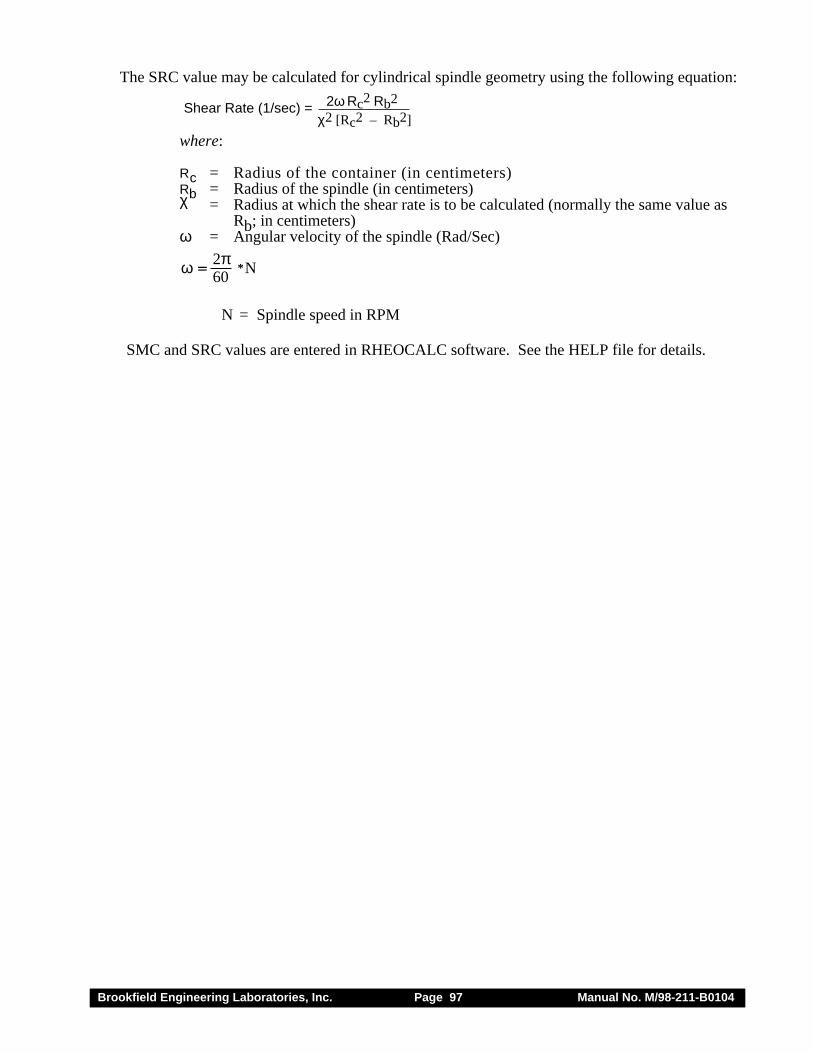
Brookfield Engineering Laboratories, Inc. Page 97 Manual No. M/98-211-B0104
The SRC value may be calculated for cylindrical spindle geometry using the following equation:
2ω Rc2 Rb2
χ2 [Rc2 – Rb2]Shear Rate (1/sec) =
where:
Rc = Radius of the container (in centimeters)Rb = Radius of the spindle (in centimeters)χ = Radius at which the shear rate is to be calculated (normally the same value as
Rb; in centimeters)ω = Angular velocity of the spindle (Rad/Sec)
ω = N2π60
*
N = Spindle speed in RPM
SMC and SRC values are entered in RHEOCALC software. See the HELP file for details.
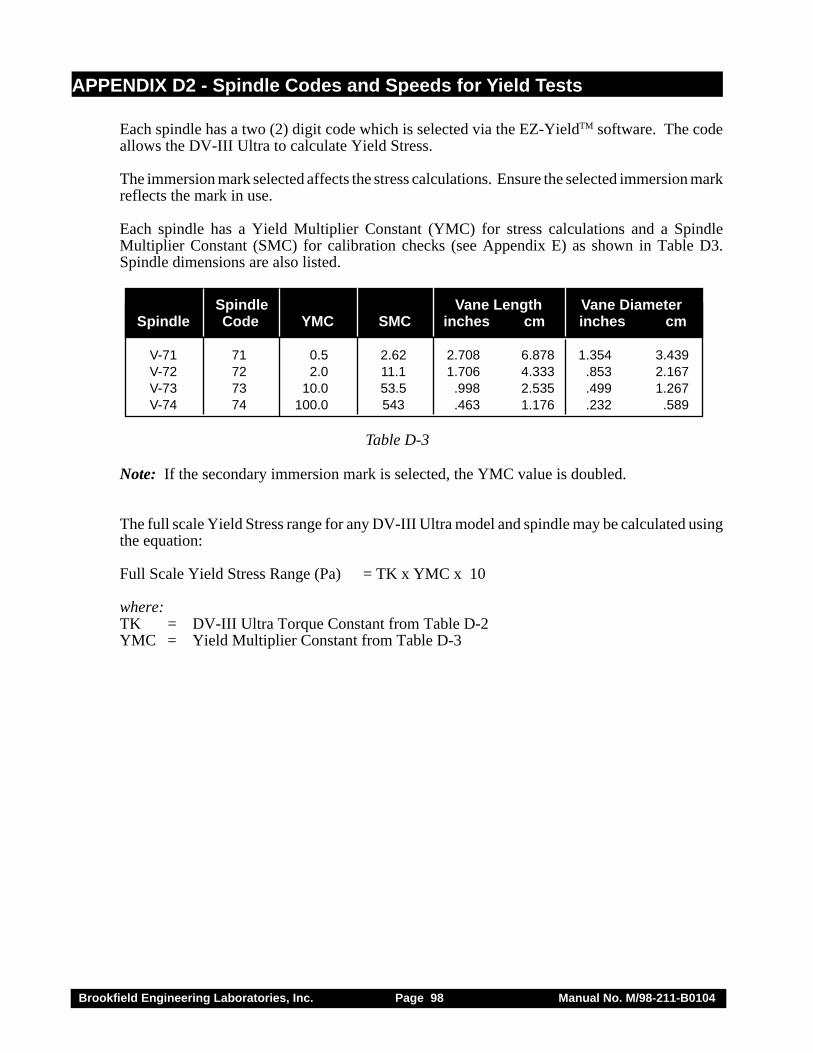
Brookfield Engineering Laboratories, Inc. Page 98 Manual No. M/98-211-B0104
APPENDIX D2 - Spindle Codes and Speeds for Yield Tests
Each spindle has a two (2) digit code which is selected via the EZ-YieldTM software. The codeallows the DV-III Ultra to calculate Yield Stress.
The immersion mark selected affects the stress calculations. Ensure the selected immersion markreflects the mark in use.
Each spindle has a Yield Multiplier Constant (YMC) for stress calculations and a SpindleMultiplier Constant (SMC) for calibration checks (see Appendix E) as shown in Table D3.Spindle dimensions are also listed.
Spindle Vane Length Vane DiameterSpindle Code YMC SMC inches cm inches cm
V-71 71 0.5 2.62 2.708 6.878 1.354 3.439V-72 72 2.0 11.1 1.706 4.333 .853 2.167V-73 73 10.0 53.5 .998 2.535 .499 1.267V-74 74 100.0 543 .463 1.176 .232 .589
Table D-3
Note: If the secondary immersion mark is selected, the YMC value is doubled.
The full scale Yield Stress range for any DV-III Ultra model and spindle may be calculated usingthe equation:
Full Scale Yield Stress Range (Pa) = TK x YMC x 10
where:TK = DV-III Ultra Torque Constant from Table D-2YMC = Yield Multiplier Constant from Table D-3
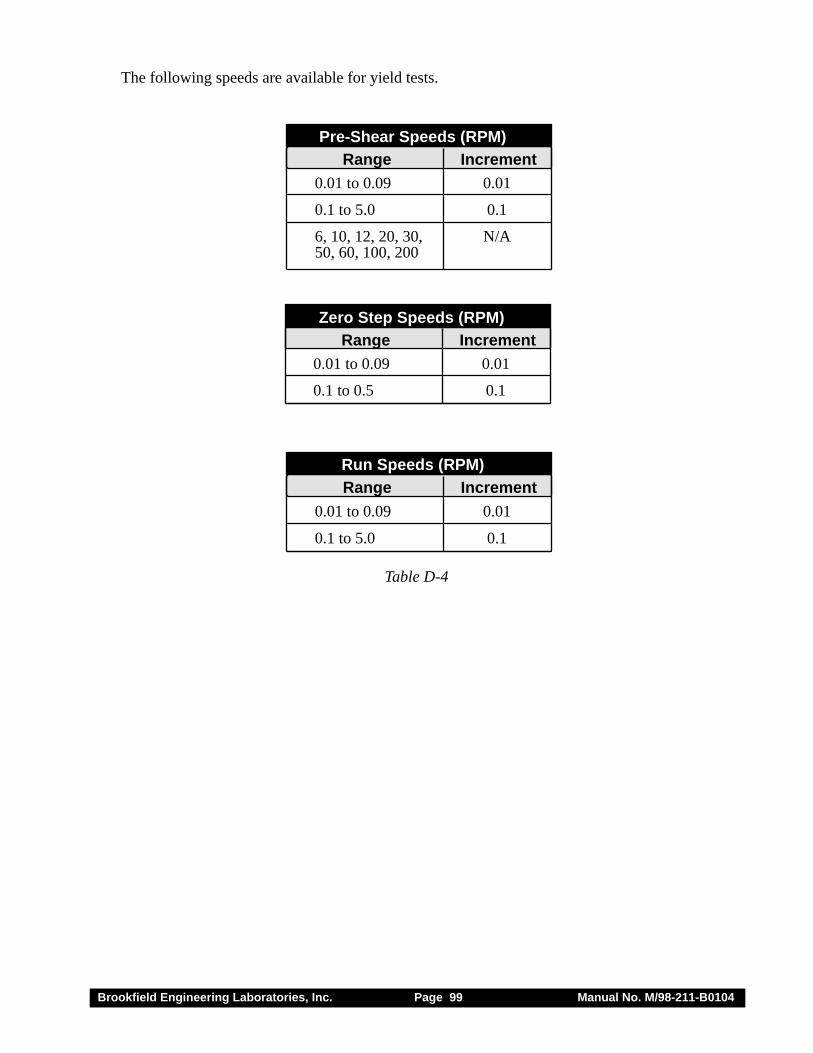
Brookfield Engineering Laboratories, Inc. Page 99 Manual No. M/98-211-B0104
The following speeds are available for yield tests.
0.01 to 0.09 0.01
0.1 to 5.0 0.1
6, 10, 12, 20, 30, N/A50, 60, 100, 200
Pre-Shear Speeds (RPM)Range Increment
0.01 to 0.09 0.01
0.1 to 0.5 0.1
Zero Step Speeds (RPM)Range Increment
0.01 to 0.09 0.01
0.1 to 5.0 0.1
Run Speeds (RPM)Range Increment
Table D-4
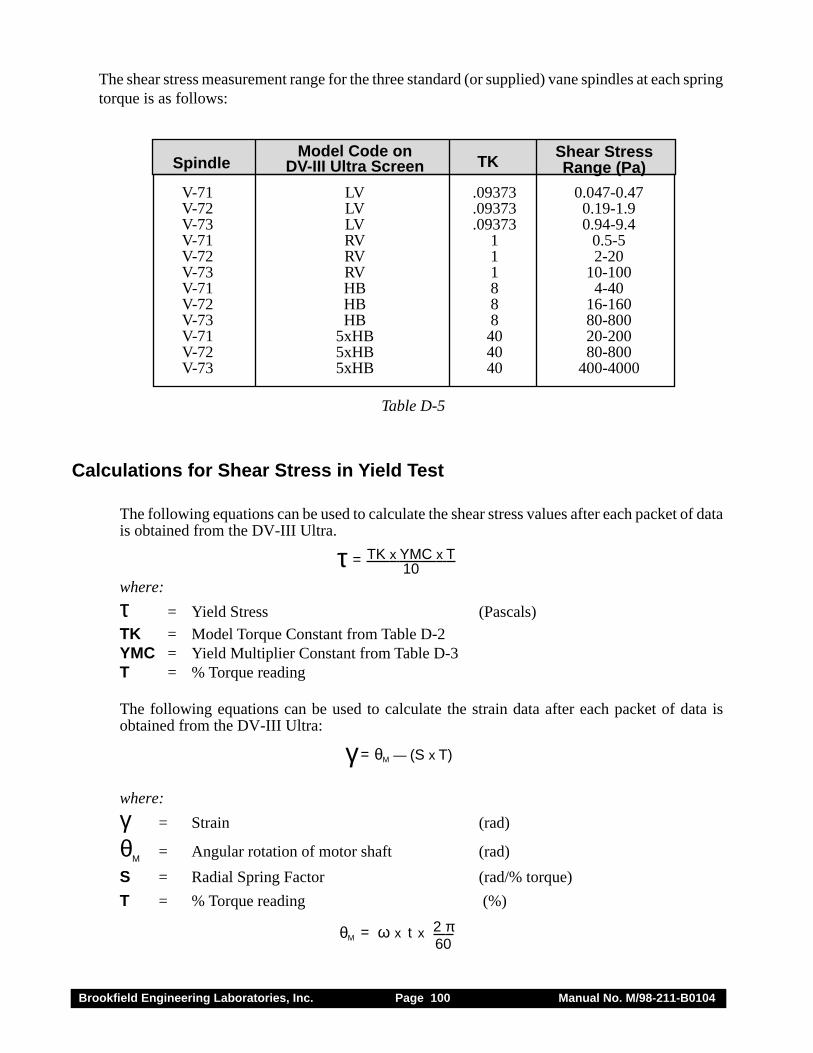
Brookfield Engineering Laboratories, Inc. Page 100 Manual No. M/98-211-B0104
The shear stress measurement range for the three standard (or supplied) vane spindles at each springtorque is as follows:
V-71 LV .09373 0.047-0.47V-72 LV .09373 0.19-1.9V-73 LV .09373 0.94-9.4V-71 RV 1 0.5-5V-72 RV 1 2-20V-73 RV 1 10-100V-71 HB 8 4-40V-72 HB 8 16-160V-73 HB 8 80-800V-71 5xHB 40 20-200V-72 5xHB 40 80-800V-73 5xHB 40 400-4000
Spindle TKModel Code on
DV-III Ultra ScreenShear StressRange (Pa)
Table D-5
Calculations for Shear Stress in Yield Test
The following equations can be used to calculate the shear stress values after each packet of datais obtained from the DV-III Ultra.
TK x YMC x T10τ =
where:
τ = Yield Stress (Pascals)
TK = Model Torque Constant from Table D-2YMC = Yield Multiplier Constant from Table D-3T = % Torque reading
The following equations can be used to calculate the strain data after each packet of data isobtained from the DV-III Ultra:
γ= θM — (S x T)
where:
γ = Strain (rad)
θM = Angular rotation of motor shaft (rad)
S = Radial Spring Factor (rad/% torque)
T = % Torque reading (%)
= ω x t xθM2 π60
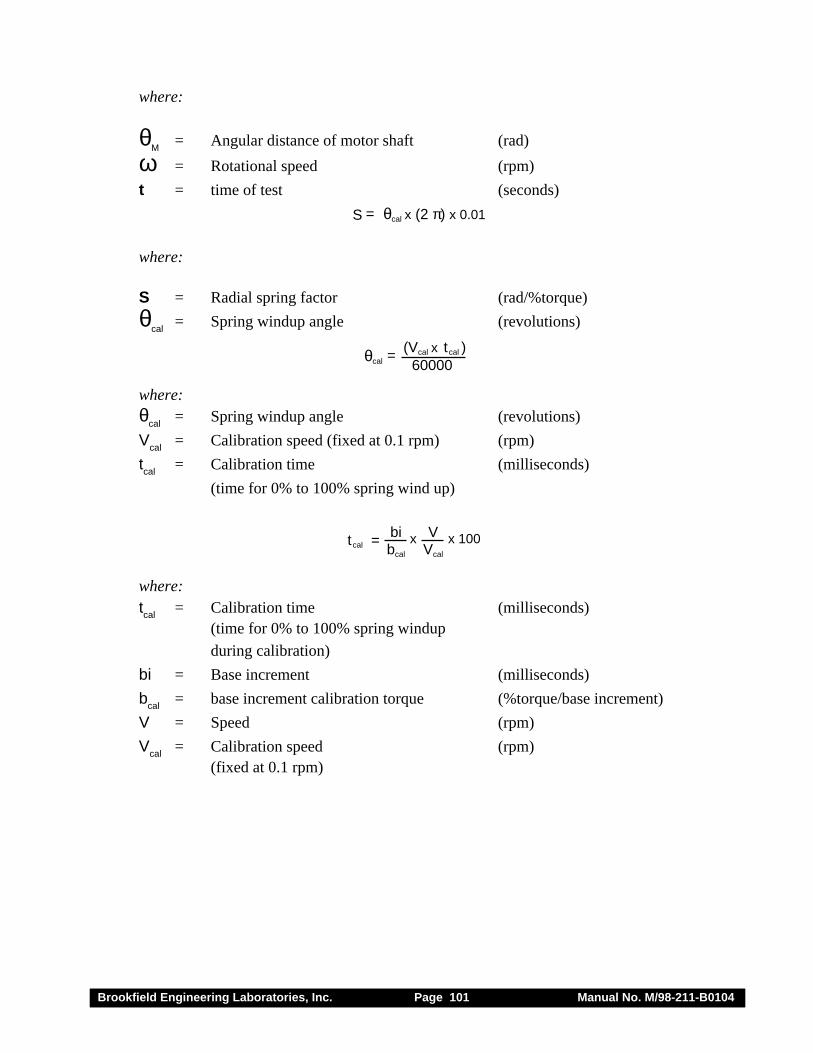
Brookfield Engineering Laboratories, Inc. Page 101 Manual No. M/98-211-B0104
where:
θM
= Angular distance of motor shaft (rad)
ω = Rotational speed (rpm)
t = time of test (seconds)
= θcal x (2 π) x 0.01S
where:
S = Radial spring factor (rad/%torque)
θcal
= Spring windup angle (revolutions)
=θcal
(Vcal x t cal )60000
where:θcal = Spring windup angle (revolutions)
Vcal = Calibration speed (fixed at 0.1 rpm) (rpm)
tcal = Calibration time (milliseconds)
(time for 0% to 100% spring wind up)
=t calbibcal
x 100VVcal
x
where:tcal = Calibration time (milliseconds)
(time for 0% to 100% spring windup
during calibration)
bi = Base increment (milliseconds)
bcal = base increment calibration torque (%torque/base increment)
V = Speed (rpm)
Vcal = Calibration speed (rpm)(fixed at 0.1 rpm)
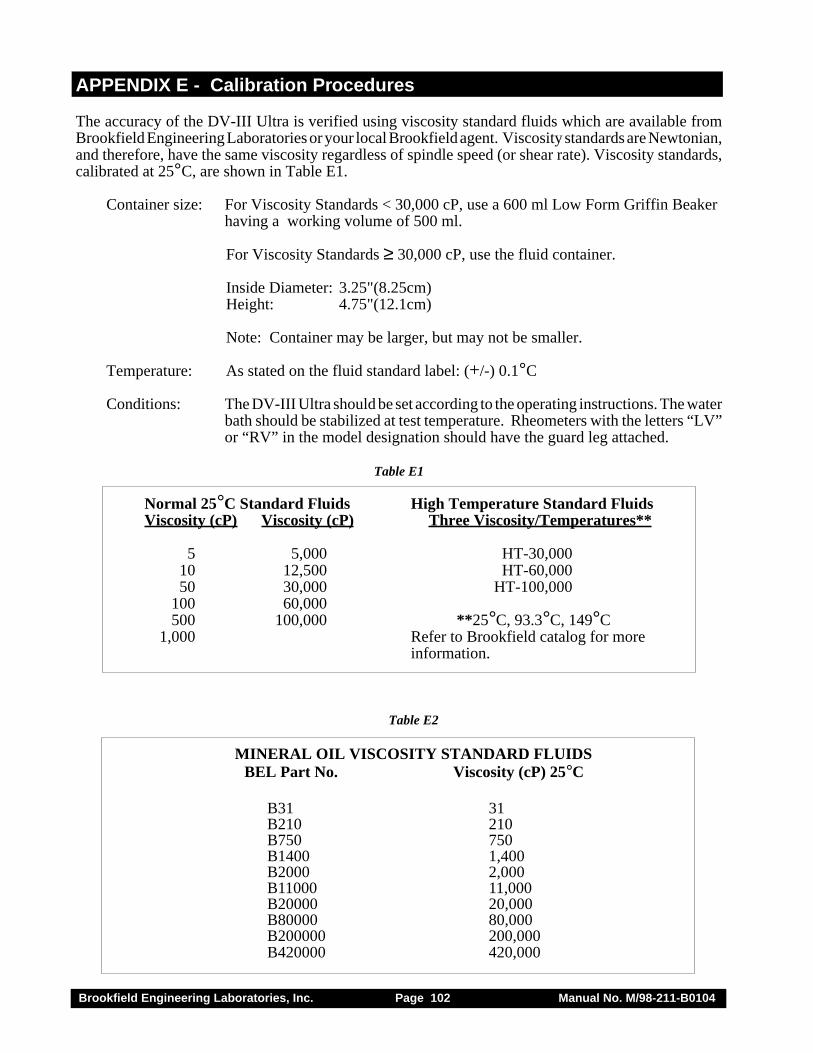
Brookfield Engineering Laboratories, Inc. Page 102 Manual No. M/98-211-B0104
APPENDIX E - Calibration Procedures
The accuracy of the DV-III Ultra is verified using viscosity standard fluids which are available fromBrookfield Engineering Laboratories or your local Brookfield agent. Viscosity standards are Newtonian,and therefore, have the same viscosity regardless of spindle speed (or shear rate). Viscosity standards,calibrated at 25°C, are shown in Table E1.
Container size: For Viscosity Standards < 30,000 cP, use a 600 ml Low Form Griffin Beakerhaving a working volume of 500 ml.
For Viscosity Standards ≥ 30,000 cP, use the fluid container.
Inside Diameter: 3.25"(8.25cm)Height: 4.75"(12.1cm)
Note: Container may be larger, but may not be smaller.
Temperature: As stated on the fluid standard label: (+/-) 0.1°C
Conditions: The DV-III Ultra should be set according to the operating instructions. The waterbath should be stabilized at test temperature. Rheometers with the letters “LV”or “RV” in the model designation should have the guard leg attached.
Table E1
Normal 25°C Standard Fluids High Temperature Standard FluidsViscosity (cP) Viscosity (cP) Three Viscosity/Temperatures**
5 5,000 HT-30,00010 12,500 HT-60,00050 30,000 HT-100,000
100 60,000500 100,000 **25°C, 93.3°C, 149°C
1,000 Refer to Brookfield catalog for moreinformation.
Table E2
MINERAL OIL VISCOSITY STANDARD FLUIDSBEL Part No. Viscosity (cP) 25°C
B31 31B210 210B750 750B1400 1,400B2000 2,000B11000 11,000B20000 20,000B80000 80,000B200000 200,000B420000 420,000
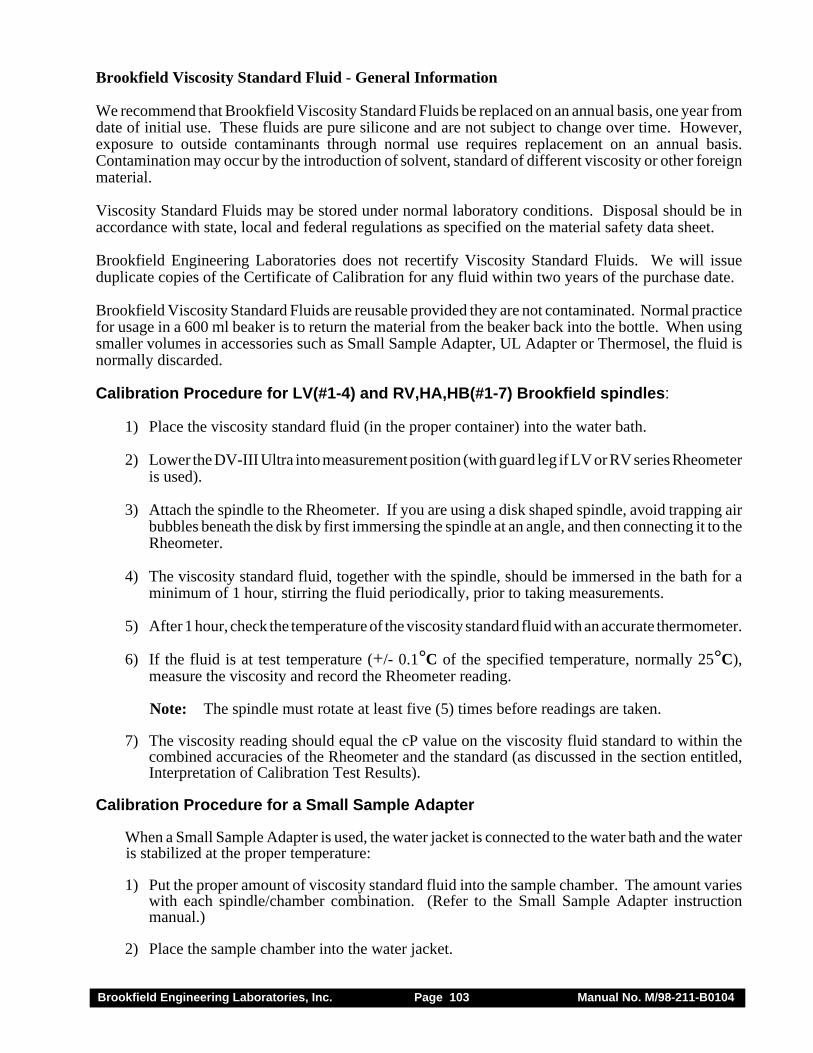
Brookfield Engineering Laboratories, Inc. Page 103 Manual No. M/98-211-B0104
Brookfield Viscosity Standard Fluid - General Information
We recommend that Brookfield Viscosity Standard Fluids be replaced on an annual basis, one year fromdate of initial use. These fluids are pure silicone and are not subject to change over time. However,exposure to outside contaminants through normal use requires replacement on an annual basis.Contamination may occur by the introduction of solvent, standard of different viscosity or other foreignmaterial.
Viscosity Standard Fluids may be stored under normal laboratory conditions. Disposal should be inaccordance with state, local and federal regulations as specified on the material safety data sheet.
Brookfield Engineering Laboratories does not recertify Viscosity Standard Fluids. We will issueduplicate copies of the Certificate of Calibration for any fluid within two years of the purchase date.
Brookfield Viscosity Standard Fluids are reusable provided they are not contaminated. Normal practicefor usage in a 600 ml beaker is to return the material from the beaker back into the bottle. When usingsmaller volumes in accessories such as Small Sample Adapter, UL Adapter or Thermosel, the fluid isnormally discarded.
Calibration Procedure for LV(#1-4) and RV,HA,HB(#1-7) Brookfield spindles:
1) Place the viscosity standard fluid (in the proper container) into the water bath.
2) Lower the DV-III Ultra into measurement position (with guard leg if LV or RV series Rheometeris used).
3) Attach the spindle to the Rheometer. If you are using a disk shaped spindle, avoid trapping airbubbles beneath the disk by first immersing the spindle at an angle, and then connecting it to theRheometer.
4) The viscosity standard fluid, together with the spindle, should be immersed in the bath for aminimum of 1 hour, stirring the fluid periodically, prior to taking measurements.
5) After 1 hour, check the temperature of the viscosity standard fluid with an accurate thermometer.
6) If the fluid is at test temperature (+/- 0.1°C of the specified temperature, normally 25°C),measure the viscosity and record the Rheometer reading.
Note: The spindle must rotate at least five (5) times before readings are taken.
7) The viscosity reading should equal the cP value on the viscosity fluid standard to within thecombined accuracies of the Rheometer and the standard (as discussed in the section entitled,Interpretation of Calibration Test Results).
Calibration Procedure for a Small Sample Adapter
When a Small Sample Adapter is used, the water jacket is connected to the water bath and the wateris stabilized at the proper temperature:
1) Put the proper amount of viscosity standard fluid into the sample chamber. The amount varieswith each spindle/chamber combination. (Refer to the Small Sample Adapter instructionmanual.)
2) Place the sample chamber into the water jacket.

Brookfield Engineering Laboratories, Inc. Page 104 Manual No. M/98-211-B0104
3) Put the spindle into the test fluid and attach the extension link, coupling nut and free hangingspindle (or directly attach the solid shaft spindle) to the DV-III Ultra.
4) Allow 30 minutes for the viscosity standard, sample chamber and spindle to reach testtemperature.
5) Measure the viscosity and record the Rheometer reading.
Note: The spindle must rotate at least five (5) times before a viscosity reading is taken.
Calibration Procedure for a Thermosel System
When a Thermosel System is used, the controller stabilizes the Thermo Container at the testtemperature. A two-step process is recommended for the Thermosel:
A) Evaluate the calibration of the Viscometer alone according to the procedure outlined inAppendix E, “Calibration Procedure for LV (#1-4) and RV,HA,HB (#1-7) Brookfield spindles.”
B) Evaluate the Viscometer with Thermosel according to the procedure listed below:
a) Put the proper amount of HT viscosity standard fluid into the HT-2 sample chamber. Theamount varies with the spindle used. (Refer to the Thermosel instruction manual).
b) Place the sample chamber into the Thermo Container.
c) Put the spindle into the test fluid and attach the extension link, coupling nut and free hangingspindle (or directly attach the solid shaft spindle) to the DV-III Ultra.
d) Allow 30 minutes for the viscosity standard, sample chamber and spindle to reach testtemperature.
e) Measure the viscosity and record the Rheometer reading.
Note: The spindle must rotate at least five (5) times before a viscosity reading is taken.
Calibration Procedure using UL or DIN UL Adapters
When a UL or DIN UL Adapter is used, the water bath is stabilized at the proper temperature:
1) Put the proper amount of viscosity standard fluid into the UL Tube. (Refer to the UL Adapterinstruction manual).
2) Attach the spindle (with extension link and coupling nut) onto the DV-III Ultra.
3) Attach the tube to the mounting channel.
4) Lower the tube into the water bath reservoir, or if using the ULA-40Y water jacket, connect theinlet/outlets to the bath external circulating pump.
5) Allow 30 minutes for the viscosity standard, sample chamber and spindle to reach testtemperature.
6) Measure the viscosity and record the Rheometer reading.
Note: The spindle must rotate at least five (5) times before a viscosity reading is taken.
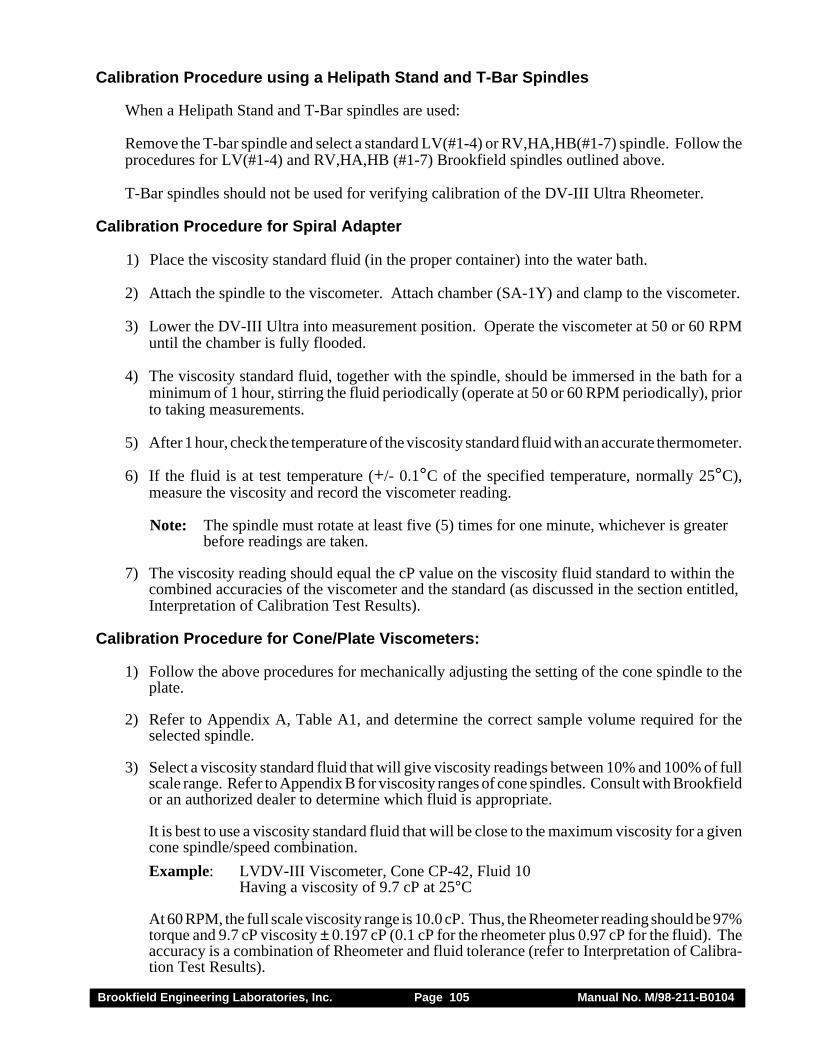
Brookfield Engineering Laboratories, Inc. Page 105 Manual No. M/98-211-B0104
Calibration Procedure using a Helipath Stand and T-Bar Spindles
When a Helipath Stand and T-Bar spindles are used:
Remove the T-bar spindle and select a standard LV(#1-4) or RV,HA,HB(#1-7) spindle. Follow theprocedures for LV(#1-4) and RV,HA,HB (#1-7) Brookfield spindles outlined above.
T-Bar spindles should not be used for verifying calibration of the DV-III Ultra Rheometer.
Calibration Procedure for Spiral Adapter
1) Place the viscosity standard fluid (in the proper container) into the water bath.
2) Attach the spindle to the viscometer. Attach chamber (SA-1Y) and clamp to the viscometer.
3) Lower the DV-III Ultra into measurement position. Operate the viscometer at 50 or 60 RPMuntil the chamber is fully flooded.
4) The viscosity standard fluid, together with the spindle, should be immersed in the bath for aminimum of 1 hour, stirring the fluid periodically (operate at 50 or 60 RPM periodically), priorto taking measurements.
5) After 1 hour, check the temperature of the viscosity standard fluid with an accurate thermometer.
6) If the fluid is at test temperature (+/- 0.1°C of the specified temperature, normally 25°C),measure the viscosity and record the viscometer reading.
Note: The spindle must rotate at least five (5) times for one minute, whichever is greaterbefore readings are taken.
7) The viscosity reading should equal the cP value on the viscosity fluid standard to within thecombined accuracies of the viscometer and the standard (as discussed in the section entitled,Interpretation of Calibration Test Results).
Calibration Procedure for Cone/Plate Viscometers:
1) Follow the above procedures for mechanically adjusting the setting of the cone spindle to theplate.
2) Refer to Appendix A, Table A1, and determine the correct sample volume required for theselected spindle.
3) Select a viscosity standard fluid that will give viscosity readings between 10% and 100% of fullscale range. Refer to Appendix B for viscosity ranges of cone spindles. Consult with Brookfieldor an authorized dealer to determine which fluid is appropriate.
It is best to use a viscosity standard fluid that will be close to the maximum viscosity for a givencone spindle/speed combination.
Example: LVDV-III Viscometer, Cone CP-42, Fluid 10Having a viscosity of 9.7 cP at 25°C
At 60 RPM, the full scale viscosity range is 10.0 cP. Thus, the Rheometer reading should be 97%torque and 9.7 cP viscosity ± 0.197 cP (0.1 cP for the rheometer plus 0.97 cP for the fluid). Theaccuracy is a combination of Rheometer and fluid tolerance (refer to Interpretation of Calibra-tion Test Results).
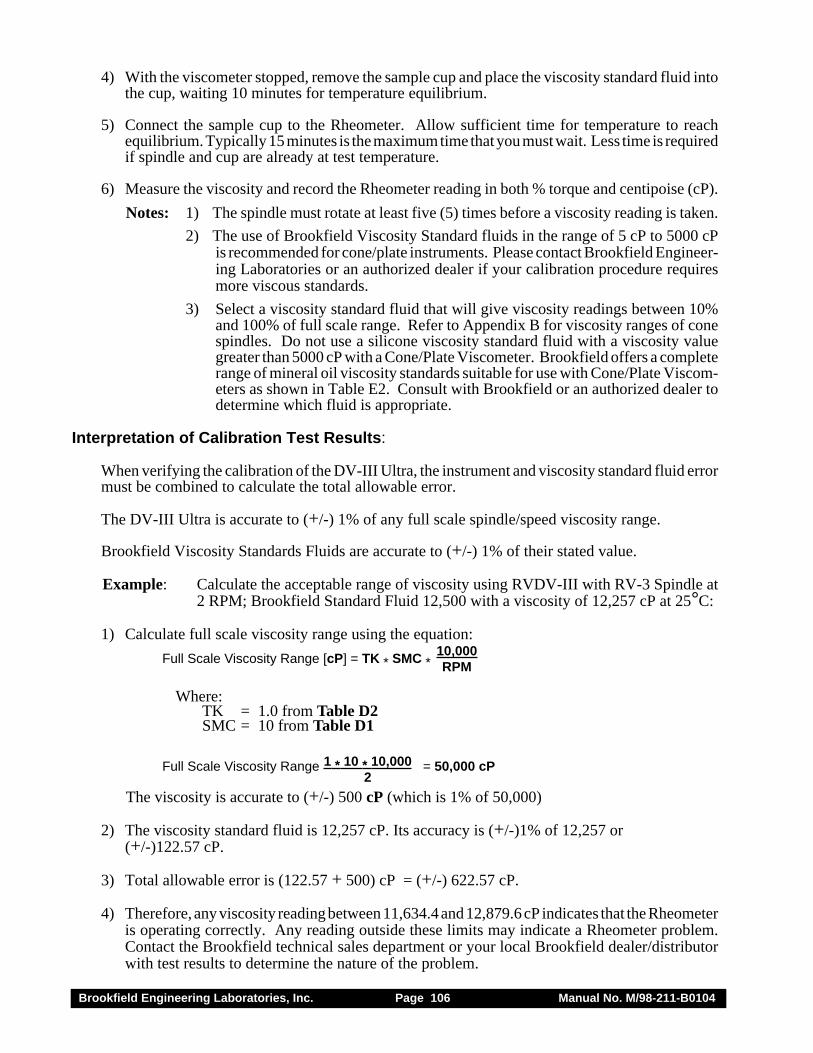
Brookfield Engineering Laboratories, Inc. Page 106 Manual No. M/98-211-B0104
4) With the viscometer stopped, remove the sample cup and place the viscosity standard fluid intothe cup, waiting 10 minutes for temperature equilibrium.
5) Connect the sample cup to the Rheometer. Allow sufficient time for temperature to reachequilibrium. Typically 15 minutes is the maximum time that you must wait. Less time is requiredif spindle and cup are already at test temperature.
6) Measure the viscosity and record the Rheometer reading in both % torque and centipoise (cP).
Notes: 1) The spindle must rotate at least five (5) times before a viscosity reading is taken.
2) The use of Brookfield Viscosity Standard fluids in the range of 5 cP to 5000 cPis recommended for cone/plate instruments. Please contact Brookfield Engineer-ing Laboratories or an authorized dealer if your calibration procedure requiresmore viscous standards.
3) Select a viscosity standard fluid that will give viscosity readings between 10%and 100% of full scale range. Refer to Appendix B for viscosity ranges of conespindles. Do not use a silicone viscosity standard fluid with a viscosity valuegreater than 5000 cP with a Cone/Plate Viscometer. Brookfield offers a completerange of mineral oil viscosity standards suitable for use with Cone/Plate Viscom-eters as shown in Table E2. Consult with Brookfield or an authorized dealer todetermine which fluid is appropriate.
Interpretation of Calibration Test Results:
When verifying the calibration of the DV-III Ultra, the instrument and viscosity standard fluid errormust be combined to calculate the total allowable error.
The DV-III Ultra is accurate to (+/-) 1% of any full scale spindle/speed viscosity range.
Brookfield Viscosity Standards Fluids are accurate to (+/-) 1% of their stated value.
Example: Calculate the acceptable range of viscosity using RVDV-III with RV-3 Spindle at2 RPM; Brookfield Standard Fluid 12,500 with a viscosity of 12,257 cP at 25°C:
1) Calculate full scale viscosity range using the equation:
Full Scale Viscosity Range [cP] = TK * SMC *10,000RPM
Where:TK = 1.0 from Table D2SMC = 10 from Table D1
Full Scale Viscosity Range = 50,000 cP1 * 10 * 10,0002
The viscosity is accurate to (+/-) 500 cP (which is 1% of 50,000)
2) The viscosity standard fluid is 12,257 cP. Its accuracy is (+/-)1% of 12,257 or(+/-)122.57 cP.
3) Total allowable error is (122.57 + 500) cP = (+/-) 622.57 cP.
4) Therefore, any viscosity reading between 11,634.4 and 12,879.6 cP indicates that the Rheometeris operating correctly. Any reading outside these limits may indicate a Rheometer problem.Contact the Brookfield technical sales department or your local Brookfield dealer/distributorwith test results to determine the nature of the problem.
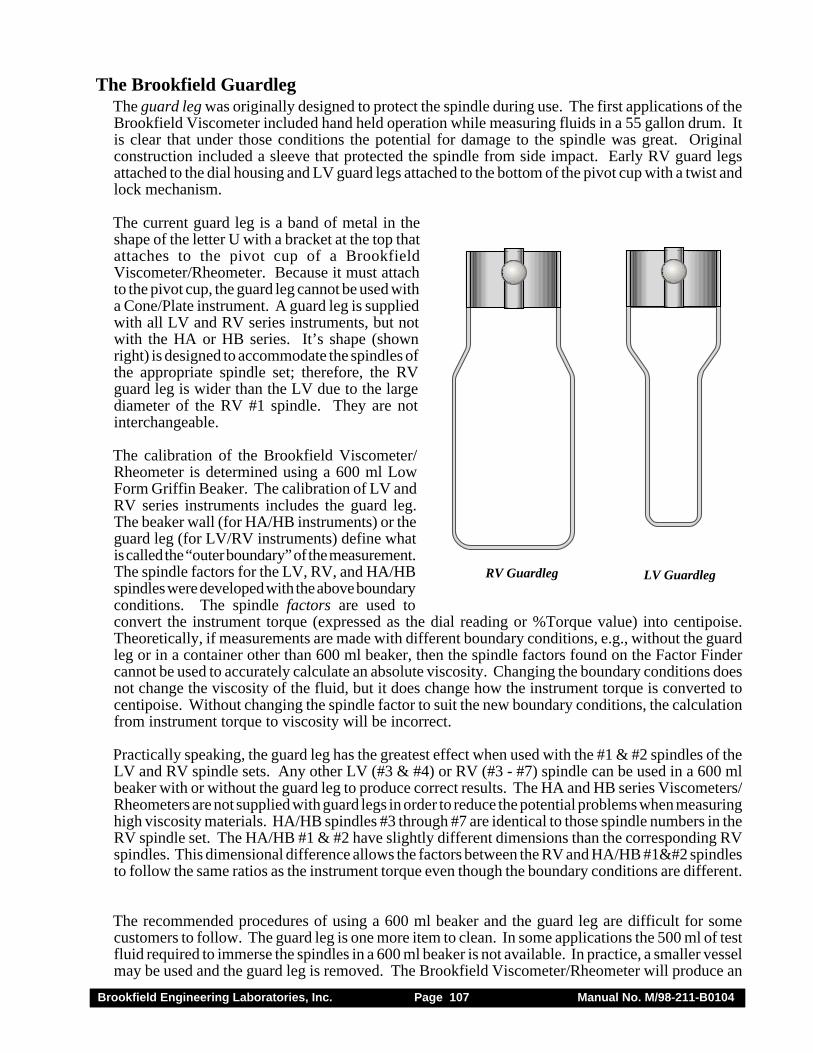
Brookfield Engineering Laboratories, Inc. Page 107 Manual No. M/98-211-B0104
The Brookfield GuardlegThe guard leg was originally designed to protect the spindle during use. The first applications of theBrookfield Viscometer included hand held operation while measuring fluids in a 55 gallon drum. Itis clear that under those conditions the potential for damage to the spindle was great. Originalconstruction included a sleeve that protected the spindle from side impact. Early RV guard legsattached to the dial housing and LV guard legs attached to the bottom of the pivot cup with a twist andlock mechanism.
The current guard leg is a band of metal in theshape of the letter U with a bracket at the top thatattaches to the pivot cup of a BrookfieldViscometer/Rheometer. Because it must attachto the pivot cup, the guard leg cannot be used witha Cone/Plate instrument. A guard leg is suppliedwith all LV and RV series instruments, but notwith the HA or HB series. It’s shape (shownright) is designed to accommodate the spindles ofthe appropriate spindle set; therefore, the RVguard leg is wider than the LV due to the largediameter of the RV #1 spindle. They are notinterchangeable.
The calibration of the Brookfield Viscometer/Rheometer is determined using a 600 ml LowForm Griffin Beaker. The calibration of LV andRV series instruments includes the guard leg.The beaker wall (for HA/HB instruments) or theguard leg (for LV/RV instruments) define whatis called the “outer boundary” of the measurement.The spindle factors for the LV, RV, and HA/HBspindles were developed with the above boundaryconditions. The spindle factors are used toconvert the instrument torque (expressed as the dial reading or %Torque value) into centipoise.Theoretically, if measurements are made with different boundary conditions, e.g., without the guardleg or in a container other than 600 ml beaker, then the spindle factors found on the Factor Findercannot be used to accurately calculate an absolute viscosity. Changing the boundary conditions doesnot change the viscosity of the fluid, but it does change how the instrument torque is converted tocentipoise. Without changing the spindle factor to suit the new boundary conditions, the calculationfrom instrument torque to viscosity will be incorrect.
Practically speaking, the guard leg has the greatest effect when used with the #1 & #2 spindles of theLV and RV spindle sets. Any other LV (#3 & #4) or RV (#3 - #7) spindle can be used in a 600 mlbeaker with or without the guard leg to produce correct results. The HA and HB series Viscometers/Rheometers are not supplied with guard legs in order to reduce the potential problems when measuringhigh viscosity materials. HA/HB spindles #3 through #7 are identical to those spindle numbers in theRV spindle set. The HA/HB #1 & #2 have slightly different dimensions than the corresponding RVspindles. This dimensional difference allows the factors between the RV and HA/HB #1 spindlesto follow the same ratios as the instrument torque even though the boundary conditions are different.
The recommended procedures of using a 600 ml beaker and the guard leg are difficult for somecustomers to follow. The guard leg is one more item to clean. In some applications the 500 ml of testfluid required to immerse the spindles in a 600 ml beaker is not available. In practice, a smaller vesselmay be used and the guard leg is removed. The Brookfield Viscometer/Rheometer will produce an
RV Guardleg LV Guardleg
Brookfield Engineering Laboratories, Inc. Page 108 Manual No. M/98-211-B0104
accurate and repeatable torque reading under any measurement circumstance. However, theconversion of this torque reading to centipoise will only be correct if the factor used was developedfor those specific conditions. Brookfield has outlined a method for recalibrating a BrookfieldViscometer/Rheometer to any measurement circumstance in More Solutions to Sticky Problems,Section 3.3.10. It is important to note that for many viscometer users the true viscosity is not asimportant as a repeatable day to day value. This repeatable value can be obtained without any specialeffort for any measurement circumstance. But, it should be known that this type of torque reading willnot convert into a correct centipoise value when using a Brookfield factor if the boundary conditionsare not those specified by Brookfield.
The guard leg is a part of the calibration check of the Brookfield LV and RV series Viscometer/Rheometer. Our customers should be aware of its existence, its purpose and the effect that it may haveon data. With this knowledge, the viscometer user may make modifications to the recommendedmethod of operation to suit their needs.
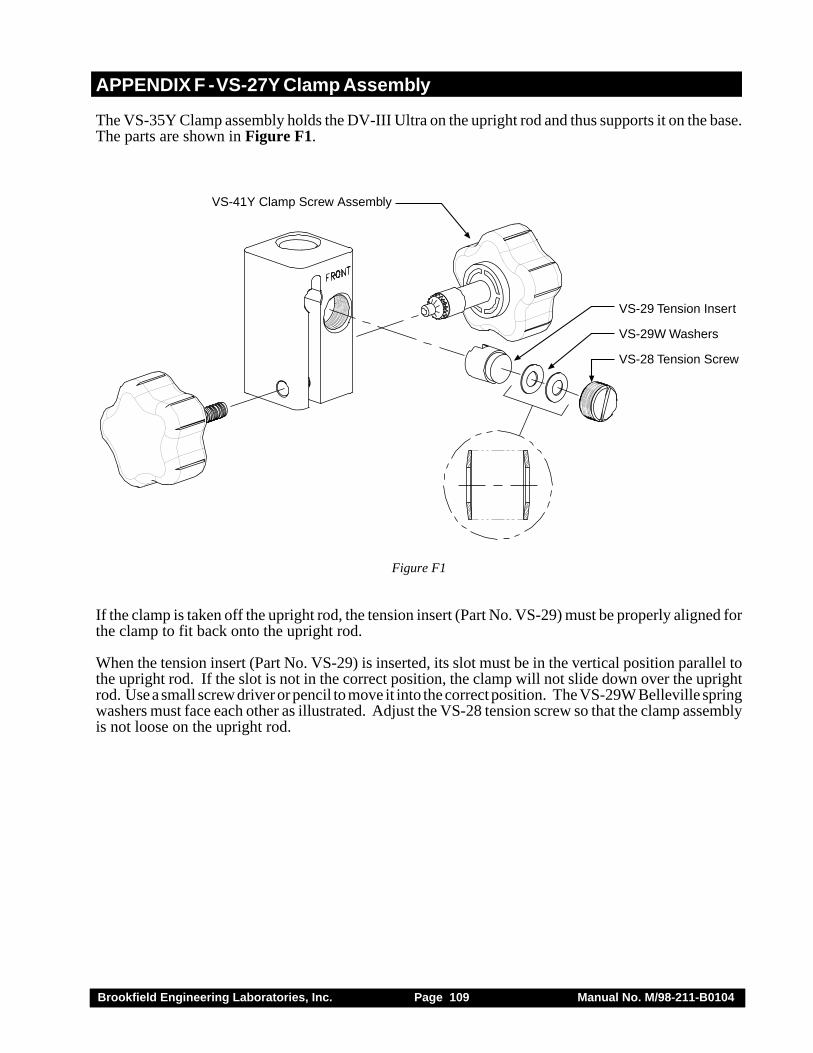
Brookfield Engineering Laboratories, Inc. Page 109 Manual No. M/98-211-B0104
APPENDIX F - VS-27Y Clamp Assembly
The VS-35Y Clamp assembly holds the DV-III Ultra on the upright rod and thus supports it on the base.The parts are shown in Figure F1.
Figure F1
If the clamp is taken off the upright rod, the tension insert (Part No. VS-29) must be properly aligned forthe clamp to fit back onto the upright rod.
When the tension insert (Part No. VS-29) is inserted, its slot must be in the vertical position parallel tothe upright rod. If the slot is not in the correct position, the clamp will not slide down over the uprightrod. Use a small screw driver or pencil to move it into the correct position. The VS-29W Belleville springwashers must face each other as illustrated. Adjust the VS-28 tension screw so that the clamp assemblyis not loose on the upright rod.
VS-41Y Clamp Screw Assembly
VS-29 Tension Insert
VS-29W Washers
VS-28 Tension Screw
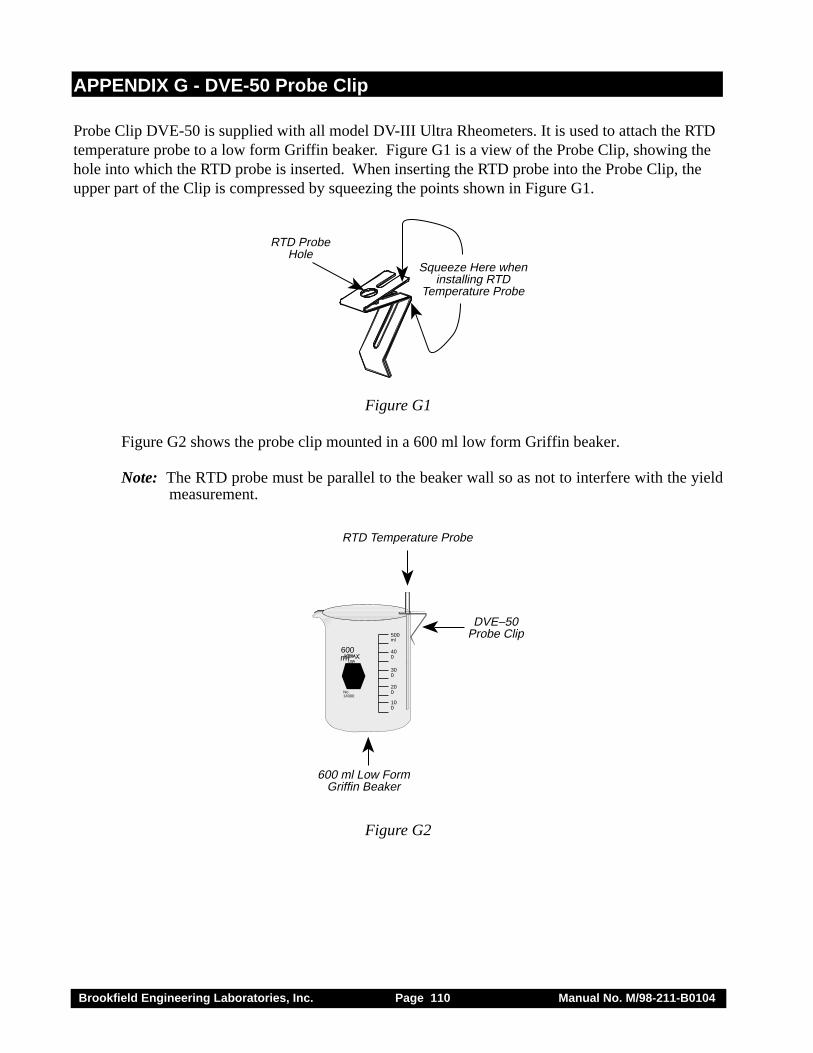
Brookfield Engineering Laboratories, Inc. Page 110 Manual No. M/98-211-B0104
APPENDIX G - DVE-50 Probe Clip
Probe Clip DVE-50 is supplied with all model DV-III Ultra Rheometers. It is used to attach the RTDtemperature probe to a low form Griffin beaker. Figure G1 is a view of the Probe Clip, showing thehole into which the RTD probe is inserted. When inserting the RTD probe into the Probe Clip, theupper part of the Clip is compressed by squeezing the points shown in Figure G1.
RTD ProbeHole
Squeeze Here wheninstalling RTD
Temperature Probe
Figure G1
Figure G2 shows the probe clip mounted in a 600 ml low form Griffin beaker.
Note: The RTD probe must be parallel to the beaker wall so as not to interfere with the yieldmeasurement.
600ml
500ml
400
300
200
100
USA
No.14000
600 ml Low FormGriffin Beaker
DVE–50Probe Clip
RTD Temperature Probe
Figure G2
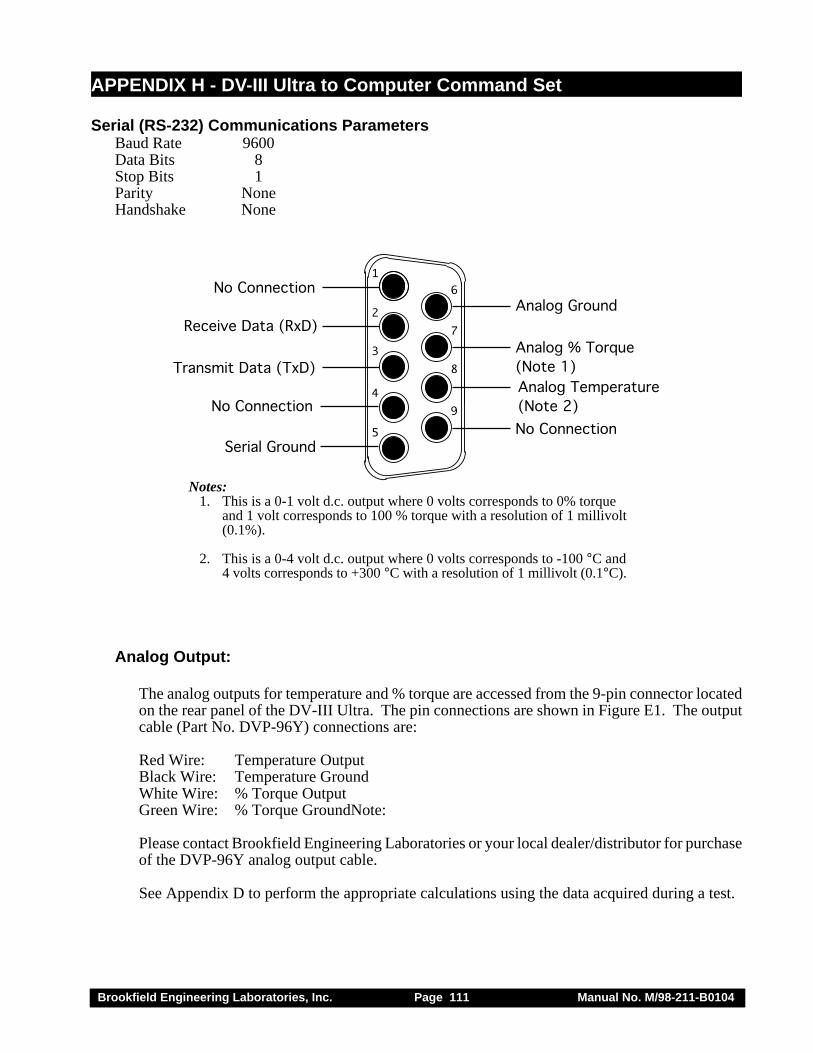
Brookfield Engineering Laboratories, Inc. Page 111 Manual No. M/98-211-B0104
APPENDIX H - DV-III Ultra to Computer Command Set
Serial (RS-232) Communications ParametersBaud Rate 9600Data Bits 8Stop Bits 1Parity NoneHandshake None
2
3
4
5
6
7
8
9
1
No Connection
Transmit Data (TxD)
Receive Data (RxD)
No Connection
No ConnectionSerial Ground
Analog Ground
Analog % Torque
(Note 1)
Analog Temperature
(Note 2)
Notes: 1. This is a 0-1 volt d.c. output where 0 volts corresponds to 0% torque
and 1 volt corresponds to 100 % torque with a resolution of 1 millivolt(0.1%).
2. This is a 0-4 volt d.c. output where 0 volts corresponds to -100 °C and4 volts corresponds to +300 °C with a resolution of 1 millivolt (0.1°C).
Analog Output:
The analog outputs for temperature and % torque are accessed from the 9-pin connector locatedon the rear panel of the DV-III Ultra. The pin connections are shown in Figure E1. The outputcable (Part No. DVP-96Y) connections are:
Red Wire: Temperature OutputBlack Wire: Temperature GroundWhite Wire: % Torque OutputGreen Wire: % Torque GroundNote:
Please contact Brookfield Engineering Laboratories or your local dealer/distributor for purchaseof the DVP-96Y analog output cable.
See Appendix D to perform the appropriate calculations using the data acquired during a test.
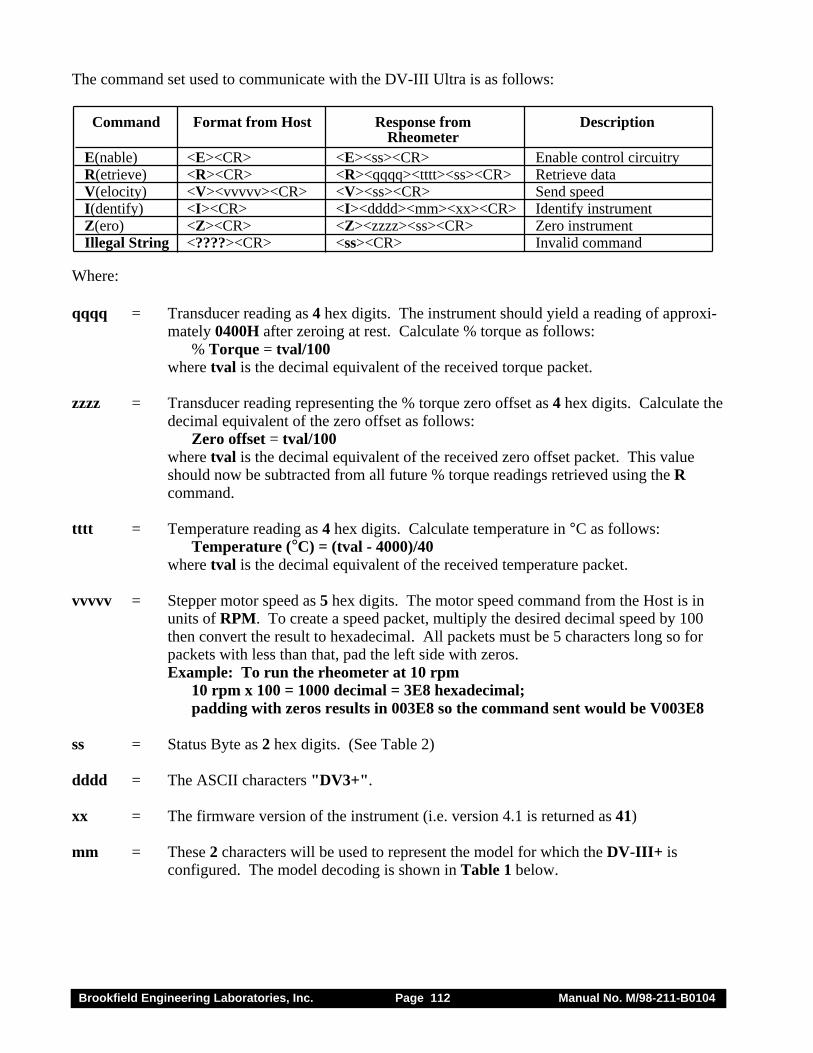
Brookfield Engineering Laboratories, Inc. Page 112 Manual No. M/98-211-B0104
The command set used to communicate with the DV-III Ultra is as follows:
E(nable) <E><CR> <E><ss><CR> Enable control circuitryR(etrieve) <R><CR> <R><qqqq><tttt><ss><CR> Retrieve dataV(elocity) <V><vvvvv><CR> <V><ss><CR> Send speedI(dentify) <I><CR> <I><dddd><mm><xx><CR> Identify instrumentZ(ero) <Z><CR> <Z><zzzz><ss><CR> Zero instrumentIllegal String <????><CR> <ss><CR> Invalid command
Command Format from Host Response from DescriptionRheometer
Where:
qqqq = Transducer reading as 4 hex digits. The instrument should yield a reading of approxi-mately 0400H after zeroing at rest. Calculate % torque as follows:
% Torque = tval/100where tval is the decimal equivalent of the received torque packet.
zzzz = Transducer reading representing the % torque zero offset as 4 hex digits. Calculate thedecimal equivalent of the zero offset as follows:
Zero offset = tval/100where tval is the decimal equivalent of the received zero offset packet. This valueshould now be subtracted from all future % torque readings retrieved using the Rcommand.
tttt = Temperature reading as 4 hex digits. Calculate temperature in °C as follows:Temperature (°C) = (tval - 4000)/40
where tval is the decimal equivalent of the received temperature packet.
vvvvv = Stepper motor speed as 5 hex digits. The motor speed command from the Host is inunits of RPM. To create a speed packet, multiply the desired decimal speed by 100then convert the result to hexadecimal. All packets must be 5 characters long so forpackets with less than that, pad the left side with zeros.Example: To run the rheometer at 10 rpm
10 rpm x 100 = 1000 decimal = 3E8 hexadecimal;padding with zeros results in 003E8 so the command sent would be V003E8
ss = Status Byte as 2 hex digits. (See Table 2)
dddd = The ASCII characters "DV3+".
xx = The firmware version of the instrument (i.e. version 4.1 is returned as 41)
mm = These 2 characters will be used to represent the model for which the DV-III+ isconfigured. The model decoding is shown in Table 1 below.
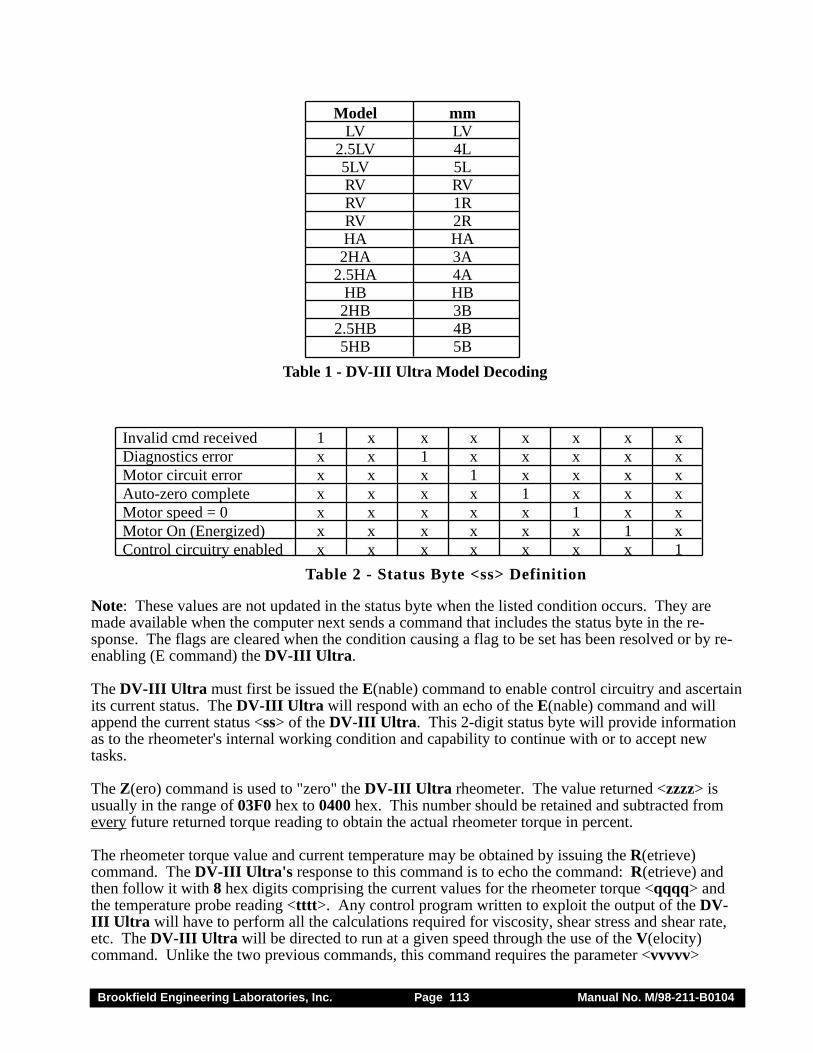
Brookfield Engineering Laboratories, Inc. Page 113 Manual No. M/98-211-B0104
Model mmLV LV
2.5LV 4L5LV 5LRV RVRV 1RRV 2RHA HA
2HA 3A2.5HA 4A
HB HB2HB 3B
2.5HB 4B5HB 5B
Table 1 - DV-III Ultra Model Decoding
Invalid cmd received 1 x x x x x x xDiagnostics error x x 1 x x x x xMotor circuit error x x x 1 x x x xAuto-zero complete x x x x 1 x x xMotor speed = 0 x x x x x 1 x xMotor On (Energized) x x x x x x 1 xControl circuitry enabled x x x x x x x 1
Table 2 - Status Byte <ss> Definition
Note: These values are not updated in the status byte when the listed condition occurs. They aremade available when the computer next sends a command that includes the status byte in the re-sponse. The flags are cleared when the condition causing a flag to be set has been resolved or by re-enabling (E command) the DV-III Ultra.
The DV-III Ultra must first be issued the E(nable) command to enable control circuitry and ascertainits current status. The DV-III Ultra will respond with an echo of the E(nable) command and willappend the current status <ss> of the DV-III Ultra. This 2-digit status byte will provide informationas to the rheometer's internal working condition and capability to continue with or to accept newtasks.
The Z(ero) command is used to "zero" the DV-III Ultra rheometer. The value returned <zzzz> isusually in the range of 03F0 hex to 0400 hex. This number should be retained and subtracted fromevery future returned torque reading to obtain the actual rheometer torque in percent.
The rheometer torque value and current temperature may be obtained by issuing the R(etrieve)command. The DV-III Ultra's response to this command is to echo the command: R(etrieve) andthen follow it with 8 hex digits comprising the current values for the rheometer torque <qqqq> andthe temperature probe reading <tttt>. Any control program written to exploit the output of the DV-III Ultra will have to perform all the calculations required for viscosity, shear stress and shear rate,etc. The DV-III Ultra will be directed to run at a given speed through the use of the V(elocity)command. Unlike the two previous commands, this command requires the parameter <vvvvv>
Brookfield Engineering Laboratories, Inc. Page 114 Manual No. M/98-211-B0104
which contains the value for the desired speed. The DV-III Ultra responds to this command byrepeating the command: V(elocity) and appending the status byte <ss> which will, amongst otherthings, inform the calling program as to whether the motor was turned on and/or whether the desiredspeed was attained.
RS-232 Output During The Yield TestAll output that occurs immediately before and after the yield test is described in Section III.4. Thatpre- and post- test output is sent out both the serial (RS-232) and parallel ports. When using theBrookfield Computer Cable (Brookfield part # DVP-80), the DV-III Ultra will output a data stringduring the actual yield test run. This data is ONLY sent out to the RS-232 port for use with the EZ-YieldTM software.
The following output is sent to the serial (RS-232) port at the end of every Base Increment period:
xxxxxx:yy.yy:ttt.t:zz.zz
where the delimiter between all fields is a colon (:) character andxxxxxx = The Base Increment count in hexadecimal format, padded with leading zeroes. This
is the time, in milliseconds that each reading was taken in the instrument.yy.yy = % Torque value. % Torque is output with a resolution of 0.01% and a maximum of
99.99%.ttt.t = Temperature in °C.zz.zz = Delta Torque (%). This is the actual change in percent torque, measured from the
previous reading, calculated at the end of each Base Increment period.
Brookfield Engineering Laboratories, Inc. Page 115 Manual No. M/98-211-B0104
APPENDIX I - Fault Diagnosis and Troubleshooting
Listed are some of the more common problems that you may encounter while using your rheometer.
❏ Spindle Does Not Rotate
✓ Make sure the rheometer is plugged in.
✓ Check the voltage rating on your rheometer (115V or 220V); it must match the wall voltage.
✓ Make sure the motor is ON and the desired rpm is selected.
❏ Spindle Wobbles When Rotating or Looks Bent
✓ Make sure the spindle is tightened securely to the rheometer coupling.
✓ Check the straightness of all other spindles; replace if bent.
✓ Inspect rheometer coupling and spindle coupling mating areas and threads for dirt; cleanthreads on spindle coupling with a 3/56 left-hand tap.
✓ Inspect rheometer coupling threads for wear; if the threads are worn, the unit needs service(see Appendix I). Check to see if spindles rotate eccentrically or wobble. There is an allow-able runout of 1/32-inch in each direction (1/16-inch total) when measured from the bottom ofthe spindle rotating in air.
✓ Check to see if the rheometer coupling appears bent; if so, the unit is in need of service (seeAppendix J, “How to Return Your Rheometer”).
If you continue to experience problems with your rheometer, follow this troubleshooting section tohelp isolate potential problems.
❏ Perform an Oscillation Check
This check verifies the mechanical condition of the shaft and bearing assembly in the rheom-eter. Auto zero the instrument according to directions in the manual. With the spindle re-moved, motor off and the display showing % torque perform the oscillation check as follows:
1) Manually lift the spindle nut and rotate counter clockwise until the display shows 20%-30% deflection.
2) Release the spindle nut.
3) The % display should return to 0.0% ±0.1%.
Brookfield Engineering Laboratories, Inc. Page 116 Manual No. M/98-211-B0104
❏ Viscometer Will Not Return to Zero
✓ Rheometer is not level• Adjust the laboratory stand
✓ Pivot point or jewel bearing faulty• Perform calibration check• Contact Brookfield Engineering Laboratories, Inc. or your Brookfield dealer for repair.
❏ Inaccurate Readings
✓ Verify spindle, speed and model selection.
✓ If % readings are under-range (less than 10%), the units display (%, cP, D/cm2, 1/sec) willflash; change spindle and/or speed.
✓ “EEEE” on the digital display means the unit is over-range (greater than 100%); reduce speedand/or change spindle.
✓ Verify test parameters: temperature, container, volume, method. Refer to:• “More Solutions to Sticky Problems”, Section III• DV-III Ultra Digital Rheometer Operating Instructions, Appendix C, “Variables in
Viscosity Measurements.”
✓ Perform a calibration check; follow the instructions in Appendix E.
✓ Verify tolerances are calculated correctly.
✓ Verify the calibration check procedures were followed exactly.
If the unit is found to be out of tolerance, the unit may be in need of service. See Appendix J fordetails on “How to Return Your Rheometer.”
❏ Display Reading Will Not Stabilize
✓ Special characteristic of sample fluid. There is no problem with the rheometer.• Refer to Appendix C
✓ Check for erratic spindle rotation• Verify power supply• Contact Brookfield Engineering Laboratories, Inc. or your Brookfield dealer for repair.
✓ Bent spindle or spindle coupling.• Contact Brookfield Engineering Laboratories, Inc. or your Brookfield dealer for repair.
✓ Temperature fluctuation in sample fluid• Use temperature bath control.
Brookfield Engineering Laboratories, Inc. Page 117 Manual No. M/98-211-B0104
❏ No Recorder Response
✓ Be sure the rheometer is not at ZERO reading.
✓ Be sure the recorder is ON and not on STANDBY.
✓ Verify the range settings.
✓ Check cable leads for clean connection.
❏ Recorder Pen Moves in Wrong Direction
✓ Output polarity reversed• Reverse leads
❏ Rheometer Will Not Communicate with PC
✓ Check the comm port setting and ensure the correct port on the PC is being utilized.
✓ Ensure that the rheometer has the appropriate communications cable (Communications) con-nected to it and that the opposite end of the cable is connected to a valid COM (serial) port onthe host PC).
✓ Ensure that the rheometer is powered “ON”.
✓ Ensure that the appropriate COM port is selected on the Main Toolbar of the EZ-YieldTM soft-ware.
✓ Ensure that "DV-III Ultra" is selected on the Main Toolbox of the EZ-Yield Software.
✓ If there is still erratic or no communication, check the following:• Click the START button. Select “Settings” then “Control Panel”. Double click the “System”
icon. Select the “Device Manager” tab. Select “Ports”, highlight the COM port in use andclick the PROPERTIES button (or double-click the COM port in use). Click “Port Settings”then “Advanced”.
• Ensure the check box labeled “Use FIFO buffers (requires 16550 compatible UART)” ischecked. Ensure that the sliders for the “Receive Buffer” and the “Transmit Buffer” are bothset all the way to the left (Low). Click the OK buttons to accept the changes and get back tothe desktop.
• If there is still a communication problem, follow the above procedure, but this time, un-check the box labeled “Use FIFO buffers (requires 16550 compatible UART)”. Again,check the OK buttons to accept the changes.
✓ Check the interconnecting cable for proper installation.

Brookfield Engineering Laboratories, Inc. Page 118 Manual No. M/98-211-B0104
✓ Contact Brookfield or an authorized dealer with the following information:• When the communication error occurs• The exact text displayed when the error occurs• Computer hardware details including processor speed, RAM, network cards, modems, etc.• Computer operating system• Total number of COM ports• List of Brookfield equipment attached to COM ports and their corresponding COM port
number
Brookfield Engineering Laboratories, Inc. Page 119 Manual No. M/98-211-B0104
APPENDIX J - Warranty Repair and Service
Warranty
Brookfield Viscometers are guaranteed for one year from date of purchase against defects in materialsand workmanship. They are certified against primary viscosity standards traceable to the NationalInstitute of Standards and Technology (NIST). The Viscometer must be returned to BrookfieldEngineering Laboratories, Inc. or the Brookfield dealer from whom it was purchased for no chargewarranty service. Transportation is at the purchaser’s expense. The Viscometer should be shipped inits carrying case together with all spindles originally provided with the instrument.
For repair or service in the United States, return to:
Brookfield Engineering Laboratories, Inc.11 Commerce Boulevard
Middleboro, MA 02346 U.S.A.
Telephone: (508) 946-6200 FAX: (508) 946-6262e-mail: sales@brookfield engineering.com website: www.brookfieldengineering.com
For repair or service outside the United States, consult Brookfield Engineering Laboratories, Inc. orthe dealer from whom you purchased the instrument.
For repair or service in the United Kingdom, return to:
Brookfield Viscometers Limited1 Whitehall Estate
Flex MeadowPinnacles West
Harlow, Essex CM19 5TJ, United Kingdom
Telephone: (44) 27/945 1774 FAX: (44) 27/945 1775e-mail: [email protected] website: www.brookfield.co.uk
For repair or service in Germany, return to:
Brookfield Engineering Laboratories Vertriebs GmbHBarbarossastrasse 3
D-73547 Lorch, Germany
Telephone: (49) 7172/927100 FAX: (49) 7172/927105e-mail: [email protected]
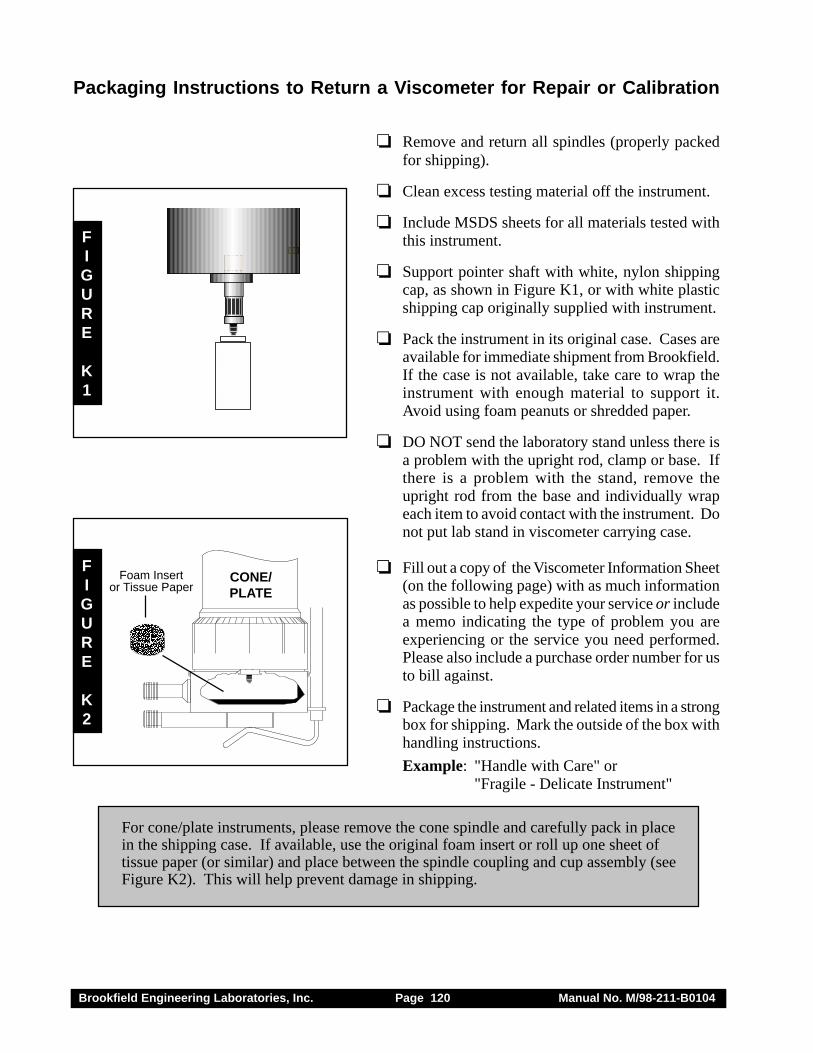
Brookfield Engineering Laboratories, Inc. Page 120 Manual No. M/98-211-B0104
❏ Remove and return all spindles (properly packedfor shipping).
❏ Clean excess testing material off the instrument.
❏ Include MSDS sheets for all materials tested withthis instrument.
❏ Support pointer shaft with white, nylon shippingcap, as shown in Figure K1, or with white plasticshipping cap originally supplied with instrument.
❏ Pack the instrument in its original case. Cases areavailable for immediate shipment from Brookfield.If the case is not available, take care to wrap theinstrument with enough material to support it.Avoid using foam peanuts or shredded paper.
❏ DO NOT send the laboratory stand unless there isa problem with the upright rod, clamp or base. Ifthere is a problem with the stand, remove theupright rod from the base and individually wrapeach item to avoid contact with the instrument. Donot put lab stand in viscometer carrying case.
❏ Fill out a copy of the Viscometer Information Sheet(on the following page) with as much informationas possible to help expedite your service or includea memo indicating the type of problem you areexperiencing or the service you need performed.Please also include a purchase order number for usto bill against.
❏ Package the instrument and related items in a strongbox for shipping. Mark the outside of the box withhandling instructions.
Example: "Handle with Care" or"Fragile - Delicate Instrument"
For cone/plate instruments, please remove the cone spindle and carefully pack in placein the shipping case. If available, use the original foam insert or roll up one sheet oftissue paper (or similar) and place between the spindle coupling and cup assembly (seeFigure K2). This will help prevent damage in shipping.
CONE/PLATE
Packaging Instructions to Return a Viscometer for Repair or Calibration
FIGURE
K1
FIGURE
K2
aaaaaaaaaaaaaaaaaaaaFoam Insertor Tissue Paper
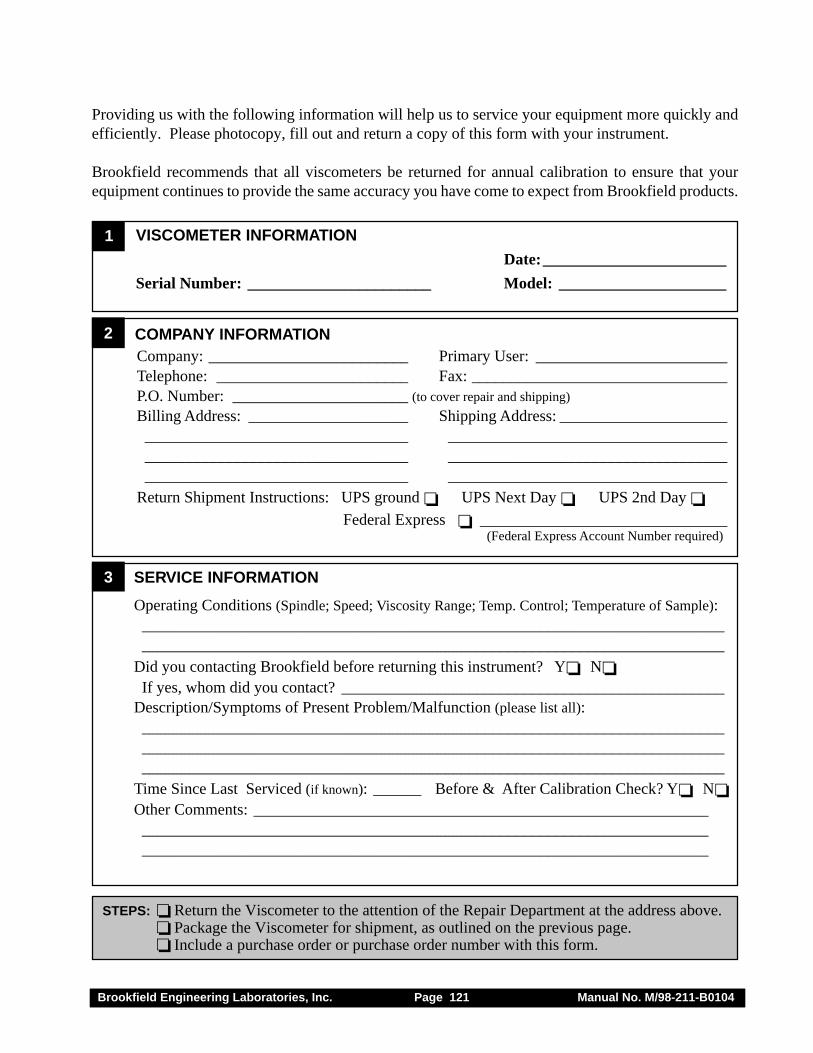
Brookfield Engineering Laboratories, Inc. Page 121 Manual No. M/98-211-B0104
Providing us with the following information will help us to service your equipment more quickly andefficiently. Please photocopy, fill out and return a copy of this form with your instrument.
Brookfield recommends that all viscometers be returned for annual calibration to ensure that yourequipment continues to provide the same accuracy you have come to expect from Brookfield products.
COMPANY INFORMATION
3 SERVICE INFORMATION
Operating Conditions (Spindle; Speed; Viscosity Range; Temp. Control; Temperature of Sample):__________________________________________________________________________________________________________________________________________________
Did you contacting Brookfield before returning this instrument? Y❏ N❏ If yes, whom did you contact? ________________________________________________Description/Symptoms of Present Problem/Malfunction (please list all):___________________________________________________________________________________________________________________________________________________________________________________________________________________________
Time Since Last Serviced (if known): ______ Before & After Calibration Check? Y❏ N❏Other Comments: _______________________________________________________________________________________________________________________________________________________________________________________________________
1
2
VISCOMETER INFORMATION
Date:_______________________
Serial Number: _______________________ Model: _____________________
Company: _________________________ Primary User: ________________________Telephone: ________________________ Fax: ________________________________P.O. Number: ______________________ (to cover repair and shipping)
Billing Address: ____________________ Shipping Address: ______________________________________________________ ____________________________________________________________________ ____________________________________________________________________ ___________________________________
Return Shipment Instructions: UPS ground ❏ UPS Next Day ❏ UPS 2nd Day ❏Federal Express ❏ _______________________________
(Federal Express Account Number required)
STEPS: ❏ Return the Viscometer to the attention of the Repair Department at the address above.❏ Package the Viscometer for shipment, as outlined on the previous page.❏ Include a purchase order or purchase order number with this form.
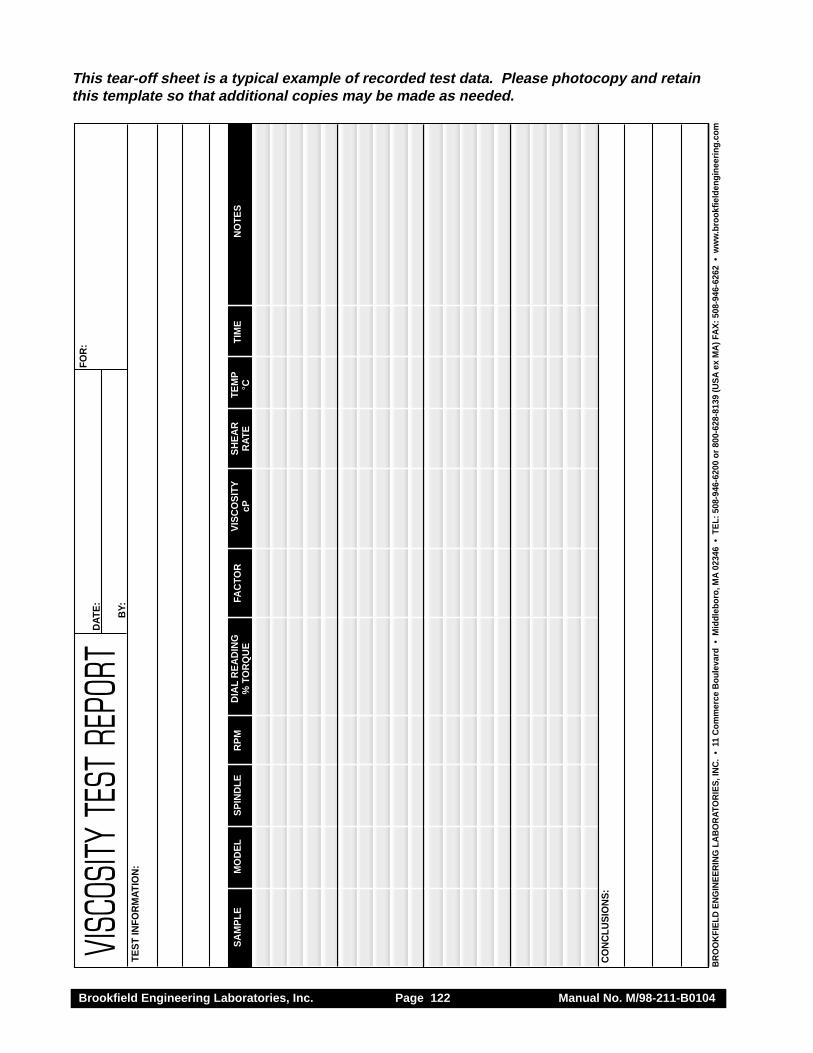
Brookfield Engineering Laboratories, Inc. Page 122 Manual No. M/98-211-B0104
VISC
OSIT
Y TE
ST R
EPOR
T
SA
MP
LEM
OD
EL
SP
IND
LER
PM
DIA
L R
EA
DIN
GFA
CTO
RV
ISC
OS
ITY
SH
EA
RTE
MP
TIM
EN
OTE
S%
TO
RQ
UE
cPR
ATE
°C
TES
T IN
FOR
MA
TIO
N:
CO
NC
LUS
ION
S:
FOR
:D
ATE
:
BY:
BR
OO
KFI
ELD
EN
GIN
EE
RIN
G L
AB
OR
ATO
RIE
S, I
NC
. •
11
Com
mer
ce B
oule
vard
• M
iddl
ebor
o, M
A 0
2346
• T
EL:
508
-946
-620
0 or
800
-628
-813
9 (U
SA
ex
MA
) FA
X: 5
08-9
46-6
262
• w
ww
.bro
okfie
lden
gine
erin
g.co
m
This tear-off sheet is a typical example of recorded test data. Please photocopy and retainthis template so that additional copies may be made as needed.