
Brookfield Infrastructure Partners/media/Files/B/Brookfield-BIP-IR/IR Day... · Today’s Agenda...
76
Brookfield Infrastructure Partners INVESTOR DAY SEPTEMBER 26, 2018
Transcript of Brookfield Infrastructure Partners/media/Files/B/Brookfield-BIP-IR/IR Day... · Today’s Agenda...

Brookfield Infrastructure Partners
INVESTOR DAY
SEPTEMBER 26 , 2018

Today’s Agenda
2018 – A Quick RecapSam Pollock, Chief Executive Officer
3
Spotlight on our Midstream Business Hillary Higgins, Vice President, Strategic Initiatives
17
Capital Allocation ModelBahir Manios, Chief Financial Officer
32
Capital Recycling Sam Pollock, Chief Executive Officer
57
2
Use this layout at the intro to show the breakdown of your presentation

2018 – A Quick Recap
divider slides prior to issuing this deck.
3

BIP’s second decade is off to a good start!
$1.3 billion sale of Transelec
Deploying up to $1.8 billion in six new investments
~$350 million in organic growth initiatives
‘Same-store’ FFO growth of 9%1
4
1) YTD, on a constant-currency basis

We increased our annual distribution by 8%…
5
$0.71 $0.73
$0.88
$1.00
$1.15
$1.28
$1.41
$1.55
$1.74
$1.88
2009 2010 2011 2012 2013 2014 2015 2016 2017 2018F
11%CAGR
8%

… and continued to deliver long-term value for unitholders
6
Annualized total returnsAs at Sept 21/18 1 Year 3 Year 5 Year 10 Year
BIP (6%) 21% 15% 19%
BIP.UN (3%) 19% 20% 25%1
2008 2009 2010 2011 2012 2013 2014 2015 2016 2017 2018
BIP (NYSE)
S&P 500 Index
DJB Global Infra IndexS&P Utilities Index Alerian MLP Index
1) BIP (TSX) returns since inception (September 2009)

2018 is a year of asset rotation
7

Completed sale of Transelec in March 2018
8
$1.3BSALE PROCEEDS
4.3xMULTIPLE OF
CAPITAL
16%IRR
12YEAR HOLD

9
POLLING QUESTION #1
Which of BIP’s operating segments do you believe will
experience the greatest growth in the next five years?
a) Utilities
b) Transport
c) Energy
d) Data Infrastructure
Keep text options left aligned and centered

We are investing up to $1.8 billion into six new businesses1
10
1) Aside from Gas Natural Colombia, each of these investments remains subject to customary conditions to completion.
$0.1BREGULATED
UTILITIES
$0.3BDATA
INFRASTRUCTURE
$1.4BENERGY

Acquired attractive Colombian regulated utility
11
Gas Natural Colombia
$1.0BENTERPRISE VALUE
• Second largest gas distribution system
in Colombia
• Over 21,000 km pipeline network
• Serves ~2.9 million customers
• BIP equity investment – ~$90 million

We entered the U.S. Data Center market…
12
U.S. Data Center
Business1
$1.1BENTERPRISE VALUE
• Large-scale, multi-tenant retail
colocation provider
• 31 well-located data centers
• Customer base of over 1,100 companies
• BIP equity investment – ~$160 million
1) Subject to customary conditions to completion.

…and expanded our presence into the South American market
13
South American Data Center
Business1
$2.3BENTERPRISE VALUE
• Leading hyperscale data center owner in
South America
• Eight existing assets, six facilities under
construction, 4,300 km fibre network
• Predominantly USD-denominated revenues
• Co-controlling investment with Digital Realty
• BIP equity investment – ~$200 million
1) Subject to customary conditions to completion.

Dislocation in North American energy market is driving opportunities
14
NorthRiver1
$3.3BENTERPRISE VALUE
• Largest independent natural gas gathering
and processing operation in Canada
• 19 facilities; operating capacity of 3.3 bcf/d
• 10-year weighted average contract life
• BIP equity investment – ~$540 million
1) Subject to customary conditions to completion.

We took a mispriced public company private
15
North American
Residential Energy
Infrastructure Business1
$3.3BENTERPRISE VALUE
• Leading provider of essential residential
energy infrastructure and home services
• Annuity-like business with well-established
market position
• Serves 1.8 million customers
• BIP equity investment – ~$630 million
1) Subject to customary conditions to completion.

In advanced discussions to acquire high-quality energy assets in India
16
Indian Natural Gas
Transmission Business
$2.0BENTERPRISE VALUE
• 1,480 km cross-country gas pipeline
• Vital link in India’s national gas grid
• 20-year take-or-pay contract
• BIP equity investment – up to ~$200 million

Spotlight on our Midstream Business
divider slides prior to issuing this deck.
17

18
Since 2015, we have transformed
our energy business
and have expanded globally…
Below is sample of a statement slide to be used only for a key fact or message.

Our midstream business has gone through a period of significant growth
19
~20% FFO
~5% FFO
20184 countries
$3.2 billion invested1
1) Reflects recently announced transactions including pending Indian natural gas transmission transaction
20151 country
$0.5 billion invested

We built this business by capitalizing on contrarian views
20
2009 2016
Initial investment in U.S.
Gas Transmission
(~25% stake)
$4 billion
Brazilian
Regulated Gas
Transmission
$5.2 billion
Western Canadian
Midstream1
$3.3 billion
North American Dislocation
Crisis in Brazil
2015
Doubled-down
on our U.S. Gas
Transmission
North American
Gas Storage
$800 million
2018
Indian Natural Gas
Transmission1
$2.0 billion
1) Western Canadian Midstream business is subject to customary conditions to completion; Indian Natural Gas Transmission business is in advanced discussions.

SERVICE REGION
We are an established midstream owner/operator
21
North America Brazil India1
~18,500KMOF PIPELINES
600BcfOF GAS STORAGE
CAPACITY
GAS STORAGE PIPELINE
1) Indian Natural Gas Transmission business is in advanced discussions.

Our businesses serve a critical component of the value chain
They provide gathering & processing, storage and transport
for the following essential uses:
22
Industrial and
Manufacturing
Clients
Electricity
Generation
Local Distribution
Companies for
Residential Use

We secured an attractive midstream business located in a prolific basin1
• Strategic position in Montney region
• Take-or-pay contracts with investment-
grade counterparties
• Over 40 years of drilling inventory
• Significant takeaway capacity to high
demand areas of Canada and the U.S.
23
1) Subject to customary conditions to completion.

In advanced discussions to invest in cross-country pipeline in India
• 11 compressor stations with over 900 MW
of power installed and two pipeline
operation centers
• Favorable supply-demand dynamics
• High-quality cash flows, backed by take-or-
pay contracts
• One of the best managed and operated
pipeline assets in the world
24
KG Basin
Mumbai-
Saurashtra
Basin
Mahanadi
Basin
Ennore
Kochi
Dhabol
Dahej
Hazira
Mundra
Natural Gas Basin
Existing Sources into EWP
Upcoming Sources into EWP
East West Pipeline
GAIL Pipeline Network
Existing LNG Terminals
Under Construction LNG Terminals
GSPL Pipeline Network

We are excited about the prospects in the midstream sector
We evaluate opportunities across all commodities,
however, our transaction activity to-date has focused on natural gas
25
Core Infrastructure
Characteristics
Significant
Growth Potential
Well-established
Owner/operator
• Provision of essential service
• Strategically located & difficult to replicate
• High-quality cash flows
• Emergence of new resources and continued
growing demand
• Large funding gap for infrastructure build-out
• ~40 years of investment experience
• Deep institutional knowledge

26
POLLING QUESTION #2
Which North American energy basin presents the most
attractive opportunity in the next five years?
a) Permian
b) Marcellus
c) Gulf Coast
d) Montney
e) Canadian Oil Sands
Keep text options left aligned and centered

The size of the North American natural gas market is unparalleled
• Emergence of shale resources driving substantial infrastructure investment
• Natural gas demand is at an all-time high
• U.S. has evolved from being a net importer to net exporter of energy
27
0
20
40
60
80
100
120
140
0
2
4
6
8
10
12
14
2000 2007 2014 2021 2028
U.S. Natural Gas and Crude Oil Production
Crude Oil Production, MMb/d (LHS) Natural Gas Production,Bcf/d (RHS)
1
1) U.S. Energy Information Administration historical and 2018 Annual Energy Outlook

The current investable universe is large…
There is ~$150 billion of energy
infrastructure opportunities in the U.S.
28

~$40 billionof energy infrastructure MLPs
seeking structural simplification
These are the opportunities that we are focused on
29
Creates large pipeline of prospective
proprietary opportunities of scale
~$100 billionof midstream capex expected
through 2021

We are also focused on other regions globally
30
India
• Privatization of government-owned pipelines and LNG terminals
• Robust gas demand expected
• Domestic gas supply increasingly competitive
Mexico
• Existing infrastructure inadequate to meet growing demand
• >$100 billion investment to develop onshore and offshore fields
Australia
• Investments in LNG infrastructure
• Opportunity to consolidate ownership interests in multi-user assets

Where do we go from here?
We will continue to pursue midstream assets for good value, using the same
proven strategy
31
Large corporate
acquisitions
& JVs
1 2
Asset sales
from
mega-mergers
3
Carve-outs
Capital Allocation Model
32
divider slides prior to issuing this deck.

Today’s agenda
33
Financial
Report Card
1 2
Self-Funded
Organic Growth Model

2018 Financial Report Card
34
Financial Performance
Balance Sheet Strength
Financial Risk Management

Financial results so far in 2018 have been solid…
• Current FFO/Unit run-rate as of Q2’18 of $3.00 is 4% lower than prior year
• Robust organic growth of ~8% – offset by impacts from:
i. Foreign exchange – Appreciation of U.S. dollar
ii. Timing issues – Redeployment of proceeds from asset sales
iii. One time events – Nation-wide truck driver strike in Brazil
35

… and the outlook is strong
36
Contribution from newly-acquired businesses
Organic growth at mid range of LT target
of 6-9%
Improved foreign exchange hedge rates2018 currentrun-rate
Pro-formarun-rate
$3.00
$3.60
FFO/unit
1
20%
1) Holding BRL FX constant

Key metrics remain robust
Metrics are expected to have good upward momentum going forward,
given embedded organic growth in the business
37
2017 2018F 2017 2018F
$1.8B
$2.0B
$6.7B
$7.5B
Maintaining margin profile
55%
Adjusted EBITDA Invested Capital
Increasing ROIC
13% to 14%
+11%+12%
1) Constant currency basis
2) Constant currency basis and adjusting for impact of cash on hand, yet to be deployed
1 2

Financial position is solid
38
• Secured deals fully funded
• $500 million – $1 billion of
advanced asset sale
processes ongoing
• Avg. term to maturity of eight
years at operating level
• No significant maturities in
next five years
• 90% of debt is fixed rate1
• ~85% of debt non-recourse
• Corporate interest
coverage of ~25x
• Completed over $4 billion
of financings
1) Excludes Brazil where fixed rate market is not available
$3.5BCORPORATE
LIQUIDITY
<5%DEBT MATURING IN
NEXT TWO YEARS
BBB+CORPORATE
RATING

Our cash flows have become more diversified
Objective is to have 80-85% of our FFO be either
generated in, or hedged to, U.S. dollars
39
EUROPE
25%
SOUTH AMERICA
30%ASIA PACIFIC
20%
Secured Transactions
✓ Enercare
✓ NorthRiver
✓ U.S. Data Centers
UTILITIES
TRANSPORT
NORTH AMERICA
25%
ENERGY
DATA INFRASTRUCTURE

This year’s discussion:
Self-funded organic growth model
40

41
POLLING QUESTION #3
How do you measure our ability to pay distributions?
a) Available liquidity
b) Consolidated Operating Cash Flows
c) Funds from Operations
d) Adjusted Funds from Operations
e) Net Income
Keep text options left aligned and centered

Our funding plan for our
“base business” works as follows…
42

Capital allocation model
43
~15%Retained for funding of recurring growth capex
~65%Distributed to unitholders
Every $1 of
FFO
~20%Maintenance Capex

Before we get into this further,
it’s important to discuss why
proportionate results are used
in evaluating capital allocations decisions
44

Proportionate results best reflect underlying cash flows
45
2Incorporate earnings
of entities that are
not consolidated
i.e., Joint ventures and
strategic partnerships
~40%of FFO
Eliminate earnings
attributable to
minority interests
i.e., Consolidated entities that
BIP does not wholly own
1

Our “Big Four” unconsolidated businesses
Common denominator:
significant economics, strategic alignment and strong governance
46
Comprise 30%
of FFO
TDF€5B French Telecom Business
• 45% interest; largest shareholder
• Control operating committee
NGPL$4B U.S. Gas Transmission Network
• 50/50 JV with Kinder Morgan
• Co-control; equal partners on all committees
ArterisR$20B Brazilian Toll Road Operation
• 58% interest
• Joint control over operating committees
with Abertis
PatrickA$3B Aus. Container Terminal Business
• 50/50 JV with Qube
• Co-control; equal partners on all
committees

Fundamental limitation of consolidated cash flow presentation
47
Consolidated cash flow from operating activities
only reflects net cash received from
equity accounted investments
Investing and financing activities are
presented on net basis
i.e. distributions are presented after
maintenance and growth capital
investments, and debt amortization

Illustrated using a simple example
Analyzing proportionate results gives a better sense as to how much
we are investing in the business and how we finance our activities
48
US millions
51%(Consolidated)
50% JV (Equity Accounted)
Operating Activities
Funds from Operations (proxy) $ 200 $ 45
200 45
Investing Activities
Growth Capex (150) –
Maintenance Capex (20) –
(170) –
Financing Activities
Proceeds from debt issuance 60 –
Distributions to non-controlling interests (45) –
15 –
Net Cash Flows $ 45 $ 45

Let’s review the historical track record of
how we have allocated our capital
49

We have reinvested ~20% of our FFO into maintenance capex…
50
For the year ended Dec. 31
in US millions 2017 2016 2015 2014 2013 Total
Maintenance Capex $ 229 $ 173 $ 136 $ 131 $ 129 $ 798
Average spend as a % of FFO 18%

…and retained and reinvested excess cash into accretive growth projects
51
For the year ended Dec. 31
in US millions 2017 2016 2015 2014 2013 Total
Recurring capex projects $ 388) $ 326) $ 324) $ 275) $ 228)
Debt funding (216) (178) (197) (153) (130)
Equity funding $ 172) $ 148) $ 127) $ 122) $ 98) $ 667)
Percentage of FFO 15%
Large-scale expansion projects $ 505) $ 517) $ 273) $ 336) $ 276)
Debt funding of expansions (257) (282) (167) (186) (158)
Equity funding $ 248) $ 235) $ 106) $ 150) $ 118) $ 857)
Total Gross Capex $ 893 $ 843 $ 597 $ 611 $ 504 $ 3,448

Our current backlog of growth projects is broken down as follows…
$2 billion committed capital backlog(~50% debt funded over 24 – 36 months)
52
− Home connections in the U.K.
− De-bottlenecking expansions
− Brazil electricity transmission
buildout
− Smart meter expansions
− Fibre-to-the-home roll-outs
Equity requirements funded through
new capital injections from BIP
Equity requirements funded through
retained operating cash flows
(or ~$200 million per year)
$1.2BLARGE-SCALE EXPANSIONS
$800MRECURRING PROJECTS

…and we generate a meaningful amount of operating cash flows
We generate a significant amount of operating cash flows which we use to fund recurring
capex and distributions to unitholders
53
For the year ended Dec. 31
in US millions 2017 2016 2015
Cash flow from operations $ 1,481 $ 753 $ 632
Add: FFO generated by Equity Accounted Investments 584) 454) 341)
Subsidiary distributions to non-controlling interests (831) (169) (91)
Maintenance capital expenditures (229) (173) (136)
Adjusted free cash flow from operations $ 1,005 $ 865 $ 746
From Note 4 of audited financial statements
Converting consolidated cash flows to proportionate

54
Funding sources for historical investments
in US millions 2017 2016 2015 2014 2013 Total
Capital Market Issuances $ 1,341) $ 935) $ 1,792) $ 2) $ 338) $ 4,408)
Proceeds from capital recycling ─) 1,317) 28) ─) 1,097) 2,442)
$ 1,341) $ 2,252) $ 1,820) $ 2) $ 1,435) $ 6,850)
We’ve raised $6.9 billion over the last five years
in US millions 2017 2016 2015 2014 2013 Total
Capital deployed in M&A $ 1,902) $ 1,476) $ 1,673) $ 539) $ 569) $ 6,159)
Large-scale expansions 248) 235) 106) 150) 118) 857)
$ 2,150) $ 1,711) $ 1,779) $ 689) $ 687) $ 7,016)
And deployed it into M&A and large-scale expansions

Distributions have represented ~65% of our total FFO
55
For the year ended Dec. 31
in US millions 2017 2016 2015 2014 2013 Total
FFO (Proportionate) $ 1,170 $ 944 $ 808 $ 724 $ 682 $ 4,328
Distributions (LP, GP, Prefs) 794 628 546 448 388 2,804
Payout Ratio 68% 67% 68% 62% 57% 65%

56
To summarize
BIP generates significant free cash flow
Recurring organic growth is funded by operating cash flows
New investment activities and large scale expansions are funded from
asset sales and capital market raises

Capital Recycling
57
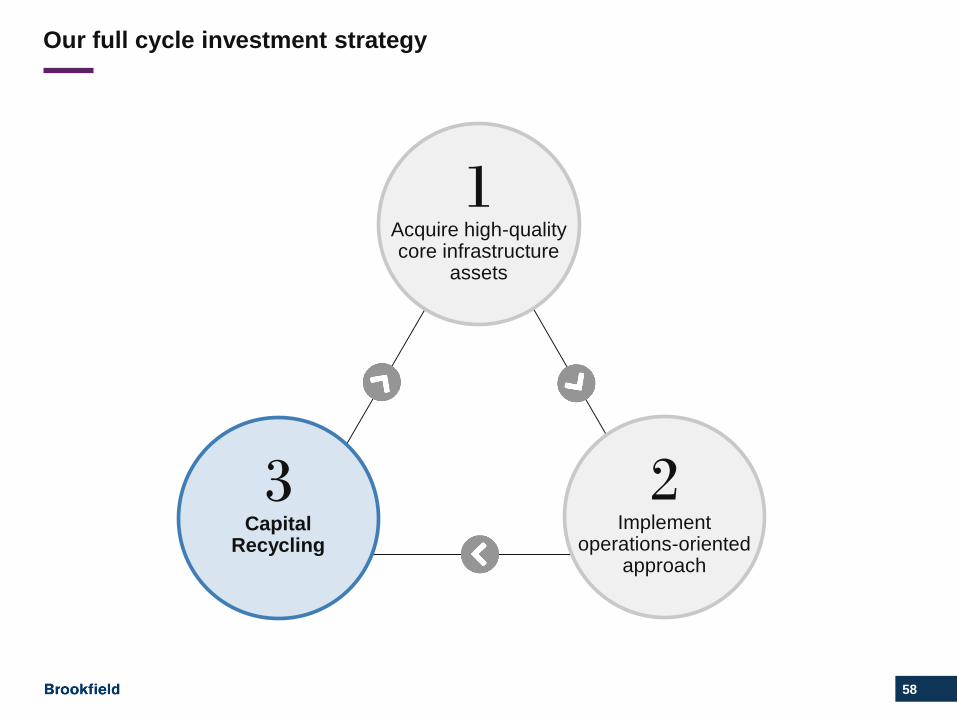
Our full cycle investment strategy
58
Acquire high-quality core infrastructure
assets
1
Capital Recycling
3Implement
operations-oriented approach
2

Why is capital recycling important to BIP?
59
Key Value
Creation Lever
1 2
Alternative
Source of Capital
3
Capital
Discipline

Most infrastructure businesses reach a maturity point
Maturity Profile
60
Operational
Enhancements
Capital
Expansion
ACQUISITION
MATURITY
Capacity
Utilization
Capital appreciation/same-store growth

Value is created by exchanging high-return assets for low-return assets
61
Sell mature assets
6-10% IRRs
Acquire growing assets
12-15%+ IRRs

Recycling of Transelec proceeds into new investments will be very accretive
Recent example…
62
Transelec Recently AnnouncedAcquisitions
4%Accretion
7%
FFO
Yield
11%
FFO
Yield
1
Transelec Recently AnnouncedAcquisitions
~2-3%
Growth
~5-7%
Growth
1
Initial FFO Yield Same-Store Growth Rate
1) Comprised of recently-announced U.S. data center acquisition, Western Canadian midstream business and North American residential energy infrastructure business, each of
which remains subject to customary closing conditions.

Better to sell off 100% of low growth businesses at attractive rates than issue stock
By choosing to recycle capital, we increase returns to unitholders
by avoiding dilution on our high-growth businesses
63
Why not just issue equity?
We have two choices:
Sell mature/
low growth assets
Issuing
Equity

Capital recycling further increases per unit growth from new investments
64
Recycle Capital Issue Equity Baseline
3%
5%

Capital discipline
ensures that businesses are sold when
returns are maximized,
not when cash is “needed”
65

Our track record demonstrates the benefits of this strategy
66
Initial Investments
100% 100%
32%
% of
assets sold
Pre-2008 2010Assets
held at spinoff
PPPs BBI
~25%CUMULATIVE
IRR
8 yearsAVERAGE HOLDING
PERIOD
10BUSINESSES
SOLD
$3.3BPROCEEDS
GENERATED

Capital recycling considerations
67
Sale processes can
be lengthy and
uncertain
Need to redeploy
capital – may result in
periods of excess
liquidity
Creates perception
of change in
risk profile

Multiple sources of capital available throughout business cycle
68
1Line of Credit
3Asset Sale
Proceeds
2Issue Prefs, Debt
or Equity

We are confident in our ability to redeploy capital
69
2006
2018
Transelec
BBI
BUUK
AVN &
Arteris
VLI
TDF
NTS
Enercare1
NorthRiver1
OF EQUITY
CAPITAL
DEPLOYED
>$27B
1) Subject to customary conditions to completion.

It is unlikely that any individual sale represents more than +/-5% of FFO
70
Asset recycling doesn’t change the risk profile
Year Zero Year Seven
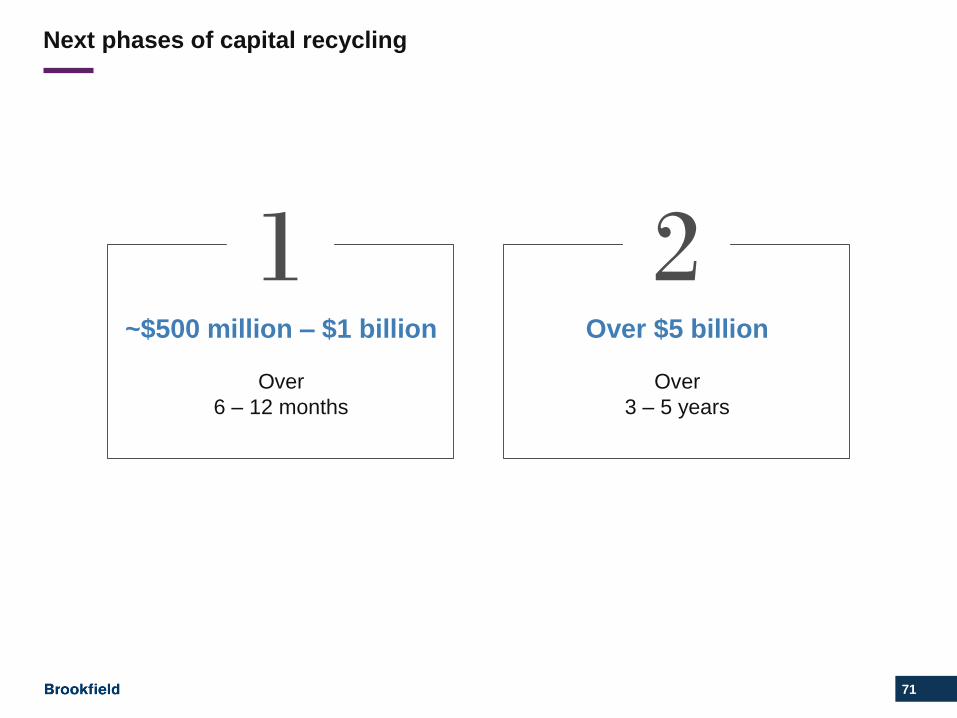
Next phases of capital recycling
71
2Over $5 billion
Over
3 – 5 years
~$500 million – $1 billion
Over
6 – 12 months
1

72
POLLING QUESTION #4
Which asset should BIP never sell?
a) BUUK (U.K. Regulated Distribution)
b) DBCT (Australian Regulated Terminal)
c) Arc (Australian Railroad)
d) NGPL (U.S. Gas Transmission)
e) Every asset has its price
Keep text options left aligned and centered

Takeaways
73
Exciting period
of growth underway1More opportunities
in data and energy2
Internally funded
organic growth3Disciplined approach
to capital recycling 4

Q&A
74

Important Cautionary Notes
All amounts are in U.S. dollars unless otherwise specified. Unless otherwise indicated, the statistical and financial data in this presentation is presented as of June 30, 2018.
DISCLAIMER
This presentation has been prepared for informational purposes only from information supplied by Brookfield Infrastructure and from third-party sources indicated herein. Such third-party information has notbeen independently verified. Brookfield Infrastructure makes no representation or warranty, expressed or implied, as to the accuracy or completeness of such information.
CAUTION REGARDING FORWARD-LOOKING STATEMENTS
This presentation contains “forward-looking information” within the meaning of Canadian provincial securities laws and “forward-looking statements” within the meaning of Section 27A of the U.S. Securities Actof 1933, as amended, Section 21E of the U.S. Securities Exchange Act of 1934, as amended, “safe harbor” provisions of the United States Private Securities Litigation Reform Act of 1995 and in any applicableCanadian securities regulations. The words “expect”, “estimate”, “anticipate”, “plan”, “believe”, “seek”, “intend”, “forecast”, “project”, “target” or derivatives thereof and other expressions which are predictions ofor indicate future events, trends or prospects and which do not relate to historical matters identify the above mentioned and other forward-looking statements and information. Forward-looking statements andinformation in this presentation include statements regarding expansion of Brookfield Infrastructure’s business, growth in FFO, participating in a growing asset class, the likelihood and timing of successfullycompleting the transactions and other initiatives referred to in this presentation, the integration of newly acquired businesses into our existing operations, the future prospects and financing of the assets thatBrookfield Infrastructure operates or will operate, commissioning of our capital backlog, availability of investment opportunities, our intention to maintain an investment grade credit rating, the continued growthof Brookfield Infrastructure and its businesses in a competitive infrastructure sector, future revenue and distribution growth prospects in general and other statements with respect to our beliefs, outlooks, plans,expectations and intentions. These forward-looking statements and information are not historical facts but reflect our current expectations regarding future results or events and are based on informationcurrently available to us and on assumptions we believe are reasonable. Although we believe that our anticipated future results, performance or achievements expressed or implied by these forward-lookingstatements and information are based on reasonable assumptions and expectations, the reader should not place undue reliance on forward-looking statements and information because they involveassumptions, known and unknown risks, uncertainties and other factors which may cause our actual results, performance or achievements to differ materially from anticipated future results, performance orachievements expressed or implied by these forward-looking statements and information. These beliefs, assumptions and expectations can change as a result of many possible events or factors, not all ofwhich are known to us or are within our control. If a change occurs, our business, financial condition, liquidity and results of operations and our plans and strategies may vary materially from those expressed inthe forward-looking statements and information herein.
Factors that could cause actual results of Brookfield Infrastructure to differ materially from those contemplated or implied by the statements in this presentation include general economic conditions in thejurisdictions in which we operate and elsewhere which may impact the markets for our products and services, the ability to achieve growth within Brookfield Infrastructure’s businesses and in particularcompletion on time and on budget of various large capital projects, which themselves depend on access to capital and continuing favorable commodity prices, the impact of market conditions on ourbusinesses, the fact that success of Brookfield Infrastructure is dependent on market demand for an infrastructure company, which is unknown, the performance of global capital markets, the availability andterms of equity and debt financing for Brookfield Infrastructure, the ability to effectively complete transactions in the competitive infrastructure space (including the ability to complete announced and potentialtransactions that may be subject to conditions precedent, and the inability to reach final agreement with counterparties to transactions being currently pursued, given that there can be no assurance that anysuch transaction will be agreed to or completed) and to integrate acquisitions into existing operations, the future performance of these acquisitions, the market conditions of key commodities, the price, supply ordemand for which can have a significant impact upon the financial and operating performance of our business, changes in technology which have the potential to disrupt the business and industries in which weinvest, uncertainty with respect to future sources of investment opportunities, our ability to achieve the milestones necessary to deliver the targeted returns to our unitholders, our active pipeline of newinvestment opportunities and growing backlog of committed organic growth capital expenditure projects may not be completed as planned, and other risks and factors described in the documents filed byBrookfield Infrastructure Partners L.P. (the “Partnership”) with the securities regulators in Canada and the United States including under “Risk Factors” in the Partnership’s most recent Annual Report on Form20-F and most recent interim report and other risks and factors that are described therein. Except as required by law, Brookfield Infrastructure undertakes no obligation to publicly update or revise any forward-looking statements or information, whether as a result of new information, future events or otherwise.
IMPORTANT NOTE REGARDING NON-IFRS FINANCIAL MEASURES
To measure performance we focus on net income as well as funds from operations (“FFO”), adjusted funds from operations (“AFFO”), adjusted EBITDA, rate base, return on rate base, adjusted EBITDA tointerest ratio, consolidated leverage, corporate interest coverage, constant currency basis and adjusted EBITDA margin, which we refer to throughout this presentation. We define FFO as net income excludingthe impact of depreciation and amortization, deferred income taxes, breakage and transaction costs and non-cash valuation gains or losses. We define AFFO as FFO less maintenance capital expenditures. Wedefine adjusted EBITDA as net income excluding the impact of depreciation and amortization, interest expense, current and deferred income taxes, breakage and transaction costs and non-cash valuation gainsor losses. We define rate base as a regulated or notionally stipulated asset base. We define return on rate base as adjusted EBITDA divided by time weighted average rate base. We define adjusted EBITDA tointerest ratio as adjusted EBITDA divided by interest expense on a proportionate basis, taking into account Brookfield Infrastructure’s ownership in operations. We define consolidated leverage as net debtdivided by net debt plus the market value of Brookfield Infrastructure based on the closing price of Brookfield Infrastructure’s units on the New York Stock Exchange (assuming full conversion of Brookfield’sinterest in Brookfield Infrastructure into units of Brookfield Infrastructure). We define corporate interest coverage as AFFO plus interest expense incurred on corporate debt divided by interest expense incurredon corporate debt. We define constant currency basis as current period earnings translated at prior period foreign exchange rates which allows the Partnership to remove the impact of changes in rates fromour operating results. We define adjusted EBITDA margin as adjusted EBITDA divided by revenues. These measures are not calculated in accordance with, and do not have any standardized meaningprescribed by International Financial Reporting Standards (“IFRS”). These measures are therefore unlikely to be comparable to similar measures presented by other issuers. These measures have limitationsas analytical tools. See the Reconciliation of Non-IFRS Financial Measures section of the Partnership’s most recent Annual Report on Form 20-F and most recent interim report for a more fulsome discussionincluding reconciliations to the most directly comparable IFRS measures.
75

Brookfield Infrastructure Partners
INVESTOR DAY
SEPTEMBER 26 , 2018