Brookfi eld Infrastructure Partners L.P./media/Files/B/Brookfield-BIP-IR/... · Brookfi eld...
33
Brookfield Infrastructure Partners L.P. UNAUDITED INTERIM CONDENSED CONSOLIDATED AND COMBINED FINANCIAL STATEMENTS AS OF MARCH 31, 2011 (U.S. DOLLARS IN MILLIONS) INDEX Page Unaudited Interim Condensed Consolidated and Combined Statements of Financial Position of Brookfield Infrastructure Partners L.P. 2 Unaudited Interim Condensed Consolidated and Combined Statements of Operating Results of Brookfield Infrastructure Partners L.P. 3 Unaudited Interim Condensed Consolidated and Combined Statements of Comprehensive Income of Brookfield Infrastructure Partners L.P. 4 Unaudited Interim Condensed Consolidated and Combined Statements of Partnership Capital of Brookfield Infrastructure Partners L.P. 5 Unaudited Interim Condensed Consolidated and Combined Statements of Cash Flows of Brookfield Infrastructure Partners L.P. 6 Notes to Unaudited Interim Condensed Consolidated and Combined Financial Statements of Brookfield Infrastructure Partners L.P. 7 Management’s Discussion and Analysis 12 Brookfield Infrastructure Partners L.P. (the "partnership" and together with its subsidiary and operating entities "Brookfield Infrastructure") owns and operates high quality, long-life assets that generate stable cash flows, require relatively minimal maintenance capital expenditures and, by virtue of barriers to entry or other characteristics, tend to appreciate in value over time. Our current operations consist of utility businesses, transport and energy businesses and freehold timberlands in North and South America, Australasia and Europe. Brookfield Asset Management Inc. ("Brookfield") has an approximate 30% interest in Brookfield Infrastructure. Brookfield Infrastructure has appointed Brookfield as their Manager to provide certain management, administrative and advisory services, for a fee, under the Master Services Agreement.
Transcript of Brookfi eld Infrastructure Partners L.P./media/Files/B/Brookfield-BIP-IR/... · Brookfi eld...

Brookfi eld Infrastructure Partners L.P.
UNAUDITED INTERIM CONDENSED CONSOLIDATED AND COMBINED FINANCIAL STATEMENTS
AS OF MARCH 31, 2011 (U.S. DOLLARS IN MILLIONS)
INDEX
Page
Unaudited Interim Condensed Consolidated and Combined Statements of Financial Position of Brookfi eld Infrastructure Partners L.P.
2
Unaudited Interim Condensed Consolidated and Combined Statements of Operating Results of Brookfi eld Infrastructure Partners L.P.
3
Unaudited Interim Condensed Consolidated and Combined Statements of Comprehensive Income of Brookfi eld Infrastructure Partners L.P.
4
Unaudited Interim Condensed Consolidated and Combined Statements of Partnership Capital of Brookfi eld Infrastructure Partners L.P.
5
Unaudited Interim Condensed Consolidated and Combined Statements of Cash Flows of Brookfi eld Infrastructure Partners L.P. 6
Notes to Unaudited Interim Condensed Consolidated and Combined Financial Statements of Brookfi eld Infrastructure Partners L.P.
7
Management’s Discussion and Analysis 12
Brookfi eld Infrastructure Partners L.P. (the "partnership" and together with its subsidiary and operating
entities "Brookfi eld Infrastructure") owns and operates high quality, long-life assets that generate stable cash
fl ows, require relatively minimal maintenance capital expenditures and, by virtue of barriers to entry or other
characteristics, tend to appreciate in value over time. Our current operations consist of utility businesses,
transport and energy businesses and freehold timberlands in North and South America, Australasia and
Europe.
Brookfi eld Asset Management Inc. ("Brookfi eld") has an approximate 30% interest in Brookfi eld Infrastructure.
Brookfi eld Infrastructure has appointed Brookfi eld as their Manager to provide certain management,
administrative and advisory services, for a fee, under the Master Services Agreement.

2 Brookfi eld Infrastructure Partners | 2011 First Quarter Interim Report
BROOKFIELD INFRASTRUCTURE PARTNERS L.P.
UNAUDITED INTERIM CONDENSED CONSOLIDATED AND COMBINED STATEMENTS OF FINANCIAL POSITION
As of
US$ MILLIONS, UNAUDITED Notes March 31, 2011 December 31, 2010
AssetsCash and cash equivalents $ 259 $ 154Accounts receivable and other 176 187Inventory 52 38Financial assets (current) 5 6Assets classifi ed as held for sale 1,872 1,859Current assets 2,364 2,244
Property, plant and equipment 4 3,115 2,995
Intangible assets 2,934 2,903Standing timber 2,574 2,578Investments in associates 3 1,079 1,069Goodwill 591 591Investment properties 179 175Financial assets (non-current) 120 118Other assets (non-current) 62 59Deferred income tax asset 438 377Total assets $ 13,456 $ 13,109
Liabilities and partnership capitalAccounts payable and other $ 275 $ 240Non-recourse borrowings (current) 301 615Financial liabilities (current) 28 29Liabilities directly associated with assets classifi ed as held for sale 1,872 1,859Current liabilities 2,476 2,743
Corporate borrowings 103 18Non-recourse borrowings (non-current) 4,378 3,960Financial liabilities (non-current) 101 97Other liabilities (non-current) 278 261Deferred income tax liabilities 1,093 1,025Preferred shares 20 20Total liabilities 8,449 8,124
Partnership capital
Limited partners' capital 6 2,881 2,881
General partner's capital 6 19 19
Retained earnings 299 302Other comprehensive income 186 178Non-controlling interest 1,622 1,605Total partnership capital 5,007 4,985Total liabilities and partnership capital $ 13,456 $ 13,109
The accompanying notes are an integral part of these fi nancial statements.
Brookfi eld Infrastructure Partners | 2011 First Quarter Interim Report 3
BROOKFIELD INFRASTRUCTURE PARTNERS L.P.
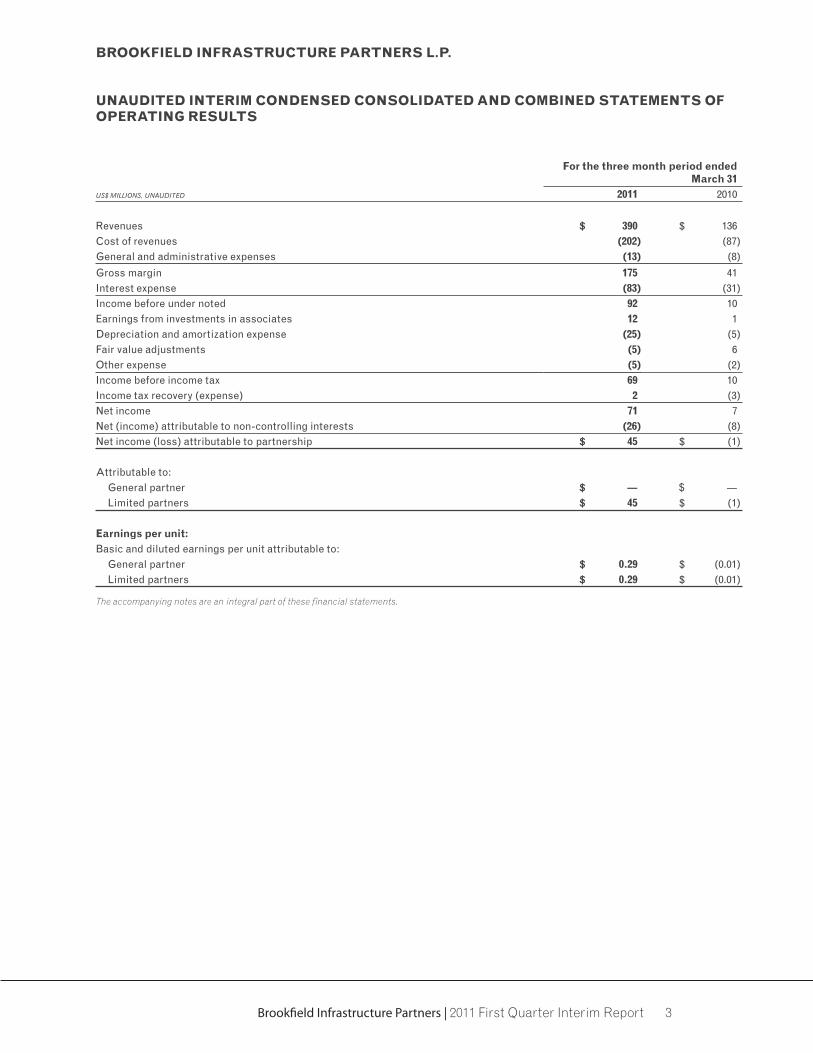
UNAUDITED INTERIM CONDENSED CONSOLIDATED AND COMBINED STATEMENTS OF OPERATING RESULTS
For the three month period ended March 31
US$ MILLIONS, UNAUDITED 2011 2010
Revenues $ 390 $ 136Cost of revenues (202) (87)General and administrative expenses (13) (8)
Gross margin 175 41Interest expense (83) (31)Income before under noted 92 10Earnings from investments in associates 12 1Depreciation and amortization expense (25) (5)Fair value adjustments (5) 6Other expense (5) (2)Income before income tax 69 10Income tax recovery (expense) 2 (3)Net income 71 7Net (income) attributable to non-controlling interests (26) (8)Net income (loss) attributable to partnership $ 45 $ (1)
Attributable to:General partner $ ― $ ―Limited partners $ 45 $ (1)
Earnings per unit:Basic and diluted earnings per unit attributable to:
General partner $ 0.29 $ (0.01)Limited partners $ 0.29 $ (0.01)
The accompanying notes are an integral part of these fi nancial statements.
4 Brookfi eld Infrastructure Partners | 2011 First Quarter Interim Report
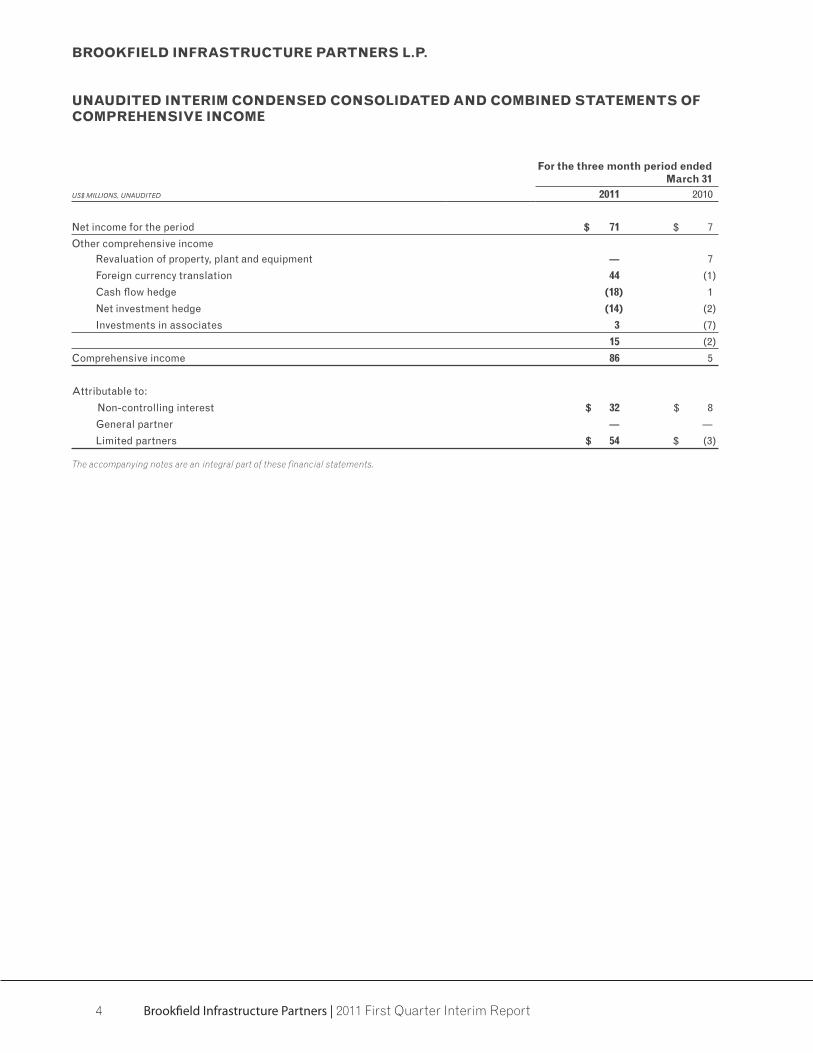
BROOKFIELD INFRASTRUCTURE PARTNERS L.P.
UNAUDITED INTERIM CONDENSED CONSOLIDATED AND COMBINED STATEMENTS OF COMPREHENSIVE INCOME
For the three month period ended March 31
US$ MILLIONS, UNAUDITED 2011 2010
Net income for the period $ 71 $ 7
Other comprehensive income Revaluation of property, plant and equipment ― 7
Foreign currency translation 44 (1)
Cash fl ow hedge (18) 1
Net investment hedge (14) (2)
Investments in associates 3 (7)
15 (2)
Comprehensive income 86 5
Attributable to:
Non-controlling interest $ 32 $ 8
General partner ― ―Limited partners $ 54 $ (3)
The accompanying notes are an integral part of these fi nancial statements.
Brookfi eld Infrastructure Partners | 2011 First Quarter Interim Report 5
BROOKFIELD INFRASTRUCTURE PARTNERS L.P.
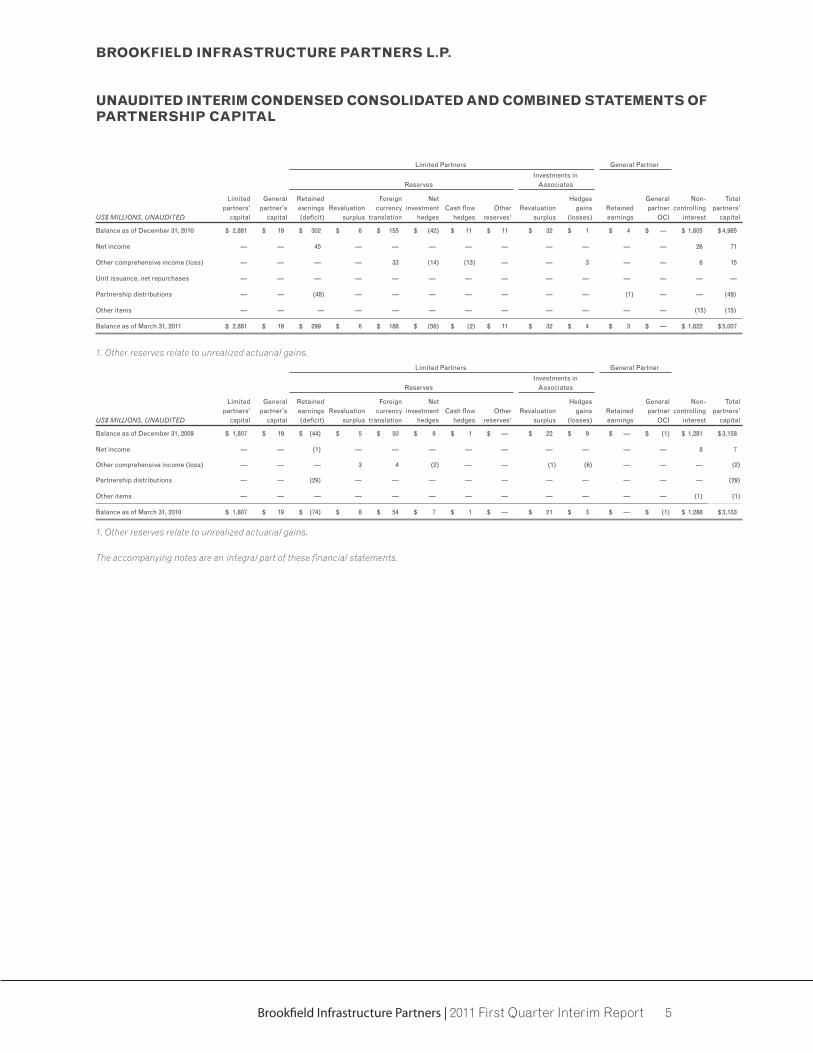
UNAUDITED INTERIM CONDENSED CONSOLIDATED AND COMBINED STATEMENTS OF PARTNERSHIP CAPITAL
Limited Partners General Partner
ReservesInvestments in
Associates
US$ MILLIONS, UNAUDITED
Limited partners'
capital
Generalpartner's
capital
Retained earnings (defi cit)
Revaluation surplus
Foreign currency
translation
Net investment
hedgesCash fl ow
hedgesOther
reserves1
Revaluation surplus
Hedges gains
(losses)Retained earnings
General partner
OCI
Non-controlling
interest
Total partners'
capital
Balance as of December 31, 2010 $ 2,881 $ 19 $ 302 $ 6 $ 155 $ (42) $ 11 $ 11 $ 32 $ 1 $ 4 $ — $ 1,605 $ 4,985
Net income — — 45 — — — — — — — — — 26 71
Other comprehensive income (loss) — — — — 33 (14) (13) — — 3 — — 6 15
Unit issuance, net repurchases — — — — — — — — — — — — — —
Partnership distributions — — (48) — — — — — — — (1) — — (49)
Other items — — — — — — — — — — — — (15) (15)
Balance as of March 31, 2011 $ 2,881 $ 19 $ 299 $ 6 $ 188 $ (56) $ (2) $ 11 $ 32 $ 4 $ 3 $ — $ 1,622 $ 5,007
1. Other reserves relate to unrealized actuarial gains.
Limited Partners General Partner
ReservesInvestments in
Associates
US$ MILLIONS, UNAUDITED
Limited partners'
capital
Generalpartner's
capital
Retained earnings (defi cit)
Revaluation surplus
Foreign currency
translation
Net investment
hedgesCash fl ow
hedgesOther
reserves1
Revaluation surplus
Hedges gains
(losses)Retained earnings
General partner
OCI
Non-controlling
interest
Total partners'
capital
Balance as of December 31, 2009 $ 1,807 $ 19 $ (44) $ 5 $ 50 $ 9 $ 1 $ — $ 22 $ 9 $ — $ (1) $ 1,281 $ 3,158
Net income — — (1) — — — — — — — — — 8 7
Other comprehensive income (loss) — — — 3 4 (2) — — (1) (6) — — — (2)
Partnership distributions — — (29) — — — — — — — — — — (29)
Other items — — — — — — — — — — — — (1) (1)
Balance as of March 31, 2010 $ 1,807 $ 19 $ (74) $ 8 $ 54 $ 7 $ 1 $ — $ 21 $ 3 $ — $ (1) $ 1,288 $ 3,133
1. Other reserves relate to unrealized actuarial gains.
The accompanying notes are an integral part of these fi nancial statements.
6 Brookfi eld Infrastructure Partners | 2011 First Quarter Interim Report
BROOKFIELD INFRASTRUCTURE PARTNERS L.P.
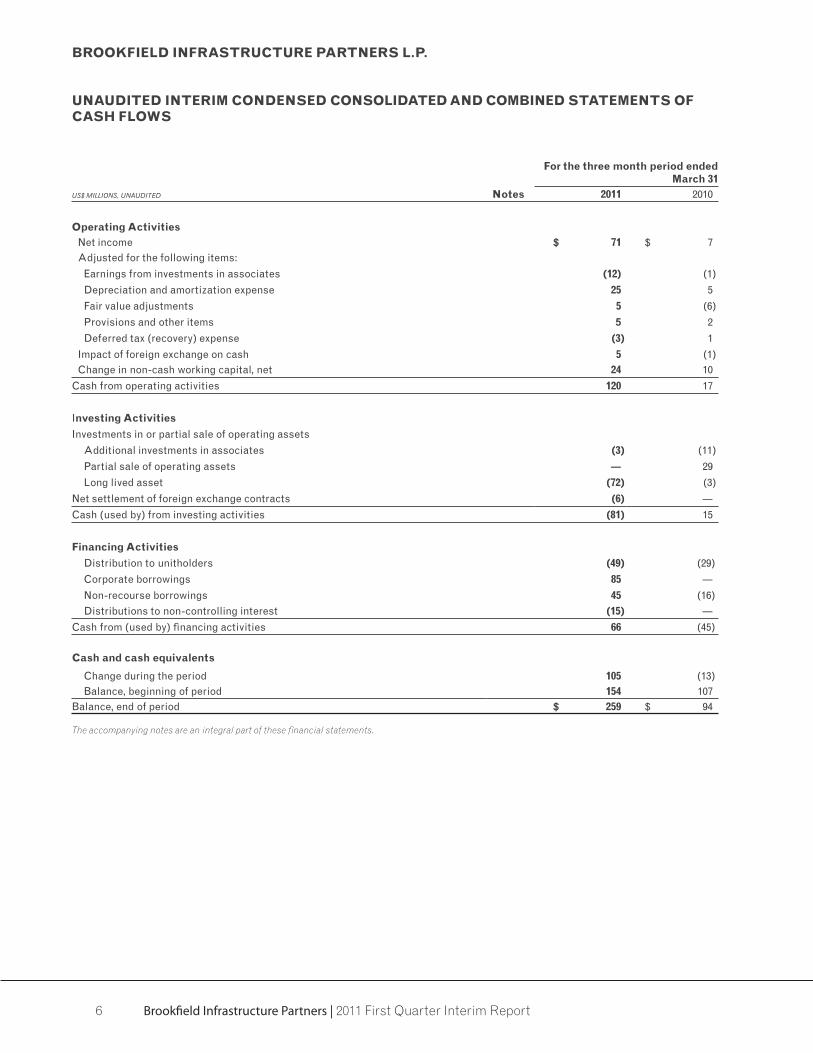
UNAUDITED INTERIM CONDENSED CONSOLIDATED AND COMBINED STATEMENTS OF CASH FLOWS
For the three month period ended March 31
US$ MILLIONS, UNAUDITED Notes 2011 2010
Operating ActivitiesNet income $ 71 $ 7Adjusted for the following items:
Earnings from investments in associates (12) (1)
Depreciation and amortization expense 25 5
Fair value adjustments 5 (6)
Provisions and other items 5 2
Deferred tax (recovery) expense (3) 1
Impact of foreign exchange on cash 5 (1)Change in non-cash working capital, net 24 10
Cash from operating activities 120 17
Investing Activities
Investments in or partial sale of operating assets
Additional investments in associates (3) (11)
Partial sale of operating assets ― 29
Long lived asset (72) (3)
Net settlement of foreign exchange contracts (6) ―Cash (used by) from investing activities (81) 15
Financing Activities
Distribution to unitholders (49) (29)
Corporate borrowings 85 ―Non-recourse borrowings 45 (16)Distributions to non-controlling interest (15) ―
Cash from (used by) fi nancing activities 66 (45)
Cash and cash equivalents
Change during the period 105 (13)Balance, beginning of period 154 107
Balance, end of period $ 259 $ 94
The accompanying notes are an integral part of these fi nancial statements.

Brookfi eld Infrastructure Partners | 2011 First Quarter Interim Report 7
NOTES TO INTERIM CONDENSED CONSOLIDATED AND COMBINED FINANCIAL STATEMENTS − UNAUDITEDFOR THE PERIOD FROM JANUARY 1, 2011 TO MARCH 31, 2011
1. ORGANIZATION AND DESCRIPTION OF THE BUSINESS
Brookfi eld Infrastructure Partners L.P. (the ‘‘partnership’’) owns and operates utility businesses, transport and
energy businesses and timber assets in North and South America, Australasia, and Europe. The partnership
was formed as a limited partnership established under the laws of Bermuda, pursuant to a limited partnership
agreement dated May 17, 2007, as amended and restated. The partnership’s limited partnership units are listed
on the New York Stock Exchange and the Toronto Stock Exchange under the symbols ‘‘BIP’’ and ‘‘BIP.UN’’,
respectively. The registered offi ce is Canon’s Court, 22 Victoria Street, Hamilton, Bermuda.
2. SUMMARY OF ACCOUNTING POLICIES
These interim condensed consolidated and combined fi nancial statements of the partnership and its
consolidated subsidiaries (together "Brookfi eld Infrastructure") have been prepared in accordance with
International Accounting Standard 34 Interim Financial Reporting (“IAS 34”) as issued by the International
Accounting Standards Board (“IASB”) and using the accounting policies Brookfi eld Infrastructure adopted
in its consolidated and combined fi nancial statements as of and for the year ended December 31, 2010.
The accounting policies the partnership adopted in its fi nancial statements as of and for the year ended
December 31, 2010 are disclosed in Note 2 of Brookfi eld Infrastructure's annual consolidated and combined
fi nancial statements as of and for the year ended December 31, 2010, with which reference should be made to
in reading these interim condensed consolidated and combined fi nancial statements.
These interim condensed consolidated and combined fi nancial statements were authorized for issuance by the
Board of Directors of the partnership on May 5 , 2011.
Reorganization of Brookfi eld Infrastructure Interests
Effective December 31, 2010, the partnership entered into voting arrangements with various affi liates of
Brookfi eld Asset Management ("Brookfi eld"), Brookfi eld Infrastructure’s ultimate parent company, whereby
the partnership effectively gained control of Holding LP. The partnership entered into similar arrangements
in respect of Brookfi eld’s indirect holdings in the U.S. and Canadian freehold timberlands, Australian coal
terminal operation and UK port operation, subject to certain limitations. This reorganization does not represent
a business combination under IFRS 3, Business Combinations (IFRS 3R), as all combining businesses are
ultimately controlled by the same parties both before and after the voting arrangements were completed.
IFRS 3R does not include specifi c measurement guidance for transfers of businesses or subsidiaries between
entities under common control.
Accordingly, Brookfi eld Infrastructure has developed a policy to account for such transactions taking into
consideration other guidance set out under the IFRS framework and pronouncements of other standard-
setting bodies. As consistent with the annual consolidated and combined fi nancial statements as of and for
the year ended December 31, 2010, these interim condensed consolidated and combined fi nancial statements
of Brookfi eld Infrastructure are presented to refl ect continuing control as follows:
• Assets and liabilities of Holding LP, and the partnership’s interests in the U.S. and Canadian freehold
timberlands, Australian coal terminal operation and its UK port operation are refl ected at their carrying
amounts as of the reorganization date. No adjustments were made to refl ect fair values or to recognize any
new assets or liabilities, including goodwill, as a result of the combination;
• In the partnership’s consolidated and combined Statements of Financial Position, Statements of Operating
Results and Statements of Cash Flow, the partnership’s freehold timberlands, Australian coal terminal
and UK port operation are presented as if these arrangements had been in place from the time Brookfi eld
acquired control. For Brookfi eld Infrastructure’s freehold timberlands and UK port operation, Brookfi eld
acquired control prior to January 1, 2010, and for Brookfi eld Infrastructure’s Australian coal terminal
operation, Brookfi eld acquired control with the closing of the Prime merger on December 8, 2010; and

8 Brookfi eld Infrastructure Partners | 2011 First Quarter Interim Report
• Holding LP has issued redeemable partnership units held by Brookfi eld, which may, at the request of the
holder, require the Holding LP to redeem the units for cash consideration equal to the market price of the
partnership’s limited partnership units. This right is subject to the partnership’s right of fi rst refusal which
entitled it, at its sole discretion, to elect to acquire any unit so presented to Holding LP in exchange for
one of the partnership’s units (subject to certain customary adjustments). As the partnership, at its sole
discretion, has the right to settle the obligation with limited partnership units, the redeemable partnership
units are classifi ed as limited partnership units.
3. INVESTMENTS IN ASSOCIATES
As of
US$ MILLIONS March 31, 2011 December 31, 2010
Non-current:
Investments in associates $ 1,079 $ 1,069
Reconciliation of movement in investments accounted for using the equity method
Balance at January 1 $ 1,069 $ 1,087
Share of income for the year - continuing operations 12 52
Share of reserves for the year - OCI 3 2
Foreign currency translation (10) 81
Distributions ― (71)
Other 2 ―Additions (dispositions) 1, 2 3 (82)
Ending balance $ 1,079 $ 1,069
1. In December 2010, Brookfi eld Infrastructure acquired the remaining 60% of Prime, obtaining a controlling stake in the associate. Investments in associates were derecognized and acquisition accounting in accordance with IFRS 3R was applied.
2. As of March 31, 2011, Brookfi eld Infrastructure’s interest in its European port operation is 60%; however its ownership was subject to a share equalization scheme that will adjust the aggregate interest of the partners in the European port operation based on performance of the port operation in the years ended December 31, 2012 and 2013. An agreement was reached by all relevant parties subject to certain closing conditions, and as such, Brookfi eld Infrastructure’s ownership decreased to 40%.
The following table presents the carrying value of the partnership's investments in associates:
As of
US$ MILLIONS March 31, 2011 December 31, 2010
North American gas transmission operation $ 392 $ 384
Australasian energy distribution operation 268 280
South American transmission operation 122 115
European port operation 235 236
Other associates 62 54
$ 1,079 $ 1,069

Brookfi eld Infrastructure Partners | 2011 First Quarter Interim Report 9
SUMMARISED FINANCIAL INFORMATION OF ASSOCIATES
The following table summarises the aggregate balances for investments in associates:
As of
US$ MILLIONS March 31, 2011 December 31, 2010
Financial position:
Total assets $ 13,830 $ 12,500
Total liabilities (10,104) (8,692)
Net assets $ 3,726 $ 3,808
Three months ended March 31
US$ MILLIONS 2011 2010
Financial performance:
Total revenue $ 547 $ 436
Total income for the period 53 18
Brookfi eld Infrastructure's share of associates' income $ 12 $ 1
4. PROPERTY, PLANT AND EQUIPMENT
US$ MILLIONS Utility AssetsTransport &
Energy AssetsTimberland
Assets Total Assets
Gross carrying amount:
Balance at January 1, 2010 $ 221 $ 299 $ 685 $ 1,205
Additions 12 26 6 44
Transfer from investment properties ― ― (1) (1)
Acquisitions through business combinations 513 1,418 ― 1,931
Fair value adjustment ― ― (139) (139)
Net foreign currency exchange differences ― 33 8 41
Other ― (33) 1 (32)
Balances at December 31, 2010 746 1,743 560 3,049
Additions 18 53 1 72
Net foreign currency exchange differences 25 38 6 56
Balances at March 31, 2011 $ 789 $ 1,834 $ 567 $ 3,190
Accumulated depreciation:
Balance at January 1, 2010 $ (17) $ (2) $ (5) $ (22)
Depreciation expense (8) (15) ― (20)
Net foreign currency exchange differences (6) (1) ― (7)
Balance at December 31, 2010 (31) (18) (5) (54)
Depreciation expense (5) (14) ― (19)
Net foreign currency exchange differences (1) (1) ― (2)
Balance at March 31, 2011 (37) (33) (5) (75)
Net book value:
December 31, 2010 $ 715 $ 1,725 $ 555 $ 2,995
March 31, 2011 $ 752 $ 1,801 $ 562 $ 3,115

10 Brookfi eld Infrastructure Partners | 2011 First Quarter Interim Report
5. SEGMENTED INFORMATION
IFRS 8 Operating Segments, requires operating segments to be determined based on internal reports that are
regularly reviewed by the Executive Management and the Board of Directors for the purpose of allocating
resources to the segment and to assessing its performance. Key measures used by the Chief Operating
Decision Maker in assessing performance and in making resource allocation decisions are funds from
operations (“FFO”) and earnings before interest, tax, depreciation and amortization (“EBITDA”), measures
not defi ned by IFRS, which enable the determination of cash return on the equity deployed. FFO is calculated
as net income excluding the impact of depreciation and amortization, fair value adjustments, unrealized
gains or losses on derivative instruments, deferred taxes, interest charges and fair value adjustments on
redeemable partnership units and other non-cash items. EBITDA is calculated as FFO excluding the impact
of interest and taxes.
Utilities Transport and Energy Timber
FOR THE THREE MONTH PERIOD ENDED
MARCH 31, 2011
US$ MILLIONS 100%
Brookfi eld Infrastructure's
Share 100%
Brookfi eld Infrastructure's
Share 100%
Brookfi eld Infrastructure's
Share Corporate Total1
Revenues $ 280 $ 140 $ 474 $ 247 $ 109 $ 36 ―
Costs attributed to revenues (81) (43) (306) (163) (56) (19) (13)
EBITDA 199 97 168 84 53 17 (13)
Other income 2 1 1 ― 1 ― ―Interest expense (73) (38) (84) (39) (21) (7) (5)
Cash taxes 1 1 (1) ― (1) ― ―FFO 129 61 84 45 32 10 (18)
Depreciation and amortization (48) (20) (58) (28) ― ― ―Fair value adjustments ― ― ― ― (5) (2) ―Unrealized (losses) gains on derivative
instruments (16) (3) 1 ― ― ― ―Deferred taxes and other items (9) (8) 21 13 (7) (2) (3)
Net income (loss) attributable to partnership $ 56 $ 30 $ 48 $ 30 $ 20 $ 6 $ (21) $ 45
Utilities Transport and Energy Timber
FOR THE THREE MONTH PERIOD ENDED
MARCH 31, 2010
US$ MILLIONS 100%
Brookfi eld Infrastructure's
Share 100%
Brookfi eld Infrastructure's
Share 100%
Brookfi eld Infrastructure's
Share Corporate Total1
Revenues $ 191 $ 73 $ 364 $ 124 $ 80 $ 23 $ ―
Costs attributed to revenues (58) (25) (203) (78) (52) (15) (8)
EBITDA 133 48 161 46 28 8 (8)
Other income (expenses) ― ― ― ― (1) 1 ―Interest expense (51) (20) (65) (17) (21) (7) (3)
Cash taxes (1) (1) (7) (2) (1) ― ―FFO 81 27 89 27 5 2 (11)
Depreciation and amortization (40) (14) (51) (17) ― ― ―Fair value adjustments ― ― ― ― 6 2 ―Unrealized losses on derivative
instruments (7) (1) ― ― ― ― ―Deferred taxes and other items 4 (1) (2) ― (3) (1) (14)
Net income (loss) attributable to partnership $ 38 $ 11 $ 36 $ 10 $ 8 $ 3 $ (25) $ (1)
1. The above tables present Brookfi eld Infrastructure's results from operations on a proportionate basis. As Brookfi eld Infrastructure has a number of investments that are accounted for using the equity method of accounting, a signifi cant portion of Brookfi eld Infrastructure's operating results are presented in one line on the Statements of Operating Results. The above tables present the detailed components making up net income for investments accounted for using the consolidation and equity methods in a more fulsome manner. Accordingly, with the exception of net income, the totals of each line item in the above table will not agree to the Statements of Operating Results.

Brookfi eld Infrastructure Partners | 2011 First Quarter Interim Report 11
6. PARTNERSHIP CAPITAL
General Partnership units Limited Partnership units Total
As of As of As of
US$ MILLIONS
March 31, 2011
December 31, 2010
March 31, 2011
December 31, 2010
March 31, 2011
December 31, 2010
Authorized to issue
On issue at January 1 1.1 1.1 156.3 105.6 157.4 106.7Issued for cash ― ― ― 50.7 ― 50.7Shares repurchased ― ― ― ― ― ―Ending balance 1.1 1.1 156.3 156.3 157.4 157.4
The weighted average number of general partnership units outstanding for the period ended March 31, 2011 was
1.1 million (March 31, 2010 :1.1 million). The weighted average number of limited partnership units outstanding
for the period ended March 31, 2011 was 156.3 million (March 31, 2010: 105.6 million).
General Partnership units Limited Partnership units Total
As of As of As of
US$ MILLIONS
March 31, 2011
December 31, 2010
March 31, 2011
December 31, 2010
March 31, 2011
December 31, 2010
Opening balance 19 19 2,881 1,807 2,900 1,826
Share issuance ― ― ― 1,074 ― 1,074Ending balance 19 19 2,881 2,881 2,900 2,900
12 Brookfi eld Infrastructure Partners | 2011 First Quarter Interim Report
MANAGEMENT'S DISCUSSION & ANALYSISFOR THE QUARTER ENDED MARCH 31, 2011
INTRODUCTION
This Management's Discussion and Analysis (MD&A) should be read in conjunction with Brookfi eld Infrastructure
Partners L.P.’s (the "partnership" and together with its subsidiary and operating entities "Brookfi eld Infrastructure")
most recently issued Form 20-F. Additional information, including Brookfi eld Infrastructure's Form 20-F, is available on
its website at www.brookfi eldinfrastructure.com, on SEDAR’s website at www.sedar.com and on EDGAR’s website at
www.sec.gov/edgar.shtml.
Business Overview
Brookfi eld Infrastructure owns and operates high quality, long-life assets that generate stable cash fl ows, require
relatively minimal maintenance capital expenditures and, by virtue of barriers to entry and other characteristics, tend
to appreciate in value over time. Our current operations consist of utility businesses, transport and energy businesses
and timber assets in North and South America, Australasia, and Europe. Our vision is to be a leading owner and
operator of high quality infrastructure assets that produce an attractive risk-adjusted total return for our unitholders.
To accomplish this objective, we will seek to leverage Brookfi eld Asset Management Inc’s ("Brookfi eld") best-in-class
operating platforms to acquire targeted assets and actively manage them to extract additional value following our
initial investment. An integral part of our strategy is to participate with institutional investors in Brookfi eld-sponsored
partnerships that target acquisitions that suit our profi le. We will focus on consortiums and partnerships in which
Brookfi eld has suffi cient infl uence or control to deploy an operations-oriented approach.
Performance Targets and Key Measures
Our objective is to earn a total return of 12% to 15% per annum on the infrastructure assets that we own, measured over
the long-term. This return will be generated from the in-place cash flow of our operations plus growth. We endeavor to
manage our operations to generate increasing funds from operations (FFO) per unit. If we are successful in doing so,
we will be able to increase distributions to unitholders. Additionally, the increase in our FFO per unit should result in
capital appreciation. Thus, for our business as a whole, our key performance measure is AFFO yield, defined as FFO less
maintenance capital expenditures (adjusted funds from operations or AFFO) divided by Invested Capital (see page 21
for more detail), which measures the sustainable return on capital that we have deployed. We also measure the growth
of FFO per unit, which we believe is a proxy for our ability to increase distributions. In addition, we have performance
measures that track the key value drivers for each of our operating platforms. See Operating Platforms for more detail.
Distribution Policy
Our objective is to pay a distribution that is sustainable on a long-term basis while retaining within our operations
suffi cient liquidity for recurring growth capital expenditures and general purposes. We currently believe that a payout
of 60% to 70% of our FFO is appropriate. In light of the per unit FFO growth that we foresee in our operations, we are
targeting 3% to 7% annual distribution growth. Our quarterly distribution was increased by 13% to $0.31 per unit in
February 2011.
Basis of Presentation
These consolidated and combined fi nancial statements are prepared in accordance with International Financial
Reporting Standards (“IFRS”), as issued by the International Accounting Standards Board (“IASB”). The consolidated
and combined fi nancial statements include the accounts of Brookfi eld Infrastructure and the entities over which it
has control. Brookfi eld Infrastructure accounts for investments over which it exercises signifi cant infl uence, however
does not control, using the equity method. Certain prior year amounts have been reclassifi ed or restated to conform
to the current year’s presentation.
For each operating platform – utilities, transport and energy, and timber – this MD&A outlines Brookfi eld
Infrastructure’s proportionate share of results in order to demonstrate the impact of key value drivers of each of
these operating platforms on the partnership’s overall performance.

Brookfi eld Infrastructure Partners | 2011 First Quarter Interim Report 13
OUR OPERATIONS
Our business is comprised of high quality, long-life assets that provide essential products and services for the global
economy. We have a stable cash fl ow profi le with over 78% of our EBITDA supported by regulated or contractual
revenues. While each of our businesses have high barriers to entry and strong competitive positions, we generate
cash fl ows under a number of different revenue frameworks. As a result, we group our businesses into operating
platforms based on the similarities in their underlying economic drivers in order to assist our unitholders in evaluating
our performance and assessing our value.
Our operating platforms are summarized below:
Operating Platform Asset Type Location
Utilities
Electricity Transmission
Energy Distribution
North & South America
Australasia and Europe
Coal Terminal Operations Australasia
Transport and Energy
Energy Transmission Primarily North America
Railroad Australasia
Ports Europe
Timber
Freehold Timberlands North America
Our utilities platform is comprised of regulated businesses which earn a return on their asset base, as well as businesses
with long-term contracts designed to generate a return on capital over the life of the contract. Our transport and energy
platform provides transportation, storage and handling services for energy, freight and bulk commodities for which
we are paid an access fee. Profi tability is based on the volume of services that we provide and the price achieved for
these services. Our timber platform is comprised of freehold timberlands that provide inputs for a number of essential
products for the global economy on a sustainable basis, including structural lumber.
OVERVIEW OF PERFORMANCE
In this section we review our consolidated and combined performance and fi nancial position for the three month period
ended March 31, 2011. Further details on the key drivers of our operations and fi nancial position are contained within
the review of Operating Platforms.
To measure performance, we focus on net income as well as funds from operations (FFO) and adjusted funds from
operations (AFFO). We defi ne FFO as net income excluding the impact of depreciation, depletion and amortization,
deferred taxes and other non-cash items and AFFO as FFO less maintenance capex, as detailed in the Reconciliation
of IFRS Financial Measures section of this MD&A. FFO is a measure of operating performance, and AFFO is a measure
of the sustainable cash fl ow of our business. Since they are not calculated in accordance with, and do not have any
standardized meanings prescribed by IFRS, FFO and AFFO are unlikely to be comparable to similar measures presented
by other issuers, and FFO and AFFO have limitations as analytical tools. See the Reconciliation of non-IFRS Financial
Measures section for a more fulsome discussion, including a reconciliation to the most directly comparable IFRS
measures.

14 Brookfi eld Infrastructure Partners | 2011 First Quarter Interim Report
Results of Operations
The following table summarizes the fi nancial results of Brookfi eld Infrastructure.
MILLIONS, EXCEPT PER UNIT INFORMATION, UNAUDITED
Key Metrics 2011 2010
Funds from operations (FFO) $ 98 $ 45
Per unit FFO 0.62 0.42
Payout ratio1 50% 66%
Growth of per unit FFO 48% 83%
Adjusted funds from operations (AFFO)2 71 37
AFFO yield3 10% 8%
1. Payout ratio is defi ned as distributions to unitholders divided by FFO.
2. AFFO is defi ned as FFO less maintenance capital expenditures.
3. AFFO yield is defi ned as AFFO divided by average invested capital.
For the three-month period ended March 31, 2011, we recorded FFO of $98 million, or $0.62 per unit compared with
$45 million, or $0.42 per unit, in the comparable period last year. This 48% increase in our per unit FFO was largely
attributable to strong accretion from the Prime merger. On an invested capital base of $2,915 million, we generated an
AFFO yield of 10%, driven by strong returns on capital in our utilities and timber operating platforms, partially offset
by below average returns in our transport and energy operations. With the strong diversity of our business, we believe
that we have a solid foundation upon which to achieve our goal of generating stable cash fl ows with consistent growth
for our unitholders. For the quarter, our distribution of $0.31 per unit implied a payout of 50% of our FFO, which is below
our targeted range of 60% to 70%.
MILLIONS, EXCEPT PER UNIT INFORMATION, UNAUDITED Three months ended March 31
Summary Income Statement 2011 2010
Revenues $ 390 $ 136
Cost of revenues (202) (87)
General and administrative expenses (13) (8)
Gross margin 175 41
Interest expense – corporate borrowings (2) (2)
Interest expense – non-recourse borrowings (81) (29)
Earnings from investments in associates 12 1
Net income (loss) 45 (1)
Net income (loss) per unit 0.29 (0.01)
For the three months ended March 31, 2011, we earned net income of $45 million, compared to a loss of $1 million in the
same period of the prior year. The increase from the prior period is primarily a result of the Prime merger and stronger
performances from our utilities and timber operations.
MILLIONS, UNAUDITED As of
Summary Balance Sheet March 31, 2011 December 31, 2010
Cash and cash equivalents $ 259 $ 154
Total assets 13,456 13,109
Corporate borrowings 103 18
Non-recourse borrowings 4,679 4,575
Non-controlling interest 1,622 1,605
Partnership capital 3,385 3,380
As of March 31, 2011, we had $13,456 million in assets and $3,385 million in partnership capital compared to $13,109 million
in assets and $3,380 million in partnership capital at December 31, 2010, representing a book value per unit of $21.51
and $21.47 for the periods ended March 31, 2011 and December 31, 2010, respectively.
Corporate borrowings totaled $103 million at quarter end compared to an $18 million balance at year end. Our
consolidated and combined balance sheet as of March 31, 2011 refl ects $4,679 million of non-recourse borrowings
compared to $4,575 million as of December 31, 2010. As of March 31, 2011, our consolidated net debt to capitalization
ratio was 49%.

Brookfi eld Infrastructure Partners | 2011 First Quarter Interim Report 15
ACQUISITIONS AND DIVESTITURES
We are co-owners of a European-based port operator. Our ownership was subject to a share equalization scheme
that adjusted our interest in the port to between 35% and 65% based on performance of the port in the years ended
December 31, 2012 and 2013. During the quarter, an agreement was reached among all parties to settle the share
equalization scheme. Subject to certain closing conditions, Brookfi eld Infrastructure’s ownership of the European port
operator will decrease to 40%.
SELECTED INCOME STATEMENT AND BALANCE SHEET INFORMATION
The following table presents selected income statement and balance sheet information by operating platform on a
proportionate basis:
Income Statement Three months ended March 31
MILLIONS, UNAUDITED 2011 2010
Net income by segment
Utilities $ 30 $ 11
Transport and energy 30 10
Timber 6 3
Corporate and other (21) (25)
Net income $ 45 $ (1)
EBITDA by segment
Utilities $ 97 $ 48
Transport and energy 84 46
Timber 17 8
Corporate and other (13) (8)
EBITDA $ 185 $ 94
FFO by segment
Utilities $ 61 $ 27
Transport and energy 45 27
Timber 10 2
Corporate and other (18) (11)
Funds from operations (FFO) $ 98 $ 45
16 Brookfi eld Infrastructure Partners | 2011 First Quarter Interim Report
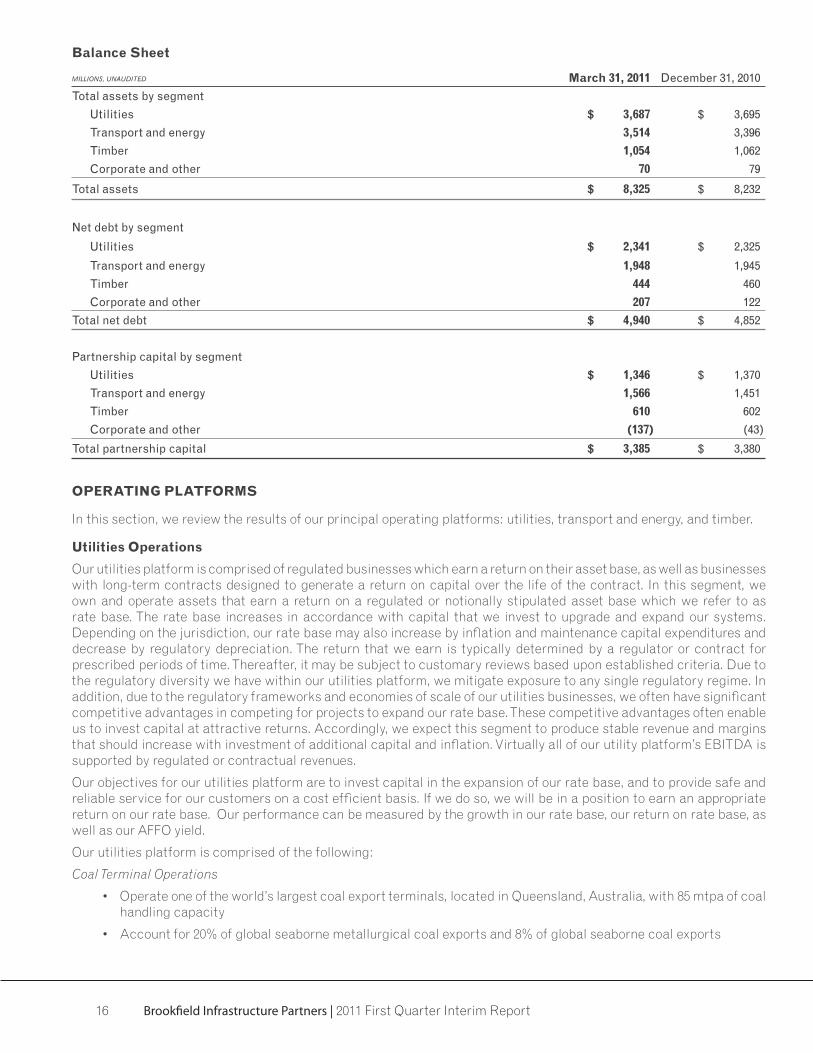
Balance Sheet
MILLIONS, UNAUDITED March 31, 2011 December 31, 2010
Total assets by segment
Utilities $ 3,687 $ 3,695
Transport and energy 3,514 3,396
Timber 1,054 1,062
Corporate and other 70 79
Total assets $ 8,325 $ 8,232
Net debt by segment
Utilities $ 2,341 $ 2,325
Transport and energy 1,948 1,945
Timber 444 460
Corporate and other 207 122
Total net debt $ 4,940 $ 4,852
Partnership capital by segment
Utilities $ 1,346 $ 1,370
Transport and energy 1,566 1,451
Timber 610 602
Corporate and other (137) (43)
Total partnership capital $ 3,385 $ 3,380
OPERATING PLATFORMS
In this section, we review the results of our principal operating platforms: utilities, transport and energy, and timber.
Utilities Operations
Our utilities platform is comprised of regulated businesses which earn a return on their asset base, as well as businesses
with long-term contracts designed to generate a return on capital over the life of the contract. In this segment, we
own and operate assets that earn a return on a regulated or notionally stipulated asset base which we refer to as
rate base. The rate base increases in accordance with capital that we invest to upgrade and expand our systems.
Depending on the jurisdiction, our rate base may also increase by infl ation and maintenance capital expenditures and
decrease by regulatory depreciation. The return that we earn is typically determined by a regulator or contract for
prescribed periods of time. Thereafter, it may be subject to customary reviews based upon established criteria. Due to
the regulatory diversity we have within our utilities platform, we mitigate exposure to any single regulatory regime. In
addition, due to the regulatory frameworks and economies of scale of our utilities businesses, we often have signifi cant
competitive advantages in competing for projects to expand our rate base. These competitive advantages often enable
us to invest capital at attractive returns. Accordingly, we expect this segment to produce stable revenue and margins
that should increase with investment of additional capital and infl ation. Virtually all of our utility platform’s EBITDA is
supported by regulated or contractual revenues.
Our objectives for our utilities platform are to invest capital in the expansion of our rate base, and to provide safe and
reliable service for our customers on a cost effi cient basis. If we do so, we will be in a position to earn an appropriate
return on our rate base. Our performance can be measured by the growth in our rate base, our return on rate base, as
well as our AFFO yield.
Our utilities platform is comprised of the following:
Coal Terminal Operations
• Operate one of the world’s largest coal export terminals, located in Queensland, Australia, with 85 mtpa of coal
handling capacity
• Account for 20% of global seaborne metallurgical coal exports and 8% of global seaborne coal exports

Brookfi eld Infrastructure Partners | 2011 First Quarter Interim Report 17
Electricity Transmission
• Operate 8,750 kilometers of transmission lines in North and South America
• Transmit electricity to 98% of the population of Chile
Energy Distribution
• Operate 864,000 electricity and natural gas connections
• One of the largest independent operators of utility connections in the UK and one of the largest distributors of
energy in New Zealand
Results of Operations
The following table presents the roll-forward of our rate base and selected key metrics:
As of
MILLIONS, UNAUDITED March 31, 2011 December 31, 2010
Rate base, start of period $ 3,182 $ 1,891
Impact of merger ― 1,185
Capital expenditures commissioned 35 69
Infl ation and other indexation 41 65
Regulatory depreciation (20) (49)
Foreign exchange 14 21
Rate base, end of period $ 3,252 $ 3,182
Three months ended March 31MILLIONS, UNAUDITED 2011 2010
Funds from operations (FFO) $ 61 $ 27
Maintenance capital (6) (2)
Adjusted funds from operations (AFFO) $ 55 $ 25
Return on rate base1,3 10% 10%
AFFO yield2,3 13% 12%
1 Return on rate base is EBITDA divided by average rate base.
2 AFFO yield is AFFO divided by average invested capital.
3 Return on rate base and AFFO yield excludes impact of developer contributions at our European energy distribution operation.
For the quarter ended March 31, 2011, our utilities platform generated FFO of $61 million, compared to $27 million
in the same period of the prior year. The increase in FFO is attributable to the Prime merger and strong performances
from our Australian coal terminal, electricity transmission operations and UK distribution business. In the period,
our maintenance capital expenditures were $6 million compared with the quarterly sustainable level of $4 million
due to scheduling of certain projects. After deducting maintenance capital expenditures, our AFFO yield was 13%
on an invested capital base of $1,310 million, excluding the impact of developers contributions received by our UK
distribution operation.

18 Brookfi eld Infrastructure Partners | 2011 First Quarter Interim Report
The following table presents our utilities platform’s proportionate share of fi nancial results:
Three months ended March 31
MILLIONS, UNAUDITED 2011 2010
Revenue $ 126 $ 73
Costs attributed to revenues (43) (25)
Developer contributions 14 ―EBITDA 97 48
Other income 1 ―Interest expense (38) (20)
Cash taxes 1 (1)
Funds from operations (FFO) 61 27
Depreciation and amortization (20) (14)
Unrealized losses on derivative instruments (3) (1)
Deferred taxes and other items (8) (1)
Net income $ 30 $ 11
For the quarter ended March 31, 2011, our utilities platform generated EBITDA and FFO of $97 million and $61 million,
respectively, compared to $48 million and $27 million in the comparable period of 2010.
The following table presents our proportionate EBITDA and FFO for each operation in this platform:
MILLIONS, UNAUDITED EBITDA FFO
For the quarter ended March 31 2011 2010 2011 2010
Coal Terminal Operations
Australasia $ 40 $ 22 $ 21 $ 13
Electricity Transmission
South America 14 12 11 8
North America 6 6 4 4
Energy Distribution
Europe 22 3 17 1
Australasia 15 5 8 1
Total $ 97 $ 48 $ 61 $ 27
Our Australian coal terminal, South American electricity transmission operation and UK distribution business were
responsible for 78% and 80%, respectively, of EBITDA and FFO in our utilities platform.
Our Australian coal terminal reported EBITDA and FFO of $40 million and $21 million, respectively, for the quarter,
versus $22 million and $13 million in the comparative period. Adjusting for the change in ownership due to the Prime
merger, our Australian coal terminal's FFO increased by 10% primarily as a result of the implementation of the recently
fi nalized access undertaking, with its higher regulated rate of return, and the strengthening of the Australian dollar.
As a result of widespread fl ooding that caused coal mines in the Bowen Basin to experience signifi cant production and
supply chain distributions, our terminal operated at 47% of capacity. Despite the decline in throughput, the terminal's
fi nancial performance was not impacted due to resilient take-or-pay contracts that do not have force majeure provisions.
Our South American transmission operations’ EBITDA and FFO were $14 million and $11 million, respectively, for the
quarter, versus $12 million and $8 million, respectively, in the same period in the prior year. The increases in EBITDA
and FFO were mainly attributable to revenue indexation and growth capital expenditures.
Our UK distribution business earned EBITDA and FFO of $22 million and $17 million, respectively, in the quarter
versus $3 million and $1 million, respectively, in the comparative period. The increases in EBITDA and FFO were
predominantly attributable to greater developer contributions. Our UK distribution business receives an upfront
payment from developers in conjunction with the installation of gas and electricity connections in new homes in order
to deliver utility services. As a result of improved home building activity, our UK distribution business installed a total
of 12,000 electricity and gas connections in the current year compared with 7,000 in the prior year, increasing our total
number of connections to 447,000. Furthermore, we receive greater developer contributions for electricity connections.
During the quarter, electricity connections were 30% of total compared with 12% in the prior year.
Brookfi eld Infrastructure Partners | 2011 First Quarter Interim Report 19
Non-cash expenses are primarily comprised of depreciation and amortization, non-cash infl ation indexation on our
Chilean peso denominated debt and unrealized mark-to-market losses on derivative contracts which are a part of our net
investment hedging program. Depreciation and amortization totalled $20 million for the quarter ended March 31, 2011,
compared to $14 million in the same period of the prior year. The increase is primarily due to the Prime merger.
Regulatory Update
Our utilities businesses have periodic reviews of their rates by regulators. However, our regulatory risk is reduced due
to the number of jurisdictions in which we operate and the constructive relationships that we try to maintain with our
regulators.
Our North American transmission operations submitted a rate application to the Ontario Energy Board (OEB) for a
two year capital program covering 2011 and 2012. The two year program totals $24 million and includes a number of
projects, the largest of which is rebuilding the third line project substation. During the quarter, the OEB approved our
rate application, thus approving our capital projects.
Business Development and Outlook
Within our utility operations, we have numerous opportunities to upgrade and expand our rate base. While we are
required to make certain capital expenditures to maintain safety and reliability, we will direct discretionary capital to
those businesses that provide the highest risk-adjusted returns. In our utility platform, we expect to earn a return on
the equity that we invest which is consistent with the overall return objective for our business.
Our capital project backlog is comprised of investments that will increase our rate base. It is defi ned as projects that
have been awarded to us, as well as projects that have been fi led with the regulator with scheduled expenditures within
the next two years, for which we have not invested the capital.
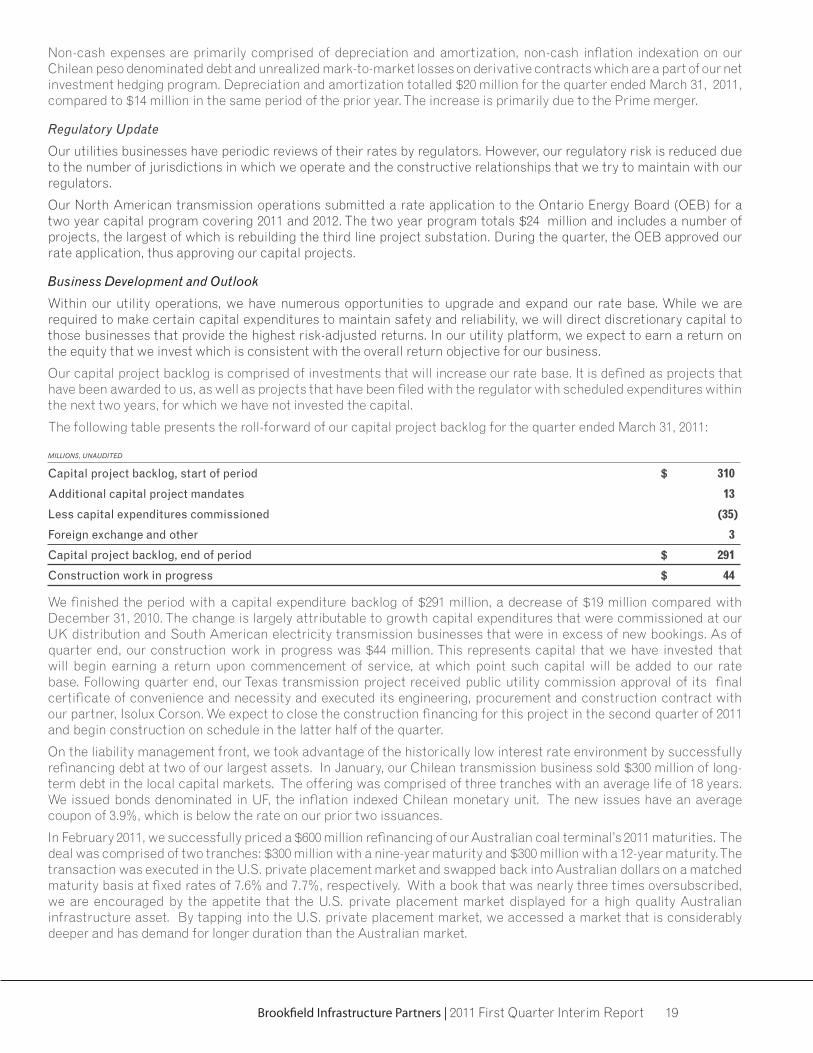
The following table presents the roll-forward of our capital project backlog for the quarter ended March 31, 2011:
MILLIONS, UNAUDITED
Capital project backlog, start of period $ 310
Additional capital project mandates 13
Less capital expenditures commissioned (35)
Foreign exchange and other 3
Capital project backlog, end of period $ 291
Construction work in progress $ 44
We fi nished the period with a capital expenditure backlog of $291 million, a decrease of $19 million compared with
December 31, 2010. The change is largely attributable to growth capital expenditures that were commissioned at our
UK distribution and South American electricity transmission businesses that were in excess of new bookings. As of
quarter end, our construction work in progress was $44 million. This represents capital that we have invested that
will begin earning a return upon commencement of service, at which point such capital will be added to our rate
base. Following quarter end, our Texas transmission project received public utility commission approval of its fi nal
certifi cate of convenience and necessity and executed its engineering, procurement and construction contract with
our partner, Isolux Corson. We expect to close the construction fi nancing for this project in the second quarter of 2011
and begin construction on schedule in the latter half of the quarter.
On the liability management front, we took advantage of the historically low interest rate environment by successfully
refi nancing debt at two of our largest assets. In January, our Chilean transmission business sold $300 million of long-
term debt in the local capital markets. The offering was comprised of three tranches with an average life of 18 years.
We issued bonds denominated in UF, the infl ation indexed Chilean monetary unit. The new issues have an average
coupon of 3.9%, which is below the rate on our prior two issuances.
In February 2011, we successfully priced a $600 million refi nancing of our Australian coal terminal’s 2011 maturities. The
deal was comprised of two tranches: $300 million with a nine-year maturity and $300 million with a 12-year maturity. The
transaction was executed in the U.S. private placement market and swapped back into Australian dollars on a matched
maturity basis at fi xed rates of 7.6% and 7.7%, respectively. With a book that was nearly three times oversubscribed,
we are encouraged by the appetite that the U.S. private placement market displayed for a high quality Australian
infrastructure asset. By tapping into the U.S. private placement market, we accessed a market that is considerably
deeper and has demand for longer duration than the Australian market.
20 Brookfi eld Infrastructure Partners | 2011 First Quarter Interim Report
Transport and Energy Operations
Our transport and energy platform is comprised of open access systems that provide transportation, storage and
handling of energy, freight and bulk commodities. This operating platform is comprised of businesses with price ceilings
as a result of regulation, such as our energy transmission and rail operations, as well as unregulated businesses, such
as our ports. Transport and energy businesses typically have high barriers to entry and in many instances have very few
substitutes in their local markets. While these businesses have greater sensitivity to market prices and volume than our
utilities platform, revenues are generally stable and, in many cases, are supported by long-term contracts or customer
relationships. Our transport and energy platform is expected to benefi t from increases in demand for commodities
as well as increases in the global movement of goods. Furthermore, the diversifi cation within our transport and
energy platform mitigates the impact of fl uctuations in demand from any particular sector, commodity or customer.
Approximately 70% of our transport and energy platform’s EBITDA is supported by long-term contractual revenues.
Our objectives for our transport and energy platform are to provide safe and reliable services to our customers and to
satisfy their growth requirements by increasing the utilization of our assets and expanding our capacity in a capital
effi cient manner. If we do so, we will be able to charge an appropriate price for our services, and we will be able to
earn an attractive return on the capital that we have deployed as well as the capital that we will invest to increase the
capacity of our operations. Our performance can be measured by our revenue growth, EBITDA margin as well as our
AFFO yield.
Our transport and energy platform is comprised of the following:
Energy Transmission
• Operate 15,500 kilometers of natural gas transmission lines primarily in the U.S.
• Serve 60% of the Chicago/Northern Indiana natural gas market
• Operate 7% of U.S. natural gas storage capacity
Rail Operations
• Operate 5,100 kilometers of tracks
• Sole rail network in Southwestern Western Australia
Ports Operations
• Handle 85 million tonnes of goods annually
• Operate 20 ports across the UK, Europe and China
Results of Operations
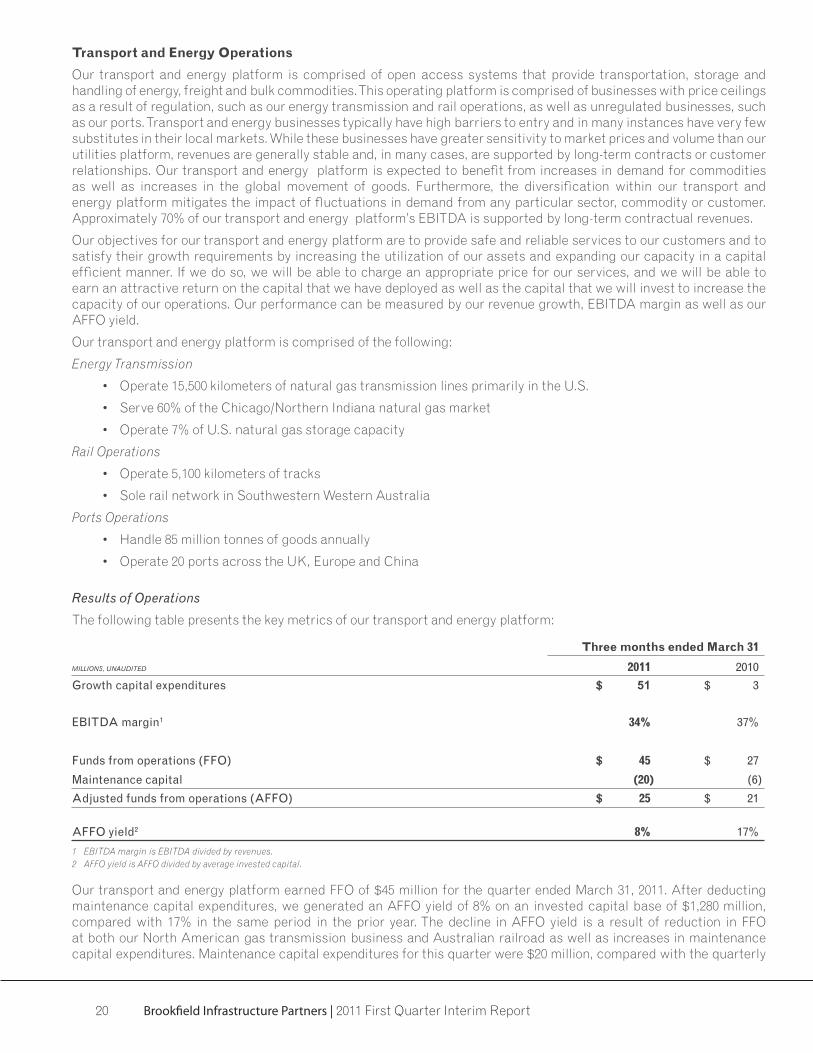
The following table presents the key metrics of our transport and energy platform:
Three months ended March 31
MILLIONS, UNAUDITED 2011 2010
Growth capital expenditures $ 51 $ 3
EBITDA margin1 34% 37%
Funds from operations (FFO) $ 45 $ 27
Maintenance capital (20) (6)
Adjusted funds from operations (AFFO) $ 25 $ 21
AFFO yield2 8% 17%
1 EBITDA margin is EBITDA divided by revenues.
2 AFFO yield is AFFO divided by average invested capital.
Our transport and energy platform earned FFO of $45 million for the quarter ended March 31, 2011. After deducting
maintenance capital expenditures, we generated an AFFO yield of 8% on an invested capital base of $1,280 million,
compared with 17% in the same period in the prior year. The decline in AFFO yield is a result of reduction in FFO
at both our North American gas transmission business and Australian railroad as well as increases in maintenance
capital expenditures. Maintenance capital expenditures for this quarter were $20 million, compared with the quarterly

Brookfi eld Infrastructure Partners | 2011 First Quarter Interim Report 21
sustainable amount of $17 million. The increase was largely due to the acceleration of certain maintenance capital
expenditures programs as a result of the recent severe weather conditions in western Australia.
The following table presents our transport and energy platform’s proportionate share of fi nancial results:
Three months ended March 31
MILLIONS, UNAUDITED 2011 2010
Revenues $ 247 $ 124
Cost attributed to revenues (163) (78)
EBITDA 84 46
Interest expense (39) (17)
Cash taxes ― (2)
Funds from operations (FFO) 45 27
Depreciation, depletion and amortization (28) (17)
Deferred taxes and other items 13 ―Net income $ 30 $ 10
For the quarter ended March 31, 2011, our transport and energy platform generated EBITDA and FFO of $84 million and
$45 million, respectively, compared to $46 million and $27 million, respectively, in the same period of 2010.
The following table presents proportionate EBITDA and FFO for each business in this operating platform:
MILLIONS, UNAUDITED EBITDA FFO
For the quarter ended March 31 2011 2010 2011 2010
Energy Transmission
North America $ 32 $ 17 $ 15 $ 9
Other 10 4 9 4
Rail road
Australasia 24 11 13 8
Ports
UK 10 8 5 4
Europe 8 6 3 2
Total $ 84 $ 46 $ 45 $ 27
Our North American gas transmission business, Australian railroad and UK port operations were responsible for 79%
and 73%, respectively, of EBITDA and FFO in our transport and energy platform.
Our North American gas transmission business reported EBITDA and FFO of $32 million and $15 million, respectively
for the quarter verses $17 million and $9 million, respectively, in the prior year. Adjusting for the change in ownership
due to the Prime merger, FFO declined by 35% due to the implementation of the FERC rate settlement in July 2010 and
softening market conditions which negatively impacted the value of certain products such as sales of retained natural
gas, market sensitive transportation capacity and line pack services. This was partially offset by lower maintenance
expenses.
Our Australian railroad reported EBITDA and FFO of $24 million and $13 million, respectively, for the quarter, versus
$11 million and $8 million in the same period of the prior year. Adjusting for the change in ownership due to the Prime
merger, FFO was 35% lower than the prior year due to weak grain volumes attributable to the drought in Western
Australia. In addition, higher margins on the operation's debt, which was refi nanced in July 2010, contributed to the
decline. These factors were partially offset by lower operating costs as a result of implementation of our cost reduction
program.
Our UK ports operation reported EBITDA and FFO of $10 million and $5 million, respectively, for the quarter versus
$8 million and $4 million in the comparable period. We continue to benefi t from volume growth in our Teesport container
operations, offset by lower margins due to ineffi ciencies arising from operating at full capacity. The container terminal
expansion project, discussed below, will increase capacity and is expected to restore margins in this segment. We also
benefi ted from a $2 million minimum volume guarantee payment from one of our customers, which was partially offset
by higher fi nancing costs during the current period.

22 Brookfi eld Infrastructure Partners | 2011 First Quarter Interim Report
Business Development and Outlook
In our transport and energy platform, we strive to increase the amount of goods that we can transport or handle in a
capital effi cient manner. Due to the economies of scale or strategic locations of our networks, we are often able to earn
very attractive returns when we invest capital to expand our facilities to serve our customers’ growth requirements.
The following table presents our proportionate share of growth capital expenditures that we anticipate investing during
the next 24 months:
MILLIONS, UNAUDITED
Australian railroad $ 573
UK port operations 25
Total growth capital expenditures $ 598
Construction work in progress $ 77
During the quarter, we made signifi cant progress on a number of growth initiatives. Our Australian railroad business
has now signed two long-term commercial track access agreements (CTAA) for expansion opportunities. The two
CTAA’s relate to the Extension Hill iron ore project and a new $3 billion fertilizer facility at Collie, which is south of
Perth. We continue to make good progress on four CTAA’s, with large iron ore customers that are expanding existing
mine operations and/or developing new mines sites. We expect to fi nalize the CTAA’s with these customers during
the second and third quarters. In total, we anticipate that these six expansion projects will increase the tonnage that
is transported by our network by approximately 25 mtpa, or 50%. The ramp up in tonnage related to these projects is
expected to begin later this year and continue through to 2014. While each of these projects is well advanced, their
ultimate timing is dependent on execution of the project by their sponsors and the availability of port capacity, both of
which are beyond our control. In order to mitigate our capital at risk, we intend to structure the CTAA’s to include take-
or-pay provisions. The two CTAA’s that have been signed include these features.
In February, Tata Steel announced the sale of Teesside Cast Products (TCP) to Sahaviriya Steel Industries PCL (SSI),
a Thai steel producer. TCP was one of the largest customers of our UK port, prior to the shutdown of its steel facility
in the second quarter of 2010. The sale closed at the end of March, and SSI has indicated that it intends to restart
steel production by year end. Furthermore, SSI expects to invest approximately $500 million into TCP to improve its
operations. We are currently in discussions with SSI to gain a full understanding of their plans for TCP. We expect
that the commencement of steel production will result in a signifi cant increase in our UK port’s conservancy and bulk
handling revenue.
Timber
Our timber platform consists of 431,000 acres of high-quality freehold timberlands located in the coastal region of
British Columbia, Canada and the Pacifi c Northwest region of the U.S. Our timberlands are predominantly comprised
of premium Douglas-fi r, hemlock and cedar species suitable for high value structural and appearance applications in
domestic and export markets. Our land holdings include approximately 12,000 acres of higher and better use (HBU)
lands, which may have greater value if used for real estate development or conservation.
The following table presents our proportionate share of selected statistics of our timberlands as of March 31, 2011:
As of
UNAUDITED March 31, 2011 March 31, 2010
Timberlands (000’s acres) 419 421
HBU lands (000’s acres) 12 12
Long-run sustainable yield (millions m3 per annum) 1.6 1.6
Deferred harvest volume (millions m3) 2.9 2.9
Our timberlands have an estimated merchantable inventory of 29.1 million m3 of timber, which includes a deferred
harvest volume of 2.9 million m3. This deferred harvest volume is in addition to harvest volumes that refl ect annual
timber growth as determined through our long-run sustainable yield (LRSY). As markets improve, cash fl ows should
increase as we ramp-up our harvest to monetize this deferred harvest volume.
One of the key attributes of our timber platform is its operating fl exibility which allows us to optimize our harvest mix
and harvest levels as well as the markets to which we sell in order to maximize value. Based on anticipated market
Brookfi eld Infrastructure Partners | 2011 First Quarter Interim Report 23
conditions, we plan our annual harvest to produce the products that offer the most attractive margins in the context
of current market conditions and freight costs to access those markets. When log prices are attractive, we increase
harvest levels to monetize the value of our inventory. When log prices are weak, we grow inventory on the stump to
enhance value through capital appreciation. Our objectives for our timber platform are to maximize the total return
on the capital that we invest in this business. Thus, our performance can be measured by our harvest levels, EBITDA
margin and AFFO yield.
Results of Operations
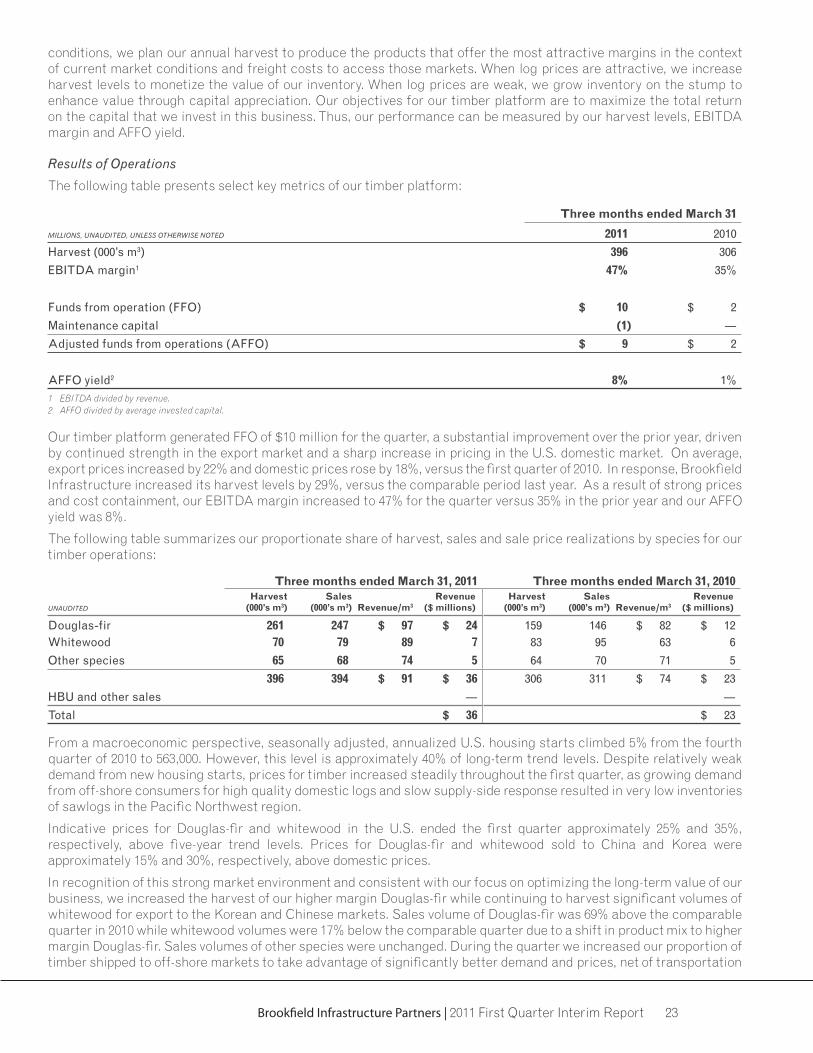
The following table presents select key metrics of our timber platform:
Three months ended March 31
MILLIONS, UNAUDITED, UNLESS OTHERWISE NOTED 2011 2010
Harvest (000’s m3) 396 306
EBITDA margin1 47% 35%
Funds from operation (FFO) $ 10 $ 2
Maintenance capital (1) ―Adjusted funds from operations (AFFO) $ 9 $ 2
AFFO yield2 8% 1%1 EBITDA divided by revenue.
2 AFFO divided by average invested capital.
Our timber platform generated FFO of $10 million for the quarter, a substantial improvement over the prior year, driven
by continued strength in the export market and a sharp increase in pricing in the U.S. domestic market. On average,
export prices increased by 22% and domestic prices rose by 18%, versus the fi rst quarter of 2010. In response, Brookfi eld
Infrastructure increased its harvest levels by 29%, versus the comparable period last year. As a result of strong prices
and cost containment, our EBITDA margin increased to 47% for the quarter versus 35% in the prior year and our AFFO
yield was 8%.
The following table summarizes our proportionate share of harvest, sales and sale price realizations by species for our
timber operations:
Three months ended March 31, 2011 Three months ended March 31, 2010
UNAUDITED
Harvest (000’s m3)
Sales (000’s m3) Revenue/m3
Revenue($ millions)
Harvest (000’s m3)
Sales (000’s m3) Revenue/m3
Revenue($ millions)
Douglas-fir 261 247 $ 97 $ 24 159 146 $ 82 $ 12Whitewood 70 79 89 7 83 95 63 6
Other species 65 68 74 5 64 70 71 5
396 394 $ 91 $ 36 306 311 $ 74 $ 23
HBU and other sales ― ―Total $ 36 $ 23
From a macroeconomic perspective, seasonally adjusted, annualized U.S. housing starts climbed 5% from the fourth
quarter of 2010 to 563,000. However, this level is approximately 40% of long-term trend levels. Despite relatively weak
demand from new housing starts, prices for timber increased steadily throughout the fi rst quarter, as growing demand
from off-shore consumers for high quality domestic logs and slow supply-side response resulted in very low inventories
of sawlogs in the Pacifi c Northwest region.
Indicative prices for Douglas-fi r and whitewood in the U.S. ended the fi rst quarter approximately 25% and 35%,
respectively, above fi ve-year trend levels. Prices for Douglas-fi r and whitewood sold to China and Korea were
approximately 15% and 30%, respectively, above domestic prices.
In recognition of this strong market environment and consistent with our focus on optimizing the long-term value of our
business, we increased the harvest of our higher margin Douglas-fi r while continuing to harvest signifi cant volumes of
whitewood for export to the Korean and Chinese markets. Sales volume of Douglas-fi r was 69% above the comparable
quarter in 2010 while whitewood volumes were 17% below the comparable quarter due to a shift in product mix to higher
margin Douglas-fi r. Sales volumes of other species were unchanged. During the quarter we increased our proportion of
timber shipped to off-shore markets to take advantage of signifi cantly better demand and prices, net of transportation
24 Brookfi eld Infrastructure Partners | 2011 First Quarter Interim Report
costs. Export volumes represented 49% of shipments in the quarter, compared to 44% in the comparable quarter of 2010.
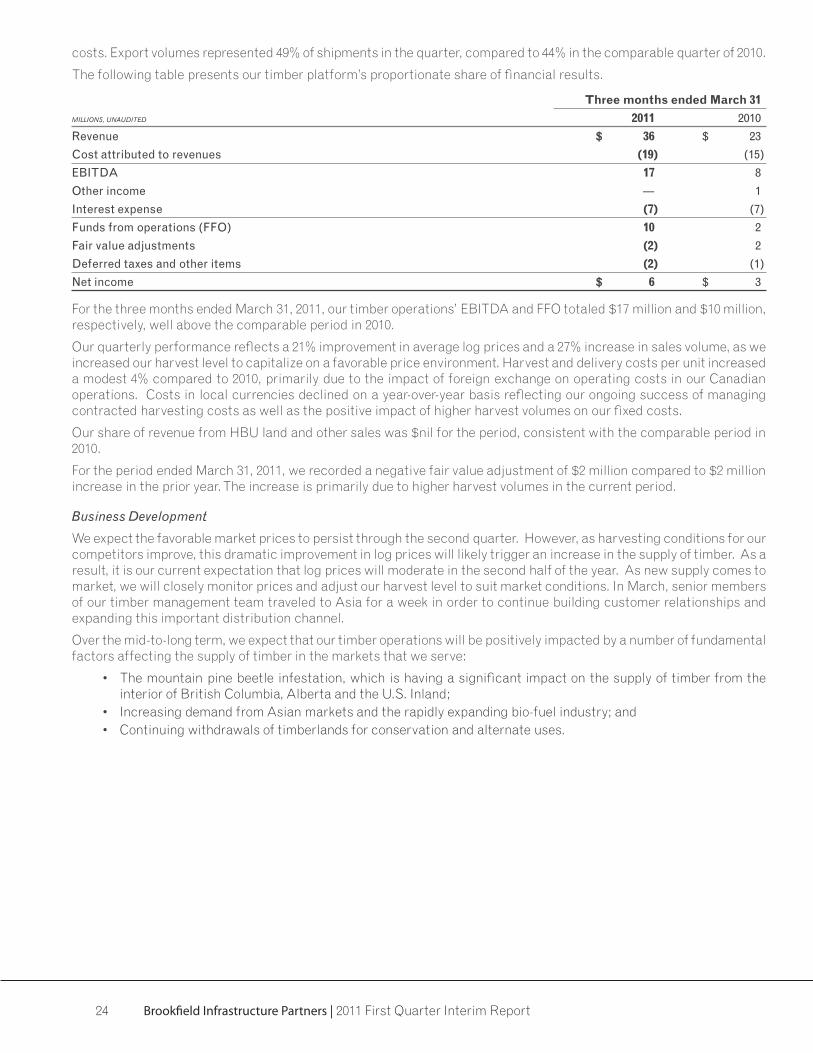
The following table presents our timber platform’s proportionate share of fi nancial results.
Three months ended March 31
MILLIONS, UNAUDITED 2011 2010
Revenue $ 36 $ 23
Cost attributed to revenues (19) (15)
EBITDA 17 8
Other income ― 1
Interest expense (7) (7)
Funds from operations (FFO) 10 2
Fair value adjustments (2) 2
Deferred taxes and other items (2) (1)
Net income $ 6 $ 3
For the three months ended March 31, 2011, our timber operations’ EBITDA and FFO totaled $17 million and $10 million,
respectively, well above the comparable period in 2010.
Our quarterly performance refl ects a 21% improvement in average log prices and a 27% increase in sales volume, as we
increased our harvest level to capitalize on a favorable price environment. Harvest and delivery costs per unit increased
a modest 4% compared to 2010, primarily due to the impact of foreign exchange on operating costs in our Canadian
operations. Costs in local currencies declined on a year-over-year basis refl ecting our ongoing success of managing
contracted harvesting costs as well as the positive impact of higher harvest volumes on our fi xed costs.
Our share of revenue from HBU land and other sales was $nil for the period, consistent with the comparable period in
2010.
For the period ended March 31, 2011, we recorded a negative fair value adjustment of $2 million compared to $2 million
increase in the prior year. The increase is primarily due to higher harvest volumes in the current period.
Business Development
We expect the favorable market prices to persist through the second quarter. However, as harvesting conditions for our
competitors improve, this dramatic improvement in log prices will likely trigger an increase in the supply of timber. As a
result, it is our current expectation that log prices will moderate in the second half of the year. As new supply comes to
market, we will closely monitor prices and adjust our harvest level to suit market conditions. In March, senior members
of our timber management team traveled to Asia for a week in order to continue building customer relationships and
expanding this important distribution channel.
Over the mid-to-long term, we expect that our timber operations will be positively impacted by a number of fundamental
factors affecting the supply of timber in the markets that we serve:
• The mountain pine beetle infestation, which is having a signifi cant impact on the supply of timber from the
interior of British Columbia, Alberta and the U.S. Inland;
• Increasing demand from Asian markets and the rapidly expanding bio-fuel industry; and
• Continuing withdrawals of timberlands for conservation and alternate uses.

Brookfi eld Infrastructure Partners | 2011 First Quarter Interim Report 25
CORPORATE AND OTHER
The following table presents the components of Corporate and Other, on a proportionate basis, for the three months
ended March 31, 2011 and 2010:
Three months ended March 31
MILLIONS, UNAUDITED 2011 2010
General and administrative costs $ (3) $ (3)
Base management fee (11) (6)
Other income 1 1
Financing costs (5) (3)
Funds from operations (FFO) (18) (11)
Deferred taxes and other (3) (14)
Corporate and other $ (21) $ (25)
General and administrative costs were in-line with prior year levels as higher professional service expenses incurred in
association with the Primer merger, were offset by lower corporate expenses incurred at the Prime level. In the prior
year, we included in our general and administrative expenses a proportionate share of Prime’s corporate, general and
administrative expenses. Following the merger, a substantial amount of these expenses are provided under the Master
Services Agreement. As a result, a substantial amount of these costs have been absorbed by Brookfi eld. We currently
anticipate that our corporate and administrative costs, excluding the base management fee, will be in the range of
$9 million to $11 million per year.
Pursuant to our Master Services Agreement, we pay a quarterly base management fee to Brookfi eld based on our
market value, plus recourse debt net of cash. This fee increased over the prior quarter due to the $1.1 billion equity
issuance associated with the Prime merger and the increased trading price of our partnership units.
Financing costs include dividends paid on our preferred shares, interest expense and standby fees on our committed
credit facility, less ancillary interest earned on cash balances. These costs exclude non-cash amortization of fi nancing
costs of $1 million for the three months ended March 31, 2011. Financing costs for the quarter were higher than the
comparable period in the prior year. The increase is primarily attributable to the increased size of our corporate facility
interest on our corporate facility, and interest on Prime's corporate bonds.
Other Investments
Our other investments include the results from our 30% interest in a U.S. hydro facility and our public private partnerships
(PPP’s). These results are included as a part of other income. On a proportionate basis, our other investments earned
FFO of $1 million in the three months ended March 31, 2011. Subsequent to period end, we sold our two Australian
PPP's to a third party for $15 million.
The PPP’s differ from our other infrastructure assets. PPP’s have fi nite concessions of between 25 to 30 years, and
cash generated from these projects must fully retire project debt over the term of the concession. Thus, FFO for our
PPP operations include IFRS net income plus depreciation less debt amortization payments, which approximates the
distributions to us from these operations. These projects are expected to generate stable cash fl ows from long-term
contracts combined with long-term fi nancing arrangements.
26 Brookfi eld Infrastructure Partners | 2011 First Quarter Interim Report
CAPITAL RESOURCES AND LIQUIDITY
The nature of our asset base and the quality of our associated cash fl ows enable us to maintain a stable and low
cost capitalization. We attempt to maintain suffi cient fi nancial liquidity at all times so that we are able to participate
in attractive opportunities as they arise, better withstand sudden adverse changes in economic circumstances and
maintain a relatively high distribution of our FFO to unitholders. Our principal sources of liquidity are cash fl ows from
our operations, undrawn credit facilities and access to public and private capital markets. We also structure the
ownership of our assets to enhance our ability to monetize them to provide additional liquidity, if necessary.
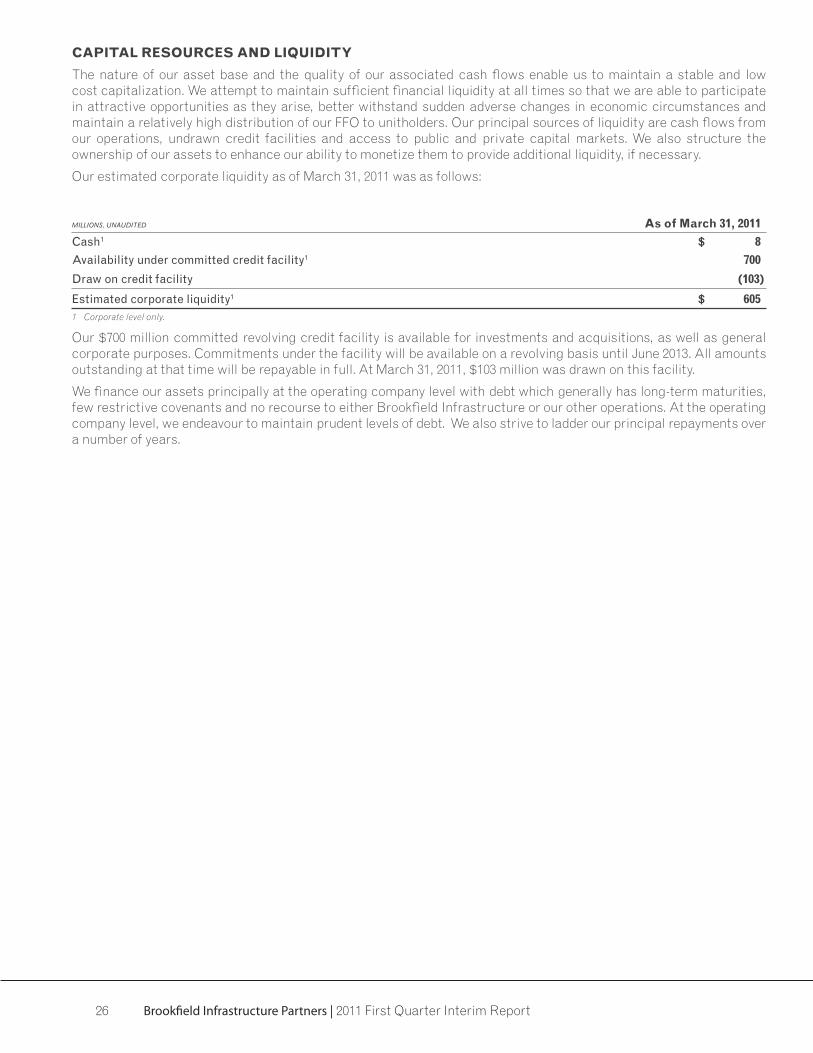
Our estimated corporate liquidity as of March 31, 2011 was as follows:
MILLIONS, UNAUDITED As of March 31, 2011
Cash1 $ 8
Availability under committed credit facility1 700
Draw on credit facility (103)
Estimated corporate liquidity1 $ 6051 Corporate level only.
Our $700 million committed revolving credit facility is available for investments and acquisitions, as well as general
corporate purposes. Commitments under the facility will be available on a revolving basis until June 2013. All amounts
outstanding at that time will be repayable in full. At March 31, 2011, $103 million was drawn on this facility.
We fi nance our assets principally at the operating company level with debt which generally has long-term maturities,
few restrictive covenants and no recourse to either Brookfi eld Infrastructure or our other operations. At the operating
company level, we endeavour to maintain prudent levels of debt. We also strive to ladder our principal repayments over
a number of years.

Brookfi eld Infrastructure Partners | 2011 First Quarter Interim Report 27
On a proportionate basis, scheduled principal repayments as of March 31, 2011 for our borrowings over the next fi ve
years are as follows:
MILLIONS, UNAUDITED
Average Term(years) 2011 2012 2013 2014 2015 Beyond Total
Recourse borrowings
Corporate borrowings 3 $ ― $ ― $ 103 $ ― $ ― $ ― $ 103
Subsidiary borrowings 2 ― 112 ― ― ― ― 112
Total recourse borrowings 2 ― 112 103 ― ― ― 215
Non-recourse borrowings1, 2
Utilities 8 110 70 599 104 45 1,484 2,412
Transport and energy 6 73 376 413 510 9 737 2,118
Timber 7 ― ― 136 ― 130 209 475
Total non-recourse borrowings1, 2 7 183 446 1,148 614 184 2,430 5,005
Total borrowings 7 $ 183 $ 558 $ 1,251 $ 614 $ 184 $ 2,430 $ 5,220
Cash retained in businesses
Utilities $ 71
Transport and energy 170
Timber 31
Corporate 8
Total cash retained $ 280
Net debt
Utilities $ 2,341
Transport and energy 1,948
Timber 444
Corporate 207
Total net debt $ 4,9401 Represents non-recourse debt to Brookfi eld Infrastructure as the holders have recourse only to the underlying operations.
2 Non-recourse project debt from our social infrastructure operations has been excluded from the above tables as this is long-term debt which is fully amortized during the term of our concession contracts.
Our debt has an average term of seven years. On a proportionate consolidated basis, our net debt-to-capitalization ratio
as of March 31, 2011 was 59%.
The following table summarizes our proportionate average debt balance allocated to each operating platform:
Three Months Ended March 31, 2011 Three Months Ended March 31, 2010
MILLIONS, UNAUDITED
Proportionate Average Debt
Average Cash Interest Rate
Cash Interest
Proportionate Average Debt
Average Cash Interest Rate
Cash Interest
Utilities $ 2,396 6.3% $ 38 $ 1,430 5.6% $ 20
Transport and energy 2,105 7.4% 39 1,003 6.8% 17
Timber 475 5.9% 7 475 5.9% 7
Subsidiary corporate borrowings 113 10.6% 3 43 9.3% 1
Corporate borrowings 68 5.9% 1 ― ― ―Total $ 5,157 6.8% $ 88 $ 2,951 6.1% $ 45

28 Brookfi eld Infrastructure Partners | 2011 First Quarter Interim Report
Proportionate debt can be reconciled to consolidated debt as follows:
As of
MILLIONS, UNAUDITED March 31, 2011 December 31, 2010
Consolidated debt $ 4,782 $ 4,593
Less: borrowings attributable to non-controlling interest (1,697) (1,675)
Premium on debt 141 154
Add: Proportionate share of borrowings of investments in associates
Utilities 674 675
Transport and energy 1,320 1,303
Proportionate debt $ 5,220 $ 5,050
Our equity strategy is to issue equity in conjunction with future acquisitions. However, we may also issue an amount
of equity opportunistically to enhance our liquidity to pursue future acquisitions. In December 2009, we fi led shelf
registrations to enable us to issue securities in both the U.S. and Canadian markets.
FOREIGN CURRENCY HEDGING STRATEGY
To the extent it makes economic sense to do so, our strategy is to hedge a portion of our equity investment and/or cash
fl ows exposed to foreign currencies within our business. The following key principles form the basis of our foreign
currency hedging strategy:
• We leverage any natural hedges that may exist within our operations
• We utilize local currency debt fi nancing to the extent possible
• We may utilize derivative contracts to the extent that natural hedges are insuffi cient
The following table presents the hedged position of our equity investment in foreign currencies as of March 31, 2011:
Net Investment Hedges
MILLIONS, UNAUDITED USD AUD NZD CAD GBP EUR
Equity Investment − US$ $ 1,103 $ 1,564 $ 158 $ 90 $ 348 $ 122
FX contracts − US$ 889 (539) (103) ― (190) (57)
Net unhedged − US$ n/a 1,025 55 90 158 65
Equity Investment − natural currency 1,103 1,514 207 88 217 86
FX contracts − natural currency 889 (522) (135) ― (118) (40)
% of Equity Investment hedged
Unhedged position in natural currency n/a $ 992 $ 72 $ 88 $ 99 $ 46
At March 31, 2011, we had hedges in place equal to approximately 39% of our net equity investment in foreign currencies.
We recorded losses of $15 million in comprehensive income relating to these contracts, which were more than offset by
foreign currency translation gains of $35 million recorded during the quarter.

Brookfi eld Infrastructure Partners | 2011 First Quarter Interim Report 29
CAPITAL REINVESTMENT
Our fi nancing plan is to fund our recurring growth capital expenditures with cash fl ow generated by our operations,
as well as debt fi nancing that is sized to maintain our credit profi le. To fund large scale development projects and
acquisitions, we will evaluate a variety of capital sources including proceeds from selling non-core assets, equity and
debt fi nancing. We will seek to raise additional equity if we believe that we can earn returns on these investments
in excess of the cost of the incremental equity. During the quarter, we generated $22 million of cash available for
re-investment in our business, and we invested $78 million in growth capital projects.
The following table highlights the cashfl ow that was generated during the quarter which was available for reinvestment
in our business:
MILLIONS, UNAUDITED Three months ended March 31, 2011
Funds from operations (FFO) $ 98
Less maintenance capital (27)
Adjusted funds from operations (AFFO) 71
Distributions (49)
Funds available for reinvestment $ 22
The following table presents the components of growth and maintenance capital expenditures:
Three months ended March 31
MILLIONS, UNAUDITED 2011 2010
Growth capital expenditures by segment
Utilities $ 27 $ 15
Transport and energy 51 3
Timber ― ―$ 78 $ 18
Maintenance capital expenditures by segment
Utilities $ 6 $ 2
Transport and energy 20 6
Timber 1 ―
$ 27 $ 8
Based on our current operations, we expect that maintenance capital expenditures will be in the range of $90 million to
$100 million in 2011.
PARTNERSHIP CAPITAL
The total number of partnership units outstanding was comprised of the following:
MILLIONS, PARTNERSHIP UNITS March 31, 2011 December 31, 2010
Limited partnership units 156.3 156.3
General partnership units 1.1 1.1
Total 157.4 157.4

30 Brookfi eld Infrastructure Partners | 2011 First Quarter Interim Report
The general partner is entitled to incentive distribution rights which are based on the amount by which quarterly
distributions on the limited partnership units exceed specifi ed target levels. To the extent distributions on limited
partnership units exceed $0.305 per quarter, the incentive distribution rights are entitled to 15% of incremental
distributions above this threshold. To the extent that distributions on limited partnership units exceed $0.33 per unit,
the incentive distribution rights are entitled to 25% of incremental distributions above this threshold.
RECONCILIATION OF NON-IFRS FINANCIAL MEASURES
To measure performance, we focus on net income as well as FFO. We defi ne FFO as net income excluding the impact
of depreciation, depletion and amortization, deferred taxes and other items as shown in the reconciliation below. For
our social infrastructure operations we also subtract debt amortization from FFO as these are fi nite life concessions
and debt must be fully amortized during the concession term. FFO is a measure of operating performance that is not
calculated in accordance with, and does not have any standardized meaning prescribed by IFRS. FFO is therefore
unlikely to be comparable to similar measures presented by other issuers. FFO has limitations as an analytical tool:
• FFO does not include depreciation and amortization expense; because we own capital assets with fi nite lives,
depreciation and amortization expense recognizes the fact that we must maintain or replace our asset base in
order to preserve our revenue generating capability;
• FFO does not include deferred income taxes, which may become payable if we own our assets for a long period
of time;
• FFO does not include any non-cash fair value adjustments or mark-to-market adjustments recorded to net
income; and
• FFO does not include performance fees accrued relating to our Canadian timber operations, which must be paid
in cash and represents a fee we expect to accrue in the future.
Because of these limitations, FFO should not be considered as the sole measure of our performance and should not
be considered in isolation from, or as a substitute for, analysis of our results as reported under IFRS. We compensate
for these limitations by relying on our IFRS results and using FFO only supplementally. However, FFO is a key measure
that we use to evaluate the performance of our operations and forms the basis for our partnership’s distribution policy.
When viewed with our IFRS results, we believe that FFO provides a more complete understanding of factors and trends
affecting our underlying operations. FFO allows us to evaluate our businesses on the basis of cash return on net capital
deployed by removing the effect of non-cash and other items. We add back depreciation and amortization to remove the
implication that our assets decline in value over time since we believe that the value of most or our assets will typically
increase over time provided we make all necessary maintenance expenditures.
We add back depletion because we endeavor to manage our timberlands on a sustainable basis over the long term.
Furthermore, changes in asset values typically do not decline on a predetermined schedule, as suggested by accounting
depreciation or depletion, but instead will inevitably vary upwards and downwards based on a number of market and
other conditions that cannot be determined in advance. We add back deferred income taxes because we do not believe
this item refl ects the present value of the actual cash tax obligations we will be required to pay, particularly if our
operations are held for a long period of time. We add back fair value adjustments and mark-to-market adjustments
recorded in net income as these are non-cash in nature and indicate a point in time approximation of value on long-term
items. Finally, we add back a performance fee payable to Brookfi eld by Island Timberlands. This performance fee was
calculated based upon a percentage of the increased appraised value of the renewable resources and HBU land assets
held by our Canadian timber operations over a threshold level. We believe it is appropriate to measure our performance
excluding the impact of this accrual as we expect that over time the fi nancial impact of this fee will be more than offset
by increased income associated with the increased appraised value of these assets, a benefi t which is not refl ected in
the period in which the related fee accrues. In addition, as a result of our fee-netting mechanism, which is designed to
eliminate any duplication of fees, any performance fees will reduce future incentive distributions that may otherwise be
made to Brookfi eld by the partnership. As this credit is refl ected as a reduction in distributions to Brookfi eld, it would
not be refl ected in FFO without adding back the performance fee.
In addition, we focus on adjusted funds from operations or AFFO, which is defi ned as funds from operations (FFO) less
maintenance capital expenditures. Management uses AFFO as a measure of long-term sustaining cash fl ow.
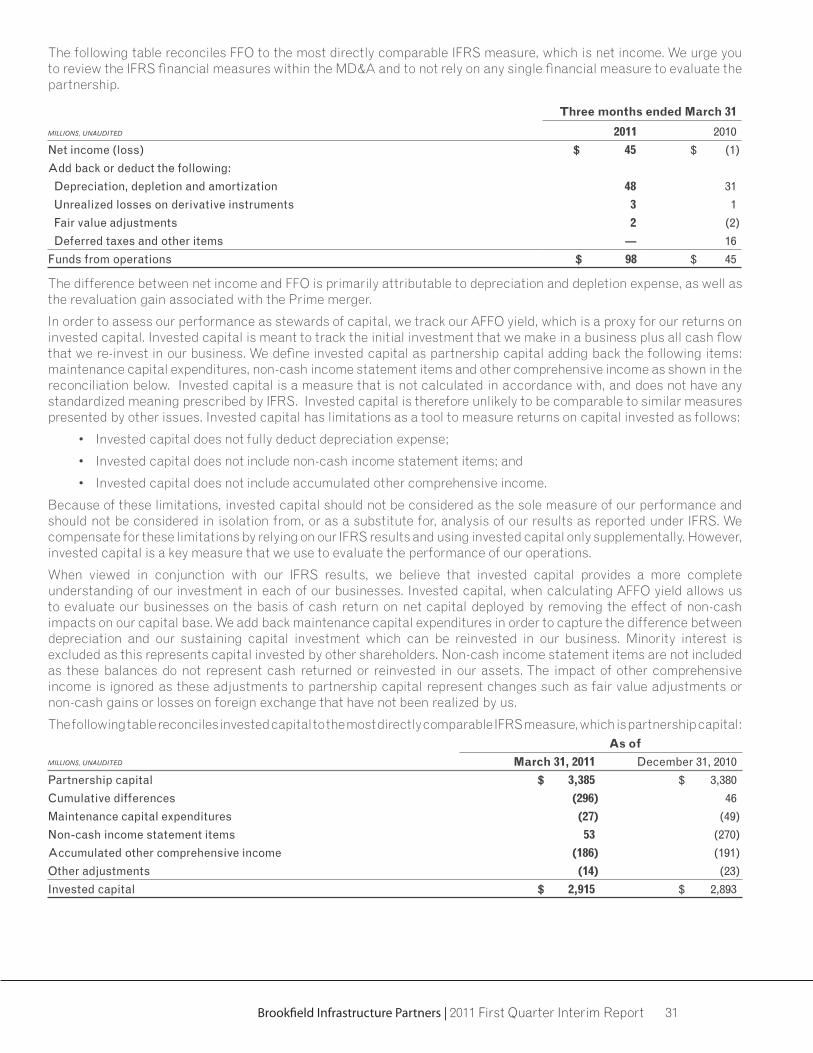
Brookfi eld Infrastructure Partners | 2011 First Quarter Interim Report 31
The following table reconciles FFO to the most directly comparable IFRS measure, which is net income. We urge you
to review the IFRS fi nancial measures within the MD&A and to not rely on any single fi nancial measure to evaluate the
partnership.
Three months ended March 31
MILLIONS, UNAUDITED 2011 2010
Net income (loss) $ 45 $ (1)
Add back or deduct the following:
Depreciation, depletion and amortization 48 31
Unrealized losses on derivative instruments 3 1
Fair value adjustments 2 (2)
Deferred taxes and other items ― 16
Funds from operations $ 98 $ 45
The difference between net income and FFO is primarily attributable to depreciation and depletion expense, as well as
the revaluation gain associated with the Prime merger.
In order to assess our performance as stewards of capital, we track our AFFO yield, which is a proxy for our returns on
invested capital. Invested capital is meant to track the initial investment that we make in a business plus all cash fl ow
that we re-invest in our business. We defi ne invested capital as partnership capital adding back the following items:
maintenance capital expenditures, non-cash income statement items and other comprehensive income as shown in the
reconciliation below. Invested capital is a measure that is not calculated in accordance with, and does not have any
standardized meaning prescribed by IFRS. Invested capital is therefore unlikely to be comparable to similar measures
presented by other issues. Invested capital has limitations as a tool to measure returns on capital invested as follows:
• Invested capital does not fully deduct depreciation expense;
• Invested capital does not include non-cash income statement items; and
• Invested capital does not include accumulated other comprehensive income.
Because of these limitations, invested capital should not be considered as the sole measure of our performance and
should not be considered in isolation from, or as a substitute for, analysis of our results as reported under IFRS. We
compensate for these limitations by relying on our IFRS results and using invested capital only supplementally. However,
invested capital is a key measure that we use to evaluate the performance of our operations.
When viewed in conjunction with our IFRS results, we believe that invested capital provides a more complete
understanding of our investment in each of our businesses. Invested capital, when calculating AFFO yield allows us
to evaluate our businesses on the basis of cash return on net capital deployed by removing the effect of non-cash
impacts on our capital base. We add back maintenance capital expenditures in order to capture the difference between
depreciation and our sustaining capital investment which can be reinvested in our business. Minority interest is
excluded as this represents capital invested by other shareholders. Non-cash income statement items are not included
as these balances do not represent cash returned or reinvested in our assets. The impact of other comprehensive
income is ignored as these adjustments to partnership capital represent changes such as fair value adjustments or
non-cash gains or losses on foreign exchange that have not been realized by us.
The following table reconciles invested capital to the most directly comparable IFRS measure, which is partnership capital:
As of MILLIONS, UNAUDITED March 31, 2011 December 31, 2010
Partnership capital $ 3,385 $ 3,380
Cumulative differences (296) 46
Maintenance capital expenditures (27) (49)
Non-cash income statement items 53 (270)
Accumulated other comprehensive income (186) (191)
Other adjustments (14) (23)
Invested capital $ 2,915 $ 2,893
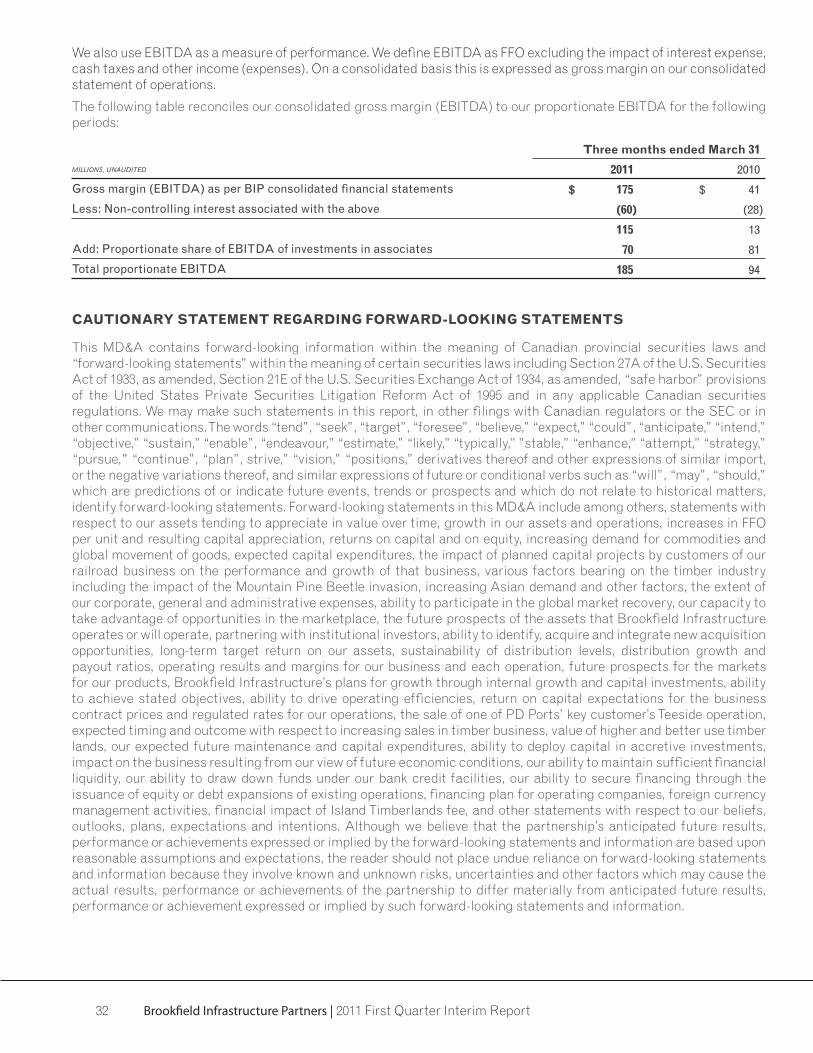
32 Brookfi eld Infrastructure Partners | 2011 First Quarter Interim Report
We also use EBITDA as a measure of performance. We defi ne EBITDA as FFO excluding the impact of interest expense,
cash taxes and other income (expenses). On a consolidated basis this is expressed as gross margin on our consolidated
statement of operations.
The following table reconciles our consolidated gross margin (EBITDA) to our proportionate EBITDA for the following
periods:
Three months ended March 31
MILLIONS, UNAUDITED 2011 2010
Gross margin (EBITDA) as per BIP consolidated fi nancial statements $ 175 $ 41
Less: Non-controlling interest associated with the above (60) (28)
115 13
Add: Proportionate share of EBITDA of investments in associates 70 81
Total proportionate EBITDA 185 94
CAUTIONARY STATEMENT REGARDING FORWARD-LOOKING STATEMENTS
This MD&A contains forward-looking information within the meaning of Canadian provincial securities laws and
“forward-looking statements” within the meaning of certain securities laws including Section 27A of the U.S. Securities
Act of 1933, as amended, Section 21E of the U.S. Securities Exchange Act of 1934, as amended, “safe harbor” provisions
of the United States Private Securities Litigation Reform Act of 1995 and in any applicable Canadian securities
regulations. We may make such statements in this report, in other fi lings with Canadian regulators or the SEC or in
other communications. The words “tend”, “seek”, “target”, “foresee”, “believe,” “expect,” “could”, “anticipate,” “intend,”
“objective,” “sustain,” “enable”, “endeavour,” “estimate,” “likely,” “typically,” ”stable,” “enhance,” “attempt,” “strategy,”
“pursue," “continue”, “plan”, strive,” “vision,” “positions,” derivatives thereof and other expressions of similar import,
or the negative variations thereof, and similar expressions of future or conditional verbs such as “will”, “may”, “should,”
which are predictions of or indicate future events, trends or prospects and which do not relate to historical matters,
identify forward-looking statements. Forward-looking statements in this MD&A include among others, statements with
respect to our assets tending to appreciate in value over time, growth in our assets and operations, increases in FFO
per unit and resulting capital appreciation, returns on capital and on equity, increasing demand for commodities and
global movement of goods, expected capital expenditures, the impact of planned capital projects by customers of our
railroad business on the performance and growth of that business, various factors bearing on the timber industry
including the impact of the Mountain Pine Beetle invasion, increasing Asian demand and other factors, the extent of
our corporate, general and administrative expenses, ability to participate in the global market recovery, our capacity to
take advantage of opportunities in the marketplace, the future prospects of the assets that Brookfi eld Infrastructure
operates or will operate, partnering with institutional investors, ability to identify, acquire and integrate new acquisition
opportunities, long-term target return on our assets, sustainability of distribution levels, distribution growth and
payout ratios, operating results and margins for our business and each operation, future prospects for the markets
for our products, Brookfi eld Infrastructure’s plans for growth through internal growth and capital investments, ability
to achieve stated objectives, ability to drive operating effi ciencies, return on capital expectations for the business
contract prices and regulated rates for our operations, the sale of one of PD Ports’ key customer’s Teeside operation,
expected timing and outcome with respect to increasing sales in timber business, value of higher and better use timber
lands, our expected future maintenance and capital expenditures, ability to deploy capital in accretive investments,
impact on the business resulting from our view of future economic conditions, our ability to maintain suffi cient fi nancial
liquidity, our ability to draw down funds under our bank credit facilities, our ability to secure fi nancing through the
issuance of equity or debt expansions of existing operations, fi nancing plan for operating companies, foreign currency
management activities, fi nancial impact of Island Timberlands fee, and other statements with respect to our beliefs,
outlooks, plans, expectations and intentions. Although we believe that the partnership’s anticipated future results,
performance or achievements expressed or implied by the forward-looking statements and information are based upon
reasonable assumptions and expectations, the reader should not place undue reliance on forward-looking statements
and information because they involve known and unknown risks, uncertainties and other factors which may cause the
actual results, performance or achievements of the partnership to differ materially from anticipated future results,
performance or achievement expressed or implied by such forward-looking statements and information.

Brookfi eld Infrastructure Partners | 2011 First Quarter Interim Report 33
Factors that could cause actual results to differ materially from those contemplated or implied by forward-looking
statements include: general economic and fi nancial conditions in the countries in which we do business generally which
may impact market demand, foreign currency risk, the high level of government regulation affecting our businesses,
the outcome and timing of various regulatory, legal and contractual issues, global credit and fi nancial markets, the
competitive business environment in the industries in which we operate, the competitive market for acquisitions and
other growth opportunities, availability of equity and debt fi nancing, the completion of various large capital projects
by mining customers of our railroad business which themselves rely on access to capital and continued favorable
commodity prices, ability to negotiate favorable take-or-pay contractual terms, acts of God or similar events outside of
our control, and other risks and factors detailed from time to time in documents fi led by Brookfi eld Infrastructure with
the securities regulators in Canada and the United States, including Brookfi eld Infrastructure’s most recent Annual
Report on Form 20-F under the heading “Risk Factors”.
We caution that the foregoing list of important factors that may affect future results is not exhaustive. When relying
on our forward-looking statements to make decisions with respect to Brookfi eld Infrastructure, investors and others
should carefully consider the foregoing factors and other uncertainties and potential events. Except as required by law,
the partnership undertakes no obligation to publicly update or revise any forward-looking statements or information,
whether written or oral, that may be as a result of new information, future events or otherwise.
CAUTIONARY STATEMENT REGARDING USE OF IFRS ACCOUNTING MEASURES
Although our fi nancial results are determined in accordance with International Financial Reporting Standards (IFRS),
the basis of presentation throughout much of this report differs from IFRS in that it is organized by business segment
and utilizes funds from operations (FFO) and adjusted funds from operations (AFFO) as important measures. This is
refl ective of how we manage the business and, in our opinion, enables the reader to better understand our affairs.
We provide a reconciliation to the most directly comparable IFRS measure in this MD&A. Readers are encouraged to
consider both measures in assessing Brookfi eld Infrastructure's results.
BUSINESS ENVIRONMENT AND RISKS
Brookfi eld Infrastructure's fi nancial results are impacted by various factors, including the performance of each of our
operations and various external factors infl uencing the specifi c sectors and geographic locations in which we operate;
macro-economic factors such as economic growth, changes in currency, infl ation and interest rates; regulatory
requirements and initiatives; and litigation and claims that arise in the normal course of business. These and other
factors are described in Brookfi eld Infrastructure’s most recent Annual Report on Form 20-F which is available on our
website at www.brookfi eldinfrastructure.com and at www.sec.gov/edgar.shtml and www.sedar.com.