
BROILER - Aviagen | Aviagen
16
BROILER Performance Objectives Revised 2021 ROSS 308 AP
Transcript of BROILER - Aviagen | Aviagen

BR
OIL
ER Performance Objectives
Revised 2021
ROSS 308 AP

ROSS 308 AP BROILER: Performance Objectives
1 2021
Introduction
This booklet contains the performance objectives for the Ross® 308 AP broiler and is to be used with the Ross Broiler Management Handbook.
Performance
These objectives indicate the performance achievable under good management and environmental conditions and when feeding recommended nutrient levels.
Producers may find that local factors prevent such performance being achieved. For example:
• The availability of raw materials may limit nutrient content and intake. • Extreme climatic conditions will reduce performance. • Economic considerations may limit choice of production systems.
Therefore, average performance may be lower than the figures presented here.
The objectives are presented in two sections to reflect the global nature of the publication.
contains the performance data in metric measurements and contains imperial measurements.
In the tables, the values are rounded. This may result in small inaccuracies when using the objectives to calculate other performance statistics.
Yields will vary between processing plants depending on type of equipment used (e.g. carcass chilling technology, automated versus manual deboning) and the exact portion being produced.
Every attempt has been made to ensure the accuracy and relevance of the information presented, however, Aviagen® accepts no liability for the consequences of using this information for the management of chickens.
For further information on the management of Ross stock, please contact your local Ross representative.
gSection 1
lbSection 2

ROSS 308 AP BROILER: Performance Objectives
22021
Contents
02 Key Management Points
03 As-Hatched Performance
04 Male Performance
05 Female Performance
07 As-Hatched Performance
08 Male Performance
09 Female Performance
11 Carcass Yield
Key Management Points Cost effective production of chicken meat depends on achieving good bird performance and the following points are important for optimizing performance of the Ross 308 AP broiler:
• Maximize chick quality by good management of hatching, storage and transport conditions.• Design the brooding set-up to ensure easy access to water and feed at placement and to ease the
transition between supplementary systems and the automated feeders and drinkers at 4-5 days. Feed a highly digestible, and nutritionally balanced Starter diet.
• Keep chicks in their thermal comfort zone by monitoring chick behavior, but beware of low relative humidities (less than 50% RH). Establish a minimum ventilation program from day one.
• Monitor crop fill, feeding and drinking behavior and 7-day live weight to allow continuous improvement of the brooding set-up.
• Keep birds in their thermal comfort zone throughout the growing period. Fast growing broilers produce large amounts of heat, particularly in the second half of the growout period. Keeping ambient temperatures less than 21ºC (69.8ºF) from 21 days onwards may improve growth rates.
• Maintain high standards of biosecurity and cleanliness to keep disease to a minimum.
gSection 1
gSection 1
gSection 1
lbSection 2
lbSection 2
lbSection 2

ROSS 308 AP BROILER: Performance Objectives g
3 2021
Day Body weight (g)1
Daily gain (g)
Av. daily gain/week (g)
Daily intake (g)
Cum. intake (g)2
FCR3
0 44
1 60 16 11 0.178
2 77 17 14 25 0.327
3 96 19 18 43 0.452
4 118 22 22 66 0.558
5 143 25 27 92 0.648
6 170 28 31 123 0.724
7 201 31 22.47 35 158 0.789
8 235 34 40 198 0.845
9 272 37 45 243 0.893
10 313 41 49 292 0.934
11 357 44 54 346 0.971
12 404 48 59 406 1.003
13 455 51 64 470 1.032
14 510 55 44.16 69 539 1.058
15 568 58 75 614 1.082
16 629 61 80 694 1.104
17 694 65 85 780 1.124
18 762 68 91 871 1.143
19 833 71 96 967 1.161
20 907 74 102 1069 1.179
21 984 77 67.77 108 1177 1.196
22 1064 80 113 1290 1.213
23 1147 82 119 1409 1.229
24 1232 85 124 1533 1.245
25 1319 87 130 1663 1.262
26 1408 89 136 1799 1.278
27 1500 91 141 1940 1.294
28 1593 93 86.95 147 2086 1.310
29 1688 95 152 2238 1.327
30 1784 96 157 2395 1.344
31 1882 98 163 2558 1.360
32 1981 99 168 2726 1.377
33 2080 100 173 2899 1.395
34 2181 101 178 3076 1.412
35 2282 101 98.44 183 3259 1.430
36 2384 102 187 3447 1.447
37 2486 102 192 3639 1.465
38 2588 102 197 3835 1.484
39 2690 102 201 4036 1.502
40 2792 102 205 4242 1.521
41 2894 102 209 4451 1.540
42 2995 101 101.89 213 4664 1.559
43 3096 101 217 4881 1.578
44 3197 100 221 5102 1.598
45 3297 100 224 5326 1.618
46 3396 99 227 5553 1.638
47 3494 98 231 5784 1.658
48 3591 97 234 6018 1.678
49 3687 96 98.80 237 6254 1.699
50 3782 95 239 6493 1.720
51 3876 94 242 6735 1.740
52 3969 93 244 6980 1.762
53 4060 91 247 7226 1.783
54 4150 90 249 7475 1.804
55 4239 89 251 7726 1.826
56 4326 87 91.30 253 7978 1.848
57 4412 86 254 8233 1.869
58 4496 84 256 8489 1.891
59 4579 83 257 8746 1.914
60 4661 81 259 9005 1.936
61 4741 80 260 9265 1.958
62 4819 78 261 9526 1.981
63 4896 77 81.41 262 9788 2.003
64 4971 75 263 10051 2.026
65 5045 74 264 10315 2.049
66 5117 72 265 10580 2.072
67 5188 71 265 10845 2.095
68 5257 69 266 11111 2.118
69 5325 68 266 11377 2.141
70 5391 66 70.68 266 11643 2.165
As-Hatched Performance
1On-farm body weight (i.e. feed present in intestinal tract).
2Feed consumption per living bird.
3FCR includes initial body weight at placement and does not account for mortality.
NOTE: In the table values are rounded. This may result in small inaccuracies when using the objectives to calculate other performance statistics.
gROSS 308 AP BROILER: Performance Objectives
42021
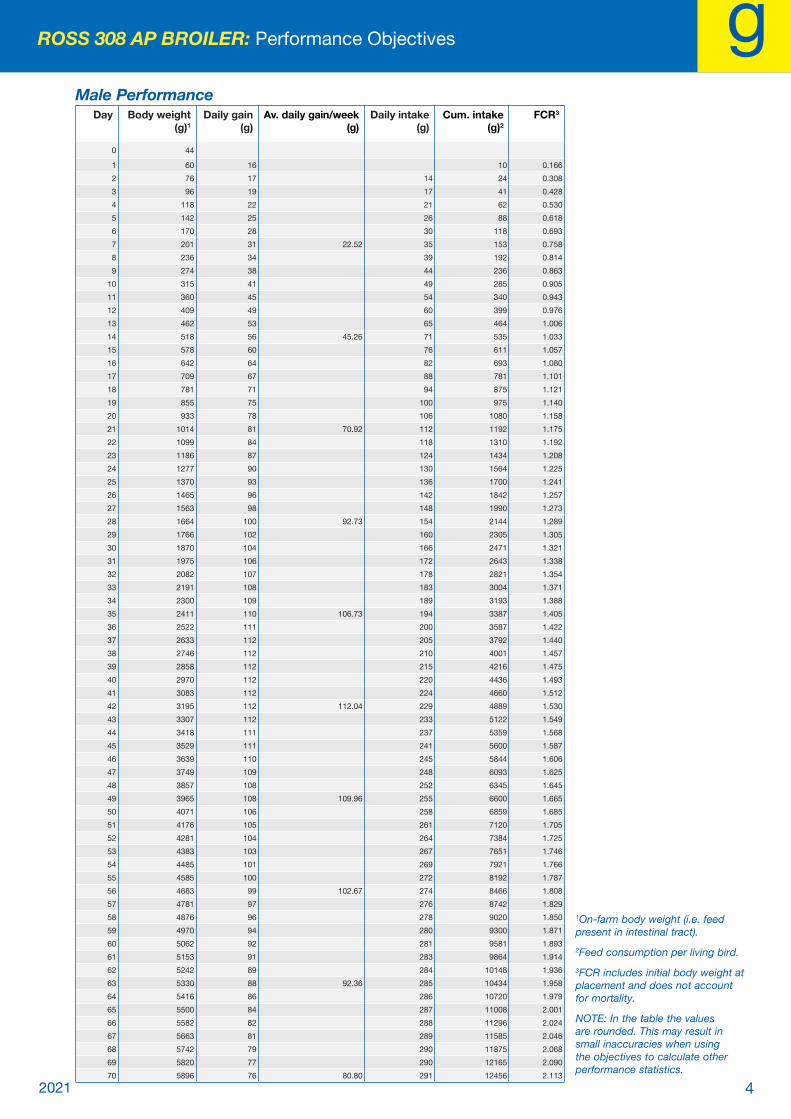
Male Performance Day Body weight
(g)1Daily gain
(g)Av. daily gain/week
(g)Daily intake
(g)Cum. intake
(g)2FCR3
0 44
1 60 16 10 0.166
2 76 17 14 24 0.308
3 96 19 17 41 0.428
4 118 22 21 62 0.530
5 142 25 26 88 0.618
6 170 28 30 118 0.693
7 201 31 22.52 35 153 0.758
8 236 34 39 192 0.814
9 274 38 44 236 0.863
10 315 41 49 285 0.905
11 360 45 54 340 0.943
12 409 49 60 399 0.976
13 462 53 65 464 1.006
14 518 56 45.26 71 535 1.033
15 578 60 76 611 1.057
16 642 64 82 693 1.080
17 709 67 88 781 1.101
18 781 71 94 875 1.121
19 855 75 100 975 1.140
20 933 78 106 1080 1.158
21 1014 81 70.92 112 1192 1.175
22 1099 84 118 1310 1.192
23 1186 87 124 1434 1.208
24 1277 90 130 1564 1.225
25 1370 93 136 1700 1.241
26 1465 96 142 1842 1.257
27 1563 98 148 1990 1.273
28 1664 100 92.73 154 2144 1.289
29 1766 102 160 2305 1.305
30 1870 104 166 2471 1.321
31 1975 106 172 2643 1.338
32 2082 107 178 2821 1.354
33 2191 108 183 3004 1.371
34 2300 109 189 3193 1.388
35 2411 110 106.73 194 3387 1.405
36 2522 111 200 3587 1.422
37 2633 112 205 3792 1.440
38 2746 112 210 4001 1.457
39 2858 112 215 4216 1.475
40 2970 112 220 4436 1.493
41 3083 112 224 4660 1.512
42 3195 112 112.04 229 4889 1.530
43 3307 112 233 5122 1.549
44 3418 111 237 5359 1.568
45 3529 111 241 5600 1.587
46 3639 110 245 5844 1.606
47 3749 109 248 6093 1.625
48 3857 108 252 6345 1.645
49 3965 108 109.96 255 6600 1.665
50 4071 106 258 6859 1.685
51 4176 105 261 7120 1.705
52 4281 104 264 7384 1.725
53 4383 103 267 7651 1.746
54 4485 101 269 7921 1.766
55 4585 100 272 8192 1.787
56 4683 99 102.67 274 8466 1.808
57 4781 97 276 8742 1.829
58 4876 96 278 9020 1.850
59 4970 94 280 9300 1.871
60 5062 92 281 9581 1.893
61 5153 91 283 9864 1.914
62 5242 89 284 10148 1.936
63 5330 88 92.36 285 10434 1.958
64 5416 86 286 10720 1.979
65 5500 84 287 11008 2.001
66 5582 82 288 11296 2.024
67 5663 81 289 11585 2.046
68 5742 79 290 11875 2.068
69 5820 77 290 12165 2.090
70 5896 76 80.80 291 12456 2.113
1On-farm body weight (i.e. feed present in intestinal tract).
2Feed consumption per living bird.
3FCR includes initial body weight at placement and does not account for mortality.
NOTE: In the table the values are rounded. This may result in small inaccuracies when using the objectives to calculate other performance statistics.

ROSS 308 AP BROILER: Performance Objectives g
5 2021
Female PerformanceDay Body weight
(g)1Daily gain
(g)Av. daily gain/week
(g)Daily intake
(g)Cum. intake
(g)2FCR3
0 44
1 60 16 11 0.189
2 77 17 15 27 0.346
3 96 19 19 46 0.477
4 118 22 23 69 0.586
5 143 25 27 97 0.678
6 170 27 32 128 0.755
7 201 30 22.42 36 164 0.820
8 234 33 40 205 0.875
9 271 37 45 250 0.923
10 310 40 49 299 0.963
11 353 43 54 353 0.999
12 400 46 59 412 1.030
13 449 50 63 475 1.058
14 502 53 43.06 68 544 1.083
15 558 56 73 617 1.106
16 617 59 78 695 1.127
17 679 62 83 778 1.147
18 744 65 88 866 1.165
19 811 68 93 960 1.183
20 881 70 98 1058 1.200
21 954 73 64.61 103 1161 1.217
22 1029 75 109 1270 1.234
23 1107 77 114 1384 1.250
24 1187 80 119 1502 1.266
25 1268 81 124 1626 1.283
26 1351 83 129 1755 1.299
27 1436 85 134 1889 1.315
28 1522 86 81.18 139 2028 1.332
29 1610 88 144 2171 1.349
30 1699 89 148 2320 1.366
31 1788 90 153 2473 1.383
32 1879 90 158 2631 1.400
33 1970 91 162 2793 1.418
34 2062 92 167 2960 1.436
35 2154 92 90.16 171 3131 1.454
36 2246 92 175 3307 1.472
37 2338 92 179 3486 1.491
38 2430 92 183 3669 1.510
39 2522 92 187 3856 1.529
40 2614 92 191 4047 1.548
41 2705 91 194 4242 1.568
42 2796 91 91.75 198 4439 1.588
43 2886 90 201 4641 1.608
44 2975 89 204 4845 1.628
45 3064 89 207 5052 1.649
46 3152 88 210 5262 1.670
47 3239 87 213 5475 1.690
48 3325 86 215 5690 1.712
49 3409 85 87.64 218 5908 1.733
50 3493 84 220 6128 1.754
51 3575 82 222 6351 1.776
52 3657 81 224 6575 1.798
53 3737 80 226 6801 1.820
54 3815 79 228 7029 1.842
55 3893 77 230 7259 1.865
56 3969 76 79.93 231 7490 1.887
57 4043 75 233 7723 1.910
58 4117 73 234 7957 1.933
59 4189 72 235 8192 1.956
60 4259 70 236 8429 1.979
61 4328 69 237 8666 2.002
62 4396 68 238 8904 2.026
63 4462 66 70.45 239 9143 2.049
64 4527 65 240 9383 2.073
65 4590 63 240 9623 2.096
66 4652 62 241 9864 2.120
67 4713 61 241 10105 2.144
68 4772 59 242 10347 2.168
69 4829 58 242 10589 2.193
70 4886 56 60.56 242 10831 2.217
1On-farm body weight (i.e. feed present in intestinal tract).
2Feed consumption per living bird.
3FCR includes initial body weight at placement and does not account for mortality.
NOTE: In the table the values are rounded. This may result in small inaccuracies when using the objectives to calculate other performance statistics.

gROSS 308 AP BROILER: Performance Objectives
62021
Notes
ROSS 308 AP BROILER: Performance Objectives lb
20217
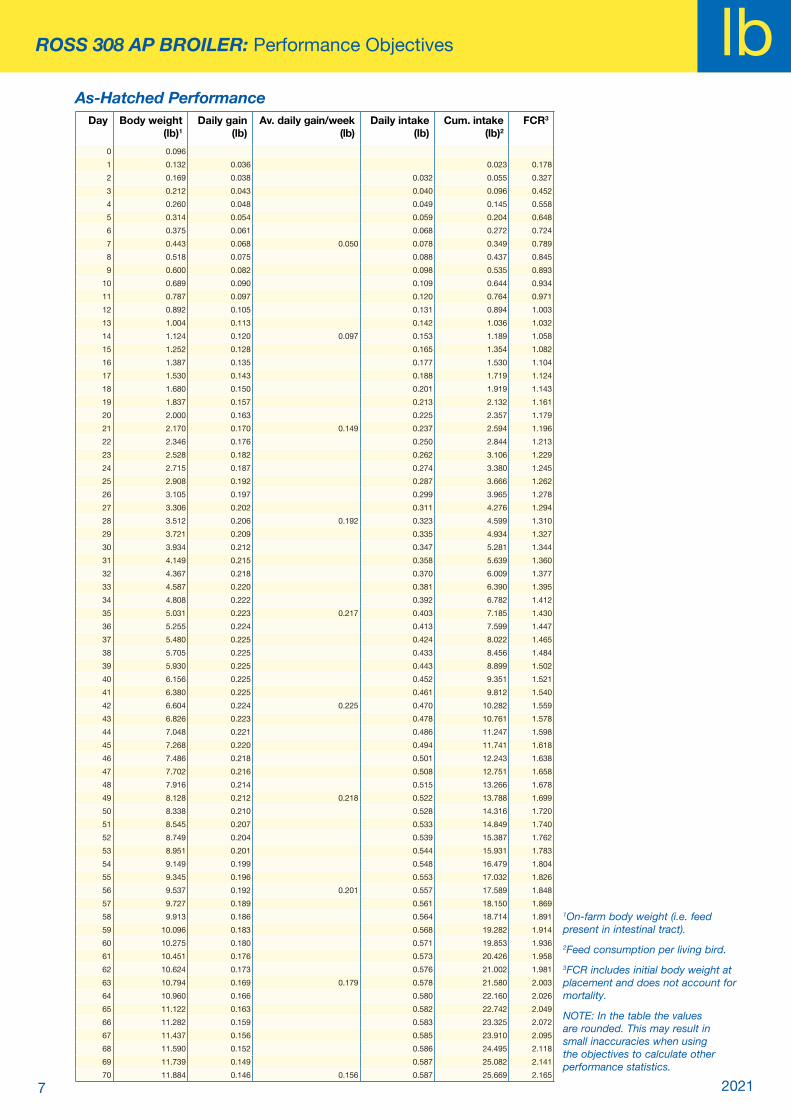
As-Hatched PerformanceDay Body weight
(lb)1Daily gain
(lb)Av. daily gain/week
(lb)Daily intake
(lb)Cum. intake
(lb)2FCR3
0 0.096
1 0.132 0.036 0.023 0.178
2 0.169 0.038 0.032 0.055 0.327
3 0.212 0.043 0.040 0.096 0.452
4 0.260 0.048 0.049 0.145 0.558
5 0.314 0.054 0.059 0.204 0.648
6 0.375 0.061 0.068 0.272 0.724
7 0.443 0.068 0.050 0.078 0.349 0.789
8 0.518 0.075 0.088 0.437 0.845
9 0.600 0.082 0.098 0.535 0.893
10 0.689 0.090 0.109 0.644 0.934
11 0.787 0.097 0.120 0.764 0.971
12 0.892 0.105 0.131 0.894 1.003
13 1.004 0.113 0.142 1.036 1.032
14 1.124 0.120 0.097 0.153 1.189 1.058
15 1.252 0.128 0.165 1.354 1.082
16 1.387 0.135 0.177 1.530 1.104
17 1.530 0.143 0.188 1.719 1.124
18 1.680 0.150 0.201 1.919 1.143
19 1.837 0.157 0.213 2.132 1.161
20 2.000 0.163 0.225 2.357 1.179
21 2.170 0.170 0.149 0.237 2.594 1.196
22 2.346 0.176 0.250 2.844 1.213
23 2.528 0.182 0.262 3.106 1.229
24 2.715 0.187 0.274 3.380 1.245
25 2.908 0.192 0.287 3.666 1.262
26 3.105 0.197 0.299 3.965 1.278
27 3.306 0.202 0.311 4.276 1.294
28 3.512 0.206 0.192 0.323 4.599 1.310
29 3.721 0.209 0.335 4.934 1.327
30 3.934 0.212 0.347 5.281 1.344
31 4.149 0.215 0.358 5.639 1.360
32 4.367 0.218 0.370 6.009 1.377
33 4.587 0.220 0.381 6.390 1.395
34 4.808 0.222 0.392 6.782 1.412
35 5.031 0.223 0.217 0.403 7.185 1.430
36 5.255 0.224 0.413 7.599 1.447
37 5.480 0.225 0.424 8.022 1.465
38 5.705 0.225 0.433 8.456 1.484
39 5.930 0.225 0.443 8.899 1.502
40 6.156 0.225 0.452 9.351 1.521
41 6.380 0.225 0.461 9.812 1.540
42 6.604 0.224 0.225 0.470 10.282 1.559
43 6.826 0.223 0.478 10.761 1.578
44 7.048 0.221 0.486 11.247 1.598
45 7.268 0.220 0.494 11.741 1.618
46 7.486 0.218 0.501 12.243 1.638
47 7.702 0.216 0.508 12.751 1.658
48 7.916 0.214 0.515 13.266 1.678
49 8.128 0.212 0.218 0.522 13.788 1.699
50 8.338 0.210 0.528 14.316 1.720
51 8.545 0.207 0.533 14.849 1.740
52 8.749 0.204 0.539 15.387 1.762
53 8.951 0.201 0.544 15.931 1.783
54 9.149 0.199 0.548 16.479 1.804
55 9.345 0.196 0.553 17.032 1.826
56 9.537 0.192 0.201 0.557 17.589 1.848
57 9.727 0.189 0.561 18.150 1.869
58 9.913 0.186 0.564 18.714 1.891
59 10.096 0.183 0.568 19.282 1.914
60 10.275 0.180 0.571 19.853 1.936
61 10.451 0.176 0.573 20.426 1.958
62 10.624 0.173 0.576 21.002 1.981
63 10.794 0.169 0.179 0.578 21.580 2.003
64 10.960 0.166 0.580 22.160 2.026
65 11.122 0.163 0.582 22.742 2.049
66 11.282 0.159 0.583 23.325 2.072
67 11.437 0.156 0.585 23.910 2.095
68 11.590 0.152 0.586 24.495 2.118
69 11.739 0.149 0.587 25.082 2.141
70 11.884 0.146 0.156 0.587 25.669 2.165
1On-farm body weight (i.e. feed present in intestinal tract).
2Feed consumption per living bird.
3FCR includes initial body weight at placement and does not account for mortality.
NOTE: In the table the values are rounded. This may result in small inaccuracies when using the objectives to calculate other performance statistics.

lb lbROSS 308 AP BROILER: Performance Objectives
82021
Male PerformanceDay Body weight
(lb)1Daily gain
(lb)Av. daily gain/week
(lb)Daily intake
(lb)Cum. intake
(lb)2FCR3
0 0.096
1 0.131 0.035 0.022 0.166
2 0.169 0.037 0.030 0.052 0.308
3 0.211 0.042 0.038 0.090 0.428
4 0.259 0.048 0.047 0.138 0.530
5 0.314 0.055 0.056 0.194 0.618
6 0.375 0.061 0.066 0.260 0.693
7 0.444 0.068 0.050 0.076 0.336 0.758
8 0.519 0.076 0.087 0.423 0.814
9 0.603 0.084 0.097 0.520 0.863
10 0.694 0.091 0.108 0.629 0.905
11 0.794 0.100 0.120 0.749 0.943
12 0.902 0.108 0.132 0.880 0.976
13 1.018 0.116 0.144 1.024 1.006
14 1.142 0.124 0.100 0.156 1.180 1.033
15 1.275 0.133 0.168 1.348 1.057
16 1.415 0.141 0.181 1.529 1.080
17 1.564 0.149 0.194 1.722 1.101
18 1.721 0.157 0.207 1.929 1.121
19 1.885 0.164 0.220 2.149 1.140
20 2.057 0.172 0.233 2.382 1.158
21 2.237 0.179 0.156 0.246 2.628 1.175
22 2.423 0.186 0.260 2.888 1.192
23 2.616 0.193 0.273 3.161 1.208
24 2.815 0.199 0.287 3.447 1.225
25 3.020 0.205 0.300 3.747 1.241
26 3.231 0.211 0.313 4.061 1.257
27 3.447 0.216 0.327 4.388 1.273
28 3.668 0.221 0.204 0.340 4.728 1.289
29 3.893 0.225 0.353 5.081 1.305
30 4.122 0.229 0.366 5.447 1.321
31 4.355 0.233 0.379 5.826 1.338
32 4.591 0.236 0.392 6.218 1.354
33 4.830 0.239 0.404 6.622 1.371
34 5.071 0.241 0.416 7.039 1.388
35 5.315 0.243 0.235 0.428 7.467 1.405
36 5.560 0.245 0.440 7.907 1.422
37 5.806 0.246 0.452 8.359 1.440
38 6.053 0.247 0.463 8.822 1.457
39 6.301 0.248 0.474 9.295 1.475
40 6.549 0.248 0.484 9.779 1.493
41 6.796 0.248 0.494 10.274 1.512
42 7.044 0.247 0.247 0.504 10.778 1.530
43 7.290 0.247 0.513 11.291 1.549
44 7.536 0.246 0.523 11.814 1.568
45 7.780 0.244 0.531 12.345 1.587
46 8.023 0.243 0.540 12.885 1.606
47 8.264 0.241 0.548 13.433 1.625
48 8.504 0.239 0.555 13.988 1.645
49 8.741 0.237 0.242 0.563 14.551 1.665
50 8.975 0.235 0.570 15.121 1.685
51 9.208 0.232 0.576 15.697 1.705
52 9.437 0.229 0.583 16.280 1.725
53 9.664 0.227 0.588 16.868 1.746
54 9.887 0.224 0.594 17.462 1.766
55 10.108 0.221 0.599 18.061 1.787
56 10.325 0.217 0.226 0.604 18.665 1.808
57 10.539 0.214 0.609 19.274 1.829
58 10.750 0.211 0.613 19.887 1.850
59 10.957 0.207 0.617 20.503 1.871
60 11.161 0.204 0.620 21.123 1.893
61 11.361 0.200 0.623 21.747 1.914
62 11.558 0.197 0.626 22.373 1.936
63 11.751 0.193 0.204 0.629 23.003 1.958
64 11.940 0.189 0.632 23.634 1.979
65 12.125 0.186 0.634 24.268 2.001
66 12.307 0.182 0.636 24.904 2.024
67 12.485 0.178 0.637 25.541 2.046
68 12.660 0.174 0.639 26.180 2.068
69 12.830 0.171 0.640 26.820 2.090
70 12.998 0.167 0.178 0.641 27.461 2.113
1On-farm body weight (i.e. feed present in intestinal tract).
2Feed consumption per living bird.
3FCR includes initial body weight at placement and does not account for mortality.
NOTE: In the table the values are rounded. This may result in small inaccuracies when using the objectives to calculate other performance statistics.

ROSS 308 AP BROILER: Performance Objectives lb
20219
Female PerformanceDay Body weight
(lb)1Daily gain
(lb)Av. daily gain/week
(lb)Daily intake
(lb)Cum. intake
(lb)2FCR3
0 0.096
1 0.132 0.036 0.025 0.189
2 0.170 0.038 0.034 0.059 0.346
3 0.212 0.043 0.043 0.101 0.477
4 0.261 0.048 0.051 0.153 0.586
5 0.315 0.054 0.061 0.213 0.678
6 0.375 0.060 0.070 0.283 0.755
7 0.442 0.067 0.049 0.079 0.363 0.820
8 0.516 0.074 0.089 0.452 0.875
9 0.597 0.081 0.099 0.550 0.923
10 0.684 0.088 0.109 0.659 0.963
11 0.779 0.095 0.119 0.778 0.999
12 0.881 0.102 0.129 0.908 1.030
13 0.990 0.109 0.140 1.048 1.058
14 1.107 0.116 0.095 0.151 1.199 1.083
15 1.230 0.123 0.161 1.360 1.106
16 1.360 0.130 0.172 1.532 1.127
17 1.496 0.137 0.183 1.716 1.147
18 1.639 0.143 0.194 1.910 1.165
19 1.788 0.149 0.206 2.116 1.183
20 1.943 0.155 0.217 2.332 1.200
21 2.104 0.161 0.142 0.228 2.560 1.217
22 2.270 0.166 0.239 2.800 1.234
23 2.440 0.171 0.251 3.050 1.250
24 2.616 0.175 0.262 3.312 1.266
25 2.795 0.180 0.273 3.585 1.283
26 2.979 0.184 0.284 3.869 1.299
27 3.166 0.187 0.295 4.165 1.315
28 3.356 0.190 0.179 0.306 4.471 1.332
29 3.550 0.193 0.317 4.787 1.349
30 3.745 0.196 0.327 5.115 1.366
31 3.943 0.198 0.338 5.452 1.383
32 4.142 0.199 0.348 5.800 1.400
33 4.343 0.201 0.358 6.158 1.418
34 4.545 0.202 0.368 6.526 1.436
35 4.748 0.203 0.199 0.377 6.903 1.454
36 4.951 0.203 0.386 7.290 1.472
37 5.154 0.203 0.395 7.685 1.491
38 5.358 0.203 0.404 8.089 1.510
39 5.560 0.203 0.413 8.502 1.529
40 5.762 0.202 0.421 8.923 1.548
41 5.964 0.201 0.429 9.351 1.568
42 6.164 0.200 0.202 0.436 9.787 1.588
43 6.362 0.199 0.443 10.231 1.608
44 6.560 0.197 0.450 10.681 1.628
45 6.755 0.195 0.457 11.138 1.649
46 6.949 0.194 0.463 11.601 1.670
47 7.140 0.191 0.469 12.070 1.690
48 7.329 0.189 0.475 12.545 1.712
49 7.516 0.187 0.193 0.480 13.025 1.733
50 7.701 0.184 0.485 13.510 1.754
51 7.882 0.182 0.490 14.000 1.776
52 8.062 0.179 0.495 14.495 1.798
53 8.238 0.176 0.499 14.994 1.820
54 8.411 0.174 0.503 15.497 1.842
55 8.582 0.171 0.506 16.003 1.865
56 8.750 0.168 0.176 0.510 16.513 1.887
57 8.914 0.165 0.513 17.026 1.910
58 9.076 0.162 0.516 17.542 1.933
59 9.234 0.158 0.519 18.061 1.956
60 9.390 0.155 0.521 18.582 1.979
61 9.542 0.152 0.523 19.105 2.002
62 9.691 0.149 0.525 19.630 2.026
63 9.837 0.146 0.155 0.527 20.157 2.049
64 9.980 0.143 0.528 20.685 2.073
65 10.119 0.140 0.530 21.215 2.096
66 10.256 0.137 0.531 21.746 2.120
67 10.389 0.133 0.532 22.278 2.144
68 10.520 0.130 0.533 22.811 2.168
69 10.647 0.127 0.533 23.344 2.193
70 10.771 0.124 0.134 0.534 23.878 2.217
1On-farm body weight (i.e. feed present in intestinal tract).
2Feed consumption per living bird.
3FCR includes initial body weight at placement and does not account for mortality.
NOTE: In the table the values are rounded, this may result in small inaccuracies when using the objectives to calculate other performance statistics.
lb lbROSS 308 AP BROILER: Performance Objectives
102021
Notes

ROSS 308 AP BROILER: Performance Objectives
11 2021
Carcass Yield
The following diagrams indicate how yields of the major portions change with increasing live weight in each sex. Eviscerated yield is broken down into breast meat and leg meat to represent a deboning operation.
Definitions of Terms
Eviscerated % eviscerated carcass (without neck, abdominal fat and internal organs) as a percentage of live weight.
Breast % breast meat (without skin and bone) as a percentage of live weight.
Thigh/Drumstick % whole thigh/drumstick (with skin and bone) as a percentage of live weight.
NOTE: These figures represent dry yield. They do not include any moisture retained during chilling or processing. Carcass component yields will vary among processing plants depending on, for example, type of equipment used and the exact portion(s) being produced.
77.00
70.3010.0812.1618.62
71.2910.0112.6020.39
72.289.9512.9521.73
72.639.9213.2122.76
72.999.8913.4123.59
73.329.8613.5924.27
73.659.8413.7424.83
73.969.8213.8525.32
74.369.8113.9525.72
74.589.8014.0526.08
74.869.7814.1226.39
Breast % Thigh % Drumstick % Eviscerated %
0 10 20 30 40 50
Live
wei
ght
Male - Portion
75.149.7714.1926.66
75.419.7714.2526.90
75.669.7614.3127.12
75.919.7514.3627.32
76.159.7414.4027.50
76.389.7414.4427.66
76.599.7314.4827.80
76.809.7314.5127.94
9.7214.5428.07
kg (lb)
1.2 2.65
1.4 3.09
1.6 3.53
1.8 3.97
2.0 4.41
2.2 4.85
2.4 5.29
2.6 5.73
2.8 6.17
3.0 6.61
3.2 7.05
3.4 7.50
3.6 7.94
3.8 8.38
4.0 8.82
4.2 9.26
4.4 9.70
4.6 10.14
4.8 10.58
5.0 11.02

ROSS 308 AP BROILER: Performance Objectives
122021
NOTE: These figures represent dry yield. They do not include any moisture retained during chilling or processing. Carcass component yields will vary among processing plants depending on, for example, type of equipment used and the exact portion(s) being produced.
Definitions of Terms
Eviscerated % eviscerated carcass (without neck, abdominal fat and internal organs) as a percentage of live weight.
Breast % breast meat (without skin and bone) as a percentage of live weight.
Thigh/Drumstick % whole thigh/drumstick (with skin and bone) as a percentage of live weight.
70.679.7812.6619.38
71.659.6412.9321.46
72.649.5313.1323.02
73.079.4513.2824.24
73.489.3813.4125.21
73.879.3313.5126.00
74.169.2913.5926.66
74.439.2513.6727.22
74.689.2213.7327.71
74.929.1913.7828.13
75.169.1713.8328.49
Breast % Thigh % Drumstick % Eviscerated %
0 10 20 30 40 50
Live
wei
ght
Female - Portion
75.399.1413.8728.81
75.619.1313.9129.10
75.819.1113.9429.35
76.019.0813.9729.59
76.209.0714.0029.79
76.389.0614.0229.98
76.549.0514.0430.16
76.709.0414.0630.31
76.859.0314.0830.45
kg (lb)
1.2 2.65
1.4 3.09
1.6 3.53
1.8 3.97
2.0 4.41
2.2 4.85
2.4 5.29
2.6 5.73
2.8 6.17
3.0 6.61
3.2 7.05
3.4 7.50
3.6 7.94
3.8 8.38
4.0 8.82
4.2 9.26
4.4 9.70
4.6 10.14
4.8 10.58
5.0 11.02

ROSS 308 AP BROILER: Performance Objectives
13 2021
NOTE: These figures represent dry yield. They do not include any moisture retained during chilling or processing. Carcass component yields will vary among processing plants depending on, for example, type of equipment used and the exact portion(s) being produced.
Definitions of Terms
Breast % breast meat (without skin and bone) as a percentage of live weight.
Leg Meat % sum of deboned thigh (without skin) and deboned drumstick (without skin) as a percentage of live weight.
Total % sum of leg meat and breast meat.
Live
wei
ght
32.7418.6214.12
35.3820.3914.98
37.3521.7315.63
38.8922.7616.13
40.1323.5916.54
41.1424.2716.87
41.9724.8317.14
42.6925.3217.38
43.2925.7217.57
43.8226.0817.74
44.2826.3917.90
Leg Meat % Breast % Total %
0 10 15 20 25 30 35 40 45 50
Male - Debone
44.6926.6618.03
45.0426.9018.14
45.3827.1218.26
45.6727.3218.35
45.9327.5018.43
46.1727.6618.52
46.3927.8018.59
46.6027.9418.65
46.7828.0718.71
1.2 2.65
1.4 3.09
1.6 3.53
1.8 3.97
2.0 4.41
2.2 4.85
2.4 5.29
2.6 5.73
2.8 6.17
3.0 6.61
3.2 7.05
3.4 7.50
3.6 7.94
3.8 8.38
4.0 8.82
4.2 9.26
4.4 9.70
4.60 10.14
4.8 10.58
5.0 11.02
kg (lb)

ROSS 308 AP BROILER: Performance Objectives
142021
Definitions of Terms
Breast % breast meat (without skin and bone) as a percentage of live weight.
Leg Meat % sum of deboned thigh (without skin) and deboned drumstick (without skin) as a percentage of live weight.
Total % sum of leg meat and breast meat.
Live
wei
ght
35.1719.3815.79
37.5121.4616.05
39.2723.0216.24
40.6424.2416.40
41.7325.2116.52
42.6326.0016.63
43.3726.6616.71
44.0027.2216.77
44.5527.7116.84
45.0228.1316.89
45.4328.4916.94
Leg Meat % Breast % Total %
0 10 15 20 25 30 35 40 45 50
Female - Debone
45.7928.8116.98
46.1129.1017.01
46.4029.3517.04
46.6629.5917.07
46.9029.7917.11
47.1029.9817.13
47.3030.1617.15
47.4830.3117.17
47.6430.4517.19
1.2 2.65
1.4 3.09
1.6 3.53
1.8 3.97
2.0 4.41
2.2 4.85
2.4 5.29
2.6 5.73
2.8 6.17
3.0 6.61
3.2 7.05
3.4 7.50
3.6 7.94
3.8 8.38
4.0 8.82
4.2 9.26
4.4 9.70
4.6 10.14
4.8 10.58
5.0 11.02
kg (lb)
NOTE: These figures represent dry yield. They do not include any moisture retained during chilling or processing. Carcass component yields will vary among processing plants depending on, for example, type of equipment used and the exact portion(s) being produced.

Aviagen and the Aviagen logo, Ross and the Ross logo are registered trademarks of Aviagen in the US and other countries. All other trademarks or brands are registered by their respective owners.
Privacy Statement: Aviagen collects data to effectively communicate and provide information to you about our products and our
business. This data may include your email address, name, business address and telephone number. To view our full Privacy Policy visit Aviagen.com
© 2020 Aviagen.
Dec 2020


