Broad-Scale Models
20
GOAL Predict Channel Characteristics in Space and Time • Assess Potential for Fish Use and Productivity • Assess Impacts of Land Use and Natural Disturbance STRATEGY Use Understanding of Watershed Processes as a Guide for Empirical Models • Identify Controls on Habitat Formation • Determine Appropriate Data Structure – put available information to the best use Broad-Scale Models Dan Miller + Kelly Burnett, Kelly Christiansen, Sharon Clarke, Lee Benda
Transcript of Broad-Scale Models

GOALPredict Channel Characteristics in Space and Time
• Assess Potential for Fish Use and Productivity
• Assess Impacts of Land Use and Natural Disturbance
STRATEGYUse Understanding of Watershed Processes
as a Guide for Empirical Models
• Identify Controls on Habitat Formation
• Determine Appropriate Data Structure – put available information to the best use
Broad-Scale ModelsDan Miller + Kelly Burnett, Kelly Christiansen, Sharon Clarke, Lee Benda

A Spatial Template –Sediment Production, Delivery, Storage
Dynamic Drivers –Storms and Floods trigger erosional
events and drive sediment movement;Changes in vegetation alter erosional
susceptibility and transport potential
A Branched and HierarchicalChannel Network
History of Events –Antecedent Conditions
A Conceptual Framework for Process Interactionsat the Watershed Scale

HillslopeGradientSlope FormContributing Area
Hydrologic ResponseLandslide SusceptibilityDebris Flow Routing
ChannelDrainage AreaGradientValley WidthTributary Junctions
Channel Type / FormDebris Fan, Terrace
N
Landslide / Debris Flow ScourLandslide or Debris Flow DepositionColluvial ChannelFluvial Channel
km
5
DEM-Derived Attributes: The Spatial Template

SedimentVolume
BouldersLWD
Pools
Harvey East Branch
0%
10%
20%
30%
40%
50%
60%
70%
0 0.5 1 1.5 2
Mean Sediment Depth (m)
Mea
n P
oo
l Den
sity
(m
/m)
Estimate Habitat Attributes as Functions ofGeomorphic Variables

0%
5%
10%
15%
20%
25%
30%
0 20 40 60 80 100Distance from Tributary (m)
Bo
uld
ers
Upstream
Downstream
0
0.5
1.0
1.5
2.0
0 20 40 60 80 100
Distance from Tributary (m)
LWD
Den
sity
(#
/10
0m
)
UpstreamDownstream
Boulders Wood
Spatial Controls on Channel Roughness
Boulders and LWD tend to be associated with debris fans at low-order tributary mouths – old debris flow deposits
0
0.1
0.2
0.3
0.4
0.5
0.6
0.7
0.8
0 20 40 60 80 100Distance from Tributary (m)
Sed
imen
t D
epth
(m
) Upstream
Downstream
Sediment

102
103
0 0.5 1 1.5 2 2.5 3
Transport Potential – Channel SizeChannel Slope (m/m) * Drainage Area (sq. km)
Lan
dsl
ide
Vo
lum
e (c
ub
ic m
eter
s)
?
Large EffectsTransient dams – pondsChannel displacement
Increasing EffectsLWD, BouldersJams
Few Effects
PermanentValley-floor aggradationLandslide dams - lakes
104
105
106
107
108
Landslide Effects Determined by the Relative Size of the Landslide and Channel

Channel Characteristics
• Sediment / LWD Inputs
• Transport Potential
• Storage Potential
Landslides, Debris Flows
Discharge ∝ Drainage AreaChannel Gradient
Valley Width
Basin Characteristics
• Assembly of channel and valley types (size, gradient, width)
• Size, network location, and spacing of debris-flow-prone tributaries

Debris Flows: Addressed in terms of Initiation, Runout, and Deposition
Initiation
Scour
Transport
Deposition
Runout

Landslide OccurrenceWhat factors affect landslide susceptibility?
• Balance of Forces
• Pore-Pressure Gradients
• Effective Soil Strength
Estimate probability of soil failure as a function of:
• Surface Gradient
• Specific Contributing Area
• Stand Type
• Forest Roads
Empirically calibrate against mapped landslide locations (ODF 1996 storm study, Siuslaw National Forest 1996 landslide inventory)
} DEM

( ))tan(1)sin(1 θθ −= −AA-1= specific contributing area
θ = surface gradient
Define a Topographic Indexof Landslide Susceptibility
0
5
10
15
20
0.01 1 100 10000
Topographic Index
%LS
%Area
Normalized Landslide Densityas a Function of the Index
Siuslaw Inventory
0
1
2
3
4
5
Open Mixed LargeConifer
Roads
Vegetation
Lan
dsl
ide
Den
sity
(#/s
q k
m)
UncorrectedBias CorrectedBias & Topo
Mean Landslide Densityas a Function of Vegetation Cover
Landslide Susceptibility as a function of topography and vegetation cover

>0
2- 5
5-10
>10
Probable Landslide Density (#/km2) based on topography and stand-typeCalibrated to February, 1996 Storm; Knowles Creek Basin, OR

Debris Flow RunoutWhat factors affect runout distance?
• Gravitational acceleration
• Changes in mass
• Frictional deceleration and deposition
Estimate probability of runout to any point as a function of:
• Channel gradient
• Tributary junction angles
• Probable volume –using cumulative scour length as a proxy
• Riparian stand type
Empirically calibrate against mapped debris flow impacts (ODF 1996 storm study)
} DEM

Probability of Delivery to a Fish-Bearing Channel based on gradient, scour length, tributary junction angles, and stand typeCalibrated to February, 1996 Storm; Knowles Creek Basin, OR
<30%
60%
90%
>90%

Probability of LWD Recruitment based on probability of upslope landsliding and delivery to a fish-bearing channelCalibrated to February, 1996 Storm; Knowles Creek Basin, OR
<1%
5%
10%
>10%

Probability of Direct in-channel Debris Flow Impactsincorporating probability of initiation, transport, and deposition
< 5%10%15%>15%

KnowlesCreek
SweetCreek
< 5%10%15%>15%
Basin-Scale Heterogeneity in Debris Flow Probability
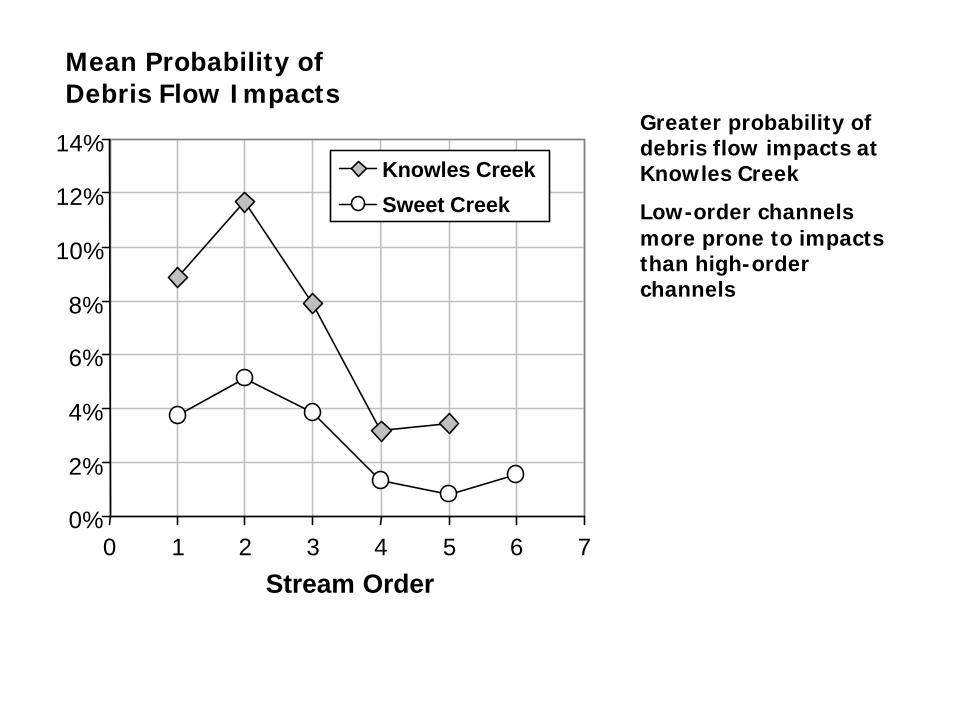
Greater probability of debris flow impacts at Knowles Creek
Low-order channels more prone to impacts than high-order channels
0%
2%
4%
6%
8%
10%
12%
14%
0 1 2 3 4 5 6 7
Stream Order
Knowles Creek
Sweet Creek
Mean Probability ofDebris Flow Impacts

Current 100 years
Open, RoadsMixedLarge Conifer
Vegetation Changes over Time
Vegetation affects:• Landslide susceptibility• Probable debris flow runout distance

0%
10%
20%
30%
40%
50%
60%
70%
0 1 2 3 4 5 6 7
Stream Order
Knowles CreekSweet Creek
Changes in vegetation cover alter the probability of debris flow impacts
Proportional ReductionThese alterations vary as a function of stream order and network structure

Goal: Topographic, vegetation cover, and landslide/debris flow mapping at coarse scales to infer channel/habitat characteristics at finer scales
Accomplishments:Landslide susceptibility and debris-flow-runout probability as functions of topography and vegetation cover
Landslide initiation hazardPotential for landslide deliveryProbability of debris flow traversal – LWD recruitment, road crossings
Reach- and basin-scale estimates of channel characteristicsTopographic controls on spatial heterogeneity:
number, location, and spacing of debris-flow prone tributariesEffects of vegetation change modulated by network structure