British law and caste identity manipulation in colonial ...pu/conference/dec_09_conf/Papers/... ·...
26
British law and caste identity manipulation in colonial India: the Punjab Alienation of Land Act. Guilhem Cassan * September 10, 2009 Very preliminary, please do not quote. I analyze the impact of the creation of an ”agricultural tribe” category by the Punjab Alienation of Land Act of 1901, the membership of which was almost compulsory in order to buy or sell land. Using original panel data built from the decennial census of Punjab from 1881 to 1921, I show, using various triple difference strategies, that in the districts where the law was enacted, caste groups showed a tendency to manipulate their caste identity in order to claim an affiliation to castes and tribes registered as agricultural by the British administration, pointing to both the role of the British administration in the making of caste as a salient identity in colonial Punjab, as well as the ability of caste groups to manipulate their identity in response to economic and institutional incentives. * Paris School of Economics and Laboratoire d’Economie Appliqu´ ee (email: [email protected]). I thank Sylvie Lambert, Denis Cogneau, Dave Donaldson, V´ eronique B´ en´ e¨ ı and several seminar partici- pants for helpful comments. I am grateful to the Laboratoire d’Economie Appliqu´ ee-INRA for funding the data collection. 1
Transcript of British law and caste identity manipulation in colonial ...pu/conference/dec_09_conf/Papers/... ·...

British law and caste identity manipulation in colonial
India: the Punjab Alienation of Land Act.
Guilhem Cassan∗
September 10, 2009
Very preliminary, please do not quote.
I analyze the impact of the creation of an ”agricultural tribe” category by the PunjabAlienation of Land Act of 1901, the membership of which was almost compulsory in orderto buy or sell land. Using original panel data built from the decennial census of Punjabfrom 1881 to 1921, I show, using various triple difference strategies, that in the districtswhere the law was enacted, caste groups showed a tendency to manipulate their casteidentity in order to claim an affiliation to castes and tribes registered as agricultural bythe British administration, pointing to both the role of the British administration in themaking of caste as a salient identity in colonial Punjab, as well as the ability of castegroups to manipulate their identity in response to economic and institutional incentives.
∗Paris School of Economics and Laboratoire d’Economie Appliquee (email: [email protected]). Ithank Sylvie Lambert, Denis Cogneau, Dave Donaldson, Veronique Beneı and several seminar partici-pants for helpful comments. I am grateful to the Laboratoire d’Economie Appliquee-INRA for fundingthe data collection.
1

Introduction
This paper analyzes the impact on the caste system of a land policy reform, the PunjabAlienation of Land Act, passed in 1901 by the British administration in Punjab. Bycreating an ”agricultural tribes” category the membership of which was almost compul-sory to buy or sell land, it created a very strong incentive for caste groups to manipulatetheir caste identity in order to claim membership to a caste group actually considered asan agricultural tribe1 so as to be able to enter the land market. By using caste censusdata from 1881 to 1921, I am able to follow the population of the different caste groupsof the Province of Punjab, and thus to evaluate the impact of the enacting of this law onthe tendency of caste groups to respond to the incentives given to them by the Britishadministration.This paper is related to several strands of the economic literature. First of all, it isvery close in spirit to the growing literature studying the role of the British institutionsin India in several colonial and contemporary outcomes ( Iyer [forthcoming], Banerjeeand Iyer [2005], Banerjee and Somanathan [2007], Chaudhary [2009]), and thus, moregenerally, to the literature focusing on the understanding of the role of institutions in de-velopment (Acemoglu et al. [2001], Engerman and Sokoloff [1997]). Then, it is also linkedto the study of ethnicity which has now become a very large strand of the mainstreamdevelopment economic literature. Indeed, ethnic fractionalization has been associatedwith lower provision of public goods (Alesina et al. [1999], Miguel and Gugerty [2005]) ,lower growth (Acemoglu et al. [2001], Alesina and La Ferrara [2005]) or lower quality ofgovernment (La Porta et al. [1999], Easterly and Levine [1997]). For India, more thanethnic identity, it is caste that has been at the center of attention with studies such asBanerjee and Somanathan [2007], Banerjee et al. [2005] or Chaudhary [2006]. Thosestudies, in line with the research on ethnic fractionalization, typically find that castefractionalization leads to lower public good access, both in colonial times and in morerecent periods.However, what is missing in this type of studies is to allow for the possibility of ethnic orcaste identification to be endogenous: all those study rely on cross section data and thushave to make the hypothesis that the caste/ethnic groups are exogenous to the outcomemeasured 2, while it has been widely acknowledged in social sciences that ethnic iden-tity might not be as fixed as it is often assumed3 and might thus respond endogenouslyto institutional or economic incentives, and thus leading to spurious results. However,documenting this aspect has proven tricky, as it requires to follow ethnic groups throughtime in order to ascertain their evolution. For ethnic groups, the study of Michalopoulos[2008] demonstrates the link between ethnic group formation and very long term geo-
1The tendency of caste associations to manipulate their caste names in colonial times has been widelystudied by social scientists, and is presented in more details in the body of this paper.
2Most of those study use data collected often decades before their measured outcome, and thus arguethat their exogeneity hypothesis is not too strong.
3The so called ”constructivist” approach underlines that ethnic composition of a region as well asindividuals or groups ethnic identities might evolve in response to the context (see Posner [forthcoming]for a review)
2

graphic and meteorological determinants. In the Indian context, the only attempt tounderstand the evolution of the number of caste groups I am aware of is the one by Banand Rao [2007], which points to a causal impact of the post independence land policyon the number of caste groups.To my knowledge, this paper is the first one to empirically raise the question of anddemonstrate the link between colonial institutions and more traditional institutions,such as ethnicity or the caste system4. It thus poses a bridge between the two differentstrands of literature discussed above, and points to the need of addressing the issue ofthe role of the interaction of the two in the development of a country. Moreover, thispaper is also the first one to try to address the question of group identity manipulationusing panel data, hence allowing more convincing econometric techniques to be used.Indeed, being able to follow caste groups populations at the district level both beforeand after 1901, I can evaluate precisely the impact of the Punjab Alienation of LandAct on the trend of the population of the caste groups affected by the law.The first part of the paper presents the law and gives some historical perspective, thesecond part describes the data being used, the third part is dedicated to the differentempirical strategies and robustness checks while the last part rules out other potentialinterpretations of the results found.
1 Historical background
1.1 The Punjab Alienation of Land Act
By the end of the 19th century, the debt of the peasantry had become a concern forthe British authorities : ”One of the most significant domestic problem confronting theIndian government [...] was the growing indebtness of the cultivating classes and aconcomitant transfer of landed property [...] to urban moneylenders.” Barrier [1966].This concern was of particular importance in the Province of Punjab, since the Indianarmy was largely recruiting in the Province. Hence, avoiding rural agitation there was aprime concern and ”...the driving force behind government attempts to find solution todebt and land transfer was fear for its own position [...].” [Barrier, 1966]. The act, whichwas put in application in June 1901 creates an ”agricultural tribe”5 category for whichthe selling or buying or land was restricted : a member of an agricultural tribe couldsell his land only to an other member of an agricultural tribe (see Annex 1 for the textof the Act). Since most of the land was held by members of the ”agricultural tribes”,this resulted in an almost complete exclusion of non agricultural tribe members from theland market, as underlined by Barrier [1966] : ”Sales to non agriculturists ceased after
4Of course, this question has already been studied in other social sciences, see for example Posner[2005] for Africa or Bayly [1999] and Dirks [2001] for India.
5In colonial writings, the distinction between a ”tribe” and a ”caste” if very unclear, as underlinedin Kaul [1912]”...in vulgar parlance, the terms Caste and Tribe are used as synonyms”. Throughout thispaper, I will thus write caste or tribe indifferently.
3

1901.” 6. Thus, the Act was really enforced, and was a real constraint for Punjabese.This act was then reinforced by the Punjab Pre Emption acts of 1905 and 1913 whograve pre emption rights on land sales to members of agricultural tribes. In a Provincein which the population lived in rural areas in its vast majority, being considered as amember of agricultural tribes became critical after the enacting of the act.
1.2 Its impact on the caste system
Indeed from 1901 on, the various Census reports underline a tendency from caste as-sociations to make claims towards the British administration in order to be consideredas agricultural : as can be read in the Report on the Census of Punjab, 1911 : ”Theintroduction of the Punjab Alienation of Land Act [...]has naturally stimulated [...] atendency to claim an affinity with one or the other of the castes declared by Governmentas agricultural” Kaul [1912] 7. Indeed, it has been widely documented (from Ghurye[1932] and Srinivas [1966] to Dirks [2001] and Bayly [1999]) that far from being fixed,the caste system, especially under the British rule, was evolving under the action of thecaste associations (or caste ”sabhas”) which were formed in order to press for ”supportsocial advancement” Assayag [1995] and to gain access to the economic opportunitiescreated by the British presence 8 (see Annex 2 for more details on the tendency by theBritish rulers to create a caste directed legislation and hence, caste specific economicopportunities). Hence, the Punjab Alienation of Land Act created a tendency for castegroups to try to be recorded by the British administration as members of agriculturaltribes, in order to be able to enter the land market.
2 Data
2.1 Caste Census Data
To estimate the impact of the Punjab Alienation of Land Act on the evolution of thecaste system, I have collected caste census data from 1881 to 1921. Indeed, from 1871 to1931, every decennial Census collected caste data, which was then tabulated at the dis-trict level. It has been widely documented that the Census was part of the mobilizationstrategies from caste associations, who were very often claiming for new caste names,making the following of each single caste very difficult across time, as both classificationsand names might change across time. However, the Punjab Census data is of very goodquality from 1881 to 1921: using the different Census reports and the Glossary of theTribes and Castes of the Punjab and North-West Frontier Province (Rose [1911]), I have
6Other references emphasize the impact of the law on the non agricultural castes, such as :”by meansof this act moneylenders were practically wiped out of the land market” Hirashima [1978]
7 This claims persisted through time and can also be found in the Report on the Census of Punjab,1931: ”...on the present occasion more than ever before a tendency was noticeable in various localities,[...]to return a higher caste. One of the main reasons was a desire to be included in one of the agriculturaltribes [...] to secure exemption from the provisions of the Punjab Alienation of Land Act.” Khan [1933]
8”the associations began to press for places in the new administrative and educational institutions andfor political representation” Rudolph and Rudolph [1960]
4

Table 1: Descriptive Statistics : districts and states of Punjab, 1901.
British Districts Princely StatesMean Population (std deviation) 1397666 (1133804) 207298 (357096)
Mean Population/km2 (std deviation) 303.7 (177) 194.5 (126.6)Mean Urban Population (std deviation) 10.9% (0.04) 9.9%(0.07)
Number of Districts/States 11 21
been able to track all caste groups, taking into account the hundreds of changes in clas-sification and names9 and thus building what I believe is the first dataset following castegroups demography over time at such a fine level10. However, the various modificationsof district borders and the partition of the North West Frontier Province from Punjabin 1901 as well as the creation of the Delhi Province in 1911 have led me to leave asidesome districts while merging some others, in order to assure their comparability overtime (see Figure 1).
Overall, I am able to follow 76 caste groups, 15 of which are agricultural11, whichrepresent from 97% to 99% of the population of the 34 districts and states I am trackingover time, which themselves contain 80% of the population of the Province of Punjab. Ihave thus built a district level panel of caste composition allowing to study through timeat a very fine geographical level the response of caste groups to the Punjab Alienationof Land Act.
2.2 Descriptive Statistics
The whole Province of Punjab had a 24.4 million population in 1901, for an area of 354634 square kilometers. It corresponds to the contemporary States of Punjab (Pakistan),Punjab (India), Himachal Pradesh (India) and Hariana (India). As for the rest of India,it was not entirely administered by the British, since some area, the Princely States,were under the rule of local Princes, and as such, were not subject to British law (seeIyer [forthcoming] for more details, and Figure 2 for their localization), the population ofthe Princely states was 4.4 millions, thus leaving 19.9 million under direct British rule.
The Province of Punjab was essentially rural, with 89% of the population living ina rural area12, hence most of its population is directly concerned by the act, while the
9The reason why I do not use the 1871 and 1931 Census is that they do not report Castes group atsuch a fine level as the other years, thus not allowing me to track all Castes for those years. Also, it hasoften been reported that Caste Census data is flawed due to people reporting their occupation or theirregion instead of their castes, but the Glossary and the Census reports do list those occupational andregional names, that I was thus able to identify and remove, and which account for a negligible part ofthe total population.
10Both geographically fine, at the district level, and fine at the caste level, since I follow caste groups,and not only ”scheduled castes” and ”scheduled tribes” as is usually the case in most datasets.
11More castes and tribes were actually considered as agricultural, but in order to be able to trackthem over time, I had to merge them either with other agricultural castes, or with non agricultural ones(which bias the results downward).
12The Urban population is defined as ”(1) Every municipality of whatever size.(2) All civil lines notincluded within municipal limits.(3) Every cantonment.(4) Every other continuous collection of houses,
5
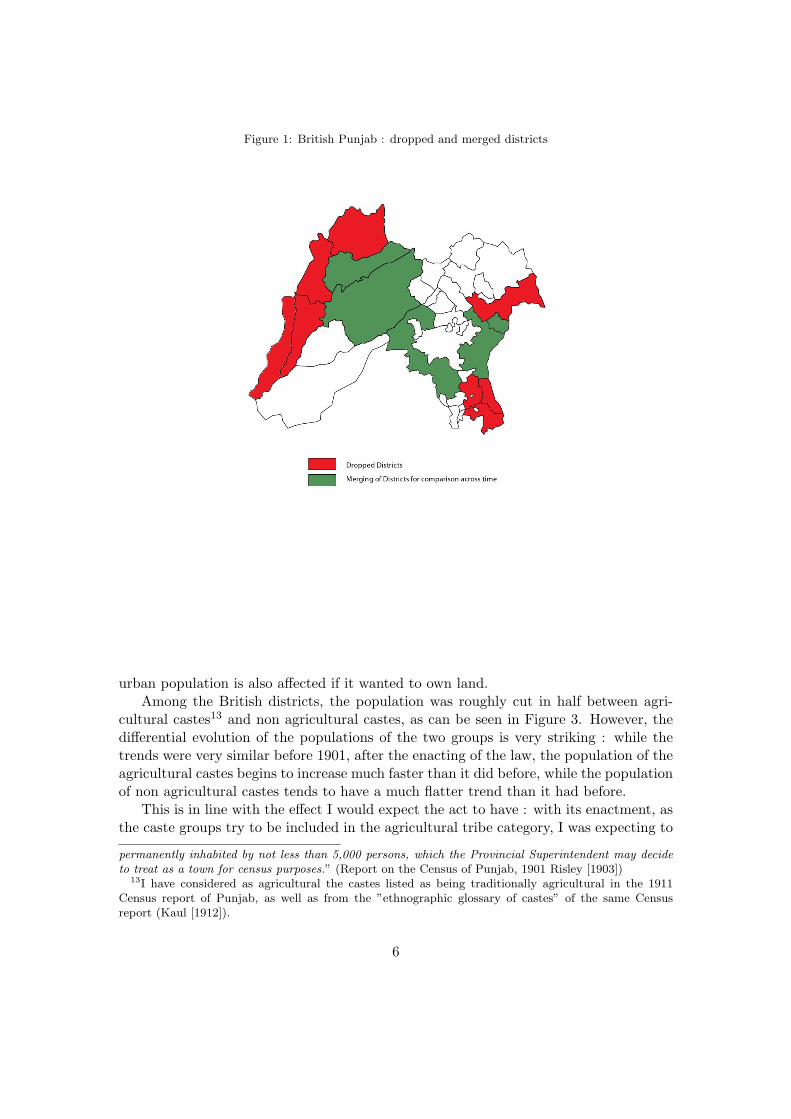
Figure 1: British Punjab : dropped and merged districts
urban population is also affected if it wanted to own land.Among the British districts, the population was roughly cut in half between agri-
cultural castes13 and non agricultural castes, as can be seen in Figure 3. However, thedifferential evolution of the populations of the two groups is very striking : while thetrends were very similar before 1901, after the enacting of the law, the population of theagricultural castes begins to increase much faster than it did before, while the populationof non agricultural castes tends to have a much flatter trend than it had before.
This is in line with the effect I would expect the act to have : with its enactment, asthe caste groups try to be included in the agricultural tribe category, I was expecting to
permanently inhabited by not less than 5,000 persons, which the Provincial Superintendent may decideto treat as a town for census purposes.” (Report on the Census of Punjab, 1901 Risley [1903])
13I have considered as agricultural the castes listed as being traditionally agricultural in the 1911Census report of Punjab, as well as from the ”ethnographic glossary of castes” of the same Censusreport (Kaul [1912]).
6
Figure 2: British Punjab : Princely States and British Districts
British Districts
Princely States
Figure 3: Evolution of the populations of agricultural versus non agricultural tribes in British districtsof Punjab. 1881-1921.
0
1000000
2000000
3000000
4000000
5000000
6000000
7000000
8000000
9000000
1881 1891 1901 1911 192145,00%
47,00%
49,00%
51,00%
53,00%
55,00%
57,00%
59,00%
61,00%
63,00%
Non agricultural castes Agricultural castes Share of agricultural castes
7

see a rise in the population trend of agricultural tribes and a decline in the populationtrend of non agricultural tribes, as the non agricultural tribes manage to enter theagricultural castes.
3 Empirical Approach
3.1 First identification strategy : non agricultural castes as a controlgroup
The fact that only certain castes were considered as ”agricultural” by the act does notallow us to use a simple double difference strategy. Indeed, as ”agricultural tribes”were not randomly selected, they are likely to exhibit systematic differences from nonagricultural ones. To account for this, I will turn to a triple difference strategy, comparingthe variations in the caste populations of those two groups before and after the law. Inthis case, the identification relies on the much weaker hypothesis that the differencesin the variation of the population of agricultural castes versus non agricultural tribesbefore and after 1901 would have remained stable in the absence of the law, and notthat their variations themselves were similar. Hence, I will run regressions of the form :
lvtitd = constant+ βagri + γpostt + δagri ∗ postt + ηXdt + εit (1)
With lvtitd the percentage variation (approximated by the difference in log) of thepopulation of caste i in district d (if the regression is at the district level) during each ofthe periods t (1881-1901 and 1901-1921), agri a dummy indicating whether caste i is anagricultural tribe, postt a dummy taking a value of 1 when the period is in the 1901-1921interval and 0 in the 1881-1901 interval, and Xdt a set of District dummies, and districtdummies interacted with the postt dummy, to control for any possible district specificchange in trend 14 (if the regression is at the district level).
I use two main specifications of this regression. In specification 1, I regress thevariation in caste population at the British Punjab level, while in specification 2 and3, I regress the variation in caste population at each British district level, which allowsme to control in specification 3 for any district specific change in trend that might havebeen driving the results (for example, a district with a higher than average share ofagricultural tribes that would have been less exposed to some negative demographicshock).
As can be seen in Table 2 the very precisely estimated coefficient on the interactionbetween agr and post (apart from the first specification in which the lack of observationleads to large standard error) is bigger than the coefficient on agr and remains of com-parable range across specifications: the effect that we were anticipating is thus present,as after the law passes, the difference in the trends between agricultural tribes and nonagricultural tribes decreases. Indeed, this points to a clear tendency for caste identity
14Adding an interaction between post and district dummies, makes the coefficients on post non com-parable across specifications, as this interaction results in a decomposition of the post coefficient acrossdistricts. The coefficients on agr and post*agr remain comparable, however.
8

Table 2: Within British Punjab impact of the Act. Dependent variable : difference in log-populations.
State level District level(1) (2) (3)
post -0.351*** -0.466*** -0.238***(0.100) (0.0643) (0.0854)
agr 0.00759 -0.0602 -0.0610(0.0585) (0.0649) (0.0636)
post*agr 0.273*** 0.306*** 0.308***(0.0870) (0.0827) (0.0826)
Constant 0.193** 0.237*** 0.0755(0.0771) (0.0324) (0.0482)
District Dummies NO NO YESpost*District Dummies NO NO YESObservations 158 1172 1172
R2 0.116 0.090 0.116Robust standard errors in parentheses
*** p<0.01, ** p<0.05, * p<0.1
manipulation in response to the enacting of the law, with the average agricultural castehaving a growth rate from 27 to 30 percentage points bigger than the one of the averagenon agricultural caste after 1901, while their growth rate were not statistically differentbefore 1901. As can be seen in specification 3, this effect is not driven by an outlierdistrict, as the results remain robust to including an interaction term of post with dis-trict dummies, controlling for any district specific change in demography. However, thenegative coefficient on the post dummy underlines the fact that after 1901, the averagenon agricultural caste tended to see its population increase on average less, leading us tosuspect the existence of some demographic shocks that would affect Punjab after 1901.
3.2 Second Identification Strategy: Princely States as a control group
3.2.1 Full Sample
Hence, one might argue that the results obtained with the first identification strategy arenot the results of the Punjab Alienation of Land Act, but solely that those demographicshocks affect more non agricultural tribes than agricultural ones : for example, it couldwell be that the non agricultural castes members tend to live in more urban area, inwhich the diseases might tend to spread faster. And as a matter of fact, the 1901-1921period faced various episodes of epidemic, with plague, malaria and influenza killingmillions, as can be seen in Figure 4.
To account for this, I use an other identification strategy: in line with the work ofIyer [forthcoming], I use the fact that all of India was not under direct British rule.Indeed, the Princely States were under the rule of local Princes, and as such, werenot subject to the British legislation, and in particular, to the Alienation of Land Act.Arguably, the States of Punjab faced the same epidemic as the British districts, due totheir close proximity (as can be seen in Map 2), but were not concerned by the PunjabAlienation of Land Act, thus providing a counterfactual that allows me to control for thedemographic shocks of the period: the castes located in the Princely States of Punjabare indeed similar to the castes of the British districts, are subject to the same epidemic,
9

Figure 4: Main Demographic Shocks affecting the Punjab
1881 1891 1901 1911 1921
1896 1911
Plague Epidemic : 2.5 Million Deaths between 1901 & 1911
Alienation of Land Act
Malaria Epidemic : 4.5 Million Deaths between 1901 & 1911
1918 :Influenza Epidemic
1914 1918
WWI :12 000 Deaths
1892 :Fundation of the Chenab Colony
but are not concerned by the agricultural/non agricultural castes categories created bythe law. Hence, if the variation in caste groups populations observed in British Punjabwere to be attributed to the Alienation of Land Act, we would expect the Princely Statescaste groups not to exhibit any specific change around 1901 as was the case in BritishPunjab. Indeed, we can see in Figure 5 that the populations of both agricultural andnon agricultural tribes exhibit relatively similar trends up to 1911. As a matter of fact,they actually exhibit very similar trends up to 1921 if the State of Bahalwalpur was nottaken into account15, as can be checked in the same Figure.
I will thus estimate regressions of the form :
lvtitd = constant+βagri+γpostt+δagri∗postt+ρbrd+πagri∗postt∗brd+ηXdt+εitd (2)
With the same notation as in Model 1 and brd a dummy indicating whether district d isa British district or a Princely State, with alternatively the interaction of brd and posttreplacing the interaction of district dummies and postt, to control either for a Britishdistricts specific shock (ie. the demographic shocks affected asymmetrically British dis-tricts and Princely States, which might for example be due to the fact that Britishdistrict were more densely populated as seen in Table ??) or for district specific shocks,when the regressions are at the district level. These sets of dummies allow me to controlfor the fact that the epidemics might not affect all districts in the same manner, as wellas for any district specific change in trend that might drive the result, as in the firstidentification strategy.
The observed upward trend in the population of the agricultural tribes after 1911 isnot a major issue to my identification strategy, as it pushes the coefficient downwardsand thus drives the result in the opposite direction of the expected impact of the Act.
15See Annex 3 for the evolution of the agricultural and non agricultural castes of this State)
10

Figure 5: Evolution of the populations of agricultural versus non agricultural tribes in the PrincelyStates of Punjab. 1881-1921.
0
500000
1000000
1500000
2000000
2500000
1881 1891 1901 1911 192145,00%
47,00%
49,00%
51,00%
53,00%
55,00%
57,00%
59,00%
61,00%
63,00%
Non agricultural castes Agricultural Castes Share of agricultural castes
As a matter of fact, this identification strategy tends to bias the coefficient downwardsfor two reasons. First, it relies on the assumption that the law was not passed in all thePrincely States, which might not have been the case, as any of those States was free topass any law of its choice, and might have chosen to implement this law. Second, it alsoassumes that even if not passed in the State, the law had no impact in the State, whichis far from being obvious: it is quite clear that any person living in a Princely State butnear a border with a British district would be affected by the law if it were to try tobuy some land just on the other side of the border, and would thus face very similarincentives to a British district inhabitant.We can see in Table 3 that the coefficients on the interaction of post, british and agris significant in all the specifications but two and negative in all, while the interactionbetween post and agr is not significant in all specifications, and has a negative signin a majority of them. Hence, it appears that the tendency for agricultural tribes togrow relatively faster than the non agricultural tribes after 1901 than before is onlyspecific to British districts (as indicated by the coefficient on br*agr, before 1901, theyeven tended to grow relatively slower in the British districts before 1901), the districtswere the law was passed. This confirms the fact that the results obtained in our firstidentification strategy were not driven by asymmetric demographic shocks but by theimpact of the law itself. Even more so, the estimated impact of the Act with thisidentification strategy is roughly consistent with the results obtained in the first one,with the average agricultural caste exhibiting an increase in its relative trend rangingfrom 16 (specification 2) to around 50 percentage points (specification 4 and 5), in Britishdistricts only.
11

Table 3: British districts vs Princely States. Dependent variable : difference in log-populations.
State level District level(1) (2) (3) (4) (5)
post -0.248** -0.136 -0.339*** -0.212*** -0.238**(0.106) (0.167) (0.0453) (0.0425) (0.0857)
agr 0.102 0.170* 0.0661 0.114*** 0.107**(0.0839) (0.0892) (0.0401) (0.0418) (0.0425)
post*agr 0.104 -0.00823 0.0691 -0.0574 -0.0563(0.115) (0.173) (0.0702) (0.0683) (0.0702)
br*agr -0.0312 -0.162* -0.0783 -0.174** -0.168**(0.0644) (0.0844) (0.0661) (0.0761) (0.0740)
post*br*agr 0.0661 0.281 0.110 0.363*** 0.364***(0.0618) (0.176) (0.0791) (0.102) (0.103)
br 0.131** 0.0955**(0.0651) (0.0386)
post*br -0.215 -0.254***(0.171) (0.0646)
Constant 0.131* 0.0622 0.189*** 0.141*** 0.0755(0.0691) (0.0761) (0.0212) (0.0241) (0.0484)
District Dummies NO NO NO NO YESpost*District Dummies NO NO NO NO YESObservations 304 304 2382 2382 2382
R2 0.045 0.052 0.066 0.074 0.118Robust standard errors in parentheses
*** p<0.01, ** p<0.05, * p<0.1
3.2.2 Neighboring districts and states
However, the negative and significant coefficient on the interaction of British and postin Table 3 suggests that the British districts have been more affected than the PrincelyStates by the epidemics of the period. One could thus argue that the results obtainedin this specification are solely due to the fact that the non agricultural castes are moreaffected by the epidemics in the British districts than in the Princely States. As theepidemics are likely to affect more similarly neighboring districts than distant ones, amanner to control for this possibility, inspired by Banerjee and Iyer [2005], would be torestrict the sample to the British districts and Princely States neighbors to each other16.Indeed, due to geographical nature of the spread of an epidemic, neighboring districts andstates are likely to be affected by the same diseases at the same time and with the samevirulence, hence controlling for the possibility that the results obtained in the formerspecifications were driven by the comparison of heavily affected British districts withnon affected Princely States (or the contrary), or for any other geographically linkedshock affecting the Province of Punjab around 1901. The results obtained with thisspecification are to be read in Table 4. Overall, the qualitative results are not affectedby restricting the sample to this neighbors, while of comparable range. However, thenegative and significant coefficient on the interaction between post and british seems toshow that even in this restricted sample of neighboring districts, the British districtsare more heavily impacted by the epidemics, this being certainly due to the fact thatthey are much more dense than their Princely neighbors (as seen in Table ??, thus
16As the british*post treatment is discrete, I do not have to use the matching technique used byHuillery [2009].
12

Table 4: British districts vs Princely States. Dependent variable: difference in log-populations.
State level District level(1) (2) (3) (4) (5)
post -0.243*** -0.151 -0.326*** -0.142** -0.241***(0.0840) (0.146) (0.0533) (0.0614) (0.0849)
agr 0.179** 0.189* 0.120** 0.162*** 0.147**(0.0763) (0.0984) (0.0558) (0.0603) (0.0602)
post*agr 0.0544 -0.0376 0.0516 -0.133 -0.131(0.106) (0.159) (0.0893) (0.0942) (0.0945)
br*agr -0.0863 -0.105 -0.181** -0.253*** -0.239***(0.0719) (0.121) (0.0752) (0.0899) (0.0887)
post*br*agr 0.0553 0.233 0.135 0.449*** 0.447***(0.0727) (0.173) (0.0857) (0.110) (0.110)
br 0.0190 0.0725(0.0792) (0.0491)
post*br -0.178 -0.314***(0.152) (0.0687)
Constant 0.0855** 0.0757 0.186*** 0.143*** 0.0831*(0.0415) (0.0741) (0.0232) (0.0317) (0.0480)
District Dummies NO NO NO NO YESpost*District Dummies NO NO NO NO YESObservations 302 302 1626 1626 1626
R2 0.061 0.069 0.060 0.074 0.110Robust standard errors in parentheses
*** p<0.01, ** p<0.05, * p<0.1
facilitating contamination. Still, the sample of neighboring Princely States constitutesa counterfactual for the impact of the disease on the population of agricultural castesin the absence of the Punjab Alienation of Land Act, and we can see that both in thefull sample (Table 3) and in the restricted sample (Table 4) the coefficient on agr ispositive and significant in most of the specifications, while the interaction of post andagr is close in absolute term to zero, and non significantly different from it, thus pointingto the fact that the epidemics seem to have affected more the agricultural castes thanthe non agricultural ones, as they were growing faster before the peak of the epidemics,and at roughly the same rate during the epidemic episodes. Hence, it seems that theasymmetric impact of the epidemics on the agricultural versus non agricultural castes,if any, goes in a direction biasing my estimates downward17.
4 Ruling out alternative interpretations
However, it is unclear how the impact of the law should be interpreted: while theanecdotical evidence taken from the Census reports points to caste identity manipulation,we can not yet rule out other interpretations.
4.1 Change in the caste composition of migration
First, it could well be that the results are entirely driven by migration: after the lawpasses, members of the castes that would be considered as agricultural in the British
17Annex 4 proposes two others robustness checks ruling out the demographic shocks’ impact hypoth-esis.
13

Figure 6: Evolution of the share of persons born outside a British District of Punjab in the BritishDistricts of Punjab. 1881-1921.
4,00%
4,20%
4,40%
4,60%
4,80%
5,00%
5,20%
5,40%
5,60%
5,80%
6,00%
1881 1891 1901 1911 1921
Share of persons borned outside of British Punjab
districts of Punjab face an incentive to migrate from their place of origin (outside ofPunjab or a Princely State of Punjab) to a British district of Punjab in order to benefitfrom the status that the law gives to them. In order to rule out this interpretation, Iuse the birth place statistics of the Census18 summarized in Figure 6.
We can see that with being around 5%, migration is fairly small, and seems to bedecreasing after 1901. However, what can not be seen (as the birth place data is notdetailed at the caste level) is whether the composition of migration has changed after1901 towards more arrivals of members of agricultural tribes. Hence, I am going to bevery conservative, and assume that all the persons born outside a British district ofPunjab and enumerated after 1901 are actually members of such castes. To check ifmigration is indeed driving the results, I then recompute the variations of population ofeach caste group, but this time subtracting the population of migrants (ie. numbers ofmigrants recorded in 1921) from the population of agricultural tribes, assuming that themigrants are distributed across the different agricultural castes proportionally to theirrespective sizes19. This very conservative method artificially creates measurement error,as it considers all migrants as being agricultural caste members, which is of course a veryunrealistic assumption, and also because, due to data limitation, I don’t have access toproper migration data, but only to the birthplace of the inhabitants, meaning that Iwill consider as having migrated after 1901 any person recorded in 1921 as being bornoutside a British District of Punjab, and thus will treat any person having migrated
18I thank Dave Donaldson for having given me access to this data.19ie. I substract x% of the population of a district’s migrants from the population of an agricultural
caste representing x% of the district’s agricultural tribes population.
14

Table 5: Migration robustness check : within British Punjab. Dependent variable : difference in log-populations.
State level District level(1) (2) (3)
post -0.351*** -0.466*** -0.225***(0.100) (0.0643) (0.0850)
agr 0.00759 -0.0602 -0.0610(0.0585) (0.0649) (0.0636)
post*agr 0.166* 0.194** 0.196**(0.0870) (0.0829) (0.0827)
Constant 0.193** 0.237*** 0.0755(0.0771) (0.0324) (0.0482)
District Dummies NO NO YESpost*District Dummies NO NO YESObservations 158 1172 1172
R2 0.114 0.093 0.116Robust standard errors in parentheses
*** p<0.01, ** p<0.05, * p<0.1
before 1901 and still present in 1921 as having migrated after 1901. This second pointnot only creates measurement error, but also bias the coefficient downwards, as thesame person will be recorded first before 1901 in the caste it belongs to (which mightnot be agricultural) and will then be subtracted from an agricultural caste populationin 1921, thus artificially decreasing the variation in the difference between the trendsof agricultural versus non agricultural tribes before and after 1901. Reconducting thesame identification strategies as earlier on (described in Models 1 and 2), but this timeremoving any influence that migration might have had, I am now able to see if the resultsobtained were or not only driven by migration.
As can be seen in Tables 5 and 6, despite the very conservative character of themethod used and the measurement error it creates, the coefficient of interest agr, post*agr,british*agr and post*british*agr are still of the expected sign in all but one specifica-tion, and still relatively precisely estimated in the majority of the specifications (thecoefficients are of course, by construction, smaller than their counterpart in the formerspecifications), thus clearly ruling out the hypothesis that migration was driving theevolution of the population of the agricultural tribes after 1901.
4.2 Better economic conditions for agricultural castes due to the Act
Another potentially very relevant interpretation of the results would be to say that thefact that the agricultural castes grow faster than they used to after the law is enactedjust shows that the law has attained its objective of giving better economic conditionsto the agricultural castes. Indeed, one might reasonably argue that with the law, theincrease in their population just reflects the fact that they entered the demographictransition before the other castes, thanks to the law itself, and the effect that I amidentifying is just the success of the law. It is indeed clear that this is likely to be part ofthe story, but how far can it drive the whole evolution of agricultural castes’ populationis a question which remained to be answered. Thus, I will show in this section that
15

Table 6: Migration robustness check : British Punjab vs Princely States. Dependent variable : differencein log-populations.
State level District level(1) (2) (3) (4) (5)
post -0.248** -0.136 -0.339*** -0.212*** -0.225**(0.106) (0.167) (0.0453) (0.0425) (0.0854)
agr 0.102 0.170* 0.0661 0.114*** 0.107**(0.0839) (0.0892) (0.0401) (0.0418) (0.0425)
post*agr 0.104 -0.00823 0.0691 -0.0574 -0.0563(0.115) (0.173) (0.0702) (0.0683) (0.0702)
br*agr -0.0312 -0.162* -0.0783 -0.174** -0.168**(0.0644) (0.0844) (0.0661) (0.0761) (0.0740)
post*br*agr -0.0404 0.174 -0.00224 0.251** 0.253**(0.0618) (0.176) (0.0796) (0.102) (0.103)
br 0.131** 0.0955**(0.0651) (0.0386)
post*br -0.215 -0.254***(0.171) (0.0646)
Constant 0.131* 0.0622 0.189*** 0.141*** 0.0755(0.0691) (0.0761) (0.0212) (0.0241) (0.0484)
District Dummies NO NO NO NO YESpost*District Dummies NO NO NO NO YESObservations 304 304 2382 2382 2382
R2 0.044 0.051 0.068 0.076 0.119Robust standard errors in parentheses
*** p<0.01, ** p<0.05, * p<0.1
the demographic transition argument can not realistically explain the evolution of thosecastes’ population.In order to deal with this concern, I will need to resort to demographic arguments. Ashas already been discussed, the 1901-1921 period is full of demographic shocks. Myargument will thus be very simple, and can be summarized as such: in the absence ofthose shocks and in the absence of any caste identity manipulation, are the growth raterequired for the agricultural castes’ population to reach their 1921 share in the Britishdistricts’ population realistic ? In order to answer this question, I will first nullify theimpact of those shocks by constructing a counterfactual Punjab in which those shockshave not happened. To do so, I will assume that the non agricultural castes of the Britishdistricts of Punjab would have kept their 1881-1901 growth rate if the epidemics had nottake place. Then, I can build the counterfactual population of the agricultural castes inthis epidemic-free Punjab: using the shares of the agricultural castes in 1921, I computethe population of agricultural castes corresponding to this share. Table 7 describes thecalculation made, and tells us that in order to have the share they had in 1921 in theabsence of any epidemics, the agricultural castes would have needed to jump from agrowth rate of 16.9% between 1881 and 1901 to a growth rate of 38.1% between 1901and 1921. In order to understand whether this massive change in the growth rate is ornot unrealistic, we need to deepen this analysis, by trying to see what it means in termsof change of death rate. Indeed, I know from the Punjab Census reports of 1891 and 1901(Rose [1901], Maclagan [1892]) that the average annual death rate in Punjab was 31 permille between 1881 and 1891 and around 32 per mille between 1891 and 1901. Hence,assuming that all caste groups were on average facing the same death rate during the
16

Table 7: Construction of the ”epidemics-free” counterfactual 1921 Punjab
population in 1881 population in 1901 1881-1901 growth rateAgr. Castes 5,893,071 6,884,153 16.9%Non Agr. Castes 6,912,727 8,354,610 20.1%
1921population population share counterfactual population Counterfactual growth rate
Agr. Castes 7,636,080 48.5% 9,511,261 38.1%Non Agr. Castes 8,106,536 51.5% 10,097,246 20.1%
Table 8: Construction of the ”epidemics-free” death rate for Agricultural castes.
1881-1901annual death rate annual rate of natural increase corresponding annual birth rate
3.1% 0.8% 3.9%1901-1921
corresponding annual death rate counterfactual annual rate of natural increase reporting annual birth rate2.3% 1.6% 3.9%
whole of the 1881-1901 period, I can compute the annual birth rate for the agriculturalcastes 20 at that time. Hence, as the demographic transition consists generally in havinga population’s death rate declining decades before the population’s birth rates21, I willtake as given that the agricultural castes’ birth rate remains unaffected by the law.Therefore, with a given birth rate, the only factor remaining to explain the massivegrowth rate change around 1901 would be a decrease in the death rates. Table 8 detailsthe calculation of the annual death rate needed to jump from a 0.8% to a 1.6% rateof natural. It can be seen that it requires a drop in annual death rate from 3.1% to2.3%. To understand what such a change would mean, one has to turn to the variationof England’s death rate (found in Galor [2005]), which, from 3% in 1750 did not reach2% until 1800, in a country which was facing massive structural change due to the firstIndustrial Revolution. Therefore, in a Punjab whose structures are not deeply changingat the turn of the XXth century, such a massive decline in death rate appears more thanunrealistic. As a result, the only remaining explanation for such an evolution is that nonagricultural castes members were able to manipulate their caste identity in order to berecorded as agricultural castes members.
5 Conclusion
This paper shows, using different identification strategies, that the enacting of the Pun-jab Alienation of Land Act in 1901, by creating an ”agricultural tribes” category withalmost exclusive access to the land market (a huge economic advantage in a Province
20From Table 7’s growth rates, I can compute the annual rate of natural increase, and deduct theannual birth rate from the sum of the annual death rate and rate of natural increase ,as detailed in Table8.
21According to Galor [2005], the decline in death rates preceded the decline in fertility rates by 140years in England, and by 100 years in Sweden and Finland.
17

of Punjab whose population was still rural at almost 90% in 1921) has deeply affectedthe caste system. Indeed, caste groups were given a very strong incentive to manipulatetheir caste identity in order to benefit from the Act, and from 1901 on, the trend ofthe population of agricultural castes as measured by the Census exhibited an increasevarying between 16 and 50 percentage points depending on the specifications, as com-pared to the trend of the population of non agricultural castes, this effect only takingplace in the British district of Punjab and not in the Princely States, not concerned bythe law. Moreover, I show that neither migration nor demography can alone explain thevariation in population, underlining that the results are mainly driven by the ability ofcaste groups to manipulate their identity in response to administrative incentives.This paper is thus, to my knowledge, the first to convincingly document the permeabilityof caste groups and the ability of castes and caste associations to react and adapt theircaste identity in the relatively short term to their environment. Moreover, it clearlypoints to the role played by the British administration in the evolution of the castesystem. Hence, it urges towards a deepening of the analysis of the different long termmechanisms of development being analyzed by economists by focusing in their interac-tion, to allow for a country specific-or even Province specific, as is the case here- analysisof the institutions and of their potential long term impact.
18

References
Daron Acemoglu, Simon Johnson, and James Robinson. The colonial origins of compar-ative development: an empirical investigation. The American Economic Review, 91(5):1369–1401, 2001.
Alberto Alesina and Eliana La Ferrara. Ethnic diversity and economic performance.Journal of Economic Literature, 43:762–800, 2005.
Alberto Alesina, Reza Baqir, and William Easterly. Public goods and ethnic divisions.The Quaterly journal of economics, 114(4):1243–84, November 1999.
Jackie Assayag. the making of democratic inequality. caste, class, lobbies and politics incontemporary india (1880-1995). Pondy Papers in Social Sciences, 1995.
Radu Ban and Vijayendra Rao. The political construction of caste in south india. workingpaper, 2007.
Abhijit Banerjee and Lakshmi Iyer. History, institutions and economic performance: thelegacy of colonial land tenure systems in india. American Economic Review, 95(4):1190–1213, 2005.
Abhijit Banerjee and Rohini Somanathan. The political economy of public goods: someevidence from india. Journal of development economics, 82(2):287–314, 2007.
Abhijit Banerjee, Rohini Somanathan, and Lakshmi Iyer. History, social divisions, andpublic goods in rural india. Journal of the European Economic Association, 3(2-3):639–647, 2005.
Norman G Barrier. The Punjab Alienation of Land Bill of 1900. Duke University, 1966.
Susan Bayly. Caste, society and politics in India. Cambridge University Press, 1999.
Latika Chaudhary. Social divisions and public goods provision: evidence from colonialindia. working paper, 69:269–302, 2006.
Latika Chaudhary. Determinants of primary schooling in british india. Journal of Eco-nomic history, 2009.
Nicholas B. Dirks. Castes of Mind. Colonialism and the making of Modern India. Prince-ton University Press, 2001.
William Easterly and Ross Levine. Africa’s growth tragedy: policies and ethnic divisions.The Quaterly journal of economics, 112(3), November 1997.
Stanley Engerman and Kenneth Sokoloff. How Latin America fell behind: Essays onthe economic histories of Brazil and Mexico, 1800-1914, chapter Factor endowments,institutions, and differential paths of growth maong new world economies: a viewfrom economic historans of the United States, pages 260–304. Stanford: StanfordUniversity Press, 1997.
19

Oded Galor. The demographic transition and the emergence of sustained economicgrowth. Journal of European Economic Association, 3(2-3):494–504, April-May 2005.
Govinda Ghurye. Caste and Race in India. London: Routledge and Kegan Paul, 1932.
Shigemochi Hirashima. The structure of disparity in developing agriculture: a case studyof the punjab pakistan. Institute of developing economies, 1978.
Elise Huillery. History matters: The long-term impact of colonial public investments infrench west africa. American Economic Journal: Applied Economics, 1(2):176–215,2009.
Lakshmi Iyer. Direct versus indirect colonial rule in india: Long-term consequences. TheReview of Economics and Statistics, forthcoming.
Pandit Harikishan Kaul. Report on the Census of Punjab 1911. 1912.
Khan Ahmad Hasan Khan. Report on the Census of Punjab 1931. 1933.
Rafael La Porta, Florencio Lopez de Silanes, Andrei Shleifer, and Robert Vishny. Thequality of government. Journal of Law, Economics and Organisation, 15(1), April1999.
E.D. Maclagan. Report on the Census of Punjab 1891. 1892.
Stelios Michalopoulos. The origins of ethnolinguistic diversity: Theory and evidence.working paper, 2008.
Edward Miguel and Mary Kay Gugerty. Ethnic diversity, social sanctions and publicgoods in kenya. Journal of Public Economics, 89(11-12):2325–2368, April 2005.
David Omissi. The sepoy and the raj: the indian army 1860-1948. Mac Millan, 1994.
Daniel Posner. Institutions and Ethnic politics in Africa. Cambridge University Press,2005.
Daniel Posner. The implications of constructivism for studying the relationship betweenethnic diversity and economic growth. In Ethnicity, politics and economics. Chandra,Kanchan (ed), forthcoming.
Herbert Risley. Report on the Census of India, 1901. 1903.
H Rose. Glossary of the Tribes and Castes of the Punjab and North West Frontier.University of California Press, 1911.
H.A. Rose. Report on the Census of Punjab 1901. 1901.
Lloyd I. Rudolph and Susanne Hoeber Rudolph. The political role of india’s casteassociations. Pacific Affairs, 33(1):5–22, 1960.
20

Edward Said. Orientalism. New York : Vintage Books, 1978.
Srinivas. Social Change in Modern India. University of California Press, 1966.
21
Annex 1 : the Punjab Alienation of Land Act
Extract of the Punjab Alienation of Land Act :Sanction of District Officer (Revenue) required to certain permanent alienations. Saveas hereinafter provided a person who desires to make a permanent alienation of his landshall be at liberty to make such alienation where: the alienor is not a member of anagricultural tribe; or the alienor is a member of an agricultural tribe and the alienee isa member of the same tribe or of a tribe in the same group.
Annex 2 : the British Raj and Caste legislation
The impact of the British colonization on the caste system has long been studied byhistorians and anthropologists. Dirks [2001], for example, argues that ”[...] caste isa modern phenomenon, that it is, specifically, the product of an historical encounterbetween India and Western colonial rule”. Indeed, the British rule was a period of deepchanges for the Indian society, in particular regarding caste. As finely underlined byBayly [1999], the British Raj has given Indians incentives to turn caste into the salientethnic identity it has now become: ”[...]from the early nineteenth century onwards,British rule significantly expanded and sharpened these norms and conventions, buildingmany manifestations of caste language and ideology into its structures of authoritativegovernment.” Indeed, not only did the Sepoy mutiny of 1857 lead to the replacement ofthe East India Company by the British Crown for the administration of British IndiaIyer [forthcoming], it also ” made it clear to the British that they knew fat too littleabout the colonized populations of India” Dirks [2001]. In a global context in which the”science of race” was widely recognized, caste became more and more at the center ofcolonial policies and data collection. From the 1880’s, caste became a central part of therecruiting policy into the army, in line with the ”martial race” theory : some castes and”races” were seen as being more martial, more ”warlike” and more disciplined than theothers, thus making better soldiers (Omissi [1994]). It was thus those castes and ”races”only that were allowed in the Indian army. Along the same lines, the Criminal TribesAct of 1871 put entire caste groups under the suspicion of being criminal. Indeed, inwhat has been described as the ”Orientalist” (Said [1978]) point of view, caste was todefine one’s characteristic, and to understand India was to understand caste, and thusto create caste directed legislation, of which the Punjab Alienation of Land Act is alsoa striking example.
Annex 3 : Bahawalpur Agricultural Tribes
As can be seen in Figure 8, the Bahawalpur state exhibits a very specific trend, withthe agricultural and non agricultural castes having a symmetric patterns which mighteither point to a large permeability between agricultural and non agricultural castes inthis state or to the fact that something is not properly done in the recording of castedata in this State.
22

Figure 7: Evolution of the populations of agricultural versus non agricultural tribes in Punjab’s PrincelyStates, Bahwalpur excepted. 1881-1921.
0
200000
400000
600000
800000
1000000
1200000
1400000
1600000
1800000
2000000
1881 1891 1901 1911 192145,00%
47,00%
49,00%
51,00%
53,00%
55,00%
57,00%
59,00%
61,00%
63,00%
Non agricultural castes Agricultural castes Share of agricultural castes
Figure 8: Evolution of the populations of agricultural versus non agricultural tribes in Bahwalpur.1881-1921.
0
100000
200000
300000
400000
500000
600000
1881 1891 1901 1911 192145,00%
47,00%
49,00%
51,00%
53,00%
55,00%
57,00%
59,00%
61,00%
63,00%
Non agricultural castes Agricultural castes Share of agricultural castes
Annex 4 : Diseases and First World War Robustness checks
In this annex, I propose two different robustness checks in order to rule out the hypothesisthat the different demographic shock of 1901-1921 drive my results.
Controlling for the First World War
The first and more straightforward strategy is simply to remove as much demographicshocks as it is possible. Hence, to remove the impact of the First World War andInfluenza epidemic, that both happen after 1911, I consider the restricted period of1891-1911, thus completely negating any impact that those two shocks might have hadin the results presented in the paper. I thus use the exact same specification used inmodel 1 and 2 but using the two 10 years periods 1891-1901 and 1901-1911 instead
23

Table 9: First World War and Influenza robustness check : within British Punjab. Dependent variable: difference in log-populations.
State level District level(1) (2) (3)
post -0.174** -0.349*** -0.373***(0.0827) (0.0598) (0.113)
agr 0.0255 -0.142*** -0.144***(0.0451) (0.0426) (0.0441)
post*agr 0.130 0.299*** 0.301***(0.0808) (0.0807) (0.0840)
Constant 0.0740 0.155*** 0.268***(0.0447) (0.0365) (0.101)
District Dummies NO NO YESpost*District Dummies NO NO YESObservations 163 1189 1189
R2 0.041 0.057 0.087Robust standard errors in parentheses
*** p<0.01, ** p<0.05, * p<0.1
of 1881-1901 and 1901-1921. Tables 9 and 10 present the results obtained. With anaverage impact of 15 percentage points, the results obtained here are in line with theresults obtained in the full 40 years sample, thus pointing to the fact that World War Iand the influenza epidemic had nothing to do with the results obtained.
Controlling for the plague and malaria epidemics
However, one might still argue that, if not World War I and influenza, it could well bethat it is the plague and malaria epidemics of the 1901-1911 period that drive the results.To control for that, I propose to verify whether a change in trend of the agricultural castespopulation happened around 1911: if the results obtained are driven by the demographicshocks happening during the 1901-1911 period, then we should see a trend specific tothe 1901-1911 period, that would not persist after 1911, once the shocks have passed.Hence, if it is plague and malaria that drive the result, the difference in agricultural versusnon agricultural castes population trend should be 1901-1911 specific, the identificationassumption being here that plague, malaria, influenza and World War I being verydifferent type of shocks, it is very unlikely that they would affect the population ofagricultural and non agricultural castes in the same way.I thus use the exact same specification used in model 1 and 2 but using the two 10 yearsperiods 1901-1911 and 1911-1921 instead of 1881-1901 and 1901-1921. Tables 11 and 12present the results obtained. We can see that, while the coefficient on agr (in Table 11)and br*agr (in Table 12) is positive and significant in most of the specifications, pointingto the fact that agricultural castes tended to grow faster than agricultural ones in Britishdistricts during the whole of the 1901-1921 periods, the coefficient on the interactionbetween post and agr (in Table 11) is small and non significant, while the coefficient onthe interaction between post, br and agr (in Table 12) is also small and non significantin all but one specification, pointing to the fact that there was no change around 1911in the tendency for agricultural castes to grow faster than non agricultural ones. The
24

Table 10: First World War and Influenza robustness check : British Punjab vs Princely States. Depen-dent variable : difference in log-populations.
State level District level(1) (2) (3) (4) (5)
post -0.0424 0.104 -0.249*** -0.148*** -0.373***(0.0711) (0.123) (0.0417) (0.0460) (0.114)
agr 0.0285 0.0663 -0.0274 0.0129 0.00453(0.0534) (0.0797) (0.0394) (0.0410) (0.0418)
post*agr -0.0204 -0.166 0.115** 0.0131 0.0254(0.0821) (0.130) (0.0535) (0.0569) (0.0581)
br*agr 0.0315 -0.0408 -0.0753 -0.155** -0.148**(0.0599) (0.0983) (0.0458) (0.0621) (0.0640)
post*br*agr 0.0191 0.296* 0.0847 0.286*** 0.276***(0.0638) (0.157) (0.0691) (0.0964) (0.101)
br 0.0723 0.0798*(0.0802) (0.0437)
post*br -0.277* -0.202***(0.151) (0.0680)
Constant 0.0395 0.00165 0.116*** 0.0756*** 0.268***(0.0454) (0.0746) (0.0230) (0.0257) (0.101)
District Dummies NO NO NO NO YESpost*District Dummies NO NO NO NO YESObservations 309 309 2396 2396 2396
R2 0.004 0.026 0.035 0.041 0.080Robust standard errors in parentheses
*** p<0.01, ** p<0.05, * p<0.1
negative and significant coefficient on post*br*agr in specification (2) of Table 12 is notin contradiction with the results obtained in the other columns of the table: it has to berelated to the fact that the coefficient on post*agr of this specification is positive andsignificant. Overall, those coefficents mean that the population of agricultural castesgrow faster after 1911 in Princely States (coefficient on post*agr) while the evolution ofthe population of agricultural castes sees no change around 1911 (the sum of post*agrand post*br*agr is close to zero). Moreover, as shown in specifications (5) and (6), aslong as the regressions are at the district level, and allow to control for district specificchanges, the coefficients on post*agr and post*br*agr become small and non significant,thus pointing to the fact that some of the most populated Princely States, such asBahawalpur (detailed in Annex 3) for example, see their population of agricultural castesincrease faster than non agricultural ones after 1911, but that this effect is not commonto all Princely Districts.Hence, overall, it appears that there is no change in the trend of the population of theagricultural castes around 1911, thus pointing to the fact that the shocks caused bythe plague and malaria epidemics did not drive the results obtained, as the trend inthe population of agricultural versus non agricultural castes remain constant across the1901-1921 period.
25

Table 11: Plague and malaria robustness check : within British Punjab. Dependent variable : differencein log-populations.
State level District level(1) (2) (3)
post 0.0729 0.200*** 0.416***(0.0929) (0.0608) (0.154)
agr 0.150** 0.172*** 0.174***(0.0712) (0.0533) (0.0547)
post*agr -0.0615 -0.0678 -0.0663(0.101) (0.104) (0.108)
Constant -0.0946 -0.209*** -0.173**(0.0647) (0.0394) (0.0682)
District Dummies NO NO YESpost*District Dummies NO NO YESObservations 169 1279 1279
R2 0.020 0.019 0.047Robust standard errors in parentheses
*** p<0.01, ** p<0.05, * p<0.1
Table 12: Plague and malaria robustness check : British Punjab vs Princely States. Dependent variable: difference in log-populations.
State level District level(1) (2) (3) (4) (5)
post -0.0979 -0.285*** 0.162*** 0.119** 0.416***(0.0676) (0.105) (0.0397) (0.0481) (0.154)
agr 0.00692 -0.0999 0.0985** 0.0329 0.0386(0.0591) (0.0778) (0.0429) (0.0430) (0.0428)
post*agr 0.127 0.314*** -0.0936 -0.0502 -0.0616(0.0814) (0.115) (0.0724) (0.0773) (0.0748)
br*agr 0.0506 0.250** 0.00940 0.140** 0.135**(0.0366) (0.102) (0.0486) (0.0635) (0.0654)
post*br*agr -0.0176 -0.376** 0.0638 -0.0177 -0.00472(0.0424) (0.152) (0.0935) (0.120) (0.123)
br -0.200** -0.130***(0.0943) (0.0407)
post*br 0.358** 0.0815(0.145) (0.0747)
Constant -0.00166 0.105 -0.145*** -0.0791*** -0.173**(0.0471) (0.0691) (0.0279) (0.0281) (0.0684)
District Dummies NO NO NO NO YESpost*District Dummies NO NO NO NO YESObservations 323 323 2730 2730 2730
R2 0.013 0.040 0.012 0.015 0.043Robust standard errors in parentheses
*** p<0.01, ** p<0.05, * p<0.1
26