British law and caste identity manipulation in...
24
British law and caste identity manipulation in colonial India: the Punjab Alienation of Land Act. Guilhem Cassan * January 12, 2010 I analyze the impact of the creation of an ”agricultural tribe” category by the Punjab Alienation of Land Act of 1901, the membership of which was almost compulsory in order to buy or sell land. Using original panel data built from the decennial census of Punjab from 1881 to 1921. I show, using various triple difference strategies, that in the districts where the law was enacted, caste groups manipulated their caste identity in order to claim an affiliation to the castes and tribes registered as agricultural by the British administration. This points to both the role of the British administration in the making of caste as a salient identity in colonial Punjab, as well as the ability of caste groups to manipulate their identity in response to economic incentives. More broadly, it questions the impact of any ethnic based policy on the definition of ethnic groups themselves. * Paris School of Economics (PSE), Laboratoire d’Economie Appliqu´ ee (LEA-INRA) and Centre de Sciences Humaines de Delhi (CSH) (email: [email protected]). I thank Sylvie Lambert, Denis Cogneau, Dave Donaldson, Ekaterina Zhuravskaya, V´ eronique B´ en´ e¨ ı as well as several seminar and conference participants for helpful comments. I am grateful to the Laboratoire d’Economie Appliqu´ ee-INRA for funding the data collection. 1
Transcript of British law and caste identity manipulation in...
British law and caste identity manipulation in colonial
India: the Punjab Alienation of Land Act.
Guilhem Cassan∗
January 12, 2010
I analyze the impact of the creation of an ”agricultural tribe” category by the PunjabAlienation of Land Act of 1901, the membership of which was almost compulsory inorder to buy or sell land. Using original panel data built from the decennial census ofPunjab from 1881 to 1921. I show, using various triple difference strategies, that in thedistricts where the law was enacted, caste groups manipulated their caste identity in orderto claim an affiliation to the castes and tribes registered as agricultural by the Britishadministration. This points to both the role of the British administration in the makingof caste as a salient identity in colonial Punjab, as well as the ability of caste groups tomanipulate their identity in response to economic incentives. More broadly, it questionsthe impact of any ethnic based policy on the definition of ethnic groups themselves.
∗Paris School of Economics (PSE), Laboratoire d’Economie Appliquee (LEA-INRA) and Centre deSciences Humaines de Delhi (CSH) (email: [email protected]). I thank Sylvie Lambert, Denis Cogneau,Dave Donaldson, Ekaterina Zhuravskaya, Veronique Beneı as well as several seminar and conferenceparticipants for helpful comments. I am grateful to the Laboratoire d’Economie Appliquee-INRA forfunding the data collection.
1
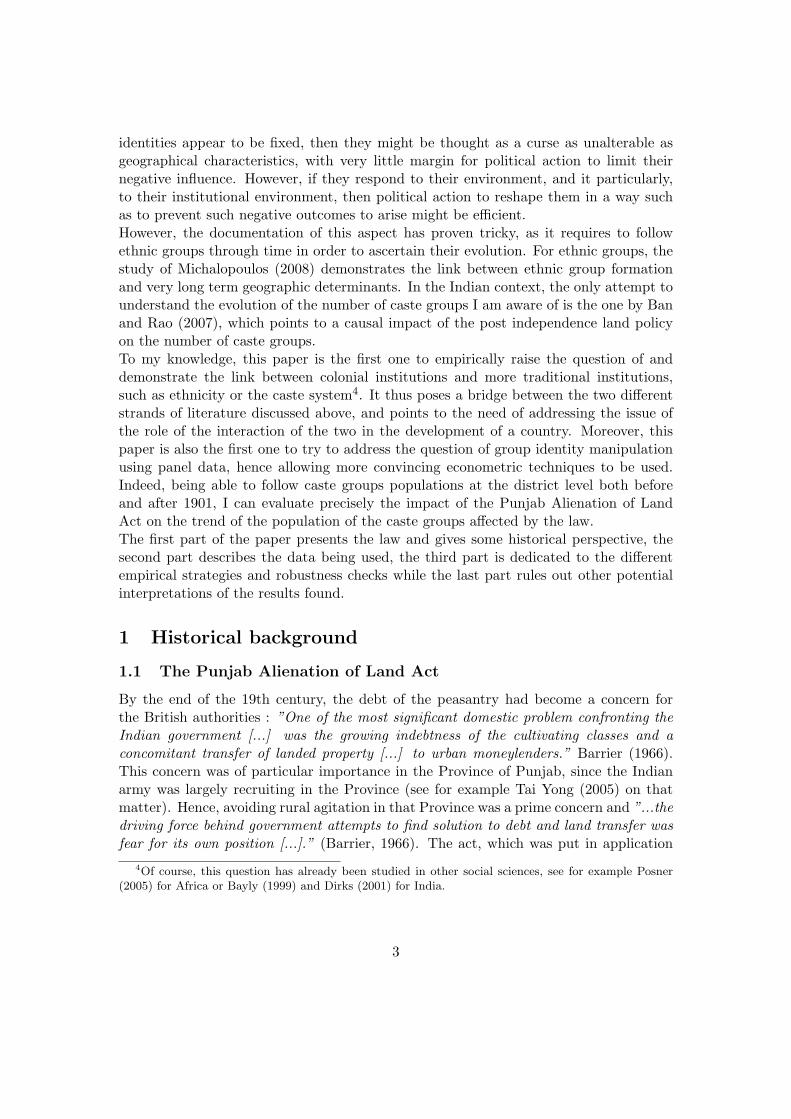
Introduction
This paper analyzes the impact on the caste system of a land policy reform, the PunjabAlienation of Land Act, passed in 1901 by the British administration in Punjab. Bycreating an ”agricultural tribes” category, the membership of which was almost compul-sory to buy or sell land, it created a very strong incentive for caste groups to manipulatetheir caste identity in order to claim membership to a caste group actually considered asan agricultural tribe1 so as to be able to enter the land market. By using caste censusdata from 1881 to 1921, I am able to follow the population of the different caste groupsof the Province of Punjab, and thus to evaluate the impact of the enacting of this law onthe tendency of caste groups to respond to the incentives given to them by the Britishadministration.This paper is related to several strands of the economic literature. First of all, it is veryclose in spirit to the growing literature studying the role of the British institutions inIndia in several colonial and contemporary outcomes (Iyer (Forthcoming), Banerjee andIyer (2005), Banerjee and Somanathan (2007), Chaudhary (2009)), and thus, more gen-erally, to the literature focusing on the understanding of the long term determinants ofdevelopment (Acemoglu, Johnson and Robinson (2001), Engerman and Sokoloff (1997)).Then, it is also linked to the study of ethnicity which has now become a very large strandof the mainstream economic literature. Indeed, ethnic fractionalization has been asso-ciated with lower provision of public goods (Alesina, Baqir and Easterly (1999), Migueland Gugerty (2005)), lower growth (Acemoglu, Johnson and Robinson (2001), Alesinaand La Ferrara (2005)) or lower quality of government (La Porta et al. (1999), Easterlyand Levine (1997)). For India, more than ethnic identity, it is caste that has been atthe center of attention with studies such as Banerjee and Somanathan (2007), Baner-jee, Somanathan and Iyer (2005) or Chaudhary (2006). Those studies, in line with theresearch on ethnic fractionalization, typically find that caste fractionalization leads tolower public good access, both in colonial times and in more recent periods. According tothis literature, ethnic or caste identity appears therefore to be a key aspect of economicdevelopment. However, this type of studies typically consider ethnic identities to beexogenously given. Indeed, all those studies rely on cross section data and thus have tomake such an exogeneity hypothesis 2, while it has been widely acknowledged in socialsciences that ethnic identity might not be as fixed as it is often assumed3 and mightthus respond endogenously to institutional or economic incentives, and lead to spuriousresults. Moreover, and certainly more importantly, if the results of this literature arerobust, then understanding the origin and evolution of ethnic or caste identities is es-sential to think about the solutions to bring to the issues they raise. Indeed, if ethnic
1The tendency of caste and caste associations to manipulate their caste names in colonial times hasbeen widely studied by social scientists, and is presented in more details in the body of this paper.
2Most of those study use data collected often decades before their measured outcome, and thus arguethat their exogeneity hypothesis is not too strong.
3The so called ”constructivist” approach underlines that ethnic composition of a region as well asindividuals or groups ethnic identities might evolve in response to the context (see Posner (Forthcoming)for a review)
2
identities appear to be fixed, then they might be thought as a curse as unalterable asgeographical characteristics, with very little margin for political action to limit theirnegative influence. However, if they respond to their environment, and it particularly,to their institutional environment, then political action to reshape them in a way suchas to prevent such negative outcomes to arise might be efficient.However, the documentation of this aspect has proven tricky, as it requires to followethnic groups through time in order to ascertain their evolution. For ethnic groups, thestudy of Michalopoulos (2008) demonstrates the link between ethnic group formationand very long term geographic determinants. In the Indian context, the only attempt tounderstand the evolution of the number of caste groups I am aware of is the one by Banand Rao (2007), which points to a causal impact of the post independence land policyon the number of caste groups.To my knowledge, this paper is the first one to empirically raise the question of anddemonstrate the link between colonial institutions and more traditional institutions,such as ethnicity or the caste system4. It thus poses a bridge between the two differentstrands of literature discussed above, and points to the need of addressing the issue ofthe role of the interaction of the two in the development of a country. Moreover, thispaper is also the first one to try to address the question of group identity manipulationusing panel data, hence allowing more convincing econometric techniques to be used.Indeed, being able to follow caste groups populations at the district level both beforeand after 1901, I can evaluate precisely the impact of the Punjab Alienation of LandAct on the trend of the population of the caste groups affected by the law.The first part of the paper presents the law and gives some historical perspective, thesecond part describes the data being used, the third part is dedicated to the differentempirical strategies and robustness checks while the last part rules out other potentialinterpretations of the results found.
1 Historical background
1.1 The Punjab Alienation of Land Act
By the end of the 19th century, the debt of the peasantry had become a concern forthe British authorities : ”One of the most significant domestic problem confronting theIndian government [...] was the growing indebtness of the cultivating classes and aconcomitant transfer of landed property [...] to urban moneylenders.” Barrier (1966).This concern was of particular importance in the Province of Punjab, since the Indianarmy was largely recruiting in the Province (see for example Tai Yong (2005) on thatmatter). Hence, avoiding rural agitation in that Province was a prime concern and ”...thedriving force behind government attempts to find solution to debt and land transfer wasfear for its own position [...].” (Barrier, 1966). The act, which was put in application
4Of course, this question has already been studied in other social sciences, see for example Posner(2005) for Africa or Bayly (1999) and Dirks (2001) for India.
3
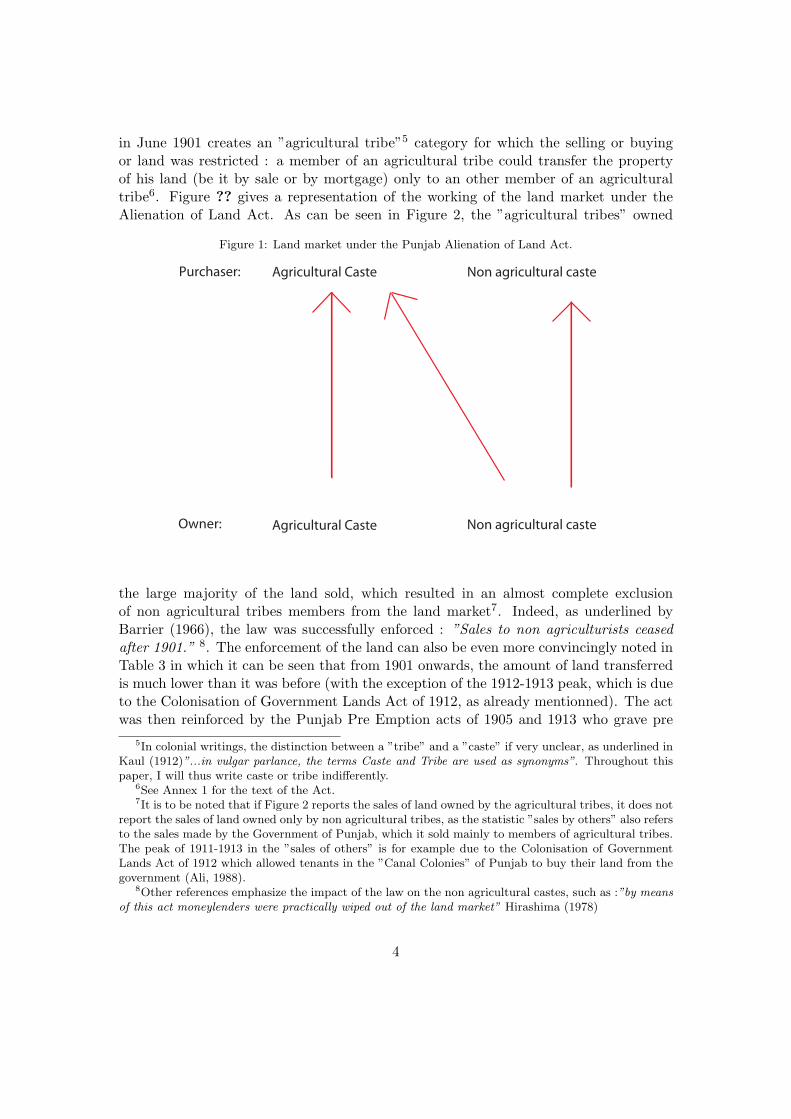
in June 1901 creates an ”agricultural tribe”5 category for which the selling or buyingor land was restricted : a member of an agricultural tribe could transfer the propertyof his land (be it by sale or by mortgage) only to an other member of an agriculturaltribe6. Figure ?? gives a representation of the working of the land market under theAlienation of Land Act. As can be seen in Figure 2, the ”agricultural tribes” owned
Figure 1: Land market under the Punjab Alienation of Land Act.
Agricultural Caste Non agricultural caste
Agricultural Caste Non agricultural caste
Purchaser:
Owner:
the large majority of the land sold, which resulted in an almost complete exclusionof non agricultural tribes members from the land market7. Indeed, as underlined byBarrier (1966), the law was successfully enforced : ”Sales to non agriculturists ceasedafter 1901.” 8. The enforcement of the land can also be even more convincingly noted inTable 3 in which it can be seen that from 1901 onwards, the amount of land transferredis much lower than it was before (with the exception of the 1912-1913 peak, which is dueto the Colonisation of Government Lands Act of 1912, as already mentionned). The actwas then reinforced by the Punjab Pre Emption acts of 1905 and 1913 who grave pre
5In colonial writings, the distinction between a ”tribe” and a ”caste” if very unclear, as underlined inKaul (1912)”...in vulgar parlance, the terms Caste and Tribe are used as synonyms”. Throughout thispaper, I will thus write caste or tribe indifferently.
6See Annex 1 for the text of the Act.7It is to be noted that if Figure 2 reports the sales of land owned by the agricultural tribes, it does not
report the sales of land owned only by non agricultural tribes, as the statistic ”sales by others” also refersto the sales made by the Government of Punjab, which it sold mainly to members of agricultural tribes.The peak of 1911-1913 in the ”sales of others” is for example due to the Colonisation of GovernmentLands Act of 1912 which allowed tenants in the ”Canal Colonies” of Punjab to buy their land from thegovernment (Ali, 1988).
8Other references emphasize the impact of the law on the non agricultural castes, such as :”by meansof this act moneylenders were practically wiped out of the land market” Hirashima (1978)
4

Figure 2: Sales of land by ”agricultural” status (in acres). Province of Punjab, 1902-1932.
Source: Report of the Land Revenue Administration of the Punjab, 1932.
0
50000
100000
150000
200000
250000
1902
-1903
1903
-1904
1904
-1905
1905
-1906
1906
-1907
1907
-1908
1908
-1909
1909
-1910
1910
-1911
1911
-1912
1912
-1913
1913
-1914
1914
-1915
1915
-1916
1916
-1917
1917
-1918
1918
-1919
1919
-1920
1920
-1921
1921
-1922
1922
-1923
1923
-1924
1924
-1925
1925
-1926
1926
-1927
1927
-1928
1928
-1929
1929
-1930
1930
-1931
Sales by agricultural castes Sales by others
emption rights on land sales to members of agricultural tribes. In a Province in whichthe population lived in rural areas in its vast majority, being considered as a member ofagricultural tribes became critical after the enacting of the act, as it was the only wayto have access to land ownership. The law thus created a very strong incentive to belisted as an ”agricultural tribe”.
1.2 Its impact on the caste system
Various reports of the administration mention the different manners in which attemptsto avoid the act were made. The first and most obvious one was to lobby the authoritiesin order to have the caste be entered in the list of ”agricultural tribes”. Indeed, thenumber of castes considered as agricultural increased over time. An other way to evadethe act was to use ”benami transactions”: using a member of an agricultural tribe to buyor mortgage land for a member of a non agricultural tribe9. But the way mentioned inthe reports that we are dealing with in this paper is caste identity manipulation, whichis described at several occasions in the various Annual Reports on the Punjab Alienationof Land Act. Indeed, for the year 1904-1905, it is written: ”...menials that have acquiredmoney are attempting to get themselves recorded as agricultural tribes with a view to
9For example, in the Report on the Working of the Punjab Alienation of Land Act for 1908 : ”Whatare called benami transactions are reported from most districts. The money lender induces a memberof an agricultural tribe [...] to take land on mortgage for the would be borrower.” (Punjab Government(1909))
5

Figure 3: Transfers of land property (in acres). Province of Punjab, 1896-1931.
150000
170000
190000
210000
230000
250000
270000
290000
310000
330000
350000
1896
-1897
1897
-1898
1898
-1899
1899
-1900
1900
-1901
1901
-1902
1902
-1903
1903
-1904
1904
-1905
1905
-1906
1906
-1907
1907
-1908
1908
-1909
1909
-1910
1910
-1911
1911
-1912
1912
-1913
1913
-1914
1914
-1915
1915
-1916
1916
-1917
1917
-1918
1918
-1919
1919
-1920
1920
-1921
1921
-1922
1922
-1923
1923
-1924
1924
-1925
1925
-1926
1926
-1927
1927
-1928
1928
-1929
1929
-1930
1930
-1931
Area transferred (in acres)
Source : Report of the land revenue administration of the Punjab, 1932.
1901: Land Alienation Act
acquiring land...” (Punjab Government (1906)), while for the year 1906-1907, one cansee mentions of ”...cases of evasive attempt to change tribal designation from a non agri-cultural to an agricultural tribe in order to defeat the provisions of the Act...” (PunjabGovernment (1908)). This tendency is reported to be the due to individual action, as inthe examples given here, but also sometimes to the mobilization of the caste as a whole:”Frequent cases arise in which application is made by tribes not included in the groupnotified for the district to have the tribal designation altered to one so included” (Pun-jab Government (1909)). Those attempts can also be found in various Census reports,that underline a tendency from caste associations to make claims towards the Britishadministration in order to be considered as agricultural :in the Report on the Censusof Punjab, 1911, for example : ”The introduction of the Punjab Alienation of Land Act[...]has naturally stimulated [...] a tendency to claim an affinity with one or the other ofthe castes declared by Government as agricultural” Kaul (1912)10.This takes place in a wider context of caste identity manipulation all across India. In-deed, it has been widely documented (from Ghurye (1932) and Srinivas (1966) to Dirks(2001) and Bayly (1999)) that far from being fixed, the caste system, under the British
10This claims persisted through time and can also be found in the Report on the Census of Punjab,1931: ”...on the present occasion more than ever before a tendency was noticeable in various localities,[...]to return a higher caste. One of the main reasons was a desire to be included in one of the agriculturaltribes [...] to secure exemption from the provisions of the Punjab Alienation of Land Act.” Khan (1933)
6
rule, was evolving under the action of the caste associations (or caste ”sabhas”) whichwere formed in order to ”support social advancement” Assayag (1995) and to gain ac-cess to the economic opportunities created by the British presence 11. Authors such asDirks (2001), argue that ”[...] caste is a modern phenomenon, that it is, specifically, theproduct of an historical encounter between India and Western colonial rule”. Indeed, theBritish rule was a period of deep changes for the Indian society, in particular regardingcaste. As finely underlined by Bayly (1999), the British Raj has given Indians incentivesto turn caste into their salient ethnic identity : ”[...]from the early nineteenth centuryonwards, British rule significantly expanded and sharpened these norms and conventions,building many manifestations of caste language and ideology into its structures of au-thoritative government.” As a matter of fact, the Sepoy mutiny of 1857, which lead tothe replacement of the East India Company by the British Crown for the administrationof British India Iyer (Forthcoming), ” made it clear to the British that they knew fattoo little about the colonized populations of India” Dirks (2001). As, in what has beendescribed as the ”Orientalist” (Said (1978)) point of view, caste was to define one’scharacteristic, understanding India required to understand caste. Hence, caste becamemore and more at the center of colonial policies and data collection. From the 1880’s,for example, caste identity became central in the recruitment policy into the army, inline with the ”martial race” theory : some castes and ”races” were seen as being moremartial, more ”warlike” and more disciplined than the others, thus making better sol-diers (Omissi (1994)). It was thus those castes and ”races” only that were allowed inthe Indian army. Along the same lines, the Criminal Tribes Act of 1871 put entire castegroups under the suspicion of being criminal. The Punjab Alienation of Land Act, withits implicit view that caste identity is to define one’s occupation, is clearly part of thismoves towards caste directed legislation. However, contrary to recruitment in the armyor suspicion to be a criminal which where of concern for only a minority, it affecteddeeply the life of the vaste majority of the inhabitants of the Province of Punjab, andthus creating a very strong incentive for caste identity manipulation.
2 Data
2.1 Caste Census Data
To estimate the impact of the Punjab Alienation of Land Act on caste identity manipu-lation, I have collected caste census data from 1881 to 1921. Indeed, from 1871 to 1931,every decennial Census collected caste data, which was then tabulated at the districtlevel. As already mentioned, it has been widely documented that the Census was partof the mobilization strategies from caste associations, who were very often claiming fornew caste names, making the following of each single caste very difficult across time, asboth classifications and names might change across time. However, the Punjab Censusdata is of very good quality from 1881 to 1921: using the different Census reports and
11”the associations began to press for places in the new administrative and educational institutions andfor political representation” Rudolph and Rudolph (1960)
7
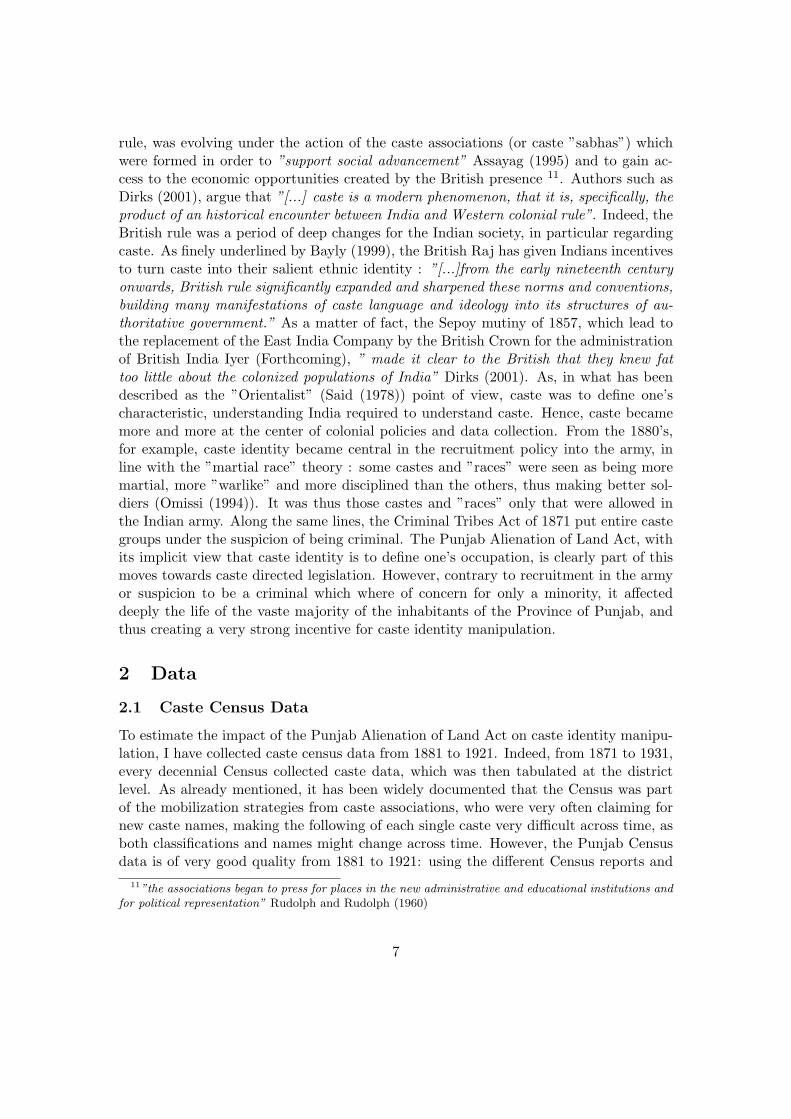
the Glossary of the Tribes and Castes of the Punjab and North-West Frontier Province(Rose (1911)), I have been able to track all caste groups, taking into account the hun-dreds of changes in classification and names12 and thus building what I believe is the firstdataset following caste groups demography over time at such a fine level13. However, thevarious modifications of district borders and the partition of the North West FrontierProvince from Punjab in 1901 as well as the creation of the Delhi Province in 1911 haveled me to leave aside some districts while merging some others, in order to assure theircomparability over time (see Figure 4).
Figure 4: British Punjab : dropped and merged districts
Dropped districts
Merged Districts
Overall, I am able to follow 76 caste groups, 15 of which are agricultural14, whichrepresent from 97% to 99% of the population of the 34 districts and states I am tracking
12The reason why I do not use the 1871 and 1931 Census is that they do not report Castes group atsuch a fine level as the other years, thus not allowing me to track all Castes for those years. Also, it hasoften been reported that Caste Census data is flawed due to people reporting their occupation or theirregion instead of their castes, but the Glossary and the Census reports do list those occupational andregional names, that I was thus able to identify and remove, and which account for a negligible part ofthe total population.
13Both geographically fine, at the district level, and fine at the caste level, since I follow caste groups,and not only ”scheduled castes” and ”scheduled tribes” as is usually the case in most datasets.
14More castes and tribes were actually considered as agricultural, but in order to be able to track themover time, I had to merge them either with other agricultural castes, or with non agricultural ones (whichbias the results downward). I code as ”agricultural” all caste or tribe defined as such in the Notificationsof the 18th April 1904 and of 30th March 1906, found in the Reports on the Punjab Alienation of LandAct (Punjab Government (1905) and Punjab Government (1907)). Castes were defined as agriculturalat the district level. Also, as I use the 1906 list of agricultural castes (I could not find reports on thePunjab Alienation of Land Act after 1908, and no modification of the list takes place between 1906 and
8
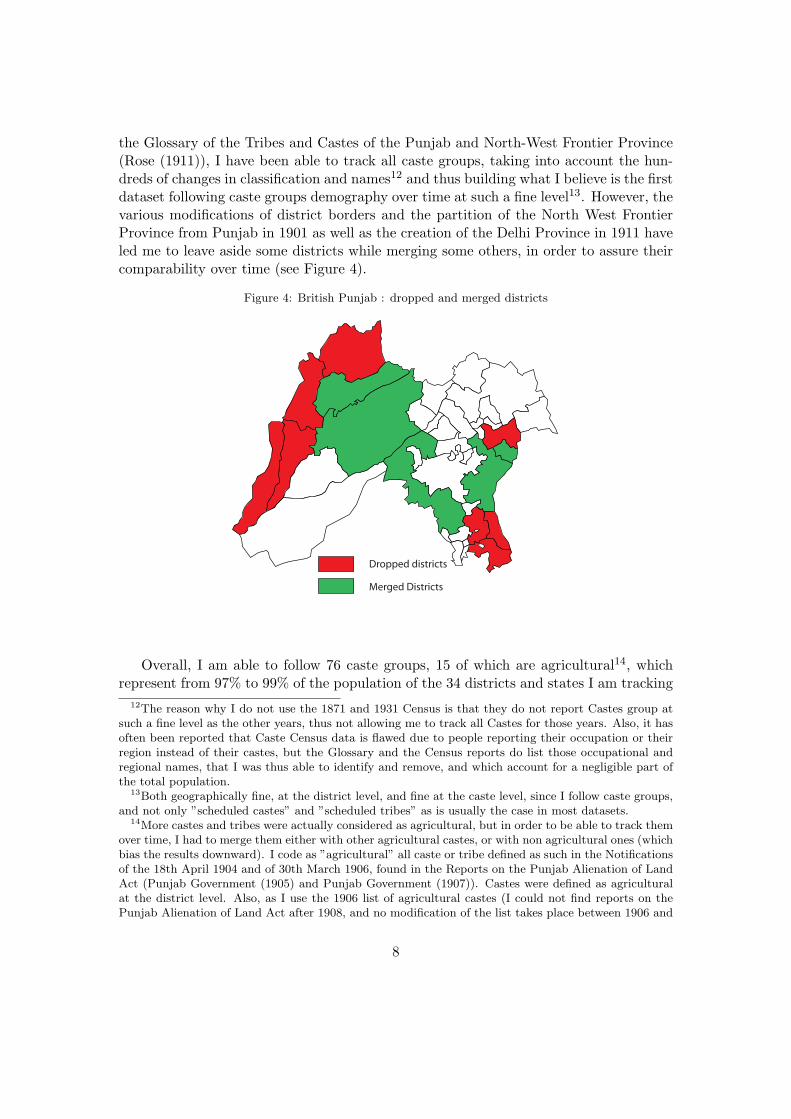
Figure 5: British Punjab : Princely States and British Districts
Princely States
British Districts
over time, which themselves contain 80% of the population of the Province of Punjab. Ihave thus built a district level panel of caste composition allowing to study through timeat a very fine geographical level the response of caste groups to the Punjab Alienationof Land Act.
2.2 Descriptive Statistics
The whole Province of Punjab had a 24.4 million population in 1901, for an area of 354634 square kilometers. It corresponds to the contemporary States of Punjab (Pakistan),Punjab (India), Himachal Pradesh (India) and Haryana (India). As for the rest of India,it was not entirely administered by the British, since some area, the Princely States,were under the rule of local Princes, and as such, were not subject to British law (seeIyer (Forthcoming) for more details, and Figure 5 for their localization), the populationof the Princely states was 4.4 millions, thus leaving 19.9 millions under direct Britishrule.
The Province of Punjab was essentially rural, with 89% of the population living ina rural area15, hence most of its population is directly concerned by the act, while the
1908), I consider as non agricultural any caste entering the category after 1906, leading to a downwardbias of my estimations.
15The Urban population is defined as ”(1) Every municipality of whatever size.(2) All civil lines notincluded within municipal limits.(3) Every cantonment.(4) Every other continuous collection of houses,permanently inhabited by not less than 5,000 persons, which the Provincial Superintendent may decideto treat as a town for census purposes.” (Report on the Census of Punjab, 1901 Risley (1903))
9
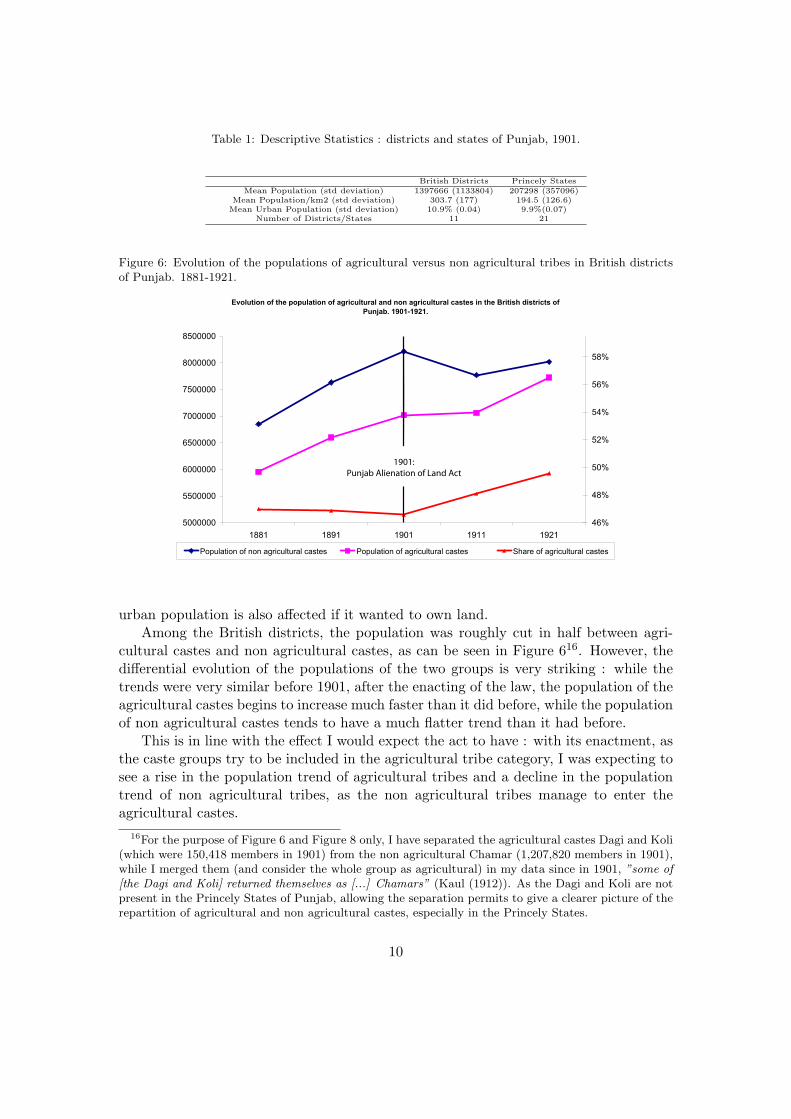
Table 1: Descriptive Statistics : districts and states of Punjab, 1901.
British Districts Princely StatesMean Population (std deviation) 1397666 (1133804) 207298 (357096)
Mean Population/km2 (std deviation) 303.7 (177) 194.5 (126.6)Mean Urban Population (std deviation) 10.9% (0.04) 9.9%(0.07)
Number of Districts/States 11 21
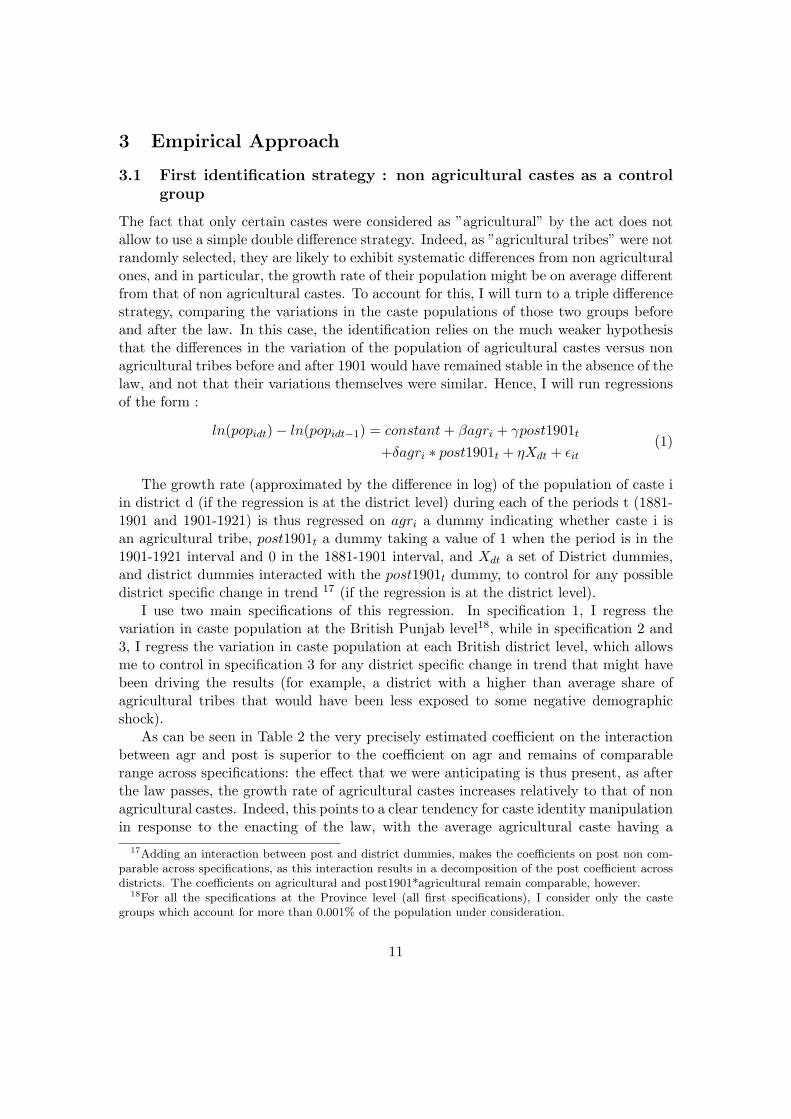
Figure 6: Evolution of the populations of agricultural versus non agricultural tribes in British districtsof Punjab. 1881-1921.
Evolution of the population of agricultural and non agricultural castes in the British districts of Punjab. 1901-1921.
5000000
5500000
6000000
6500000
7000000
7500000
8000000
8500000
1881 1891 1901 1911 192146%
48%
50%
52%
54%
56%
58%
Population of non agricultural castes Population of agricultural castes Share of agricultural castes
1901:Punjab Alienation of Land Act
urban population is also affected if it wanted to own land.Among the British districts, the population was roughly cut in half between agri-
cultural castes and non agricultural castes, as can be seen in Figure 616. However, thedifferential evolution of the populations of the two groups is very striking : while thetrends were very similar before 1901, after the enacting of the law, the population of theagricultural castes begins to increase much faster than it did before, while the populationof non agricultural castes tends to have a much flatter trend than it had before.
This is in line with the effect I would expect the act to have : with its enactment, asthe caste groups try to be included in the agricultural tribe category, I was expecting tosee a rise in the population trend of agricultural tribes and a decline in the populationtrend of non agricultural tribes, as the non agricultural tribes manage to enter theagricultural castes.
16For the purpose of Figure 6 and Figure 8 only, I have separated the agricultural castes Dagi and Koli(which were 150,418 members in 1901) from the non agricultural Chamar (1,207,820 members in 1901),while I merged them (and consider the whole group as agricultural) in my data since in 1901, ”some of[the Dagi and Koli] returned themselves as [...] Chamars” (Kaul (1912)). As the Dagi and Koli are notpresent in the Princely States of Punjab, allowing the separation permits to give a clearer picture of therepartition of agricultural and non agricultural castes, especially in the Princely States.
10
3 Empirical Approach
3.1 First identification strategy : non agricultural castes as a controlgroup
The fact that only certain castes were considered as ”agricultural” by the act does notallow to use a simple double difference strategy. Indeed, as ”agricultural tribes” were notrandomly selected, they are likely to exhibit systematic differences from non agriculturalones, and in particular, the growth rate of their population might be on average differentfrom that of non agricultural castes. To account for this, I will turn to a triple differencestrategy, comparing the variations in the caste populations of those two groups beforeand after the law. In this case, the identification relies on the much weaker hypothesisthat the differences in the variation of the population of agricultural castes versus nonagricultural tribes before and after 1901 would have remained stable in the absence of thelaw, and not that their variations themselves were similar. Hence, I will run regressionsof the form :
ln(popidt) − ln(popidt−1) = constant+ βagri + γpost1901t
+δagri ∗ post1901t + ηXdt + εit(1)
The growth rate (approximated by the difference in log) of the population of caste iin district d (if the regression is at the district level) during each of the periods t (1881-1901 and 1901-1921) is thus regressed on agri a dummy indicating whether caste i isan agricultural tribe, post1901t a dummy taking a value of 1 when the period is in the1901-1921 interval and 0 in the 1881-1901 interval, and Xdt a set of District dummies,and district dummies interacted with the post1901t dummy, to control for any possibledistrict specific change in trend 17 (if the regression is at the district level).
I use two main specifications of this regression. In specification 1, I regress thevariation in caste population at the British Punjab level18, while in specification 2 and3, I regress the variation in caste population at each British district level, which allowsme to control in specification 3 for any district specific change in trend that might havebeen driving the results (for example, a district with a higher than average share ofagricultural tribes that would have been less exposed to some negative demographicshock).
As can be seen in Table 2 the very precisely estimated coefficient on the interactionbetween agr and post is superior to the coefficient on agr and remains of comparablerange across specifications: the effect that we were anticipating is thus present, as afterthe law passes, the growth rate of agricultural castes increases relatively to that of nonagricultural castes. Indeed, this points to a clear tendency for caste identity manipulationin response to the enacting of the law, with the average agricultural caste having a
17Adding an interaction between post and district dummies, makes the coefficients on post non com-parable across specifications, as this interaction results in a decomposition of the post coefficient acrossdistricts. The coefficients on agricultural and post1901*agricultural remain comparable, however.
18For all the specifications at the Province level (all first specifications), I consider only the castegroups which account for more than 0.001% of the population under consideration.
11
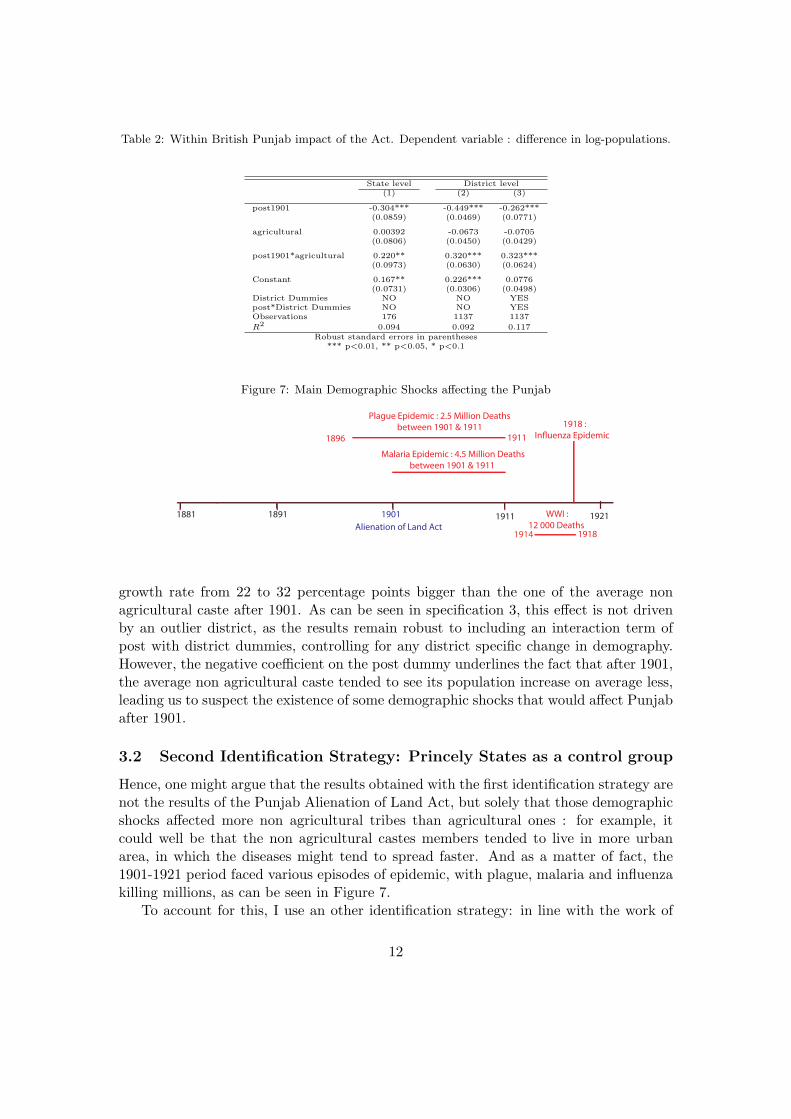
Table 2: Within British Punjab impact of the Act. Dependent variable : difference in log-populations.
State level District level(1) (2) (3)
post1901 -0.304*** -0.449*** -0.262***(0.0859) (0.0469) (0.0771)
agricultural 0.00392 -0.0673 -0.0705(0.0806) (0.0450) (0.0429)
post1901*agricultural 0.220** 0.320*** 0.323***(0.0973) (0.0630) (0.0624)
Constant 0.167** 0.226*** 0.0776(0.0731) (0.0306) (0.0498)
District Dummies NO NO YESpost*District Dummies NO NO YESObservations 176 1137 1137
R2 0.094 0.092 0.117Robust standard errors in parentheses
*** p<0.01, ** p<0.05, * p<0.1
Figure 7: Main Demographic Shocks affecting the Punjab
1881 1891 1901 1911 1921
1896 1911
Plague Epidemic : 2.5 Million Deaths between 1901 & 1911
Alienation of Land Act
Malaria Epidemic : 4.5 Million Deaths between 1901 & 1911
1918 :In�uenza Epidemic
1914 1918
WWI :12 000 Deaths
growth rate from 22 to 32 percentage points bigger than the one of the average nonagricultural caste after 1901. As can be seen in specification 3, this effect is not drivenby an outlier district, as the results remain robust to including an interaction term ofpost with district dummies, controlling for any district specific change in demography.However, the negative coefficient on the post dummy underlines the fact that after 1901,the average non agricultural caste tended to see its population increase on average less,leading us to suspect the existence of some demographic shocks that would affect Punjabafter 1901.
3.2 Second Identification Strategy: Princely States as a control group
Hence, one might argue that the results obtained with the first identification strategy arenot the results of the Punjab Alienation of Land Act, but solely that those demographicshocks affected more non agricultural tribes than agricultural ones : for example, itcould well be that the non agricultural castes members tended to live in more urbanarea, in which the diseases might tend to spread faster. And as a matter of fact, the1901-1921 period faced various episodes of epidemic, with plague, malaria and influenzakilling millions, as can be seen in Figure 7.
To account for this, I use an other identification strategy: in line with the work of
12
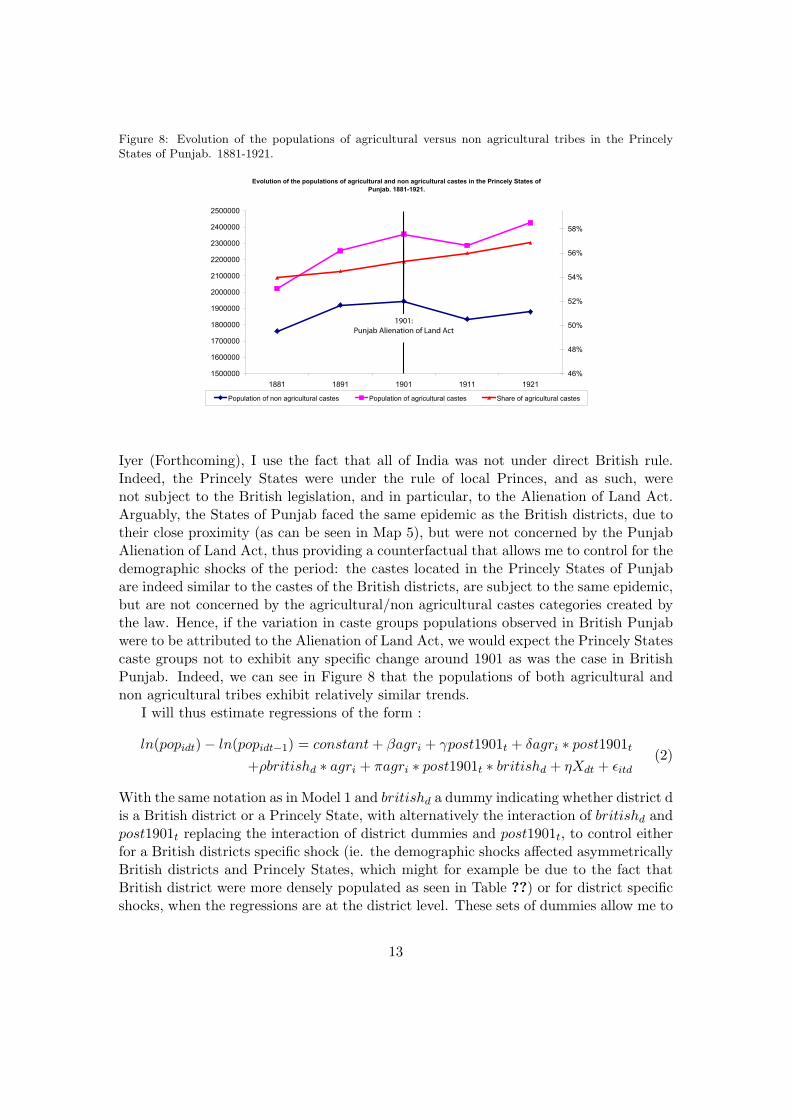
Figure 8: Evolution of the populations of agricultural versus non agricultural tribes in the PrincelyStates of Punjab. 1881-1921.
Evolution of the populations of agricultural and non agricultural castes in the Princely States of Punjab. 1881-1921.
1500000
1600000
1700000
1800000
1900000
2000000
2100000
2200000
2300000
2400000
2500000
1881 1891 1901 1911 192146%
48%
50%
52%
54%
56%
58%
Population of non agricultural castes Population of agricultural castes Share of agricultural castes
1901:Punjab Alienation of Land Act
Iyer (Forthcoming), I use the fact that all of India was not under direct British rule.Indeed, the Princely States were under the rule of local Princes, and as such, werenot subject to the British legislation, and in particular, to the Alienation of Land Act.Arguably, the States of Punjab faced the same epidemic as the British districts, due totheir close proximity (as can be seen in Map 5), but were not concerned by the PunjabAlienation of Land Act, thus providing a counterfactual that allows me to control for thedemographic shocks of the period: the castes located in the Princely States of Punjabare indeed similar to the castes of the British districts, are subject to the same epidemic,but are not concerned by the agricultural/non agricultural castes categories created bythe law. Hence, if the variation in caste groups populations observed in British Punjabwere to be attributed to the Alienation of Land Act, we would expect the Princely Statescaste groups not to exhibit any specific change around 1901 as was the case in BritishPunjab. Indeed, we can see in Figure 8 that the populations of both agricultural andnon agricultural tribes exhibit relatively similar trends.
I will thus estimate regressions of the form :
ln(popidt) − ln(popidt−1) = constant+ βagri + γpost1901t + δagri ∗ post1901t
+ρbritishd ∗ agri + πagri ∗ post1901t ∗ britishd + ηXdt + εitd(2)
With the same notation as in Model 1 and britishd a dummy indicating whether district dis a British district or a Princely State, with alternatively the interaction of britishd andpost1901t replacing the interaction of district dummies and post1901t, to control eitherfor a British districts specific shock (ie. the demographic shocks affected asymmetricallyBritish districts and Princely States, which might for example be due to the fact thatBritish district were more densely populated as seen in Table ??) or for district specificshocks, when the regressions are at the district level. These sets of dummies allow me to
13
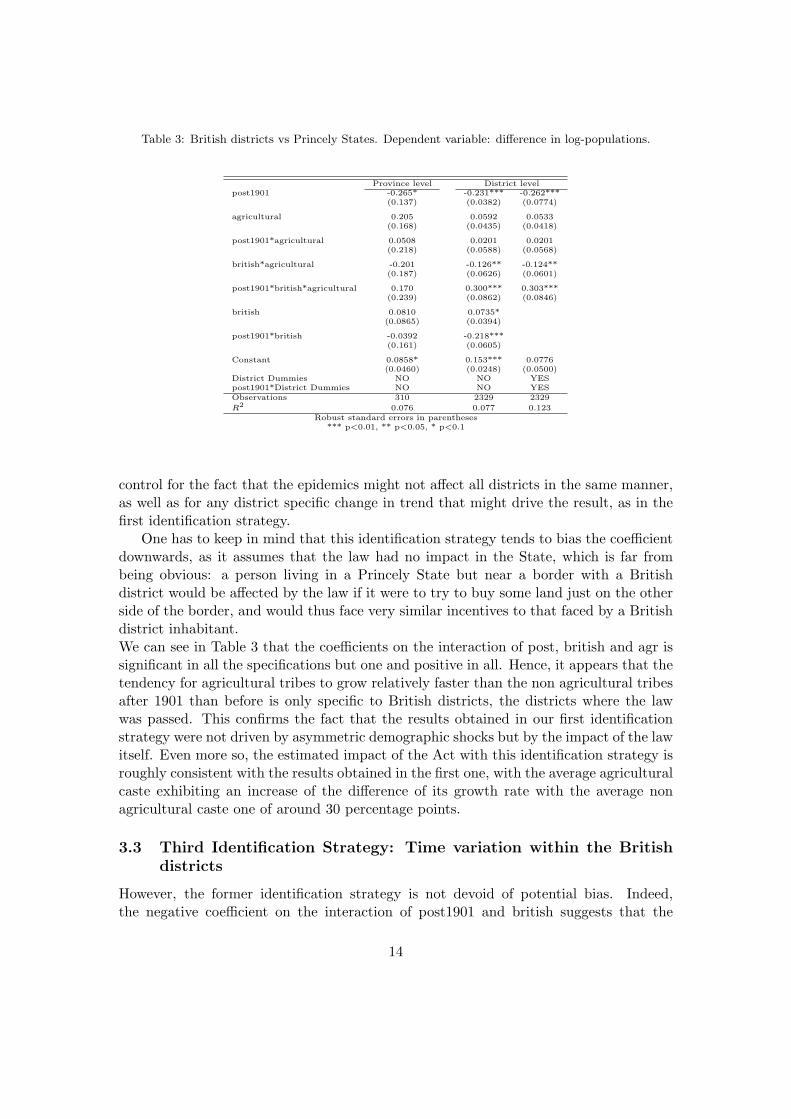
Table 3: British districts vs Princely States. Dependent variable: difference in log-populations.
Province level District levelpost1901 -0.265* -0.231*** -0.262***
(0.137) (0.0382) (0.0774)
agricultural 0.205 0.0592 0.0533(0.168) (0.0435) (0.0418)
post1901*agricultural 0.0508 0.0201 0.0201(0.218) (0.0588) (0.0568)
british*agricultural -0.201 -0.126** -0.124**(0.187) (0.0626) (0.0601)
post1901*british*agricultural 0.170 0.300*** 0.303***(0.239) (0.0862) (0.0846)
british 0.0810 0.0735*(0.0865) (0.0394)
post1901*british -0.0392 -0.218***(0.161) (0.0605)
Constant 0.0858* 0.153*** 0.0776(0.0460) (0.0248) (0.0500)
District Dummies NO NO YESpost1901*District Dummies NO NO YESObservations 310 2329 2329
R2 0.076 0.077 0.123Robust standard errors in parentheses
*** p<0.01, ** p<0.05, * p<0.1
control for the fact that the epidemics might not affect all districts in the same manner,as well as for any district specific change in trend that might drive the result, as in thefirst identification strategy.
One has to keep in mind that this identification strategy tends to bias the coefficientdownwards, as it assumes that the law had no impact in the State, which is far frombeing obvious: a person living in a Princely State but near a border with a Britishdistrict would be affected by the law if it were to try to buy some land just on the otherside of the border, and would thus face very similar incentives to that faced by a Britishdistrict inhabitant.We can see in Table 3 that the coefficients on the interaction of post, british and agr issignificant in all the specifications but one and positive in all. Hence, it appears that thetendency for agricultural tribes to grow relatively faster than the non agricultural tribesafter 1901 than before is only specific to British districts, the districts where the lawwas passed. This confirms the fact that the results obtained in our first identificationstrategy were not driven by asymmetric demographic shocks but by the impact of the lawitself. Even more so, the estimated impact of the Act with this identification strategy isroughly consistent with the results obtained in the first one, with the average agriculturalcaste exhibiting an increase of the difference of its growth rate with the average nonagricultural caste one of around 30 percentage points.
3.3 Third Identification Strategy: Time variation within the Britishdistricts
However, the former identification strategy is not devoid of potential bias. Indeed,the negative coefficient on the interaction of post1901 and british suggests that the
14
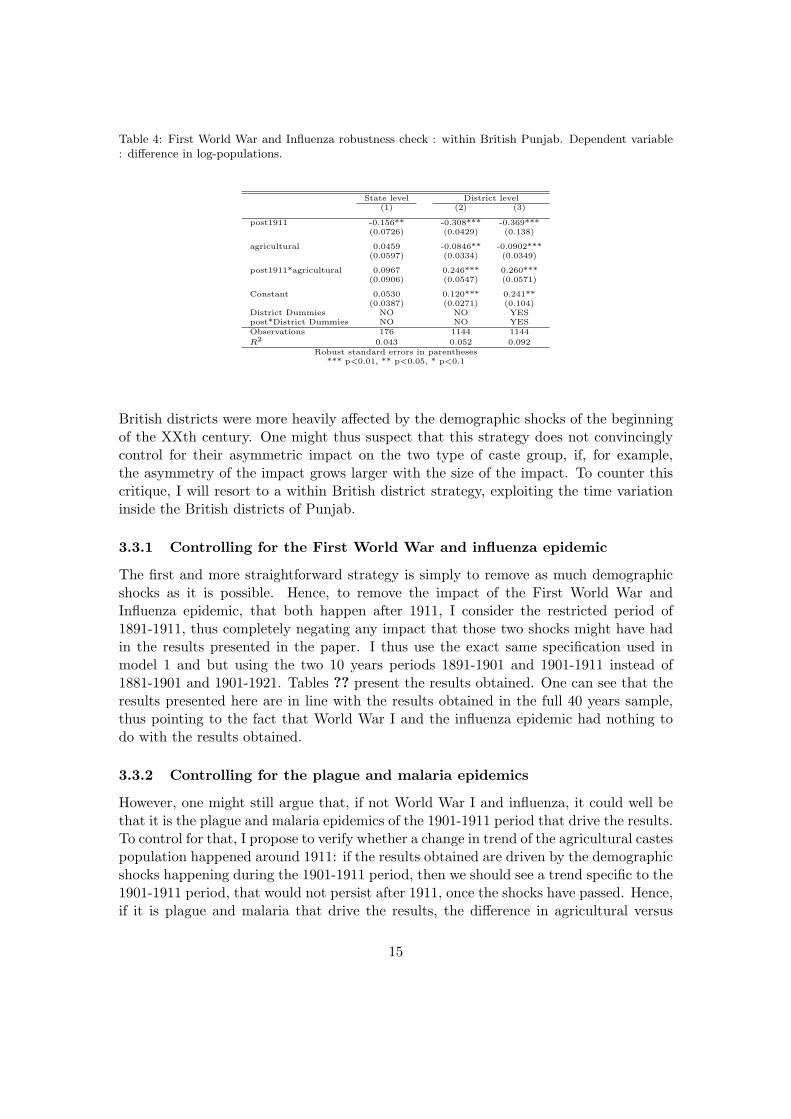
Table 4: First World War and Influenza robustness check : within British Punjab. Dependent variable: difference in log-populations.
State level District level(1) (2) (3)
post1911 -0.156** -0.308*** -0.369***(0.0726) (0.0429) (0.138)
agricultural 0.0459 -0.0846** -0.0902***(0.0597) (0.0334) (0.0349)
post1911*agricultural 0.0967 0.246*** 0.260***(0.0906) (0.0547) (0.0571)
Constant 0.0530 0.120*** 0.241**(0.0387) (0.0271) (0.104)
District Dummies NO NO YESpost*District Dummies NO NO YESObservations 176 1144 1144
R2 0.043 0.052 0.092Robust standard errors in parentheses
*** p<0.01, ** p<0.05, * p<0.1
British districts were more heavily affected by the demographic shocks of the beginningof the XXth century. One might thus suspect that this strategy does not convincinglycontrol for their asymmetric impact on the two type of caste group, if, for example,the asymmetry of the impact grows larger with the size of the impact. To counter thiscritique, I will resort to a within British district strategy, exploiting the time variationinside the British districts of Punjab.
3.3.1 Controlling for the First World War and influenza epidemic
The first and more straightforward strategy is simply to remove as much demographicshocks as it is possible. Hence, to remove the impact of the First World War andInfluenza epidemic, that both happen after 1911, I consider the restricted period of1891-1911, thus completely negating any impact that those two shocks might have hadin the results presented in the paper. I thus use the exact same specification used inmodel 1 and but using the two 10 years periods 1891-1901 and 1901-1911 instead of1881-1901 and 1901-1921. Tables ?? present the results obtained. One can see that theresults presented here are in line with the results obtained in the full 40 years sample,thus pointing to the fact that World War I and the influenza epidemic had nothing todo with the results obtained.
3.3.2 Controlling for the plague and malaria epidemics
However, one might still argue that, if not World War I and influenza, it could well bethat it is the plague and malaria epidemics of the 1901-1911 period that drive the results.To control for that, I propose to verify whether a change in trend of the agricultural castespopulation happened around 1911: if the results obtained are driven by the demographicshocks happening during the 1901-1911 period, then we should see a trend specific to the1901-1911 period, that would not persist after 1911, once the shocks have passed. Hence,if it is plague and malaria that drive the results, the difference in agricultural versus
15
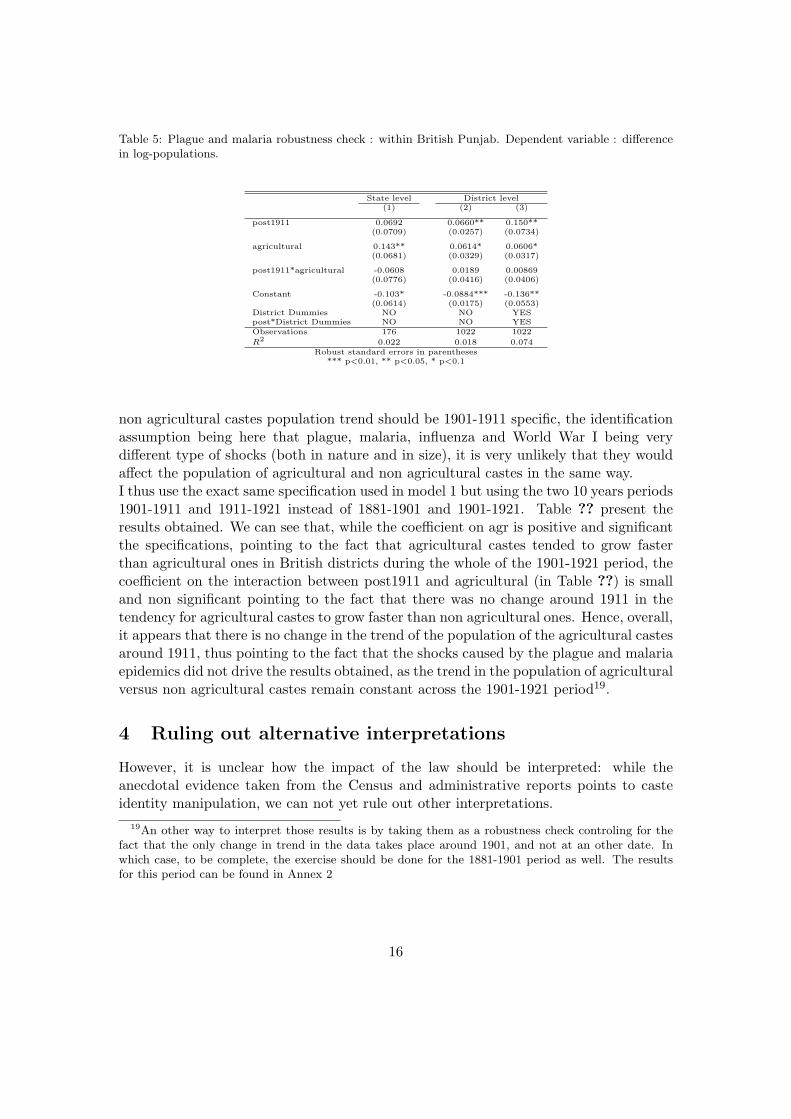
Table 5: Plague and malaria robustness check : within British Punjab. Dependent variable : differencein log-populations.
State level District level(1) (2) (3)
post1911 0.0692 0.0660** 0.150**(0.0709) (0.0257) (0.0734)
agricultural 0.143** 0.0614* 0.0606*(0.0681) (0.0329) (0.0317)
post1911*agricultural -0.0608 0.0189 0.00869(0.0776) (0.0416) (0.0406)
Constant -0.103* -0.0884*** -0.136**(0.0614) (0.0175) (0.0553)
District Dummies NO NO YESpost*District Dummies NO NO YESObservations 176 1022 1022
R2 0.022 0.018 0.074Robust standard errors in parentheses
*** p<0.01, ** p<0.05, * p<0.1
non agricultural castes population trend should be 1901-1911 specific, the identificationassumption being here that plague, malaria, influenza and World War I being verydifferent type of shocks (both in nature and in size), it is very unlikely that they wouldaffect the population of agricultural and non agricultural castes in the same way.I thus use the exact same specification used in model 1 but using the two 10 years periods1901-1911 and 1911-1921 instead of 1881-1901 and 1901-1921. Table ?? present theresults obtained. We can see that, while the coefficient on agr is positive and significantthe specifications, pointing to the fact that agricultural castes tended to grow fasterthan agricultural ones in British districts during the whole of the 1901-1921 period, thecoefficient on the interaction between post1911 and agricultural (in Table ??) is smalland non significant pointing to the fact that there was no change around 1911 in thetendency for agricultural castes to grow faster than non agricultural ones. Hence, overall,it appears that there is no change in the trend of the population of the agricultural castesaround 1911, thus pointing to the fact that the shocks caused by the plague and malariaepidemics did not drive the results obtained, as the trend in the population of agriculturalversus non agricultural castes remain constant across the 1901-1921 period19.
4 Ruling out alternative interpretations
However, it is unclear how the impact of the law should be interpreted: while theanecdotal evidence taken from the Census and administrative reports points to casteidentity manipulation, we can not yet rule out other interpretations.
19An other way to interpret those results is by taking them as a robustness check controling for thefact that the only change in trend in the data takes place around 1901, and not at an other date. Inwhich case, to be complete, the exercise should be done for the 1881-1901 period as well. The resultsfor this period can be found in Annex 2
16
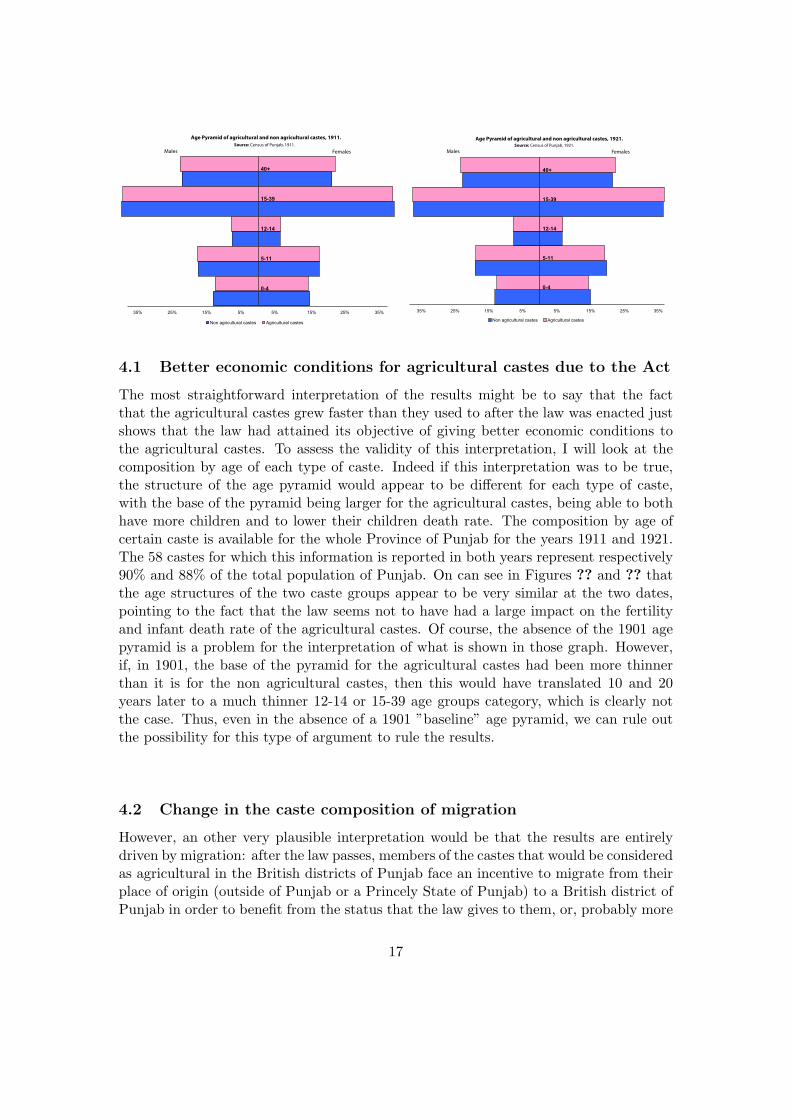
Age Pyramid of agricultural and non agricultural castes, 1911.
35% 25% 15%5%5%15%25%35%
0-4
5-11
12-14
15-39
40+
Non agricultural castes Agricultural castes
Males FemalesSource: Census of Punjab, 1911.
35% 25% 15% 5%5%15%25%35%
0-4
5-11
12-14
15-39
40+
Non agricultural castes Agricultural castes
Age Pyramid of agricultural and non agricultural castes, 1921.
Males FemalesSource: Census of Punjab, 1921.
4.1 Better economic conditions for agricultural castes due to the Act
The most straightforward interpretation of the results might be to say that the factthat the agricultural castes grew faster than they used to after the law was enacted justshows that the law had attained its objective of giving better economic conditions tothe agricultural castes. To assess the validity of this interpretation, I will look at thecomposition by age of each type of caste. Indeed if this interpretation was to be true,the structure of the age pyramid would appear to be different for each type of caste,with the base of the pyramid being larger for the agricultural castes, being able to bothhave more children and to lower their children death rate. The composition by age ofcertain caste is available for the whole Province of Punjab for the years 1911 and 1921.The 58 castes for which this information is reported in both years represent respectively90% and 88% of the total population of Punjab. On can see in Figures ?? and ?? thatthe age structures of the two caste groups appear to be very similar at the two dates,pointing to the fact that the law seems not to have had a large impact on the fertilityand infant death rate of the agricultural castes. Of course, the absence of the 1901 agepyramid is a problem for the interpretation of what is shown in those graph. However,if, in 1901, the base of the pyramid for the agricultural castes had been more thinnerthan it is for the non agricultural castes, then this would have translated 10 and 20years later to a much thinner 12-14 or 15-39 age groups category, which is clearly notthe case. Thus, even in the absence of a 1901 ”baseline” age pyramid, we can rule outthe possibility for this type of argument to rule the results.
4.2 Change in the caste composition of migration
However, an other very plausible interpretation would be that the results are entirelydriven by migration: after the law passes, members of the castes that would be consideredas agricultural in the British districts of Punjab face an incentive to migrate from theirplace of origin (outside of Punjab or a Princely State of Punjab) to a British district ofPunjab in order to benefit from the status that the law gives to them, or, probably more
17
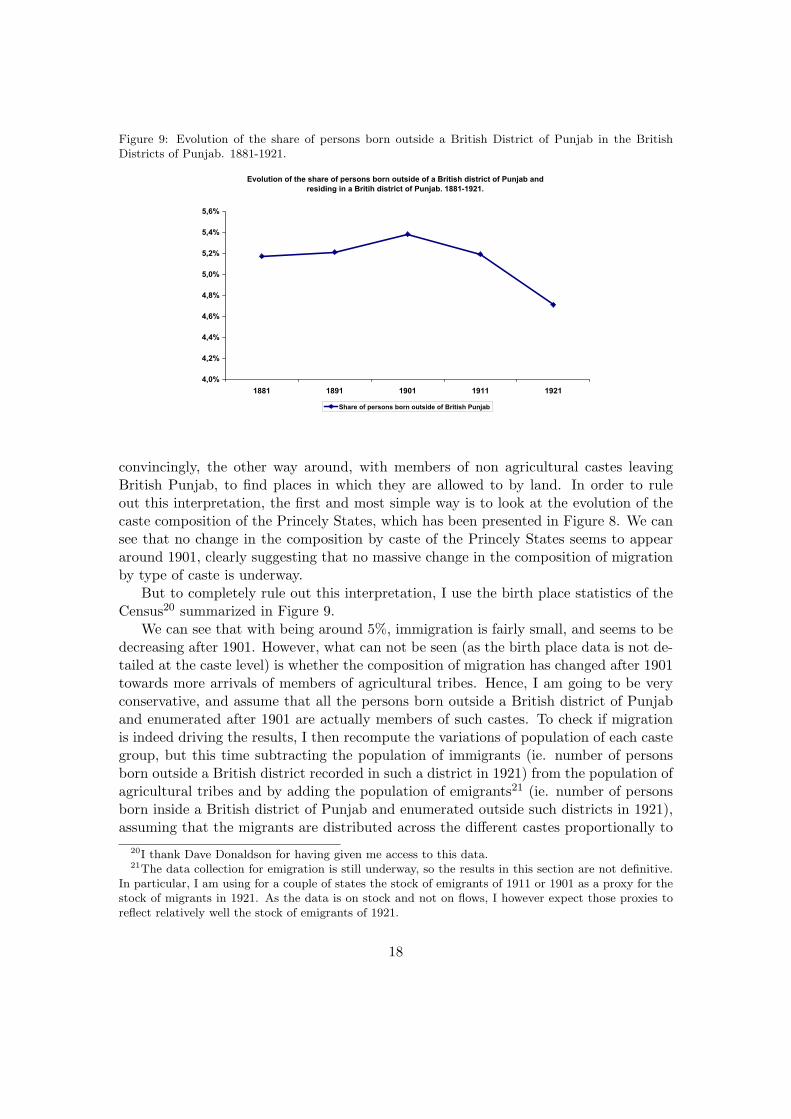
Figure 9: Evolution of the share of persons born outside a British District of Punjab in the BritishDistricts of Punjab. 1881-1921.
Evolution of the share of persons born outside of a British district of Punjab and residing in a Britih district of Punjab. 1881-1921.
4,0%
4,2%
4,4%
4,6%
4,8%
5,0%
5,2%
5,4%
5,6%
1881 1891 1901 1911 1921
Share of persons born outside of British Punjab
convincingly, the other way around, with members of non agricultural castes leavingBritish Punjab, to find places in which they are allowed to by land. In order to ruleout this interpretation, the first and most simple way is to look at the evolution of thecaste composition of the Princely States, which has been presented in Figure 8. We cansee that no change in the composition by caste of the Princely States seems to appeararound 1901, clearly suggesting that no massive change in the composition of migrationby type of caste is underway.
But to completely rule out this interpretation, I use the birth place statistics of theCensus20 summarized in Figure 9.
We can see that with being around 5%, immigration is fairly small, and seems to bedecreasing after 1901. However, what can not be seen (as the birth place data is not de-tailed at the caste level) is whether the composition of migration has changed after 1901towards more arrivals of members of agricultural tribes. Hence, I am going to be veryconservative, and assume that all the persons born outside a British district of Punjaband enumerated after 1901 are actually members of such castes. To check if migrationis indeed driving the results, I then recompute the variations of population of each castegroup, but this time subtracting the population of immigrants (ie. number of personsborn outside a British district recorded in such a district in 1921) from the population ofagricultural tribes and by adding the population of emigrants21 (ie. number of personsborn inside a British district of Punjab and enumerated outside such districts in 1921),assuming that the migrants are distributed across the different castes proportionally to
20I thank Dave Donaldson for having given me access to this data.21The data collection for emigration is still underway, so the results in this section are not definitive.
In particular, I am using for a couple of states the stock of emigrants of 1911 or 1901 as a proxy for thestock of migrants in 1921. As the data is on stock and not on flows, I however expect those proxies toreflect relatively well the stock of emigrants of 1921.
18
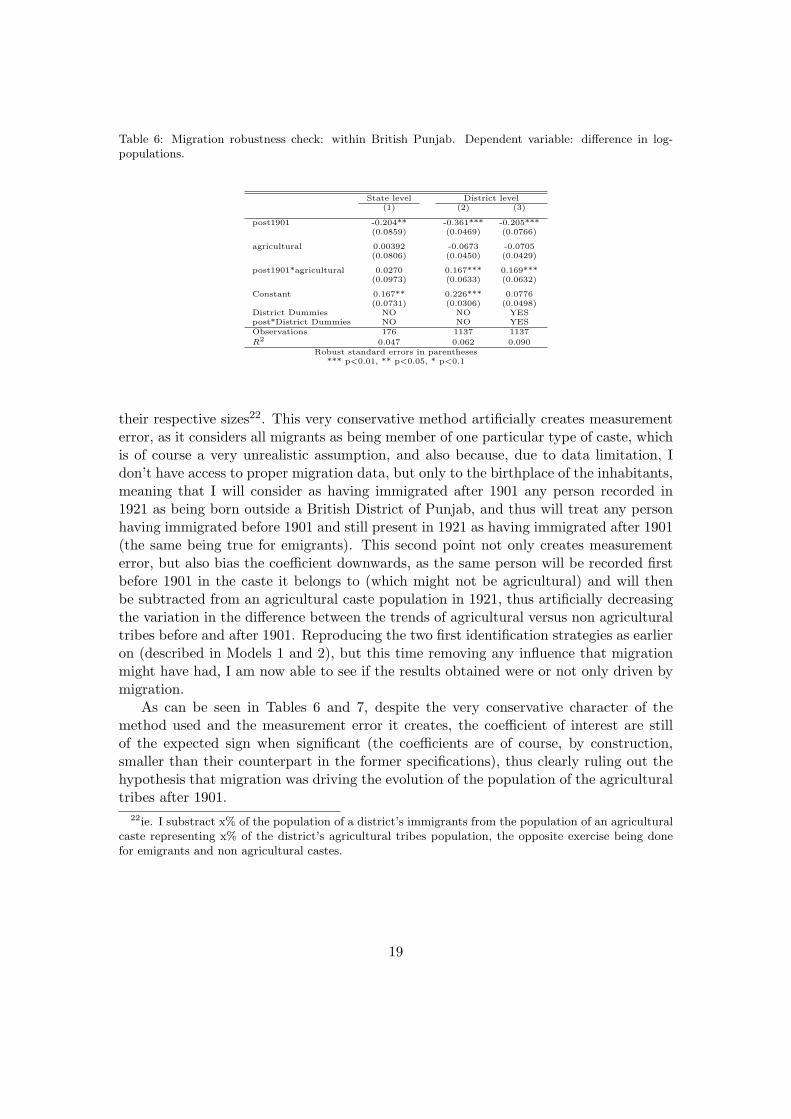
Table 6: Migration robustness check: within British Punjab. Dependent variable: difference in log-populations.
State level District level(1) (2) (3)
post1901 -0.204** -0.361*** -0.205***(0.0859) (0.0469) (0.0766)
agricultural 0.00392 -0.0673 -0.0705(0.0806) (0.0450) (0.0429)
post1901*agricultural 0.0270 0.167*** 0.169***(0.0973) (0.0633) (0.0632)
Constant 0.167** 0.226*** 0.0776(0.0731) (0.0306) (0.0498)
District Dummies NO NO YESpost*District Dummies NO NO YESObservations 176 1137 1137
R2 0.047 0.062 0.090Robust standard errors in parentheses
*** p<0.01, ** p<0.05, * p<0.1
their respective sizes22. This very conservative method artificially creates measurementerror, as it considers all migrants as being member of one particular type of caste, whichis of course a very unrealistic assumption, and also because, due to data limitation, Idon’t have access to proper migration data, but only to the birthplace of the inhabitants,meaning that I will consider as having immigrated after 1901 any person recorded in1921 as being born outside a British District of Punjab, and thus will treat any personhaving immigrated before 1901 and still present in 1921 as having immigrated after 1901(the same being true for emigrants). This second point not only creates measurementerror, but also bias the coefficient downwards, as the same person will be recorded firstbefore 1901 in the caste it belongs to (which might not be agricultural) and will thenbe subtracted from an agricultural caste population in 1921, thus artificially decreasingthe variation in the difference between the trends of agricultural versus non agriculturaltribes before and after 1901. Reproducing the two first identification strategies as earlieron (described in Models 1 and 2), but this time removing any influence that migrationmight have had, I am now able to see if the results obtained were or not only driven bymigration.
As can be seen in Tables 6 and 7, despite the very conservative character of themethod used and the measurement error it creates, the coefficient of interest are stillof the expected sign when significant (the coefficients are of course, by construction,smaller than their counterpart in the former specifications), thus clearly ruling out thehypothesis that migration was driving the evolution of the population of the agriculturaltribes after 1901.
22ie. I substract x% of the population of a district’s immigrants from the population of an agriculturalcaste representing x% of the district’s agricultural tribes population, the opposite exercise being donefor emigrants and non agricultural castes.
19
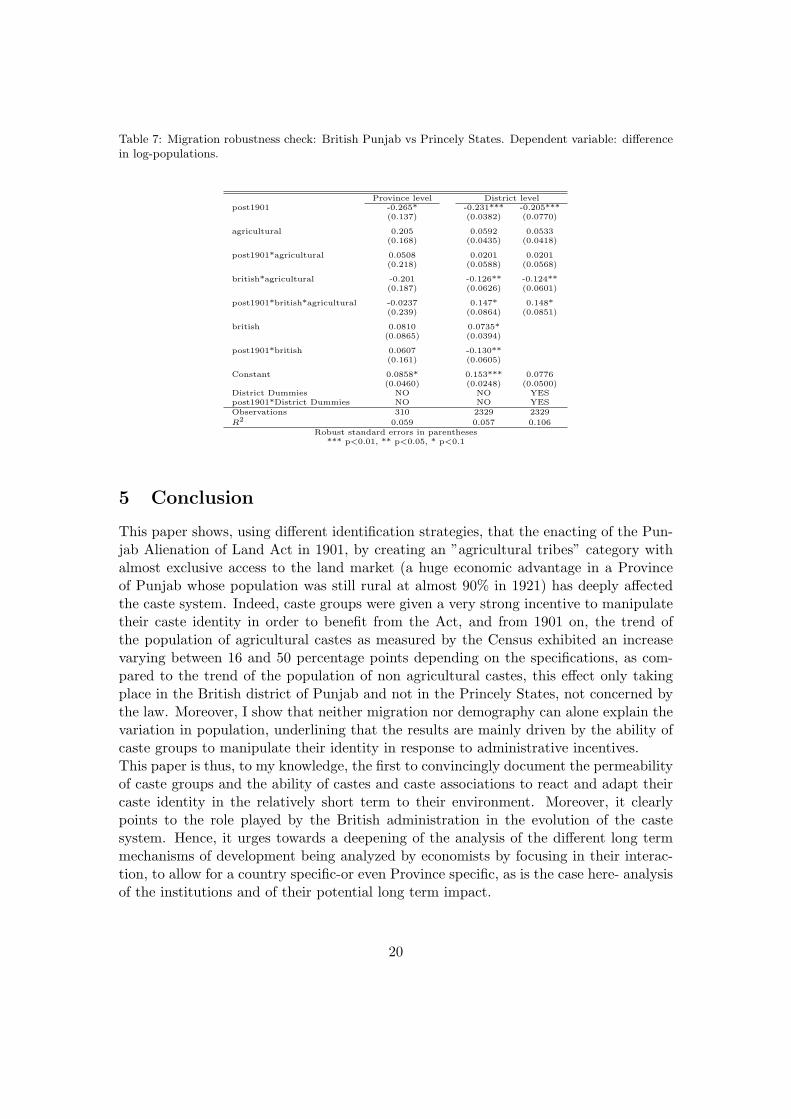
Table 7: Migration robustness check: British Punjab vs Princely States. Dependent variable: differencein log-populations.
Province level District levelpost1901 -0.265* -0.231*** -0.205***
(0.137) (0.0382) (0.0770)
agricultural 0.205 0.0592 0.0533(0.168) (0.0435) (0.0418)
post1901*agricultural 0.0508 0.0201 0.0201(0.218) (0.0588) (0.0568)
british*agricultural -0.201 -0.126** -0.124**(0.187) (0.0626) (0.0601)
post1901*british*agricultural -0.0237 0.147* 0.148*(0.239) (0.0864) (0.0851)
british 0.0810 0.0735*(0.0865) (0.0394)
post1901*british 0.0607 -0.130**(0.161) (0.0605)
Constant 0.0858* 0.153*** 0.0776(0.0460) (0.0248) (0.0500)
District Dummies NO NO YESpost1901*District Dummies NO NO YESObservations 310 2329 2329
R2 0.059 0.057 0.106Robust standard errors in parentheses
*** p<0.01, ** p<0.05, * p<0.1
5 Conclusion
This paper shows, using different identification strategies, that the enacting of the Pun-jab Alienation of Land Act in 1901, by creating an ”agricultural tribes” category withalmost exclusive access to the land market (a huge economic advantage in a Provinceof Punjab whose population was still rural at almost 90% in 1921) has deeply affectedthe caste system. Indeed, caste groups were given a very strong incentive to manipulatetheir caste identity in order to benefit from the Act, and from 1901 on, the trend ofthe population of agricultural castes as measured by the Census exhibited an increasevarying between 16 and 50 percentage points depending on the specifications, as com-pared to the trend of the population of non agricultural castes, this effect only takingplace in the British district of Punjab and not in the Princely States, not concerned bythe law. Moreover, I show that neither migration nor demography can alone explain thevariation in population, underlining that the results are mainly driven by the ability ofcaste groups to manipulate their identity in response to administrative incentives.This paper is thus, to my knowledge, the first to convincingly document the permeabilityof caste groups and the ability of castes and caste associations to react and adapt theircaste identity in the relatively short term to their environment. Moreover, it clearlypoints to the role played by the British administration in the evolution of the castesystem. Hence, it urges towards a deepening of the analysis of the different long termmechanisms of development being analyzed by economists by focusing in their interac-tion, to allow for a country specific-or even Province specific, as is the case here- analysisof the institutions and of their potential long term impact.
20
References
Acemoglu, Daron, Simon Johnson and James Robinson. 2001. “The colonial originsof comparative development: an empirical investigation.” The American EconomicReview 91(5):1369–1401.
Alesina, Alberto and Eliana La Ferrara. 2005. “Ethnic Diversity and economic perfor-mance.” Journal of Economic Literature 43:762–800.
Alesina, Alberto, Reza Baqir and William Easterly. 1999. “Public goods and ethnicdivisions.” The Quaterly journal of economics 114(4):1243–84.
Ali, Imran. 1988. The Punjab under Imperialism, 1885-1947. Oxford University Press.
Assayag, Jackie. 1995. “the making of democratic inequality. Caste, class, lobbies andpolitics in contemporary India (1880-1995).” Pondy Papers in Social Sciences .
Ban, Radu and Vijayendra Rao. 2007. “The political construction of caste in SouthIndia.” working paper .
Banerjee, Abhijit and Lakshmi Iyer. 2005. “History, institutions and economic per-formance: the legacy of colonial land tenure systems in India.” American EconomicReview 95(4):1190–1213.
Banerjee, Abhijit and Rohini Somanathan. 2007. “The political economy of public goods:some evidence from India.” Journal of development economics 82(2):287–314.
Banerjee, Abhijit, Rohini Somanathan and Lakshmi Iyer. 2005. “History, social divisions,and public goods in rural India.” Journal of the European Economic Association 3(2-3):639–647.
Barrier, Norman G. 1966. The Punjab Alienation of Land Bill of 1900. Duke University.
Bayly, Susan. 1999. Caste, society and politics in India. Cambridge University Press.
Chaudhary, Latika. 2006. “Social divisions and public goods provision: evidence fromcolonial India.” working paper 69:269–302.
Chaudhary, Latika. 2009. “Determinants of primary schooling in British India.” Journalof Economic history .
Dirks, Nicholas B. 2001. Castes of Mind. Colonialism and the making of Modern India.Princeton University Press.
Easterly, William and Ross Levine. 1997. “Africa’s growth tragedy: policies and ethnicdivisions.” The Quaterly journal of economics 112(3).
21
Engerman, Stanley and Kenneth Sokoloff. 1997. How Latin America fell behind: Es-says on the economic histories of Brazil and Mexico, 1800-1914. Stanford: StanfordUniversity Press chapter Factor endowments, institutions, and differential paths ofgrowth maong new world economies: a view from economic historans of the UnitedStates, pp. 260–304.
Galor, Oded. 2005. “The demographic transition and the emergence of sustained eco-nomic growth.” Journal of European Economic Association 3(2-3):494–504.
Ghurye, Govinda. 1932. Caste and Race in India. London: Routledge and Kegan Paul.
Hirashima, Shigemochi. 1978. “The structure of disparity in developing agriculture: acase study of the Punjab Pakistan.” Institute of developing economies .
Iyer, Lakshmi. Forthcoming. “Direct versus Indirect Colonial Rule in India: Long-termConsequences.” The Review of Economics and Statistics .
Kaul, Pandit Harikishan. 1912. Report on the Census of Punjab 1911.
Khan, Khan Ahmad Hasan. 1933. Report on the Census of Punjab 1931.
La Porta, Rafael, Florencio Lopez de Silanes, Andrei Shleifer and Robert Vishny. 1999.“The quality of government.” Journal of Law, Economics and Organisation 15(1).
Maclagan, E.D. 1892. Report on the Census of Punjab 1891.
Michalopoulos, Stelios. 2008. “The Origins of Ethnolinguistic Diversity: Theory andEvidence.” working paper .
Miguel, Edward and Mary Kay Gugerty. 2005. “Ethnic diversity, social sanctions andpublic goods in Kenya.” Journal of Public Economics 89(11-12):2325–2368.
Omissi, David. 1994. The sepoy and the raj: the indian army 1860-1948. Mac Millan.
Posner, Daniel. 2005. Institutions and Ethnic politics in Africa. Cambridge UniversityPress.
Posner, Daniel. Forthcoming. The implications of constructivism for studying the re-lationship between ethnic diversity and economic growth. In Ethnicity, politics andeconomics. Chandra, Kanchan (ed).
Punjab Government, ed. 1905. Annual Report on the Punjab Alienation of Land Act, forthe year ending the 30th September 1904. Lahore Civil and Military Gazette Press.
Punjab Government, ed. 1906. Annual Report on the Punjab Alienation of Land Act, forthe year ending the 30th September 1905. Lahore Civil and Military Gazette Press.
Punjab Government, ed. 1907. Annual Report on the Punjab Alienation of Land Act, forthe year ending the 30th September 1906. Lahore Civil and Military Gazette Press.
22
Punjab Government, ed. 1908. Annual Report on the Punjab Alienation of Land Act, forthe year ending the 30th September 1907. Lahore Civil and Military Gazette Press.
Punjab Government, ed. 1909. Annual Report on the Punjab Alienation of Land Act, forthe year ending the 30th September 1908. Lahore Civil and Military Gazette Press.
Risley, Herbert. 1903. Report on the Census of India, 1901.
Rose, H.A. 1901. Report on the Census of Punjab 1901.
Rose, H.A. 1911. Glossary of the Tribes and Castes of the Punjab and North WestFrontier. University of California Press.
Rudolph, Lloyd I. and Susanne Hoeber Rudolph. 1960. “The political role of India’scaste associations.” Pacific Affairs 33(1):5–22.
Said, Edward. 1978. Orientalism. New York : Vintage Books.
Srinivas. 1966. Social Change in Modern India. University of California Press.
Tai Yong, Tan. 2005. The Garrison State: Military, Government and Society in ColonialPunjab, 1849-1947. Sage Publications.
23
Annex 1 : the Punjab Alienation of Land Act
Extract of the Punjab Alienation of Land Act :Sanction of District Officer (Revenue) required to certain permanent alienations. Saveas hereinafter provided a person who desires to make a permanent alienation of his landshall be at liberty to make such alienation where: the alienor is not a member of anagricultural tribe; or the alienor is a member of an agricultural tribe and the alienee isa member of the same tribe or of a tribe in the same group.
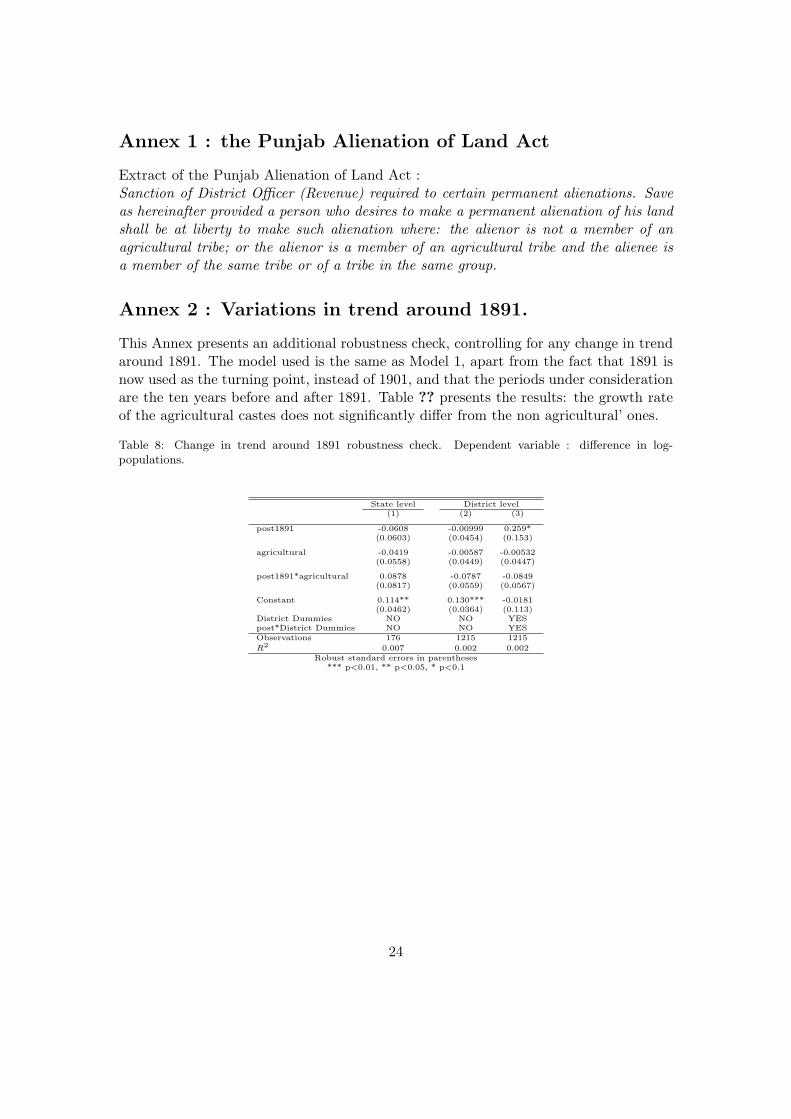
Annex 2 : Variations in trend around 1891.
This Annex presents an additional robustness check, controlling for any change in trendaround 1891. The model used is the same as Model 1, apart from the fact that 1891 isnow used as the turning point, instead of 1901, and that the periods under considerationare the ten years before and after 1891. Table ?? presents the results: the growth rateof the agricultural castes does not significantly differ from the non agricultural’ ones.
Table 8: Change in trend around 1891 robustness check. Dependent variable : difference in log-populations.
State level District level(1) (2) (3)
post1891 -0.0608 -0.00999 0.259*(0.0603) (0.0454) (0.153)
agricultural -0.0419 -0.00587 -0.00532(0.0558) (0.0449) (0.0447)
post1891*agricultural 0.0878 -0.0787 -0.0849(0.0817) (0.0559) (0.0567)
Constant 0.114** 0.130*** -0.0181(0.0462) (0.0364) (0.113)
District Dummies NO NO YESpost*District Dummies NO NO YESObservations 176 1215 1215
R2 0.007 0.002 0.002Robust standard errors in parentheses
*** p<0.01, ** p<0.05, * p<0.1
24