British Airways Plc Annual Report and Accounts … Airways Plc Annual Report and Accounts Year ended...
76
British Airways Plc Annual Report and Accounts Year ended 31 December 2013 Company registration number : 1777777
Transcript of British Airways Plc Annual Report and Accounts … Airways Plc Annual Report and Accounts Year ended...
British Airways Plc
Annual Report and AccountsYear ended 31 December 2013
Company registration number : 1777777
British Airways Plc

Contents
Officers and professional advisers 1
Strategic and directors’ reports Strategic report Management review 2 Financial review 5 Principal risks and uncertainties 8 Directors’ report 10
Directors’ responsibilities statement in relation to the financial statements 12
Independent auditors’ report 13
Group financial statements Group consolidated income statement 14 Group statement of other comprehensive income 15 Balance sheets 16 Cash flow statements 17 Statements of changes in equity 18 Notes to the accounts 19 Operating and financial statistics 68 Fleet table 69 Principal investments 70 Glossary 71 Subsidiary undertakings 72

1
British Airways Plc
Officers and professional advisers Directors Keith Williams (Executive Chairman) Alison Reed (Deputy Chairman) Nick Swift (Chief Financial Officer) Andrew Crawley Frank van der Post Ken Smart Gavin Patterson Garrett Copeland Julia Simpson Secretary Andrew Fleming Registered office Waterside PO Box 365 Harmondsworth UB7 0GB Parent company International Consolidated Airlines Group S.A. Calle Velázquez 130 Madrid, 28006 Spain Independent auditors Ernst & Young LLP 1 More London Place London SE1 2AF
BA AR&A 2013 A4.indd 1BA AR&A 2013 A4.indd 1 03/03/2014 16:3403/03/2014 16:34

2
Strategic report The Directors present their strategic report for the year ended 31 December 2013.
British Airways (‘BA’ or ‘the Group’) is the UK’s largest international scheduled airline and one of the world’s leading global premium airlines. The Group’s principal place of business is London with significant presence at Heathrow, Gatwick and London City airports. Operating one of the most extensive international scheduled airline networks, together with its joint business agreements, code share and franchise partners, BA flies to more than 400 destinations worldwide. BA’s vision is to be the most admired airline. We will do this by delivering outstanding service to engaged customers which, together with strong cost control, will make us financially fit and enable continued investment in great people, great products and the best network. The strategic report is presented in the following three sections:
Management review; Financial review; and Principal risks and uncertainties.
Management review The result for the year has built upon the solid foundation of 2012 with the focus on ensuring that our investments in new products and services deliver for our customers. The most notable highlight was the introduction of two new aircraft types: the Boeing 787 and Airbus A380. The first of each type arrived at Heathrow within a week of one another this summer. The new aircraft are the centrepiece of the Group’s £5 billion investment programme over five years in new aircraft, smarter cabins, elegant lounges and new technologies to make life more comfortable in the air and on the ground. While the Group continues to operate in a challenging environment, there are reasons to believe the UK and the global economy will experience further sustained growth and we are well placed to benefit from this. Tight control of our costs remains vital in order to ensure we remain competitive and can continue to invest. Throughout 2013, the Group’s customer loyalty schemes, the BA Executive Club and Avios, continued to add redemption choices for their expanding customer base including, for the BA Executive Club, the use of Avios for cash discounts. The Avios programme also launched in South Africa. BA Holidays had another strong year driven by investment in dedicated marketing and product range expansion. As a result of the increased investment and focus, the business has become increasingly competitive in the traditional tour operating market.
New aircraft and investment in our product where it matters most In 2013, BA accepted delivery of nine new long-haul aircraft (four Boeing 787 Dreamliners, three Airbus A380s and two Boeing 777-300 ERs). We were the first airline in Europe to operate both the Boeing 787 and Airbus A380 and we are capitalising on this to enhance our customer proposition. The customer reviews of our Airbus A380s are positive, particularly how the space onboard is used to enhance our service. A key advantage over other aircraft types is in connecting congested airports on busy routes. We are currently operating to Los Angeles, Hong Kong and Johannesburg and will start services to Washington D.C. and Singapore later in 2014. Customers were also complimentary about the Boeing 787, particularly the cabin environment. The new aircraft fits into the fleet well as it can achieve new levels of operational efficiency and environmental performance, opening route and frequency possibilities that would not otherwise exist. The aircraft currently flies to Newark and Toronto and will start services to Austin, Hyderabad, Chengdu, Philadelphia and Calgary in 2014. 2014 will see the delivery of a further 26 new aircraft. As well as enhancing our product and offering us some significant efficiencies, these aircraft will help improve operational stability as we retire our older fleet. Included in the 2014 deliveries are three Embraer aircraft that will be placed into service in our London City Airport operations which will enable new routes to be launched and extra frequencies added to existing routes. The Group’s continuing fleet replacement programme saw 18 Airbus A350 and 18 Boeing 787-900 aircraft ordered during 2013, to be delivered over the next 10 years. Lounges have been opened in Belfast, Glasgow, Edinburgh and Cape Town and an enhanced spa experience was unveiled this year in our Heathrow and JFK lounges. BA continued to expand its network in 2013. New routes started to Colombo in Sri Lanka in April, Chengdu in China’s Sichuan province in September and London City’s inaugural flight to Granada took place in July. In 2014, BA has announced ten new routes to further expand the network.
BA AR&A 2013 A4.indd 2BA AR&A 2013 A4.indd 2 03/03/2014 16:3403/03/2014 16:34

3
Strategic report continued Use technology to enhance customer engagement BA became the first airline in Europe to allow its customers to use their handheld electronic devices during taxiing, take-off and landing following acceptance of the procedures by the Civil Aviation Authority. The airline was able to demonstrate that the changes complied with all existing safety rules and regulations.
Deliver our brand – all of us, all the time We are aware that running a robust operation is crucial for meeting our customers’ expectations and delivering a cost-effective business. We monitor our operational performance through a broad range of measures at many levels. Departure punctuality is our primary measure, as high performance here requires other operational processes to run smoothly and also because it is a significant driver of customer satisfaction. In 2013, 76 per cent of flights departed within 15 minutes of the scheduled departure time compared to 79% in 2012. We are looking to improve this level of punctuality and there are a wide-range of initiatives underway across the airline. We have continued to employ the use of technology to improve customer service. All our senior cabin crew have been given iPads which enables them to provide insight into customers’ preferences across a wide range of areas, from special meal requests to onward travel plans. This autumn we began to roll out very similar systems for ground colleagues in our main home, Heathrow Terminal 5. This allows our staff to deliver a bespoke service to customers with information at their fingertips and ensures we can provide up-to-date information in times of disruption.
Grow our lead in London The BA brand had a successful year in 2013 maintaining the high level brand bonding scores achieved in 2012 when the airline played a significant role in the London 2012 Olympic and Paralympic Games. In the well-respected Superbrands survey of 2013, BA was the second ranked business brand behind Apple. For consumer superbrands, BA was ranked number one in 2014 and came fourth in 2013, behind Rolex, Microsoft and Apple. We were also named the top airline brand of the year. BA overtook Virgin Atlantic to become Britain’s favourite carrier, according to a YouGov survey. The market research company uses surveys to measure the public perception of hundreds of brands every day, drawing its data from seven different measurement systems. Furthermore, figures from BrandIndex, which independently measures the perception of thousands of brands, show that BA led the way among airlines when it came to customer consideration and most likely to purchase indices. The airline has also received numerous awards throughout the year, including: best short-haul airline in the Telegraph Travel Awards; best airline for customer service in the British Travel Awards; best airline, best short-haul carrier, best first class, best frequent flyer programme and best airport lounge awards at the Business Traveller Awards; and best long-haul and best short-haul airline in The Sunday Times travel awards.
Growing revenue with our airline partners BA continues to look at increasing its range of fares for customers. In 2013 BA introduced two new short-haul fares called Semi-Flex and Hand Baggage Only to add to its existing Club Europe and Euro Traveller. Both have been designed to match the needs of short-haul customers, offering them wider choice and more flexibility. The new fares allow BA to broaden its appeal to a wider customer base targeting the price conscious who still want a premium travel experience. Following sponsorship by BA, Qatar Airways joined the oneworld alliance, substantially strengthening the alliance’s customer offering by adding 20 new destinations and five new countries to the alliance’s network. Malaysian Airlines also joined the alliance, adding 16 new destinations and two new countries. oneworld partner American Airlines merged with US Airways at the end of the year. The newly-created airline, which will serve more than 330 destinations worldwide, will continue to be a member of the oneworld alliance and is expected to bring benefits to our transatlantic joint business. The Japanese government has approved the addition of Finnair to the existing joint business between Japan Airlines and BA. The agreement allows all three airlines to co-operate commercially on flights between Europe and Japan. BA and Cathay Pacific entered a codeshare agreement for flights to Australia in March. The arrangements mean that BA customers travelling to and from Australia can connect via Hong Kong to flights operated by Cathay Pacific and bearing BA flight numbers.
Where appropriate, BA will continue to seek to deepen other partnerships through the extension of codeshare relationships and the development of joint businesses. The airline continues to be committed to the future development of the oneworld alliance and looks forward to welcoming TAM Airlines and Sri Lankan Airlines in 2014.
BA AR&A 2013 A4.indd 3BA AR&A 2013 A4.indd 3 03/03/2014 16:3403/03/2014 16:34

4
Strategic report continued
Make our costs competitive The continuing high price of fuel, which accounts for more than a third of our costs, means it is essential that we maintain a strong focus on controlling other costs. In 2013, non-fuel unit costs were flat compared to 2012 on a constant currency basis. This continues to be an area of focus for the business. The new aircraft joining our fleet will help drive c. £140 million of fuel efficiencies per annum by 2015. The airline has played its part in the Civil Aviation Authority-led quinquennial review on airport pricing, which has led to a proposal that charges at London Heathrow be capped at a rise of 1.5% below RPI for the next five years. Our priority is to ensure that airport users get value for money from the charges they pay. The charges at our home base of Heathrow have tripled in the last 10 years which has made it the most expensive airport hub in the world. We want airport operators to deliver an effective, timely service to our customers at a fair price. IAG has committed to deliver €650 million in synergies across the combined business by 2015, up from the previous target of €560 million which will come from a mix of revenue and cost benefits. As of 31 December 2013, IAG has delivered €461 million of which €265 million (€243 million net of implementation cost) of synergy benefits is attributed to BA.
Setting the standard for responsible aviation BA continues to lead the industry in adopting a responsible approach to the environmental impact of aviation. This is not only imperative for the environment, but is the right financial approach when faced with high fuel costs, and it is an increasingly important consideration for customers. The airline is working to establish Europe’s first sustainable bio-jet plant with US energy company Solena Fuels Corporation, which is expected to power some of BA’s planes from around 2017. The airline has committed to purchasing sustainable fuel from the plant at market competitive rates. BA was named as the quietest airline at Heathrow for short-haul operations as part of the airport’s new Fly Quiet programme. The airline has a noise reduction target to reduce the average noise per flight by 15 per cent by 2018. Following the devastating damage in the Philippines caused by Typhoon Haiyan, BA sent a Boeing 747 freighter carrying almost 120 tonnes of cargo in order to aid the relief effort.
Community investment In 2010, BA launched Flying Start, a charity partnership with Comic Relief. The aim was ambitious – to raise £6 million and change the lives of children worldwide. This year, we raised a further £2.5 million meaning we have now surpassed our £6 million target with thanks to our customers and the efforts of colleagues across the airline who have taken part in fundraising events.
Culture and capabilities for success BA recognises that its most valuable asset is its people. Genuine and effective engagement with colleagues is key and enables them to provide a service which puts the customer first and helps make BA a great place to work. The 2013 employee opinion survey, “Speak Up”, has seen some strong scores and great progress has been made in areas such as leadership visibility and communication. We now need to maintain focus and work together to build upon this year’s progress. The airline’s apprenticeship programme goes from strength to strength with almost 200 apprentices recruited during the year. Since BA introduced its Heathrow Engineering apprenticeship schemes in 2010, almost 350 apprentices have been recruited. The airline now offers a range of 10 different schemes, including IT, Operations, World Cargo, People Services and Finance Services. Forty places were offered on the 2013 Graduate Scheme in seven areas of the business, including operational research, engineering, IT, finance and procurement. The airline’s commitment to recruit top graduate talent highlights the important role that graduates are expected to play in shaping the future of the airline.
Outlook BA has made significant progress in 2013. Our aim is to maintain momentum and deliver value for our shareholder, invest for our customers, improve our punctuality and make BA a great place to work.
BA AR&A 2013 A4.indd 4BA AR&A 2013 A4.indd 4 03/03/2014 16:3403/03/2014 16:34
5
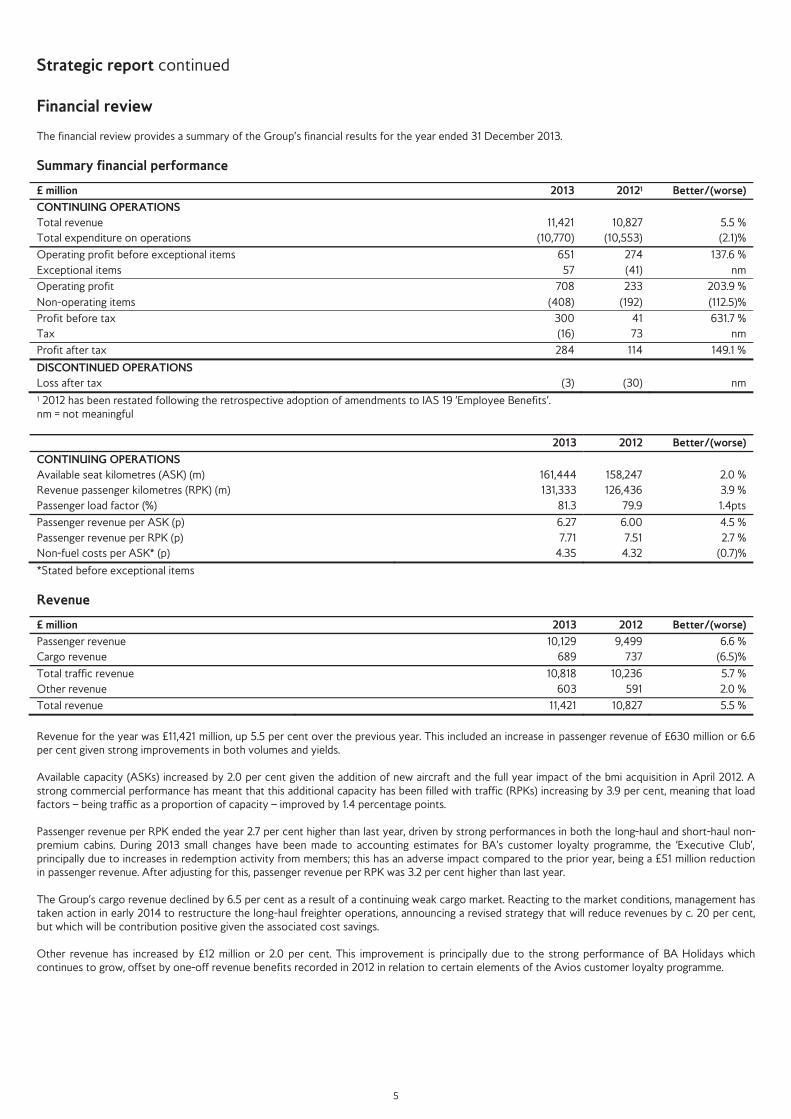
Strategic report continued Financial review The financial review provides a summary of the Group’s financial results for the year ended 31 December 2013.
Summary financial performance
1 2012 has been restated following the retrospective adoption of amendments to IAS 19 ‘Employee Benefits’. nm = not meaningful 2013 2012 Better/(worse) CONTINUING OPERATIONS Available seat kilometres (ASK) (m) 161,444 158,247 2.0 % Revenue passenger kilometres (RPK) (m) 131,333 126,436 3.9 % Passenger load factor (%) 81.3 79.9 1.4pts
Passenger revenue per ASK (p) 6.27 6.00 4.5 % Passenger revenue per RPK (p) 7.71 7.51 2.7 % Non-fuel costs per ASK* (p) 4.35 4.32 (0.7)%
*Stated before exceptional items
Revenue
£ million 2013 2012 Better/(worse) Passenger revenue 10,129 9,499 6.6 % Cargo revenue 689 737 (6.5)%
Total traffic revenue 10,818 10,236 5.7 % Other revenue 603 591 2.0 %
Total revenue 11,421 10,827 5.5 %
Revenue for the year was £11,421 million, up 5.5 per cent over the previous year. This included an increase in passenger revenue of £630 million or 6.6 per cent given strong improvements in both volumes and yields. Available capacity (ASKs) increased by 2.0 per cent given the addition of new aircraft and the full year impact of the bmi acquisition in April 2012. A strong commercial performance has meant that this additional capacity has been filled with traffic (RPKs) increasing by 3.9 per cent, meaning that load factors – being traffic as a proportion of capacity – improved by 1.4 percentage points. Passenger revenue per RPK ended the year 2.7 per cent higher than last year, driven by strong performances in both the long-haul and short-haul non-premium cabins. During 2013 small changes have been made to accounting estimates for BA's customer loyalty programme, the ‘Executive Club’, principally due to increases in redemption activity from members; this has an adverse impact compared to the prior year, being a £51 million reduction in passenger revenue. After adjusting for this, passenger revenue per RPK was 3.2 per cent higher than last year. The Group’s cargo revenue declined by 6.5 per cent as a result of a continuing weak cargo market. Reacting to the market conditions, management has taken action in early 2014 to restructure the long-haul freighter operations, announcing a revised strategy that will reduce revenues by c. 20 per cent, but which will be contribution positive given the associated cost savings. Other revenue has increased by £12 million or 2.0 per cent. This improvement is principally due to the strong performance of BA Holidays which continues to grow, offset by one-off revenue benefits recorded in 2012 in relation to certain elements of the Avios customer loyalty programme.
£ million 2013 20121 Better/(worse) CONTINUING OPERATIONS Total revenue 11,421 10,827 5.5 % Total expenditure on operations (10,770) (10,553) (2.1)%
Operating profit before exceptional items 651 274 137.6 % Exceptional items 57 (41) nm
Operating profit 708 233 203.9 % Non-operating items (408) (192) (112.5)%
Profit before tax 300 41 631.7 % Tax (16) 73 nm
Profit after tax 284 114 149.1 %
DISCONTINUED OPERATIONS Loss after tax (3) (30) nm
BA AR&A 2013 A4.indd 5BA AR&A 2013 A4.indd 5 03/03/2014 16:3403/03/2014 16:34

6
Strategic report continued
Operating costs £ million 2013 2012 Better/(worse) Employee costs 2,387 2,345 (1.8)% Restructuring 5 36 nm Depreciation, amortisation and impairment 722 720 (0.3)% Aircraft operating lease costs 85 98 13.3% Fuel, oil and emission costs 3,755 3,712 (1.2)% Engineering and other aircraft costs 643 625 (2.9)% Landing fees and en route charges 790 726 (8.8)% Handling charges, catering and other operating costs 1,340 1,213 (10.5)% Selling costs 439 466 5.8% Currency differences 28 (1) nm Accommodation, ground equipment and IT costs 576 613 6.0%
Total Group expenditure on operations* 10,770 10,553 (2.1)% Total Group expenditure excluding fuel* 7,015 6,841 (2.5)%
*Stated before exceptional items. nm = not meaningful Fuel costs increased year-on-year by £43 million to £3,755 million compared to £3,712 million in the prior year. The increase is mainly attributed to the increase in volume and impact of foreign exchange, offset by a reduction in the average fuel price and an increase in fuel efficiency. Underlying non-fuel costs have increased by £174 million to £7,015 million, or a 2.5 per cent increase. Given that ASKs increased by 2.0 per cent, this represents a 0.7 per cent increase in non-fuel costs per ASK. Part of this increase is due to the unfavourable impact of foreign currency exchange rates, at a constant exchange rate non-fuel costs per ASKs were flat compared to the prior year. Consistent with the increasing revenue trend, landing fees have increased due to increased volume, although there have also been price increases across the network which have had an adverse impact on unit costs. Handling charges, catering and other operating costs have increased in line with the increase in volume, but have also increased due to the incremental activity of BA Holidays, which has generated additional revenues that do not contribute to ASKs. Exceptional items Exceptional items represent a net income of £57 million in 2013 (2012: £41 million net loss). During the year, management made changes to a medical benefit plan available to US colleagues following their retirement, reducing the value of the benefits available and phasing the scheme out. These changes have yielded a one-off gain of £143 million. The Group has also reviewed management estimates applied to the frequent flyer programme, with improvements in data tracking now allowing for the recognition of revenue on departure date rather than at booking. This delay in revenue recognition has increased the frequent flyer liability. The exceptional charge of £86 million represents the prior period impact of this increase. Exceptional items in 2012 related to the impact of business combination transactions that do not contribute to the on-going results of the Group (£71 million charge) and the release of a provision following the settlement of a fine with the Office of Fair Trading in the UK relating to investigations into passenger fuel surcharges (£30 million gain). Non-operating income and expenditure In total, non-operating income and expenditure are an expense of £408 million in the current year (2012 restated: £192 million) an increase of £216 million. The two principal changes in non-operating income and costs were a one-off £58 million gain on bargain purchase in 2012 arising from the acquisition of bmi and the revaluation of the convertible bond liability giving rise to a £164 million charge (2012: £10 million charge). The convertible bond derivative liability represents the cost of buying shares in IAG to settle BA’s obligation to the bondholders of the £350 million 5.8% convertible bond, convertible into ordinary shares of IAG at the option of the holder, before or upon maturity in August 2014. BA had the option to redeem the bonds early at their principal amount if the IAG share price, over a pre-determined period of time, exceeded 283.5p. This happened in August 2013 and as a result, all bondholders exercised their conversion rights. The derivative liability increased by £164 million to £226 million (2012: £62 million derivative liability), being the difference between the outstanding £349 million bond principal and the cost of the IAG shares of £575 million.
BA AR&A 2013 A4.indd 6BA AR&A 2013 A4.indd 6 03/03/2014 16:3403/03/2014 16:34
7
Strategic report continued
Taxation The tax charge on continuing operations for the year ended 31 December 2013 was £16 million (2012 restated: £73 million credit). This included a deferred tax credit of £103 million (2012: £73 million) arising from reductions to the UK rate of corporation tax substantively enacted in the year. The Group profit before tax was £300 million but is stated after two items for which no corporation tax is reflected in the financial statements: a loss of £65 million from the post-tax share of associates; and a £164 million loss on the revaluation of the convertible bond. After adjusting for these items and the changes in tax rates, the Group’s effective tax rate was 22 per cent, compared to the UK corporation tax rate of 23.25 per cent. The adoption of amendments to IAS 19 ‘Employee Benefits’, gave rise to a restated net deferred tax liability of £216 million as at 31 December 2012 as a result of actuarial losses that are now recognised. During the year, the net deferred tax liability has increased by £228 million to £444 million, primarily resulting from a reduction in deferred tax assets related to the pension liabilities given significant actuarial gains recognised in the year.
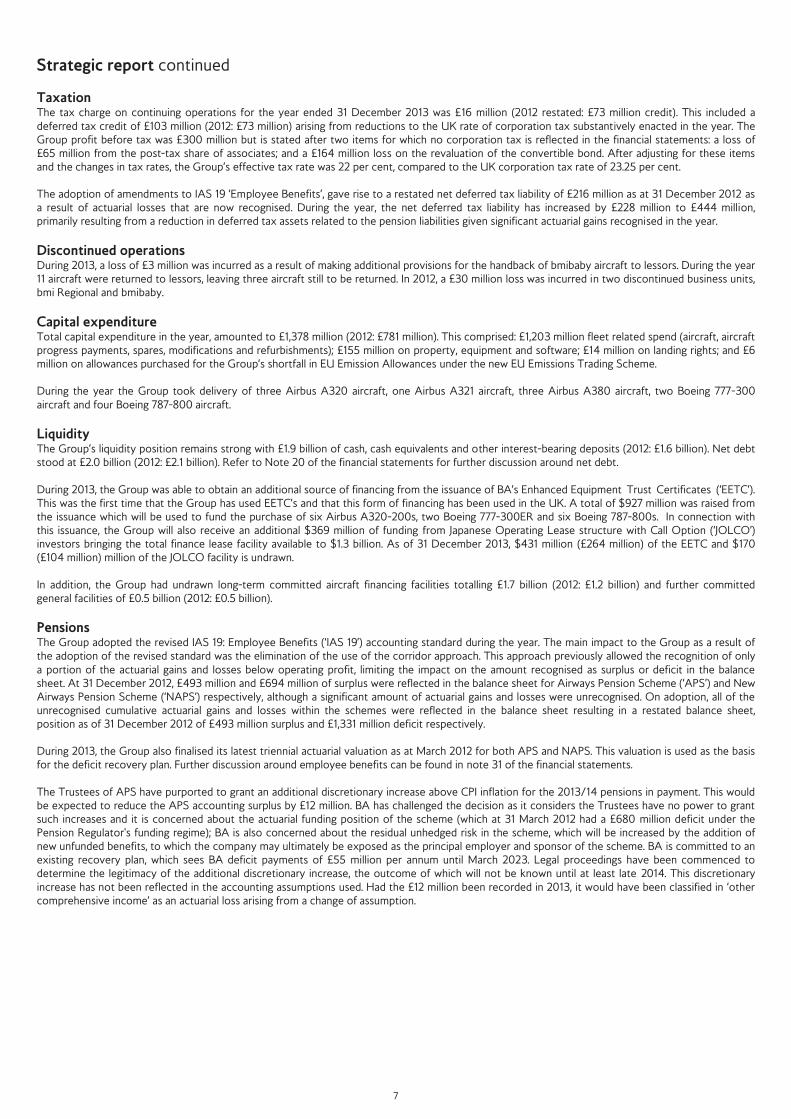
Discontinued operations During 2013, a loss of £3 million was incurred as a result of making additional provisions for the handback of bmibaby aircraft to lessors. During the year 11 aircraft were returned to lessors, leaving three aircraft still to be returned. In 2012, a £30 million loss was incurred in two discontinued business units, bmi Regional and bmibaby.
Capital expenditure Total capital expenditure in the year, amounted to £1,378 million (2012: £781 million). This comprised: £1,203 million fleet related spend (aircraft, aircraft progress payments, spares, modifications and refurbishments); £155 million on property, equipment and software; £14 million on landing rights; and £6 million on allowances purchased for the Group’s shortfall in EU Emission Allowances under the new EU Emissions Trading Scheme. During the year the Group took delivery of three Airbus A320 aircraft, one Airbus A321 aircraft, three Airbus A380 aircraft, two Boeing 777-300 aircraft and four Boeing 787-800 aircraft.
Liquidity The Group’s liquidity position remains strong with £1.9 billion of cash, cash equivalents and other interest-bearing deposits (2012: £1.6 billion). Net debt stood at £2.0 billion (2012: £2.1 billion). Refer to Note 20 of the financial statements for further discussion around net debt. During 2013, the Group was able to obtain an additional source of financing from the issuance of BA’s Enhanced Equipment Trust Certificates (‘EETC’). This was the first time that the Group has used EETC’s and that this form of financing has been used in the UK. A total of $927 million was raised from the issuance which will be used to fund the purchase of six Airbus A320-200s, two Boeing 777-300ER and six Boeing 787-800s. In connection with this issuance, the Group will also receive an additional $369 million of funding from Japanese Operating Lease structure with Call Option (‘JOLCO’) investors bringing the total finance lease facility available to $1.3 billion. As of 31 December 2013, $431 million (£264 million) of the EETC and $170 (£104 million) million of the JOLCO facility is undrawn. In addition, the Group had undrawn long-term committed aircraft financing facilities totalling £1.7 billion (2012: £1.2 billion) and further committed general facilities of £0.5 billion (2012: £0.5 billion).
Pensions The Group adopted the revised IAS 19: Employee Benefits (‘IAS 19’) accounting standard during the year. The main impact to the Group as a result of the adoption of the revised standard was the elimination of the use of the corridor approach. This approach previously allowed the recognition of only a portion of the actuarial gains and losses below operating profit, limiting the impact on the amount recognised as surplus or deficit in the balance sheet. At 31 December 2012, £493 million and £694 million of surplus were reflected in the balance sheet for Airways Pension Scheme (‘APS’) and New Airways Pension Scheme (‘NAPS’) respectively, although a significant amount of actuarial gains and losses were unrecognised. On adoption, all of the unrecognised cumulative actuarial gains and losses within the schemes were reflected in the balance sheet resulting in a restated balance sheet, position as of 31 December 2012 of £493 million surplus and £1,331 million deficit respectively. During 2013, the Group also finalised its latest triennial actuarial valuation as at March 2012 for both APS and NAPS. This valuation is used as the basis for the deficit recovery plan. Further discussion around employee benefits can be found in note 31 of the financial statements. The Trustees of APS have purported to grant an additional discretionary increase above CPI inflation for the 2013/14 pensions in payment. This would be expected to reduce the APS accounting surplus by £12 million. BA has challenged the decision as it considers the Trustees have no power to grant such increases and it is concerned about the actuarial funding position of the scheme (which at 31 March 2012 had a £680 million deficit under the Pension Regulator's funding regime); BA is also concerned about the residual unhedged risk in the scheme, which will be increased by the addition of new unfunded benefits, to which the company may ultimately be exposed as the principal employer and sponsor of the scheme. BA is committed to an existing recovery plan, which sees BA deficit payments of £55 million per annum until March 2023. Legal proceedings have been commenced to determine the legitimacy of the additional discretionary increase, the outcome of which will not be known until at least late 2014. This discretionary increase has not been reflected in the accounting assumptions used. Had the £12 million been recorded in 2013, it would have been classified in ‘other comprehensive income’ as an actuarial loss arising from a change of assumption.
BA AR&A 2013 A4.indd 7BA AR&A 2013 A4.indd 7 03/03/2014 16:3403/03/2014 16:34
8
Strategic report continued
Principal risks and uncertainties The highly regulated and commercially competitive environment, together with operational complexity, leaves the Group exposed to a number of significant risks. The focus remains on mitigating these risks at all levels in the business, although many remain outside our control such as government regulation, taxes, terrorism, adverse weather, pandemics and availability of funding from the financial markets. The risks and uncertainties described below are the ones that are expected to have the most significant impact on the Group. The list presented is not intended to be exhaustive. The Group carries out detailed risk management reviews to ensure that the risks are mitigated where possible. Strategic Competition The markets in which the Group operates are highly competitive. Direct competition is faced from other airlines on routes, as well as from indirect flights, charter services and from other modes of transport. Competitor capacity growth in excess of demand growth could materially impact our margins. Some competitors have cost structures that are lower than BA or have other competitive advantages such as being supported by government intervention or benefiting from insolvency protection. Fare discounting by some competitors has historically had a negative effect on the Group’s results because a response is generally required to competitors’ fares to maintain passenger traffic. The Group’s strong global market positioning, leadership in strategic markets, alliances and diverse customer base continues to address this risk. Consolidation and deregulation As noted above, the airline market is fiercely competitive and will need to continue to rationalise given the current market conditions. This may involve further airline failures and consolidation leading to opportunities to capture market share and expand the Group. Mergers and acquisitions amongst competitors have the potential to adversely affect market position and revenue. The Group maintains rigorous cost control and targeted product investment to remain competitive. The airline industry is increasingly dependent on alliances and BA is no exception to this. Maintaining a leading presence in oneworld and ensuring the alliance itself performs as expected by the members is key in safeguarding the network. Negotiations with joint business partners are an integral part of alliance relationships and the outcome of these are uncertain. Some of the markets in which the Group operates remain regulated by governments, in some instances controlling capacity and/or restricting market entry. Relaxation of such restrictions, while creating growth opportunities for the Group, may have a negative impact on margins. Government intervention Regulation of the airline industry is increasing and covers many of the Group’s activities including safety, security, route flying rights, airport slot access and environmental controls. The ability to both comply with and influence any changes in these regulations is key to maintaining performance. Continued plans by the UK Government to increase Air Passenger Duty at the same time as the commencement of the European Union Emissions Trading Scheme, coupled with the potential for other environmental taxes imposed in other jurisdictions, may have an adverse impact upon demand for air travel and/or reduce the profit margin per ticket. These taxes may also benefit BA’s competitors by reducing the relative cost of doing business from their respective hubs. Infrastructure constraints Heathrow has no spare runway capacity and has operated on the same two main runways since it opened over 60 years ago. As a result, the Group is vulnerable to short-term operational disruption and there is little that can be done to mitigate this. BA continues to promote the expansion of the airport to create extra capacity and reduce delays, enabling Heathrow to compete more effectively against the major European hubs. Business and operational Brand reputation BA’s brand has significant commercial value. Erosion of the brand, through either a single event or series of events, may adversely impact the Company’s leadership position with customers and could ultimately affect future revenue and profitability. The Group regularly monitors customer satisfaction through the global monthly Customer Voice survey, alongside ongoing research and development of the BA product, in order to mitigate this risk. BA allocates substantial resources to safety, operational integrity, on-board product and new aircraft to maintain its leadership position. Economic conditions The Group’s revenue is highly sensitive to economic conditions in the markets operated in. Deterioration in either the domestic and/or global economy may have a material impact on the reported financial position. BA is exposed to any contraction in the economy resulting from management of the fiscal deficit issues in Europe and the USA. Employee relations BA has a large unionised workforce. Collective bargaining takes place on a regular basis and a breakdown in the bargaining process may disrupt operations and adversely affect business performance. Failure of a critical IT system BA is dependent on IT systems for most of the principal business processes. The failure of a key system may cause significant disruption to operations and result in lost revenue. System controls, disaster recovery and business continuity arrangements exist to mitigate the risk of a critical system failure.
BA AR&A 2013 A4.indd 8BA AR&A 2013 A4.indd 8 03/03/2014 16:3403/03/2014 16:34

9
Strategic report continued Pandemic If there is a significant outbreak of swine flu or other infectious disease, staff absence will increase which may seriously impact the operation. Key corporate clients may discourage travel, significantly impacting sales. The Group has comprehensive pandemic business continuity plans that were last used during the 2009 swine flu outbreak. Landing fees and security charges Airport, transit and landing fees and security charges represent a significant operating cost to BA and have an impact on operations. Whilst certain airport and security charges are passed on to passengers by way of surcharges, others are not. There can be no assurance that such costs will not increase or that the Group will not incur new costs in the UK or elsewhere. Charges at BA’s London hubs from April 2014 have been determined by the Civil Aviation Authority. At Heathrow, the proposal is for charges to be capped at a rise of 1.5% below inflation for the next five years. At Gatwick, rises are expected at 1% below inflation. There is a risk that development plans will not be delivered, or future infrastructure investment will be prioritised in a way that benefits other airport users ahead of the Group’s interests. BA is constructively engaged in the review process. Safety/security incidents The safety and security of customers and employees are fundamental values for BA. Failure to prevent or respond effectively to a major safety or security incident may adversely impact operations and financial performance. The Safety Committee satisfies itself that BA has appropriate safety resources and procedures. The Operations Control Incident Centre responds in a structured way in the event of an incident. Event causing significant network disruption Several possible events may cause a significant network disruption. Example scenarios include a major failure of the public transport system, the complete or partial loss of the use of terminals at Heathrow, adverse weather conditions (such as snow, fog or volcanic ash), widespread or coordinated air traffic control industrial action, war, civil unrest or terrorism. Such a disruption may result in lost revenue and additional cost. Management has implemented robust business continuity plans to mitigate these risks to the extent feasible. Financial Financial risk management objectives, policies and procedures The Group is exposed to a variety of financial risks, including market risk, credit risk, capital risk and liquidity risk. The overall risk management programme focuses on the unpredictability of financial markets and seeks to minimise potential adverse effects on financial performance. The BA Board approves prudent treasury policies and delegates certain responsibilities to senior management, who directly control day-to-day treasury operations and operate within clearly defined parameters. The financial risks faced by the Group are covered in note 26 to the financial statements. Debt funding The Group carries substantial debt that needs to be repaid or refinanced. The ability to finance ongoing operations and committed future fleet growth plans is vulnerable to various factors including financial market conditions and financial institutions’ appetite for secured aircraft financing. The Group carries substantial cash reserves and committed financing facilities to mitigate the risk of short-term interruptions to the aircraft financing market. Fuel price The Group used approximately 5.6 million tonnes of jet fuel in 2013. Volatility in the price of oil and petroleum products can have a material impact on the Group’s operating results. This price risk is partially hedged through the purchase of oil derivatives in forward markets, which can generate a profit or a loss. The financial risks faced by the Group are covered in more detail in note 26 to the financial statements. Pensions Negative movements in pension asset values and financial returns from these assets may increase the size of the pension deficit. Management regularly reviews the status of the pension funds and remains committed to appropriate action. Compliance and regulatory Compliance with Competition, Bribery and Corruption Law The Group is exposed to the risk of individual employee’s or groups of employees’ unethical behaviour resulting in fines or losses to the Group. The Group has comprehensive policies and training schemes in place to educate colleagues. The Strategic report is approved by the Board and signed on its behalf by Keith Williams Nick Swift Executive Chairman Chief Financial Officer 28 February 2014 28 February 2014
BA AR&A 2013 A4.indd 9BA AR&A 2013 A4.indd 9 03/03/2014 16:3403/03/2014 16:34

10
Directors’ report The Directors present their report for the year ended 31 December 2013. A review of the Group’s business and future developments is detailed further on pages 2 to 9 of the Strategic report. Results and Dividends The operating profit for the year ended 31 December 2013 amounted to £708 million (2012: £233 million). The Board has decided not to recommend the payment of a final dividend in respect of the year ended 31 December 2013 (2012: £nil). Directors The Directors who served during the year and since the year end are as follows: Sir Martin Broughton resigned 1 January 2014 Alison Reed Keith Williams Nick Swift Andrew Crawley Frank van der Post Enrique Dupuy de Lôme resigned 1 January 2014 Ken Smart Gavin Patterson Garrett Copeland Julia Simpson Company Secretary Kulbinder Dosanjh resigned on 11 October 2013 and Andrew Fleming was appointed as Company Secretary with effect from that date. Employment policies The employment policies in place aim to balance rights of employees and the responsibilities of the Group in order to drive the business forward. The policies are regularly reviewed and updated with input from colleagues. The overall aim is to have policies that are fair, legally compliant, cost effective and that empower line managers. BA continues to drive genuine and effective engagement with colleagues, putting the customer at the forefront of everything it does and maintaining a high performing organisation. BA’s objective is to have involved colleagues, with deep knowledge of their customers, who are empowered to serve their needs proactively. There is a framework in place for consultation with colleagues, through direct engagement as well as collective bargaining, enabling everyone to have an open and honest dialogue with the Group. Regular briefings (including updates on financial and economic factors affecting the performance of the Group) are run across the airline and other communication channels include live on-line forums, a personalised intranet, mobile SMS and video messages and a range of BA-wide and local newsletters. In 2013 we also introduced Yammer, an internal networking and collaboration tool within BA. BA is committed to delivering competitive packages that reward colleagues for their performance and contribution to the business and allow it to attract, retain and grow existing and future talent. BA drives the involvement of employees in the Group’s performance through the employee bonus scheme and the IAG Group share schemes for eligible employees. As a responsible organisation, disability is taken very seriously and applications are welcomed from individuals with disabilities. BA aims to employ the most talented people and thus has procedures in place to ensure that individuals with disabilities are supported in reaching their full potential by making reasonable adjustments for them in the workplace. Wellbeing and Inclusion is a key part of BA’s people strategy. Mandatory training on inclusion principles, and how to avoid discrimination, continues for all colleagues and managers to ensure that BA has a culture of fairness and respect and all our colleagues feel supported and able to be their best at work. Political Donations The Group does not make political donations or incur political expenditure and has no intention of doing so.
BA AR&A 2013 A4.indd 10BA AR&A 2013 A4.indd 10 03/03/2014 16:3403/03/2014 16:34

11
Directors’ report continued
Internal control and risk management Corporate Governance As the shares of the Company are not listed, it is not required to comply with the UK Corporate Governance Code. However, as the Company continues to be an issuer of listed debt it remains subject to certain provisions of the Companies Act 2006, Listing Rules and the Disclosure and Transparency Rules. In order to comply with these provisions, certain information about the Company’s corporate governance is detailed in this report. The Group has in place internal control and risk management systems in relation to the Group’s financial reporting process and the process for the preparation of consolidated financial statements. During the year, no changes in risk management and internal control systems over financial reporting have occurred that have materially affected, or are reasonably likely to have materially affected, the Group’s financial reporting. Internal control framework Effective Corporate Governance remains key to the business. The Group continues to review its internal control framework to ensure it maintains a strong and effective internal control environment. During the reporting period, the effectiveness of the framework was regularly reviewed by the Leadership Team. Business controls are reviewed on an ongoing basis by the internal audit function through a programme based on risk assessment. Professionally qualified personnel manage the department with experience gained from both inside and outside the industry. A risk-based audit plan, which provides assurance over key business processes and commercial and financial risks facing the Group, is approved by the IAG Audit Committee half yearly. The BA Board considered significant control matters raised by management and both the internal and external auditors, and it reported its findings to the IAG Audit Committee. If weaknesses were identified, the BA Board would ensure that management took appropriate action. No significant failings or weaknesses were identified during 2013. Risk management The Group has a structure and process to help identify, assess and manage risks. This process has been in place throughout the reporting period to which these statements apply and up to the date of their approval. During the year, the Risk Group consisted of the Leadership Team, the Head of Corporate Risk and Compliance and key senior executives. Meeting quarterly, it reviews the Group’s key risks contained in the corporate risk register and ensures that all new and emerging risks are appropriately evaluated and any further actions identified. The Risk Group also provides policy and guidance to those responsible for managing the individual risks and to the departmental risk leaders. The management of each major area of corporate risk is subject to review by an appropriate ‘assurance body’. This includes a review of the controls in place to mitigate the risks and the further actions being taken by management. The Risk Group reported quarterly to the BA Board to assist in the management of risk in accordance with the UK Corporate Governance Code (2012). The risk management process includes multiple opportunities for rigorous discussion and debate to assess the relative profile of each risk. The outcome includes a heat map. This plots each critical risk on an impact and probability scale. For each critical risk, mitigating actions exist and are actively managed. This process is iterative and refreshed on an ongoing basis. This report does not include the mapped results and mitigating actions for the principal risks because of the sensitive commercial nature of some of management’s plans. Overseas branches The Group flies to a number of destinations around the world. In addition to the overseas branches established in many of these countries, there are also branches in countries to which BA does not fly. A full list of destinations can be found on the website www.ba.com. Going concern The business activities, performance, strategy and risks of the Group are set out in this report. The financial position of the Group, including cash flows, liquidity position and available committed facilities are discussed in the financial review on pages 5 to 7 of the Strategic report, and further information is provided in note 26 of the financial statements. After making enquiries, the Directors have a reasonable expectation that the Company and the Group have adequate resources to continue operating for the foreseeable future. For this reason, the going concern basis has been adopted in preparing the accounts. Directors’ and Officers’ liability insurance and indemnities IAG purchased insurance against Directors' and Officers' liability covering the IAG Group, as permitted by the Companies Act 2006, for the benefit of the Directors and Officers. The Company has granted rolling indemnities to the Directors and the Secretary, uncapped in amount but subject to applicable law, in relation to certain losses and liabilities which they may incur in the course of acting as officers of companies within the Group. These indemnities also set out the terms on which the Company may, in its discretion, advance defence costs. The indemnities were in force during the whole of the financial year or from the date of appointment in respect of Officers who joined during 2013 and remain in force.
BA AR&A 2013 A4.indd 11BA AR&A 2013 A4.indd 11 03/03/2014 16:3403/03/2014 16:34

12
Directors’ report continued The Company has granted qualifying pension scheme indemnities in the form permitted by the Companies Act 2006 to the Directors of two companies, British Airways Pension Trustees Limited and British Airways Pension Trustees (No 2) Limited, that act as trustees of the Company’s UK pension schemes. These indemnities were in force throughout the last financial year or from the date of appointment in respect of Officers who joined during 2013 and remain in force. Auditors In accordance with Section 489 of the Companies Act 2006, resolutions concerning the re-appointment of the auditor, Ernst & Young LLP and authorising the Directors to set their remuneration will be proposed at the next Annual General Meeting.
Directors’ statement as to disclosure of information to the auditor The Directors who are members of the Board at the time of approving the Directors’ report and business review are listed above. Having made enquiries of fellow Directors and of the Group’s auditor, each of these Directors confirms that:
To the best of each Director’s knowledge and belief there is no information relevant to the preparation of the auditor's report of which the Group’s auditor is unaware; and Each Director has taken all the steps a Director might reasonably be expected to have taken to make him or herself aware of relevant audit information and to establish that the Group’s auditor is aware of that information.
This confirmation is given and should be interpreted in accordance with the provisions of Section 418(2) of the Companies Act 2006.
Directors’ responsibilities statement in relation to the financial statements The Directors as listed are responsible for preparing the Strategic report, Directors’ report and the financial statements in accordance with applicable UK law and those International Financial Reporting Standards (‘IFRSs’) as adopted by the EU. The Directors are required to prepare financial statements for each financial period, which present fairly the financial position of the Company and of the Group and the financial performance and cash flows of the Company and of the Group for that period. In preparing those financial statements, the Directors are required to:
Select suitable accounting policies and then apply them consistently; Present information, including accounting policies, in a manner that provides relevant, reliable, comparable and understandable information; Provide additional disclosures when compliance with the specific requirements in IFRS is insufficient to enable users to understand the impact of particular transactions, other events and conditions on the entity’s financial position and financial performance; and State that the Group has complied with IFRS, subject to any material departures disclosed and explained in the financial statements.
The Directors as listed are responsible for keeping adequate accounting records, which disclose, with reasonable accuracy at any time, the financial position of the Company and of the Group and enable them to ensure that the financial statements comply with the Companies Act 2006 and Article 4 of the IAS Regulation. They are also responsible for safeguarding the assets of the Group and hence for taking reasonable steps for the prevention and detection of fraud and other irregularities. In addition, the Directors are responsible for the maintenance and integrity of the corporate and financial information included in the Company’s website. Legislation in the UK governing the preparation and dissemination of financial statements may differ from legislation in other jurisdictions.
Directors’ responsibility statement pursuant to DTR 4 The Directors as listed confirm that, to the best of each person’s knowledge:
The Group and Company financial statements in this report, which have been prepared in accordance with IFRS as adopted by the EU, IFRIC interpretation and those parts of the Companies Act 2006 applicable to companies reporting under IFRS, give a true and fair view of the assets, liabilities, financial position and profit/loss of the Group as a whole and of the Company; and The management report contained in this report includes a fair review of the development and performance of the business and the position of the Group as a whole and of the Company, together with a description of the principal risks and uncertainties that they face.
Approved by the Board and signed on its behalf by Andrew Fleming Company Secretary 28 February 2014 Company registration number - 1777777
BA AR&A 2013 A4.indd 12BA AR&A 2013 A4.indd 12 03/03/2014 16:3403/03/2014 16:34

13
British Airways Plc Independent auditors’ report
We have audited the financial statements of British Airways Plc for the year ended 31 December 2013 which comprise the Group consolidated income statement, the Group statement of other comprehensive income, the Group and Parent Company balance sheets, the Group and Parent Company cash flow statements, the Group and Parent Company statement of changes in equity and the related notes 1 to 34. The financial reporting framework that has been applied in their preparation is applicable law and International Financial Reporting Standards (IFRSs) as adopted by the European Union and, as regards the Parent Company financial statements, as applied in accordance with the provisions of the Companies Act 2006. This report is made solely to the Company’s members, as a body, in accordance with Chapter 3 of Part 16 of the Companies Act 2006. Our audit work has been undertaken so that we might state to the Company’s members those matters we are required to state to them in an auditor’s report and for no other purpose. To the fullest extent permitted by law, we do not accept or assume responsibility to anyone other than the company and the company’s members as a body, for our audit work, for this report, or for the opinions we have formed. Respective responsibilities of Directors and auditor As explained more fully in the Directors’ Responsibilities Statement set out on page 12, the Directors are responsible for the preparation of the financial statements and for being satisfied that they give a true and fair view. Our responsibility is to audit and express an opinion on the financial statements in accordance with applicable law and International Standards on Auditing (UK and Ireland). Those standards require us to comply with the Auditing Practices Board’s Ethical Standards for Auditors. Scope of the audit of the financial statements An audit involves obtaining evidence about the amounts and disclosures in the financial statements sufficient to give reasonable assurance that the financial statements are free from material misstatement, whether caused by fraud or error. This includes an assessment of: whether the accounting policies are appropriate to the Group’s and the Parent Company’s circumstances and have been consistently applied and adequately disclosed; the reasonableness of significant accounting estimates made by the Directors; and the overall presentation of the financial statements. In addition, we read all the financial and non-financial information in the Annual Reports to identify material inconsistencies with the audited financial statements and to identify any information that is apparently materially incorrect based on, or materially inconsistent with, the knowledge acquired by us in the course of performing the audit. If we become aware of any apparent material misstatements or inconsistencies we consider the implications for our report.
Opinion on financial statements In our opinion:
the financial statements give a true and fair view of the state of the Group’s and of the Parent Company’s affairs as at 31 December 2013 and of the Group’s profit for the year then ended; the Group financial statements have been properly prepared in accordance with IFRSs as adopted by the European Union; the Parent Company financial statements have been properly prepared in accordance with IFRSs as adopted by the European Union and as applied in accordance with the provisions of the Companies Act 2006; and the financial statements have been prepared in accordance with the requirements of the Companies Act 2006.
Opinion on other matters prescribed by the Companies Act 2006 In our opinion the information given in the Strategic Report and the Directors’ Report for the financial year for which the financial statements are prepared is consistent with the financial statements. Matters on which we are required to report by exception We have nothing to report in respect of the following matters where the Companies Act 2006 requires us to report to you if, in our opinion:
adequate accounting records have not been kept by the Parent Company, or returns adequate for our audit have not been received from branches not visited by us; or the Parent Company financial statements are not in agreement with the accounting records and returns; or certain disclosures of Directors’ remuneration specified by law are not made; or we have not received all the information and explanations we require for our audit.
Debbie O'Hanlon (Senior statutory auditor) for and on behalf of Ernst & Young LLP, Statutory Auditor London 28 February 2014
BA AR&A 2013 A4.indd 13BA AR&A 2013 A4.indd 13 03/03/2014 16:3403/03/2014 16:34

14
Group consolidated income statement For the year ended 31 December Group
£ million Note 2013 2012 (Restated) ¹
CONTINUING OPERATIONS Passenger revenue 10,129 9,499 Cargo revenue 689 737
Traffic revenue 10,818 10,236 Other revenue 603 591
Total revenue 3 11,421 10,827
Employee costs 8 2,387 2,345 Restructuring 8 5 36 Depreciation, amortisation and impairment 6 722 720 Aircraft operating lease costs 85 98 Fuel, oil and emission costs 3,755 3,712 Engineering and other aircraft costs 643 625 Landing fees and en route charges 790 726 Handling charges, catering and other operating costs 1,340 1,213 Selling costs 439 466 Currency differences 28 (1) Accommodation, ground equipment and IT costs 576 613
Total expenditure on operations before exceptional items 10,770 10,553
Operating profit before exceptional items 651 274
Exceptional items 5 57 (41)
Operating profit 6 708 233
Gain on bargain purchase 58 Gains on fuel derivatives not qualifying for hedge accounting 17 8 Finance costs 9 (176) (173) Finance income 9 13 25 Net financing expense relating to pensions 31 (45) (35) Retranslation of currency borrowings 4 5 Loss on sale of property, plant and equipment and investments (3) Share of post-tax losses in associates accounted for using the equity method 17 (65) (66) Revaluation of convertible bond derivative liability (164) (10) Net gain/(loss) relating to available-for-sale financial assets 8 (1)
Profit before tax from continuing operations 300 41 Tax 10 (16) 73
Profit after tax from continuing operations 284 114
DISCOUNTINUED OPERATIONS
Loss after tax from discontinued operations 4 (3) (30)
Profit after tax 281 84
Attributable to:
Equity holders of the parent 264 68 Non-controlling interest 17 16
281 84
¹ Refer to Note 2 'Summary of significant accounting policies' for more information with regards to the adoption of revised IAS 19 'Employee Benefits'.
BA AR&A 2013 A4.indd 14BA AR&A 2013 A4.indd 14 03/03/2014 16:3403/03/2014 16:34

15
Group statement of other comprehensive income For the year ended 31 December Group
£ million Note 2013 2012 (Restated) ¹
Profit for the year 281 84
Other comprehensive income:
Items that will not be re-classified to the income statement
Pension remeasurements 31 628 (843)
Income taxes 10 (186) 117
442 (726)
Items that may be re-classified to the income statement
Exchange gains/(losses) 1 (4)
Net gains on cash flow hedges 128 97 Share of other movements in reserves of associates 17 1 12 Available-for-sale financial assets - marked to market 15 4 Available-for-sale financial assets - recycled to income statement (8) Income taxes 10 (29) (27)
108 82
Total other comprehensive income 550 (644)
Total comprehensive income for the year (net of tax) 831 (560)
Attributable to: Equity holders of the parent 814 (576) Non-controlling interest 30 17 16
831 (560)
¹ Refer to Note 2 'Summary of significant accounting policies' for more information with regards to the adoption of revised IAS 19 'Employee Benefits'.
BA AR&A 2013 A4.indd 15BA AR&A 2013 A4.indd 15 04/03/2014 16:2704/03/2014 16:27

16
Balance sheets As at 31 December
Group Company
£ million Note 2013
2012 (Restated) ¹
2011 (Restated) ¹
2013 2012
(Restated) ¹ 2011
(Restated) ¹ Non-current assets
Property, plant and equipment:
Fleet 12 6,456 5,909 5,765 6,166 5,597 5,488 Property 12 816 831 856 776 789 811 Equipment 12 215 202 207 193 185 193 7,487 6,942 6,828 7,135 6,571 6,492
Intangibles:
Goodwill 15 40 40 40 Landing rights 15 668 655 242 642 630 215 Emissions allowances 15 26 39 12 26 39 12 Software 15 147 85 53 147 84 52 881 819 347 815 753 279
Investments in subsidiaries 17 2,453 2,372 2,304 Investments in associates 17 115 174 232 Available-for-sale financial assets 18 39 39 39 17 28 24 Employee benefit assets 31 407 493 587 407 493 587 Derivative financial instruments 27 8 8 6 8 8 6 Other non-current assets 19 59 25 28 193 162 167
Total non-current assets 8,996 8,500 8,067 11,028 10,387 9,859
Non-current assets held for sale 14 10 2 15 10 15 Current assets and receivables Inventories 110 117 139 109 117 137 Trade receivables 19 533 488 460 522 481 448 Other current assets 19 338 393 273 496 739 409 Derivative financial instruments 27 84 37 73 84 37 74 Other current interest-bearing deposits 20 1,220 1,118 1,259 1,220 1,116 1,242 Cash and cash equivalents 20 630 481 570 562 419 530
1,850 1,599 1,829 1,782 1,535 1,772
Total current assets and receivables 2,915 2,634 2,774 2,993 2,909 2,840 Total assets 11,921 11,136 10,856 14,031 13,296 12,714 Shareholders' equity Issued share capital 28 290 290 290 290 290 290 Share premium 28 1,512 937 937 1,512 937 937 Other reserves 30 453 (359) 207 463 (375) (217)
Total shareholders' equity 2,255 868 1,434 2,265 852 1,010
Non-controlling interests 30 200 200 200
Total equity 2,455 1,068 1,634 2,265 852 1,010
Non-current liabilities Interest-bearing long-term borrowings 23 3,453 3,226 3,358 3,694 3,440 3,596 Employee benefit obligations 31 619 1,732 1,251 607 1,725 1,245 Provisions for deferred tax 10 444 216 394 327 98 349 Long-term provisions 25 185 244 179 112 101 170 Derivative financial instruments 27 11 67 62 11 67 62 Other long-term liabilities 22 127 185 295 98 147 258
Total non-current liabilities 4,839 5,670 5,539 4,849 5,578 5,680
Current liabilities Current portion of long-term borrowings 23 365 466 385 358 458 384 Trade and other payables 21 4,073 3,600 3,117 6,414 6,162 5,473 Derivative financial instruments 27 51 31 21 51 32 22 Current tax payable 1 9 12 6 6 Short-term provisions 25 137 292 148 94 208 139
Total current liabilities 4,627 4,398 3,683 6,917 6,866 6,024
Total equity and liabilities 11,921 11,136 10,856 14,031 13,296 12,714
¹ Refer to Note 2 'Summary of significant accounting policies' for more information with regards to the adoption of revised IAS 19 'Employee Benefits'.
Approved by the Board and signed on its behalf by
Keith Williams Nick Swift Executive Chairman Chief Financial Officer 28 February 2014 28 February 2014
BA AR&A 2013 A4.indd 16BA AR&A 2013 A4.indd 16 03/03/2014 16:3403/03/2014 16:34

17
Cash flow statements
For the year ended 31 December Group Company
£ million Note 2013 2012 2013 2012
CONTINUING OPERATIONS Cash flow from operating activities Operating profit 708 233 661 251 Depreciation, amortisation and impairment 6 722 720 689 680 Cash payments to pension schemes (net of service costs) 31d (302) (303) (302) (303) Movement in working capital and other non-cash movements 31 207 96 116 Interest paid (123) (139) (101) (118) Taxation (5) (3) (5)
Net cash generated from operating activities 1,031 715 1,038 626
Cash flow used in investing activities Acquisition of subsidiary, net of cash acquired (7) (68) Purchase of property, plant and equipment and intangible assets (1,378) (781) (1,367) (747) Investment in subsidiaries 17 (87) (10) Loans made to related parties (92) (92) Repayment of loans from related parties 105 6 105 6 Sale of non-current assets 5 20 3 16 Interest received 14 23 14 23 Dividends received 9 Other investing movements (2) 7 (2) 2 (Increase)/decrease in other current interest-bearing deposits (102) 141 (104) 126
Net cash used in investing activities (1,358) (683) (1,429) (744)
Cash flow from/(used in) financing activities
Proceeds from long-term borrowings 997 430 997 430 Repayments of borrowings¹ (194) (258) (173) (240) Payment of finance lease liabilities (319) (224) (333) (237) Distributions made to holders of perpetual securities (17) (16)
Net cash flow from/(used in) financing activities 467 (68) 491 (47)
Net change in cash and cash equivalents from continuing operations 140 (36) 100 (165)
DISCONTINUED OPERATIONS Net cash flow used in discontinued operations 4 (36) (107)
Net change in cash and cash equivalents 104 (143) 100 (165) Net foreign exchange differences 45 54 43 54 Cash and cash equivalents at 1 January 481 570 419 530
Cash and cash equivalents as at 31 December 20 630 481 562 419
¹ During the year, BA's £350 million 5.8% fixed interest convertible bond, of which £349 million was outstanding, was converted into IAG shares requiring BA to purchase IAG shares for £575 million with consideration held on intercompany account. This was settled by BA through the issue of 'C' Ordinary shares to IAG.
BA AR&A 2013 A4.indd 17BA AR&A 2013 A4.indd 17 03/03/2014 16:3403/03/2014 16:34

18
For the year ended 31 December 2013 Company
Other
Issued Share reserves Total £ million capital premium (note 30) equity Balance at 1 January 2013 290 937 (375) 852
Profit for the year 298 298
Other comprehensive income for the year 542 542
Total comprehensive income for the year 840 840 Issue of ordinary shares (note 28) 575 575 Cost of share-based payment (net of tax) (2) (2)
As at 31 December 2013 290 1,512 463 2,265
For the year ended 31 December 2012 Company Other Restated
Issued Share reserves total £ million capital premium (note 34) equity Balance previously reported as at 31 December 2011 290 937 931 2158 Cumulative effect for prior periods¹ (1,148) (1,148) Restated balance at 1 January 2012 290 937 (217) 1,010
Profit for the year 483 483
Other comprehensive income for the year (651) (651)
Total comprehensive income for the year (168) (168) Cost of share-based payment (net of tax) 10 10
As at 31 December 2012 290 937 (375) 852
¹ Refer to Note 2 'Summary of significant accounting policies' for more information with regards to the adoption of revised IAS 19 'Employee Benefits'.
Statements of changes in equity
For the year ended 31 December 2013 Group Other Total Non- Issued Share reserves shareholders' controlling Total
£ million capital premium (note 30) equity interest equity Balance at 1 January 2013 290 937 (359) 868 200 1,068
Profit for the year 264 264 17 281
Other comprehensive income for the year 550 550 550
Total comprehensive income for the year 814 814 17 831
Issue of ordinary shares (note 28) 575 575 575
Cost of share-based payment (net of tax) (2) (2) (2)
Distributions made to holders of perpetual securities (17) (17)
As at 31 December 2013 290 1,512 453 2,255 200 2,455
For the year ended 31 December 2012 Group
Other Total Non- Restated
Issued Share reserves shareholders' controlling total
£ million capital premium (note 30) equity interest equity Balance previously reported as at 31 December 2011 290 937 1,355 2,582 200 2,782
Cumulative effect for prior periods¹ (1,148) (1,148) (1,148)
Restated balance at 1 January 2012 290 937 207 1,434 200 1,634
Profit for the year 68 68 16 84
Other comprehensive income for the year (644) (644) (644)
Total comprehensive income for the year (576) (576) 16 (560)
Cost of share-based payment (net of tax) 10 10 10
Distributions made to holders of perpetual securities (16) (16)
As at 31 December 2012 290 937 (359) 868 200 1,068
BA AR&A 2013 A4.indd 18BA AR&A 2013 A4.indd 18 03/03/2014 16:3403/03/2014 16:34

19
Notes to the accounts 1 Authorisation of financial statements and compliance with IFRSs The Groups and Company's financial statements for the year ended 31 December 2013 were authorised for issue by the Board of Directors on 28 February 2014 and the balance sheets were signed on the Board's behalf by Keith Williams and Nick Swift. British Airways Plc is a public limited company incorporated and domiciled in England and Wales. The Group and Company has prepared its consolidated financial statements in accordance with International Financial Reporting Standards (‘IFRSs’) as adopted by the EU. IFRSs as adopted by the EU differ in certain respects from IFRSs as issued by the International Accounting Standards Board (‘IASB’). References to 'IFRS' hereafter should be construed as references to IFRSs as adopted by the EU. The principal accounting policies adopted by the Group and by the Company are set out in note 2.
The Company has taken advantage of the exemption provided under Section 408 of the Companies Act 2006 not to publish its individual income statement and related notes.
2 Summary of significant accounting policies Basis of preparation The basis of preparation and accounting policies set out in this Report and Accounts have been prepared in accordance with the recognition and measurement criteria of IFRSs, which also include International Accounting Standards (‘IASs’), as issued by the IASB and with those of the Standing Interpretations issued by the International Financial Reporting Interpretations Committee (‘IFRIC’) of the IASB.
These financial statements have been prepared on a historical cost convention except for certain financial assets and liabilities, including derivative financial instruments and available-for-sale financial assets, that are measured at fair value.
The Group’s and Company’s financial statements are presented in pounds sterling and all values are rounded to the nearest million pounds (£ million), except where indicated otherwise. Basis of consolidation The Group accounts include the accounts of the Company and its subsidiaries, each made up to 31 December, together with the attributable share of results and reserves of associates, adjusted where appropriate to conform with the Group’s accounting policies. Subsidiaries are entities controlled by the Group. Control exists when the Group has the power either directly or indirectly to govern the financial and operating policies of the entity so as to obtain benefit from its activities. Subsidiaries are consolidated from the date of their acquisition, which is the date on which the Group obtains control, and continue to be consolidated until the date that such control ceases.
All intra-group account balances, including intra-group profits, have been eliminated in preparing the consolidated financial statements. Non-controlling interests represent the portion of profit or loss and net assets in subsidiaries that are not held by the Group and are presented separately within equity in the consolidated balance sheet. Revenue Passenger and cargo revenue is recognised when the transportation service is provided. Passenger tickets net of discounts are recorded as current liabilities in the ‘sales in advance of carriage’ account until recognised as revenue. Unused tickets are recognised as revenue using estimates regarding the timing of recognition based on the terms and conditions of the ticket and historical trends. Other revenue is recognised at the time the service is provided. Revenue recognition – customer loyalty programmes The Group operates two principal loyalty programmes. The airline’s frequent flyer programme operates through the airline's 'Executive Club' and allows frequent travellers to accumulate Avios that entitle them to a choice of various awards, primarily free travel. The fair value attributed to the awarded Avios is deferred as a liability and recognised as revenue on redemption of the points and provision of the service to the participants to whom the Avios are issued. During the year management have changed the estimate regarding the revenue recognised on redemption. Further detail can be found in note 5 ‘Exceptional Items’. In addition, Avios are sold to commercial partners to use in promotional activity. The fair value of the Avios sold is deferred and recognised as revenue on redemption of the Avios and provision of the service to the participants to whom the Avios are issued. The cost of the redemption of the Avios is recognised when the Avios are redeemed. The Group’s wholly-owned subsidiary, Avios Group (AGL) Limited, also operates a customer loyalty scheme. The scheme allows companies to purchase Avios for use in their own promotional activities. Avios can be redeemed for a range of benefits, including flights on BA and other carriers. The fair value of the Avios sold is deferred and recognised as revenue on redemption of the Avios and provision of the service to the participants to whom the Avios are issued. The cost of providing redemption services is recognised when the Avios are redeemed.
BA AR&A 2013 A4.indd 19BA AR&A 2013 A4.indd 19 03/03/2014 16:3403/03/2014 16:34

20
2 Summary of significant accounting policies continued
Segmental reporting Operating segments are reported in a manner consistent with the internal reporting provided to the chief operating decision-maker. The chief operating decision-maker, who is responsible for resource allocation and assessing performance of the operating segments, has been identified as the Leadership Team. The Leadership Team is headed by the Executive Chairman and structured by function; the Leadership Team is responsible for the day-to-day running of the Group and discharging managerial responsibility.
Intangible assets Intangible assets are held at cost and are either amortised on a straight-line basis over their economic life, or they are deemed to have an indefinite economic life and are not amortised, but tested annually for impairment. The carrying value of intangibles is reviewed for impairment if events or changes in circumstances indicate the carrying value may not be recoverable.
a Goodwill Where the cost of a business combination exceeds the fair value attributable to the net assets acquired, the resulting goodwill is capitalised and tested for impairment annually and whenever indicators exist that the carrying value may not be recoverable. Any goodwill arising on the acquisition of equity accounted entities is included within the cost of those entities. Where the net fair value of the identifiable assets and liabilities of the acquiree is in excess of the consideration paid, a gain on bargain purchase is recognised immediately in the income statement.
Goodwill is allocated to cash-generating units for the purpose of impairment testing.
b Landing rights Landing rights acquired from other airlines are capitalised at fair value on acquisition. Subsequently they are accounted for at cost less any accumulated impairment losses. Capitalised landing rights based outside the EU are amortised on a straight-line basis over a period not exceeding 20 years. Capitalised landing rights based within the EU are not amortised, as regulations provide that these landing rights are perpetual.
c Software The cost of purchase or development of computer software that is separable from an item of related hardware is capitalised separately and amortised over a period not exceeding five years on a straight-line basis.
d Emissions allowances Purchased emissions allowances are initially recognised at cost and are not revalued or amortised but are tested for impairment whenever indicators exist that the carrying value may not be recoverable.
Property, plant and equipment Property, plant and equipment is held at cost. The Group has a policy of not revaluing property, plant and equipment. Depreciation is calculated to write off the cost less estimated residual value on a straight-line basis, over the economic life of the asset. Residual values, where applicable, are reviewed annually against prevailing market values for equivalently aged assets and depreciation rates are adjusted accordingly on a prospective basis.
The carrying value is reviewed for impairment when events or changes in circumstances indicate the carrying value may not be recoverable and the cumulative impairment losses are shown as a reduction in the carrying value of property, plant and equipment.
a Capitalisation of interest on progress payments Interest attributed to progress payments, and related exchange movements on foreign currency amounts, made on account of aircraft and other qualifying assets under construction is capitalised and added to the cost of the asset concerned.
b Fleet All aircraft are stated at the fair value of the consideration given after taking account of manufacturers' credits. Fleet assets owned, or held on finance lease or hire purchase arrangements, are depreciated at rates calculated to write down the cost to the estimated residual value over a depreciation period of between 18 and 25 years. For engines maintained under ‘pay-as-you-go’ contracts, the depreciation lives and residual values are the same as the aircraft to which the engines relate. For all other engines, the engine core is depreciated to its residual value over the average remaining life of the related fleet. Major overhaul expenditure is depreciated over periods ranging from 26-78 months, according to the engine type.
Cabin interior modifications, including those required for brand changes and relaunches, are depreciated over the lower of five years and the remaining life of the aircraft.
Aircraft and engine spares acquired on the introduction or expansion of a fleet, as well as rotable spares purchased separately, are carried as property, plant and equipment and generally depreciated in line with the fleet to which they relate.
Major overhaul expenditure, including replacement spares and labour costs, is capitalised and amortised over the average expected life between major overhauls. All other replacement spares and other costs relating to maintenance of fleet assets (including maintenance provided under 'pay-as-you-go' contracts) are charged to the income statement on consumption or as incurred respectively. c Property and equipment Provision is made for the depreciation of all property and equipment, apart from freehold land, based upon expected useful lives, or in the case of leasehold properties over the duration of the leases if shorter, on a straight-line basis.
Property, with the exception of freehold land, is depreciated over its expected useful life subject to a maximum of 50 years. Equipment is depreciated over periods ranging from four to 20 years, according to the type of equipment.
BA AR&A 2013 A4.indd 20BA AR&A 2013 A4.indd 20 03/03/2014 16:3403/03/2014 16:34
21
2 Summary of significant accounting policies continued
Property, plant and equipment continued d Leased and hire purchase assets Where assets are financed through finance leases or hire purchase arrangements, under which substantially all the risks and rewards of ownership are transferred to the Group, the assets are treated as if they had been purchased outright. The amount included in the cost of property, plant and equipment represents the aggregate of the capital elements payable during the lease or hire purchase term. The corresponding obligation, reduced by the appropriate proportion of lease or hire purchase payments made, is included in borrowings.
The amount included in the cost of property, plant and equipment is depreciated on the basis described in the preceding paragraphs and the interest element of lease or hire purchase payments made is included in interest payable in the income statement.
Total minimum payments, measured at inception, under all other lease arrangements, known as operating leases, are charged to the income statement in equal annual amounts over the period of the lease.
Non-current assets held for sale Non-current assets are classified as held for sale when their carrying value is to be recovered principally through sale as opposed to continuing use. The sale must be considered to be highly probable and to be enacted within 12 months. Held for sale assets are carried at the lower of carrying value and fair value less costs to sell. Assets are not depreciated or amortised once classified as held for sale.
Inventories Inventories, including aircraft expendables, are valued at the lower of cost and net realisable value, determined by the weighted average cost method.
Interests in associates An associate is an undertaking in which the Group has a long-term equity interest and over which it has the power to exercise significant influence. The Group’s interest in the net assets of associates is included in investment in associates in the consolidated balance sheet and its interest in their results is included in the income statement, below operating profit. The attributable results of those companies invested in or disposed of during the year are included for the period of ownership.
Cash and cash equivalents Cash and cash equivalents includes cash in hand and deposits with any qualifying financial institution repayable on demand or maturing within three months of the date of acquisition and which are subject to an insignificant risk of change in value.
Other current interest-bearing deposits Other current interest-bearing deposits, principally comprising funds held with banks and other financial institutions, are carried at amortised cost using the effective interest method. Such financial assets are classified as held-to-maturity when the Group has the positive intention and ability to hold to maturity. Gains and losses are recognised in income when the deposits are derecognised or impaired, as well as through the amortisation process.
Trade and other receivables Trade and other receivables are stated at cost less allowances made for doubtful receivables, which approximates fair value given the short-dated nature of these assets. A provision for impairment of receivables (allowance for doubtful receivables) is established when there is objective evidence that the Group will not be able to collect all amounts due according to the original terms of the receivable.
Employee benefits Employee benefits, including pensions and other post-retirement benefits (principally post-retirement healthcare benefits) are presented in these financial statements in accordance with IAS 19 'Employee Benefits'.
a Pension obligations The Group has both defined benefit and defined contribution plans. A defined contribution plan is a pension plan under which the Group pays fixed contributions into a separate entity. The Group has no legal or constructive obligations to pay further contributions if the fund does not hold sufficient assets to pay all employees the benefits relating to employee service in the current and prior periods.
The Group’s net obligation in respect of defined benefit pension plans is calculated separately for each plan by estimating the amount of future benefit that employees have earned in return for their service in the current and prior periods; that benefit is discounted to determine its present value and the fair value of any plan assets are deducted. The discount rate is the yield at the balance sheet date on AA-rate corporate bonds of the appropriate currency that have durations approximating those of the Group’s obligations. The calculation is performed by a qualified actuary using the projected unit credit method. When the calculation results in a net asset to the Group, the recognised asset is limited to the present value of any future refunds from the plan or reductions in future contributions to the plan (‘the asset ceiling’). The cost of administering the Group’s defined benefit pension plans is provided as part of the scheme obligation, whilst the cost of managing the plan investments is treated as part of the return on plan assets.
The fair value of scheme assets is based on market price information and, in the case of quoted securities, is the published bid price. The fair value of insurance policies which exactly match the amount and timing of some or all benefits payable under the scheme are deemed to be the present value of the related obligations. Longevity swaps are measured at their fair value.
BA AR&A 2013 A4.indd 21BA AR&A 2013 A4.indd 21 03/03/2014 16:3403/03/2014 16:34

22
2 Summary of significant accounting policies continued Employee benefits continued a Pension obligations continued Current service costs are recognised within operating expenses in the period in which they arise. Past service costs are recognised at the earlier of the plan amendment or curtailment occurring and when the Group recognises the related restructuring costs or termination benefits. The net interest is calculated by applying the discount rate used to measure the defined benefit obligation at the beginning of the period to the net defined benefit liability or asset, taking into account any changes in the net defined benefit liability or asset during the period as a result of contributions and benefit payments. Net interest and other expenses related to the defined benefit plans are recognised in the income statement. Re-measurements, comprising of actuarial gains and losses, the effect of the asset ceiling (excluding interest) and the return on plan assets (excluding interest), are recognised immediately in the statement of other comprehensive income. Re-measurements are not reclassified to profit or loss in subsequent periods.
b Termination benefits Termination benefits are payable when employment is terminated by the Group before the normal retirement date, or whenever an employee accepts voluntary redundancy in exchange for these benefits. The Group recognises termination benefits when it is demonstrably committed to either terminating the employment of current employees according to a detailed formal plan without realistic possibility of withdrawal, or providing termination benefits as a result of an offer made to encourage voluntary redundancy. Other employee benefits are recognised when there is deemed to be a present obligation. Share-based payments The Group has a number of equity-settled share-based employee incentive plans in which the Group’s employees participate. Prior to the merger the awards were made under schemes operated by the Company and represented rights over its ordinary shares. These awards rolled over into awards in respect of shares in IAG at the merger. Subsequent to the merger, awards are made under schemes operated by IAG and represent rights over its ordinary shares. The cost of these awards is recharged from IAG to the Group and recognised as intercompany payables to IAG. Taxation Current tax assets and liabilities are measured at the amount expected to be recovered from or paid to the taxation authorities, based on tax rates and laws that are enacted or substantively enacted at the balance sheet date. Deferred income tax is recognised on all temporary differences arising between the tax bases of assets and liabilities and their carrying amounts in the financial statements, with the following exceptions:
Where the temporary difference arises from the initial recognition of goodwill or of an asset or liability in a transaction that is not a business combination that at the time of the transaction affects neither accounting nor taxable profit or loss;
In respect of taxable temporary differences associated with investments in subsidiaries or associates, where the timing of the reversal of the temporary differences can be controlled and it is probable that the temporary differences will not reverse in the foreseeable future; and
Deferred income tax assets are recognised only to the extent that it is probable that taxable profit will be available against which the deductible temporary differences, carried forward tax credits or tax losses can be utilised.
Deferred income tax assets and liabilities are measured on an undiscounted basis at the tax rates that are expected to apply when the related asset is realised or liability is settled, based on tax rates and laws enacted or substantively enacted at the balance sheet date. Income tax is charged or credited directly to equity if it relates to items that are credited or charged to equity. Otherwise income tax is recognised in the income statement. Provisions Provisions are made when an obligation exists for a future liability in respect of a past event and where the amount of the obligation can be reliably estimated. Restructuring provisions are made for direct expenditures of a business reorganisation where the plans are sufficiently detailed and well advanced and where appropriate communication to those affected has been undertaken at the balance sheet date. If the effect is material, expected future cash flows are discounted using a rate that reflects, where appropriate, the risks specific to the liability. Where discounting is used, the increase in the provision due to unwinding the discount is recognised as a finance cost. Foreign currency translation Transactions in foreign currencies are initially recorded in the Group’s functional currency, sterling, by applying the spot exchange rate ruling at the date of the transaction. Monetary foreign currency balances are translated into sterling at the rates ruling at the balance sheet date. All other profits or losses arising on translation are dealt with through the income statement except where hedge accounting is applied. The net assets of foreign operations are translated into sterling at the rate of exchange ruling at the balance sheet date. Profits and losses of such operations are translated into sterling at average rates of exchange during the period. The resulting exchange differences are taken directly to a separate component of equity until all or part of the interest is sold, when the relevant portion of the cumulative exchange is recognised in the income statement.
BA AR&A 2013 A4.indd 22BA AR&A 2013 A4.indd 22 03/03/2014 16:3403/03/2014 16:34

23
2 Summary of significant accounting policies continued Financial instruments In accordance with IAS 39 'Financial Instruments - Recognition and Measurement', financial instruments are recorded initially at fair value. Subsequent measurement of those instruments at the balance sheet date reflects the designation of the financial instrument. The Group determines the classification at initial recognition and re-evaluates this designation at each period-end except for those financial instruments measured at fair value through the income statement. a Loans and receivables Loans and receivables are non-derivative financial assets with fixed or determinable payments that are not quoted in the active market. Such assets are carried at amortised cost using the effective interest method if the time value of money is insignificant. This category of financial assets includes trade and other receivables. b Available-for-sale financial assets Other equity investments (other than interests in associates) are designated as available-for-sale financial assets and are recorded at fair value. Any change in the fair value is reported in equity until the investment is sold, when the cumulative amount recognised in equity is recognised in the income statement. In the case of equity securities classified as available-for-sale investments, a significant or prolonged decline in the fair value of the security below its cost is considered as an indicator that the security is impaired. If any such evidence exists for available-for-sale financial assets, the cumulative gain or loss previously reported in equity is included in the income statement. The fair value of quoted investments is determined by reference to published bid prices at the close of business on the balance sheet date. Where there is no active market, fair value is determined using valuation techniques. Where fair value cannot be reliably estimated, assets are carried at cost. c Derivatives Derivative financial instruments, comprising foreign exchange derivatives and fuel hedging derivatives (including options, swaps and futures), are measured at fair value on the Group balance sheet. The treatment of gains and losses arising from revaluation is described below in the accounting policy for cash flow hedges. The gains or losses related to derivatives not used as effective hedging instrument is recognised in the income statement. d Financial liabilities measured at amortised cost Long-term borrowings are recorded at amortised cost. Certain leases contain interest rate swaps that are closely related to the underlying financing and, as such, are not accounted for as an embedded derivative. Cash flow hedges Changes in the fair value of derivative financial instruments are reported through operating income or financing according to the nature of the instrument, unless the derivative financial instrument has been designated as a hedge of a highly probable expected future cash flow. Gains and losses on derivative financial instruments designated as cash flow hedges and assessed as effective for the period are taken to equity in accordance with the requirements of IAS 39. Gains and losses taken to equity are reflected in the income statement when either the hedged cash flow impacts income or the hedged item is no longer expected to occur.
Certain loan repayment instalments denominated in US dollars, euro and Japanese yen are designated as cash flow hedges of highly probable future foreign currency revenues. Exchange differences arising from the translation of these loan repayment instalments are taken to equity in accordance with IAS 39 requirements and subsequently reflected in the income statement when either the future revenue impacts income or its occurrence is no longer expected to occur. Impairment of financial assets The Group assesses at each balance sheet date whether a financial asset or group of financial assets is impaired. A financial asset is considered impaired if objective evidence indicates that one or more events that have occurred since the initial recognition of the asset have had a negative impact on the estimated future cash flows of that asset. An impairment loss in respect of a financial asset carried at amortised cost is calculated as the difference between its carrying amount and the present value of the estimated future cash flows discounted at the asset’s original effective interest rate. Derecognition of financial assets and liabilities A financial asset or liability is generally derecognised when the contract that gives rise to it has been settled, sold, cancelled or has expired. Where an existing financial liability is replaced by another from the same lender on substantially different terms, or the terms of an existing liability are substantially modified, such an exchange or modification is treated as a derecognition of the original liability and the recognition of a new liability, such that the difference in the respective carrying amounts are recognised in the income statement. Exceptional items Exceptional items (disclosed in note 5) are those that in management’s view need to be disclosed by virtue of their size or incidence.
BA AR&A 2013 A4.indd 23BA AR&A 2013 A4.indd 23 03/03/2014 16:3403/03/2014 16:34

24
2 Summary of significant accounting policies continued Key accounting estimates and judgements The preparation of financial statements requires management to make judgements, estimates and assumptions that affect the application of policies and reported amounts of assets and liabilities, income and expenses. These estimates and associated assumptions are based on historical experience and various other factors believed to be reasonable under the circumstances. Actual results could differ from these estimates. These underlying assumptions are reviewed on an ongoing basis. Revisions to accounting estimates are recognised in the period in which the estimate is revised if the revision affects only that period, or in the period of the revision and future periods if these are also affected. The estimates and assumptions that have a significant risk of causing a material adjustment within the next financial year are discussed below. a Impairment of non-financial assets The Group assesses whether there are any indicators of impairment for all non-financial assets at each reporting date. Goodwill and intangible assets with indefinite economic lives are tested for impairment annually and at other times when such indicators exist. The recoverable amounts of cash-generating units have been determined based on value-in-use calculations. These calculations require the use of estimates as disclosed in note 16. Other non-financial assets are tested for impairment when there are indicators that the carrying amounts may not be recoverable. b Pensions and other post-retirement benefits The cost of defined benefit pension plans and other post-employment medical benefits is determined using actuarial valuations. The actuarial valuation involves making assumptions about discount rates, expected rates of return on assets, future salary increases, mortality rates and future pension increases. Due to the long-term nature of these schemes, such estimates are subject to significant uncertainty and are disclosed in note 31. c Impairment of available-for-sale financial assets The Group classifies certain financial assets as available-for-sale and recognises movements in their fair value in equity. When the fair value declines, management makes assumptions about the decline in value to determine whether it is an impairment that should be recognised in the income statement. d Passenger revenue recognition Passenger revenue is recognised when the transportation service is provided. Ticket sales that are not expected to be used for transportation ('unused tickets') are recognised as revenue using estimates regarding the timing of recognition based on the terms and conditions of the ticket and historical trends.
e Frequent flyer revenue The amount deferred as a liability is measured based on the fair value of the awarded Avios. The fair value is measured by reference to the amount that the award credit could have been sold for separately. The amount deferred is recognised as revenue on redemption of the points including a portion of the points that the Group does not expect to be redeemed by the customers (‘breakage’). Both fair value and breakage used are estimates that management exercises judgement on.
f Income taxes The Group is subject to income taxes in numerous jurisdictions. Significant judgement is required in determining the worldwide provision for income taxes. There are many transactions and calculations for which the ultimate tax determination is uncertain. The Group recognises liabilities for anticipated tax audit issues based on estimates of whether additional taxes will be due. Where the final tax outcome of these matters is different from the amounts that were initially recorded, such differences will impact the current and deferred income tax assets and liabilities in the period in which such determination is made.
g Residual values and useful lives of assets The Group exercises judgement to determine useful lives and residual values of property, plant and equipment. The assets are depreciated to their residual values over their estimated useful lives.
Impact of new International Financial Reporting Standards The accounting policies adopted are consistent with those of the previous financial period except as follows: a IAS 19 ‘Employee Benefits’ The Group has adopted the revised IAS 19 'Employee Benefits' from 1 January 2013, retrospectively applying these changes to prior periods in accordance with the transitional provisions set out in the standard. The revised standard has eliminated the use of the corridor approach, resulting in recognition of all re-measurements of the defined benefit liability/asset. Any deficits and surpluses of defined benefit plans are now recognised in full in the Group and Company balance sheets, subject to any restrictions on surpluses due to the asset ceiling requirements. Unrecognised cumulative gains in relation to APS will not be recognised as these will be restricted by the asset ceiling.
BA AR&A 2013 A4.indd 24BA AR&A 2013 A4.indd 24 03/03/2014 16:3403/03/2014 16:34

25
2 Summary of significant accounting policies continued Impact of new International Financial Reporting Standards continued a IAS 19 ‘Employee Benefits’ continued The revised standard also requires the Group to determine the net interest expense/income for the year on the net defined benefit liability/asset by applying the discount rate used at the beginning of the period. Previously, the Group determined interest income on plan assets based on their long-term rate of expected return. Before adopting the amendment, the Group also had a finance charge/income in relation to the amortisation of actuarial losses in excess of the corridor and the effect of the asset ceiling; following the adoption of the amended standard, all actuarial losses/gains will be recognised immediately in other comprehensive income, as will changes in the asset ceiling for APS. The revised standard also enhances the disclosure requirements for the defined benefit plans, requiring more information about the characteristics of such plans and the risk to which the Group is exposed through participation in those plans. These are set out in note 31. The amendment to IAS 19 does not result in any change to the actuarial valuation for the ‘triennial valuation’, nor will it impact the profile of the deficit funding contributions that are agreed with the Scheme Trustees. The restatements recorded by the Group are summarised as follows:
Effect on the income statement Effect on other comprehensive income
£ million
Net financing income/(expense)
relating to pensions Tax
Net profit/ (loss)
Actuarial losses
relating to pensions Tax
Other comprehensive
income
Total comprehensive
income
Amount previously reported for 2012 (215) 69 (100) (27) 82 (18)
Change to the comparative period 180 4 184 (843) 117 (726) (542)
Restated for the year ended 31 December 2012 (35) 73 84 (843) 90 (644) (560)
Attributable to: Net
profit Total comprehensive
income
Equity holders of the parent 68 (576)
Non-controlling interest 16 16
For the year ended 31 December 2012 (restated) 84 (560)
Had BA not adopted the amendments in IAS 19, profit before tax for the year ended 31 December 2013 would have been different given the significant changes in determining the income statement charges. Total equity as of 31 December 2013 would have been higher as BA would have been adopting the corridor approach which would have had unrecognised actuarial losses.
£ million
Employee benefit assets
Total non-
current assets
Total assets
Employee benefit
obligations
Provisions for
deferred tax
Total non-
current liabilities
Total liabilities
Total equity
Balance previously reported as at 31 December 2011 1,100 8,580 11,369 232 778 4,904 8,587 2,782
Cumulative effect for prior periods (513) (513) (513) 1,019 (384) 635 635 (1,148)
Restated balance as at 31 December 2011 587 8,067 10,856 1,251 394 5,539 9,222 1,634
£ million
Employee benefit assets
Total non-
current assets
Total assets
Employee benefit
obligations
Provisions for
deferred tax
Total non-
current liabilities
Total liabilities
Total equity
Amount previously reported as at 31 December 2012 1,194 9,201 11,837 238 721 4,681 9,079 2,758
Cumulative effect for prior periods (701) (701) (701) 1,494 (505) 989 989 (1,690)
Restated amount as at 31 December 2012 493 8,500 11,136 1,732 216 5,670 10,068 1,068
b IFRS 13 ‘Fair Value Measurement’ IFRS 13 ‘Fair value measurement’ has been adopted from 1 January 2013. The standard explains how to measure fair value and aims to enhance fair value disclosures. The standard does not require fair value measurement in addition to those already required or permitted by other IFRSs, rather it prescribes how fair value should be measured if another IFRS requires it. The adoption of the standard did not result in a change to the way fair value is measured but rather introduced additional disclosures, as set out in Note 27. Other amendments resulting from Improvements to IFRSs or to standards did not have any impact on the accounting policies, financial position or performance of the Group.
BA AR&A 2013 A4.indd 25BA AR&A 2013 A4.indd 25 03/03/2014 16:3403/03/2014 16:34

26
2 Summary of significant accounting policies continued Impact of new International Financial Reporting Standards continued c Amendment to IFRS 7 ’Offsetting of financial assets and liabilities’ The amendment to IFRS 7 has been adopted from 1 January 2013. The amendment required new disclosures on offsetting assets and liabilities. The Group has expanded its disclosures as set out in Note 26. New standards, amendments and interpretations not yet effective The IASB and IFRIC issued the following standards, amendments and interpretations with an effective date after the date of these financial statements which management believes could impact the Group in future periods. Unless otherwise stated, the Group plans to adopt the following standards, interpretations and amendments from 1 January 2014. a Consolidation, joint arrangements and related disclosure The IASB issued three new standards relating to interest in other entities and related disclosure. These standards are effective for periods beginning on or after 1 January 2014 and have been endorsed by the EU. The new standards are: IFRS 10 ‘Consolidated Financial Statements’, IFRS 11 ‘Joint Arrangements’ and IFRS 12 ‘Disclosure of Interest in Other Entities’. IFRS 10 replaces the guidance on control and consolidation in IAS 27 and SIC-12-Consolidation-special purpose entities. IFRS 11 requires joint arrangements to be accounted for as a joint operation or as a joint venture depending on the rights and obligations of each party to the arrangement. IFRS 12 requires enhanced disclosure of the nature, risk and the financial effects associated with the Group’s interest in subsidiaries, associates, joint arrangements and unconsolidated structured entities. The core principle that a consolidated entity presents a parent and its subsidiaries as if they were a single entity remains unchanged, as do the mechanics of consolidation. It is anticipated that the application of these standards will have no significant impact on the Group’s net profit or net assets. b The new financial instruments standard IFRS 9 ‘Financial Instruments’ (2009) and (2010) are effective for periods beginning on or after 1 January 2015. This standard has not been endorsed by the EU. IFRS 9 (2009) removes the multiple classification and measurement models for financial assets required by IAS 39 and introduces a model that has only two classification categories: amortised cost and fair value. Classification is driven by the business model for managing the financial assets and the contractual cash flow characteristics of the financial assets. The accounting and presentation for financial liabilities and for derecognising financial instruments is relocated from IAS 39 without any significant changes. IFRS 9 (2010) introduces additional changes relating to financial liabilities. The IASB currently has an active project to make limited amendments to the classification and measurement requirements of IFRS 9 and add new requirements to address the impairment of financial assets and hedge accounting. The Group has not yet decided the date of adoption and has not yet completed its evaluation of the effects of the adoption. There are no other standards and interpretations in issue but not yet adopted that the Directors anticipate will have a material effect on the reported income or net assets of the Group. The Group has not early adopted any standard, interpretation or amendment that has been issued but is not yet effective.
3 Segment information a Business segments The Group’s network passenger and cargo operations are managed as a single business unit. The Leadership Team makes resource allocation decisions based on route profitability, which considers aircraft type and route economics, based primarily by reference to passenger economics with limited reference to cargo demand. The objective in making resource allocation decisions is to optimise consolidated financial results. While the operations of certain subsidiaries are considered to be separate operating segments, their activities are considered to be sufficiently similar in nature to aggregate all segments. Whilst Avios Group (AGL) Limited and British Airways Holidays Limited offer additional products, their primary business is closely related to the airline business. The primary financial information reviewed by the Leadership Team is based on the consolidated results of the Group. Based on the way the Group aggregates its operating business, and the manner in which resource allocation decisions are made, the Group has only one reportable segment for financial reporting purposes, being the consolidated results of the Group. b Geographical analysis - by area of original sale Group
£ million 2013 2012
UK 5,125 4,801 USA 2,080 1,954 Rest of the world 4,216 4,072
Revenue 11,421 10,827
The total of non-current assets excluding available-for-sale financial assets, employee benefit assets, other non-current assets and derivative financial instruments located in the UK is £8,317 million (2012: £7,677 million) and the total of these non-current assets located in other countries is £176 million (2012: £260 million).
BA AR&A 2013 A4.indd 26BA AR&A 2013 A4.indd 26 03/03/2014 16:3403/03/2014 16:34

27
4 Discontinued operations
In 2012, BA acquired bmibaby and bmi Regional as part of the acquisition of British Midland Airways Limited. As bmibaby and bmi Regional were not part of the Group’s long-term plans, they are presented as discontinued operations. bmi Regional was sold to Sector Aviation Holdings Ltd in 2012. bmibaby ceased to trade in September 2012, with all its aircraft being stood down in advance of handback to lessors. In 2013, revenue of £nil (2012: £71 million) was earned with total expenditure on operations of £3 million (2012: £101 million) relating to additional costs incurred in handing back aircraft to lessors. There was no finance income, finance expense or taxation relating to discontinued operations (2012: less than £1 million), as such, the loss after tax was £3 million (2012: £30 million) and is attributable entirely to equity holders of the parent. All cash flows used in discontinued operations relate to operating activities.
5 Exceptional items
Exceptional items are those that in management's view need to be disclosed by virtue of their size or incidence. The following items are deemed to be exceptional: Group
£ million 2013 2012
Change in revenue estimate in BA Executive Club (86) US PRMB plan amendment 143
Business combination costs (71)
Settlement of competition investigations 30
Exceptional items 57 (41)
The exceptional items noted above relate to the following consolidated income statement categories:
£ million 2013 2012 Passenger revenue (86) Employee costs 143 (9) Restructuring (20) Selling costs (6) Other operating costs (13) Accommodation, ground equipment and IT costs 7
Exceptional items 57 (41)
Change in revenue estimate in BA Executive Club During 2013, management has revised estimates relating to frequent flyer revenue recognised on redemption. Historically, management information systems have provided a constraint on the reliability of revenue recognition at the point of departure. As part of a group-wide exercise to review the existing frequent flyer programmes, reporting has been developed to better estimate the revenue that should be deferred to departure. This new management information has been adopted during the period, giving rise to a current period reduction in passenger revenue of £86 million that relates to the liability for deferred revenue at 1 January 2013 (treated as exceptional) and a £8 million reduction in revenue in relation to current year redemptions (non-exceptional). US PRMB plan amendment BA provides certain additional post-retirement healthcare benefits to eligible employees in the US through the US Post-Retirement Medical Benefit plan (‘US PRMB’). The Group made changes to the US PRMB plan during 2013 to bring the level of benefits in line with national trends in the US. This scheme is accounted for as a defined benefit plan which means that any reduction in benefit would result in the recognition of a past service gain when the plan amendment occurs. This change has resulted in the recognition of a one-off gain in employee cost of £143 million during the year. Business combination costs From the date of acquisition of bmi a number of costs were incurred for the continuing operations in the year ended 31 December 2012 including a restructuring expense of £20 million, transaction costs of £6 million and integration expenses of £45 million. Settlement of competition investigations In 2012, BA settled a fine with the Office of Fair Trading in the UK relating to investigations into passenger fuel surcharging dating back to 2004 through to 2006. The fine agreed was £59 million resulting in a £30 million release of the provision held.
BA AR&A 2013 A4.indd 27BA AR&A 2013 A4.indd 27 03/03/2014 16:3403/03/2014 16:34

28
6 Expenses by nature Operating profit is arrived at after charging:
Depreciation, amortisation and impairment of non-current assets:
Group
£ million 2013 2012
Owned assets 498 480 Finance leased aircraft 152 165 Hire purchased aircraft 6 Other leasehold interests 48 45 Impairment charge on property, plant and equipment 16 15 Amortisation of intangible assets 8 9
722 720
Operating lease costs:
Group
£ million 2013 2012
Minimum lease rentals - aircraft 85 98 - property and equipment 98 105 Property and equipment sub-lease rentals received (17) (14) Net onerous lease provision release (2)
166 187
Cost of inventories:
Group
£ million 2013 2012
Cost of inventories recognised as an expense, mainly fuel 3,811 3,736
7 Auditors’ remuneration Group
£ million 2013 2012
Fees payable to the Group's auditor for the audit of the annual report and accounts 1 2 Services relating to corporate finance transactions 1 Other services 1 1
3 3
The audit fees payable to Ernst & Young LLP are approved by the BA Board having been reviewed in the context of other companies for cost effectiveness. The Board also reviews and approves the nature and extent of non-audit services to ensure that independence is maintained. ‘Other services’ includes fees payable to Ernst & Young LLP with respect to the audit of subsidiaries, other services pursuant to legislation and other services relating to taxation; individually these costs are less than £1 million. Remuneration receivable by the Company’s auditors for the supply of other services to the Company is not presented separately as this information is included in the Group auditors’ remuneration.
BA AR&A 2013 A4.indd 28BA AR&A 2013 A4.indd 28 03/03/2014 16:3403/03/2014 16:34

29
8 Employee costs and numbers a Employee costs The average number of persons employed during the year was as follows: Group Company
Number 2013 2012 2013 2012
UK 36,453 37,909 34,079 33,983 Overseas 5,404 5,304 4,397 4,369
41,857 43,213 38,476 38,352
Group Company
£ million 2013 2012 2013 2012
Wages and salaries 1,562 1,580 1,455 1,441 Social security costs 175 166 159 153 Costs related to pension scheme benefits (note 31) 221 184 215 179 Other employee costs 429 415 413 398
Total employee costs excluding restructuring 2,387 2,345 2,242 2,171 Restructuring 5 56 3 56
Total employee costs 2,392 2,401 2,245 2,227
Included in 'wages and salaries' is a total expense for share-based payments of £14 million (2012: £15 million) that arises from transactions accounted for as equity-settled share-based payment transactions (see note 29). Other employee costs include allowances and accommodation for crew. Included in ‘Restructuring’ in 2013 is £nil (2012: £20 million) incurred in relation to the integration of bmi mainline disclosed as exceptional (see note 5). b Directors’ emoluments Group and Company
£ million 2013 2012
Directors’ remuneration 3 2
During the year, no Directors (2012: two) accrued benefits under a defined benefit pension scheme and two Directors (2012: two) accrued benefits under a defined contribution pension scheme. Pension contributions for the year totalled less than £1 million (2012: less than £1 million). During the year, four Directors (2012: five) of the Company were employed and remunerated by IAG. The aggregate emoluments for the highest paid Director were borne by IAG. His aggregate emoluments for the year amounted to £853,000 (2012: £873,000) and contributions to the Company's defined benefit scheme amounted to £nil (2012: £nil). The value of the accrued benefits in respect of his pension scheme at 31 December 2013 amounted to £2,559,000 (2012: £2,297,000). None of the Directors held any direct interest in any shares of the Company. However, four Directors (2012: four) participated in Long Term Incentive Schemes of the Company that were in existence prior to the merger and seven Directors (2012: eight) participated in IAG’s Long Term Incentive Schemes. During the year, four Directors (2012: none) exercised their rights under the British Airways Share Option Plans. No Directors exercised their awards (2012: none) under the IAG Long Term Incentive Schemes. c Remuneration of key management personnel Compensation of key management personnel (which includes the Directors and Leadership Team of the Group): Group and Company
£ million 2013 2012 Short-term employee benefits 7 5 Share-based payments 3 3
As at 31 December 10 8
BA AR&A 2013 A4.indd 29BA AR&A 2013 A4.indd 29 03/03/2014 16:3403/03/2014 16:34

30
9 Finance costs and income
a Finance costs
Group
£ million 2013 2012
On bank loans (18) (21) On finance leases (63) (70) Acceleration of bond amortisation¹ (24) On other loans (65) (79)
Interest expense (170) (170) Unwinding of discounting on provisions (note 25) (10) (7) Capitalised interest² 4 3 Change in fair value of cross currency swaps 1
(176) (173)
¹ In August 2009, BA issued a £350 million 5.8% fixed interest convertible bond. The terms of the bond allowed conversion into IAG shares at an effective conversion price of £1.89 per share at the option of the holder on or before August 2014. BA also had an option to redeem the bonds early at their principal amount together with accrued but unpaid interest subject to specific conditions. During the year these conditions were met and BA called for the early redemption of the bond which resulted in full conversion. As a result, an acceleration of the amortised cost accounting was made resulting in a £24 million interest charge. ² Interest costs on progress payments are capitalised at a rate based on the London Interbank Offered Rate (LIBOR) plus the rate specific to the borrowings. b Finance income
Group
£ million 2013 2012
Bank interest receivable (total interest income for financial assets not at fair value through the income statement) 13 25
10 Tax a Tax on profit on ordinary activities Tax charge/(credit) in the income statement
Group
£ million 2013 2012 (Restated)
Current income tax
UK corporation tax 61 1 Overseas tax 1 Current tax adjustments in respect of prior years - UK corporation tax (6) (2) Current tax adjustments in respect of prior years - overseas tax 1
Total current income tax charge 56
Deferred tax arising on differences between the accounting and tax treatment of:
Property, plant and equipment (25) (46) Employee defined benefit plans 29 52 Tax losses utilised/(carried forward) 35 (20) Foreign exchange (11) (5) Share-based payment deductions (1) (1) Deferred revenue in relation to loyalty reward programmes 17 8 Employee related provisions 6 (5) Adjustments in respect of prior years - deferred tax 6 3 Effect of tax rate changes (103) (73) Other items 7 14
Total deferred tax credit (40) (73)
Total charge/(credit) in the income statement 16 (73)
BA AR&A 2013 A4.indd 30BA AR&A 2013 A4.indd 30 03/03/2014 16:3403/03/2014 16:34
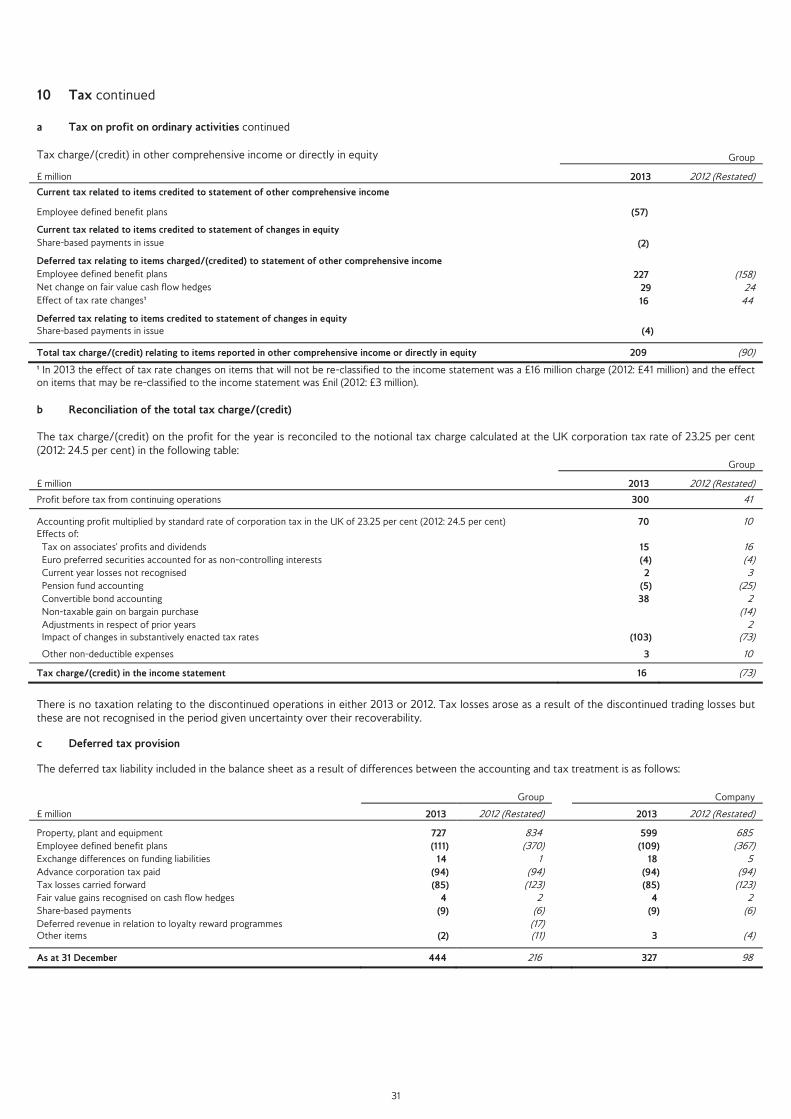
31
10 Tax continued a Tax on profit on ordinary activities continued
Tax charge/(credit) in other comprehensive income or directly in equity Group
£ million 2013 2012 (Restated)
Current tax related to items credited to statement of other comprehensive income
Employee defined benefit plans (57)
Current tax related to items credited to statement of changes in equity Share-based payments in issue (2)
Deferred tax relating to items charged/(credited) to statement of other comprehensive income Employee defined benefit plans 227 (158) Net change on fair value cash flow hedges 29 24 Effect of tax rate changes¹ 16 44
Deferred tax relating to items credited to statement of changes in equity Share-based payments in issue (4)
Total tax charge/(credit) relating to items reported in other comprehensive income or directly in equity 209 (90)
¹ In 2013 the effect of tax rate changes on items that will not be re-classified to the income statement was a £16 million charge (2012: £41 million) and the effect on items that may be re-classified to the income statement was £nil (2012: £3 million). b Reconciliation of the total tax charge/(credit) The tax charge/(credit) on the profit for the year is reconciled to the notional tax charge calculated at the UK corporation tax rate of 23.25 per cent (2012: 24.5 per cent) in the following table: Group
£ million 2013 2012 (Restated)
Profit before tax from continuing operations 300 41
Accounting profit multiplied by standard rate of corporation tax in the UK of 23.25 per cent (2012: 24.5 per cent) 70 10 Effects of: Tax on associates' profits and dividends 15 16 Euro preferred securities accounted for as non-controlling interests (4) (4) Current year losses not recognised 2 3 Pension fund accounting (5) (25) Convertible bond accounting 38 2 Non-taxable gain on bargain purchase (14) Adjustments in respect of prior years 2 Impact of changes in substantively enacted tax rates (103) (73)
Other non-deductible expenses 3 10
Tax charge/(credit) in the income statement 16 (73)
There is no taxation relating to the discontinued operations in either 2013 or 2012. Tax losses arose as a result of the discontinued trading losses but these are not recognised in the period given uncertainty over their recoverability. c Deferred tax provision The deferred tax liability included in the balance sheet as a result of differences between the accounting and tax treatment is as follows: Group Company
£ million 2013 2012 (Restated) 2013 2012 (Restated)
Property, plant and equipment 727 834 599 685 Employee defined benefit plans (111) (370) (109) (367) Exchange differences on funding liabilities 14 1 18 5 Advance corporation tax paid (94) (94) (94) (94) Tax losses carried forward (85) (123) (85) (123) Fair value gains recognised on cash flow hedges 4 2 4 2 Share-based payments (9) (6) (9) (6) Deferred revenue in relation to loyalty reward programmes (17) Other items (2) (11) 3 (4)
As at 31 December 444 216 327 98
BA AR&A 2013 A4.indd 31BA AR&A 2013 A4.indd 31 03/03/2014 16:3403/03/2014 16:34

32
10 Tax continued c Deferred tax provision continued Movement in provision
Group Company
£ million 2013 2012 (Restated) 2013 2012 (Restated)
Balance at 1 January 216 394 98 349 Deferred tax credit relating to income statement (40) (73) (38) (162) Deferred tax charge/(credit) taken to statement of other comprehensive income 272 (90) 271 (89) Deferred tax credit taken to statement of changes in equity (4) (4) Acquisitions (15)
As at 31 December 444 216 327 98
d Other taxes The Group also contributed tax revenues through payment of transaction and payroll related taxes. A breakdown of these other taxes paid is as follows:
Group
£ million 2013 2012
UK Air Passenger Duty 600 572
Other ticket taxes 372 326 Payroll related taxes 175 166
Total 1,147 1,064
The UK Government has announced that the rate of Air Passenger Duty will increase by the rate of inflation (RPI) from 1 April 2014. e Factors that may affect future tax charges Following the change in ownership of the Group on 21 January 2011, UK pre-entry capital losses carried forward of £169 million (2012: £170 million) are held. These losses are available for offsetting against certain future UK chargeable gains, subject to the pre-entry losses legislation. No deferred tax asset has been recognised in respect of these capital losses as no further utilisation is currently anticipated. The Group has deferred taxation arising on chargeable gains by roll-over and hold-over relief claims that have reduced the tax basis of fixed assets by £69 million (2012: £69 million). No deferred tax liability has been recognised in respect of the crystallisation of these chargeable gains as they could be offset against the UK capital losses carried forward. The Group also has an unrecognised deferred tax asset of £51 million (2012: £51 million) arising from temporary differences in respect of future capital losses if UK properties that historically were eligible for industrial buildings allowances are realised at their residual value. The Group has overseas tax losses of £116 million (2012: £105 million) that are carried forward for offsetting against suitable future taxable profits. No deferred tax asset has been recognised in respect of these losses as their utilisation is not currently anticipated. The main rate of corporation tax reduced from 24% to 23% effective from 1 April 2013. Further reductions were substantively enacted in the year reducing the rate to 21% effective from 1 April 2014 and to 20% effective from 1 April 2015. The provision for deferred tax arising on differences between tax and accounting treatment at 31 December 2013 was calculated at the rates at which the differences are expected to reverse in future periods. No further reductions to the rate of UK corporation tax are currently anticipated.
11 Dividends The Directors have declared that no dividend will be paid for the year ended 31 December 2013 (2012: £nil).
BA AR&A 2013 A4.indd 32BA AR&A 2013 A4.indd 32 03/03/2014 16:3403/03/2014 16:34

33
12 Property, plant and equipment a Group Group
£ million Fleet Property Equipment Total Cost Balance at 1 January 2012 12,590 1,459 765 14,814 Additions 656 33 40 729 Acquisitions 108 1 109 Disposals (139) (7) (23) (169)
Reclassifications (6) (8) (14)
Balance as at 31 December 2012 13,209 1,477 783 15,469 Additions 1,188 40 46 1,274 Disposals (295) (2) (6) (303)
Reclassifications (132) (132)
As at 31 December 2013 13,970 1,515 823 16,308
Depreciation and impairment Balance at 1 January 2012 6,825 603 558 7,986 Charge for the year 601 50 45 696 Impairment charge¹ 15 15 Disposals (134) (7) (22) (163) Reclassifications (7) (7)
Balance as at 31 December 2012 7,300 646 581 8,527 Charge for the year 610 55 33 698 Impairment charge¹ 16 16 Disposals (292) (2) (6) (300) Reclassifications (120) (120)
As at 31 December 2013 7,514 699 608 8,821
Net book amounts
31 December 2013 6,456 816 215 7,487 31 December 2012 5,909 831 202 6,942
Analysis as at 31 December 2013 Owned 3,346 766 176 4,288 Finance leased 2,866 19 2,885
Progress payments 244 50 20 314
6,456 816 215 7,487
Analysis as at 31 December 2012 Owned 3,297 769 133 4,199 Finance leased 2,255 23 2,278 Hire purchase arrangements 73 73 Progress payments 265 62 46 373 Assets not in current use 19 19
5,909 831 202 6,942
Group
£ million 2013 2012
The net book amount of property comprises: Freehold 244 239 Long-leasehold improvements 269 267 Short-leasehold improvements² 303 325
As at 31 December 816 831
¹ The impairment charge of £16 million (2012: £15 million) relates to two Boeing 747-400 aircraft (2012: three Boeing 747-400 aircraft) which were permanently written down to their realisable value. ² Short-leasehold improvements relate to leasehold interests with a duration of less than fifty years. At 31 December 2013, bank and other loans of the Group are secured on fleet assets with a cost of £2,094 million (2012: £2,669 million) and letters of credit of £230 million in favour of the British Airways Pension Trustees are secured on certain aircraft (2012: £230 million).
BA AR&A 2013 A4.indd 33BA AR&A 2013 A4.indd 33 03/03/2014 16:3403/03/2014 16:34

34
12 Property, plant and equipment continued b Company Company
£ million Fleet Property Equipment Total Cost Balance at 1 January 2012 12,087 1,372 721 14,180 Additions 627 33 31 691 Disposals (133) (7) (15) (155) Reclassifications (6) (8) (14) Transfers from subsidiary company 73 1 74
Balance as at 31 December 2012 12,648 1,390 738 14,776 Additions 1,186 40 36 1,262 Disposals (291) (2) (4) (297) Reclassifications (132) (132)
As at 31 December 2013 13,411 1,428 770 15,609
Depreciation and impairment Balance at 1 January 2012 6,599 561 528 7,688 Charge for the year 570 47 40 657 Disposals (130) (7) (15) (152) Impairment charge¹ 15 15 Reclassifications (7) (7) Transfers from subsidiary company 4 4
Balance as at 31 December 2012 7,051 601 553 8,205 Charge for the year 586 53 27 666 Disposals (288) (2) (3) (293) Impairment charge¹ 16 16 Reclassifications (120) (120)
As at 31 December 2013 7,245 652 577 8,474
Net book amounts 31 December 2013 6,166 776 193 7,135 31 December 2012 5,597 789 185 6,571 Analysis as at 31 December 2013 Owned 3,071 726 158 3,955 Finance leased 2,851 19 2,870
Progress payments 244 50 16 310
6,166 776 193 7,135
Analysis as at 31 December 2012 Owned 2,994 727 116 3,837 Finance leased 2,246 23 2,269 Hire purchase arrangements 73 73 Progress payments 265 62 46 373 Assets not in current use 19 19
5,597 789 185 6,571
Company £ million 2013 2012
The net book amount of property comprises: Freehold 204 197 Long-leasehold improvements 269 267 Short-leasehold improvements² 303 325 As at 31 December 776 789 ¹ The impairment charge of £16 million (2012: £15 million) relates to two Boeing B747-400 aircraft (2012: three Boeing B747-400 aircraft) which were permanently written down to their realisable value. ² Short leasehold improvements relate to leasehold interests with a duration of less than fifty years. At 31 December 2013, bank and other loans of the Company are secured on fleet assets with a cost of £1,785 million (2012: £2,360 million) and letters of credit of £230 million in favour of the British Airways Pension Trustees are secured on certain aircraft (2012: £230 million). 13 Capital expenditure commitments Capital expenditure authorised and contracted for but not provided for in the accounts amounts to £6,914 million for the Group (2012: £3,940 million) and £6,894 million for the Company (2012: £3,924 million). The majority of capital expenditure commitments are denominated in US dollars, as such the commitments are subject to exchange movements.
The outstanding commitments include £6,849 million for the acquisition of 18 Airbus A350s (from 2018 to 2021), 38 Boeing 787s (from 2014 to 2021), seven Airbus A320s (2014), nine Airbus A380s (from 2014 to 2016), two Boeing 777s (2014) and an Embraer 190 (2014).
BA AR&A 2013 A4.indd 34BA AR&A 2013 A4.indd 34 03/03/2014 16:3403/03/2014 16:34

35
14 Non-current assets held for sale The non-current assets held for sale of £10 million in the Group and the Company represent four Boeing 737-400s and one Boeing 767-300 aircraft that have been permanently stood down and are due to exit the business within 12 months. These are held at depreciated cost which is expected to be less than the fair value less costs to sell. At 31 December 2012, a property acquired as part of the bmi acquisition with a fair value of £2 million was held for sale in the Group (Company: £nil) and was disposed during 2013, with no gain or loss arising on disposal.
15 Intangible assets a Group Group
£ million Goodwill Landing rights Emissions
allowances Software Total
Cost Balance at 1 January 2012 40 301 12 201 554 Additions 7 27 40 74 Acquisitions 408 408 Exchange differences (1) (1)
Balance as at 31 December 2012 40 715 39 241 1,035 Additions 12 10 70 92 Disposals (23) (23) Exchange differences 1 1
As at 31 December 2013 40 728 26 311 1,105
Amortisation Balance at 1 January 2012 59 148 207 Charge for the year 1 8 9
Balance as at 31 December 2012 60 156 216 Charge for the year¹ 8 8
As at 31 December 2013 60 164 224
Net book amounts 31 December 2013 40 668 26 147 881 31 December 2012 40 655 39 85 819
¹ Amortisation on non-EU based landing rights was less than £1 million for the period.
b Company Company
£ million Landing rights Emissions
allowances Software Total
Cost
Balance at 1 January 2012 264 12 200 476 Additions 7 27 40 74
Transfers from other subsidiary companies 408 408
Balance as at 31 December 2012 679 39 240 958
Additions 12 10 70 92 Disposals (23) (23)
As at 31 December 2013 691 26 310 1,027
Amortisation
Balance at 1 January 2012 49 148 197 Charge for the year 8 8
Balance as at 31 December 2012 49 156 205 Charge for the year 7 7
As at 31 December 2013 49 163 212
Net book amounts 31 December 2013 642 26 147 815 31 December 2012 630 39 84 753
BA AR&A 2013 A4.indd 35BA AR&A 2013 A4.indd 35 03/03/2014 16:3403/03/2014 16:34

36
16 Impairment of property, plant, equipment and intangible assets An annual impairment review is conducted on all intangible assets that have an indefinite economic life. Goodwill and landing rights based within the EU are considered to have an indefinite economic life. The impairment review is carried out at the level of a ‘cash-generating unit’ (CGU), defined as the smallest identifiable group of assets, liabilities and associated intangible assets that generate cash inflows that are largely independent of the cash flows from other assets or groups of assets. On this basis, an impairment review has been conducted on two CGUs. An impairment review was performed on the network airline operations CGU, including passenger and cargo operations out of all operated airports as well as all related ancillary operations as it contains both goodwill and landing rights within the EU. A separate impairment review has been conducted on the operations of the OpenSkies CGU as it contains landing rights within the EU. An impairment review involves the comparison of the carrying value of the CGU to the recoverable amount. An impairment charge is recognised to the extent that the carrying value exceeds the recoverable amount. a Network airline operations
2013 2012
£ million Emissions
allowances Landing
rights Goodwill Total Emissions
allowances Landing
rights Goodwill Total
Network airline operations 26 642 40 708 39 630 40 709
The recoverable amount of the network airline operations has been measured based on its value in use, using a discounted cash flow model. Cash flow projections are based on the business plan approved by the Board covering a five-year period. Cash flows beyond the five-year period are projected to increase in line with the long-term growth rate of the main economies in which BA operates. The pre-tax discount rate applied to the cash flow projections is derived from the Group’s post-tax weighted average cost of capital, adjusted for the risks specific to the assets. No impairment charge has arisen as a result of the review performed on the network airline operations. No reasonable possible change in the key assumptions for the network airline operation would cause the carrying amount of goodwill and intangible assets with indefinite economic life to exceed the recoverable amount.
Key assumptions
2013 2012
Pre-tax discount rate (derived from the long-term weighted average cost of capital) 10.0% 10.0% Long-term growth rate 2.5% 2.5% Operating margin range 8.0% - 11.2% 4.6% - 8.5% Fuel price range per barrel $100 - $110 $100 - $110
BA AR&A 2013 A4.indd 36BA AR&A 2013 A4.indd 36 03/03/2014 16:3403/03/2014 16:34

37
16 Impairment of property, plant, equipment and intangible assets continued b OpenSkies
2013 2012
£ million Landing rights Total Landing rights Total
Carrying value of OpenSkies’ intangible assets¹ 26 26 25 25
¹ Included within total intangible assets allocated to the OpenSkies CGU are £20 million (2012: £18 million) of indefinite life intangible assets. The recoverable amount of the OpenSkies CGU has been measured on its value in use, using a discounted cash flow model. Cash flow projections are based on the forecast approved by the Board covering a one-year period. Cash flows for the next four years have been projected in line with expected growth using the latest one year forecast approved by the Board. This includes consideration of historic and future growth in the countries that OpenSkies operates. Cash flows beyond the five-year period are projected to increase in line with the long-term growth rate of the main economies in which OpenSkies operates. The pre-tax discount rate applied to the cash flow projections is derived from OpenSkies’ post-tax weighted average cost of capital, adjusted for the risks specific to the assets. The impairment review of OpenSkies resulted in no impairment during the year (2012: no impairment). The recoverable amount of the assets within OpenSkies exceeds the carrying value by £3 million (2012: £9 million). If the discount rate were increased by 60 basis points (2012: 170 basis points) or the operating margin were to decrease by 9 per cent (2012: 22 per cent), the headroom would amount to £nil. Key assumptions
2013 2012
Pre-tax discount rate (derived from the long-term weighted average cost of capital) 10.0% 10.0% Long-term growth rate 2.1% 2.5% Operating margin range (8.4)% - 3.8% (7.8)% - 4.6% Fuel price range per barrel $100 - $110 $100 - $110
The operating margins of both CGUs are based on the estimated effects of planned business efficiency and business change programmes, approved and enacted at the balance sheet date. The trading environment is subject to both regulatory and competitive pressures that can have a material effect on the operating performance of the business. c Impairment of Fleet During the year ended 31 December 2013 two Boeing 747-400 aircraft were written down to their net realisable value and an impairment charge of £16 million was realised. One of the aircraft was permanently stood down in December 2013, whilst the other was permanently stood down in January 2014.
BA AR&A 2013 A4.indd 37BA AR&A 2013 A4.indd 37 03/03/2014 16:3403/03/2014 16:34

38
17 Investments a Group
Investment in associates Group
£ million 2013 2012
Balance at 1 January 174 232 Exchange differences 5 (4) Share of attributable results (65) (66) Share of movements on other reserves 1 12
As at 31 December 115 174
Details of the principal investments that the Group accounts for as associates using the equity method are set out below:
Percentage of equity owned Principal activities Holding
Country of incorporation and principal operations
IB Opco Holding S.L ('Iberia')¹ 13.55 Airline operations Ordinary shares Spain
¹ Held by a subsidiary company
While the Group holds less than 20 per cent of the issued share capital of Iberia, it accounts for its investment in Iberia as an associate as it has the ability to exercise significant influence over the investment due to its voting power (both through its equity holding and its representation on key decision-making committees) and the nature of its commercial relationships with Iberia.
The following summarised financial information of the Group’s investment in associates is shown based on the Group’s share of results and net assets:
Group
£ million 2013 2012
Non-current assets 403 369 Current assets 194 202 Current liabilities (266) (228) Non-current liabilities (224) (177)
Share of net assets 107 166
Goodwill attributable to investments in associates 8 8
Revenues 472 529 Net loss after tax (65) (66)
b Company
A summary of the Company’s investments in subsidiaries is set out below: Company
Total Total
£ million Cost Provisions 2013 2012
Balance at 1 January 3,494 (1,122) 2,372 2,304 Exchange differences 5 5 (4) Additions 87 87 93 Provision (11) (11) (21)
As at 31 December 3,586 (1,133) 2,453 2,372
The Group and Company's principal investments in subsidiaries, associates and other investments are listed on pages 70 and 72.
BA AR&A 2013 A4.indd 38BA AR&A 2013 A4.indd 38 03/03/2014 16:3403/03/2014 16:34

39
18 Available-for-sale financial assets Group Company
£ million 2013 2012 2013 2012
Listed securities
International Consolidated Airlines Group S.A. 7 12 7 12 Flybe Group Plc 12 6 Comair Limited 10 5
Unlisted securities (see note 27) 10 16 10 16
39 39 17 28
19 Trade receivables and other assets Other non-current assets are set out below:
Group Company
£ million 2013 2012 2013 2012
Prepayments and accrued income 13 13 Other debtors 46 12 46 10 Amounts owed by subsidiaries 147 152
Other non-current assets 59 25 193 162
Trade receivables and other current assets are set out below:
Group Company
£ million 2013 2012 2013 2012
Trade receivables 552 502 541 495 Provision for doubtful receivables (19) (14) (19) (14)
Net trade receivables 533 488 522 481
Prepayments and accrued income 238 218 146 144 Other debtors 100 175 98 165 Amounts owed by subsidiaries 252 430
Trade receivables and other current assets 871 881 1,018 1,220
During the period the Group wrote £2 million (2012: £3 million) of receivables off against the provision (Company: 2013: £2 million; 2012: £3 million).
The aging analysis of trade receivables is as follows: Group Company £ million 2013 2012 2013 2012
Neither past due nor impaired 466 417 458 414 Past due but not impaired: < 30 days 34 37 32 33 30 - 60 days 15 22 15 22 > 60 days 18 12 17 12
Net trade receivables 533 488 522 481
Trade receivables are generally non-interest-bearing and on 30 days terms.
BA AR&A 2013 A4.indd 39BA AR&A 2013 A4.indd 39 03/03/2014 16:3403/03/2014 16:34

40
20 Cash, cash equivalents and other current interest-bearing deposits a Cash and cash equivalents
Group Company £ million 2013 2012 2013 2012
Cash at bank and in hand 606 469 538 407 Short-term deposits falling due within three months 24 12 24 12
Cash and cash equivalents 630 481 562 419
Other current interest-bearing deposits maturing after three months 1,220 1,118 1,220 1,116
Cash at bank is primarily held in AAA money market funds and bank deposits. Short-term deposits are made for periods up to three months depending on the cash requirements of the Group and earn interest based on the floating deposit rates. The fair value of cash and cash equivalents is £630 million for the Group (2012: £481 million) and £562 million for the Company (2012: £419 million). At 31 December 2013, the Group and Company had no outstanding bank overdrafts (2012: £nil). Other current interest-bearing deposits are made for periods in excess of three months with maturity typically within 12 months and earn interest based on the market rates available at the time the deposit was made.
b Reconciliation of net cash flow to movement in net debt
Group £ million 2013 2012
Increase/(decrease) in cash and cash equivalents from continuing operations 140 (36) Net cash flow used in discontinued operations (36) (107) Increase/(decrease) in other current interest-bearing deposits 102 (141) Interest bearing borrowings acquired through business combinations (27) Net cash outflow from decrease in debt and lease financing 513 482 New loans and finance leases taken out and hire purchase arrangements made (997) (430) Conversion of convertible bond to equity 349
Decrease/(increase) in net debt resulting from cash flow 71 (259) Exchange differences and other non-cash movements 54 80
Decrease/(increase) in net debt during the year 125 (179) Net debt at 1 January (2,093) (1,914)
Net debt as at 31 December (1,968) (2,093)
21 Trade and other payables
Group Company
£ million 2013 2012 2013 2012
Trade creditors 940 979 898 937 Amounts owed to subsidiary companies 2,704 2,911 Other creditors¹ 404 343 399 337 Other taxation and social security 35 32 32 29 Sales in advance of carriage¹ 1,453 1,235 1,369 1,178 Accruals and deferred income² 1,241 1,011 1,012 770
As at 31 December 4,073 3,600 6,414 6,162
¹ The Group and Company have reclassified £382 million of payables in the 2012 comparative from 'other creditors' to 'sales in advance of carriage' following a change in the Group's definition of each type of payable. ² Includes deferred income from customer loyalty programmes of £985 million (2012: £782 million) for the Group and £813 million (2012: £600 million) for the Company.
BA AR&A 2013 A4.indd 40BA AR&A 2013 A4.indd 40 03/03/2014 16:3403/03/2014 16:34

41
22 Other long-term liabilities Group Company
£ million 2013 2012 2013 2012
Other creditors 8 Accruals and deferred income 127 177 98 147
As at 31 December 127 185 98 147
23 Long-term borrowings Group Company
£ million 2013 2012 2013 2012
a Current Bank and other loans¹ 141 185 105 151 Finance leases² 224 276 240 290 Hire purchase arrangements 5 5 Loans from subsidiaries 13 12
As at 31 December 365 466 358 458
b Non-current Bank and other loans¹ 692 1,187 454 912 Finance leases² 2,761 2,039 2,861 2,156 Loans from subsidiaries 379 372
As at 31 December 3,453 3,226 3,694 3,440
¹ Bank and other loans are repayable up to the year 2024. Bank and other loans of the Group amounting to £554 million (2012: £768 million) and bank loans of the
Company amounting to £280 million (2012: £459 million) are secured on aircraft. Finance leases and hire purchase arrangements are all secured on aircraft or other property, plant and equipment.
² Included in finance leases for the Company is £126 million (2012: £143 million) of finance leases with subsidiaries of the Group, of which £19 million (2012: £17 million) is
classified as current.
BA AR&A 2013 A4.indd 41BA AR&A 2013 A4.indd 41 03/03/2014 16:3403/03/2014 16:34

42
23 Long-term borrowings continued c Bank and other loans Bank and other loans comprise the following: Group Company £ million 2013 2012 2013 2012
£350 million fixed rate 5.8 per cent convertible bond 2014 (i) 312 312 £250 million fixed rate 8.75 per cent eurobonds 2016 (ii) 249 249 249 249 Floating rate sterling mortgage loans secured on aircraft (iii) 119 138 87 102 Floating rate US dollar mortgage loans secured on aircraft (iv) 65 80 57 68 Fixed rate sterling mortgage loans secured on aircraft (v) 107 120 Floating rate Japanese yen mortgage loans secured on aircraft (vi) 84 237 84 236 Floating rate US dollar mortgage loans secured on plant and equipment (vii) 15 22 15 22 Floating rate euro mortgage loan secured on aircraft (viii) 52 53 52 53 Fixed rate US dollar mortgage loan secured on aircraft (ix) 127 140 European Investment Bank sterling loans secured on property (x) 15 21 15 21
833 1,372 559 1,063 Less: current instalments due on bank and other loans 141 185 105 151
Non-current bank and other loans as at 31 December 692 1,187 454 912
(i) In August 2009, BA issued a £350 million 5.8 per cent fixed interest convertible bond. The terms of the bond allowed conversion into IAG shares
at an effective conversion price of £1.89 per share at the option of the holder on or before August 2014. BA also had an option to redeem the bonds early at their principal amount together with accrued but unpaid interest subject to specific conditions. During the year, these conditions were met, and BA called for the early redemption of the outstanding £349 million bond principal which resulted in full conversion.
(ii) £250 million fixed rate 8.75 per cent unsecured eurobonds 2016 are repayable in one instalment on 23 August 2016. (iii) Floating rate sterling mortgage loans are secured on specific aircraft assets of the Group and bear interest of between 0.53 per cent and 0.69 per
cent above LIBOR. The loans are repayable between 2015 and 2019. (iv) Floating rate US dollar mortgage loans are secured on specific aircraft assets of the Group and bear interest between 0.98 and 2.40 per cent
above LIBOR. The loans are repayable between 2015 and 2017. (v) Fixed rate sterling mortgage loans are secured on specific aircraft assets of the Group and bear interest of between 6.1 per cent and 6.3 per cent.
The loans are repayable between 2016 and 2018. (vi) Floating rate Japanese yen mortgage loans are secured on specific aircraft assets of the Group and bear interest of 0.55 per cent above LIBOR.
The loans are repayable between 2014 and 2016. (vii) Floating rate US dollar mortgage loans are secured on certain plant and equipment of the Group and bear interest of 0.75 per cent above LIBOR.
The loans are repayable in 2014. (viii) The floating rate euro mortgage loan is secured on specific aircraft assets of the Group and bears interest of 0.5 per cent above LIBOR. The loan
is repayable in 2024. (ix) Fixed rate US dollar mortgage loans are secured on specific aircraft assets of the Group. These loans bear interest of between 3.81 per cent and
4.76 per cent and are repayable between 2021 and 2024. (x) European Investment Bank sterling loans are secured on certain property assets of the Group and bear interest of between 0.2 per cent and 0.0
per cent below LIBOR. The loans are repayable between 2014 and 2017.
BA AR&A 2013 A4.indd 42BA AR&A 2013 A4.indd 42 03/03/2014 16:3403/03/2014 16:34

43
23 Long-term borrowings continued
d Total loans, finance leases and hire purchase arrangements Group Company
£ million 2013 2012 2013 2012
Loans: Bank: US dollar $338 $393 $117 $145 euro €62 €65 €62 €65 Japanese yen ¥14,259 ¥32,268 ¥14,259 ¥32,268 Sterling £240 £279 £102 £123 £584 £811 £310 £502 Fixed rate bonds: Sterling £249 £561 £249 £561 Loans from subsidiary undertakings:
US dollar $229 $228
euro €300 €300 £392 £384 Finance leases: US dollar $2,701 $2,081 $2,685 $2,061 euro € 416 €127 €416 €127 Japanese yen ¥18,557 ¥9,332 ¥18,557 ¥9,332 Sterling £874 £862 £1,000 £1,005 £2,985 £2,315 £3,101 £2,446 Hire purchase arrangements:
US dollar $8 $8 £5 £5
As at 31 December £3,818 £3,692 £4,052 £3,898
e Obligations under finance leases and hire purchase contracts The Group uses finance leases and hire purchase contracts principally to acquire aircraft. These leases have both renewal options and purchase options exercisable at the option of the Group. Future minimum lease payments under finance leases and hire purchase contracts are as follows:
Group Company
£ million 2013 2012 2013 2012
Future minimum payments due: Within one year 289 335 312 356 After more than one year but within five years 1,531 1,146 1,628 1,243 In five years or more 1,531 1,086 1,547 1,124
3,351 2,567 3,487 2,723 Less: finance charges 366 247 386 272
Present value of minimum lease and hire purchase payments 2,985 2,320 3,101 2,451
The present value of minimum lease and hire purchase payments is analysed as follows: Within one year 224 281 240 295 After more than one year but within five years 1,343 1,005 1,427 1,086 In five years or more 1,418 1,034 1,434 1,070
As at 31 December 2,985 2,320 3,101 2,451
BA AR&A 2013 A4.indd 43BA AR&A 2013 A4.indd 43 03/03/2014 16:3403/03/2014 16:34
44
24 Operating lease commitments The Group has entered into commercial leases on certain properties, equipment and aircraft. These leases have durations ranging from five years for aircraft to 133 years for ground leases. Certain leases contain options for renewal. The aggregate payments for which there are commitments under operating leases fall due as follows:
a Fleet
Group Company
£ million 2013 2012 2013 2012
Within one year 98 111 65 55 Between one and five years 353 205 289 101 Over five years 206 86 206 84
As at 31 December 657 402 560 240
b Property and equipment
Group Company
£ million 2013 2012 2013 2012
Within one year 85 87 82 78 Between one and five years 249 274 241 246 Over five years 1,641 1,689 1,641 1,642
As at 31 December 1,975 2,050 1,964 1,966
c Sub-leasing
The Group and Company sub-lease surplus rental properties and aircraft assets held under non-cancellable leases to third parties and subsidiary companies. These leases have remaining terms of one to 33 years. Future minimum rentals receivable under non-cancellable operating leases are as follows:
Group Company
£ million 2013 2012 2013 2012
Property and equipment
Within one year 5 8 5 8
Between one and five years 7 11 7 11 Over five years 2 2
As at 31 December 14 19 14 19
BA AR&A 2013 A4.indd 44BA AR&A 2013 A4.indd 44 03/03/2014 16:3403/03/2014 16:34

45
25 Provisions for liabilities Group
£ million Restoration and
handback Restructuring Legal claims Other Total
Balance at 1 January 2013 Current 42 42 113 95 292 Non-current 159 5 80 244
201 42 118 175 536 Arising during the year in: Continuing operations 38 14 10 48 110 Discontinued operations 3 3 Utilised (39) (27) (82) (90) (238) Release of unused amounts (15) (15) (28) (39) (97) Exchange differences (1) 2 (3) (2) Unwinding of discount
1 6 3 10
As at 31 December 2013 188 14 26 94 322
Analysis: Current 32 14 25 66 137 Non-current 156 1 28 185
188 14 26 94 322
Company
£ million Restoration and
handback Restructuring Legal claims Other Total
Balance at 1 January 2013 Current 10 41 106 51 208 Non-current 85 5 11 101
95 41 111 62 309
Arising during the year 29 12 10 45 96 Utilised (4) (26) (80) (47) (157) Release of unused amounts (5) (14) (23) (5) (47) Exchange differences (1) 2 (3) (2) Unwinding of discount 1 6 7
As at 31 December 2013 115 13 26 52 206
Analysis: Current 15 13 25 41 94 Non-current 100 1 11 112
115 13 26 52 206
Restoration and handback costs include provision for the costs to meet the contractual return conditions on aircraft held under operating leases. The provision also includes amounts relating to leased land and buildings where restoration costs are contractually required at the end of the lease. Where such costs arise as a result of capital expenditure on the leased asset, the restoration costs are also capitalised. The Company is subject to investigations into cargo and/or passenger fuel surcharges and related litigation in various jurisdictions, during the year £28 million was paid in relation to certain of these (2012: £60 million). The Company is also subject to multi-party claims from groups of employees on a number of matters relating to its operations including claims for additional holiday pay and for age discrimination. During the year settlements were reached with regards to some of these claims. The final amount required to pay the remaining claims and fines is subject to uncertainty. Other provisions include: compensation due to customers whose flights were significantly delayed, unless the airline can prove that the delay was caused by circumstances beyond its control; a provision for the EU Emissions Trading Scheme that represents the excess of BA's CO2 emitted on a flight within the EU in excess of the EU Emission Allowances granted; and provisions relating to unfavourable contracts.
BA AR&A 2013 A4.indd 45BA AR&A 2013 A4.indd 45 03/03/2014 16:3403/03/2014 16:34

46
26 Financial risk management objectives and policies The Group is exposed to a variety of financial risks: market risk (including foreign currency risk, interest rate risk and fuel price risk), credit risk, capital risk and liquidity risk. The Group's overall risk management programme focuses on the unpredictability of financial markets and seeks to minimise potential adverse effects on the Group's financial performance. Group Treasury carries out financial risk management under governance approved by the Board. Group Treasury identifies, evaluates and hedges financial risks. The Board provides written principles for overall risk management, as well as written policies covering specific areas, such as foreign exchange risk, interest rate risk, credit risk, use of derivative financial instruments and investment of excess liquidity. a Fuel price risk The Group is exposed to fuel price risk. The Group's fuel price risk management strategy aims to provide the airline with protection against sudden and significant increases in oil prices while ensuring that the airline is not competitively disadvantaged in the event of a substantial fall in the price of fuel. The current Group strategy, as approved by the Board, is to hedge between 70 per cent and 100 per cent of fuel consumption for the next quarter; an average of 45 per cent between quarters two and five; and 10 per cent between quarters six and eight, with the flexibility to operate within +/- 10 per cent of the policy. In implementing the strategy, the fuel risk management programme allows for the use of a number of derivatives available on the over-the-counter (OTC) markets with approved counterparties and within approved limits. The following table demonstrates the sensitivity of financial instruments to a reasonably possible change in fuel prices, with all other variables held constant, on profit before tax and equity:
Group and Company
2013 2012
Increase/(decrease) in fuel price
Effect on profit before tax Effect on equity
Increase/(decrease) in fuel price
Effect on profit before tax Effect on equity
per cent £ million £ million per cent £ million £ million
Increase/(decrease) Increase/(decrease) Increase/(decrease) Increase/(decrease)
30 (4) 632 30 5 575 (30) (20) (552) (30) (14) (543)
The sensitivity analysis above shows that the profit on fuel derivatives in 2013 would have been adversely impacted if fuel prices had been 30% higher or 30% lower. This is because both price movements would reduce hedge ineffectiveness in the income statement.
BA AR&A 2013 A4.indd 46BA AR&A 2013 A4.indd 46 03/03/2014 16:3403/03/2014 16:34

47
26 Financial risk management objectives and policies continued b Foreign currency risk The Group is exposed to currency risk on revenue, purchases and borrowings that are denominated in a currency other than sterling. The currencies in which these transactions are primarily denominated are the US dollar, euro and Japanese yen. The Group generates a surplus in most currencies in which it does business. The US dollar is an exception as capital expenditure, debt repayments and fuel payments denominated in US dollars normally create a deficit. The Group can experience adverse or beneficial effects arising from foreign exchange rate movements. The Group seeks to reduce foreign exchange exposures arising from transactions in various currencies through a policy of matching, as far as possible, receipts and payments in each individual currency. Surpluses of convertible currencies are sold, either spot or forward, for US dollars or pounds sterling. Forward foreign exchange contracts and currency options are used to cover near-term future revenues and operating payments in a variety of currencies. The Group has substantial liabilities denominated in US dollar, euro and yen. The Group utilises its US dollar, euro and yen debt repayments as a hedge of future US dollar, euro and yen revenues. The following table demonstrates the sensitivity of financial instruments to a reasonably possible change in the US dollar, euro and yen exchange rates, with all other variables held constant, on profit/(loss) before tax and equity. These represent both the Group and the Company as the majority of the foreign currency risks are borne by the Company.
Strengthening/ (weakening) in US dollar
rate
Effect on profit
before tax
Effect on equity
Strengthening/ (weakening) in euro rate
Effect on profit
before tax
Effect on equity
Strengthening/ (weakening)
in yen rate
Effect on profit
before tax
Effect on equity
per cent £ million £ million per cent £ million £ million per cent £ million £ million
Group Increase /(decrease)
Increase /(decrease)
Increase /(decrease)
Increase /(decrease)
Increase /(decrease)
Increase /(decrease)
Increase /(decrease)
Increase /(decrease)
Increase /(decrease)
2013 10 9 10 10 (2) (108) 10 (3) (18) (10) (9) (6) (10) 2 116 (10) 3 18
201210 (9) (2) 10 4 (71) 10 (2) (28) (10) 9 5 (10) (4) 74 (10) 2 28
c Interest rate risk The Group is exposed to changes in interest rates on floating rate debt and cash deposits. Interest rate risk on borrowings is managed through determining the right balance of fixed and floating debt within the financing structure. Market conditions are considered when determining the desired balance of fixed and floating rate debt. Had there been a 50 basis point increase in interest rates, there would have been a £1 million (2012: £1 million) negative impact on the Group and Company’s shareholders’ equity and income statement. A 50 basis point decrease in interest rates would have resulted in a £1 million (2012: £1 million) positive impact on shareholders equity and the income statement for both the Group and the Company.
BA AR&A 2013 A4.indd 47BA AR&A 2013 A4.indd 47 03/03/2014 16:3403/03/2014 16:34

48
26 Financial risk management objectives and policies continued d Credit risk The Group is exposed to credit risk to the extent of non-performance by its counterparties in respect of financial assets receivable. However, the Group has policies and procedures in place to ensure credit risk is limited by placing credit limits on each counterparty. The Group continuously monitors counterparty credit limits and defaults of counterparties, incorporating this information into credit risk controls. Treasury activities, which include placing money market deposits, fuel hedging and foreign currency transactions could lead to a concentration of different credit risks on the same counterparty. This risk is managed by the allocation of an overall exposure limit for the counterparty that is then allocated down to specific treasury activities for that party. Exposures at the activity level are monitored on a daily basis and the overall exposure limit for the counterparty is reviewed at least monthly in the light of available market information such as credit ratings and credit default swap levels. It is the Group’s policy that all counterparties who wish to trade on credit terms are subject to credit verification procedures. The maximum exposure to credit risk is limited to the carrying value of each class of asset as summarised in note 27. The Group does not hold any collateral to mitigate this exposure. Credit risks arising from acting as guarantor are disclosed in note 32. e Liquidity risk Prudent liquidity risk management includes maintaining sufficient cash and interest-bearing deposits, the availability of funding from an adequate amount of credit facilities and the ability to close out market positions. Due to the dynamic nature of the underlying business, Group Treasury maintains flexibility in funding by maintaining availability under committed credit lines. The Company’s long-term corporate debt ratings as at 31 December 2013 assigned by Moody’s and Standard and Poor’s, respectively, were B1 and BB. The Group has adequate cash reserves to meet operating requirements for the next 12 months. The stability of the liquidity position is maintained through the Group having no financial covenants or material adverse change clauses in its drawn and undrawn debt facilities. In addition, fuel and currency hedging is carried out on an open credit basis with no collateralisation or margin call requirements. At 31 December 2013 the Group and Company had unused overdraft facilities of £10 million (2012: £10 million). The Group and Company held undrawn uncommitted money market lines of £25 million as at 31 December 2013 (2012: £25 million). The Group and Company had the following undrawn general and committed aircraft financing facilities: 31 December 2013
million Currency £ equivalent
US dollar facilities expiring December 2014 $936 573 US dollar facility expiring October 2015 $805 493 US dollar facility expiring September 2016 $805 493 US dollar facility expiring October 2016 $509 311 US dollar facility expiring December 2021 $1,164 712
Included in the above undrawn general and committed aircraft financing facilities are undrawn amounts of $431 million (£264 million) sourced from the current year issuance of the Group's EETC which generated a total of $927 million in available financing, and $170 million (£104 million) sourced from the related JOLCO facility of $369 million.
31 December 2012
million Currency £ equivalent
US dollar facility expiring June 2013 $156 96 US dollar facility expiring December 2014 $335 206 US dollar facility expiring October 2015 $805 496 US dollar facility expiring October 2016 $509 313 US dollar facility expiring December 2016 $966 595
BA AR&A 2013 A4.indd 48BA AR&A 2013 A4.indd 48 03/03/2014 16:3403/03/2014 16:34
49
26 Financial risk management objectives and policies continued e Liquidity risk continued The table below analyses the Group’s financial assets and liabilities into relevant maturity groupings based on the remaining period at the balance sheet date to the contractual maturity date. The amounts disclosed in the table are the contractual undiscounted cash flows and include interest. Group
£ million Within 6 months 6 - 12 months 1 - 2 years 2 - 5 years
More than 5 years
Total 2013
Financial Assets
Cash and cash equivalents 630 630 Other current interest-bearing deposits 594 634 1,228 Trade receivables 533 533 Other current assets 94 94 Other non-current assets 46 46 Derivative financial instruments: Forward currency contracts 1 1 2 Fuel derivatives 60 23 7 90 Financial Liabilities Interest-bearing loans and borrowings: Finance lease and hire purchase obligations (139) (150) (439) (1,092) (1,531) (3,351) Fixed rate borrowings (27) (35) (63) (408) (61) (594) Floating rate borrowings (72) (44) (110) (90) (43) (359) Trade and other payables (1,614) (1,614) Derivative financial instruments: Cross currency swaps (1) (1) (2) Forward currency contracts (28) (17) (7) (52) Fuel derivatives (1) (1) Currency option contracts (2) (3) (2) (7)
As at 31 December 29 409 (569) (1,591) (1,635) (3,357)
Group
£ million Within 6 months 6 - 12 months 1 - 2 years 2 - 5 years
More than 5 years
Total 2012
Financial Assets
Cash and cash equivalents 481 481 Other current interest-bearing deposits 762 365 1,127 Trade receivables 488 488 Other current assets 172 172 Other non-current assets 12 12 Derivative financial instruments: Forward currency contracts 1 1 Fuel derivatives 19 15 10 44 Financial Liabilities Interest-bearing loans and borrowings: Finance lease and hire purchase obligations (189) (146) (220) (926) (1,086) (2,567) Fixed rate borrowings (37) (45) (395) (436) (96) (1,009) Floating rate borrowings (87) (77) (152) (198) (51) (565) Trade and other payables (1,604) (1,604) Derivative financial instruments: Cross currency swaps (1) (1) (2) Forward currency contracts (12) (8) (3) (23) Fuel derivatives (4) (3) (1) (8) Currency option contracts (1) (1) (1) (3)
Convertible bond derivative liability (62) (62)
As at 31 December (11) 100 (813) (1,561) (1,233) (3,518)
BA AR&A 2013 A4.indd 49BA AR&A 2013 A4.indd 49 03/03/2014 16:3403/03/2014 16:34

50
26 Financial risk management objectives and policies continued e Liquidity risk continued Company
£ million Within 6 months 6 - 12 months 1 - 2 years 2 - 5 years
More than 5 years
Total 2013
Financial Assets
Cash and cash equivalents 562 562 Other interest bearing deposits 594 634 1,228 Trade receivables 522 522 Other current assets 345 345 Other non-current assets 193 193 Derivative financial instruments: Forward currency contracts 1 1 2 Fuel derivatives 60 23 7 90 Financial Liabilities Interest-bearing loans and borrowings: Finance lease and hire purchase obligations (150) (162) (462) (1,166) (1,547) (3,487) Fixed rate borrowings (28) (29) (57) (378) (661) (1,153) Floating rate borrowings (65) (42) (101) (70) (40) (318) Trade and other payables (4,077) (4,077) Derivative financial instruments: Cross currency swaps (1) (1) (2) Forward currency contracts (28) (17) (7) (52) Fuel derivatives (1) (1) Currency option contracts (2) (3) (2) (7)
As at 31 December (2,267) 405 (430) (1,615) (2,248) (6,155)
Company
£ million Within 6 months 6 - 12 months 1 - 2 years 2 - 5 years
More than 5 years
Total 2012
Financial Assets
Cash and cash equivalents 419 419 Other current interest-bearing deposits 759 365 1,124 Trade receivables 481 481 Other current assets 591 591 Other non-current assets 162 162 Derivative financial instruments: Forward currency contracts 1 1 Fuel derivatives 19 15 10 44 Financial Liabilities Interest-bearing loans and borrowings: Finance lease and hire purchase obligations (199) (157) (242) (1,001) (1,124) (2,723) Fixed rate borrowings (39) (39) (389) (398) (679) (1,544) Floating rate borrowings (80) (74) (143) (175) (42) (514) Trade and other payables (4,233) (4,233) Derivative financial instruments: Cross currency swaps (1) (1) (2) Forward currency contracts (12) (8) (3) (23) Fuel derivatives (5) (2) (1) (8) Currency option contracts (1) (1) (1) (3) Convertible bond derivative liability (62) (62)
As at 31 December (2,299) 99 (670) (1,575) (1,845) (6,290)
f Master netting or similar agreements The Group enters into derivative transactions under master netting agreements. In general, under such agreements the amounts owed by each counterparty on a single day in respect of all transactions outstanding are aggregated into a single net amount that is payable by one party to the other. In certain circumstances, for example when a credit event such as a default occurs, all outstanding transactions under the agreement are terminated. The termination value is assessed and only a single amount is payable in settlement of all transactions. Certain transactions do not meet the criteria for offsetting in the balance sheet. This is because the Group does not have any current legally enforceable right to offset recognised amounts, because the right to offset is enforceable only on the occurrence of future events such as a default on the bank loans or other credit events.
BA AR&A 2013 A4.indd 50BA AR&A 2013 A4.indd 50 03/03/2014 16:3403/03/2014 16:34

51
26 Financial risk management objectives and policies continued f Master netting or similar agreements continued The following table sets out the carrying amounts of derivatives recognised in the Group and Company balance sheet that are subject to the above.
Group and Company
£ million
Gross value of financial
instruments
Financial instruments that are offset under
netting agreements
Net amounts of financial
instruments in the balance
sheet
Related financial instruments that
are not offset Net amount
31 December 2013
Financial assets - Forward currency contracts 2 2 (2) - Currency option contracts 2 (2) - Fuel derivatives 110 (20) 90 (1) 89
114 (22) 92 (3) 89
Financial liabilities
- Forward currency contracts (52) (52) 2 (50) - Currency option contracts (9) 2 (7) (7) - Cross currency swaps (2) (2) (2) - Fuel derivatives (21) 20 (1) 1
(84) 22 (62) 3 (59)
30 30 30
Group and Company
£ million
Gross value of financial
instruments
Financial instruments that are offset under
netting agreements
Net amounts of financial
instruments in the balance
sheet
Related financial instruments that
are not offset Net amount
31 December 2012
Financial assets - Forward currency contracts 1 1 (1) - Currency option contracts 2 (2) - Fuel derivatives 80 (36) 44 (2) 42
83 (38) 45 (3) 42
Financial liabilities
- Forward currency contracts (23) (23) 1 (22) - Currency option contracts (5) 2 (3) (3) - Cross currency swaps (2) (2) (2) - Fuel derivatives (44) 36 (8) 2 (6) - Convertible bond derivative liability (62) (62) (62)
(136) 38 (98) 3 (95)
(53) (53) (53)
g Capital risk management The Group's objectives when managing capital are to safeguard the Group's ability to continue as a going concern in order to provide returns for shareholders and benefits for other stakeholders and to maintain an optimal capital structure to reduce the cost of capital. Consistent with others in the industry, the Group monitors capital on the basis of the gearing ratio, net debt as a percentage of total capital. Net debt is defined as the total borrowings, finance leases and hire purchase liabilities, net interest-bearing deposits and cash and cash equivalents less overdrafts. Total capital is defined as the total of capital, reserves, non-controlling interests and net debt.
BA AR&A 2013 A4.indd 51BA AR&A 2013 A4.indd 51 03/03/2014 16:3403/03/2014 16:34
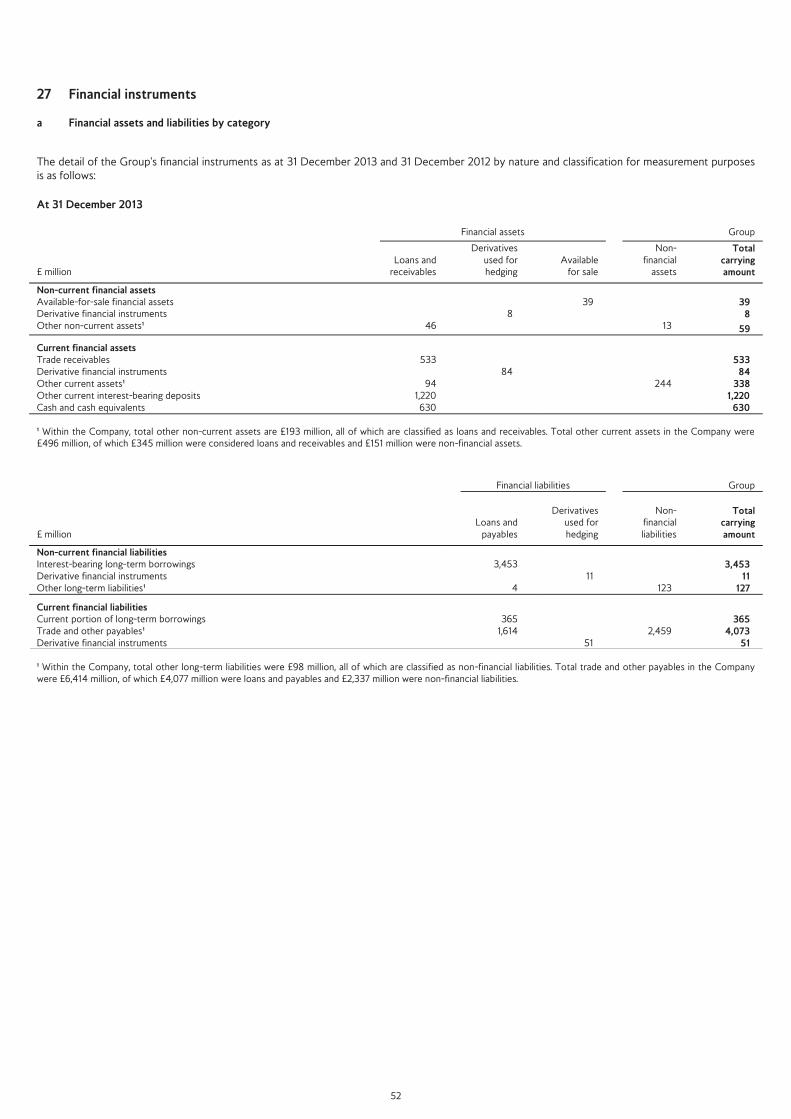
52
27 Financial instruments a Financial assets and liabilities by category The detail of the Group's financial instruments as at 31 December 2013 and 31 December 2012 by nature and classification for measurement purposes is as follows:
At 31 December 2013
Financial assets Group
£ million
Loans and
receivables
Derivatives used for hedging
Available for sale
Non-financial
assets
Total carrying amount
Non-current financial assets Available-for-sale financial assets 39 39 Derivative financial instruments 8 8 Other non-current assets¹ 46 13 59
Current financial assets Trade receivables 533 533 Derivative financial instruments 84 84 Other current assets¹ 94 244 338 Other current interest-bearing deposits 1,220 1,220 Cash and cash equivalents 630 630 ¹ Within the Company, total other non-current assets are £193 million, all of which are classified as loans and receivables. Total other current assets in the Company were £496 million, of which £345 million were considered loans and receivables and £151 million were non-financial assets.
Financial liabilities Group
£ million Loans and
payables
Derivatives used for hedging
Non-financial liabilities
Total carrying amount
Non-current financial liabilities Interest-bearing long-term borrowings 3,453 3,453 Derivative financial instruments 11 11 Other long-term liabilities¹ 4 123 127
Current financial liabilities Current portion of long-term borrowings 365 365 Trade and other payables¹ 1,614 2,459 4,073 Derivative financial instruments 51 51 ¹ Within the Company, total other long-term liabilities were £98 million, all of which are classified as non-financial liabilities. Total trade and other payables in the Company were £6,414 million, of which £4,077 million were loans and payables and £2,337 million were non-financial liabilities.
BA AR&A 2013 A4.indd 52BA AR&A 2013 A4.indd 52 03/03/2014 16:3403/03/2014 16:34

53
27 Financial instruments continued
a Financial assets and liabilities by category continued
At 31 December 2012
Financial assets Group
£ million Loans and
receivables
Derivatives used for hedging
Available for sale
Non-financial
assets
Total carrying amount
Non-current financial assets Available-for-sale financial assets 39 39 Derivative financial instruments 8 8 Other non-current assets¹ 12 13 25
Current financial assets Trade receivables 488 488 Derivative financial instruments 37 37 Other current assets¹ 172 221 393 Other current interest-bearing deposits 1,118 1,118 Cash and cash equivalents 481 481
¹ Within the Company, total other non-current assets are £162 million, all of which are classified as loans and receivables. Total other current assets in the Company are £739 million, of which £591 million are considered loans and receivables and £148 million are non-financial assets.
Financial liabilities Group
£ million Loans and
payables
Financial liabilities at FV through
P&L
Derivatives used for hedging
Non-financial liabilities
Total carrying amount
Non-current financial liabilities Interest-bearing long-term borrowings 3,226 3,226 Derivative financial instruments 62 5 67 Other long-term liabilities¹ 12 173 185
Current financial liabilities Current portion of long-term borrowings 466 466 Trade and other payables¹ 1,604 1,996 3,600 Derivative financial instruments 31 31
¹ Within the Company, the total of other long-term liabilities were £147 million, all of which are classified as non-financial liabilities. Total trade and other payables in the Company were £6,162 million, of which £4,233 million are considered loans and payables and £1,929 million are non-financial liabilities.
BA AR&A 2013 A4.indd 53BA AR&A 2013 A4.indd 53 03/03/2014 16:3403/03/2014 16:34

54
27 Financial instruments continued
b Fair values of financial assets and financial liabilities The fair values of the Group’s financial instruments are disclosed in hierarchy levels depending on the nature of the inputs used in determining the fair values as follows: Level 1: Quoted prices (unadjusted) in active markets for identical assets or liabilities; Level 2: Inputs other than quoted prices included within level 1, that are observable for the asset or liability, either directly or indirectly; and Level 3: Inputs for the asset or liability that are not based on observable market data. The carrying amounts and fair values of the Group's financial assets and liabilities as at 31 December 2013 are set out below: Group
Fair value Carrying value
£ million Level 1 Level 2 Level 3 Total Total
Financial assets: Available-for-sale financial assets¹ 29 10 39 39 Forward currency contracts² 2 2 2 Fuel derivatives² 90 90 90 Financial liabilities: Interest-bearing loans and borrowings: ¹ Finance lease and hire purchase obligations 3,125 3,125 2,985 Fixed rate borrowings 282 255 537 483 Floating rate borrowings 350 350 350 Cross currency swaps³ 2 2 2 Fuel derivatives³ 1 1 1 Forward currency contracts³ 52 52 52 Currency option contracts³ 7 7 7
¹ Within the Company, available-for-sale financial assets of £17 million are fair valued at £17 million (Level 1: £7 million and Level 3: £10 million), finance lease and hire purchase obligations of £3,101 million are fair valued at £3,254 million (Level 2), fixed rate borrowings of £641 million are fair valued at £671 million (Level 1: £517 million and Level 2: £155 million) and floating rate borrowings of £310 million are fair valued at £310 million (Level 2).
² Current portion of derivative financial assets is £84 million. ³ Current portion of derivative financial liabilities is £51 million.
The carrying amounts and fair values of the Group's financial assets and liabilities as at 31 December 2012 are set out below: Group
Fair value Carrying value
£ million Level 1 Level 2 Level 3 Total Total
Financial assets: Available-for-sale financial assets¹ 23 16 39 39 Forward currency contracts² 1 1 1 Fuel derivatives² 44 44 44 Financial liabilities: Interest-bearing loans and borrowings: ¹ Finance lease and hire purchase obligations 2,508 2,508 2,320 Fixed rate borrowings 646 294 940 821 Floating rate borrowings 551 551 551 Cross currency swaps³ 2 2 2 Fuel derivatives³ 8 8 8 Forward currency contracts³ 23 23 23 Currency option contracts³ 3 3 3 Convertible bond derivative liability³ 62 62 62
¹ Within the Company, available-for-sale financial assets of £28 million are fair valued at £28 million (Level 1: £12 million and Level 3: £16 million), finance lease and hire purchase obligations of £2,451 million are fair valued at £2,660 million (Level 2), fixed rate borrowings of £945 million are fair valued at £1,055 million (Level 1: £646 million and Level 2: £409 million) and floating rate borrowings of £502 million are fair valued at £502 million (Level 2). ² Current portion of derivative financial assets is £37 million. ³ Current portion of derivative financial liabilities is £31 million.
BA AR&A 2013 A4.indd 54BA AR&A 2013 A4.indd 54 03/03/2014 16:3403/03/2014 16:34

55
27 Financial instruments continued b Fair values of financial assets and financial liabilities continued The fair value of financial assets and liabilities is included at the amount at which the Group would expect to receive upon selling an asset or pay to transfer a liability in an orderly transaction between market participants at the measurement date. The fair value of cash and cash equivalents, other current interest bearing deposits, trade receivables, other current assets and trade and other payables approximate their carrying amounts largely due to the short-term maturities of these instruments. The following methods and assumptions were used by the Group in estimating its fair value disclosures for financial instruments: Available-for-sale financial assets and loan notes Listed fixed asset investments (Level 1) are stated at market value as at 31 December 2013. For unquoted investments (Level 3), the fair value cannot be measured reliably as such the assets are stated at historic cost less accumulated impairment losses. Forward currency transactions and over-the-counter (OTC) fuel derivatives These derivatives are entered into with various counter-parties, principally financial institutions with investment grade ratings. These are measured at the market value of instruments with similar terms and conditions at the balance sheet date (Level 2) using forward pricing models. Changes in counterparty and own credit risk are deemed to be not significant. Bank and other loans, finance leases, hire purchase arrangements and the non-Japanese yen denominated portions of hire purchase arrangements carrying fixed rates of interest The fair value of the Group’s interest-bearing borrowings and loans including leases, are determined by discounting the remaining contractual cash-flows at the relevant market interest rates as at 31 December 2013 (Level 2). Euro-sterling notes and Euro-sterling bond 2016 These are stated at quoted market value (Level 1). There have been no transfers between levels of the fair value hierarchy during the period. Out of the financial instruments listed in the table above, only the interest-bearing loans and borrowings are not measured at fair value on a recurring basis.
BA AR&A 2013 A4.indd 55BA AR&A 2013 A4.indd 55 03/03/2014 16:3403/03/2014 16:34
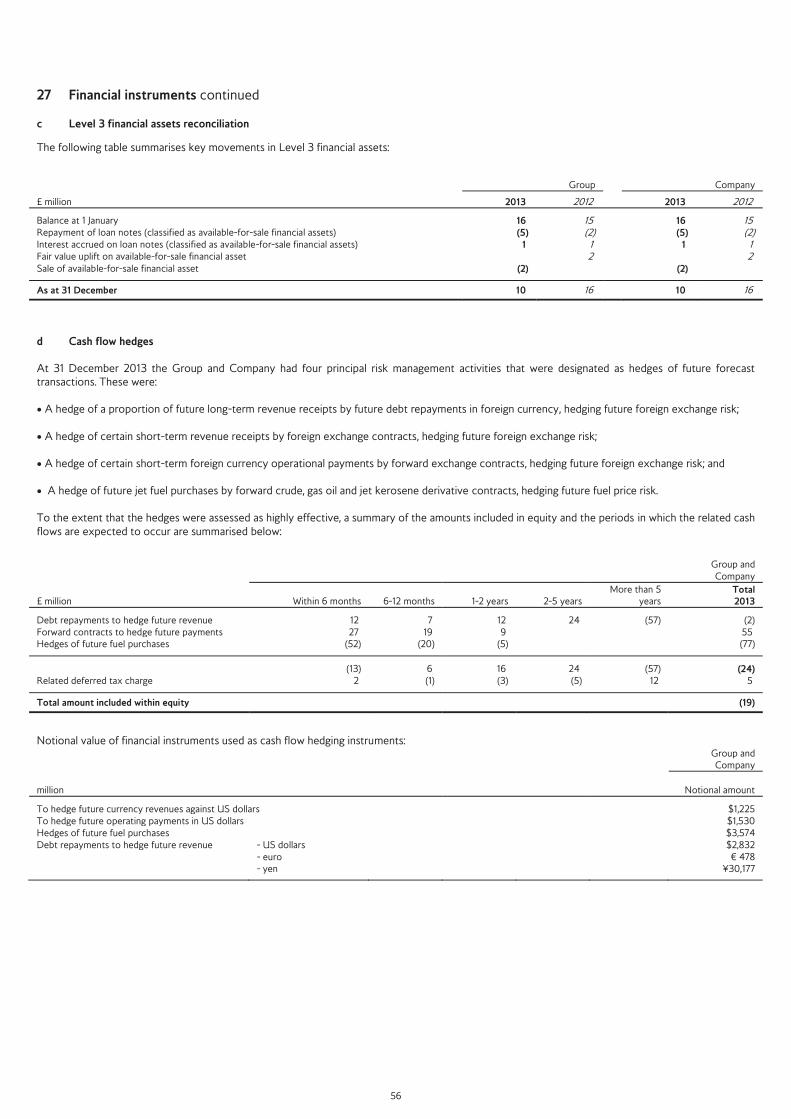
56
27 Financial instruments continued c Level 3 financial assets reconciliation
The following table summarises key movements in Level 3 financial assets:
Group Company
£ million 2013 2012 2013 2012
Balance at 1 January 16 15 16 15 Repayment of loan notes (classified as available-for-sale financial assets) (5) (2) (5) (2) Interest accrued on loan notes (classified as available-for-sale financial assets) 1 1 1 1 Fair value uplift on available-for-sale financial asset 2 2 Sale of available-for-sale financial asset (2) (2)
As at 31 December 10 16 10 16
d Cash flow hedges At 31 December 2013 the Group and Company had four principal risk management activities that were designated as hedges of future forecast transactions. These were:
A hedge of a proportion of future long-term revenue receipts by future debt repayments in foreign currency, hedging future foreign exchange risk;
A hedge of certain short-term revenue receipts by foreign exchange contracts, hedging future foreign exchange risk;
A hedge of certain short-term foreign currency operational payments by forward exchange contracts, hedging future foreign exchange risk; and
A hedge of future jet fuel purchases by forward crude, gas oil and jet kerosene derivative contracts, hedging future fuel price risk. To the extent that the hedges were assessed as highly effective, a summary of the amounts included in equity and the periods in which the related cash flows are expected to occur are summarised below:
Group and Company
£ million Within 6 months 6-12 months 1-2 years 2-5 years More than 5
years Total 2013
Debt repayments to hedge future revenue 12 7 12 24 (57) (2) Forward contracts to hedge future payments 27 19 9 55 Hedges of future fuel purchases (52) (20) (5) (77)
(13) 6 16 24 (57) (24) Related deferred tax charge 2 (1) (3) (5) 12 5
Total amount included within equity (19)
Notional value of financial instruments used as cash flow hedging instruments:
Group and Company
million
Notional amount
To hedge future currency revenues against US dollars $1,225 To hedge future operating payments in US dollars $1,530 Hedges of future fuel purchases $3,574 Debt repayments to hedge future revenue - US dollars $2,832 - euro € 478 - yen ¥30,177
BA AR&A 2013 A4.indd 56BA AR&A 2013 A4.indd 56 03/03/2014 16:3403/03/2014 16:34

57
27 Financial instruments continued d Cash flow hedges continued
Group and Company
£ million Within 6 months
6 - 12 months 1 - 2 years 2 - 5 years
More than 5 years Total 2012
Debt repayments to hedge future revenue 32 21 36 42 (17) 114 Forward contracts to hedge future payments 13 8 3 24 Hedges of future fuel purchases (17) (9) (7) (33)
28 20 32 42 (17) 105
Related deferred tax charge (24)
Total amount included within equity 81
Notional value of financial instruments used as cash flow hedging instruments:
Group and Company
million Notional amount
To hedge future currency revenues against US dollars $939 To hedge future operating payments against US dollars $1,115 Hedges of future fuel purchases $3,659 Debt repayments to hedge future revenue - US dollars $2,244 - euro € 192 - yen ¥38,370
The ineffective portion recognised in the income statement that arose from hedges of future fuel purchases amounts to a gain of £17 million (2012: £8 million gain). There was no ineffective portion of cash flow hedges other than hedges of future fuel purchases. Company The Company undertakes hedging activities on behalf of other companies within the Group and performs the treasury activities of the Group centrally. As a result, the disclosures above apply to the Company as for the Group.
28 Share capital Group and Company
2013 2012
Number of shares 000s £ million
Number of shares 000s £ million
Allotted, called up and fully paid A1 Ordinary shares of £289.7 each 897 260 897 260 A2 Ordinary shares of £289.7 each 99 29 99 29 B Ordinary shares of £1 each 1,000 1 1,000 1 C Ordinary shares of £1 each 148
As at 31 December 2,144 290 1,996 290
During the year, BA issued 148,000 C Ordinary shares to IAG for consideration of £575 million, resulting in an increase in share premium of £575 million to £1,512 million (2012: £937 million). The shares were issued in compensation for BA purchasing £575 million of IAG shares to settle the conversion to IAG shares of the outstanding £349 million 5.8% fixed interest convertible bond principal. The A1 and A2 class ordinary shareholders have full voting and economic rights in accordance with the percentage of shares held. The B class ordinary shareholders have full voting rights in accordance with the percentage of shares held, however have minimal economic rights attached to them. The C class ordinary shareholders have full economic rights in accordance with the percentage of shares held, however are non-voting.
BA AR&A 2013 A4.indd 57BA AR&A 2013 A4.indd 57 03/03/2014 16:3403/03/2014 16:34

58
29 Share options The Group operates share-based payment schemes as part of the total remuneration package provided to employees. These schemes comprise both share option schemes where employees acquire shares at a grant price and share award plans whereby shares are issued to employees at no cost, subject to the achievement by the Group of specified performance targets.
The share-based payments charge has been recorded as part of ‘employee costs’ (note 8) in the income statement as follows: £ million 2013 2012
BA granted schemes (a) 5 10 IPSP and IDBP schemes recharged from IAG (b) 9 5
Total share-based payments charge recorded in employee costs 14 15
a BA Granted Schemes
The share-based payment charge for BA granted schemes relates to the British Airways Performance Share Plan 2005 (PSP) – based on Total Shareholder Return performance conditions – and the British Airways Deferred Share Plan 2005 (DSP) – based on a service condition which requires employees to remain in employment for three years after the grant date. Shares issued under both the PSP and the DSP are at no cost to the employee. During 2013, the remaining PSP options lapsed as the performance conditions were not met. For the DSP options, the service condition was met and all outstanding options were exercised. The Group also has the British Airways Share Option Plan 1999 (SOP), from which options granted in 2004 and 2005 have vested and can be exercised at a set option exercise price at any time until the 10th anniversary of the date of grant. Outstanding options from BA granted schemes are set out below: Outstanding number of shares (millions) Options with an exercise price³ Options at no cost
2013 2012 2013 2012
As at 1 January 5 6 11 18 Exercised during the year¹ (2) (5) Expired/cancelled (1) (6) (7)
As at 31 December² 3 5 11
Of which exercisable 3 5
¹ The average share price at the date of exercise for options exercised was £3.02 (2012: £1.63). ² The weighted average remaining life of options is 1.08 years (2012: 1.66 years). ³ The shares outstanding at the year-end have an exercise price between £2.62 and £2.76 (2012: £1.57 and £2.76).
BA settles all options exercised with IAG shares, held in the balance sheet as ‘available-for-sale financial assets’. The Group monitors the number of listed IAG ordinary shares held against the exposure to exercisable options, investing in additional shares at appropriate intervals. At 31 December 2013, 1.8 million shares were held (2012: 6.1 million). b IPSP and IDBP schemes recharged from IAG
BA participates in two IAG share-based payment schemes, with awards to BA employees being made in plans operated by IAG that represent rights over its ordinary shares. The costs of these awards are recharged from IAG based on their determination of award fair values. The amount outstanding at the year end is disclosed in note 33 (related party transactions). A brief description of the schemes is set out below:
i) IAG Performance Share Plan
The IAG Performance Share Plan is granted to senior executives and managers of the Group who are most directly involved in shaping and delivering business success over the medium to long term. A conditional award of shares is subject to the achievement of a variety of performance conditions, which will vest after three years subject to the employee remaining employed by the Group. The award made will vest based 70 per cent on meeting Total Shareholder Return (TSR) performance conditions over the following three financial years and 30 per cent on achievement of IAG synergy targets. No payment is required from individuals when the shares are awarded.
ii) IAG Bonus Deferral Plan
The IAG Bonus Deferral Plan (IBDP) is granted to qualifying employees based on performance and service tests. It will be awarded when a bonus is triggered subject to the employee remaining in employment with the IAG Group for three years after the grant date. The relevant population will receive 50 per cent of their bonus in cash and the remaining 50 per cent in shares through the IBDP.
BA AR&A 2013 A4.indd 58BA AR&A 2013 A4.indd 58 03/03/2014 16:3403/03/2014 16:34

59
30 Other reserves and non-controlling interests a Group Group
£ million Retained earnings
Unrealised gains and
losses Currency
translation
Equity portion of convertible
bond Total
Non-controlling
interests¹
Balance previously reported as at 31 December 2011 1,603 (147) 36 (137) 1,355 200 Cumulative effect for prior periods² (1,148) (1,148)
Restated balance at 1 January 2012 455 (147) 36 (137) 207 200 Profit for the year 68 68 16 Exchange losses (4) (4) Fair value of cash flow hedges transferred to passenger revenue 53 53 Fair value of cash flow hedges transferred to fuel and oil costs (8) (8) Fair value of cash flow hedges transferred to currency differences (27) (27) Net change in fair value of cash flow hedges 79 79 Share of other movements in reserves of associates 12 12 Available-for-sale financial assets - marked to market 4 4 Pension remeasurements² (843) (843) Cost of share-based payment 10 10 Income tax 117 (27) 90 Distributions made to holders of perpetual securities (16)
Total income and expense for the year (636) 74 (4) (566)
Balance at 1 January 2013 (181) (73) 32 (137) (359) 200 Profit for the year 264 264 17 Exchange gains 1 1 Fair value of cash flow hedges transferred to passenger revenue 53 53 Fair value of cash flow hedges transferred to fuel and oil costs (21) (21) Fair value of cash flow hedges transferred to currency differences 5 5 Net change in fair value of cash flow hedges 91 91 Share of movement in reserves of associates 1 1 Available-for-sale financial assets - marked to market 15 15 Available-for-sale financial assets - recycled to the income statement (8) (8) Pension remeasurements² 628 628 Cost of share-based payment (8) (8) Income tax (180) (29) (209) Distributions made to holders of perpetual securities (17) Transfers between reserves (137) 137
Total income and expense for the year 568 106 1 137 812
As at 31 December 2013 387 33 33 453 200
¹ Non-controlling interests comprise €300 million of 6.75 per cent fixed coupon euro perpetual preferred securities issued by British Airways Finance (Jersey) L.P. in which
the general partner is British Airways Holdings Limited, a wholly-owned subsidiary of the Company. The holders of these securities have no rights against Group undertakings other than the issuing entity and, to the extent prescribed by the subordinated guarantee, the Company. The effect of the securities on the Group as a whole, taking into account the subordinated guarantee and other surrounding arrangements, is that the obligations to transfer economic benefits in connection with the securities do not go beyond those that would normally attach to preference shares issued by a UK company.
² Refer to note 2 ‘Summary of significant accounting policies’ for more information with regards to the adoption of revised IAS 19 ‘Employee Benefits’. Retained Earnings The retained earnings reserve represents the accumulated retained profits of the Group. Unrealised gains and losses The unrealised gains and losses reserve records fair value changes on available-for-sale investments and the portion of the gain or loss on a hedging instrument in a cash flow hedge that is determined to be an effective hedge. Currency translation reserve The currency translation reserve is used to record exchange differences arising from the translation of the financial statements of foreign subsidiaries and associates. Equity portion of convertible bond Following the conversion of the £350 million 5.8% convertible bond in 2013, £137 million was transferred from other reserves to retained earnings.
BA AR&A 2013 A4.indd 59BA AR&A 2013 A4.indd 59 03/03/2014 16:3403/03/2014 16:34

60
30 Other reserves and non-controlling interests continued b Company Company
£ million Retained earnings
Unrealised gains and losses
Equity portion of convertible
bond Total
Balance previously reported as at 31 December 2011 1,218 (150) (137) 931 Cumulative effect for prior periods¹ (1,148) (1,148)
Restated balance at 1 January 2012 70 (150) (137) (217) Profit for the year 483 483 Fair value of cash flow hedges transferred to passenger revenue 52 52 Fair value of cash flow hedges transferred to fuel and oil costs (8) (8) Fair value of cash flow hedges transferred to currency differences (27) (27) Net change in fair value of cash flow hedges 80 80 Movement in investments 4 4 Pension remeasurements¹ (841) (841) Cost of share-based payments 10 10 Income tax 116 (27) 89
Total income and expense for the year (232) 74 (158)
Balance at 1 January 2013 (162) (76) (137) (375) Profit for the year 298 298 Fair value of cash flow hedges transferred to passenger revenue 53 53 Fair value of cash flow hedges transferred to fuel and oil costs (21) (21) Fair value of cash flow hedges transferred to currency differences 5 5 Net change in fair value of cash flow hedges 91 91 Movement in investments (3) (3) Pension remeasurements¹ 632 632 Cost of share-based payments (8) (8) Income tax (180) (29) (209) Transfers between reserves (137) 137
Total income and expense for the year 605 96 137 838
As at 31 December 2013 443 20 463
¹ Refer to note 2 ‘Summary of significant accounting policies’ for more information with regards to the adoption of revised IAS 19 ‘Employee Benefits’. See note 30a for a description of the reserves.
31 Employee benefits The Company operates two principal funded defined benefit pension schemes, the Airways Pension Scheme (APS) and the New Airways Pension Scheme (NAPS), both of which are in the UK and are closed to new members. APS has been closed to new members since 1984 and NAPS closed to new members in 2003. The Company’s principal defined contribution scheme is the British Airways Retirement Plan (BARP), of which all new permanent employees over the age of 16 employed by the Company and certain subsidiary undertakings in the UK may become members. Benefits provided under APS are based on final average pensionable pay and, for the majority of members, are subject to inflationary increases in payment in line with the Annual Review Orders (ARO) issued by the Government, which are based on the Consumer Price Index (CPI). Benefits provided under NAPS are based on final average pensionable pay reduced by an amount (the ‘abatement’) not exceeding one and a half times the Government's lower earnings limit. NAPS pension increases are also linked to the ARO and increases are capped at a maximum of five per cent in any one year. In NAPS, annual pensionable pay increases for active members are capped at RPI. The Trustees of APS have purported to grant an additional discretionary increase above CPI inflation for the 2013/14 pensions in payment. This would be expected to reduce the APS accounting surplus by £12 million. BA has challenged the decision as it considers the Trustees have no power to grant such increases and it is concerned about the actuarial funding position of the scheme (which at 31 March 2012 had a £680 million deficit under the Pension Regulator's funding regime). BA is also concerned about the residual unhedged risk in the scheme, which will be increased by the addition of new unfunded benefits, to which the Company may ultimately be exposed as the principal employer and sponsor of the scheme. BA is committed to an existing recovery plan, which sees BA deficit payments of £55 million per annum until March 2023. Legal proceedings have been commenced to determine the legitimacy of the additional discretionary increase, the outcome of which will not be known until at least late 2014. This discretionary increase has not been reflected in the accounting assumptions used. Had the £12 million been recorded in 2013, it would have been classified in ‘other comprehensive income’ as an actuarial loss arising from a change of assumption.
BA AR&A 2013 A4.indd 60BA AR&A 2013 A4.indd 60 03/03/2014 16:3403/03/2014 16:34

61
31 Employee benefits continued APS and NAPS are governed by separate Trustee Boards. Although APS and NAPS have separate Trustee Boards, much of the business of the two Schemes is common. Most Main Board and Committee meetings are held in tandem, although each Trustee Board reaches its decisions independently. There are three Committees which are separately responsible for the governance, operation and investments of each Scheme. British Airways Pension Trustees Limited holds the assets of both Schemes on behalf of their respective Trustees. Deficit payment plans are agreed with the Trustees of each scheme every three years based on the actuarial valuation (the ‘triennial valuation’) rather than the IAS 19 accounting valuation. The latest deficit recovery plan was agreed at 31 March 2012 (see note 31i). Most employees engaged outside the UK are covered by appropriate local arrangements. The Company provides certain additional post-retirement healthcare benefits to eligible employees in the US through the US Post-Retirement Medical Benefit plan (‘US PRMB’). The defined benefit plans expose the Company to actuarial risks, such as longevity risk, currency risk, interest rate risk and market (investment) risk. Disclosures for post-retirement benefits are presented on a consolidated basis and include a net pension liability of £12 million (2012: £7 million) relating to British Airways Holidays Limited, with the remainder relating to the Company. The comparatives in this note have been restated for the adoption of the revised IAS 19 ‘Employee benefits’. a Employee benefit schemes recognised on the balance sheet
As at 31 December 2013 £ million APS NAPS Other¹ Total
Scheme assets at fair value 6,918 11,611 322 18,851 Present value of scheme liabilities (6,318) (12,026) (510) (18,854)
Net pension asset/(liability) 600 (415) (188) (3) Effect of the asset ceiling² (198) (198) Other employee benefit obligations (11) (11)
As at 31 December 2013 402 (415) (199) (212)
Represented by: Employee benefit assets 407 Employee benefit obligations (619)
(212)
As at 31 December 2012 £ million APS NAPS Other¹ Total
Scheme assets at fair value 7,174 10,089 294 17,557 Present value of scheme liabilities (6,439) (11,420) (685) (18,544)
Net pension asset / (liability) 735 (1,331) (391) (987) Effect of the asset ceiling² (242) (242) Other employee benefit obligations (10) (10)
As at 31 December 2012 493 (1,331) (401) (1,239)
Represented by Employee benefit assets 493 Employee benefit obligations (1,732)
(1,239)
¹ The present value of scheme liabilities for the US PRMB was £58 million at 31 December 2013 (£223 million as at 31 December 2012). ² APS is in an IAS 19 accounting surplus, which would be available to the Company as a refund upon wind up of the scheme. This refund is restricted due to withholding taxes that would be payable by the Trustees.
BA AR&A 2013 A4.indd 61BA AR&A 2013 A4.indd 61 03/03/2014 16:3403/03/2014 16:34

62
31 Employee benefits continued b Pension costs charged/(credited) to the consolidated income statement:
Pension costs charged/(credited) to operating profit are:
£ million 2013 2012
Defined benefit plans: Current service cost¹ 174 147 Past service cost² (143)
31 147 Defined contribution plans 47 37
Pension costs recorded as employee costs² 78 184
¹ Includes £2 million (2012: £4 million) relating to the US PRMB plan.
² The credit to ‘past service cost’ of £143 million in 2013 has been treated as an exceptional item (note 5) and as such employee costs per note 8 are £221 million. The past service cost is a gain resulting from amendments made by the Company during the year to the US PRMB plan, which have resulted in changes to the benefits payable to plan members as well as a discontinuance of the plan, with the plan being phased out over the next ten years.
Pension costs charged/(credited) as finance costs are:
£ million 2013 2012
Interest income on scheme assets 756 776 Interest expense on scheme liabilities (791) (797) Interest expense on asset ceiling (10) (14)
Net financing expense relating to pensions (45) (35)
c Remeasurements recognised in the statement of other comprehensive income are:
£ million 2013 2012
Return on plan assets excluding interest income 697 671 Remeasurement of plan liabilities from changes in financial assumptions (117) (1,629) Remeasurement of experience (losses)/gains (6) 33 Remeasurement of the APS asset ceiling 54 65 Exchange differences 17
Pension remeasurements 628 (843)
d Fair value of scheme assets
A reconciliation of the opening and closing balances of the fair value of scheme assets is set out below:
£ million 2013 2012
As at 1 January 17,557 16,300 Interest income 756 776 Return on plan assets excluding interest income 697 671 Employer contributions¹ ² 476 450 Employee contributions 86 84 Benefits paid (713) (710) Exchange differences (8) (14)
As at 31 December 18,851 17,557
¹ Includes employer contributions to APS of £63 million (2012: £87 million) and to NAPS of £396 million (2012: £346 million), of which deficit funding payments represented £55 million for APS (2012: £75 million) and £208 million for NAPS (2012: £235 million). ² Cash payments to pension schemes (net of service costs) reflected in the consolidated cash flow statement were £302 million (2012: £303 million), being the employer contributions of £476 million (2012: £450 million) less the current service cost of £174 million (2012: £147 million) as set out in note 31b.
BA AR&A 2013 A4.indd 62BA AR&A 2013 A4.indd 62 03/03/2014 16:3403/03/2014 16:34

63
31 Employee benefits continued d Fair value of scheme assets continued
Scheme assets as at 31 December comprise: £million 2013 2012
Return seeking investments - equities UK 2,113 1,680 Overseas 4,513 4,031 6,626 5,711 Return seeking investments - other Private equity 580 560 Property 1,296 1,168 Alternative investments 650 596
2,526 2,324
Liability matching investments UK Fixed bonds 2,296 2,273 Overseas Fixed bonds 212 200 UK Index-Linked bonds 3,967 4,439 Overseas Index-Linked bonds 362 455
6,837 7,367 Other Cash and cash equivalents 854 757 Derivatives 24 (58) Insurance contract 1,406 1,190 Longevity swap (43) (26) Other 621 292
18,851 17,557
All equities and bonds have quoted prices in active markets.
For APS & NAPS, the composition of the scheme assets is: As at 31 December 2013 As at 31 December 2012
£ million APS NAPS APS NAPS
Return seeking investments 1,395 7,586 1,305 6,550 Liability matching investments 3,869 2,891 4,443 2,854
5,264 10,477 5,748 9,404 Insurance contract and related longevity swap 1,346 1,164 Other 308 1,134 262 685
Fair value of scheme assets 6,918 11,611 7,174 10,089
For both APS and NAPS, the Trustees have ultimate responsibility for decision making on investment matters, including the asset-liability matching strategy. The Investment Committee adopts an annual business plan which sets out investment objectives and work required to support achievement of these objectives. The Investment Committee also deals with the monitoring of performance and activities, including work on developing the strategic benchmark to improve the risk return profile of the scheme where possible, as well as having a trigger-based dynamic governance process to be able to take advantage of opportunities as they arise. The Investment Committees review the existing investment restrictions, performance benchmarks and targets, as well as continuing to develop the de-risking and liability hedging portfolio.
The strategic benchmark for asset allocations differentiate between 'return seeking investments' and 'liability matching investments'. Given the respective maturity of each scheme, the proportion for APS and NAPS vary. At 31 March 2013 - the date of the latest annual review - the benchmark for APS was 23.7% (2012: 22.5%) in return seeking assets and 76.3% (2012: 77.5%) in liability matching investments; and for NAPS the benchmark was 68% (2012: 68%) in return seeking assets and 32% (2012: 32%) in liability matching investments. Bandwidths are set around these strategic benchmarks that allow for tactical asset allocation decisions, providing parameters for the Investment Committee and their investment managers to work within.
In addition to this, APS has an insurance contract with Rothesay Life which now covers 24 per cent (2012: 20 per cent) of the pensioner liabilities for an agreed list of members. The insurance contract is based on future increases to pensions in line with RPI inflation and will match future obligations on that basis for that part of the scheme. The insurance contract can only be used to pay or fund employee benefits under the scheme. APS also has secured a longevity swap contract with Rothesay Life, which covers an additional 20 per cent (2012: 20 per cent) of the pensioner liabilities for the same members covered by the insurance contract above. The value of the contract is based on the difference between the value of the payments expected to be received under this contract and the pensions payable by the scheme under the contract.
Both schemes use derivative instruments for both investment purposes and to manage exposures to financial risks, such as interest rate, foreign exchange and liquidity risks arising in the normal course of business. Exposure to interest-rate risk is managed through the use of Inflation-Linked Swap contracts. Foreign exchange forward contracts are entered into to mitigate the risk of currency fluctuations. For NAPS, a strategy exists to provide protection against the equity market downside risk by reducing some of the upside participation.
The asset-liability matching strategy in respect of the Group's other schemes have been determined in accordance with best local practice.
BA AR&A 2013 A4.indd 63BA AR&A 2013 A4.indd 63 03/03/2014 16:3403/03/2014 16:34

64
31 Employee benefits continued e Present value of scheme liabilities
A reconciliation of the opening and closing balances of the present value of the defined benefit obligations is set out below:
£ million 2013 2012
As at 1 January 18,544 16,661 Current service cost 174 147 Past service cost (143) Interest expense 791 797 Remeasurements – financial assumptions 117 1,629 Remeasurements – demographic assumptions 6 (33) Benefits paid (713) (710) Employee contributions 86 84 Exchange differences (8) (31)
As at 31 December 18,854 18,544
The defined benefit obligation comprises £67 million (2012: £233 million) arising from unfunded plans and £12,423 million (2012: £11,838 million) from plans that are wholly or partly funded.
f Effect of the asset ceiling
A reconciliation of the effect of the asset ceiling representing the IAS19 irrecoverable surplus in APS is set out below:
£ million 2013 2012
As at 1 January 242 293 Interest expense 10 14 Remeasurements (54) (65)
As at 31 December 198 242
g Actuarial assumptions
The principal assumptions used for the purposes of the actuarial valuations were as follows: 2013 2012
Per cent per annum APS NAPS Other schemes APS NAPS Other schemes
Discount rate 4.40 4.70 4.5 - 4.9 4.10 4.50 4.0 - 4.7 Rate of increase in pensionable pay¹ 3.25 3.30 3.5 - 4.3 2.85 2.90 3.5 - 4.1 Rate of increase of pensions in payment³ 2.50 2.55 1.5 - 3.3 2.10 2.15 1.5 - 3.0 RPI rate of inflation² 3.25 3.30 3.0 - 3.5 2.85 2.90 3.0 - 3.1 CPI rate of inflation² 2.50 2.55 2.5 - 3.0 2.10 2.15 2.4 - 3.0
¹ Rate of increase in salaries is assumed to be in line with employee cost inflation reflected in the Group’s five year business plan and inflation for all later periods. ² The inflation rate assumptions for NAPS and APS are based on the difference between the yields on index-linked and fixed-interest long-term government bonds. The inflation assumptions are used to determine the rate of increase for pensions in payment and the rate of increase in deferred pensions where there is such an increase.
³ It has been assumed that the rate of increase of pensions in payment will be in line with CPI for APS. However, the Trustees have purported to grant an additional discretionary increase of 20 basis points in relation to 2013/14 payments, a decision that BA has challenged, has not reflected in the IAS 19 assumptions and has commenced legal proceedings about to determine the legitimacy of the additional increase. Rate of increase in healthcare costs is based on medical trend rates of 8.0 per cent grading down to 5.0 per cent over six years (2012: 7.5 per cent to 5.0 per cent over five years).
In the UK, mortality rates are calculated using the standard SAPS mortality tables produced by the CMI for APS and NAPS. The standard mortality tables were selected based on the actual recent mortality experience of members and were adjusted to allow for future mortality changes. The current longevities underlying the values of the scheme liabilities were as follows:
UK
Mortality Assumptions 2013 2012
Life expectancy at age 60 for a: - male currently aged 60 28.3 28.4 - male currently aged 40 29.7 29.9 - female currently aged 60 29.7 30.2 - female currently aged 40
32.2 32.7
At 31 December 2013, the weighted-average duration of the defined benefit obligation was 12 years for APS (2012: 13 years) and 19 years for NAPS (2012: 20 years). In the US, mortality rates were based on the PPA13 mortality tables.
BA AR&A 2013 A4.indd 64BA AR&A 2013 A4.indd 64 03/03/2014 16:3403/03/2014 16:34

65
31 Employee benefits continued h Sensitivity analysis
Reasonably possible changes at the reporting date to a significant actuarial assumption, holding other assumptions constant, would have affected the present value of scheme liabilities by the amounts shown:
£ million Increase in net
pension liability
Discount rate (decrease of 10 basis points) 299 Future salary growth (increase of 10 basis points) 51 Future pension growth (increase of 10 basis points) 221 Future mortality rate - one year increase in life expectancy 509
Although the analysis does not take into account the full distribution of cash flows expected under the plans, it does provide an approximation of the sensitivity of the assumptions shown.
i Funding
Pension contributions for APS and NAPS were determined by actuarial valuations made at 31 March 2012 using assumptions and methodologies agreed between the Company and the Trustees of each scheme. At the date of the actuarial valuation, the actuarial deficits of APS and NAPS amounted to £680 million and £2,660 million respectively. In order to address the deficits in the schemes, BA has also committed to the following deficit payments:
£ million APS NAPS
Within 12 months 55 22 2-5 years 220 641 5-10 years 234 1,251 More than 10 years
679
Total expected deficit payments for APS and NAPS 509 2,593
The Group has determined that the minimum funding requirements set out above for APS and NAPS will not be restricted. The present value of the contributions payable is expected to be available as a refund or a reduction in future contributions after they are paid into the plan. This determination has been made independently for each plan. As such, no additional liability is required.
Deficit payments in respect of local arrangements outside the UK have been determined in accordance with best local practice.
In total, the Group expects to pay £292 million in employer contributions and deficit payments to its post-retirement benefit plans in 2014. This includes expected employer contributions of £63 million to APS (of which £55 million relates to the funding shortfall) and £214 million to NAPS (of which £22 million relates to the funding shortfall).
BA AR&A 2013 A4.indd 65BA AR&A 2013 A4.indd 65 03/03/2014 16:3403/03/2014 16:34

66
32 Contingent liabilities and guarantees a Contingent Liabilities The Group and the Company have contingent liabilities which at 31 December 2013 amounted to £58 million (2012: £45 million). These contingent liabilities include claims and litigation related to operations and tax affairs. Regulatory proceedings and litigation The Group is party to a number of third party class actions relating to its passenger and cargo traffic. The Group has a number of defences to these class actions. The Group expects the outcome of these class actions will be known over the course of the next few years. The Group is also involved in other regulatory proceedings and litigation that are pending, the outcome of which in the aggregate is not expected to have a material effect on the Group’s financial position or results of operations. Taxation The Group files income and other tax returns in many jurisdictions throughout the world. Various tax authorities are currently examining the Group’s tax returns. Tax returns contain matters that could be subject to differing interpretations of applicable tax laws and regulations and the resolution of tax positions through negotiations with relevant tax authorities, or through litigation, can take several years to complete. While it is difficult to predict the ultimate outcome in some cases, the Group does not anticipate that there will be any material impact on the Group’s financial position or results of operations. b Guarantees Bank guarantees The Group and Company have issued bank guarantees totalling £35 million (2012: £32 million) and £34 million (2012: £31 million) respectively. Pensions and perpetual preferred securities The Group and the Company have provided collaterals on certain payments to the Company’s pension scheme, Airways Pensions Scheme (‘APS’), triggered in the event of BA’s insolvency, which at 31 December 2013 amounted to £250 million (2012: £250 million). In addition, a guarantee amounting to £230 million (2012: £230 million) secured by certain aircraft was issued by a third party in favour of APS also triggered in the event of insolvency. See note 12 and note 31 for details around the collaterals provided. The Company has also issued guarantees in respect of the fixed perpetual preferred securities issued by a subsidiary undertaking which amounted to £252 million (2012: £244 million). See note 30 for details around the guarantee provided.
BA AR&A 2013 A4.indd 66BA AR&A 2013 A4.indd 66 03/03/2014 16:3403/03/2014 16:34
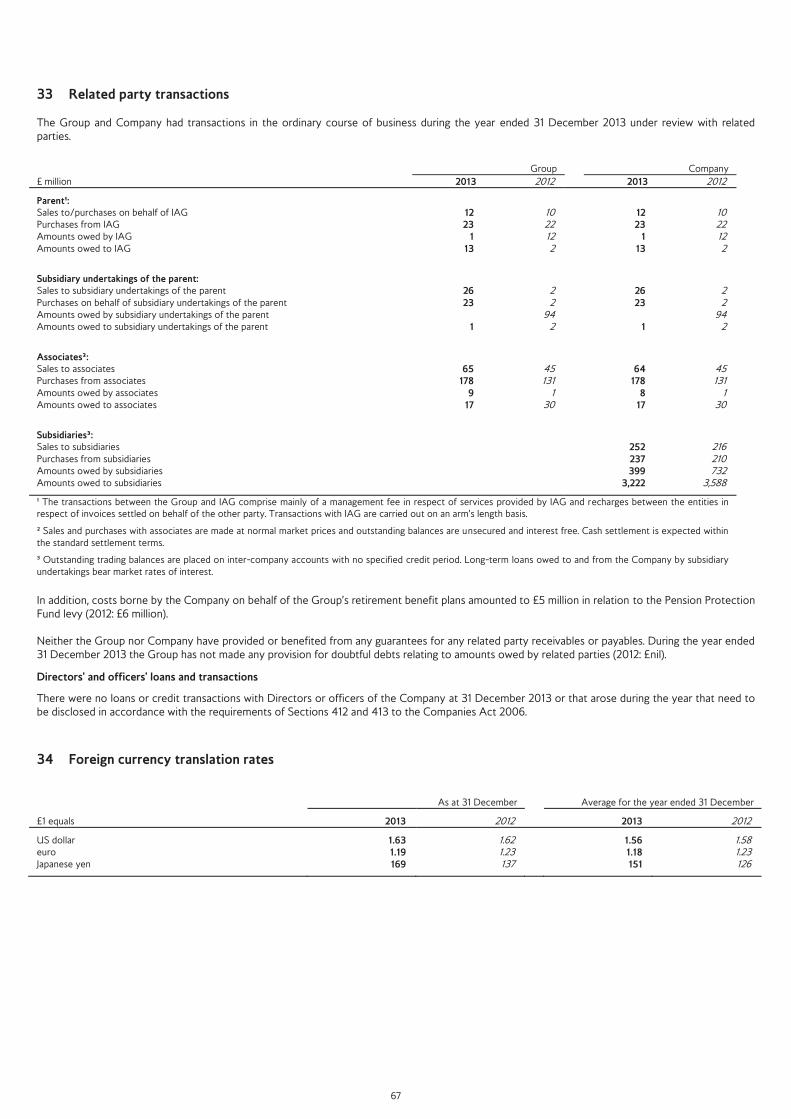
67
33 Related party transactions The Group and Company had transactions in the ordinary course of business during the year ended 31 December 2013 under review with related parties. Group Company £ million 2013 2012 2013 2012
Parent¹: Sales to/purchases on behalf of IAG 12 10 12 10 Purchases from IAG 23 22 23 22 Amounts owed by IAG 1 12 1 12 Amounts owed to IAG 13 2 13 2
Subsidiary undertakings of the parent: Sales to subsidiary undertakings of the parent 26 2 26 2 Purchases on behalf of subsidiary undertakings of the parent 23 2 23 2 Amounts owed by subsidiary undertakings of the parent 94 94 Amounts owed to subsidiary undertakings of the parent 1 2 1 2
Associates²: Sales to associates 65 45 64 45 Purchases from associates 178 131 178 131 Amounts owed by associates 9 1 8 1 Amounts owed to associates 17 30 17 30
Subsidiaries³:
Sales to subsidiaries 252 216 Purchases from subsidiaries 237 210 Amounts owed by subsidiaries 399 732 Amounts owed to subsidiaries 3,222 3,588
¹ The transactions between the Group and IAG comprise mainly of a management fee in respect of services provided by IAG and recharges between the entities in respect of invoices settled on behalf of the other party. Transactions with IAG are carried out on an arm’s length basis.
² Sales and purchases with associates are made at normal market prices and outstanding balances are unsecured and interest free. Cash settlement is expected within the standard settlement terms.
³ Outstanding trading balances are placed on inter-company accounts with no specified credit period. Long-term loans owed to and from the Company by subsidiary undertakings bear market rates of interest.
In addition, costs borne by the Company on behalf of the Group’s retirement benefit plans amounted to £5 million in relation to the Pension Protection Fund levy (2012: £6 million). Neither the Group nor Company have provided or benefited from any guarantees for any related party receivables or payables. During the year ended 31 December 2013 the Group has not made any provision for doubtful debts relating to amounts owed by related parties (2012: £nil).
Directors' and officers' loans and transactions There were no loans or credit transactions with Directors or officers of the Company at 31 December 2013 or that arose during the year that need to be disclosed in accordance with the requirements of Sections 412 and 413 to the Companies Act 2006.
34 Foreign currency translation rates As at 31 December Average for the year ended 31 December
£1 equals 2013 2012 2013 2012
US dollar 1.63 1.62 1.56 1.58 euro 1.19 1.23 1.18 1.23 Japanese yen 169 137 151 126
BA AR&A 2013 A4.indd 67BA AR&A 2013 A4.indd 67 03/03/2014 16:3403/03/2014 16:34

68
Operating and financial statistics
12 months to 31 December
Total Group continuing operations 2013 2012 2011
Traffic and capacity Revenue passenger km (RPK) m 131,333 126,436 117,348 Available seat km (ASK) m 161,444 158,247 150,152 Passenger load factor % 81.3 79.9 78.2 Cargo tonne km (CTK) m 4,646 4,891 4,793 Total revenue tonne km (RTK) m 17,767 17,597 16,597 Total available tonne km (ATK) m 24,536 24,152 22,849 Overall load factor % 72.4 72.9 72.6 Passengers carried '000 39,960 37,580 34,250 Tonnes of cargo carried '000 733 788 785
Operations Average manpower equivalent (MPE) 38,592 38,761 36,164 ASKs per MPE 4,183 4,083 4,152 Aircraft in service at year end 278 273 245 Aircraft utilisation (average hours per aircraft per day) 10.61 10.89 11.13 Punctuality - within 15 minutes % 76 79 83 Regularity % 98.6 98.9 99.3
Financial Passenger revenue per RPK p 7.71 7.51 7.43Passenger revenue per ASK p 6.27 6.00 5.81Cargo revenue per CTK p 14.82 15.07 15.42Average fuel price (US cents/US gallon) 314.84 317.85 312.71Operating margin % 6.2 2.2 5.2 Operating margin before exceptional items % 5.7 2.5 5.2 Earnings before interest, tax, depreciation, amortisation and rentals (EBITDAR) m 1,515 1,051 1,274 Net debt/total capital ratio¹ % 44.5 66.2 54.0 Total traffic revenue per ATK p 44.1 42.4 41.4 Total traffic revenue per ASK p 6.70 6.47 6.30 Total expenditure before exceptional items on operations per ASK p 6.67 6.67 6.31 Total expenditure before exceptional items on operations excluding fuel per ASK p 4.35 4.32 4.14 Total expenditure before exceptional items on operations per ATK p 43.9 43.7 41.4
¹ The 2012 and 2011 comparative for the Net debt/total capital ratio has been restated to reflect the restated 2012 and 2011 balance sheets following the revision to IAS 19
‘Employee benefits’. Prior to restatement the comparative ratio was 43.1% in 2012 and 40.8% in 2011. Operating statistics do not include those of associate undertakings and franchisees.
BA AR&A 2013 A4.indd 68BA AR&A 2013 A4.indd 68 03/03/2014 16:3403/03/2014 16:34

69
Fleet Table Number in service with Group companies at 31 December 2013
On Balance
Sheet Off Balance
Sheet Total Total Changes
since Future
deliveries Options
fixed assets operating leases
December 2013
December 2012
December 2012
(Note 6) (Note 7)
CONTINUING AIRLINE OPERATIONS (Note 1)
Airbus A318 2 2 2
Airbus A319 31 13 44 44
Airbus A320 (Note 2) 37 13 50 48 2 17 70
Airbus A321 14 4 18 18
Airbus A350 18 18
Airbus A380 3 3 3 9 7
Boeing 737-400 (Note 3) 15 15 19 (4)
Boeing 747-400 (Note 4) 51 51 52 (1)
Boeing 757-200 1 2 3 3
Boeing 767-300 (Note 5) 20 20 21 (1)
Boeing 777-200 41 5 46 46
Boeing 777-300 7 1 8 6 2 4
Boeing 787-800 4 4 4 38 16
Embraer E170 6 6 6
Embraer E190 8 8 8 3 15
TOTAL CONTINUING OPERATIONS 240 38 278 273 5 89 126
Note:
1. Includes those operated by British Airways Plc, BA Cityflyer Limited and OpenSkies SASU. 2. Includes three Airbus A320 aircraft delivered during the period. One leased Airbus A320 was returned to the lessor during the period. 3. Four Boeing B737-400 aircraft were permanently stood down and transferred to assets held for sale during the period. 4. One Boeing B747-400 aircraft was permanently stood down out of service during the period. 5. One Boeing B767-300 aircraft was permanently stood down and transferred to assets held for sale during the period. 6. Future deliveries have increased by 37. Three Airbus A320, three Airbus A380, two Boeing B777-300 and four Boeing B787 aircraft were
delivered in the period. Ten leased Airbus A320s plus three Embraer E190 aircraft due for delivery from 2014. 18 Boeing B787 options have been converted to firm orders plus 18 Airbus A350 options were purchased and converted during the period.
7. Options have increased by 45. 18 Boeing B787 options converted to firm orders plus purchase of 18 Airbus A350, six Boeing B787 and 50 Airbus A320 options, plus a reduction of eleven Airbus A320 fixed price options.
DISCONTINUED AIRLINE OPERATIONS As part of the bmi acquisition, 12 Boeing B737-300 aircraft and two Boeing B737-500 aircraft were acquired, on ‘off balance sheet operating leases'. At 31 December 2012, these were stood down in advance of handback. During 2013, nine Boeing B737-300 and two Boeing B737-500 aircraft have been returned to the lessor.
BA AR&A 2013 A4.indd 69BA AR&A 2013 A4.indd 69 03/03/2014 16:3403/03/2014 16:34

70
Principal investments At 31 December 2013
Investments in subsidiaries The following table includes those principal investments which impact the results or assets of the Group. These subsidiaries are wholly-owned except where indicated.
Principal activities
Country of incorporation and
registration and principal operations
Avios Group (AGL) Limited Airline marketing England
BA and AA Holdings Limited Holding company England
BA Cityflyer Limited Airline operations England BritAir Holdings Limited Holding company England British Airways 777 Leasing Limited Aircraft financing England British Airways Avionic Engineering Limited Aircraft maintenance England British Airways Ejets Leasing Limited¹ Aircraft financing Bermuda British Airways Holdings Limited Airline finance Jersey British Airways Holidays Limited Package holidays England British Airways Interior Engineering Limited Aircraft maintenance England British Airways Leasing Limited Aircraft financing England British Airways Maintenance Cardiff Limited Aircraft maintenance England British Midland Airways Limited¹ Airline operations England OpenSkies SASU¹ Airline operations France Speedbird Insurance Company Limited Insurance Bermuda The Plimsoll Line Limited Holding company England
Investments in associates
Percentage of equity owned
Principal activities Country of
incorporation and principal operations
IB Opco Holding S.L¹ 13.55 Airline operations Spain
Available-for-sale investments
Percentage of equity owned
Principal activities Country of
incorporation and principal operations
Comair Limited¹ 9.6 Airline operations South Africa Flybe Group Plc¹ 14.6 Airline operations England International Consolidated Airlines Group S.A. 0.1 Airline operations Spain The Airline Group Limited 16.7 Air traffic control
holding company England
¹ Not owned directly by British Airways Plc
BA AR&A 2013 A4.indd 70BA AR&A 2013 A4.indd 70 03/03/2014 16:3403/03/2014 16:34

71
Glossary
Airline operations This includes British Airways Plc, BA Cityflyer Limited, Flyline Tele Sales & Services GmbH, OpenSkies SASU and British Midland Airways Limited.
Available seat kilometres (ASK) The number of seats available for sale multiplied by the distance flown.
Available tonne kilometres (ATK) The number of tonnes of capacity available for the carriage of revenue load (passenger and cargo) multiplied by the distance flown.
Cargo tonne kilometres (CTK) The number of revenue tonnes of cargo (freight and mail) carried multiplied by the distance flown.
Continuing operations The segments of the business that are considered to be normal, and expects to operate in the foreseeable future.
Discontinued operations A discontinued operation is a component of the entity that has been disposed of or is classified as held for sale.
EBITDAR Earnings before interest, tax, depreciation, amortisation and aircraft rentals.
Exceptional items Those items that in management’s view need to be separately disclosed by virtue of their size or incidence.
Gain on bargain purchase The excess of fair value of net assets over the consideration paid.
JOLCO Japanese operating lease with call option.
Load factor The percentage relationship of revenue load carried to capacity available.
Manpower equivalent Number of employees adjusted for part-time workers, overtime and contractors.
Merger The combining of two or more entities through a purchase acquisition.
Merger effective date 21 January 2011, the date British Airways and Iberia signed a merger agreement to create International Airlines Group.
Net debt Loans, finance leases and hire purchase arrangements net of other current interest-bearing deposits and cash and cash equivalents less overdrafts.
Net debt/total capital ratio Net debt as a ratio of total capital.
nm Not meaningful.
n/a Not applicable.
Operating margin Operating profit/(loss) as a percentage of revenue.
Overall load factor RTK expressed as a percentage of ATK.
Passenger load factor RPK expressed as a percentage of ASK.
EETC This is the enhanced equipment trust certificate borrowing facility obtained in 2013 and secured on related aircraft upon drawdown.
Punctuality The industry's standard, measured as the percentage of flights departing within 15 minutes of schedule.
Regularity The percentage of flights completed to flights scheduled, excluding flights cancelled for commercial reasons.
Revenue passenger kilometres (RPK) The number of revenue passengers carried multiplied by the distance flown.
Passenger revenue per ASK Passenger revenue divided by ASK.
Passenger revenue per RPK Passenger revenue divided by RPK.
Revenue tonne kilometres (RTK) The revenue load in tonnes multiplied by the distance flown.
Total capital Total equity plus net debt.
Total Group revenue per ASK Total Group revenue divided by ASK.
Total traffic revenue per ASK Revenue from total traffic divided by ASK.
Total traffic revenue per ATK Revenue from total traffic divided by ATK.
BA AR&A 2013 A4.indd 71BA AR&A 2013 A4.indd 71 03/03/2014 16:3403/03/2014 16:34

72
Subsidiary Undertakings of British Airways Plc at 31 December 2013 The holdings disclosed concern ordinary shares unless otherwise stated.
Name of company Country of incorporation Avios Group (AGL) Limited (formerly The Mileage Company Limited) England Avios South Africa Proprietary Limited South Africa BA and AA Holdings Limited England BA Call Centre India Private Limited (callBA) India BA Cityflyer Limited England BA European Limited England BA Number One Limited England BA Number Two Limited Jersey bmibaby Limited England BritAir Holdings Limited England British Airways (BA) Limited England British Airways (España) Limited England British Airways (European Operations at Gatwick) Limited England British Airways (No.1) Limited England British Airways 777 Leasing Limited England British Airways Associated Companies Limited England British Airways Avionic Engineering Limited England British Airways Capital Limited Jersey British Airways Ejets Leasing Limited Bermuda British Airways Employee Benefits Trustees (Jersey) Limited Jersey British Airways Finance (Jersey) Limited Partnership Jersey British Airways Holdings BV Netherlands British Airways Holdings Limited Jersey British Airways Holidays Limited England British Airways Interior Engineering Limited England British Airways Leasing Limited England British Airways Maintenance Cardiff Limited England British Airways Pension Trustees (No 2) Limited England British Airways Plc Employee Share Ownership Trust Jersey British Airways Regional Limited England British Caledonian Airways Limited England British Caledonian Group Limited Scotland British Mediterranean Airways Limited England British Midland Airways Limited England British Midland Limited England Caledonian Aviation Investments Limited England Deutsche BA Holding GmbH Germany Diamond Insurance Company Limited Isle of Man Flyline Tele Sales & Services GmbH Germany Illiad Inc USA OpenSkies Aviation Limited England OpenSkies SASU France Overseas Air Travel Limited England Remotereport Trading Limited England Speedbird Cash Management Limited¹ Bermuda Speedbird Insurance Company Limited Bermuda Speedwing International Limited England Teleflight Limited England The Plimsoll Line Limited England
Associated holdings
Name of company Equity owned Country of incorporation Dunwoody Airline Services (Holdings) Limited 40% England IB Opco Holding S.L 13.55% Spain
¹ Has ordinary and non-redeemable preference shares.
BA AR&A 2013 A4.indd 72BA AR&A 2013 A4.indd 72 03/03/2014 16:3403/03/2014 16:34


British Airways Plc
Annual Report and AccountsYear ended 31 December 2013
Company registration number : 1777777
British Airways Plc