Brisbane Central State School Queensland State … Central State School Queensland State School...
13
Brisbane Central State School Queensland State School Reporting 2014 School Annual Report Postal address Rogers Street Spring Hill 4000 Phone (07) 3230 4333 Fax (07) 3831 5469 Email [email protected] Webpages Additional reporting information pertaining to Queensland state schools is located on the My School website and the Queensland Government data website. Contact person Graham Rickuss Principal Principal’s foreword Introduction At Brisbane Central State School we honour our past while looking to the future. Beyond our grand administration building and heritage colour scheme you will discover modern facilities, resources and programs that enable the development of the whole child. Our campus hosts student learning in a variety of settings, from fully connected classrooms with interactive whiteboards, to a computer lab, library and hall. We are dedicated to our students and our community. We understand that learning is a three-way partnership between students, parents and teachers. We nurture an inclusive environment where diversity, persistence and confidence are valued. Our school caters for a diverse community from Prep to Year 7. Brisbane Central State School students engage confidently in school and the Brisbane City Cluster group initiatives, which provide them with the competencies to be able to participate in the broadest spectrum of community life, both locally and globally. During the year, Brisbane Central State School farewelled Mrs Melissa Burke who had been the principal for the past two and three-quarter years. Thank you for your interest in our school. Graham Rickuss Principal
Transcript of Brisbane Central State School Queensland State … Central State School Queensland State School...

Brisbane Central State School Queensland State School Reporting 2014 School Annual Report
Postal address Rogers Street Spring Hill 4000
Phone (07) 3230 4333
Fax (07) 3831 5469
Email [email protected]
Webpages
Additional reporting information pertaining to Queensland state schools is located on the My School website and the Queensland Government data website.
Contact person Graham Rickuss Principal
Principal’s foreword Introduction
At Brisbane Central State School we honour our past while looking to the future. Beyond our grand administration building and heritage colour scheme you will discover modern facilities, resources and programs that enable the development of the whole child. Our campus hosts student learning in a variety of settings, from fully connected classrooms with interactive whiteboards, to a computer lab, library and hall. We are dedicated to our students and our community. We understand that learning is a three-way partnership between students, parents and teachers. We nurture an inclusive environment where diversity, persistence and confidence are valued. Our school caters for a diverse community from Prep to Year 7. Brisbane Central State School students engage confidently in school and the Brisbane City Cluster group initiatives, which provide them with the competencies to be able to participate in the broadest spectrum of community life, both locally and globally. During the year, Brisbane Central State School farewelled Mrs Melissa Burke who had been the principal for the past two and three-quarter years. Thank you for your interest in our school. Graham Rickuss Principal

School progress towards its goals in 2014
Priority Progress
Implement the Australian Curriculum
During 2014 we - Adapted C2C English, Mathematics, Science, History and
Geography units to the learning needs of our students. - Tracked the use of C2C Units in English, Maths, History and
Science taking into consideration students in multi-age classes. - Provided training and development for teachers focusing on
Australian Curriculum achievement standards, A exemplars, task sheets and student friendly Guide to Make Judgements.
- Moderated with cluster schools to gain understanding of Australian Curriculum achievement standards and a consistency of judgement across schools.
Implement whole school Reading pedagogical practices
During 2014 we - Implemented QAR (Question Answer Relationship) across
school for reading comprehension. - Implemented a Vocabulary Framework, in particular explicit
teaching and word walls. Using data to inform teaching practice
During 2014 we - Continued Data Meetings with teachers focusing on tracking
and improving outcomes for students. - Developed the Class Improvement Plans, aligned to Year level
targets. - Established and monitored cohort standards and individual
targets for students. - Tracked and monitored student data against Year Level
targets. Develop instructional leadership with a focus on workforce performance
During 2014 we - Continued evidence based, data driven Action Research
Projects where teachers lead inquiry. - Connected and align Action Research Project to Developing
Performance Framework and Class Improvement Plan. - Continued staff feedback processes.
Develop productive partnerships with students, staff, parents, and the community
During 2014 we - Examined and applied ways to strengthen feedback processes
to students and caregivers regarding student achievement and progress.
- Continued to develop a calendar of joint school community events through newsletter and website.
- Utilised school website, QSchools application and social media tools to promote school activities, events and news stories.

Future outlook
School Improvement Plan for 2015
Explicit Improvement
Description
Reading *Create a shared understanding of the teaching of reading. *Alignment of pedagogy for consistency of practice and language throughout the school. *Create a reading program overview containing all current pedagogical practices.
Assessment Pedagogy
*Embed assessment pedagogy – A Exemplar, child friendly A criteria to guide explicit teaching and provide feedback. *Begin the use of WALT, WILF and TIB for units and lessons. *Focus on using data to create student learning goals that are communicated to students, parents, support teachers and teacher aides. *Focus on giving feedback to students on learning goals. * 5 week planning cycles with HOC.
Oral Language
* Focus on including oral language within each lesson. * Use of consistent oral language strategies within the school. * Embed vocabulary pedagogy – subject specific word wall that are continually updated.
Focus Areas Description
Pedagogical Framework
* Revise the use of the pedagogical framework to include: - Explicit instruction overview for lessons including WALT, WILF and warm ups.
Professional Learning
* Linked to whole school pedagogical approaches. * Continue Professional Learning Action Plans linked to Annual Performance development plan. * Embed the use of the Timperley model for Professional learning.
Coaching * Create and put into practice the professional learning documents. * Working with coach individually, as paired teachers and in triads.
Student Tracker
* Revise and update class improvement plan. * Use data to inform 5 week planning, teaching and assessment as per school pedagogical framework. * Use as a basis for data meetings each term with principal.
Our school at a glance
School Profile
Coeducational or single sex: Coeducational
Year levels offered in 2014: Prep Year - Year 6
Total student enrolments for this school:
Total Girls Boys
Enrolment Continuity
(Feb – Nov)
2012 217 111 106 89%
2013 211 109 102 87%
2014 277 137 140 88%
Student counts are based on the Census (August) enrolment collection.
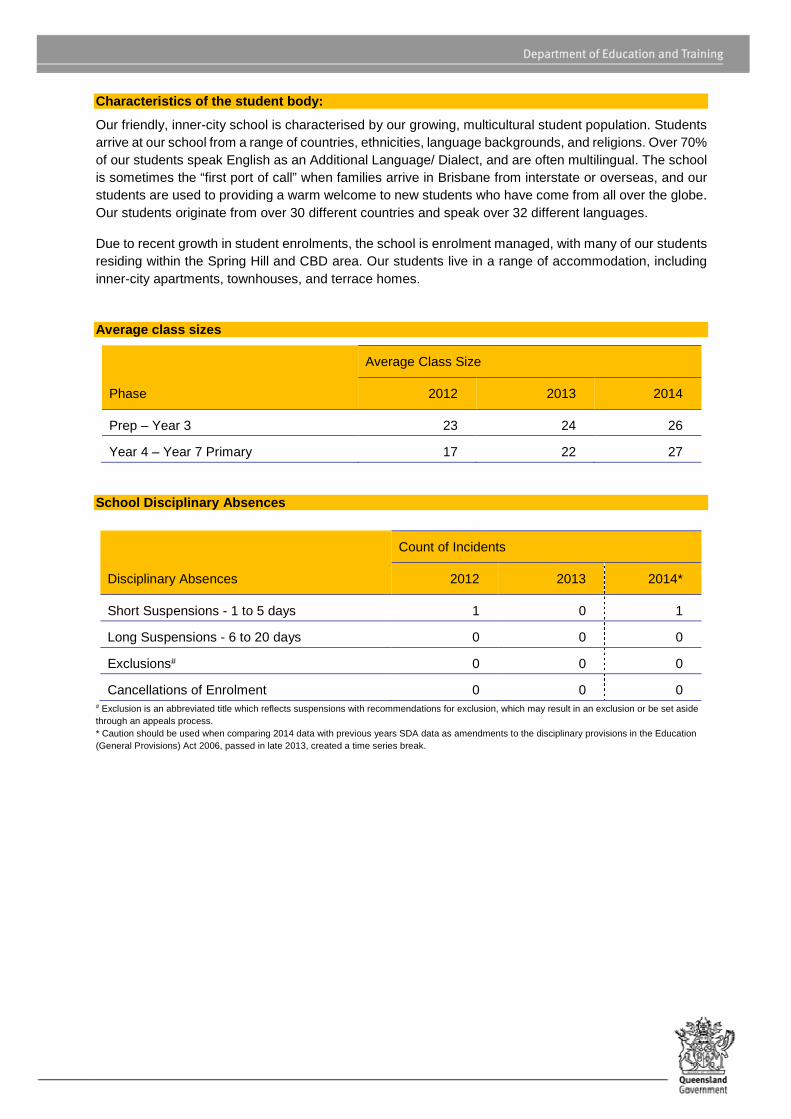
Characteristics of the student body:
Our friendly, inner-city school is characterised by our growing, multicultural student population. Students arrive at our school from a range of countries, ethnicities, language backgrounds, and religions. Over 70% of our students speak English as an Additional Language/ Dialect, and are often multilingual. The school is sometimes the “first port of call” when families arrive in Brisbane from interstate or overseas, and our students are used to providing a warm welcome to new students who have come from all over the globe. Our students originate from over 30 different countries and speak over 32 different languages.
Due to recent growth in student enrolments, the school is enrolment managed, with many of our students residing within the Spring Hill and CBD area. Our students live in a range of accommodation, including inner-city apartments, townhouses, and terrace homes.
Average class sizes
Phase
Average Class Size
2012 2013 2014
Prep – Year 3 23 24 26
Year 4 – Year 7 Primary 17 22 27
School Disciplinary Absences
# Exclusion is an abbreviated title which reflects suspensions with recommendations for exclusion, which may result in an exclusion or be set aside through an appeals process. * Caution should be used when comparing 2014 data with previous years SDA data as amendments to the disciplinary provisions in the Education (General Provisions) Act 2006, passed in late 2013, created a time series break.
Disciplinary Absences
Count of Incidents
2012 2013 2014*
Short Suspensions - 1 to 5 days 1 0 1
Long Suspensions - 6 to 20 days 0 0 0
Exclusions# 0 0 0
Cancellations of Enrolment 0 0 0

Curriculum offerings
Our distinctive curriculum offerings
• Comprehensive French program from Prep to Year 7: using the Accelerative Integrated Method (AIM). Students from Years 3 to 7, received up to 90 minutes per week of French lessons. Students from Prep to Year 2 receive 30 minutes. Students participated in a number of French cultural activities, including the French Film Festival, French Café Theatre and Bastille Day;
• UQ Sports Program: weekly skills and games development program for Years 4 to 7, with
students provided the opportunity to compete against other schools;
• English as a Second Language Program: Specialist Teachers, who are trained in the teaching of students for whom English is a Second Language, worked collaboratively with teachers to support student learning for 3 days per week;
• Swimming lessons: Year 1 to 7 attended swimming lessons at Healthstream Fitness, Kelvin
Grove. Students received 1:5 tuition form a qualified instructor, at their individual level during Term 1 and 4. Prep students attended swimming lessons during Term 4;
• Project U2B: Selected students participated in an online Maths Extension course with qualified, registered teachers from the Brisbane School of Distance Education;
• Adopt-A-Cop program: The school’s Adopt-A-Cop visited regularly delivering talks on topics such as cyber safety, protective behaviours and bullying. The Adopt-A-Cop also participated in literacy, numeracy and sporting activities;
• Intervention and Extension Teacher: An additional teacher was employed throughout the year
to provide support and extension programs in literacy and numeracy. Students included in the program were identified through school-based and systemic assessment tools;
• Spark Reading Program: A partnership was formed between the school and Navitas, through
the Australian Business Community Network. Employees volunteered weekly to read with identified students;
• Year 5-7 Camp program
Curriculum offerings
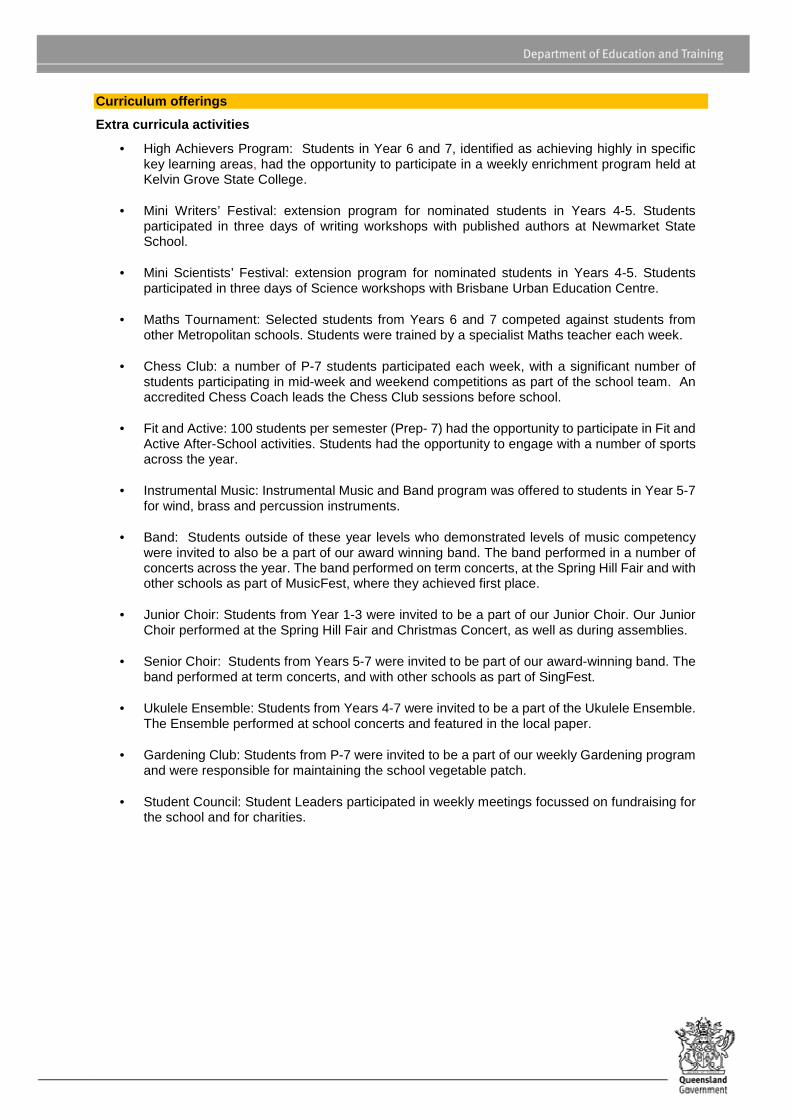
Extra curricula activities
• High Achievers Program: Students in Year 6 and 7, identified as achieving highly in specific key learning areas, had the opportunity to participate in a weekly enrichment program held at Kelvin Grove State College.
• Mini Writers’ Festival: extension program for nominated students in Years 4-5. Students participated in three days of writing workshops with published authors at Newmarket State School.
• Mini Scientists’ Festival: extension program for nominated students in Years 4-5. Students participated in three days of Science workshops with Brisbane Urban Education Centre.
• Maths Tournament: Selected students from Years 6 and 7 competed against students from other Metropolitan schools. Students were trained by a specialist Maths teacher each week.
• Chess Club: a number of P-7 students participated each week, with a significant number of students participating in mid-week and weekend competitions as part of the school team. An accredited Chess Coach leads the Chess Club sessions before school.
• Fit and Active: 100 students per semester (Prep- 7) had the opportunity to participate in Fit and Active After-School activities. Students had the opportunity to engage with a number of sports across the year.
• Instrumental Music: Instrumental Music and Band program was offered to students in Year 5-7 for wind, brass and percussion instruments.
• Band: Students outside of these year levels who demonstrated levels of music competency were invited to also be a part of our award winning band. The band performed in a number of concerts across the year. The band performed on term concerts, at the Spring Hill Fair and with other schools as part of MusicFest, where they achieved first place.
• Junior Choir: Students from Year 1-3 were invited to be a part of our Junior Choir. Our Junior
Choir performed at the Spring Hill Fair and Christmas Concert, as well as during assemblies.
• Senior Choir: Students from Years 5-7 were invited to be part of our award-winning band. The band performed at term concerts, and with other schools as part of SingFest.
• Ukulele Ensemble: Students from Years 4-7 were invited to be a part of the Ukulele Ensemble.
The Ensemble performed at school concerts and featured in the local paper.
• Gardening Club: Students from P-7 were invited to be a part of our weekly Gardening program and were responsible for maintaining the school vegetable patch.
• Student Council: Student Leaders participated in weekly meetings focussed on fundraising for
the school and for charities.
Curriculum offerings
How Information and Communication Technologies are used to assist learning
All computers in the school are able to access the school’s network, and wireless data access is available in most rooms within the school. There are Smartboards (interactive whiteboards) situated in every classroom. All classes had access to the school’s computer lab, which contains an interactive whiteboard and 20 desktop computers. iPads were purchased to support the EAL/D and French programs. Teachers also regularly utilised a range of ICT devices, including data projectors, digital cameras, iPod touches, and Flip Minos, to enhance student learning. Teachers planned ICT experiences that were embedded within, and integral to, all key learning areas, and utilised laptops, interactive whiteboards, and a range of computer software programs to deliver content and skills digitally to students. Students also engaged in online extension learning programs through the Brisbane School of Distance Education using Elluminate.
Teachers were also provided with additional training in the use of ICTs, including designing and using EdStudios, OneSchool and Excel.
Social Climate
Brisbane Central is a small school, inner-city school that values diversity and close ties to the local community. Our students and their families are often well known to other parents, students and staff. Staff members work collaboratively to create an environment which is safe, supportive and conducive to learning. Students interact across year levels in the playground, in addition to older students assisting and taking responsibility for younger children in the classrooms and playground when necessary. Our classrooms are characterised by high-achieving, well-behaved and culturally-aware students. Over 60% of our students are from culturally and Linguistically Diverse Backgrounds and these communities are well-supported and are active contributors to our school.
The school follows the Responsible Behaviour Plan for Students. The Plan focuses on the provision of a safe and supportive learning environment for all students, as well as detailing expectations for student behaviour in classrooms, playgrounds, school buildings and before and after school. Clearly stated in the Plan is the school’s response to bullying (including cyber bullying).
On two afternoons each week, parents have the opportunity to use the school’s open space and play equipment for after school play through the “Stay and Play” program as many of our families live on small housing blocks or in apartments. In 2014, our school community participated in a Disco, Book Week, Harmony Day, NAIDOC Week, Under 8’s Day, Bastille Day, School Concerts, and Maths Fiesta.

Parent, student and staff satisfaction with the sch ool
Performance measure
Percentage of parent/caregivers who agree# that: 2012 2013 2014
their child is getting a good education at school (S2016) 96% 94% 91%
this is a good school (S2035) 96% 100% 91%
their child likes being at this school* (S2001) 100% 100% 96%
their child feels safe at this school* (S2002) 96% 97% 91%
their child's learning needs are being met at this school* (S2003) 100% 94% 91%
their child is making good progress at this school* (S2004) 100% 97% 93%
teachers at this school expect their child to do his or her best* (S2005) 100% 97% 96%
teachers at this school provide their child with useful feedback about his or her school work* (S2006) 100% 84% 93%
teachers at this school motivate their child to learn* (S2007) 96% 91% 96%
teachers at this school treat students fairly* (S2008) 100% 94% 98%
they can talk to their child's teachers about their concerns* (S2009) 100% 100% 98%
this school works with them to support their child's learning* (S2010) 100% 91% 96%
this school takes parents' opinions seriously* (S2011) 100% 90% 85%
student behaviour is well managed at this school* (S2012) 100% 97% 83%
this school looks for ways to improve* (S2013) 100% 100% 89%
this school is well maintained* (S2014) 96% 97% 78%
Performance measure
Percentage of students who agree# that: 2012 2013 2014
they are getting a good education at school (S2048) 95% 97% 99%
they like being at their school* (S2036) 100% 94% 96%
they feel safe at their school* (S2037) 100% 88% 93%
their teachers motivate them to learn* (S2038) 95% 97% 99%
their teachers expect them to do their best* (S2039) 100% 100% 100%
their teachers provide them with useful feedback about their school work* (S2040) 97% 97% 100%
teachers treat students fairly at their school* (S2041) 97% 88% 93%
they can talk to their teachers about their concerns* (S2042) 95% 83% 93%
their school takes students' opinions seriously* (S2043) 97% 85% 93%
student behaviour is well managed at their school* (S2044) 89% 86% 94%
their school looks for ways to improve* (S2045) 92% 97% 99%
their school is well maintained* (S2046) 92% 94% 97%
their school gives them opportunities to do interesting things* (S2047) 92% 85% 96%

Performance measure
Percentage of school staff who agree# that: 2012 2013 2014
they enjoy working at their school (S2069) 95% 92%
they feel that their school is a safe place in which to work (S2070) 95% 100%
they receive useful feedback about their work at their school (S2071) 90% 100%
students are encouraged to do their best at their school (S2072) 100% 100%
students are treated fairly at their school (S2073) 100% 100%
student behaviour is well managed at their school (S2074) 100% 96%
staff are well supported at their school (S2075) 95% 91%
their school takes staff opinions seriously (S2076) 83% 86%
their school looks for ways to improve (S2077) 100% 100%
their school is well maintained (S2078) 100% 100%
their school gives them opportunities to do interesting things (S2079) 90% 96%
* Nationally agreed student and parent/caregiver items were incorporated in the School Opinion Survey in 2012.
# ‘Agree’ represents the percentage of respondents who Somewhat Agree, Agree or Strongly Agree with the statement. Due to a major redevelopment of the surveys (parent/caregiver and student in 2012; staff in 2013), comparisons with results from previous years are not recommended.
DW = Data withheld to ensure confidentiality.
Involving parents in their child’s education
Parents are seen as integral partners in their child’s learning. Parental access to the school and involvement in the many learning experiences of students is encouraged and supported. Our staff offer reporting to parents four times per year. Interviews are conducted with parents to outline their progress during terms one and three. During these interviews the teacher outlines student progress as well as their goals for the following term. Written reports are sent home in terms two and four.
Our active parent community is highly involved in student learning, with parents assisting where necessary within the classes. Parental involvement and support was also provided to ensure the smooth running of a number of school events, including school disco night, Under 8’s Day, Arts Show, Sports Days, NAIDOC Week, and the annual Christmas Concert.
Parent volunteers were also responsible for the smooth and seamless operation of the uniform shop. Our volunteers enable all students to have ready access to school uniforms, ensuring there are options for all budgets. Our parent uniform conveners ensure a warm welcome and local information for all new parents to the school, many of whom are new to the state or to the country.
The school offers free English class for parents who would like additional opportunities to learn English. The class, which is taught by two volunteer, qualified TESOL teachers, combines excursions with learning experiences aimed at providing opportunities for parents to practice and learn English.

Reducing the school’s environmental footprint
Brisbane Central State School has a number of solar panels, to offset our electricity consumption. Newer buildings are equipped with lighting that come on when someone enters the room and automatically turn off. Our water consumption is offset by the installation of a rainwater tank that is utilised by our toilet facilities, and for the purposes of watering gardens and cleaning. A vegetable garden has been established, with students growing a range of vegetables and herbs as part of our Gardening Club. We have a paper and cardboard recycling bin to reduce our waste into landfill.
Environmental footprint indicators
Years Electricity
kWh Water kL
2011-2012 58,285 179
2012-2013 61,594 817
2013-2014 68,367 1,457
The consumption data is compiled from sources including ERM, Ergon reports and utilities data entered into OneSchool by each school. The data provides an indication of the consumption trend in each of the utility categories which impact on the school’s environmental footprint.
Our staff profile
Staff composition, including Indigenous staff
2014 Workforce Composition Teaching Staff*
Non-teaching Staff
Indigenous Staff
Headcounts 24 12 0
Full-time equivalents 17 7 0
Qualification of all teachers
Highest level ofattainment
Number of Teaching Staff *
Certificate 0
Diploma 0
Advanced Diploma 0
Bachelor Degree 14
Graduate Diploma etc.** 2
Masters 4
Doctorate 0
Total 20
0 0 0
14
2
4
00
2
4
6
8
10
12
14
16
*Teaching staff includes School Leaders
**Graduate Diploma etc. includes Graduate Diploma, Bachelor Honours Degree, and Graduate Certificate.

Expenditure on and teacher participation in profess ional development
The total funds expended on teacher professional development in 2014 were $32 382
The major professional development initiatives are as follows:
Explicit teaching of vocabulary
Teaching English as a Second Language Students in a Mainstream Classroom
Using Warm Up in lessons.
Question Answer Relationship (QAR) for reading comprehension
Action Learning Project where teachers worked on self –identified areas of improvement.
The proportion of the teaching staff involved in professional development activities during 2014 was 100%
Average staff attendance 2012 2013 2014
Staff attendance for permanent and temporary staff and school leaders.
98% 98% 96%
Proportion of staff retained from the previous scho ol year
From the end of the previous school year, 89% of staff was retained by the school for the entire 2014 school year.
School income broken down by funding source
School income broken down by funding source is available via the My School website at http://www.myschool.edu.au/.
To access our income details, click on the My School link above. You will then be taken to the My School website with the following ‘Find a school’ text box.
Where it says ‘Search by school name’ , type in the name of the school you wish to view, and select <GO>. Read and follow the instructions on the next screen; you will be asked to accept the Terms of Use and Privacy Policy before being given access to the school’s My School entry webpage.
School financial information is available by selecting ‘School finances’ in the menu box in the top left corner of the school’s entry webpage. If you are unable to access the internet, please contact the school for a paper copy of income by funding source.

Performance of our students
Key student outcomes
Student attendance 2012 2013 2014
The overall attendance rate for the students at this school (shown as a percentage). 95% 93% 94%
The overall attendance rate in 2014 for all Queensland Primary schools was 92%.
Student attendance rate for each year level (shown as a percentage)
Year
1 Year
2
Year 3
Year 4
Year 5
Year 6
Year 7
Year 8 Year 9 Year 10
Year 11
Year 12
2012 94% 95% 94% 93% 95% 96% 96%
2013 95% 92% 94% 90% 94% 93% 94%
2014 93% 96% 93% 96% 94% 95% 94%
DW = Data withheld to ensure confidentiality.
Student attendance distribution
The proportions of students by attendance range.
*The method for calculating attendance changed in 2013 – care should be taken when comparing data after 2012 to that of previous years.
Description of how non-attendance is managed by the school
Non-attendance is managed in state schools in line with the DETE policies, SMS-PR-029: Managing Student Absences and SMS-PR-036: Roll Marking in State Schools, which outline processes for managing and recording student attendance and absenteeism.
Rolls are marked twice a day after the first bell and after second break. Students require a late slip if they arrive after the morning roll is marked. Parents/caregivers report absences with reasons to the student absence line or via email to the class teacher or administration office. Rolls are reviewed and unexplained absences and late arrivals are followed up with parents/caregivers in person or by phone. Education Queensland’s form letters are used to highlight, discuss and resolve excessive absences with parents/caregivers in line with the legislation.
7
11
9
10
14
12
23
21
19
59
54
59
0% 20% 40% 60% 80% 100%
2012
* 2013
2014
Proportion of Students
Attendance Rate: 0% to <85% 85% to <90% 90% to <95% 95% to 100%

National Assessment Program – Literacy and Numeracy (NAPLAN) results – our reading, writing, spelling, grammar and punctuation, and num eracy results for the Years 3, 5, 7, and 9.
Our reading, writing, spelling, grammar and punctuation, and numeracy results for the Years 3, 5, 7 and 9 are available via the My School website at http://www.myschool.edu.au/.
To access our NAPLAN results, click on the My School link above. You will then be taken to the My School website with the following ‘Find a school’ text box.
Where it says ‘Search by school name’ , type in the name of the school whose NAPLAN results you wish to view, and select <GO>.
Read and follow the instructions on the next screen; you will be asked to accept the Terms of Use and Privacy Policy before being able to access NAPLAN data. If you are unable to access the internet, please contact the school for a paper copy of our school’s NAPLAN results.
Achievement – Closing the Gap
Two percentage of our students identify as Indigenous students were enrolled at Brisbane Central State School in 2014. During 2014, their attendance rates were 83.2% which was a significant different to our general population. The year 3 students that participated in the NAPLAN were on par with other students in their year level. The NAPLAN data for our year 5 students showed they were lagging behind other students, however not particularly so. Students’ curriculum achievements showed that they were at standard for their year level.