BRINGING TOP TRENDS in FRESH - iriworldwide.com Top Trends in Fresh... · Jerry Goldsmith Spartan...
67
© 2018 Information Resources Inc. (IRI). Confidential and Proprietary. 1 FOODS BRINGING TO LIFE: TOP TRENDS in FRESH Sally Lyons Wyatt Executive Vice President and Practice Leader, IRI Chris DuBois SVP, Strategic Accounts Transparency & Social Strategy and Cultural Alignment Webinar 2 of 5
Transcript of BRINGING TOP TRENDS in FRESH - iriworldwide.com Top Trends in Fresh... · Jerry Goldsmith Spartan...

© 2018 Information Resources Inc. (IRI). Confidential and Proprietary. 1
FOODS
BRINGING
TO LIFE: TOP TRENDS in FRESH
Sally Lyons Wyatt Executive Vice President
and Practice Leader, IRI
Chris DuBois SVP, Strategic Accounts
Transparency & Social Strategy and Cultural Alignment Webinar 2 of 5

FMI is the trade association that
serves as the voice of food retail.
We assist food retailers in their role
of feeding families and enriching
lives.

ASSET PROTECTION
EDUCATION RESEARCH
FOOD SAFETY & DEFENSE
GOVERNMENT RELATIONS
SUSTAINABILITY
SUPPLY CHAIN
HEALTH & WELLNESS
PRIVATE BRANDS
FRESH FOODS INFORMATION SERVICE
CENTER STORE CONSUMER &
COMMUNITY AFFAIRS INDEPENDENT
OPERATOR
COMMUNICATION WHOLESALER
TECHNOLOGY
The Association:
Our members are food retailers, wholesales and
suppliers of all types and sizes
FMI provides comprehensive programs,
resources and advocacy for the food, pharmacy
and grocery retail industry

Fresh @ FMI
Fresh Foods
Emphasis on fresh
• Produce
• Meat
• Seafood
• Deli/In-store, fresh prepared foods and
assortments
• Bakery
• Floral
FMI is committed to the growth and success of fresh
companies and their partners. FMI provides resources
and networks that support the interests of member
companies throughout the global, fresh produce supply
chain, including family-owned, private and publicly traded
businesses as well as regional, national and international
companies.
Rick Stein Vice President, Fresh Foods
Food Marketing Institute
202.220.0700

FMI Fresh Foods
Research and Education
In-depth information, trends and
insights to foster innovation,
take advantage of new
opportunities and help develop
winning strategies
Networking
Share ideas, explore best
practices and develop business
relations
Advocacy
Understand what is going on in
Washington and make your
voice heard
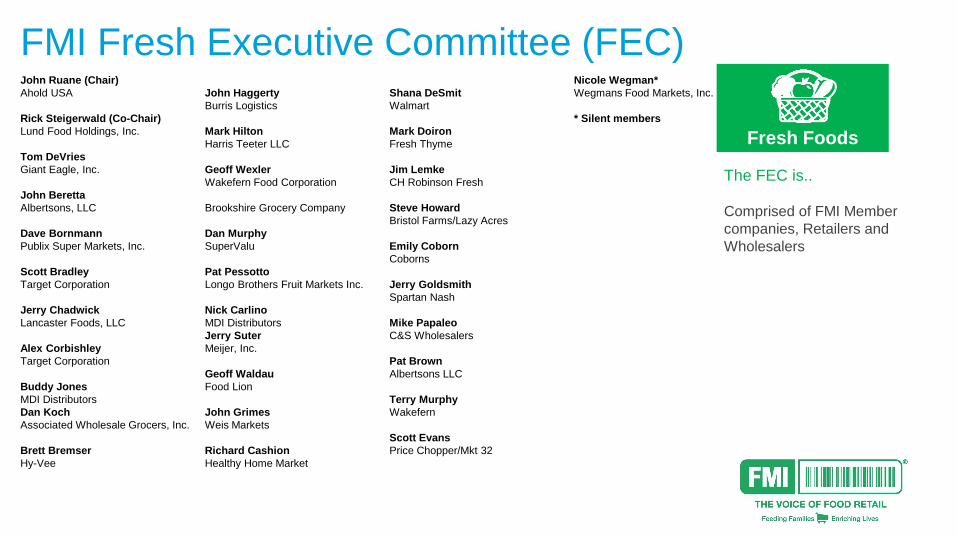
FMI Fresh Executive Committee (FEC) John Ruane (Chair)
Ahold USA
Rick Steigerwald (Co-Chair)
Lund Food Holdings, Inc.
Tom DeVries
Giant Eagle, Inc.
John Beretta
Albertsons, LLC
Dave Bornmann
Publix Super Markets, Inc.
Scott Bradley
Target Corporation
Jerry Chadwick
Lancaster Foods, LLC
Alex Corbishley
Target Corporation
Buddy Jones
MDI Distributors
Dan Koch
Associated Wholesale Grocers, Inc.
Brett Bremser
Hy-Vee
John Haggerty
Burris Logistics
Mark Hilton
Harris Teeter LLC
Geoff Wexler
Wakefern Food Corporation
Brookshire Grocery Company
Dan Murphy
SuperValu
Pat Pessotto
Longo Brothers Fruit Markets Inc.
Nick Carlino
MDI Distributors
Jerry Suter
Meijer, Inc.
Geoff Waldau
Food Lion
John Grimes
Weis Markets
Richard Cashion
Healthy Home Market
Shana DeSmit
Walmart
Mark Doiron
Fresh Thyme
Jim Lemke
CH Robinson Fresh
Steve Howard
Bristol Farms/Lazy Acres
Emily Coborn
Coborns
Jerry Goldsmith
Spartan Nash
Mike Papaleo
C&S Wholesalers
Pat Brown
Albertsons LLC
Terry Murphy
Wakefern
Scott Evans
Price Chopper/Mkt 32
Nicole Wegman*
Wegmans Food Markets, Inc.
* Silent members
The FEC is..
Comprised of FMI Member
companies, Retailers and
Wholesalers
Fresh Foods

FMI Fresh Foods Leadership Council
John Ruane (Co-Chair)
Ahold USA
Rick Steigerwald (Co-Chair)
Lund Food Holdings, Inc.
All- FEC Members
FMI Fresh Executive Council
Chris Dubois
IRI
Michael Eardley
International Dairy-Deli-Bakery Assoc.
Bridget Wasser
National Cattleman's Beef Association
Sarah Schmansky
Nielsen Perishables Group
Paul Mastronardi
Mastronardi Produce
David Sherrod
SE Produce Council
Jeff Oberman
United Fresh Produce Assoc.
Janet Riley
North American Meat Institute
Galit Feinreich
Ready Pac Foods, Inc.
Tom Super
National Chicken Council
Patrick Fleming
National Pork Board
Joe Watson
Produce Marketing Assoc.
Joe Weber
Smithfield Foods Inc.
Art Yerecic
Yerecic Label
Brad Roche
Hill Phoenix
Greg Livelli
Hussmann
Robb MacKie
American Bakers Assoc.
Jim Huston
Johnsonville
Chad Gregory
United Egg Producers
Joe DePetrillo
Earthbound/White Wave
Shawna Lemke
Monsanto
John Knorr
Phillips Seafood
Mike Celani
Wonderful
Chandra Macleod
Aqua Star Seafood
Jeff Thompson
Trident Seafood
Emily Blair
Miliken
John Dunne
Acosta
Scott Aakre
Hormel Foods
Sally Lyons Wyatt
IRI
Wendy Reinhardt Kapsak
Produce for Better Health (PBH)
Michael Lang
Invatron
Tom Daniel
Sterilox/Chemstar
Randy Evins
SAP
Tom Windish
Cargill

© 2018 Information Resources Inc. (IRI). Confidential and Proprietary. 8
TODAY’S DISCUSSION
Progression of our study
Trend Overviews
2018 Education Series Rollout

© 2018 Information Resources Inc. (IRI). Confidential and Proprietary. 9
Our study focused on the shopper and consumer
LEVERAGED
10
trends 2016 & 2017
CONFIRMED
relevance & evolution with
consumers
VALIDATED
primary & secondary research

© 2018 Information Resources Inc. (IRI). Confidential and Proprietary. 10
2017 2016
“Fresh”en Up @...
IRI Worldwide.com/insights or
fmi.org/TopTrendsInFresh

© 2018 Information Resources Inc. (IRI). Confidential and Proprietary. 11
SEAFOOD MEAT
PR
OD
UC
E
29.0% ($116Billion)
Perimeter Findings…More than Half of F&B Growth
From 2013’s
30.5% ($140Billion)
To 2017’s
DE
LI
$426.8B F&B 2017
FR
ES
H
PR
EP
AR
ED
B
AK
ER
Y
Source: IRI FreshLook POS data, Multi-Outlet, 52 weeks ending 12/31/2017

© 2018 Information Resources Inc. (IRI). Confidential and Proprietary. 12
Nearly double F&B
Perimeter outpacing other F&B departments over last 4 years,
but slowing growth
4-YEAR CAGR DOLLAR GROWTH
TOTAL
FOOD BEVERAGES
2.3%
REFRIGRATED PERIMETER
1.8% 1.5%
FOOD &
BEVERAGE
1.2%
GENERAL
FOOD
1.2%
FROZEN
0.8%
SEAFOOD MEAT
PR
OD
UC
E B
AK
ER
Y
FR
ES
H
PR
EP
AR
ED
BA
KE
RY
2.9%

© 2018 Information Resources Inc. (IRI). Confidential and Proprietary. 13
DE
LI
SEAFOOD MEAT
PR
OD
UC
E
But…Momentum
Slows in 2017
$6.3B
$2.5B
$5.8B
$12.3B
$48.6B $4.4B
Source: IRI FreshLook POS data, Multi-Outlet, 52
weeks ending 12/31/2017
$59.8B
FR
ES
H
PR
EP
AR
ED
BA
KE
RY
$ 1.5 billion
+1.1%
Vol 0.0%
Source: IRI FreshLook POS data, Multi-Outlet, 52 weeks ending 12/31/2017

© 2018 Information Resources Inc. (IRI). Confidential and Proprietary. 14
-0.3% -0.4%
0.9
$
1.7
-2.9%
With volume declines impacting key segments
Seafood Deli Prep Deli Cheese
Source: IRI FreshLook POS data, Multi-Outlet, 52 weeks ending 12/31/2017
Meat
-0.3%
1.6
0.6%
Produce
0.0
$
Bakery
0.5% 0.1%
Deli Meat
0.7%
-4.4%
VOL
VOL
$
$ $
VOL VOL VOL $
$ VOL
VOL
0.6
$
© 2018 Information Resources Inc. (IRI). Confidential and Proprietary. 15
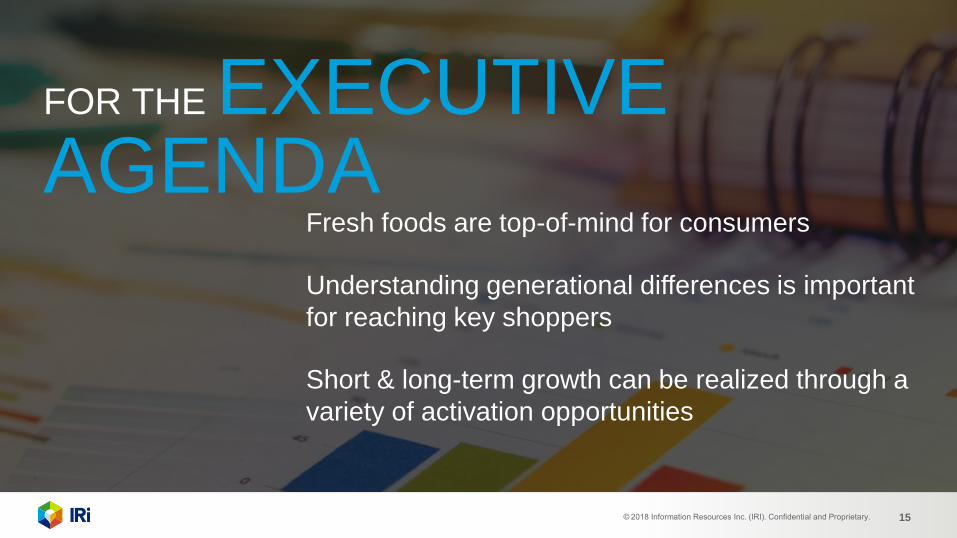
FOR THE EXECUTIVE AGENDA
Fresh foods are top-of-mind for consumers
Understanding generational differences is important
for reaching key shoppers
Short & long-term growth can be realized through a
variety of activation opportunities

© 2018 Information Resources Inc. (IRI). Confidential and Proprietary. 16
BUT THERE IS A LOT OF
WORK TO DO
TRENDS are RELEVANT still
© 2018 Information Resources Inc. (IRI). Confidential and Proprietary. 17
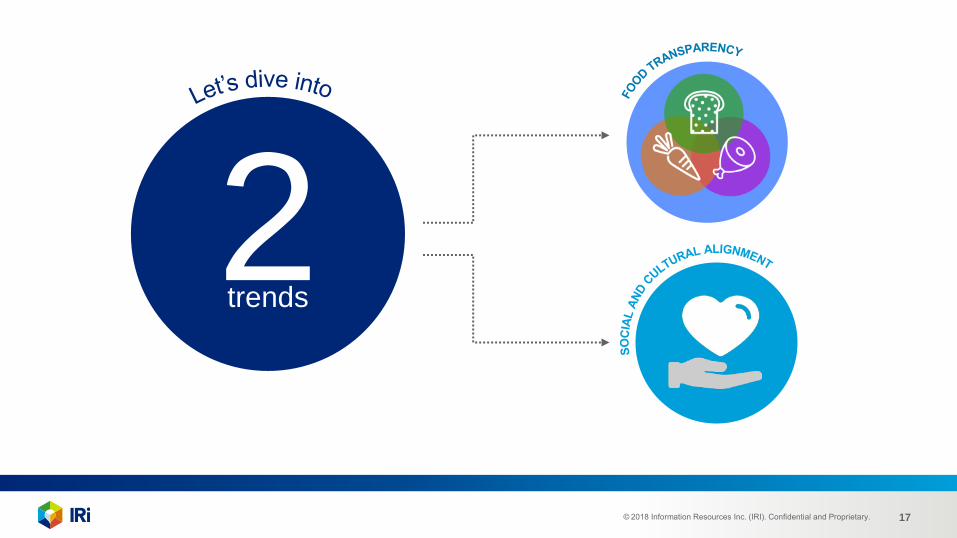
2 trends

© 2018 Information Resources Inc. (IRI). Confidential and Proprietary. 18
These macro trends
have several similarities
What’s in
my food?
Where did
my food
come from?
How was it
farmed?
Were the animals
and people treated
fairly?
Did they avoid
harsh chemicals?
Was the planet
taken care of?
© 2018 Information Resources Inc. (IRI). Confidential and Proprietary. 19
FOOD
TRANSPARENCY

© 2018 Information Resources Inc. (IRI). Confidential and Proprietary. 20
The consumer desire to know how and where food was grown or made. The consumer expectation for clarity, accuracy and usefulness of food related information from the companies that produce and sell it.
FOOD TRANSPARENCY

© 2018 Information Resources Inc. (IRI). Confidential and Proprietary. 21
Transparency is important to the vast
majority of fresh food shoppers
Nearly ½ of
those shoppers
define healthy food
by the “absence of
the bad stuff”
82% Health & Wellness (net)
1 Free of growth hormones
2 Free of antibiotics
3 No GMO or bio-engineered
4 Grown without pesticides or fertilizers
5 Non-irradiated foods
Source: 2017 Fresh Food Shopping Trends Survey FOOD TRANSPARENCY
CONSUMERS CONFIRMING

© 2018 Information Resources Inc. (IRI). Confidential and Proprietary. 22
2015 2017
Organic
Produce Deli NAE
Meat
Deli
Organic
Cheese
NAE
Meat
Organic
Meat
$4.5B
+13% sales
$5.7B
+8% $%Chg
17% 5 yr CAGR
+40% 5 yr CAGR
$2.9B
+23% sales
$5.1B
+45% sales
$582M
+32% sales
$819M
+9% sales
Source: IRI FreshLook POS data, MULO, 52 weeks ending 12/31/2017
Primary claims are still very relevant to consumers with
strong growth
FOOD TRANSPARENCY
CONSUMERS CONFIRMING

© 2018 Information Resources Inc. (IRI). Confidential and Proprietary. 23
Antibiotic-free chicken has more than doubled in the past
couple years
2015
2017
12% of sales
Source: IRI FreshLook POS data, MULO, 52 weeks ending 12/31/2017
Antibiotic
free Organic
Combined
Annual
Growth
28% of sales
3% of sales
4% of sales
+31%
+61%
FOOD TRANSPARENCY
CONSUMERS CONFIRMING

© 2018 Information Resources Inc. (IRI). Confidential and Proprietary. 24
Although Organic Produce can now be found in more categories, the
price compression has limited the dollar share but still driving growth
2015
2017
+13%
Source: IRI FreshLook POS data, MULO, 52 weeks ending 12/31/2017
Sales
growth
# of
categories
> 10%
sales share
+8%
Organic
8% of sales
9% of sales
9
17
FOOD TRANSPARENCY
CONSUMERS CONFIRMING

© 2018 Information Resources Inc. (IRI). Confidential and Proprietary. 25
These primary claims have contributed to meat and produce
growth where available
Organic chicken
contribution to total
chicken $ sales growth
13%
Organic produce
contribution to total
produce $ sales growth
20%
NAE and Organic deli
meat contribution to total
deli $ sales growth
3%
Source: IRI FreshLook POS data, MULO, 52 weeks ending 12/31/2017
FOOD TRANSPARENCY
CONSUMERS CONFIRMING

© 2018 Information Resources Inc. (IRI). Confidential and Proprietary. 26 FOOD TRANSPARENCY EVOLUTION
2 in 3 fresh food shoppers report
that H&W/transparency
has become a more
motivating factor for them
than it was in the past
1 in 3 mentioned the “absence
of the bad stuff” being
much more important now
than a few years ago.
Source: 2017 Fresh Food Shopping Trends Survey

© 2018 Information Resources Inc. (IRI). Confidential and Proprietary. 27
Consumers are
putting more
emphasis on certain
transparency factors
FACTORS THAT HAVE INCREASED IN IMPORTANCE: (ARE MUCH MORE PREVALENT NOW VS. A FEW YEARS AGO)
65% 32% 33% 31% 30% 15%
Health &
Wellness (Net) Antibiotic
free
Free of growth
hormones
Free of pesticides
or fertilizers
No-GMOs
ingredients
Non-irradiated
foods
Source: 2017 Fresh Food Shopping Trends Survey FOOD TRANSPARENCY EVOLUTION

© 2018 Information Resources Inc. (IRI). Confidential and Proprietary. 28
0
0.002
0.004
0.006
0.008
0.01
0.012
Jan-12 Jul-12 Jan-13 Jul-13 Jan-14 Jul-14 Jan-15 Jul-15 Jan-16 Jul-16 Jan-17 Jul-17 Jan-18
FOOD PRODUCTION & SUSTAINABILITY SOCIAL MEDIA MENTIONS 5-YEAR TREND
Social media mentions rising steadily since 2012 with spikes tied to news media
Consumers online conversations are increasingly discussing
food production
Source: IRI Social Advantage Monitoring and Analysis (>40MM sites) Jan 2012-Mar 2018, normalized *Animal Welfare claims includes No Antibiotics Ever, All Veg Diet, No Animal Bi-Products, Free-Range/Cage Free and Grass Fed
Share
of
To
tal In
tern
et
(%)
Sustainable
Seafood
Food
Waste GMO
Fair
Trade
Animal
Welfare
Additional
Claims
FOOD TRANSPARENCY EVOLUTION

© 2018 Information Resources Inc. (IRI). Confidential and Proprietary. 29
0
0.002
0.004
0.006
0.008
0.01
0.012
Jan-12 Jul-12 Jan-13 Jul-13 Jan-14 Jul-14 Jan-15 Jul-15 Jan-16 Jul-16 Jan-17 Jul-17 Jan-18
GMO SOCIAL MEDIA MENTIONS 5-YEAR TREND
Consumer interest in GMOs is also increasing
GMO chatter has been on the rise since 2012, peaking exponentially in 2017
Source: IRI Social Advantage Monitoring and Analysis, Jan 2012-Mar 2018, normalized
At 5.1MM, GMO post volume
is roughly
1/2 as many mentions as
Coca-Cola and
2X more than Gatorade
Share
of
To
tal In
tern
et
(%)
non-GMO claims
reaching store-
shelves + news
media mentions
FOOD TRANSPARENCY EVOLUTION

© 2018 Information Resources Inc. (IRI). Confidential and Proprietary. 30
What consumers are saying about GMOs can provide
personalization messaging Specific key-words mentioned together (size indicates number of mentions)
Source: IRI Social Advantage Monitoring and Analysis, Jan 2012-Mar 2018, normalized, demos indexed to social media engagement
products
Ingredients List
Water
People work
salt help
Vitamins
makes
health
chemicals
body
think
FOOD TRANSPARENCY EVOLUTION

© 2018 Information Resources Inc. (IRI). Confidential and Proprietary. 31
…and look who’s talking
Source: IRI Social Advantage Monitoring and Analysis, Jan 2012-Mar 2018, normalized, demos indexed to social media engagement
% of GMO Social Media Mentions by Age
13-18
19-24
25-34
35-44
45-54
55-64
65+
54% of GMO chatter
from 25-44 year olds,
most likely raising the
next generation
FOOD TRANSPARENCY EVOLUTION

© 2018 Information Resources Inc. (IRI). Confidential and Proprietary. 32
0%
10%
20%
30%
40%
50%
60%
70%
80%
90%
100%
% OF BRANDS’ SOCIAL MEDIA MENTIONS WITH POSITIVE SENTIMENT
First Mover Fast Follower Other Category Suppliers
First Mover announces
program and converts
line in test markets
Food can claims impact perception & sales When, how and where programs are implemented matters to generating success
Source: IRI Social Advantage, 52 weeks ending 12/30/2017 & IRI Test/Control POS Sales Analysis
Fast Follower
announces similar
program and
converts line
In addition to sustaining
positive social mentions, First
Mover brand saw +5.3%
higher dollar sales in test
markets vs. control
FOOD TRANSPARENCY EVOLUTION

© 2018 Information Resources Inc. (IRI). Confidential and Proprietary. 33
Source: IRI/Spins NaturalLink segmentation; IRI Consumer panel
IRI FreshLook POS data; MULO, 52 weeks ending 11/29/2015, IRI analysis
2015
*
*
* * * *
* *
2017
Source: IRI FreshLook POS data; MULO, 52 weeks ending 12/31/17 ranked
based on combined score of both attributes
Adoption over the past 2 years has been significant in the northeast and in Florida –
NAE reaching 10% U.S. $ share and Organic Produce up 1.2 points to 8.7% $ share
Low
Adoption
High
Adoption NAE Meat and Organic Produce
• Indicates market increased from low to high adoption since 2015
• due to increased programs, especially in NAE meats
FOOD TRANSPARENCY EVOLUTION

© 2018 Information Resources Inc. (IRI). Confidential and Proprietary. 34
Seattle still outpaces the U.S. F
RO
M 2
01
5
TO
20
17
5.9% 11.6%
Organic Produce
US Average Share
Seattle Share
7.5% 14.2%
US Average Share
Seattle Share
10% 13.7%
Organic Produce
US Average Share
Seattle Share
8.7% 14.9%
US Average Share
Seattle Share
Source: IRI/Spins NaturalLink segmentation; IRI Consumer panel
IRI FreshLook POS data; MULO, 52 weeks ending 11/29/2015, IRI analysis
Source: IRI FreshLook POS data; MULO, 52 weeks ending 12/31/17 ranked
based on combined score of both attributes
NAE Meat Seattle
NAE Meat
FOOD TRANSPARENCY EVOLUTION

© 2018 Information Resources Inc. (IRI). Confidential and Proprietary. 35
Norfolk is keeping up with the U.S. averages F
RO
M 2
01
5
TO
20
17
Organic Produce Organic Produce
Source: IRI/Spins NaturalLink segmentation; IRI Consumer panel
IRI FreshLook POS data; MULO, 52 weeks ending 11/29/2015, IRI analysis
Source: IRI FreshLook POS data; MULO, 52 weeks ending 12/31/17 ranked
based on combined score of both attributes
NAE Meat Norfolk
NAE Meat
5.9% 4.9%
US Average Share
Norfolk Share
7.5% 7.0%
US Average Share
Norfolk Share
10% 10%
US Average Share
Norfolk Share
8.7% 8.6%
US Average Share
Norfolk Share
FOOD TRANSPARENCY EVOLUTION
© 2018 Information Resources Inc. (IRI). Confidential and Proprietary. 36
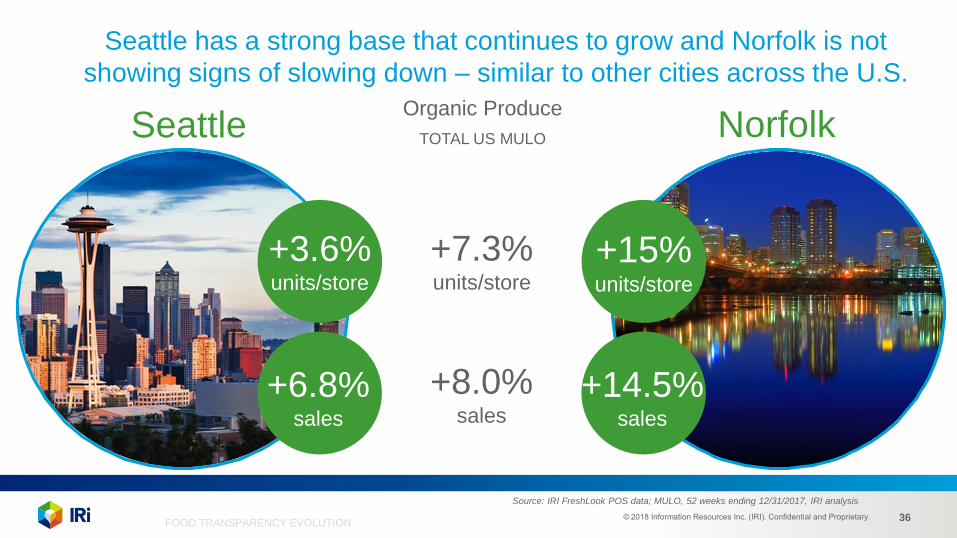
Source: IRI FreshLook POS data; MULO, 52 weeks ending 12/31/2017, IRI analysis
Norfolk Seattle
+15% units/store
+14.5% sales
+3.6% units/store
+6.8% sales
TOTAL US MULO
+7.3% units/store
+8.0% sales
Seattle has a strong base that continues to grow and Norfolk is not
showing signs of slowing down – similar to other cities across the U.S.
Organic Produce
FOOD TRANSPARENCY EVOLUTION
© 2018 Information Resources Inc. (IRI). Confidential and Proprietary. 37
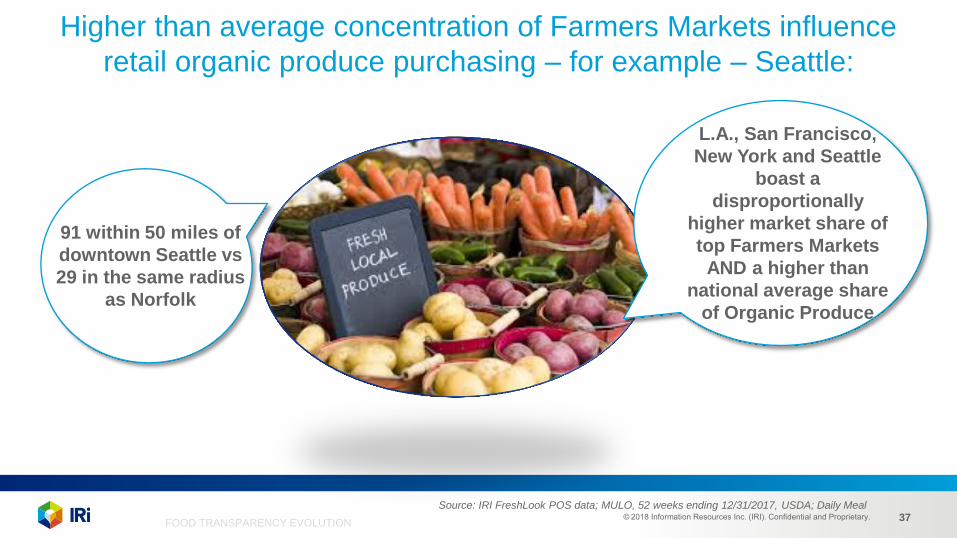
Higher than average concentration of Farmers Markets influence
retail organic produce purchasing – for example – Seattle:
L.A., San Francisco,
New York and Seattle
boast a
disproportionally
higher market share of
top Farmers Markets
AND a higher than
national average share
of Organic Produce
91 within 50 miles of
downtown Seattle vs
29 in the same radius
as Norfolk
Source: IRI FreshLook POS data; MULO, 52 weeks ending 12/31/2017, USDA; Daily Meal
FOOD TRANSPARENCY EVOLUTION
© 2018 Information Resources Inc. (IRI). Confidential and Proprietary. 38
Top
20% Retailers
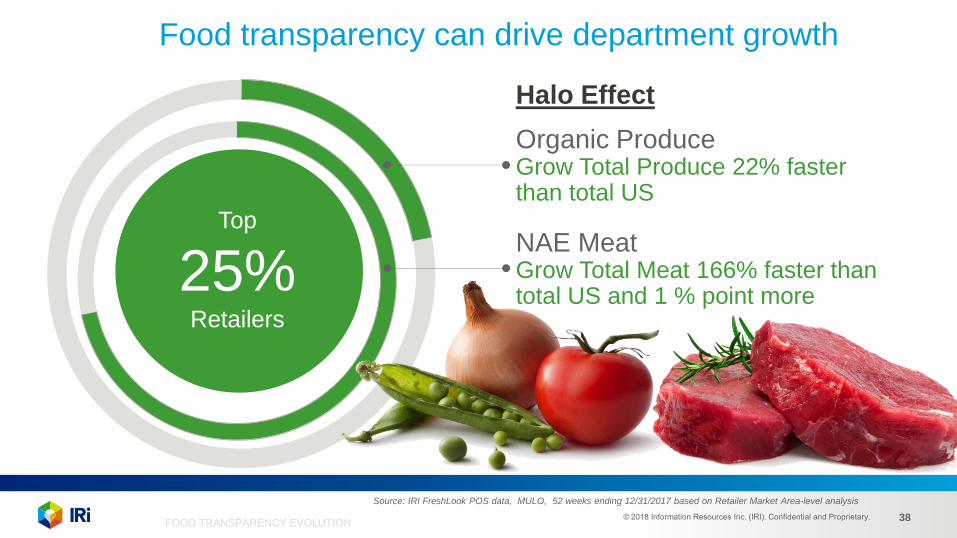
Food transparency can drive department growth
NAE Meat Grow Total Meat 166% faster than total US and 1 % point more
Organic Produce Grow Total Produce 22% faster than total US
Halo Effect
Source: IRI FreshLook POS data, MULO, 52 weeks ending 12/31/2017 based on Retailer Market Area-level analysis
Top
25% Retailers
FOOD TRANSPARENCY EVOLUTION

© 2018 Information Resources Inc. (IRI). Confidential and Proprietary. 39
Information & expertise is influencing the shopping outlet
preferences when buying fresh
Specialty Grocery Store
Farmers Market
Mass Merchandise
Store
43%
MILLENNIALS BABY BOOMERS
63% 19%
MILLENNIALS BABY BOOMERS
35% 23%
MILLENNIALS BABY BOOMERS
34% TOTAL TOTAL TOTAL
27% 24% 50%
Source: 2017 Fresh Food Shopping Trends Survey FOOD TRANSPARENCY EVOLUTION

© 2018 Information Resources Inc. (IRI). Confidential and Proprietary. 40
Source: Company Website and App
Mobile applications are allowing consumers to gain more information about
their foods and presents an opportunity to connect with “the connected”
FOOD TRANSPARENCY EVOLUTION

© 2018 Information Resources Inc. (IRI). Confidential and Proprietary. 41
SOCIAL STRATEGY &
CULTURAL
ALIGNMENT

© 2018 Information Resources Inc. (IRI). Confidential and Proprietary. 42
A company’s ability to grow sales by integrating the underlying consumer motivations and values that ultimately impact sales
SOCIAL STRATEGY &
CULTURAL ALIGNMENT

© 2018 Information Resources Inc. (IRI). Confidential and Proprietary. 43
Source: IRI Social Advantage, 52 weeks ending 12/30/2016
During our 2017 webinar, we identified these five top social
sentiment drivers of consumer purchase and consumption
SOCIAL STRATEGY &
CULTURAL ALIGNMENT

© 2018 Information Resources Inc. (IRI). Confidential and Proprietary. 44
Data Source: IRI FreshLook POS, MULO, latest 52 weeks ending 12-31-2017
Ratings Source: Greenpeace USA, Grocery Store Scorecard
Strong sustainability programs are continuing to sell more seafood
SOCIAL & CULTURAL
CONSUMERS CONFIRMING
+3.3% +0.1%
Strong/Average Program
+4.4% YOY DOLLAR SALES
Strong/Average Program
+0.6% YOY DOLLAR SALES
Weak Program
+2.2% YOY DOLLAR SALES
Weak Program
-2.6% YOY DOLLAR SALES

© 2018 Information Resources Inc. (IRI). Confidential and Proprietary. 45
Cage Free eggs are proving to be a viable segment for growth and premiumization –
We have seen an increase in cage-free eggs flocks and more coming
Sources: American Egg Board, cagefreefuture.com
SOCIAL & CULTURAL
CONSUMERS CONFIRMING
15.9% of US flocks in
Oct. 2017
119 pledges from
companies
10% of TTL
fresh eggs
18 point spread vs.
rest of fresh eggs
Industry wide pledges to
go cage-free by 2025 or
sooner including top
QSR, food service,
retailers and producers
Massive cost
increases and
industry consolidation
Demand may
not be met
© 2018 Information Resources Inc. (IRI). Confidential and Proprietary. 46
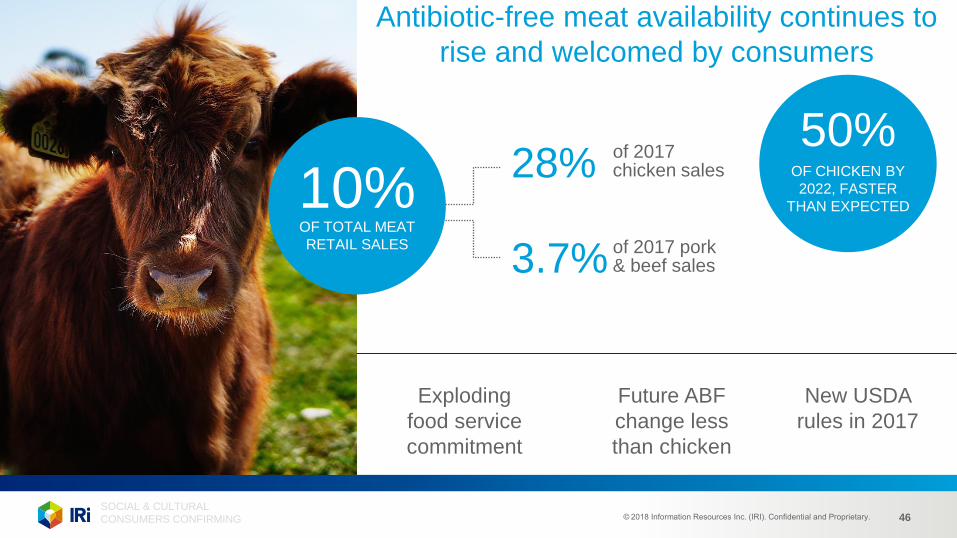
Antibiotic-free meat availability continues to
rise and welcomed by consumers
SOCIAL & CULTURAL
CONSUMERS CONFIRMING
10% OF TOTAL MEAT
RETAIL SALES
28%
3.7%
of 2017 chicken sales
of 2017 pork & beef sales
50% OF CHICKEN BY
2022, FASTER
THAN EXPECTED
Exploding
food service
commitment
Future ABF
change less
than chicken
New USDA
rules in 2017

© 2018 Information Resources Inc. (IRI). Confidential and Proprietary. 47
Retailers who merchandise antibiotic-free meat grew faster than average
Top 25% of ABF/Organic Retailer RMAs grew
pounds 166% faster across Total Fresh Meat 1.6% sales
growth vs.
0.6% Total
2017
US growth
SOCIAL & CULTURAL
CONSUMERS CONFIRMING
© 2018 Information Resources Inc. (IRI). Confidential and Proprietary. 48
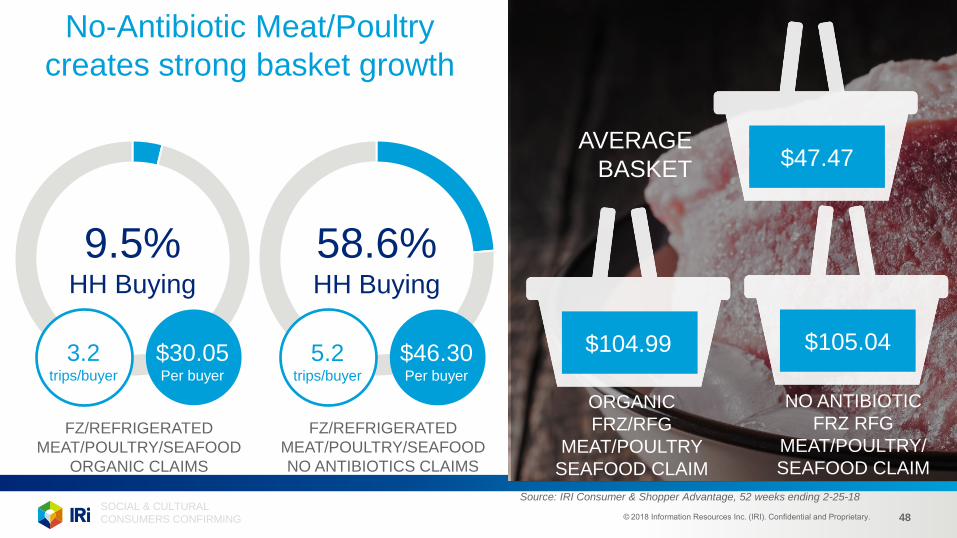
No-Antibiotic Meat/Poultry
creates strong basket growth
9.5% HH Buying
FZ/REFRIGERATED
MEAT/POULTRY/SEAFOOD
ORGANIC CLAIMS
$30.05 Per buyer
3.2 trips/buyer
58.6% HH Buying
$46.30 Per buyer
5.2 trips/buyer
FZ/REFRIGERATED
MEAT/POULTRY/SEAFOOD
NO ANTIBIOTICS CLAIMS
AVERAGE
BASKET $47.47
$104.99 $105.04
ORGANIC
FRZ/RFG
MEAT/POULTRY
SEAFOOD CLAIM
NO ANTIBIOTIC
FRZ RFG
MEAT/POULTRY/
SEAFOOD CLAIM
Source: IRI Consumer & Shopper Advantage, 52 weeks ending 2-25-18
SOCIAL & CULTURAL
CONSUMERS CONFIRMING

© 2018 Information Resources Inc. (IRI). Confidential and Proprietary. 49
57% of consumers
are motivated by
social & cultural
factors – specifically:
27% 26% 22% 18% 14%
Less packaging Sustainability
produced/grown
Organic Animal welfare
certified
Ecological/
biodegradable
packaging
Source: 2017 Fresh Food Shopping Trends Survey
SOCIAL & CULTURAL
EVOLUTION
© 2018 Information Resources Inc. (IRI). Confidential and Proprietary. 50
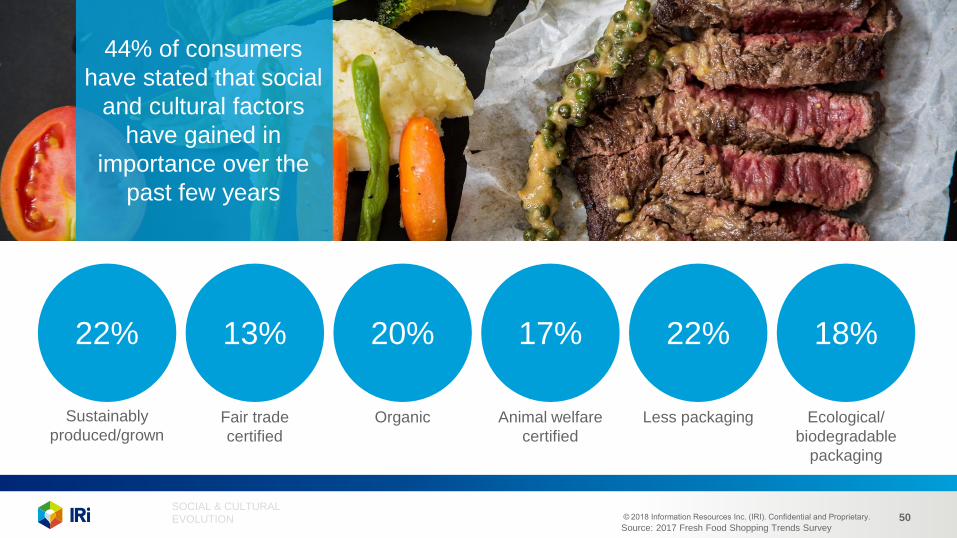
44% of consumers
have stated that social
and cultural factors
have gained in
importance over the
past few years
22% 13% 20% 17% 22% 18%
Sustainably
produced/grown Fair trade
certified
Organic Animal welfare
certified
Less packaging Ecological/
biodegradable
packaging
Source: 2017 Fresh Food Shopping Trends Survey
SOCIAL & CULTURAL
EVOLUTION
© 2018 Information Resources Inc. (IRI). Confidential and Proprietary. 51
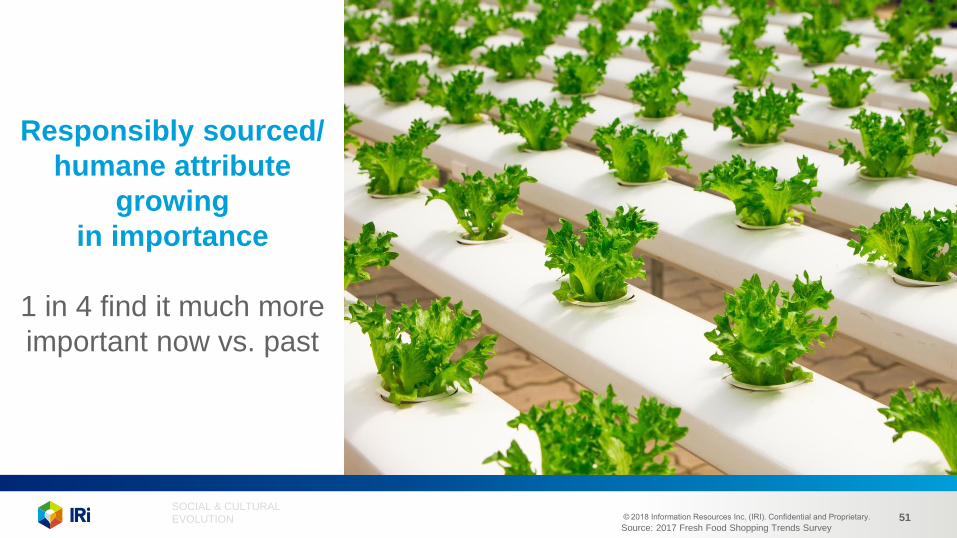
Responsibly sourced/
humane attribute
growing
in importance
1 in 4 find it much more
important now vs. past
Source: 2017 Fresh Food Shopping Trends Survey
SOCIAL & CULTURAL
EVOLUTION

© 2018 Information Resources Inc. (IRI). Confidential and Proprietary. 52
Millennials are
more likely to…
67% 68% 32% 27% 33% 18%
seek out locally
sourced foods
care about the
social and cultural
aspect of their
fresh food
care about
less packaging
purchase animal
welfare certified
purchase organic seek ecological
options
Source: 2017 Fresh Food Shopping Trends Survey
SOCIAL & CULTURAL
EVOLUTION

© 2018 Information Resources Inc. (IRI). Confidential and Proprietary. 53
Generational differences in values exist regarding sustainably
produced, organic, ecological (less packaging) factors
Source: 2017 Fresh Food Shopping Trends Survey
55% 43% 39%
SOCIAL & CULTURAL
EVOLUTION

© 2018 Information Resources Inc. (IRI). Confidential and Proprietary. 54
Local is a contributing
factor for where
consumers shop to
purchase produce
and meat
Importance of ‘Local’ when
shopping for Fresh Food: (Very
important/primary reason I shop outlet)
30% 21%
Locally sourced
fruits/vegetables
Locally farmed
meat/poultry
Source: 2017 Fresh Food Shopping Trends Survey
SOCIAL & CULTURAL
EVOLUTION

© 2018 Information Resources Inc. (IRI). Confidential and Proprietary. 55
47% 40%
54% 53%
40% 35%
38% 33%
Makes me feel like store cares about
overall welfare of others (me/my family)
Makes me feel the store
cares about local community
Makes me feel like the store lives up
to my values/expectations
Makes me feel like the store understands
my values/preferences
Locally sourced
fruits/vegetables
Locally farmed
meat/poultry
Source: 2017 Fresh Food Shopping Trends Survey
Having access to the locally sourced produce and meat makes shoppers feel like
the outlet cares about the local community and the overall welfare of the community
SOCIAL & CULTURAL
EVOLUTION

© 2018 Information Resources Inc. (IRI). Confidential and Proprietary. 56
Consumers engage
online and their
conversations influence
their purchasing
SOCIAL & CULTURAL
EVOLUTION
© 2018 Information Resources Inc. (IRI). Confidential and Proprietary. 57
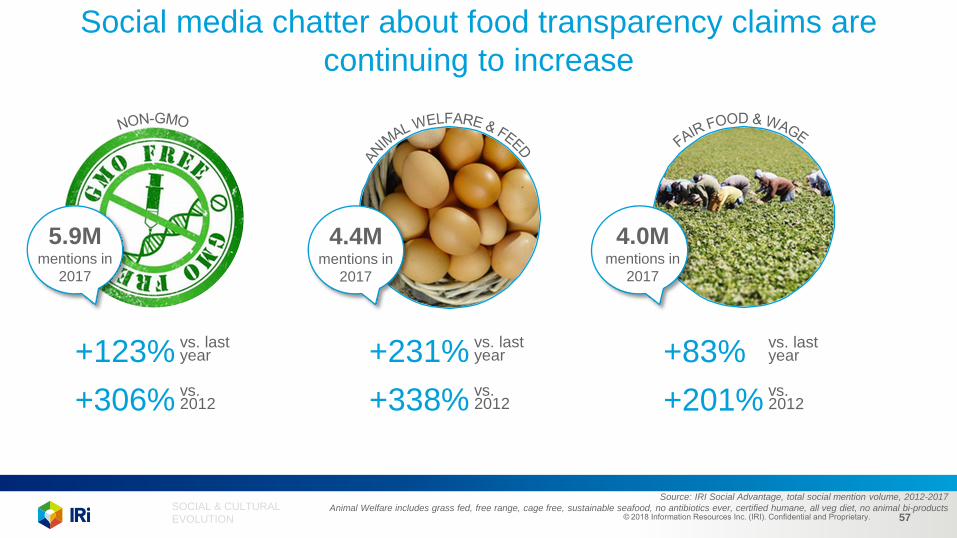
Social media chatter about food transparency claims are
continuing to increase
Source: IRI Social Advantage, total social mention volume, 2012-2017
Animal Welfare includes grass fed, free range, cage free, sustainable seafood, no antibiotics ever, certified humane, all veg diet, no animal bi-products
4.4M mentions in
2017
5.9M mentions in
2017
4.0M mentions in
2017
+123% vs. last year
+306% vs. 2012
+231% vs. last year
+338% vs. 2012
+83% vs. last year
+201% vs. 2012
SOCIAL & CULTURAL
EVOLUTION

© 2018 Information Resources Inc. (IRI). Confidential and Proprietary. 58
Not only has social chatter increased, it’s become more detailed
Source: IRI Social Advantage, total social mention volume, 2012-2017
Animal Welfare includes grass fed, free range, cage free, sustainable seafood, no antibiotics ever, certified humane, all veg diet, no animal bi-products
How we treat and feed our food supply has seen the most notable increase in the past 24 months
+222%
2M mentions in
2017
1.9M mentions in
2017
401K mentions in
2017
57K mentions in
2017
+227% +353% +226% vs. YAGO vs. YAGO vs. YAGO vs. YAGO
SOCIAL & CULTURAL
EVOLUTION

© 2018 Information Resources Inc. (IRI). Confidential and Proprietary. 59
We see fair wage/trade
driving partnerships
and online chatter
Retailer/grower partnerships:
Worker conditions
Pay/Wage agreements
Formal governance
Structure
Education commitments
Top words with
‘fair trade’ on
social media
Source: IRI Social Advantage, 2017
People
Community
Support
Love
SOCIAL & CULTURAL
EVOLUTION

© 2018 Information Resources Inc. (IRI). Confidential and Proprietary. 60
Unfortunately, America leads
the world in food waste
133 billion lbs of waste globally
40% of food is
wasted
totaling
$161B In U.S.
21% of municipal
landfill use
Food waste
is
16% of methane
emissions
A 15% reduction in US food waste
could feed 25 million people
Source: USDA
SOCIAL & CULTURAL
EVOLUTION

© 2018 Information Resources Inc. (IRI). Confidential and Proprietary. 61
More and more consumers are talking
about food waste online, which will
lead to solution adoption
Source: IRI Social Advantage, total social mention volume, 2012-2017
Animal Welfare includes grass fed, free range, cage free, sustainable seafood, no antibiotics ever, certified humane, all veg diet, no animal bi-products
+123% vs. last year
+306% vs. 2012
1.8M mentions in
2017
SOCIAL & CULTURAL
EVOLUTION

© 2018 Information Resources Inc. (IRI). Confidential and Proprietary. 62
Embrace consumers by...
Leveraging
omni-channel
communications
Ensuring pre-
packaged meats
and meals clearly
communicate
ingredients
Making it easier
for consumers to
find the social and
cultural symbols
SOCIAL & CULTURAL
EVOLUTION

© 2018 Information Resources Inc. (IRI). Confidential and Proprietary. 63
Retailer priorities to consider
Amplify the Integrity of Fresh Increase focus on social and cultural needs
that are relevant to key targets
Own the Consumer Connection Retailers are highly trusted by consumers for accurate
information
Be Consistent Across Departments Consumers see the total store –
Transparency and Social/Cultural transcend categories
Get Full Credit from Consumers Tout relationships with food banks;
Preventable waste programs;
Food integrity programs

© 2018 Information Resources Inc. (IRI). Confidential and Proprietary. 64
Manufacturers may consider
First Mover vs. Fast Follower Strategies In the full spectrum of possibilities, not all elements require
first-mover investments but you need to engage
The Pace Will Accelerate Current pace is accelerating as fresh supply chains
improve and adopt new capabilities - ensure you are too!
Issues May Not Matter Until They Matter… But then it will matter…Consumer focus will shift and fragment,
but some topics will amplify quickly.
Variety Counts Consumers have an increased focus on right size portions
and packaging, so leverage your assortment

© 2018 Information Resources Inc. (IRI). Confidential and Proprietary. 65
© 2018 Information Resources Inc. (IRI). Confidential and Proprietary. 66
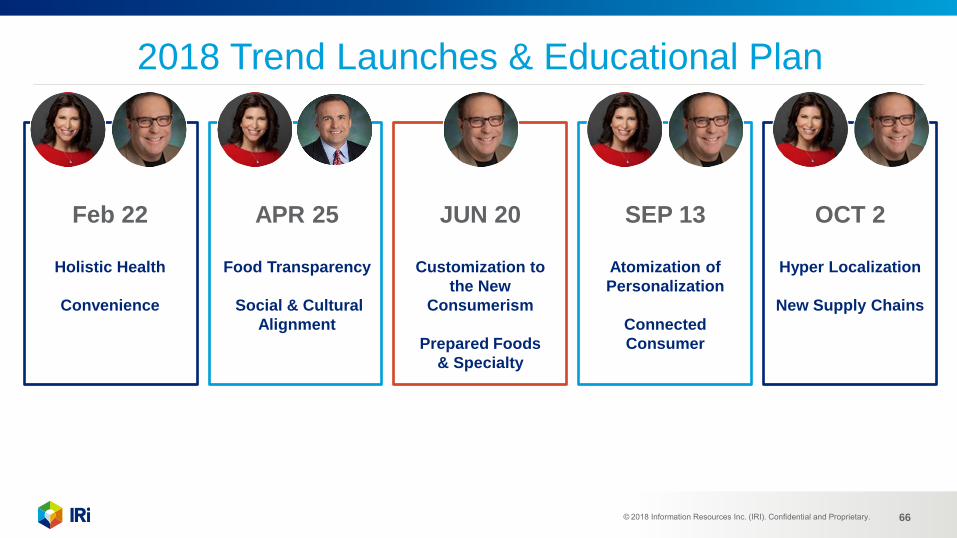
2018 Trend Launches & Educational Plan
Feb 22
Holistic Health
Convenience
APR 25
Food Transparency
Social & Cultural
Alignment
JUN 20
Customization to
the New
Consumerism
Prepared Foods
& Specialty
SEP 13
Atomization of
Personalization
Connected
Consumer
OCT 2
Hyper Localization
New Supply Chains

© 2018 Information Resources Inc. (IRI). Confidential and Proprietary. 67
FOODS
BRINGING
TO LIFE: TOP TRENDS in FRESH
Thank you!
Sally Lyons Wyatt [email protected]
Copyright © 2018 Information Resources, Inc. (IRI). Confidential and proprietary.
Chris DuBois [email protected]
Transparency & Social Strategy and Cultural Alignment Webinar 2 of 5