Brighthouse Funds Trust II
309
Brighthouse Funds Trust II Schedule of Investments September 30, 2018
Transcript of Brighthouse Funds Trust II

Brighthouse Funds Trust II
Schedule of InvestmentsSeptember 30, 2018
Brighthouse Funds Trust II
Table of Contents
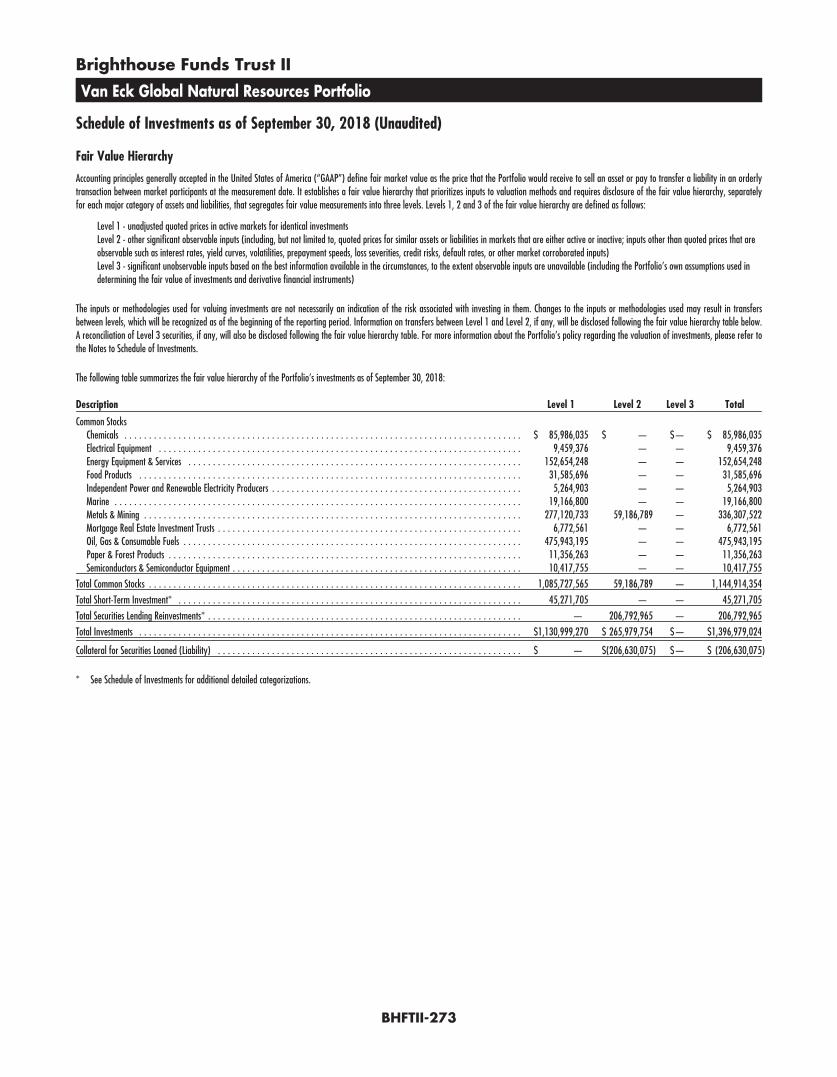
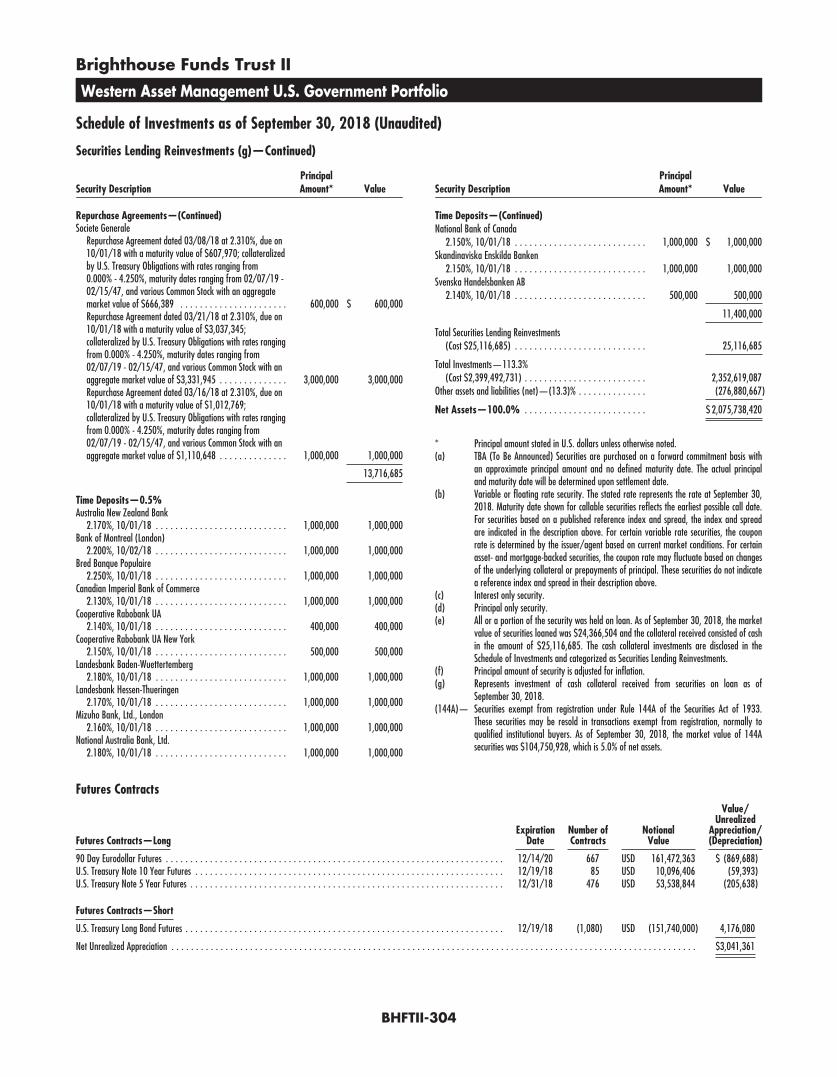
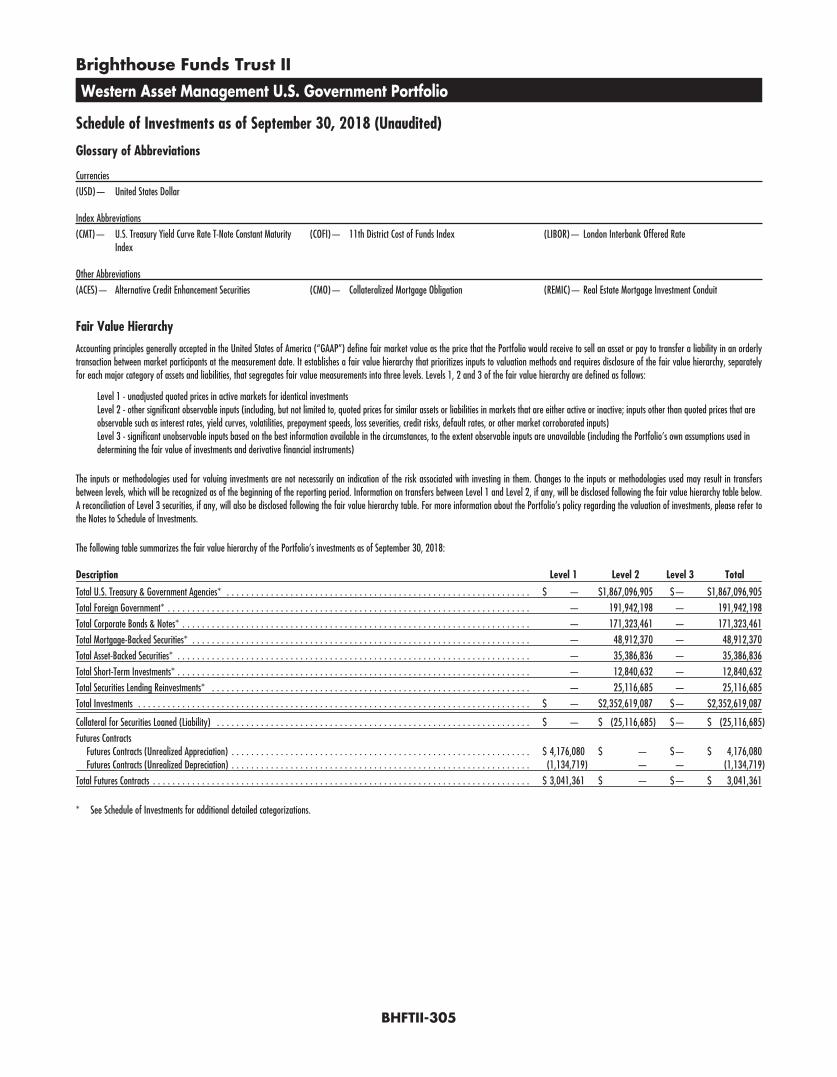
Schedule of Investments as of September 30, 2018 (Unaudited)
Baillie Gifford International Stock Portfolio . . . . . . . . . . . . . . . . . . . . . . . . . . . . . . . . . . . . . . . . . . . . BHFTII-1BlackRock Bond Income Portfolio . . . . . . . . . . . . . . . . . . . . . . . . . . . . . . . . . . . . . . . . . . . . . . . . . . BHFTII-6BlackRock Capital Appreciation Portfolio . . . . . . . . . . . . . . . . . . . . . . . . . . . . . . . . . . . . . . . . . . . . . BHFTII-50BlackRock Ultra-Short Term Bond Portfolio . . . . . . . . . . . . . . . . . . . . . . . . . . . . . . . . . . . . . . . . . . . . BHFTII-55Brighthouse/Artisan Mid Cap Value Portfolio . . . . . . . . . . . . . . . . . . . . . . . . . . . . . . . . . . . . . . . . . . BHFTII-58Brighthouse/Dimensional International Small Company Portfolio . . . . . . . . . . . . . . . . . . . . . . . . . . . . BHFTII-62Brighthouse/Wellington Balanced Portfolio . . . . . . . . . . . . . . . . . . . . . . . . . . . . . . . . . . . . . . . . . . . BHFTII-101Brighthouse/Wellington Core Equity Opportunities Portfolio . . . . . . . . . . . . . . . . . . . . . . . . . . . . . . . BHFTII-132Brighthouse Asset Allocation 20 Portfolio . . . . . . . . . . . . . . . . . . . . . . . . . . . . . . . . . . . . . . . . . . . . . BHFTII-136Brighthouse Asset Allocation 40 Portfolio . . . . . . . . . . . . . . . . . . . . . . . . . . . . . . . . . . . . . . . . . . . . . BHFTII-137Brighthouse Asset Allocation 60 Portfolio . . . . . . . . . . . . . . . . . . . . . . . . . . . . . . . . . . . . . . . . . . . . . BHFTII-138Brighthouse Asset Allocation 80 Portfolio . . . . . . . . . . . . . . . . . . . . . . . . . . . . . . . . . . . . . . . . . . . . . BHFTII-139Frontier Mid Cap Growth Portfolio . . . . . . . . . . . . . . . . . . . . . . . . . . . . . . . . . . . . . . . . . . . . . . . . . BHFTII-140Jennison Growth Portfolio . . . . . . . . . . . . . . . . . . . . . . . . . . . . . . . . . . . . . . . . . . . . . . . . . . . . . . . . BHFTII-145Loomis Sayles Small Cap Core Portfolio . . . . . . . . . . . . . . . . . . . . . . . . . . . . . . . . . . . . . . . . . . . . . . BHFTII-150Loomis Sayles Small Cap Growth Portfolio . . . . . . . . . . . . . . . . . . . . . . . . . . . . . . . . . . . . . . . . . . . . BHFTII-157MetLife Aggregate Bond Index Portfolio . . . . . . . . . . . . . . . . . . . . . . . . . . . . . . . . . . . . . . . . . . . . . . BHFTII-162MetLife Mid Cap Stock index Portfolio . . . . . . . . . . . . . . . . . . . . . . . . . . . . . . . . . . . . . . . . . . . . . . . BHFTII-179MetLife Stock Index Portfolio . . . . . . . . . . . . . . . . . . . . . . . . . . . . . . . . . . . . . . . . . . . . . . . . . . . . . . BHFTII-188MetLife MSCI EAFE® Index Portfolio . . . . . . . . . . . . . . . . . . . . . . . . . . . . . . . . . . . . . . . . . . . . . . . . BHFTII-198MetLife Russell 2000® Index Portfolio . . . . . . . . . . . . . . . . . . . . . . . . . . . . . . . . . . . . . . . . . . . . . . . BHFTII-210MFS® Total Return Portfolio . . . . . . . . . . . . . . . . . . . . . . . . . . . . . . . . . . . . . . . . . . . . . . . . . . . . . . BHFTII-231MFS® Value Portfolio . . . . . . . . . . . . . . . . . . . . . . . . . . . . . . . . . . . . . . . . . . . . . . . . . . . . . . . . . . . BHFTII-246Neuberger Berman Genesis Portfolio . . . . . . . . . . . . . . . . . . . . . . . . . . . . . . . . . . . . . . . . . . . . . . . . BHFTII-251T. Rowe Price Large Cap Growth Portfolio . . . . . . . . . . . . . . . . . . . . . . . . . . . . . . . . . . . . . . . . . . . . BHFTII-255T. Rowe Price Small Cap Growth Portfolio . . . . . . . . . . . . . . . . . . . . . . . . . . . . . . . . . . . . . . . . . . . . BHFTII-262Van Eck Global Natural Resources Portfolio . . . . . . . . . . . . . . . . . . . . . . . . . . . . . . . . . . . . . . . . . . . BHFTII-270Western Asset Management Strategic Bond Opportunities Portfolio . . . . . . . . . . . . . . . . . . . . . . . . . . BHFTII-274Western Asset Management U.S. Government Portfolio . . . . . . . . . . . . . . . . . . . . . . . . . . . . . . . . . . . BHFTII-299Notes to Schedule of Investments . . . . . . . . . . . . . . . . . . . . . . . . . . . . . . . . . . . . . . . . . . . . . . . . . . BHFTII-306
Not all Portfolios are available under every product.Refer to your prospectus for information on the Portfolios that are available.

Brighthouse Funds Trust II
Baillie Gifford International Stock Portfolio
Schedule of Investments as of September 30, 2018 (Unaudited)
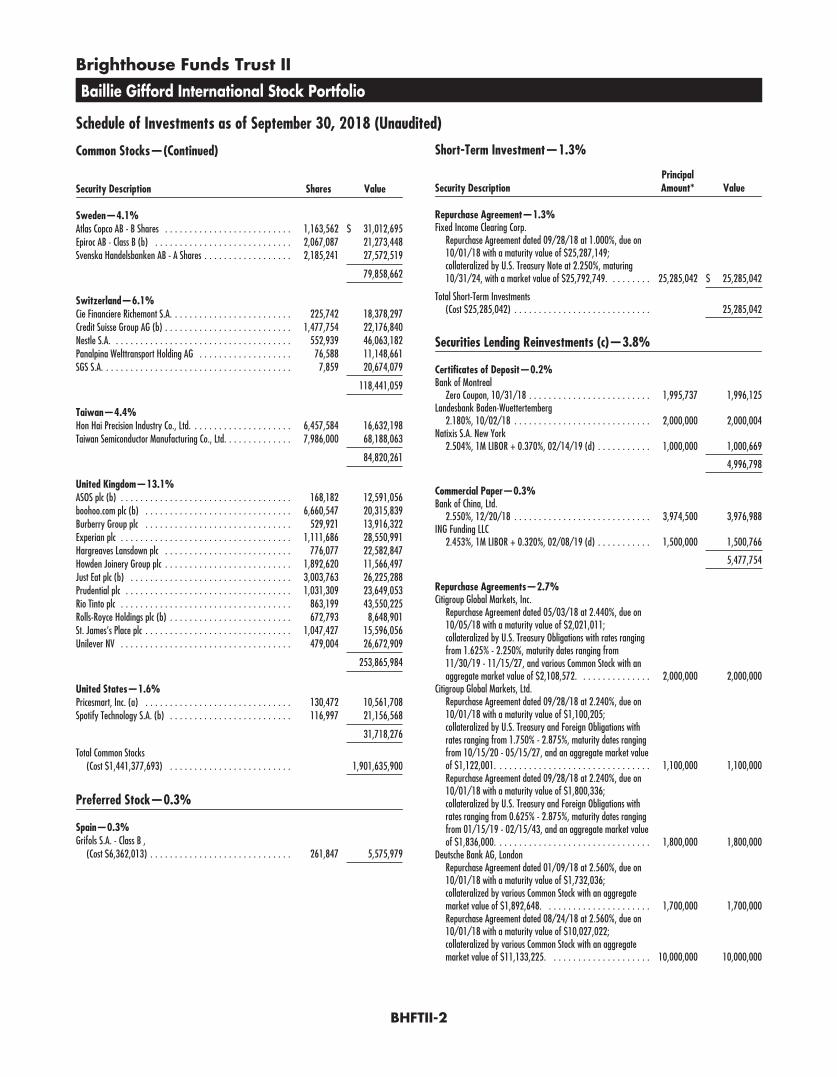
Common Stocks—98.2% of Net Assets
Security Description Shares Value
Argentina—2.7%MercadoLibre, Inc. (a) . . . . . . . . . . . . . . . . . . . . . . . . . . . . 155,633 $ 52,988,368
Australia—1.4%Cochlear, Ltd. . . . . . . . . . . . . . . . . . . . . . . . . . . . . . . . . . . 140,697 20,520,843Seek, Ltd. . . . . . . . . . . . . . . . . . . . . . . . . . . . . . . . . . . . . . 421,538 6,301,114
26,821,957
Brazil—1.2%Itau Unibanco Holding S.A. (ADR) (a) . . . . . . . . . . . . . . . . . . 1,164,057 12,781,346Kroton Educacional S.A. . . . . . . . . . . . . . . . . . . . . . . . . . . . . 3,920,400 11,066,487
23,847,833
Canada—4.4%Constellation Software, Inc. . . . . . . . . . . . . . . . . . . . . . . . . . 42,571 31,306,403Fairfax Financial Holdings, Ltd. . . . . . . . . . . . . . . . . . . . . . . . 74,426 40,434,871Ritchie Bros. Auctioneers, Inc. . . . . . . . . . . . . . . . . . . . . . . . . 348,653 12,596,833
84,338,107
China—2.0%Alibaba Group Holding, Ltd. (ADR) (b) . . . . . . . . . . . . . . . . . . 151,626 24,981,900Ctrip.com International, Ltd. (ADR) (b) . . . . . . . . . . . . . . . . . . 339,611 12,623,341
37,605,241
Denmark—3.5%DSV A/S . . . . . . . . . . . . . . . . . . . . . . . . . . . . . . . . . . . . . 379,662 34,500,168Novozymes A/S - B Shares . . . . . . . . . . . . . . . . . . . . . . . . . 352,547 19,311,868Pandora A/S . . . . . . . . . . . . . . . . . . . . . . . . . . . . . . . . . . . 216,515 13,534,758
67,346,794
Finland—2.3%Kone Oyj - Class B . . . . . . . . . . . . . . . . . . . . . . . . . . . . . . . 544,802 29,085,363Sampo Oyj - A Shares . . . . . . . . . . . . . . . . . . . . . . . . . . . . . 307,017 15,884,590
44,969,953
France—4.7%Danone S.A. . . . . . . . . . . . . . . . . . . . . . . . . . . . . . . . . . . . 240,476 18,616,831Edenred . . . . . . . . . . . . . . . . . . . . . . . . . . . . . . . . . . . . . . 859,539 32,722,668Essilor International Cie Generale d’Optique S.A. . . . . . . . . . . . 116,459 17,220,767Legrand S.A. . . . . . . . . . . . . . . . . . . . . . . . . . . . . . . . . . . . 314,523 22,902,478
91,462,744
Germany—8.5%Brenntag AG . . . . . . . . . . . . . . . . . . . . . . . . . . . . . . . . . . . 229,696 14,177,168Continental AG . . . . . . . . . . . . . . . . . . . . . . . . . . . . . . . . . 65,295 11,366,271Deutsche Boerse AG . . . . . . . . . . . . . . . . . . . . . . . . . . . . . . 356,609 47,780,337MTU Aero Engines AG . . . . . . . . . . . . . . . . . . . . . . . . . . . . . 97,682 22,003,589SAP SE . . . . . . . . . . . . . . . . . . . . . . . . . . . . . . . . . . . . . . . 442,830 54,499,686Scout24 AG s . . . . . . . . . . . . . . . . . . . . . . . . . . . . . . . . . . 311,673 14,532,622
164,359,673
Hong Kong—4.5%AIA Group, Ltd. . . . . . . . . . . . . . . . . . . . . . . . . . . . . . . . . . 4,011,200 35,838,980Hang Seng Bank, Ltd. . . . . . . . . . . . . . . . . . . . . . . . . . . . . . 887,300 23,967,556
Security Description Shares Value
Hong Kong—(Continued)Hong Kong Exchanges and Clearing, Ltd. . . . . . . . . . . . . . . . . 948,000 $ 26,937,307
86,743,843
India—0.9%Housing Development Finance Corp., Ltd. . . . . . . . . . . . . . . . . 707,118 17,066,026
Ireland—5.0%CRH plc . . . . . . . . . . . . . . . . . . . . . . . . . . . . . . . . . . . . . . 750,371 24,536,123James Hardie Industries plc . . . . . . . . . . . . . . . . . . . . . . . . . 838,564 12,661,424Kingspan Group plc . . . . . . . . . . . . . . . . . . . . . . . . . . . . . . 580,933 27,059,611Ryanair Holdings plc (ADR) (a)(b) . . . . . . . . . . . . . . . . . . . . . 336,377 32,305,647
96,562,805
Japan—11.8%Denso Corp. . . . . . . . . . . . . . . . . . . . . . . . . . . . . . . . . . . . 408,500 21,567,125FANUC Corp. . . . . . . . . . . . . . . . . . . . . . . . . . . . . . . . . . . . 83,500 15,746,405Japan Exchange Group, Inc. . . . . . . . . . . . . . . . . . . . . . . . . . 2,075,400 36,165,133Nidec Corp. . . . . . . . . . . . . . . . . . . . . . . . . . . . . . . . . . . . . 186,600 26,851,260Shimano, Inc. . . . . . . . . . . . . . . . . . . . . . . . . . . . . . . . . . . 174,100 28,059,960SMC Corp. . . . . . . . . . . . . . . . . . . . . . . . . . . . . . . . . . . . . 77,400 24,778,106Sony Corp. . . . . . . . . . . . . . . . . . . . . . . . . . . . . . . . . . . . . 408,000 25,021,683Sumitomo Mitsui Trust Holdings, Inc. . . . . . . . . . . . . . . . . . . . 564,900 23,247,491Toyota Tsusho Corp. . . . . . . . . . . . . . . . . . . . . . . . . . . . . . . 726,200 27,417,614
228,854,777
Netherlands—1.4%Heineken Holding NV . . . . . . . . . . . . . . . . . . . . . . . . . . . . . 293,462 26,572,926
Panama—1.0%Copa Holdings S.A. - Class A . . . . . . . . . . . . . . . . . . . . . . . . . 242,804 19,385,471
Peru—1.2%Credicorp, Ltd. . . . . . . . . . . . . . . . . . . . . . . . . . . . . . . . . . . 102,148 22,787,176
Russia—0.6%Magnit PJSC (GDR) . . . . . . . . . . . . . . . . . . . . . . . . . . . . . . 854,138 12,131,671
Singapore—1.5%United Overseas Bank, Ltd. . . . . . . . . . . . . . . . . . . . . . . . . . 1,481,364 29,273,735
South Africa—3.8%Discovery, Ltd. . . . . . . . . . . . . . . . . . . . . . . . . . . . . . . . . . 1,702,346 20,419,375Naspers, Ltd. - N Shares . . . . . . . . . . . . . . . . . . . . . . . . . . . 250,149 53,838,095
74,257,470
South Korea—3.6%NAVER Corp. . . . . . . . . . . . . . . . . . . . . . . . . . . . . . . . . . . . 24,322 15,669,329Samsung Electronics Co., Ltd. . . . . . . . . . . . . . . . . . . . . . . . . 1,295,715 54,267,472
69,936,801
Spain—2.9%Bankinter S.A. . . . . . . . . . . . . . . . . . . . . . . . . . . . . . . . . . . 2,006,777 18,479,560Grifols S.A. . . . . . . . . . . . . . . . . . . . . . . . . . . . . . . . . . . . . 469,966 13,222,799Industria de Diseno Textil S.A. . . . . . . . . . . . . . . . . . . . . . . . 790,927 23,915,928
55,618,287
BHFTII-1
Brighthouse Funds Trust II
Baillie Gifford International Stock Portfolio
Schedule of Investments as of September 30, 2018 (Unaudited)
Common Stocks—(Continued)
Security Description Shares Value
Sweden—4.1%Atlas Copco AB - B Shares . . . . . . . . . . . . . . . . . . . . . . . . . . 1,163,562 $ 31,012,695Epiroc AB - Class B (b) . . . . . . . . . . . . . . . . . . . . . . . . . . . . 2,067,087 21,273,448Svenska Handelsbanken AB - A Shares . . . . . . . . . . . . . . . . . . 2,185,241 27,572,519
79,858,662
Switzerland—6.1%Cie Financiere Richemont S.A. . . . . . . . . . . . . . . . . . . . . . . . . 225,742 18,378,297Credit Suisse Group AG (b) . . . . . . . . . . . . . . . . . . . . . . . . . . 1,477,754 22,176,840Nestle S.A. . . . . . . . . . . . . . . . . . . . . . . . . . . . . . . . . . . . . 552,939 46,063,182Panalpina Welttransport Holding AG . . . . . . . . . . . . . . . . . . . 76,588 11,148,661SGS S.A. . . . . . . . . . . . . . . . . . . . . . . . . . . . . . . . . . . . . . . 7,859 20,674,079
118,441,059
Taiwan—4.4%Hon Hai Precision Industry Co., Ltd. . . . . . . . . . . . . . . . . . . . . 6,457,584 16,632,198Taiwan Semiconductor Manufacturing Co., Ltd. . . . . . . . . . . . . . 7,986,000 68,188,063
84,820,261
United Kingdom—13.1%ASOS plc (b) . . . . . . . . . . . . . . . . . . . . . . . . . . . . . . . . . . . 168,182 12,591,056boohoo.com plc (b) . . . . . . . . . . . . . . . . . . . . . . . . . . . . . . 6,660,547 20,315,839Burberry Group plc . . . . . . . . . . . . . . . . . . . . . . . . . . . . . . 529,921 13,916,322Experian plc . . . . . . . . . . . . . . . . . . . . . . . . . . . . . . . . . . . 1,111,686 28,550,991Hargreaves Lansdown plc . . . . . . . . . . . . . . . . . . . . . . . . . . 776,077 22,582,847Howden Joinery Group plc . . . . . . . . . . . . . . . . . . . . . . . . . . 1,892,620 11,566,497Just Eat plc (b) . . . . . . . . . . . . . . . . . . . . . . . . . . . . . . . . . 3,003,763 26,225,288Prudential plc . . . . . . . . . . . . . . . . . . . . . . . . . . . . . . . . . . 1,031,309 23,649,053Rio Tinto plc . . . . . . . . . . . . . . . . . . . . . . . . . . . . . . . . . . . 863,199 43,550,225Rolls-Royce Holdings plc (b) . . . . . . . . . . . . . . . . . . . . . . . . . 672,793 8,648,901St. James’s Place plc . . . . . . . . . . . . . . . . . . . . . . . . . . . . . . 1,047,427 15,596,056Unilever NV . . . . . . . . . . . . . . . . . . . . . . . . . . . . . . . . . . . 479,004 26,672,909
253,865,984
United States—1.6%Pricesmart, Inc. (a) . . . . . . . . . . . . . . . . . . . . . . . . . . . . . . 130,472 10,561,708Spotify Technology S.A. (b) . . . . . . . . . . . . . . . . . . . . . . . . . 116,997 21,156,568
31,718,276
Total Common Stocks(Cost $1,441,377,693) . . . . . . . . . . . . . . . . . . . . . . . . . 1,901,635,900
Preferred Stock—0.3%
Spain—0.3%Grifols S.A. - Class B ,
(Cost $6,362,013) . . . . . . . . . . . . . . . . . . . . . . . . . . . . . 261,847 5,575,979
Short-Term Investment—1.3%
Security DescriptionPrincipalAmount* Value
Repurchase Agreement—1.3%Fixed Income Clearing Corp.
Repurchase Agreement dated 09/28/18 at 1.000%, due on10/01/18 with a maturity value of $25,287,149;collateralized by U.S. Treasury Note at 2.250%, maturing10/31/24, with a market value of $25,792,749. . . . . . . . . 25,285,042 $ 25,285,042
Total Short-Term Investments(Cost $25,285,042) . . . . . . . . . . . . . . . . . . . . . . . . . . . . 25,285,042
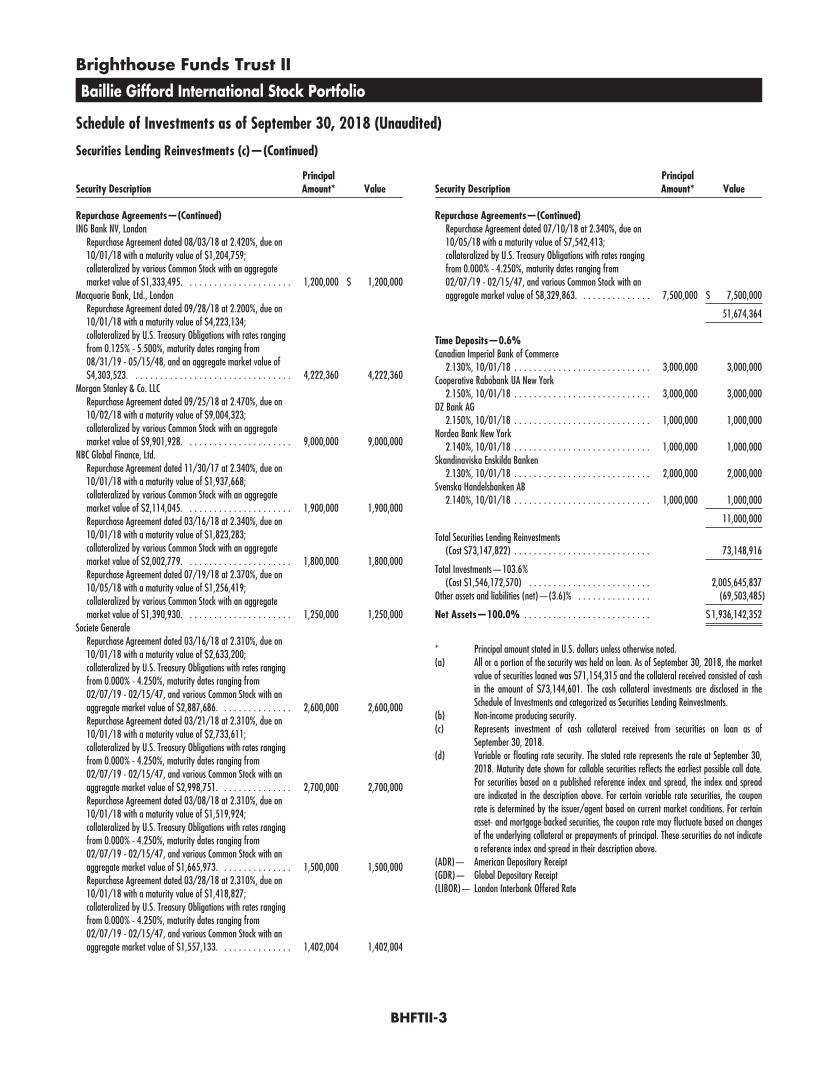
Securities Lending Reinvestments (c)—3.8%
Certificates of Deposit—0.2%Bank of Montreal
Zero Coupon, 10/31/18 . . . . . . . . . . . . . . . . . . . . . . . . . 1,995,737 1,996,125Landesbank Baden-Wuettertemberg
2.180%, 10/02/18 . . . . . . . . . . . . . . . . . . . . . . . . . . . . 2,000,000 2,000,004Natixis S.A. New York
2.504%, 1M LIBOR + 0.370%, 02/14/19 (d) . . . . . . . . . . . 1,000,000 1,000,669
4,996,798
Commercial Paper—0.3%Bank of China, Ltd.
2.550%, 12/20/18 . . . . . . . . . . . . . . . . . . . . . . . . . . . . 3,974,500 3,976,988ING Funding LLC
2.453%, 1M LIBOR + 0.320%, 02/08/19 (d) . . . . . . . . . . . 1,500,000 1,500,766
5,477,754
Repurchase Agreements—2.7%Citigroup Global Markets, Inc.
Repurchase Agreement dated 05/03/18 at 2.440%, due on10/05/18 with a maturity value of $2,021,011;collateralized by U.S. Treasury Obligations with rates rangingfrom 1.625% - 2.250%, maturity dates ranging from11/30/19 - 11/15/27, and various Common Stock with anaggregate market value of $2,108,572. . . . . . . . . . . . . . . 2,000,000 2,000,000
Citigroup Global Markets, Ltd.Repurchase Agreement dated 09/28/18 at 2.240%, due on10/01/18 with a maturity value of $1,100,205;collateralized by U.S. Treasury and Foreign Obligations withrates ranging from 1.750% - 2.875%, maturity dates rangingfrom 10/15/20 - 05/15/27, and an aggregate market valueof $1,122,001. . . . . . . . . . . . . . . . . . . . . . . . . . . . . . . . 1,100,000 1,100,000Repurchase Agreement dated 09/28/18 at 2.240%, due on10/01/18 with a maturity value of $1,800,336;collateralized by U.S. Treasury and Foreign Obligations withrates ranging from 0.625% - 2.875%, maturity dates rangingfrom 01/15/19 - 02/15/43, and an aggregate market valueof $1,836,000. . . . . . . . . . . . . . . . . . . . . . . . . . . . . . . . 1,800,000 1,800,000
Deutsche Bank AG, LondonRepurchase Agreement dated 01/09/18 at 2.560%, due on10/01/18 with a maturity value of $1,732,036;collateralized by various Common Stock with an aggregatemarket value of $1,892,648. . . . . . . . . . . . . . . . . . . . . . 1,700,000 1,700,000Repurchase Agreement dated 08/24/18 at 2.560%, due on10/01/18 with a maturity value of $10,027,022;collateralized by various Common Stock with an aggregatemarket value of $11,133,225. . . . . . . . . . . . . . . . . . . . . 10,000,000 10,000,000
BHFTII-2
Brighthouse Funds Trust II
Baillie Gifford International Stock Portfolio
Schedule of Investments as of September 30, 2018 (Unaudited)
Securities Lending Reinvestments (c)—(Continued)
Security DescriptionPrincipalAmount* Value
Repurchase Agreements—(Continued)ING Bank NV, London
Repurchase Agreement dated 08/03/18 at 2.420%, due on10/01/18 with a maturity value of $1,204,759;collateralized by various Common Stock with an aggregatemarket value of $1,333,495. . . . . . . . . . . . . . . . . . . . . . 1,200,000 $ 1,200,000
Macquarie Bank, Ltd., LondonRepurchase Agreement dated 09/28/18 at 2.200%, due on10/01/18 with a maturity value of $4,223,134;collateralized by U.S. Treasury Obligations with rates rangingfrom 0.125% - 5.500%, maturity dates ranging from08/31/19 - 05/15/48, and an aggregate market value of$4,303,523. . . . . . . . . . . . . . . . . . . . . . . . . . . . . . . . . 4,222,360 4,222,360
Morgan Stanley & Co. LLCRepurchase Agreement dated 09/25/18 at 2.470%, due on10/02/18 with a maturity value of $9,004,323;collateralized by various Common Stock with an aggregatemarket value of $9,901,928. . . . . . . . . . . . . . . . . . . . . . 9,000,000 9,000,000
NBC Global Finance, Ltd.Repurchase Agreement dated 11/30/17 at 2.340%, due on10/01/18 with a maturity value of $1,937,668;collateralized by various Common Stock with an aggregatemarket value of $2,114,045. . . . . . . . . . . . . . . . . . . . . . 1,900,000 1,900,000Repurchase Agreement dated 03/16/18 at 2.340%, due on10/01/18 with a maturity value of $1,823,283;collateralized by various Common Stock with an aggregatemarket value of $2,002,779. . . . . . . . . . . . . . . . . . . . . . 1,800,000 1,800,000Repurchase Agreement dated 07/19/18 at 2.370%, due on10/05/18 with a maturity value of $1,256,419;collateralized by various Common Stock with an aggregatemarket value of $1,390,930. . . . . . . . . . . . . . . . . . . . . . 1,250,000 1,250,000
Societe GeneraleRepurchase Agreement dated 03/16/18 at 2.310%, due on10/01/18 with a maturity value of $2,633,200;collateralized by U.S. Treasury Obligations with rates rangingfrom 0.000% - 4.250%, maturity dates ranging from02/07/19 - 02/15/47, and various Common Stock with anaggregate market value of $2,887,686. . . . . . . . . . . . . . . 2,600,000 2,600,000Repurchase Agreement dated 03/21/18 at 2.310%, due on10/01/18 with a maturity value of $2,733,611;collateralized by U.S. Treasury Obligations with rates rangingfrom 0.000% - 4.250%, maturity dates ranging from02/07/19 - 02/15/47, and various Common Stock with anaggregate market value of $2,998,751. . . . . . . . . . . . . . . 2,700,000 2,700,000Repurchase Agreement dated 03/08/18 at 2.310%, due on10/01/18 with a maturity value of $1,519,924;collateralized by U.S. Treasury Obligations with rates rangingfrom 0.000% - 4.250%, maturity dates ranging from02/07/19 - 02/15/47, and various Common Stock with anaggregate market value of $1,665,973. . . . . . . . . . . . . . . 1,500,000 1,500,000Repurchase Agreement dated 03/28/18 at 2.310%, due on10/01/18 with a maturity value of $1,418,827;collateralized by U.S. Treasury Obligations with rates rangingfrom 0.000% - 4.250%, maturity dates ranging from02/07/19 - 02/15/47, and various Common Stock with anaggregate market value of $1,557,133. . . . . . . . . . . . . . . 1,402,004 1,402,004
Security DescriptionPrincipalAmount* Value
Repurchase Agreements—(Continued)Repurchase Agreement dated 07/10/18 at 2.340%, due on10/05/18 with a maturity value of $7,542,413;collateralized by U.S. Treasury Obligations with rates rangingfrom 0.000% - 4.250%, maturity dates ranging from02/07/19 - 02/15/47, and various Common Stock with anaggregate market value of $8,329,863. . . . . . . . . . . . . . . 7,500,000 $ 7,500,000
51,674,364
Time Deposits—0.6%Canadian Imperial Bank of Commerce
2.130%, 10/01/18 . . . . . . . . . . . . . . . . . . . . . . . . . . . . 3,000,000 3,000,000Cooperative Rabobank UA New York
2.150%, 10/01/18 . . . . . . . . . . . . . . . . . . . . . . . . . . . . 3,000,000 3,000,000DZ Bank AG
2.150%, 10/01/18 . . . . . . . . . . . . . . . . . . . . . . . . . . . . 1,000,000 1,000,000Nordea Bank New York
2.140%, 10/01/18 . . . . . . . . . . . . . . . . . . . . . . . . . . . . 1,000,000 1,000,000Skandinaviska Enskilda Banken
2.130%, 10/01/18 . . . . . . . . . . . . . . . . . . . . . . . . . . . . 2,000,000 2,000,000Svenska Handelsbanken AB
2.140%, 10/01/18 . . . . . . . . . . . . . . . . . . . . . . . . . . . . 1,000,000 1,000,000
11,000,000
Total Securities Lending Reinvestments(Cost $73,147,822) . . . . . . . . . . . . . . . . . . . . . . . . . . . . 73,148,916
Total Investments—103.6%(Cost $1,546,172,570) . . . . . . . . . . . . . . . . . . . . . . . . . 2,005,645,837
Other assets and liabilities (net)—(3.6)% . . . . . . . . . . . . . . . (69,503,485)
Net Assets—100.0% . . . . . . . . . . . . . . . . . . . . . . . . . . $ 1,936,142,352
* Principal amount stated in U.S. dollars unless otherwise noted.(a) All or a portion of the security was held on loan. As of September 30, 2018, the market
value of securities loaned was $71,154,315 and the collateral received consisted of cashin the amount of $73,144,601. The cash collateral investments are disclosed in theSchedule of Investments and categorized as Securities Lending Reinvestments.
(b) Non-income producing security.(c) Represents investment of cash collateral received from securities on loan as of
September 30, 2018.(d) Variable or floating rate security. The stated rate represents the rate at September 30,
2018. Maturity date shown for callable securities reflects the earliest possible call date.For securities based on a published reference index and spread, the index and spreadare indicated in the description above. For certain variable rate securities, the couponrate is determined by the issuer/agent based on current market conditions. For certainasset- and mortgage-backed securities, the coupon rate may fluctuate based on changesof the underlying collateral or prepayments of principal. These securities do not indicatea reference index and spread in their description above.
(ADR)— American Depositary Receipt(GDR)— Global Depositary Receipt(LIBOR)— London Interbank Offered Rate
BHFTII-3
Brighthouse Funds Trust II
Baillie Gifford International Stock Portfolio
Schedule of Investments as of September 30, 2018 (Unaudited)
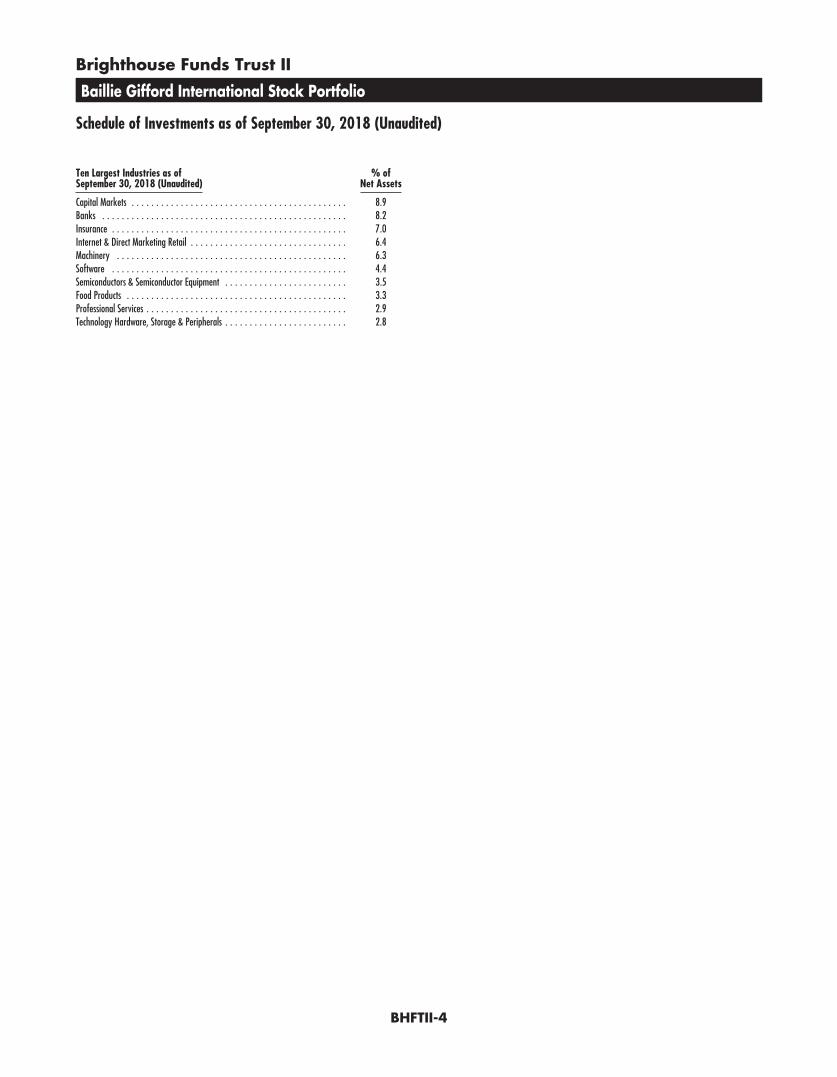
Ten Largest Industries as ofSeptember 30, 2018 (Unaudited)
% ofNet Assets
Capital Markets . . . . . . . . . . . . . . . . . . . . . . . . . . . . . . . . . . . . . . . . . . . . 8.9Banks . . . . . . . . . . . . . . . . . . . . . . . . . . . . . . . . . . . . . . . . . . . . . . . . . . 8.2Insurance . . . . . . . . . . . . . . . . . . . . . . . . . . . . . . . . . . . . . . . . . . . . . . . . 7.0Internet & Direct Marketing Retail . . . . . . . . . . . . . . . . . . . . . . . . . . . . . . . . 6.4Machinery . . . . . . . . . . . . . . . . . . . . . . . . . . . . . . . . . . . . . . . . . . . . . . . 6.3Software . . . . . . . . . . . . . . . . . . . . . . . . . . . . . . . . . . . . . . . . . . . . . . . . 4.4Semiconductors & Semiconductor Equipment . . . . . . . . . . . . . . . . . . . . . . . . . 3.5Food Products . . . . . . . . . . . . . . . . . . . . . . . . . . . . . . . . . . . . . . . . . . . . . 3.3Professional Services . . . . . . . . . . . . . . . . . . . . . . . . . . . . . . . . . . . . . . . . . 2.9Technology Hardware, Storage & Peripherals . . . . . . . . . . . . . . . . . . . . . . . . . 2.8
BHFTII-4
Brighthouse Funds Trust II
Baillie Gifford International Stock Portfolio
Schedule of Investments as of September 30, 2018 (Unaudited)
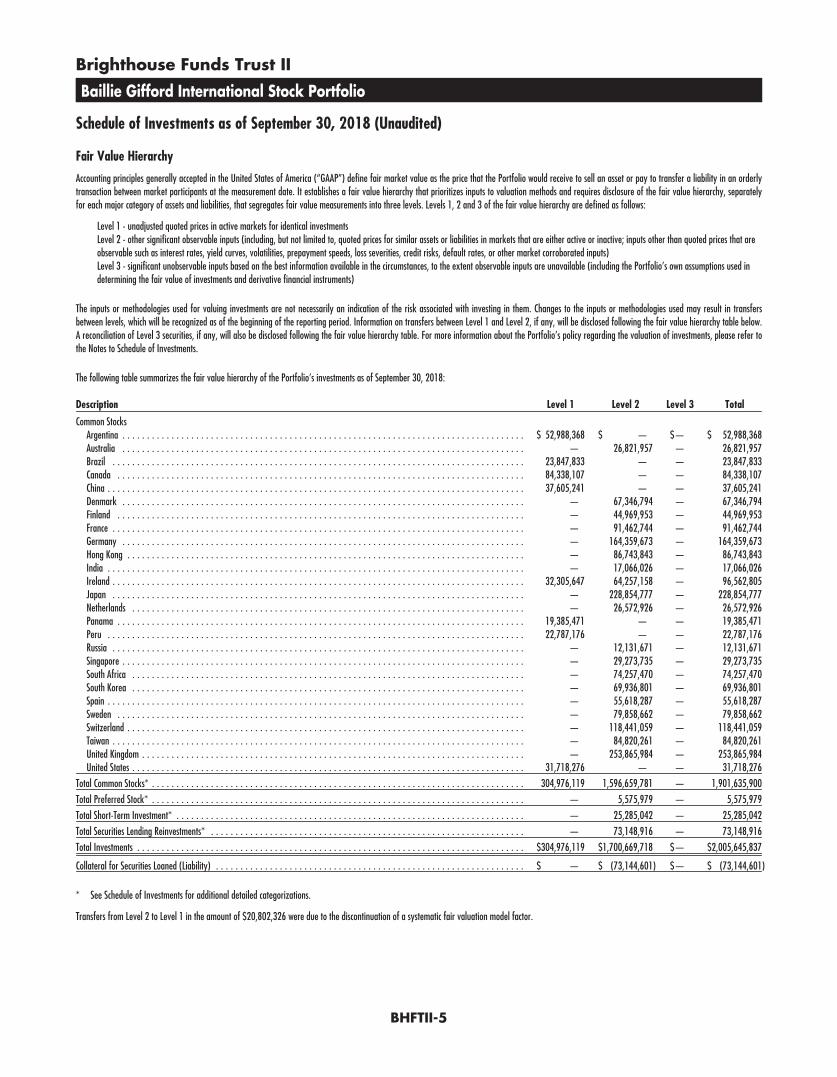
Fair Value Hierarchy
Accounting principles generally accepted in the United States of America (“GAAP”) define fair market value as the price that the Portfolio would receive to sell an asset or pay to transfer a liability in an orderlytransaction between market participants at the measurement date. It establishes a fair value hierarchy that prioritizes inputs to valuation methods and requires disclosure of the fair value hierarchy, separatelyfor each major category of assets and liabilities, that segregates fair value measurements into three levels. Levels 1, 2 and 3 of the fair value hierarchy are defined as follows:
Level 1 - unadjusted quoted prices in active markets for identical investmentsLevel 2 - other significant observable inputs (including, but not limited to, quoted prices for similar assets or liabilities in markets that are either active or inactive; inputs other than quoted prices that areobservable such as interest rates, yield curves, volatilities, prepayment speeds, loss severities, credit risks, default rates, or other market corroborated inputs)Level 3 - significant unobservable inputs based on the best information available in the circumstances, to the extent observable inputs are unavailable (including the Portfolio’s own assumptions used indetermining the fair value of investments and derivative financial instruments)
The inputs or methodologies used for valuing investments are not necessarily an indication of the risk associated with investing in them. Changes to the inputs or methodologies used may result in transfersbetween levels, which will be recognized as of the beginning of the reporting period. Information on transfers between Level 1 and Level 2, if any, will be disclosed following the fair value hierarchy table below.A reconciliation of Level 3 securities, if any, will also be disclosed following the fair value hierarchy table. For more information about the Portfolio’s policy regarding the valuation of investments, please refer tothe Notes to Schedule of Investments.
The following table summarizes the fair value hierarchy of the Portfolio’s investments as of September 30, 2018:
Description Level 1 Level 2 Level 3 Total
Common StocksArgentina . . . . . . . . . . . . . . . . . . . . . . . . . . . . . . . . . . . . . . . . . . . . . . . . . . . . . . . . . . . . . . . . . . . . . . . . . . . . . . . . . . $ 52,988,368 $ — $— $ 52,988,368Australia . . . . . . . . . . . . . . . . . . . . . . . . . . . . . . . . . . . . . . . . . . . . . . . . . . . . . . . . . . . . . . . . . . . . . . . . . . . . . . . . . . — 26,821,957 — 26,821,957Brazil . . . . . . . . . . . . . . . . . . . . . . . . . . . . . . . . . . . . . . . . . . . . . . . . . . . . . . . . . . . . . . . . . . . . . . . . . . . . . . . . . . . . 23,847,833 — — 23,847,833Canada . . . . . . . . . . . . . . . . . . . . . . . . . . . . . . . . . . . . . . . . . . . . . . . . . . . . . . . . . . . . . . . . . . . . . . . . . . . . . . . . . . . 84,338,107 — — 84,338,107China . . . . . . . . . . . . . . . . . . . . . . . . . . . . . . . . . . . . . . . . . . . . . . . . . . . . . . . . . . . . . . . . . . . . . . . . . . . . . . . . . . . . . 37,605,241 — — 37,605,241Denmark . . . . . . . . . . . . . . . . . . . . . . . . . . . . . . . . . . . . . . . . . . . . . . . . . . . . . . . . . . . . . . . . . . . . . . . . . . . . . . . . . . — 67,346,794 — 67,346,794Finland . . . . . . . . . . . . . . . . . . . . . . . . . . . . . . . . . . . . . . . . . . . . . . . . . . . . . . . . . . . . . . . . . . . . . . . . . . . . . . . . . . . — 44,969,953 — 44,969,953France . . . . . . . . . . . . . . . . . . . . . . . . . . . . . . . . . . . . . . . . . . . . . . . . . . . . . . . . . . . . . . . . . . . . . . . . . . . . . . . . . . . . — 91,462,744 — 91,462,744Germany . . . . . . . . . . . . . . . . . . . . . . . . . . . . . . . . . . . . . . . . . . . . . . . . . . . . . . . . . . . . . . . . . . . . . . . . . . . . . . . . . . — 164,359,673 — 164,359,673Hong Kong . . . . . . . . . . . . . . . . . . . . . . . . . . . . . . . . . . . . . . . . . . . . . . . . . . . . . . . . . . . . . . . . . . . . . . . . . . . . . . . . . — 86,743,843 — 86,743,843India . . . . . . . . . . . . . . . . . . . . . . . . . . . . . . . . . . . . . . . . . . . . . . . . . . . . . . . . . . . . . . . . . . . . . . . . . . . . . . . . . . . . . — 17,066,026 — 17,066,026Ireland . . . . . . . . . . . . . . . . . . . . . . . . . . . . . . . . . . . . . . . . . . . . . . . . . . . . . . . . . . . . . . . . . . . . . . . . . . . . . . . . . . . . 32,305,647 64,257,158 — 96,562,805Japan . . . . . . . . . . . . . . . . . . . . . . . . . . . . . . . . . . . . . . . . . . . . . . . . . . . . . . . . . . . . . . . . . . . . . . . . . . . . . . . . . . . . — 228,854,777 — 228,854,777Netherlands . . . . . . . . . . . . . . . . . . . . . . . . . . . . . . . . . . . . . . . . . . . . . . . . . . . . . . . . . . . . . . . . . . . . . . . . . . . . . . . . — 26,572,926 — 26,572,926Panama . . . . . . . . . . . . . . . . . . . . . . . . . . . . . . . . . . . . . . . . . . . . . . . . . . . . . . . . . . . . . . . . . . . . . . . . . . . . . . . . . . . 19,385,471 — — 19,385,471Peru . . . . . . . . . . . . . . . . . . . . . . . . . . . . . . . . . . . . . . . . . . . . . . . . . . . . . . . . . . . . . . . . . . . . . . . . . . . . . . . . . . . . . 22,787,176 — — 22,787,176Russia . . . . . . . . . . . . . . . . . . . . . . . . . . . . . . . . . . . . . . . . . . . . . . . . . . . . . . . . . . . . . . . . . . . . . . . . . . . . . . . . . . . . — 12,131,671 — 12,131,671Singapore . . . . . . . . . . . . . . . . . . . . . . . . . . . . . . . . . . . . . . . . . . . . . . . . . . . . . . . . . . . . . . . . . . . . . . . . . . . . . . . . . . — 29,273,735 — 29,273,735South Africa . . . . . . . . . . . . . . . . . . . . . . . . . . . . . . . . . . . . . . . . . . . . . . . . . . . . . . . . . . . . . . . . . . . . . . . . . . . . . . . . — 74,257,470 — 74,257,470South Korea . . . . . . . . . . . . . . . . . . . . . . . . . . . . . . . . . . . . . . . . . . . . . . . . . . . . . . . . . . . . . . . . . . . . . . . . . . . . . . . . — 69,936,801 — 69,936,801Spain . . . . . . . . . . . . . . . . . . . . . . . . . . . . . . . . . . . . . . . . . . . . . . . . . . . . . . . . . . . . . . . . . . . . . . . . . . . . . . . . . . . . . — 55,618,287 — 55,618,287Sweden . . . . . . . . . . . . . . . . . . . . . . . . . . . . . . . . . . . . . . . . . . . . . . . . . . . . . . . . . . . . . . . . . . . . . . . . . . . . . . . . . . . — 79,858,662 — 79,858,662Switzerland . . . . . . . . . . . . . . . . . . . . . . . . . . . . . . . . . . . . . . . . . . . . . . . . . . . . . . . . . . . . . . . . . . . . . . . . . . . . . . . . . — 118,441,059 — 118,441,059Taiwan . . . . . . . . . . . . . . . . . . . . . . . . . . . . . . . . . . . . . . . . . . . . . . . . . . . . . . . . . . . . . . . . . . . . . . . . . . . . . . . . . . . . — 84,820,261 — 84,820,261United Kingdom . . . . . . . . . . . . . . . . . . . . . . . . . . . . . . . . . . . . . . . . . . . . . . . . . . . . . . . . . . . . . . . . . . . . . . . . . . . . . . — 253,865,984 — 253,865,984United States . . . . . . . . . . . . . . . . . . . . . . . . . . . . . . . . . . . . . . . . . . . . . . . . . . . . . . . . . . . . . . . . . . . . . . . . . . . . . . . . 31,718,276 — — 31,718,276
Total Common Stocks* . . . . . . . . . . . . . . . . . . . . . . . . . . . . . . . . . . . . . . . . . . . . . . . . . . . . . . . . . . . . . . . . . . . . . . . . . . . . 304,976,119 1,596,659,781 — 1,901,635,900
Total Preferred Stock* . . . . . . . . . . . . . . . . . . . . . . . . . . . . . . . . . . . . . . . . . . . . . . . . . . . . . . . . . . . . . . . . . . . . . . . . . . . . — 5,575,979 — 5,575,979
Total Short-Term Investment* . . . . . . . . . . . . . . . . . . . . . . . . . . . . . . . . . . . . . . . . . . . . . . . . . . . . . . . . . . . . . . . . . . . . . . . — 25,285,042 — 25,285,042
Total Securities Lending Reinvestments* . . . . . . . . . . . . . . . . . . . . . . . . . . . . . . . . . . . . . . . . . . . . . . . . . . . . . . . . . . . . . . . . — 73,148,916 — 73,148,916
Total Investments . . . . . . . . . . . . . . . . . . . . . . . . . . . . . . . . . . . . . . . . . . . . . . . . . . . . . . . . . . . . . . . . . . . . . . . . . . . . . . . $304,976,119 $1,700,669,718 $— $2,005,645,837
Collateral for Securities Loaned (Liability) . . . . . . . . . . . . . . . . . . . . . . . . . . . . . . . . . . . . . . . . . . . . . . . . . . . . . . . . . . . . . . . $ — $ (73,144,601) $— $ (73,144,601)
* See Schedule of Investments for additional detailed categorizations.
Transfers from Level 2 to Level 1 in the amount of $20,802,326 were due to the discontinuation of a systematic fair valuation model factor.
BHFTII-5
Brighthouse Funds Trust II
BlackRock Bond Income Portfolio
Schedule of Investments as of September 30, 2018 (Unaudited)
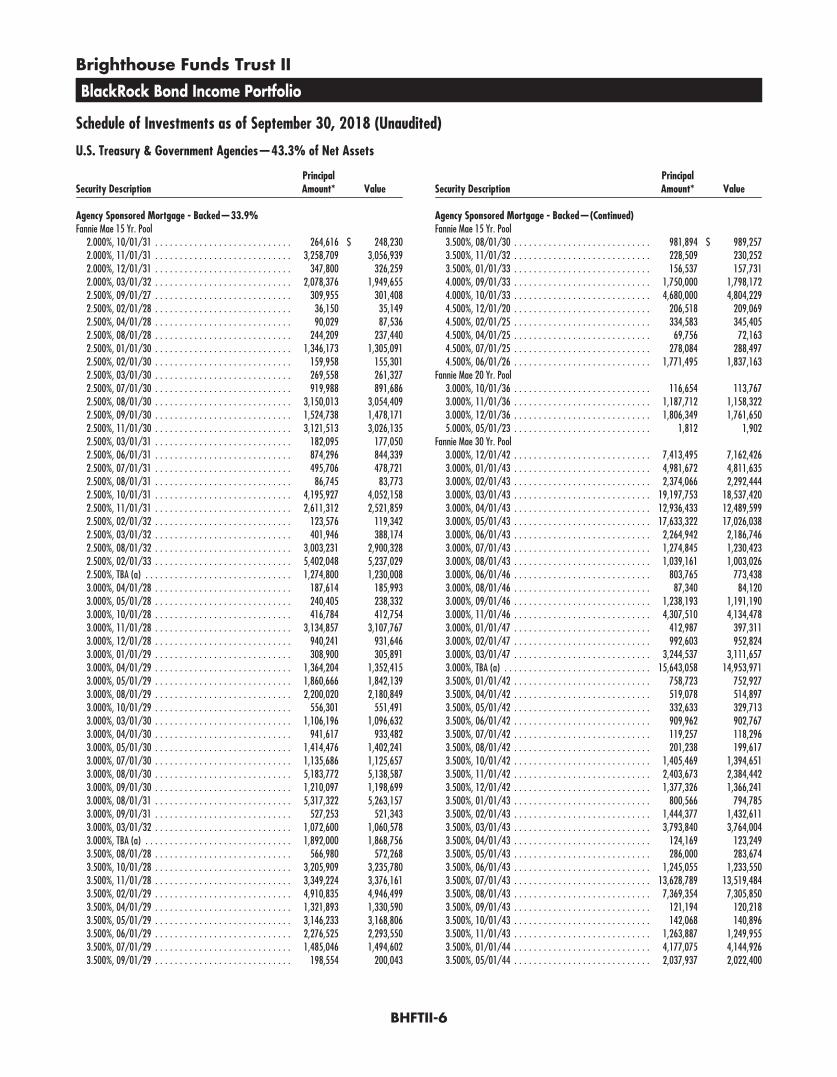
U.S. Treasury & Government Agencies—43.3% of Net Assets
Security DescriptionPrincipalAmount* Value
Agency Sponsored Mortgage - Backed—33.9%Fannie Mae 15 Yr. Pool
2.000%, 10/01/31 . . . . . . . . . . . . . . . . . . . . . . . . . . . . 264,616 $ 248,2302.000%, 11/01/31 . . . . . . . . . . . . . . . . . . . . . . . . . . . . 3,258,709 3,056,9392.000%, 12/01/31 . . . . . . . . . . . . . . . . . . . . . . . . . . . . 347,800 326,2592.000%, 03/01/32 . . . . . . . . . . . . . . . . . . . . . . . . . . . . 2,078,376 1,949,6552.500%, 09/01/27 . . . . . . . . . . . . . . . . . . . . . . . . . . . . 309,955 301,4082.500%, 02/01/28 . . . . . . . . . . . . . . . . . . . . . . . . . . . . 36,150 35,1492.500%, 04/01/28 . . . . . . . . . . . . . . . . . . . . . . . . . . . . 90,029 87,5362.500%, 08/01/28 . . . . . . . . . . . . . . . . . . . . . . . . . . . . 244,209 237,4402.500%, 01/01/30 . . . . . . . . . . . . . . . . . . . . . . . . . . . . 1,346,173 1,305,0912.500%, 02/01/30 . . . . . . . . . . . . . . . . . . . . . . . . . . . . 159,958 155,3012.500%, 03/01/30 . . . . . . . . . . . . . . . . . . . . . . . . . . . . 269,558 261,3272.500%, 07/01/30 . . . . . . . . . . . . . . . . . . . . . . . . . . . . 919,988 891,6862.500%, 08/01/30 . . . . . . . . . . . . . . . . . . . . . . . . . . . . 3,150,013 3,054,4092.500%, 09/01/30 . . . . . . . . . . . . . . . . . . . . . . . . . . . . 1,524,738 1,478,1712.500%, 11/01/30 . . . . . . . . . . . . . . . . . . . . . . . . . . . . 3,121,513 3,026,1352.500%, 03/01/31 . . . . . . . . . . . . . . . . . . . . . . . . . . . . 182,095 177,0502.500%, 06/01/31 . . . . . . . . . . . . . . . . . . . . . . . . . . . . 874,296 844,3392.500%, 07/01/31 . . . . . . . . . . . . . . . . . . . . . . . . . . . . 495,706 478,7212.500%, 08/01/31 . . . . . . . . . . . . . . . . . . . . . . . . . . . . 86,745 83,7732.500%, 10/01/31 . . . . . . . . . . . . . . . . . . . . . . . . . . . . 4,195,927 4,052,1582.500%, 11/01/31 . . . . . . . . . . . . . . . . . . . . . . . . . . . . 2,611,312 2,521,8592.500%, 02/01/32 . . . . . . . . . . . . . . . . . . . . . . . . . . . . 123,576 119,3422.500%, 03/01/32 . . . . . . . . . . . . . . . . . . . . . . . . . . . . 401,946 388,1742.500%, 08/01/32 . . . . . . . . . . . . . . . . . . . . . . . . . . . . 3,003,231 2,900,3282.500%, 02/01/33 . . . . . . . . . . . . . . . . . . . . . . . . . . . . 5,402,048 5,237,0292.500%, TBA (a) . . . . . . . . . . . . . . . . . . . . . . . . . . . . . . 1,274,800 1,230,0083.000%, 04/01/28 . . . . . . . . . . . . . . . . . . . . . . . . . . . . 187,614 185,9933.000%, 05/01/28 . . . . . . . . . . . . . . . . . . . . . . . . . . . . 240,405 238,3323.000%, 10/01/28 . . . . . . . . . . . . . . . . . . . . . . . . . . . . 416,784 412,7543.000%, 11/01/28 . . . . . . . . . . . . . . . . . . . . . . . . . . . . 3,134,857 3,107,7673.000%, 12/01/28 . . . . . . . . . . . . . . . . . . . . . . . . . . . . 940,241 931,6463.000%, 01/01/29 . . . . . . . . . . . . . . . . . . . . . . . . . . . . 308,900 305,8913.000%, 04/01/29 . . . . . . . . . . . . . . . . . . . . . . . . . . . . 1,364,204 1,352,4153.000%, 05/01/29 . . . . . . . . . . . . . . . . . . . . . . . . . . . . 1,860,666 1,842,1393.000%, 08/01/29 . . . . . . . . . . . . . . . . . . . . . . . . . . . . 2,200,020 2,180,8493.000%, 10/01/29 . . . . . . . . . . . . . . . . . . . . . . . . . . . . 556,301 551,4913.000%, 03/01/30 . . . . . . . . . . . . . . . . . . . . . . . . . . . . 1,106,196 1,096,6323.000%, 04/01/30 . . . . . . . . . . . . . . . . . . . . . . . . . . . . 941,617 933,4823.000%, 05/01/30 . . . . . . . . . . . . . . . . . . . . . . . . . . . . 1,414,476 1,402,2413.000%, 07/01/30 . . . . . . . . . . . . . . . . . . . . . . . . . . . . 1,135,686 1,125,6573.000%, 08/01/30 . . . . . . . . . . . . . . . . . . . . . . . . . . . . 5,183,772 5,138,5873.000%, 09/01/30 . . . . . . . . . . . . . . . . . . . . . . . . . . . . 1,210,097 1,198,6993.000%, 08/01/31 . . . . . . . . . . . . . . . . . . . . . . . . . . . . 5,317,322 5,263,1573.000%, 09/01/31 . . . . . . . . . . . . . . . . . . . . . . . . . . . . 527,253 521,3433.000%, 03/01/32 . . . . . . . . . . . . . . . . . . . . . . . . . . . . 1,072,600 1,060,5783.000%, TBA (a) . . . . . . . . . . . . . . . . . . . . . . . . . . . . . . 1,892,000 1,868,7563.500%, 08/01/28 . . . . . . . . . . . . . . . . . . . . . . . . . . . . 566,980 572,2683.500%, 10/01/28 . . . . . . . . . . . . . . . . . . . . . . . . . . . . 3,205,909 3,235,7803.500%, 11/01/28 . . . . . . . . . . . . . . . . . . . . . . . . . . . . 3,349,224 3,376,1613.500%, 02/01/29 . . . . . . . . . . . . . . . . . . . . . . . . . . . . 4,910,835 4,946,4993.500%, 04/01/29 . . . . . . . . . . . . . . . . . . . . . . . . . . . . 1,321,893 1,330,5903.500%, 05/01/29 . . . . . . . . . . . . . . . . . . . . . . . . . . . . 3,146,233 3,168,8063.500%, 06/01/29 . . . . . . . . . . . . . . . . . . . . . . . . . . . . 2,276,525 2,293,5503.500%, 07/01/29 . . . . . . . . . . . . . . . . . . . . . . . . . . . . 1,485,046 1,494,6023.500%, 09/01/29 . . . . . . . . . . . . . . . . . . . . . . . . . . . . 198,554 200,043
Security DescriptionPrincipalAmount* Value
Agency Sponsored Mortgage - Backed—(Continued)Fannie Mae 15 Yr. Pool
3.500%, 08/01/30 . . . . . . . . . . . . . . . . . . . . . . . . . . . . 981,894 $ 989,2573.500%, 11/01/32 . . . . . . . . . . . . . . . . . . . . . . . . . . . . 228,509 230,2523.500%, 01/01/33 . . . . . . . . . . . . . . . . . . . . . . . . . . . . 156,537 157,7314.000%, 09/01/33 . . . . . . . . . . . . . . . . . . . . . . . . . . . . 1,750,000 1,798,1724.000%, 10/01/33 . . . . . . . . . . . . . . . . . . . . . . . . . . . . 4,680,000 4,804,2294.500%, 12/01/20 . . . . . . . . . . . . . . . . . . . . . . . . . . . . 206,518 209,0694.500%, 02/01/25 . . . . . . . . . . . . . . . . . . . . . . . . . . . . 334,583 345,4054.500%, 04/01/25 . . . . . . . . . . . . . . . . . . . . . . . . . . . . 69,756 72,1634.500%, 07/01/25 . . . . . . . . . . . . . . . . . . . . . . . . . . . . 278,084 288,4974.500%, 06/01/26 . . . . . . . . . . . . . . . . . . . . . . . . . . . . 1,771,495 1,837,163
Fannie Mae 20 Yr. Pool3.000%, 10/01/36 . . . . . . . . . . . . . . . . . . . . . . . . . . . . 116,654 113,7673.000%, 11/01/36 . . . . . . . . . . . . . . . . . . . . . . . . . . . . 1,187,712 1,158,3223.000%, 12/01/36 . . . . . . . . . . . . . . . . . . . . . . . . . . . . 1,806,349 1,761,6505.000%, 05/01/23 . . . . . . . . . . . . . . . . . . . . . . . . . . . . 1,812 1,902
Fannie Mae 30 Yr. Pool3.000%, 12/01/42 . . . . . . . . . . . . . . . . . . . . . . . . . . . . 7,413,495 7,162,4263.000%, 01/01/43 . . . . . . . . . . . . . . . . . . . . . . . . . . . . 4,981,672 4,811,6353.000%, 02/01/43 . . . . . . . . . . . . . . . . . . . . . . . . . . . . 2,374,066 2,292,4443.000%, 03/01/43 . . . . . . . . . . . . . . . . . . . . . . . . . . . . 19,197,753 18,537,4203.000%, 04/01/43 . . . . . . . . . . . . . . . . . . . . . . . . . . . . 12,936,433 12,489,5993.000%, 05/01/43 . . . . . . . . . . . . . . . . . . . . . . . . . . . . 17,633,322 17,026,0383.000%, 06/01/43 . . . . . . . . . . . . . . . . . . . . . . . . . . . . 2,264,942 2,186,7463.000%, 07/01/43 . . . . . . . . . . . . . . . . . . . . . . . . . . . . 1,274,845 1,230,4233.000%, 08/01/43 . . . . . . . . . . . . . . . . . . . . . . . . . . . . 1,039,161 1,003,0263.000%, 06/01/46 . . . . . . . . . . . . . . . . . . . . . . . . . . . . 803,765 773,4383.000%, 08/01/46 . . . . . . . . . . . . . . . . . . . . . . . . . . . . 87,340 84,1203.000%, 09/01/46 . . . . . . . . . . . . . . . . . . . . . . . . . . . . 1,238,193 1,191,1903.000%, 11/01/46 . . . . . . . . . . . . . . . . . . . . . . . . . . . . 4,307,510 4,134,4783.000%, 01/01/47 . . . . . . . . . . . . . . . . . . . . . . . . . . . . 412,987 397,3113.000%, 02/01/47 . . . . . . . . . . . . . . . . . . . . . . . . . . . . 992,603 952,8243.000%, 03/01/47 . . . . . . . . . . . . . . . . . . . . . . . . . . . . 3,244,537 3,111,6573.000%, TBA (a) . . . . . . . . . . . . . . . . . . . . . . . . . . . . . . 15,643,058 14,953,9713.500%, 01/01/42 . . . . . . . . . . . . . . . . . . . . . . . . . . . . 758,723 752,9273.500%, 04/01/42 . . . . . . . . . . . . . . . . . . . . . . . . . . . . 519,078 514,8973.500%, 05/01/42 . . . . . . . . . . . . . . . . . . . . . . . . . . . . 332,633 329,7133.500%, 06/01/42 . . . . . . . . . . . . . . . . . . . . . . . . . . . . 909,962 902,7673.500%, 07/01/42 . . . . . . . . . . . . . . . . . . . . . . . . . . . . 119,257 118,2963.500%, 08/01/42 . . . . . . . . . . . . . . . . . . . . . . . . . . . . 201,238 199,6173.500%, 10/01/42 . . . . . . . . . . . . . . . . . . . . . . . . . . . . 1,405,469 1,394,6513.500%, 11/01/42 . . . . . . . . . . . . . . . . . . . . . . . . . . . . 2,403,673 2,384,4423.500%, 12/01/42 . . . . . . . . . . . . . . . . . . . . . . . . . . . . 1,377,326 1,366,2413.500%, 01/01/43 . . . . . . . . . . . . . . . . . . . . . . . . . . . . 800,566 794,7853.500%, 02/01/43 . . . . . . . . . . . . . . . . . . . . . . . . . . . . 1,444,377 1,432,6113.500%, 03/01/43 . . . . . . . . . . . . . . . . . . . . . . . . . . . . 3,793,840 3,764,0043.500%, 04/01/43 . . . . . . . . . . . . . . . . . . . . . . . . . . . . 124,169 123,2493.500%, 05/01/43 . . . . . . . . . . . . . . . . . . . . . . . . . . . . 286,000 283,6743.500%, 06/01/43 . . . . . . . . . . . . . . . . . . . . . . . . . . . . 1,245,055 1,233,5503.500%, 07/01/43 . . . . . . . . . . . . . . . . . . . . . . . . . . . . 13,628,789 13,519,4843.500%, 08/01/43 . . . . . . . . . . . . . . . . . . . . . . . . . . . . 7,369,354 7,305,8503.500%, 09/01/43 . . . . . . . . . . . . . . . . . . . . . . . . . . . . 121,194 120,2183.500%, 10/01/43 . . . . . . . . . . . . . . . . . . . . . . . . . . . . 142,068 140,8963.500%, 11/01/43 . . . . . . . . . . . . . . . . . . . . . . . . . . . . 1,263,887 1,249,9553.500%, 01/01/44 . . . . . . . . . . . . . . . . . . . . . . . . . . . . 4,177,075 4,144,9263.500%, 05/01/44 . . . . . . . . . . . . . . . . . . . . . . . . . . . . 2,037,937 2,022,400
BHFTII-6

Brighthouse Funds Trust II
BlackRock Bond Income Portfolio
Schedule of Investments as of September 30, 2018 (Unaudited)
U.S. Treasury & Government Agencies—(Continued)
Security DescriptionPrincipalAmount* Value
Agency Sponsored Mortgage - Backed—(Continued)Fannie Mae 30 Yr. Pool
3.500%, 06/01/44 . . . . . . . . . . . . . . . . . . . . . . . . . . . . 10,543,152 $ 10,457,9573.500%, 07/01/44 . . . . . . . . . . . . . . . . . . . . . . . . . . . . 53,487 52,8903.500%, 02/01/45 . . . . . . . . . . . . . . . . . . . . . . . . . . . . 1,066,516 1,057,9333.500%, 07/01/45 . . . . . . . . . . . . . . . . . . . . . . . . . . . . 3,276,934 3,241,4733.500%, 10/01/45 . . . . . . . . . . . . . . . . . . . . . . . . . . . . 1,647,591 1,637,6303.500%, 11/01/45 . . . . . . . . . . . . . . . . . . . . . . . . . . . . 3,476,391 3,444,5013.500%, 12/01/45 . . . . . . . . . . . . . . . . . . . . . . . . . . . . 828,651 821,0973.500%, 03/01/46 . . . . . . . . . . . . . . . . . . . . . . . . . . . . 1,208,231 1,194,0713.500%, 04/01/46 . . . . . . . . . . . . . . . . . . . . . . . . . . . . 1,830,499 1,808,7903.500%, 05/01/46 . . . . . . . . . . . . . . . . . . . . . . . . . . . . 764,577 755,6163.500%, 06/01/46 . . . . . . . . . . . . . . . . . . . . . . . . . . . . 3,308,731 3,268,7813.500%, 08/01/46 . . . . . . . . . . . . . . . . . . . . . . . . . . . . 1,576,442 1,557,4783.500%, 09/01/46 . . . . . . . . . . . . . . . . . . . . . . . . . . . . 1,654,975 1,635,6483.500%, 11/01/46 . . . . . . . . . . . . . . . . . . . . . . . . . . . . 3,054,622 3,021,7053.500%, 12/01/46 . . . . . . . . . . . . . . . . . . . . . . . . . . . . 3,565,632 3,521,2063.500%, 01/01/47 . . . . . . . . . . . . . . . . . . . . . . . . . . . . 7,818,501 7,739,4313.500%, 02/01/47 . . . . . . . . . . . . . . . . . . . . . . . . . . . . 612,685 605,7563.500%, 05/01/47 . . . . . . . . . . . . . . . . . . . . . . . . . . . . 2,070,451 2,045,4173.500%, 06/01/47 . . . . . . . . . . . . . . . . . . . . . . . . . . . . 1,256,586 1,239,5973.500%, 07/01/47 . . . . . . . . . . . . . . . . . . . . . . . . . . . . 904,258 893,0983.500%, 09/01/47 . . . . . . . . . . . . . . . . . . . . . . . . . . . . 875,387 864,6243.500%, 10/01/47 . . . . . . . . . . . . . . . . . . . . . . . . . . . . 275,643 272,5263.500%, 11/01/47 . . . . . . . . . . . . . . . . . . . . . . . . . . . . 1,489,054 1,474,1953.500%, 12/01/47 . . . . . . . . . . . . . . . . . . . . . . . . . . . . 10,198,102 10,077,6363.500%, 01/01/48 . . . . . . . . . . . . . . . . . . . . . . . . . . . . 6,595,556 6,515,3773.500%, TBA (a) . . . . . . . . . . . . . . . . . . . . . . . . . . . . . . 27,606,000 27,166,3194.000%, 08/01/33 . . . . . . . . . . . . . . . . . . . . . . . . . . . . 1,149,996 1,161,7734.000%, 06/01/39 . . . . . . . . . . . . . . . . . . . . . . . . . . . . 891,132 906,5414.000%, 12/01/39 . . . . . . . . . . . . . . . . . . . . . . . . . . . . 81,411 82,8154.000%, 07/01/40 . . . . . . . . . . . . . . . . . . . . . . . . . . . . 1,066,514 1,084,9084.000%, 08/01/40 . . . . . . . . . . . . . . . . . . . . . . . . . . . . 1,943,902 1,977,6914.000%, 10/01/40 . . . . . . . . . . . . . . . . . . . . . . . . . . . . 5,269,961 5,364,2874.000%, 11/01/40 . . . . . . . . . . . . . . . . . . . . . . . . . . . . 353,431 359,5754.000%, 12/01/40 . . . . . . . . . . . . . . . . . . . . . . . . . . . . 1,793,480 1,824,6374.000%, 04/01/41 . . . . . . . . . . . . . . . . . . . . . . . . . . . . 170,090 173,0394.000%, 09/01/41 . . . . . . . . . . . . . . . . . . . . . . . . . . . . 4,430,757 4,507,8044.000%, 10/01/41 . . . . . . . . . . . . . . . . . . . . . . . . . . . . 300,289 305,5114.000%, 12/01/41 . . . . . . . . . . . . . . . . . . . . . . . . . . . . 1,202,444 1,228,3374.000%, 01/01/42 . . . . . . . . . . . . . . . . . . . . . . . . . . . . 1,182,667 1,203,2294.000%, 02/01/42 . . . . . . . . . . . . . . . . . . . . . . . . . . . . 2,950,797 3,002,0964.000%, 05/01/42 . . . . . . . . . . . . . . . . . . . . . . . . . . . . 1,154,036 1,176,6714.000%, 06/01/42 . . . . . . . . . . . . . . . . . . . . . . . . . . . . 623,878 634,6504.000%, 07/01/42 . . . . . . . . . . . . . . . . . . . . . . . . . . . . 4,356,844 4,448,7134.000%, 08/01/42 . . . . . . . . . . . . . . . . . . . . . . . . . . . . 324,434 330,0754.000%, 09/01/42 . . . . . . . . . . . . . . . . . . . . . . . . . . . . 814,612 828,7594.000%, 12/01/42 . . . . . . . . . . . . . . . . . . . . . . . . . . . . 2,349,061 2,395,8004.000%, 01/01/43 . . . . . . . . . . . . . . . . . . . . . . . . . . . . 983,106 1,000,1864.000%, 03/01/43 . . . . . . . . . . . . . . . . . . . . . . . . . . . . 203,924 207,5764.000%, 10/01/43 . . . . . . . . . . . . . . . . . . . . . . . . . . . . 744,767 757,7054.000%, 11/01/43 . . . . . . . . . . . . . . . . . . . . . . . . . . . . 3,542,970 3,619,1574.000%, 01/01/44 . . . . . . . . . . . . . . . . . . . . . . . . . . . . 2,587,766 2,643,2954.000%, 02/01/44 . . . . . . . . . . . . . . . . . . . . . . . . . . . . 2,496,765 2,550,4784.000%, 05/01/44 . . . . . . . . . . . . . . . . . . . . . . . . . . . . 3,727,090 3,807,3294.000%, 07/01/44 . . . . . . . . . . . . . . . . . . . . . . . . . . . . 235,797 239,1674.000%, 08/01/44 . . . . . . . . . . . . . . . . . . . . . . . . . . . . 824,572 842,325
Security DescriptionPrincipalAmount* Value
Agency Sponsored Mortgage - Backed—(Continued)Fannie Mae 30 Yr. Pool
4.000%, 12/01/44 . . . . . . . . . . . . . . . . . . . . . . . . . . . . 2,318,213 $ 2,364,3954.000%, 01/01/45 . . . . . . . . . . . . . . . . . . . . . . . . . . . . 387,949 395,8204.000%, 02/01/45 . . . . . . . . . . . . . . . . . . . . . . . . . . . . 1,154,033 1,176,4634.000%, 03/01/45 . . . . . . . . . . . . . . . . . . . . . . . . . . . . 990,775 1,006,9224.000%, 04/01/45 . . . . . . . . . . . . . . . . . . . . . . . . . . . . 950,055 969,3604.000%, 05/01/45 . . . . . . . . . . . . . . . . . . . . . . . . . . . . 934,276 952,4294.000%, 10/01/45 . . . . . . . . . . . . . . . . . . . . . . . . . . . . 6,060,661 6,174,7514.000%, 11/01/45 . . . . . . . . . . . . . . . . . . . . . . . . . . . . 2,277,820 2,322,9224.000%, 12/01/45 . . . . . . . . . . . . . . . . . . . . . . . . . . . . 4,726,520 4,812,3154.000%, 01/01/46 . . . . . . . . . . . . . . . . . . . . . . . . . . . . 5,047,789 5,113,5034.000%, 02/01/46 . . . . . . . . . . . . . . . . . . . . . . . . . . . . 1,643,418 1,672,5144.000%, 03/01/46 . . . . . . . . . . . . . . . . . . . . . . . . . . . . 8,254,989 8,398,2904.000%, 04/01/46 . . . . . . . . . . . . . . . . . . . . . . . . . . . . 10,986,043 11,181,9224.000%, 06/01/46 . . . . . . . . . . . . . . . . . . . . . . . . . . . . 23,381,978 23,773,0924.000%, 08/01/46 . . . . . . . . . . . . . . . . . . . . . . . . . . . . 3,255,585 3,311,8544.000%, 09/01/46 . . . . . . . . . . . . . . . . . . . . . . . . . . . . 17,636,898 17,941,7124.000%, 10/01/46 . . . . . . . . . . . . . . . . . . . . . . . . . . . . 2,961,541 3,012,5734.000%, 11/01/46 . . . . . . . . . . . . . . . . . . . . . . . . . . . . 285,883 291,0564.000%, 12/01/46 . . . . . . . . . . . . . . . . . . . . . . . . . . . . 1,359,275 1,382,6984.000%, 01/01/47 . . . . . . . . . . . . . . . . . . . . . . . . . . . . 1,576,142 1,603,9494.000%, 03/01/47 . . . . . . . . . . . . . . . . . . . . . . . . . . . . 7,191,233 7,294,6174.000%, 08/01/47 . . . . . . . . . . . . . . . . . . . . . . . . . . . . 1,030,849 1,045,3804.000%, 03/01/48 . . . . . . . . . . . . . . . . . . . . . . . . . . . . 2,669,702 2,719,6324.000%, 04/01/48 . . . . . . . . . . . . . . . . . . . . . . . . . . . . 1,667,391 1,698,5924.000%, 08/01/48 . . . . . . . . . . . . . . . . . . . . . . . . . . . . 10,409,613 10,559,9234.500%, 08/01/39 . . . . . . . . . . . . . . . . . . . . . . . . . . . . 1,277,543 1,329,8404.500%, 11/01/39 . . . . . . . . . . . . . . . . . . . . . . . . . . . . 378,812 394,7574.500%, 01/01/40 . . . . . . . . . . . . . . . . . . . . . . . . . . . . 40,817 42,5154.500%, 04/01/40 . . . . . . . . . . . . . . . . . . . . . . . . . . . . 93,915 97,7924.500%, 05/01/40 . . . . . . . . . . . . . . . . . . . . . . . . . . . . 242,652 252,6464.500%, 06/01/40 . . . . . . . . . . . . . . . . . . . . . . . . . . . . 223,483 232,6504.500%, 07/01/40 . . . . . . . . . . . . . . . . . . . . . . . . . . . . 453,813 472,4284.500%, 08/01/40 . . . . . . . . . . . . . . . . . . . . . . . . . . . . 3,081,127 3,206,5784.500%, 11/01/40 . . . . . . . . . . . . . . . . . . . . . . . . . . . . 876,213 911,8864.500%, 07/01/41 . . . . . . . . . . . . . . . . . . . . . . . . . . . . 255,275 265,5364.500%, 08/01/41 . . . . . . . . . . . . . . . . . . . . . . . . . . . . 35,334 36,4654.500%, 09/01/41 . . . . . . . . . . . . . . . . . . . . . . . . . . . . 968,848 1,007,0994.500%, 10/01/41 . . . . . . . . . . . . . . . . . . . . . . . . . . . . 187,110 194,7114.500%, 01/01/42 . . . . . . . . . . . . . . . . . . . . . . . . . . . . 180,845 188,2024.500%, 06/01/42 . . . . . . . . . . . . . . . . . . . . . . . . . . . . 83,209 85,8774.500%, 08/01/42 . . . . . . . . . . . . . . . . . . . . . . . . . . . . 1,047,296 1,087,2864.500%, 09/01/42 . . . . . . . . . . . . . . . . . . . . . . . . . . . . 2,793,960 2,908,7584.500%, 09/01/43 . . . . . . . . . . . . . . . . . . . . . . . . . . . . 1,074,540 1,114,8934.500%, 10/01/43 . . . . . . . . . . . . . . . . . . . . . . . . . . . . 1,440,905 1,494,9314.500%, 12/01/43 . . . . . . . . . . . . . . . . . . . . . . . . . . . . 1,649,882 1,711,9904.500%, 01/01/44 . . . . . . . . . . . . . . . . . . . . . . . . . . . . 1,742,639 1,807,9404.500%, 09/01/45 . . . . . . . . . . . . . . . . . . . . . . . . . . . . 777,787 813,6554.500%, 11/01/45 . . . . . . . . . . . . . . . . . . . . . . . . . . . . 495,615 517,6364.500%, 12/01/45 . . . . . . . . . . . . . . . . . . . . . . . . . . . . 1,273,315 1,323,5074.500%, 09/01/46 . . . . . . . . . . . . . . . . . . . . . . . . . . . . 672,500 704,2844.500%, 09/01/47 . . . . . . . . . . . . . . . . . . . . . . . . . . . . 83,605 86,4344.500%, 10/01/47 . . . . . . . . . . . . . . . . . . . . . . . . . . . . 215,050 222,8884.500%, 11/01/47 . . . . . . . . . . . . . . . . . . . . . . . . . . . . 54,288 56,2084.500%, 12/01/47 . . . . . . . . . . . . . . . . . . . . . . . . . . . . 67,310 69,6924.500%, 02/01/48 . . . . . . . . . . . . . . . . . . . . . . . . . . . . 122,902 127,061
BHFTII-7

Brighthouse Funds Trust II
BlackRock Bond Income Portfolio
Schedule of Investments as of September 30, 2018 (Unaudited)
U.S. Treasury & Government Agencies—(Continued)
Security DescriptionPrincipalAmount* Value
Agency Sponsored Mortgage - Backed—(Continued)Fannie Mae 30 Yr. Pool
4.500%, 03/01/48 . . . . . . . . . . . . . . . . . . . . . . . . . . . . 228,987 $ 236,9314.500%, 04/01/48 . . . . . . . . . . . . . . . . . . . . . . . . . . . . 1,425,231 1,492,6144.500%, 05/01/48 . . . . . . . . . . . . . . . . . . . . . . . . . . . . 19,200,788 20,021,1904.500%, 07/01/48 . . . . . . . . . . . . . . . . . . . . . . . . . . . . 277,230 288,4224.500%, 08/01/48 . . . . . . . . . . . . . . . . . . . . . . . . . . . . 21,100,330 21,785,5405.000%, 11/01/32 . . . . . . . . . . . . . . . . . . . . . . . . . . . . 3,670 3,8605.000%, 09/01/35 . . . . . . . . . . . . . . . . . . . . . . . . . . . . 213,670 226,8565.000%, 06/01/39 (b) . . . . . . . . . . . . . . . . . . . . . . . . . 9,191,730 9,757,8745.000%, 04/01/41 . . . . . . . . . . . . . . . . . . . . . . . . . . . . 36,127 38,4435.000%, 07/01/41 . . . . . . . . . . . . . . . . . . . . . . . . . . . . 437,643 465,6985.000%, 08/01/41 . . . . . . . . . . . . . . . . . . . . . . . . . . . . 379,942 404,2965.000%, 01/01/42 . . . . . . . . . . . . . . . . . . . . . . . . . . . . 51,453 54,0365.500%, 11/01/32 . . . . . . . . . . . . . . . . . . . . . . . . . . . . 1,030,012 1,110,5225.500%, 12/01/32 . . . . . . . . . . . . . . . . . . . . . . . . . . . . 177,902 191,8865.500%, 01/01/33 . . . . . . . . . . . . . . . . . . . . . . . . . . . . 667,083 718,8265.500%, 12/01/33 . . . . . . . . . . . . . . . . . . . . . . . . . . . . 237,135 255,8435.500%, 05/01/34 . . . . . . . . . . . . . . . . . . . . . . . . . . . . 1,865,107 2,015,7575.500%, 08/01/37 . . . . . . . . . . . . . . . . . . . . . . . . . . . . 1,931,401 2,087,4775.500%, 02/01/38 . . . . . . . . . . . . . . . . . . . . . . . . . . . . 321,866 349,7155.500%, 03/01/38 . . . . . . . . . . . . . . . . . . . . . . . . . . . . 202,690 219,7335.500%, 04/01/38 . . . . . . . . . . . . . . . . . . . . . . . . . . . . 112,113 119,6955.500%, 06/01/38 . . . . . . . . . . . . . . . . . . . . . . . . . . . . 350,199 378,1045.500%, 12/01/38 . . . . . . . . . . . . . . . . . . . . . . . . . . . . 117,719 125,6815.500%, 01/01/39 . . . . . . . . . . . . . . . . . . . . . . . . . . . . 312,221 336,2365.500%, 08/01/39 . . . . . . . . . . . . . . . . . . . . . . . . . . . . 243,849 262,3885.500%, 12/01/39 . . . . . . . . . . . . . . . . . . . . . . . . . . . . 456,275 489,9405.500%, 04/01/40 . . . . . . . . . . . . . . . . . . . . . . . . . . . . 70,192 75,4365.500%, 04/01/41 . . . . . . . . . . . . . . . . . . . . . . . . . . . . 281,499 302,9785.500%, TBA (a) . . . . . . . . . . . . . . . . . . . . . . . . . . . . . . 3,696,000 3,946,6356.000%, 02/01/34 . . . . . . . . . . . . . . . . . . . . . . . . . . . . 217,784 239,8896.000%, 08/01/34 . . . . . . . . . . . . . . . . . . . . . . . . . . . . 161,340 177,6976.000%, 04/01/35 . . . . . . . . . . . . . . . . . . . . . . . . . . . . 2,583,116 2,844,9116.000%, 06/01/36 . . . . . . . . . . . . . . . . . . . . . . . . . . . . 299,112 330,5856.000%, 02/01/38 . . . . . . . . . . . . . . . . . . . . . . . . . . . . 523,164 575,6046.000%, 03/01/38 . . . . . . . . . . . . . . . . . . . . . . . . . . . . 167,989 184,8826.000%, 05/01/38 . . . . . . . . . . . . . . . . . . . . . . . . . . . . 521,293 573,7176.000%, 10/01/38 . . . . . . . . . . . . . . . . . . . . . . . . . . . . 645,366 711,4326.000%, 12/01/38 . . . . . . . . . . . . . . . . . . . . . . . . . . . . 197,978 218,2596.000%, 04/01/40 . . . . . . . . . . . . . . . . . . . . . . . . . . . . 2,093,895 2,308,1086.000%, 09/01/40 . . . . . . . . . . . . . . . . . . . . . . . . . . . . 210,084 230,3856.000%, 06/01/41 . . . . . . . . . . . . . . . . . . . . . . . . . . . . 473,160 520,3516.500%, 05/01/40 . . . . . . . . . . . . . . . . . . . . . . . . . . . . 3,068,357 3,385,176
Fannie Mae Connecticut Avenue Securities (CMO)4.416%, 1M LIBOR + 2.200%, 01/25/30 (c) . . . . . . . . . . . 795,826 820,1485.216%, 1M LIBOR + 3.000%, 10/25/29 (c) . . . . . . . . . . . 246,328 265,2535.766%, 1M LIBOR + 3.550%, 07/25/29 (c) . . . . . . . . . . . 1,289,928 1,408,2175.816%, 1M LIBOR + 3.600%, 01/25/30 (c) . . . . . . . . . . . 1,350,000 1,427,5906.216%, 1M LIBOR + 4.000%, 05/25/30 (c) . . . . . . . . . . . 1,140,000 1,220,1256.466%, 1M LIBOR + 4.250%, 04/25/29 (c) . . . . . . . . . . . 1,620,000 1,850,6797.966%, 1M LIBOR + 5.750%, 07/25/29 (c) . . . . . . . . . . . 683,032 827,708
Fannie Mae Pool4.000%, 01/01/41 . . . . . . . . . . . . . . . . . . . . . . . . . . . . 439,302 444,894
Fannie Mae REMICS (CMO)5.000%, 04/25/35 . . . . . . . . . . . . . . . . . . . . . . . . . . . . 53,221 54,807
Security DescriptionPrincipalAmount* Value
Agency Sponsored Mortgage - Backed—(Continued)Fannie Mae-ACES (CMO)
2.690%, 01/25/39 (c) (d) . . . . . . . . . . . . . . . . . . . . . . . 2,928,142 $ 290,3643.086%, 12/25/27 (c) . . . . . . . . . . . . . . . . . . . . . . . . . . 507,000 483,508
Freddie Mac 15 Yr. Gold Pool2.500%, 04/01/27 . . . . . . . . . . . . . . . . . . . . . . . . . . . . 132,844 129,0982.500%, 10/01/28 . . . . . . . . . . . . . . . . . . . . . . . . . . . . 445,433 432,8552.500%, 08/01/29 . . . . . . . . . . . . . . . . . . . . . . . . . . . . 1,041,993 1,007,6902.500%, 12/01/29 . . . . . . . . . . . . . . . . . . . . . . . . . . . . 295,703 286,8232.500%, 05/01/30 . . . . . . . . . . . . . . . . . . . . . . . . . . . . 1,112,491 1,077,1882.500%, 07/01/30 . . . . . . . . . . . . . . . . . . . . . . . . . . . . 755,227 731,4552.500%, 08/01/30 . . . . . . . . . . . . . . . . . . . . . . . . . . . . 2,552,641 2,469,7962.500%, 09/01/30 . . . . . . . . . . . . . . . . . . . . . . . . . . . . 2,816,880 2,724,0332.500%, 04/01/31 . . . . . . . . . . . . . . . . . . . . . . . . . . . . 1,979,099 1,912,2242.500%, TBA (a) . . . . . . . . . . . . . . . . . . . . . . . . . . . . . . 9,133,000 8,807,2363.000%, 01/01/30 . . . . . . . . . . . . . . . . . . . . . . . . . . . . 852,834 844,7463.000%, 04/01/30 . . . . . . . . . . . . . . . . . . . . . . . . . . . . 4,239,900 4,196,7593.000%, 05/01/30 . . . . . . . . . . . . . . . . . . . . . . . . . . . . 679,386 672,9353.000%, 06/01/30 . . . . . . . . . . . . . . . . . . . . . . . . . . . . 29,773 29,4563.000%, 07/01/30 . . . . . . . . . . . . . . . . . . . . . . . . . . . . 1,583,496 1,565,9003.000%, 08/01/30 . . . . . . . . . . . . . . . . . . . . . . . . . . . . 502,444 496,3903.000%, TBA (a) . . . . . . . . . . . . . . . . . . . . . . . . . . . . . . 11,359,000 11,191,8033.500%, TBA (a) . . . . . . . . . . . . . . . . . . . . . . . . . . . . . . 6,274,000 6,306,5314.000%, TBA (a) . . . . . . . . . . . . . . . . . . . . . . . . . . . . . . 2,651,000 2,704,952
Freddie Mac 30 Yr. Gold Pool3.000%, 12/01/42 . . . . . . . . . . . . . . . . . . . . . . . . . . . . 2,666,080 2,574,6533.000%, 01/01/43 . . . . . . . . . . . . . . . . . . . . . . . . . . . . 1,790,035 1,728,4113.000%, 03/01/43 . . . . . . . . . . . . . . . . . . . . . . . . . . . . 3,847,245 3,713,8993.000%, 07/01/43 (b) . . . . . . . . . . . . . . . . . . . . . . . . . 11,112,268 10,723,0463.000%, 12/01/46 . . . . . . . . . . . . . . . . . . . . . . . . . . . . 3,088,233 2,963,6633.000%, TBA (a) . . . . . . . . . . . . . . . . . . . . . . . . . . . . . . 41,863,779 40,047,7743.500%, 04/01/42 . . . . . . . . . . . . . . . . . . . . . . . . . . . . 2,282,065 2,263,0943.500%, 05/01/42 . . . . . . . . . . . . . . . . . . . . . . . . . . . . 112,697 111,6353.500%, 08/01/42 . . . . . . . . . . . . . . . . . . . . . . . . . . . . 2,805,216 2,783,2133.500%, 10/01/42 . . . . . . . . . . . . . . . . . . . . . . . . . . . . 150,086 148,1823.500%, 11/01/42 . . . . . . . . . . . . . . . . . . . . . . . . . . . . 1,081,303 1,072,2973.500%, 01/01/43 . . . . . . . . . . . . . . . . . . . . . . . . . . . . 1,290,701 1,279,9553.500%, 06/01/43 . . . . . . . . . . . . . . . . . . . . . . . . . . . . 322,943 320,2533.500%, 12/01/43 . . . . . . . . . . . . . . . . . . . . . . . . . . . . 5,116,866 5,074,3113.500%, 01/01/44 (b) . . . . . . . . . . . . . . . . . . . . . . . . . 23,292,835 23,099,2453.500%, 04/01/44 . . . . . . . . . . . . . . . . . . . . . . . . . . . . 2,309,790 2,290,4403.500%, 05/01/44 . . . . . . . . . . . . . . . . . . . . . . . . . . . . 587,806 583,0823.500%, 06/01/44 . . . . . . . . . . . . . . . . . . . . . . . . . . . . 402,386 399,0373.500%, 07/01/44 . . . . . . . . . . . . . . . . . . . . . . . . . . . . 112,465 111,6683.500%, 08/01/44 . . . . . . . . . . . . . . . . . . . . . . . . . . . . 426,053 422,5063.500%, 09/01/44 . . . . . . . . . . . . . . . . . . . . . . . . . . . . 909,614 901,5183.500%, 11/01/44 . . . . . . . . . . . . . . . . . . . . . . . . . . . . 24,133 23,8953.500%, 01/01/45 . . . . . . . . . . . . . . . . . . . . . . . . . . . . 171,771 169,7403.500%, 05/01/45 . . . . . . . . . . . . . . . . . . . . . . . . . . . . 260,143 256,8123.500%, 06/01/45 . . . . . . . . . . . . . . . . . . . . . . . . . . . . 219,800 217,0163.500%, 07/01/45 . . . . . . . . . . . . . . . . . . . . . . . . . . . . 6,120 6,0423.500%, 08/01/45 . . . . . . . . . . . . . . . . . . . . . . . . . . . . 6,708,887 6,645,7433.500%, 09/01/45 . . . . . . . . . . . . . . . . . . . . . . . . . . . . 191,091 189,6003.500%, 10/01/45 . . . . . . . . . . . . . . . . . . . . . . . . . . . . 24,311 24,0033.500%, 01/01/46 . . . . . . . . . . . . . . . . . . . . . . . . . . . . 1,116,305 1,102,1673.500%, 02/01/46 . . . . . . . . . . . . . . . . . . . . . . . . . . . . 77,047 76,0283.500%, 03/01/46 . . . . . . . . . . . . . . . . . . . . . . . . . . . . 811,932 801,196
BHFTII-8
Brighthouse Funds Trust II
BlackRock Bond Income Portfolio
Schedule of Investments as of September 30, 2018 (Unaudited)
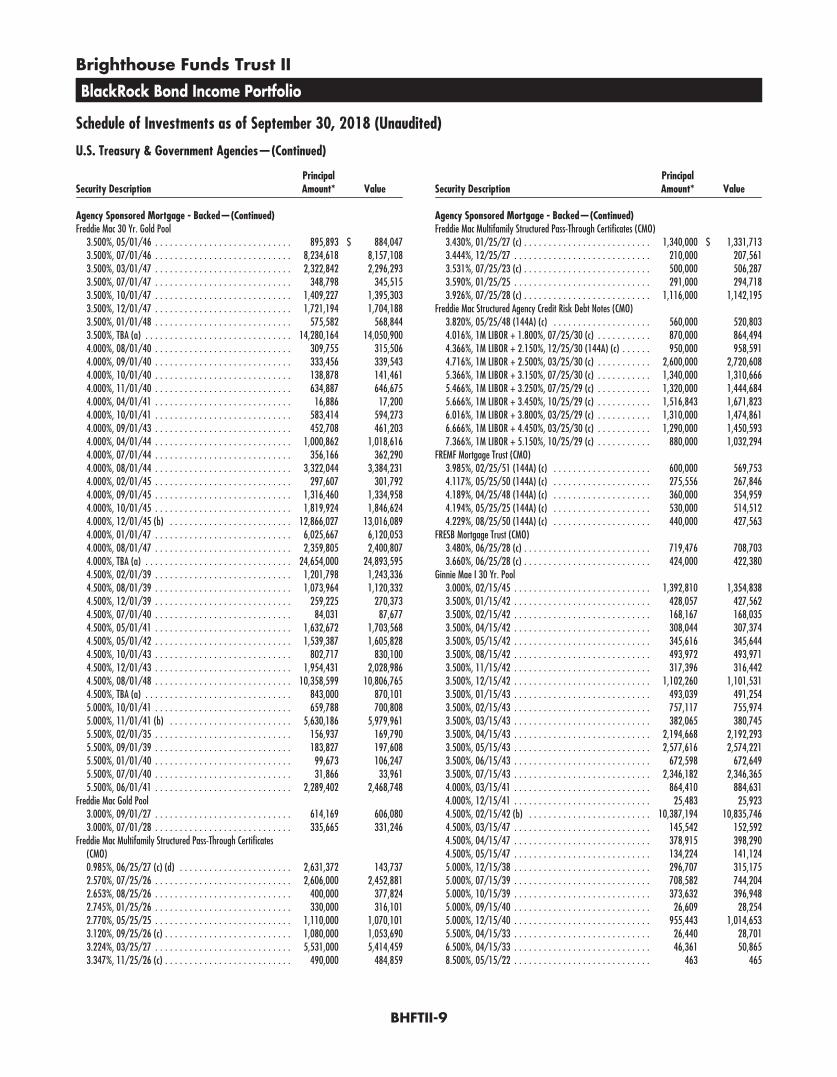
U.S. Treasury & Government Agencies—(Continued)
Security DescriptionPrincipalAmount* Value
Agency Sponsored Mortgage - Backed—(Continued)Freddie Mac 30 Yr. Gold Pool
3.500%, 05/01/46 . . . . . . . . . . . . . . . . . . . . . . . . . . . . 895,893 $ 884,0473.500%, 07/01/46 . . . . . . . . . . . . . . . . . . . . . . . . . . . . 8,234,618 8,157,1083.500%, 03/01/47 . . . . . . . . . . . . . . . . . . . . . . . . . . . . 2,322,842 2,296,2933.500%, 07/01/47 . . . . . . . . . . . . . . . . . . . . . . . . . . . . 348,798 345,5153.500%, 10/01/47 . . . . . . . . . . . . . . . . . . . . . . . . . . . . 1,409,227 1,395,3033.500%, 12/01/47 . . . . . . . . . . . . . . . . . . . . . . . . . . . . 1,721,194 1,704,1883.500%, 01/01/48 . . . . . . . . . . . . . . . . . . . . . . . . . . . . 575,582 568,8443.500%, TBA (a) . . . . . . . . . . . . . . . . . . . . . . . . . . . . . . 14,280,164 14,050,9004.000%, 08/01/40 . . . . . . . . . . . . . . . . . . . . . . . . . . . . 309,755 315,5064.000%, 09/01/40 . . . . . . . . . . . . . . . . . . . . . . . . . . . . 333,456 339,5434.000%, 10/01/40 . . . . . . . . . . . . . . . . . . . . . . . . . . . . 138,878 141,4614.000%, 11/01/40 . . . . . . . . . . . . . . . . . . . . . . . . . . . . 634,887 646,6754.000%, 04/01/41 . . . . . . . . . . . . . . . . . . . . . . . . . . . . 16,886 17,2004.000%, 10/01/41 . . . . . . . . . . . . . . . . . . . . . . . . . . . . 583,414 594,2734.000%, 09/01/43 . . . . . . . . . . . . . . . . . . . . . . . . . . . . 452,708 461,2034.000%, 04/01/44 . . . . . . . . . . . . . . . . . . . . . . . . . . . . 1,000,862 1,018,6164.000%, 07/01/44 . . . . . . . . . . . . . . . . . . . . . . . . . . . . 356,166 362,2904.000%, 08/01/44 . . . . . . . . . . . . . . . . . . . . . . . . . . . . 3,322,044 3,384,2314.000%, 02/01/45 . . . . . . . . . . . . . . . . . . . . . . . . . . . . 297,607 301,7924.000%, 09/01/45 . . . . . . . . . . . . . . . . . . . . . . . . . . . . 1,316,460 1,334,9584.000%, 10/01/45 . . . . . . . . . . . . . . . . . . . . . . . . . . . . 1,819,924 1,846,6244.000%, 12/01/45 (b) . . . . . . . . . . . . . . . . . . . . . . . . . 12,866,027 13,016,0894.000%, 01/01/47 . . . . . . . . . . . . . . . . . . . . . . . . . . . . 6,025,667 6,120,0534.000%, 08/01/47 . . . . . . . . . . . . . . . . . . . . . . . . . . . . 2,359,805 2,400,8074.000%, TBA (a) . . . . . . . . . . . . . . . . . . . . . . . . . . . . . . 24,654,000 24,893,5954.500%, 02/01/39 . . . . . . . . . . . . . . . . . . . . . . . . . . . . 1,201,798 1,243,3364.500%, 08/01/39 . . . . . . . . . . . . . . . . . . . . . . . . . . . . 1,073,964 1,120,3324.500%, 12/01/39 . . . . . . . . . . . . . . . . . . . . . . . . . . . . 259,225 270,3734.500%, 07/01/40 . . . . . . . . . . . . . . . . . . . . . . . . . . . . 84,031 87,6774.500%, 05/01/41 . . . . . . . . . . . . . . . . . . . . . . . . . . . . 1,632,672 1,703,5684.500%, 05/01/42 . . . . . . . . . . . . . . . . . . . . . . . . . . . . 1,539,387 1,605,8284.500%, 10/01/43 . . . . . . . . . . . . . . . . . . . . . . . . . . . . 802,717 830,1004.500%, 12/01/43 . . . . . . . . . . . . . . . . . . . . . . . . . . . . 1,954,431 2,028,9864.500%, 08/01/48 . . . . . . . . . . . . . . . . . . . . . . . . . . . . 10,358,599 10,806,7654.500%, TBA (a) . . . . . . . . . . . . . . . . . . . . . . . . . . . . . . 843,000 870,1015.000%, 10/01/41 . . . . . . . . . . . . . . . . . . . . . . . . . . . . 659,788 700,8085.000%, 11/01/41 (b) . . . . . . . . . . . . . . . . . . . . . . . . . 5,630,186 5,979,9615.500%, 02/01/35 . . . . . . . . . . . . . . . . . . . . . . . . . . . . 156,937 169,7905.500%, 09/01/39 . . . . . . . . . . . . . . . . . . . . . . . . . . . . 183,827 197,6085.500%, 01/01/40 . . . . . . . . . . . . . . . . . . . . . . . . . . . . 99,673 106,2475.500%, 07/01/40 . . . . . . . . . . . . . . . . . . . . . . . . . . . . 31,866 33,9615.500%, 06/01/41 . . . . . . . . . . . . . . . . . . . . . . . . . . . . 2,289,402 2,468,748
Freddie Mac Gold Pool3.000%, 09/01/27 . . . . . . . . . . . . . . . . . . . . . . . . . . . . 614,169 606,0803.000%, 07/01/28 . . . . . . . . . . . . . . . . . . . . . . . . . . . . 335,665 331,246
Freddie Mac Multifamily Structured Pass-Through Certificates(CMO)0.985%, 06/25/27 (c) (d) . . . . . . . . . . . . . . . . . . . . . . . 2,631,372 143,7372.570%, 07/25/26 . . . . . . . . . . . . . . . . . . . . . . . . . . . . 2,606,000 2,452,8812.653%, 08/25/26 . . . . . . . . . . . . . . . . . . . . . . . . . . . . 400,000 377,8242.745%, 01/25/26 . . . . . . . . . . . . . . . . . . . . . . . . . . . . 330,000 316,1012.770%, 05/25/25 . . . . . . . . . . . . . . . . . . . . . . . . . . . . 1,110,000 1,070,1013.120%, 09/25/26 (c) . . . . . . . . . . . . . . . . . . . . . . . . . . 1,080,000 1,053,6903.224%, 03/25/27 . . . . . . . . . . . . . . . . . . . . . . . . . . . . 5,531,000 5,414,4593.347%, 11/25/26 (c) . . . . . . . . . . . . . . . . . . . . . . . . . . 490,000 484,859
Security DescriptionPrincipalAmount* Value
Agency Sponsored Mortgage - Backed—(Continued)Freddie Mac Multifamily Structured Pass-Through Certificates (CMO)
3.430%, 01/25/27 (c) . . . . . . . . . . . . . . . . . . . . . . . . . . 1,340,000 $ 1,331,7133.444%, 12/25/27 . . . . . . . . . . . . . . . . . . . . . . . . . . . . 210,000 207,5613.531%, 07/25/23 (c) . . . . . . . . . . . . . . . . . . . . . . . . . . 500,000 506,2873.590%, 01/25/25 . . . . . . . . . . . . . . . . . . . . . . . . . . . . 291,000 294,7183.926%, 07/25/28 (c) . . . . . . . . . . . . . . . . . . . . . . . . . . 1,116,000 1,142,195
Freddie Mac Structured Agency Credit Risk Debt Notes (CMO)3.820%, 05/25/48 (144A) (c) . . . . . . . . . . . . . . . . . . . . 560,000 520,8034.016%, 1M LIBOR + 1.800%, 07/25/30 (c) . . . . . . . . . . . 870,000 864,4944.366%, 1M LIBOR + 2.150%, 12/25/30 (144A) (c) . . . . . . 950,000 958,5914.716%, 1M LIBOR + 2.500%, 03/25/30 (c) . . . . . . . . . . . 2,600,000 2,720,6085.366%, 1M LIBOR + 3.150%, 07/25/30 (c) . . . . . . . . . . . 1,340,000 1,310,6665.466%, 1M LIBOR + 3.250%, 07/25/29 (c) . . . . . . . . . . . 1,320,000 1,444,6845.666%, 1M LIBOR + 3.450%, 10/25/29 (c) . . . . . . . . . . . 1,516,843 1,671,8236.016%, 1M LIBOR + 3.800%, 03/25/29 (c) . . . . . . . . . . . 1,310,000 1,474,8616.666%, 1M LIBOR + 4.450%, 03/25/30 (c) . . . . . . . . . . . 1,290,000 1,450,5937.366%, 1M LIBOR + 5.150%, 10/25/29 (c) . . . . . . . . . . . 880,000 1,032,294
FREMF Mortgage Trust (CMO)3.985%, 02/25/51 (144A) (c) . . . . . . . . . . . . . . . . . . . . 600,000 569,7534.117%, 05/25/50 (144A) (c) . . . . . . . . . . . . . . . . . . . . 275,556 267,8464.189%, 04/25/48 (144A) (c) . . . . . . . . . . . . . . . . . . . . 360,000 354,9594.194%, 05/25/25 (144A) (c) . . . . . . . . . . . . . . . . . . . . 530,000 514,5124.229%, 08/25/50 (144A) (c) . . . . . . . . . . . . . . . . . . . . 440,000 427,563
FRESB Mortgage Trust (CMO)3.480%, 06/25/28 (c) . . . . . . . . . . . . . . . . . . . . . . . . . . 719,476 708,7033.660%, 06/25/28 (c) . . . . . . . . . . . . . . . . . . . . . . . . . . 424,000 422,380
Ginnie Mae I 30 Yr. Pool3.000%, 02/15/45 . . . . . . . . . . . . . . . . . . . . . . . . . . . . 1,392,810 1,354,8383.500%, 01/15/42 . . . . . . . . . . . . . . . . . . . . . . . . . . . . 428,057 427,5623.500%, 02/15/42 . . . . . . . . . . . . . . . . . . . . . . . . . . . . 168,167 168,0353.500%, 04/15/42 . . . . . . . . . . . . . . . . . . . . . . . . . . . . 308,044 307,3743.500%, 05/15/42 . . . . . . . . . . . . . . . . . . . . . . . . . . . . 345,616 345,6443.500%, 08/15/42 . . . . . . . . . . . . . . . . . . . . . . . . . . . . 493,972 493,9713.500%, 11/15/42 . . . . . . . . . . . . . . . . . . . . . . . . . . . . 317,396 316,4423.500%, 12/15/42 . . . . . . . . . . . . . . . . . . . . . . . . . . . . 1,102,260 1,101,5313.500%, 01/15/43 . . . . . . . . . . . . . . . . . . . . . . . . . . . . 493,039 491,2543.500%, 02/15/43 . . . . . . . . . . . . . . . . . . . . . . . . . . . . 757,117 755,9743.500%, 03/15/43 . . . . . . . . . . . . . . . . . . . . . . . . . . . . 382,065 380,7453.500%, 04/15/43 . . . . . . . . . . . . . . . . . . . . . . . . . . . . 2,194,668 2,192,2933.500%, 05/15/43 . . . . . . . . . . . . . . . . . . . . . . . . . . . . 2,577,616 2,574,2213.500%, 06/15/43 . . . . . . . . . . . . . . . . . . . . . . . . . . . . 672,598 672,6493.500%, 07/15/43 . . . . . . . . . . . . . . . . . . . . . . . . . . . . 2,346,182 2,346,3654.000%, 03/15/41 . . . . . . . . . . . . . . . . . . . . . . . . . . . . 864,410 884,6314.000%, 12/15/41 . . . . . . . . . . . . . . . . . . . . . . . . . . . . 25,483 25,9234.500%, 02/15/42 (b) . . . . . . . . . . . . . . . . . . . . . . . . . 10,387,194 10,835,7464.500%, 03/15/47 . . . . . . . . . . . . . . . . . . . . . . . . . . . . 145,542 152,5924.500%, 04/15/47 . . . . . . . . . . . . . . . . . . . . . . . . . . . . 378,915 398,2904.500%, 05/15/47 . . . . . . . . . . . . . . . . . . . . . . . . . . . . 134,224 141,1245.000%, 12/15/38 . . . . . . . . . . . . . . . . . . . . . . . . . . . . 296,707 315,1755.000%, 07/15/39 . . . . . . . . . . . . . . . . . . . . . . . . . . . . 708,582 744,2045.000%, 10/15/39 . . . . . . . . . . . . . . . . . . . . . . . . . . . . 373,632 396,9485.000%, 09/15/40 . . . . . . . . . . . . . . . . . . . . . . . . . . . . 26,609 28,2545.000%, 12/15/40 . . . . . . . . . . . . . . . . . . . . . . . . . . . . 955,443 1,014,6535.500%, 04/15/33 . . . . . . . . . . . . . . . . . . . . . . . . . . . . 26,440 28,7016.500%, 04/15/33 . . . . . . . . . . . . . . . . . . . . . . . . . . . . 46,361 50,8658.500%, 05/15/22 . . . . . . . . . . . . . . . . . . . . . . . . . . . . 463 465
BHFTII-9

Brighthouse Funds Trust II
BlackRock Bond Income Portfolio
Schedule of Investments as of September 30, 2018 (Unaudited)
U.S. Treasury & Government Agencies—(Continued)
Security DescriptionPrincipalAmount* Value
Agency Sponsored Mortgage - Backed—(Continued)Ginnie Mae II 30 Yr. Pool
3.000%, 12/20/44 . . . . . . . . . . . . . . . . . . . . . . . . . . . . 170,977 $ 166,7633.000%, 04/20/45 . . . . . . . . . . . . . . . . . . . . . . . . . . . . 3,321,448 3,230,3023.000%, 06/20/45 . . . . . . . . . . . . . . . . . . . . . . . . . . . . 8,661,079 8,421,6143.000%, 07/20/45 . . . . . . . . . . . . . . . . . . . . . . . . . . . . 89,688 87,1993.000%, 08/20/45 . . . . . . . . . . . . . . . . . . . . . . . . . . . . 89,511 87,1283.000%, 10/20/45 . . . . . . . . . . . . . . . . . . . . . . . . . . . . 1,071,196 1,041,2463.000%, 12/20/45 . . . . . . . . . . . . . . . . . . . . . . . . . . . . 94,045 91,3873.000%, 04/20/46 . . . . . . . . . . . . . . . . . . . . . . . . . . . . 19,126,114 18,573,6023.000%, 05/20/46 . . . . . . . . . . . . . . . . . . . . . . . . . . . . 135,385 131,6203.000%, 06/20/46 . . . . . . . . . . . . . . . . . . . . . . . . . . . . 3,096,971 3,005,5973.000%, 07/20/46 . . . . . . . . . . . . . . . . . . . . . . . . . . . . 6,375,186 6,187,0723.000%, 08/20/46 . . . . . . . . . . . . . . . . . . . . . . . . . . . . 1,200,741 1,165,3113.000%, 09/20/46 . . . . . . . . . . . . . . . . . . . . . . . . . . . . 11,680,987 11,341,6763.000%, 10/20/46 . . . . . . . . . . . . . . . . . . . . . . . . . . . . 463,761 449,9333.000%, 11/20/46 . . . . . . . . . . . . . . . . . . . . . . . . . . . . 300,771 291,7573.000%, 12/20/46 . . . . . . . . . . . . . . . . . . . . . . . . . . . . 1,142,067 1,107,6613.000%, 01/20/47 . . . . . . . . . . . . . . . . . . . . . . . . . . . . 593,170 575,2713.000%, 03/20/47 . . . . . . . . . . . . . . . . . . . . . . . . . . . . 1,355,512 1,315,3753.000%, 04/20/47 . . . . . . . . . . . . . . . . . . . . . . . . . . . . 825,316 800,3323.000%, 06/20/47 . . . . . . . . . . . . . . . . . . . . . . . . . . . . 84,900 82,3253.000%, 07/20/47 . . . . . . . . . . . . . . . . . . . . . . . . . . . . 578,811 561,1633.000%, TBA (a) . . . . . . . . . . . . . . . . . . . . . . . . . . . . . . 16,507,500 15,987,4493.500%, 04/20/43 . . . . . . . . . . . . . . . . . . . . . . . . . . . . 2,192,707 2,192,8503.500%, 05/20/43 . . . . . . . . . . . . . . . . . . . . . . . . . . . . 1,174,646 1,174,7223.500%, 07/20/43 . . . . . . . . . . . . . . . . . . . . . . . . . . . . 91,833 91,8393.500%, 02/20/44 . . . . . . . . . . . . . . . . . . . . . . . . . . . . 2,733,649 2,733,8283.500%, 05/20/45 . . . . . . . . . . . . . . . . . . . . . . . . . . . . 771,666 769,3383.500%, 04/20/46 . . . . . . . . . . . . . . . . . . . . . . . . . . . . 37,018,727 36,884,2163.500%, 05/20/46 . . . . . . . . . . . . . . . . . . . . . . . . . . . . 1,676,418 1,670,0683.500%, 06/20/46 . . . . . . . . . . . . . . . . . . . . . . . . . . . . 19,104,936 19,026,6813.500%, 07/20/46 . . . . . . . . . . . . . . . . . . . . . . . . . . . . 3,248,530 3,234,7233.500%, 09/20/46 . . . . . . . . . . . . . . . . . . . . . . . . . . . . 620,317 617,5853.500%, 10/20/46 . . . . . . . . . . . . . . . . . . . . . . . . . . . . 2,490,071 2,480,4363.500%, 11/20/46 . . . . . . . . . . . . . . . . . . . . . . . . . . . . 14,941,137 14,870,7233.500%, TBA (a) . . . . . . . . . . . . . . . . . . . . . . . . . . . . . . 21,080,496 20,961,5074.000%, 04/20/39 . . . . . . . . . . . . . . . . . . . . . . . . . . . . 49,153 50,4394.000%, 07/20/39 . . . . . . . . . . . . . . . . . . . . . . . . . . . . 363,111 372,5654.000%, 09/20/40 . . . . . . . . . . . . . . . . . . . . . . . . . . . . 99,306 101,9054.000%, 10/20/40 . . . . . . . . . . . . . . . . . . . . . . . . . . . . 1,108,276 1,137,2864.000%, 11/20/40 . . . . . . . . . . . . . . . . . . . . . . . . . . . . 618,560 634,7364.000%, 12/20/40 . . . . . . . . . . . . . . . . . . . . . . . . . . . . 2,322,545 2,383,3614.000%, 01/20/41 . . . . . . . . . . . . . . . . . . . . . . . . . . . . 2,035,905 2,089,2344.000%, 02/20/41 . . . . . . . . . . . . . . . . . . . . . . . . . . . . 36,171 37,1184.000%, 07/20/43 . . . . . . . . . . . . . . . . . . . . . . . . . . . . 192,593 197,5654.000%, 08/20/44 . . . . . . . . . . . . . . . . . . . . . . . . . . . . 782,622 802,0934.000%, 10/20/46 . . . . . . . . . . . . . . . . . . . . . . . . . . . . 192,274 196,2504.000%, TBA (a) . . . . . . . . . . . . . . . . . . . . . . . . . . . . . . 83,229,500 84,526,8194.500%, 12/20/39 . . . . . . . . . . . . . . . . . . . . . . . . . . . . 82,744 86,7514.500%, 01/20/40 . . . . . . . . . . . . . . . . . . . . . . . . . . . . 103,002 107,9834.500%, 02/20/40 . . . . . . . . . . . . . . . . . . . . . . . . . . . . 80,831 84,7374.500%, 05/20/40 . . . . . . . . . . . . . . . . . . . . . . . . . . . . 5,526 5,7934.500%, 09/20/48 . . . . . . . . . . . . . . . . . . . . . . . . . . . . 920,656 959,2984.500%, TBA (a) . . . . . . . . . . . . . . . . . . . . . . . . . . . . . . 18,087,500 18,695,1285.000%, 10/20/33 . . . . . . . . . . . . . . . . . . . . . . . . . . . . 864,559 929,5995.000%, 10/20/39 . . . . . . . . . . . . . . . . . . . . . . . . . . . . 291,273 311,057
Security DescriptionPrincipalAmount* Value
Agency Sponsored Mortgage - Backed—(Continued)Ginnie Mae II 30 Yr. Pool
5.000%, 07/20/42 . . . . . . . . . . . . . . . . . . . . . . . . . . . . 382,317 $ 405,3985.000%, TBA (a) . . . . . . . . . . . . . . . . . . . . . . . . . . . . . . 6,065,000 6,331,291
Government National Mortgage Association (CMO)0.582%, 06/16/53 (c) (d) . . . . . . . . . . . . . . . . . . . . . . . 1,319,974 32,3280.675%, 02/16/50 (c) (d) . . . . . . . . . . . . . . . . . . . . . . . 1,859,938 83,2260.727%, 03/16/55 (c) (d) . . . . . . . . . . . . . . . . . . . . . . . 3,487,298 183,0110.750%, 11/16/53 (c) (d) . . . . . . . . . . . . . . . . . . . . . . . 1,070,836 37,8260.773%, 05/16/59 (c) (d) . . . . . . . . . . . . . . . . . . . . . . . 2,162,345 141,1650.790%, 09/16/51 (c) (d) . . . . . . . . . . . . . . . . . . . . . . . 21,117,301 1,102,4730.808%, 05/16/59 (c) (d) . . . . . . . . . . . . . . . . . . . . . . . 3,078,437 203,9630.825%, 08/16/41 (d) . . . . . . . . . . . . . . . . . . . . . . . . . 3,138,863 46,0410.891%, 09/16/55 (c) (d) . . . . . . . . . . . . . . . . . . . . . . . 2,181,662 142,4970.892%, 11/16/55 (c) (d) . . . . . . . . . . . . . . . . . . . . . . . 3,407,155 209,7110.908%, 06/16/58 (c) (d) . . . . . . . . . . . . . . . . . . . . . . . 2,713,683 199,9370.926%, 08/15/58 (c) (d) . . . . . . . . . . . . . . . . . . . . . . . 6,873,417 516,5390.952%, 09/16/56 (c) (d) . . . . . . . . . . . . . . . . . . . . . . . 1,366,688 107,1580.965%, 02/16/58 (c) (d) . . . . . . . . . . . . . . . . . . . . . . . 5,323,593 366,2730.997%, 09/16/58 (c) (d) . . . . . . . . . . . . . . . . . . . . . . . 2,006,739 160,8571.000%, 02/16/39 (d) . . . . . . . . . . . . . . . . . . . . . . . . . 2,642,543 28,0251.003%, 08/16/58 (c) (d) . . . . . . . . . . . . . . . . . . . . . . . 3,811,389 290,1221.033%, 05/16/58 (c) (d) . . . . . . . . . . . . . . . . . . . . . . . 2,597,574 204,1551.062%, 12/16/57 (c) (d) . . . . . . . . . . . . . . . . . . . . . . . 3,752,268 292,3671.125%, 04/16/58 (c) (d) . . . . . . . . . . . . . . . . . . . . . . . 4,896,652 399,6432.000%, 03/16/35 . . . . . . . . . . . . . . . . . . . . . . . . . . . . 201,806 175,3262.250%, 12/16/38 . . . . . . . . . . . . . . . . . . . . . . . . . . . . 317,640 289,924
1,259,121,937
U.S. Treasury—9.4%U.S. Treasury Bonds
2.875%, 05/15/43 . . . . . . . . . . . . . . . . . . . . . . . . . . . . 8,084,000 7,640,6432.875%, 11/15/46 . . . . . . . . . . . . . . . . . . . . . . . . . . . . 2,181,000 2,050,3103.000%, 02/15/47 . . . . . . . . . . . . . . . . . . . . . . . . . . . . 1,447,000 1,393,6983.000%, 08/15/48 (e) . . . . . . . . . . . . . . . . . . . . . . . . . 15,110,000 14,533,3413.125%, 02/15/43 (e) . . . . . . . . . . . . . . . . . . . . . . . . . 7,953,000 7,854,8303.625%, 08/15/43 . . . . . . . . . . . . . . . . . . . . . . . . . . . . 7,590,000 8,140,5713.750%, 11/15/43 (e) . . . . . . . . . . . . . . . . . . . . . . . . . 8,055,000 8,817,0794.250%, 05/15/39 . . . . . . . . . . . . . . . . . . . . . . . . . . . . 2,095,000 2,442,3944.375%, 11/15/39 . . . . . . . . . . . . . . . . . . . . . . . . . . . . 2,042,000 2,422,3234.500%, 08/15/39 . . . . . . . . . . . . . . . . . . . . . . . . . . . . 2,035,000 2,451,062
U.S. Treasury Notes1.000%, 10/15/19 . . . . . . . . . . . . . . . . . . . . . . . . . . . . 20,393,000 20,046,4781.125%, 06/30/21 . . . . . . . . . . . . . . . . . . . . . . . . . . . . 14,275,000 13,620,3571.250%, 08/31/19 . . . . . . . . . . . . . . . . . . . . . . . . . . . . 20,393,000 20,139,6811.625%, 06/30/20 . . . . . . . . . . . . . . . . . . . . . . . . . . . . 12,746,000 12,491,0801.625%, 07/31/20 . . . . . . . . . . . . . . . . . . . . . . . . . . . . 12,746,000 12,477,1391.625%, 10/31/23 . . . . . . . . . . . . . . . . . . . . . . . . . . . . 11,216,000 10,516,3141.875%, 04/30/22 . . . . . . . . . . . . . . . . . . . . . . . . . . . . 14,275,000 13,774,2602.000%, 04/30/24 . . . . . . . . . . . . . . . . . . . . . . . . . . . . 12,236,000 11,626,1122.000%, 05/31/24 . . . . . . . . . . . . . . . . . . . . . . . . . . . . 12,236,000 11,616,5522.000%, 08/15/25 . . . . . . . . . . . . . . . . . . . . . . . . . . . . 5,098,000 4,777,9812.000%, 11/15/26 . . . . . . . . . . . . . . . . . . . . . . . . . . . . 8,440,000 7,810,6272.125%, 09/30/21 . . . . . . . . . . . . . . . . . . . . . . . . . . . . 14,275,000 13,964,4072.250%, 07/31/21 . . . . . . . . . . . . . . . . . . . . . . . . . . . . 14,275,000 14,030,7642.250%, 01/31/24 . . . . . . . . . . . . . . . . . . . . . . . . . . . . 11,216,000 10,821,688
BHFTII-10

Brighthouse Funds Trust II
BlackRock Bond Income Portfolio
Schedule of Investments as of September 30, 2018 (Unaudited)
U.S. Treasury & Government Agencies—(Continued)
Security DescriptionPrincipalAmount* Value
U.S. Treasury—(Continued)U.S. Treasury Notes
2.250%, 11/15/25 . . . . . . . . . . . . . . . . . . . . . . . . . . . . 5,098,000 $ 4,846,2862.250%, 02/15/27 (e) . . . . . . . . . . . . . . . . . . . . . . . . . 8,263,000 7,779,1632.625%, 08/31/20 . . . . . . . . . . . . . . . . . . . . . . . . . . . . 27,790,000 27,691,2152.625%, 05/15/21 . . . . . . . . . . . . . . . . . . . . . . . . . . . . 23,914,000 23,766,4062.750%, 08/31/23 . . . . . . . . . . . . . . . . . . . . . . . . . . . . 27,100,000 26,864,9922.750%, 08/31/25 . . . . . . . . . . . . . . . . . . . . . . . . . . . . 11,460,000 11,272,4322.875%, 08/15/28 . . . . . . . . . . . . . . . . . . . . . . . . . . . . 9,650,000 9,503,742
347,183,927
Total U.S. Treasury & Government Agencies(Cost $1,639,825,971) . . . . . . . . . . . . . . . . . . . . . . . . . 1,606,305,864
Corporate Bonds & Notes—29.4%
Advertising—0.0%ACE03 MH1 B2
Zero Coupon, 08/15/30 . . . . . . . . . . . . . . . . . . . . . . . . . 676,840 517,695Interpublic Group of Cos., Inc. (The)
3.500%, 10/01/20 . . . . . . . . . . . . . . . . . . . . . . . . . . . . 495,000 495,0243.750%, 10/01/21 . . . . . . . . . . . . . . . . . . . . . . . . . . . . 265,000 265,515
1,278,234
Aerospace/Defense—1.0%BAE Systems Holdings, Inc.
2.850%, 12/15/20 (144A) . . . . . . . . . . . . . . . . . . . . . . . 699,000 689,6524.750%, 10/07/44 (144A) . . . . . . . . . . . . . . . . . . . . . . . 132,000 133,960
General Dynamics Corp.3.750%, 05/15/28 . . . . . . . . . . . . . . . . . . . . . . . . . . . . 2,965,000 2,974,914
Harris Corp.2.700%, 04/27/20 . . . . . . . . . . . . . . . . . . . . . . . . . . . . 706,000 698,9964.400%, 06/15/28 . . . . . . . . . . . . . . . . . . . . . . . . . . . . 2,865,000 2,873,6615.054%, 04/27/45 . . . . . . . . . . . . . . . . . . . . . . . . . . . . 1,115,000 1,171,461
L3 Technologies, Inc.3.850%, 06/15/23 . . . . . . . . . . . . . . . . . . . . . . . . . . . . 1,745,000 1,748,9283.850%, 12/15/26 . . . . . . . . . . . . . . . . . . . . . . . . . . . . 1,885,000 1,812,4514.400%, 06/15/28 . . . . . . . . . . . . . . . . . . . . . . . . . . . . 340,000 338,819
Lockheed Martin Corp.2.900%, 03/01/25 . . . . . . . . . . . . . . . . . . . . . . . . . . . . 670,000 640,2753.550%, 01/15/26 . . . . . . . . . . . . . . . . . . . . . . . . . . . . 815,000 804,2833.600%, 03/01/35 . . . . . . . . . . . . . . . . . . . . . . . . . . . . 2,306,000 2,153,9853.800%, 03/01/45 . . . . . . . . . . . . . . . . . . . . . . . . . . . . 675,000 630,6364.070%, 12/15/42 . . . . . . . . . . . . . . . . . . . . . . . . . . . . 1,160,000 1,125,9454.090%, 09/15/52 . . . . . . . . . . . . . . . . . . . . . . . . . . . . 594,000 564,3844.700%, 05/15/46 . . . . . . . . . . . . . . . . . . . . . . . . . . . . 2,005,000 2,134,067
Northrop Grumman Corp.2.550%, 10/15/22 . . . . . . . . . . . . . . . . . . . . . . . . . . . . 1,850,000 1,782,2302.930%, 01/15/25 . . . . . . . . . . . . . . . . . . . . . . . . . . . . 3,065,000 2,909,4793.250%, 01/15/28 . . . . . . . . . . . . . . . . . . . . . . . . . . . . 3,106,000 2,920,6723.850%, 04/15/45 . . . . . . . . . . . . . . . . . . . . . . . . . . . . 690,000 625,9664.030%, 10/15/47 . . . . . . . . . . . . . . . . . . . . . . . . . . . . 1,180,000 1,104,409
Raytheon Co.7.200%, 08/15/27 . . . . . . . . . . . . . . . . . . . . . . . . . . . . 530,000 661,364
United Technologies Corp.4.050%, 05/04/47 (b) . . . . . . . . . . . . . . . . . . . . . . . . . 2,095,000 1,911,5344.125%, 11/16/28 . . . . . . . . . . . . . . . . . . . . . . . . . . . . 4,730,000 4,698,176
Security DescriptionPrincipalAmount* Value
Aerospace/Defense—(Continued)United Technologies Corp.
4.150%, 05/15/45 . . . . . . . . . . . . . . . . . . . . . . . . . . . . 696,000 $ 646,2194.625%, 11/16/48 (b) . . . . . . . . . . . . . . . . . . . . . . . . . 830,000 830,053
38,586,519
Agriculture—0.2%BAT Capital Corp.
3.222%, 08/15/24 (144A) . . . . . . . . . . . . . . . . . . . . . . . 1,580,000 1,505,5464.540%, 08/15/47 (144A) . . . . . . . . . . . . . . . . . . . . . . . 1,818,000 1,663,552
Reynolds American, Inc.4.450%, 06/12/25 . . . . . . . . . . . . . . . . . . . . . . . . . . . . 5,615,000 5,654,041
8,823,139
Airlines—0.5%American Airlines Group, Inc.
4.625%, 03/01/20 (144A) . . . . . . . . . . . . . . . . . . . . . . . 2,214,000 2,219,535American Airlines Pass-Through Trust
3.375%, 05/01/27 . . . . . . . . . . . . . . . . . . . . . . . . . . . . 2,459,364 2,367,1384.400%, 09/22/23 . . . . . . . . . . . . . . . . . . . . . . . . . . . . 782,690 780,655
Avianca Holdings S.A. / Avianca Leasing LLC / Grupo TacaHoldings, Ltd.8.375%, 05/10/20 . . . . . . . . . . . . . . . . . . . . . . . . . . . . 481,000 481,000
Delta Air Lines, Inc.2.600%, 12/04/20 . . . . . . . . . . . . . . . . . . . . . . . . . . . . 3,005,000 2,939,2102.875%, 03/13/20 . . . . . . . . . . . . . . . . . . . . . . . . . . . . 8,220,000 8,153,0113.400%, 04/19/21 . . . . . . . . . . . . . . . . . . . . . . . . . . . . 265,000 263,341
Gol Finance, Inc.7.000%, 01/31/25 (144A) (b) . . . . . . . . . . . . . . . . . . . . 1,274,000 1,028,755
Turkish Airlines Pass-Through Trust4.200%, 03/15/27 (144A) . . . . . . . . . . . . . . . . . . . . . . . 1,058,805 958,218
United Airlines Pass-Through Trust4.600%, 03/01/26 . . . . . . . . . . . . . . . . . . . . . . . . . . . . 595,000 593,8434.750%, 04/11/22 . . . . . . . . . . . . . . . . . . . . . . . . . . . . 303,683 304,442
20,089,148
Auto Manufacturers—1.6%Daimler Finance North America LLC
2.300%, 02/12/21 (144A) . . . . . . . . . . . . . . . . . . . . . . . 1,015,000 988,4773.100%, 05/04/20 (144A) . . . . . . . . . . . . . . . . . . . . . . . 3,130,000 3,120,4613.350%, 05/04/21 (144A) . . . . . . . . . . . . . . . . . . . . . . . 3,770,000 3,754,507
Ford Motor Credit Co. LLC2.979%, 08/03/22 . . . . . . . . . . . . . . . . . . . . . . . . . . . . 2,125,000 2,015,3333.096%, 05/04/23 . . . . . . . . . . . . . . . . . . . . . . . . . . . . 1,930,000 1,809,9423.157%, 08/04/20 . . . . . . . . . . . . . . . . . . . . . . . . . . . . 500,000 495,1323.200%, 01/15/21 . . . . . . . . . . . . . . . . . . . . . . . . . . . . 1,310,000 1,290,5083.219%, 01/09/22 . . . . . . . . . . . . . . . . . . . . . . . . . . . . 9,970,000 9,642,3773.336%, 03/18/21 . . . . . . . . . . . . . . . . . . . . . . . . . . . . 205,000 202,0895.750%, 02/01/21 (b) . . . . . . . . . . . . . . . . . . . . . . . . . 2,714,000 2,821,4245.875%, 08/02/21 . . . . . . . . . . . . . . . . . . . . . . . . . . . . 670,000 700,683
General Motors Co.5.400%, 04/01/48 (b) . . . . . . . . . . . . . . . . . . . . . . . . . 300,000 279,6176.250%, 10/02/43 . . . . . . . . . . . . . . . . . . . . . . . . . . . . 250,000 256,0406.750%, 04/01/46 . . . . . . . . . . . . . . . . . . . . . . . . . . . . 370,000 399,976
BHFTII-11
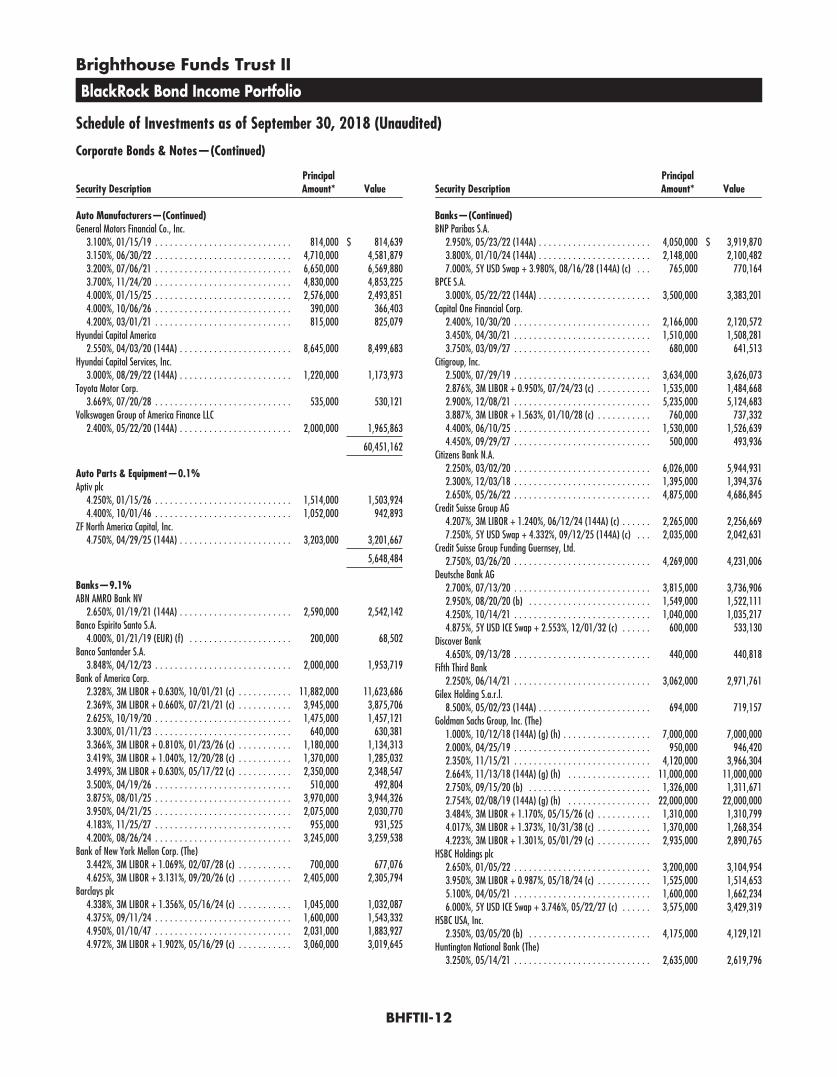
Brighthouse Funds Trust II
BlackRock Bond Income Portfolio
Schedule of Investments as of September 30, 2018 (Unaudited)
Corporate Bonds & Notes—(Continued)
Security DescriptionPrincipalAmount* Value
Auto Manufacturers—(Continued)General Motors Financial Co., Inc.
3.100%, 01/15/19 . . . . . . . . . . . . . . . . . . . . . . . . . . . . 814,000 $ 814,6393.150%, 06/30/22 . . . . . . . . . . . . . . . . . . . . . . . . . . . . 4,710,000 4,581,8793.200%, 07/06/21 . . . . . . . . . . . . . . . . . . . . . . . . . . . . 6,650,000 6,569,8803.700%, 11/24/20 . . . . . . . . . . . . . . . . . . . . . . . . . . . . 4,830,000 4,853,2254.000%, 01/15/25 . . . . . . . . . . . . . . . . . . . . . . . . . . . . 2,576,000 2,493,8514.000%, 10/06/26 . . . . . . . . . . . . . . . . . . . . . . . . . . . . 390,000 366,4034.200%, 03/01/21 . . . . . . . . . . . . . . . . . . . . . . . . . . . . 815,000 825,079
Hyundai Capital America2.550%, 04/03/20 (144A) . . . . . . . . . . . . . . . . . . . . . . . 8,645,000 8,499,683
Hyundai Capital Services, Inc.3.000%, 08/29/22 (144A) . . . . . . . . . . . . . . . . . . . . . . . 1,220,000 1,173,973
Toyota Motor Corp.3.669%, 07/20/28 . . . . . . . . . . . . . . . . . . . . . . . . . . . . 535,000 530,121
Volkswagen Group of America Finance LLC2.400%, 05/22/20 (144A) . . . . . . . . . . . . . . . . . . . . . . . 2,000,000 1,965,863
60,451,162
Auto Parts & Equipment—0.1%Aptiv plc
4.250%, 01/15/26 . . . . . . . . . . . . . . . . . . . . . . . . . . . . 1,514,000 1,503,9244.400%, 10/01/46 . . . . . . . . . . . . . . . . . . . . . . . . . . . . 1,052,000 942,893
ZF North America Capital, Inc.4.750%, 04/29/25 (144A) . . . . . . . . . . . . . . . . . . . . . . . 3,203,000 3,201,667
5,648,484
Banks—9.1%ABN AMRO Bank NV
2.650%, 01/19/21 (144A) . . . . . . . . . . . . . . . . . . . . . . . 2,590,000 2,542,142Banco Espirito Santo S.A.
4.000%, 01/21/19 (EUR) (f) . . . . . . . . . . . . . . . . . . . . . 200,000 68,502Banco Santander S.A.
3.848%, 04/12/23 . . . . . . . . . . . . . . . . . . . . . . . . . . . . 2,000,000 1,953,719Bank of America Corp.
2.328%, 3M LIBOR + 0.630%, 10/01/21 (c) . . . . . . . . . . . 11,882,000 11,623,6862.369%, 3M LIBOR + 0.660%, 07/21/21 (c) . . . . . . . . . . . 3,945,000 3,875,7062.625%, 10/19/20 . . . . . . . . . . . . . . . . . . . . . . . . . . . . 1,475,000 1,457,1213.300%, 01/11/23 . . . . . . . . . . . . . . . . . . . . . . . . . . . . 640,000 630,3813.366%, 3M LIBOR + 0.810%, 01/23/26 (c) . . . . . . . . . . . 1,180,000 1,134,3133.419%, 3M LIBOR + 1.040%, 12/20/28 (c) . . . . . . . . . . . 1,370,000 1,285,0323.499%, 3M LIBOR + 0.630%, 05/17/22 (c) . . . . . . . . . . . 2,350,000 2,348,5473.500%, 04/19/26 . . . . . . . . . . . . . . . . . . . . . . . . . . . . 510,000 492,8043.875%, 08/01/25 . . . . . . . . . . . . . . . . . . . . . . . . . . . . 3,970,000 3,944,3263.950%, 04/21/25 . . . . . . . . . . . . . . . . . . . . . . . . . . . . 2,075,000 2,030,7704.183%, 11/25/27 . . . . . . . . . . . . . . . . . . . . . . . . . . . . 955,000 931,5254.200%, 08/26/24 . . . . . . . . . . . . . . . . . . . . . . . . . . . . 3,245,000 3,259,538
Bank of New York Mellon Corp. (The)3.442%, 3M LIBOR + 1.069%, 02/07/28 (c) . . . . . . . . . . . 700,000 677,0764.625%, 3M LIBOR + 3.131%, 09/20/26 (c) . . . . . . . . . . . 2,405,000 2,305,794
Barclays plc4.338%, 3M LIBOR + 1.356%, 05/16/24 (c) . . . . . . . . . . . 1,045,000 1,032,0874.375%, 09/11/24 . . . . . . . . . . . . . . . . . . . . . . . . . . . . 1,600,000 1,543,3324.950%, 01/10/47 . . . . . . . . . . . . . . . . . . . . . . . . . . . . 2,031,000 1,883,9274.972%, 3M LIBOR + 1.902%, 05/16/29 (c) . . . . . . . . . . . 3,060,000 3,019,645
Security DescriptionPrincipalAmount* Value
Banks—(Continued)BNP Paribas S.A.
2.950%, 05/23/22 (144A) . . . . . . . . . . . . . . . . . . . . . . . 4,050,000 $ 3,919,8703.800%, 01/10/24 (144A) . . . . . . . . . . . . . . . . . . . . . . . 2,148,000 2,100,4827.000%, 5Y USD Swap + 3.980%, 08/16/28 (144A) (c) . . . 765,000 770,164
BPCE S.A.3.000%, 05/22/22 (144A) . . . . . . . . . . . . . . . . . . . . . . . 3,500,000 3,383,201
Capital One Financial Corp.2.400%, 10/30/20 . . . . . . . . . . . . . . . . . . . . . . . . . . . . 2,166,000 2,120,5723.450%, 04/30/21 . . . . . . . . . . . . . . . . . . . . . . . . . . . . 1,510,000 1,508,2813.750%, 03/09/27 . . . . . . . . . . . . . . . . . . . . . . . . . . . . 680,000 641,513
Citigroup, Inc.2.500%, 07/29/19 . . . . . . . . . . . . . . . . . . . . . . . . . . . . 3,634,000 3,626,0732.876%, 3M LIBOR + 0.950%, 07/24/23 (c) . . . . . . . . . . . 1,535,000 1,484,6682.900%, 12/08/21 . . . . . . . . . . . . . . . . . . . . . . . . . . . . 5,235,000 5,124,6833.887%, 3M LIBOR + 1.563%, 01/10/28 (c) . . . . . . . . . . . 760,000 737,3324.400%, 06/10/25 . . . . . . . . . . . . . . . . . . . . . . . . . . . . 1,530,000 1,526,6394.450%, 09/29/27 . . . . . . . . . . . . . . . . . . . . . . . . . . . . 500,000 493,936
Citizens Bank N.A.2.250%, 03/02/20 . . . . . . . . . . . . . . . . . . . . . . . . . . . . 6,026,000 5,944,9312.300%, 12/03/18 . . . . . . . . . . . . . . . . . . . . . . . . . . . . 1,395,000 1,394,3762.650%, 05/26/22 . . . . . . . . . . . . . . . . . . . . . . . . . . . . 4,875,000 4,686,845
Credit Suisse Group AG4.207%, 3M LIBOR + 1.240%, 06/12/24 (144A) (c) . . . . . . 2,265,000 2,256,6697.250%, 5Y USD Swap + 4.332%, 09/12/25 (144A) (c) . . . 2,035,000 2,042,631
Credit Suisse Group Funding Guernsey, Ltd.2.750%, 03/26/20 . . . . . . . . . . . . . . . . . . . . . . . . . . . . 4,269,000 4,231,006
Deutsche Bank AG2.700%, 07/13/20 . . . . . . . . . . . . . . . . . . . . . . . . . . . . 3,815,000 3,736,9062.950%, 08/20/20 (b) . . . . . . . . . . . . . . . . . . . . . . . . . 1,549,000 1,522,1114.250%, 10/14/21 . . . . . . . . . . . . . . . . . . . . . . . . . . . . 1,040,000 1,035,2174.875%, 5Y USD ICE Swap + 2.553%, 12/01/32 (c) . . . . . . 600,000 533,130
Discover Bank4.650%, 09/13/28 . . . . . . . . . . . . . . . . . . . . . . . . . . . . 440,000 440,818
Fifth Third Bank2.250%, 06/14/21 . . . . . . . . . . . . . . . . . . . . . . . . . . . . 3,062,000 2,971,761
Gilex Holding S.a.r.l.8.500%, 05/02/23 (144A) . . . . . . . . . . . . . . . . . . . . . . . 694,000 719,157
Goldman Sachs Group, Inc. (The)1.000%, 10/12/18 (144A) (g) (h) . . . . . . . . . . . . . . . . . . 7,000,000 7,000,0002.000%, 04/25/19 . . . . . . . . . . . . . . . . . . . . . . . . . . . . 950,000 946,4202.350%, 11/15/21 . . . . . . . . . . . . . . . . . . . . . . . . . . . . 4,120,000 3,966,3042.664%, 11/13/18 (144A) (g) (h) . . . . . . . . . . . . . . . . . 11,000,000 11,000,0002.750%, 09/15/20 (b) . . . . . . . . . . . . . . . . . . . . . . . . . 1,326,000 1,311,6712.754%, 02/08/19 (144A) (g) (h) . . . . . . . . . . . . . . . . . 22,000,000 22,000,0003.484%, 3M LIBOR + 1.170%, 05/15/26 (c) . . . . . . . . . . . 1,310,000 1,310,7994.017%, 3M LIBOR + 1.373%, 10/31/38 (c) . . . . . . . . . . . 1,370,000 1,268,3544.223%, 3M LIBOR + 1.301%, 05/01/29 (c) . . . . . . . . . . . 2,935,000 2,890,765
HSBC Holdings plc2.650%, 01/05/22 . . . . . . . . . . . . . . . . . . . . . . . . . . . . 3,200,000 3,104,9543.950%, 3M LIBOR + 0.987%, 05/18/24 (c) . . . . . . . . . . . 1,525,000 1,514,6535.100%, 04/05/21 . . . . . . . . . . . . . . . . . . . . . . . . . . . . 1,600,000 1,662,2346.000%, 5Y USD ICE Swap + 3.746%, 05/22/27 (c) . . . . . . 3,575,000 3,429,319
HSBC USA, Inc.2.350%, 03/05/20 (b) . . . . . . . . . . . . . . . . . . . . . . . . . 4,175,000 4,129,121
Huntington National Bank (The)3.250%, 05/14/21 . . . . . . . . . . . . . . . . . . . . . . . . . . . . 2,635,000 2,619,796
BHFTII-12
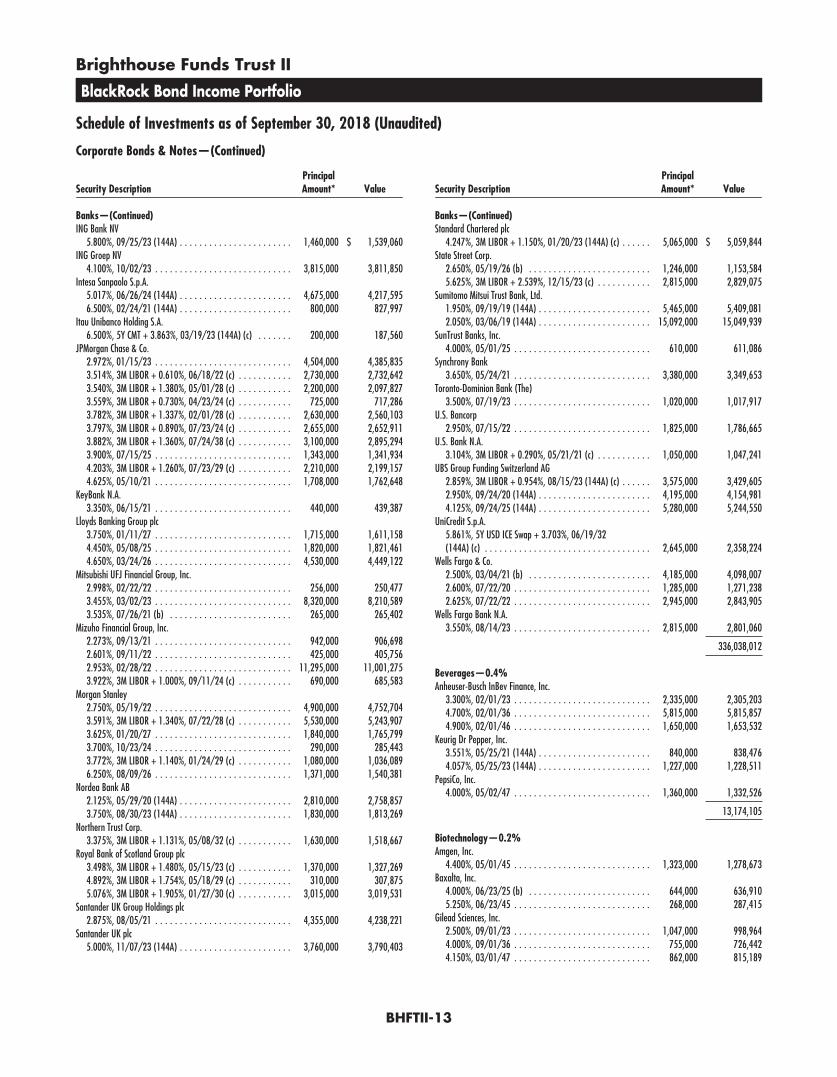
Brighthouse Funds Trust II
BlackRock Bond Income Portfolio
Schedule of Investments as of September 30, 2018 (Unaudited)
Corporate Bonds & Notes—(Continued)
Security DescriptionPrincipalAmount* Value
Banks—(Continued)ING Bank NV
5.800%, 09/25/23 (144A) . . . . . . . . . . . . . . . . . . . . . . . 1,460,000 $ 1,539,060ING Groep NV
4.100%, 10/02/23 . . . . . . . . . . . . . . . . . . . . . . . . . . . . 3,815,000 3,811,850Intesa Sanpaolo S.p.A.
5.017%, 06/26/24 (144A) . . . . . . . . . . . . . . . . . . . . . . . 4,675,000 4,217,5956.500%, 02/24/21 (144A) . . . . . . . . . . . . . . . . . . . . . . . 800,000 827,997
Itau Unibanco Holding S.A.6.500%, 5Y CMT + 3.863%, 03/19/23 (144A) (c) . . . . . . . 200,000 187,560
JPMorgan Chase & Co.2.972%, 01/15/23 . . . . . . . . . . . . . . . . . . . . . . . . . . . . 4,504,000 4,385,8353.514%, 3M LIBOR + 0.610%, 06/18/22 (c) . . . . . . . . . . . 2,730,000 2,732,6423.540%, 3M LIBOR + 1.380%, 05/01/28 (c) . . . . . . . . . . . 2,200,000 2,097,8273.559%, 3M LIBOR + 0.730%, 04/23/24 (c) . . . . . . . . . . . 725,000 717,2863.782%, 3M LIBOR + 1.337%, 02/01/28 (c) . . . . . . . . . . . 2,630,000 2,560,1033.797%, 3M LIBOR + 0.890%, 07/23/24 (c) . . . . . . . . . . . 2,655,000 2,652,9113.882%, 3M LIBOR + 1.360%, 07/24/38 (c) . . . . . . . . . . . 3,100,000 2,895,2943.900%, 07/15/25 . . . . . . . . . . . . . . . . . . . . . . . . . . . . 1,343,000 1,341,9344.203%, 3M LIBOR + 1.260%, 07/23/29 (c) . . . . . . . . . . . 2,210,000 2,199,1574.625%, 05/10/21 . . . . . . . . . . . . . . . . . . . . . . . . . . . . 1,708,000 1,762,648
KeyBank N.A.3.350%, 06/15/21 . . . . . . . . . . . . . . . . . . . . . . . . . . . . 440,000 439,387
Lloyds Banking Group plc3.750%, 01/11/27 . . . . . . . . . . . . . . . . . . . . . . . . . . . . 1,715,000 1,611,1584.450%, 05/08/25 . . . . . . . . . . . . . . . . . . . . . . . . . . . . 1,820,000 1,821,4614.650%, 03/24/26 . . . . . . . . . . . . . . . . . . . . . . . . . . . . 4,530,000 4,449,122
Mitsubishi UFJ Financial Group, Inc.2.998%, 02/22/22 . . . . . . . . . . . . . . . . . . . . . . . . . . . . 256,000 250,4773.455%, 03/02/23 . . . . . . . . . . . . . . . . . . . . . . . . . . . . 8,320,000 8,210,5893.535%, 07/26/21 (b) . . . . . . . . . . . . . . . . . . . . . . . . . 265,000 265,402
Mizuho Financial Group, Inc.2.273%, 09/13/21 . . . . . . . . . . . . . . . . . . . . . . . . . . . . 942,000 906,6982.601%, 09/11/22 . . . . . . . . . . . . . . . . . . . . . . . . . . . . 425,000 405,7562.953%, 02/28/22 . . . . . . . . . . . . . . . . . . . . . . . . . . . . 11,295,000 11,001,2753.922%, 3M LIBOR + 1.000%, 09/11/24 (c) . . . . . . . . . . . 690,000 685,583
Morgan Stanley2.750%, 05/19/22 . . . . . . . . . . . . . . . . . . . . . . . . . . . . 4,900,000 4,752,7043.591%, 3M LIBOR + 1.340%, 07/22/28 (c) . . . . . . . . . . . 5,530,000 5,243,9073.625%, 01/20/27 . . . . . . . . . . . . . . . . . . . . . . . . . . . . 1,840,000 1,765,7993.700%, 10/23/24 . . . . . . . . . . . . . . . . . . . . . . . . . . . . 290,000 285,4433.772%, 3M LIBOR + 1.140%, 01/24/29 (c) . . . . . . . . . . . 1,080,000 1,036,0896.250%, 08/09/26 . . . . . . . . . . . . . . . . . . . . . . . . . . . . 1,371,000 1,540,381
Nordea Bank AB2.125%, 05/29/20 (144A) . . . . . . . . . . . . . . . . . . . . . . . 2,810,000 2,758,8573.750%, 08/30/23 (144A) . . . . . . . . . . . . . . . . . . . . . . . 1,830,000 1,813,269
Northern Trust Corp.3.375%, 3M LIBOR + 1.131%, 05/08/32 (c) . . . . . . . . . . . 1,630,000 1,518,667
Royal Bank of Scotland Group plc3.498%, 3M LIBOR + 1.480%, 05/15/23 (c) . . . . . . . . . . . 1,370,000 1,327,2694.892%, 3M LIBOR + 1.754%, 05/18/29 (c) . . . . . . . . . . . 310,000 307,8755.076%, 3M LIBOR + 1.905%, 01/27/30 (c) . . . . . . . . . . . 3,015,000 3,019,531
Santander UK Group Holdings plc2.875%, 08/05/21 . . . . . . . . . . . . . . . . . . . . . . . . . . . . 4,355,000 4,238,221
Santander UK plc5.000%, 11/07/23 (144A) . . . . . . . . . . . . . . . . . . . . . . . 3,760,000 3,790,403
Security DescriptionPrincipalAmount* Value
Banks—(Continued)Standard Chartered plc
4.247%, 3M LIBOR + 1.150%, 01/20/23 (144A) (c) . . . . . . 5,065,000 $ 5,059,844State Street Corp.
2.650%, 05/19/26 (b) . . . . . . . . . . . . . . . . . . . . . . . . . 1,246,000 1,153,5845.625%, 3M LIBOR + 2.539%, 12/15/23 (c) . . . . . . . . . . . 2,815,000 2,829,075
Sumitomo Mitsui Trust Bank, Ltd.1.950%, 09/19/19 (144A) . . . . . . . . . . . . . . . . . . . . . . . 5,465,000 5,409,0812.050%, 03/06/19 (144A) . . . . . . . . . . . . . . . . . . . . . . . 15,092,000 15,049,939
SunTrust Banks, Inc.4.000%, 05/01/25 . . . . . . . . . . . . . . . . . . . . . . . . . . . . 610,000 611,086
Synchrony Bank3.650%, 05/24/21 . . . . . . . . . . . . . . . . . . . . . . . . . . . . 3,380,000 3,349,653
Toronto-Dominion Bank (The)3.500%, 07/19/23 . . . . . . . . . . . . . . . . . . . . . . . . . . . . 1,020,000 1,017,917
U.S. Bancorp2.950%, 07/15/22 . . . . . . . . . . . . . . . . . . . . . . . . . . . . 1,825,000 1,786,665
U.S. Bank N.A.3.104%, 3M LIBOR + 0.290%, 05/21/21 (c) . . . . . . . . . . . 1,050,000 1,047,241
UBS Group Funding Switzerland AG2.859%, 3M LIBOR + 0.954%, 08/15/23 (144A) (c) . . . . . . 3,575,000 3,429,6052.950%, 09/24/20 (144A) . . . . . . . . . . . . . . . . . . . . . . . 4,195,000 4,154,9814.125%, 09/24/25 (144A) . . . . . . . . . . . . . . . . . . . . . . . 5,280,000 5,244,550
UniCredit S.p.A.5.861%, 5Y USD ICE Swap + 3.703%, 06/19/32(144A) (c) . . . . . . . . . . . . . . . . . . . . . . . . . . . . . . . . . . 2,645,000 2,358,224
Wells Fargo & Co.2.500%, 03/04/21 (b) . . . . . . . . . . . . . . . . . . . . . . . . . 4,185,000 4,098,0072.600%, 07/22/20 . . . . . . . . . . . . . . . . . . . . . . . . . . . . 1,285,000 1,271,2382.625%, 07/22/22 . . . . . . . . . . . . . . . . . . . . . . . . . . . . 2,945,000 2,843,905
Wells Fargo Bank N.A.3.550%, 08/14/23 . . . . . . . . . . . . . . . . . . . . . . . . . . . . 2,815,000 2,801,060
336,038,012
Beverages—0.4%Anheuser-Busch InBev Finance, Inc.
3.300%, 02/01/23 . . . . . . . . . . . . . . . . . . . . . . . . . . . . 2,335,000 2,305,2034.700%, 02/01/36 . . . . . . . . . . . . . . . . . . . . . . . . . . . . 5,815,000 5,815,8574.900%, 02/01/46 . . . . . . . . . . . . . . . . . . . . . . . . . . . . 1,650,000 1,653,532
Keurig Dr Pepper, Inc.3.551%, 05/25/21 (144A) . . . . . . . . . . . . . . . . . . . . . . . 840,000 838,4764.057%, 05/25/23 (144A) . . . . . . . . . . . . . . . . . . . . . . . 1,227,000 1,228,511
PepsiCo, Inc.4.000%, 05/02/47 . . . . . . . . . . . . . . . . . . . . . . . . . . . . 1,360,000 1,332,526
13,174,105
Biotechnology—0.2%Amgen, Inc.
4.400%, 05/01/45 . . . . . . . . . . . . . . . . . . . . . . . . . . . . 1,323,000 1,278,673Baxalta, Inc.
4.000%, 06/23/25 (b) . . . . . . . . . . . . . . . . . . . . . . . . . 644,000 636,9105.250%, 06/23/45 . . . . . . . . . . . . . . . . . . . . . . . . . . . . 268,000 287,415
Gilead Sciences, Inc.2.500%, 09/01/23 . . . . . . . . . . . . . . . . . . . . . . . . . . . . 1,047,000 998,9644.000%, 09/01/36 . . . . . . . . . . . . . . . . . . . . . . . . . . . . 755,000 726,4424.150%, 03/01/47 . . . . . . . . . . . . . . . . . . . . . . . . . . . . 862,000 815,189
BHFTII-13
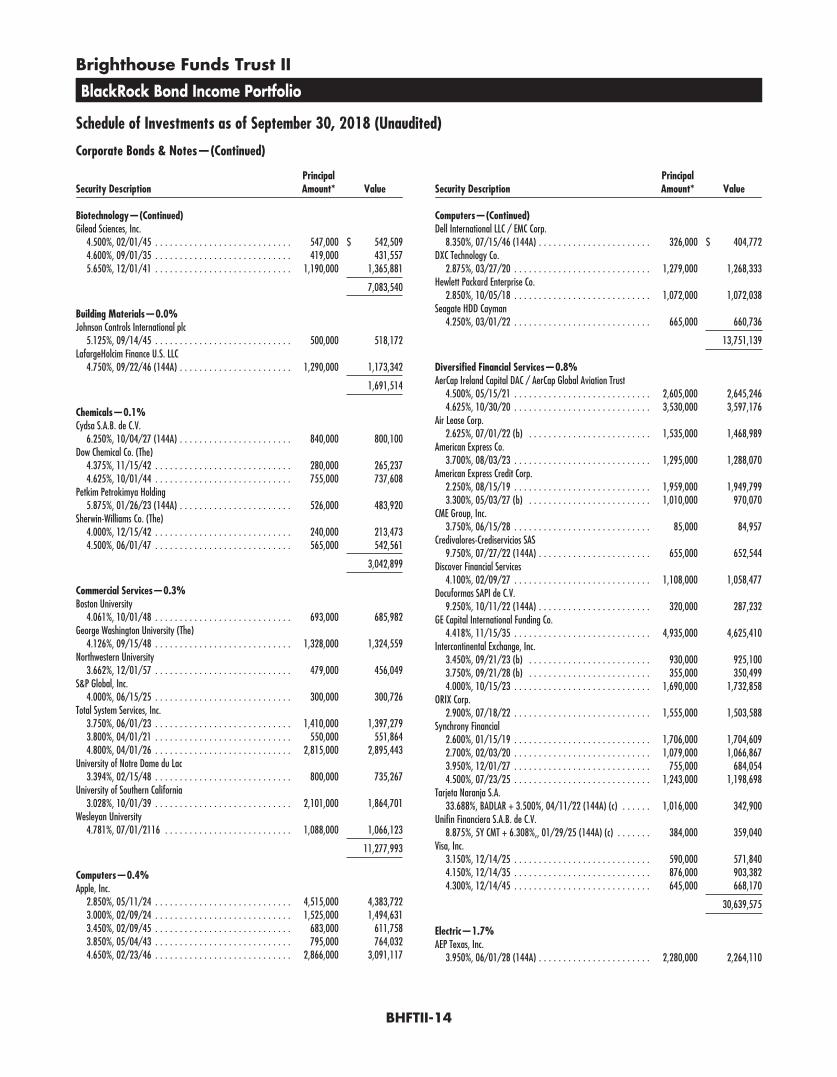
Brighthouse Funds Trust II
BlackRock Bond Income Portfolio
Schedule of Investments as of September 30, 2018 (Unaudited)
Corporate Bonds & Notes—(Continued)
Security DescriptionPrincipalAmount* Value
Biotechnology—(Continued)Gilead Sciences, Inc.
4.500%, 02/01/45 . . . . . . . . . . . . . . . . . . . . . . . . . . . . 547,000 $ 542,5094.600%, 09/01/35 . . . . . . . . . . . . . . . . . . . . . . . . . . . . 419,000 431,5575.650%, 12/01/41 . . . . . . . . . . . . . . . . . . . . . . . . . . . . 1,190,000 1,365,881
7,083,540
Building Materials—0.0%Johnson Controls International plc
5.125%, 09/14/45 . . . . . . . . . . . . . . . . . . . . . . . . . . . . 500,000 518,172LafargeHolcim Finance U.S. LLC
4.750%, 09/22/46 (144A) . . . . . . . . . . . . . . . . . . . . . . . 1,290,000 1,173,342
1,691,514
Chemicals—0.1%Cydsa S.A.B. de C.V.
6.250%, 10/04/27 (144A) . . . . . . . . . . . . . . . . . . . . . . . 840,000 800,100Dow Chemical Co. (The)
4.375%, 11/15/42 . . . . . . . . . . . . . . . . . . . . . . . . . . . . 280,000 265,2374.625%, 10/01/44 . . . . . . . . . . . . . . . . . . . . . . . . . . . . 755,000 737,608
Petkim Petrokimya Holding5.875%, 01/26/23 (144A) . . . . . . . . . . . . . . . . . . . . . . . 526,000 483,920
Sherwin-Williams Co. (The)4.000%, 12/15/42 . . . . . . . . . . . . . . . . . . . . . . . . . . . . 240,000 213,4734.500%, 06/01/47 . . . . . . . . . . . . . . . . . . . . . . . . . . . . 565,000 542,561
3,042,899
Commercial Services—0.3%Boston University
4.061%, 10/01/48 . . . . . . . . . . . . . . . . . . . . . . . . . . . . 693,000 685,982George Washington University (The)
4.126%, 09/15/48 . . . . . . . . . . . . . . . . . . . . . . . . . . . . 1,328,000 1,324,559Northwestern University
3.662%, 12/01/57 . . . . . . . . . . . . . . . . . . . . . . . . . . . . 479,000 456,049S&P Global, Inc.
4.000%, 06/15/25 . . . . . . . . . . . . . . . . . . . . . . . . . . . . 300,000 300,726Total System Services, Inc.
3.750%, 06/01/23 . . . . . . . . . . . . . . . . . . . . . . . . . . . . 1,410,000 1,397,2793.800%, 04/01/21 . . . . . . . . . . . . . . . . . . . . . . . . . . . . 550,000 551,8644.800%, 04/01/26 . . . . . . . . . . . . . . . . . . . . . . . . . . . . 2,815,000 2,895,443
University of Notre Dame du Lac3.394%, 02/15/48 . . . . . . . . . . . . . . . . . . . . . . . . . . . . 800,000 735,267
University of Southern California3.028%, 10/01/39 . . . . . . . . . . . . . . . . . . . . . . . . . . . . 2,101,000 1,864,701
Wesleyan University4.781%, 07/01/2116 . . . . . . . . . . . . . . . . . . . . . . . . . . 1,088,000 1,066,123
11,277,993
Computers—0.4%Apple, Inc.
2.850%, 05/11/24 . . . . . . . . . . . . . . . . . . . . . . . . . . . . 4,515,000 4,383,7223.000%, 02/09/24 . . . . . . . . . . . . . . . . . . . . . . . . . . . . 1,525,000 1,494,6313.450%, 02/09/45 . . . . . . . . . . . . . . . . . . . . . . . . . . . . 683,000 611,7583.850%, 05/04/43 . . . . . . . . . . . . . . . . . . . . . . . . . . . . 795,000 764,0324.650%, 02/23/46 . . . . . . . . . . . . . . . . . . . . . . . . . . . . 2,866,000 3,091,117
Security DescriptionPrincipalAmount* Value
Computers—(Continued)Dell International LLC / EMC Corp.
8.350%, 07/15/46 (144A) . . . . . . . . . . . . . . . . . . . . . . . 326,000 $ 404,772DXC Technology Co.
2.875%, 03/27/20 . . . . . . . . . . . . . . . . . . . . . . . . . . . . 1,279,000 1,268,333Hewlett Packard Enterprise Co.
2.850%, 10/05/18 . . . . . . . . . . . . . . . . . . . . . . . . . . . . 1,072,000 1,072,038Seagate HDD Cayman
4.250%, 03/01/22 . . . . . . . . . . . . . . . . . . . . . . . . . . . . 665,000 660,736
13,751,139
Diversified Financial Services—0.8%AerCap Ireland Capital DAC / AerCap Global Aviation Trust
4.500%, 05/15/21 . . . . . . . . . . . . . . . . . . . . . . . . . . . . 2,605,000 2,645,2464.625%, 10/30/20 . . . . . . . . . . . . . . . . . . . . . . . . . . . . 3,530,000 3,597,176
Air Lease Corp.2.625%, 07/01/22 (b) . . . . . . . . . . . . . . . . . . . . . . . . . 1,535,000 1,468,989
American Express Co.3.700%, 08/03/23 . . . . . . . . . . . . . . . . . . . . . . . . . . . . 1,295,000 1,288,070
American Express Credit Corp.2.250%, 08/15/19 . . . . . . . . . . . . . . . . . . . . . . . . . . . . 1,959,000 1,949,7993.300%, 05/03/27 (b) . . . . . . . . . . . . . . . . . . . . . . . . . 1,010,000 970,070
CME Group, Inc.3.750%, 06/15/28 . . . . . . . . . . . . . . . . . . . . . . . . . . . . 85,000 84,957
Credivalores-Crediservicios SAS9.750%, 07/27/22 (144A) . . . . . . . . . . . . . . . . . . . . . . . 655,000 652,544
Discover Financial Services4.100%, 02/09/27 . . . . . . . . . . . . . . . . . . . . . . . . . . . . 1,108,000 1,058,477
Docuformas SAPI de C.V.9.250%, 10/11/22 (144A) . . . . . . . . . . . . . . . . . . . . . . . 320,000 287,232
GE Capital International Funding Co.4.418%, 11/15/35 . . . . . . . . . . . . . . . . . . . . . . . . . . . . 4,935,000 4,625,410
Intercontinental Exchange, Inc.3.450%, 09/21/23 (b) . . . . . . . . . . . . . . . . . . . . . . . . . 930,000 925,1003.750%, 09/21/28 (b) . . . . . . . . . . . . . . . . . . . . . . . . . 355,000 350,4994.000%, 10/15/23 . . . . . . . . . . . . . . . . . . . . . . . . . . . . 1,690,000 1,732,858
ORIX Corp.2.900%, 07/18/22 . . . . . . . . . . . . . . . . . . . . . . . . . . . . 1,555,000 1,503,588
Synchrony Financial2.600%, 01/15/19 . . . . . . . . . . . . . . . . . . . . . . . . . . . . 1,706,000 1,704,6092.700%, 02/03/20 . . . . . . . . . . . . . . . . . . . . . . . . . . . . 1,079,000 1,066,8673.950%, 12/01/27 . . . . . . . . . . . . . . . . . . . . . . . . . . . . 755,000 684,0544.500%, 07/23/25 . . . . . . . . . . . . . . . . . . . . . . . . . . . . 1,243,000 1,198,698
Tarjeta Naranja S.A.33.688%, BADLAR + 3.500%, 04/11/22 (144A) (c) . . . . . . 1,016,000 342,900
Unifin Financiera S.A.B. de C.V.8.875%, 5Y CMT + 6.308%,, 01/29/25 (144A) (c) . . . . . . . 384,000 359,040
Visa, Inc.3.150%, 12/14/25 . . . . . . . . . . . . . . . . . . . . . . . . . . . . 590,000 571,8404.150%, 12/14/35 . . . . . . . . . . . . . . . . . . . . . . . . . . . . 876,000 903,3824.300%, 12/14/45 . . . . . . . . . . . . . . . . . . . . . . . . . . . . 645,000 668,170
30,639,575
Electric—1.7%AEP Texas, Inc.
3.950%, 06/01/28 (144A) . . . . . . . . . . . . . . . . . . . . . . . 2,280,000 2,264,110
BHFTII-14
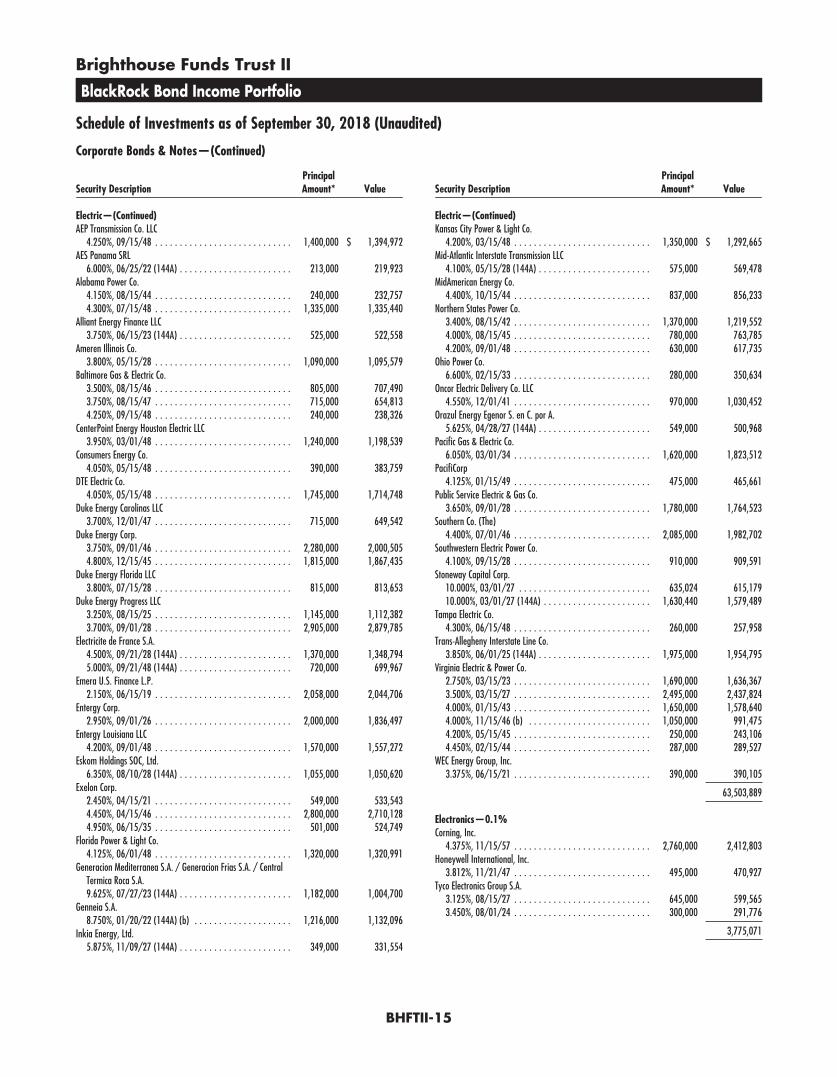
Brighthouse Funds Trust II
BlackRock Bond Income Portfolio
Schedule of Investments as of September 30, 2018 (Unaudited)
Corporate Bonds & Notes—(Continued)
Security DescriptionPrincipalAmount* Value
Electric—(Continued)AEP Transmission Co. LLC
4.250%, 09/15/48 . . . . . . . . . . . . . . . . . . . . . . . . . . . . 1,400,000 $ 1,394,972AES Panama SRL
6.000%, 06/25/22 (144A) . . . . . . . . . . . . . . . . . . . . . . . 213,000 219,923Alabama Power Co.
4.150%, 08/15/44 . . . . . . . . . . . . . . . . . . . . . . . . . . . . 240,000 232,7574.300%, 07/15/48 . . . . . . . . . . . . . . . . . . . . . . . . . . . . 1,335,000 1,335,440
Alliant Energy Finance LLC3.750%, 06/15/23 (144A) . . . . . . . . . . . . . . . . . . . . . . . 525,000 522,558
Ameren Illinois Co.3.800%, 05/15/28 . . . . . . . . . . . . . . . . . . . . . . . . . . . . 1,090,000 1,095,579
Baltimore Gas & Electric Co.3.500%, 08/15/46 . . . . . . . . . . . . . . . . . . . . . . . . . . . . 805,000 707,4903.750%, 08/15/47 . . . . . . . . . . . . . . . . . . . . . . . . . . . . 715,000 654,8134.250%, 09/15/48 . . . . . . . . . . . . . . . . . . . . . . . . . . . . 240,000 238,326
CenterPoint Energy Houston Electric LLC3.950%, 03/01/48 . . . . . . . . . . . . . . . . . . . . . . . . . . . . 1,240,000 1,198,539
Consumers Energy Co.4.050%, 05/15/48 . . . . . . . . . . . . . . . . . . . . . . . . . . . . 390,000 383,759
DTE Electric Co.4.050%, 05/15/48 . . . . . . . . . . . . . . . . . . . . . . . . . . . . 1,745,000 1,714,748
Duke Energy Carolinas LLC3.700%, 12/01/47 . . . . . . . . . . . . . . . . . . . . . . . . . . . . 715,000 649,542
Duke Energy Corp.3.750%, 09/01/46 . . . . . . . . . . . . . . . . . . . . . . . . . . . . 2,280,000 2,000,5054.800%, 12/15/45 . . . . . . . . . . . . . . . . . . . . . . . . . . . . 1,815,000 1,867,435
Duke Energy Florida LLC3.800%, 07/15/28 . . . . . . . . . . . . . . . . . . . . . . . . . . . . 815,000 813,653
Duke Energy Progress LLC3.250%, 08/15/25 . . . . . . . . . . . . . . . . . . . . . . . . . . . . 1,145,000 1,112,3823.700%, 09/01/28 . . . . . . . . . . . . . . . . . . . . . . . . . . . . 2,905,000 2,879,785
Electricite de France S.A.4.500%, 09/21/28 (144A) . . . . . . . . . . . . . . . . . . . . . . . 1,370,000 1,348,7945.000%, 09/21/48 (144A) . . . . . . . . . . . . . . . . . . . . . . . 720,000 699,967
Emera U.S. Finance L.P.2.150%, 06/15/19 . . . . . . . . . . . . . . . . . . . . . . . . . . . . 2,058,000 2,044,706
Entergy Corp.2.950%, 09/01/26 . . . . . . . . . . . . . . . . . . . . . . . . . . . . 2,000,000 1,836,497
Entergy Louisiana LLC4.200%, 09/01/48 . . . . . . . . . . . . . . . . . . . . . . . . . . . . 1,570,000 1,557,272
Eskom Holdings SOC, Ltd.6.350%, 08/10/28 (144A) . . . . . . . . . . . . . . . . . . . . . . . 1,055,000 1,050,620
Exelon Corp.2.450%, 04/15/21 . . . . . . . . . . . . . . . . . . . . . . . . . . . . 549,000 533,5434.450%, 04/15/46 . . . . . . . . . . . . . . . . . . . . . . . . . . . . 2,800,000 2,710,1284.950%, 06/15/35 . . . . . . . . . . . . . . . . . . . . . . . . . . . . 501,000 524,749
Florida Power & Light Co.4.125%, 06/01/48 . . . . . . . . . . . . . . . . . . . . . . . . . . . . 1,320,000 1,320,991
Generacion Mediterranea S.A. / Generacion Frias S.A. / CentralTermica Roca S.A.9.625%, 07/27/23 (144A) . . . . . . . . . . . . . . . . . . . . . . . 1,182,000 1,004,700
Genneia S.A.8.750%, 01/20/22 (144A) (b) . . . . . . . . . . . . . . . . . . . . 1,216,000 1,132,096
Inkia Energy, Ltd.5.875%, 11/09/27 (144A) . . . . . . . . . . . . . . . . . . . . . . . 349,000 331,554
Security DescriptionPrincipalAmount* Value
Electric—(Continued)Kansas City Power & Light Co.
4.200%, 03/15/48 . . . . . . . . . . . . . . . . . . . . . . . . . . . . 1,350,000 $ 1,292,665Mid-Atlantic Interstate Transmission LLC
4.100%, 05/15/28 (144A) . . . . . . . . . . . . . . . . . . . . . . . 575,000 569,478MidAmerican Energy Co.
4.400%, 10/15/44 . . . . . . . . . . . . . . . . . . . . . . . . . . . . 837,000 856,233Northern States Power Co.
3.400%, 08/15/42 . . . . . . . . . . . . . . . . . . . . . . . . . . . . 1,370,000 1,219,5524.000%, 08/15/45 . . . . . . . . . . . . . . . . . . . . . . . . . . . . 780,000 763,7854.200%, 09/01/48 . . . . . . . . . . . . . . . . . . . . . . . . . . . . 630,000 617,735
Ohio Power Co.6.600%, 02/15/33 . . . . . . . . . . . . . . . . . . . . . . . . . . . . 280,000 350,634
Oncor Electric Delivery Co. LLC4.550%, 12/01/41 . . . . . . . . . . . . . . . . . . . . . . . . . . . . 970,000 1,030,452
Orazul Energy Egenor S. en C. por A.5.625%, 04/28/27 (144A) . . . . . . . . . . . . . . . . . . . . . . . 549,000 500,968
Pacific Gas & Electric Co.6.050%, 03/01/34 . . . . . . . . . . . . . . . . . . . . . . . . . . . . 1,620,000 1,823,512
PacifiCorp4.125%, 01/15/49 . . . . . . . . . . . . . . . . . . . . . . . . . . . . 475,000 465,661
Public Service Electric & Gas Co.3.650%, 09/01/28 . . . . . . . . . . . . . . . . . . . . . . . . . . . . 1,780,000 1,764,523
Southern Co. (The)4.400%, 07/01/46 . . . . . . . . . . . . . . . . . . . . . . . . . . . . 2,085,000 1,982,702
Southwestern Electric Power Co.4.100%, 09/15/28 . . . . . . . . . . . . . . . . . . . . . . . . . . . . 910,000 909,591
Stoneway Capital Corp.10.000%, 03/01/27 . . . . . . . . . . . . . . . . . . . . . . . . . . . 635,024 615,17910.000%, 03/01/27 (144A) . . . . . . . . . . . . . . . . . . . . . . 1,630,440 1,579,489
Tampa Electric Co.4.300%, 06/15/48 . . . . . . . . . . . . . . . . . . . . . . . . . . . . 260,000 257,958
Trans-Allegheny Interstate Line Co.3.850%, 06/01/25 (144A) . . . . . . . . . . . . . . . . . . . . . . . 1,975,000 1,954,795
Virginia Electric & Power Co.2.750%, 03/15/23 . . . . . . . . . . . . . . . . . . . . . . . . . . . . 1,690,000 1,636,3673.500%, 03/15/27 . . . . . . . . . . . . . . . . . . . . . . . . . . . . 2,495,000 2,437,8244.000%, 01/15/43 . . . . . . . . . . . . . . . . . . . . . . . . . . . . 1,650,000 1,578,6404.000%, 11/15/46 (b) . . . . . . . . . . . . . . . . . . . . . . . . . 1,050,000 991,4754.200%, 05/15/45 . . . . . . . . . . . . . . . . . . . . . . . . . . . . 250,000 243,1064.450%, 02/15/44 . . . . . . . . . . . . . . . . . . . . . . . . . . . . 287,000 289,527
WEC Energy Group, Inc.3.375%, 06/15/21 . . . . . . . . . . . . . . . . . . . . . . . . . . . . 390,000 390,105
63,503,889
Electronics—0.1%Corning, Inc.
4.375%, 11/15/57 . . . . . . . . . . . . . . . . . . . . . . . . . . . . 2,760,000 2,412,803Honeywell International, Inc.
3.812%, 11/21/47 . . . . . . . . . . . . . . . . . . . . . . . . . . . . 495,000 470,927Tyco Electronics Group S.A.
3.125%, 08/15/27 . . . . . . . . . . . . . . . . . . . . . . . . . . . . 645,000 599,5653.450%, 08/01/24 . . . . . . . . . . . . . . . . . . . . . . . . . . . . 300,000 291,776
3,775,071
BHFTII-15

Brighthouse Funds Trust II
BlackRock Bond Income Portfolio
Schedule of Investments as of September 30, 2018 (Unaudited)
Corporate Bonds & Notes—(Continued)
Security DescriptionPrincipalAmount* Value
Engineering & Construction—0.0%Aeropuerto Internacional de Tocumen S.A.
5.625%, 05/18/36 (144A) . . . . . . . . . . . . . . . . . . . . . . . 276,000 $ 284,280Aeropuertos Argentina S.A.
6.875%, 02/01/27 (144A) . . . . . . . . . . . . . . . . . . . . . . . 539,000 518,518Aeropuertos Dominicanos Siglo S.A.
6.750%, 03/30/29 (144A) . . . . . . . . . . . . . . . . . . . . . . . 279,000 289,741
1,092,539
Environmental Control—0.1%Republic Services, Inc.
3.950%, 05/15/28 . . . . . . . . . . . . . . . . . . . . . . . . . . . . 1,890,000 1,877,379Waste Management, Inc.
3.900%, 03/01/35 . . . . . . . . . . . . . . . . . . . . . . . . . . . . 967,000 943,786
2,821,165
Food—0.3%Arcor SAIC
6.000%, 07/06/23 (144A) . . . . . . . . . . . . . . . . . . . . . . . 281,000 280,649Campbell Soup Co.
8.875%, 05/01/21 . . . . . . . . . . . . . . . . . . . . . . . . . . . . 680,000 759,938General Mills, Inc.
3.200%, 04/16/21 (b) . . . . . . . . . . . . . . . . . . . . . . . . . 890,000 884,2014.000%, 04/17/25 . . . . . . . . . . . . . . . . . . . . . . . . . . . . 983,000 972,606
Kroger Co. (The)2.650%, 10/15/26 (b) . . . . . . . . . . . . . . . . . . . . . . . . . 2,415,000 2,153,578
MARB BondCo plc6.875%, 01/19/25 (144A) . . . . . . . . . . . . . . . . . . . . . . . 1,529,000 1,421,970
Tyson Foods, Inc.3.550%, 06/02/27 . . . . . . . . . . . . . . . . . . . . . . . . . . . . 1,420,000 1,339,5123.900%, 09/28/23 . . . . . . . . . . . . . . . . . . . . . . . . . . . . 225,000 225,8333.950%, 08/15/24 . . . . . . . . . . . . . . . . . . . . . . . . . . . . 1,745,000 1,743,9985.100%, 09/28/48 . . . . . . . . . . . . . . . . . . . . . . . . . . . . 200,000 203,654
9,985,939
Forest Products & Paper—0.1%Eldorado Intl. Finance GmbH
8.625%, 06/16/21 (144A) . . . . . . . . . . . . . . . . . . . . . . . 609,000 622,702Georgia-Pacific LLC
7.375%, 12/01/25 . . . . . . . . . . . . . . . . . . . . . . . . . . . . 935,000 1,116,527Klabin Finance S.A.
4.875%, 09/19/27 (144A) . . . . . . . . . . . . . . . . . . . . . . . 510,000 450,713Suzano Austria GmbH
6.000%, 01/15/29 (144A) (b) . . . . . . . . . . . . . . . . . . . . 881,000 884,524
3,074,466
Gas—0.1%NiSource, Inc.
2.650%, 11/17/22 . . . . . . . . . . . . . . . . . . . . . . . . . . . . 240,000 228,9983.490%, 05/15/27 . . . . . . . . . . . . . . . . . . . . . . . . . . . . 1,825,000 1,729,945
1,958,943
Healthcare-Products—0.6%Abbott Laboratories
3.400%, 11/30/23 . . . . . . . . . . . . . . . . . . . . . . . . . . . . 500,000 497,8733.750%, 11/30/26 (b) . . . . . . . . . . . . . . . . . . . . . . . . . 5,260,000 5,243,406
Security DescriptionPrincipalAmount* Value
Healthcare-Products—(Continued)Becton Dickinson & Co.
2.133%, 06/06/19 . . . . . . . . . . . . . . . . . . . . . . . . . . . . 1,630,000 $ 1,620,3542.675%, 12/15/19 . . . . . . . . . . . . . . . . . . . . . . . . . . . . 2,345,000 2,331,7212.894%, 06/06/22 . . . . . . . . . . . . . . . . . . . . . . . . . . . . 3,240,000 3,149,6023.300%, 03/01/23 . . . . . . . . . . . . . . . . . . . . . . . . . . . . 1,420,000 1,383,8784.685%, 12/15/44 . . . . . . . . . . . . . . . . . . . . . . . . . . . . 367,000 361,294
Edwards Lifesciences Corp.4.300%, 06/15/28 . . . . . . . . . . . . . . . . . . . . . . . . . . . . 485,000 484,489
Medtronic, Inc.3.500%, 03/15/25 (b) . . . . . . . . . . . . . . . . . . . . . . . . . 445,000 441,4374.375%, 03/15/35 . . . . . . . . . . . . . . . . . . . . . . . . . . . . 3,410,000 3,522,256
Thermo Fisher Scientific, Inc.2.950%, 09/19/26 . . . . . . . . . . . . . . . . . . . . . . . . . . . . 1,615,000 1,497,313
20,533,623
Healthcare-Services—0.8%Aetna, Inc.
4.125%, 11/15/42 . . . . . . . . . . . . . . . . . . . . . . . . . . . . 475,000 434,5144.500%, 05/15/42 . . . . . . . . . . . . . . . . . . . . . . . . . . . . 881,000 845,9484.750%, 03/15/44 . . . . . . . . . . . . . . . . . . . . . . . . . . . . 690,000 679,567
AHS Hospital Corp.5.024%, 07/01/45 . . . . . . . . . . . . . . . . . . . . . . . . . . . . 490,000 544,337
Anthem, Inc.4.101%, 03/01/28 . . . . . . . . . . . . . . . . . . . . . . . . . . . . 905,000 890,928
Baylor Scott & White Holdings4.185%, 11/15/45 . . . . . . . . . . . . . . . . . . . . . . . . . . . . 775,000 761,199
Catholic Health Initiatives4.350%, 11/01/42 . . . . . . . . . . . . . . . . . . . . . . . . . . . . 550,000 494,881
Cigna Corp.3.250%, 04/15/25 . . . . . . . . . . . . . . . . . . . . . . . . . . . . 1,947,000 1,842,581
Dignity Health2.637%, 11/01/19 . . . . . . . . . . . . . . . . . . . . . . . . . . . . 1,319,000 1,310,753
Halfmoon Parent, Inc.3.200%, 09/17/20 (144A) . . . . . . . . . . . . . . . . . . . . . . . 7,505,000 7,476,5564.125%, 11/15/25 (144A) . . . . . . . . . . . . . . . . . . . . . . . 435,000 433,609
Kaiser Foundation Hospitals3.500%, 04/01/22 . . . . . . . . . . . . . . . . . . . . . . . . . . . . 1,288,000 1,290,2904.150%, 05/01/47 . . . . . . . . . . . . . . . . . . . . . . . . . . . . 383,000 381,875
Laboratory Corp. of America Holdings2.625%, 02/01/20 . . . . . . . . . . . . . . . . . . . . . . . . . . . . 1,583,000 1,573,004
Montefiore Obligated Group5.246%, 11/01/48 . . . . . . . . . . . . . . . . . . . . . . . . . . . . 1,089,000 1,086,816
Ochsner Clinic Foundation5.897%, 05/15/45 . . . . . . . . . . . . . . . . . . . . . . . . . . . . 638,000 764,726
Providence St Joseph Health Obligated Group3.930%, 10/01/48 . . . . . . . . . . . . . . . . . . . . . . . . . . . . 887,000 825,565
Rede D’or Finance S.a.r.l.4.950%, 01/17/28 (144A) . . . . . . . . . . . . . . . . . . . . . . . 370,000 319,125
Southern Baptist Hospital of Florida, Inc.4.857%, 07/15/45 . . . . . . . . . . . . . . . . . . . . . . . . . . . . 650,000 698,308
Sutter Health3.695%, 08/15/28 . . . . . . . . . . . . . . . . . . . . . . . . . . . . 1,045,000 1,025,397
Trinity Health Corp.4.125%, 12/01/45 . . . . . . . . . . . . . . . . . . . . . . . . . . . . 829,000 794,217
BHFTII-16

Brighthouse Funds Trust II
BlackRock Bond Income Portfolio
Schedule of Investments as of September 30, 2018 (Unaudited)
Corporate Bonds & Notes—(Continued)
Security DescriptionPrincipalAmount* Value
Healthcare-Services—(Continued)UnitedHealth Group, Inc.
3.750%, 07/15/25 . . . . . . . . . . . . . . . . . . . . . . . . . . . . 1,730,000 $ 1,737,6013.750%, 10/15/47 . . . . . . . . . . . . . . . . . . . . . . . . . . . . 1,050,000 974,5063.850%, 06/15/28 . . . . . . . . . . . . . . . . . . . . . . . . . . . . 450,000 450,8714.200%, 01/15/47 . . . . . . . . . . . . . . . . . . . . . . . . . . . . 790,000 784,5254.625%, 07/15/35 . . . . . . . . . . . . . . . . . . . . . . . . . . . . 377,000 401,194
28,822,893
Holding Companies-Diversified—0.0%Grupo KUO S.A.B. de C.V.
5.750%, 07/07/27 (144A) . . . . . . . . . . . . . . . . . . . . . . . 1,068,000 1,025,280
Housewares—0.0%Newell Brands, Inc.
2.875%, 12/01/19 . . . . . . . . . . . . . . . . . . . . . . . . . . . . 906,000 904,359
Insurance—0.2%Ambac Assurance Corp.
5.100%, 06/07/20 (144A) . . . . . . . . . . . . . . . . . . . . . . . 162,922 221,981Ambac LSNI LLC
7.396%, 3M LIBOR + 5.000%, 02/12/23 (144A) (c) . . . . . . 1,017,256 1,027,428Aon plc
4.750%, 05/15/45 . . . . . . . . . . . . . . . . . . . . . . . . . . . . 485,000 484,467AXA Equitable Holdings, Inc.
3.900%, 04/20/23 (144A) . . . . . . . . . . . . . . . . . . . . . . . 475,000 471,4455.000%, 04/20/48 (144A) . . . . . . . . . . . . . . . . . . . . . . . 780,000 725,580
Hartford Financial Services Group, Inc. (The)4.300%, 04/15/43 . . . . . . . . . . . . . . . . . . . . . . . . . . . . 325,000 307,530
Marsh & McLennan Cos., Inc.3.750%, 03/14/26 (b) . . . . . . . . . . . . . . . . . . . . . . . . . 359,000 352,4104.200%, 03/01/48 . . . . . . . . . . . . . . . . . . . . . . . . . . . . 1,215,000 1,144,1974.350%, 01/30/47 . . . . . . . . . . . . . . . . . . . . . . . . . . . . 191,000 182,260
Principal Financial Group, Inc.4.300%, 11/15/46 . . . . . . . . . . . . . . . . . . . . . . . . . . . . 360,000 338,909
Prudential Financial, Inc.3.878%, 03/27/28 . . . . . . . . . . . . . . . . . . . . . . . . . . . . 2,120,000 2,100,499
Travelers Cos., Inc. (The)4.600%, 08/01/43 . . . . . . . . . . . . . . . . . . . . . . . . . . . . 945,000 982,620
8,339,326
Iron/Steel—0.1%Nucor Corp.
5.200%, 08/01/43 . . . . . . . . . . . . . . . . . . . . . . . . . . . . 585,000 635,254Samarco Mineracao S.A.
4.125%, 11/01/22 . . . . . . . . . . . . . . . . . . . . . . . . . . . 602,000 413,574Steel Dynamics, Inc.
5.125%, 10/01/21 . . . . . . . . . . . . . . . . . . . . . . . . . . . . 1,086,000 1,097,946
2,146,774
Media—1.3%Cablevision S.A.
6.500%, 06/15/21 (144A) . . . . . . . . . . . . . . . . . . . . . . . 277,000 272,845CBS Corp.
2.300%, 08/15/19 . . . . . . . . . . . . . . . . . . . . . . . . . . . . 2,077,000 2,066,029
Security DescriptionPrincipalAmount* Value
Media—(Continued)Charter Communications Operating LLC / Charter Communications
Operating Capital Corp.3.579%, 07/23/20 . . . . . . . . . . . . . . . . . . . . . . . . . . . . 6,710,000 $ 6,714,0224.500%, 02/01/24 . . . . . . . . . . . . . . . . . . . . . . . . . . . . 2,115,000 2,123,8834.908%, 07/23/25 . . . . . . . . . . . . . . . . . . . . . . . . . . . . 2,902,000 2,945,3975.375%, 05/01/47 . . . . . . . . . . . . . . . . . . . . . . . . . . . . 795,000 757,8495.750%, 04/01/48 . . . . . . . . . . . . . . . . . . . . . . . . . . . . 1,145,000 1,144,2936.384%, 10/23/35 . . . . . . . . . . . . . . . . . . . . . . . . . . . . 3,898,000 4,198,730
Comcast Corp.3.150%, 03/01/26 . . . . . . . . . . . . . . . . . . . . . . . . . . . . 2,980,000 2,812,3563.200%, 07/15/36 . . . . . . . . . . . . . . . . . . . . . . . . . . . . 2,770,000 2,308,3443.400%, 07/15/46 . . . . . . . . . . . . . . . . . . . . . . . . . . . . 1,625,000 1,312,7634.250%, 01/15/33 . . . . . . . . . . . . . . . . . . . . . . . . . . . . 1,356,000 1,328,1314.400%, 08/15/35 . . . . . . . . . . . . . . . . . . . . . . . . . . . . 1,001,000 981,101
COX Communications, Inc.3.150%, 08/15/24 (144A) . . . . . . . . . . . . . . . . . . . . . . . 2,780,000 2,633,934
Discovery Communications LLC3.800%, 03/13/24 . . . . . . . . . . . . . . . . . . . . . . . . . . . . 1,616,000 1,584,5803.950%, 06/15/25 (144A) . . . . . . . . . . . . . . . . . . . . . . . 1,230,000 1,199,7585.200%, 09/20/47 . . . . . . . . . . . . . . . . . . . . . . . . . . . . 435,000 426,193
NBCUniversal Enterprise, Inc.5.250%, 12/31/49 (144A) . . . . . . . . . . . . . . . . . . . . . . . 1,290,000 1,308,053
NBCUniversal Media LLC4.450%, 01/15/43 . . . . . . . . . . . . . . . . . . . . . . . . . . . . 915,000 871,881
Time Warner Cable LLC4.125%, 02/15/21 . . . . . . . . . . . . . . . . . . . . . . . . . . . . 2,130,000 2,147,0444.500%, 09/15/42 . . . . . . . . . . . . . . . . . . . . . . . . . . . . 161,000 137,2175.000%, 02/01/20 . . . . . . . . . . . . . . . . . . . . . . . . . . . . 1,055,000 1,075,8365.500%, 09/01/41 . . . . . . . . . . . . . . . . . . . . . . . . . . . . 588,000 565,526
Viacom, Inc.2.750%, 12/15/19 . . . . . . . . . . . . . . . . . . . . . . . . . . . . 705,000 700,9806.875%, 04/30/36 . . . . . . . . . . . . . . . . . . . . . . . . . . . . 850,000 966,675
Warner Media LLC2.100%, 06/01/19 . . . . . . . . . . . . . . . . . . . . . . . . . . . . 3,352,000 3,334,7133.600%, 07/15/25 . . . . . . . . . . . . . . . . . . . . . . . . . . . . 820,000 785,4064.650%, 06/01/44 . . . . . . . . . . . . . . . . . . . . . . . . . . . . 440,000 395,1944.850%, 07/15/45 . . . . . . . . . . . . . . . . . . . . . . . . . . . . 1,980,000 1,843,938
48,942,671
Mining—0.2%Anglo American Capital plc
3.625%, 09/11/24 (144A) . . . . . . . . . . . . . . . . . . . . . . . 2,075,000 1,974,985Barrick Gold Corp.
5.250%, 04/01/42 . . . . . . . . . . . . . . . . . . . . . . . . . . . . 720,000 749,804BHP Billiton Finance USA, Ltd.
5.000%, 09/30/43 . . . . . . . . . . . . . . . . . . . . . . . . . . . . 760,000 842,438Largo Resources, Ltd.
9.250%, 06/01/21 (144A) . . . . . . . . . . . . . . . . . . . . . . . 96,000 100,320Newmont Mining Corp.
3.500%, 03/15/22 . . . . . . . . . . . . . . . . . . . . . . . . . . . . 2,740,000 2,716,333
6,383,880
Miscellaneous Manufacturing—0.1%Eaton Corp.
2.750%, 11/02/22 . . . . . . . . . . . . . . . . . . . . . . . . . . . . 1,285,000 1,246,843
BHFTII-17
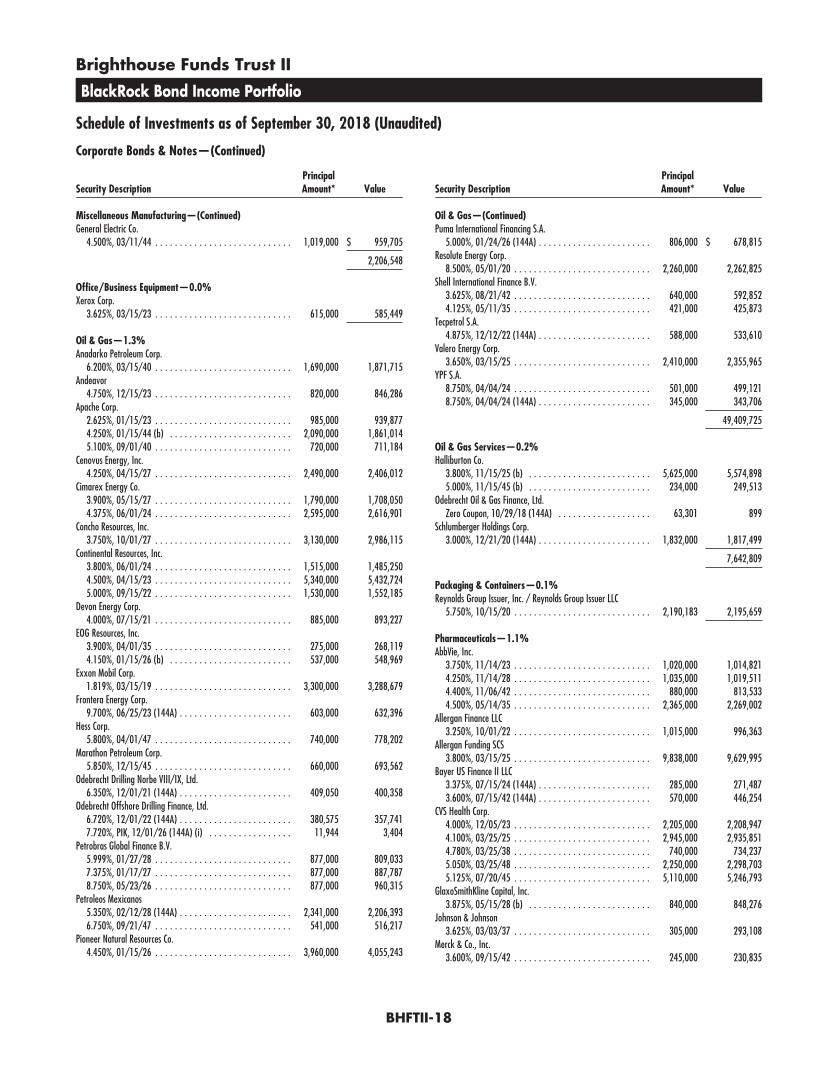
Brighthouse Funds Trust II
BlackRock Bond Income Portfolio
Schedule of Investments as of September 30, 2018 (Unaudited)
Corporate Bonds & Notes—(Continued)
Security DescriptionPrincipalAmount* Value
Miscellaneous Manufacturing—(Continued)General Electric Co.
4.500%, 03/11/44 . . . . . . . . . . . . . . . . . . . . . . . . . . . . 1,019,000 $ 959,705
2,206,548
Office/Business Equipment—0.0%Xerox Corp.
3.625%, 03/15/23 . . . . . . . . . . . . . . . . . . . . . . . . . . . . 615,000 585,449
Oil & Gas—1.3%Anadarko Petroleum Corp.
6.200%, 03/15/40 . . . . . . . . . . . . . . . . . . . . . . . . . . . . 1,690,000 1,871,715Andeavor
4.750%, 12/15/23 . . . . . . . . . . . . . . . . . . . . . . . . . . . . 820,000 846,286Apache Corp.
2.625%, 01/15/23 . . . . . . . . . . . . . . . . . . . . . . . . . . . . 985,000 939,8774.250%, 01/15/44 (b) . . . . . . . . . . . . . . . . . . . . . . . . . 2,090,000 1,861,0145.100%, 09/01/40 . . . . . . . . . . . . . . . . . . . . . . . . . . . . 720,000 711,184
Cenovus Energy, Inc.4.250%, 04/15/27 . . . . . . . . . . . . . . . . . . . . . . . . . . . . 2,490,000 2,406,012
Cimarex Energy Co.3.900%, 05/15/27 . . . . . . . . . . . . . . . . . . . . . . . . . . . . 1,790,000 1,708,0504.375%, 06/01/24 . . . . . . . . . . . . . . . . . . . . . . . . . . . . 2,595,000 2,616,901
Concho Resources, Inc.3.750%, 10/01/27 . . . . . . . . . . . . . . . . . . . . . . . . . . . . 3,130,000 2,986,115
Continental Resources, Inc.3.800%, 06/01/24 . . . . . . . . . . . . . . . . . . . . . . . . . . . . 1,515,000 1,485,2504.500%, 04/15/23 . . . . . . . . . . . . . . . . . . . . . . . . . . . . 5,340,000 5,432,7245.000%, 09/15/22 . . . . . . . . . . . . . . . . . . . . . . . . . . . . 1,530,000 1,552,185
Devon Energy Corp.4.000%, 07/15/21 . . . . . . . . . . . . . . . . . . . . . . . . . . . . 885,000 893,227
EOG Resources, Inc.3.900%, 04/01/35 . . . . . . . . . . . . . . . . . . . . . . . . . . . . 275,000 268,1194.150%, 01/15/26 (b) . . . . . . . . . . . . . . . . . . . . . . . . . 537,000 548,969
Exxon Mobil Corp.1.819%, 03/15/19 . . . . . . . . . . . . . . . . . . . . . . . . . . . . 3,300,000 3,288,679
Frontera Energy Corp.9.700%, 06/25/23 (144A) . . . . . . . . . . . . . . . . . . . . . . . 603,000 632,396
Hess Corp.5.800%, 04/01/47 . . . . . . . . . . . . . . . . . . . . . . . . . . . . 740,000 778,202
Marathon Petroleum Corp.5.850%, 12/15/45 . . . . . . . . . . . . . . . . . . . . . . . . . . . . 660,000 693,562
Odebrecht Drilling Norbe VIII/IX, Ltd.6.350%, 12/01/21 (144A) . . . . . . . . . . . . . . . . . . . . . . . 409,050 400,358
Odebrecht Offshore Drilling Finance, Ltd.6.720%, 12/01/22 (144A) . . . . . . . . . . . . . . . . . . . . . . . 380,575 357,7417.720%, PIK, 12/01/26 (144A) (i) . . . . . . . . . . . . . . . . . 11,944 3,404
Petrobras Global Finance B.V.5.999%, 01/27/28 . . . . . . . . . . . . . . . . . . . . . . . . . . . . 877,000 809,0337.375%, 01/17/27 . . . . . . . . . . . . . . . . . . . . . . . . . . . . 877,000 887,7878.750%, 05/23/26 . . . . . . . . . . . . . . . . . . . . . . . . . . . . 877,000 960,315
Petroleos Mexicanos5.350%, 02/12/28 (144A) . . . . . . . . . . . . . . . . . . . . . . . 2,341,000 2,206,3936.750%, 09/21/47 . . . . . . . . . . . . . . . . . . . . . . . . . . . . 541,000 516,217
Pioneer Natural Resources Co.4.450%, 01/15/26 . . . . . . . . . . . . . . . . . . . . . . . . . . . . 3,960,000 4,055,243
Security DescriptionPrincipalAmount* Value
Oil & Gas—(Continued)Puma International Financing S.A.
5.000%, 01/24/26 (144A) . . . . . . . . . . . . . . . . . . . . . . . 806,000 $ 678,815Resolute Energy Corp.
8.500%, 05/01/20 . . . . . . . . . . . . . . . . . . . . . . . . . . . . 2,260,000 2,262,825Shell International Finance B.V.
3.625%, 08/21/42 . . . . . . . . . . . . . . . . . . . . . . . . . . . . 640,000 592,8524.125%, 05/11/35 . . . . . . . . . . . . . . . . . . . . . . . . . . . . 421,000 425,873
Tecpetrol S.A.4.875%, 12/12/22 (144A) . . . . . . . . . . . . . . . . . . . . . . . 588,000 533,610
Valero Energy Corp.3.650%, 03/15/25 . . . . . . . . . . . . . . . . . . . . . . . . . . . . 2,410,000 2,355,965
YPF S.A.8.750%, 04/04/24 . . . . . . . . . . . . . . . . . . . . . . . . . . . . 501,000 499,1218.750%, 04/04/24 (144A) . . . . . . . . . . . . . . . . . . . . . . . 345,000 343,706
49,409,725
Oil & Gas Services—0.2%Halliburton Co.
3.800%, 11/15/25 (b) . . . . . . . . . . . . . . . . . . . . . . . . . 5,625,000 5,574,8985.000%, 11/15/45 (b) . . . . . . . . . . . . . . . . . . . . . . . . . 234,000 249,513
Odebrecht Oil & Gas Finance, Ltd.Zero Coupon, 10/29/18 (144A) . . . . . . . . . . . . . . . . . . . 63,301 899
Schlumberger Holdings Corp.3.000%, 12/21/20 (144A) . . . . . . . . . . . . . . . . . . . . . . . 1,832,000 1,817,499
7,642,809
Packaging & Containers—0.1%Reynolds Group Issuer, Inc. / Reynolds Group Issuer LLC
5.750%, 10/15/20 . . . . . . . . . . . . . . . . . . . . . . . . . . . . 2,190,183 2,195,659
Pharmaceuticals—1.1%AbbVie, Inc.
3.750%, 11/14/23 . . . . . . . . . . . . . . . . . . . . . . . . . . . . 1,020,000 1,014,8214.250%, 11/14/28 . . . . . . . . . . . . . . . . . . . . . . . . . . . . 1,035,000 1,019,5114.400%, 11/06/42 . . . . . . . . . . . . . . . . . . . . . . . . . . . . 880,000 813,5334.500%, 05/14/35 . . . . . . . . . . . . . . . . . . . . . . . . . . . . 2,365,000 2,269,002
Allergan Finance LLC3.250%, 10/01/22 . . . . . . . . . . . . . . . . . . . . . . . . . . . . 1,015,000 996,363
Allergan Funding SCS3.800%, 03/15/25 . . . . . . . . . . . . . . . . . . . . . . . . . . . . 9,838,000 9,629,995
Bayer US Finance II LLC3.375%, 07/15/24 (144A) . . . . . . . . . . . . . . . . . . . . . . . 285,000 271,4873.600%, 07/15/42 (144A) . . . . . . . . . . . . . . . . . . . . . . . 570,000 446,254
CVS Health Corp.4.000%, 12/05/23 . . . . . . . . . . . . . . . . . . . . . . . . . . . . 2,205,000 2,208,9474.100%, 03/25/25 . . . . . . . . . . . . . . . . . . . . . . . . . . . . 2,945,000 2,935,8514.780%, 03/25/38 . . . . . . . . . . . . . . . . . . . . . . . . . . . . 740,000 734,2375.050%, 03/25/48 . . . . . . . . . . . . . . . . . . . . . . . . . . . . 2,250,000 2,298,7035.125%, 07/20/45 . . . . . . . . . . . . . . . . . . . . . . . . . . . . 5,110,000 5,246,793
GlaxoSmithKline Capital, Inc.3.875%, 05/15/28 (b) . . . . . . . . . . . . . . . . . . . . . . . . . 840,000 848,276
Johnson & Johnson3.625%, 03/03/37 . . . . . . . . . . . . . . . . . . . . . . . . . . . . 305,000 293,108
Merck & Co., Inc.3.600%, 09/15/42 . . . . . . . . . . . . . . . . . . . . . . . . . . . . 245,000 230,835
BHFTII-18
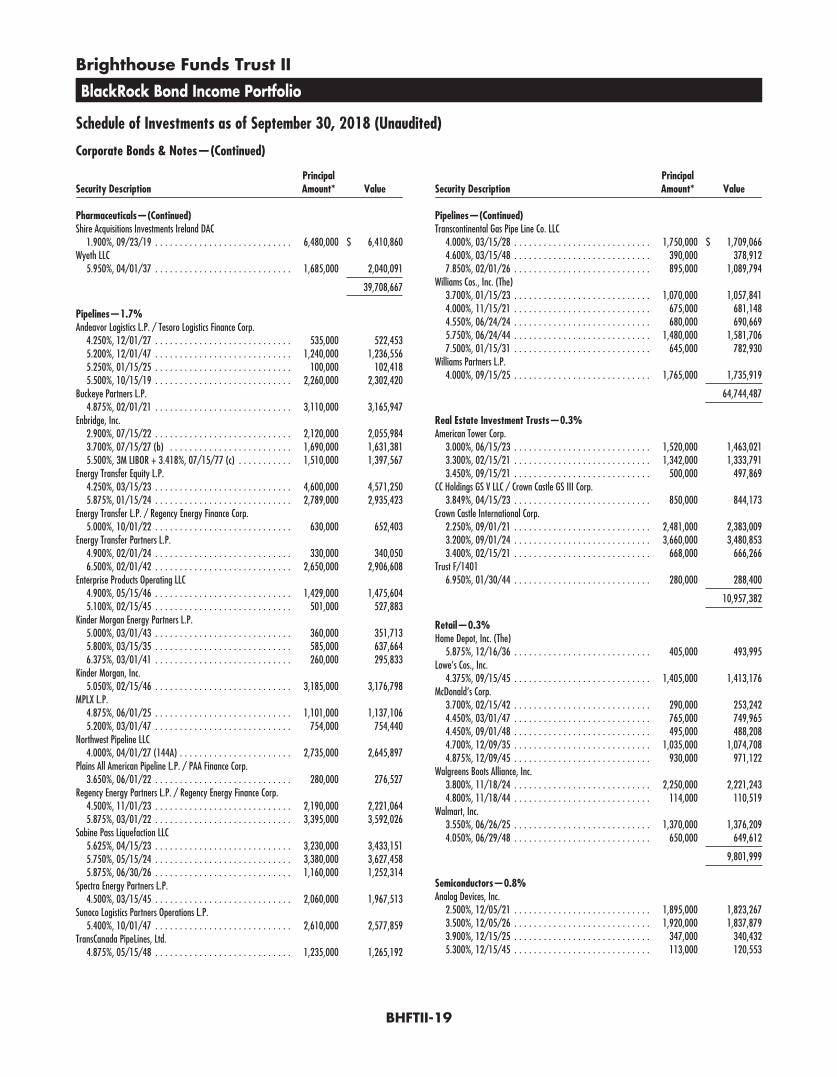
Brighthouse Funds Trust II
BlackRock Bond Income Portfolio
Schedule of Investments as of September 30, 2018 (Unaudited)
Corporate Bonds & Notes—(Continued)
Security DescriptionPrincipalAmount* Value
Pharmaceuticals—(Continued)Shire Acquisitions Investments Ireland DAC
1.900%, 09/23/19 . . . . . . . . . . . . . . . . . . . . . . . . . . . . 6,480,000 $ 6,410,860Wyeth LLC
5.950%, 04/01/37 . . . . . . . . . . . . . . . . . . . . . . . . . . . . 1,685,000 2,040,091
39,708,667
Pipelines—1.7%Andeavor Logistics L.P. / Tesoro Logistics Finance Corp.
4.250%, 12/01/27 . . . . . . . . . . . . . . . . . . . . . . . . . . . . 535,000 522,4535.200%, 12/01/47 . . . . . . . . . . . . . . . . . . . . . . . . . . . . 1,240,000 1,236,5565.250%, 01/15/25 . . . . . . . . . . . . . . . . . . . . . . . . . . . . 100,000 102,4185.500%, 10/15/19 . . . . . . . . . . . . . . . . . . . . . . . . . . . . 2,260,000 2,302,420
Buckeye Partners L.P.4.875%, 02/01/21 . . . . . . . . . . . . . . . . . . . . . . . . . . . . 3,110,000 3,165,947
Enbridge, Inc.2.900%, 07/15/22 . . . . . . . . . . . . . . . . . . . . . . . . . . . . 2,120,000 2,055,9843.700%, 07/15/27 (b) . . . . . . . . . . . . . . . . . . . . . . . . . 1,690,000 1,631,3815.500%, 3M LIBOR + 3.418%, 07/15/77 (c) . . . . . . . . . . . 1,510,000 1,397,567
Energy Transfer Equity L.P.4.250%, 03/15/23 . . . . . . . . . . . . . . . . . . . . . . . . . . . . 4,600,000 4,571,2505.875%, 01/15/24 . . . . . . . . . . . . . . . . . . . . . . . . . . . . 2,789,000 2,935,423
Energy Transfer L.P. / Regency Energy Finance Corp.5.000%, 10/01/22 . . . . . . . . . . . . . . . . . . . . . . . . . . . . 630,000 652,403
Energy Transfer Partners L.P.4.900%, 02/01/24 . . . . . . . . . . . . . . . . . . . . . . . . . . . . 330,000 340,0506.500%, 02/01/42 . . . . . . . . . . . . . . . . . . . . . . . . . . . . 2,650,000 2,906,608
Enterprise Products Operating LLC4.900%, 05/15/46 . . . . . . . . . . . . . . . . . . . . . . . . . . . . 1,429,000 1,475,6045.100%, 02/15/45 . . . . . . . . . . . . . . . . . . . . . . . . . . . . 501,000 527,883
Kinder Morgan Energy Partners L.P.5.000%, 03/01/43 . . . . . . . . . . . . . . . . . . . . . . . . . . . . 360,000 351,7135.800%, 03/15/35 . . . . . . . . . . . . . . . . . . . . . . . . . . . . 585,000 637,6646.375%, 03/01/41 . . . . . . . . . . . . . . . . . . . . . . . . . . . . 260,000 295,833
Kinder Morgan, Inc.5.050%, 02/15/46 . . . . . . . . . . . . . . . . . . . . . . . . . . . . 3,185,000 3,176,798
MPLX L.P.4.875%, 06/01/25 . . . . . . . . . . . . . . . . . . . . . . . . . . . . 1,101,000 1,137,1065.200%, 03/01/47 . . . . . . . . . . . . . . . . . . . . . . . . . . . . 754,000 754,440
Northwest Pipeline LLC4.000%, 04/01/27 (144A) . . . . . . . . . . . . . . . . . . . . . . . 2,735,000 2,645,897
Plains All American Pipeline L.P. / PAA Finance Corp.3.650%, 06/01/22 . . . . . . . . . . . . . . . . . . . . . . . . . . . . 280,000 276,527
Regency Energy Partners L.P. / Regency Energy Finance Corp.4.500%, 11/01/23 . . . . . . . . . . . . . . . . . . . . . . . . . . . . 2,190,000 2,221,0645.875%, 03/01/22 . . . . . . . . . . . . . . . . . . . . . . . . . . . . 3,395,000 3,592,026
Sabine Pass Liquefaction LLC5.625%, 04/15/23 . . . . . . . . . . . . . . . . . . . . . . . . . . . . 3,230,000 3,433,1515.750%, 05/15/24 . . . . . . . . . . . . . . . . . . . . . . . . . . . . 3,380,000 3,627,4585.875%, 06/30/26 . . . . . . . . . . . . . . . . . . . . . . . . . . . . 1,160,000 1,252,314
Spectra Energy Partners L.P.4.500%, 03/15/45 . . . . . . . . . . . . . . . . . . . . . . . . . . . . 2,060,000 1,967,513
Sunoco Logistics Partners Operations L.P.5.400%, 10/01/47 . . . . . . . . . . . . . . . . . . . . . . . . . . . . 2,610,000 2,577,859
TransCanada PipeLines, Ltd.4.875%, 05/15/48 . . . . . . . . . . . . . . . . . . . . . . . . . . . . 1,235,000 1,265,192
Security DescriptionPrincipalAmount* Value
Pipelines—(Continued)Transcontinental Gas Pipe Line Co. LLC
4.000%, 03/15/28 . . . . . . . . . . . . . . . . . . . . . . . . . . . . 1,750,000 $ 1,709,0664.600%, 03/15/48 . . . . . . . . . . . . . . . . . . . . . . . . . . . . 390,000 378,9127.850%, 02/01/26 . . . . . . . . . . . . . . . . . . . . . . . . . . . . 895,000 1,089,794
Williams Cos., Inc. (The)3.700%, 01/15/23 . . . . . . . . . . . . . . . . . . . . . . . . . . . . 1,070,000 1,057,8414.000%, 11/15/21 . . . . . . . . . . . . . . . . . . . . . . . . . . . . 675,000 681,1484.550%, 06/24/24 . . . . . . . . . . . . . . . . . . . . . . . . . . . . 680,000 690,6695.750%, 06/24/44 . . . . . . . . . . . . . . . . . . . . . . . . . . . . 1,480,000 1,581,7067.500%, 01/15/31 . . . . . . . . . . . . . . . . . . . . . . . . . . . . 645,000 782,930
Williams Partners L.P.4.000%, 09/15/25 . . . . . . . . . . . . . . . . . . . . . . . . . . . . 1,765,000 1,735,919
64,744,487
Real Estate Investment Trusts—0.3%American Tower Corp.
3.000%, 06/15/23 . . . . . . . . . . . . . . . . . . . . . . . . . . . . 1,520,000 1,463,0213.300%, 02/15/21 . . . . . . . . . . . . . . . . . . . . . . . . . . . . 1,342,000 1,333,7913.450%, 09/15/21 . . . . . . . . . . . . . . . . . . . . . . . . . . . . 500,000 497,869
CC Holdings GS V LLC / Crown Castle GS III Corp.3.849%, 04/15/23 . . . . . . . . . . . . . . . . . . . . . . . . . . . . 850,000 844,173
Crown Castle International Corp.2.250%, 09/01/21 . . . . . . . . . . . . . . . . . . . . . . . . . . . . 2,481,000 2,383,0093.200%, 09/01/24 . . . . . . . . . . . . . . . . . . . . . . . . . . . . 3,660,000 3,480,8533.400%, 02/15/21 . . . . . . . . . . . . . . . . . . . . . . . . . . . . 668,000 666,266
Trust F/14016.950%, 01/30/44 . . . . . . . . . . . . . . . . . . . . . . . . . . . . 280,000 288,400
10,957,382
Retail—0.3%Home Depot, Inc. (The)
5.875%, 12/16/36 . . . . . . . . . . . . . . . . . . . . . . . . . . . . 405,000 493,995Lowe’s Cos., Inc.
4.375%, 09/15/45 . . . . . . . . . . . . . . . . . . . . . . . . . . . . 1,405,000 1,413,176McDonald’s Corp.
3.700%, 02/15/42 . . . . . . . . . . . . . . . . . . . . . . . . . . . . 290,000 253,2424.450%, 03/01/47 . . . . . . . . . . . . . . . . . . . . . . . . . . . . 765,000 749,9654.450%, 09/01/48 . . . . . . . . . . . . . . . . . . . . . . . . . . . . 495,000 488,2084.700%, 12/09/35 . . . . . . . . . . . . . . . . . . . . . . . . . . . . 1,035,000 1,074,7084.875%, 12/09/45 . . . . . . . . . . . . . . . . . . . . . . . . . . . . 930,000 971,122
Walgreens Boots Alliance, Inc.3.800%, 11/18/24 . . . . . . . . . . . . . . . . . . . . . . . . . . . . 2,250,000 2,221,2434.800%, 11/18/44 . . . . . . . . . . . . . . . . . . . . . . . . . . . . 114,000 110,519
Walmart, Inc.3.550%, 06/26/25 . . . . . . . . . . . . . . . . . . . . . . . . . . . . 1,370,000 1,376,2094.050%, 06/29/48 . . . . . . . . . . . . . . . . . . . . . . . . . . . . 650,000 649,612
9,801,999
Semiconductors—0.8%Analog Devices, Inc.
2.500%, 12/05/21 . . . . . . . . . . . . . . . . . . . . . . . . . . . . 1,895,000 1,823,2673.500%, 12/05/26 . . . . . . . . . . . . . . . . . . . . . . . . . . . . 1,920,000 1,837,8793.900%, 12/15/25 . . . . . . . . . . . . . . . . . . . . . . . . . . . . 347,000 340,4325.300%, 12/15/45 . . . . . . . . . . . . . . . . . . . . . . . . . . . . 113,000 120,553
BHFTII-19
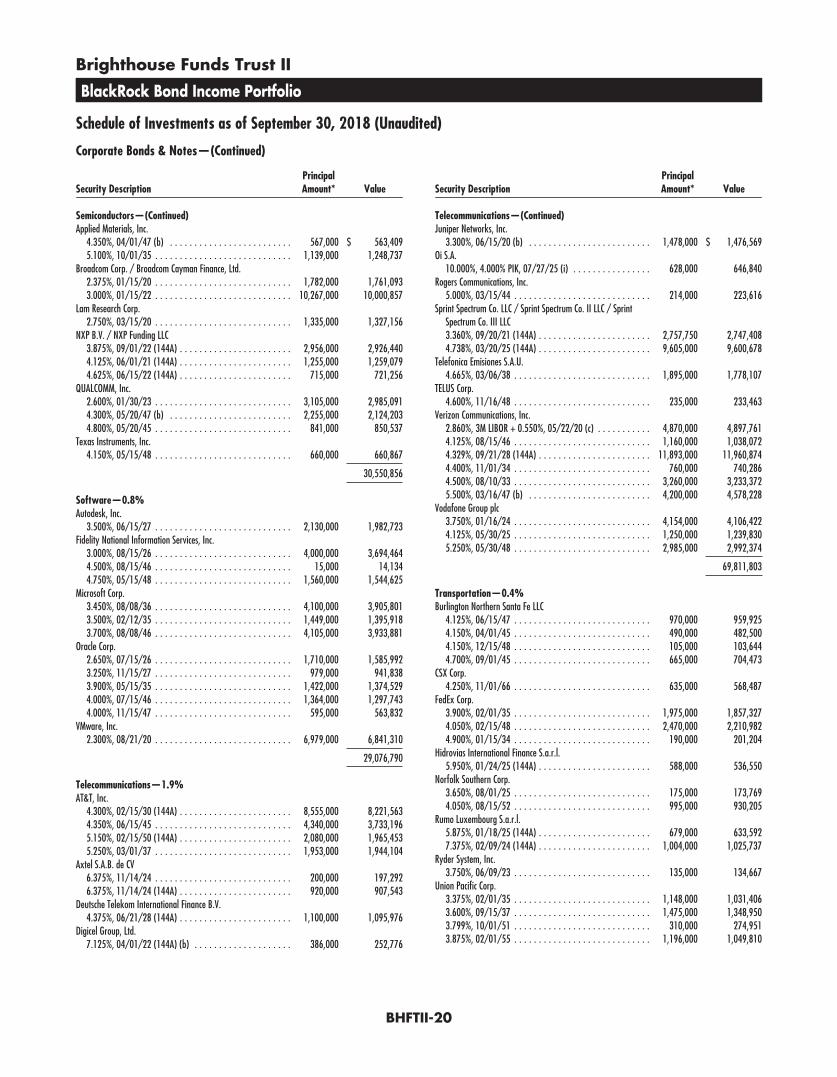
Brighthouse Funds Trust II
BlackRock Bond Income Portfolio
Schedule of Investments as of September 30, 2018 (Unaudited)
Corporate Bonds & Notes—(Continued)
Security DescriptionPrincipalAmount* Value
Semiconductors—(Continued)Applied Materials, Inc.
4.350%, 04/01/47 (b) . . . . . . . . . . . . . . . . . . . . . . . . . 567,000 $ 563,4095.100%, 10/01/35 . . . . . . . . . . . . . . . . . . . . . . . . . . . . 1,139,000 1,248,737
Broadcom Corp. / Broadcom Cayman Finance, Ltd.2.375%, 01/15/20 . . . . . . . . . . . . . . . . . . . . . . . . . . . . 1,782,000 1,761,0933.000%, 01/15/22 . . . . . . . . . . . . . . . . . . . . . . . . . . . . 10,267,000 10,000,857
Lam Research Corp.2.750%, 03/15/20 . . . . . . . . . . . . . . . . . . . . . . . . . . . . 1,335,000 1,327,156
NXP B.V. / NXP Funding LLC3.875%, 09/01/22 (144A) . . . . . . . . . . . . . . . . . . . . . . . 2,956,000 2,926,4404.125%, 06/01/21 (144A) . . . . . . . . . . . . . . . . . . . . . . . 1,255,000 1,259,0794.625%, 06/15/22 (144A) . . . . . . . . . . . . . . . . . . . . . . . 715,000 721,256
QUALCOMM, Inc.2.600%, 01/30/23 . . . . . . . . . . . . . . . . . . . . . . . . . . . . 3,105,000 2,985,0914.300%, 05/20/47 (b) . . . . . . . . . . . . . . . . . . . . . . . . . 2,255,000 2,124,2034.800%, 05/20/45 . . . . . . . . . . . . . . . . . . . . . . . . . . . . 841,000 850,537
Texas Instruments, Inc.4.150%, 05/15/48 . . . . . . . . . . . . . . . . . . . . . . . . . . . . 660,000 660,867
30,550,856
Software—0.8%Autodesk, Inc.
3.500%, 06/15/27 . . . . . . . . . . . . . . . . . . . . . . . . . . . . 2,130,000 1,982,723Fidelity National Information Services, Inc.
3.000%, 08/15/26 . . . . . . . . . . . . . . . . . . . . . . . . . . . . 4,000,000 3,694,4644.500%, 08/15/46 . . . . . . . . . . . . . . . . . . . . . . . . . . . . 15,000 14,1344.750%, 05/15/48 . . . . . . . . . . . . . . . . . . . . . . . . . . . . 1,560,000 1,544,625
Microsoft Corp.3.450%, 08/08/36 . . . . . . . . . . . . . . . . . . . . . . . . . . . . 4,100,000 3,905,8013.500%, 02/12/35 . . . . . . . . . . . . . . . . . . . . . . . . . . . . 1,449,000 1,395,9183.700%, 08/08/46 . . . . . . . . . . . . . . . . . . . . . . . . . . . . 4,105,000 3,933,881
Oracle Corp.2.650%, 07/15/26 . . . . . . . . . . . . . . . . . . . . . . . . . . . . 1,710,000 1,585,9923.250%, 11/15/27 . . . . . . . . . . . . . . . . . . . . . . . . . . . . 979,000 941,8383.900%, 05/15/35 . . . . . . . . . . . . . . . . . . . . . . . . . . . . 1,422,000 1,374,5294.000%, 07/15/46 . . . . . . . . . . . . . . . . . . . . . . . . . . . . 1,364,000 1,297,7434.000%, 11/15/47 . . . . . . . . . . . . . . . . . . . . . . . . . . . . 595,000 563,832
VMware, Inc.2.300%, 08/21/20 . . . . . . . . . . . . . . . . . . . . . . . . . . . . 6,979,000 6,841,310
29,076,790
Telecommunications—1.9%AT&T, Inc.
4.300%, 02/15/30 (144A) . . . . . . . . . . . . . . . . . . . . . . . 8,555,000 8,221,5634.350%, 06/15/45 . . . . . . . . . . . . . . . . . . . . . . . . . . . . 4,340,000 3,733,1965.150%, 02/15/50 (144A) . . . . . . . . . . . . . . . . . . . . . . . 2,080,000 1,965,4535.250%, 03/01/37 . . . . . . . . . . . . . . . . . . . . . . . . . . . . 1,953,000 1,944,104
Axtel S.A.B. de CV6.375%, 11/14/24 . . . . . . . . . . . . . . . . . . . . . . . . . . . . 200,000 197,2926.375%, 11/14/24 (144A) . . . . . . . . . . . . . . . . . . . . . . . 920,000 907,543
Deutsche Telekom International Finance B.V.4.375%, 06/21/28 (144A) . . . . . . . . . . . . . . . . . . . . . . . 1,100,000 1,095,976
Digicel Group, Ltd.7.125%, 04/01/22 (144A) (b) . . . . . . . . . . . . . . . . . . . . 386,000 252,776
Security DescriptionPrincipalAmount* Value
Telecommunications—(Continued)Juniper Networks, Inc.
3.300%, 06/15/20 (b) . . . . . . . . . . . . . . . . . . . . . . . . . 1,478,000 $ 1,476,569Oi S.A.
10.000%, 4.000% PIK, 07/27/25 (i) . . . . . . . . . . . . . . . . 628,000 646,840Rogers Communications, Inc.
5.000%, 03/15/44 . . . . . . . . . . . . . . . . . . . . . . . . . . . . 214,000 223,616Sprint Spectrum Co. LLC / Sprint Spectrum Co. II LLC / Sprint
Spectrum Co. III LLC3.360%, 09/20/21 (144A) . . . . . . . . . . . . . . . . . . . . . . . 2,757,750 2,747,4084.738%, 03/20/25 (144A) . . . . . . . . . . . . . . . . . . . . . . . 9,605,000 9,600,678
Telefonica Emisiones S.A.U.4.665%, 03/06/38 . . . . . . . . . . . . . . . . . . . . . . . . . . . . 1,895,000 1,778,107
TELUS Corp.4.600%, 11/16/48 . . . . . . . . . . . . . . . . . . . . . . . . . . . . 235,000 233,463
Verizon Communications, Inc.2.860%, 3M LIBOR + 0.550%, 05/22/20 (c) . . . . . . . . . . . 4,870,000 4,897,7614.125%, 08/15/46 . . . . . . . . . . . . . . . . . . . . . . . . . . . . 1,160,000 1,038,0724.329%, 09/21/28 (144A) . . . . . . . . . . . . . . . . . . . . . . . 11,893,000 11,960,8744.400%, 11/01/34 . . . . . . . . . . . . . . . . . . . . . . . . . . . . 760,000 740,2864.500%, 08/10/33 . . . . . . . . . . . . . . . . . . . . . . . . . . . . 3,260,000 3,233,3725.500%, 03/16/47 (b) . . . . . . . . . . . . . . . . . . . . . . . . . 4,200,000 4,578,228
Vodafone Group plc3.750%, 01/16/24 . . . . . . . . . . . . . . . . . . . . . . . . . . . . 4,154,000 4,106,4224.125%, 05/30/25 . . . . . . . . . . . . . . . . . . . . . . . . . . . . 1,250,000 1,239,8305.250%, 05/30/48 . . . . . . . . . . . . . . . . . . . . . . . . . . . . 2,985,000 2,992,374
69,811,803
Transportation—0.4%Burlington Northern Santa Fe LLC
4.125%, 06/15/47 . . . . . . . . . . . . . . . . . . . . . . . . . . . . 970,000 959,9254.150%, 04/01/45 . . . . . . . . . . . . . . . . . . . . . . . . . . . . 490,000 482,5004.150%, 12/15/48 . . . . . . . . . . . . . . . . . . . . . . . . . . . . 105,000 103,6444.700%, 09/01/45 . . . . . . . . . . . . . . . . . . . . . . . . . . . . 665,000 704,473
CSX Corp.4.250%, 11/01/66 . . . . . . . . . . . . . . . . . . . . . . . . . . . . 635,000 568,487
FedEx Corp.3.900%, 02/01/35 . . . . . . . . . . . . . . . . . . . . . . . . . . . . 1,975,000 1,857,3274.050%, 02/15/48 . . . . . . . . . . . . . . . . . . . . . . . . . . . . 2,470,000 2,210,9824.900%, 01/15/34 . . . . . . . . . . . . . . . . . . . . . . . . . . . . 190,000 201,204
Hidrovias International Finance S.a.r.l.5.950%, 01/24/25 (144A) . . . . . . . . . . . . . . . . . . . . . . . 588,000 536,550
Norfolk Southern Corp.3.650%, 08/01/25 . . . . . . . . . . . . . . . . . . . . . . . . . . . . 175,000 173,7694.050%, 08/15/52 . . . . . . . . . . . . . . . . . . . . . . . . . . . . 995,000 930,205
Rumo Luxembourg S.a.r.l.5.875%, 01/18/25 (144A) . . . . . . . . . . . . . . . . . . . . . . . 679,000 633,5927.375%, 02/09/24 (144A) . . . . . . . . . . . . . . . . . . . . . . . 1,004,000 1,025,737
Ryder System, Inc.3.750%, 06/09/23 . . . . . . . . . . . . . . . . . . . . . . . . . . . . 135,000 134,667
Union Pacific Corp.3.375%, 02/01/35 . . . . . . . . . . . . . . . . . . . . . . . . . . . . 1,148,000 1,031,4063.600%, 09/15/37 . . . . . . . . . . . . . . . . . . . . . . . . . . . . 1,475,000 1,348,9503.799%, 10/01/51 . . . . . . . . . . . . . . . . . . . . . . . . . . . . 310,000 274,9513.875%, 02/01/55 . . . . . . . . . . . . . . . . . . . . . . . . . . . . 1,196,000 1,049,810
BHFTII-20
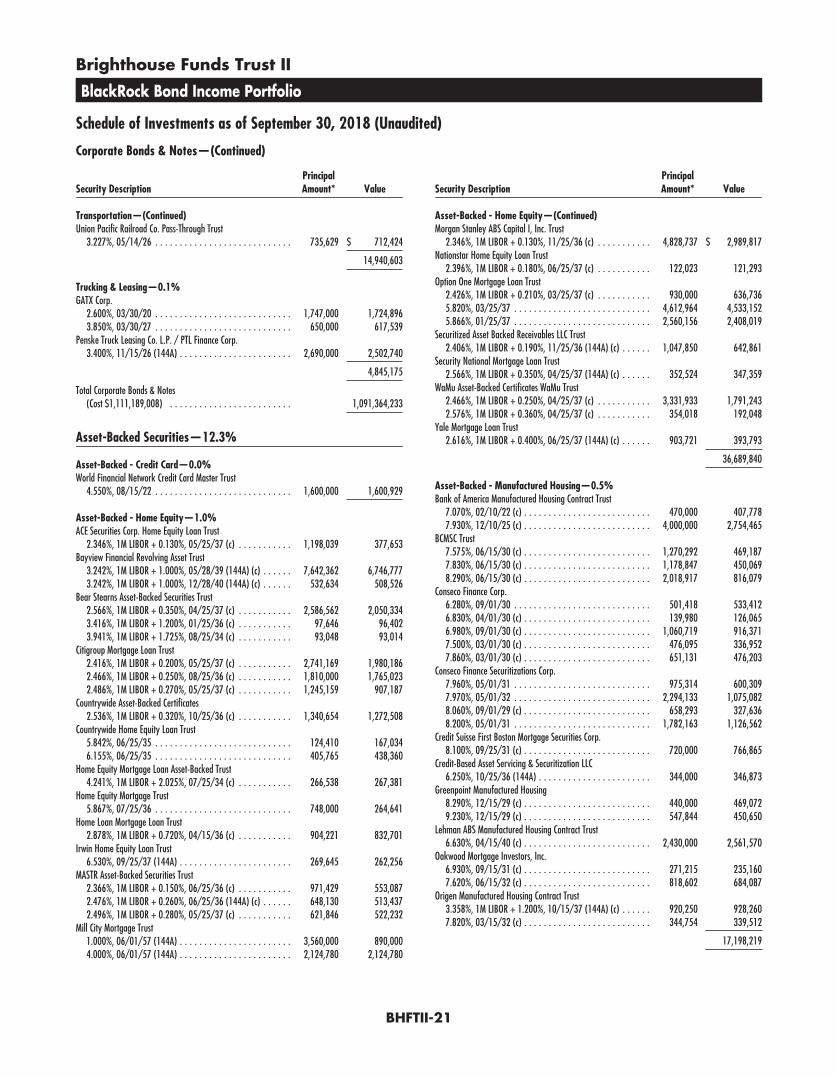
Brighthouse Funds Trust II
BlackRock Bond Income Portfolio
Schedule of Investments as of September 30, 2018 (Unaudited)
Corporate Bonds & Notes—(Continued)
Security DescriptionPrincipalAmount* Value
Transportation—(Continued)Union Pacific Railroad Co. Pass-Through Trust
3.227%, 05/14/26 . . . . . . . . . . . . . . . . . . . . . . . . . . . . 735,629 $ 712,424
14,940,603
Trucking & Leasing—0.1%GATX Corp.
2.600%, 03/30/20 . . . . . . . . . . . . . . . . . . . . . . . . . . . . 1,747,000 1,724,8963.850%, 03/30/27 . . . . . . . . . . . . . . . . . . . . . . . . . . . . 650,000 617,539
Penske Truck Leasing Co. L.P. / PTL Finance Corp.3.400%, 11/15/26 (144A) . . . . . . . . . . . . . . . . . . . . . . . 2,690,000 2,502,740
4,845,175
Total Corporate Bonds & Notes(Cost $1,111,189,008) . . . . . . . . . . . . . . . . . . . . . . . . . 1,091,364,233
Asset-Backed Securities—12.3%
Asset-Backed - Credit Card—0.0%World Financial Network Credit Card Master Trust
4.550%, 08/15/22 . . . . . . . . . . . . . . . . . . . . . . . . . . . . 1,600,000 1,600,929
Asset-Backed - Home Equity—1.0%ACE Securities Corp. Home Equity Loan Trust
2.346%, 1M LIBOR + 0.130%, 05/25/37 (c) . . . . . . . . . . . 1,198,039 377,653Bayview Financial Revolving Asset Trust
3.242%, 1M LIBOR + 1.000%, 05/28/39 (144A) (c) . . . . . . 7,642,362 6,746,7773.242%, 1M LIBOR + 1.000%, 12/28/40 (144A) (c) . . . . . . 532,634 508,526
Bear Stearns Asset-Backed Securities Trust2.566%, 1M LIBOR + 0.350%, 04/25/37 (c) . . . . . . . . . . . 2,586,562 2,050,3343.416%, 1M LIBOR + 1.200%, 01/25/36 (c) . . . . . . . . . . . 97,646 96,4023.941%, 1M LIBOR + 1.725%, 08/25/34 (c) . . . . . . . . . . . 93,048 93,014
Citigroup Mortgage Loan Trust2.416%, 1M LIBOR + 0.200%, 05/25/37 (c) . . . . . . . . . . . 2,741,169 1,980,1862.466%, 1M LIBOR + 0.250%, 08/25/36 (c) . . . . . . . . . . . 1,810,000 1,765,0232.486%, 1M LIBOR + 0.270%, 05/25/37 (c) . . . . . . . . . . . 1,245,159 907,187
Countrywide Asset-Backed Certificates2.536%, 1M LIBOR + 0.320%, 10/25/36 (c) . . . . . . . . . . . 1,340,654 1,272,508
Countrywide Home Equity Loan Trust5.842%, 06/25/35 . . . . . . . . . . . . . . . . . . . . . . . . . . . . 124,410 167,0346.155%, 06/25/35 . . . . . . . . . . . . . . . . . . . . . . . . . . . . 405,765 438,360
Home Equity Mortgage Loan Asset-Backed Trust4.241%, 1M LIBOR + 2.025%, 07/25/34 (c) . . . . . . . . . . . 266,538 267,381
Home Equity Mortgage Trust5.867%, 07/25/36 . . . . . . . . . . . . . . . . . . . . . . . . . . . . 748,000 264,641
Home Loan Mortgage Loan Trust2.878%, 1M LIBOR + 0.720%, 04/15/36 (c) . . . . . . . . . . . 904,221 832,701
Irwin Home Equity Loan Trust6.530%, 09/25/37 (144A) . . . . . . . . . . . . . . . . . . . . . . . 269,645 262,256
MASTR Asset-Backed Securities Trust2.366%, 1M LIBOR + 0.150%, 06/25/36 (c) . . . . . . . . . . . 971,429 553,0872.476%, 1M LIBOR + 0.260%, 06/25/36 (144A) (c) . . . . . . 648,130 513,4372.496%, 1M LIBOR + 0.280%, 05/25/37 (c) . . . . . . . . . . . 621,846 522,232
Mill City Mortgage Trust1.000%, 06/01/57 (144A) . . . . . . . . . . . . . . . . . . . . . . . 3,560,000 890,0004.000%, 06/01/57 (144A) . . . . . . . . . . . . . . . . . . . . . . . 2,124,780 2,124,780
Security DescriptionPrincipalAmount* Value
Asset-Backed - Home Equity—(Continued)Morgan Stanley ABS Capital I, Inc. Trust
2.346%, 1M LIBOR + 0.130%, 11/25/36 (c) . . . . . . . . . . . 4,828,737 $ 2,989,817Nationstar Home Equity Loan Trust
2.396%, 1M LIBOR + 0.180%, 06/25/37 (c) . . . . . . . . . . . 122,023 121,293Option One Mortgage Loan Trust
2.426%, 1M LIBOR + 0.210%, 03/25/37 (c) . . . . . . . . . . . 930,000 636,7365.820%, 03/25/37 . . . . . . . . . . . . . . . . . . . . . . . . . . . . 4,612,964 4,533,1525.866%, 01/25/37 . . . . . . . . . . . . . . . . . . . . . . . . . . . . 2,560,156 2,408,019
Securitized Asset Backed Receivables LLC Trust2.406%, 1M LIBOR + 0.190%, 11/25/36 (144A) (c) . . . . . . 1,047,850 642,861
Security National Mortgage Loan Trust2.566%, 1M LIBOR + 0.350%, 04/25/37 (144A) (c) . . . . . . 352,524 347,359
WaMu Asset-Backed Certificates WaMu Trust2.466%, 1M LIBOR + 0.250%, 04/25/37 (c) . . . . . . . . . . . 3,331,933 1,791,2432.576%, 1M LIBOR + 0.360%, 04/25/37 (c) . . . . . . . . . . . 354,018 192,048
Yale Mortgage Loan Trust2.616%, 1M LIBOR + 0.400%, 06/25/37 (144A) (c) . . . . . . 903,721 393,793
36,689,840
Asset-Backed - Manufactured Housing—0.5%Bank of America Manufactured Housing Contract Trust
7.070%, 02/10/22 (c) . . . . . . . . . . . . . . . . . . . . . . . . . . 470,000 407,7787.930%, 12/10/25 (c) . . . . . . . . . . . . . . . . . . . . . . . . . . 4,000,000 2,754,465
BCMSC Trust7.575%, 06/15/30 (c) . . . . . . . . . . . . . . . . . . . . . . . . . . 1,270,292 469,1877.830%, 06/15/30 (c) . . . . . . . . . . . . . . . . . . . . . . . . . . 1,178,847 450,0698.290%, 06/15/30 (c) . . . . . . . . . . . . . . . . . . . . . . . . . . 2,018,917 816,079
Conseco Finance Corp.6.280%, 09/01/30 . . . . . . . . . . . . . . . . . . . . . . . . . . . . 501,418 533,4126.830%, 04/01/30 (c) . . . . . . . . . . . . . . . . . . . . . . . . . . 139,980 126,0656.980%, 09/01/30 (c) . . . . . . . . . . . . . . . . . . . . . . . . . . 1,060,719 916,3717.500%, 03/01/30 (c) . . . . . . . . . . . . . . . . . . . . . . . . . . 476,095 336,9527.860%, 03/01/30 (c) . . . . . . . . . . . . . . . . . . . . . . . . . . 651,131 476,203
Conseco Finance Securitizations Corp.7.960%, 05/01/31 . . . . . . . . . . . . . . . . . . . . . . . . . . . . 975,314 600,3097.970%, 05/01/32 . . . . . . . . . . . . . . . . . . . . . . . . . . . . 2,294,133 1,075,0828.060%, 09/01/29 (c) . . . . . . . . . . . . . . . . . . . . . . . . . . 658,293 327,6368.200%, 05/01/31 . . . . . . . . . . . . . . . . . . . . . . . . . . . . 1,782,163 1,126,562
Credit Suisse First Boston Mortgage Securities Corp.8.100%, 09/25/31 (c) . . . . . . . . . . . . . . . . . . . . . . . . . . 720,000 766,865
Credit-Based Asset Servicing & Securitization LLC6.250%, 10/25/36 (144A) . . . . . . . . . . . . . . . . . . . . . . . 344,000 346,873
Greenpoint Manufactured Housing8.290%, 12/15/29 (c) . . . . . . . . . . . . . . . . . . . . . . . . . . 440,000 469,0729.230%, 12/15/29 (c) . . . . . . . . . . . . . . . . . . . . . . . . . . 547,844 450,650
Lehman ABS Manufactured Housing Contract Trust6.630%, 04/15/40 (c) . . . . . . . . . . . . . . . . . . . . . . . . . . 2,430,000 2,561,570
Oakwood Mortgage Investors, Inc.6.930%, 09/15/31 (c) . . . . . . . . . . . . . . . . . . . . . . . . . . 271,215 235,1607.620%, 06/15/32 (c) . . . . . . . . . . . . . . . . . . . . . . . . . . 818,602 684,087
Origen Manufactured Housing Contract Trust3.358%, 1M LIBOR + 1.200%, 10/15/37 (144A) (c) . . . . . . 920,250 928,2607.820%, 03/15/32 (c) . . . . . . . . . . . . . . . . . . . . . . . . . . 344,754 339,512
17,198,219
BHFTII-21
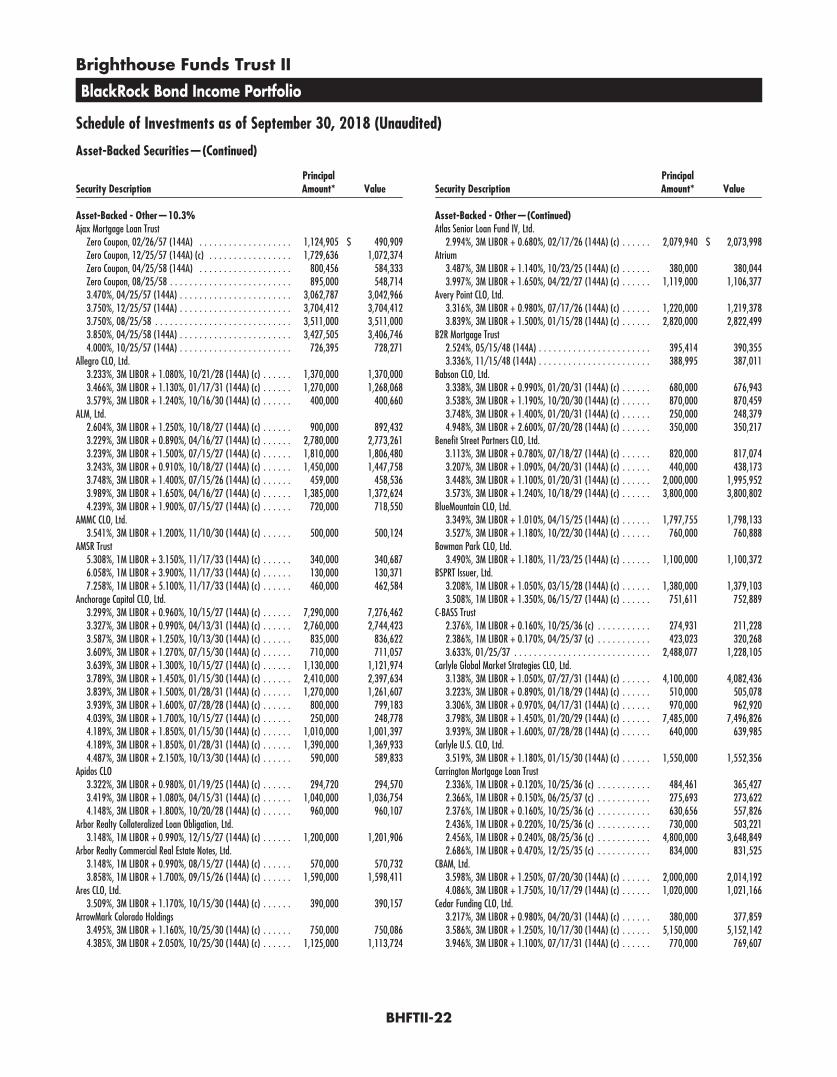
Brighthouse Funds Trust II
BlackRock Bond Income Portfolio
Schedule of Investments as of September 30, 2018 (Unaudited)
Asset-Backed Securities—(Continued)
Security DescriptionPrincipalAmount* Value
Asset-Backed - Other—10.3%Ajax Mortgage Loan Trust
Zero Coupon, 02/26/57 (144A) . . . . . . . . . . . . . . . . . . . 1,124,905 $ 490,909Zero Coupon, 12/25/57 (144A) (c) . . . . . . . . . . . . . . . . . 1,729,636 1,072,374Zero Coupon, 04/25/58 (144A) . . . . . . . . . . . . . . . . . . . 800,456 584,333Zero Coupon, 08/25/58 . . . . . . . . . . . . . . . . . . . . . . . . . 895,000 548,7143.470%, 04/25/57 (144A) . . . . . . . . . . . . . . . . . . . . . . . 3,062,787 3,042,9663.750%, 12/25/57 (144A) . . . . . . . . . . . . . . . . . . . . . . . 3,704,412 3,704,4123.750%, 08/25/58 . . . . . . . . . . . . . . . . . . . . . . . . . . . . 3,511,000 3,511,0003.850%, 04/25/58 (144A) . . . . . . . . . . . . . . . . . . . . . . . 3,427,505 3,406,7464.000%, 10/25/57 (144A) . . . . . . . . . . . . . . . . . . . . . . . 726,395 728,271
Allegro CLO, Ltd.3.233%, 3M LIBOR + 1.080%, 10/21/28 (144A) (c) . . . . . . 1,370,000 1,370,0003.466%, 3M LIBOR + 1.130%, 01/17/31 (144A) (c) . . . . . . 1,270,000 1,268,0683.579%, 3M LIBOR + 1.240%, 10/16/30 (144A) (c) . . . . . . 400,000 400,660
ALM, Ltd.2.604%, 3M LIBOR + 1.250%, 10/18/27 (144A) (c) . . . . . . 900,000 892,4323.229%, 3M LIBOR + 0.890%, 04/16/27 (144A) (c) . . . . . . 2,780,000 2,773,2613.239%, 3M LIBOR + 1.500%, 07/15/27 (144A) (c) . . . . . . 1,810,000 1,806,4803.243%, 3M LIBOR + 0.910%, 10/18/27 (144A) (c) . . . . . . 1,450,000 1,447,7583.748%, 3M LIBOR + 1.400%, 07/15/26 (144A) (c) . . . . . . 459,000 458,5363.989%, 3M LIBOR + 1.650%, 04/16/27 (144A) (c) . . . . . . 1,385,000 1,372,6244.239%, 3M LIBOR + 1.900%, 07/15/27 (144A) (c) . . . . . . 720,000 718,550
AMMC CLO, Ltd.3.541%, 3M LIBOR + 1.200%, 11/10/30 (144A) (c) . . . . . . 500,000 500,124
AMSR Trust5.308%, 1M LIBOR + 3.150%, 11/17/33 (144A) (c) . . . . . . 340,000 340,6876.058%, 1M LIBOR + 3.900%, 11/17/33 (144A) (c) . . . . . . 130,000 130,3717.258%, 1M LIBOR + 5.100%, 11/17/33 (144A) (c) . . . . . . 460,000 462,584
Anchorage Capital CLO, Ltd.3.299%, 3M LIBOR + 0.960%, 10/15/27 (144A) (c) . . . . . . 7,290,000 7,276,4623.327%, 3M LIBOR + 0.990%, 04/13/31 (144A) (c) . . . . . . 2,760,000 2,744,4233.587%, 3M LIBOR + 1.250%, 10/13/30 (144A) (c) . . . . . . 835,000 836,6223.609%, 3M LIBOR + 1.270%, 07/15/30 (144A) (c) . . . . . . 710,000 711,0573.639%, 3M LIBOR + 1.300%, 10/15/27 (144A) (c) . . . . . . 1,130,000 1,121,9743.789%, 3M LIBOR + 1.450%, 01/15/30 (144A) (c) . . . . . . 2,410,000 2,397,6343.839%, 3M LIBOR + 1.500%, 01/28/31 (144A) (c) . . . . . . 1,270,000 1,261,6073.939%, 3M LIBOR + 1.600%, 07/28/28 (144A) (c) . . . . . . 800,000 799,1834.039%, 3M LIBOR + 1.700%, 10/15/27 (144A) (c) . . . . . . 250,000 248,7784.189%, 3M LIBOR + 1.850%, 01/15/30 (144A) (c) . . . . . . 1,010,000 1,001,3974.189%, 3M LIBOR + 1.850%, 01/28/31 (144A) (c) . . . . . . 1,390,000 1,369,9334.487%, 3M LIBOR + 2.150%, 10/13/30 (144A) (c) . . . . . . 590,000 589,833
Apidos CLO3.322%, 3M LIBOR + 0.980%, 01/19/25 (144A) (c) . . . . . . 294,720 294,5703.419%, 3M LIBOR + 1.080%, 04/15/31 (144A) (c) . . . . . . 1,040,000 1,036,7544.148%, 3M LIBOR + 1.800%, 10/20/28 (144A) (c) . . . . . . 960,000 960,107
Arbor Realty Collateralized Loan Obligation, Ltd.3.148%, 1M LIBOR + 0.990%, 12/15/27 (144A) (c) . . . . . . 1,200,000 1,201,906
Arbor Realty Commercial Real Estate Notes, Ltd.3.148%, 1M LIBOR + 0.990%, 08/15/27 (144A) (c) . . . . . . 570,000 570,7323.858%, 1M LIBOR + 1.700%, 09/15/26 (144A) (c) . . . . . . 1,590,000 1,598,411
Ares CLO, Ltd.3.509%, 3M LIBOR + 1.170%, 10/15/30 (144A) (c) . . . . . . 390,000 390,157
ArrowMark Colorado Holdings3.495%, 3M LIBOR + 1.160%, 10/25/30 (144A) (c) . . . . . . 750,000 750,0864.385%, 3M LIBOR + 2.050%, 10/25/30 (144A) (c) . . . . . . 1,125,000 1,113,724
Security DescriptionPrincipalAmount* Value
Asset-Backed - Other—(Continued)Atlas Senior Loan Fund IV, Ltd.
2.994%, 3M LIBOR + 0.680%, 02/17/26 (144A) (c) . . . . . . 2,079,940 $ 2,073,998Atrium
3.487%, 3M LIBOR + 1.140%, 10/23/25 (144A) (c) . . . . . . 380,000 380,0443.997%, 3M LIBOR + 1.650%, 04/22/27 (144A) (c) . . . . . . 1,119,000 1,106,377
Avery Point CLO, Ltd.3.316%, 3M LIBOR + 0.980%, 07/17/26 (144A) (c) . . . . . . 1,220,000 1,219,3783.839%, 3M LIBOR + 1.500%, 01/15/28 (144A) (c) . . . . . . 2,820,000 2,822,499
B2R Mortgage Trust2.524%, 05/15/48 (144A) . . . . . . . . . . . . . . . . . . . . . . . 395,414 390,3553.336%, 11/15/48 (144A) . . . . . . . . . . . . . . . . . . . . . . . 388,995 387,011
Babson CLO, Ltd.3.338%, 3M LIBOR + 0.990%, 01/20/31 (144A) (c) . . . . . . 680,000 676,9433.538%, 3M LIBOR + 1.190%, 10/20/30 (144A) (c) . . . . . . 870,000 870,4593.748%, 3M LIBOR + 1.400%, 01/20/31 (144A) (c) . . . . . . 250,000 248,3794.948%, 3M LIBOR + 2.600%, 07/20/28 (144A) (c) . . . . . . 350,000 350,217
Benefit Street Partners CLO, Ltd.3.113%, 3M LIBOR + 0.780%, 07/18/27 (144A) (c) . . . . . . 820,000 817,0743.207%, 3M LIBOR + 1.090%, 04/20/31 (144A) (c) . . . . . . 440,000 438,1733.448%, 3M LIBOR + 1.100%, 01/20/31 (144A) (c) . . . . . . 2,000,000 1,995,9523.573%, 3M LIBOR + 1.240%, 10/18/29 (144A) (c) . . . . . . 3,800,000 3,800,802
BlueMountain CLO, Ltd.3.349%, 3M LIBOR + 1.010%, 04/15/25 (144A) (c) . . . . . . 1,797,755 1,798,1333.527%, 3M LIBOR + 1.180%, 10/22/30 (144A) (c) . . . . . . 760,000 760,888
Bowman Park CLO, Ltd.3.490%, 3M LIBOR + 1.180%, 11/23/25 (144A) (c) . . . . . . 1,100,000 1,100,372
BSPRT Issuer, Ltd.3.208%, 1M LIBOR + 1.050%, 03/15/28 (144A) (c) . . . . . . 1,380,000 1,379,1033.508%, 1M LIBOR + 1.350%, 06/15/27 (144A) (c) . . . . . . 751,611 752,889
C-BASS Trust2.376%, 1M LIBOR + 0.160%, 10/25/36 (c) . . . . . . . . . . . 274,931 211,2282.386%, 1M LIBOR + 0.170%, 04/25/37 (c) . . . . . . . . . . . 423,023 320,2683.633%, 01/25/37 . . . . . . . . . . . . . . . . . . . . . . . . . . . . 2,488,077 1,228,105
Carlyle Global Market Strategies CLO, Ltd.3.138%, 3M LIBOR + 1.050%, 07/27/31 (144A) (c) . . . . . . 4,100,000 4,082,4363.223%, 3M LIBOR + 0.890%, 01/18/29 (144A) (c) . . . . . . 510,000 505,0783.306%, 3M LIBOR + 0.970%, 04/17/31 (144A) (c) . . . . . . 970,000 962,9203.798%, 3M LIBOR + 1.450%, 01/20/29 (144A) (c) . . . . . . 7,485,000 7,496,8263.939%, 3M LIBOR + 1.600%, 07/28/28 (144A) (c) . . . . . . 640,000 639,985
Carlyle U.S. CLO, Ltd.3.519%, 3M LIBOR + 1.180%, 01/15/30 (144A) (c) . . . . . . 1,550,000 1,552,356
Carrington Mortgage Loan Trust2.336%, 1M LIBOR + 0.120%, 10/25/36 (c) . . . . . . . . . . . 484,461 365,4272.366%, 1M LIBOR + 0.150%, 06/25/37 (c) . . . . . . . . . . . 275,693 273,6222.376%, 1M LIBOR + 0.160%, 10/25/36 (c) . . . . . . . . . . . 630,656 557,8262.436%, 1M LIBOR + 0.220%, 10/25/36 (c) . . . . . . . . . . . 730,000 503,2212.456%, 1M LIBOR + 0.240%, 08/25/36 (c) . . . . . . . . . . . 4,800,000 3,648,8492.686%, 1M LIBOR + 0.470%, 12/25/35 (c) . . . . . . . . . . . 834,000 831,525
CBAM, Ltd.3.598%, 3M LIBOR + 1.250%, 07/20/30 (144A) (c) . . . . . . 2,000,000 2,014,1924.086%, 3M LIBOR + 1.750%, 10/17/29 (144A) (c) . . . . . . 1,020,000 1,021,166
Cedar Funding CLO, Ltd.3.217%, 3M LIBOR + 0.980%, 04/20/31 (144A) (c) . . . . . . 380,000 377,8593.586%, 3M LIBOR + 1.250%, 10/17/30 (144A) (c) . . . . . . 5,150,000 5,152,1423.946%, 3M LIBOR + 1.100%, 07/17/31 (144A) (c) . . . . . . 770,000 769,607
BHFTII-22
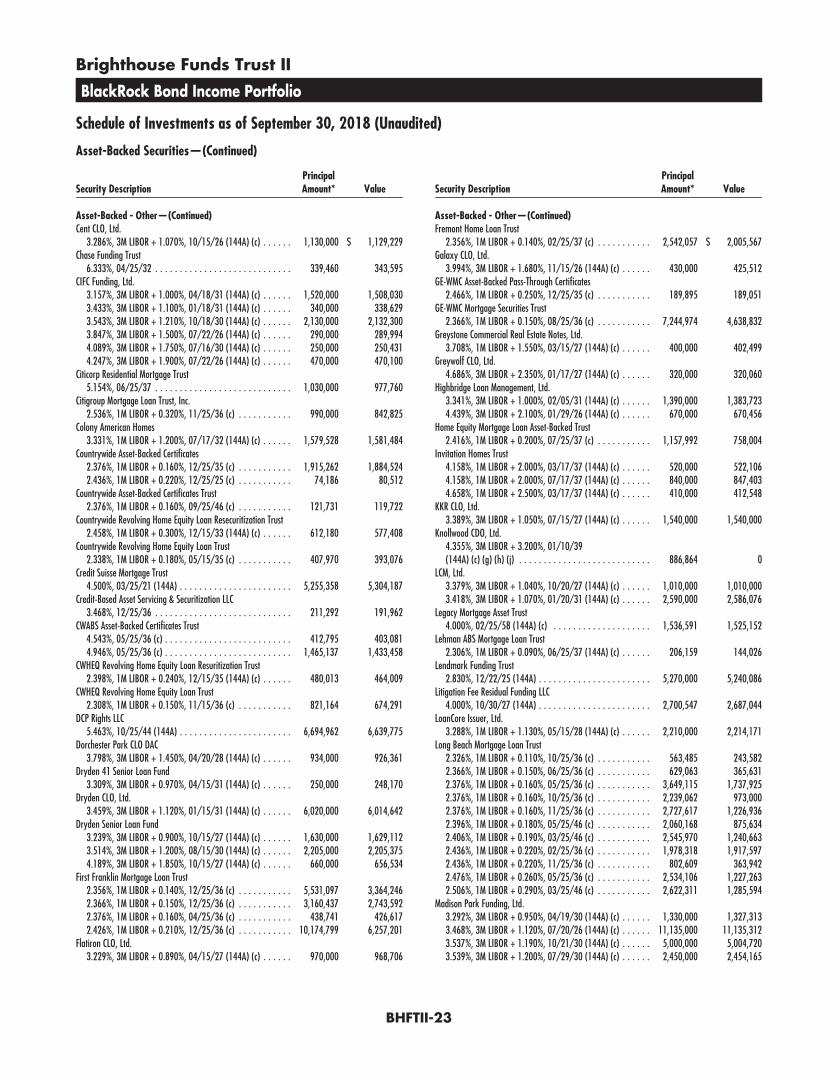
Brighthouse Funds Trust II
BlackRock Bond Income Portfolio
Schedule of Investments as of September 30, 2018 (Unaudited)
Asset-Backed Securities—(Continued)
Security DescriptionPrincipalAmount* Value
Asset-Backed - Other—(Continued)Cent CLO, Ltd.
3.286%, 3M LIBOR + 1.070%, 10/15/26 (144A) (c) . . . . . . 1,130,000 $ 1,129,229Chase Funding Trust
6.333%, 04/25/32 . . . . . . . . . . . . . . . . . . . . . . . . . . . . 339,460 343,595CIFC Funding, Ltd.
3.157%, 3M LIBOR + 1.000%, 04/18/31 (144A) (c) . . . . . . 1,520,000 1,508,0303.433%, 3M LIBOR + 1.100%, 01/18/31 (144A) (c) . . . . . . 340,000 338,6293.543%, 3M LIBOR + 1.210%, 10/18/30 (144A) (c) . . . . . . 2,130,000 2,132,3003.847%, 3M LIBOR + 1.500%, 07/22/26 (144A) (c) . . . . . . 290,000 289,9944.089%, 3M LIBOR + 1.750%, 07/16/30 (144A) (c) . . . . . . 250,000 250,4314.247%, 3M LIBOR + 1.900%, 07/22/26 (144A) (c) . . . . . . 470,000 470,100
Citicorp Residential Mortgage Trust5.154%, 06/25/37 . . . . . . . . . . . . . . . . . . . . . . . . . . . . 1,030,000 977,760
Citigroup Mortgage Loan Trust, Inc.2.536%, 1M LIBOR + 0.320%, 11/25/36 (c) . . . . . . . . . . . 990,000 842,825
Colony American Homes3.331%, 1M LIBOR + 1.200%, 07/17/32 (144A) (c) . . . . . . 1,579,528 1,581,484
Countrywide Asset-Backed Certificates2.376%, 1M LIBOR + 0.160%, 12/25/35 (c) . . . . . . . . . . . 1,915,262 1,884,5242.436%, 1M LIBOR + 0.220%, 12/25/25 (c) . . . . . . . . . . . 74,186 80,512
Countrywide Asset-Backed Certificates Trust2.376%, 1M LIBOR + 0.160%, 09/25/46 (c) . . . . . . . . . . . 121,731 119,722
Countrywide Revolving Home Equity Loan Resecuritization Trust2.458%, 1M LIBOR + 0.300%, 12/15/33 (144A) (c) . . . . . . 612,180 577,408
Countrywide Revolving Home Equity Loan Trust2.338%, 1M LIBOR + 0.180%, 05/15/35 (c) . . . . . . . . . . . 407,970 393,076
Credit Suisse Mortgage Trust4.500%, 03/25/21 (144A) . . . . . . . . . . . . . . . . . . . . . . . 5,255,358 5,304,187
Credit-Based Asset Servicing & Securitization LLC3.468%, 12/25/36 . . . . . . . . . . . . . . . . . . . . . . . . . . . . 211,292 191,962
CWABS Asset-Backed Certificates Trust4.543%, 05/25/36 (c) . . . . . . . . . . . . . . . . . . . . . . . . . . 412,795 403,0814.946%, 05/25/36 (c) . . . . . . . . . . . . . . . . . . . . . . . . . . 1,465,137 1,433,458
CWHEQ Revolving Home Equity Loan Resuritization Trust2.398%, 1M LIBOR + 0.240%, 12/15/35 (144A) (c) . . . . . . 480,013 464,009
CWHEQ Revolving Home Equity Loan Trust2.308%, 1M LIBOR + 0.150%, 11/15/36 (c) . . . . . . . . . . . 821,164 674,291
DCP Rights LLC5.463%, 10/25/44 (144A) . . . . . . . . . . . . . . . . . . . . . . . 6,694,962 6,639,775
Dorchester Park CLO DAC3.798%, 3M LIBOR + 1.450%, 04/20/28 (144A) (c) . . . . . . 934,000 926,361
Dryden 41 Senior Loan Fund3.309%, 3M LIBOR + 0.970%, 04/15/31 (144A) (c) . . . . . . 250,000 248,170
Dryden CLO, Ltd.3.459%, 3M LIBOR + 1.120%, 01/15/31 (144A) (c) . . . . . . 6,020,000 6,014,642
Dryden Senior Loan Fund3.239%, 3M LIBOR + 0.900%, 10/15/27 (144A) (c) . . . . . . 1,630,000 1,629,1123.514%, 3M LIBOR + 1.200%, 08/15/30 (144A) (c) . . . . . . 2,205,000 2,205,3754.189%, 3M LIBOR + 1.850%, 10/15/27 (144A) (c) . . . . . . 660,000 656,534
First Franklin Mortgage Loan Trust2.356%, 1M LIBOR + 0.140%, 12/25/36 (c) . . . . . . . . . . . 5,531,097 3,364,2462.366%, 1M LIBOR + 0.150%, 12/25/36 (c) . . . . . . . . . . . 3,160,437 2,743,5922.376%, 1M LIBOR + 0.160%, 04/25/36 (c) . . . . . . . . . . . 438,741 426,6172.426%, 1M LIBOR + 0.210%, 12/25/36 (c) . . . . . . . . . . . 10,174,799 6,257,201
Flatiron CLO, Ltd.3.229%, 3M LIBOR + 0.890%, 04/15/27 (144A) (c) . . . . . . 970,000 968,706
Security DescriptionPrincipalAmount* Value
Asset-Backed - Other—(Continued)Fremont Home Loan Trust
2.356%, 1M LIBOR + 0.140%, 02/25/37 (c) . . . . . . . . . . . 2,542,057 $ 2,005,567Galaxy CLO, Ltd.
3.994%, 3M LIBOR + 1.680%, 11/15/26 (144A) (c) . . . . . . 430,000 425,512GE-WMC Asset-Backed Pass-Through Certificates
2.466%, 1M LIBOR + 0.250%, 12/25/35 (c) . . . . . . . . . . . 189,895 189,051GE-WMC Mortgage Securities Trust
2.366%, 1M LIBOR + 0.150%, 08/25/36 (c) . . . . . . . . . . . 7,244,974 4,638,832Greystone Commercial Real Estate Notes, Ltd.
3.708%, 1M LIBOR + 1.550%, 03/15/27 (144A) (c) . . . . . . 400,000 402,499Greywolf CLO, Ltd.
4.686%, 3M LIBOR + 2.350%, 01/17/27 (144A) (c) . . . . . . 320,000 320,060Highbridge Loan Management, Ltd.
3.341%, 3M LIBOR + 1.000%, 02/05/31 (144A) (c) . . . . . . 1,390,000 1,383,7234.439%, 3M LIBOR + 2.100%, 01/29/26 (144A) (c) . . . . . . 670,000 670,456
Home Equity Mortgage Loan Asset-Backed Trust2.416%, 1M LIBOR + 0.200%, 07/25/37 (c) . . . . . . . . . . . 1,157,992 758,004
Invitation Homes Trust4.158%, 1M LIBOR + 2.000%, 03/17/37 (144A) (c) . . . . . . 520,000 522,1064.158%, 1M LIBOR + 2.000%, 07/17/37 (144A) (c) . . . . . . 840,000 847,4034.658%, 1M LIBOR + 2.500%, 03/17/37 (144A) (c) . . . . . . 410,000 412,548
KKR CLO, Ltd.3.389%, 3M LIBOR + 1.050%, 07/15/27 (144A) (c) . . . . . . 1,540,000 1,540,000
Knollwood CDO, Ltd.4.355%, 3M LIBOR + 3.200%, 01/10/39(144A) (c) (g) (h) (j) . . . . . . . . . . . . . . . . . . . . . . . . . . . 886,864 0
LCM, Ltd.3.379%, 3M LIBOR + 1.040%, 10/20/27 (144A) (c) . . . . . . 1,010,000 1,010,0003.418%, 3M LIBOR + 1.070%, 01/20/31 (144A) (c) . . . . . . 2,590,000 2,586,076
Legacy Mortgage Asset Trust4.000%, 02/25/58 (144A) (c) . . . . . . . . . . . . . . . . . . . . 1,536,591 1,525,152
Lehman ABS Mortgage Loan Trust2.306%, 1M LIBOR + 0.090%, 06/25/37 (144A) (c) . . . . . . 206,159 144,026
Lendmark Funding Trust2.830%, 12/22/25 (144A) . . . . . . . . . . . . . . . . . . . . . . . 5,270,000 5,240,086
Litigation Fee Residual Funding LLC4.000%, 10/30/27 (144A) . . . . . . . . . . . . . . . . . . . . . . . 2,700,547 2,687,044
LoanCore Issuer, Ltd.3.288%, 1M LIBOR + 1.130%, 05/15/28 (144A) (c) . . . . . . 2,210,000 2,214,171
Long Beach Mortgage Loan Trust2.326%, 1M LIBOR + 0.110%, 10/25/36 (c) . . . . . . . . . . . 563,485 243,5822.366%, 1M LIBOR + 0.150%, 06/25/36 (c) . . . . . . . . . . . 629,063 365,6312.376%, 1M LIBOR + 0.160%, 05/25/36 (c) . . . . . . . . . . . 3,649,115 1,737,9252.376%, 1M LIBOR + 0.160%, 10/25/36 (c) . . . . . . . . . . . 2,239,062 973,0002.376%, 1M LIBOR + 0.160%, 11/25/36 (c) . . . . . . . . . . . 2,727,617 1,226,9362.396%, 1M LIBOR + 0.180%, 05/25/46 (c) . . . . . . . . . . . 2,060,168 875,6342.406%, 1M LIBOR + 0.190%, 03/25/46 (c) . . . . . . . . . . . 2,545,970 1,240,6632.436%, 1M LIBOR + 0.220%, 02/25/36 (c) . . . . . . . . . . . 1,978,318 1,917,5972.436%, 1M LIBOR + 0.220%, 11/25/36 (c) . . . . . . . . . . . 802,609 363,9422.476%, 1M LIBOR + 0.260%, 05/25/36 (c) . . . . . . . . . . . 2,534,106 1,227,2632.506%, 1M LIBOR + 0.290%, 03/25/46 (c) . . . . . . . . . . . 2,622,311 1,285,594
Madison Park Funding, Ltd.3.292%, 3M LIBOR + 0.950%, 04/19/30 (144A) (c) . . . . . . 1,330,000 1,327,3133.468%, 3M LIBOR + 1.120%, 07/20/26 (144A) (c) . . . . . . 11,135,000 11,135,3123.537%, 3M LIBOR + 1.190%, 10/21/30 (144A) (c) . . . . . . 5,000,000 5,004,7203.539%, 3M LIBOR + 1.200%, 07/29/30 (144A) (c) . . . . . . 2,450,000 2,454,165
BHFTII-23
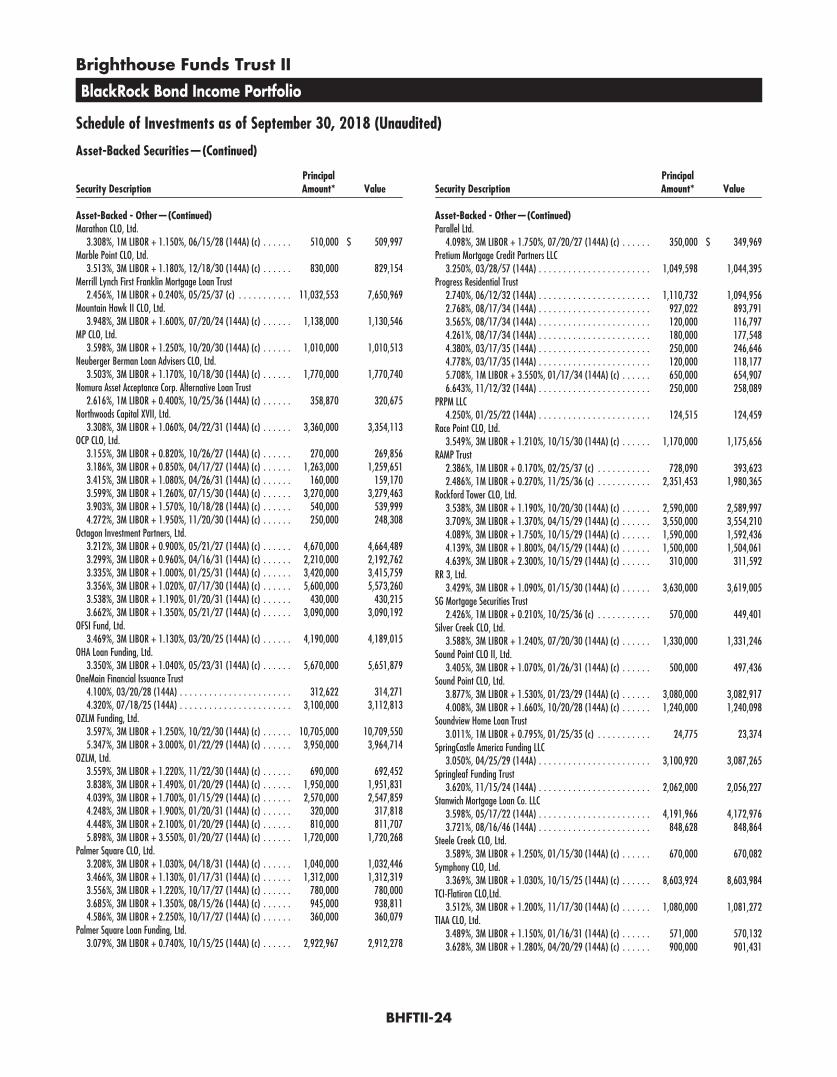
Brighthouse Funds Trust II
BlackRock Bond Income Portfolio
Schedule of Investments as of September 30, 2018 (Unaudited)
Asset-Backed Securities—(Continued)
Security DescriptionPrincipalAmount* Value
Asset-Backed - Other—(Continued)Marathon CLO, Ltd.
3.308%, 1M LIBOR + 1.150%, 06/15/28 (144A) (c) . . . . . . 510,000 $ 509,997Marble Point CLO, Ltd.
3.513%, 3M LIBOR + 1.180%, 12/18/30 (144A) (c) . . . . . . 830,000 829,154Merrill Lynch First Franklin Mortgage Loan Trust
2.456%, 1M LIBOR + 0.240%, 05/25/37 (c) . . . . . . . . . . . 11,032,553 7,650,969Mountain Hawk II CLO, Ltd.
3.948%, 3M LIBOR + 1.600%, 07/20/24 (144A) (c) . . . . . . 1,138,000 1,130,546MP CLO, Ltd.
3.598%, 3M LIBOR + 1.250%, 10/20/30 (144A) (c) . . . . . . 1,010,000 1,010,513Neuberger Berman Loan Advisers CLO, Ltd.
3.503%, 3M LIBOR + 1.170%, 10/18/30 (144A) (c) . . . . . . 1,770,000 1,770,740Nomura Asset Acceptance Corp. Alternative Loan Trust
2.616%, 1M LIBOR + 0.400%, 10/25/36 (144A) (c) . . . . . . 358,870 320,675Northwoods Capital XVII, Ltd.
3.308%, 3M LIBOR + 1.060%, 04/22/31 (144A) (c) . . . . . . 3,360,000 3,354,113OCP CLO, Ltd.
3.155%, 3M LIBOR + 0.820%, 10/26/27 (144A) (c) . . . . . . 270,000 269,8563.186%, 3M LIBOR + 0.850%, 04/17/27 (144A) (c) . . . . . . 1,263,000 1,259,6513.415%, 3M LIBOR + 1.080%, 04/26/31 (144A) (c) . . . . . . 160,000 159,1703.599%, 3M LIBOR + 1.260%, 07/15/30 (144A) (c) . . . . . . 3,270,000 3,279,4633.903%, 3M LIBOR + 1.570%, 10/18/28 (144A) (c) . . . . . . 540,000 539,9994.272%, 3M LIBOR + 1.950%, 11/20/30 (144A) (c) . . . . . . 250,000 248,308
Octagon Investment Partners, Ltd.3.212%, 3M LIBOR + 0.900%, 05/21/27 (144A) (c) . . . . . . 4,670,000 4,664,4893.299%, 3M LIBOR + 0.960%, 04/16/31 (144A) (c) . . . . . . 2,210,000 2,192,7623.335%, 3M LIBOR + 1.000%, 01/25/31 (144A) (c) . . . . . . 3,420,000 3,415,7593.356%, 3M LIBOR + 1.020%, 07/17/30 (144A) (c) . . . . . . 5,600,000 5,573,2603.538%, 3M LIBOR + 1.190%, 01/20/31 (144A) (c) . . . . . . 430,000 430,2153.662%, 3M LIBOR + 1.350%, 05/21/27 (144A) (c) . . . . . . 3,090,000 3,090,192
OFSI Fund, Ltd.3.469%, 3M LIBOR + 1.130%, 03/20/25 (144A) (c) . . . . . . 4,190,000 4,189,015
OHA Loan Funding, Ltd.3.350%, 3M LIBOR + 1.040%, 05/23/31 (144A) (c) . . . . . . 5,670,000 5,651,879
OneMain Financial Issuance Trust4.100%, 03/20/28 (144A) . . . . . . . . . . . . . . . . . . . . . . . 312,622 314,2714.320%, 07/18/25 (144A) . . . . . . . . . . . . . . . . . . . . . . . 3,100,000 3,112,813
OZLM Funding, Ltd.3.597%, 3M LIBOR + 1.250%, 10/22/30 (144A) (c) . . . . . . 10,705,000 10,709,5505.347%, 3M LIBOR + 3.000%, 01/22/29 (144A) (c) . . . . . . 3,950,000 3,964,714
OZLM, Ltd.3.559%, 3M LIBOR + 1.220%, 11/22/30 (144A) (c) . . . . . . 690,000 692,4523.838%, 3M LIBOR + 1.490%, 01/20/29 (144A) (c) . . . . . . 1,950,000 1,951,8314.039%, 3M LIBOR + 1.700%, 01/15/29 (144A) (c) . . . . . . 2,570,000 2,547,8594.248%, 3M LIBOR + 1.900%, 01/20/31 (144A) (c) . . . . . . 320,000 317,8184.448%, 3M LIBOR + 2.100%, 01/20/29 (144A) (c) . . . . . . 810,000 811,7075.898%, 3M LIBOR + 3.550%, 01/20/27 (144A) (c) . . . . . . 1,720,000 1,720,268
Palmer Square CLO, Ltd.3.208%, 3M LIBOR + 1.030%, 04/18/31 (144A) (c) . . . . . . 1,040,000 1,032,4463.466%, 3M LIBOR + 1.130%, 01/17/31 (144A) (c) . . . . . . 1,312,000 1,312,3193.556%, 3M LIBOR + 1.220%, 10/17/27 (144A) (c) . . . . . . 780,000 780,0003.685%, 3M LIBOR + 1.350%, 08/15/26 (144A) (c) . . . . . . 945,000 938,8114.586%, 3M LIBOR + 2.250%, 10/17/27 (144A) (c) . . . . . . 360,000 360,079
Palmer Square Loan Funding, Ltd.3.079%, 3M LIBOR + 0.740%, 10/15/25 (144A) (c) . . . . . . 2,922,967 2,912,278
Security DescriptionPrincipalAmount* Value
Asset-Backed - Other—(Continued)Parallel Ltd.
4.098%, 3M LIBOR + 1.750%, 07/20/27 (144A) (c) . . . . . . 350,000 $ 349,969Pretium Mortgage Credit Partners LLC
3.250%, 03/28/57 (144A) . . . . . . . . . . . . . . . . . . . . . . . 1,049,598 1,044,395Progress Residential Trust
2.740%, 06/12/32 (144A) . . . . . . . . . . . . . . . . . . . . . . . 1,110,732 1,094,9562.768%, 08/17/34 (144A) . . . . . . . . . . . . . . . . . . . . . . . 927,022 893,7913.565%, 08/17/34 (144A) . . . . . . . . . . . . . . . . . . . . . . . 120,000 116,7974.261%, 08/17/34 (144A) . . . . . . . . . . . . . . . . . . . . . . . 180,000 177,5484.380%, 03/17/35 (144A) . . . . . . . . . . . . . . . . . . . . . . . 250,000 246,6464.778%, 03/17/35 (144A) . . . . . . . . . . . . . . . . . . . . . . . 120,000 118,1775.708%, 1M LIBOR + 3.550%, 01/17/34 (144A) (c) . . . . . . 650,000 654,9076.643%, 11/12/32 (144A) . . . . . . . . . . . . . . . . . . . . . . . 250,000 258,089
PRPM LLC4.250%, 01/25/22 (144A) . . . . . . . . . . . . . . . . . . . . . . . 124,515 124,459
Race Point CLO, Ltd.3.549%, 3M LIBOR + 1.210%, 10/15/30 (144A) (c) . . . . . . 1,170,000 1,175,656
RAMP Trust2.386%, 1M LIBOR + 0.170%, 02/25/37 (c) . . . . . . . . . . . 728,090 393,6232.486%, 1M LIBOR + 0.270%, 11/25/36 (c) . . . . . . . . . . . 2,351,453 1,980,365
Rockford Tower CLO, Ltd.3.538%, 3M LIBOR + 1.190%, 10/20/30 (144A) (c) . . . . . . 2,590,000 2,589,9973.709%, 3M LIBOR + 1.370%, 04/15/29 (144A) (c) . . . . . . 3,550,000 3,554,2104.089%, 3M LIBOR + 1.750%, 10/15/29 (144A) (c) . . . . . . 1,590,000 1,592,4364.139%, 3M LIBOR + 1.800%, 04/15/29 (144A) (c) . . . . . . 1,500,000 1,504,0614.639%, 3M LIBOR + 2.300%, 10/15/29 (144A) (c) . . . . . . 310,000 311,592
RR 3, Ltd.3.429%, 3M LIBOR + 1.090%, 01/15/30 (144A) (c) . . . . . . 3,630,000 3,619,005
SG Mortgage Securities Trust2.426%, 1M LIBOR + 0.210%, 10/25/36 (c) . . . . . . . . . . . 570,000 449,401
Silver Creek CLO, Ltd.3.588%, 3M LIBOR + 1.240%, 07/20/30 (144A) (c) . . . . . . 1,330,000 1,331,246
Sound Point CLO II, Ltd.3.405%, 3M LIBOR + 1.070%, 01/26/31 (144A) (c) . . . . . . 500,000 497,436
Sound Point CLO, Ltd.3.877%, 3M LIBOR + 1.530%, 01/23/29 (144A) (c) . . . . . . 3,080,000 3,082,9174.008%, 3M LIBOR + 1.660%, 10/20/28 (144A) (c) . . . . . . 1,240,000 1,240,098
Soundview Home Loan Trust3.011%, 1M LIBOR + 0.795%, 01/25/35 (c) . . . . . . . . . . . 24,775 23,374
SpringCastle America Funding LLC3.050%, 04/25/29 (144A) . . . . . . . . . . . . . . . . . . . . . . . 3,100,920 3,087,265
Springleaf Funding Trust3.620%, 11/15/24 (144A) . . . . . . . . . . . . . . . . . . . . . . . 2,062,000 2,056,227
Stanwich Mortgage Loan Co. LLC3.598%, 05/17/22 (144A) . . . . . . . . . . . . . . . . . . . . . . . 4,191,966 4,172,9763.721%, 08/16/46 (144A) . . . . . . . . . . . . . . . . . . . . . . . 848,628 848,864
Steele Creek CLO, Ltd.3.589%, 3M LIBOR + 1.250%, 01/15/30 (144A) (c) . . . . . . 670,000 670,082
Symphony CLO, Ltd.3.369%, 3M LIBOR + 1.030%, 10/15/25 (144A) (c) . . . . . . 8,603,924 8,603,984
TCI-Flatiron CLO,Ltd.3.512%, 3M LIBOR + 1.200%, 11/17/30 (144A) (c) . . . . . . 1,080,000 1,081,272
TIAA CLO, Ltd.3.489%, 3M LIBOR + 1.150%, 01/16/31 (144A) (c) . . . . . . 571,000 570,1323.628%, 3M LIBOR + 1.280%, 04/20/29 (144A) (c) . . . . . . 900,000 901,431
BHFTII-24
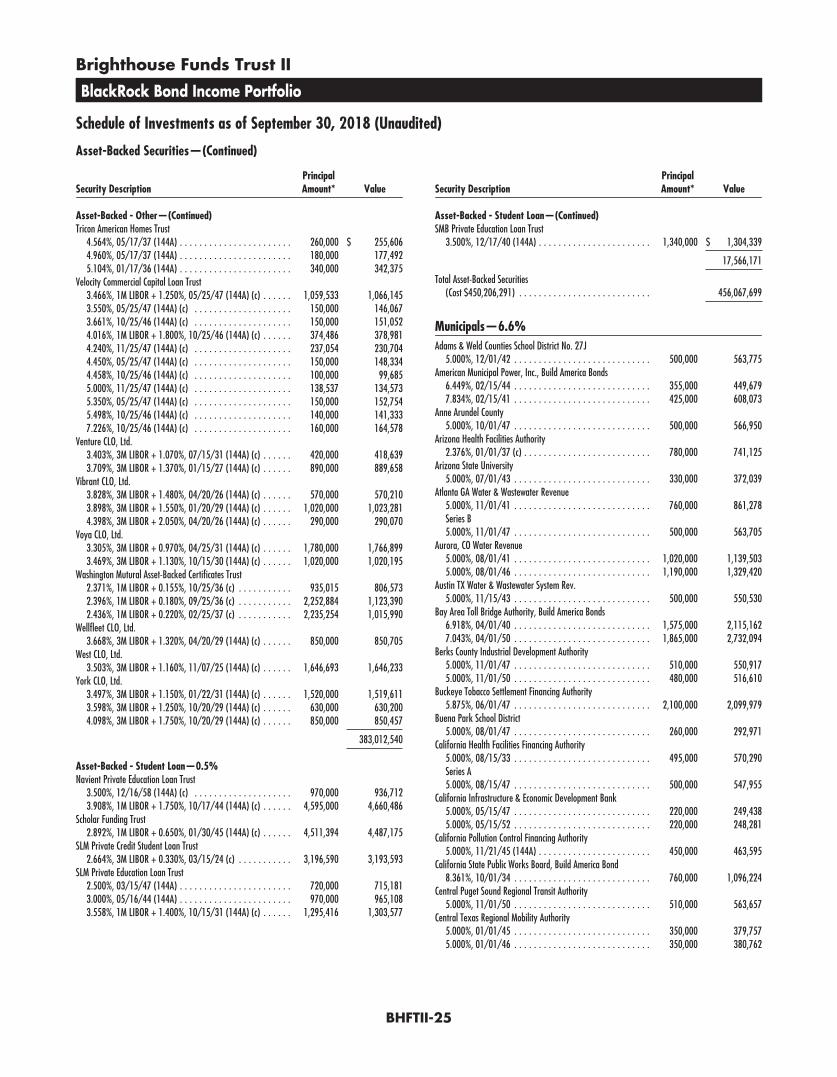
Brighthouse Funds Trust II
BlackRock Bond Income Portfolio
Schedule of Investments as of September 30, 2018 (Unaudited)
Asset-Backed Securities—(Continued)
Security DescriptionPrincipalAmount* Value
Asset-Backed - Other—(Continued)Tricon American Homes Trust
4.564%, 05/17/37 (144A) . . . . . . . . . . . . . . . . . . . . . . . 260,000 $ 255,6064.960%, 05/17/37 (144A) . . . . . . . . . . . . . . . . . . . . . . . 180,000 177,4925.104%, 01/17/36 (144A) . . . . . . . . . . . . . . . . . . . . . . . 340,000 342,375
Velocity Commercial Capital Loan Trust3.466%, 1M LIBOR + 1.250%, 05/25/47 (144A) (c) . . . . . . 1,059,533 1,066,1453.550%, 05/25/47 (144A) (c) . . . . . . . . . . . . . . . . . . . . 150,000 146,0673.661%, 10/25/46 (144A) (c) . . . . . . . . . . . . . . . . . . . . 150,000 151,0524.016%, 1M LIBOR + 1.800%, 10/25/46 (144A) (c) . . . . . . 374,486 378,9814.240%, 11/25/47 (144A) (c) . . . . . . . . . . . . . . . . . . . . 237,054 230,7044.450%, 05/25/47 (144A) (c) . . . . . . . . . . . . . . . . . . . . 150,000 148,3344.458%, 10/25/46 (144A) (c) . . . . . . . . . . . . . . . . . . . . 100,000 99,6855.000%, 11/25/47 (144A) (c) . . . . . . . . . . . . . . . . . . . . 138,537 134,5735.350%, 05/25/47 (144A) (c) . . . . . . . . . . . . . . . . . . . . 150,000 152,7545.498%, 10/25/46 (144A) (c) . . . . . . . . . . . . . . . . . . . . 140,000 141,3337.226%, 10/25/46 (144A) (c) . . . . . . . . . . . . . . . . . . . . 160,000 164,578
Venture CLO, Ltd.3.403%, 3M LIBOR + 1.070%, 07/15/31 (144A) (c) . . . . . . 420,000 418,6393.709%, 3M LIBOR + 1.370%, 01/15/27 (144A) (c) . . . . . . 890,000 889,658
Vibrant CLO, Ltd.3.828%, 3M LIBOR + 1.480%, 04/20/26 (144A) (c) . . . . . . 570,000 570,2103.898%, 3M LIBOR + 1.550%, 01/20/29 (144A) (c) . . . . . . 1,020,000 1,023,2814.398%, 3M LIBOR + 2.050%, 04/20/26 (144A) (c) . . . . . . 290,000 290,070
Voya CLO, Ltd.3.305%, 3M LIBOR + 0.970%, 04/25/31 (144A) (c) . . . . . . 1,780,000 1,766,8993.469%, 3M LIBOR + 1.130%, 10/15/30 (144A) (c) . . . . . . 1,020,000 1,020,195
Washington Mutural Asset-Backed Certificates Trust2.371%, 1M LIBOR + 0.155%, 10/25/36 (c) . . . . . . . . . . . 935,015 806,5732.396%, 1M LIBOR + 0.180%, 09/25/36 (c) . . . . . . . . . . . 2,252,884 1,123,3902.436%, 1M LIBOR + 0.220%, 02/25/37 (c) . . . . . . . . . . . 2,235,254 1,015,990
Wellfleet CLO, Ltd.3.668%, 3M LIBOR + 1.320%, 04/20/29 (144A) (c) . . . . . . 850,000 850,705
West CLO, Ltd.3.503%, 3M LIBOR + 1.160%, 11/07/25 (144A) (c) . . . . . . 1,646,693 1,646,233
York CLO, Ltd.3.497%, 3M LIBOR + 1.150%, 01/22/31 (144A) (c) . . . . . . 1,520,000 1,519,6113.598%, 3M LIBOR + 1.250%, 10/20/29 (144A) (c) . . . . . . 630,000 630,2004.098%, 3M LIBOR + 1.750%, 10/20/29 (144A) (c) . . . . . . 850,000 850,457
383,012,540
Asset-Backed - Student Loan—0.5%Navient Private Education Loan Trust
3.500%, 12/16/58 (144A) (c) . . . . . . . . . . . . . . . . . . . . 970,000 936,7123.908%, 1M LIBOR + 1.750%, 10/17/44 (144A) (c) . . . . . . 4,595,000 4,660,486
Scholar Funding Trust2.892%, 1M LIBOR + 0.650%, 01/30/45 (144A) (c) . . . . . . 4,511,394 4,487,175
SLM Private Credit Student Loan Trust2.664%, 3M LIBOR + 0.330%, 03/15/24 (c) . . . . . . . . . . . 3,196,590 3,193,593
SLM Private Education Loan Trust2.500%, 03/15/47 (144A) . . . . . . . . . . . . . . . . . . . . . . . 720,000 715,1813.000%, 05/16/44 (144A) . . . . . . . . . . . . . . . . . . . . . . . 970,000 965,1083.558%, 1M LIBOR + 1.400%, 10/15/31 (144A) (c) . . . . . . 1,295,416 1,303,577
Security DescriptionPrincipalAmount* Value
Asset-Backed - Student Loan—(Continued)SMB Private Education Loan Trust
3.500%, 12/17/40 (144A) . . . . . . . . . . . . . . . . . . . . . . . 1,340,000 $ 1,304,339
17,566,171
Total Asset-Backed Securities(Cost $450,206,291) . . . . . . . . . . . . . . . . . . . . . . . . . . . 456,067,699
Municipals—6.6%Adams & Weld Counties School District No. 27J
5.000%, 12/01/42 . . . . . . . . . . . . . . . . . . . . . . . . . . . . 500,000 563,775American Municipal Power, Inc., Build America Bonds
6.449%, 02/15/44 . . . . . . . . . . . . . . . . . . . . . . . . . . . . 355,000 449,6797.834%, 02/15/41 . . . . . . . . . . . . . . . . . . . . . . . . . . . . 425,000 608,073
Anne Arundel County5.000%, 10/01/47 . . . . . . . . . . . . . . . . . . . . . . . . . . . . 500,000 566,950
Arizona Health Facilities Authority2.376%, 01/01/37 (c) . . . . . . . . . . . . . . . . . . . . . . . . . . 780,000 741,125
Arizona State University5.000%, 07/01/43 . . . . . . . . . . . . . . . . . . . . . . . . . . . . 330,000 372,039
Atlanta GA Water & Wastewater Revenue5.000%, 11/01/41 . . . . . . . . . . . . . . . . . . . . . . . . . . . . 760,000 861,278Series B5.000%, 11/01/47 . . . . . . . . . . . . . . . . . . . . . . . . . . . . 500,000 563,705
Aurora, CO Water Revenue5.000%, 08/01/41 . . . . . . . . . . . . . . . . . . . . . . . . . . . . 1,020,000 1,139,5035.000%, 08/01/46 . . . . . . . . . . . . . . . . . . . . . . . . . . . . 1,190,000 1,329,420
Austin TX Water & Wastewater System Rev.5.000%, 11/15/43 . . . . . . . . . . . . . . . . . . . . . . . . . . . . 500,000 550,530
Bay Area Toll Bridge Authority, Build America Bonds6.918%, 04/01/40 . . . . . . . . . . . . . . . . . . . . . . . . . . . . 1,575,000 2,115,1627.043%, 04/01/50 . . . . . . . . . . . . . . . . . . . . . . . . . . . . 1,865,000 2,732,094
Berks County Industrial Development Authority5.000%, 11/01/47 . . . . . . . . . . . . . . . . . . . . . . . . . . . . 510,000 550,9175.000%, 11/01/50 . . . . . . . . . . . . . . . . . . . . . . . . . . . . 480,000 516,610
Buckeye Tobacco Settlement Financing Authority5.875%, 06/01/47 . . . . . . . . . . . . . . . . . . . . . . . . . . . . 2,100,000 2,099,979
Buena Park School District5.000%, 08/01/47 . . . . . . . . . . . . . . . . . . . . . . . . . . . . 260,000 292,971
California Health Facilities Financing Authority5.000%, 08/15/33 . . . . . . . . . . . . . . . . . . . . . . . . . . . . 495,000 570,290Series A5.000%, 08/15/47 . . . . . . . . . . . . . . . . . . . . . . . . . . . . 500,000 547,955
California Infrastructure & Economic Development Bank5.000%, 05/15/47 . . . . . . . . . . . . . . . . . . . . . . . . . . . . 220,000 249,4385.000%, 05/15/52 . . . . . . . . . . . . . . . . . . . . . . . . . . . . 220,000 248,281
California Pollution Control Financing Authority5.000%, 11/21/45 (144A) . . . . . . . . . . . . . . . . . . . . . . . 450,000 463,595
California State Public Works Board, Build America Bond8.361%, 10/01/34 . . . . . . . . . . . . . . . . . . . . . . . . . . . . 760,000 1,096,224
Central Puget Sound Regional Transit Authority5.000%, 11/01/50 . . . . . . . . . . . . . . . . . . . . . . . . . . . . 510,000 563,657
Central Texas Regional Mobility Authority5.000%, 01/01/45 . . . . . . . . . . . . . . . . . . . . . . . . . . . . 350,000 379,7575.000%, 01/01/46 . . . . . . . . . . . . . . . . . . . . . . . . . . . . 350,000 380,762
BHFTII-25
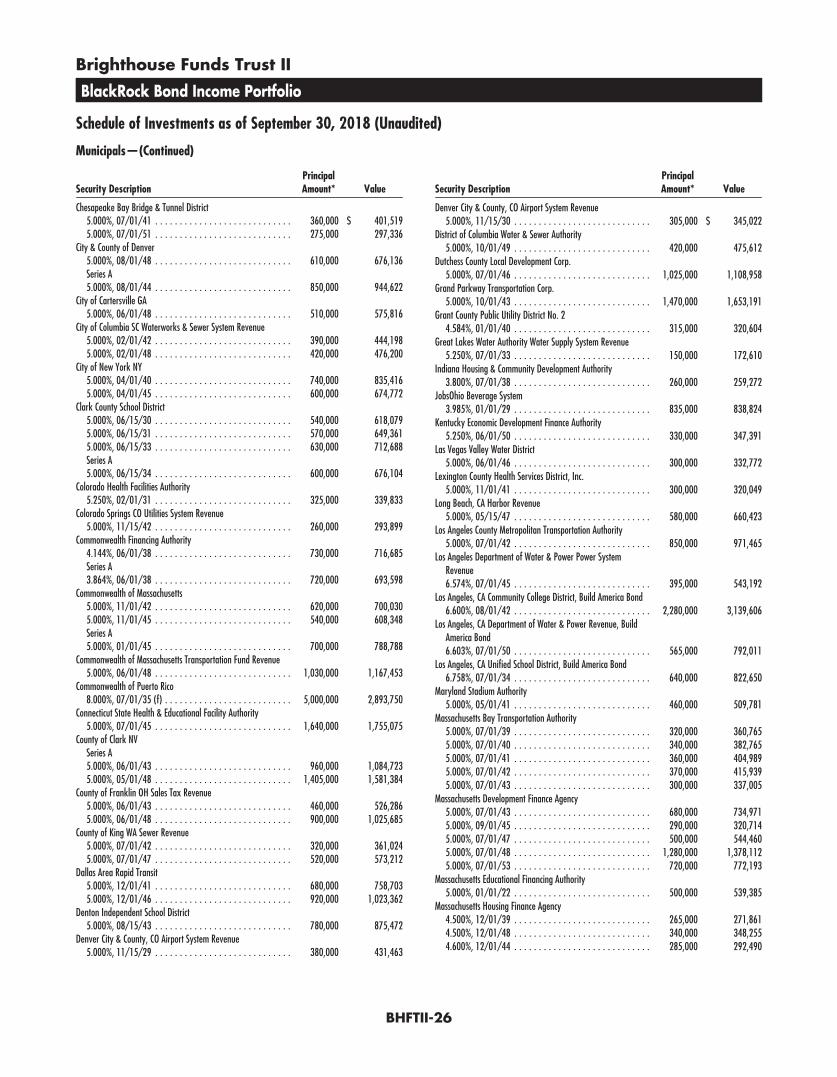
Brighthouse Funds Trust II
BlackRock Bond Income Portfolio
Schedule of Investments as of September 30, 2018 (Unaudited)
Municipals—(Continued)
Security DescriptionPrincipalAmount* Value
Chesapeake Bay Bridge & Tunnel District5.000%, 07/01/41 . . . . . . . . . . . . . . . . . . . . . . . . . . . . 360,000 $ 401,5195.000%, 07/01/51 . . . . . . . . . . . . . . . . . . . . . . . . . . . . 275,000 297,336
City & County of Denver5.000%, 08/01/48 . . . . . . . . . . . . . . . . . . . . . . . . . . . . 610,000 676,136Series A5.000%, 08/01/44 . . . . . . . . . . . . . . . . . . . . . . . . . . . . 850,000 944,622
City of Cartersville GA5.000%, 06/01/48 . . . . . . . . . . . . . . . . . . . . . . . . . . . . 510,000 575,816
City of Columbia SC Waterworks & Sewer System Revenue5.000%, 02/01/42 . . . . . . . . . . . . . . . . . . . . . . . . . . . . 390,000 444,1985.000%, 02/01/48 . . . . . . . . . . . . . . . . . . . . . . . . . . . . 420,000 476,200
City of New York NY5.000%, 04/01/40 . . . . . . . . . . . . . . . . . . . . . . . . . . . . 740,000 835,4165.000%, 04/01/45 . . . . . . . . . . . . . . . . . . . . . . . . . . . . 600,000 674,772
Clark County School District5.000%, 06/15/30 . . . . . . . . . . . . . . . . . . . . . . . . . . . . 540,000 618,0795.000%, 06/15/31 . . . . . . . . . . . . . . . . . . . . . . . . . . . . 570,000 649,3615.000%, 06/15/33 . . . . . . . . . . . . . . . . . . . . . . . . . . . . 630,000 712,688Series A5.000%, 06/15/34 . . . . . . . . . . . . . . . . . . . . . . . . . . . . 600,000 676,104
Colorado Health Facilities Authority5.250%, 02/01/31 . . . . . . . . . . . . . . . . . . . . . . . . . . . . 325,000 339,833
Colorado Springs CO Utilities System Revenue5.000%, 11/15/42 . . . . . . . . . . . . . . . . . . . . . . . . . . . . 260,000 293,899
Commonwealth Financing Authority4.144%, 06/01/38 . . . . . . . . . . . . . . . . . . . . . . . . . . . . 730,000 716,685Series A3.864%, 06/01/38 . . . . . . . . . . . . . . . . . . . . . . . . . . . . 720,000 693,598
Commonwealth of Massachusetts5.000%, 11/01/42 . . . . . . . . . . . . . . . . . . . . . . . . . . . . 620,000 700,0305.000%, 11/01/45 . . . . . . . . . . . . . . . . . . . . . . . . . . . . 540,000 608,348Series A5.000%, 01/01/45 . . . . . . . . . . . . . . . . . . . . . . . . . . . . 700,000 788,788
Commonwealth of Massachusetts Transportation Fund Revenue5.000%, 06/01/48 . . . . . . . . . . . . . . . . . . . . . . . . . . . . 1,030,000 1,167,453
Commonwealth of Puerto Rico8.000%, 07/01/35 (f) . . . . . . . . . . . . . . . . . . . . . . . . . . 5,000,000 2,893,750
Connecticut State Health & Educational Facility Authority5.000%, 07/01/45 . . . . . . . . . . . . . . . . . . . . . . . . . . . . 1,640,000 1,755,075
County of Clark NVSeries A5.000%, 06/01/43 . . . . . . . . . . . . . . . . . . . . . . . . . . . . 960,000 1,084,7235.000%, 05/01/48 . . . . . . . . . . . . . . . . . . . . . . . . . . . . 1,405,000 1,581,384
County of Franklin OH Sales Tax Revenue5.000%, 06/01/43 . . . . . . . . . . . . . . . . . . . . . . . . . . . . 460,000 526,2865.000%, 06/01/48 . . . . . . . . . . . . . . . . . . . . . . . . . . . . 900,000 1,025,685
County of King WA Sewer Revenue5.000%, 07/01/42 . . . . . . . . . . . . . . . . . . . . . . . . . . . . 320,000 361,0245.000%, 07/01/47 . . . . . . . . . . . . . . . . . . . . . . . . . . . . 520,000 573,212
Dallas Area Rapid Transit5.000%, 12/01/41 . . . . . . . . . . . . . . . . . . . . . . . . . . . . 680,000 758,7035.000%, 12/01/46 . . . . . . . . . . . . . . . . . . . . . . . . . . . . 920,000 1,023,362
Denton Independent School District5.000%, 08/15/43 . . . . . . . . . . . . . . . . . . . . . . . . . . . . 780,000 875,472
Denver City & County, CO Airport System Revenue5.000%, 11/15/29 . . . . . . . . . . . . . . . . . . . . . . . . . . . . 380,000 431,463
Security DescriptionPrincipalAmount* Value
Denver City & County, CO Airport System Revenue5.000%, 11/15/30 . . . . . . . . . . . . . . . . . . . . . . . . . . . . 305,000 $ 345,022
District of Columbia Water & Sewer Authority5.000%, 10/01/49 . . . . . . . . . . . . . . . . . . . . . . . . . . . . 420,000 475,612
Dutchess County Local Development Corp.5.000%, 07/01/46 . . . . . . . . . . . . . . . . . . . . . . . . . . . . 1,025,000 1,108,958
Grand Parkway Transportation Corp.5.000%, 10/01/43 . . . . . . . . . . . . . . . . . . . . . . . . . . . . 1,470,000 1,653,191
Grant County Public Utility District No. 24.584%, 01/01/40 . . . . . . . . . . . . . . . . . . . . . . . . . . . . 315,000 320,604
Great Lakes Water Authority Water Supply System Revenue5.250%, 07/01/33 . . . . . . . . . . . . . . . . . . . . . . . . . . . . 150,000 172,610
Indiana Housing & Community Development Authority3.800%, 07/01/38 . . . . . . . . . . . . . . . . . . . . . . . . . . . . 260,000 259,272
JobsOhio Beverage System3.985%, 01/01/29 . . . . . . . . . . . . . . . . . . . . . . . . . . . . 835,000 838,824
Kentucky Economic Development Finance Authority5.250%, 06/01/50 . . . . . . . . . . . . . . . . . . . . . . . . . . . . 330,000 347,391
Las Vegas Valley Water District5.000%, 06/01/46 . . . . . . . . . . . . . . . . . . . . . . . . . . . . 300,000 332,772
Lexington County Health Services District, Inc.5.000%, 11/01/41 . . . . . . . . . . . . . . . . . . . . . . . . . . . . 300,000 320,049
Long Beach, CA Harbor Revenue5.000%, 05/15/47 . . . . . . . . . . . . . . . . . . . . . . . . . . . . 580,000 660,423
Los Angeles County Metropolitan Transportation Authority5.000%, 07/01/42 . . . . . . . . . . . . . . . . . . . . . . . . . . . . 850,000 971,465
Los Angeles Department of Water & Power Power SystemRevenue6.574%, 07/01/45 . . . . . . . . . . . . . . . . . . . . . . . . . . . . 395,000 543,192
Los Angeles, CA Community College District, Build America Bond6.600%, 08/01/42 . . . . . . . . . . . . . . . . . . . . . . . . . . . . 2,280,000 3,139,606
Los Angeles, CA Department of Water & Power Revenue, BuildAmerica Bond6.603%, 07/01/50 . . . . . . . . . . . . . . . . . . . . . . . . . . . . 565,000 792,011
Los Angeles, CA Unified School District, Build America Bond6.758%, 07/01/34 . . . . . . . . . . . . . . . . . . . . . . . . . . . . 640,000 822,650
Maryland Stadium Authority5.000%, 05/01/41 . . . . . . . . . . . . . . . . . . . . . . . . . . . . 460,000 509,781
Massachusetts Bay Transportation Authority5.000%, 07/01/39 . . . . . . . . . . . . . . . . . . . . . . . . . . . . 320,000 360,7655.000%, 07/01/40 . . . . . . . . . . . . . . . . . . . . . . . . . . . . 340,000 382,7655.000%, 07/01/41 . . . . . . . . . . . . . . . . . . . . . . . . . . . . 360,000 404,9895.000%, 07/01/42 . . . . . . . . . . . . . . . . . . . . . . . . . . . . 370,000 415,9395.000%, 07/01/43 . . . . . . . . . . . . . . . . . . . . . . . . . . . . 300,000 337,005
Massachusetts Development Finance Agency5.000%, 07/01/43 . . . . . . . . . . . . . . . . . . . . . . . . . . . . 680,000 734,9715.000%, 09/01/45 . . . . . . . . . . . . . . . . . . . . . . . . . . . . 290,000 320,7145.000%, 07/01/47 . . . . . . . . . . . . . . . . . . . . . . . . . . . . 500,000 544,4605.000%, 07/01/48 . . . . . . . . . . . . . . . . . . . . . . . . . . . . 1,280,000 1,378,1125.000%, 07/01/53 . . . . . . . . . . . . . . . . . . . . . . . . . . . . 720,000 772,193
Massachusetts Educational Financing Authority5.000%, 01/01/22 . . . . . . . . . . . . . . . . . . . . . . . . . . . . 500,000 539,385
Massachusetts Housing Finance Agency4.500%, 12/01/39 . . . . . . . . . . . . . . . . . . . . . . . . . . . . 265,000 271,8614.500%, 12/01/48 . . . . . . . . . . . . . . . . . . . . . . . . . . . . 340,000 348,2554.600%, 12/01/44 . . . . . . . . . . . . . . . . . . . . . . . . . . . . 285,000 292,490
BHFTII-26

Brighthouse Funds Trust II
BlackRock Bond Income Portfolio
Schedule of Investments as of September 30, 2018 (Unaudited)
Municipals—(Continued)
Security DescriptionPrincipalAmount* Value
Massachusetts Port Authority5.000%, 07/01/43 . . . . . . . . . . . . . . . . . . . . . . . . . . . . 460,000 $ 502,854
Massachusetts School Building Authority5.250%, 02/15/48 . . . . . . . . . . . . . . . . . . . . . . . . . . . . 770,000 882,782
Massachusetts Water Resources Authority5.000%, 08/01/40 . . . . . . . . . . . . . . . . . . . . . . . . . . . . 270,000 303,018
Mesquite, TX Independent School District5.000%, 08/15/42 . . . . . . . . . . . . . . . . . . . . . . . . . . . . 570,000 635,818
Metropolitan Atlanta Rapid Transit AuthoritySeries A5.000%, 07/01/41 . . . . . . . . . . . . . . . . . . . . . . . . . . . . 510,000 564,3105.000%, 07/01/42 . . . . . . . . . . . . . . . . . . . . . . . . . . . . 510,000 563,984Series B5.000%, 07/01/45 . . . . . . . . . . . . . . . . . . . . . . . . . . . . 400,000 446,420
Metropolitan Government of Nashville & Davidson County,Health & Educational Facilities Board5.000%, 07/01/46 . . . . . . . . . . . . . . . . . . . . . . . . . . . . 690,000 747,001
Metropolitan St. Louis Sewer District5.000%, 05/01/42 . . . . . . . . . . . . . . . . . . . . . . . . . . . . 710,000 804,643Series A5.000%, 05/01/47 . . . . . . . . . . . . . . . . . . . . . . . . . . . . 650,000 733,005
Metropolitan Transportation Authority5.000%, 11/15/42 . . . . . . . . . . . . . . . . . . . . . . . . . . . . 670,000 751,0835.250%, 11/15/57 . . . . . . . . . . . . . . . . . . . . . . . . . . . . 820,000 919,466
Metropolitan Transportation Authority, Build America Bonds6.668%, 11/15/39 . . . . . . . . . . . . . . . . . . . . . . . . . . . . 170,000 220,2896.687%, 11/15/40 . . . . . . . . . . . . . . . . . . . . . . . . . . . . 590,000 772,3456.814%, 11/15/40 . . . . . . . . . . . . . . . . . . . . . . . . . . . . 1,005,000 1,325,113
Metropolitan Washington Airports Authority5.000%, 10/01/32 . . . . . . . . . . . . . . . . . . . . . . . . . . . . 890,000 997,5835.000%, 10/01/43 . . . . . . . . . . . . . . . . . . . . . . . . . . . . 790,000 877,966
Metropolitan Washington Airports Authority Dulles Toll RoadRevenue, Build America Bond7.462%, 10/01/46 . . . . . . . . . . . . . . . . . . . . . . . . . . . . 560,000 797,944
Miami-Dade County, FL5.000%, 07/01/35 . . . . . . . . . . . . . . . . . . . . . . . . . . . . 345,000 388,053
Miami-Dade County, FL Aviation Revenue2.504%, 10/01/24 . . . . . . . . . . . . . . . . . . . . . . . . . . . . 1,000,000 941,2503.354%, 10/01/29 . . . . . . . . . . . . . . . . . . . . . . . . . . . . 195,000 184,3633.454%, 10/01/30 . . . . . . . . . . . . . . . . . . . . . . . . . . . . 355,000 334,4853.504%, 10/01/31 . . . . . . . . . . . . . . . . . . . . . . . . . . . . 330,000 310,5205.000%, 10/01/38 . . . . . . . . . . . . . . . . . . . . . . . . . . . . 1,025,000 1,113,0685.000%, 10/01/40 . . . . . . . . . . . . . . . . . . . . . . . . . . . . 500,000 549,360Series C4.062%, 10/01/31 . . . . . . . . . . . . . . . . . . . . . . . . . . . . 495,000 486,060
Miami-Dade County, FL Educational Facilities Authority5.000%, 04/01/53 . . . . . . . . . . . . . . . . . . . . . . . . . . . . 1,090,000 1,189,8335.073%, 04/01/50 . . . . . . . . . . . . . . . . . . . . . . . . . . . . 655,000 715,208Series A5.000%, 04/01/48 . . . . . . . . . . . . . . . . . . . . . . . . . . . . 530,000 582,523
Michigan Finance Authority5.000%, 11/15/41 . . . . . . . . . . . . . . . . . . . . . . . . . . . . 330,000 360,3205.000%, 12/01/47 . . . . . . . . . . . . . . . . . . . . . . . . . . . . 1,810,000 1,936,718
Michigan State Housing Development Authority3.550%, 10/01/33 . . . . . . . . . . . . . . . . . . . . . . . . . . . . 300,000 295,1944.000%, 10/01/43 . . . . . . . . . . . . . . . . . . . . . . . . . . . . 290,000 289,5454.050%, 10/01/48 . . . . . . . . . . . . . . . . . . . . . . . . . . . . 140,000 139,758
Security DescriptionPrincipalAmount* Value
Michigan State Housing Development Authority4.150%, 10/01/53 . . . . . . . . . . . . . . . . . . . . . . . . . . . . 690,000 $ 688,730
Mississippi State Hospital Equipment & Facilities Authority, BaptistMemorial Health Care5.000%, 09/01/46 . . . . . . . . . . . . . . . . . . . . . . . . . . . . 630,000 663,182
Missouri State Health & Educational Facilities Authority Revenue3.652%, 08/15/57 . . . . . . . . . . . . . . . . . . . . . . . . . . . . 1,495,000 1,379,7065.000%, 11/15/29 . . . . . . . . . . . . . . . . . . . . . . . . . . . . 340,000 383,775
Municipal Electric Authority of Georgia, Build America Bond6.637%, 04/01/57 . . . . . . . . . . . . . . . . . . . . . . . . . . . . 1,000,000 1,179,580
New Jersey State Turnpike Authority, Build America Bond7.414%, 01/01/40 . . . . . . . . . . . . . . . . . . . . . . . . . . . . 1,451,000 2,076,076
New Jersey Transportation Trust Fund Authority5.000%, 06/15/29 . . . . . . . . . . . . . . . . . . . . . . . . . . . . 380,000 419,794
New Orleans Aviation Board5.000%, 01/01/40 . . . . . . . . . . . . . . . . . . . . . . . . . . . . 530,000 569,310
New York City Housing Development Corp3.700%, 11/01/38 . . . . . . . . . . . . . . . . . . . . . . . . . . . . 320,000 313,7603.850%, 11/01/43 . . . . . . . . . . . . . . . . . . . . . . . . . . . . 950,000 940,9184.000%, 11/01/53 . . . . . . . . . . . . . . . . . . . . . . . . . . . . 1,010,000 998,688
New York City Transitional Finance Authority Building AidRevenue5.000%, 07/15/40 . . . . . . . . . . . . . . . . . . . . . . . . . . . . 370,000 407,237
New York City Transitional Finance Authority Future Tax SecuredRevenue3.050%, 05/01/27 . . . . . . . . . . . . . . . . . . . . . . . . . . . . 1,670,000 1,582,0743.550%, 05/01/25 . . . . . . . . . . . . . . . . . . . . . . . . . . . . 1,475,000 1,462,7725.000%, 08/01/31 . . . . . . . . . . . . . . . . . . . . . . . . . . . . 190,000 217,1915.000%, 02/01/35 . . . . . . . . . . . . . . . . . . . . . . . . . . . . 410,000 458,7165.000%, 05/01/36 . . . . . . . . . . . . . . . . . . . . . . . . . . . . 390,000 436,355
New York City Water & Sewer System5.000%, 06/15/39 . . . . . . . . . . . . . . . . . . . . . . . . . . . . 1,070,000 1,212,3215.000%, 06/15/40 . . . . . . . . . . . . . . . . . . . . . . . . . . . . 770,000 872,4185.000%, 06/15/47 . . . . . . . . . . . . . . . . . . . . . . . . . . . . 985,000 1,099,9305.375%, 06/15/43 . . . . . . . . . . . . . . . . . . . . . . . . . . . . 2,360,000 2,518,5925.500%, 06/15/43 . . . . . . . . . . . . . . . . . . . . . . . . . . . . 2,825,000 3,023,6545.882%, 06/15/44 . . . . . . . . . . . . . . . . . . . . . . . . . . . . 1,150,000 1,458,844
New York City Water & Sewer System, Build America Bonds5.440%, 06/15/43 . . . . . . . . . . . . . . . . . . . . . . . . . . . . 505,000 606,8535.750%, 06/15/41 . . . . . . . . . . . . . . . . . . . . . . . . . . . . 675,000 836,872
New York Convention Center Development Corp.5.000%, 11/15/40 . . . . . . . . . . . . . . . . . . . . . . . . . . . . 370,000 407,1415.000%, 11/15/46 . . . . . . . . . . . . . . . . . . . . . . . . . . . . 920,000 1,020,197
New York State Dormitory Authority5.000%, 02/15/31 . . . . . . . . . . . . . . . . . . . . . . . . . . . . 330,000 376,9395.000%, 03/15/32 . . . . . . . . . . . . . . . . . . . . . . . . . . . . 580,000 656,5775.000%, 02/15/36 . . . . . . . . . . . . . . . . . . . . . . . . . . . . 620,000 702,4915.000%, 02/15/37 . . . . . . . . . . . . . . . . . . . . . . . . . . . . 360,000 406,7145.000%, 02/15/38 . . . . . . . . . . . . . . . . . . . . . . . . . . . . 330,000 372,8215.000%, 02/15/39 . . . . . . . . . . . . . . . . . . . . . . . . . . . . 330,000 371,2015.000%, 03/15/39 . . . . . . . . . . . . . . . . . . . . . . . . . . . . 810,000 919,6175.000%, 02/15/40 . . . . . . . . . . . . . . . . . . . . . . . . . . . . 380,000 426,5125.000%, 02/15/41 . . . . . . . . . . . . . . . . . . . . . . . . . . . . 620,000 695,3865.000%, 02/15/42 . . . . . . . . . . . . . . . . . . . . . . . . . . . . 840,000 941,4475.000%, 02/15/43 . . . . . . . . . . . . . . . . . . . . . . . . . . . . 540,000 604,778
BHFTII-27
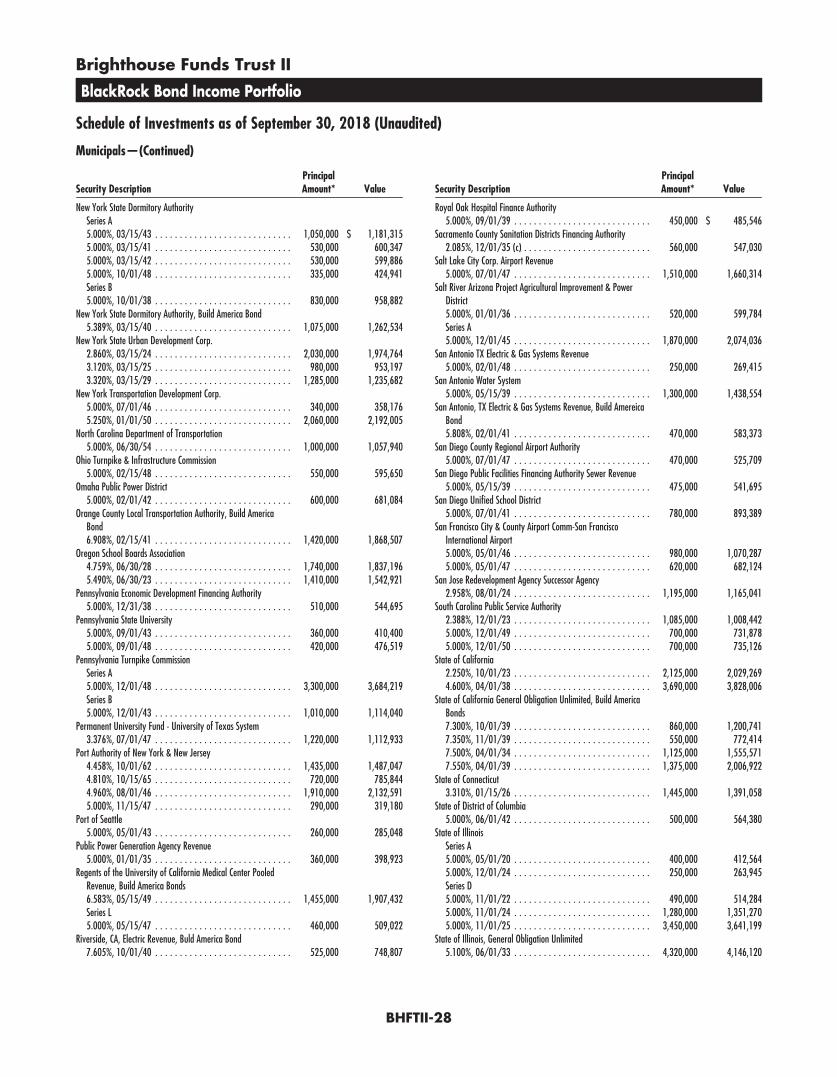
Brighthouse Funds Trust II
BlackRock Bond Income Portfolio
Schedule of Investments as of September 30, 2018 (Unaudited)
Municipals—(Continued)
Security DescriptionPrincipalAmount* Value
New York State Dormitory AuthoritySeries A5.000%, 03/15/43 . . . . . . . . . . . . . . . . . . . . . . . . . . . . 1,050,000 $ 1,181,3155.000%, 03/15/41 . . . . . . . . . . . . . . . . . . . . . . . . . . . . 530,000 600,3475.000%, 03/15/42 . . . . . . . . . . . . . . . . . . . . . . . . . . . . 530,000 599,8865.000%, 10/01/48 . . . . . . . . . . . . . . . . . . . . . . . . . . . . 335,000 424,941Series B5.000%, 10/01/38 . . . . . . . . . . . . . . . . . . . . . . . . . . . . 830,000 958,882
New York State Dormitory Authority, Build America Bond5.389%, 03/15/40 . . . . . . . . . . . . . . . . . . . . . . . . . . . . 1,075,000 1,262,534
New York State Urban Development Corp.2.860%, 03/15/24 . . . . . . . . . . . . . . . . . . . . . . . . . . . . 2,030,000 1,974,7643.120%, 03/15/25 . . . . . . . . . . . . . . . . . . . . . . . . . . . . 980,000 953,1973.320%, 03/15/29 . . . . . . . . . . . . . . . . . . . . . . . . . . . . 1,285,000 1,235,682
New York Transportation Development Corp.5.000%, 07/01/46 . . . . . . . . . . . . . . . . . . . . . . . . . . . . 340,000 358,1765.250%, 01/01/50 . . . . . . . . . . . . . . . . . . . . . . . . . . . . 2,060,000 2,192,005
North Carolina Department of Transportation5.000%, 06/30/54 . . . . . . . . . . . . . . . . . . . . . . . . . . . . 1,000,000 1,057,940
Ohio Turnpike & Infrastructure Commission5.000%, 02/15/48 . . . . . . . . . . . . . . . . . . . . . . . . . . . . 550,000 595,650
Omaha Public Power District5.000%, 02/01/42 . . . . . . . . . . . . . . . . . . . . . . . . . . . . 600,000 681,084
Orange County Local Transportation Authority, Build AmericaBond6.908%, 02/15/41 . . . . . . . . . . . . . . . . . . . . . . . . . . . . 1,420,000 1,868,507
Oregon School Boards Association4.759%, 06/30/28 . . . . . . . . . . . . . . . . . . . . . . . . . . . . 1,740,000 1,837,1965.490%, 06/30/23 . . . . . . . . . . . . . . . . . . . . . . . . . . . . 1,410,000 1,542,921
Pennsylvania Economic Development Financing Authority5.000%, 12/31/38 . . . . . . . . . . . . . . . . . . . . . . . . . . . . 510,000 544,695
Pennsylvania State University5.000%, 09/01/43 . . . . . . . . . . . . . . . . . . . . . . . . . . . . 360,000 410,4005.000%, 09/01/48 . . . . . . . . . . . . . . . . . . . . . . . . . . . . 420,000 476,519
Pennsylvania Turnpike CommissionSeries A5.000%, 12/01/48 . . . . . . . . . . . . . . . . . . . . . . . . . . . . 3,300,000 3,684,219Series B5.000%, 12/01/43 . . . . . . . . . . . . . . . . . . . . . . . . . . . . 1,010,000 1,114,040
Permanent University Fund - University of Texas System3.376%, 07/01/47 . . . . . . . . . . . . . . . . . . . . . . . . . . . . 1,220,000 1,112,933
Port Authority of New York & New Jersey4.458%, 10/01/62 . . . . . . . . . . . . . . . . . . . . . . . . . . . . 1,435,000 1,487,0474.810%, 10/15/65 . . . . . . . . . . . . . . . . . . . . . . . . . . . . 720,000 785,8444.960%, 08/01/46 . . . . . . . . . . . . . . . . . . . . . . . . . . . . 1,910,000 2,132,5915.000%, 11/15/47 . . . . . . . . . . . . . . . . . . . . . . . . . . . . 290,000 319,180
Port of Seattle5.000%, 05/01/43 . . . . . . . . . . . . . . . . . . . . . . . . . . . . 260,000 285,048
Public Power Generation Agency Revenue5.000%, 01/01/35 . . . . . . . . . . . . . . . . . . . . . . . . . . . . 360,000 398,923
Regents of the University of California Medical Center PooledRevenue, Build America Bonds6.583%, 05/15/49 . . . . . . . . . . . . . . . . . . . . . . . . . . . . 1,455,000 1,907,432Series L5.000%, 05/15/47 . . . . . . . . . . . . . . . . . . . . . . . . . . . . 460,000 509,022
Riverside, CA, Electric Revenue, Buld America Bond7.605%, 10/01/40 . . . . . . . . . . . . . . . . . . . . . . . . . . . . 525,000 748,807
Security DescriptionPrincipalAmount* Value
Royal Oak Hospital Finance Authority5.000%, 09/01/39 . . . . . . . . . . . . . . . . . . . . . . . . . . . . 450,000 $ 485,546
Sacramento County Sanitation Districts Financing Authority2.085%, 12/01/35 (c) . . . . . . . . . . . . . . . . . . . . . . . . . . 560,000 547,030
Salt Lake City Corp. Airport Revenue5.000%, 07/01/47 . . . . . . . . . . . . . . . . . . . . . . . . . . . . 1,510,000 1,660,314
Salt River Arizona Project Agricultural Improvement & PowerDistrict5.000%, 01/01/36 . . . . . . . . . . . . . . . . . . . . . . . . . . . . 520,000 599,784Series A5.000%, 12/01/45 . . . . . . . . . . . . . . . . . . . . . . . . . . . . 1,870,000 2,074,036
San Antonio TX Electric & Gas Systems Revenue5.000%, 02/01/48 . . . . . . . . . . . . . . . . . . . . . . . . . . . . 250,000 269,415
San Antonio Water System5.000%, 05/15/39 . . . . . . . . . . . . . . . . . . . . . . . . . . . . 1,300,000 1,438,554
San Antonio, TX Electric & Gas Systems Revenue, Build AmereicaBond5.808%, 02/01/41 . . . . . . . . . . . . . . . . . . . . . . . . . . . . 470,000 583,373
San Diego County Regional Airport Authority5.000%, 07/01/47 . . . . . . . . . . . . . . . . . . . . . . . . . . . . 470,000 525,709
San Diego Public Facilities Financing Authority Sewer Revenue5.000%, 05/15/39 . . . . . . . . . . . . . . . . . . . . . . . . . . . . 475,000 541,695
San Diego Unified School District5.000%, 07/01/41 . . . . . . . . . . . . . . . . . . . . . . . . . . . . 780,000 893,389
San Francisco City & County Airport Comm-San FranciscoInternational Airport5.000%, 05/01/46 . . . . . . . . . . . . . . . . . . . . . . . . . . . . 980,000 1,070,2875.000%, 05/01/47 . . . . . . . . . . . . . . . . . . . . . . . . . . . . 620,000 682,124
San Jose Redevelopment Agency Successor Agency2.958%, 08/01/24 . . . . . . . . . . . . . . . . . . . . . . . . . . . . 1,195,000 1,165,041
South Carolina Public Service Authority2.388%, 12/01/23 . . . . . . . . . . . . . . . . . . . . . . . . . . . . 1,085,000 1,008,4425.000%, 12/01/49 . . . . . . . . . . . . . . . . . . . . . . . . . . . . 700,000 731,8785.000%, 12/01/50 . . . . . . . . . . . . . . . . . . . . . . . . . . . . 700,000 735,126
State of California2.250%, 10/01/23 . . . . . . . . . . . . . . . . . . . . . . . . . . . . 2,125,000 2,029,2694.600%, 04/01/38 . . . . . . . . . . . . . . . . . . . . . . . . . . . . 3,690,000 3,828,006
State of California General Obligation Unlimited, Build AmericaBonds7.300%, 10/01/39 . . . . . . . . . . . . . . . . . . . . . . . . . . . . 860,000 1,200,7417.350%, 11/01/39 . . . . . . . . . . . . . . . . . . . . . . . . . . . . 550,000 772,4147.500%, 04/01/34 . . . . . . . . . . . . . . . . . . . . . . . . . . . . 1,125,000 1,555,5717.550%, 04/01/39 . . . . . . . . . . . . . . . . . . . . . . . . . . . . 1,375,000 2,006,922
State of Connecticut3.310%, 01/15/26 . . . . . . . . . . . . . . . . . . . . . . . . . . . . 1,445,000 1,391,058
State of District of Columbia5.000%, 06/01/42 . . . . . . . . . . . . . . . . . . . . . . . . . . . . 500,000 564,380
State of IllinoisSeries A5.000%, 05/01/20 . . . . . . . . . . . . . . . . . . . . . . . . . . . . 400,000 412,5645.000%, 12/01/24 . . . . . . . . . . . . . . . . . . . . . . . . . . . . 250,000 263,945Series D5.000%, 11/01/22 . . . . . . . . . . . . . . . . . . . . . . . . . . . . 490,000 514,2845.000%, 11/01/24 . . . . . . . . . . . . . . . . . . . . . . . . . . . . 1,280,000 1,351,2705.000%, 11/01/25 . . . . . . . . . . . . . . . . . . . . . . . . . . . . 3,450,000 3,641,199
State of Illinois, General Obligation Unlimited5.100%, 06/01/33 . . . . . . . . . . . . . . . . . . . . . . . . . . . . 4,320,000 4,146,120
BHFTII-28
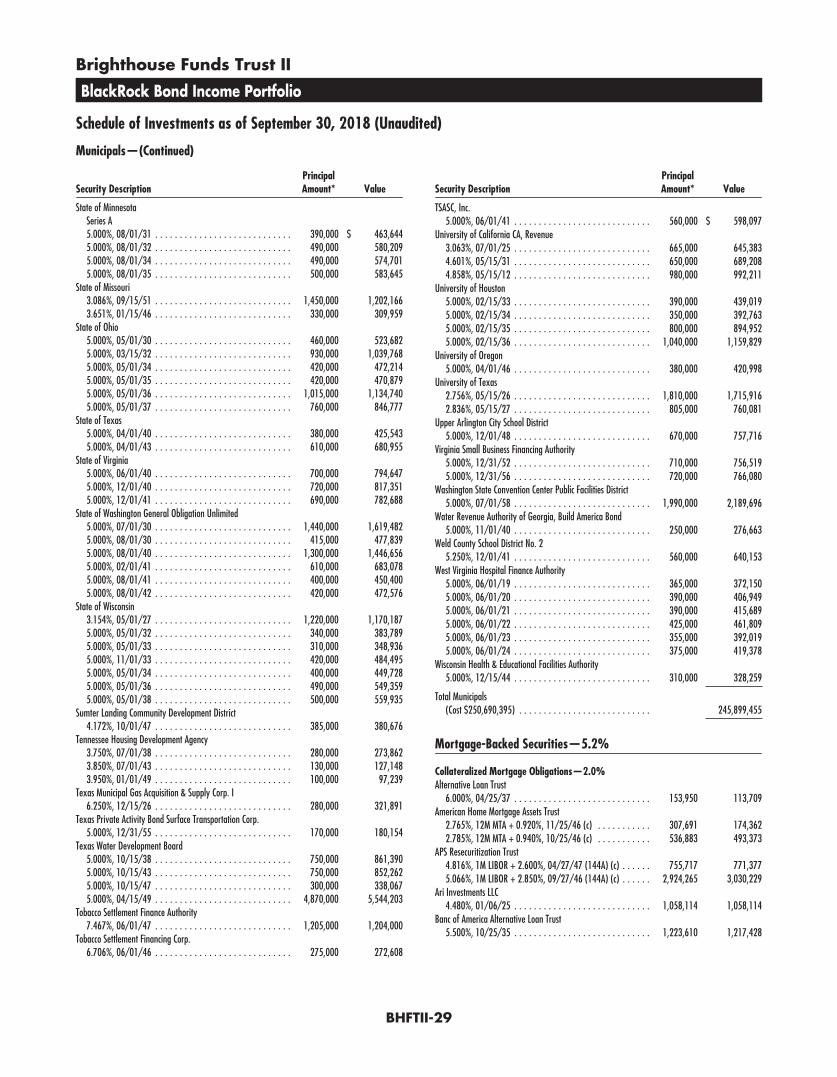
Brighthouse Funds Trust II
BlackRock Bond Income Portfolio
Schedule of Investments as of September 30, 2018 (Unaudited)
Municipals—(Continued)
Security DescriptionPrincipalAmount* Value
State of MinnesotaSeries A5.000%, 08/01/31 . . . . . . . . . . . . . . . . . . . . . . . . . . . . 390,000 $ 463,6445.000%, 08/01/32 . . . . . . . . . . . . . . . . . . . . . . . . . . . . 490,000 580,2095.000%, 08/01/34 . . . . . . . . . . . . . . . . . . . . . . . . . . . . 490,000 574,7015.000%, 08/01/35 . . . . . . . . . . . . . . . . . . . . . . . . . . . . 500,000 583,645
State of Missouri3.086%, 09/15/51 . . . . . . . . . . . . . . . . . . . . . . . . . . . . 1,450,000 1,202,1663.651%, 01/15/46 . . . . . . . . . . . . . . . . . . . . . . . . . . . . 330,000 309,959
State of Ohio5.000%, 05/01/30 . . . . . . . . . . . . . . . . . . . . . . . . . . . . 460,000 523,6825.000%, 03/15/32 . . . . . . . . . . . . . . . . . . . . . . . . . . . . 930,000 1,039,7685.000%, 05/01/34 . . . . . . . . . . . . . . . . . . . . . . . . . . . . 420,000 472,2145.000%, 05/01/35 . . . . . . . . . . . . . . . . . . . . . . . . . . . . 420,000 470,8795.000%, 05/01/36 . . . . . . . . . . . . . . . . . . . . . . . . . . . . 1,015,000 1,134,7405.000%, 05/01/37 . . . . . . . . . . . . . . . . . . . . . . . . . . . . 760,000 846,777
State of Texas5.000%, 04/01/40 . . . . . . . . . . . . . . . . . . . . . . . . . . . . 380,000 425,5435.000%, 04/01/43 . . . . . . . . . . . . . . . . . . . . . . . . . . . . 610,000 680,955
State of Virginia5.000%, 06/01/40 . . . . . . . . . . . . . . . . . . . . . . . . . . . . 700,000 794,6475.000%, 12/01/40 . . . . . . . . . . . . . . . . . . . . . . . . . . . . 720,000 817,3515.000%, 12/01/41 . . . . . . . . . . . . . . . . . . . . . . . . . . . . 690,000 782,688
State of Washington General Obligation Unlimited5.000%, 07/01/30 . . . . . . . . . . . . . . . . . . . . . . . . . . . . 1,440,000 1,619,4825.000%, 08/01/30 . . . . . . . . . . . . . . . . . . . . . . . . . . . . 415,000 477,8395.000%, 08/01/40 . . . . . . . . . . . . . . . . . . . . . . . . . . . . 1,300,000 1,446,6565.000%, 02/01/41 . . . . . . . . . . . . . . . . . . . . . . . . . . . . 610,000 683,0785.000%, 08/01/41 . . . . . . . . . . . . . . . . . . . . . . . . . . . . 400,000 450,4005.000%, 08/01/42 . . . . . . . . . . . . . . . . . . . . . . . . . . . . 420,000 472,576
State of Wisconsin3.154%, 05/01/27 . . . . . . . . . . . . . . . . . . . . . . . . . . . . 1,220,000 1,170,1875.000%, 05/01/32 . . . . . . . . . . . . . . . . . . . . . . . . . . . . 340,000 383,7895.000%, 05/01/33 . . . . . . . . . . . . . . . . . . . . . . . . . . . . 310,000 348,9365.000%, 11/01/33 . . . . . . . . . . . . . . . . . . . . . . . . . . . . 420,000 484,4955.000%, 05/01/34 . . . . . . . . . . . . . . . . . . . . . . . . . . . . 400,000 449,7285.000%, 05/01/36 . . . . . . . . . . . . . . . . . . . . . . . . . . . . 490,000 549,3595.000%, 05/01/38 . . . . . . . . . . . . . . . . . . . . . . . . . . . . 500,000 559,935
Sumter Landing Community Development District4.172%, 10/01/47 . . . . . . . . . . . . . . . . . . . . . . . . . . . . 385,000 380,676
Tennessee Housing Development Agency3.750%, 07/01/38 . . . . . . . . . . . . . . . . . . . . . . . . . . . . 280,000 273,8623.850%, 07/01/43 . . . . . . . . . . . . . . . . . . . . . . . . . . . . 130,000 127,1483.950%, 01/01/49 . . . . . . . . . . . . . . . . . . . . . . . . . . . . 100,000 97,239
Texas Municipal Gas Acquisition & Supply Corp. I6.250%, 12/15/26 . . . . . . . . . . . . . . . . . . . . . . . . . . . . 280,000 321,891
Texas Private Activity Bond Surface Transportation Corp.5.000%, 12/31/55 . . . . . . . . . . . . . . . . . . . . . . . . . . . . 170,000 180,154
Texas Water Development Board5.000%, 10/15/38 . . . . . . . . . . . . . . . . . . . . . . . . . . . . 750,000 861,3905.000%, 10/15/43 . . . . . . . . . . . . . . . . . . . . . . . . . . . . 750,000 852,2625.000%, 10/15/47 . . . . . . . . . . . . . . . . . . . . . . . . . . . . 300,000 338,0675.000%, 04/15/49 . . . . . . . . . . . . . . . . . . . . . . . . . . . . 4,870,000 5,544,203
Tobacco Settlement Finance Authority7.467%, 06/01/47 . . . . . . . . . . . . . . . . . . . . . . . . . . . . 1,205,000 1,204,000
Tobacco Settlement Financing Corp.6.706%, 06/01/46 . . . . . . . . . . . . . . . . . . . . . . . . . . . . 275,000 272,608
Security DescriptionPrincipalAmount* Value
TSASC, Inc.5.000%, 06/01/41 . . . . . . . . . . . . . . . . . . . . . . . . . . . . 560,000 $ 598,097
University of California CA, Revenue3.063%, 07/01/25 . . . . . . . . . . . . . . . . . . . . . . . . . . . . 665,000 645,3834.601%, 05/15/31 . . . . . . . . . . . . . . . . . . . . . . . . . . . . 650,000 689,2084.858%, 05/15/12 . . . . . . . . . . . . . . . . . . . . . . . . . . . . 980,000 992,211
University of Houston5.000%, 02/15/33 . . . . . . . . . . . . . . . . . . . . . . . . . . . . 390,000 439,0195.000%, 02/15/34 . . . . . . . . . . . . . . . . . . . . . . . . . . . . 350,000 392,7635.000%, 02/15/35 . . . . . . . . . . . . . . . . . . . . . . . . . . . . 800,000 894,9525.000%, 02/15/36 . . . . . . . . . . . . . . . . . . . . . . . . . . . . 1,040,000 1,159,829
University of Oregon5.000%, 04/01/46 . . . . . . . . . . . . . . . . . . . . . . . . . . . . 380,000 420,998
University of Texas2.756%, 05/15/26 . . . . . . . . . . . . . . . . . . . . . . . . . . . . 1,810,000 1,715,9162.836%, 05/15/27 . . . . . . . . . . . . . . . . . . . . . . . . . . . . 805,000 760,081
Upper Arlington City School District5.000%, 12/01/48 . . . . . . . . . . . . . . . . . . . . . . . . . . . . 670,000 757,716
Virginia Small Business Financing Authority5.000%, 12/31/52 . . . . . . . . . . . . . . . . . . . . . . . . . . . . 710,000 756,5195.000%, 12/31/56 . . . . . . . . . . . . . . . . . . . . . . . . . . . . 720,000 766,080
Washington State Convention Center Public Facilities District5.000%, 07/01/58 . . . . . . . . . . . . . . . . . . . . . . . . . . . . 1,990,000 2,189,696
Water Revenue Authority of Georgia, Build America Bond5.000%, 11/01/40 . . . . . . . . . . . . . . . . . . . . . . . . . . . . 250,000 276,663
Weld County School District No. 25.250%, 12/01/41 . . . . . . . . . . . . . . . . . . . . . . . . . . . . 560,000 640,153
West Virginia Hospital Finance Authority5.000%, 06/01/19 . . . . . . . . . . . . . . . . . . . . . . . . . . . . 365,000 372,1505.000%, 06/01/20 . . . . . . . . . . . . . . . . . . . . . . . . . . . . 390,000 406,9495.000%, 06/01/21 . . . . . . . . . . . . . . . . . . . . . . . . . . . . 390,000 415,6895.000%, 06/01/22 . . . . . . . . . . . . . . . . . . . . . . . . . . . . 425,000 461,8095.000%, 06/01/23 . . . . . . . . . . . . . . . . . . . . . . . . . . . . 355,000 392,0195.000%, 06/01/24 . . . . . . . . . . . . . . . . . . . . . . . . . . . . 375,000 419,378
Wisconsin Health & Educational Facilities Authority5.000%, 12/15/44 . . . . . . . . . . . . . . . . . . . . . . . . . . . . 310,000 328,259
Total Municipals(Cost $250,690,395) . . . . . . . . . . . . . . . . . . . . . . . . . . . 245,899,455
Mortgage-Backed Securities—5.2%
Collateralized Mortgage Obligations—2.0%Alternative Loan Trust
6.000%, 04/25/37 . . . . . . . . . . . . . . . . . . . . . . . . . . . . 153,950 113,709American Home Mortgage Assets Trust
2.765%, 12M MTA + 0.920%, 11/25/46 (c) . . . . . . . . . . . 307,691 174,3622.785%, 12M MTA + 0.940%, 10/25/46 (c) . . . . . . . . . . . 536,883 493,373
APS Resecuritization Trust4.816%, 1M LIBOR + 2.600%, 04/27/47 (144A) (c) . . . . . . 755,717 771,3775.066%, 1M LIBOR + 2.850%, 09/27/46 (144A) (c) . . . . . . 2,924,265 3,030,229
Ari Investments LLC4.480%, 01/06/25 . . . . . . . . . . . . . . . . . . . . . . . . . . . . 1,058,114 1,058,114
Banc of America Alternative Loan Trust5.500%, 10/25/35 . . . . . . . . . . . . . . . . . . . . . . . . . . . . 1,223,610 1,217,428
BHFTII-29
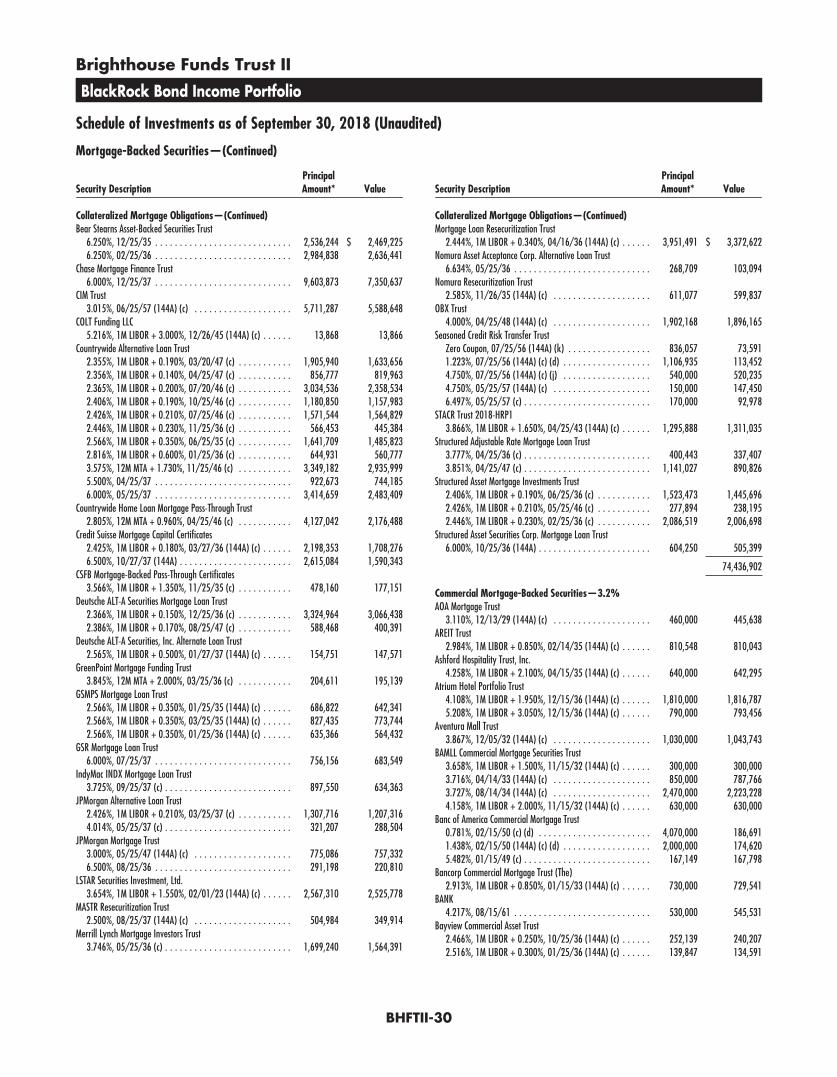
Brighthouse Funds Trust II
BlackRock Bond Income Portfolio
Schedule of Investments as of September 30, 2018 (Unaudited)
Mortgage-Backed Securities—(Continued)
Security DescriptionPrincipalAmount* Value
Collateralized Mortgage Obligations—(Continued)Bear Stearns Asset-Backed Securities Trust
6.250%, 12/25/35 . . . . . . . . . . . . . . . . . . . . . . . . . . . . 2,536,244 $ 2,469,2256.250%, 02/25/36 . . . . . . . . . . . . . . . . . . . . . . . . . . . . 2,984,838 2,636,441
Chase Mortgage Finance Trust6.000%, 12/25/37 . . . . . . . . . . . . . . . . . . . . . . . . . . . . 9,603,873 7,350,637
CIM Trust3.015%, 06/25/57 (144A) (c) . . . . . . . . . . . . . . . . . . . . 5,711,287 5,588,648
COLT Funding LLC5.216%, 1M LIBOR + 3.000%, 12/26/45 (144A) (c) . . . . . . 13,868 13,866
Countrywide Alternative Loan Trust2.355%, 1M LIBOR + 0.190%, 03/20/47 (c) . . . . . . . . . . . 1,905,940 1,633,6562.356%, 1M LIBOR + 0.140%, 04/25/47 (c) . . . . . . . . . . . 856,777 819,9632.365%, 1M LIBOR + 0.200%, 07/20/46 (c) . . . . . . . . . . . 3,034,536 2,358,5342.406%, 1M LIBOR + 0.190%, 10/25/46 (c) . . . . . . . . . . . 1,180,850 1,157,9832.426%, 1M LIBOR + 0.210%, 07/25/46 (c) . . . . . . . . . . . 1,571,544 1,564,8292.446%, 1M LIBOR + 0.230%, 11/25/36 (c) . . . . . . . . . . . 566,453 445,3842.566%, 1M LIBOR + 0.350%, 06/25/35 (c) . . . . . . . . . . . 1,641,709 1,485,8232.816%, 1M LIBOR + 0.600%, 01/25/36 (c) . . . . . . . . . . . 644,931 560,7773.575%, 12M MTA + 1.730%, 11/25/46 (c) . . . . . . . . . . . 3,349,182 2,935,9995.500%, 04/25/37 . . . . . . . . . . . . . . . . . . . . . . . . . . . . 922,673 744,1856.000%, 05/25/37 . . . . . . . . . . . . . . . . . . . . . . . . . . . . 3,414,659 2,483,409
Countrywide Home Loan Mortgage Pass-Through Trust2.805%, 12M MTA + 0.960%, 04/25/46 (c) . . . . . . . . . . . 4,127,042 2,176,488
Credit Suisse Mortgage Capital Certificates2.425%, 1M LIBOR + 0.180%, 03/27/36 (144A) (c) . . . . . . 2,198,353 1,708,2766.500%, 10/27/37 (144A) . . . . . . . . . . . . . . . . . . . . . . . 2,615,084 1,590,343
CSFB Mortgage-Backed Pass-Through Certificates3.566%, 1M LIBOR + 1.350%, 11/25/35 (c) . . . . . . . . . . . 478,160 177,151
Deutsche ALT-A Securities Mortgage Loan Trust2.366%, 1M LIBOR + 0.150%, 12/25/36 (c) . . . . . . . . . . . 3,324,964 3,066,4382.386%, 1M LIBOR + 0.170%, 08/25/47 (c) . . . . . . . . . . . 588,468 400,391
Deutsche ALT-A Securities, Inc. Alternate Loan Trust2.565%, 1M LIBOR + 0.500%, 01/27/37 (144A) (c) . . . . . . 154,751 147,571
GreenPoint Mortgage Funding Trust3.845%, 12M MTA + 2.000%, 03/25/36 (c) . . . . . . . . . . . 204,611 195,139
GSMPS Mortgage Loan Trust2.566%, 1M LIBOR + 0.350%, 01/25/35 (144A) (c) . . . . . . 686,822 642,3412.566%, 1M LIBOR + 0.350%, 03/25/35 (144A) (c) . . . . . . 827,435 773,7442.566%, 1M LIBOR + 0.350%, 01/25/36 (144A) (c) . . . . . . 635,366 564,432
GSR Mortgage Loan Trust6.000%, 07/25/37 . . . . . . . . . . . . . . . . . . . . . . . . . . . . 756,156 683,549
IndyMac INDX Mortgage Loan Trust3.725%, 09/25/37 (c) . . . . . . . . . . . . . . . . . . . . . . . . . . 897,550 634,363
JPMorgan Alternative Loan Trust2.426%, 1M LIBOR + 0.210%, 03/25/37 (c) . . . . . . . . . . . 1,307,716 1,207,3164.014%, 05/25/37 (c) . . . . . . . . . . . . . . . . . . . . . . . . . . 321,207 288,504
JPMorgan Mortgage Trust3.000%, 05/25/47 (144A) (c) . . . . . . . . . . . . . . . . . . . . 775,086 757,3326.500%, 08/25/36 . . . . . . . . . . . . . . . . . . . . . . . . . . . . 291,198 220,810
LSTAR Securities Investment, Ltd.3.654%, 1M LIBOR + 1.550%, 02/01/23 (144A) (c) . . . . . . 2,567,310 2,525,778
MASTR Resecuritization Trust2.500%, 08/25/37 (144A) (c) . . . . . . . . . . . . . . . . . . . . 504,984 349,914
Merrill Lynch Mortgage Investors Trust3.746%, 05/25/36 (c) . . . . . . . . . . . . . . . . . . . . . . . . . . 1,699,240 1,564,391
Security DescriptionPrincipalAmount* Value
Collateralized Mortgage Obligations—(Continued)Mortgage Loan Resecuritization Trust
2.444%, 1M LIBOR + 0.340%, 04/16/36 (144A) (c) . . . . . . 3,951,491 $ 3,372,622Nomura Asset Acceptance Corp. Alternative Loan Trust
6.634%, 05/25/36 . . . . . . . . . . . . . . . . . . . . . . . . . . . . 268,709 103,094Nomura Resecuritization Trust
2.585%, 11/26/35 (144A) (c) . . . . . . . . . . . . . . . . . . . . 611,077 599,837OBX Trust
4.000%, 04/25/48 (144A) (c) . . . . . . . . . . . . . . . . . . . . 1,902,168 1,896,165Seasoned Credit Risk Transfer Trust
Zero Coupon, 07/25/56 (144A) (k) . . . . . . . . . . . . . . . . . 836,057 73,5911.223%, 07/25/56 (144A) (c) (d) . . . . . . . . . . . . . . . . . . 1,106,935 113,4524.750%, 07/25/56 (144A) (c) (j) . . . . . . . . . . . . . . . . . . 540,000 520,2354.750%, 05/25/57 (144A) (c) . . . . . . . . . . . . . . . . . . . . 150,000 147,4506.497%, 05/25/57 (c) . . . . . . . . . . . . . . . . . . . . . . . . . . 170,000 92,978
STACR Trust 2018-HRP13.866%, 1M LIBOR + 1.650%, 04/25/43 (144A) (c) . . . . . . 1,295,888 1,311,035
Structured Adjustable Rate Mortgage Loan Trust3.777%, 04/25/36 (c) . . . . . . . . . . . . . . . . . . . . . . . . . . 400,443 337,4073.851%, 04/25/47 (c) . . . . . . . . . . . . . . . . . . . . . . . . . . 1,141,027 890,826
Structured Asset Mortgage Investments Trust2.406%, 1M LIBOR + 0.190%, 06/25/36 (c) . . . . . . . . . . . 1,523,473 1,445,6962.426%, 1M LIBOR + 0.210%, 05/25/46 (c) . . . . . . . . . . . 277,894 238,1952.446%, 1M LIBOR + 0.230%, 02/25/36 (c) . . . . . . . . . . . 2,086,519 2,006,698
Structured Asset Securities Corp. Mortgage Loan Trust6.000%, 10/25/36 (144A) . . . . . . . . . . . . . . . . . . . . . . . 604,250 505,399
74,436,902
Commercial Mortgage-Backed Securities—3.2%AOA Mortgage Trust
3.110%, 12/13/29 (144A) (c) . . . . . . . . . . . . . . . . . . . . 460,000 445,638AREIT Trust
2.984%, 1M LIBOR + 0.850%, 02/14/35 (144A) (c) . . . . . . 810,548 810,043Ashford Hospitality Trust, Inc.
4.258%, 1M LIBOR + 2.100%, 04/15/35 (144A) (c) . . . . . . 640,000 642,295Atrium Hotel Portfolio Trust
4.108%, 1M LIBOR + 1.950%, 12/15/36 (144A) (c) . . . . . . 1,810,000 1,816,7875.208%, 1M LIBOR + 3.050%, 12/15/36 (144A) (c) . . . . . . 790,000 793,456
Aventura Mall Trust3.867%, 12/05/32 (144A) (c) . . . . . . . . . . . . . . . . . . . . 1,030,000 1,043,743
BAMLL Commercial Mortgage Securities Trust3.658%, 1M LIBOR + 1.500%, 11/15/32 (144A) (c) . . . . . . 300,000 300,0003.716%, 04/14/33 (144A) (c) . . . . . . . . . . . . . . . . . . . . 850,000 787,7663.727%, 08/14/34 (144A) (c) . . . . . . . . . . . . . . . . . . . . 2,470,000 2,223,2284.158%, 1M LIBOR + 2.000%, 11/15/32 (144A) (c) . . . . . . 630,000 630,000
Banc of America Commercial Mortgage Trust0.781%, 02/15/50 (c) (d) . . . . . . . . . . . . . . . . . . . . . . . 4,070,000 186,6911.438%, 02/15/50 (144A) (c) (d) . . . . . . . . . . . . . . . . . . 2,000,000 174,6205.482%, 01/15/49 (c) . . . . . . . . . . . . . . . . . . . . . . . . . . 167,149 167,798
Bancorp Commercial Mortgage Trust (The)2.913%, 1M LIBOR + 0.850%, 01/15/33 (144A) (c) . . . . . . 730,000 729,541
BANK4.217%, 08/15/61 . . . . . . . . . . . . . . . . . . . . . . . . . . . . 530,000 545,531
Bayview Commercial Asset Trust2.466%, 1M LIBOR + 0.250%, 10/25/36 (144A) (c) . . . . . . 252,139 240,2072.516%, 1M LIBOR + 0.300%, 01/25/36 (144A) (c) . . . . . . 139,847 134,591
BHFTII-30

Brighthouse Funds Trust II
BlackRock Bond Income Portfolio
Schedule of Investments as of September 30, 2018 (Unaudited)
Mortgage-Backed Securities—(Continued)
Security DescriptionPrincipalAmount* Value
Commercial Mortgage-Backed Securities—(Continued)Bayview Commercial Asset Trust
2.516%, 1M LIBOR + 0.300%, 10/25/36 (144A) (c) . . . . . . 256,563 $ 245,0112.576%, 1M LIBOR + 0.360%, 04/25/36 (144A) (c) . . . . . . 161,994 157,1262.666%, 1M LIBOR + 0.450%, 01/25/36 (144A) (c) . . . . . . 104,109 99,6382.666%, 1M LIBOR + 0.450%, 09/25/37 (144A) (c) . . . . . . 662,563 633,5123.216%, 1M LIBOR + 1.000%, 10/25/37 (144A) (c) . . . . . . 133,499 133,3773.716%, 1M LIBOR + 1.500%, 12/25/37 (144A) (c) . . . . . . 720,000 547,391
BB-UBS Trust0.730%, 11/05/36 (144A) (c) (d) . . . . . . . . . . . . . . . . . . 85,480,000 2,913,2444.160%, 11/05/36 (144A) (c) . . . . . . . . . . . . . . . . . . . . 330,000 307,840
BBCMS Mortgage Trust2.880%, 1M LIBOR + 0.722%, 03/15/37 (144A) (c) . . . . . . 280,000 279,825
Benchmark Mortgage Trust4.208%, 07/15/51 . . . . . . . . . . . . . . . . . . . . . . . . . . . . 920,000 948,604
BHMS Mortgage Trust3.408%, 1M LIBOR + 1.250%, 07/15/35 (144A) (c) . . . . . . 1,250,000 1,251,2554.058%, 1M LIBOR + 1.900%, 07/15/35 (144A) (c) . . . . . . 270,000 270,025
BSPRT Issuer, Ltd.2.978%, 1M LIBOR + 0.820%, 10/15/34 (144A) (c) . . . . . . 130,053 129,979
BWAY Mortgage Trust3.446%, 03/10/33 (144A) . . . . . . . . . . . . . . . . . . . . . . . 1,495,000 1,439,3403.454%, 03/10/33 (144A) . . . . . . . . . . . . . . . . . . . . . . . 2,690,000 2,653,5753.633%, 03/10/33 (144A) . . . . . . . . . . . . . . . . . . . . . . . 600,000 579,0714.058%, 03/10/33 (144A) (c) . . . . . . . . . . . . . . . . . . . . 1,210,000 1,147,338
BXP Trust3.670%, 08/13/37 (144A) (c) . . . . . . . . . . . . . . . . . . . . 1,640,000 1,480,843
CCRESG Commercial Mortgage Trust5.671%, 04/10/29 (144A) (c) . . . . . . . . . . . . . . . . . . . . 230,000 233,487
CD Mortgage Trust3.631%, 02/10/50 . . . . . . . . . . . . . . . . . . . . . . . . . . . . 350,000 346,7215.648%, 10/15/48 . . . . . . . . . . . . . . . . . . . . . . . . . . . . 422,795 435,113
CFCRE Commercial Mortgage Trust0.891%, 05/10/58 (c) (d) . . . . . . . . . . . . . . . . . . . . . . . 2,370,000 113,7711.899%, 05/10/58 (c) (d) . . . . . . . . . . . . . . . . . . . . . . . 2,523,869 244,834
CGDBB Commercial Mortgage Trust2.948%, 1M LIBOR + 0.790%, 07/15/32 (144A) (c) . . . . . . 1,490,000 1,492,1033.758%, 1M LIBOR + 1.600%, 07/15/32 (144A) (c) . . . . . . 1,110,000 1,110,3504.308%, 1M LIBOR + 2.150%, 07/15/32 (144A) (c) . . . . . . 1,680,000 1,679,737
Citigroup Commercial Mortgage Trust2.788%, 04/10/49 (144A) . . . . . . . . . . . . . . . . . . . . . . . 930,000 705,3284.996%, 04/15/49 (c) . . . . . . . . . . . . . . . . . . . . . . . . . . 40,000 40,905
CLNS Trust5.631%, 1M LIBOR + 3.500%, 06/11/32 (144A) (c) . . . . . . 665,000 668,741
Commercial Mortgage Pass-Through Certificates Mortgage Trust0.168%, 02/10/35 (144A) (c) (d) . . . . . . . . . . . . . . . . . . 60,958,000 343,8031.204%, 03/10/46 (c) (d) . . . . . . . . . . . . . . . . . . . . . . . 25,360,694 773,9152.933%, 1M LIBOR + 0.800%, 08/13/27 (144A) (c) . . . . . . 700,000 700,0003.183%, 02/10/48 . . . . . . . . . . . . . . . . . . . . . . . . . . . . 513,000 501,0913.285%, 10/10/36 (144A) (c) . . . . . . . . . . . . . . . . . . . . 270,000 246,1603.550%, 07/15/47 . . . . . . . . . . . . . . . . . . . . . . . . . . . . 550,000 549,6893.748%, 1M LIBOR + 1.600%, 02/13/32 (144A) (c) . . . . . . 1,280,000 1,282,3993.796%, 08/10/47 . . . . . . . . . . . . . . . . . . . . . . . . . . . . 540,000 546,4013.807%, 05/10/48 (144A) (c) . . . . . . . . . . . . . . . . . . . . 730,000 720,5963.977%, 05/10/47 . . . . . . . . . . . . . . . . . . . . . . . . . . . . 1,394,000 1,423,1154.006%, 04/10/47 . . . . . . . . . . . . . . . . . . . . . . . . . . . . 400,000 409,0794.051%, 04/10/47 . . . . . . . . . . . . . . . . . . . . . . . . . . . . 1,896,000 1,941,989
Security DescriptionPrincipalAmount* Value
Commercial Mortgage-Backed Securities—(Continued)Commercial Mortgage Pass-Through Certificates Mortgage Trust
4.236%, 02/10/47 (c) . . . . . . . . . . . . . . . . . . . . . . . . . . 320,000 $ 331,0434.398%, 1M LIBOR + 2.250%, 02/13/32 (144A) (c) . . . . . . 550,000 553,4374.453%, 07/10/48 (c) . . . . . . . . . . . . . . . . . . . . . . . . . . 1,600,000 1,569,2144.562%, 12/10/47 (c) . . . . . . . . . . . . . . . . . . . . . . . . . . 420,000 406,2244.696%, 08/10/48 (c) . . . . . . . . . . . . . . . . . . . . . . . . . . 1,256,000 1,232,3005.398%, 1M LIBOR + 3.250%, 02/13/32 (144A) (c) . . . . . . 50,000 50,3755.870%, 06/10/44 (144A) (c) . . . . . . . . . . . . . . . . . . . . 190,000 192,914
Commercial Mortgage Trust3.807%, 05/10/48 (144A) (c) . . . . . . . . . . . . . . . . . . . . 1,740,000 1,726,1414.122%, 1M LIBOR + 1.964%, 08/15/35 (144A) (c) . . . . . . 690,000 684,6044.739%, 1M LIBOR + 2.581%, 08/15/35 (144A) (c) . . . . . . 630,000 624,374
Core Industrial Trust3.077%, 02/10/34 (144A) . . . . . . . . . . . . . . . . . . . . . . . 1,975,068 1,956,7913.977%, 02/10/34 (144A) (c) . . . . . . . . . . . . . . . . . . . . 2,360,000 2,292,523
Credit Suisse First Boston Mortgage Securities Corp.4.952%, 07/15/37 (c) . . . . . . . . . . . . . . . . . . . . . . . . . . 70,000 71,6855.234%, 10/15/39 (144A) (c) . . . . . . . . . . . . . . . . . . . . 250,000 250,955
Credit Suisse Mortgage Capital Certificates3.108%, 1M LIBOR + 0.950%, 12/15/30 (144A) (c) . . . . . . 280,000 280,086
Credit Suisse Mortgage Capital Certificates Trust3.758%, 1M LIBOR + 1.600%, 11/15/33 (144A) (c) . . . . . . 201,070 202,022
CSAIL Commercial Mortgage Trust0.220%, 11/15/50 (c) (d) . . . . . . . . . . . . . . . . . . . . . . . 3,940,000 64,923
DBJPM Mortgage Trust1.000%, 06/10/50 (144A) (c) (d) . . . . . . . . . . . . . . . . . . 2,060,000 131,6483.634%, 08/10/49 (144A) (c) . . . . . . . . . . . . . . . . . . . . 698,000 593,307
DBUBS Mortgage Trust3.452%, 10/10/34 (144A) . . . . . . . . . . . . . . . . . . . . . . . 850,000 839,6063.648%, 10/10/34 (144A) (c) . . . . . . . . . . . . . . . . . . . . 1,710,000 1,567,845
Eleven Madison Trust Mortgage Trust3.673%, 09/10/35 (144A) (c) . . . . . . . . . . . . . . . . . . . . 440,000 436,608
GAHR Commercial Mortgage Trust3.495%, 12/15/34 (144A) (c) . . . . . . . . . . . . . . . . . . . . 880,000 870,7483.613%, 1M LIBOR + 1.300%, 12/15/34 (144A) (c) . . . . . . 149,089 149,136
GPMT, Ltd.3.082%, 1M LIBOR + 0.900%, 11/21/35 (144A) (c) . . . . . . 869,000 869,000
GS Mortgage Securities Corp.3.550%, 12/10/27 (144A) (c) . . . . . . . . . . . . . . . . . . . . 11,042,358 10,882,432
GS Mortgage Securities Corp. II4.508%, 1M LIBOR + 2.350%, 02/15/37 (144A) (c) . . . . . . 230,000 231,7985.366%, 05/03/32 (144A) . . . . . . . . . . . . . . . . . . . . . . . 840,000 919,211
GS Mortgage Securities Corp. Trust2.856%, 05/10/34 (144A) . . . . . . . . . . . . . . . . . . . . . . . 710,000 692,6713.458%, 1M LIBOR + 1.300%, 07/15/32 (144A) (c) . . . . . . 80,000 80,1253.658%, 1M LIBOR + 1.500%, 07/15/32 (144A) (c) . . . . . . 170,000 170,3173.958%, 1M LIBOR + 1.800%, 07/15/32 (144A) (c) . . . . . . 70,000 70,1964.658%, 1M LIBOR + 2.500%, 07/15/32 (144A) (c) . . . . . . 30,000 30,112
GS Mortgage Securities Trust3.000%, 08/10/50 (144A) . . . . . . . . . . . . . . . . . . . . . . . 240,000 203,4733.345%, 07/10/48 . . . . . . . . . . . . . . . . . . . . . . . . . . . . 180,650 155,2613.931%, 09/10/47 . . . . . . . . . . . . . . . . . . . . . . . . . . . . 800,000 813,9514.529%, 04/10/47 (c) . . . . . . . . . . . . . . . . . . . . . . . . . . 50,000 49,3684.558%, 07/10/48 (c) . . . . . . . . . . . . . . . . . . . . . . . . . . 500,000 491,3804.846%, 06/10/47 (144A) (c) . . . . . . . . . . . . . . . . . . . . 64,000 59,305
BHFTII-31

Brighthouse Funds Trust II
BlackRock Bond Income Portfolio
Schedule of Investments as of September 30, 2018 (Unaudited)
Mortgage-Backed Securities—(Continued)
Security DescriptionPrincipalAmount* Value
Commercial Mortgage-Backed Securities—(Continued)Hilton Orlando Trust
4.808%, 1M LIBOR + 2.650%, 12/15/34 (144A) (c) . . . . . . 780,000 $ 782,926HMH Trust
3.062%, 07/05/31 (144A) . . . . . . . . . . . . . . . . . . . . . . . 1,210,000 1,169,129IMT Trust
3.478%, 06/15/34 (144A) . . . . . . . . . . . . . . . . . . . . . . . 540,000 534,2023.613%, 06/15/34 (144A) (c) . . . . . . . . . . . . . . . . . . . . 570,000 545,325
JPMBB Commercial Mortgage Securities Trust0.965%, 05/15/48 (c) (d) . . . . . . . . . . . . . . . . . . . . . . . 1,174,214 35,7181.038%, 09/15/47 (c) (d) . . . . . . . . . . . . . . . . . . . . . . . 2,800,706 112,0643.775%, 08/15/47 . . . . . . . . . . . . . . . . . . . . . . . . . . . . 550,000 554,9533.801%, 09/15/47 . . . . . . . . . . . . . . . . . . . . . . . . . . . . 220,000 222,0824.271%, 12/15/48 (144A) (c) . . . . . . . . . . . . . . . . . . . . 300,000 288,273
JPMCC Commercial Mortgage Securities Trust4.050%, 09/15/50 . . . . . . . . . . . . . . . . . . . . . . . . . . . . 110,000 108,9384.802%, 03/15/50 (144A) (c) . . . . . . . . . . . . . . . . . . . . 650,000 631,491
JPMDB Commercial Mortgage Securities Trust0.750%, 12/15/49 (144A) (c) (d) . . . . . . . . . . . . . . . . . . 2,067,000 102,552
JPMorgan Chase Commercial Mortgage Securities Trust0.646%, 04/15/46 (c) (d) . . . . . . . . . . . . . . . . . . . . . . . 4,900,000 109,7290.750%, 08/15/49 (144A) (c) (d) . . . . . . . . . . . . . . . . . . 5,300,000 251,9420.940%, 12/15/49 (c) (d) . . . . . . . . . . . . . . . . . . . . . . . 986,609 39,2842.949%, 10/06/38 (144A) (c) . . . . . . . . . . . . . . . . . . . . 1,670,000 1,565,1763.458%, 1M LIBOR + 1.300%, 06/15/45 (144A) (c) . . . . . . 130,000 133,2134.400%, 01/15/49 (c) . . . . . . . . . . . . . . . . . . . . . . . . . . 970,000 917,4624.900%, 01/15/49 (c) . . . . . . . . . . . . . . . . . . . . . . . . . . 1,785,000 1,823,6435.158%, 1M LIBOR + 3.000%, 02/15/35 (144A) (c) . . . . . . 480,000 482,7006.325%, 08/12/40 (144A) (c) . . . . . . . . . . . . . . . . . . . . 99,682 101,203
Lehman Brothers Small Balance Commercial Mortgage Trust2.466%, 1M LIBOR + 0.250%, 03/25/37 (144A) (c) . . . . . . 608,968 585,193
Lone Star Portfolio Trust4.208%, 1M LIBOR + 1.800%, 09/15/28 (144A) (c) . . . . . . 33,562 33,593
LSTAR Commercial Mortgage Trust1.270%, 03/10/50 (144A) (c) (d) . . . . . . . . . . . . . . . . . . 891,428 41,986
Madison Avenue Trust4.169%, 10/12/32 (144A) (c) . . . . . . . . . . . . . . . . . . . . 998,000 997,366
Merrill Lynch Mortgage Trust6.527%, 09/12/42 (144A) (c) . . . . . . . . . . . . . . . . . . . . 490,000 503,909
Morgan Stanley Bank of America Merrill Lynch Trust1.335%, 12/15/47 (144A) (c) (d) . . . . . . . . . . . . . . . . . . 1,810,000 106,8791.586%, 11/15/49 (c) (d) . . . . . . . . . . . . . . . . . . . . . . . 1,097,832 89,8253.060%, 10/15/48 (144A) . . . . . . . . . . . . . . . . . . . . . . . 730,000 628,5223.068%, 10/15/48 . . . . . . . . . . . . . . . . . . . . . . . . . . . . 850,000 739,2063.892%, 06/15/47 . . . . . . . . . . . . . . . . . . . . . . . . . . . . 3,000,000 3,040,7434.270%, 07/15/50 (144A) (c) . . . . . . . . . . . . . . . . . . . . 700,000 629,3894.558%, 05/15/50 (c) . . . . . . . . . . . . . . . . . . . . . . . . . . 300,000 296,4874.679%, 10/15/48 (c) . . . . . . . . . . . . . . . . . . . . . . . . . . 170,000 169,195
Morgan Stanley Capital Trust2.360%, 06/15/50 (144A) (c) (d) . . . . . . . . . . . . . . . . . . 1,190,000 183,3342.546%, 06/15/50 (144A) . . . . . . . . . . . . . . . . . . . . . . . 1,510,000 1,202,7013.560%, 07/13/29 (144A) (c) . . . . . . . . . . . . . . . . . . . . 540,000 519,9034.108%, 1M LIBOR + 1.950%, 11/15/34 (144A) (c) . . . . . . 330,000 331,0314.165%, 05/15/48 (144A) (c) . . . . . . . . . . . . . . . . . . . . 110,000 98,2254.165%, 05/15/48 (c) . . . . . . . . . . . . . . . . . . . . . . . . . . 150,000 143,1714.177%, 07/15/51 . . . . . . . . . . . . . . . . . . . . . . . . . . . . 470,000 481,4704.281%, 06/15/50 (c) . . . . . . . . . . . . . . . . . . . . . . . . . . 339,000 329,110
Security DescriptionPrincipalAmount* Value
Commercial Mortgage-Backed Securities—(Continued)Morgan Stanley Capital Trust
4.708%, 1M LIBOR + 2.550%, 07/15/35 (144A) (c) . . . . . . 640,000 $ 640,4034.758%, 1M LIBOR + 2.600%, 11/15/34 (144A) (c) . . . . . . 1,977,000 1,984,4135.208%, 1M LIBOR + 3.050%, 11/15/34 (144A) (c) . . . . . . 610,000 613,431
Natixis Commercial Mortgage Securities Trust3.013%, 1M LIBOR + 0.950%, 06/15/35 (144A) (c) . . . . . . 240,000 240,116
Olympic Tower Mortgage Trust0.511%, 05/10/39 (144A) (c) (d) . . . . . . . . . . . . . . . . . . 13,300,000 393,1614.077%, 05/10/39 (144A) (c) . . . . . . . . . . . . . . . . . . . . 1,345,000 1,232,968
One Market Plaza TrustZero Coupon, 02/10/32 (144A) (c) (d) . . . . . . . . . . . . . . . 4,222,000 40.218%, 02/10/32 (144A) (c) (d) . . . . . . . . . . . . . . . . . . 21,110,000 97,528
Park Avenue Mortgage Trust4.277%, 1M LIBOR + 2.119%, 09/15/34 (144A) (c) . . . . . . 3,510,000 3,516,583
Park Avenue Trust0.271%, 06/05/37 (144A) (c) (d) . . . . . . . . . . . . . . . . . . 5,000,000 72,4063.779%, 06/05/37 (144A) (c) . . . . . . . . . . . . . . . . . . . . 2,460,000 2,189,367
Prima Capital CRE Securitization, Ltd.4.000%, 08/24/49 (144A) . . . . . . . . . . . . . . . . . . . . . . . 260,000 256,022
RAIT Trust3.108%, 1M LIBOR + 0.950%, 06/15/37 (144A) (c) . . . . . . 924,529 924,809
Resource Capital Corp., Ltd.2.958%, 1M LIBOR + 0.800%, 07/15/34 (144A) (c) . . . . . . 615,669 615,6684.158%, 1M LIBOR + 2.000%, 07/15/34 (144A) (c) . . . . . . 331,911 331,911
UBS Commercial Mortgage Trust3.000%, 10/15/51 (144A) (c) . . . . . . . . . . . . . . . . . . . . 105,000 83,749
Velocity Commercial Capital Loan Trust4.646%, 1M LIBOR + 2.430%, 06/25/45 (144A) (c) . . . . . . 144,315 145,247
Waldorf Astoria Boca Raton Trust3.508%, 1M LIBOR + 1.350%, 06/15/29 (144A) (c) . . . . . . 1,590,000 1,590,994
Wells Fargo Commercial Mortgage Trust0.926%, 05/15/51 (c) (d) . . . . . . . . . . . . . . . . . . . . . . . 4,988,322 280,4941.072%, 12/15/48 (c) (d) . . . . . . . . . . . . . . . . . . . . . . . 1,312,022 64,9131.221%, 12/15/59 (c) (d) . . . . . . . . . . . . . . . . . . . . . . . 2,389,583 135,1331.407%, 08/15/49 (144A) (c) (d) . . . . . . . . . . . . . . . . . . 1,430,000 109,6522.600%, 11/15/50 (144A) (c) . . . . . . . . . . . . . . . . . . . . 505,000 409,4382.998%, 1M LIBOR + 0.850%, 12/13/31 (144A) (c) . . . . . . 490,000 490,3123.453%, 07/15/50 . . . . . . . . . . . . . . . . . . . . . . . . . . . . 449,000 436,6983.718%, 12/15/48 . . . . . . . . . . . . . . . . . . . . . . . . . . . . 190,000 189,5913.753%, 12/15/48 (c) . . . . . . . . . . . . . . . . . . . . . . . . . . 35,000 32,3533.809%, 12/15/48 . . . . . . . . . . . . . . . . . . . . . . . . . . . . 630,000 633,3373.874%, 06/15/36 (144A) (c) . . . . . . . . . . . . . . . . . . . . 270,000 267,4024.315%, 1M LIBOR + 2.157%, 12/15/36 (144A) (c) . . . . . . 270,000 271,9304.501%, 09/15/50 (144A) (c) . . . . . . . . . . . . . . . . . . . . 150,000 138,971
WF-RBS Commercial Mortgage Trust3.108%, 1M LIBOR + 0.950%, 03/15/44 (144A) (c) . . . . . . 27,927 28,0493.678%, 08/15/47 . . . . . . . . . . . . . . . . . . . . . . . . . . . . 595,000 596,5193.907%, 09/15/57 (c) . . . . . . . . . . . . . . . . . . . . . . . . . . 1,540,000 1,448,773
118,320,953
Total Mortgage-Backed Securities(Cost $194,299,853) . . . . . . . . . . . . . . . . . . . . . . . . . . . 192,757,855
Foreign Government—3.3%
Municipal—0.0%Provincia de Rio Negro
7.750%, 12/07/25 (144A) (l) . . . . . . . . . . . . . . . . . . . . . 600,000 450,006
BHFTII-32
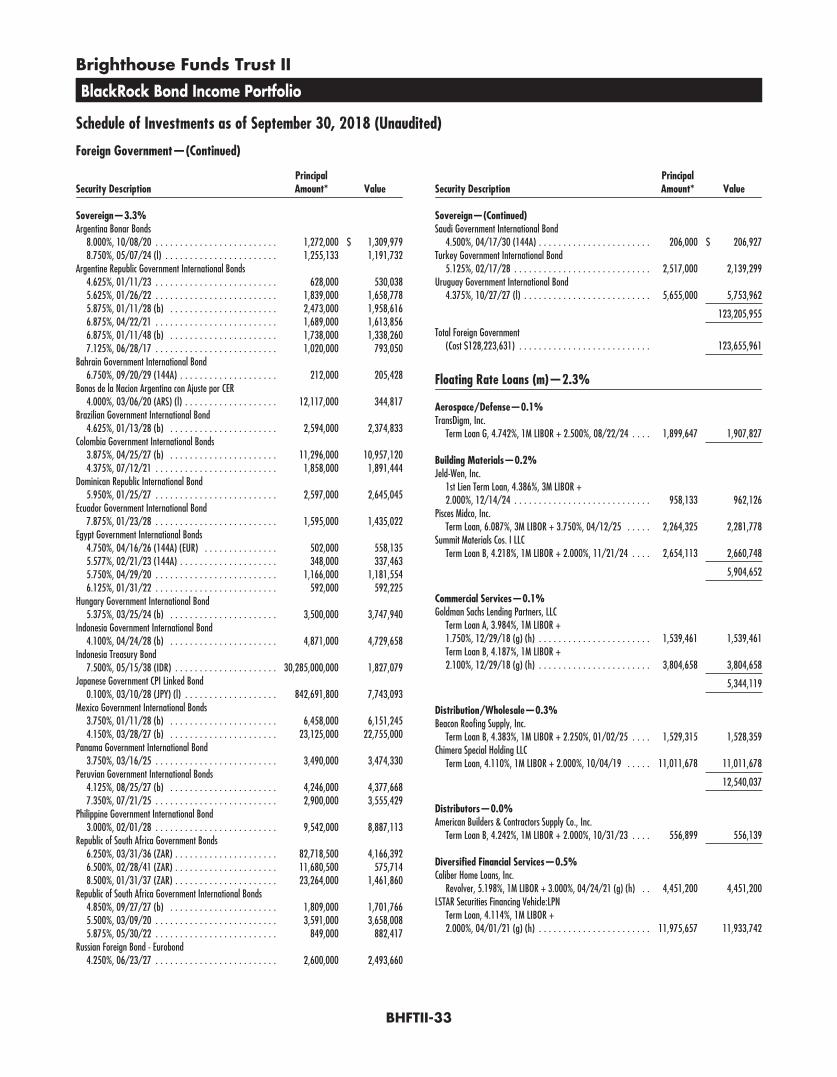
Brighthouse Funds Trust II
BlackRock Bond Income Portfolio
Schedule of Investments as of September 30, 2018 (Unaudited)
Foreign Government—(Continued)
Security DescriptionPrincipalAmount* Value
Sovereign—3.3%Argentina Bonar Bonds
8.000%, 10/08/20 . . . . . . . . . . . . . . . . . . . . . . . . . 1,272,000 $ 1,309,9798.750%, 05/07/24 (l) . . . . . . . . . . . . . . . . . . . . . . . 1,255,133 1,191,732
Argentine Republic Government International Bonds4.625%, 01/11/23 . . . . . . . . . . . . . . . . . . . . . . . . . 628,000 530,0385.625%, 01/26/22 . . . . . . . . . . . . . . . . . . . . . . . . . 1,839,000 1,658,7785.875%, 01/11/28 (b) . . . . . . . . . . . . . . . . . . . . . . 2,473,000 1,958,6166.875%, 04/22/21 . . . . . . . . . . . . . . . . . . . . . . . . . 1,689,000 1,613,8566.875%, 01/11/48 (b) . . . . . . . . . . . . . . . . . . . . . . 1,738,000 1,338,2607.125%, 06/28/17 . . . . . . . . . . . . . . . . . . . . . . . . . 1,020,000 793,050
Bahrain Government International Bond6.750%, 09/20/29 (144A) . . . . . . . . . . . . . . . . . . . . 212,000 205,428
Bonos de la Nacion Argentina con Ajuste por CER4.000%, 03/06/20 (ARS) (l) . . . . . . . . . . . . . . . . . . . 12,117,000 344,817
Brazilian Government International Bond4.625%, 01/13/28 (b) . . . . . . . . . . . . . . . . . . . . . . 2,594,000 2,374,833
Colombia Government International Bonds3.875%, 04/25/27 (b) . . . . . . . . . . . . . . . . . . . . . . 11,296,000 10,957,1204.375%, 07/12/21 . . . . . . . . . . . . . . . . . . . . . . . . . 1,858,000 1,891,444
Dominican Republic International Bond5.950%, 01/25/27 . . . . . . . . . . . . . . . . . . . . . . . . . 2,597,000 2,645,045
Ecuador Government International Bond7.875%, 01/23/28 . . . . . . . . . . . . . . . . . . . . . . . . . 1,595,000 1,435,022
Egypt Government International Bonds4.750%, 04/16/26 (144A) (EUR) . . . . . . . . . . . . . . . 502,000 558,1355.577%, 02/21/23 (144A) . . . . . . . . . . . . . . . . . . . . 348,000 337,4635.750%, 04/29/20 . . . . . . . . . . . . . . . . . . . . . . . . . 1,166,000 1,181,5546.125%, 01/31/22 . . . . . . . . . . . . . . . . . . . . . . . . . 592,000 592,225
Hungary Government International Bond5.375%, 03/25/24 (b) . . . . . . . . . . . . . . . . . . . . . . 3,500,000 3,747,940
Indonesia Government International Bond4.100%, 04/24/28 (b) . . . . . . . . . . . . . . . . . . . . . . 4,871,000 4,729,658
Indonesia Treasury Bond7.500%, 05/15/38 (IDR) . . . . . . . . . . . . . . . . . . . . . 30,285,000,000 1,827,079
Japanese Government CPI Linked Bond0.100%, 03/10/28 (JPY) (l) . . . . . . . . . . . . . . . . . . . 842,691,800 7,743,093
Mexico Government International Bonds3.750%, 01/11/28 (b) . . . . . . . . . . . . . . . . . . . . . . 6,458,000 6,151,2454.150%, 03/28/27 (b) . . . . . . . . . . . . . . . . . . . . . . 23,125,000 22,755,000
Panama Government International Bond3.750%, 03/16/25 . . . . . . . . . . . . . . . . . . . . . . . . . 3,490,000 3,474,330
Peruvian Government International Bonds4.125%, 08/25/27 (b) . . . . . . . . . . . . . . . . . . . . . . 4,246,000 4,377,6687.350%, 07/21/25 . . . . . . . . . . . . . . . . . . . . . . . . . 2,900,000 3,555,429
Philippine Government International Bond3.000%, 02/01/28 . . . . . . . . . . . . . . . . . . . . . . . . . 9,542,000 8,887,113
Republic of South Africa Government Bonds6.250%, 03/31/36 (ZAR) . . . . . . . . . . . . . . . . . . . . . 82,718,500 4,166,3926.500%, 02/28/41 (ZAR) . . . . . . . . . . . . . . . . . . . . . 11,680,500 575,7148.500%, 01/31/37 (ZAR) . . . . . . . . . . . . . . . . . . . . . 23,264,000 1,461,860
Republic of South Africa Government International Bonds4.850%, 09/27/27 (b) . . . . . . . . . . . . . . . . . . . . . . 1,809,000 1,701,7665.500%, 03/09/20 . . . . . . . . . . . . . . . . . . . . . . . . . 3,591,000 3,658,0085.875%, 05/30/22 . . . . . . . . . . . . . . . . . . . . . . . . . 849,000 882,417
Russian Foreign Bond - Eurobond4.250%, 06/23/27 . . . . . . . . . . . . . . . . . . . . . . . . . 2,600,000 2,493,660
Security DescriptionPrincipalAmount* Value
Sovereign—(Continued)Saudi Government International Bond
4.500%, 04/17/30 (144A) . . . . . . . . . . . . . . . . . . . . . . . 206,000 $ 206,927Turkey Government International Bond
5.125%, 02/17/28 . . . . . . . . . . . . . . . . . . . . . . . . . . . . 2,517,000 2,139,299Uruguay Government International Bond
4.375%, 10/27/27 (l) . . . . . . . . . . . . . . . . . . . . . . . . . . 5,655,000 5,753,962
123,205,955
Total Foreign Government(Cost $128,223,631) . . . . . . . . . . . . . . . . . . . . . . . . . . . 123,655,961
Floating Rate Loans (m)—2.3%
Aerospace/Defense—0.1%TransDigm, Inc.
Term Loan G, 4.742%, 1M LIBOR + 2.500%, 08/22/24 . . . . 1,899,647 1,907,827
Building Materials—0.2%Jeld-Wen, Inc.
1st Lien Term Loan, 4.386%, 3M LIBOR +2.000%, 12/14/24 . . . . . . . . . . . . . . . . . . . . . . . . . . . . 958,133 962,126
Pisces Midco, Inc.Term Loan, 6.087%, 3M LIBOR + 3.750%, 04/12/25 . . . . . 2,264,325 2,281,778
Summit Materials Cos. I LLCTerm Loan B, 4.218%, 1M LIBOR + 2.000%, 11/21/24 . . . . 2,654,113 2,660,748
5,904,652
Commercial Services—0.1%Goldman Sachs Lending Partners, LLC
Term Loan A, 3.984%, 1M LIBOR +1.750%, 12/29/18 (g) (h) . . . . . . . . . . . . . . . . . . . . . . . 1,539,461 1,539,461Term Loan B, 4.187%, 1M LIBOR +2.100%, 12/29/18 (g) (h) . . . . . . . . . . . . . . . . . . . . . . . 3,804,658 3,804,658
5,344,119
Distribution/Wholesale—0.3%Beacon Roofing Supply, Inc.
Term Loan B, 4.383%, 1M LIBOR + 2.250%, 01/02/25 . . . . 1,529,315 1,528,359Chimera Special Holding LLC
Term Loan, 4.110%, 1M LIBOR + 2.000%, 10/04/19 . . . . . 11,011,678 11,011,678
12,540,037
Distributors—0.0%American Builders & Contractors Supply Co., Inc.
Term Loan B, 4.242%, 1M LIBOR + 2.000%, 10/31/23 . . . . 556,899 556,139
Diversified Financial Services—0.5%Caliber Home Loans, Inc.
Revolver, 5.198%, 1M LIBOR + 3.000%, 04/24/21 (g) (h) . . 4,451,200 4,451,200LSTAR Securities Financing Vehicle:LPN
Term Loan, 4.114%, 1M LIBOR +2.000%, 04/01/21 (g) (h) . . . . . . . . . . . . . . . . . . . . . . . 11,975,657 11,933,742
BHFTII-33
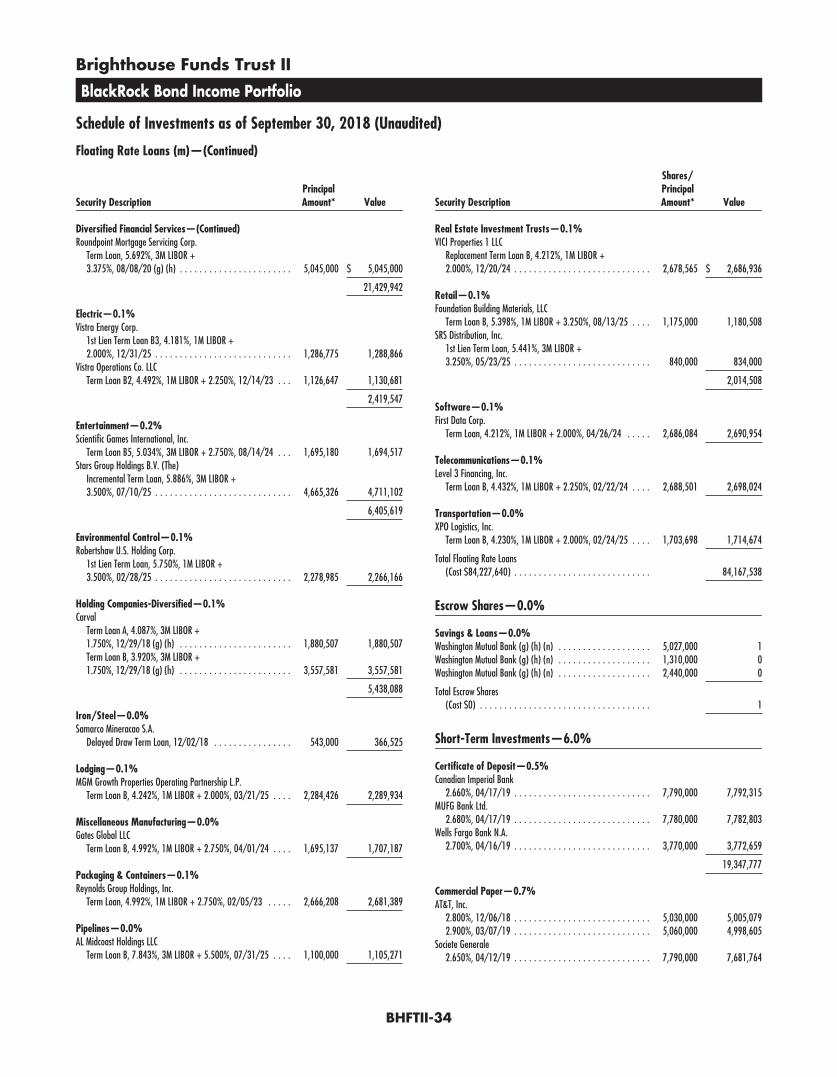
Brighthouse Funds Trust II
BlackRock Bond Income Portfolio
Schedule of Investments as of September 30, 2018 (Unaudited)
Floating Rate Loans (m)—(Continued)
Security DescriptionPrincipalAmount* Value
Diversified Financial Services—(Continued)Roundpoint Mortgage Servicing Corp.
Term Loan, 5.692%, 3M LIBOR +3.375%, 08/08/20 (g) (h) . . . . . . . . . . . . . . . . . . . . . . . 5,045,000 $ 5,045,000
21,429,942
Electric—0.1%Vistra Energy Corp.
1st Lien Term Loan B3, 4.181%, 1M LIBOR +2.000%, 12/31/25 . . . . . . . . . . . . . . . . . . . . . . . . . . . . 1,286,775 1,288,866
Vistra Operations Co. LLCTerm Loan B2, 4.492%, 1M LIBOR + 2.250%, 12/14/23 . . . 1,126,647 1,130,681
2,419,547
Entertainment—0.2%Scientific Games International, Inc.
Term Loan B5, 5.034%, 3M LIBOR + 2.750%, 08/14/24 . . . 1,695,180 1,694,517Stars Group Holdings B.V. (The)
Incremental Term Loan, 5.886%, 3M LIBOR +3.500%, 07/10/25 . . . . . . . . . . . . . . . . . . . . . . . . . . . . 4,665,326 4,711,102
6,405,619
Environmental Control—0.1%Robertshaw U.S. Holding Corp.
1st Lien Term Loan, 5.750%, 1M LIBOR +3.500%, 02/28/25 . . . . . . . . . . . . . . . . . . . . . . . . . . . . 2,278,985 2,266,166
Holding Companies-Diversified—0.1%Carval
Term Loan A, 4.087%, 3M LIBOR +1.750%, 12/29/18 (g) (h) . . . . . . . . . . . . . . . . . . . . . . . 1,880,507 1,880,507Term Loan B, 3.920%, 3M LIBOR +1.750%, 12/29/18 (g) (h) . . . . . . . . . . . . . . . . . . . . . . . 3,557,581 3,557,581
5,438,088
Iron/Steel—0.0%Samarco Mineracao S.A.
Delayed Draw Term Loan, 12/02/18 . . . . . . . . . . . . . . . . 543,000 366,525
Lodging—0.1%MGM Growth Properties Operating Partnership L.P.
Term Loan B, 4.242%, 1M LIBOR + 2.000%, 03/21/25 . . . . 2,284,426 2,289,934
Miscellaneous Manufacturing—0.0%Gates Global LLC
Term Loan B, 4.992%, 1M LIBOR + 2.750%, 04/01/24 . . . . 1,695,137 1,707,187
Packaging & Containers—0.1%Reynolds Group Holdings, Inc.
Term Loan, 4.992%, 1M LIBOR + 2.750%, 02/05/23 . . . . . 2,666,208 2,681,389
Pipelines—0.0%AL Midcoast Holdings LLC
Term Loan B, 7.843%, 3M LIBOR + 5.500%, 07/31/25 . . . . 1,100,000 1,105,271
Security Description
Shares/PrincipalAmount* Value
Real Estate Investment Trusts—0.1%VICI Properties 1 LLC
Replacement Term Loan B, 4.212%, 1M LIBOR +2.000%, 12/20/24 . . . . . . . . . . . . . . . . . . . . . . . . . . . . 2,678,565 $ 2,686,936
Retail—0.1%Foundation Building Materials, LLC
Term Loan B, 5.398%, 1M LIBOR + 3.250%, 08/13/25 . . . . 1,175,000 1,180,508SRS Distribution, Inc.
1st Lien Term Loan, 5.441%, 3M LIBOR +3.250%, 05/23/25 . . . . . . . . . . . . . . . . . . . . . . . . . . . . 840,000 834,000
2,014,508
Software—0.1%First Data Corp.
Term Loan, 4.212%, 1M LIBOR + 2.000%, 04/26/24 . . . . . 2,686,084 2,690,954
Telecommunications—0.1%Level 3 Financing, Inc.
Term Loan B, 4.432%, 1M LIBOR + 2.250%, 02/22/24 . . . . 2,688,501 2,698,024
Transportation—0.0%XPO Logistics, Inc.
Term Loan B, 4.230%, 1M LIBOR + 2.000%, 02/24/25 . . . . 1,703,698 1,714,674
Total Floating Rate Loans(Cost $84,227,640) . . . . . . . . . . . . . . . . . . . . . . . . . . . . 84,167,538
Escrow Shares—0.0%
Savings & Loans—0.0%Washington Mutual Bank (g) (h) (n) . . . . . . . . . . . . . . . . . . . 5,027,000 1Washington Mutual Bank (g) (h) (n) . . . . . . . . . . . . . . . . . . . 1,310,000 0Washington Mutual Bank (g) (h) (n) . . . . . . . . . . . . . . . . . . . 2,440,000 0
Total Escrow Shares(Cost $0) . . . . . . . . . . . . . . . . . . . . . . . . . . . . . . . . . . . 1
Short-Term Investments—6.0%
Certificate of Deposit—0.5%Canadian Imperial Bank
2.660%, 04/17/19 . . . . . . . . . . . . . . . . . . . . . . . . . . . . 7,790,000 7,792,315MUFG Bank Ltd.
2.680%, 04/17/19 . . . . . . . . . . . . . . . . . . . . . . . . . . . . 7,780,000 7,782,803Wells Fargo Bank N.A.
2.700%, 04/16/19 . . . . . . . . . . . . . . . . . . . . . . . . . . . . 3,770,000 3,772,659
19,347,777
Commercial Paper—0.7%AT&T, Inc.
2.800%, 12/06/18 . . . . . . . . . . . . . . . . . . . . . . . . . . . . 5,030,000 5,005,0792.900%, 03/07/19 . . . . . . . . . . . . . . . . . . . . . . . . . . . . 5,060,000 4,998,605
Societe Generale2.650%, 04/12/19 . . . . . . . . . . . . . . . . . . . . . . . . . . . . 7,790,000 7,681,764
BHFTII-34
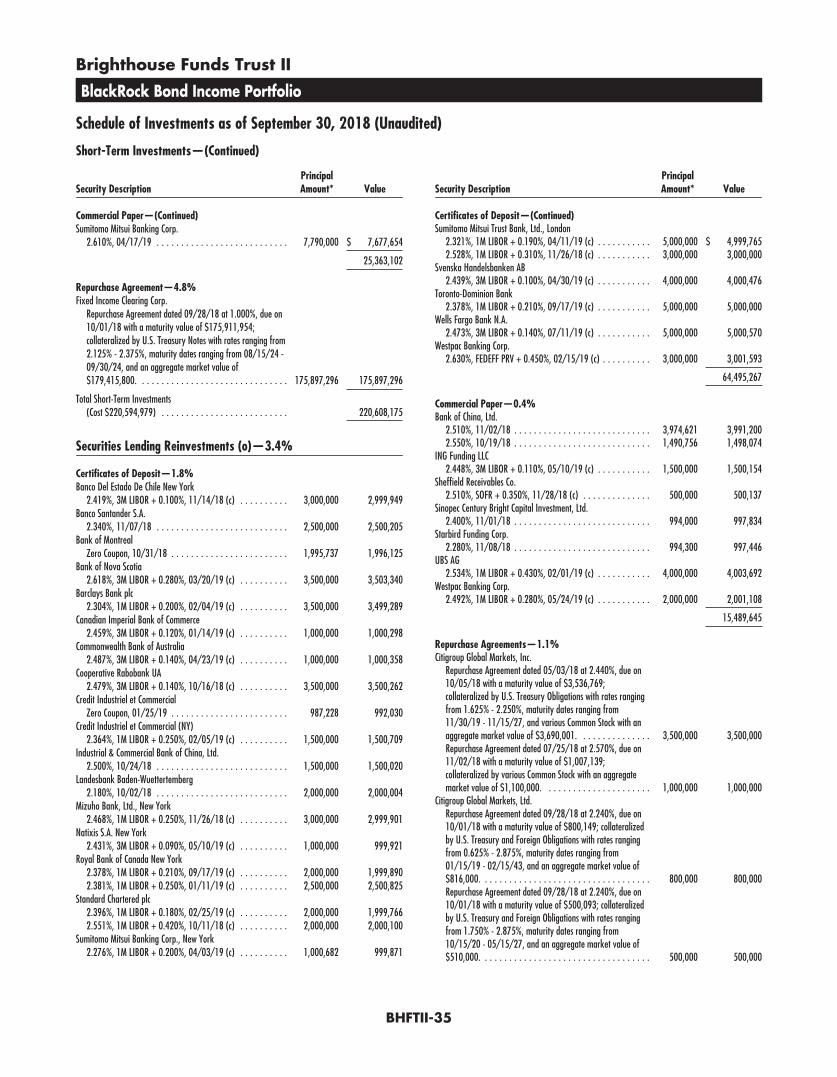
Brighthouse Funds Trust II
BlackRock Bond Income Portfolio
Schedule of Investments as of September 30, 2018 (Unaudited)
Short-Term Investments—(Continued)
Security DescriptionPrincipalAmount* Value
Commercial Paper—(Continued)Sumitomo Mitsui Banking Corp.
2.610%, 04/17/19 . . . . . . . . . . . . . . . . . . . . . . . . . . . 7,790,000 $ 7,677,654
25,363,102
Repurchase Agreement—4.8%Fixed Income Clearing Corp.
Repurchase Agreement dated 09/28/18 at 1.000%, due on10/01/18 with a maturity value of $175,911,954;collateralized by U.S. Treasury Notes with rates ranging from2.125% - 2.375%, maturity dates ranging from 08/15/24 -09/30/24, and an aggregate market value of$179,415,800. . . . . . . . . . . . . . . . . . . . . . . . . . . . . . . 175,897,296 175,897,296
Total Short-Term Investments(Cost $220,594,979) . . . . . . . . . . . . . . . . . . . . . . . . . . 220,608,175
Securities Lending Reinvestments (o)—3.4%
Certificates of Deposit—1.8%Banco Del Estado De Chile New York
2.419%, 3M LIBOR + 0.100%, 11/14/18 (c) . . . . . . . . . . 3,000,000 2,999,949Banco Santander S.A.
2.340%, 11/07/18 . . . . . . . . . . . . . . . . . . . . . . . . . . . 2,500,000 2,500,205Bank of Montreal
Zero Coupon, 10/31/18 . . . . . . . . . . . . . . . . . . . . . . . . 1,995,737 1,996,125Bank of Nova Scotia
2.618%, 3M LIBOR + 0.280%, 03/20/19 (c) . . . . . . . . . . 3,500,000 3,503,340Barclays Bank plc
2.304%, 1M LIBOR + 0.200%, 02/04/19 (c) . . . . . . . . . . 3,500,000 3,499,289Canadian Imperial Bank of Commerce
2.459%, 3M LIBOR + 0.120%, 01/14/19 (c) . . . . . . . . . . 1,000,000 1,000,298Commonwealth Bank of Australia
2.487%, 3M LIBOR + 0.140%, 04/23/19 (c) . . . . . . . . . . 1,000,000 1,000,358Cooperative Rabobank UA
2.479%, 3M LIBOR + 0.140%, 10/16/18 (c) . . . . . . . . . . 3,500,000 3,500,262Credit Industriel et Commercial
Zero Coupon, 01/25/19 . . . . . . . . . . . . . . . . . . . . . . . . 987,228 992,030Credit Industriel et Commercial (NY)
2.364%, 1M LIBOR + 0.250%, 02/05/19 (c) . . . . . . . . . . 1,500,000 1,500,709Industrial & Commercial Bank of China, Ltd.
2.500%, 10/24/18 . . . . . . . . . . . . . . . . . . . . . . . . . . . 1,500,000 1,500,020Landesbank Baden-Wuettertemberg
2.180%, 10/02/18 . . . . . . . . . . . . . . . . . . . . . . . . . . . 2,000,000 2,000,004Mizuho Bank, Ltd., New York
2.468%, 1M LIBOR + 0.250%, 11/26/18 (c) . . . . . . . . . . 3,000,000 2,999,901Natixis S.A. New York
2.431%, 3M LIBOR + 0.090%, 05/10/19 (c) . . . . . . . . . . 1,000,000 999,921Royal Bank of Canada New York
2.378%, 1M LIBOR + 0.210%, 09/17/19 (c) . . . . . . . . . . 2,000,000 1,999,8902.381%, 1M LIBOR + 0.250%, 01/11/19 (c) . . . . . . . . . . 2,500,000 2,500,825
Standard Chartered plc2.396%, 1M LIBOR + 0.180%, 02/25/19 (c) . . . . . . . . . . 2,000,000 1,999,7662.551%, 1M LIBOR + 0.420%, 10/11/18 (c) . . . . . . . . . . 2,000,000 2,000,100
Sumitomo Mitsui Banking Corp., New York2.276%, 1M LIBOR + 0.200%, 04/03/19 (c) . . . . . . . . . . 1,000,682 999,871
Security DescriptionPrincipalAmount* Value
Certificates of Deposit—(Continued)Sumitomo Mitsui Trust Bank, Ltd., London
2.321%, 1M LIBOR + 0.190%, 04/11/19 (c) . . . . . . . . . . . 5,000,000 $ 4,999,7652.528%, 1M LIBOR + 0.310%, 11/26/18 (c) . . . . . . . . . . . 3,000,000 3,000,000
Svenska Handelsbanken AB2.439%, 3M LIBOR + 0.100%, 04/30/19 (c) . . . . . . . . . . . 4,000,000 4,000,476
Toronto-Dominion Bank2.378%, 1M LIBOR + 0.210%, 09/17/19 (c) . . . . . . . . . . . 5,000,000 5,000,000
Wells Fargo Bank N.A.2.473%, 3M LIBOR + 0.140%, 07/11/19 (c) . . . . . . . . . . . 5,000,000 5,000,570
Westpac Banking Corp.2.630%, FEDEFF PRV + 0.450%, 02/15/19 (c) . . . . . . . . . . 3,000,000 3,001,593
64,495,267
Commercial Paper—0.4%Bank of China, Ltd.
2.510%, 11/02/18 . . . . . . . . . . . . . . . . . . . . . . . . . . . . 3,974,621 3,991,2002.550%, 10/19/18 . . . . . . . . . . . . . . . . . . . . . . . . . . . . 1,490,756 1,498,074
ING Funding LLC2.448%, 3M LIBOR + 0.110%, 05/10/19 (c) . . . . . . . . . . . 1,500,000 1,500,154
Sheffield Receivables Co.2.510%, SOFR + 0.350%, 11/28/18 (c) . . . . . . . . . . . . . . 500,000 500,137
Sinopec Century Bright Capital Investment, Ltd.2.400%, 11/01/18 . . . . . . . . . . . . . . . . . . . . . . . . . . . . 994,000 997,834
Starbird Funding Corp.2.280%, 11/08/18 . . . . . . . . . . . . . . . . . . . . . . . . . . . . 994,300 997,446
UBS AG2.534%, 1M LIBOR + 0.430%, 02/01/19 (c) . . . . . . . . . . . 4,000,000 4,003,692
Westpac Banking Corp.2.492%, 1M LIBOR + 0.280%, 05/24/19 (c) . . . . . . . . . . . 2,000,000 2,001,108
15,489,645
Repurchase Agreements—1.1%Citigroup Global Markets, Inc.
Repurchase Agreement dated 05/03/18 at 2.440%, due on10/05/18 with a maturity value of $3,536,769;collateralized by U.S. Treasury Obligations with rates rangingfrom 1.625% - 2.250%, maturity dates ranging from11/30/19 - 11/15/27, and various Common Stock with anaggregate market value of $3,690,001. . . . . . . . . . . . . . . 3,500,000 3,500,000Repurchase Agreement dated 07/25/18 at 2.570%, due on11/02/18 with a maturity value of $1,007,139;collateralized by various Common Stock with an aggregatemarket value of $1,100,000. . . . . . . . . . . . . . . . . . . . . . 1,000,000 1,000,000
Citigroup Global Markets, Ltd.Repurchase Agreement dated 09/28/18 at 2.240%, due on10/01/18 with a maturity value of $800,149; collateralizedby U.S. Treasury and Foreign Obligations with rates rangingfrom 0.625% - 2.875%, maturity dates ranging from01/15/19 - 02/15/43, and an aggregate market value of$816,000. . . . . . . . . . . . . . . . . . . . . . . . . . . . . . . . . . . 800,000 800,000Repurchase Agreement dated 09/28/18 at 2.240%, due on10/01/18 with a maturity value of $500,093; collateralizedby U.S. Treasury and Foreign Obligations with rates rangingfrom 1.750% - 2.875%, maturity dates ranging from10/15/20 - 05/15/27, and an aggregate market value of$510,000. . . . . . . . . . . . . . . . . . . . . . . . . . . . . . . . . . . 500,000 500,000
BHFTII-35
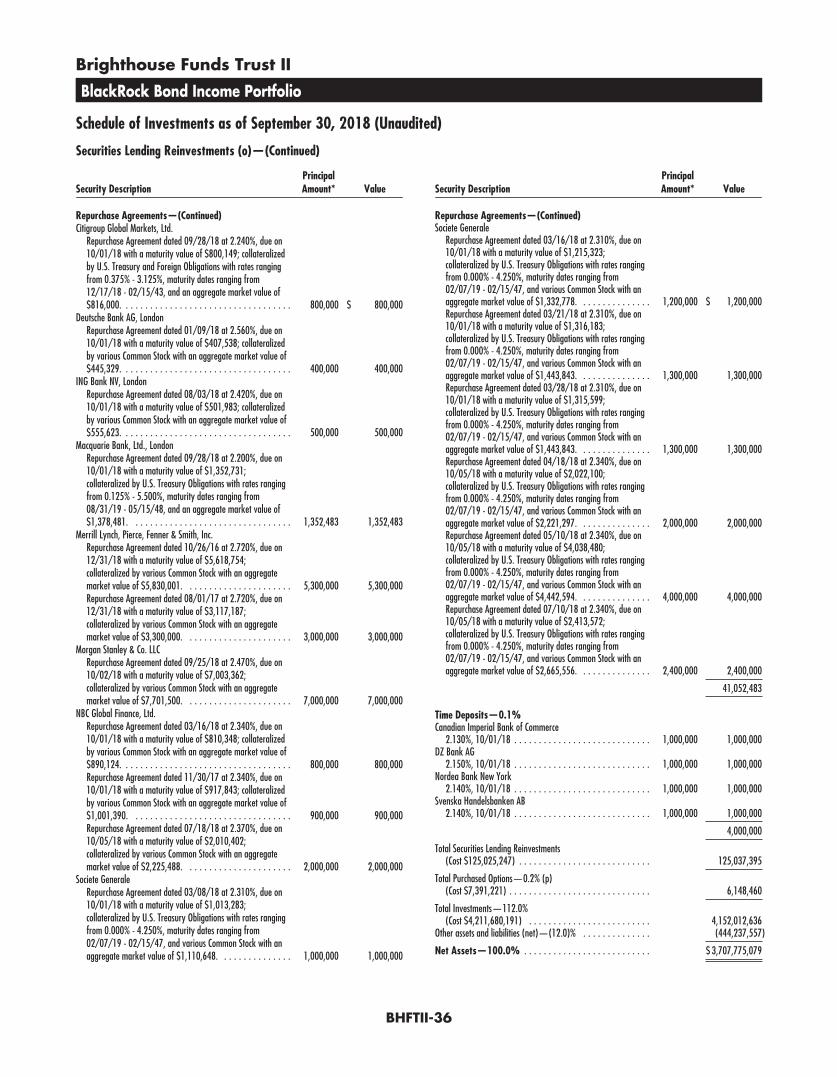
Brighthouse Funds Trust II
BlackRock Bond Income Portfolio
Schedule of Investments as of September 30, 2018 (Unaudited)
Securities Lending Reinvestments (o)—(Continued)
Security DescriptionPrincipalAmount* Value
Repurchase Agreements—(Continued)Citigroup Global Markets, Ltd.
Repurchase Agreement dated 09/28/18 at 2.240%, due on10/01/18 with a maturity value of $800,149; collateralizedby U.S. Treasury and Foreign Obligations with rates rangingfrom 0.375% - 3.125%, maturity dates ranging from12/17/18 - 02/15/43, and an aggregate market value of$816,000. . . . . . . . . . . . . . . . . . . . . . . . . . . . . . . . . . . 800,000 $ 800,000
Deutsche Bank AG, LondonRepurchase Agreement dated 01/09/18 at 2.560%, due on10/01/18 with a maturity value of $407,538; collateralizedby various Common Stock with an aggregate market value of$445,329. . . . . . . . . . . . . . . . . . . . . . . . . . . . . . . . . . . 400,000 400,000
ING Bank NV, LondonRepurchase Agreement dated 08/03/18 at 2.420%, due on10/01/18 with a maturity value of $501,983; collateralizedby various Common Stock with an aggregate market value of$555,623. . . . . . . . . . . . . . . . . . . . . . . . . . . . . . . . . . . 500,000 500,000
Macquarie Bank, Ltd., LondonRepurchase Agreement dated 09/28/18 at 2.200%, due on10/01/18 with a maturity value of $1,352,731;collateralized by U.S. Treasury Obligations with rates rangingfrom 0.125% - 5.500%, maturity dates ranging from08/31/19 - 05/15/48, and an aggregate market value of$1,378,481. . . . . . . . . . . . . . . . . . . . . . . . . . . . . . . . . 1,352,483 1,352,483
Merrill Lynch, Pierce, Fenner & Smith, Inc.Repurchase Agreement dated 10/26/16 at 2.720%, due on12/31/18 with a maturity value of $5,618,754;collateralized by various Common Stock with an aggregatemarket value of $5,830,001. . . . . . . . . . . . . . . . . . . . . . 5,300,000 5,300,000Repurchase Agreement dated 08/01/17 at 2.720%, due on12/31/18 with a maturity value of $3,117,187;collateralized by various Common Stock with an aggregatemarket value of $3,300,000. . . . . . . . . . . . . . . . . . . . . . 3,000,000 3,000,000
Morgan Stanley & Co. LLCRepurchase Agreement dated 09/25/18 at 2.470%, due on10/02/18 with a maturity value of $7,003,362;collateralized by various Common Stock with an aggregatemarket value of $7,701,500. . . . . . . . . . . . . . . . . . . . . . 7,000,000 7,000,000
NBC Global Finance, Ltd.Repurchase Agreement dated 03/16/18 at 2.340%, due on10/01/18 with a maturity value of $810,348; collateralizedby various Common Stock with an aggregate market value of$890,124. . . . . . . . . . . . . . . . . . . . . . . . . . . . . . . . . . . 800,000 800,000Repurchase Agreement dated 11/30/17 at 2.340%, due on10/01/18 with a maturity value of $917,843; collateralizedby various Common Stock with an aggregate market value of$1,001,390. . . . . . . . . . . . . . . . . . . . . . . . . . . . . . . . . 900,000 900,000Repurchase Agreement dated 07/18/18 at 2.370%, due on10/05/18 with a maturity value of $2,010,402;collateralized by various Common Stock with an aggregatemarket value of $2,225,488. . . . . . . . . . . . . . . . . . . . . . 2,000,000 2,000,000
Societe GeneraleRepurchase Agreement dated 03/08/18 at 2.310%, due on10/01/18 with a maturity value of $1,013,283;collateralized by U.S. Treasury Obligations with rates rangingfrom 0.000% - 4.250%, maturity dates ranging from02/07/19 - 02/15/47, and various Common Stock with anaggregate market value of $1,110,648. . . . . . . . . . . . . . . 1,000,000 1,000,000
Security DescriptionPrincipalAmount* Value
Repurchase Agreements—(Continued)Societe Generale
Repurchase Agreement dated 03/16/18 at 2.310%, due on10/01/18 with a maturity value of $1,215,323;collateralized by U.S. Treasury Obligations with rates rangingfrom 0.000% - 4.250%, maturity dates ranging from02/07/19 - 02/15/47, and various Common Stock with anaggregate market value of $1,332,778. . . . . . . . . . . . . . . 1,200,000 $ 1,200,000Repurchase Agreement dated 03/21/18 at 2.310%, due on10/01/18 with a maturity value of $1,316,183;collateralized by U.S. Treasury Obligations with rates rangingfrom 0.000% - 4.250%, maturity dates ranging from02/07/19 - 02/15/47, and various Common Stock with anaggregate market value of $1,443,843. . . . . . . . . . . . . . . 1,300,000 1,300,000Repurchase Agreement dated 03/28/18 at 2.310%, due on10/01/18 with a maturity value of $1,315,599;collateralized by U.S. Treasury Obligations with rates rangingfrom 0.000% - 4.250%, maturity dates ranging from02/07/19 - 02/15/47, and various Common Stock with anaggregate market value of $1,443,843. . . . . . . . . . . . . . . 1,300,000 1,300,000Repurchase Agreement dated 04/18/18 at 2.340%, due on10/05/18 with a maturity value of $2,022,100;collateralized by U.S. Treasury Obligations with rates rangingfrom 0.000% - 4.250%, maturity dates ranging from02/07/19 - 02/15/47, and various Common Stock with anaggregate market value of $2,221,297. . . . . . . . . . . . . . . 2,000,000 2,000,000Repurchase Agreement dated 05/10/18 at 2.340%, due on10/05/18 with a maturity value of $4,038,480;collateralized by U.S. Treasury Obligations with rates rangingfrom 0.000% - 4.250%, maturity dates ranging from02/07/19 - 02/15/47, and various Common Stock with anaggregate market value of $4,442,594. . . . . . . . . . . . . . . 4,000,000 4,000,000Repurchase Agreement dated 07/10/18 at 2.340%, due on10/05/18 with a maturity value of $2,413,572;collateralized by U.S. Treasury Obligations with rates rangingfrom 0.000% - 4.250%, maturity dates ranging from02/07/19 - 02/15/47, and various Common Stock with anaggregate market value of $2,665,556. . . . . . . . . . . . . . . 2,400,000 2,400,000
41,052,483
Time Deposits—0.1%Canadian Imperial Bank of Commerce
2.130%, 10/01/18 . . . . . . . . . . . . . . . . . . . . . . . . . . . . 1,000,000 1,000,000DZ Bank AG
2.150%, 10/01/18 . . . . . . . . . . . . . . . . . . . . . . . . . . . . 1,000,000 1,000,000Nordea Bank New York
2.140%, 10/01/18 . . . . . . . . . . . . . . . . . . . . . . . . . . . . 1,000,000 1,000,000Svenska Handelsbanken AB
2.140%, 10/01/18 . . . . . . . . . . . . . . . . . . . . . . . . . . . . 1,000,000 1,000,000
4,000,000
Total Securities Lending Reinvestments(Cost $125,025,247) . . . . . . . . . . . . . . . . . . . . . . . . . . . 125,037,395
Total Purchased Options—0.2% (p)(Cost $7,391,221) . . . . . . . . . . . . . . . . . . . . . . . . . . . . . 6,148,460
Total Investments—112.0%(Cost $4,211,680,191) . . . . . . . . . . . . . . . . . . . . . . . . . 4,152,012,636
Other assets and liabilities (net)—(12.0)% . . . . . . . . . . . . . . (444,237,557)
Net Assets—100.0% . . . . . . . . . . . . . . . . . . . . . . . . . . $ 3,707,775,079
BHFTII-36
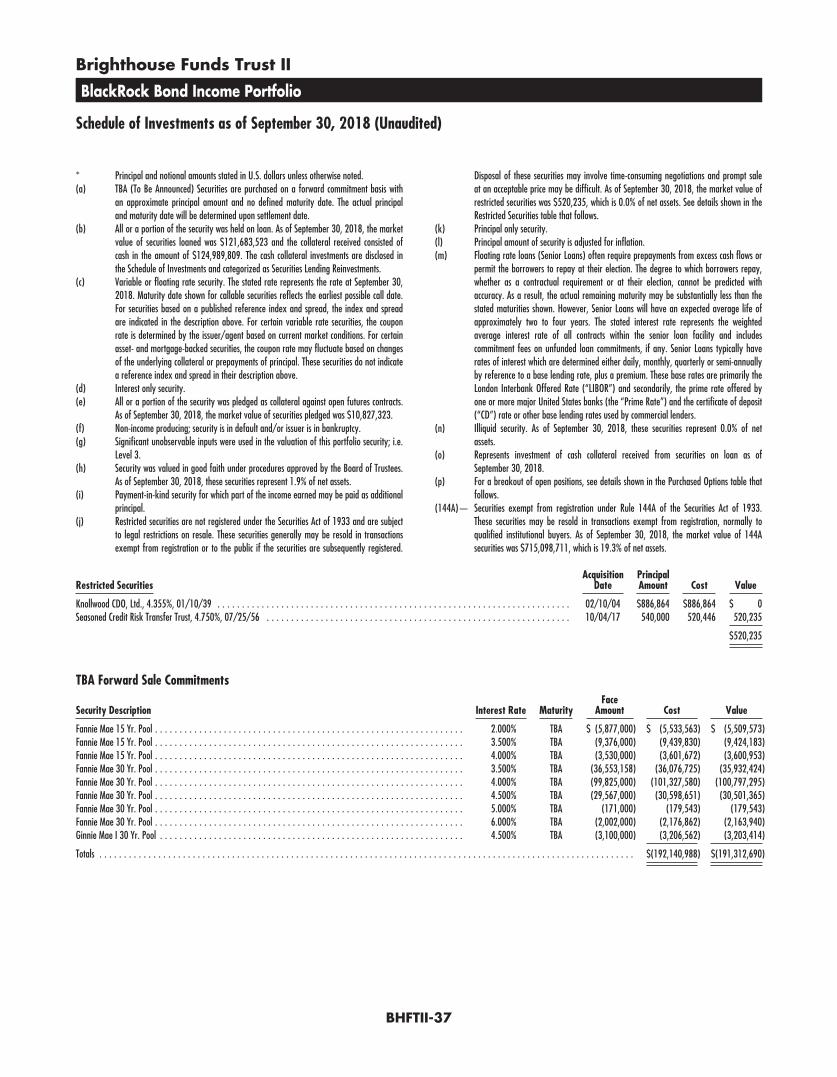
Brighthouse Funds Trust II
BlackRock Bond Income Portfolio
Schedule of Investments as of September 30, 2018 (Unaudited)
* Principal and notional amounts stated in U.S. dollars unless otherwise noted.(a) TBA (To Be Announced) Securities are purchased on a forward commitment basis with
an approximate principal amount and no defined maturity date. The actual principaland maturity date will be determined upon settlement date.
(b) All or a portion of the security was held on loan. As of September 30, 2018, the marketvalue of securities loaned was $121,683,523 and the collateral received consisted ofcash in the amount of $124,989,809. The cash collateral investments are disclosed inthe Schedule of Investments and categorized as Securities Lending Reinvestments.
(c) Variable or floating rate security. The stated rate represents the rate at September 30,2018. Maturity date shown for callable securities reflects the earliest possible call date.For securities based on a published reference index and spread, the index and spreadare indicated in the description above. For certain variable rate securities, the couponrate is determined by the issuer/agent based on current market conditions. For certainasset- and mortgage-backed securities, the coupon rate may fluctuate based on changesof the underlying collateral or prepayments of principal. These securities do not indicatea reference index and spread in their description above.
(d) Interest only security.(e) All or a portion of the security was pledged as collateral against open futures contracts.
As of September 30, 2018, the market value of securities pledged was $10,827,323.(f) Non-income producing; security is in default and/or issuer is in bankruptcy.(g) Significant unobservable inputs were used in the valuation of this portfolio security; i.e.
Level 3.(h) Security was valued in good faith under procedures approved by the Board of Trustees.
As of September 30, 2018, these securities represent 1.9% of net assets.(i) Payment-in-kind security for which part of the income earned may be paid as additional
principal.(j) Restricted securities are not registered under the Securities Act of 1933 and are subject
to legal restrictions on resale. These securities generally may be resold in transactionsexempt from registration or to the public if the securities are subsequently registered.
Disposal of these securities may involve time-consuming negotiations and prompt saleat an acceptable price may be difficult. As of September 30, 2018, the market value ofrestricted securities was $520,235, which is 0.0% of net assets. See details shown in theRestricted Securities table that follows.
(k) Principal only security.(l) Principal amount of security is adjusted for inflation.(m) Floating rate loans (Senior Loans) often require prepayments from excess cash flows or
permit the borrowers to repay at their election. The degree to which borrowers repay,whether as a contractual requirement or at their election, cannot be predicted withaccuracy. As a result, the actual remaining maturity may be substantially less than thestated maturities shown. However, Senior Loans will have an expected average life ofapproximately two to four years. The stated interest rate represents the weightedaverage interest rate of all contracts within the senior loan facility and includescommitment fees on unfunded loan commitments, if any. Senior Loans typically haverates of interest which are determined either daily, monthly, quarterly or semi-annuallyby reference to a base lending rate, plus a premium. These base rates are primarily theLondon Interbank Offered Rate (“LIBOR”) and secondarily, the prime rate offered byone or more major United States banks (the “Prime Rate”) and the certificate of deposit(“CD”) rate or other base lending rates used by commercial lenders.
(n) Illiquid security. As of September 30, 2018, these securities represent 0.0% of netassets.
(o) Represents investment of cash collateral received from securities on loan as ofSeptember 30, 2018.
(p) For a breakout of open positions, see details shown in the Purchased Options table thatfollows.
(144A)— Securities exempt from registration under Rule 144A of the Securities Act of 1933.These securities may be resold in transactions exempt from registration, normally toqualified institutional buyers. As of September 30, 2018, the market value of 144Asecurities was $715,098,711, which is 19.3% of net assets.
Restricted SecuritiesAcquisition
DatePrincipalAmount Cost Value
Knollwood CDO, Ltd., 4.355%, 01/10/39 . . . . . . . . . . . . . . . . . . . . . . . . . . . . . . . . . . . . . . . . . . . . . . . . . . . . . . . . . . . . . . . . . . . . . . . . 02/10/04 $886,864 $886,864 $ 0Seasoned Credit Risk Transfer Trust, 4.750%, 07/25/56 . . . . . . . . . . . . . . . . . . . . . . . . . . . . . . . . . . . . . . . . . . . . . . . . . . . . . . . . . . . . . . 10/04/17 540,000 520,446 520,235
$520,235
TBA Forward Sale Commitments
Security Description Interest Rate MaturityFace
Amount Cost Value
Fannie Mae 15 Yr. Pool . . . . . . . . . . . . . . . . . . . . . . . . . . . . . . . . . . . . . . . . . . . . . . . . . . . . . . . . . . . . . . . 2.000% TBA $ (5,877,000) $ (5,533,563) $ (5,509,573)Fannie Mae 15 Yr. Pool . . . . . . . . . . . . . . . . . . . . . . . . . . . . . . . . . . . . . . . . . . . . . . . . . . . . . . . . . . . . . . . 3.500% TBA (9,376,000) (9,439,830) (9,424,183)Fannie Mae 15 Yr. Pool . . . . . . . . . . . . . . . . . . . . . . . . . . . . . . . . . . . . . . . . . . . . . . . . . . . . . . . . . . . . . . . 4.000% TBA (3,530,000) (3,601,672) (3,600,953)Fannie Mae 30 Yr. Pool . . . . . . . . . . . . . . . . . . . . . . . . . . . . . . . . . . . . . . . . . . . . . . . . . . . . . . . . . . . . . . . 3.500% TBA (36,553,158) (36,076,725) (35,932,424)Fannie Mae 30 Yr. Pool . . . . . . . . . . . . . . . . . . . . . . . . . . . . . . . . . . . . . . . . . . . . . . . . . . . . . . . . . . . . . . . 4.000% TBA (99,825,000) (101,327,580) (100,797,295)Fannie Mae 30 Yr. Pool . . . . . . . . . . . . . . . . . . . . . . . . . . . . . . . . . . . . . . . . . . . . . . . . . . . . . . . . . . . . . . . 4.500% TBA (29,567,000) (30,598,651) (30,501,365)Fannie Mae 30 Yr. Pool . . . . . . . . . . . . . . . . . . . . . . . . . . . . . . . . . . . . . . . . . . . . . . . . . . . . . . . . . . . . . . . 5.000% TBA (171,000) (179,543) (179,543)Fannie Mae 30 Yr. Pool . . . . . . . . . . . . . . . . . . . . . . . . . . . . . . . . . . . . . . . . . . . . . . . . . . . . . . . . . . . . . . . 6.000% TBA (2,002,000) (2,176,862) (2,163,940)Ginnie Mae I 30 Yr. Pool . . . . . . . . . . . . . . . . . . . . . . . . . . . . . . . . . . . . . . . . . . . . . . . . . . . . . . . . . . . . . . 4.500% TBA (3,100,000) (3,206,562) (3,203,414)
Totals . . . . . . . . . . . . . . . . . . . . . . . . . . . . . . . . . . . . . . . . . . . . . . . . . . . . . . . . . . . . . . . . . . . . . . . . . . . . . . . . . . . . . . . . . . . . . . . . . . . . . . . . . . . . . $(192,140,988) $(191,312,690)
BHFTII-37

Brighthouse Funds Trust II
BlackRock Bond Income Portfolio
Schedule of Investments as of September 30, 2018 (Unaudited)
Forward Foreign Currency Exchange Contracts
Contracts to Buy CounterpartySettlement
DateIn Exchange
for
UnrealizedAppreciation/(Depreciation)
ARS 5,321,030 JPMC . . . . . . . . . . . . . . . . . . . . . . . . . . . . . . . . . . . . . . . . . . . . . . . . . . . . . . . . . . . . . . . . . . . . . . . . . . 10/09/18 USD 134,200 $ (6,552)ARS 6,184,250 BNP . . . . . . . . . . . . . . . . . . . . . . . . . . . . . . . . . . . . . . . . . . . . . . . . . . . . . . . . . . . . . . . . . . . . . . . . . . 11/02/18 USD 145,000 (1,314)ARS 7,907,310 CBNA . . . . . . . . . . . . . . . . . . . . . . . . . . . . . . . . . . . . . . . . . . . . . . . . . . . . . . . . . . . . . . . . . . . . . . . . . 11/02/18 USD 185,400 (1,680)ARS 12,449,000 JPMC . . . . . . . . . . . . . . . . . . . . . . . . . . . . . . . . . . . . . . . . . . . . . . . . . . . . . . . . . . . . . . . . . . . . . . . . . . 11/02/18 USD 295,000 (5,758)ARS 12,493,250 JPMC . . . . . . . . . . . . . . . . . . . . . . . . . . . . . . . . . . . . . . . . . . . . . . . . . . . . . . . . . . . . . . . . . . . . . . . . . . 11/02/18 USD 295,000 (4,730)ARS 5,764,170 BNP . . . . . . . . . . . . . . . . . . . . . . . . . . . . . . . . . . . . . . . . . . . . . . . . . . . . . . . . . . . . . . . . . . . . . . . . . . 11/30/18 USD 141,800 (12,356)ARS 5,920,320 BNP . . . . . . . . . . . . . . . . . . . . . . . . . . . . . . . . . . . . . . . . . . . . . . . . . . . . . . . . . . . . . . . . . . . . . . . . . . 11/30/18 USD 140,960 (8,010)ARS 6,469,819 BNP . . . . . . . . . . . . . . . . . . . . . . . . . . . . . . . . . . . . . . . . . . . . . . . . . . . . . . . . . . . . . . . . . . . . . . . . . . 11/30/18 USD 155,040 (9,750)ARS 6,834,300 BNP . . . . . . . . . . . . . . . . . . . . . . . . . . . . . . . . . . . . . . . . . . . . . . . . . . . . . . . . . . . . . . . . . . . . . . . . . . 11/30/18 USD 165,000 (11,525)ARS 12,655,500 BNP . . . . . . . . . . . . . . . . . . . . . . . . . . . . . . . . . . . . . . . . . . . . . . . . . . . . . . . . . . . . . . . . . . . . . . . . . . 11/30/18 USD 295,000 (10,800)ARS 6,042,150 CBNA . . . . . . . . . . . . . . . . . . . . . . . . . . . . . . . . . . . . . . . . . . . . . . . . . . . . . . . . . . . . . . . . . . . . . . . . . 11/30/18 USD 145,000 (9,314)ARS 6,155,250 JPMC . . . . . . . . . . . . . . . . . . . . . . . . . . . . . . . . . . . . . . . . . . . . . . . . . . . . . . . . . . . . . . . . . . . . . . . . . . 11/30/18 USD 145,000 (6,774)ARS 18,147,150 CBNA . . . . . . . . . . . . . . . . . . . . . . . . . . . . . . . . . . . . . . . . . . . . . . . . . . . . . . . . . . . . . . . . . . . . . . . . . 12/28/18 USD 441,000 (44,904)AUD 902,725 JPMC . . . . . . . . . . . . . . . . . . . . . . . . . . . . . . . . . . . . . . . . . . . . . . . . . . . . . . . . . . . . . . . . . . . . . . . . . . 10/24/18 USD 654,351 (1,734)AUD 402,000 MSIP . . . . . . . . . . . . . . . . . . . . . . . . . . . . . . . . . . . . . . . . . . . . . . . . . . . . . . . . . . . . . . . . . . . . . . . . . . 12/19/18 USD 290,121 637BRL 6,877,908 BNP . . . . . . . . . . . . . . . . . . . . . . . . . . . . . . . . . . . . . . . . . . . . . . . . . . . . . . . . . . . . . . . . . . . . . . . . . . 10/02/18 USD 1,717,802 (14,738)BRL 10,141,880 BNP . . . . . . . . . . . . . . . . . . . . . . . . . . . . . . . . . . . . . . . . . . . . . . . . . . . . . . . . . . . . . . . . . . . . . . . . . . 10/02/18 USD 2,498,000 13,268BRL 1,389,288 BBP . . . . . . . . . . . . . . . . . . . . . . . . . . . . . . . . . . . . . . . . . . . . . . . . . . . . . . . . . . . . . . . . . . . . . . . . . . 10/02/18 USD 335,520 8,487BRL 2,428,536 BBP . . . . . . . . . . . . . . . . . . . . . . . . . . . . . . . . . . . . . . . . . . . . . . . . . . . . . . . . . . . . . . . . . . . . . . . . . . 10/02/18 USD 606,543 (5,204)BRL 6,284,008 BBP . . . . . . . . . . . . . . . . . . . . . . . . . . . . . . . . . . . . . . . . . . . . . . . . . . . . . . . . . . . . . . . . . . . . . . . . . . 10/02/18 USD 1,569,472 (13,466)BRL 2,089,417 GSI . . . . . . . . . . . . . . . . . . . . . . . . . . . . . . . . . . . . . . . . . . . . . . . . . . . . . . . . . . . . . . . . . . . . . . . . . . . 10/02/18 USD 521,846 (4,477)BRL 2,285,453 GSI . . . . . . . . . . . . . . . . . . . . . . . . . . . . . . . . . . . . . . . . . . . . . . . . . . . . . . . . . . . . . . . . . . . . . . . . . . . 10/02/18 USD 545,220 20,689BRL 2,346,298 GSI . . . . . . . . . . . . . . . . . . . . . . . . . . . . . . . . . . . . . . . . . . . . . . . . . . . . . . . . . . . . . . . . . . . . . . . . . . . 10/02/18 USD 587,000 (6,025)BRL 2,692,387 GSI . . . . . . . . . . . . . . . . . . . . . . . . . . . . . . . . . . . . . . . . . . . . . . . . . . . . . . . . . . . . . . . . . . . . . . . . . . . 10/02/18 USD 672,441 (5,769)BRL 2,768,577 GSI . . . . . . . . . . . . . . . . . . . . . . . . . . . . . . . . . . . . . . . . . . . . . . . . . . . . . . . . . . . . . . . . . . . . . . . . . . . 10/02/18 USD 691,470 (5,933)BRL 9,370,663 GSI . . . . . . . . . . . . . . . . . . . . . . . . . . . . . . . . . . . . . . . . . . . . . . . . . . . . . . . . . . . . . . . . . . . . . . . . . . . 10/02/18 USD 2,289,660 30,644BRL 17,743,346 GSI . . . . . . . . . . . . . . . . . . . . . . . . . . . . . . . . . . . . . . . . . . . . . . . . . . . . . . . . . . . . . . . . . . . . . . . . . . . 10/02/18 USD 4,336,000 57,494BRL 1,402,742 MSIP . . . . . . . . . . . . . . . . . . . . . . . . . . . . . . . . . . . . . . . . . . . . . . . . . . . . . . . . . . . . . . . . . . . . . . . . . . 10/02/18 USD 335,520 11,818BRL 3,525,644 MSIP . . . . . . . . . . . . . . . . . . . . . . . . . . . . . . . . . . . . . . . . . . . . . . . . . . . . . . . . . . . . . . . . . . . . . . . . . . 10/02/18 USD 880,552 (7,555)BRL 4,164,066 MSIP . . . . . . . . . . . . . . . . . . . . . . . . . . . . . . . . . . . . . . . . . . . . . . . . . . . . . . . . . . . . . . . . . . . . . . . . . . 10/02/18 USD 1,040,003 (8,923)BRL 4,114,529 UBSA . . . . . . . . . . . . . . . . . . . . . . . . . . . . . . . . . . . . . . . . . . . . . . . . . . . . . . . . . . . . . . . . . . . . . . . . . . 10/02/18 USD 1,027,630 (8,817)BRL 8,763,056 BNP . . . . . . . . . . . . . . . . . . . . . . . . . . . . . . . . . . . . . . . . . . . . . . . . . . . . . . . . . . . . . . . . . . . . . . . . . . 11/05/18 USD 2,168,000 (3,240)BRL 10,001,692 BNP . . . . . . . . . . . . . . . . . . . . . . . . . . . . . . . . . . . . . . . . . . . . . . . . . . . . . . . . . . . . . . . . . . . . . . . . . . 11/05/18 USD 2,498,000 (27,257)BRL 8,726,200 UBSA . . . . . . . . . . . . . . . . . . . . . . . . . . . . . . . . . . . . . . . . . . . . . . . . . . . . . . . . . . . . . . . . . . . . . . . . . . 11/05/18 USD 2,168,000 (12,345)BRL 3,079,605 BBP . . . . . . . . . . . . . . . . . . . . . . . . . . . . . . . . . . . . . . . . . . . . . . . . . . . . . . . . . . . . . . . . . . . . . . . . . . 11/26/18 USD 752,000 7,293CAD 10,029,269 BBP . . . . . . . . . . . . . . . . . . . . . . . . . . . . . . . . . . . . . . . . . . . . . . . . . . . . . . . . . . . . . . . . . . . . . . . . . . 12/19/18 USD 7,715,000 62,766CLP 422,202,240 UBSA . . . . . . . . . . . . . . . . . . . . . . . . . . . . . . . . . . . . . . . . . . . . . . . . . . . . . . . . . . . . . . . . . . . . . . . . . . 10/09/18 USD 610,560 31,397CLP 1,242,048,024 CBNA . . . . . . . . . . . . . . . . . . . . . . . . . . . . . . . . . . . . . . . . . . . . . . . . . . . . . . . . . . . . . . . . . . . . . . . . . 10/24/18 USD 1,831,200 57,960CLP 491,332,934 BBP . . . . . . . . . . . . . . . . . . . . . . . . . . . . . . . . . . . . . . . . . . . . . . . . . . . . . . . . . . . . . . . . . . . . . . . . . . 10/26/18 USD 732,480 14,872CLP 682,585,728 BBP . . . . . . . . . . . . . . . . . . . . . . . . . . . . . . . . . . . . . . . . . . . . . . . . . . . . . . . . . . . . . . . . . . . . . . . . . . 10/26/18 USD 1,017,600 20,662CLP 403,061,276 BNP . . . . . . . . . . . . . . . . . . . . . . . . . . . . . . . . . . . . . . . . . . . . . . . . . . . . . . . . . . . . . . . . . . . . . . . . . . 11/09/18 USD 610,560 2,673EUR 2,289,000 GSI . . . . . . . . . . . . . . . . . . . . . . . . . . . . . . . . . . . . . . . . . . . . . . . . . . . . . . . . . . . . . . . . . . . . . . . . . . . 10/03/18 USD 2,674,478 (16,624)IDR 16,172,352,000 JPMC . . . . . . . . . . . . . . . . . . . . . . . . . . . . . . . . . . . . . . . . . . . . . . . . . . . . . . . . . . . . . . . . . . . . . . . . . . 10/12/18 USD 1,069,600 14,456IDR 39,091,955,000 BBP . . . . . . . . . . . . . . . . . . . . . . . . . . . . . . . . . . . . . . . . . . . . . . . . . . . . . . . . . . . . . . . . . . . . . . . . . . 10/31/18 USD 2,653,000 (38,576)JPY 82,691,793 BOA . . . . . . . . . . . . . . . . . . . . . . . . . . . . . . . . . . . . . . . . . . . . . . . . . . . . . . . . . . . . . . . . . . . . . . . . . . 10/10/18 USD 749,400 (21,182)KRW 2,493,260,572 BNP . . . . . . . . . . . . . . . . . . . . . . . . . . . . . . . . . . . . . . . . . . . . . . . . . . . . . . . . . . . . . . . . . . . . . . . . . . 10/02/18 USD 2,226,000 21,699KRW 2,483,058,480 BBP . . . . . . . . . . . . . . . . . . . . . . . . . . . . . . . . . . . . . . . . . . . . . . . . . . . . . . . . . . . . . . . . . . . . . . . . . . 10/02/18 USD 2,236,587 1,915MXN 59,827,685 BNP . . . . . . . . . . . . . . . . . . . . . . . . . . . . . . . . . . . . . . . . . . . . . . . . . . . . . . . . . . . . . . . . . . . . . . . . . . 10/01/18 USD 3,179,500 17,448MXN 5,029,805 CBNA . . . . . . . . . . . . . . . . . . . . . . . . . . . . . . . . . . . . . . . . . . . . . . . . . . . . . . . . . . . . . . . . . . . . . . . . . 10/09/18 USD 257,539 10,942MXN 9,226,910 HSBC . . . . . . . . . . . . . . . . . . . . . . . . . . . . . . . . . . . . . . . . . . . . . . . . . . . . . . . . . . . . . . . . . . . . . . . . . . 10/09/18 USD 472,663 19,849MXN 5,536,315 MSIP . . . . . . . . . . . . . . . . . . . . . . . . . . . . . . . . . . . . . . . . . . . . . . . . . . . . . . . . . . . . . . . . . . . . . . . . . . 10/09/18 USD 283,598 11,919MXN 53,449,125 GSI . . . . . . . . . . . . . . . . . . . . . . . . . . . . . . . . . . . . . . . . . . . . . . . . . . . . . . . . . . . . . . . . . . . . . . . . . . . 10/17/18 USD 2,821,800 27,634MXN 41,857,872 JPMC . . . . . . . . . . . . . . . . . . . . . . . . . . . . . . . . . . . . . . . . . . . . . . . . . . . . . . . . . . . . . . . . . . . . . . . . . . 10/19/18 USD 2,226,000 4,794MXN 13,172,469 RBS . . . . . . . . . . . . . . . . . . . . . . . . . . . . . . . . . . . . . . . . . . . . . . . . . . . . . . . . . . . . . . . . . . . . . . . . . . . 10/23/18 USD 699,000 2,582MXN 10,379,662 BBP . . . . . . . . . . . . . . . . . . . . . . . . . . . . . . . . . . . . . . . . . . . . . . . . . . . . . . . . . . . . . . . . . . . . . . . . . . 11/26/18 USD 543,000 6,916MXN 13,782,203 BBP . . . . . . . . . . . . . . . . . . . . . . . . . . . . . . . . . . . . . . . . . . . . . . . . . . . . . . . . . . . . . . . . . . . . . . . . . . 11/26/18 USD 721,000 9,183MXN 86,179,089 HSBC . . . . . . . . . . . . . . . . . . . . . . . . . . . . . . . . . . . . . . . . . . . . . . . . . . . . . . . . . . . . . . . . . . . . . . . . . . 11/26/18 USD 4,426,000 139,780
BHFTII-38
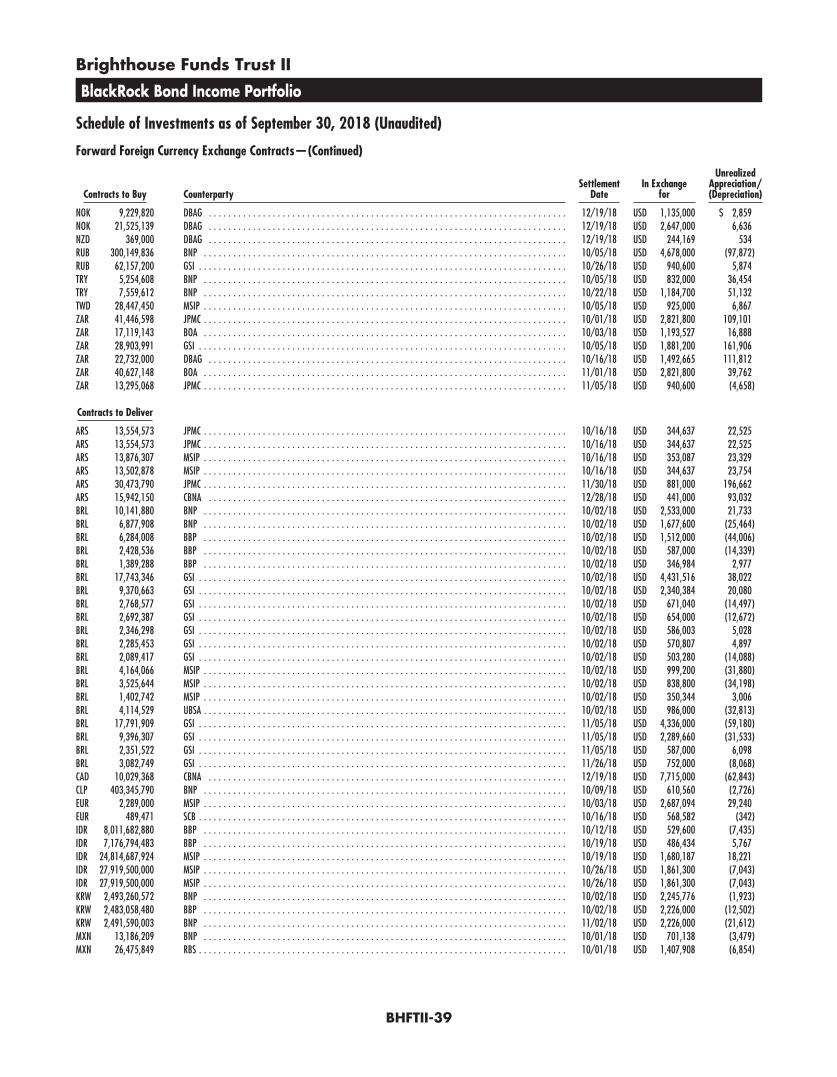
Brighthouse Funds Trust II
BlackRock Bond Income Portfolio
Schedule of Investments as of September 30, 2018 (Unaudited)
Forward Foreign Currency Exchange Contracts—(Continued)
Contracts to Buy CounterpartySettlement
DateIn Exchange
for
UnrealizedAppreciation/(Depreciation)
NOK 9,229,820 DBAG . . . . . . . . . . . . . . . . . . . . . . . . . . . . . . . . . . . . . . . . . . . . . . . . . . . . . . . . . . . . . . . . . . . . . . . . . 12/19/18 USD 1,135,000 $ 2,859NOK 21,525,139 DBAG . . . . . . . . . . . . . . . . . . . . . . . . . . . . . . . . . . . . . . . . . . . . . . . . . . . . . . . . . . . . . . . . . . . . . . . . . 12/19/18 USD 2,647,000 6,636NZD 369,000 DBAG . . . . . . . . . . . . . . . . . . . . . . . . . . . . . . . . . . . . . . . . . . . . . . . . . . . . . . . . . . . . . . . . . . . . . . . . . 12/19/18 USD 244,169 534RUB 300,149,836 BNP . . . . . . . . . . . . . . . . . . . . . . . . . . . . . . . . . . . . . . . . . . . . . . . . . . . . . . . . . . . . . . . . . . . . . . . . . . 10/05/18 USD 4,678,000 (97,872)RUB 62,157,200 GSI . . . . . . . . . . . . . . . . . . . . . . . . . . . . . . . . . . . . . . . . . . . . . . . . . . . . . . . . . . . . . . . . . . . . . . . . . . . 10/26/18 USD 940,600 5,874TRY 5,254,608 BNP . . . . . . . . . . . . . . . . . . . . . . . . . . . . . . . . . . . . . . . . . . . . . . . . . . . . . . . . . . . . . . . . . . . . . . . . . . 10/05/18 USD 832,000 36,454TRY 7,559,612 BNP . . . . . . . . . . . . . . . . . . . . . . . . . . . . . . . . . . . . . . . . . . . . . . . . . . . . . . . . . . . . . . . . . . . . . . . . . . 10/22/18 USD 1,184,700 51,132TWD 28,447,450 MSIP . . . . . . . . . . . . . . . . . . . . . . . . . . . . . . . . . . . . . . . . . . . . . . . . . . . . . . . . . . . . . . . . . . . . . . . . . . 10/05/18 USD 925,000 6,867ZAR 41,446,598 JPMC . . . . . . . . . . . . . . . . . . . . . . . . . . . . . . . . . . . . . . . . . . . . . . . . . . . . . . . . . . . . . . . . . . . . . . . . . . 10/01/18 USD 2,821,800 109,101ZAR 17,119,143 BOA . . . . . . . . . . . . . . . . . . . . . . . . . . . . . . . . . . . . . . . . . . . . . . . . . . . . . . . . . . . . . . . . . . . . . . . . . . 10/03/18 USD 1,193,527 16,888ZAR 28,903,991 GSI . . . . . . . . . . . . . . . . . . . . . . . . . . . . . . . . . . . . . . . . . . . . . . . . . . . . . . . . . . . . . . . . . . . . . . . . . . . 10/05/18 USD 1,881,200 161,906ZAR 22,732,000 DBAG . . . . . . . . . . . . . . . . . . . . . . . . . . . . . . . . . . . . . . . . . . . . . . . . . . . . . . . . . . . . . . . . . . . . . . . . . 10/16/18 USD 1,492,665 111,812ZAR 40,627,148 BOA . . . . . . . . . . . . . . . . . . . . . . . . . . . . . . . . . . . . . . . . . . . . . . . . . . . . . . . . . . . . . . . . . . . . . . . . . . 11/01/18 USD 2,821,800 39,762ZAR 13,295,068 JPMC . . . . . . . . . . . . . . . . . . . . . . . . . . . . . . . . . . . . . . . . . . . . . . . . . . . . . . . . . . . . . . . . . . . . . . . . . . 11/05/18 USD 940,600 (4,658)
Contracts to Deliver
ARS 13,554,573 JPMC . . . . . . . . . . . . . . . . . . . . . . . . . . . . . . . . . . . . . . . . . . . . . . . . . . . . . . . . . . . . . . . . . . . . . . . . . . 10/16/18 USD 344,637 22,525ARS 13,554,573 JPMC . . . . . . . . . . . . . . . . . . . . . . . . . . . . . . . . . . . . . . . . . . . . . . . . . . . . . . . . . . . . . . . . . . . . . . . . . . 10/16/18 USD 344,637 22,525ARS 13,876,307 MSIP . . . . . . . . . . . . . . . . . . . . . . . . . . . . . . . . . . . . . . . . . . . . . . . . . . . . . . . . . . . . . . . . . . . . . . . . . . 10/16/18 USD 353,087 23,329ARS 13,502,878 MSIP . . . . . . . . . . . . . . . . . . . . . . . . . . . . . . . . . . . . . . . . . . . . . . . . . . . . . . . . . . . . . . . . . . . . . . . . . . 10/16/18 USD 344,637 23,754ARS 30,473,790 JPMC . . . . . . . . . . . . . . . . . . . . . . . . . . . . . . . . . . . . . . . . . . . . . . . . . . . . . . . . . . . . . . . . . . . . . . . . . . 11/30/18 USD 881,000 196,662ARS 15,942,150 CBNA . . . . . . . . . . . . . . . . . . . . . . . . . . . . . . . . . . . . . . . . . . . . . . . . . . . . . . . . . . . . . . . . . . . . . . . . . 12/28/18 USD 441,000 93,032BRL 10,141,880 BNP . . . . . . . . . . . . . . . . . . . . . . . . . . . . . . . . . . . . . . . . . . . . . . . . . . . . . . . . . . . . . . . . . . . . . . . . . . 10/02/18 USD 2,533,000 21,733BRL 6,877,908 BNP . . . . . . . . . . . . . . . . . . . . . . . . . . . . . . . . . . . . . . . . . . . . . . . . . . . . . . . . . . . . . . . . . . . . . . . . . . 10/02/18 USD 1,677,600 (25,464)BRL 6,284,008 BBP . . . . . . . . . . . . . . . . . . . . . . . . . . . . . . . . . . . . . . . . . . . . . . . . . . . . . . . . . . . . . . . . . . . . . . . . . . 10/02/18 USD 1,512,000 (44,006)BRL 2,428,536 BBP . . . . . . . . . . . . . . . . . . . . . . . . . . . . . . . . . . . . . . . . . . . . . . . . . . . . . . . . . . . . . . . . . . . . . . . . . . 10/02/18 USD 587,000 (14,339)BRL 1,389,288 BBP . . . . . . . . . . . . . . . . . . . . . . . . . . . . . . . . . . . . . . . . . . . . . . . . . . . . . . . . . . . . . . . . . . . . . . . . . . 10/02/18 USD 346,984 2,977BRL 17,743,346 GSI . . . . . . . . . . . . . . . . . . . . . . . . . . . . . . . . . . . . . . . . . . . . . . . . . . . . . . . . . . . . . . . . . . . . . . . . . . . 10/02/18 USD 4,431,516 38,022BRL 9,370,663 GSI . . . . . . . . . . . . . . . . . . . . . . . . . . . . . . . . . . . . . . . . . . . . . . . . . . . . . . . . . . . . . . . . . . . . . . . . . . . 10/02/18 USD 2,340,384 20,080BRL 2,768,577 GSI . . . . . . . . . . . . . . . . . . . . . . . . . . . . . . . . . . . . . . . . . . . . . . . . . . . . . . . . . . . . . . . . . . . . . . . . . . . 10/02/18 USD 671,040 (14,497)BRL 2,692,387 GSI . . . . . . . . . . . . . . . . . . . . . . . . . . . . . . . . . . . . . . . . . . . . . . . . . . . . . . . . . . . . . . . . . . . . . . . . . . . 10/02/18 USD 654,000 (12,672)BRL 2,346,298 GSI . . . . . . . . . . . . . . . . . . . . . . . . . . . . . . . . . . . . . . . . . . . . . . . . . . . . . . . . . . . . . . . . . . . . . . . . . . . 10/02/18 USD 586,003 5,028BRL 2,285,453 GSI . . . . . . . . . . . . . . . . . . . . . . . . . . . . . . . . . . . . . . . . . . . . . . . . . . . . . . . . . . . . . . . . . . . . . . . . . . . 10/02/18 USD 570,807 4,897BRL 2,089,417 GSI . . . . . . . . . . . . . . . . . . . . . . . . . . . . . . . . . . . . . . . . . . . . . . . . . . . . . . . . . . . . . . . . . . . . . . . . . . . 10/02/18 USD 503,280 (14,088)BRL 4,164,066 MSIP . . . . . . . . . . . . . . . . . . . . . . . . . . . . . . . . . . . . . . . . . . . . . . . . . . . . . . . . . . . . . . . . . . . . . . . . . . 10/02/18 USD 999,200 (31,880)BRL 3,525,644 MSIP . . . . . . . . . . . . . . . . . . . . . . . . . . . . . . . . . . . . . . . . . . . . . . . . . . . . . . . . . . . . . . . . . . . . . . . . . . 10/02/18 USD 838,800 (34,198)BRL 1,402,742 MSIP . . . . . . . . . . . . . . . . . . . . . . . . . . . . . . . . . . . . . . . . . . . . . . . . . . . . . . . . . . . . . . . . . . . . . . . . . . 10/02/18 USD 350,344 3,006BRL 4,114,529 UBSA . . . . . . . . . . . . . . . . . . . . . . . . . . . . . . . . . . . . . . . . . . . . . . . . . . . . . . . . . . . . . . . . . . . . . . . . . . 10/02/18 USD 986,000 (32,813)BRL 17,791,909 GSI . . . . . . . . . . . . . . . . . . . . . . . . . . . . . . . . . . . . . . . . . . . . . . . . . . . . . . . . . . . . . . . . . . . . . . . . . . . 11/05/18 USD 4,336,000 (59,180)BRL 9,396,307 GSI . . . . . . . . . . . . . . . . . . . . . . . . . . . . . . . . . . . . . . . . . . . . . . . . . . . . . . . . . . . . . . . . . . . . . . . . . . . 11/05/18 USD 2,289,660 (31,533)BRL 2,351,522 GSI . . . . . . . . . . . . . . . . . . . . . . . . . . . . . . . . . . . . . . . . . . . . . . . . . . . . . . . . . . . . . . . . . . . . . . . . . . . 11/05/18 USD 587,000 6,098BRL 3,082,749 GSI . . . . . . . . . . . . . . . . . . . . . . . . . . . . . . . . . . . . . . . . . . . . . . . . . . . . . . . . . . . . . . . . . . . . . . . . . . . 11/26/18 USD 752,000 (8,068)CAD 10,029,368 CBNA . . . . . . . . . . . . . . . . . . . . . . . . . . . . . . . . . . . . . . . . . . . . . . . . . . . . . . . . . . . . . . . . . . . . . . . . . 12/19/18 USD 7,715,000 (62,843)CLP 403,345,790 BNP . . . . . . . . . . . . . . . . . . . . . . . . . . . . . . . . . . . . . . . . . . . . . . . . . . . . . . . . . . . . . . . . . . . . . . . . . . 10/09/18 USD 610,560 (2,726)EUR 2,289,000 MSIP . . . . . . . . . . . . . . . . . . . . . . . . . . . . . . . . . . . . . . . . . . . . . . . . . . . . . . . . . . . . . . . . . . . . . . . . . . 10/03/18 USD 2,687,094 29,240EUR 489,471 SCB . . . . . . . . . . . . . . . . . . . . . . . . . . . . . . . . . . . . . . . . . . . . . . . . . . . . . . . . . . . . . . . . . . . . . . . . . . . 10/16/18 USD 568,582 (342)IDR 8,011,682,880 BBP . . . . . . . . . . . . . . . . . . . . . . . . . . . . . . . . . . . . . . . . . . . . . . . . . . . . . . . . . . . . . . . . . . . . . . . . . . 10/12/18 USD 529,600 (7,435)IDR 7,176,794,483 BBP . . . . . . . . . . . . . . . . . . . . . . . . . . . . . . . . . . . . . . . . . . . . . . . . . . . . . . . . . . . . . . . . . . . . . . . . . . 10/19/18 USD 486,434 5,767IDR 24,814,687,924 MSIP . . . . . . . . . . . . . . . . . . . . . . . . . . . . . . . . . . . . . . . . . . . . . . . . . . . . . . . . . . . . . . . . . . . . . . . . . . 10/19/18 USD 1,680,187 18,221IDR 27,919,500,000 MSIP . . . . . . . . . . . . . . . . . . . . . . . . . . . . . . . . . . . . . . . . . . . . . . . . . . . . . . . . . . . . . . . . . . . . . . . . . . 10/26/18 USD 1,861,300 (7,043)IDR 27,919,500,000 MSIP . . . . . . . . . . . . . . . . . . . . . . . . . . . . . . . . . . . . . . . . . . . . . . . . . . . . . . . . . . . . . . . . . . . . . . . . . . 10/26/18 USD 1,861,300 (7,043)KRW 2,493,260,572 BNP . . . . . . . . . . . . . . . . . . . . . . . . . . . . . . . . . . . . . . . . . . . . . . . . . . . . . . . . . . . . . . . . . . . . . . . . . . 10/02/18 USD 2,245,776 (1,923)KRW 2,483,058,480 BBP . . . . . . . . . . . . . . . . . . . . . . . . . . . . . . . . . . . . . . . . . . . . . . . . . . . . . . . . . . . . . . . . . . . . . . . . . . 10/02/18 USD 2,226,000 (12,502)KRW 2,491,590,003 BNP . . . . . . . . . . . . . . . . . . . . . . . . . . . . . . . . . . . . . . . . . . . . . . . . . . . . . . . . . . . . . . . . . . . . . . . . . . 11/02/18 USD 2,226,000 (21,612)MXN 13,186,209 BNP . . . . . . . . . . . . . . . . . . . . . . . . . . . . . . . . . . . . . . . . . . . . . . . . . . . . . . . . . . . . . . . . . . . . . . . . . . 10/01/18 USD 701,138 (3,479)MXN 26,475,849 RBS . . . . . . . . . . . . . . . . . . . . . . . . . . . . . . . . . . . . . . . . . . . . . . . . . . . . . . . . . . . . . . . . . . . . . . . . . . . 10/01/18 USD 1,407,908 (6,854)
BHFTII-39
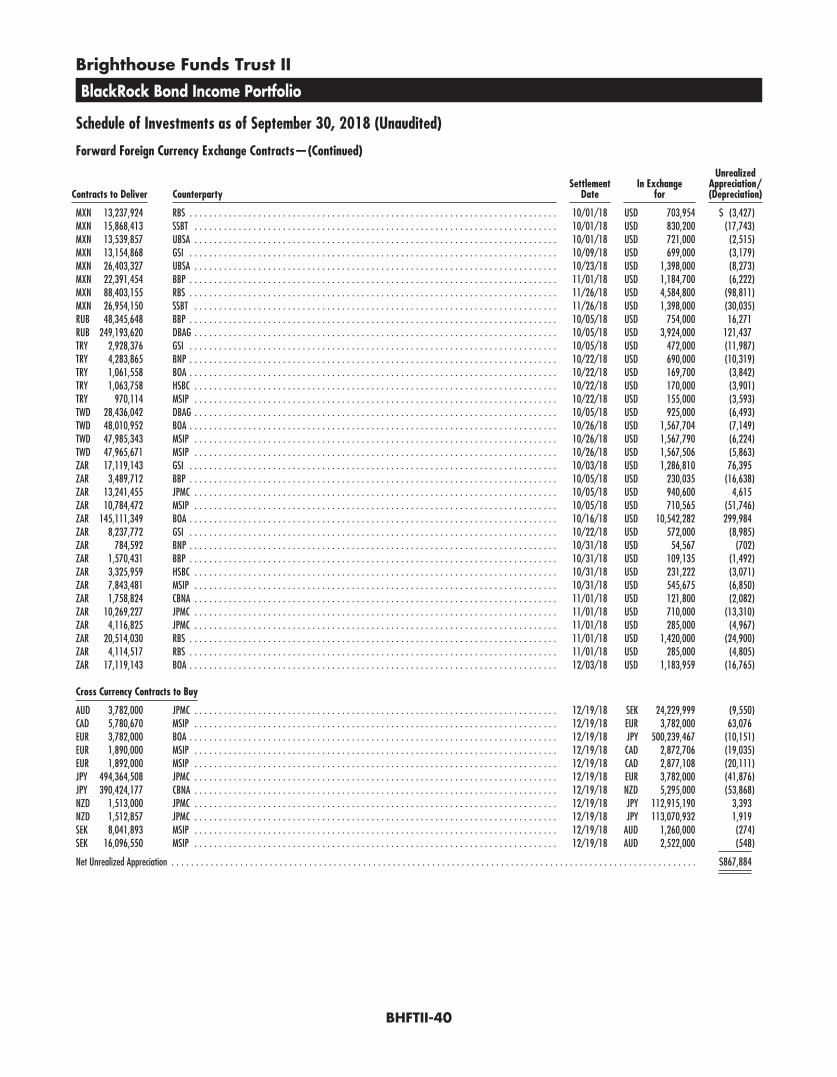
Brighthouse Funds Trust II
BlackRock Bond Income Portfolio
Schedule of Investments as of September 30, 2018 (Unaudited)
Forward Foreign Currency Exchange Contracts—(Continued)
Contracts to Deliver CounterpartySettlement
DateIn Exchange
for
UnrealizedAppreciation/(Depreciation)
MXN 13,237,924 RBS . . . . . . . . . . . . . . . . . . . . . . . . . . . . . . . . . . . . . . . . . . . . . . . . . . . . . . . . . . . . . . . . . . . . . . . . . . . 10/01/18 USD 703,954 $ (3,427)MXN 15,868,413 SSBT . . . . . . . . . . . . . . . . . . . . . . . . . . . . . . . . . . . . . . . . . . . . . . . . . . . . . . . . . . . . . . . . . . . . . . . . . . 10/01/18 USD 830,200 (17,743)MXN 13,539,857 UBSA . . . . . . . . . . . . . . . . . . . . . . . . . . . . . . . . . . . . . . . . . . . . . . . . . . . . . . . . . . . . . . . . . . . . . . . . . . 10/01/18 USD 721,000 (2,515)MXN 13,154,868 GSI . . . . . . . . . . . . . . . . . . . . . . . . . . . . . . . . . . . . . . . . . . . . . . . . . . . . . . . . . . . . . . . . . . . . . . . . . . . 10/09/18 USD 699,000 (3,179)MXN 26,403,327 UBSA . . . . . . . . . . . . . . . . . . . . . . . . . . . . . . . . . . . . . . . . . . . . . . . . . . . . . . . . . . . . . . . . . . . . . . . . . . 10/23/18 USD 1,398,000 (8,273)MXN 22,391,454 BBP . . . . . . . . . . . . . . . . . . . . . . . . . . . . . . . . . . . . . . . . . . . . . . . . . . . . . . . . . . . . . . . . . . . . . . . . . . . 11/01/18 USD 1,184,700 (6,222)MXN 88,403,155 RBS . . . . . . . . . . . . . . . . . . . . . . . . . . . . . . . . . . . . . . . . . . . . . . . . . . . . . . . . . . . . . . . . . . . . . . . . . . . 11/26/18 USD 4,584,800 (98,811)MXN 26,954,150 SSBT . . . . . . . . . . . . . . . . . . . . . . . . . . . . . . . . . . . . . . . . . . . . . . . . . . . . . . . . . . . . . . . . . . . . . . . . . . 11/26/18 USD 1,398,000 (30,035)RUB 48,345,648 BBP . . . . . . . . . . . . . . . . . . . . . . . . . . . . . . . . . . . . . . . . . . . . . . . . . . . . . . . . . . . . . . . . . . . . . . . . . . . 10/05/18 USD 754,000 16,271RUB 249,193,620 DBAG . . . . . . . . . . . . . . . . . . . . . . . . . . . . . . . . . . . . . . . . . . . . . . . . . . . . . . . . . . . . . . . . . . . . . . . . . . 10/05/18 USD 3,924,000 121,437TRY 2,928,376 GSI . . . . . . . . . . . . . . . . . . . . . . . . . . . . . . . . . . . . . . . . . . . . . . . . . . . . . . . . . . . . . . . . . . . . . . . . . . . 10/05/18 USD 472,000 (11,987)TRY 4,283,865 BNP . . . . . . . . . . . . . . . . . . . . . . . . . . . . . . . . . . . . . . . . . . . . . . . . . . . . . . . . . . . . . . . . . . . . . . . . . . . 10/22/18 USD 690,000 (10,319)TRY 1,061,558 BOA . . . . . . . . . . . . . . . . . . . . . . . . . . . . . . . . . . . . . . . . . . . . . . . . . . . . . . . . . . . . . . . . . . . . . . . . . . . 10/22/18 USD 169,700 (3,842)TRY 1,063,758 HSBC . . . . . . . . . . . . . . . . . . . . . . . . . . . . . . . . . . . . . . . . . . . . . . . . . . . . . . . . . . . . . . . . . . . . . . . . . . 10/22/18 USD 170,000 (3,901)TRY 970,114 MSIP . . . . . . . . . . . . . . . . . . . . . . . . . . . . . . . . . . . . . . . . . . . . . . . . . . . . . . . . . . . . . . . . . . . . . . . . . . 10/22/18 USD 155,000 (3,593)TWD 28,436,042 DBAG . . . . . . . . . . . . . . . . . . . . . . . . . . . . . . . . . . . . . . . . . . . . . . . . . . . . . . . . . . . . . . . . . . . . . . . . . . 10/05/18 USD 925,000 (6,493)TWD 48,010,952 BOA . . . . . . . . . . . . . . . . . . . . . . . . . . . . . . . . . . . . . . . . . . . . . . . . . . . . . . . . . . . . . . . . . . . . . . . . . . . 10/26/18 USD 1,567,704 (7,149)TWD 47,985,343 MSIP . . . . . . . . . . . . . . . . . . . . . . . . . . . . . . . . . . . . . . . . . . . . . . . . . . . . . . . . . . . . . . . . . . . . . . . . . . 10/26/18 USD 1,567,790 (6,224)TWD 47,965,671 MSIP . . . . . . . . . . . . . . . . . . . . . . . . . . . . . . . . . . . . . . . . . . . . . . . . . . . . . . . . . . . . . . . . . . . . . . . . . . 10/26/18 USD 1,567,506 (5,863)ZAR 17,119,143 GSI . . . . . . . . . . . . . . . . . . . . . . . . . . . . . . . . . . . . . . . . . . . . . . . . . . . . . . . . . . . . . . . . . . . . . . . . . . . 10/03/18 USD 1,286,810 76,395ZAR 3,489,712 BBP . . . . . . . . . . . . . . . . . . . . . . . . . . . . . . . . . . . . . . . . . . . . . . . . . . . . . . . . . . . . . . . . . . . . . . . . . . . 10/05/18 USD 230,035 (16,638)ZAR 13,241,455 JPMC . . . . . . . . . . . . . . . . . . . . . . . . . . . . . . . . . . . . . . . . . . . . . . . . . . . . . . . . . . . . . . . . . . . . . . . . . . 10/05/18 USD 940,600 4,615ZAR 10,784,472 MSIP . . . . . . . . . . . . . . . . . . . . . . . . . . . . . . . . . . . . . . . . . . . . . . . . . . . . . . . . . . . . . . . . . . . . . . . . . . 10/05/18 USD 710,565 (51,746)ZAR 145,111,349 BOA . . . . . . . . . . . . . . . . . . . . . . . . . . . . . . . . . . . . . . . . . . . . . . . . . . . . . . . . . . . . . . . . . . . . . . . . . . . 10/16/18 USD 10,542,282 299,984ZAR 8,237,772 GSI . . . . . . . . . . . . . . . . . . . . . . . . . . . . . . . . . . . . . . . . . . . . . . . . . . . . . . . . . . . . . . . . . . . . . . . . . . . 10/22/18 USD 572,000 (8,985)ZAR 784,592 BNP . . . . . . . . . . . . . . . . . . . . . . . . . . . . . . . . . . . . . . . . . . . . . . . . . . . . . . . . . . . . . . . . . . . . . . . . . . . 10/31/18 USD 54,567 (702)ZAR 1,570,431 BBP . . . . . . . . . . . . . . . . . . . . . . . . . . . . . . . . . . . . . . . . . . . . . . . . . . . . . . . . . . . . . . . . . . . . . . . . . . . 10/31/18 USD 109,135 (1,492)ZAR 3,325,959 HSBC . . . . . . . . . . . . . . . . . . . . . . . . . . . . . . . . . . . . . . . . . . . . . . . . . . . . . . . . . . . . . . . . . . . . . . . . . . 10/31/18 USD 231,222 (3,071)ZAR 7,843,481 MSIP . . . . . . . . . . . . . . . . . . . . . . . . . . . . . . . . . . . . . . . . . . . . . . . . . . . . . . . . . . . . . . . . . . . . . . . . . . 10/31/18 USD 545,675 (6,850)ZAR 1,758,824 CBNA . . . . . . . . . . . . . . . . . . . . . . . . . . . . . . . . . . . . . . . . . . . . . . . . . . . . . . . . . . . . . . . . . . . . . . . . . . 11/01/18 USD 121,800 (2,082)ZAR 10,269,227 JPMC . . . . . . . . . . . . . . . . . . . . . . . . . . . . . . . . . . . . . . . . . . . . . . . . . . . . . . . . . . . . . . . . . . . . . . . . . . 11/01/18 USD 710,000 (13,310)ZAR 4,116,825 JPMC . . . . . . . . . . . . . . . . . . . . . . . . . . . . . . . . . . . . . . . . . . . . . . . . . . . . . . . . . . . . . . . . . . . . . . . . . . 11/01/18 USD 285,000 (4,967)ZAR 20,514,030 RBS . . . . . . . . . . . . . . . . . . . . . . . . . . . . . . . . . . . . . . . . . . . . . . . . . . . . . . . . . . . . . . . . . . . . . . . . . . . 11/01/18 USD 1,420,000 (24,900)ZAR 4,114,517 RBS . . . . . . . . . . . . . . . . . . . . . . . . . . . . . . . . . . . . . . . . . . . . . . . . . . . . . . . . . . . . . . . . . . . . . . . . . . . 11/01/18 USD 285,000 (4,805)ZAR 17,119,143 BOA . . . . . . . . . . . . . . . . . . . . . . . . . . . . . . . . . . . . . . . . . . . . . . . . . . . . . . . . . . . . . . . . . . . . . . . . . . . 12/03/18 USD 1,183,959 (16,765)
Cross Currency Contracts to Buy
AUD 3,782,000 JPMC . . . . . . . . . . . . . . . . . . . . . . . . . . . . . . . . . . . . . . . . . . . . . . . . . . . . . . . . . . . . . . . . . . . . . . . . . . 12/19/18 SEK 24,229,999 (9,550)CAD 5,780,670 MSIP . . . . . . . . . . . . . . . . . . . . . . . . . . . . . . . . . . . . . . . . . . . . . . . . . . . . . . . . . . . . . . . . . . . . . . . . . . 12/19/18 EUR 3,782,000 63,076EUR 3,782,000 BOA . . . . . . . . . . . . . . . . . . . . . . . . . . . . . . . . . . . . . . . . . . . . . . . . . . . . . . . . . . . . . . . . . . . . . . . . . . . 12/19/18 JPY 500,239,467 (10,151)EUR 1,890,000 MSIP . . . . . . . . . . . . . . . . . . . . . . . . . . . . . . . . . . . . . . . . . . . . . . . . . . . . . . . . . . . . . . . . . . . . . . . . . . 12/19/18 CAD 2,872,706 (19,035)EUR 1,892,000 MSIP . . . . . . . . . . . . . . . . . . . . . . . . . . . . . . . . . . . . . . . . . . . . . . . . . . . . . . . . . . . . . . . . . . . . . . . . . . 12/19/18 CAD 2,877,108 (20,111)JPY 494,364,508 JPMC . . . . . . . . . . . . . . . . . . . . . . . . . . . . . . . . . . . . . . . . . . . . . . . . . . . . . . . . . . . . . . . . . . . . . . . . . . 12/19/18 EUR 3,782,000 (41,876)JPY 390,424,177 CBNA . . . . . . . . . . . . . . . . . . . . . . . . . . . . . . . . . . . . . . . . . . . . . . . . . . . . . . . . . . . . . . . . . . . . . . . . . . 12/19/18 NZD 5,295,000 (53,868)NZD 1,513,000 JPMC . . . . . . . . . . . . . . . . . . . . . . . . . . . . . . . . . . . . . . . . . . . . . . . . . . . . . . . . . . . . . . . . . . . . . . . . . . 12/19/18 JPY 112,915,190 3,393NZD 1,512,857 JPMC . . . . . . . . . . . . . . . . . . . . . . . . . . . . . . . . . . . . . . . . . . . . . . . . . . . . . . . . . . . . . . . . . . . . . . . . . . 12/19/18 JPY 113,070,932 1,919SEK 8,041,893 MSIP . . . . . . . . . . . . . . . . . . . . . . . . . . . . . . . . . . . . . . . . . . . . . . . . . . . . . . . . . . . . . . . . . . . . . . . . . . 12/19/18 AUD 1,260,000 (274)SEK 16,096,550 MSIP . . . . . . . . . . . . . . . . . . . . . . . . . . . . . . . . . . . . . . . . . . . . . . . . . . . . . . . . . . . . . . . . . . . . . . . . . . 12/19/18 AUD 2,522,000 (548)
Net Unrealized Appreciation . . . . . . . . . . . . . . . . . . . . . . . . . . . . . . . . . . . . . . . . . . . . . . . . . . . . . . . . . . . . . . . . . . . . . . . . . . . . . . . . . . . . . . . . . . . . . . . . . . . . . . . . . . . $867,884
BHFTII-40
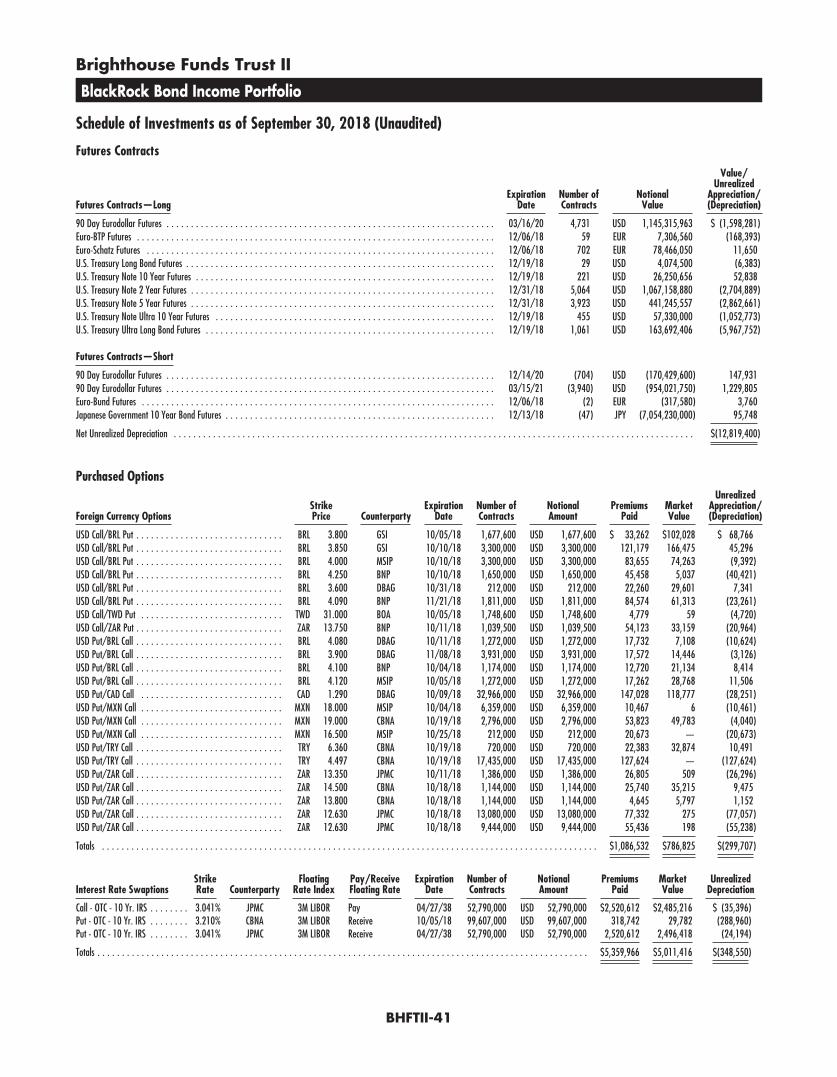
Brighthouse Funds Trust II
BlackRock Bond Income Portfolio
Schedule of Investments as of September 30, 2018 (Unaudited)
Futures Contracts
Futures Contracts—LongExpiration
DateNumber ofContracts
NotionalValue
Value/Unrealized
Appreciation/(Depreciation)
90 Day Eurodollar Futures . . . . . . . . . . . . . . . . . . . . . . . . . . . . . . . . . . . . . . . . . . . . . . . . . . . . . . . . . . . . . . . . . . . 03/16/20 4,731 USD 1,145,315,963 $ (1,598,281)Euro-BTP Futures . . . . . . . . . . . . . . . . . . . . . . . . . . . . . . . . . . . . . . . . . . . . . . . . . . . . . . . . . . . . . . . . . . . . . . . . . 12/06/18 59 EUR 7,306,560 (168,393)Euro-Schatz Futures . . . . . . . . . . . . . . . . . . . . . . . . . . . . . . . . . . . . . . . . . . . . . . . . . . . . . . . . . . . . . . . . . . . . . . . 12/06/18 702 EUR 78,466,050 11,650U.S. Treasury Long Bond Futures . . . . . . . . . . . . . . . . . . . . . . . . . . . . . . . . . . . . . . . . . . . . . . . . . . . . . . . . . . . . . . . 12/19/18 29 USD 4,074,500 (6,383)U.S. Treasury Note 10 Year Futures . . . . . . . . . . . . . . . . . . . . . . . . . . . . . . . . . . . . . . . . . . . . . . . . . . . . . . . . . . . . . 12/19/18 221 USD 26,250,656 52,838U.S. Treasury Note 2 Year Futures . . . . . . . . . . . . . . . . . . . . . . . . . . . . . . . . . . . . . . . . . . . . . . . . . . . . . . . . . . . . . . 12/31/18 5,064 USD 1,067,158,880 (2,704,889)U.S. Treasury Note 5 Year Futures . . . . . . . . . . . . . . . . . . . . . . . . . . . . . . . . . . . . . . . . . . . . . . . . . . . . . . . . . . . . . . 12/31/18 3,923 USD 441,245,557 (2,862,661)U.S. Treasury Note Ultra 10 Year Futures . . . . . . . . . . . . . . . . . . . . . . . . . . . . . . . . . . . . . . . . . . . . . . . . . . . . . . . . . 12/19/18 455 USD 57,330,000 (1,052,773)U.S. Treasury Ultra Long Bond Futures . . . . . . . . . . . . . . . . . . . . . . . . . . . . . . . . . . . . . . . . . . . . . . . . . . . . . . . . . . . 12/19/18 1,061 USD 163,692,406 (5,967,752)
Futures Contracts—Short
90 Day Eurodollar Futures . . . . . . . . . . . . . . . . . . . . . . . . . . . . . . . . . . . . . . . . . . . . . . . . . . . . . . . . . . . . . . . . . . . 12/14/20 (704) USD (170,429,600) 147,93190 Day Eurodollar Futures . . . . . . . . . . . . . . . . . . . . . . . . . . . . . . . . . . . . . . . . . . . . . . . . . . . . . . . . . . . . . . . . . . . 03/15/21 (3,940) USD (954,021,750) 1,229,805Euro-Bund Futures . . . . . . . . . . . . . . . . . . . . . . . . . . . . . . . . . . . . . . . . . . . . . . . . . . . . . . . . . . . . . . . . . . . . . . . . 12/06/18 (2) EUR (317,580) 3,760Japanese Government 10 Year Bond Futures . . . . . . . . . . . . . . . . . . . . . . . . . . . . . . . . . . . . . . . . . . . . . . . . . . . . . . . 12/13/18 (47) JPY (7,054,230,000) 95,748
Net Unrealized Depreciation . . . . . . . . . . . . . . . . . . . . . . . . . . . . . . . . . . . . . . . . . . . . . . . . . . . . . . . . . . . . . . . . . . . . . . . . . . . . . . . . . . . . . . . . . . . . . . . . . . . . . . . . . . $(12,819,400)
Purchased Options
Foreign Currency OptionsStrikePrice Counterparty
ExpirationDate
Number ofContracts
NotionalAmount
PremiumsPaid
MarketValue
UnrealizedAppreciation/(Depreciation)
USD Call/BRL Put . . . . . . . . . . . . . . . . . . . . . . . . . . . . . . BRL 3.800 GSI 10/05/18 1,677,600 USD 1,677,600 $ 33,262 $102,028 $ 68,766USD Call/BRL Put . . . . . . . . . . . . . . . . . . . . . . . . . . . . . . BRL 3.850 GSI 10/10/18 3,300,000 USD 3,300,000 121,179 166,475 45,296USD Call/BRL Put . . . . . . . . . . . . . . . . . . . . . . . . . . . . . . BRL 4.000 MSIP 10/10/18 3,300,000 USD 3,300,000 83,655 74,263 (9,392)USD Call/BRL Put . . . . . . . . . . . . . . . . . . . . . . . . . . . . . . BRL 4.250 BNP 10/10/18 1,650,000 USD 1,650,000 45,458 5,037 (40,421)USD Call/BRL Put . . . . . . . . . . . . . . . . . . . . . . . . . . . . . . BRL 3.600 DBAG 10/31/18 212,000 USD 212,000 22,260 29,601 7,341USD Call/BRL Put . . . . . . . . . . . . . . . . . . . . . . . . . . . . . . BRL 4.090 BNP 11/21/18 1,811,000 USD 1,811,000 84,574 61,313 (23,261)USD Call/TWD Put . . . . . . . . . . . . . . . . . . . . . . . . . . . . . TWD 31.000 BOA 10/05/18 1,748,600 USD 1,748,600 4,779 59 (4,720)USD Call/ZAR Put . . . . . . . . . . . . . . . . . . . . . . . . . . . . . . ZAR 13.750 BNP 10/11/18 1,039,500 USD 1,039,500 54,123 33,159 (20,964)USD Put/BRL Call . . . . . . . . . . . . . . . . . . . . . . . . . . . . . . BRL 4.080 DBAG 10/11/18 1,272,000 USD 1,272,000 17,732 7,108 (10,624)USD Put/BRL Call . . . . . . . . . . . . . . . . . . . . . . . . . . . . . . BRL 3.900 DBAG 11/08/18 3,931,000 USD 3,931,000 17,572 14,446 (3,126)USD Put/BRL Call . . . . . . . . . . . . . . . . . . . . . . . . . . . . . . BRL 4.100 BNP 10/04/18 1,174,000 USD 1,174,000 12,720 21,134 8,414USD Put/BRL Call . . . . . . . . . . . . . . . . . . . . . . . . . . . . . . BRL 4.120 MSIP 10/05/18 1,272,000 USD 1,272,000 17,262 28,768 11,506USD Put/CAD Call . . . . . . . . . . . . . . . . . . . . . . . . . . . . . CAD 1.290 DBAG 10/09/18 32,966,000 USD 32,966,000 147,028 118,777 (28,251)USD Put/MXN Call . . . . . . . . . . . . . . . . . . . . . . . . . . . . . MXN 18.000 MSIP 10/04/18 6,359,000 USD 6,359,000 10,467 6 (10,461)USD Put/MXN Call . . . . . . . . . . . . . . . . . . . . . . . . . . . . . MXN 19.000 CBNA 10/19/18 2,796,000 USD 2,796,000 53,823 49,783 (4,040)USD Put/MXN Call . . . . . . . . . . . . . . . . . . . . . . . . . . . . . MXN 16.500 MSIP 10/25/18 212,000 USD 212,000 20,673 — (20,673)USD Put/TRY Call . . . . . . . . . . . . . . . . . . . . . . . . . . . . . . TRY 6.360 CBNA 10/19/18 720,000 USD 720,000 22,383 32,874 10,491USD Put/TRY Call . . . . . . . . . . . . . . . . . . . . . . . . . . . . . . TRY 4.497 CBNA 10/19/18 17,435,000 USD 17,435,000 127,624 — (127,624)USD Put/ZAR Call . . . . . . . . . . . . . . . . . . . . . . . . . . . . . . ZAR 13.350 JPMC 10/11/18 1,386,000 USD 1,386,000 26,805 509 (26,296)USD Put/ZAR Call . . . . . . . . . . . . . . . . . . . . . . . . . . . . . . ZAR 14.500 CBNA 10/18/18 1,144,000 USD 1,144,000 25,740 35,215 9,475USD Put/ZAR Call . . . . . . . . . . . . . . . . . . . . . . . . . . . . . . ZAR 13.800 CBNA 10/18/18 1,144,000 USD 1,144,000 4,645 5,797 1,152USD Put/ZAR Call . . . . . . . . . . . . . . . . . . . . . . . . . . . . . . ZAR 12.630 JPMC 10/18/18 13,080,000 USD 13,080,000 77,332 275 (77,057)USD Put/ZAR Call . . . . . . . . . . . . . . . . . . . . . . . . . . . . . . ZAR 12.630 JPMC 10/18/18 9,444,000 USD 9,444,000 55,436 198 (55,238)
Totals . . . . . . . . . . . . . . . . . . . . . . . . . . . . . . . . . . . . . . . . . . . . . . . . . . . . . . . . . . . . . . . . . . . . . . . . . . . . . . . . . . . . . . . . . . . . . . . . . . . . . $1,086,532 $786,825 $(299,707)
Interest Rate SwaptionsStrikeRate Counterparty
FloatingRate Index
Pay/ReceiveFloating Rate
ExpirationDate
Number ofContracts
NotionalAmount
PremiumsPaid
MarketValue
UnrealizedDepreciation
Call - OTC - 10 Yr. IRS . . . . . . . . 3.041% JPMC 3M LIBOR Pay 04/27/38 52,790,000 USD 52,790,000 $2,520,612 $2,485,216 $ (35,396)Put - OTC - 10 Yr. IRS . . . . . . . . 3.210% CBNA 3M LIBOR Receive 10/05/18 99,607,000 USD 99,607,000 318,742 29,782 (288,960)Put - OTC - 10 Yr. IRS . . . . . . . . 3.041% JPMC 3M LIBOR Receive 04/27/38 52,790,000 USD 52,790,000 2,520,612 2,496,418 (24,194)
Totals . . . . . . . . . . . . . . . . . . . . . . . . . . . . . . . . . . . . . . . . . . . . . . . . . . . . . . . . . . . . . . . . . . . . . . . . . . . . . . . . . . . . . . . . . . . . . . . . . . . . $5,359,966 $5,011,416 $(348,550)
BHFTII-41

Brighthouse Funds Trust II
BlackRock Bond Income Portfolio
Schedule of Investments as of September 30, 2018 (Unaudited)
Purchased Options—(Continued)
Options on Exchange-Traded Futures ContractsStrikePrice
ExpirationDate
Number ofContracts
NotionalAmount
PremiumsPaid
MarketValue
UnrealizedDepreciation
Put - U.S. Treasury Note 10-Year Futures . . . . . . . . . . . . . . . . . . . . . . . . . . . . . USD 118.500 10/05/18 3,202 USD 3,202,000 $944,723 $350,219 $(594,504)
Written Options
Foreign Currency OptionsStrikePrice Counterparty
ExpirationDate
Number ofContracts
NotionalAmount
PremiumsReceived
MarketValue
UnrealizedAppreciation/(Depreciation)
USD Call/BRL Put . . . . . . . . . . . . . . . . . . . . . . . . . . . . . . . . . BRL 4.450 BNP 10/04/18 (1,174,000) USD (1,174,000) $ (4,461) $ (3) $ 4,458USD Call/BRL Put . . . . . . . . . . . . . . . . . . . . . . . . . . . . . . . . . BRL 3.960 GSI 10/05/18 (2,516,400) USD (2,516,400) (22,262) (60,721) (38,459)USD Call/BRL Put . . . . . . . . . . . . . . . . . . . . . . . . . . . . . . . . . BRL 4.250 MSIP 10/10/18 (3,300,000) USD (3,300,000) (34,320) (10,075) 24,245USD Call/BRL Put . . . . . . . . . . . . . . . . . . . . . . . . . . . . . . . . . BRL 4.000 GSI 10/10/18 (3,300,000) USD (3,300,000) (71,679) (74,263) (2,584)USD Call/BRL Put . . . . . . . . . . . . . . . . . . . . . . . . . . . . . . . . . BRL 4.110 BNP 11/21/18 (1,811,000) USD (1,811,000) (73,889) (51,105) 22,784USD Call/BRL Put . . . . . . . . . . . . . . . . . . . . . . . . . . . . . . . . . BRL 4.100 GSI 11/21/18 (1,677,600) USD (1,677,600) (74,955) (55,121) 19,834USD Call/ZAR Put . . . . . . . . . . . . . . . . . . . . . . . . . . . . . . . . . ZAR 13.750 JPMC 10/11/18 (1,039,500) USD (1,039,500) (19,615) (33,159) (13,544)USD Put/BRL Call . . . . . . . . . . . . . . . . . . . . . . . . . . . . . . . . . BRL 4.120 DBAG 10/05/18 (1,272,000) USD (1,272,000) (43,426) (28,767) 14,659USD Put/BRL Call . . . . . . . . . . . . . . . . . . . . . . . . . . . . . . . . . BRL 4.080 MSIP 10/11/18 (1,272,000) USD (1,272,000) (17,548) (7,108) 10,440USD Put/CAD Call . . . . . . . . . . . . . . . . . . . . . . . . . . . . . . . . . CAD 1.290 BBP 10/09/18 (32,966,000) USD (32,966,000) (54,724) (118,776) (64,052)USD Put/TRY Call . . . . . . . . . . . . . . . . . . . . . . . . . . . . . . . . . TRY 4.497 BNP 10/19/18 (17,435,000) USD (17,435,000) (66,985) — 66,985USD Put/TRY Call . . . . . . . . . . . . . . . . . . . . . . . . . . . . . . . . . TRY 5.960 CBNA 10/19/18 (1,080,000) USD (1,080,000) (6,403) (8,622) (2,219)USD Put/ZAR Call . . . . . . . . . . . . . . . . . . . . . . . . . . . . . . . . . ZAR 13.800 CBNA 10/18/18 (1,716,000) USD (1,716,000) (12,390) (8,695) 3,695
Totals . . . . . . . . . . . . . . . . . . . . . . . . . . . . . . . . . . . . . . . . . . . . . . . . . . . . . . . . . . . . . . . . . . . . . . . . . . . . . . . . . . . . . . . . . . . . . . . . . . . . . $(502,657) $(456,415) $46,242
Forward Volatility AgreementsCurrency
PriceStrike
Volatility CounterpartyExpiration
DateNumber ofContracts
NotionalAmount
PremiumsReceived
MarketValue
UnrealizedDepreciation
USD Put/JPY Call . . . . . . . . . . . . . . . . . . . . . . . . USD 8.900% DBAG 04/03/19 (6,233,000) USD (6,233,000) $— $ (44,267) $ (44,267)USD Put/JPY Call . . . . . . . . . . . . . . . . . . . . . . . . USD 8.900% DBAG 04/03/19 (6,233,000) USD (6,233,000) — (44,267) (44,267)USD Put/JPY Call . . . . . . . . . . . . . . . . . . . . . . . . USD 8.725% DBAG 04/03/19 (12,736,000) USD (12,736,000) — (78,072) (78,072)
Totals . . . . . . . . . . . . . . . . . . . . . . . . . . . . . . . . . . . . . . . . . . . . . . . . . . . . . . . . . . . . . . . . . . . . . . . . . . . . . . . . . . . . . . . . . . . . . . . . . . . . . . . $— $(166,606) $(166,606)
Interest Rate SwaptionsStrikeRate Counterparty
FloatingRate Index
Pay/ReceiveFloating Rate
ExpirationDate
Number ofContracts
NotionalAmount
PremiumsReceived
MarketValue
UnrealizedAppreciation/(Depreciation)
Call - OTC - 2 Yr. IRS . . . . . . . . 2.780% JPMC 3M LIBOR Receive 11/29/18 (344,100,000) USD (344,100,000) $(316,572) $ (45,352) $271,220Put - OTC - 2 Yr. IRS . . . . . . . . 3.080% JPMC 3M LIBOR Pay 11/29/18 (344,100,000) USD (344,100,000) (275,280) (353,047) (77,767)
Totals . . . . . . . . . . . . . . . . . . . . . . . . . . . . . . . . . . . . . . . . . . . . . . . . . . . . . . . . . . . . . . . . . . . . . . . . . . . . . . . . . . . . . . . . . . . . . . . . . . . . . $(591,852) $(398,399) $193,453
Options on Exchange-Traded Futures ContractsStrikePrice
ExpirationDate
Number ofContracts
NotionalAmount
PremiumsReceived
MarketValue
UnrealizedDepreciation
Put - Eurodollar Midcurve 2-Year Futures . . . . . . . . . . . . . . . . . . . . . . . . . . . . USD 96.750 12/14/18 (2,358) USD (5,895,000) $(290,010) $(427,387) $(137,377)
Swap Agreements
OTC Interest Rate Swaps
Pay/ReceiveFloating Rate
FloatingRate Index
PaymentFrequency
FixedRate
PaymentFrequency
MaturityDate Counterparty
NotionalAmount
MarketValue
UpfrontPremium
Paid/(Received)
UnrealizedAppreciation/
(Depreciation)(1)
Pay . . . . . . . . . . . . . . . . . 28-Day TIIE Monthly 6.270% Monthly 12/05/25 BOA MXN 2,209,451 $ (11,756) $— $ (11,756)Pay . . . . . . . . . . . . . . . . . 28-Day TIIE Monthly 6.325% Monthly 07/17/25 CBNA MXN 19,973,500 (97,306) — (97,306)Pay . . . . . . . . . . . . . . . . . 28-Day TIIE Monthly 6.330% Monthly 08/06/25 CBNA MXN 59,593,000 (291,819) — (291,819)Pay . . . . . . . . . . . . . . . . . 28-Day TIIE Monthly 6.980% Monthly 11/28/18 JPMC MXN 92,466,976 (9,600) — (9,600)Pay . . . . . . . . . . . . . . . . . 28-Day TIIE Monthly 6.980% Monthly 11/28/18 CBNA MXN 163,000,000 (16,924) — (16,924)Pay . . . . . . . . . . . . . . . . . 28-Day TIIE Monthly 7.060% Monthly 11/21/18 JPMC MXN 114,610,942 (9,800) — (9,800)
BHFTII-42
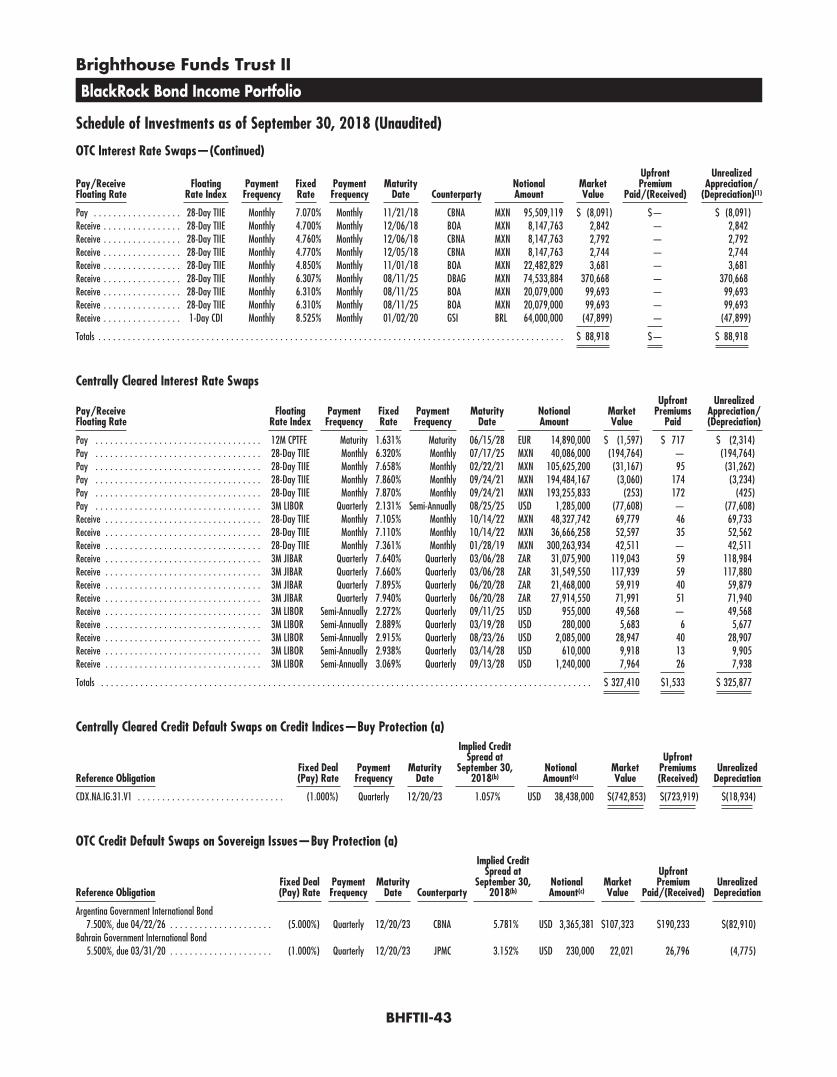
Brighthouse Funds Trust II
BlackRock Bond Income Portfolio
Schedule of Investments as of September 30, 2018 (Unaudited)
OTC Interest Rate Swaps—(Continued)
Pay/ReceiveFloating Rate
FloatingRate Index
PaymentFrequency
FixedRate
PaymentFrequency
MaturityDate Counterparty
NotionalAmount
MarketValue
UpfrontPremium
Paid/(Received)
UnrealizedAppreciation/
(Depreciation)(1)
Pay . . . . . . . . . . . . . . . . . . 28-Day TIIE Monthly 7.070% Monthly 11/21/18 CBNA MXN 95,509,119 $ (8,091) $— $ (8,091)Receive . . . . . . . . . . . . . . . . 28-Day TIIE Monthly 4.700% Monthly 12/06/18 BOA MXN 8,147,763 2,842 — 2,842Receive . . . . . . . . . . . . . . . . 28-Day TIIE Monthly 4.760% Monthly 12/06/18 CBNA MXN 8,147,763 2,792 — 2,792Receive . . . . . . . . . . . . . . . . 28-Day TIIE Monthly 4.770% Monthly 12/05/18 CBNA MXN 8,147,763 2,744 — 2,744Receive . . . . . . . . . . . . . . . . 28-Day TIIE Monthly 4.850% Monthly 11/01/18 BOA MXN 22,482,829 3,681 — 3,681Receive . . . . . . . . . . . . . . . . 28-Day TIIE Monthly 6.307% Monthly 08/11/25 DBAG MXN 74,533,884 370,668 — 370,668Receive . . . . . . . . . . . . . . . . 28-Day TIIE Monthly 6.310% Monthly 08/11/25 BOA MXN 20,079,000 99,693 — 99,693Receive . . . . . . . . . . . . . . . . 28-Day TIIE Monthly 6.310% Monthly 08/11/25 BOA MXN 20,079,000 99,693 — 99,693Receive . . . . . . . . . . . . . . . . 1-Day CDI Monthly 8.525% Monthly 01/02/20 GSI BRL 64,000,000 (47,899) — (47,899)
Totals . . . . . . . . . . . . . . . . . . . . . . . . . . . . . . . . . . . . . . . . . . . . . . . . . . . . . . . . . . . . . . . . . . . . . . . . . . . . . . . . . . . . . . . . . . . . . . . $ 88,918 $— $ 88,918
Centrally Cleared Interest Rate Swaps
Pay/ReceiveFloating Rate
FloatingRate Index
PaymentFrequency
FixedRate
PaymentFrequency
MaturityDate
NotionalAmount
MarketValue
UpfrontPremiums
Paid
UnrealizedAppreciation/(Depreciation)
Pay . . . . . . . . . . . . . . . . . . . . . . . . . . . . . . . . . . 12M CPTFE Maturity 1.631% Maturity 06/15/28 EUR 14,890,000 $ (1,597) $ 717 $ (2,314)Pay . . . . . . . . . . . . . . . . . . . . . . . . . . . . . . . . . . 28-Day TIIE Monthly 6.320% Monthly 07/17/25 MXN 40,086,000 (194,764) — (194,764)Pay . . . . . . . . . . . . . . . . . . . . . . . . . . . . . . . . . . 28-Day TIIE Monthly 7.658% Monthly 02/22/21 MXN 105,625,200 (31,167) 95 (31,262)Pay . . . . . . . . . . . . . . . . . . . . . . . . . . . . . . . . . . 28-Day TIIE Monthly 7.860% Monthly 09/24/21 MXN 194,484,167 (3,060) 174 (3,234)Pay . . . . . . . . . . . . . . . . . . . . . . . . . . . . . . . . . . 28-Day TIIE Monthly 7.870% Monthly 09/24/21 MXN 193,255,833 (253) 172 (425)Pay . . . . . . . . . . . . . . . . . . . . . . . . . . . . . . . . . . 3M LIBOR Quarterly 2.131% Semi-Annually 08/25/25 USD 1,285,000 (77,608) — (77,608)Receive . . . . . . . . . . . . . . . . . . . . . . . . . . . . . . . . 28-Day TIIE Monthly 7.105% Monthly 10/14/22 MXN 48,327,742 69,779 46 69,733Receive . . . . . . . . . . . . . . . . . . . . . . . . . . . . . . . . 28-Day TIIE Monthly 7.110% Monthly 10/14/22 MXN 36,666,258 52,597 35 52,562Receive . . . . . . . . . . . . . . . . . . . . . . . . . . . . . . . . 28-Day TIIE Monthly 7.361% Monthly 01/28/19 MXN 300,263,934 42,511 — 42,511Receive . . . . . . . . . . . . . . . . . . . . . . . . . . . . . . . . 3M JIBAR Quarterly 7.640% Quarterly 03/06/28 ZAR 31,075,900 119,043 59 118,984Receive . . . . . . . . . . . . . . . . . . . . . . . . . . . . . . . . 3M JIBAR Quarterly 7.660% Quarterly 03/06/28 ZAR 31,549,550 117,939 59 117,880Receive . . . . . . . . . . . . . . . . . . . . . . . . . . . . . . . . 3M JIBAR Quarterly 7.895% Quarterly 06/20/28 ZAR 21,468,000 59,919 40 59,879Receive . . . . . . . . . . . . . . . . . . . . . . . . . . . . . . . . 3M JIBAR Quarterly 7.940% Quarterly 06/20/28 ZAR 27,914,550 71,991 51 71,940Receive . . . . . . . . . . . . . . . . . . . . . . . . . . . . . . . . 3M LIBOR Semi-Annually 2.272% Quarterly 09/11/25 USD 955,000 49,568 — 49,568Receive . . . . . . . . . . . . . . . . . . . . . . . . . . . . . . . . 3M LIBOR Semi-Annually 2.889% Quarterly 03/19/28 USD 280,000 5,683 6 5,677Receive . . . . . . . . . . . . . . . . . . . . . . . . . . . . . . . . 3M LIBOR Semi-Annually 2.915% Quarterly 08/23/26 USD 2,085,000 28,947 40 28,907Receive . . . . . . . . . . . . . . . . . . . . . . . . . . . . . . . . 3M LIBOR Semi-Annually 2.938% Quarterly 03/14/28 USD 610,000 9,918 13 9,905Receive . . . . . . . . . . . . . . . . . . . . . . . . . . . . . . . . 3M LIBOR Semi-Annually 3.069% Quarterly 09/13/28 USD 1,240,000 7,964 26 7,938
Totals . . . . . . . . . . . . . . . . . . . . . . . . . . . . . . . . . . . . . . . . . . . . . . . . . . . . . . . . . . . . . . . . . . . . . . . . . . . . . . . . . . . . . . . . . . . . . . . . . . . . $ 327,410 $1,533 $ 325,877
Centrally Cleared Credit Default Swaps on Credit Indices—Buy Protection (a)
Reference ObligationFixed Deal(Pay) Rate
PaymentFrequency
MaturityDate
Implied CreditSpread at
September 30,2018(b)
NotionalAmount(c)
MarketValue
UpfrontPremiums(Received)
UnrealizedDepreciation
CDX.NA.IG.31.V1 . . . . . . . . . . . . . . . . . . . . . . . . . . . . . . (1.000%) Quarterly 12/20/23 1.057% USD 38,438,000 $(742,853) $(723,919) $(18,934)
OTC Credit Default Swaps on Sovereign Issues—Buy Protection (a)
Reference ObligationFixed Deal(Pay) Rate
PaymentFrequency
MaturityDate Counterparty
Implied CreditSpread at
September 30,2018(b)
NotionalAmount(c)
MarketValue
UpfrontPremium
Paid/(Received)Unrealized
Depreciation
Argentina Government International Bond7.500%, due 04/22/26 . . . . . . . . . . . . . . . . . . . . . (5.000%) Quarterly 12/20/23 CBNA 5.781% USD 3,365,381 $107,323 $190,233 $(82,910)
Bahrain Government International Bond5.500%, due 03/31/20 . . . . . . . . . . . . . . . . . . . . . (1.000%) Quarterly 12/20/23 JPMC 3.152% USD 230,000 22,021 26,796 (4,775)
BHFTII-43

Brighthouse Funds Trust II
BlackRock Bond Income Portfolio
Schedule of Investments as of September 30, 2018 (Unaudited)
OTC Credit Default Swaps on Sovereign Issues—Buy Protection (a)—(Continued)
Reference ObligationFixed Deal(Pay) Rate
PaymentFrequency
MaturityDate Counterparty
Implied CreditSpread at
September 30,2018(b)
NotionalAmount(c)
MarketValue
UpfrontPremium
Paid/(Received)Unrealized
Depreciation
Brazil Government International Bond4.250%, due 01/07/25 . . . . . . . . . . . . . . . . . . . (1.000%) Quarterly 12/20/23 CBNA 2.602% USD 8,843,193 $ 645,771 $ 782,736 $(136,965)
Brazil Government International Bond4.250%, due 01/07/25 . . . . . . . . . . . . . . . . . . . (1.000%) Quarterly 12/20/23 GSI 2.602% USD 3,050,000 222,725 272,025 (49,300)
Mexico Government International Bond7.500%, due 04/08/33 . . . . . . . . . . . . . . . . . . . (1.000%) Quarterly 06/20/20 JPMC 0.492% USD 3,824,276 (32,957) 33,406 (66,363)
Mexico Government International Bond7.500%, due 04/08/33 . . . . . . . . . . . . . . . . . . . (1.000%) Quarterly 09/20/20 BOA 0.511% USD 3,824,276 (36,174) 50,241 (86,415)
Mexico Government International Bond4.150%, due 03/28/27 . . . . . . . . . . . . . . . . . . . (1.000%) Quarterly 12/20/23 CBNA 1.128% USD 1,880,000 11,426 18,965 (7,539)
Mexico Government International Bond4.150%, due 03/28/27 . . . . . . . . . . . . . . . . . . . (1.000%) Quarterly 12/20/23 CBNA 1.128% USD 1,120,000 6,807 11,298 (4,491)
Mexico Government International Bond4.150%, due 03/28/27 . . . . . . . . . . . . . . . . . . . (1.000%) Quarterly 12/20/23 GSI 1.128% USD 10,295,000 62,572 99,700 (37,128)
Philippines Government International Bond10.625%, due 03/16/25 . . . . . . . . . . . . . . . . . . (1.000%) Quarterly 12/20/23 BNP 0.777% USD 5,627,000 (60,086) (27,793) (32,293)
Republic of Colombia10.375%, due 01/23/33 . . . . . . . . . . . . . . . . . . (1.000%) Quarterly 12/20/23 CBNA 1.102% USD 589,000 2,874 4,733 (1,859)
South Africa Government International Bond5.500%, due 03/09/20 . . . . . . . . . . . . . . . . . . . (1.000%) Quarterly 12/20/23 MSIP 2.020% USD 1,550,000 73,252 93,427 (20,175)
Totals . . . . . . . . . . . . . . . . . . . . . . . . . . . . . . . . . . . . . . . . . . . . . . . . . . . . . . . . . . . . . . . . . . . . . . . . . . . . . . . . . . . . . . . . . . . . . . . . . . . . $1,025,554 $1,555,767 $(530,213)
OTC Credit Default Swaps on Sovereign Issues—Sell Protection (d)
Reference ObligationFixed Deal
Receive RatePaymentFrequency
MaturityDate Counterparty
Implied CreditSpread at
September 30,2018(b)
NotionalAmount(c)
MarketValue
UpfrontPremium
(Received)Unrealized
Appreciation
Mexico Government International Bond7.500%, due 04/08/33 . . . . . . . . . . . 1.000% Quarterly 06/20/20 BOA 0.492% USD 3,824,276 $32,957 $(38,756) $ 71,713
Mexico Government International Bond7.500%, due 04/08/33 . . . . . . . . . . . 1.000% Quarterly 09/20/20 JPMC 0.511% USD 3,824,276 36,174 (43,741) 79,915
Totals . . . . . . . . . . . . . . . . . . . . . . . . . . . . . . . . . . . . . . . . . . . . . . . . . . . . . . . . . . . . . . . . . . . . . . . . . . . . . . . . . . . . . . . . . . . . . . . . . . . . . . $69,131 $(82,497) $151,628
OTC Credit Default Swaps on Credit Indices—Buy Protection (a)
Reference ObligationFixed Deal(Pay) Rate
PaymentFrequency
MaturityDate Counterparty
Implied CreditSpread at
September 30,2018(b)
NotionalAmount(c)
MarketValue
UpfrontPremium
Paid/(Received)
UnrealizedAppreciation/(Depreciation)
CMBX.NA.A.V9 . . . . . . . . . . . . . . . (2.000%) Monthly 09/17/58 CBNA 0.000% USD 510,000 $ 626 $ 10,212 $ (9,586)CMBX.NA.A.V9 . . . . . . . . . . . . . . . (2.000%) Monthly 09/17/58 CSI 0.000% USD 1,516,000 1,860 25,758 (23,898)CMBX.NA.A.V9 . . . . . . . . . . . . . . . (2.000%) Monthly 09/17/58 CSI 0.000% USD 600,000 736 10,952 (10,216)CMBX.NA.A.V9 . . . . . . . . . . . . . . . (2.000%) Monthly 09/17/58 CSI 0.000% USD 510,000 626 9,582 (8,956)CMBX.NA.A.V9 . . . . . . . . . . . . . . . (2.000%) Monthly 09/17/58 GSI 0.000% USD 260,000 319 5,203 (4,884)CMBX.NA.AAA.V6 . . . . . . . . . . . . . . (0.500%) Monthly 05/11/63 DBAG 0.000% USD 1,670,000 (16,899) 242 (17,141)CMBX.NA.AAA.V6 . . . . . . . . . . . . . . (0.500%) Monthly 05/11/63 DBAG 0.000% USD 2,340,000 (23,679) (883) (22,796)CMBX.NA.AAA.V6 . . . . . . . . . . . . . . (0.500%) Monthly 05/11/63 DBAG 0.000% USD 2,680,000 (27,119) 744 (27,863)CMBX.NA.AAA.V9 . . . . . . . . . . . . . . (0.500%) Monthly 09/17/58 CSI 0.000% USD 1,610,000 (12,467) 19,806 (32,273)CMBX.NA.AAA.V9 . . . . . . . . . . . . . . (0.500%) Monthly 09/17/58 DBAG 0.000% USD 1,280,000 (9,913) 15,972 (25,885)CMBX.NA.AAA.V9 . . . . . . . . . . . . . . (0.500%) Monthly 09/17/58 MSIP 0.000% USD 900,000 (6,970) 11,071 (18,041)CMBX.NA.AAA.V9 . . . . . . . . . . . . . . (0.500%) Monthly 09/17/58 MSIP 0.000% USD 1,090,000 (8,441) 13,409 (21,850)CMBX.NA.AAA.V9 . . . . . . . . . . . . . . (0.500%) Monthly 09/17/58 MSIP 0.000% USD 1,960,000 (15,179) 26,423 (41,602)CMBX.NA.BBB-.V6 . . . . . . . . . . . . . (3.000%) Monthly 05/11/63 JPMC 0.000% USD 340,000 40,097 34,298 5,799
Totals . . . . . . . . . . . . . . . . . . . . . . . . . . . . . . . . . . . . . . . . . . . . . . . . . . . . . . . . . . . . . . . . . . . . . . . . . . . . . . . . . . . . . . . . . . . . . . . . . $(76,403) $182,789 $(259,192)
BHFTII-44
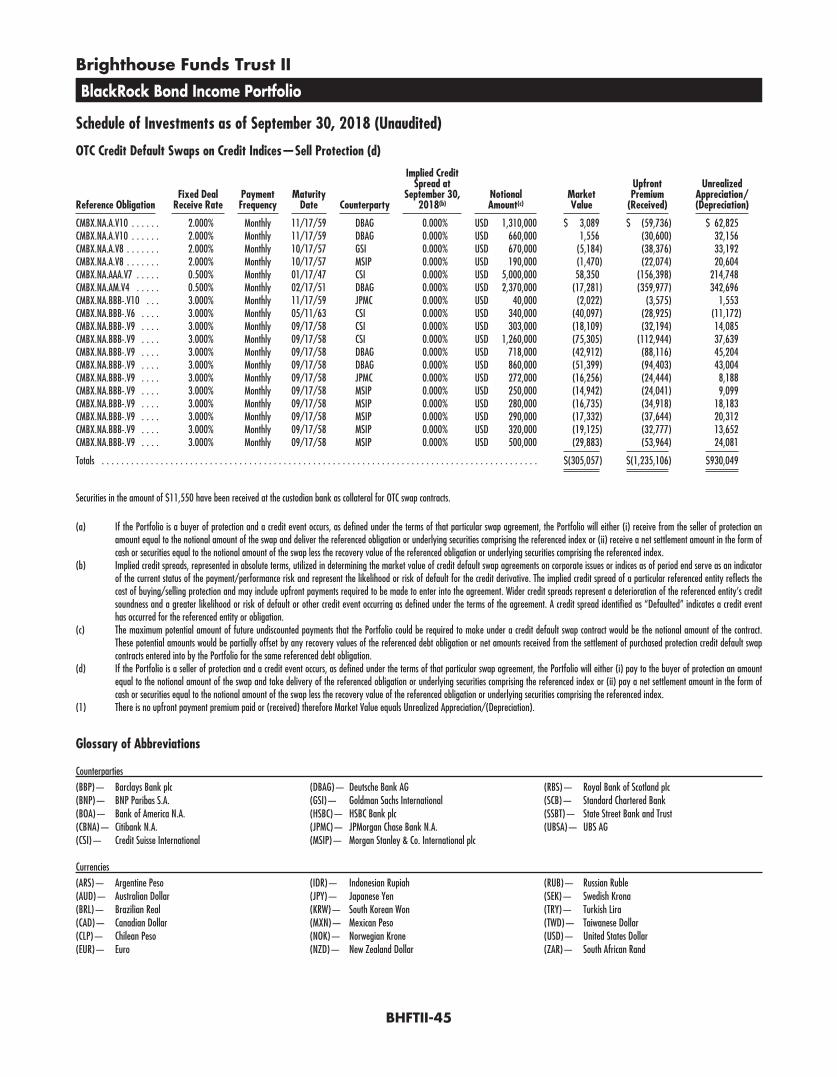
Brighthouse Funds Trust II
BlackRock Bond Income Portfolio
Schedule of Investments as of September 30, 2018 (Unaudited)
OTC Credit Default Swaps on Credit Indices—Sell Protection (d)
Reference ObligationFixed Deal
Receive RatePaymentFrequency
MaturityDate Counterparty
Implied CreditSpread at
September 30,2018(b)
NotionalAmount(c)
MarketValue
UpfrontPremium
(Received)
UnrealizedAppreciation/(Depreciation)
CMBX.NA.A.V10 . . . . . . 2.000% Monthly 11/17/59 DBAG 0.000% USD 1,310,000 $ 3,089 $ (59,736) $ 62,825CMBX.NA.A.V10 . . . . . . 2.000% Monthly 11/17/59 DBAG 0.000% USD 660,000 1,556 (30,600) 32,156CMBX.NA.A.V8 . . . . . . . 2.000% Monthly 10/17/57 GSI 0.000% USD 670,000 (5,184) (38,376) 33,192CMBX.NA.A.V8 . . . . . . . 2.000% Monthly 10/17/57 MSIP 0.000% USD 190,000 (1,470) (22,074) 20,604CMBX.NA.AAA.V7 . . . . . 0.500% Monthly 01/17/47 CSI 0.000% USD 5,000,000 58,350 (156,398) 214,748CMBX.NA.AM.V4 . . . . . 0.500% Monthly 02/17/51 DBAG 0.000% USD 2,370,000 (17,281) (359,977) 342,696CMBX.NA.BBB-.V10 . . . 3.000% Monthly 11/17/59 JPMC 0.000% USD 40,000 (2,022) (3,575) 1,553CMBX.NA.BBB-.V6 . . . . 3.000% Monthly 05/11/63 CSI 0.000% USD 340,000 (40,097) (28,925) (11,172)CMBX.NA.BBB-.V9 . . . . 3.000% Monthly 09/17/58 CSI 0.000% USD 303,000 (18,109) (32,194) 14,085CMBX.NA.BBB-.V9 . . . . 3.000% Monthly 09/17/58 CSI 0.000% USD 1,260,000 (75,305) (112,944) 37,639CMBX.NA.BBB-.V9 . . . . 3.000% Monthly 09/17/58 DBAG 0.000% USD 718,000 (42,912) (88,116) 45,204CMBX.NA.BBB-.V9 . . . . 3.000% Monthly 09/17/58 DBAG 0.000% USD 860,000 (51,399) (94,403) 43,004CMBX.NA.BBB-.V9 . . . . 3.000% Monthly 09/17/58 JPMC 0.000% USD 272,000 (16,256) (24,444) 8,188CMBX.NA.BBB-.V9 . . . . 3.000% Monthly 09/17/58 MSIP 0.000% USD 250,000 (14,942) (24,041) 9,099CMBX.NA.BBB-.V9 . . . . 3.000% Monthly 09/17/58 MSIP 0.000% USD 280,000 (16,735) (34,918) 18,183CMBX.NA.BBB-.V9 . . . . 3.000% Monthly 09/17/58 MSIP 0.000% USD 290,000 (17,332) (37,644) 20,312CMBX.NA.BBB-.V9 . . . . 3.000% Monthly 09/17/58 MSIP 0.000% USD 320,000 (19,125) (32,777) 13,652CMBX.NA.BBB-.V9 . . . . 3.000% Monthly 09/17/58 MSIP 0.000% USD 500,000 (29,883) (53,964) 24,081
Totals . . . . . . . . . . . . . . . . . . . . . . . . . . . . . . . . . . . . . . . . . . . . . . . . . . . . . . . . . . . . . . . . . . . . . . . . . . . . . . . . . . . . . . . . . $(305,057) $(1,235,106) $930,049
Securities in the amount of $11,550 have been received at the custodian bank as collateral for OTC swap contracts.
(a) If the Portfolio is a buyer of protection and a credit event occurs, as defined under the terms of that particular swap agreement, the Portfolio will either (i) receive from the seller of protection anamount equal to the notional amount of the swap and deliver the referenced obligation or underlying securities comprising the referenced index or (ii) receive a net settlement amount in the form ofcash or securities equal to the notional amount of the swap less the recovery value of the referenced obligation or underlying securities comprising the referenced index.
(b) Implied credit spreads, represented in absolute terms, utilized in determining the market value of credit default swap agreements on corporate issues or indices as of period end serve as an indicatorof the current status of the payment/performance risk and represent the likelihood or risk of default for the credit derivative. The implied credit spread of a particular referenced entity reflects thecost of buying/selling protection and may include upfront payments required to be made to enter into the agreement. Wider credit spreads represent a deterioration of the referenced entity’s creditsoundness and a greater likelihood or risk of default or other credit event occurring as defined under the terms of the agreement. A credit spread identified as “Defaulted” indicates a credit eventhas occurred for the referenced entity or obligation.
(c) The maximum potential amount of future undiscounted payments that the Portfolio could be required to make under a credit default swap contract would be the notional amount of the contract.These potential amounts would be partially offset by any recovery values of the referenced debt obligation or net amounts received from the settlement of purchased protection credit default swapcontracts entered into by the Portfolio for the same referenced debt obligation.
(d) If the Portfolio is a seller of protection and a credit event occurs, as defined under the terms of that particular swap agreement, the Portfolio will either (i) pay to the buyer of protection an amountequal to the notional amount of the swap and take delivery of the referenced obligation or underlying securities comprising the referenced index or (ii) pay a net settlement amount in the form ofcash or securities equal to the notional amount of the swap less the recovery value of the referenced obligation or underlying securities comprising the referenced index.
(1) There is no upfront payment premium paid or (received) therefore Market Value equals Unrealized Appreciation/(Depreciation).
Glossary of Abbreviations
Counterparties
(BBP)— Barclays Bank plc(BNP)— BNP Paribas S.A.(BOA)— Bank of America N.A.(CBNA)— Citibank N.A.(CSI)— Credit Suisse International
(DBAG)— Deutsche Bank AG(GSI)— Goldman Sachs International(HSBC)— HSBC Bank plc(JPMC)— JPMorgan Chase Bank N.A.(MSIP)— Morgan Stanley & Co. International plc
(RBS)— Royal Bank of Scotland plc(SCB)— Standard Chartered Bank(SSBT)— State Street Bank and Trust(UBSA)— UBS AG
Currencies
(ARS)— Argentine Peso(AUD)— Australian Dollar(BRL)— Brazilian Real(CAD)— Canadian Dollar(CLP)— Chilean Peso(EUR)— Euro
(IDR)— Indonesian Rupiah(JPY)— Japanese Yen(KRW)— South Korean Won(MXN)— Mexican Peso(NOK)— Norwegian Krone(NZD)— New Zealand Dollar
(RUB)— Russian Ruble(SEK)— Swedish Krona(TRY)— Turkish Lira(TWD)— Taiwanese Dollar(USD)— United States Dollar(ZAR)— South African Rand
BHFTII-45
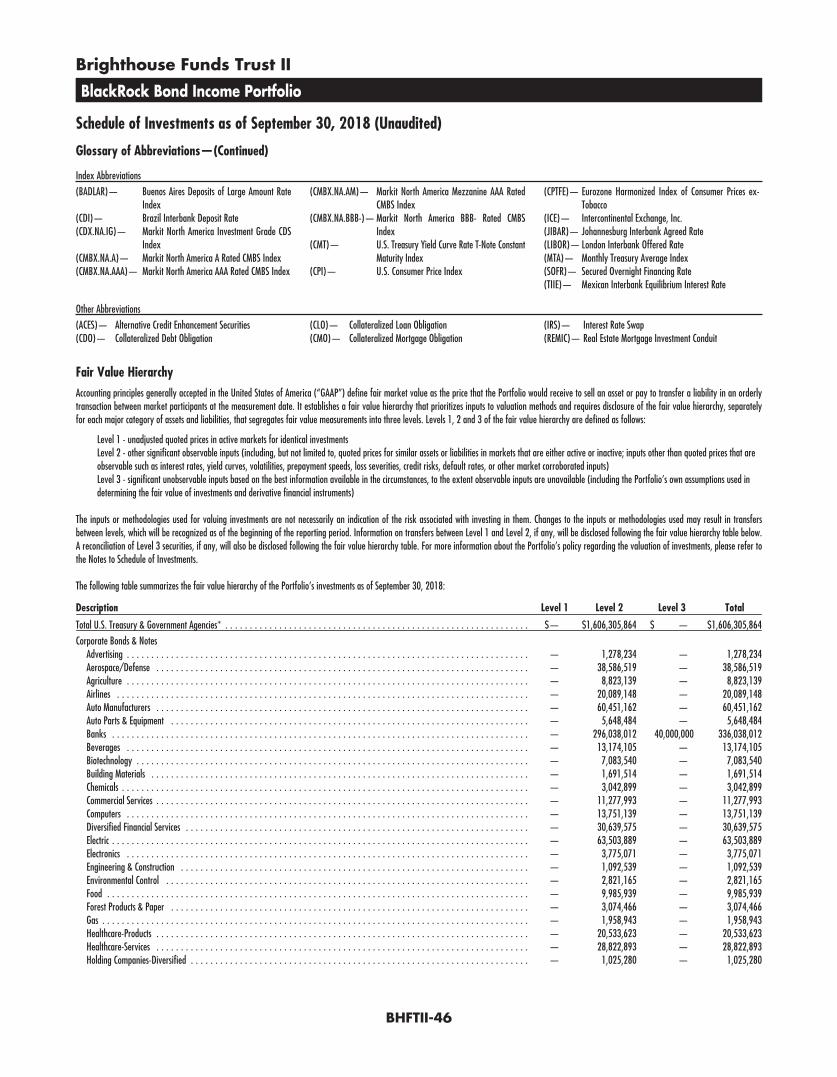
Brighthouse Funds Trust II
BlackRock Bond Income Portfolio
Schedule of Investments as of September 30, 2018 (Unaudited)
Glossary of Abbreviations—(Continued)
Index Abbreviations
(BADLAR)— Buenos Aires Deposits of Large Amount RateIndex
(CDI)— Brazil Interbank Deposit Rate(CDX.NA.IG)— Markit North America Investment Grade CDS
Index(CMBX.NA.A)— Markit North America A Rated CMBS Index(CMBX.NA.AAA)— Markit North America AAA Rated CMBS Index
(CMBX.NA.AM)— Markit North America Mezzanine AAA RatedCMBS Index
(CMBX.NA.BBB-)— Markit North America BBB- Rated CMBSIndex
(CMT)— U.S. Treasury Yield Curve Rate T-Note ConstantMaturity Index
(CPI)— U.S. Consumer Price Index
(CPTFE)— Eurozone Harmonized Index of Consumer Prices ex-Tobacco
(ICE)— Intercontinental Exchange, Inc.(JIBAR)— Johannesburg Interbank Agreed Rate(LIBOR)— London Interbank Offered Rate(MTA)— Monthly Treasury Average Index(SOFR)— Secured Overnight Financing Rate(TIIE)— Mexican Interbank Equilibrium Interest Rate
Other Abbreviations
(ACES)— Alternative Credit Enhancement Securities(CDO)— Collateralized Debt Obligation
(CLO)— Collateralized Loan Obligation(CMO)— Collateralized Mortgage Obligation
(IRS)— Interest Rate Swap(REMIC)— Real Estate Mortgage Investment Conduit
Fair Value HierarchyAccounting principles generally accepted in the United States of America (“GAAP”) define fair market value as the price that the Portfolio would receive to sell an asset or pay to transfer a liability in an orderlytransaction between market participants at the measurement date. It establishes a fair value hierarchy that prioritizes inputs to valuation methods and requires disclosure of the fair value hierarchy, separatelyfor each major category of assets and liabilities, that segregates fair value measurements into three levels. Levels 1, 2 and 3 of the fair value hierarchy are defined as follows:
Level 1 - unadjusted quoted prices in active markets for identical investmentsLevel 2 - other significant observable inputs (including, but not limited to, quoted prices for similar assets or liabilities in markets that are either active or inactive; inputs other than quoted prices that areobservable such as interest rates, yield curves, volatilities, prepayment speeds, loss severities, credit risks, default rates, or other market corroborated inputs)Level 3 - significant unobservable inputs based on the best information available in the circumstances, to the extent observable inputs are unavailable (including the Portfolio’s own assumptions used indetermining the fair value of investments and derivative financial instruments)
The inputs or methodologies used for valuing investments are not necessarily an indication of the risk associated with investing in them. Changes to the inputs or methodologies used may result in transfersbetween levels, which will be recognized as of the beginning of the reporting period. Information on transfers between Level 1 and Level 2, if any, will be disclosed following the fair value hierarchy table below.A reconciliation of Level 3 securities, if any, will also be disclosed following the fair value hierarchy table. For more information about the Portfolio’s policy regarding the valuation of investments, please refer tothe Notes to Schedule of Investments.
The following table summarizes the fair value hierarchy of the Portfolio’s investments as of September 30, 2018:
Description Level 1 Level 2 Level 3 Total
Total U.S. Treasury & Government Agencies* . . . . . . . . . . . . . . . . . . . . . . . . . . . . . . . . . . . . . . . . . . . . . . . . . . . . . . . . . . . . . . $— $1,606,305,864 $ — $1,606,305,864
Corporate Bonds & NotesAdvertising . . . . . . . . . . . . . . . . . . . . . . . . . . . . . . . . . . . . . . . . . . . . . . . . . . . . . . . . . . . . . . . . . . . . . . . . . . . . . . . . . . — 1,278,234 — 1,278,234Aerospace/Defense . . . . . . . . . . . . . . . . . . . . . . . . . . . . . . . . . . . . . . . . . . . . . . . . . . . . . . . . . . . . . . . . . . . . . . . . . . . . — 38,586,519 — 38,586,519Agriculture . . . . . . . . . . . . . . . . . . . . . . . . . . . . . . . . . . . . . . . . . . . . . . . . . . . . . . . . . . . . . . . . . . . . . . . . . . . . . . . . . . — 8,823,139 — 8,823,139Airlines . . . . . . . . . . . . . . . . . . . . . . . . . . . . . . . . . . . . . . . . . . . . . . . . . . . . . . . . . . . . . . . . . . . . . . . . . . . . . . . . . . . . — 20,089,148 — 20,089,148Auto Manufacturers . . . . . . . . . . . . . . . . . . . . . . . . . . . . . . . . . . . . . . . . . . . . . . . . . . . . . . . . . . . . . . . . . . . . . . . . . . . . — 60,451,162 — 60,451,162Auto Parts & Equipment . . . . . . . . . . . . . . . . . . . . . . . . . . . . . . . . . . . . . . . . . . . . . . . . . . . . . . . . . . . . . . . . . . . . . . . . . — 5,648,484 — 5,648,484Banks . . . . . . . . . . . . . . . . . . . . . . . . . . . . . . . . . . . . . . . . . . . . . . . . . . . . . . . . . . . . . . . . . . . . . . . . . . . . . . . . . . . . . — 296,038,012 40,000,000 336,038,012Beverages . . . . . . . . . . . . . . . . . . . . . . . . . . . . . . . . . . . . . . . . . . . . . . . . . . . . . . . . . . . . . . . . . . . . . . . . . . . . . . . . . . — 13,174,105 — 13,174,105Biotechnology . . . . . . . . . . . . . . . . . . . . . . . . . . . . . . . . . . . . . . . . . . . . . . . . . . . . . . . . . . . . . . . . . . . . . . . . . . . . . . . . — 7,083,540 — 7,083,540Building Materials . . . . . . . . . . . . . . . . . . . . . . . . . . . . . . . . . . . . . . . . . . . . . . . . . . . . . . . . . . . . . . . . . . . . . . . . . . . . . — 1,691,514 — 1,691,514Chemicals . . . . . . . . . . . . . . . . . . . . . . . . . . . . . . . . . . . . . . . . . . . . . . . . . . . . . . . . . . . . . . . . . . . . . . . . . . . . . . . . . . . — 3,042,899 — 3,042,899Commercial Services . . . . . . . . . . . . . . . . . . . . . . . . . . . . . . . . . . . . . . . . . . . . . . . . . . . . . . . . . . . . . . . . . . . . . . . . . . . . — 11,277,993 — 11,277,993Computers . . . . . . . . . . . . . . . . . . . . . . . . . . . . . . . . . . . . . . . . . . . . . . . . . . . . . . . . . . . . . . . . . . . . . . . . . . . . . . . . . . — 13,751,139 — 13,751,139Diversified Financial Services . . . . . . . . . . . . . . . . . . . . . . . . . . . . . . . . . . . . . . . . . . . . . . . . . . . . . . . . . . . . . . . . . . . . . . — 30,639,575 — 30,639,575Electric . . . . . . . . . . . . . . . . . . . . . . . . . . . . . . . . . . . . . . . . . . . . . . . . . . . . . . . . . . . . . . . . . . . . . . . . . . . . . . . . . . . . . — 63,503,889 — 63,503,889Electronics . . . . . . . . . . . . . . . . . . . . . . . . . . . . . . . . . . . . . . . . . . . . . . . . . . . . . . . . . . . . . . . . . . . . . . . . . . . . . . . . . . — 3,775,071 — 3,775,071Engineering & Construction . . . . . . . . . . . . . . . . . . . . . . . . . . . . . . . . . . . . . . . . . . . . . . . . . . . . . . . . . . . . . . . . . . . . . . . — 1,092,539 — 1,092,539Environmental Control . . . . . . . . . . . . . . . . . . . . . . . . . . . . . . . . . . . . . . . . . . . . . . . . . . . . . . . . . . . . . . . . . . . . . . . . . . — 2,821,165 — 2,821,165Food . . . . . . . . . . . . . . . . . . . . . . . . . . . . . . . . . . . . . . . . . . . . . . . . . . . . . . . . . . . . . . . . . . . . . . . . . . . . . . . . . . . . . . — 9,985,939 — 9,985,939Forest Products & Paper . . . . . . . . . . . . . . . . . . . . . . . . . . . . . . . . . . . . . . . . . . . . . . . . . . . . . . . . . . . . . . . . . . . . . . . . . — 3,074,466 — 3,074,466Gas . . . . . . . . . . . . . . . . . . . . . . . . . . . . . . . . . . . . . . . . . . . . . . . . . . . . . . . . . . . . . . . . . . . . . . . . . . . . . . . . . . . . . . . — 1,958,943 — 1,958,943Healthcare-Products . . . . . . . . . . . . . . . . . . . . . . . . . . . . . . . . . . . . . . . . . . . . . . . . . . . . . . . . . . . . . . . . . . . . . . . . . . . . — 20,533,623 — 20,533,623Healthcare-Services . . . . . . . . . . . . . . . . . . . . . . . . . . . . . . . . . . . . . . . . . . . . . . . . . . . . . . . . . . . . . . . . . . . . . . . . . . . . — 28,822,893 — 28,822,893Holding Companies-Diversified . . . . . . . . . . . . . . . . . . . . . . . . . . . . . . . . . . . . . . . . . . . . . . . . . . . . . . . . . . . . . . . . . . . . . — 1,025,280 — 1,025,280
BHFTII-46

Brighthouse Funds Trust II
BlackRock Bond Income Portfolio
Schedule of Investments as of September 30, 2018 (Unaudited)
Fair Value Hierarchy—(Continued)Description Level 1 Level 2 Level 3 Total
Housewares . . . . . . . . . . . . . . . . . . . . . . . . . . . . . . . . . . . . . . . . . . . . . . . . . . . . . . . . . . . . . . . . . . . . . . . . . . . . . . . . $ — $ 904,359 $ — $ 904,359Insurance . . . . . . . . . . . . . . . . . . . . . . . . . . . . . . . . . . . . . . . . . . . . . . . . . . . . . . . . . . . . . . . . . . . . . . . . . . . . . . . . . . — 8,339,326 — 8,339,326Iron/Steel . . . . . . . . . . . . . . . . . . . . . . . . . . . . . . . . . . . . . . . . . . . . . . . . . . . . . . . . . . . . . . . . . . . . . . . . . . . . . . . . . — 2,146,774 — 2,146,774Media . . . . . . . . . . . . . . . . . . . . . . . . . . . . . . . . . . . . . . . . . . . . . . . . . . . . . . . . . . . . . . . . . . . . . . . . . . . . . . . . . . . . — 48,942,671 — 48,942,671Mining . . . . . . . . . . . . . . . . . . . . . . . . . . . . . . . . . . . . . . . . . . . . . . . . . . . . . . . . . . . . . . . . . . . . . . . . . . . . . . . . . . . . — 6,383,880 — 6,383,880Miscellaneous Manufacturing . . . . . . . . . . . . . . . . . . . . . . . . . . . . . . . . . . . . . . . . . . . . . . . . . . . . . . . . . . . . . . . . . . . . . — 2,206,548 — 2,206,548Office/Business Equipment . . . . . . . . . . . . . . . . . . . . . . . . . . . . . . . . . . . . . . . . . . . . . . . . . . . . . . . . . . . . . . . . . . . . . . — 585,449 — 585,449Oil & Gas . . . . . . . . . . . . . . . . . . . . . . . . . . . . . . . . . . . . . . . . . . . . . . . . . . . . . . . . . . . . . . . . . . . . . . . . . . . . . . . . . . — 49,409,725 — 49,409,725Oil & Gas Services . . . . . . . . . . . . . . . . . . . . . . . . . . . . . . . . . . . . . . . . . . . . . . . . . . . . . . . . . . . . . . . . . . . . . . . . . . . . — 7,642,809 — 7,642,809Packaging & Containers . . . . . . . . . . . . . . . . . . . . . . . . . . . . . . . . . . . . . . . . . . . . . . . . . . . . . . . . . . . . . . . . . . . . . . . . — 2,195,659 — 2,195,659Pharmaceuticals . . . . . . . . . . . . . . . . . . . . . . . . . . . . . . . . . . . . . . . . . . . . . . . . . . . . . . . . . . . . . . . . . . . . . . . . . . . . . — 39,708,667 — 39,708,667Pipelines . . . . . . . . . . . . . . . . . . . . . . . . . . . . . . . . . . . . . . . . . . . . . . . . . . . . . . . . . . . . . . . . . . . . . . . . . . . . . . . . . . — 64,744,487 — 64,744,487Real Estate Investment Trusts . . . . . . . . . . . . . . . . . . . . . . . . . . . . . . . . . . . . . . . . . . . . . . . . . . . . . . . . . . . . . . . . . . . . . — 10,957,382 — 10,957,382Retail . . . . . . . . . . . . . . . . . . . . . . . . . . . . . . . . . . . . . . . . . . . . . . . . . . . . . . . . . . . . . . . . . . . . . . . . . . . . . . . . . . . . — 9,801,999 — 9,801,999Semiconductors . . . . . . . . . . . . . . . . . . . . . . . . . . . . . . . . . . . . . . . . . . . . . . . . . . . . . . . . . . . . . . . . . . . . . . . . . . . . . . — 30,550,856 — 30,550,856Software . . . . . . . . . . . . . . . . . . . . . . . . . . . . . . . . . . . . . . . . . . . . . . . . . . . . . . . . . . . . . . . . . . . . . . . . . . . . . . . . . . — 29,076,790 — 29,076,790Telecommunications . . . . . . . . . . . . . . . . . . . . . . . . . . . . . . . . . . . . . . . . . . . . . . . . . . . . . . . . . . . . . . . . . . . . . . . . . . . — 69,811,803 — 69,811,803Transportation . . . . . . . . . . . . . . . . . . . . . . . . . . . . . . . . . . . . . . . . . . . . . . . . . . . . . . . . . . . . . . . . . . . . . . . . . . . . . . . — 14,940,603 — 14,940,603Trucking & Leasing . . . . . . . . . . . . . . . . . . . . . . . . . . . . . . . . . . . . . . . . . . . . . . . . . . . . . . . . . . . . . . . . . . . . . . . . . . . . — 4,845,175 — 4,845,175
Total Corporate Bonds & Notes* . . . . . . . . . . . . . . . . . . . . . . . . . . . . . . . . . . . . . . . . . . . . . . . . . . . . . . . . . . . . . . . . . . . . . — 1,051,364,233 40,000,000 1,091,364,233
Total Asset-Backed Securities* . . . . . . . . . . . . . . . . . . . . . . . . . . . . . . . . . . . . . . . . . . . . . . . . . . . . . . . . . . . . . . . . . . . . . . . — 456,067,699 0 456,067,699
Total Municipals* . . . . . . . . . . . . . . . . . . . . . . . . . . . . . . . . . . . . . . . . . . . . . . . . . . . . . . . . . . . . . . . . . . . . . . . . . . . . . . . — 245,899,455 — 245,899,455
Total Mortgage-Backed Securities* . . . . . . . . . . . . . . . . . . . . . . . . . . . . . . . . . . . . . . . . . . . . . . . . . . . . . . . . . . . . . . . . . . . . — 192,757,855 — 192,757,855
Total Foreign Government* . . . . . . . . . . . . . . . . . . . . . . . . . . . . . . . . . . . . . . . . . . . . . . . . . . . . . . . . . . . . . . . . . . . . . . . . — 123,655,961 — 123,655,961
Floating Rate LoansAerospace/Defense . . . . . . . . . . . . . . . . . . . . . . . . . . . . . . . . . . . . . . . . . . . . . . . . . . . . . . . . . . . . . . . . . . . . . . . . . . . — 1,907,827 — 1,907,827Building Materials . . . . . . . . . . . . . . . . . . . . . . . . . . . . . . . . . . . . . . . . . . . . . . . . . . . . . . . . . . . . . . . . . . . . . . . . . . . . — 5,904,652 — 5,904,652Commercial Services . . . . . . . . . . . . . . . . . . . . . . . . . . . . . . . . . . . . . . . . . . . . . . . . . . . . . . . . . . . . . . . . . . . . . . . . . . . — — 5,344,119 5,344,119Distribution/Wholesale . . . . . . . . . . . . . . . . . . . . . . . . . . . . . . . . . . . . . . . . . . . . . . . . . . . . . . . . . . . . . . . . . . . . . . . . . — 12,540,037 — 12,540,037Distributors . . . . . . . . . . . . . . . . . . . . . . . . . . . . . . . . . . . . . . . . . . . . . . . . . . . . . . . . . . . . . . . . . . . . . . . . . . . . . . . . . — 556,139 — 556,139Diversified Financial Services . . . . . . . . . . . . . . . . . . . . . . . . . . . . . . . . . . . . . . . . . . . . . . . . . . . . . . . . . . . . . . . . . . . . . — — 21,429,942 21,429,942Electric . . . . . . . . . . . . . . . . . . . . . . . . . . . . . . . . . . . . . . . . . . . . . . . . . . . . . . . . . . . . . . . . . . . . . . . . . . . . . . . . . . . . — 2,419,547 — 2,419,547Entertainment . . . . . . . . . . . . . . . . . . . . . . . . . . . . . . . . . . . . . . . . . . . . . . . . . . . . . . . . . . . . . . . . . . . . . . . . . . . . . . . — 6,405,619 — 6,405,619Environmental Control . . . . . . . . . . . . . . . . . . . . . . . . . . . . . . . . . . . . . . . . . . . . . . . . . . . . . . . . . . . . . . . . . . . . . . . . . — 2,266,166 — 2,266,166Holding Companies-Diversified . . . . . . . . . . . . . . . . . . . . . . . . . . . . . . . . . . . . . . . . . . . . . . . . . . . . . . . . . . . . . . . . . . . . — — 5,438,088 5,438,088Iron/Steel . . . . . . . . . . . . . . . . . . . . . . . . . . . . . . . . . . . . . . . . . . . . . . . . . . . . . . . . . . . . . . . . . . . . . . . . . . . . . . . . . — 366,525 — 366,525Lodging . . . . . . . . . . . . . . . . . . . . . . . . . . . . . . . . . . . . . . . . . . . . . . . . . . . . . . . . . . . . . . . . . . . . . . . . . . . . . . . . . . . — 2,289,934 — 2,289,934Miscellaneous Manufacturing . . . . . . . . . . . . . . . . . . . . . . . . . . . . . . . . . . . . . . . . . . . . . . . . . . . . . . . . . . . . . . . . . . . . . — 1,707,187 — 1,707,187Packaging & Containers . . . . . . . . . . . . . . . . . . . . . . . . . . . . . . . . . . . . . . . . . . . . . . . . . . . . . . . . . . . . . . . . . . . . . . . . — 2,681,389 — 2,681,389Pipelines . . . . . . . . . . . . . . . . . . . . . . . . . . . . . . . . . . . . . . . . . . . . . . . . . . . . . . . . . . . . . . . . . . . . . . . . . . . . . . . . . . — 1,105,271 — 1,105,271Real Estate Investment Trusts . . . . . . . . . . . . . . . . . . . . . . . . . . . . . . . . . . . . . . . . . . . . . . . . . . . . . . . . . . . . . . . . . . . . . — 2,686,936 — 2,686,936Retail . . . . . . . . . . . . . . . . . . . . . . . . . . . . . . . . . . . . . . . . . . . . . . . . . . . . . . . . . . . . . . . . . . . . . . . . . . . . . . . . . . . . — 2,014,508 — 2,014,508Software . . . . . . . . . . . . . . . . . . . . . . . . . . . . . . . . . . . . . . . . . . . . . . . . . . . . . . . . . . . . . . . . . . . . . . . . . . . . . . . . . . — 2,690,954 — 2,690,954Telecommunications . . . . . . . . . . . . . . . . . . . . . . . . . . . . . . . . . . . . . . . . . . . . . . . . . . . . . . . . . . . . . . . . . . . . . . . . . . . — 2,698,024 — 2,698,024Transportation . . . . . . . . . . . . . . . . . . . . . . . . . . . . . . . . . . . . . . . . . . . . . . . . . . . . . . . . . . . . . . . . . . . . . . . . . . . . . . . — 1,714,674 — 1,714,674
Total Floating Rate Loans . . . . . . . . . . . . . . . . . . . . . . . . . . . . . . . . . . . . . . . . . . . . . . . . . . . . . . . . . . . . . . . . . . . . . . . . . . — 51,955,389 32,212,149 84,167,538
Total Escrow Shares* . . . . . . . . . . . . . . . . . . . . . . . . . . . . . . . . . . . . . . . . . . . . . . . . . . . . . . . . . . . . . . . . . . . . . . . . . . . . . — — 1 1
Total Short-Term Investments* . . . . . . . . . . . . . . . . . . . . . . . . . . . . . . . . . . . . . . . . . . . . . . . . . . . . . . . . . . . . . . . . . . . . . . — 220,608,175 — 220,608,175
Total Securities Lending Reinvestments* . . . . . . . . . . . . . . . . . . . . . . . . . . . . . . . . . . . . . . . . . . . . . . . . . . . . . . . . . . . . . . . . — 125,037,395 — 125,037,395
Purchased OptionsForeign Currency Options at Value . . . . . . . . . . . . . . . . . . . . . . . . . . . . . . . . . . . . . . . . . . . . . . . . . . . . . . . . . . . . . . . . . . — 786,825 — 786,825Interest Rate Swaptions at Value . . . . . . . . . . . . . . . . . . . . . . . . . . . . . . . . . . . . . . . . . . . . . . . . . . . . . . . . . . . . . . . . . . . — 5,011,416 — 5,011,416Options on Exchange-Traded Futures Contracts at Value . . . . . . . . . . . . . . . . . . . . . . . . . . . . . . . . . . . . . . . . . . . . . . . . . . . . 350,219 — — 350,219
Total Purchased Options . . . . . . . . . . . . . . . . . . . . . . . . . . . . . . . . . . . . . . . . . . . . . . . . . . . . . . . . . . . . . . . . . . . . . . . . . . $350,219 $ 5,798,241 $ — $ 6,148,460
Total Investments . . . . . . . . . . . . . . . . . . . . . . . . . . . . . . . . . . . . . . . . . . . . . . . . . . . . . . . . . . . . . . . . . . . . . . . . . . . . . . . $350,219 $4,079,450,267 $72,212,150 $4,152,012,636
BHFTII-47

Brighthouse Funds Trust II
BlackRock Bond Income Portfolio
Schedule of Investments as of September 30, 2018 (Unaudited)
Fair Value Hierarchy—(Continued)Description Level 1 Level 2 Level 3 Total
Collateral for Securities Loaned (Liability) . . . . . . . . . . . . . . . . . . . . . . . . . . . . . . . . . . . . . . . . . . . . . . . . . . . . . . . . . . . . . . . . . $ — $(124,989,809) $— $(124,989,809)
TBA Forward Sales Commitments . . . . . . . . . . . . . . . . . . . . . . . . . . . . . . . . . . . . . . . . . . . . . . . . . . . . . . . . . . . . . . . . . . . . . . . $ — $(191,312,690) $— $(191,312,690)
Forward ContractsForward Foreign Currency Exchange Contracts (Unrealized Appreciation) . . . . . . . . . . . . . . . . . . . . . . . . . . . . . . . . . . . . . . . . . . $ — $ 2,303,588 $— $ 2,303,588Forward Foreign Currency Exchange Contracts (Unrealized Depreciation) . . . . . . . . . . . . . . . . . . . . . . . . . . . . . . . . . . . . . . . . . . — (1,435,704) — (1,435,704)
Total Forward Contracts . . . . . . . . . . . . . . . . . . . . . . . . . . . . . . . . . . . . . . . . . . . . . . . . . . . . . . . . . . . . . . . . . . . . . . . . . . . . . $ — $ 867,884 $— $ 867,884
Futures ContractsFutures Contracts (Unrealized Appreciation) . . . . . . . . . . . . . . . . . . . . . . . . . . . . . . . . . . . . . . . . . . . . . . . . . . . . . . . . . . . . . $ 1,541,732 $ — $— $ 1,541,732Futures Contracts (Unrealized Depreciation) . . . . . . . . . . . . . . . . . . . . . . . . . . . . . . . . . . . . . . . . . . . . . . . . . . . . . . . . . . . . . (14,361,132) — — (14,361,132)
Total Futures Contracts . . . . . . . . . . . . . . . . . . . . . . . . . . . . . . . . . . . . . . . . . . . . . . . . . . . . . . . . . . . . . . . . . . . . . . . . . . . . . $(12,819,400) $ — $— $ (12,819,400)
Written OptionsForeign Currency Options at Value . . . . . . . . . . . . . . . . . . . . . . . . . . . . . . . . . . . . . . . . . . . . . . . . . . . . . . . . . . . . . . . . . . . . $ — $ (456,415) $— $ (456,415)Forward Volatility Agreements at Value . . . . . . . . . . . . . . . . . . . . . . . . . . . . . . . . . . . . . . . . . . . . . . . . . . . . . . . . . . . . . . . . — (166,606) — (166,606)Interest Rate Swaptions at Value . . . . . . . . . . . . . . . . . . . . . . . . . . . . . . . . . . . . . . . . . . . . . . . . . . . . . . . . . . . . . . . . . . . . . — (398,399) — (398,399)Options on Exchange-Traded Futures Contracts at Value . . . . . . . . . . . . . . . . . . . . . . . . . . . . . . . . . . . . . . . . . . . . . . . . . . . . . . (427,387) — — (427,387)
Total Written Options . . . . . . . . . . . . . . . . . . . . . . . . . . . . . . . . . . . . . . . . . . . . . . . . . . . . . . . . . . . . . . . . . . . . . . . . . . . . . . $ (427,387) $ (1,021,420) $— $ (1,448,807)
Centrally Cleared Swap ContractsCentrally Cleared Swap Contracts (Unrealized Appreciation) . . . . . . . . . . . . . . . . . . . . . . . . . . . . . . . . . . . . . . . . . . . . . . . . . . . $ — $ 635,484 $— $ 635,484Centrally Cleared Swap Contracts (Unrealized Depreciation) . . . . . . . . . . . . . . . . . . . . . . . . . . . . . . . . . . . . . . . . . . . . . . . . . . . — (328,541) — (328,541)
Total Centrally Cleared Swap Contracts . . . . . . . . . . . . . . . . . . . . . . . . . . . . . . . . . . . . . . . . . . . . . . . . . . . . . . . . . . . . . . . . . . . $ — $ 306,943 $— $ 306,943
OTC Swap ContractsOTC Swap Contracts at Value (Assets) . . . . . . . . . . . . . . . . . . . . . . . . . . . . . . . . . . . . . . . . . . . . . . . . . . . . . . . . . . . . . . . . . . $ — $ 1,913,274 $— $ 1,913,274OTC Swap Contracts at Value (Liabilities) . . . . . . . . . . . . . . . . . . . . . . . . . . . . . . . . . . . . . . . . . . . . . . . . . . . . . . . . . . . . . . . . — (1,111,131) — (1,111,131)
Total OTC Swap Contracts . . . . . . . . . . . . . . . . . . . . . . . . . . . . . . . . . . . . . . . . . . . . . . . . . . . . . . . . . . . . . . . . . . . . . . . . . . . . $ — $ 802,143 $— $ 802,143
* See Schedule of Investments for additional detailed categorizations.
Transfers from Level 3 to Level 2 in the amount of $930,082 were due to the resumption of trading activity which resulted in the availability of significant observable inputs.
Following is a reconciliation of Level 3 assets for which significant unobservable inputs were used to determine fair value:
Investments in Securities
Balance as ofDecember 31,
2017
RealizedGain/
(Loss)
Change inUnrealized
(Depreciation) Purchases Sales
Transfersout ofLevel 3
Balanceas of
September 30,2018
Change inUnrealized
(Depreciation)from Investments
Still Held atSeptember 30,
2018
Asset-Backed SecuritiesAsset-Backed - Other . . . . . . . . . . . . . . . . . . . . . . . . . . . . $ — $ — $(32,654) $ 32,654 $ — $ — $ 0 $(32,654)
Corporate Bonds & NotesBanks . . . . . . . . . . . . . . . . . . . . . . . . . . . . . . . . . . . . . . — — — 40,000,000 — — 40,000,000 —
Mortgage-Backed SecuritiesCommercial Mortgage-Backed Securities . . . . . . . . . . . . . . . 930,082 — — — — (930,082) — —
Floating Rate LoansCommercial Services . . . . . . . . . . . . . . . . . . . . . . . . . . . . — — — 5,492,000 (147,881) — 5,344,119 —Diversified Financial Services . . . . . . . . . . . . . . . . . . . . . . . — 9,720 (6,677) 23,312,742 (1,885,843) — 21,429,942 (6,677)Holding Companies-Diversified . . . . . . . . . . . . . . . . . . . . . — — — 6,081,065 (642,977) — 5,438,088 —
Escrow Shares . . . . . . . . . . . . . . . . . . . . . . . . . . . . . . . . . . . 1 — — — — — 1 —
Total . . . . . . . . . . . . . . . . . . . . . . . . . . . . . . . . . . . . . . . . . $930,083 $9,720 $(39,331) $74,918,461 $(2,676,701) $(930,082) $72,212,150 $(39,331)
BHFTII-48
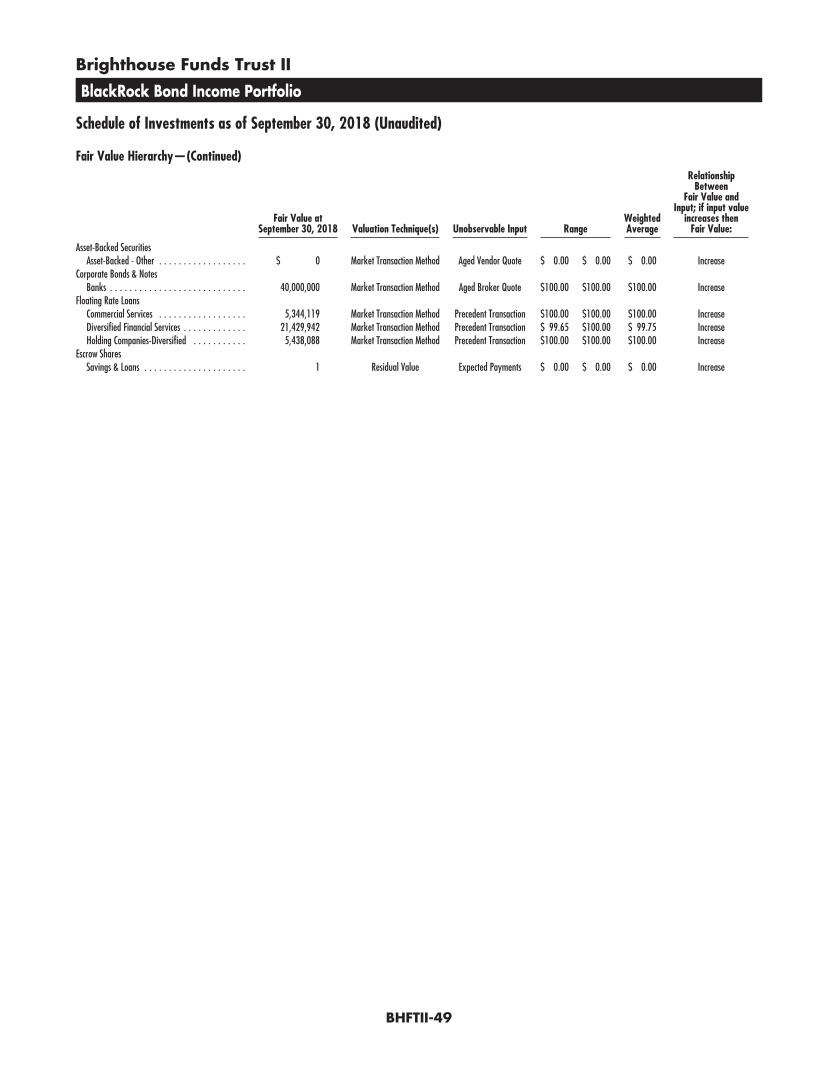
Brighthouse Funds Trust II
BlackRock Bond Income Portfolio
Schedule of Investments as of September 30, 2018 (Unaudited)
Fair Value Hierarchy—(Continued)
Fair Value atSeptember 30, 2018 Valuation Technique(s) Unobservable Input Range
WeightedAverage
RelationshipBetween
Fair Value andInput; if input value
increases thenFair Value:
Asset-Backed SecuritiesAsset-Backed - Other . . . . . . . . . . . . . . . . . . $ 0 Market Transaction Method Aged Vendor Quote $ 0.00 $ 0.00 $ 0.00 Increase
Corporate Bonds & NotesBanks . . . . . . . . . . . . . . . . . . . . . . . . . . . . 40,000,000 Market Transaction Method Aged Broker Quote $100.00 $100.00 $100.00 Increase
Floating Rate LoansCommercial Services . . . . . . . . . . . . . . . . . . 5,344,119 Market Transaction Method Precedent Transaction $100.00 $100.00 $100.00 IncreaseDiversified Financial Services . . . . . . . . . . . . . 21,429,942 Market Transaction Method Precedent Transaction $ 99.65 $100.00 $ 99.75 IncreaseHolding Companies-Diversified . . . . . . . . . . . 5,438,088 Market Transaction Method Precedent Transaction $100.00 $100.00 $100.00 Increase
Escrow SharesSavings & Loans . . . . . . . . . . . . . . . . . . . . . 1 Residual Value Expected Payments $ 0.00 $ 0.00 $ 0.00 Increase
BHFTII-49
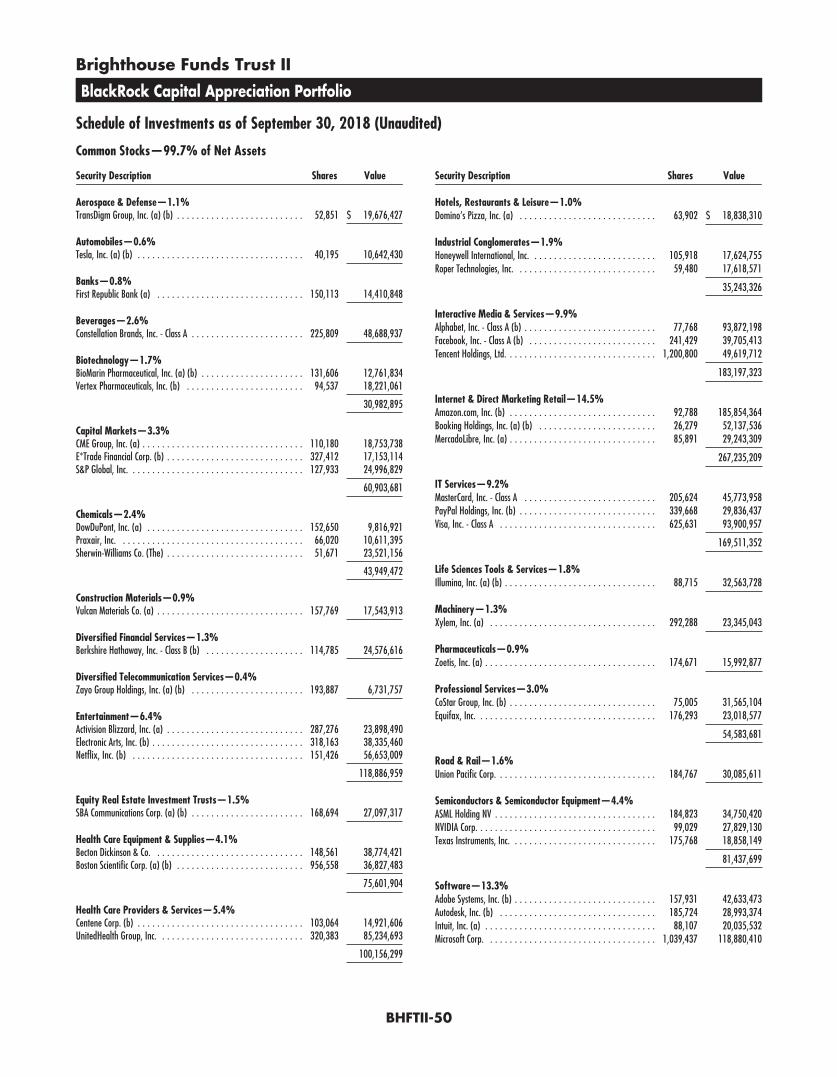
Brighthouse Funds Trust II
BlackRock Capital Appreciation Portfolio
Schedule of Investments as of September 30, 2018 (Unaudited)
Common Stocks—99.7% of Net Assets
Security Description Shares Value
Aerospace & Defense—1.1%TransDigm Group, Inc. (a) (b) . . . . . . . . . . . . . . . . . . . . . . . . . . 52,851 $ 19,676,427
Automobiles—0.6%Tesla, Inc. (a) (b) . . . . . . . . . . . . . . . . . . . . . . . . . . . . . . . . . . 40,195 10,642,430
Banks—0.8%First Republic Bank (a) . . . . . . . . . . . . . . . . . . . . . . . . . . . . . . 150,113 14,410,848
Beverages—2.6%Constellation Brands, Inc. - Class A . . . . . . . . . . . . . . . . . . . . . . . 225,809 48,688,937
Biotechnology—1.7%BioMarin Pharmaceutical, Inc. (a) (b) . . . . . . . . . . . . . . . . . . . . . 131,606 12,761,834Vertex Pharmaceuticals, Inc. (b) . . . . . . . . . . . . . . . . . . . . . . . . 94,537 18,221,061
30,982,895
Capital Markets—3.3%CME Group, Inc. (a) . . . . . . . . . . . . . . . . . . . . . . . . . . . . . . . . . 110,180 18,753,738E*Trade Financial Corp. (b) . . . . . . . . . . . . . . . . . . . . . . . . . . . . 327,412 17,153,114S&P Global, Inc. . . . . . . . . . . . . . . . . . . . . . . . . . . . . . . . . . . . 127,933 24,996,829
60,903,681
Chemicals—2.4%DowDuPont, Inc. (a) . . . . . . . . . . . . . . . . . . . . . . . . . . . . . . . . 152,650 9,816,921Praxair, Inc. . . . . . . . . . . . . . . . . . . . . . . . . . . . . . . . . . . . . . 66,020 10,611,395Sherwin-Williams Co. (The) . . . . . . . . . . . . . . . . . . . . . . . . . . . . 51,671 23,521,156
43,949,472
Construction Materials—0.9%Vulcan Materials Co. (a) . . . . . . . . . . . . . . . . . . . . . . . . . . . . . . 157,769 17,543,913
Diversified Financial Services—1.3%Berkshire Hathaway, Inc. - Class B (b) . . . . . . . . . . . . . . . . . . . . 114,785 24,576,616
Diversified Telecommunication Services—0.4%Zayo Group Holdings, Inc. (a) (b) . . . . . . . . . . . . . . . . . . . . . . . 193,887 6,731,757
Entertainment—6.4%Activision Blizzard, Inc. (a) . . . . . . . . . . . . . . . . . . . . . . . . . . . . 287,276 23,898,490Electronic Arts, Inc. (b) . . . . . . . . . . . . . . . . . . . . . . . . . . . . . . . 318,163 38,335,460Netflix, Inc. (b) . . . . . . . . . . . . . . . . . . . . . . . . . . . . . . . . . . . 151,426 56,653,009
118,886,959
Equity Real Estate Investment Trusts—1.5%SBA Communications Corp. (a) (b) . . . . . . . . . . . . . . . . . . . . . . . 168,694 27,097,317
Health Care Equipment & Supplies—4.1%Becton Dickinson & Co. . . . . . . . . . . . . . . . . . . . . . . . . . . . . . . 148,561 38,774,421Boston Scientific Corp. (a) (b) . . . . . . . . . . . . . . . . . . . . . . . . . . 956,558 36,827,483
75,601,904
Health Care Providers & Services—5.4%Centene Corp. (b) . . . . . . . . . . . . . . . . . . . . . . . . . . . . . . . . . . 103,064 14,921,606UnitedHealth Group, Inc. . . . . . . . . . . . . . . . . . . . . . . . . . . . . . 320,383 85,234,693
100,156,299
Security Description Shares Value
Hotels, Restaurants & Leisure—1.0%Domino’s Pizza, Inc. (a) . . . . . . . . . . . . . . . . . . . . . . . . . . . . 63,902 $ 18,838,310
Industrial Conglomerates—1.9%Honeywell International, Inc. . . . . . . . . . . . . . . . . . . . . . . . . . 105,918 17,624,755Roper Technologies, Inc. . . . . . . . . . . . . . . . . . . . . . . . . . . . . 59,480 17,618,571
35,243,326
Interactive Media & Services—9.9%Alphabet, Inc. - Class A (b) . . . . . . . . . . . . . . . . . . . . . . . . . . . 77,768 93,872,198Facebook, Inc. - Class A (b) . . . . . . . . . . . . . . . . . . . . . . . . . . 241,429 39,705,413Tencent Holdings, Ltd. . . . . . . . . . . . . . . . . . . . . . . . . . . . . . . 1,200,800 49,619,712
183,197,323
Internet & Direct Marketing Retail—14.5%Amazon.com, Inc. (b) . . . . . . . . . . . . . . . . . . . . . . . . . . . . . . 92,788 185,854,364Booking Holdings, Inc. (a) (b) . . . . . . . . . . . . . . . . . . . . . . . . 26,279 52,137,536MercadoLibre, Inc. (a) . . . . . . . . . . . . . . . . . . . . . . . . . . . . . . 85,891 29,243,309
267,235,209
IT Services—9.2%MasterCard, Inc. - Class A . . . . . . . . . . . . . . . . . . . . . . . . . . . 205,624 45,773,958PayPal Holdings, Inc. (b) . . . . . . . . . . . . . . . . . . . . . . . . . . . . 339,668 29,836,437Visa, Inc. - Class A . . . . . . . . . . . . . . . . . . . . . . . . . . . . . . . . 625,631 93,900,957
169,511,352
Life Sciences Tools & Services—1.8%Illumina, Inc. (a) (b) . . . . . . . . . . . . . . . . . . . . . . . . . . . . . . . 88,715 32,563,728
Machinery—1.3%Xylem, Inc. (a) . . . . . . . . . . . . . . . . . . . . . . . . . . . . . . . . . . 292,288 23,345,043
Pharmaceuticals—0.9%Zoetis, Inc. (a) . . . . . . . . . . . . . . . . . . . . . . . . . . . . . . . . . . . 174,671 15,992,877
Professional Services—3.0%CoStar Group, Inc. (b) . . . . . . . . . . . . . . . . . . . . . . . . . . . . . . 75,005 31,565,104Equifax, Inc. . . . . . . . . . . . . . . . . . . . . . . . . . . . . . . . . . . . . 176,293 23,018,577
54,583,681
Road & Rail—1.6%Union Pacific Corp. . . . . . . . . . . . . . . . . . . . . . . . . . . . . . . . . 184,767 30,085,611
Semiconductors & Semiconductor Equipment—4.4%ASML Holding NV . . . . . . . . . . . . . . . . . . . . . . . . . . . . . . . . . 184,823 34,750,420NVIDIA Corp. . . . . . . . . . . . . . . . . . . . . . . . . . . . . . . . . . . . . 99,029 27,829,130Texas Instruments, Inc. . . . . . . . . . . . . . . . . . . . . . . . . . . . . . 175,768 18,858,149
81,437,699
Software—13.3%Adobe Systems, Inc. (b) . . . . . . . . . . . . . . . . . . . . . . . . . . . . . 157,931 42,633,473Autodesk, Inc. (b) . . . . . . . . . . . . . . . . . . . . . . . . . . . . . . . . 185,724 28,993,374Intuit, Inc. (a) . . . . . . . . . . . . . . . . . . . . . . . . . . . . . . . . . . . 88,107 20,035,532Microsoft Corp. . . . . . . . . . . . . . . . . . . . . . . . . . . . . . . . . . . 1,039,437 118,880,410
BHFTII-50
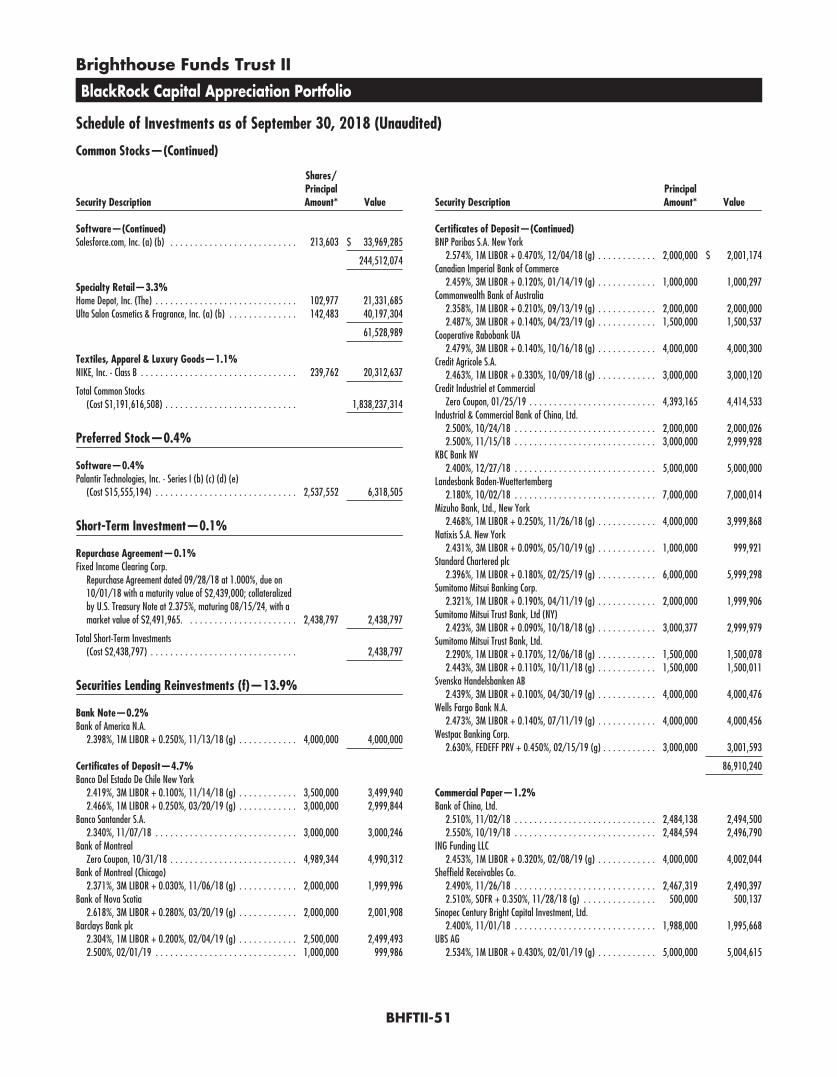
Brighthouse Funds Trust II
BlackRock Capital Appreciation Portfolio
Schedule of Investments as of September 30, 2018 (Unaudited)
Common Stocks—(Continued)
Security Description
Shares/PrincipalAmount* Value
Software—(Continued)Salesforce.com, Inc. (a) (b) . . . . . . . . . . . . . . . . . . . . . . . . . . 213,603 $ 33,969,285
244,512,074
Specialty Retail—3.3%Home Depot, Inc. (The) . . . . . . . . . . . . . . . . . . . . . . . . . . . . . 102,977 21,331,685Ulta Salon Cosmetics & Fragrance, Inc. (a) (b) . . . . . . . . . . . . . . 142,483 40,197,304
61,528,989
Textiles, Apparel & Luxury Goods—1.1%NIKE, Inc. - Class B . . . . . . . . . . . . . . . . . . . . . . . . . . . . . . . . 239,762 20,312,637
Total Common Stocks(Cost $1,191,616,508) . . . . . . . . . . . . . . . . . . . . . . . . . . . 1,838,237,314
Preferred Stock—0.4%
Software—0.4%Palantir Technologies, Inc. - Series I (b) (c) (d) (e)
(Cost $15,555,194) . . . . . . . . . . . . . . . . . . . . . . . . . . . . . 2,537,552 6,318,505
Short-Term Investment—0.1%
Repurchase Agreement—0.1%Fixed Income Clearing Corp.
Repurchase Agreement dated 09/28/18 at 1.000%, due on10/01/18 with a maturity value of $2,439,000; collateralizedby U.S. Treasury Note at 2.375%, maturing 08/15/24, with amarket value of $2,491,965. . . . . . . . . . . . . . . . . . . . . . . 2,438,797 2,438,797
Total Short-Term Investments(Cost $2,438,797) . . . . . . . . . . . . . . . . . . . . . . . . . . . . . . 2,438,797
Securities Lending Reinvestments (f)—13.9%
Bank Note—0.2%Bank of America N.A.
2.398%, 1M LIBOR + 0.250%, 11/13/18 (g) . . . . . . . . . . . . 4,000,000 4,000,000
Certificates of Deposit—4.7%Banco Del Estado De Chile New York
2.419%, 3M LIBOR + 0.100%, 11/14/18 (g) . . . . . . . . . . . . 3,500,000 3,499,9402.466%, 1M LIBOR + 0.250%, 03/20/19 (g) . . . . . . . . . . . . 3,000,000 2,999,844
Banco Santander S.A.2.340%, 11/07/18 . . . . . . . . . . . . . . . . . . . . . . . . . . . . . 3,000,000 3,000,246
Bank of MontrealZero Coupon, 10/31/18 . . . . . . . . . . . . . . . . . . . . . . . . . . 4,989,344 4,990,312
Bank of Montreal (Chicago)2.371%, 3M LIBOR + 0.030%, 11/06/18 (g) . . . . . . . . . . . . 2,000,000 1,999,996
Bank of Nova Scotia2.618%, 3M LIBOR + 0.280%, 03/20/19 (g) . . . . . . . . . . . . 2,000,000 2,001,908
Barclays Bank plc2.304%, 1M LIBOR + 0.200%, 02/04/19 (g) . . . . . . . . . . . . 2,500,000 2,499,4932.500%, 02/01/19 . . . . . . . . . . . . . . . . . . . . . . . . . . . . . 1,000,000 999,986
Security DescriptionPrincipalAmount* Value
Certificates of Deposit—(Continued)BNP Paribas S.A. New York
2.574%, 1M LIBOR + 0.470%, 12/04/18 (g) . . . . . . . . . . . . 2,000,000 $ 2,001,174Canadian Imperial Bank of Commerce
2.459%, 3M LIBOR + 0.120%, 01/14/19 (g) . . . . . . . . . . . . 1,000,000 1,000,297Commonwealth Bank of Australia
2.358%, 1M LIBOR + 0.210%, 09/13/19 (g) . . . . . . . . . . . . 2,000,000 2,000,0002.487%, 3M LIBOR + 0.140%, 04/23/19 (g) . . . . . . . . . . . . 1,500,000 1,500,537
Cooperative Rabobank UA2.479%, 3M LIBOR + 0.140%, 10/16/18 (g) . . . . . . . . . . . . 4,000,000 4,000,300
Credit Agricole S.A.2.463%, 1M LIBOR + 0.330%, 10/09/18 (g) . . . . . . . . . . . . 3,000,000 3,000,120
Credit Industriel et CommercialZero Coupon, 01/25/19 . . . . . . . . . . . . . . . . . . . . . . . . . . 4,393,165 4,414,533
Industrial & Commercial Bank of China, Ltd.2.500%, 10/24/18 . . . . . . . . . . . . . . . . . . . . . . . . . . . . . 2,000,000 2,000,0262.500%, 11/15/18 . . . . . . . . . . . . . . . . . . . . . . . . . . . . . 3,000,000 2,999,928
KBC Bank NV2.400%, 12/27/18 . . . . . . . . . . . . . . . . . . . . . . . . . . . . . 5,000,000 5,000,000
Landesbank Baden-Wuettertemberg2.180%, 10/02/18 . . . . . . . . . . . . . . . . . . . . . . . . . . . . . 7,000,000 7,000,014
Mizuho Bank, Ltd., New York2.468%, 1M LIBOR + 0.250%, 11/26/18 (g) . . . . . . . . . . . . 4,000,000 3,999,868
Natixis S.A. New York2.431%, 3M LIBOR + 0.090%, 05/10/19 (g) . . . . . . . . . . . . 1,000,000 999,921
Standard Chartered plc2.396%, 1M LIBOR + 0.180%, 02/25/19 (g) . . . . . . . . . . . . 6,000,000 5,999,298
Sumitomo Mitsui Banking Corp.2.321%, 1M LIBOR + 0.190%, 04/11/19 (g) . . . . . . . . . . . . 2,000,000 1,999,906
Sumitomo Mitsui Trust Bank, Ltd (NY)2.423%, 3M LIBOR + 0.090%, 10/18/18 (g) . . . . . . . . . . . . 3,000,377 2,999,979
Sumitomo Mitsui Trust Bank, Ltd.2.290%, 1M LIBOR + 0.170%, 12/06/18 (g) . . . . . . . . . . . . 1,500,000 1,500,0782.443%, 3M LIBOR + 0.110%, 10/11/18 (g) . . . . . . . . . . . . 1,500,000 1,500,011
Svenska Handelsbanken AB2.439%, 3M LIBOR + 0.100%, 04/30/19 (g) . . . . . . . . . . . . 4,000,000 4,000,476
Wells Fargo Bank N.A.2.473%, 3M LIBOR + 0.140%, 07/11/19 (g) . . . . . . . . . . . . 4,000,000 4,000,456
Westpac Banking Corp.2.630%, FEDEFF PRV + 0.450%, 02/15/19 (g) . . . . . . . . . . . 3,000,000 3,001,593
86,910,240
Commercial Paper—1.2%Bank of China, Ltd.
2.510%, 11/02/18 . . . . . . . . . . . . . . . . . . . . . . . . . . . . . 2,484,138 2,494,5002.550%, 10/19/18 . . . . . . . . . . . . . . . . . . . . . . . . . . . . . 2,484,594 2,496,790
ING Funding LLC2.453%, 1M LIBOR + 0.320%, 02/08/19 (g) . . . . . . . . . . . . 4,000,000 4,002,044
Sheffield Receivables Co.2.490%, 11/26/18 . . . . . . . . . . . . . . . . . . . . . . . . . . . . . 2,467,319 2,490,3972.510%, SOFR + 0.350%, 11/28/18 (g) . . . . . . . . . . . . . . . 500,000 500,137
Sinopec Century Bright Capital Investment, Ltd.2.400%, 11/01/18 . . . . . . . . . . . . . . . . . . . . . . . . . . . . . 1,988,000 1,995,668
UBS AG2.534%, 1M LIBOR + 0.430%, 02/01/19 (g) . . . . . . . . . . . . 5,000,000 5,004,615
BHFTII-51

Brighthouse Funds Trust II
BlackRock Capital Appreciation Portfolio
Schedule of Investments as of September 30, 2018 (Unaudited)
Securities Lending Reinvestments (f)—(Continued)
Security DescriptionPrincipalAmount* Value
Commercial Paper—(Continued)Westpac Banking Corp.
2.492%, 1M LIBOR + 0.280%, 05/24/19 (g) . . . . . . . . . . . . 3,000,000 $ 3,001,662
21,985,813
Repurchase Agreements—5.0%Citigroup Global Markets, Inc.
Repurchase Agreement dated 07/25/18 at 2.570%, due on11/02/18 with a maturity value of $2,014,278; collateralizedby various Common Stock with an aggregate market value of$2,200,000. . . . . . . . . . . . . . . . . . . . . . . . . . . . . . . . . . . 2,000,000 2,000,000Repurchase Agreement dated 01/25/17 at 2.720%, due on12/31/18 with a maturity value of $105,327; collateralized byU.S. Treasury Obligations with rates ranging from 0.000% -2.220%, maturity dates ranging from 11/01/18 - 04/30/20,and an aggregate market value of $102,000. . . . . . . . . . . . . 100,000 100,000
Citigroup Global Markets, Ltd.Repurchase Agreement dated 09/28/18 at 2.240%, due on10/01/18 with a maturity value of $4,200,784; collateralizedby U.S. Treasury and Foreign Obligations with rates rangingfrom 0.625% - 2.875%, maturity dates ranging from01/15/19 - 02/15/43, and an aggregate market value of$4,284,001. . . . . . . . . . . . . . . . . . . . . . . . . . . . . . . . . . . 4,200,000 4,200,000Repurchase Agreement dated 09/28/18 at 2.240%, due on10/01/18 with a maturity value of $2,700,504; collateralizedby U.S. Treasury and Foreign Obligations with rates rangingfrom 1.750% - 2.875%, maturity dates ranging from10/15/20 - 05/15/27, and an aggregate market value of$2,754,002. . . . . . . . . . . . . . . . . . . . . . . . . . . . . . . . . . . 2,700,000 2,700,000Repurchase Agreement dated 09/28/18 at 2.240%, due on10/01/18 with a maturity value of $4,000,747; collateralizedby U.S. Treasury and Foreign Obligations with rates rangingfrom 0.375% - 3.125%, maturity dates ranging from12/17/18 - 02/15/43, and an aggregate market value of$4,080,000. . . . . . . . . . . . . . . . . . . . . . . . . . . . . . . . . . . 4,000,000 4,000,000
Deutsche Bank AG, LondonRepurchase Agreement dated 01/09/18 at 2.560%, due on10/01/18 with a maturity value of $5,094,222; collateralizedby various Common Stock with an aggregate market value of$5,566,613. . . . . . . . . . . . . . . . . . . . . . . . . . . . . . . . . . . 5,000,000 5,000,000
ING Bank NV, LondonRepurchase Agreement dated 08/03/18 at 2.420%, due on10/01/18 with a maturity value of $6,216,461; collateralizedby various Common Stock with an aggregate market value of$6,880,727. . . . . . . . . . . . . . . . . . . . . . . . . . . . . . . . . . . 6,191,904 6,191,904
Macquarie Bank, Ltd., LondonRepurchase Agreement dated 09/28/18 at 2.200%, due on10/01/18 with a maturity value of $3,413,474; collateralizedby U.S. Treasury Obligations with rates ranging from 0.125% -5.500%, maturity dates ranging from 08/31/19 - 05/15/48,and an aggregate market value of $3,478,451. . . . . . . . . . . 3,412,848 3,412,848
Merrill Lynch, Pierce, Fenner & Smith, Inc.Repurchase Agreement dated 10/26/16 at 2.720%, due on12/31/18 with a maturity value of $1,272,171; collateralizedby various Common Stock with an aggregate market value of$1,320,000. . . . . . . . . . . . . . . . . . . . . . . . . . . . . . . . . . . 1,200,000 1,200,000
Security DescriptionPrincipalAmount* Value
Repurchase Agreements—(Continued)Merrill Lynch, Pierce, Fenner & Smith, Inc.
Repurchase Agreement dated 08/01/17 at 2.720%, due on12/31/18 with a maturity value of $7,273,436;collateralized by various Common Stock with an aggregatemarket value of $7,700,001. . . . . . . . . . . . . . . . . . . . . . . 7,000,000 $ 7,000,000
Morgan Stanley & Co. LLCRepurchase Agreement dated 09/25/18 at 2.470%, due on10/02/18 with a maturity value of $10,004,803;collateralized by various Common Stock with an aggregatemarket value of $11,002,143. . . . . . . . . . . . . . . . . . . . . . 10,000,000 10,000,000
NBC Global Finance, LtdRepurchase Agreement dated 11/30/17 at 2.340%, due on10/01/18 with a maturity value of $4,589,213;collateralized by various Common Stock with an aggregatemarket value of $5,006,948. . . . . . . . . . . . . . . . . . . . . . . 4,500,000 4,500,000Repurchase Agreement dated 03/16/18 at 2.340%, due on10/01/18 with a maturity value of $11,446,166;collateralized by various Common Stock with an aggregatemarket value of $12,573,003. . . . . . . . . . . . . . . . . . . . . . 11,300,000 11,300,000
Societe GeneraleRepurchase Agreement dated 03/08/18 at 2.310%, due on10/01/18 with a maturity value of $5,573,054;collateralized by U.S. Treasury Obligations with rates rangingfrom 0.000% - 4.250%, maturity dates ranging from02/07/19 - 02/15/47, and various Common Stock with anaggregate market value of $6,108,566. . . . . . . . . . . . . . . 5,500,000 5,500,000Repurchase Agreement dated 03/16/18 at 2.310%, due on10/01/18 with a maturity value of $6,684,277;collateralized by U.S. Treasury Obligations with rates rangingfrom 0.000% - 4.250%, maturity dates ranging from02/07/19 - 02/15/47, and various Common Stock with anaggregate market value of $7,330,279. . . . . . . . . . . . . . . 6,600,000 6,600,000Repurchase Agreement dated 03/21/18 at 2.310%, due on10/01/18 with a maturity value of $8,650,319;collateralized by U.S. Treasury Obligations with rates rangingfrom 0.000% - 4.250%, maturity dates ranging from02/07/19 - 02/15/47, and various Common Stock with anaggregate market value of $9,489,337. . . . . . . . . . . . . . . 8,543,961 8,543,961Repurchase Agreement dated 03/28/18 at 2.310%, due on10/01/18 with a maturity value of $6,881,594;collateralized by U.S. Treasury Obligations with rates rangingfrom 0.000% - 4.250%, maturity dates ranging from02/07/19 - 02/15/47, and various Common Stock with anaggregate market value of $7,552,409. . . . . . . . . . . . . . . 6,800,000 6,800,000Repurchase Agreement dated 07/10/18 at 2.340%, due on10/05/18 with a maturity value of $2,815,834;collateralized by U.S. Treasury Obligations with rates rangingfrom 0.000% - 4.250%, maturity dates ranging from02/07/19 - 02/15/47, and various Common Stock with anaggregate market value of $3,109,816. . . . . . . . . . . . . . . 2,800,000 2,800,000
91,848,713
Time Deposits—2.8%Canadian Imperial Bank of Commerce
2.130%, 10/01/18 . . . . . . . . . . . . . . . . . . . . . . . . . . . . 10,400,000 10,400,000
BHFTII-52

Brighthouse Funds Trust II
BlackRock Capital Appreciation Portfolio
Schedule of Investments as of September 30, 2018 (Unaudited)
Securities Lending Reinvestments (f)—(Continued)
Security DescriptionPrincipalAmount* Value
Time Deposits—(Continued)Cooperative Rabobank UA New York
2.150%, 10/01/18 . . . . . . . . . . . . . . . . . . . . . . . . . . . . . 7,300,000 $ 7,300,000DZ Bank AG
2.150%, 10/01/18 . . . . . . . . . . . . . . . . . . . . . . . . . . . . . 7,400,000 7,400,000Erste Group Bank AG
2.170%, 10/01/18 . . . . . . . . . . . . . . . . . . . . . . . . . . . . . 5,400,000 5,400,000Nordea Bank New York
2.140%, 10/01/18 . . . . . . . . . . . . . . . . . . . . . . . . . . . . . 7,400,000 7,400,000Skandinaviska Enskilda Banken
2.130%, 10/01/18 . . . . . . . . . . . . . . . . . . . . . . . . . . . . . 7,000,000 7,000,000Svenska Handelsbanken AB
2.140%, 10/01/18 . . . . . . . . . . . . . . . . . . . . . . . . . . . . . 7,400,000 7,400,000
52,300,000
Total Securities Lending Reinvestments(Cost $257,030,488) . . . . . . . . . . . . . . . . . . . . . . . . . . . . 257,044,766
Total Investments—114.1%(Cost $1,466,640,987) . . . . . . . . . . . . . . . . . . . . . . . . . . . 2,104,039,382
Other assets and liabilities (net)—(14.1)% . . . . . . . . . . . . . . . . (260,192,036)
Net Assets—100.0% . . . . . . . . . . . . . . . . . . . . . . . . . . . $ 1,843,847,346
* Principal amount stated in U.S. dollars unless otherwise noted.(a) All or a portion of the security was held on loan. As of September 30, 2018, the
market value of securities loaned was $250,312,814 and the collateral receivedconsisted of cash in the amount of $256,955,649. The cash collateral investmentsare disclosed in the Schedule of Investments and categorized as Securities LendingReinvestments.
(b) Non-income producing security.(c) Significant unobservable inputs were used in the valuation of this portfolio
security; i.e. Level 3.(d) Restricted securities are not registered under the Securities Act of 1933 and are
subject to legal restrictions on resale. These securities generally may be resold intransactions exempt from registration or to the public if the securities aresubsequently registered. Disposal of these securities may involve time-consumingnegotiations and prompt sale at an acceptable price may be difficult. As ofSeptember 30, 2018, the market value of restricted securities was $6,318,505,which is 0.3% of net assets. See details shown in the Restricted Securities table thatfollows.
(e) Security was valued in good faith under procedures approved by the Board ofTrustees. As of September 30, 2018, these securities represent 0.3% of net assets.
(f) Represents investment of cash collateral received from securities on loan as ofSeptember 30, 2018.
(g) Variable or floating rate security. The stated rate represents the rate atSeptember 30, 2018. Maturity date shown for callable securities reflects theearliest possible call date. For securities based on a published reference index andspread, the index and spread are indicated in the description above. For certainvariable rate securities, the coupon rate is determined by the issuer/agent basedon current market conditions. For certain asset- and mortgage-backed securities,the coupon rate may fluctuate based on changes of the underlying collateral orprepayments of principal. These securities do not indicate a reference index andspread in their description above.
(FEDEFF PRV)— Effective Federal Funds Rate(LIBOR)— London Interbank Offered Rate(SOFR)— Secured Overnight Financing Rate
Restricted SecuritiesAcquisition
Date Shares Cost Value
Palantir Technologies, Inc. - Series I . . . . . . . . . . . . . . . . . . . . . . . . . . . . . . . . . . . . . . . . . . . . . . . . . . . . . . . . . . . . . . . . . . . . . . . . 02/07/14 2,537,552 $15,555,194 $6,318,505
BHFTII-53
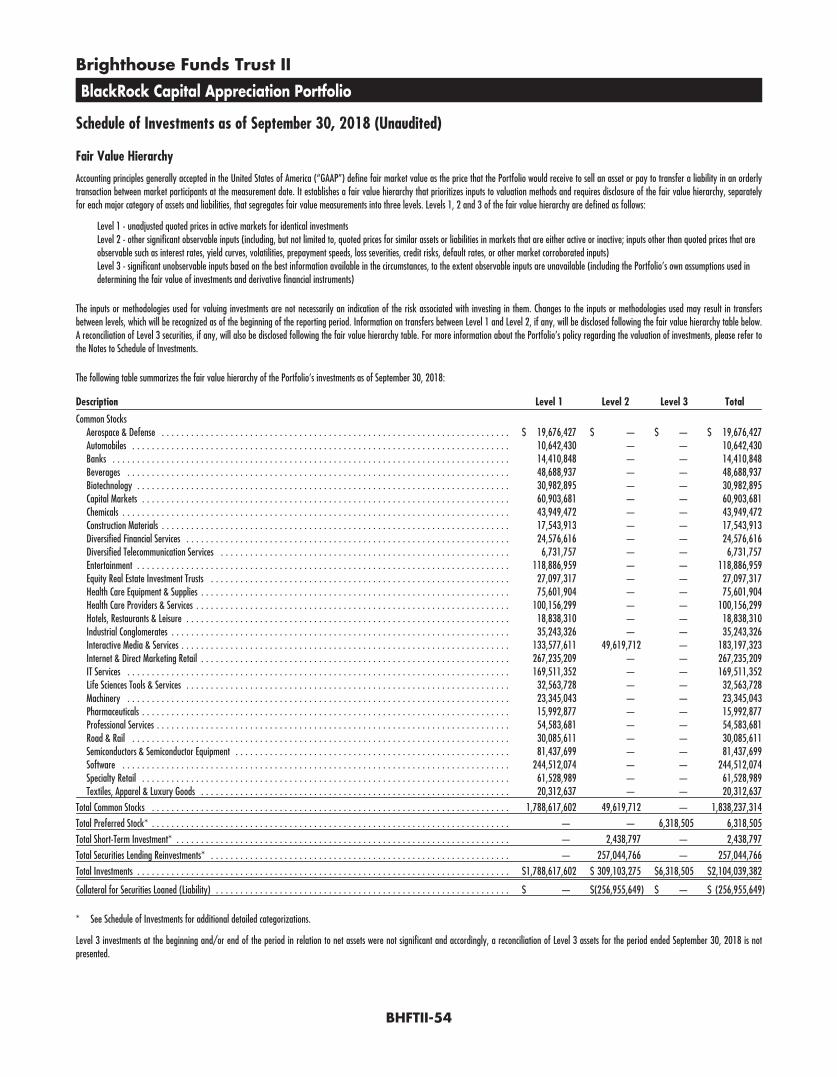
Brighthouse Funds Trust II
BlackRock Capital Appreciation Portfolio
Schedule of Investments as of September 30, 2018 (Unaudited)
Fair Value Hierarchy
Accounting principles generally accepted in the United States of America (“GAAP”) define fair market value as the price that the Portfolio would receive to sell an asset or pay to transfer a liability in an orderlytransaction between market participants at the measurement date. It establishes a fair value hierarchy that prioritizes inputs to valuation methods and requires disclosure of the fair value hierarchy, separatelyfor each major category of assets and liabilities, that segregates fair value measurements into three levels. Levels 1, 2 and 3 of the fair value hierarchy are defined as follows:
Level 1 - unadjusted quoted prices in active markets for identical investmentsLevel 2 - other significant observable inputs (including, but not limited to, quoted prices for similar assets or liabilities in markets that are either active or inactive; inputs other than quoted prices that areobservable such as interest rates, yield curves, volatilities, prepayment speeds, loss severities, credit risks, default rates, or other market corroborated inputs)Level 3 - significant unobservable inputs based on the best information available in the circumstances, to the extent observable inputs are unavailable (including the Portfolio’s own assumptions used indetermining the fair value of investments and derivative financial instruments)
The inputs or methodologies used for valuing investments are not necessarily an indication of the risk associated with investing in them. Changes to the inputs or methodologies used may result in transfersbetween levels, which will be recognized as of the beginning of the reporting period. Information on transfers between Level 1 and Level 2, if any, will be disclosed following the fair value hierarchy table below.A reconciliation of Level 3 securities, if any, will also be disclosed following the fair value hierarchy table. For more information about the Portfolio’s policy regarding the valuation of investments, please refer tothe Notes to Schedule of Investments.
The following table summarizes the fair value hierarchy of the Portfolio’s investments as of September 30, 2018:
Description Level 1 Level 2 Level 3 Total
Common StocksAerospace & Defense . . . . . . . . . . . . . . . . . . . . . . . . . . . . . . . . . . . . . . . . . . . . . . . . . . . . . . . . . . . . . . . . . . . . . . . $ 19,676,427 $ — $ — $ 19,676,427Automobiles . . . . . . . . . . . . . . . . . . . . . . . . . . . . . . . . . . . . . . . . . . . . . . . . . . . . . . . . . . . . . . . . . . . . . . . . . . . . . 10,642,430 — — 10,642,430Banks . . . . . . . . . . . . . . . . . . . . . . . . . . . . . . . . . . . . . . . . . . . . . . . . . . . . . . . . . . . . . . . . . . . . . . . . . . . . . . . . . 14,410,848 — — 14,410,848Beverages . . . . . . . . . . . . . . . . . . . . . . . . . . . . . . . . . . . . . . . . . . . . . . . . . . . . . . . . . . . . . . . . . . . . . . . . . . . . . . 48,688,937 — — 48,688,937Biotechnology . . . . . . . . . . . . . . . . . . . . . . . . . . . . . . . . . . . . . . . . . . . . . . . . . . . . . . . . . . . . . . . . . . . . . . . . . . . . 30,982,895 — — 30,982,895Capital Markets . . . . . . . . . . . . . . . . . . . . . . . . . . . . . . . . . . . . . . . . . . . . . . . . . . . . . . . . . . . . . . . . . . . . . . . . . . . 60,903,681 — — 60,903,681Chemicals . . . . . . . . . . . . . . . . . . . . . . . . . . . . . . . . . . . . . . . . . . . . . . . . . . . . . . . . . . . . . . . . . . . . . . . . . . . . . . . 43,949,472 — — 43,949,472Construction Materials . . . . . . . . . . . . . . . . . . . . . . . . . . . . . . . . . . . . . . . . . . . . . . . . . . . . . . . . . . . . . . . . . . . . . . . 17,543,913 — — 17,543,913Diversified Financial Services . . . . . . . . . . . . . . . . . . . . . . . . . . . . . . . . . . . . . . . . . . . . . . . . . . . . . . . . . . . . . . . . . . 24,576,616 — — 24,576,616Diversified Telecommunication Services . . . . . . . . . . . . . . . . . . . . . . . . . . . . . . . . . . . . . . . . . . . . . . . . . . . . . . . . . . . 6,731,757 — — 6,731,757Entertainment . . . . . . . . . . . . . . . . . . . . . . . . . . . . . . . . . . . . . . . . . . . . . . . . . . . . . . . . . . . . . . . . . . . . . . . . . . . . 118,886,959 — — 118,886,959Equity Real Estate Investment Trusts . . . . . . . . . . . . . . . . . . . . . . . . . . . . . . . . . . . . . . . . . . . . . . . . . . . . . . . . . . . . . 27,097,317 — — 27,097,317Health Care Equipment & Supplies . . . . . . . . . . . . . . . . . . . . . . . . . . . . . . . . . . . . . . . . . . . . . . . . . . . . . . . . . . . . . . . 75,601,904 — — 75,601,904Health Care Providers & Services . . . . . . . . . . . . . . . . . . . . . . . . . . . . . . . . . . . . . . . . . . . . . . . . . . . . . . . . . . . . . . . . 100,156,299 — — 100,156,299Hotels, Restaurants & Leisure . . . . . . . . . . . . . . . . . . . . . . . . . . . . . . . . . . . . . . . . . . . . . . . . . . . . . . . . . . . . . . . . . . 18,838,310 — — 18,838,310Industrial Conglomerates . . . . . . . . . . . . . . . . . . . . . . . . . . . . . . . . . . . . . . . . . . . . . . . . . . . . . . . . . . . . . . . . . . . . . 35,243,326 — — 35,243,326Interactive Media & Services . . . . . . . . . . . . . . . . . . . . . . . . . . . . . . . . . . . . . . . . . . . . . . . . . . . . . . . . . . . . . . . . . . . 133,577,611 49,619,712 — 183,197,323Internet & Direct Marketing Retail . . . . . . . . . . . . . . . . . . . . . . . . . . . . . . . . . . . . . . . . . . . . . . . . . . . . . . . . . . . . . . . 267,235,209 — — 267,235,209IT Services . . . . . . . . . . . . . . . . . . . . . . . . . . . . . . . . . . . . . . . . . . . . . . . . . . . . . . . . . . . . . . . . . . . . . . . . . . . . . . 169,511,352 — — 169,511,352Life Sciences Tools & Services . . . . . . . . . . . . . . . . . . . . . . . . . . . . . . . . . . . . . . . . . . . . . . . . . . . . . . . . . . . . . . . . . . 32,563,728 — — 32,563,728Machinery . . . . . . . . . . . . . . . . . . . . . . . . . . . . . . . . . . . . . . . . . . . . . . . . . . . . . . . . . . . . . . . . . . . . . . . . . . . . . . 23,345,043 — — 23,345,043Pharmaceuticals . . . . . . . . . . . . . . . . . . . . . . . . . . . . . . . . . . . . . . . . . . . . . . . . . . . . . . . . . . . . . . . . . . . . . . . . . . . 15,992,877 — — 15,992,877Professional Services . . . . . . . . . . . . . . . . . . . . . . . . . . . . . . . . . . . . . . . . . . . . . . . . . . . . . . . . . . . . . . . . . . . . . . . . 54,583,681 — — 54,583,681Road & Rail . . . . . . . . . . . . . . . . . . . . . . . . . . . . . . . . . . . . . . . . . . . . . . . . . . . . . . . . . . . . . . . . . . . . . . . . . . . . . 30,085,611 — — 30,085,611Semiconductors & Semiconductor Equipment . . . . . . . . . . . . . . . . . . . . . . . . . . . . . . . . . . . . . . . . . . . . . . . . . . . . . . . . 81,437,699 — — 81,437,699Software . . . . . . . . . . . . . . . . . . . . . . . . . . . . . . . . . . . . . . . . . . . . . . . . . . . . . . . . . . . . . . . . . . . . . . . . . . . . . . . 244,512,074 — — 244,512,074Specialty Retail . . . . . . . . . . . . . . . . . . . . . . . . . . . . . . . . . . . . . . . . . . . . . . . . . . . . . . . . . . . . . . . . . . . . . . . . . . . 61,528,989 — — 61,528,989Textiles, Apparel & Luxury Goods . . . . . . . . . . . . . . . . . . . . . . . . . . . . . . . . . . . . . . . . . . . . . . . . . . . . . . . . . . . . . . . 20,312,637 — — 20,312,637
Total Common Stocks . . . . . . . . . . . . . . . . . . . . . . . . . . . . . . . . . . . . . . . . . . . . . . . . . . . . . . . . . . . . . . . . . . . . . . . . . 1,788,617,602 49,619,712 — 1,838,237,314
Total Preferred Stock* . . . . . . . . . . . . . . . . . . . . . . . . . . . . . . . . . . . . . . . . . . . . . . . . . . . . . . . . . . . . . . . . . . . . . . . . . — — 6,318,505 6,318,505
Total Short-Term Investment* . . . . . . . . . . . . . . . . . . . . . . . . . . . . . . . . . . . . . . . . . . . . . . . . . . . . . . . . . . . . . . . . . . . . — 2,438,797 — 2,438,797
Total Securities Lending Reinvestments* . . . . . . . . . . . . . . . . . . . . . . . . . . . . . . . . . . . . . . . . . . . . . . . . . . . . . . . . . . . . . — 257,044,766 — 257,044,766
Total Investments . . . . . . . . . . . . . . . . . . . . . . . . . . . . . . . . . . . . . . . . . . . . . . . . . . . . . . . . . . . . . . . . . . . . . . . . . . . . $1,788,617,602 $ 309,103,275 $6,318,505 $2,104,039,382
Collateral for Securities Loaned (Liability) . . . . . . . . . . . . . . . . . . . . . . . . . . . . . . . . . . . . . . . . . . . . . . . . . . . . . . . . . . . . $ — $(256,955,649) $ — $ (256,955,649)
* See Schedule of Investments for additional detailed categorizations.
Level 3 investments at the beginning and/or end of the period in relation to net assets were not significant and accordingly, a reconciliation of Level 3 assets for the period ended September 30, 2018 is notpresented.
BHFTII-54
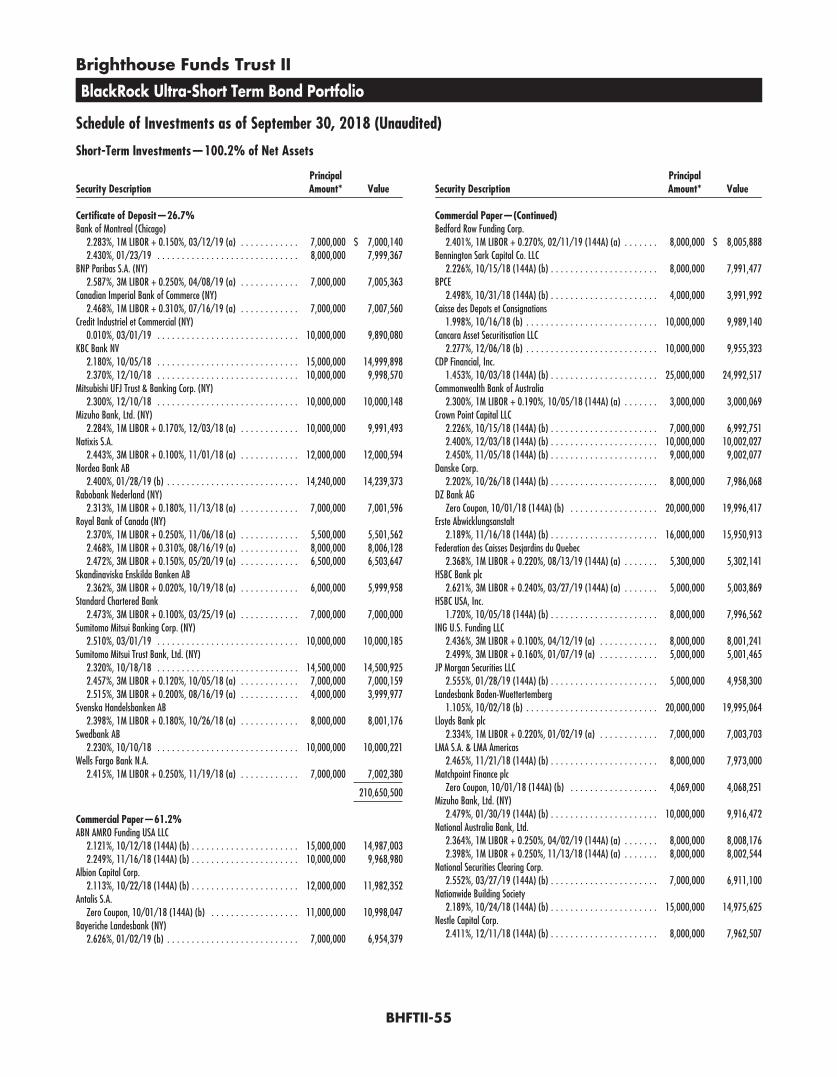
Brighthouse Funds Trust II
BlackRock Ultra-Short Term Bond Portfolio
Schedule of Investments as of September 30, 2018 (Unaudited)
Short-Term Investments—100.2% of Net Assets
Security DescriptionPrincipalAmount* Value
Certificate of Deposit—26.7%Bank of Montreal (Chicago)
2.283%, 1M LIBOR + 0.150%, 03/12/19 (a) . . . . . . . . . . . . 7,000,000 $ 7,000,1402.430%, 01/23/19 . . . . . . . . . . . . . . . . . . . . . . . . . . . . . 8,000,000 7,999,367
BNP Paribas S.A. (NY)2.587%, 3M LIBOR + 0.250%, 04/08/19 (a) . . . . . . . . . . . . 7,000,000 7,005,363
Canadian Imperial Bank of Commerce (NY)2.468%, 1M LIBOR + 0.310%, 07/16/19 (a) . . . . . . . . . . . . 7,000,000 7,007,560
Credit Industriel et Commercial (NY)0.010%, 03/01/19 . . . . . . . . . . . . . . . . . . . . . . . . . . . . . 10,000,000 9,890,080
KBC Bank NV2.180%, 10/05/18 . . . . . . . . . . . . . . . . . . . . . . . . . . . . . 15,000,000 14,999,8982.370%, 12/10/18 . . . . . . . . . . . . . . . . . . . . . . . . . . . . . 10,000,000 9,998,570
Mitsubishi UFJ Trust & Banking Corp. (NY)2.300%, 12/10/18 . . . . . . . . . . . . . . . . . . . . . . . . . . . . . 10,000,000 10,000,148
Mizuho Bank, Ltd. (NY)2.284%, 1M LIBOR + 0.170%, 12/03/18 (a) . . . . . . . . . . . . 10,000,000 9,991,493
Natixis S.A.2.443%, 3M LIBOR + 0.100%, 11/01/18 (a) . . . . . . . . . . . . 12,000,000 12,000,594
Nordea Bank AB2.400%, 01/28/19 (b) . . . . . . . . . . . . . . . . . . . . . . . . . . . 14,240,000 14,239,373
Rabobank Nederland (NY)2.313%, 1M LIBOR + 0.180%, 11/13/18 (a) . . . . . . . . . . . . 7,000,000 7,001,596
Royal Bank of Canada (NY)2.370%, 1M LIBOR + 0.250%, 11/06/18 (a) . . . . . . . . . . . . 5,500,000 5,501,5622.468%, 1M LIBOR + 0.310%, 08/16/19 (a) . . . . . . . . . . . . 8,000,000 8,006,1282.472%, 3M LIBOR + 0.150%, 05/20/19 (a) . . . . . . . . . . . . 6,500,000 6,503,647
Skandinaviska Enskilda Banken AB2.362%, 3M LIBOR + 0.020%, 10/19/18 (a) . . . . . . . . . . . . 6,000,000 5,999,958
Standard Chartered Bank2.473%, 3M LIBOR + 0.100%, 03/25/19 (a) . . . . . . . . . . . . 7,000,000 7,000,000
Sumitomo Mitsui Banking Corp. (NY)2.510%, 03/01/19 . . . . . . . . . . . . . . . . . . . . . . . . . . . . . 10,000,000 10,000,185
Sumitomo Mitsui Trust Bank, Ltd. (NY)2.320%, 10/18/18 . . . . . . . . . . . . . . . . . . . . . . . . . . . . . 14,500,000 14,500,9252.457%, 3M LIBOR + 0.120%, 10/05/18 (a) . . . . . . . . . . . . 7,000,000 7,000,1592.515%, 3M LIBOR + 0.200%, 08/16/19 (a) . . . . . . . . . . . . 4,000,000 3,999,977
Svenska Handelsbanken AB2.398%, 1M LIBOR + 0.180%, 10/26/18 (a) . . . . . . . . . . . . 8,000,000 8,001,176
Swedbank AB2.230%, 10/10/18 . . . . . . . . . . . . . . . . . . . . . . . . . . . . . 10,000,000 10,000,221
Wells Fargo Bank N.A.2.415%, 1M LIBOR + 0.250%, 11/19/18 (a) . . . . . . . . . . . . 7,000,000 7,002,380
210,650,500
Commercial Paper—61.2%ABN AMRO Funding USA LLC
2.121%, 10/12/18 (144A) (b) . . . . . . . . . . . . . . . . . . . . . . 15,000,000 14,987,0032.249%, 11/16/18 (144A) (b) . . . . . . . . . . . . . . . . . . . . . . 10,000,000 9,968,980
Albion Capital Corp.2.113%, 10/22/18 (144A) (b) . . . . . . . . . . . . . . . . . . . . . . 12,000,000 11,982,352
Antalis S.A.Zero Coupon, 10/01/18 (144A) (b) . . . . . . . . . . . . . . . . . . 11,000,000 10,998,047
Bayeriche Landesbank (NY)2.626%, 01/02/19 (b) . . . . . . . . . . . . . . . . . . . . . . . . . . . 7,000,000 6,954,379
Security DescriptionPrincipalAmount* Value
Commercial Paper—(Continued)Bedford Row Funding Corp.
2.401%, 1M LIBOR + 0.270%, 02/11/19 (144A) (a) . . . . . . . 8,000,000 $ 8,005,888Bennington Sark Capital Co. LLC
2.226%, 10/15/18 (144A) (b) . . . . . . . . . . . . . . . . . . . . . . 8,000,000 7,991,477BPCE
2.498%, 10/31/18 (144A) (b) . . . . . . . . . . . . . . . . . . . . . . 4,000,000 3,991,992Caisse des Depots et Consignations
1.998%, 10/16/18 (b) . . . . . . . . . . . . . . . . . . . . . . . . . . . 10,000,000 9,989,140Cancara Asset Securitisation LLC
2.277%, 12/06/18 (b) . . . . . . . . . . . . . . . . . . . . . . . . . . . 10,000,000 9,955,323CDP Financial, Inc.
1.453%, 10/03/18 (144A) (b) . . . . . . . . . . . . . . . . . . . . . . 25,000,000 24,992,517Commonwealth Bank of Australia
2.300%, 1M LIBOR + 0.190%, 10/05/18 (144A) (a) . . . . . . . 3,000,000 3,000,069Crown Point Capital LLC
2.226%, 10/15/18 (144A) (b) . . . . . . . . . . . . . . . . . . . . . . 7,000,000 6,992,7512.400%, 12/03/18 (144A) (b) . . . . . . . . . . . . . . . . . . . . . . 10,000,000 10,002,0272.450%, 11/05/18 (144A) (b) . . . . . . . . . . . . . . . . . . . . . . 9,000,000 9,002,077
Danske Corp.2.202%, 10/26/18 (144A) (b) . . . . . . . . . . . . . . . . . . . . . . 8,000,000 7,986,068
DZ Bank AGZero Coupon, 10/01/18 (144A) (b) . . . . . . . . . . . . . . . . . . 20,000,000 19,996,417
Erste Abwicklungsanstalt2.189%, 11/16/18 (144A) (b) . . . . . . . . . . . . . . . . . . . . . . 16,000,000 15,950,913
Federation des Caisses Desjardins du Quebec2.368%, 1M LIBOR + 0.220%, 08/13/19 (144A) (a) . . . . . . . 5,300,000 5,302,141
HSBC Bank plc2.621%, 3M LIBOR + 0.240%, 03/27/19 (144A) (a) . . . . . . . 5,000,000 5,003,869
HSBC USA, Inc.1.720%, 10/05/18 (144A) (b) . . . . . . . . . . . . . . . . . . . . . . 8,000,000 7,996,562
ING U.S. Funding LLC2.436%, 3M LIBOR + 0.100%, 04/12/19 (a) . . . . . . . . . . . . 8,000,000 8,001,2412.499%, 3M LIBOR + 0.160%, 01/07/19 (a) . . . . . . . . . . . . 5,000,000 5,001,465
JP Morgan Securities LLC2.555%, 01/28/19 (144A) (b) . . . . . . . . . . . . . . . . . . . . . . 5,000,000 4,958,300
Landesbank Baden-Wuettertemberg1.105%, 10/02/18 (b) . . . . . . . . . . . . . . . . . . . . . . . . . . . 20,000,000 19,995,064
Lloyds Bank plc2.334%, 1M LIBOR + 0.220%, 01/02/19 (a) . . . . . . . . . . . . 7,000,000 7,003,703
LMA S.A. & LMA Americas2.465%, 11/21/18 (144A) (b) . . . . . . . . . . . . . . . . . . . . . . 8,000,000 7,973,000
Matchpoint Finance plcZero Coupon, 10/01/18 (144A) (b) . . . . . . . . . . . . . . . . . . 4,069,000 4,068,251
Mizuho Bank, Ltd. (NY)2.479%, 01/30/19 (144A) (b) . . . . . . . . . . . . . . . . . . . . . . 10,000,000 9,916,472
National Australia Bank, Ltd.2.364%, 1M LIBOR + 0.250%, 04/02/19 (144A) (a) . . . . . . . 8,000,000 8,008,1762.398%, 1M LIBOR + 0.250%, 11/13/18 (144A) (a) . . . . . . . 8,000,000 8,002,544
National Securities Clearing Corp.2.552%, 03/27/19 (144A) (b) . . . . . . . . . . . . . . . . . . . . . . 7,000,000 6,911,100
Nationwide Building Society2.189%, 10/24/18 (144A) (b) . . . . . . . . . . . . . . . . . . . . . . 15,000,000 14,975,625
Nestle Capital Corp.2.411%, 12/11/18 (144A) (b) . . . . . . . . . . . . . . . . . . . . . . 8,000,000 7,962,507
BHFTII-55

Brighthouse Funds Trust II
BlackRock Ultra-Short Term Bond Portfolio
Schedule of Investments as of September 30, 2018 (Unaudited)
Short-Term Investments—(Continued)
Security DescriptionPrincipalAmount* Value
Commercial Paper—(Continued)Nieuw Amsterdam Receivables Corp.
1.474%, 10/03/18 (144A) (b) . . . . . . . . . . . . . . . . . . . . . . 8,000,000 $ 7,997,6002.305%, 12/03/18 (144A) (b) . . . . . . . . . . . . . . . . . . . . . . 10,000,000 9,956,953
Old Line Funding LLC2.269%, 12/10/18 (144A) (b) . . . . . . . . . . . . . . . . . . . . . . 10,000,000 9,953,8282.287%, 12/06/18 (144A) (b) . . . . . . . . . . . . . . . . . . . . . . 8,958,000 8,918,9912.582%, 1M LIBOR + 0.340%, 10/29/18 (144A) (a) . . . . . . . 8,500,000 8,502,771
Regency Markets No. 1 LLC2.046%, 10/16/18 (144A) (b) . . . . . . . . . . . . . . . . . . . . . . 17,000,000 16,981,351
Starbird Funding Corp.2.324%, 12/17/18 (144A) (b) . . . . . . . . . . . . . . . . . . . . . . 16,000,000 15,917,049
Suncorp Group, Ltd.2.537%, 01/09/19 (144A) (b) . . . . . . . . . . . . . . . . . . . . . . 10,000,000 9,927,900
Toronto-Dominion Bank2.344%, 11/30/18 (144A) (b) . . . . . . . . . . . . . . . . . . . . . . 10,000,000 10,002,2002.363%, 1M LIBOR + 0.230%, 11/08/18 (144A) (a) . . . . . . . 7,000,000 7,001,8972.390%, 1M LIBOR + 0.280%, 11/05/18 (144A) (a) . . . . . . . 8,000,000 8,002,456
UBS AG2.502%, 1M LIBOR + 0.260%, 08/28/19 (144A) (a) . . . . . . . 5,500,000 5,501,1722.514%, 1M LIBOR + 0.400%, 07/02/19 (144A) (a) . . . . . . . 5,000,000 5,007,1252.521%, 3M LIBOR + 0.180%, 08/01/19 (144A) (a) . . . . . . . 5,000,000 5,001,6222.662%, 1M LIBOR + 0.420%, 05/31/19 (144A) (a) . . . . . . . 7,000,000 7,010,6822.667%, 3M LIBOR + 0.330%, 04/04/19 (144A) (a) . . . . . . . 5,000,000 5,006,008
United Overseas Bank, Ltd.2.436%, 12/03/18 (144A) (b) . . . . . . . . . . . . . . . . . . . . . . 8,000,000 7,966,472
Victory Receivables Corp.2.250%, 11/09/18 (144A) (b) . . . . . . . . . . . . . . . . . . . . . . 10,000,000 9,973,937
482,457,454
Repurchase Agreements—12.3%Bank of America Securities, Inc.
Repurchase Agreement dated 09/28/18 at 2.250%, due on10/01/18 with a maturity value of $27,005,063; collateralizedby U.S. Treasury Note at 4.000%, maturing 08/15/18, with amarket value of $27,551,130. . . . . . . . . . . . . . . . . . . . . . . 27,000,000 27,000,000
Security DescriptionPrincipalAmount* Value
Repurchase Agreements—(Continued)JPMorgan Securities, Inc.
Repurchase Agreement dated 09/28/18 at 2.240%, due on10/01/18 with a maturity value of $70,013,067; collateralizedby U.S. Treasury Note at 2.000%, maturing 10/01/18, with amarket value of $71,399,477. . . . . . . . . . . . . . . . . . . . . . . 70,000,000 $ 70,000,000
97,000,000
Total Short-Term Investments(Cost $790,087,497) . . . . . . . . . . . . . . . . . . . . . . . . . . . . 790,107,954
Total Investments—100.2%(Cost $790,087,497) . . . . . . . . . . . . . . . . . . . . . . . . . . . . 790,107,954
Other assets and liabilities (net)—(0.2)% . . . . . . . . . . . . . . . . . (1,335,191)
Net Assets—100.0% . . . . . . . . . . . . . . . . . . . . . . . . . . . $788,772,763
* Principal amount stated in U.S. dollars unless otherwise noted.(a) Variable or floating rate security. The stated rate represents the rate at September 30,
2018. Maturity date shown for callable securities reflects the earliest possible call date.For securities based on a published reference index and spread, the index and spreadare indicated in the description above. For certain variable rate securities, the couponrate is determined by the issuer/agent based on current market conditions. For certainasset- and mortgage-backed securities, the coupon rate may fluctuate based on changesof the underlying collateral or prepayments of principal. These securities do not indicatea reference index and spread in their description above.
(b) The rate shown represents current yield to maturity.(144A)— Securities exempt from registration under Rule 144A of the Securities Act of 1933.
These securities may be resold in transactions exempt from registration, normally toqualified institutional buyers. As of September 30, 2018, the market value of 144Asecurities was $415,557,139, which is 52.7% of net assets.
(LIBOR)— London Interbank Offered Rate
BHFTII-56
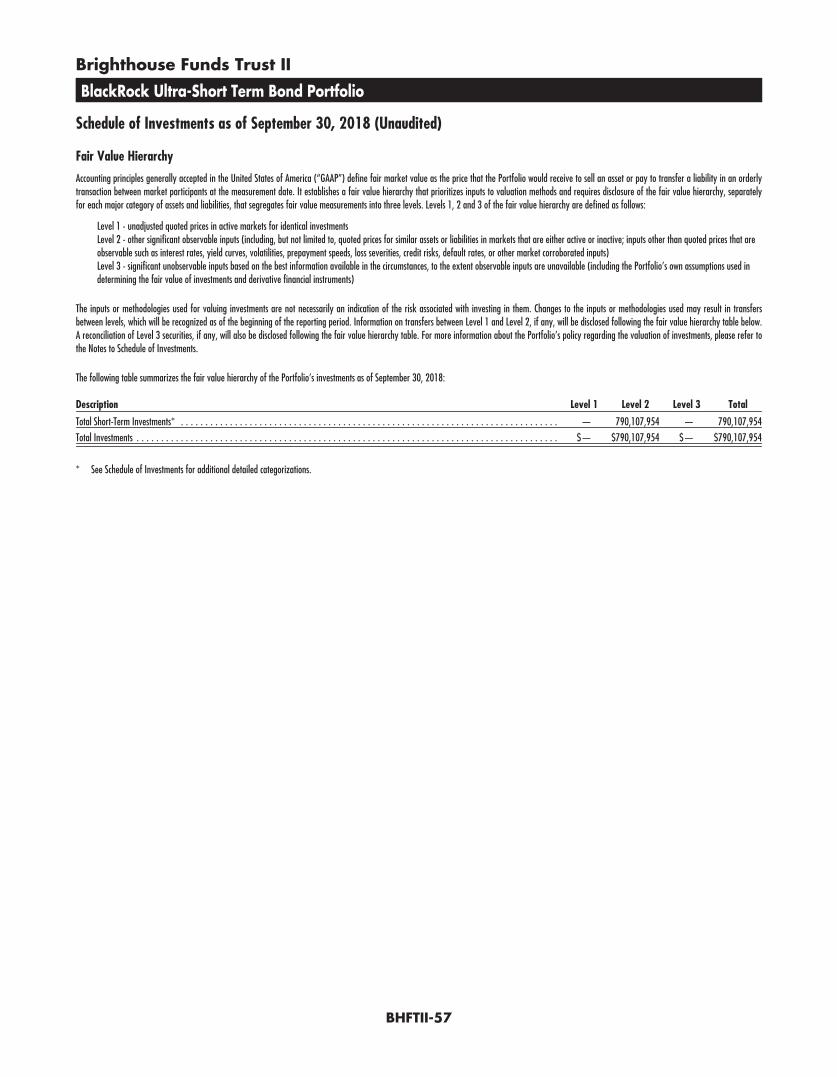
Brighthouse Funds Trust II
BlackRock Ultra-Short Term Bond Portfolio
Schedule of Investments as of September 30, 2018 (Unaudited)
Fair Value Hierarchy
Accounting principles generally accepted in the United States of America (“GAAP”) define fair market value as the price that the Portfolio would receive to sell an asset or pay to transfer a liability in an orderlytransaction between market participants at the measurement date. It establishes a fair value hierarchy that prioritizes inputs to valuation methods and requires disclosure of the fair value hierarchy, separatelyfor each major category of assets and liabilities, that segregates fair value measurements into three levels. Levels 1, 2 and 3 of the fair value hierarchy are defined as follows:
Level 1 - unadjusted quoted prices in active markets for identical investmentsLevel 2 - other significant observable inputs (including, but not limited to, quoted prices for similar assets or liabilities in markets that are either active or inactive; inputs other than quoted prices that areobservable such as interest rates, yield curves, volatilities, prepayment speeds, loss severities, credit risks, default rates, or other market corroborated inputs)Level 3 - significant unobservable inputs based on the best information available in the circumstances, to the extent observable inputs are unavailable (including the Portfolio’s own assumptions used indetermining the fair value of investments and derivative financial instruments)
The inputs or methodologies used for valuing investments are not necessarily an indication of the risk associated with investing in them. Changes to the inputs or methodologies used may result in transfersbetween levels, which will be recognized as of the beginning of the reporting period. Information on transfers between Level 1 and Level 2, if any, will be disclosed following the fair value hierarchy table below.A reconciliation of Level 3 securities, if any, will also be disclosed following the fair value hierarchy table. For more information about the Portfolio’s policy regarding the valuation of investments, please refer tothe Notes to Schedule of Investments.
The following table summarizes the fair value hierarchy of the Portfolio’s investments as of September 30, 2018:
Description Level 1 Level 2 Level 3 Total
Total Short-Term Investments* . . . . . . . . . . . . . . . . . . . . . . . . . . . . . . . . . . . . . . . . . . . . . . . . . . . . . . . . . . . . . . . . . . . . . . . . . . . . . — 790,107,954 — 790,107,954
Total Investments . . . . . . . . . . . . . . . . . . . . . . . . . . . . . . . . . . . . . . . . . . . . . . . . . . . . . . . . . . . . . . . . . . . . . . . . . . . . . . . . . . . . . . $— $790,107,954 $— $790,107,954
* See Schedule of Investments for additional detailed categorizations.
BHFTII-57

Brighthouse Funds Trust II
Brighthouse/Artisan Mid Cap Value Portfolio
Schedule of Investments as of September 30, 2018 (Unaudited)
Common Stocks—93.6% of Net Assets
Security Description Shares Value
Aerospace & Defense—1.2%Rockwell Collins, Inc. . . . . . . . . . . . . . . . . . . . . . . . . . . . . . . 89,874 $ 12,624,601
Auto Components—3.9%Delphi Technologies plc . . . . . . . . . . . . . . . . . . . . . . . . . . . . . 524,340 16,443,303Gentex Corp. (a) . . . . . . . . . . . . . . . . . . . . . . . . . . . . . . . . . 1,054,692 22,633,690
39,076,993
Banks—5.9%Fifth Third Bancorp . . . . . . . . . . . . . . . . . . . . . . . . . . . . . . . . 899,081 25,102,341M&T Bank Corp. . . . . . . . . . . . . . . . . . . . . . . . . . . . . . . . . . 133,306 21,934,169Pinnacle Financial Partners, Inc. (a) . . . . . . . . . . . . . . . . . . . . . 211,398 12,715,590
59,752,100
Capital Markets—1.6%Intercontinental Exchange, Inc. . . . . . . . . . . . . . . . . . . . . . . . . 210,935 15,796,922
Chemicals—7.7%Axalta Coating Systems, Ltd. (b) . . . . . . . . . . . . . . . . . . . . . . . 696,987 20,324,141Celanese Corp. - Series A . . . . . . . . . . . . . . . . . . . . . . . . . . . . 323,400 36,867,600Nutrien, Ltd. . . . . . . . . . . . . . . . . . . . . . . . . . . . . . . . . . . . . 349,952 20,192,230
77,383,971
Construction & Engineering—4.2%Fluor Corp. . . . . . . . . . . . . . . . . . . . . . . . . . . . . . . . . . . . . . 383,583 22,286,172Jacobs Engineering Group, Inc. . . . . . . . . . . . . . . . . . . . . . . . . 264,758 20,253,987
42,540,159
Consumer Finance—2.1%Synchrony Financial . . . . . . . . . . . . . . . . . . . . . . . . . . . . . . . 681,900 21,193,452
Diversified Consumer Services—2.1%H&R Block, Inc. (a) . . . . . . . . . . . . . . . . . . . . . . . . . . . . . . . 812,195 20,914,021
Electronic Equipment, Instruments & Components—2.1%Arrow Electronics, Inc. (b) . . . . . . . . . . . . . . . . . . . . . . . . . . . 283,496 20,899,325
Equity Real Estate Investment Trusts—2.7%Equity Commonwealth (b) . . . . . . . . . . . . . . . . . . . . . . . . . . . 616,497 19,783,389STORE Capital Corp. . . . . . . . . . . . . . . . . . . . . . . . . . . . . . . . 281,171 7,813,742
27,597,131
Food & Staples Retailing—3.0%Kroger Co. (The) (a) . . . . . . . . . . . . . . . . . . . . . . . . . . . . . . . 1,036,285 30,166,256
Health Care Providers & Services—1.1%AmerisourceBergen Corp. . . . . . . . . . . . . . . . . . . . . . . . . . . . 118,019 10,883,712
Insurance—11.7%Alleghany Corp. . . . . . . . . . . . . . . . . . . . . . . . . . . . . . . . . . . 19,824 12,935,755Aon plc . . . . . . . . . . . . . . . . . . . . . . . . . . . . . . . . . . . . . . . 121,669 18,710,259Arch Capital Group, Ltd. (b) . . . . . . . . . . . . . . . . . . . . . . . . . . 737,803 21,993,908Fairfax Financial Holdings, Ltd. . . . . . . . . . . . . . . . . . . . . . . . . 10,210 5,544,196Loews Corp. . . . . . . . . . . . . . . . . . . . . . . . . . . . . . . . . . . . . 299,610 15,049,410Progressive Corp. (The) . . . . . . . . . . . . . . . . . . . . . . . . . . . . . 231,834 16,469,487
Security Description Shares Value
Insurance—(Continued)Torchmark Corp. . . . . . . . . . . . . . . . . . . . . . . . . . . . . . . . . . 312,933 $ 27,128,162
117,831,177
Interactive Media & Services—5.4%IAC/InterActiveCorp (a) (b) . . . . . . . . . . . . . . . . . . . . . . . . . . 166,602 36,105,985TripAdvisor, Inc. (b) . . . . . . . . . . . . . . . . . . . . . . . . . . . . . . . 357,762 18,270,905
54,376,890
Internet & Direct Marketing Retail—4.9%Expedia Group, Inc. (a) . . . . . . . . . . . . . . . . . . . . . . . . . . . . . 92,045 12,010,032Liberty Expedia Holdings, Inc. - Class A (b) . . . . . . . . . . . . . . . . 263,204 12,381,116Qurate Retail, Inc. (b) . . . . . . . . . . . . . . . . . . . . . . . . . . . . . . 1,142,672 25,378,745
49,769,893
Marine—2.4%Kirby Corp. (a) (b) . . . . . . . . . . . . . . . . . . . . . . . . . . . . . . . . 298,774 24,574,161
Media—8.1%CBS Corp. - Class B . . . . . . . . . . . . . . . . . . . . . . . . . . . . . . . . 417,743 23,999,335GCI Liberty, Inc. - Class A (a) (b) . . . . . . . . . . . . . . . . . . . . . . . 415,123 21,171,273News Corp. - Class A . . . . . . . . . . . . . . . . . . . . . . . . . . . . . . . 1,301,729 17,169,806Omnicom Group, Inc. (a) . . . . . . . . . . . . . . . . . . . . . . . . . . . . 293,388 19,956,252
82,296,666
Oil, Gas & Consumable Fuels—10.6%Andeavor . . . . . . . . . . . . . . . . . . . . . . . . . . . . . . . . . . . . . . 136,524 20,956,434Apache Corp. (a) . . . . . . . . . . . . . . . . . . . . . . . . . . . . . . . . . 332,586 15,854,375Cimarex Energy Co. . . . . . . . . . . . . . . . . . . . . . . . . . . . . . . . 236,757 22,004,196Devon Energy Corp. . . . . . . . . . . . . . . . . . . . . . . . . . . . . . . . 569,375 22,740,837Hess Corp. (a) . . . . . . . . . . . . . . . . . . . . . . . . . . . . . . . . . . . 364,536 26,093,487
107,649,329
Road & Rail—4.6%AMERCO (a) . . . . . . . . . . . . . . . . . . . . . . . . . . . . . . . . . . . . 70,142 25,016,144Ryder System, Inc. . . . . . . . . . . . . . . . . . . . . . . . . . . . . . . . . 292,635 21,382,840
46,398,984
Semiconductors & Semiconductor Equipment—2.4%Analog Devices, Inc. (a) . . . . . . . . . . . . . . . . . . . . . . . . . . . . . 259,656 24,007,794
Specialty Retail—2.7%AutoNation, Inc. (a) (b) . . . . . . . . . . . . . . . . . . . . . . . . . . . . . 648,041 26,926,104
Trading Companies & Distributors—3.2%Air Lease Corp. (a) . . . . . . . . . . . . . . . . . . . . . . . . . . . . . . . . 705,528 32,369,625
Total Common Stocks(Cost $665,898,363) . . . . . . . . . . . . . . . . . . . . . . . . . . . . 945,029,266
BHFTII-58

Brighthouse Funds Trust II
Brighthouse/Artisan Mid Cap Value Portfolio
Schedule of Investments as of September 30, 2018 (Unaudited)
Short-Term Investment—6.3%
Security DescriptionPrincipalAmount* Value
Repurchase Agreement—6.3%Fixed Income Clearing Corp. Repurchase Agreement dated
09/28/18 at 1.000%, due on 10/01/18 with a maturityvalue of $64,233,007; collateralized by U.S. Treasury Note at2.125%, maturing 09/30/24, with a market value of$65,513,381. . . . . . . . . . . . . . . . . . . . . . . . . . . . . . . . . 64,227,655 $ 64,227,655
Total Short-Term Investments(Cost $64,227,655) . . . . . . . . . . . . . . . . . . . . . . . . . . . . 64,227,655
Securities Lending Reinvestments (c)—16.1%
Certificates of Deposit—9.5%Banco Del Estado De Chile New York
2.419%, 3M LIBOR + 0.100%, 11/14/18 (d) . . . . . . . . . . . 2,500,000 2,499,9582.466%, 1M LIBOR + 0.250%, 03/20/19 (d) . . . . . . . . . . . 5,000,000 4,999,740
Banco Santander S.A.2.340%, 11/07/18 . . . . . . . . . . . . . . . . . . . . . . . . . . . . 3,000,000 3,000,246
Bank of MontrealZero Coupon, 10/31/18 . . . . . . . . . . . . . . . . . . . . . . . . . 3,991,475 3,992,250
Bank of Montreal (Chicago)2.371%, 3M LIBOR + 0.030%, 11/06/18 (d) . . . . . . . . . . . 2,000,000 1,999,996
Bank of Nova Scotia2.618%, 3M LIBOR + 0.280%, 03/20/19 (d) . . . . . . . . . . . 4,000,000 4,003,816
Barclays Bank plc2.304%, 1M LIBOR + 0.200%, 02/04/19 (d) . . . . . . . . . . . 4,000,000 3,999,188
BNP Paribas S.A. New York2.574%, 1M LIBOR + 0.470%, 12/04/18 (d) . . . . . . . . . . . 2,000,000 2,001,174
Canadian Imperial Bank of Commerce2.459%, 3M LIBOR + 0.120%, 01/14/19 (d) . . . . . . . . . . . 4,000,000 4,001,188
Commonwealth Bank of Australia2.358%, 1M LIBOR + 0.210%, 09/13/19 (d) . . . . . . . . . . . 1,500,000 1,500,0002.487%, 3M LIBOR + 0.140%, 04/23/19 (d) . . . . . . . . . . . 1,500,000 1,500,537
Cooperative Rabobank UA2.479%, 3M LIBOR + 0.140%, 10/16/18 (d) . . . . . . . . . . . 3,500,000 3,500,2622.543%, 3M LIBOR + 0.200%, 04/05/19 (d) . . . . . . . . . . . 2,000,000 2,001,532
Credit Agricole S.A.2.463%, 1M LIBOR + 0.330%, 10/09/18 (d) . . . . . . . . . . . 2,500,000 2,500,100
Credit Industriel et Commercial (NY)Zero Coupon, 01/25/19 . . . . . . . . . . . . . . . . . . . . . . . . . 4,442,527 4,464,135
Industrial & Commercial Bank of China, Ltd.2.500%, 10/24/18 . . . . . . . . . . . . . . . . . . . . . . . . . . . . 1,000,000 1,000,0132.500%, 11/15/18 . . . . . . . . . . . . . . . . . . . . . . . . . . . . 5,000,000 4,999,880
KBC Bank NV2.400%, 12/27/18 . . . . . . . . . . . . . . . . . . . . . . . . . . . . 2,000,000 2,000,000
Landesbank Baden-Wuettertemberg2.180%, 10/02/18 . . . . . . . . . . . . . . . . . . . . . . . . . . . . 2,000,000 2,000,004
Mitsubishi UFJ Trust and Banking Corp.Zero Coupon, 01/15/19 . . . . . . . . . . . . . . . . . . . . . . . . . 2,977,462 2,978,083
Mizuho Bank, Ltd., New York2.468%, 1M LIBOR + 0.250%, 11/26/18 (d) . . . . . . . . . . . 2,000,000 1,999,934
Natixis S.A. New York2.431%, 3M LIBOR + 0.090%, 05/10/19 (d) . . . . . . . . . . . 1,000,000 999,9212.504%, 1M LIBOR + 0.370%, 02/14/19 (d) . . . . . . . . . . . 4,000,000 4,002,676
Royal Bank of Canada New York2.378%, 1M LIBOR + 0.210%, 09/17/19 (d) . . . . . . . . . . . 3,000,000 2,999,835
Security DescriptionPrincipalAmount* Value
Certificates of Deposit—(Continued)Standard Chartered plc
2.396%, 1M LIBOR + 0.180%, 02/25/19 (d) . . . . . . . . . . . . 4,000,000 $ 3,999,532Sumitomo Mitsui Banking Corp.
2.321%, 1M LIBOR + 0.190%, 04/11/19 (d) . . . . . . . . . . . . 2,000,000 1,999,906Sumitomo Mitsui Trust Bank, Ltd., London
2.528%, 1M LIBOR + 0.310%, 11/26/18 (d) . . . . . . . . . . . . 5,000,000 5,000,000Svenska Handelsbanken AB
2.439%, 3M LIBOR + 0.100%, 04/30/19 (d) . . . . . . . . . . . . 4,000,000 4,000,476Toronto-Dominion Bank
2.378%, 1M LIBOR + 0.210%, 09/17/19 (d) . . . . . . . . . . . . 2,000,000 2,000,000Wells Fargo Bank N.A.
2.473%, 3M LIBOR + 0.140%, 07/11/19 (d) . . . . . . . . . . . . 7,000,000 7,000,798Westpac Banking Corp.
2.630%, FEDEFF PRV + 0.450%, 02/15/19 (d) . . . . . . . . . . . 3,000,000 3,001,593
95,946,773
Commercial Paper—1.9%Bank of China, Ltd.
2.510%, 11/02/18 . . . . . . . . . . . . . . . . . . . . . . . . . . . . . 3,974,621 3,991,2002.550%, 10/19/18 . . . . . . . . . . . . . . . . . . . . . . . . . . . . . 2,484,594 2,496,790
Sheffield Receivables Co. 2.490%, 11/26/18 . . . . . . . . . . . . . . 1,973,855 1,992,3182.510%, SOFR + 0.350%, 11/28/18 (d) . . . . . . . . . . . . . . . 500,000 500,137
Sinopec Century Bright Capital Investment, Ltd.2.400%, 11/01/18 . . . . . . . . . . . . . . . . . . . . . . . . . . . . . 994,000 997,834
UBS AG2.534%, 1M LIBOR + 0.430%, 02/01/19 (d) . . . . . . . . . . . . 5,000,000 5,004,615
Westpac Banking Corp.2.492%, 1M LIBOR + 0.280%, 05/24/19 (d) . . . . . . . . . . . . 4,000,000 4,002,216
18,985,110
Repurchase Agreements—3.8%Citigroup Global Markets, Inc.
Repurchase Agreement dated 07/25/18 at 2.570%, due on11/02/18 with a maturity value of $2,014,278; collateralizedby various Common Stock with an aggregate market value of$2,200,000. . . . . . . . . . . . . . . . . . . . . . . . . . . . . . . . . . . 2,000,000 2,000,000Repurchase Agreement dated 01/25/17 at 2.720%, due on12/31/18 with a maturity value of $1,053,267; collateralizedby U.S. Treasury Obligations with rates ranging from 0.000% -2.220%, maturity dates ranging from 11/01/18 - 04/30/20,and an aggregate market value of $1,020,000. . . . . . . . . . . 1,000,000 1,000,000
Citigroup Global Markets, Ltd.Repurchase Agreement dated 09/28/18 at 2.240%, due on10/01/18 with a maturity value of $800,149; collateralized byU.S. Treasury and Foreign Obligations with rates ranging from0.625% - 2.875%, maturity dates ranging from 01/15/19 -02/15/43, and an aggregate market value of $816,000. . . . . 800,000 800,000Repurchase Agreement dated 09/28/18 at 2.240%, due on10/01/18 with a maturity value of $500,093; collateralized byU.S. Treasury and Foreign Obligations with rates ranging from1.750% - 2.875%, maturity dates ranging from 10/15/20 -05/15/27, and an aggregate market value of $510,000. . . . . 500,000 500,000
BHFTII-59
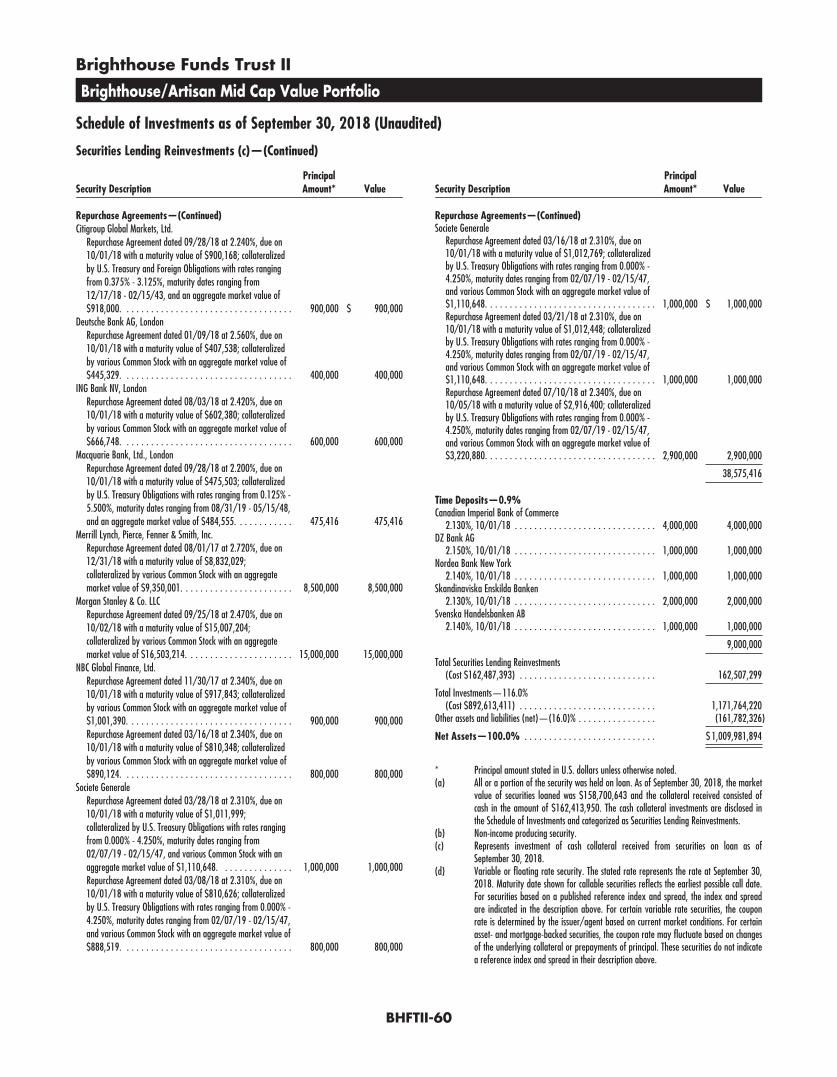
Brighthouse Funds Trust II
Brighthouse/Artisan Mid Cap Value Portfolio
Schedule of Investments as of September 30, 2018 (Unaudited)
Securities Lending Reinvestments (c)—(Continued)
Security DescriptionPrincipalAmount* Value
Repurchase Agreements—(Continued)Citigroup Global Markets, Ltd.
Repurchase Agreement dated 09/28/18 at 2.240%, due on10/01/18 with a maturity value of $900,168; collateralizedby U.S. Treasury and Foreign Obligations with rates rangingfrom 0.375% - 3.125%, maturity dates ranging from12/17/18 - 02/15/43, and an aggregate market value of$918,000. . . . . . . . . . . . . . . . . . . . . . . . . . . . . . . . . . . 900,000 $ 900,000
Deutsche Bank AG, LondonRepurchase Agreement dated 01/09/18 at 2.560%, due on10/01/18 with a maturity value of $407,538; collateralizedby various Common Stock with an aggregate market value of$445,329. . . . . . . . . . . . . . . . . . . . . . . . . . . . . . . . . . . 400,000 400,000
ING Bank NV, LondonRepurchase Agreement dated 08/03/18 at 2.420%, due on10/01/18 with a maturity value of $602,380; collateralizedby various Common Stock with an aggregate market value of$666,748. . . . . . . . . . . . . . . . . . . . . . . . . . . . . . . . . . . 600,000 600,000
Macquarie Bank, Ltd., LondonRepurchase Agreement dated 09/28/18 at 2.200%, due on10/01/18 with a maturity value of $475,503; collateralizedby U.S. Treasury Obligations with rates ranging from 0.125% -5.500%, maturity dates ranging from 08/31/19 - 05/15/48,and an aggregate market value of $484,555. . . . . . . . . . . . 475,416 475,416
Merrill Lynch, Pierce, Fenner & Smith, Inc.Repurchase Agreement dated 08/01/17 at 2.720%, due on12/31/18 with a maturity value of $8,832,029;collateralized by various Common Stock with an aggregatemarket value of $9,350,001. . . . . . . . . . . . . . . . . . . . . . . 8,500,000 8,500,000
Morgan Stanley & Co. LLCRepurchase Agreement dated 09/25/18 at 2.470%, due on10/02/18 with a maturity value of $15,007,204;collateralized by various Common Stock with an aggregatemarket value of $16,503,214. . . . . . . . . . . . . . . . . . . . . . 15,000,000 15,000,000
NBC Global Finance, Ltd.Repurchase Agreement dated 11/30/17 at 2.340%, due on10/01/18 with a maturity value of $917,843; collateralizedby various Common Stock with an aggregate market value of$1,001,390. . . . . . . . . . . . . . . . . . . . . . . . . . . . . . . . . . 900,000 900,000Repurchase Agreement dated 03/16/18 at 2.340%, due on10/01/18 with a maturity value of $810,348; collateralizedby various Common Stock with an aggregate market value of$890,124. . . . . . . . . . . . . . . . . . . . . . . . . . . . . . . . . . . 800,000 800,000
Societe GeneraleRepurchase Agreement dated 03/28/18 at 2.310%, due on10/01/18 with a maturity value of $1,011,999;collateralized by U.S. Treasury Obligations with rates rangingfrom 0.000% - 4.250%, maturity dates ranging from02/07/19 - 02/15/47, and various Common Stock with anaggregate market value of $1,110,648. . . . . . . . . . . . . . . 1,000,000 1,000,000Repurchase Agreement dated 03/08/18 at 2.310%, due on10/01/18 with a maturity value of $810,626; collateralizedby U.S. Treasury Obligations with rates ranging from 0.000% -4.250%, maturity dates ranging from 02/07/19 - 02/15/47,and various Common Stock with an aggregate market value of$888,519. . . . . . . . . . . . . . . . . . . . . . . . . . . . . . . . . . . 800,000 800,000
Security DescriptionPrincipalAmount* Value
Repurchase Agreements—(Continued)Societe Generale
Repurchase Agreement dated 03/16/18 at 2.310%, due on10/01/18 with a maturity value of $1,012,769; collateralizedby U.S. Treasury Obligations with rates ranging from 0.000% -4.250%, maturity dates ranging from 02/07/19 - 02/15/47,and various Common Stock with an aggregate market value of$1,110,648. . . . . . . . . . . . . . . . . . . . . . . . . . . . . . . . . . . 1,000,000 $ 1,000,000Repurchase Agreement dated 03/21/18 at 2.310%, due on10/01/18 with a maturity value of $1,012,448; collateralizedby U.S. Treasury Obligations with rates ranging from 0.000% -4.250%, maturity dates ranging from 02/07/19 - 02/15/47,and various Common Stock with an aggregate market value of$1,110,648. . . . . . . . . . . . . . . . . . . . . . . . . . . . . . . . . . . 1,000,000 1,000,000Repurchase Agreement dated 07/10/18 at 2.340%, due on10/05/18 with a maturity value of $2,916,400; collateralizedby U.S. Treasury Obligations with rates ranging from 0.000% -4.250%, maturity dates ranging from 02/07/19 - 02/15/47,and various Common Stock with an aggregate market value of$3,220,880. . . . . . . . . . . . . . . . . . . . . . . . . . . . . . . . . . . 2,900,000 2,900,000
38,575,416
Time Deposits—0.9%Canadian Imperial Bank of Commerce
2.130%, 10/01/18 . . . . . . . . . . . . . . . . . . . . . . . . . . . . . 4,000,000 4,000,000DZ Bank AG
2.150%, 10/01/18 . . . . . . . . . . . . . . . . . . . . . . . . . . . . . 1,000,000 1,000,000Nordea Bank New York
2.140%, 10/01/18 . . . . . . . . . . . . . . . . . . . . . . . . . . . . . 1,000,000 1,000,000Skandinaviska Enskilda Banken
2.130%, 10/01/18 . . . . . . . . . . . . . . . . . . . . . . . . . . . . . 2,000,000 2,000,000Svenska Handelsbanken AB
2.140%, 10/01/18 . . . . . . . . . . . . . . . . . . . . . . . . . . . . . 1,000,000 1,000,000
9,000,000
Total Securities Lending Reinvestments(Cost $162,487,393) . . . . . . . . . . . . . . . . . . . . . . . . . . . . 162,507,299
Total Investments—116.0%(Cost $892,613,411) . . . . . . . . . . . . . . . . . . . . . . . . . . . . 1,171,764,220
Other assets and liabilities (net)—(16.0)% . . . . . . . . . . . . . . . . (161,782,326)
Net Assets—100.0% . . . . . . . . . . . . . . . . . . . . . . . . . . . $ 1,009,981,894
* Principal amount stated in U.S. dollars unless otherwise noted.(a) All or a portion of the security was held on loan. As of September 30, 2018, the market
value of securities loaned was $158,700,643 and the collateral received consisted ofcash in the amount of $162,413,950. The cash collateral investments are disclosed inthe Schedule of Investments and categorized as Securities Lending Reinvestments.
(b) Non-income producing security.(c) Represents investment of cash collateral received from securities on loan as of
September 30, 2018.(d) Variable or floating rate security. The stated rate represents the rate at September 30,
2018. Maturity date shown for callable securities reflects the earliest possible call date.For securities based on a published reference index and spread, the index and spreadare indicated in the description above. For certain variable rate securities, the couponrate is determined by the issuer/agent based on current market conditions. For certainasset- and mortgage-backed securities, the coupon rate may fluctuate based on changesof the underlying collateral or prepayments of principal. These securities do not indicatea reference index and spread in their description above.
BHFTII-60
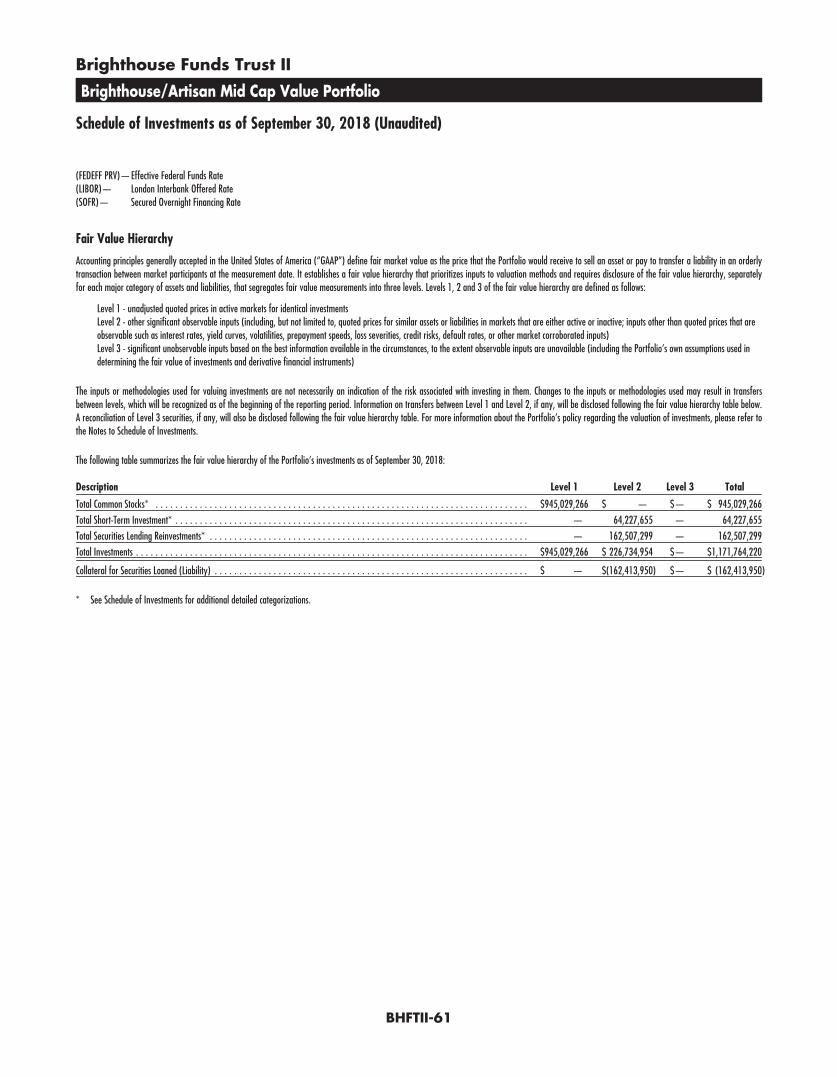
Brighthouse Funds Trust II
Brighthouse/Artisan Mid Cap Value Portfolio
Schedule of Investments as of September 30, 2018 (Unaudited)
(FEDEFF PRV)—Effective Federal Funds Rate(LIBOR)— London Interbank Offered Rate(SOFR)— Secured Overnight Financing Rate
Fair Value Hierarchy
Accounting principles generally accepted in the United States of America (“GAAP”) define fair market value as the price that the Portfolio would receive to sell an asset or pay to transfer a liability in an orderlytransaction between market participants at the measurement date. It establishes a fair value hierarchy that prioritizes inputs to valuation methods and requires disclosure of the fair value hierarchy, separatelyfor each major category of assets and liabilities, that segregates fair value measurements into three levels. Levels 1, 2 and 3 of the fair value hierarchy are defined as follows:
Level 1 - unadjusted quoted prices in active markets for identical investmentsLevel 2 - other significant observable inputs (including, but not limited to, quoted prices for similar assets or liabilities in markets that are either active or inactive; inputs other than quoted prices that areobservable such as interest rates, yield curves, volatilities, prepayment speeds, loss severities, credit risks, default rates, or other market corroborated inputs)Level 3 - significant unobservable inputs based on the best information available in the circumstances, to the extent observable inputs are unavailable (including the Portfolio’s own assumptions used indetermining the fair value of investments and derivative financial instruments)
The inputs or methodologies used for valuing investments are not necessarily an indication of the risk associated with investing in them. Changes to the inputs or methodologies used may result in transfersbetween levels, which will be recognized as of the beginning of the reporting period. Information on transfers between Level 1 and Level 2, if any, will be disclosed following the fair value hierarchy table below.A reconciliation of Level 3 securities, if any, will also be disclosed following the fair value hierarchy table. For more information about the Portfolio’s policy regarding the valuation of investments, please refer tothe Notes to Schedule of Investments.
The following table summarizes the fair value hierarchy of the Portfolio’s investments as of September 30, 2018:
Description Level 1 Level 2 Level 3 Total
Total Common Stocks* . . . . . . . . . . . . . . . . . . . . . . . . . . . . . . . . . . . . . . . . . . . . . . . . . . . . . . . . . . . . . . . . . . . . . . . . . . . . $945,029,266 $ — $— $ 945,029,266
Total Short-Term Investment* . . . . . . . . . . . . . . . . . . . . . . . . . . . . . . . . . . . . . . . . . . . . . . . . . . . . . . . . . . . . . . . . . . . . . . . . — 64,227,655 — 64,227,655
Total Securities Lending Reinvestments* . . . . . . . . . . . . . . . . . . . . . . . . . . . . . . . . . . . . . . . . . . . . . . . . . . . . . . . . . . . . . . . . . — 162,507,299 — 162,507,299
Total Investments . . . . . . . . . . . . . . . . . . . . . . . . . . . . . . . . . . . . . . . . . . . . . . . . . . . . . . . . . . . . . . . . . . . . . . . . . . . . . . . . $945,029,266 $ 226,734,954 $— $1,171,764,220
Collateral for Securities Loaned (Liability) . . . . . . . . . . . . . . . . . . . . . . . . . . . . . . . . . . . . . . . . . . . . . . . . . . . . . . . . . . . . . . . . $ — $(162,413,950) $— $ (162,413,950)
* See Schedule of Investments for additional detailed categorizations.
BHFTII-61
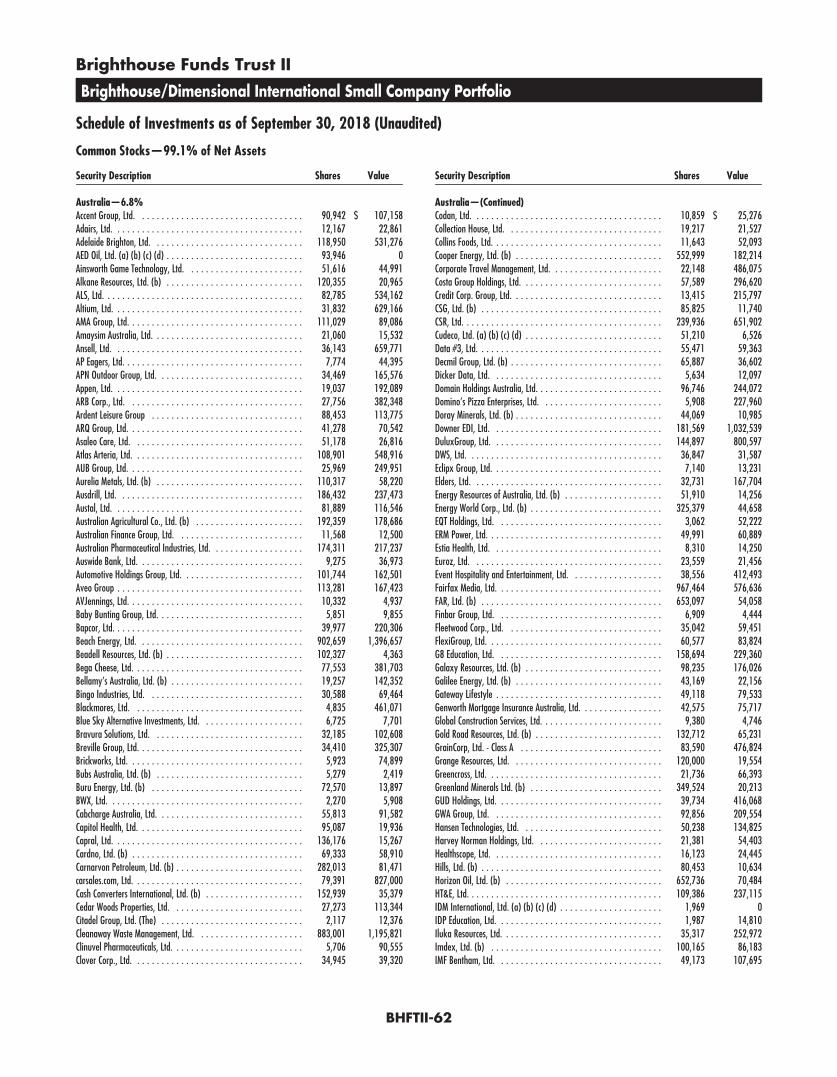
Brighthouse Funds Trust II
Brighthouse/Dimensional International Small Company Portfolio
Schedule of Investments as of September 30, 2018 (Unaudited)
Common Stocks—99.1% of Net Assets
Security Description Shares Value
Australia—6.8%Accent Group, Ltd. . . . . . . . . . . . . . . . . . . . . . . . . . . . . . . . . . 90,942 $ 107,158Adairs, Ltd. . . . . . . . . . . . . . . . . . . . . . . . . . . . . . . . . . . . . . . 12,167 22,861Adelaide Brighton, Ltd. . . . . . . . . . . . . . . . . . . . . . . . . . . . . . . 118,950 531,276AED Oil, Ltd. (a) (b) (c) (d) . . . . . . . . . . . . . . . . . . . . . . . . . . . . 93,946 0Ainsworth Game Technology, Ltd. . . . . . . . . . . . . . . . . . . . . . . . 51,616 44,991Alkane Resources, Ltd. (b) . . . . . . . . . . . . . . . . . . . . . . . . . . . . 120,355 20,965ALS, Ltd. . . . . . . . . . . . . . . . . . . . . . . . . . . . . . . . . . . . . . . . . 82,785 534,162Altium, Ltd. . . . . . . . . . . . . . . . . . . . . . . . . . . . . . . . . . . . . . . 31,832 629,166AMA Group, Ltd. . . . . . . . . . . . . . . . . . . . . . . . . . . . . . . . . . . . 111,029 89,086Amaysim Australia, Ltd. . . . . . . . . . . . . . . . . . . . . . . . . . . . . . . 21,060 15,532Ansell, Ltd. . . . . . . . . . . . . . . . . . . . . . . . . . . . . . . . . . . . . . . 36,143 659,771AP Eagers, Ltd. . . . . . . . . . . . . . . . . . . . . . . . . . . . . . . . . . . . . 7,774 44,395APN Outdoor Group, Ltd. . . . . . . . . . . . . . . . . . . . . . . . . . . . . . 34,469 165,576Appen, Ltd. . . . . . . . . . . . . . . . . . . . . . . . . . . . . . . . . . . . . . . 19,037 192,089ARB Corp., Ltd. . . . . . . . . . . . . . . . . . . . . . . . . . . . . . . . . . . . 27,756 382,348Ardent Leisure Group . . . . . . . . . . . . . . . . . . . . . . . . . . . . . . . 88,453 113,775ARQ Group, Ltd. . . . . . . . . . . . . . . . . . . . . . . . . . . . . . . . . . . . 41,278 70,542Asaleo Care, Ltd. . . . . . . . . . . . . . . . . . . . . . . . . . . . . . . . . . . 51,178 26,816Atlas Arteria, Ltd. . . . . . . . . . . . . . . . . . . . . . . . . . . . . . . . . . . 108,901 548,916AUB Group, Ltd. . . . . . . . . . . . . . . . . . . . . . . . . . . . . . . . . . . . 25,969 249,951Aurelia Metals, Ltd. (b) . . . . . . . . . . . . . . . . . . . . . . . . . . . . . . 110,317 58,220Ausdrill, Ltd. . . . . . . . . . . . . . . . . . . . . . . . . . . . . . . . . . . . . . 186,432 237,473Austal, Ltd. . . . . . . . . . . . . . . . . . . . . . . . . . . . . . . . . . . . . . . 81,889 116,546Australian Agricultural Co., Ltd. (b) . . . . . . . . . . . . . . . . . . . . . . 192,359 178,686Australian Finance Group, Ltd. . . . . . . . . . . . . . . . . . . . . . . . . . 11,568 12,500Australian Pharmaceutical Industries, Ltd. . . . . . . . . . . . . . . . . . . 174,311 217,237Auswide Bank, Ltd. . . . . . . . . . . . . . . . . . . . . . . . . . . . . . . . . . 9,275 36,973Automotive Holdings Group, Ltd. . . . . . . . . . . . . . . . . . . . . . . . . 101,744 162,501Aveo Group . . . . . . . . . . . . . . . . . . . . . . . . . . . . . . . . . . . . . . 113,281 167,423AVJennings, Ltd. . . . . . . . . . . . . . . . . . . . . . . . . . . . . . . . . . . . 10,332 4,937Baby Bunting Group, Ltd. . . . . . . . . . . . . . . . . . . . . . . . . . . . . . 5,851 9,855Bapcor, Ltd. . . . . . . . . . . . . . . . . . . . . . . . . . . . . . . . . . . . . . . 39,977 220,306Beach Energy, Ltd. . . . . . . . . . . . . . . . . . . . . . . . . . . . . . . . . . 902,659 1,396,657Beadell Resources, Ltd. (b) . . . . . . . . . . . . . . . . . . . . . . . . . . . . 102,327 4,363Bega Cheese, Ltd. . . . . . . . . . . . . . . . . . . . . . . . . . . . . . . . . . . 77,553 381,703Bellamy’s Australia, Ltd. (b) . . . . . . . . . . . . . . . . . . . . . . . . . . . 19,257 142,352Bingo Industries, Ltd. . . . . . . . . . . . . . . . . . . . . . . . . . . . . . . . 30,588 69,464Blackmores, Ltd. . . . . . . . . . . . . . . . . . . . . . . . . . . . . . . . . . . 4,835 461,071Blue Sky Alternative Investments, Ltd. . . . . . . . . . . . . . . . . . . . . 6,725 7,701Bravura Solutions, Ltd. . . . . . . . . . . . . . . . . . . . . . . . . . . . . . . 32,185 102,608Breville Group, Ltd. . . . . . . . . . . . . . . . . . . . . . . . . . . . . . . . . . 34,410 325,307Brickworks, Ltd. . . . . . . . . . . . . . . . . . . . . . . . . . . . . . . . . . . . 5,923 74,899Bubs Australia, Ltd. (b) . . . . . . . . . . . . . . . . . . . . . . . . . . . . . . 5,279 2,419Buru Energy, Ltd. (b) . . . . . . . . . . . . . . . . . . . . . . . . . . . . . . . 72,570 13,897BWX, Ltd. . . . . . . . . . . . . . . . . . . . . . . . . . . . . . . . . . . . . . . . 2,270 5,908Cabcharge Australia, Ltd. . . . . . . . . . . . . . . . . . . . . . . . . . . . . . 55,813 91,582Capitol Health, Ltd. . . . . . . . . . . . . . . . . . . . . . . . . . . . . . . . . . 95,087 19,936Capral, Ltd. . . . . . . . . . . . . . . . . . . . . . . . . . . . . . . . . . . . . . . 136,176 15,267Cardno, Ltd. (b) . . . . . . . . . . . . . . . . . . . . . . . . . . . . . . . . . . . 69,333 58,910Carnarvon Petroleum, Ltd. (b) . . . . . . . . . . . . . . . . . . . . . . . . . . 282,013 81,471carsales.com, Ltd. . . . . . . . . . . . . . . . . . . . . . . . . . . . . . . . . . . 79,391 827,000Cash Converters International, Ltd. (b) . . . . . . . . . . . . . . . . . . . . 152,939 35,379Cedar Woods Properties, Ltd. . . . . . . . . . . . . . . . . . . . . . . . . . . 27,273 113,344Citadel Group, Ltd. (The) . . . . . . . . . . . . . . . . . . . . . . . . . . . . . 2,117 12,376Cleanaway Waste Management, Ltd. . . . . . . . . . . . . . . . . . . . . . 883,001 1,195,821Clinuvel Pharmaceuticals, Ltd. . . . . . . . . . . . . . . . . . . . . . . . . . . 5,706 90,555Clover Corp., Ltd. . . . . . . . . . . . . . . . . . . . . . . . . . . . . . . . . . . 34,945 39,320
Security Description Shares Value
Australia—(Continued)Codan, Ltd. . . . . . . . . . . . . . . . . . . . . . . . . . . . . . . . . . . . . . . 10,859 $ 25,276Collection House, Ltd. . . . . . . . . . . . . . . . . . . . . . . . . . . . . . . . 19,217 21,527Collins Foods, Ltd. . . . . . . . . . . . . . . . . . . . . . . . . . . . . . . . . . . 11,643 52,093Cooper Energy, Ltd. (b) . . . . . . . . . . . . . . . . . . . . . . . . . . . . . . 552,999 182,214Corporate Travel Management, Ltd. . . . . . . . . . . . . . . . . . . . . . . 22,148 486,075Costa Group Holdings, Ltd. . . . . . . . . . . . . . . . . . . . . . . . . . . . . 57,589 296,620Credit Corp. Group, Ltd. . . . . . . . . . . . . . . . . . . . . . . . . . . . . . . 13,415 215,797CSG, Ltd. (b) . . . . . . . . . . . . . . . . . . . . . . . . . . . . . . . . . . . . . 85,825 11,740CSR, Ltd. . . . . . . . . . . . . . . . . . . . . . . . . . . . . . . . . . . . . . . . . 239,936 651,902Cudeco, Ltd. (a) (b) (c) (d) . . . . . . . . . . . . . . . . . . . . . . . . . . . . 51,210 6,526Data #3, Ltd. . . . . . . . . . . . . . . . . . . . . . . . . . . . . . . . . . . . . . 55,471 59,363Decmil Group, Ltd. (b) . . . . . . . . . . . . . . . . . . . . . . . . . . . . . . . 65,887 36,602Dicker Data, Ltd. . . . . . . . . . . . . . . . . . . . . . . . . . . . . . . . . . . 5,634 12,097Domain Holdings Australia, Ltd. . . . . . . . . . . . . . . . . . . . . . . . . . 96,746 244,072Domino’s Pizza Enterprises, Ltd. . . . . . . . . . . . . . . . . . . . . . . . . 5,908 227,960Doray Minerals, Ltd. (b) . . . . . . . . . . . . . . . . . . . . . . . . . . . . . . 44,069 10,985Downer EDI, Ltd. . . . . . . . . . . . . . . . . . . . . . . . . . . . . . . . . . . 181,569 1,032,539DuluxGroup, Ltd. . . . . . . . . . . . . . . . . . . . . . . . . . . . . . . . . . . 144,897 800,597DWS, Ltd. . . . . . . . . . . . . . . . . . . . . . . . . . . . . . . . . . . . . . . . 36,847 31,587Eclipx Group, Ltd. . . . . . . . . . . . . . . . . . . . . . . . . . . . . . . . . . . 7,140 13,231Elders, Ltd. . . . . . . . . . . . . . . . . . . . . . . . . . . . . . . . . . . . . . . 32,731 167,704Energy Resources of Australia, Ltd. (b) . . . . . . . . . . . . . . . . . . . . 51,910 14,256Energy World Corp., Ltd. (b) . . . . . . . . . . . . . . . . . . . . . . . . . . . 325,379 44,658EQT Holdings, Ltd. . . . . . . . . . . . . . . . . . . . . . . . . . . . . . . . . . 3,062 52,222ERM Power, Ltd. . . . . . . . . . . . . . . . . . . . . . . . . . . . . . . . . . . . 49,991 60,889Estia Health, Ltd. . . . . . . . . . . . . . . . . . . . . . . . . . . . . . . . . . . 8,310 14,250Euroz, Ltd. . . . . . . . . . . . . . . . . . . . . . . . . . . . . . . . . . . . . . . 23,559 21,456Event Hospitality and Entertainment, Ltd. . . . . . . . . . . . . . . . . . . 38,556 412,493Fairfax Media, Ltd. . . . . . . . . . . . . . . . . . . . . . . . . . . . . . . . . . 967,464 576,636FAR, Ltd. (b) . . . . . . . . . . . . . . . . . . . . . . . . . . . . . . . . . . . . . 653,097 54,058Finbar Group, Ltd. . . . . . . . . . . . . . . . . . . . . . . . . . . . . . . . . . 6,909 4,444Fleetwood Corp., Ltd. . . . . . . . . . . . . . . . . . . . . . . . . . . . . . . . 35,042 59,451FlexiGroup, Ltd. . . . . . . . . . . . . . . . . . . . . . . . . . . . . . . . . . . . 60,577 83,824G8 Education, Ltd. . . . . . . . . . . . . . . . . . . . . . . . . . . . . . . . . . 158,694 229,360Galaxy Resources, Ltd. (b) . . . . . . . . . . . . . . . . . . . . . . . . . . . . 98,235 176,026Galilee Energy, Ltd. (b) . . . . . . . . . . . . . . . . . . . . . . . . . . . . . . 43,169 22,156Gateway Lifestyle . . . . . . . . . . . . . . . . . . . . . . . . . . . . . . . . . . 49,118 79,533Genworth Mortgage Insurance Australia, Ltd. . . . . . . . . . . . . . . . . 42,575 75,717Global Construction Services, Ltd. . . . . . . . . . . . . . . . . . . . . . . . . 9,380 4,746Gold Road Resources, Ltd. (b) . . . . . . . . . . . . . . . . . . . . . . . . . . 132,712 65,231GrainCorp, Ltd. - Class A . . . . . . . . . . . . . . . . . . . . . . . . . . . . . 83,590 476,824Grange Resources, Ltd. . . . . . . . . . . . . . . . . . . . . . . . . . . . . . . 120,000 19,554Greencross, Ltd. . . . . . . . . . . . . . . . . . . . . . . . . . . . . . . . . . . . 21,736 66,393Greenland Minerals Ltd. (b) . . . . . . . . . . . . . . . . . . . . . . . . . . . 349,524 20,213GUD Holdings, Ltd. . . . . . . . . . . . . . . . . . . . . . . . . . . . . . . . . . 39,734 416,068GWA Group, Ltd. . . . . . . . . . . . . . . . . . . . . . . . . . . . . . . . . . . 92,856 209,554Hansen Technologies, Ltd. . . . . . . . . . . . . . . . . . . . . . . . . . . . . 50,238 134,825Harvey Norman Holdings, Ltd. . . . . . . . . . . . . . . . . . . . . . . . . . 21,381 54,403Healthscope, Ltd. . . . . . . . . . . . . . . . . . . . . . . . . . . . . . . . . . . 16,123 24,445Hills, Ltd. (b) . . . . . . . . . . . . . . . . . . . . . . . . . . . . . . . . . . . . . 80,453 10,634Horizon Oil, Ltd. (b) . . . . . . . . . . . . . . . . . . . . . . . . . . . . . . . . 652,736 70,484HT&E, Ltd. . . . . . . . . . . . . . . . . . . . . . . . . . . . . . . . . . . . . . . . 109,386 237,115IDM International, Ltd. (a) (b) (c) (d) . . . . . . . . . . . . . . . . . . . . . 1,969 0IDP Education, Ltd. . . . . . . . . . . . . . . . . . . . . . . . . . . . . . . . . . 1,987 14,810Iluka Resources, Ltd. . . . . . . . . . . . . . . . . . . . . . . . . . . . . . . . . 35,317 252,972Imdex, Ltd. (b) . . . . . . . . . . . . . . . . . . . . . . . . . . . . . . . . . . . 100,165 86,183IMF Bentham, Ltd. . . . . . . . . . . . . . . . . . . . . . . . . . . . . . . . . . 49,173 107,695
BHFTII-62

Brighthouse Funds Trust II
Brighthouse/Dimensional International Small Company Portfolio
Schedule of Investments as of September 30, 2018 (Unaudited)
Common Stocks—(Continued)
Security Description Shares Value
Australia—(Continued)Independence Group NL . . . . . . . . . . . . . . . . . . . . . . . . . . . . . . 112,057 $ 375,419Infigen Energy, Ltd. (b) . . . . . . . . . . . . . . . . . . . . . . . . . . . . . . 343,467 146,104Infomedia, Ltd. . . . . . . . . . . . . . . . . . . . . . . . . . . . . . . . . . . . 131,353 124,387Inghams Group, Ltd. . . . . . . . . . . . . . . . . . . . . . . . . . . . . . . . . 61,587 172,765Integral Diagnostics, Ltd. . . . . . . . . . . . . . . . . . . . . . . . . . . . . . 6,767 13,415Integrated Research, Ltd. . . . . . . . . . . . . . . . . . . . . . . . . . . . . . 28,972 57,179International Ferro Metals, Ltd. (a) (b) (c) (d) . . . . . . . . . . . . . . . 82,765 0Invocare, Ltd. . . . . . . . . . . . . . . . . . . . . . . . . . . . . . . . . . . . . 38,500 343,478IOOF Holdings, Ltd. . . . . . . . . . . . . . . . . . . . . . . . . . . . . . . . . . 118,246 695,805IPH, Ltd. . . . . . . . . . . . . . . . . . . . . . . . . . . . . . . . . . . . . . . . . 31,372 136,496Iress, Ltd. . . . . . . . . . . . . . . . . . . . . . . . . . . . . . . . . . . . . . . . 54,057 496,727iSelect, Ltd. . . . . . . . . . . . . . . . . . . . . . . . . . . . . . . . . . . . . . . 46,213 23,476iSentia Group, Ltd. . . . . . . . . . . . . . . . . . . . . . . . . . . . . . . . . . 28,120 6,694Japara Healthcare, Ltd. . . . . . . . . . . . . . . . . . . . . . . . . . . . . . . 32,040 32,078JB Hi-Fi, Ltd. . . . . . . . . . . . . . . . . . . . . . . . . . . . . . . . . . . . . . 46,350 839,728Jumbo Interactive, Ltd. . . . . . . . . . . . . . . . . . . . . . . . . . . . . . . 12,118 66,454Jupiter Mines, Ltd. . . . . . . . . . . . . . . . . . . . . . . . . . . . . . . . . . 53,689 13,197K&S Corp., Ltd. . . . . . . . . . . . . . . . . . . . . . . . . . . . . . . . . . . . 1,802 1,952Karoon Gas Australia, Ltd. (b) . . . . . . . . . . . . . . . . . . . . . . . . . . 75,600 60,639Kingsgate Consolidated, Ltd. (b) . . . . . . . . . . . . . . . . . . . . . . . . 121,238 18,745Kingsrose Mining, Ltd. (b) . . . . . . . . . . . . . . . . . . . . . . . . . . . . 102,961 4,392Kogan.com, Ltd. . . . . . . . . . . . . . . . . . . . . . . . . . . . . . . . . . . . 8,313 33,847Lifestyle Communities, Ltd. . . . . . . . . . . . . . . . . . . . . . . . . . . . . 7,615 33,278Link Administration Holdings, Ltd. . . . . . . . . . . . . . . . . . . . . . . . 103,225 579,176Lovisa Holdings, Ltd. . . . . . . . . . . . . . . . . . . . . . . . . . . . . . . . . 11,216 83,237Lynas Corp., Ltd. (b) . . . . . . . . . . . . . . . . . . . . . . . . . . . . . . . . 50,144 57,820MACA, Ltd. . . . . . . . . . . . . . . . . . . . . . . . . . . . . . . . . . . . . . . 56,351 49,469Macmahon Holdings, Ltd. (b) . . . . . . . . . . . . . . . . . . . . . . . . . . 380,170 71,448Magellan Financial Group, Ltd. . . . . . . . . . . . . . . . . . . . . . . . . . 17,928 356,260MaxiTRANS Industries, Ltd. . . . . . . . . . . . . . . . . . . . . . . . . . . . . 59,013 21,958Mayne Pharma Group, Ltd. (b) . . . . . . . . . . . . . . . . . . . . . . . . . 452,144 424,105McMillan Shakespeare, Ltd. . . . . . . . . . . . . . . . . . . . . . . . . . . . 29,453 361,889McPherson’s, Ltd. . . . . . . . . . . . . . . . . . . . . . . . . . . . . . . . . . . 34,460 39,361Medusa Mining, Ltd. (b) . . . . . . . . . . . . . . . . . . . . . . . . . . . . . . 60,972 16,530Metals X, Ltd. . . . . . . . . . . . . . . . . . . . . . . . . . . . . . . . . . . . . 84,827 36,124Metcash, Ltd. . . . . . . . . . . . . . . . . . . . . . . . . . . . . . . . . . . . . . 385,184 833,793Mincor Resources NL (b) . . . . . . . . . . . . . . . . . . . . . . . . . . . . . 105,687 28,945Mineral Resources, Ltd. . . . . . . . . . . . . . . . . . . . . . . . . . . . . . . 41,091 471,920MMA Offshore, Ltd. (b) . . . . . . . . . . . . . . . . . . . . . . . . . . . . . . 200,470 35,497Moelis Australia, Ltd. . . . . . . . . . . . . . . . . . . . . . . . . . . . . . . . . 4,454 17,545Monadelphous Group, Ltd. . . . . . . . . . . . . . . . . . . . . . . . . . . . . 40,177 464,799Monash IVF Group, Ltd. . . . . . . . . . . . . . . . . . . . . . . . . . . . . . . 21,931 17,358Money3 Corp., Ltd. . . . . . . . . . . . . . . . . . . . . . . . . . . . . . . . . . 25,929 41,234Morning Star Gold NL (a) (b) (c) (d) . . . . . . . . . . . . . . . . . . . . . . 33,455 0Mortgage Choice, Ltd. . . . . . . . . . . . . . . . . . . . . . . . . . . . . . . . 48,689 48,014Mount Gibson Iron, Ltd. . . . . . . . . . . . . . . . . . . . . . . . . . . . . . . 382,742 127,210Myer Holdings, Ltd. . . . . . . . . . . . . . . . . . . . . . . . . . . . . . . . . . 355,143 130,918MYOB Group, Ltd. . . . . . . . . . . . . . . . . . . . . . . . . . . . . . . . . . . 110,434 240,921MyState, Ltd. . . . . . . . . . . . . . . . . . . . . . . . . . . . . . . . . . . . . . 3,899 13,614Navigator Global Investments, Ltd. . . . . . . . . . . . . . . . . . . . . . . . 45,623 175,467Navitas, Ltd. . . . . . . . . . . . . . . . . . . . . . . . . . . . . . . . . . . . . . 85,117 274,182NetComm Wireless, Ltd. (b) . . . . . . . . . . . . . . . . . . . . . . . . . . . 18,166 9,126New Hope Corp., Ltd. . . . . . . . . . . . . . . . . . . . . . . . . . . . . . . . 12,312 35,145nib holdings, Ltd. . . . . . . . . . . . . . . . . . . . . . . . . . . . . . . . . . . 171,993 727,210Nick Scali, Ltd. . . . . . . . . . . . . . . . . . . . . . . . . . . . . . . . . . . . . 16,348 76,089Nine Entertainment Co. Holdings, Ltd. . . . . . . . . . . . . . . . . . . . . . 178,126 290,328Northern Star Resources, Ltd. . . . . . . . . . . . . . . . . . . . . . . . . . . 158,537 950,317
Security Description Shares Value
Australia—(Continued)NRW Holdings, Ltd. (b) . . . . . . . . . . . . . . . . . . . . . . . . . . . . . . 62,111 $ 93,836Nufarm, Ltd. . . . . . . . . . . . . . . . . . . . . . . . . . . . . . . . . . . . . . 96,965 472,220OceanaGold Corp. . . . . . . . . . . . . . . . . . . . . . . . . . . . . . . . . . . 166,811 503,668OFX Group, Ltd. . . . . . . . . . . . . . . . . . . . . . . . . . . . . . . . . . . . 99,303 163,722Onevue Holdings, Ltd. (b) . . . . . . . . . . . . . . . . . . . . . . . . . . . . 33,268 17,792oOh!media, Ltd. . . . . . . . . . . . . . . . . . . . . . . . . . . . . . . . . . . . 44,310 163,693Orora, Ltd. . . . . . . . . . . . . . . . . . . . . . . . . . . . . . . . . . . . . . . 299,296 717,235OZ Minerals, Ltd. . . . . . . . . . . . . . . . . . . . . . . . . . . . . . . . . . . 134,369 904,167Pacific Current Group, Ltd. . . . . . . . . . . . . . . . . . . . . . . . . . . . . 5,535 25,921Pacific Niugini, Ltd. (b) . . . . . . . . . . . . . . . . . . . . . . . . . . . . . . 61,527 7,757Pacific Smiles Group, Ltd. . . . . . . . . . . . . . . . . . . . . . . . . . . . . . 13,431 15,090Pact Group Holdings, Ltd. . . . . . . . . . . . . . . . . . . . . . . . . . . . . . 5,137 13,764Panoramic Resources, Ltd. (b) . . . . . . . . . . . . . . . . . . . . . . . . . . 167,563 66,625Paragon Care, Ltd. . . . . . . . . . . . . . . . . . . . . . . . . . . . . . . . . . 33,636 17,744Peet, Ltd. . . . . . . . . . . . . . . . . . . . . . . . . . . . . . . . . . . . . . . . 88,199 74,920Pendal Group, Ltd. . . . . . . . . . . . . . . . . . . . . . . . . . . . . . . . . . 32,196 204,534Peninsula Energy, Ltd. (b) . . . . . . . . . . . . . . . . . . . . . . . . . . . . 11,352 2,206Perpetual, Ltd. . . . . . . . . . . . . . . . . . . . . . . . . . . . . . . . . . . . . 17,753 543,859Perseus Mining, Ltd. (b) . . . . . . . . . . . . . . . . . . . . . . . . . . . . . . 231,401 63,536Platinum Asset Management, Ltd. . . . . . . . . . . . . . . . . . . . . . . . 46,344 178,531Pluton Resources, Ltd. (a) (b) (c) (d) . . . . . . . . . . . . . . . . . . . . . 48,332 0PMP, Ltd. (b) . . . . . . . . . . . . . . . . . . . . . . . . . . . . . . . . . . . . . 158,703 21,792Praemium, Ltd. (b) . . . . . . . . . . . . . . . . . . . . . . . . . . . . . . . . . 61,841 49,602Premier Investments, Ltd. . . . . . . . . . . . . . . . . . . . . . . . . . . . . 44,992 599,760Primary Health Care, Ltd. . . . . . . . . . . . . . . . . . . . . . . . . . . . . . 291,166 640,497Prime Media Group, Ltd. . . . . . . . . . . . . . . . . . . . . . . . . . . . . . 93,371 16,259Pro Medicus, Ltd. . . . . . . . . . . . . . . . . . . . . . . . . . . . . . . . . . . 13,002 117,508PWR Holdings, Ltd. . . . . . . . . . . . . . . . . . . . . . . . . . . . . . . . . . 5,725 13,243Qube Holdings, Ltd. . . . . . . . . . . . . . . . . . . . . . . . . . . . . . . . . 219,677 433,037Quintis, Ltd. (a) (b) (c) (d) . . . . . . . . . . . . . . . . . . . . . . . . . . . . 106,522 5,193RCR Tomlinson, Ltd. . . . . . . . . . . . . . . . . . . . . . . . . . . . . . . . . 113,813 88,372Reckon, Ltd. . . . . . . . . . . . . . . . . . . . . . . . . . . . . . . . . . . . . . 36,898 22,713Regis Healthcare, Ltd. . . . . . . . . . . . . . . . . . . . . . . . . . . . . . . . 29,394 61,586Regis Resources, Ltd. . . . . . . . . . . . . . . . . . . . . . . . . . . . . . . . . 180,703 484,984Reject Shop, Ltd. (The) . . . . . . . . . . . . . . . . . . . . . . . . . . . . . . 12,421 42,553Resolute Mining, Ltd. . . . . . . . . . . . . . . . . . . . . . . . . . . . . . . . . 277,334 217,101Retail Food Group, Ltd. . . . . . . . . . . . . . . . . . . . . . . . . . . . . . . 64,643 22,188Ridley Corp., Ltd. . . . . . . . . . . . . . . . . . . . . . . . . . . . . . . . . . . 123,003 135,614RPMGlobal Holdings, Ltd. (b) . . . . . . . . . . . . . . . . . . . . . . . . . . 4,190 2,051Ruralco Holdings, Ltd. . . . . . . . . . . . . . . . . . . . . . . . . . . . . . . . 9,291 19,545Salmat, Ltd. . . . . . . . . . . . . . . . . . . . . . . . . . . . . . . . . . . . . . . 45,807 18,214Sandfire Resources NL . . . . . . . . . . . . . . . . . . . . . . . . . . . . . . . 40,717 217,974Saracen Mineral Holdings, Ltd. (b) . . . . . . . . . . . . . . . . . . . . . . . 349,701 470,843SeaLink Travel Group, Ltd. . . . . . . . . . . . . . . . . . . . . . . . . . . . . 7,812 24,277Select Harvests, Ltd. . . . . . . . . . . . . . . . . . . . . . . . . . . . . . . . . 35,131 135,107Senex Energy, Ltd. (b) . . . . . . . . . . . . . . . . . . . . . . . . . . . . . . . 311,194 112,453Servcorp, Ltd. . . . . . . . . . . . . . . . . . . . . . . . . . . . . . . . . . . . . 21,215 61,000Service Stream, Ltd. . . . . . . . . . . . . . . . . . . . . . . . . . . . . . . . . 62,705 81,680Seven Group Holdings, Ltd. . . . . . . . . . . . . . . . . . . . . . . . . . . . 8,590 140,537Seven West Media, Ltd. . . . . . . . . . . . . . . . . . . . . . . . . . . . . . . 408,410 295,614SG Fleet Group, Ltd. . . . . . . . . . . . . . . . . . . . . . . . . . . . . . . . . 14,799 40,330Sigma Healthcare, Ltd. . . . . . . . . . . . . . . . . . . . . . . . . . . . . . . 560,969 253,552Silver Chef, Ltd. . . . . . . . . . . . . . . . . . . . . . . . . . . . . . . . . . . . 8,928 13,491Silver Lake Resources, Ltd. (b) . . . . . . . . . . . . . . . . . . . . . . . . . 112,092 41,650SmartGroup Corp., Ltd. . . . . . . . . . . . . . . . . . . . . . . . . . . . . . . 22,008 189,128Southern Cross Media Group, Ltd. . . . . . . . . . . . . . . . . . . . . . . . 229,061 212,721Spark Infrastructure Group . . . . . . . . . . . . . . . . . . . . . . . . . . . . 444,329 717,899
BHFTII-63
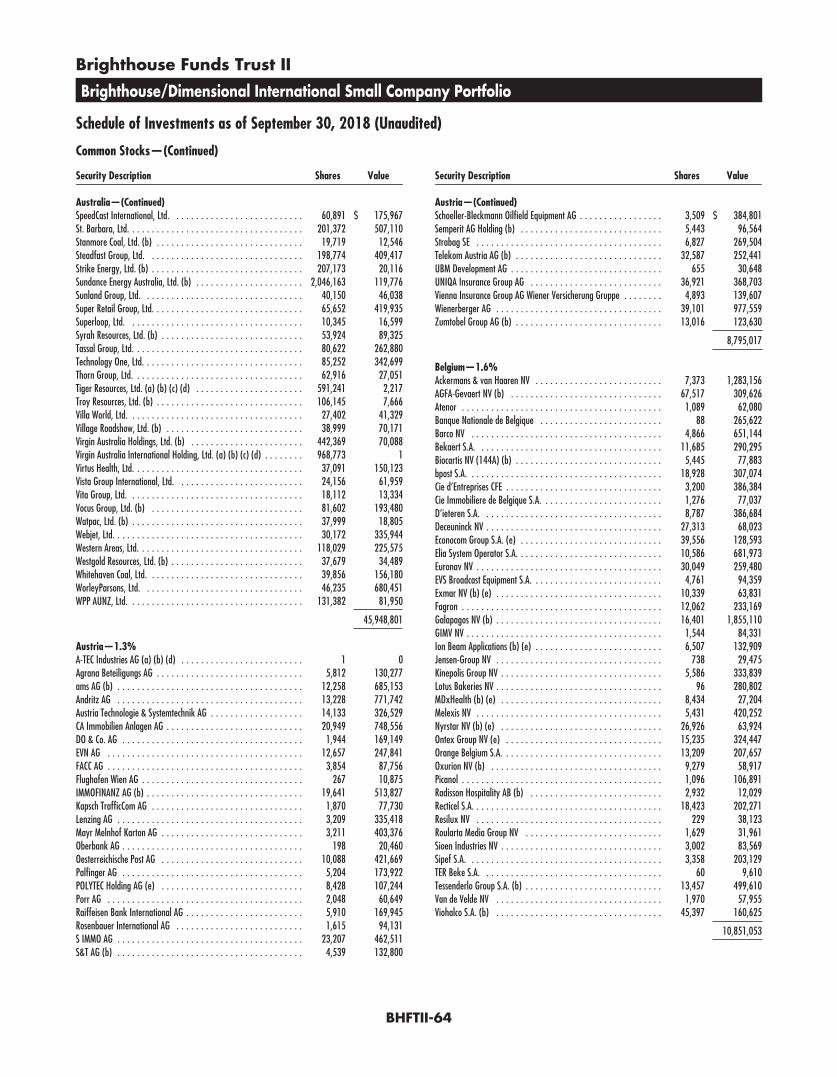
Brighthouse Funds Trust II
Brighthouse/Dimensional International Small Company Portfolio
Schedule of Investments as of September 30, 2018 (Unaudited)
Common Stocks—(Continued)
Security Description Shares Value
Australia—(Continued)SpeedCast International, Ltd. . . . . . . . . . . . . . . . . . . . . . . . . . . 60,891 $ 175,967St. Barbara, Ltd. . . . . . . . . . . . . . . . . . . . . . . . . . . . . . . . . . . . 201,372 507,110Stanmore Coal, Ltd. (b) . . . . . . . . . . . . . . . . . . . . . . . . . . . . . . 19,719 12,546Steadfast Group, Ltd. . . . . . . . . . . . . . . . . . . . . . . . . . . . . . . . 198,774 409,417Strike Energy, Ltd. (b) . . . . . . . . . . . . . . . . . . . . . . . . . . . . . . . 207,173 20,116Sundance Energy Australia, Ltd. (b) . . . . . . . . . . . . . . . . . . . . . . 2,046,163 119,776Sunland Group, Ltd. . . . . . . . . . . . . . . . . . . . . . . . . . . . . . . . . 40,150 46,038Super Retail Group, Ltd. . . . . . . . . . . . . . . . . . . . . . . . . . . . . . . 65,652 419,935Superloop, Ltd. . . . . . . . . . . . . . . . . . . . . . . . . . . . . . . . . . . . 10,345 16,599Syrah Resources, Ltd. (b) . . . . . . . . . . . . . . . . . . . . . . . . . . . . . 53,924 89,325Tassal Group, Ltd. . . . . . . . . . . . . . . . . . . . . . . . . . . . . . . . . . . 80,622 262,880Technology One, Ltd. . . . . . . . . . . . . . . . . . . . . . . . . . . . . . . . . 85,252 342,699Thorn Group, Ltd. . . . . . . . . . . . . . . . . . . . . . . . . . . . . . . . . . . 62,916 27,051Tiger Resources, Ltd. (a) (b) (c) (d) . . . . . . . . . . . . . . . . . . . . . . 591,241 2,217Troy Resources, Ltd. (b) . . . . . . . . . . . . . . . . . . . . . . . . . . . . . . 106,145 7,666Villa World, Ltd. . . . . . . . . . . . . . . . . . . . . . . . . . . . . . . . . . . . 27,402 41,329Village Roadshow, Ltd. (b) . . . . . . . . . . . . . . . . . . . . . . . . . . . . 38,999 70,171Virgin Australia Holdings, Ltd. (b) . . . . . . . . . . . . . . . . . . . . . . . 442,369 70,088Virgin Australia International Holding, Ltd. (a) (b) (c) (d) . . . . . . . . 968,773 1Virtus Health, Ltd. . . . . . . . . . . . . . . . . . . . . . . . . . . . . . . . . . . 37,091 150,123Vista Group International, Ltd. . . . . . . . . . . . . . . . . . . . . . . . . . 24,156 61,959Vita Group, Ltd. . . . . . . . . . . . . . . . . . . . . . . . . . . . . . . . . . . . 18,112 13,334Vocus Group, Ltd. (b) . . . . . . . . . . . . . . . . . . . . . . . . . . . . . . . 81,602 193,480Watpac, Ltd. (b) . . . . . . . . . . . . . . . . . . . . . . . . . . . . . . . . . . . 37,999 18,805Webjet, Ltd. . . . . . . . . . . . . . . . . . . . . . . . . . . . . . . . . . . . . . . 30,172 335,944Western Areas, Ltd. . . . . . . . . . . . . . . . . . . . . . . . . . . . . . . . . . 118,029 225,575Westgold Resources, Ltd. (b) . . . . . . . . . . . . . . . . . . . . . . . . . . . 37,679 34,489Whitehaven Coal, Ltd. . . . . . . . . . . . . . . . . . . . . . . . . . . . . . . . 39,856 156,180WorleyParsons, Ltd. . . . . . . . . . . . . . . . . . . . . . . . . . . . . . . . . 46,235 680,451WPP AUNZ, Ltd. . . . . . . . . . . . . . . . . . . . . . . . . . . . . . . . . . . . 131,382 81,950
45,948,801
Austria—1.3%A-TEC Industries AG (a) (b) (d) . . . . . . . . . . . . . . . . . . . . . . . . . 1 0Agrana Beteiligungs AG . . . . . . . . . . . . . . . . . . . . . . . . . . . . . . 5,812 130,277ams AG (b) . . . . . . . . . . . . . . . . . . . . . . . . . . . . . . . . . . . . . . 12,258 685,153Andritz AG . . . . . . . . . . . . . . . . . . . . . . . . . . . . . . . . . . . . . . 13,228 771,742Austria Technologie & Systemtechnik AG . . . . . . . . . . . . . . . . . . . 14,133 326,529CA Immobilien Anlagen AG . . . . . . . . . . . . . . . . . . . . . . . . . . . . 20,949 748,556DO & Co. AG . . . . . . . . . . . . . . . . . . . . . . . . . . . . . . . . . . . . . 1,944 169,149EVN AG . . . . . . . . . . . . . . . . . . . . . . . . . . . . . . . . . . . . . . . . 12,657 247,841FACC AG . . . . . . . . . . . . . . . . . . . . . . . . . . . . . . . . . . . . . . . . 3,854 87,756Flughafen Wien AG . . . . . . . . . . . . . . . . . . . . . . . . . . . . . . . . . 267 10,875IMMOFINANZ AG (b) . . . . . . . . . . . . . . . . . . . . . . . . . . . . . . . . 19,641 513,827Kapsch TrafficCom AG . . . . . . . . . . . . . . . . . . . . . . . . . . . . . . . 1,870 77,730Lenzing AG . . . . . . . . . . . . . . . . . . . . . . . . . . . . . . . . . . . . . . 3,209 335,418Mayr Melnhof Karton AG . . . . . . . . . . . . . . . . . . . . . . . . . . . . . 3,211 403,376Oberbank AG . . . . . . . . . . . . . . . . . . . . . . . . . . . . . . . . . . . . . 198 20,460Oesterreichische Post AG . . . . . . . . . . . . . . . . . . . . . . . . . . . . . 10,088 421,669Palfinger AG . . . . . . . . . . . . . . . . . . . . . . . . . . . . . . . . . . . . . 5,204 173,922POLYTEC Holding AG (e) . . . . . . . . . . . . . . . . . . . . . . . . . . . . . 8,428 107,244Porr AG . . . . . . . . . . . . . . . . . . . . . . . . . . . . . . . . . . . . . . . . 2,048 60,649Raiffeisen Bank International AG . . . . . . . . . . . . . . . . . . . . . . . . 5,910 169,945Rosenbauer International AG . . . . . . . . . . . . . . . . . . . . . . . . . . 1,615 94,131S IMMO AG . . . . . . . . . . . . . . . . . . . . . . . . . . . . . . . . . . . . . . 23,207 462,511S&T AG (b) . . . . . . . . . . . . . . . . . . . . . . . . . . . . . . . . . . . . . . 4,539 132,800
Security Description Shares Value
Austria—(Continued)Schoeller-Bleckmann Oilfield Equipment AG . . . . . . . . . . . . . . . . . 3,509 $ 384,801Semperit AG Holding (b) . . . . . . . . . . . . . . . . . . . . . . . . . . . . . 5,443 96,564Strabag SE . . . . . . . . . . . . . . . . . . . . . . . . . . . . . . . . . . . . . . 6,827 269,504Telekom Austria AG (b) . . . . . . . . . . . . . . . . . . . . . . . . . . . . . . 32,587 252,441UBM Development AG . . . . . . . . . . . . . . . . . . . . . . . . . . . . . . . 655 30,648UNIQA Insurance Group AG . . . . . . . . . . . . . . . . . . . . . . . . . . . 36,921 368,703Vienna Insurance Group AG Wiener Versicherung Gruppe . . . . . . . . 4,893 139,607Wienerberger AG . . . . . . . . . . . . . . . . . . . . . . . . . . . . . . . . . . 39,101 977,559Zumtobel Group AG (b) . . . . . . . . . . . . . . . . . . . . . . . . . . . . . . 13,016 123,630
8,795,017
Belgium—1.6%Ackermans & van Haaren NV . . . . . . . . . . . . . . . . . . . . . . . . . . 7,373 1,283,156AGFA-Gevaert NV (b) . . . . . . . . . . . . . . . . . . . . . . . . . . . . . . . 67,517 309,626Atenor . . . . . . . . . . . . . . . . . . . . . . . . . . . . . . . . . . . . . . . . . 1,089 62,080Banque Nationale de Belgique . . . . . . . . . . . . . . . . . . . . . . . . . 88 265,622Barco NV . . . . . . . . . . . . . . . . . . . . . . . . . . . . . . . . . . . . . . . 4,866 651,144Bekaert S.A. . . . . . . . . . . . . . . . . . . . . . . . . . . . . . . . . . . . . . 11,685 290,295Biocartis NV (144A) (b) . . . . . . . . . . . . . . . . . . . . . . . . . . . . . . 5,445 77,883bpost S.A. . . . . . . . . . . . . . . . . . . . . . . . . . . . . . . . . . . . . . . . 18,928 307,074Cie d’Entreprises CFE . . . . . . . . . . . . . . . . . . . . . . . . . . . . . . . . 3,200 386,384Cie Immobiliere de Belgique S.A. . . . . . . . . . . . . . . . . . . . . . . . . 1,276 77,037D’ieteren S.A. . . . . . . . . . . . . . . . . . . . . . . . . . . . . . . . . . . . . 8,787 386,684Deceuninck NV . . . . . . . . . . . . . . . . . . . . . . . . . . . . . . . . . . . . 27,313 68,023Econocom Group S.A. (e) . . . . . . . . . . . . . . . . . . . . . . . . . . . . . 39,556 128,593Elia System Operator S.A. . . . . . . . . . . . . . . . . . . . . . . . . . . . . . 10,586 681,973Euronav NV . . . . . . . . . . . . . . . . . . . . . . . . . . . . . . . . . . . . . . 30,049 259,480EVS Broadcast Equipment S.A. . . . . . . . . . . . . . . . . . . . . . . . . . . 4,761 94,359Exmar NV (b) (e) . . . . . . . . . . . . . . . . . . . . . . . . . . . . . . . . . . 10,339 63,831Fagron . . . . . . . . . . . . . . . . . . . . . . . . . . . . . . . . . . . . . . . . . 12,062 233,169Galapagos NV (b) . . . . . . . . . . . . . . . . . . . . . . . . . . . . . . . . . . 16,401 1,855,110GIMV NV . . . . . . . . . . . . . . . . . . . . . . . . . . . . . . . . . . . . . . . . 1,544 84,331Ion Beam Applications (b) (e) . . . . . . . . . . . . . . . . . . . . . . . . . . 6,507 132,909Jensen-Group NV . . . . . . . . . . . . . . . . . . . . . . . . . . . . . . . . . . 738 29,475Kinepolis Group NV . . . . . . . . . . . . . . . . . . . . . . . . . . . . . . . . . 5,586 333,839Lotus Bakeries NV . . . . . . . . . . . . . . . . . . . . . . . . . . . . . . . . . . 96 280,802MDxHealth (b) (e) . . . . . . . . . . . . . . . . . . . . . . . . . . . . . . . . . 8,434 27,204Melexis NV . . . . . . . . . . . . . . . . . . . . . . . . . . . . . . . . . . . . . . 5,431 420,252Nyrstar NV (b) (e) . . . . . . . . . . . . . . . . . . . . . . . . . . . . . . . . . 26,926 63,924Ontex Group NV (e) . . . . . . . . . . . . . . . . . . . . . . . . . . . . . . . . 15,235 324,447Orange Belgium S.A. . . . . . . . . . . . . . . . . . . . . . . . . . . . . . . . . 13,209 207,657Oxurion NV (b) . . . . . . . . . . . . . . . . . . . . . . . . . . . . . . . . . . . 9,279 58,917Picanol . . . . . . . . . . . . . . . . . . . . . . . . . . . . . . . . . . . . . . . . . 1,096 106,891Radisson Hospitality AB (b) . . . . . . . . . . . . . . . . . . . . . . . . . . . 2,932 12,029Recticel S.A. . . . . . . . . . . . . . . . . . . . . . . . . . . . . . . . . . . . . . . 18,423 202,271Resilux NV . . . . . . . . . . . . . . . . . . . . . . . . . . . . . . . . . . . . . . 229 38,123Roularta Media Group NV . . . . . . . . . . . . . . . . . . . . . . . . . . . . 1,629 31,961Sioen Industries NV . . . . . . . . . . . . . . . . . . . . . . . . . . . . . . . . . 3,002 83,569Sipef S.A. . . . . . . . . . . . . . . . . . . . . . . . . . . . . . . . . . . . . . . . 3,358 203,129TER Beke S.A. . . . . . . . . . . . . . . . . . . . . . . . . . . . . . . . . . . . . 60 9,610Tessenderlo Group S.A. (b) . . . . . . . . . . . . . . . . . . . . . . . . . . . . 13,457 499,610Van de Velde NV . . . . . . . . . . . . . . . . . . . . . . . . . . . . . . . . . . 1,970 57,955Viohalco S.A. (b) . . . . . . . . . . . . . . . . . . . . . . . . . . . . . . . . . . 45,397 160,625
10,851,053
BHFTII-64
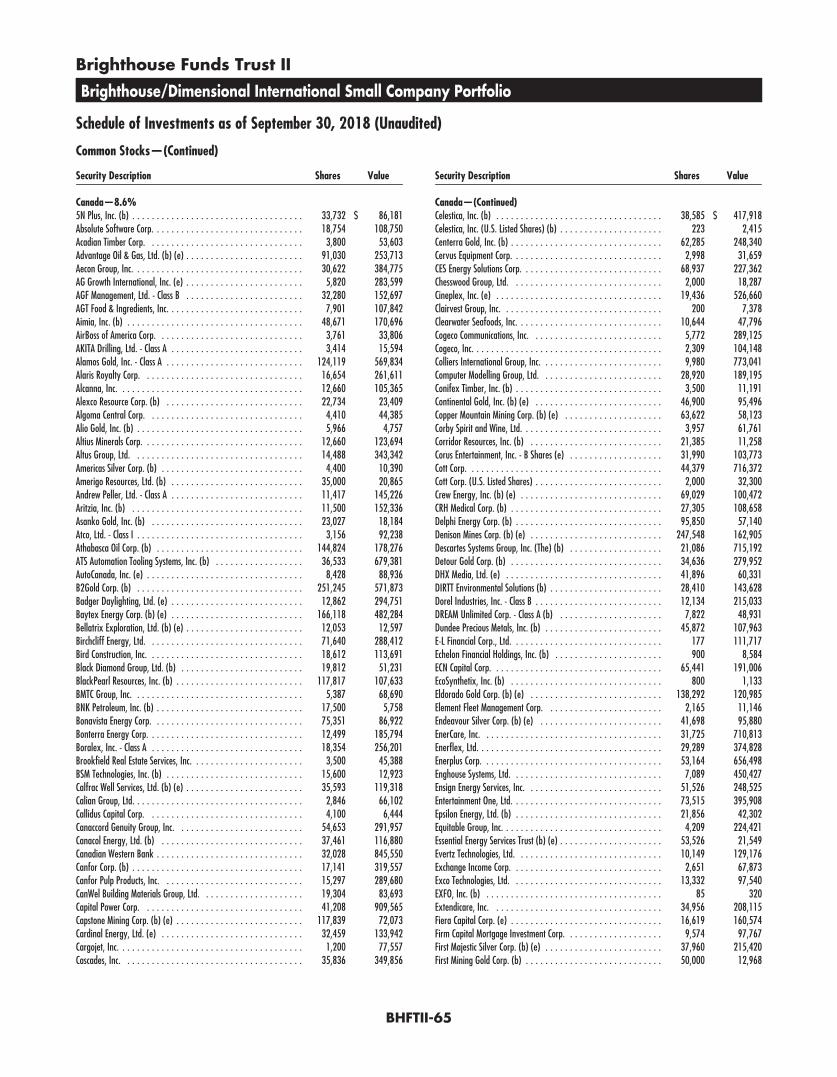
Brighthouse Funds Trust II
Brighthouse/Dimensional International Small Company Portfolio
Schedule of Investments as of September 30, 2018 (Unaudited)
Common Stocks—(Continued)
Security Description Shares Value
Canada—8.6%5N Plus, Inc. (b) . . . . . . . . . . . . . . . . . . . . . . . . . . . . . . . . . . . 33,732 $ 86,181Absolute Software Corp. . . . . . . . . . . . . . . . . . . . . . . . . . . . . . . 18,754 108,750Acadian Timber Corp. . . . . . . . . . . . . . . . . . . . . . . . . . . . . . . . 3,800 53,603Advantage Oil & Gas, Ltd. (b) (e) . . . . . . . . . . . . . . . . . . . . . . . . 91,030 253,713Aecon Group, Inc. . . . . . . . . . . . . . . . . . . . . . . . . . . . . . . . . . . 30,622 384,775AG Growth International, Inc. (e) . . . . . . . . . . . . . . . . . . . . . . . . 5,820 283,599AGF Management, Ltd. - Class B . . . . . . . . . . . . . . . . . . . . . . . . 32,280 152,697AGT Food & Ingredients, Inc. . . . . . . . . . . . . . . . . . . . . . . . . . . . 7,901 107,842Aimia, Inc. (b) . . . . . . . . . . . . . . . . . . . . . . . . . . . . . . . . . . . . 48,671 170,696AirBoss of America Corp. . . . . . . . . . . . . . . . . . . . . . . . . . . . . . 3,761 33,806AKITA Drilling, Ltd. - Class A . . . . . . . . . . . . . . . . . . . . . . . . . . . 3,414 15,594Alamos Gold, Inc. - Class A . . . . . . . . . . . . . . . . . . . . . . . . . . . . 124,119 569,834Alaris Royalty Corp. . . . . . . . . . . . . . . . . . . . . . . . . . . . . . . . . 16,654 261,611Alcanna, Inc. . . . . . . . . . . . . . . . . . . . . . . . . . . . . . . . . . . . . . 12,660 105,365Alexco Resource Corp. (b) . . . . . . . . . . . . . . . . . . . . . . . . . . . . 22,734 23,409Algoma Central Corp. . . . . . . . . . . . . . . . . . . . . . . . . . . . . . . . 4,410 44,385Alio Gold, Inc. (b) . . . . . . . . . . . . . . . . . . . . . . . . . . . . . . . . . . 5,966 4,757Altius Minerals Corp. . . . . . . . . . . . . . . . . . . . . . . . . . . . . . . . . 12,660 123,694Altus Group, Ltd. . . . . . . . . . . . . . . . . . . . . . . . . . . . . . . . . . . 14,488 343,342Americas Silver Corp. (b) . . . . . . . . . . . . . . . . . . . . . . . . . . . . . 4,400 10,390Amerigo Resources, Ltd. (b) . . . . . . . . . . . . . . . . . . . . . . . . . . . 35,000 20,865Andrew Peller, Ltd. - Class A . . . . . . . . . . . . . . . . . . . . . . . . . . . 11,417 145,226Aritzia, Inc. (b) . . . . . . . . . . . . . . . . . . . . . . . . . . . . . . . . . . . 11,500 152,336Asanko Gold, Inc. (b) . . . . . . . . . . . . . . . . . . . . . . . . . . . . . . . 23,027 18,184Atco, Ltd. - Class I . . . . . . . . . . . . . . . . . . . . . . . . . . . . . . . . . . 3,156 92,238Athabasca Oil Corp. (b) . . . . . . . . . . . . . . . . . . . . . . . . . . . . . . 144,824 178,276ATS Automation Tooling Systems, Inc. (b) . . . . . . . . . . . . . . . . . . 36,533 679,381AutoCanada, Inc. (e) . . . . . . . . . . . . . . . . . . . . . . . . . . . . . . . . 8,428 88,936B2Gold Corp. (b) . . . . . . . . . . . . . . . . . . . . . . . . . . . . . . . . . . 251,245 571,873Badger Daylighting, Ltd. (e) . . . . . . . . . . . . . . . . . . . . . . . . . . . 12,862 294,751Baytex Energy Corp. (b) (e) . . . . . . . . . . . . . . . . . . . . . . . . . . . 166,118 482,284Bellatrix Exploration, Ltd. (b) (e) . . . . . . . . . . . . . . . . . . . . . . . . 12,053 12,597Birchcliff Energy, Ltd. . . . . . . . . . . . . . . . . . . . . . . . . . . . . . . . 71,640 288,412Bird Construction, Inc. . . . . . . . . . . . . . . . . . . . . . . . . . . . . . . . 18,612 113,691Black Diamond Group, Ltd. (b) . . . . . . . . . . . . . . . . . . . . . . . . . 19,812 51,231BlackPearl Resources, Inc. (b) . . . . . . . . . . . . . . . . . . . . . . . . . . 117,817 107,633BMTC Group, Inc. . . . . . . . . . . . . . . . . . . . . . . . . . . . . . . . . . . 5,387 68,690BNK Petroleum, Inc. (b) . . . . . . . . . . . . . . . . . . . . . . . . . . . . . . 17,500 5,758Bonavista Energy Corp. . . . . . . . . . . . . . . . . . . . . . . . . . . . . . . 75,351 86,922Bonterra Energy Corp. . . . . . . . . . . . . . . . . . . . . . . . . . . . . . . . 12,499 185,794Boralex, Inc. - Class A . . . . . . . . . . . . . . . . . . . . . . . . . . . . . . . 18,354 256,201Brookfield Real Estate Services, Inc. . . . . . . . . . . . . . . . . . . . . . . 3,500 45,388BSM Technologies, Inc. (b) . . . . . . . . . . . . . . . . . . . . . . . . . . . . 15,600 12,923Calfrac Well Services, Ltd. (b) (e) . . . . . . . . . . . . . . . . . . . . . . . . 35,593 119,318Calian Group, Ltd. . . . . . . . . . . . . . . . . . . . . . . . . . . . . . . . . . . 2,846 66,102Callidus Capital Corp. . . . . . . . . . . . . . . . . . . . . . . . . . . . . . . . 4,100 6,444Canaccord Genuity Group, Inc. . . . . . . . . . . . . . . . . . . . . . . . . . 54,653 291,957Canacol Energy, Ltd. (b) . . . . . . . . . . . . . . . . . . . . . . . . . . . . . 37,461 116,880Canadian Western Bank . . . . . . . . . . . . . . . . . . . . . . . . . . . . . . 32,028 845,550Canfor Corp. (b) . . . . . . . . . . . . . . . . . . . . . . . . . . . . . . . . . . . 17,141 319,557Canfor Pulp Products, Inc. . . . . . . . . . . . . . . . . . . . . . . . . . . . . 15,297 289,680CanWel Building Materials Group, Ltd. . . . . . . . . . . . . . . . . . . . . 19,304 83,693Capital Power Corp. . . . . . . . . . . . . . . . . . . . . . . . . . . . . . . . . 41,208 909,565Capstone Mining Corp. (b) (e) . . . . . . . . . . . . . . . . . . . . . . . . . . 117,839 72,073Cardinal Energy, Ltd. (e) . . . . . . . . . . . . . . . . . . . . . . . . . . . . . 32,459 133,942Cargojet, Inc. . . . . . . . . . . . . . . . . . . . . . . . . . . . . . . . . . . . . . 1,200 77,557Cascades, Inc. . . . . . . . . . . . . . . . . . . . . . . . . . . . . . . . . . . . . 35,836 349,856
Security Description Shares Value
Canada—(Continued)Celestica, Inc. (b) . . . . . . . . . . . . . . . . . . . . . . . . . . . . . . . . . . 38,585 $ 417,918Celestica, Inc. (U.S. Listed Shares) (b) . . . . . . . . . . . . . . . . . . . . . 223 2,415Centerra Gold, Inc. (b) . . . . . . . . . . . . . . . . . . . . . . . . . . . . . . . 62,285 248,340Cervus Equipment Corp. . . . . . . . . . . . . . . . . . . . . . . . . . . . . . . 2,998 31,659CES Energy Solutions Corp. . . . . . . . . . . . . . . . . . . . . . . . . . . . . 68,937 227,362Chesswood Group, Ltd. . . . . . . . . . . . . . . . . . . . . . . . . . . . . . . 2,000 18,287Cineplex, Inc. (e) . . . . . . . . . . . . . . . . . . . . . . . . . . . . . . . . . . 19,436 526,660Clairvest Group, Inc. . . . . . . . . . . . . . . . . . . . . . . . . . . . . . . . . 200 7,378Clearwater Seafoods, Inc. . . . . . . . . . . . . . . . . . . . . . . . . . . . . . 10,644 47,796Cogeco Communications, Inc. . . . . . . . . . . . . . . . . . . . . . . . . . . 5,772 289,125Cogeco, Inc. . . . . . . . . . . . . . . . . . . . . . . . . . . . . . . . . . . . . . . 2,309 104,148Colliers International Group, Inc. . . . . . . . . . . . . . . . . . . . . . . . . 9,980 773,041Computer Modelling Group, Ltd. . . . . . . . . . . . . . . . . . . . . . . . . 28,920 189,195Conifex Timber, Inc. (b) . . . . . . . . . . . . . . . . . . . . . . . . . . . . . . 3,500 11,191Continental Gold, Inc. (b) (e) . . . . . . . . . . . . . . . . . . . . . . . . . . 46,900 95,496Copper Mountain Mining Corp. (b) (e) . . . . . . . . . . . . . . . . . . . . 63,622 58,123Corby Spirit and Wine, Ltd. . . . . . . . . . . . . . . . . . . . . . . . . . . . . 3,957 61,761Corridor Resources, Inc. (b) . . . . . . . . . . . . . . . . . . . . . . . . . . . 21,385 11,258Corus Entertainment, Inc. - B Shares (e) . . . . . . . . . . . . . . . . . . . 31,990 103,773Cott Corp. . . . . . . . . . . . . . . . . . . . . . . . . . . . . . . . . . . . . . . . 44,379 716,372Cott Corp. (U.S. Listed Shares) . . . . . . . . . . . . . . . . . . . . . . . . . . 2,000 32,300Crew Energy, Inc. (b) (e) . . . . . . . . . . . . . . . . . . . . . . . . . . . . . 69,029 100,472CRH Medical Corp. (b) . . . . . . . . . . . . . . . . . . . . . . . . . . . . . . . 27,305 108,658Delphi Energy Corp. (b) . . . . . . . . . . . . . . . . . . . . . . . . . . . . . . 95,850 57,140Denison Mines Corp. (b) (e) . . . . . . . . . . . . . . . . . . . . . . . . . . . 247,548 162,905Descartes Systems Group, Inc. (The) (b) . . . . . . . . . . . . . . . . . . . 21,086 715,192Detour Gold Corp. (b) . . . . . . . . . . . . . . . . . . . . . . . . . . . . . . . 34,636 279,952DHX Media, Ltd. (e) . . . . . . . . . . . . . . . . . . . . . . . . . . . . . . . . 41,896 60,331DIRTT Environmental Solutions (b) . . . . . . . . . . . . . . . . . . . . . . . 28,410 143,628Dorel Industries, Inc. - Class B . . . . . . . . . . . . . . . . . . . . . . . . . . 12,134 215,033DREAM Unlimited Corp. - Class A (b) . . . . . . . . . . . . . . . . . . . . . 7,822 48,931Dundee Precious Metals, Inc. (b) . . . . . . . . . . . . . . . . . . . . . . . . 45,872 107,963E-L Financial Corp., Ltd. . . . . . . . . . . . . . . . . . . . . . . . . . . . . . . 177 111,717Echelon Financial Holdings, Inc. (b) . . . . . . . . . . . . . . . . . . . . . . 900 8,584ECN Capital Corp. . . . . . . . . . . . . . . . . . . . . . . . . . . . . . . . . . . 65,441 191,006EcoSynthetix, Inc. (b) . . . . . . . . . . . . . . . . . . . . . . . . . . . . . . . 800 1,133Eldorado Gold Corp. (b) (e) . . . . . . . . . . . . . . . . . . . . . . . . . . . 138,292 120,985Element Fleet Management Corp. . . . . . . . . . . . . . . . . . . . . . . . 2,165 11,146Endeavour Silver Corp. (b) (e) . . . . . . . . . . . . . . . . . . . . . . . . . 41,698 95,880EnerCare, Inc. . . . . . . . . . . . . . . . . . . . . . . . . . . . . . . . . . . . . 31,725 710,813Enerflex, Ltd. . . . . . . . . . . . . . . . . . . . . . . . . . . . . . . . . . . . . . 29,289 374,828Enerplus Corp. . . . . . . . . . . . . . . . . . . . . . . . . . . . . . . . . . . . . 53,164 656,498Enghouse Systems, Ltd. . . . . . . . . . . . . . . . . . . . . . . . . . . . . . . 7,089 450,427Ensign Energy Services, Inc. . . . . . . . . . . . . . . . . . . . . . . . . . . . 51,526 248,525Entertainment One, Ltd. . . . . . . . . . . . . . . . . . . . . . . . . . . . . . . 73,515 395,908Epsilon Energy, Ltd. (b) . . . . . . . . . . . . . . . . . . . . . . . . . . . . . . 21,856 42,302Equitable Group, Inc. . . . . . . . . . . . . . . . . . . . . . . . . . . . . . . . . 4,209 224,421Essential Energy Services Trust (b) (e) . . . . . . . . . . . . . . . . . . . . . 53,526 21,549Evertz Technologies, Ltd. . . . . . . . . . . . . . . . . . . . . . . . . . . . . . 10,149 129,176Exchange Income Corp. . . . . . . . . . . . . . . . . . . . . . . . . . . . . . . 2,651 67,873Exco Technologies, Ltd. . . . . . . . . . . . . . . . . . . . . . . . . . . . . . . 13,332 97,540EXFO, Inc. (b) . . . . . . . . . . . . . . . . . . . . . . . . . . . . . . . . . . . . 85 320Extendicare, Inc. . . . . . . . . . . . . . . . . . . . . . . . . . . . . . . . . . . 34,956 208,115Fiera Capital Corp. (e) . . . . . . . . . . . . . . . . . . . . . . . . . . . . . . . 16,619 160,574Firm Capital Mortgage Investment Corp. . . . . . . . . . . . . . . . . . . . 9,574 97,767First Majestic Silver Corp. (b) (e) . . . . . . . . . . . . . . . . . . . . . . . . 37,960 215,420First Mining Gold Corp. (b) . . . . . . . . . . . . . . . . . . . . . . . . . . . . 50,000 12,968
BHFTII-65
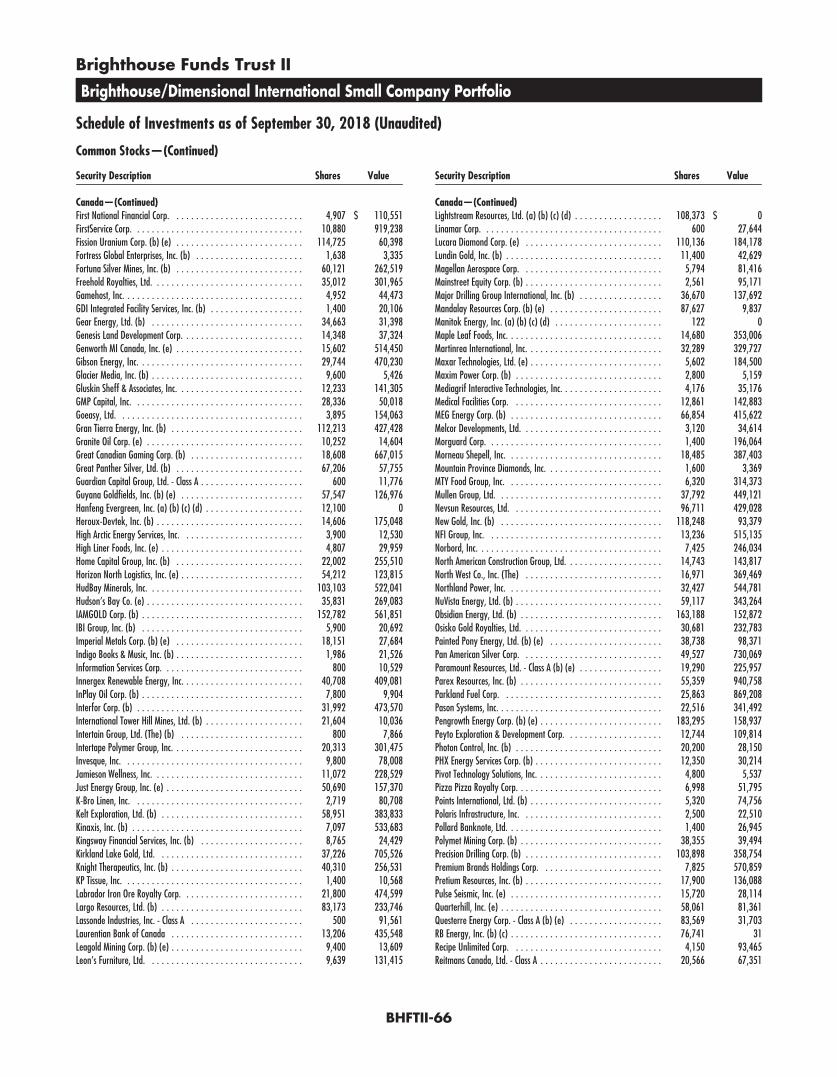
Brighthouse Funds Trust II
Brighthouse/Dimensional International Small Company Portfolio
Schedule of Investments as of September 30, 2018 (Unaudited)
Common Stocks—(Continued)
Security Description Shares Value
Canada—(Continued)First National Financial Corp. . . . . . . . . . . . . . . . . . . . . . . . . . . 4,907 $ 110,551FirstService Corp. . . . . . . . . . . . . . . . . . . . . . . . . . . . . . . . . . . 10,880 919,238Fission Uranium Corp. (b) (e) . . . . . . . . . . . . . . . . . . . . . . . . . . 114,725 60,398Fortress Global Enterprises, Inc. (b) . . . . . . . . . . . . . . . . . . . . . . 1,638 3,335Fortuna Silver Mines, Inc. (b) . . . . . . . . . . . . . . . . . . . . . . . . . . 60,121 262,519Freehold Royalties, Ltd. . . . . . . . . . . . . . . . . . . . . . . . . . . . . . . 35,012 301,965Gamehost, Inc. . . . . . . . . . . . . . . . . . . . . . . . . . . . . . . . . . . . . 4,952 44,473GDI Integrated Facility Services, Inc. (b) . . . . . . . . . . . . . . . . . . . 1,400 20,106Gear Energy, Ltd. (b) . . . . . . . . . . . . . . . . . . . . . . . . . . . . . . . 34,663 31,398Genesis Land Development Corp. . . . . . . . . . . . . . . . . . . . . . . . . 14,348 37,324Genworth MI Canada, Inc. (e) . . . . . . . . . . . . . . . . . . . . . . . . . . 15,602 514,450Gibson Energy, Inc. . . . . . . . . . . . . . . . . . . . . . . . . . . . . . . . . . 29,744 470,230Glacier Media, Inc. (b) . . . . . . . . . . . . . . . . . . . . . . . . . . . . . . . 9,600 5,426Gluskin Sheff & Associates, Inc. . . . . . . . . . . . . . . . . . . . . . . . . . 12,233 141,305GMP Capital, Inc. . . . . . . . . . . . . . . . . . . . . . . . . . . . . . . . . . . 28,336 50,018Goeasy, Ltd. . . . . . . . . . . . . . . . . . . . . . . . . . . . . . . . . . . . . . 3,895 154,063Gran Tierra Energy, Inc. (b) . . . . . . . . . . . . . . . . . . . . . . . . . . . 112,213 427,428Granite Oil Corp. (e) . . . . . . . . . . . . . . . . . . . . . . . . . . . . . . . . 10,252 14,604Great Canadian Gaming Corp. (b) . . . . . . . . . . . . . . . . . . . . . . . 18,608 667,015Great Panther Silver, Ltd. (b) . . . . . . . . . . . . . . . . . . . . . . . . . . 67,206 57,755Guardian Capital Group, Ltd. - Class A . . . . . . . . . . . . . . . . . . . . . 600 11,776Guyana Goldfields, Inc. (b) (e) . . . . . . . . . . . . . . . . . . . . . . . . . 57,547 126,976Hanfeng Evergreen, Inc. (a) (b) (c) (d) . . . . . . . . . . . . . . . . . . . . 12,100 0Heroux-Devtek, Inc. (b) . . . . . . . . . . . . . . . . . . . . . . . . . . . . . . 14,606 175,048High Arctic Energy Services, Inc. . . . . . . . . . . . . . . . . . . . . . . . . 3,900 12,530High Liner Foods, Inc. (e) . . . . . . . . . . . . . . . . . . . . . . . . . . . . . 4,807 29,959Home Capital Group, Inc. (b) . . . . . . . . . . . . . . . . . . . . . . . . . . 22,002 255,510Horizon North Logistics, Inc. (e) . . . . . . . . . . . . . . . . . . . . . . . . . 54,212 123,815HudBay Minerals, Inc. . . . . . . . . . . . . . . . . . . . . . . . . . . . . . . . 103,103 522,041Hudson’s Bay Co. (e) . . . . . . . . . . . . . . . . . . . . . . . . . . . . . . . . 35,831 269,083IAMGOLD Corp. (b) . . . . . . . . . . . . . . . . . . . . . . . . . . . . . . . . . 152,782 561,851IBI Group, Inc. (b) . . . . . . . . . . . . . . . . . . . . . . . . . . . . . . . . . 5,900 20,692Imperial Metals Corp. (b) (e) . . . . . . . . . . . . . . . . . . . . . . . . . . 18,151 27,684Indigo Books & Music, Inc. (b) . . . . . . . . . . . . . . . . . . . . . . . . . . 1,986 21,526Information Services Corp. . . . . . . . . . . . . . . . . . . . . . . . . . . . . 800 10,529Innergex Renewable Energy, Inc. . . . . . . . . . . . . . . . . . . . . . . . . 40,708 409,081InPlay Oil Corp. (b) . . . . . . . . . . . . . . . . . . . . . . . . . . . . . . . . . 7,800 9,904Interfor Corp. (b) . . . . . . . . . . . . . . . . . . . . . . . . . . . . . . . . . . 31,992 473,570International Tower Hill Mines, Ltd. (b) . . . . . . . . . . . . . . . . . . . . 21,604 10,036Intertain Group, Ltd. (The) (b) . . . . . . . . . . . . . . . . . . . . . . . . . 800 7,866Intertape Polymer Group, Inc. . . . . . . . . . . . . . . . . . . . . . . . . . . 20,313 301,475Invesque, Inc. . . . . . . . . . . . . . . . . . . . . . . . . . . . . . . . . . . . . 9,800 78,008Jamieson Wellness, Inc. . . . . . . . . . . . . . . . . . . . . . . . . . . . . . . 11,072 228,529Just Energy Group, Inc. (e) . . . . . . . . . . . . . . . . . . . . . . . . . . . . 50,690 157,370K-Bro Linen, Inc. . . . . . . . . . . . . . . . . . . . . . . . . . . . . . . . . . . 2,719 80,708Kelt Exploration, Ltd. (b) . . . . . . . . . . . . . . . . . . . . . . . . . . . . . 58,951 383,833Kinaxis, Inc. (b) . . . . . . . . . . . . . . . . . . . . . . . . . . . . . . . . . . . 7,097 533,683Kingsway Financial Services, Inc. (b) . . . . . . . . . . . . . . . . . . . . . 8,765 24,429Kirkland Lake Gold, Ltd. . . . . . . . . . . . . . . . . . . . . . . . . . . . . . 37,226 705,526Knight Therapeutics, Inc. (b) . . . . . . . . . . . . . . . . . . . . . . . . . . . 40,310 256,531KP Tissue, Inc. . . . . . . . . . . . . . . . . . . . . . . . . . . . . . . . . . . . . 1,400 10,568Labrador Iron Ore Royalty Corp. . . . . . . . . . . . . . . . . . . . . . . . . 21,800 474,599Largo Resources, Ltd. (b) . . . . . . . . . . . . . . . . . . . . . . . . . . . . . 83,173 233,746Lassonde Industries, Inc. - Class A . . . . . . . . . . . . . . . . . . . . . . . 500 91,561Laurentian Bank of Canada . . . . . . . . . . . . . . . . . . . . . . . . . . . 13,206 435,548Leagold Mining Corp. (b) (e) . . . . . . . . . . . . . . . . . . . . . . . . . . . 9,400 13,609Leon’s Furniture, Ltd. . . . . . . . . . . . . . . . . . . . . . . . . . . . . . . . 9,639 131,415
Security Description Shares Value
Canada—(Continued)Lightstream Resources, Ltd. (a) (b) (c) (d) . . . . . . . . . . . . . . . . . . 108,373 $ 0Linamar Corp. . . . . . . . . . . . . . . . . . . . . . . . . . . . . . . . . . . . . 600 27,644Lucara Diamond Corp. (e) . . . . . . . . . . . . . . . . . . . . . . . . . . . . 110,136 184,178Lundin Gold, Inc. (b) . . . . . . . . . . . . . . . . . . . . . . . . . . . . . . . . 11,400 42,629Magellan Aerospace Corp. . . . . . . . . . . . . . . . . . . . . . . . . . . . . 5,794 81,416Mainstreet Equity Corp. (b) . . . . . . . . . . . . . . . . . . . . . . . . . . . . 2,561 95,171Major Drilling Group International, Inc. (b) . . . . . . . . . . . . . . . . . 36,670 137,692Mandalay Resources Corp. (b) (e) . . . . . . . . . . . . . . . . . . . . . . . 87,627 9,837Manitok Energy, Inc. (a) (b) (c) (d) . . . . . . . . . . . . . . . . . . . . . . 122 0Maple Leaf Foods, Inc. . . . . . . . . . . . . . . . . . . . . . . . . . . . . . . . 14,680 353,006Martinrea International, Inc. . . . . . . . . . . . . . . . . . . . . . . . . . . . 32,289 329,727Maxar Technologies, Ltd. (e) . . . . . . . . . . . . . . . . . . . . . . . . . . . 5,602 184,500Maxim Power Corp. (b) . . . . . . . . . . . . . . . . . . . . . . . . . . . . . . 2,800 5,159Mediagrif Interactive Technologies, Inc. . . . . . . . . . . . . . . . . . . . . 4,176 35,176Medical Facilities Corp. . . . . . . . . . . . . . . . . . . . . . . . . . . . . . . 12,861 142,883MEG Energy Corp. (b) . . . . . . . . . . . . . . . . . . . . . . . . . . . . . . . 66,854 415,622Melcor Developments, Ltd. . . . . . . . . . . . . . . . . . . . . . . . . . . . . 3,120 34,614Morguard Corp. . . . . . . . . . . . . . . . . . . . . . . . . . . . . . . . . . . . 1,400 196,064Morneau Shepell, Inc. . . . . . . . . . . . . . . . . . . . . . . . . . . . . . . . 18,485 387,403Mountain Province Diamonds, Inc. . . . . . . . . . . . . . . . . . . . . . . . 1,600 3,369MTY Food Group, Inc. . . . . . . . . . . . . . . . . . . . . . . . . . . . . . . . 6,320 314,373Mullen Group, Ltd. . . . . . . . . . . . . . . . . . . . . . . . . . . . . . . . . . 37,792 449,121Nevsun Resources, Ltd. . . . . . . . . . . . . . . . . . . . . . . . . . . . . . . 96,711 429,028New Gold, Inc. (b) . . . . . . . . . . . . . . . . . . . . . . . . . . . . . . . . . 118,248 93,379NFI Group, Inc. . . . . . . . . . . . . . . . . . . . . . . . . . . . . . . . . . . . 13,236 515,135Norbord, Inc. . . . . . . . . . . . . . . . . . . . . . . . . . . . . . . . . . . . . . 7,425 246,034North American Construction Group, Ltd. . . . . . . . . . . . . . . . . . . . 14,743 143,817North West Co., Inc. (The) . . . . . . . . . . . . . . . . . . . . . . . . . . . . 16,971 369,469Northland Power, Inc. . . . . . . . . . . . . . . . . . . . . . . . . . . . . . . . 32,427 544,781NuVista Energy, Ltd. (b) . . . . . . . . . . . . . . . . . . . . . . . . . . . . . . 59,117 343,264Obsidian Energy, Ltd. (b) . . . . . . . . . . . . . . . . . . . . . . . . . . . . . 163,188 152,872Osisko Gold Royalties, Ltd. . . . . . . . . . . . . . . . . . . . . . . . . . . . . 30,681 232,783Painted Pony Energy, Ltd. (b) (e) . . . . . . . . . . . . . . . . . . . . . . . 38,738 98,371Pan American Silver Corp. . . . . . . . . . . . . . . . . . . . . . . . . . . . . 49,527 730,069Paramount Resources, Ltd. - Class A (b) (e) . . . . . . . . . . . . . . . . . 19,290 225,957Parex Resources, Inc. (b) . . . . . . . . . . . . . . . . . . . . . . . . . . . . . 55,359 940,758Parkland Fuel Corp. . . . . . . . . . . . . . . . . . . . . . . . . . . . . . . . . 25,863 869,208Pason Systems, Inc. . . . . . . . . . . . . . . . . . . . . . . . . . . . . . . . . . 22,516 341,492Pengrowth Energy Corp. (b) (e) . . . . . . . . . . . . . . . . . . . . . . . . . 183,295 158,937Peyto Exploration & Development Corp. . . . . . . . . . . . . . . . . . . . 12,744 109,814Photon Control, Inc. (b) . . . . . . . . . . . . . . . . . . . . . . . . . . . . . . 20,200 28,150PHX Energy Services Corp. (b) . . . . . . . . . . . . . . . . . . . . . . . . . . 12,350 30,214Pivot Technology Solutions, Inc. . . . . . . . . . . . . . . . . . . . . . . . . . 4,800 5,537Pizza Pizza Royalty Corp. . . . . . . . . . . . . . . . . . . . . . . . . . . . . . 6,998 51,795Points International, Ltd. (b) . . . . . . . . . . . . . . . . . . . . . . . . . . . 5,320 74,756Polaris Infrastructure, Inc. . . . . . . . . . . . . . . . . . . . . . . . . . . . . 2,500 22,510Pollard Banknote, Ltd. . . . . . . . . . . . . . . . . . . . . . . . . . . . . . . . 1,400 26,945Polymet Mining Corp. (b) . . . . . . . . . . . . . . . . . . . . . . . . . . . . . 38,355 39,494Precision Drilling Corp. (b) . . . . . . . . . . . . . . . . . . . . . . . . . . . . 103,898 358,754Premium Brands Holdings Corp. . . . . . . . . . . . . . . . . . . . . . . . . 7,825 570,859Pretium Resources, Inc. (b) . . . . . . . . . . . . . . . . . . . . . . . . . . . . 17,900 136,088Pulse Seismic, Inc. (e) . . . . . . . . . . . . . . . . . . . . . . . . . . . . . . . 15,720 28,114Quarterhill, Inc. (e) . . . . . . . . . . . . . . . . . . . . . . . . . . . . . . . . . 58,061 81,361Questerre Energy Corp. - Class A (b) (e) . . . . . . . . . . . . . . . . . . . 83,569 31,703RB Energy, Inc. (b) (c) . . . . . . . . . . . . . . . . . . . . . . . . . . . . . . . 76,741 31Recipe Unlimited Corp. . . . . . . . . . . . . . . . . . . . . . . . . . . . . . . 4,150 93,465Reitmans Canada, Ltd. - Class A . . . . . . . . . . . . . . . . . . . . . . . . . 20,566 67,351
BHFTII-66
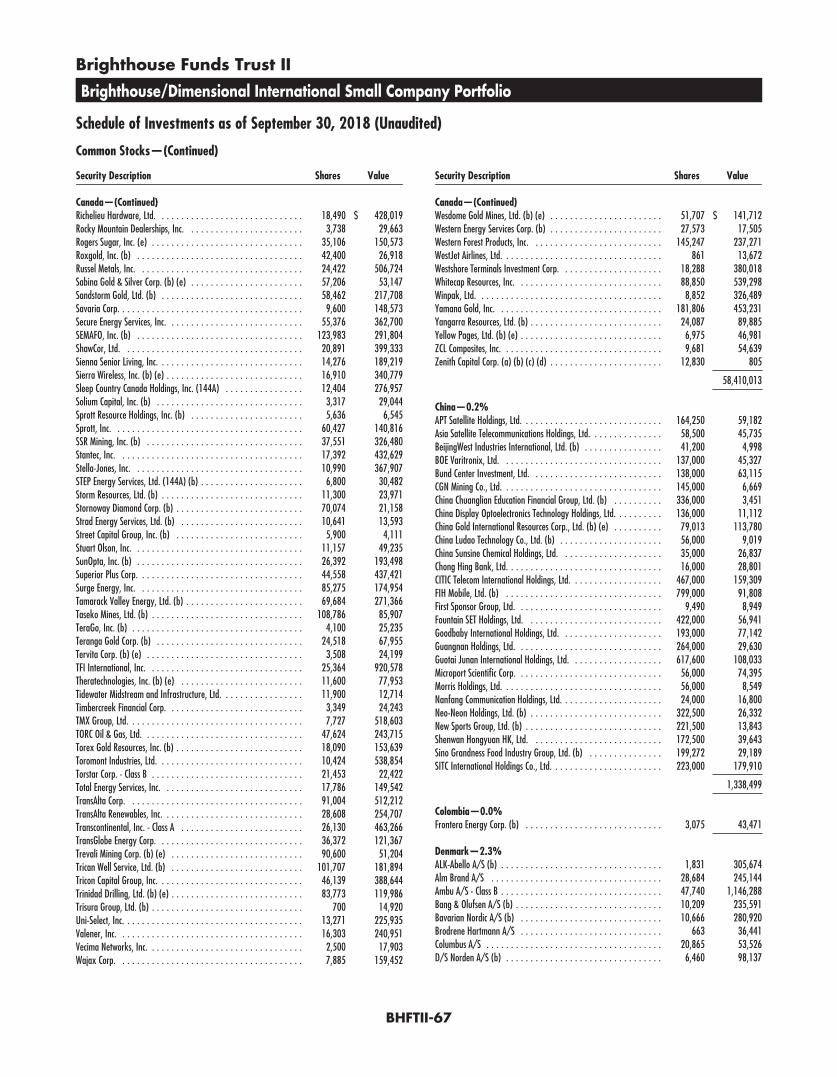
Brighthouse Funds Trust II
Brighthouse/Dimensional International Small Company Portfolio
Schedule of Investments as of September 30, 2018 (Unaudited)
Common Stocks—(Continued)
Security Description Shares Value
Canada—(Continued)Richelieu Hardware, Ltd. . . . . . . . . . . . . . . . . . . . . . . . . . . . . . 18,490 $ 428,019Rocky Mountain Dealerships, Inc. . . . . . . . . . . . . . . . . . . . . . . . 3,738 29,663Rogers Sugar, Inc. (e) . . . . . . . . . . . . . . . . . . . . . . . . . . . . . . . 35,106 150,573Roxgold, Inc. (b) . . . . . . . . . . . . . . . . . . . . . . . . . . . . . . . . . . 42,400 26,918Russel Metals, Inc. . . . . . . . . . . . . . . . . . . . . . . . . . . . . . . . . . 24,422 506,724Sabina Gold & Silver Corp. (b) (e) . . . . . . . . . . . . . . . . . . . . . . . 57,206 53,147Sandstorm Gold, Ltd. (b) . . . . . . . . . . . . . . . . . . . . . . . . . . . . . 58,462 217,708Savaria Corp. . . . . . . . . . . . . . . . . . . . . . . . . . . . . . . . . . . . . . 9,600 148,573Secure Energy Services, Inc. . . . . . . . . . . . . . . . . . . . . . . . . . . . 55,376 362,700SEMAFO, Inc. (b) . . . . . . . . . . . . . . . . . . . . . . . . . . . . . . . . . . 123,983 291,804ShawCor, Ltd. . . . . . . . . . . . . . . . . . . . . . . . . . . . . . . . . . . . . 20,891 399,333Sienna Senior Living, Inc. . . . . . . . . . . . . . . . . . . . . . . . . . . . . . 14,276 189,219Sierra Wireless, Inc. (b) (e) . . . . . . . . . . . . . . . . . . . . . . . . . . . . 16,910 340,779Sleep Country Canada Holdings, Inc. (144A) . . . . . . . . . . . . . . . . 12,404 276,957Solium Capital, Inc. (b) . . . . . . . . . . . . . . . . . . . . . . . . . . . . . . 3,317 29,044Sprott Resource Holdings, Inc. (b) . . . . . . . . . . . . . . . . . . . . . . . 5,636 6,545Sprott, Inc. . . . . . . . . . . . . . . . . . . . . . . . . . . . . . . . . . . . . . . 60,427 140,816SSR Mining, Inc. (b) . . . . . . . . . . . . . . . . . . . . . . . . . . . . . . . . 37,551 326,480Stantec, Inc. . . . . . . . . . . . . . . . . . . . . . . . . . . . . . . . . . . . . . 17,392 432,629Stella-Jones, Inc. . . . . . . . . . . . . . . . . . . . . . . . . . . . . . . . . . . 10,990 367,907STEP Energy Services, Ltd. (144A) (b) . . . . . . . . . . . . . . . . . . . . . 6,800 30,482Storm Resources, Ltd. (b) . . . . . . . . . . . . . . . . . . . . . . . . . . . . . 11,300 23,971Stornoway Diamond Corp. (b) . . . . . . . . . . . . . . . . . . . . . . . . . . 70,074 21,158Strad Energy Services, Ltd. (b) . . . . . . . . . . . . . . . . . . . . . . . . . 10,641 13,593Street Capital Group, Inc. (b) . . . . . . . . . . . . . . . . . . . . . . . . . . 5,900 4,111Stuart Olson, Inc. . . . . . . . . . . . . . . . . . . . . . . . . . . . . . . . . . . 11,157 49,235SunOpta, Inc. (b) . . . . . . . . . . . . . . . . . . . . . . . . . . . . . . . . . . 26,392 193,498Superior Plus Corp. . . . . . . . . . . . . . . . . . . . . . . . . . . . . . . . . . 44,558 437,421Surge Energy, Inc. . . . . . . . . . . . . . . . . . . . . . . . . . . . . . . . . . 85,275 174,954Tamarack Valley Energy, Ltd. (b) . . . . . . . . . . . . . . . . . . . . . . . . 69,684 271,366Taseko Mines, Ltd. (b) . . . . . . . . . . . . . . . . . . . . . . . . . . . . . . . 108,786 85,907TeraGo, Inc. (b) . . . . . . . . . . . . . . . . . . . . . . . . . . . . . . . . . . . 4,100 25,235Teranga Gold Corp. (b) . . . . . . . . . . . . . . . . . . . . . . . . . . . . . . 24,518 67,955Tervita Corp. (b) (e) . . . . . . . . . . . . . . . . . . . . . . . . . . . . . . . . 3,508 24,199TFI International, Inc. . . . . . . . . . . . . . . . . . . . . . . . . . . . . . . . 25,364 920,578Theratechnologies, Inc. (b) (e) . . . . . . . . . . . . . . . . . . . . . . . . . 11,600 77,953Tidewater Midstream and Infrastructure, Ltd. . . . . . . . . . . . . . . . . 11,900 12,714Timbercreek Financial Corp. . . . . . . . . . . . . . . . . . . . . . . . . . . . 3,349 24,243TMX Group, Ltd. . . . . . . . . . . . . . . . . . . . . . . . . . . . . . . . . . . . 7,727 518,603TORC Oil & Gas, Ltd. . . . . . . . . . . . . . . . . . . . . . . . . . . . . . . . . 47,624 243,715Torex Gold Resources, Inc. (b) . . . . . . . . . . . . . . . . . . . . . . . . . . 18,090 153,639Toromont Industries, Ltd. . . . . . . . . . . . . . . . . . . . . . . . . . . . . . 10,424 538,854Torstar Corp. - Class B . . . . . . . . . . . . . . . . . . . . . . . . . . . . . . . 21,453 22,422Total Energy Services, Inc. . . . . . . . . . . . . . . . . . . . . . . . . . . . . 17,786 149,542TransAlta Corp. . . . . . . . . . . . . . . . . . . . . . . . . . . . . . . . . . . . 91,004 512,212TransAlta Renewables, Inc. . . . . . . . . . . . . . . . . . . . . . . . . . . . . 28,608 254,707Transcontinental, Inc. - Class A . . . . . . . . . . . . . . . . . . . . . . . . . 26,130 463,266TransGlobe Energy Corp. . . . . . . . . . . . . . . . . . . . . . . . . . . . . . 36,372 121,367Trevali Mining Corp. (b) (e) . . . . . . . . . . . . . . . . . . . . . . . . . . . 90,600 51,204Trican Well Service, Ltd. (b) . . . . . . . . . . . . . . . . . . . . . . . . . . . 101,707 181,894Tricon Capital Group, Inc. . . . . . . . . . . . . . . . . . . . . . . . . . . . . . 46,139 388,644Trinidad Drilling, Ltd. (b) (e) . . . . . . . . . . . . . . . . . . . . . . . . . . . 83,773 119,986Trisura Group, Ltd. (b) . . . . . . . . . . . . . . . . . . . . . . . . . . . . . . . 700 14,920Uni-Select, Inc. . . . . . . . . . . . . . . . . . . . . . . . . . . . . . . . . . . . . 13,271 225,935Valener, Inc. . . . . . . . . . . . . . . . . . . . . . . . . . . . . . . . . . . . . . 16,303 240,951Vecima Networks, Inc. . . . . . . . . . . . . . . . . . . . . . . . . . . . . . . . 2,500 17,903Wajax Corp. . . . . . . . . . . . . . . . . . . . . . . . . . . . . . . . . . . . . . 7,885 159,452
Security Description Shares Value
Canada—(Continued)Wesdome Gold Mines, Ltd. (b) (e) . . . . . . . . . . . . . . . . . . . . . . . 51,707 $ 141,712Western Energy Services Corp. (b) . . . . . . . . . . . . . . . . . . . . . . . 27,573 17,505Western Forest Products, Inc. . . . . . . . . . . . . . . . . . . . . . . . . . . 145,247 237,271WestJet Airlines, Ltd. . . . . . . . . . . . . . . . . . . . . . . . . . . . . . . . . 861 13,672Westshore Terminals Investment Corp. . . . . . . . . . . . . . . . . . . . . 18,288 380,018Whitecap Resources, Inc. . . . . . . . . . . . . . . . . . . . . . . . . . . . . . 88,850 539,298Winpak, Ltd. . . . . . . . . . . . . . . . . . . . . . . . . . . . . . . . . . . . . . 8,852 326,489Yamana Gold, Inc. . . . . . . . . . . . . . . . . . . . . . . . . . . . . . . . . . 181,806 453,231Yangarra Resources, Ltd. (b) . . . . . . . . . . . . . . . . . . . . . . . . . . . 24,087 89,885Yellow Pages, Ltd. (b) (e) . . . . . . . . . . . . . . . . . . . . . . . . . . . . . 6,975 46,981ZCL Composites, Inc. . . . . . . . . . . . . . . . . . . . . . . . . . . . . . . . . 9,681 54,639Zenith Capital Corp. (a) (b) (c) (d) . . . . . . . . . . . . . . . . . . . . . . . 12,830 805
58,410,013
China—0.2%APT Satellite Holdings, Ltd. . . . . . . . . . . . . . . . . . . . . . . . . . . . . 164,250 59,182Asia Satellite Telecommunications Holdings, Ltd. . . . . . . . . . . . . . . 58,500 45,735BeijingWest Industries International, Ltd. (b) . . . . . . . . . . . . . . . . 41,200 4,998BOE Varitronix, Ltd. . . . . . . . . . . . . . . . . . . . . . . . . . . . . . . . . 137,000 45,327Bund Center Investment, Ltd. . . . . . . . . . . . . . . . . . . . . . . . . . . 138,000 63,115CGN Mining Co., Ltd. . . . . . . . . . . . . . . . . . . . . . . . . . . . . . . . . 145,000 6,669China Chuanglian Education Financial Group, Ltd. (b) . . . . . . . . . . 336,000 3,451China Display Optoelectronics Technology Holdings, Ltd. . . . . . . . . . 136,000 11,112China Gold International Resources Corp., Ltd. (b) (e) . . . . . . . . . . 79,013 113,780China Ludao Technology Co., Ltd. (b) . . . . . . . . . . . . . . . . . . . . . 56,000 9,019China Sunsine Chemical Holdings, Ltd. . . . . . . . . . . . . . . . . . . . . 35,000 26,837Chong Hing Bank, Ltd. . . . . . . . . . . . . . . . . . . . . . . . . . . . . . . . 16,000 28,801CITIC Telecom International Holdings, Ltd. . . . . . . . . . . . . . . . . . . 467,000 159,309FIH Mobile, Ltd. (b) . . . . . . . . . . . . . . . . . . . . . . . . . . . . . . . . 799,000 91,808First Sponsor Group, Ltd. . . . . . . . . . . . . . . . . . . . . . . . . . . . . . 9,490 8,949Fountain SET Holdings, Ltd. . . . . . . . . . . . . . . . . . . . . . . . . . . . 422,000 56,941Goodbaby International Holdings, Ltd. . . . . . . . . . . . . . . . . . . . . 193,000 77,142Guangnan Holdings, Ltd. . . . . . . . . . . . . . . . . . . . . . . . . . . . . . 264,000 29,630Guotai Junan International Holdings, Ltd. . . . . . . . . . . . . . . . . . . 617,600 108,033Microport Scientific Corp. . . . . . . . . . . . . . . . . . . . . . . . . . . . . . 56,000 74,395Morris Holdings, Ltd. . . . . . . . . . . . . . . . . . . . . . . . . . . . . . . . . 56,000 8,549Nanfang Communication Holdings, Ltd. . . . . . . . . . . . . . . . . . . . . 24,000 16,800Neo-Neon Holdings, Ltd. (b) . . . . . . . . . . . . . . . . . . . . . . . . . . . 322,500 26,332New Sports Group, Ltd. (b) . . . . . . . . . . . . . . . . . . . . . . . . . . . . 221,500 13,843Shenwan Hongyuan HK, Ltd. . . . . . . . . . . . . . . . . . . . . . . . . . . 172,500 39,643Sino Grandness Food Industry Group, Ltd. (b) . . . . . . . . . . . . . . . 199,272 29,189SITC International Holdings Co., Ltd. . . . . . . . . . . . . . . . . . . . . . . 223,000 179,910
1,338,499
Colombia—0.0%Frontera Energy Corp. (b) . . . . . . . . . . . . . . . . . . . . . . . . . . . . 3,075 43,471
Denmark—2.3%ALK-Abello A/S (b) . . . . . . . . . . . . . . . . . . . . . . . . . . . . . . . . . 1,831 305,674Alm Brand A/S . . . . . . . . . . . . . . . . . . . . . . . . . . . . . . . . . . . 28,684 245,144Ambu A/S - Class B . . . . . . . . . . . . . . . . . . . . . . . . . . . . . . . . . 47,740 1,146,288Bang & Olufsen A/S (b) . . . . . . . . . . . . . . . . . . . . . . . . . . . . . . 10,209 235,591Bavarian Nordic A/S (b) . . . . . . . . . . . . . . . . . . . . . . . . . . . . . 10,666 280,920Brodrene Hartmann A/S . . . . . . . . . . . . . . . . . . . . . . . . . . . . . 663 36,441Columbus A/S . . . . . . . . . . . . . . . . . . . . . . . . . . . . . . . . . . . . 20,865 53,526D/S Norden A/S (b) . . . . . . . . . . . . . . . . . . . . . . . . . . . . . . . . 6,460 98,137
BHFTII-67
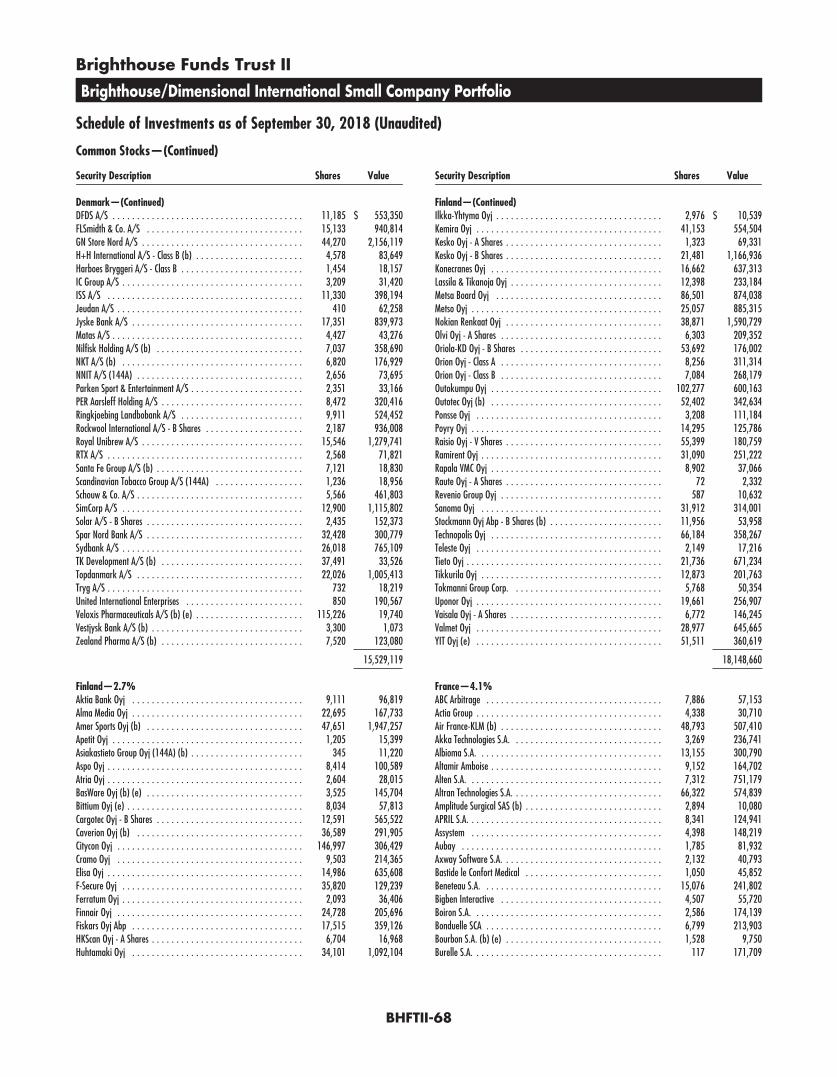
Brighthouse Funds Trust II
Brighthouse/Dimensional International Small Company Portfolio
Schedule of Investments as of September 30, 2018 (Unaudited)
Common Stocks—(Continued)
Security Description Shares Value
Denmark—(Continued)DFDS A/S . . . . . . . . . . . . . . . . . . . . . . . . . . . . . . . . . . . . . . . 11,185 $ 553,350FLSmidth & Co. A/S . . . . . . . . . . . . . . . . . . . . . . . . . . . . . . . . 15,133 940,814GN Store Nord A/S . . . . . . . . . . . . . . . . . . . . . . . . . . . . . . . . . 44,270 2,156,119H+H International A/S - Class B (b) . . . . . . . . . . . . . . . . . . . . . . 4,578 83,649Harboes Bryggeri A/S - Class B . . . . . . . . . . . . . . . . . . . . . . . . . 1,454 18,157IC Group A/S . . . . . . . . . . . . . . . . . . . . . . . . . . . . . . . . . . . . . 3,209 31,420ISS A/S . . . . . . . . . . . . . . . . . . . . . . . . . . . . . . . . . . . . . . . . 11,330 398,194Jeudan A/S . . . . . . . . . . . . . . . . . . . . . . . . . . . . . . . . . . . . . . 410 62,258Jyske Bank A/S . . . . . . . . . . . . . . . . . . . . . . . . . . . . . . . . . . . 17,351 839,973Matas A/S . . . . . . . . . . . . . . . . . . . . . . . . . . . . . . . . . . . . . . . 4,427 43,276Nilfisk Holding A/S (b) . . . . . . . . . . . . . . . . . . . . . . . . . . . . . . 7,037 358,690NKT A/S (b) . . . . . . . . . . . . . . . . . . . . . . . . . . . . . . . . . . . . . 6,820 176,929NNIT A/S (144A) . . . . . . . . . . . . . . . . . . . . . . . . . . . . . . . . . . 2,656 73,695Parken Sport & Entertainment A/S . . . . . . . . . . . . . . . . . . . . . . . 2,351 33,166PER Aarsleff Holding A/S . . . . . . . . . . . . . . . . . . . . . . . . . . . . . 8,472 320,416Ringkjoebing Landbobank A/S . . . . . . . . . . . . . . . . . . . . . . . . . 9,911 524,452Rockwool International A/S - B Shares . . . . . . . . . . . . . . . . . . . . 2,187 936,008Royal Unibrew A/S . . . . . . . . . . . . . . . . . . . . . . . . . . . . . . . . . 15,546 1,279,741RTX A/S . . . . . . . . . . . . . . . . . . . . . . . . . . . . . . . . . . . . . . . . 2,568 71,821Santa Fe Group A/S (b) . . . . . . . . . . . . . . . . . . . . . . . . . . . . . . 7,121 18,830Scandinavian Tobacco Group A/S (144A) . . . . . . . . . . . . . . . . . . 1,236 18,956Schouw & Co. A/S . . . . . . . . . . . . . . . . . . . . . . . . . . . . . . . . . . 5,566 461,803SimCorp A/S . . . . . . . . . . . . . . . . . . . . . . . . . . . . . . . . . . . . . 12,900 1,115,802Solar A/S - B Shares . . . . . . . . . . . . . . . . . . . . . . . . . . . . . . . . 2,435 152,373Spar Nord Bank A/S . . . . . . . . . . . . . . . . . . . . . . . . . . . . . . . . 32,428 300,779Sydbank A/S . . . . . . . . . . . . . . . . . . . . . . . . . . . . . . . . . . . . . 26,018 765,109TK Development A/S (b) . . . . . . . . . . . . . . . . . . . . . . . . . . . . . 37,491 33,526Topdanmark A/S . . . . . . . . . . . . . . . . . . . . . . . . . . . . . . . . . . 22,026 1,005,413Tryg A/S . . . . . . . . . . . . . . . . . . . . . . . . . . . . . . . . . . . . . . . . 732 18,219United International Enterprises . . . . . . . . . . . . . . . . . . . . . . . . 850 190,567Veloxis Pharmaceuticals A/S (b) (e) . . . . . . . . . . . . . . . . . . . . . . 115,226 19,740Vestjysk Bank A/S (b) . . . . . . . . . . . . . . . . . . . . . . . . . . . . . . . 3,300 1,073Zealand Pharma A/S (b) . . . . . . . . . . . . . . . . . . . . . . . . . . . . . 7,520 123,080
15,529,119
Finland—2.7%Aktia Bank Oyj . . . . . . . . . . . . . . . . . . . . . . . . . . . . . . . . . . . 9,111 96,819Alma Media Oyj . . . . . . . . . . . . . . . . . . . . . . . . . . . . . . . . . . . 22,695 167,733Amer Sports Oyj (b) . . . . . . . . . . . . . . . . . . . . . . . . . . . . . . . . 47,651 1,947,257Apetit Oyj . . . . . . . . . . . . . . . . . . . . . . . . . . . . . . . . . . . . . . . 1,205 15,399Asiakastieto Group Oyj (144A) (b) . . . . . . . . . . . . . . . . . . . . . . . 345 11,220Aspo Oyj . . . . . . . . . . . . . . . . . . . . . . . . . . . . . . . . . . . . . . . . 8,414 100,589Atria Oyj . . . . . . . . . . . . . . . . . . . . . . . . . . . . . . . . . . . . . . . . 2,604 28,015BasWare Oyj (b) (e) . . . . . . . . . . . . . . . . . . . . . . . . . . . . . . . . 3,525 145,704Bittium Oyj (e) . . . . . . . . . . . . . . . . . . . . . . . . . . . . . . . . . . . . 8,034 57,813Cargotec Oyj - B Shares . . . . . . . . . . . . . . . . . . . . . . . . . . . . . . 12,591 565,522Caverion Oyj (b) . . . . . . . . . . . . . . . . . . . . . . . . . . . . . . . . . . 36,589 291,905Citycon Oyj . . . . . . . . . . . . . . . . . . . . . . . . . . . . . . . . . . . . . . 146,997 306,429Cramo Oyj . . . . . . . . . . . . . . . . . . . . . . . . . . . . . . . . . . . . . . 9,503 214,365Elisa Oyj . . . . . . . . . . . . . . . . . . . . . . . . . . . . . . . . . . . . . . . . 14,986 635,608F-Secure Oyj . . . . . . . . . . . . . . . . . . . . . . . . . . . . . . . . . . . . . 35,820 129,239Ferratum Oyj . . . . . . . . . . . . . . . . . . . . . . . . . . . . . . . . . . . . . 2,093 36,406Finnair Oyj . . . . . . . . . . . . . . . . . . . . . . . . . . . . . . . . . . . . . . 24,728 205,696Fiskars Oyj Abp . . . . . . . . . . . . . . . . . . . . . . . . . . . . . . . . . . . 17,515 359,126HKScan Oyj - A Shares . . . . . . . . . . . . . . . . . . . . . . . . . . . . . . . 6,704 16,968Huhtamaki Oyj . . . . . . . . . . . . . . . . . . . . . . . . . . . . . . . . . . . 34,101 1,092,104
Security Description Shares Value
Finland—(Continued)Ilkka-Yhtyma Oyj . . . . . . . . . . . . . . . . . . . . . . . . . . . . . . . . . . 2,976 $ 10,539Kemira Oyj . . . . . . . . . . . . . . . . . . . . . . . . . . . . . . . . . . . . . . 41,153 554,504Kesko Oyj - A Shares . . . . . . . . . . . . . . . . . . . . . . . . . . . . . . . . 1,323 69,331Kesko Oyj - B Shares . . . . . . . . . . . . . . . . . . . . . . . . . . . . . . . . 21,481 1,166,936Konecranes Oyj . . . . . . . . . . . . . . . . . . . . . . . . . . . . . . . . . . . 16,662 637,313Lassila & Tikanoja Oyj . . . . . . . . . . . . . . . . . . . . . . . . . . . . . . . 12,398 233,184Metsa Board Oyj . . . . . . . . . . . . . . . . . . . . . . . . . . . . . . . . . . 86,501 874,038Metso Oyj . . . . . . . . . . . . . . . . . . . . . . . . . . . . . . . . . . . . . . . 25,057 885,315Nokian Renkaat Oyj . . . . . . . . . . . . . . . . . . . . . . . . . . . . . . . . 38,871 1,590,729Olvi Oyj - A Shares . . . . . . . . . . . . . . . . . . . . . . . . . . . . . . . . . 6,303 209,352Oriola-KD Oyj - B Shares . . . . . . . . . . . . . . . . . . . . . . . . . . . . . 53,692 176,002Orion Oyj - Class A . . . . . . . . . . . . . . . . . . . . . . . . . . . . . . . . . 8,256 311,314Orion Oyj - Class B . . . . . . . . . . . . . . . . . . . . . . . . . . . . . . . . . 7,084 268,179Outokumpu Oyj . . . . . . . . . . . . . . . . . . . . . . . . . . . . . . . . . . . 102,277 600,163Outotec Oyj (b) . . . . . . . . . . . . . . . . . . . . . . . . . . . . . . . . . . . 52,402 342,634Ponsse Oyj . . . . . . . . . . . . . . . . . . . . . . . . . . . . . . . . . . . . . . 3,208 111,184Poyry Oyj . . . . . . . . . . . . . . . . . . . . . . . . . . . . . . . . . . . . . . . 14,295 125,786Raisio Oyj - V Shares . . . . . . . . . . . . . . . . . . . . . . . . . . . . . . . . 55,399 180,759Ramirent Oyj . . . . . . . . . . . . . . . . . . . . . . . . . . . . . . . . . . . . . 31,090 251,222Rapala VMC Oyj . . . . . . . . . . . . . . . . . . . . . . . . . . . . . . . . . . . 8,902 37,066Raute Oyj - A Shares . . . . . . . . . . . . . . . . . . . . . . . . . . . . . . . . 72 2,332Revenio Group Oyj . . . . . . . . . . . . . . . . . . . . . . . . . . . . . . . . . 587 10,632Sanoma Oyj . . . . . . . . . . . . . . . . . . . . . . . . . . . . . . . . . . . . . 31,912 314,001Stockmann Oyj Abp - B Shares (b) . . . . . . . . . . . . . . . . . . . . . . . 11,956 53,958Technopolis Oyj . . . . . . . . . . . . . . . . . . . . . . . . . . . . . . . . . . . 66,184 358,267Teleste Oyj . . . . . . . . . . . . . . . . . . . . . . . . . . . . . . . . . . . . . . 2,149 17,216Tieto Oyj . . . . . . . . . . . . . . . . . . . . . . . . . . . . . . . . . . . . . . . . 21,736 671,234Tikkurila Oyj . . . . . . . . . . . . . . . . . . . . . . . . . . . . . . . . . . . . . 12,873 201,763Tokmanni Group Corp. . . . . . . . . . . . . . . . . . . . . . . . . . . . . . . 5,768 50,354Uponor Oyj . . . . . . . . . . . . . . . . . . . . . . . . . . . . . . . . . . . . . . 19,661 256,907Vaisala Oyj - A Shares . . . . . . . . . . . . . . . . . . . . . . . . . . . . . . . 6,772 146,245Valmet Oyj . . . . . . . . . . . . . . . . . . . . . . . . . . . . . . . . . . . . . . 28,977 645,665YIT Oyj (e) . . . . . . . . . . . . . . . . . . . . . . . . . . . . . . . . . . . . . . 51,511 360,619
18,148,660
France—4.1%ABC Arbitrage . . . . . . . . . . . . . . . . . . . . . . . . . . . . . . . . . . . . 7,886 57,153Actia Group . . . . . . . . . . . . . . . . . . . . . . . . . . . . . . . . . . . . . . 4,338 30,710Air France-KLM (b) . . . . . . . . . . . . . . . . . . . . . . . . . . . . . . . . . 48,793 507,410Akka Technologies S.A. . . . . . . . . . . . . . . . . . . . . . . . . . . . . . . 3,269 236,741Albioma S.A. . . . . . . . . . . . . . . . . . . . . . . . . . . . . . . . . . . . . . 13,155 300,790Altamir Amboise . . . . . . . . . . . . . . . . . . . . . . . . . . . . . . . . . . . 9,152 164,702Alten S.A. . . . . . . . . . . . . . . . . . . . . . . . . . . . . . . . . . . . . . . . 7,312 751,179Altran Technologies S.A. . . . . . . . . . . . . . . . . . . . . . . . . . . . . . . 66,322 574,839Amplitude Surgical SAS (b) . . . . . . . . . . . . . . . . . . . . . . . . . . . . 2,894 10,080APRIL S.A. . . . . . . . . . . . . . . . . . . . . . . . . . . . . . . . . . . . . . . . 8,341 124,941Assystem . . . . . . . . . . . . . . . . . . . . . . . . . . . . . . . . . . . . . . . 4,398 148,219Aubay . . . . . . . . . . . . . . . . . . . . . . . . . . . . . . . . . . . . . . . . . 1,785 81,932Axway Software S.A. . . . . . . . . . . . . . . . . . . . . . . . . . . . . . . . . 2,132 40,793Bastide le Confort Medical . . . . . . . . . . . . . . . . . . . . . . . . . . . . 1,050 45,852Beneteau S.A. . . . . . . . . . . . . . . . . . . . . . . . . . . . . . . . . . . . . 15,076 241,802Bigben Interactive . . . . . . . . . . . . . . . . . . . . . . . . . . . . . . . . . 4,507 55,720Boiron S.A. . . . . . . . . . . . . . . . . . . . . . . . . . . . . . . . . . . . . . . 2,586 174,139Bonduelle SCA . . . . . . . . . . . . . . . . . . . . . . . . . . . . . . . . . . . . 6,799 213,903Bourbon S.A. (b) (e) . . . . . . . . . . . . . . . . . . . . . . . . . . . . . . . . 1,528 9,750Burelle S.A. . . . . . . . . . . . . . . . . . . . . . . . . . . . . . . . . . . . . . . 117 171,709
BHFTII-68
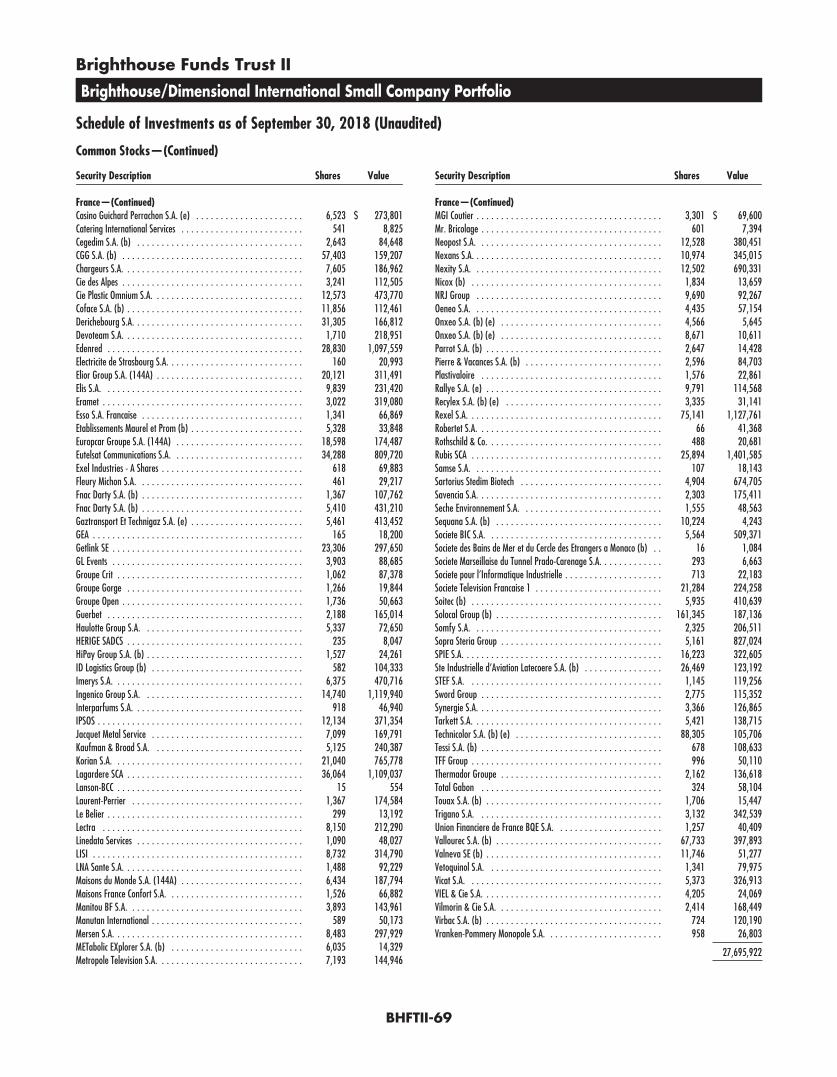
Brighthouse Funds Trust II
Brighthouse/Dimensional International Small Company Portfolio
Schedule of Investments as of September 30, 2018 (Unaudited)
Common Stocks—(Continued)
Security Description Shares Value
France—(Continued)Casino Guichard Perrachon S.A. (e) . . . . . . . . . . . . . . . . . . . . . . 6,523 $ 273,801Catering International Services . . . . . . . . . . . . . . . . . . . . . . . . . 541 8,825Cegedim S.A. (b) . . . . . . . . . . . . . . . . . . . . . . . . . . . . . . . . . . 2,643 84,648CGG S.A. (b) . . . . . . . . . . . . . . . . . . . . . . . . . . . . . . . . . . . . . 57,403 159,207Chargeurs S.A. . . . . . . . . . . . . . . . . . . . . . . . . . . . . . . . . . . . . 7,605 186,962Cie des Alpes . . . . . . . . . . . . . . . . . . . . . . . . . . . . . . . . . . . . . 3,241 112,505Cie Plastic Omnium S.A. . . . . . . . . . . . . . . . . . . . . . . . . . . . . . . 12,573 473,770Coface S.A. (b) . . . . . . . . . . . . . . . . . . . . . . . . . . . . . . . . . . . . 11,856 112,461Derichebourg S.A. . . . . . . . . . . . . . . . . . . . . . . . . . . . . . . . . . . 31,305 166,812Devoteam S.A. . . . . . . . . . . . . . . . . . . . . . . . . . . . . . . . . . . . . 1,710 218,951Edenred . . . . . . . . . . . . . . . . . . . . . . . . . . . . . . . . . . . . . . . . 28,830 1,097,559Electricite de Strasbourg S.A. . . . . . . . . . . . . . . . . . . . . . . . . . . . 160 20,993Elior Group S.A. (144A) . . . . . . . . . . . . . . . . . . . . . . . . . . . . . . 20,121 311,491Elis S.A. . . . . . . . . . . . . . . . . . . . . . . . . . . . . . . . . . . . . . . . . 9,839 231,420Eramet . . . . . . . . . . . . . . . . . . . . . . . . . . . . . . . . . . . . . . . . . 3,022 319,080Esso S.A. Francaise . . . . . . . . . . . . . . . . . . . . . . . . . . . . . . . . . 1,341 66,869Etablissements Maurel et Prom (b) . . . . . . . . . . . . . . . . . . . . . . . 5,328 33,848Europcar Groupe S.A. (144A) . . . . . . . . . . . . . . . . . . . . . . . . . . 18,598 174,487Eutelsat Communications S.A. . . . . . . . . . . . . . . . . . . . . . . . . . . 34,288 809,720Exel Industries - A Shares . . . . . . . . . . . . . . . . . . . . . . . . . . . . . 618 69,883Fleury Michon S.A. . . . . . . . . . . . . . . . . . . . . . . . . . . . . . . . . . 461 29,217Fnac Darty S.A. (b) . . . . . . . . . . . . . . . . . . . . . . . . . . . . . . . . . 1,367 107,762Fnac Darty S.A. (b) . . . . . . . . . . . . . . . . . . . . . . . . . . . . . . . . . 5,410 431,210Gaztransport Et Technigaz S.A. (e) . . . . . . . . . . . . . . . . . . . . . . . 5,461 413,452GEA . . . . . . . . . . . . . . . . . . . . . . . . . . . . . . . . . . . . . . . . . . . 165 18,200Getlink SE . . . . . . . . . . . . . . . . . . . . . . . . . . . . . . . . . . . . . . . 23,306 297,650GL Events . . . . . . . . . . . . . . . . . . . . . . . . . . . . . . . . . . . . . . . 3,903 88,685Groupe Crit . . . . . . . . . . . . . . . . . . . . . . . . . . . . . . . . . . . . . . 1,062 87,378Groupe Gorge . . . . . . . . . . . . . . . . . . . . . . . . . . . . . . . . . . . . 1,266 19,844Groupe Open . . . . . . . . . . . . . . . . . . . . . . . . . . . . . . . . . . . . . 1,736 50,663Guerbet . . . . . . . . . . . . . . . . . . . . . . . . . . . . . . . . . . . . . . . . 2,188 165,014Haulotte Group S.A. . . . . . . . . . . . . . . . . . . . . . . . . . . . . . . . . 5,337 72,650HERIGE SADCS . . . . . . . . . . . . . . . . . . . . . . . . . . . . . . . . . . . . 235 8,047HiPay Group S.A. (b) . . . . . . . . . . . . . . . . . . . . . . . . . . . . . . . . 1,527 24,261ID Logistics Group (b) . . . . . . . . . . . . . . . . . . . . . . . . . . . . . . . 582 104,333Imerys S.A. . . . . . . . . . . . . . . . . . . . . . . . . . . . . . . . . . . . . . . 6,375 470,716Ingenico Group S.A. . . . . . . . . . . . . . . . . . . . . . . . . . . . . . . . . 14,740 1,119,940Interparfums S.A. . . . . . . . . . . . . . . . . . . . . . . . . . . . . . . . . . . 918 46,940IPSOS . . . . . . . . . . . . . . . . . . . . . . . . . . . . . . . . . . . . . . . . . . 12,134 371,354Jacquet Metal Service . . . . . . . . . . . . . . . . . . . . . . . . . . . . . . . 7,099 169,791Kaufman & Broad S.A. . . . . . . . . . . . . . . . . . . . . . . . . . . . . . . 5,125 240,387Korian S.A. . . . . . . . . . . . . . . . . . . . . . . . . . . . . . . . . . . . . . . 21,040 765,778Lagardere SCA . . . . . . . . . . . . . . . . . . . . . . . . . . . . . . . . . . . . 36,064 1,109,037Lanson-BCC . . . . . . . . . . . . . . . . . . . . . . . . . . . . . . . . . . . . . . 15 554Laurent-Perrier . . . . . . . . . . . . . . . . . . . . . . . . . . . . . . . . . . . 1,367 174,584Le Belier . . . . . . . . . . . . . . . . . . . . . . . . . . . . . . . . . . . . . . . . 299 13,192Lectra . . . . . . . . . . . . . . . . . . . . . . . . . . . . . . . . . . . . . . . . . 8,150 212,290Linedata Services . . . . . . . . . . . . . . . . . . . . . . . . . . . . . . . . . . 1,090 48,027LISI . . . . . . . . . . . . . . . . . . . . . . . . . . . . . . . . . . . . . . . . . . . 8,732 314,790LNA Sante S.A. . . . . . . . . . . . . . . . . . . . . . . . . . . . . . . . . . . . . 1,488 92,229Maisons du Monde S.A. (144A) . . . . . . . . . . . . . . . . . . . . . . . . . 6,434 187,794Maisons France Confort S.A. . . . . . . . . . . . . . . . . . . . . . . . . . . . 1,526 66,882Manitou BF S.A. . . . . . . . . . . . . . . . . . . . . . . . . . . . . . . . . . . . 3,893 143,961Manutan International . . . . . . . . . . . . . . . . . . . . . . . . . . . . . . . 589 50,173Mersen S.A. . . . . . . . . . . . . . . . . . . . . . . . . . . . . . . . . . . . . . . 8,483 297,929METabolic EXplorer S.A. (b) . . . . . . . . . . . . . . . . . . . . . . . . . . . 6,035 14,329Metropole Television S.A. . . . . . . . . . . . . . . . . . . . . . . . . . . . . . 7,193 144,946
Security Description Shares Value
France—(Continued)MGI Coutier . . . . . . . . . . . . . . . . . . . . . . . . . . . . . . . . . . . . . . 3,301 $ 69,600Mr. Bricolage . . . . . . . . . . . . . . . . . . . . . . . . . . . . . . . . . . . . . 601 7,394Neopost S.A. . . . . . . . . . . . . . . . . . . . . . . . . . . . . . . . . . . . . . 12,528 380,451Nexans S.A. . . . . . . . . . . . . . . . . . . . . . . . . . . . . . . . . . . . . . . 10,974 345,015Nexity S.A. . . . . . . . . . . . . . . . . . . . . . . . . . . . . . . . . . . . . . . 12,502 690,331Nicox (b) . . . . . . . . . . . . . . . . . . . . . . . . . . . . . . . . . . . . . . . 1,834 13,659NRJ Group . . . . . . . . . . . . . . . . . . . . . . . . . . . . . . . . . . . . . . 9,690 92,267Oeneo S.A. . . . . . . . . . . . . . . . . . . . . . . . . . . . . . . . . . . . . . . 4,435 57,154Onxeo S.A. (b) (e) . . . . . . . . . . . . . . . . . . . . . . . . . . . . . . . . . 4,566 5,645Onxeo S.A. (b) (e) . . . . . . . . . . . . . . . . . . . . . . . . . . . . . . . . . 8,671 10,611Parrot S.A. (b) . . . . . . . . . . . . . . . . . . . . . . . . . . . . . . . . . . . . 2,647 14,428Pierre & Vacances S.A. (b) . . . . . . . . . . . . . . . . . . . . . . . . . . . . 2,596 84,703Plastivaloire . . . . . . . . . . . . . . . . . . . . . . . . . . . . . . . . . . . . . 1,576 22,861Rallye S.A. (e) . . . . . . . . . . . . . . . . . . . . . . . . . . . . . . . . . . . . 9,791 114,568Recylex S.A. (b) (e) . . . . . . . . . . . . . . . . . . . . . . . . . . . . . . . . 3,335 31,141Rexel S.A. . . . . . . . . . . . . . . . . . . . . . . . . . . . . . . . . . . . . . . . 75,141 1,127,761Robertet S.A. . . . . . . . . . . . . . . . . . . . . . . . . . . . . . . . . . . . . . 66 41,368Rothschild & Co. . . . . . . . . . . . . . . . . . . . . . . . . . . . . . . . . . . . 488 20,681Rubis SCA . . . . . . . . . . . . . . . . . . . . . . . . . . . . . . . . . . . . . . . 25,894 1,401,585Samse S.A. . . . . . . . . . . . . . . . . . . . . . . . . . . . . . . . . . . . . . . 107 18,143Sartorius Stedim Biotech . . . . . . . . . . . . . . . . . . . . . . . . . . . . . 4,904 674,705Savencia S.A. . . . . . . . . . . . . . . . . . . . . . . . . . . . . . . . . . . . . . 2,303 175,411Seche Environnement S.A. . . . . . . . . . . . . . . . . . . . . . . . . . . . . 1,555 48,563Sequana S.A. (b) . . . . . . . . . . . . . . . . . . . . . . . . . . . . . . . . . . 10,224 4,243Societe BIC S.A. . . . . . . . . . . . . . . . . . . . . . . . . . . . . . . . . . . . 5,564 509,371Societe des Bains de Mer et du Cercle des Etrangers a Monaco (b) . . 16 1,084Societe Marseillaise du Tunnel Prado-Carenage S.A. . . . . . . . . . . . . 293 6,663Societe pour l’Informatique Industrielle . . . . . . . . . . . . . . . . . . . . 713 22,183Societe Television Francaise 1 . . . . . . . . . . . . . . . . . . . . . . . . . . 21,284 224,258Soitec (b) . . . . . . . . . . . . . . . . . . . . . . . . . . . . . . . . . . . . . . . 5,935 410,639Solocal Group (b) . . . . . . . . . . . . . . . . . . . . . . . . . . . . . . . . . . 161,345 187,136Somfy S.A. . . . . . . . . . . . . . . . . . . . . . . . . . . . . . . . . . . . . . . 2,325 206,511Sopra Steria Group . . . . . . . . . . . . . . . . . . . . . . . . . . . . . . . . . 5,161 827,024SPIE S.A. . . . . . . . . . . . . . . . . . . . . . . . . . . . . . . . . . . . . . . . . 16,223 322,605Ste Industrielle d’Aviation Latecoere S.A. (b) . . . . . . . . . . . . . . . . 26,469 123,192STEF S.A. . . . . . . . . . . . . . . . . . . . . . . . . . . . . . . . . . . . . . . . 1,145 119,256Sword Group . . . . . . . . . . . . . . . . . . . . . . . . . . . . . . . . . . . . . 2,775 115,352Synergie S.A. . . . . . . . . . . . . . . . . . . . . . . . . . . . . . . . . . . . . . 3,366 126,865Tarkett S.A. . . . . . . . . . . . . . . . . . . . . . . . . . . . . . . . . . . . . . . 5,421 138,715Technicolor S.A. (b) (e) . . . . . . . . . . . . . . . . . . . . . . . . . . . . . . 88,305 105,706Tessi S.A. (b) . . . . . . . . . . . . . . . . . . . . . . . . . . . . . . . . . . . . . 678 108,633TFF Group . . . . . . . . . . . . . . . . . . . . . . . . . . . . . . . . . . . . . . . 996 50,110Thermador Groupe . . . . . . . . . . . . . . . . . . . . . . . . . . . . . . . . . 2,162 136,618Total Gabon . . . . . . . . . . . . . . . . . . . . . . . . . . . . . . . . . . . . . 324 58,104Touax S.A. (b) . . . . . . . . . . . . . . . . . . . . . . . . . . . . . . . . . . . . 1,706 15,447Trigano S.A. . . . . . . . . . . . . . . . . . . . . . . . . . . . . . . . . . . . . . 3,132 342,539Union Financiere de France BQE S.A. . . . . . . . . . . . . . . . . . . . . . 1,257 40,409Vallourec S.A. (b) . . . . . . . . . . . . . . . . . . . . . . . . . . . . . . . . . . 67,733 397,893Valneva SE (b) . . . . . . . . . . . . . . . . . . . . . . . . . . . . . . . . . . . . 11,746 51,277Vetoquinol S.A. . . . . . . . . . . . . . . . . . . . . . . . . . . . . . . . . . . . 1,341 79,975Vicat S.A. . . . . . . . . . . . . . . . . . . . . . . . . . . . . . . . . . . . . . . . 5,373 326,913VIEL & Cie S.A. . . . . . . . . . . . . . . . . . . . . . . . . . . . . . . . . . . . . 4,205 24,069Vilmorin & Cie S.A. . . . . . . . . . . . . . . . . . . . . . . . . . . . . . . . . . 2,414 168,449Virbac S.A. (b) . . . . . . . . . . . . . . . . . . . . . . . . . . . . . . . . . . . . 724 120,190Vranken-Pommery Monopole S.A. . . . . . . . . . . . . . . . . . . . . . . . 958 26,803
27,695,922
BHFTII-69

Brighthouse Funds Trust II
Brighthouse/Dimensional International Small Company Portfolio
Schedule of Investments as of September 30, 2018 (Unaudited)
Common Stocks—(Continued)
Security Description Shares Value
Georgia—0.0%Bank of Georgia Group plc . . . . . . . . . . . . . . . . . . . . . . . . . . . . 7,105 $ 158,481
Germany—6.1%Aareal Bank AG . . . . . . . . . . . . . . . . . . . . . . . . . . . . . . . . . . . 26,928 1,125,809Adler Modemaerkte AG . . . . . . . . . . . . . . . . . . . . . . . . . . . . . . 2,828 13,130ADLER Real Estate AG . . . . . . . . . . . . . . . . . . . . . . . . . . . . . . . 4,349 76,668ADO Properties S.A. (144A) . . . . . . . . . . . . . . . . . . . . . . . . . . . 5,349 320,316ADVA Optical Networking SE (b) . . . . . . . . . . . . . . . . . . . . . . . . 13,833 108,469AIXTRON SE (b) . . . . . . . . . . . . . . . . . . . . . . . . . . . . . . . . . . . 21,680 219,004Allgeier SE . . . . . . . . . . . . . . . . . . . . . . . . . . . . . . . . . . . . . . 2,942 114,800Amadeus Fire AG . . . . . . . . . . . . . . . . . . . . . . . . . . . . . . . . . . 1,986 224,927Aurubis AG . . . . . . . . . . . . . . . . . . . . . . . . . . . . . . . . . . . . . . 14,317 1,000,411Basler AG . . . . . . . . . . . . . . . . . . . . . . . . . . . . . . . . . . . . . . . 357 67,927Bauer AG . . . . . . . . . . . . . . . . . . . . . . . . . . . . . . . . . . . . . . . 4,696 88,491BayWa AG . . . . . . . . . . . . . . . . . . . . . . . . . . . . . . . . . . . . . . 5,731 190,969BayWa AG . . . . . . . . . . . . . . . . . . . . . . . . . . . . . . . . . . . . . . 305 10,901Bechtle AG . . . . . . . . . . . . . . . . . . . . . . . . . . . . . . . . . . . . . . 10,952 1,111,999Bertrandt AG . . . . . . . . . . . . . . . . . . . . . . . . . . . . . . . . . . . . . 1,677 154,890bet-at-home.com AG . . . . . . . . . . . . . . . . . . . . . . . . . . . . . . . . 519 35,881Bijou Brigitte AG . . . . . . . . . . . . . . . . . . . . . . . . . . . . . . . . . . 1,603 72,367Bilfinger SE . . . . . . . . . . . . . . . . . . . . . . . . . . . . . . . . . . . . . . 10,033 506,491Borussia Dortmund GmbH & Co. KGaA (Xetra Exchange) . . . . . . . . 26,420 235,148CANCOM SE . . . . . . . . . . . . . . . . . . . . . . . . . . . . . . . . . . . . . . 13,574 612,888Carl Zeiss Meditec AG . . . . . . . . . . . . . . . . . . . . . . . . . . . . . . . 7,610 640,251CECONOMY AG . . . . . . . . . . . . . . . . . . . . . . . . . . . . . . . . . . . . 18,151 128,170CENIT AG . . . . . . . . . . . . . . . . . . . . . . . . . . . . . . . . . . . . . . . 3,413 65,559CENTROTEC Sustainable AG . . . . . . . . . . . . . . . . . . . . . . . . . . . . 1,930 29,761Cewe Stiftung & Co. KGaA . . . . . . . . . . . . . . . . . . . . . . . . . . . . 2,303 191,719Comdirect Bank AG . . . . . . . . . . . . . . . . . . . . . . . . . . . . . . . . . 13,399 171,618CompuGroup Medical SE . . . . . . . . . . . . . . . . . . . . . . . . . . . . . 7,545 435,904Corestate Capital Holding S.A. (b) . . . . . . . . . . . . . . . . . . . . . . . 472 21,904CropEnergies AG . . . . . . . . . . . . . . . . . . . . . . . . . . . . . . . . . . . 9,235 49,543CTS Eventim AG & Co. KGaA . . . . . . . . . . . . . . . . . . . . . . . . . . . 14,746 661,015Data Modul AG . . . . . . . . . . . . . . . . . . . . . . . . . . . . . . . . . . . 138 10,998DEAG Deutsche Entertainment AG (b) . . . . . . . . . . . . . . . . . . . . . 3,066 12,121Delticom AG . . . . . . . . . . . . . . . . . . . . . . . . . . . . . . . . . . . . . 1,562 15,710Deutsche Beteiligungs AG . . . . . . . . . . . . . . . . . . . . . . . . . . . . . 2,815 115,602Deutsche Euroshop AG . . . . . . . . . . . . . . . . . . . . . . . . . . . . . . . 11,450 370,638Deutsche Pfandbriefbank AG (144A) . . . . . . . . . . . . . . . . . . . . . 23,307 348,954Deutz AG . . . . . . . . . . . . . . . . . . . . . . . . . . . . . . . . . . . . . . . 35,346 314,765DIC Asset AG . . . . . . . . . . . . . . . . . . . . . . . . . . . . . . . . . . . . . 14,805 162,905DMG Mori AG . . . . . . . . . . . . . . . . . . . . . . . . . . . . . . . . . . . . 8,384 429,563Dr. Hoenle AG . . . . . . . . . . . . . . . . . . . . . . . . . . . . . . . . . . . . 2,084 185,344Draegerwerk AG & Co. KGaA . . . . . . . . . . . . . . . . . . . . . . . . . . 1,062 63,465Duerr AG . . . . . . . . . . . . . . . . . . . . . . . . . . . . . . . . . . . . . . . 15,350 690,964Eckert & Ziegler AG . . . . . . . . . . . . . . . . . . . . . . . . . . . . . . . . 1,268 65,361Elmos Semiconductor AG . . . . . . . . . . . . . . . . . . . . . . . . . . . . . 5,394 113,707ElringKlinger AG . . . . . . . . . . . . . . . . . . . . . . . . . . . . . . . . . . . 11,206 124,375Energiekontor AG . . . . . . . . . . . . . . . . . . . . . . . . . . . . . . . . . . 1,301 23,032Euromicron AG (b) . . . . . . . . . . . . . . . . . . . . . . . . . . . . . . . . . 2,048 14,885Fielmann AG . . . . . . . . . . . . . . . . . . . . . . . . . . . . . . . . . . . . . 7,053 424,489First Sensor AG . . . . . . . . . . . . . . . . . . . . . . . . . . . . . . . . . . . 1,526 31,889Francotyp-Postalia Holding AG . . . . . . . . . . . . . . . . . . . . . . . . . 3,300 15,442Freenet AG . . . . . . . . . . . . . . . . . . . . . . . . . . . . . . . . . . . . . . 49,368 1,186,498FUCHS Petrolub SE . . . . . . . . . . . . . . . . . . . . . . . . . . . . . . . . . 843 41,580Gerresheimer AG . . . . . . . . . . . . . . . . . . . . . . . . . . . . . . . . . . 9,821 829,444Gerry Weber International AG (b) . . . . . . . . . . . . . . . . . . . . . . . 9,842 31,982
Security Description Shares Value
Germany—(Continued)Gesco AG . . . . . . . . . . . . . . . . . . . . . . . . . . . . . . . . . . . . . . . 4,563 $ 164,945GFT Technologies SE . . . . . . . . . . . . . . . . . . . . . . . . . . . . . . . . 5,932 79,126Grand City Properties S.A. . . . . . . . . . . . . . . . . . . . . . . . . . . . . 17,766 460,491GRENKE AG . . . . . . . . . . . . . . . . . . . . . . . . . . . . . . . . . . . . . . 3,342 398,189H&R GmbH & Co. KGaA . . . . . . . . . . . . . . . . . . . . . . . . . . . . . . 4,195 37,845Hamburger Hafen und Logistik AG . . . . . . . . . . . . . . . . . . . . . . . 8,624 202,661Heidelberger Druckmaschinen AG (b) . . . . . . . . . . . . . . . . . . . . . 100,140 267,449Hella GmbH & Co. KGaA . . . . . . . . . . . . . . . . . . . . . . . . . . . . . 4,694 261,702HolidayCheck Group AG (b) . . . . . . . . . . . . . . . . . . . . . . . . . . . 7,854 29,143Hornbach Baumarkt AG . . . . . . . . . . . . . . . . . . . . . . . . . . . . . . 1,543 47,065Hornbach Holding AG & Co. KGaA . . . . . . . . . . . . . . . . . . . . . . . 168 11,781Hugo Boss AG . . . . . . . . . . . . . . . . . . . . . . . . . . . . . . . . . . . . 18,730 1,442,226Indus Holding AG . . . . . . . . . . . . . . . . . . . . . . . . . . . . . . . . . . 9,327 579,260Isra Vision AG . . . . . . . . . . . . . . . . . . . . . . . . . . . . . . . . . . . . 7,065 355,182IVU Traffic Technologies AG . . . . . . . . . . . . . . . . . . . . . . . . . . . 2,304 15,194Jenoptik AG . . . . . . . . . . . . . . . . . . . . . . . . . . . . . . . . . . . . . 15,954 587,745K&S AG . . . . . . . . . . . . . . . . . . . . . . . . . . . . . . . . . . . . . . . . 59,335 1,245,304Kloeckner & Co. SE . . . . . . . . . . . . . . . . . . . . . . . . . . . . . . . . . 34,891 403,001Koenig & Bauer AG . . . . . . . . . . . . . . . . . . . . . . . . . . . . . . . . . 4,373 263,640Krones AG . . . . . . . . . . . . . . . . . . . . . . . . . . . . . . . . . . . . . . . 5,091 533,835KSB SE & Co. KGaA . . . . . . . . . . . . . . . . . . . . . . . . . . . . . . . . . 82 30,061KWS Saat SE . . . . . . . . . . . . . . . . . . . . . . . . . . . . . . . . . . . . . 745 287,607LANXESS AG . . . . . . . . . . . . . . . . . . . . . . . . . . . . . . . . . . . . . 18,700 1,369,571LEG Immobilien AG . . . . . . . . . . . . . . . . . . . . . . . . . . . . . . . . . 14,527 1,724,608Leifheit AG . . . . . . . . . . . . . . . . . . . . . . . . . . . . . . . . . . . . . . 1,890 39,762Leoni AG . . . . . . . . . . . . . . . . . . . . . . . . . . . . . . . . . . . . . . . . 12,471 513,693LPKF Laser & Electronics AG (b) . . . . . . . . . . . . . . . . . . . . . . . . . 4,316 38,388Manz AG (b) . . . . . . . . . . . . . . . . . . . . . . . . . . . . . . . . . . . . . 1,272 53,824Medigene AG (b) . . . . . . . . . . . . . . . . . . . . . . . . . . . . . . . . . . 2,446 34,165MLP SE . . . . . . . . . . . . . . . . . . . . . . . . . . . . . . . . . . . . . . . . . 20,985 133,921Nemetschek SE . . . . . . . . . . . . . . . . . . . . . . . . . . . . . . . . . . . 6,154 899,900Nexus AG . . . . . . . . . . . . . . . . . . . . . . . . . . . . . . . . . . . . . . . 4,536 140,634Nordex SE (b) . . . . . . . . . . . . . . . . . . . . . . . . . . . . . . . . . . . . 23,261 250,198Norma Group SE . . . . . . . . . . . . . . . . . . . . . . . . . . . . . . . . . . 10,781 688,709OHB SE . . . . . . . . . . . . . . . . . . . . . . . . . . . . . . . . . . . . . . . . 2,315 89,416OSRAM Licht AG . . . . . . . . . . . . . . . . . . . . . . . . . . . . . . . . . . . 12,909 513,232Paragon AG . . . . . . . . . . . . . . . . . . . . . . . . . . . . . . . . . . . . . . 357 15,481Patrizia Immobilien AG . . . . . . . . . . . . . . . . . . . . . . . . . . . . . . 19,307 370,647Pfeiffer Vacuum Technology AG . . . . . . . . . . . . . . . . . . . . . . . . . 2,392 355,208PNE Wind AG . . . . . . . . . . . . . . . . . . . . . . . . . . . . . . . . . . . . . 24,548 79,186Progress-Werk Oberkirch AG . . . . . . . . . . . . . . . . . . . . . . . . . . . 822 35,667ProSiebenSat.1 Media SE . . . . . . . . . . . . . . . . . . . . . . . . . . . . . 424 11,012PSI Software AG . . . . . . . . . . . . . . . . . . . . . . . . . . . . . . . . . . . 2,118 38,611Puma SE . . . . . . . . . . . . . . . . . . . . . . . . . . . . . . . . . . . . . . . . 549 270,902PVA TePla AG (b) . . . . . . . . . . . . . . . . . . . . . . . . . . . . . . . . . . 534 8,682QSC AG . . . . . . . . . . . . . . . . . . . . . . . . . . . . . . . . . . . . . . . . 26,632 49,474R Stahl AG (b) . . . . . . . . . . . . . . . . . . . . . . . . . . . . . . . . . . . . 1,594 48,442Rational AG . . . . . . . . . . . . . . . . . . . . . . . . . . . . . . . . . . . . . . 390 282,496Rheinmetall AG . . . . . . . . . . . . . . . . . . . . . . . . . . . . . . . . . . . 12,940 1,352,750Rhoen Klinikum AG . . . . . . . . . . . . . . . . . . . . . . . . . . . . . . . . . 15,358 394,787RIB Software SE . . . . . . . . . . . . . . . . . . . . . . . . . . . . . . . . . . . 8,127 172,393Rocket Internet SE (144A) (b) . . . . . . . . . . . . . . . . . . . . . . . . . . 13,297 416,222SAF-Holland S.A. . . . . . . . . . . . . . . . . . . . . . . . . . . . . . . . . . . 22,056 333,246Salzgitter AG . . . . . . . . . . . . . . . . . . . . . . . . . . . . . . . . . . . . . 12,083 603,468Schaltbau Holding AG (b) . . . . . . . . . . . . . . . . . . . . . . . . . . . . . 2,019 59,527Scout24 AG (144A) . . . . . . . . . . . . . . . . . . . . . . . . . . . . . . . . . 10,890 507,777Secunet Security Networks AG . . . . . . . . . . . . . . . . . . . . . . . . . . 72 9,525
BHFTII-70

Brighthouse Funds Trust II
Brighthouse/Dimensional International Small Company Portfolio
Schedule of Investments as of September 30, 2018 (Unaudited)
Common Stocks—(Continued)
Security Description Shares Value
Germany—(Continued)SHW AG . . . . . . . . . . . . . . . . . . . . . . . . . . . . . . . . . . . . . . . . 2,013 $ 67,973Siltronic AG . . . . . . . . . . . . . . . . . . . . . . . . . . . . . . . . . . . . . . 5,196 636,161Sixt SE . . . . . . . . . . . . . . . . . . . . . . . . . . . . . . . . . . . . . . . . . 4,968 618,340SMA Solar Technology AG . . . . . . . . . . . . . . . . . . . . . . . . . . . . . 3,992 93,533SMT Scharf AG (b) . . . . . . . . . . . . . . . . . . . . . . . . . . . . . . . . . 831 14,280Softing AG . . . . . . . . . . . . . . . . . . . . . . . . . . . . . . . . . . . . . . 1,971 21,191Software AG . . . . . . . . . . . . . . . . . . . . . . . . . . . . . . . . . . . . . 18,372 837,619Stabilus S.A. . . . . . . . . . . . . . . . . . . . . . . . . . . . . . . . . . . . . . 5,948 491,213STRATEC Biomedical AG . . . . . . . . . . . . . . . . . . . . . . . . . . . . . . 1,203 90,368Stroeer SE & Co. KGaA . . . . . . . . . . . . . . . . . . . . . . . . . . . . . . . 8,451 482,873Suedzucker AG . . . . . . . . . . . . . . . . . . . . . . . . . . . . . . . . . . . 26,310 349,613Surteco SE . . . . . . . . . . . . . . . . . . . . . . . . . . . . . . . . . . . . . . . 1,501 38,145Suss Microtec AG (b) . . . . . . . . . . . . . . . . . . . . . . . . . . . . . . . . 6,216 100,919TAG Immobilien AG . . . . . . . . . . . . . . . . . . . . . . . . . . . . . . . . . 39,448 938,904Takkt AG . . . . . . . . . . . . . . . . . . . . . . . . . . . . . . . . . . . . . . . 11,656 184,688Technotrans AG . . . . . . . . . . . . . . . . . . . . . . . . . . . . . . . . . . . 2,427 92,988Tele Columbus AG (144A) (b) . . . . . . . . . . . . . . . . . . . . . . . . . . 1,323 3,811TLG Immobilien AG . . . . . . . . . . . . . . . . . . . . . . . . . . . . . . . . . 15,689 409,489Tom Tailor Holding SE (b) . . . . . . . . . . . . . . . . . . . . . . . . . . . . . 8,518 39,787Traffic Systems SE . . . . . . . . . . . . . . . . . . . . . . . . . . . . . . . . . . 1,794 34,583VERBIO Vereinigte BioEnergie AG . . . . . . . . . . . . . . . . . . . . . . . . 4,981 33,955Vossloh AG . . . . . . . . . . . . . . . . . . . . . . . . . . . . . . . . . . . . . . 4,712 245,200VTG AG . . . . . . . . . . . . . . . . . . . . . . . . . . . . . . . . . . . . . . . . . 4,846 296,514Wacker Neuson SE . . . . . . . . . . . . . . . . . . . . . . . . . . . . . . . . . 10,071 257,921Washtec AG . . . . . . . . . . . . . . . . . . . . . . . . . . . . . . . . . . . . . . 3,431 301,157Wuestenrot & Wuerttembergische AG . . . . . . . . . . . . . . . . . . . . . 515 11,738XING SE . . . . . . . . . . . . . . . . . . . . . . . . . . . . . . . . . . . . . . . . 988 337,826Zeal Network SE . . . . . . . . . . . . . . . . . . . . . . . . . . . . . . . . . . . 1,934 48,281
40,998,689
Ghana—0.2%Tullow Oil plc (b) . . . . . . . . . . . . . . . . . . . . . . . . . . . . . . . . . . 457,293 1,567,639
Greenland—0.0%Gronlandsbanken A/S . . . . . . . . . . . . . . . . . . . . . . . . . . . . . . . 17 1,578
Guernsey, Channel Islands—0.0%Raven Russia, Ltd. (b) . . . . . . . . . . . . . . . . . . . . . . . . . . . . . . . 72,992 36,335
Hong Kong—2.6%Aeon Credit Service Asia Co., Ltd. . . . . . . . . . . . . . . . . . . . . . . . . 14,000 12,953Agritrade Resources, Ltd. . . . . . . . . . . . . . . . . . . . . . . . . . . . . . 630,000 137,654Alco Holdings, Ltd. . . . . . . . . . . . . . . . . . . . . . . . . . . . . . . . . . 136,000 19,290Allan International Holdings . . . . . . . . . . . . . . . . . . . . . . . . . . . 20,000 4,726Allied Group, Ltd. . . . . . . . . . . . . . . . . . . . . . . . . . . . . . . . . . . 22,000 125,058Allied Properties HK, Ltd. . . . . . . . . . . . . . . . . . . . . . . . . . . . . . 944,024 206,238APAC Resources, Ltd. . . . . . . . . . . . . . . . . . . . . . . . . . . . . . . . . 47,217 7,843Applied Development Holdings, Ltd. (b) . . . . . . . . . . . . . . . . . . . 390,000 32,382Arts Optical International Holdings, Ltd. (c) . . . . . . . . . . . . . . . . . 16,000 3,965Asia Financial Holdings, Ltd. . . . . . . . . . . . . . . . . . . . . . . . . . . . 254,000 155,546Asia Standard International Group, Ltd. . . . . . . . . . . . . . . . . . . . 296,000 61,010Associated International Hotels, Ltd. . . . . . . . . . . . . . . . . . . . . . . 14,000 39,344Auto Italia Holdings (b) . . . . . . . . . . . . . . . . . . . . . . . . . . . . . . 175,000 1,744Ban Loong Holdings, Ltd. (b) . . . . . . . . . . . . . . . . . . . . . . . . . . 438,000 10,671Bel Global Resources Holdings, Ltd. (a) (b) (c) (d) . . . . . . . . . . . . . 520,000 0Best Food Holding Co., Ltd. . . . . . . . . . . . . . . . . . . . . . . . . . . . . 112,000 15,993
Security Description Shares Value
Hong Kong—(Continued)Bison Finance Group, Ltd. (b) . . . . . . . . . . . . . . . . . . . . . . . . . . 74,000 $ 12,313Bonjour Holdings, Ltd. (b) . . . . . . . . . . . . . . . . . . . . . . . . . . . . 615,000 18,092Bossini International Holdings, Ltd. . . . . . . . . . . . . . . . . . . . . . . 302,000 10,959Bright Smart Securities & Commodities Group, Ltd. . . . . . . . . . . . . 176,000 36,664Brightoil Petroleum Holdings, Ltd. (a) (b) (c) (d) . . . . . . . . . . . . . 664,000 23,856Brockman Mining, Ltd. (b) . . . . . . . . . . . . . . . . . . . . . . . . . . . . 2,516,770 56,252Burwill Holdings, Ltd. (b) . . . . . . . . . . . . . . . . . . . . . . . . . . . . . 1,566,000 39,764Cafe de Coral Holdings, Ltd. . . . . . . . . . . . . . . . . . . . . . . . . . . . 116,000 265,483Camsing International Holding, Ltd. (b) . . . . . . . . . . . . . . . . . . . . 100,000 86,476Cash Financial Services Group, Ltd. (b) . . . . . . . . . . . . . . . . . . . . 288,000 3,117Century City International Holdings, Ltd. . . . . . . . . . . . . . . . . . . . 616,000 55,719Chen Hsong Holdings . . . . . . . . . . . . . . . . . . . . . . . . . . . . . . . 150,000 44,080Cheuk Nang Holdings, Ltd. . . . . . . . . . . . . . . . . . . . . . . . . . . . . 95,574 55,793Chevalier International Holdings, Ltd. . . . . . . . . . . . . . . . . . . . . . 75,139 108,042China Baoli Technologies Holdings, Ltd. (b) . . . . . . . . . . . . . . . . . 285,000 21,422China Energy Development Holdings, Ltd. (b) . . . . . . . . . . . . . . . . 3,670,000 54,363China Flavors & Fragrances Co., Ltd. . . . . . . . . . . . . . . . . . . . . . . 71,446 24,453China Goldjoy Group, Ltd. . . . . . . . . . . . . . . . . . . . . . . . . . . . . 1,368,000 78,613China LNG Group, Ltd. (b) . . . . . . . . . . . . . . . . . . . . . . . . . . . . 184,000 27,259China Medical & HealthCare Group, Ltd. (b) . . . . . . . . . . . . . . . . . 400,000 13,033China Motor Bus Co., Ltd. . . . . . . . . . . . . . . . . . . . . . . . . . . . . . 1,200 14,871China Soft Power Technology Holdings, Ltd. (b) . . . . . . . . . . . . . . 48,435 365China Solar Energy Holdings, Ltd. (a) (b) (c) (d) . . . . . . . . . . . . . . 162,000 698China Star Entertainment, Ltd. (b) . . . . . . . . . . . . . . . . . . . . . . . 378,000 25,589China Strategic Holdings, Ltd. (b) . . . . . . . . . . . . . . . . . . . . . . . . 3,402,500 30,850China Ting Group Holdings, Ltd. . . . . . . . . . . . . . . . . . . . . . . . . . 318,550 15,859China Tonghai International Financial, Ltd. (b) . . . . . . . . . . . . . . . 180,000 17,202Chinese Estates Holdings, Ltd. . . . . . . . . . . . . . . . . . . . . . . . . . . 68,000 78,541Chinney Investment, Ltd. . . . . . . . . . . . . . . . . . . . . . . . . . . . . . 8,000 2,952Chow Sang Sang Holdings International, Ltd. . . . . . . . . . . . . . . . . 119,000 231,615Chuang’s China Investments, Ltd. . . . . . . . . . . . . . . . . . . . . . . . . 511,500 33,271Chuang’s Consortium International, Ltd. . . . . . . . . . . . . . . . . . . . 382,357 79,362CK Life Sciences International Holdings, Inc. . . . . . . . . . . . . . . . . . 1,594,000 97,758CNT Group, Ltd. . . . . . . . . . . . . . . . . . . . . . . . . . . . . . . . . . . . 246,000 11,313Common Splendor International Health Industry Group, Ltd. (b) . . . 518,000 52,983Continental Holdings, Ltd. (b) . . . . . . . . . . . . . . . . . . . . . . . . . . 220,000 3,146Convoy Global Holdings, Ltd. (a) (b) (c) (d) . . . . . . . . . . . . . . . . . 1,314,000 10,508Cowell e Holdings, Inc. . . . . . . . . . . . . . . . . . . . . . . . . . . . . . . . 120,000 17,940CP Lotus Corp. (b) . . . . . . . . . . . . . . . . . . . . . . . . . . . . . . . . . . 1,750,000 23,249Crocodile Garments (b) . . . . . . . . . . . . . . . . . . . . . . . . . . . . . . 216,000 18,801Cross-Harbour Holdings, Ltd. (The) . . . . . . . . . . . . . . . . . . . . . . . 127,063 211,024CSI Properties, Ltd. . . . . . . . . . . . . . . . . . . . . . . . . . . . . . . . . . 2,574,023 116,778CST Group, Ltd. (b) . . . . . . . . . . . . . . . . . . . . . . . . . . . . . . . . . 8,984,000 29,834Dah Sing Banking Group, Ltd. . . . . . . . . . . . . . . . . . . . . . . . . . . 172,671 345,548Dah Sing Financial Holdings, Ltd. . . . . . . . . . . . . . . . . . . . . . . . . 66,260 423,433Dan Form Holdings Co., Ltd. . . . . . . . . . . . . . . . . . . . . . . . . . . . 62,000 33,266Dickson Concepts International, Ltd. . . . . . . . . . . . . . . . . . . . . . . 131,000 58,703Digital Domain Holdings, Ltd. (b) . . . . . . . . . . . . . . . . . . . . . . . . 2,520,000 34,438DMX Technologies Group, Ltd. (a) (b) (c) (d) . . . . . . . . . . . . . . . . 186,000 2,776Dynamic Holdings, Ltd. . . . . . . . . . . . . . . . . . . . . . . . . . . . . . . 20,000 16,052Eagle Nice International Holdings, Ltd. . . . . . . . . . . . . . . . . . . . . 120,000 49,293EcoGreen International Group, Ltd. . . . . . . . . . . . . . . . . . . . . . . 118,800 25,730eForce Holdings, Ltd. (b) . . . . . . . . . . . . . . . . . . . . . . . . . . . . . 128,000 2,778Elegance Optical International Holdings, Ltd. (b) . . . . . . . . . . . . . . 96,000 9,440Emperor Capital Group, Ltd. . . . . . . . . . . . . . . . . . . . . . . . . . . . 726,000 36,642Emperor Entertainment Hotel, Ltd. . . . . . . . . . . . . . . . . . . . . . . . 235,000 45,026Emperor International Holdings, Ltd. . . . . . . . . . . . . . . . . . . . . . 529,250 139,512
BHFTII-71

Brighthouse Funds Trust II
Brighthouse/Dimensional International Small Company Portfolio
Schedule of Investments as of September 30, 2018 (Unaudited)
Common Stocks—(Continued)
Security Description Shares Value
Hong Kong—(Continued)Emperor Watch & Jewellery, Ltd. . . . . . . . . . . . . . . . . . . . . . . . 1,520,000 $ 59,254Enerchina Holdings, Ltd. . . . . . . . . . . . . . . . . . . . . . . . . . . . . . 1,068,000 56,452ENM Holdings, Ltd. (b) . . . . . . . . . . . . . . . . . . . . . . . . . . . . . . 556,000 55,651Esprit Holdings, Ltd. (b) (e) . . . . . . . . . . . . . . . . . . . . . . . . . . . 833,950 199,890Fairwood Holdings, Ltd. . . . . . . . . . . . . . . . . . . . . . . . . . . . . . 26,500 92,764Far East Consortium International, Ltd. . . . . . . . . . . . . . . . . . . . 535,269 284,499Far East Holdings International, Ltd. (b) . . . . . . . . . . . . . . . . . . . 150,000 9,360First Pacific Co., Ltd. . . . . . . . . . . . . . . . . . . . . . . . . . . . . . . . 188,000 92,447Freeman FinTech Corp., Ltd. (b) . . . . . . . . . . . . . . . . . . . . . . . . 1,800,000 18,129Future Bright Holdings, Ltd. . . . . . . . . . . . . . . . . . . . . . . . . . . . 156,000 17,646Future World Financial Holdings, Ltd. (b) . . . . . . . . . . . . . . . . . . 12,575 140G-Resources Group, Ltd. (b) . . . . . . . . . . . . . . . . . . . . . . . . . . 10,474,800 88,364GCL New Energy Holdings, Ltd. (b) . . . . . . . . . . . . . . . . . . . . . . 270,000 9,663Get Nice Holdings, Ltd. . . . . . . . . . . . . . . . . . . . . . . . . . . . . . . 2,574,000 81,900Giordano International, Ltd. . . . . . . . . . . . . . . . . . . . . . . . . . . 482,000 242,024Global Brands Group Holding, Ltd. (b) . . . . . . . . . . . . . . . . . . . . 1,260,000 65,952Glorious Sun Enterprises, Ltd. . . . . . . . . . . . . . . . . . . . . . . . . . 393,000 43,610Gold Peak Industries Holdings, Ltd. . . . . . . . . . . . . . . . . . . . . . . 277,714 26,607Gold-Finance Holdings, Ltd. (b) . . . . . . . . . . . . . . . . . . . . . . . . 214,000 48,657Golden Resources Development International, Ltd. . . . . . . . . . . . . 370,000 23,362Good Resources Holdings, Ltd. (b) . . . . . . . . . . . . . . . . . . . . . . 420,000 10,199GR Properties, Ltd. (b) . . . . . . . . . . . . . . . . . . . . . . . . . . . . . . 150,000 15,241Great Eagle Holdings, Ltd. . . . . . . . . . . . . . . . . . . . . . . . . . . . . 39,571 197,133Greentech Technology International, Ltd. (b) . . . . . . . . . . . . . . . 360,000 3,544Guoan International, Ltd. (b) . . . . . . . . . . . . . . . . . . . . . . . . . . 674,000 14,626Haitong International Securities Group, Ltd. . . . . . . . . . . . . . . . . 498,448 174,539Hang Lung Group, Ltd. . . . . . . . . . . . . . . . . . . . . . . . . . . . . . . 36,000 95,682Hanison Construction Holdings, Ltd. . . . . . . . . . . . . . . . . . . . . . 148,009 27,159Hao Tian Development Group, Ltd. (b) . . . . . . . . . . . . . . . . . . . 1,001,000 33,250Harbour Centre Development, Ltd. . . . . . . . . . . . . . . . . . . . . . . 88,000 166,819HKBN, Ltd. . . . . . . . . . . . . . . . . . . . . . . . . . . . . . . . . . . . . . 203,500 348,760HKR International, Ltd. . . . . . . . . . . . . . . . . . . . . . . . . . . . . . . 366,080 176,923Hon Kwok Land Investment Co., Ltd. . . . . . . . . . . . . . . . . . . . . . 140,000 69,917Hong Kong Aircraft Engineering Co., Ltd. . . . . . . . . . . . . . . . . . . 8,800 78,464Hong Kong Ferry Holdings Co., Ltd. . . . . . . . . . . . . . . . . . . . . . 22,000 24,311Hong Kong Finance Investment Holding Group, Ltd. (b) . . . . . . . . 262,000 35,142Hong Kong International Construction Investment Management
Group Co., Ltd. . . . . . . . . . . . . . . . . . . . . . . . . . . . . . . . . . 98,000 22,650Hong Kong Television Network, Ltd. (b) . . . . . . . . . . . . . . . . . . . 165,000 53,038Hongkong & Shanghai Hotels (The) . . . . . . . . . . . . . . . . . . . . . 109,500 153,343Hongkong Chinese, Ltd. . . . . . . . . . . . . . . . . . . . . . . . . . . . . . 866,000 117,160Hopewell Holdings, Ltd. . . . . . . . . . . . . . . . . . . . . . . . . . . . . . 81,500 268,097Hsin Chong Group Holdings, Ltd. (a) (b) (c) (d) . . . . . . . . . . . . . . 918,000 7,693Huarong Investment Stock Corp., Ltd. (b) . . . . . . . . . . . . . . . . . . 175,000 8,641Hung Hing Printing Group, Ltd. . . . . . . . . . . . . . . . . . . . . . . . . 252,000 39,631Hutchison Telecommunications Hong Kong Holdings, Ltd. . . . . . . . 526,000 207,413Imagi International Holdings, Ltd. (b) . . . . . . . . . . . . . . . . . . . . 90,112 19,408International Housewares Retail Co., Ltd. . . . . . . . . . . . . . . . . . . 57,000 13,759IPE Group, Ltd. . . . . . . . . . . . . . . . . . . . . . . . . . . . . . . . . . . . 285,000 40,775IRC, Ltd. (b) . . . . . . . . . . . . . . . . . . . . . . . . . . . . . . . . . . . . . 760,000 9,543IT, Ltd. . . . . . . . . . . . . . . . . . . . . . . . . . . . . . . . . . . . . . . . . 220,000 117,187ITC Properties Group, Ltd. . . . . . . . . . . . . . . . . . . . . . . . . . . . . 172,615 51,813Jacobson Pharma Corp., Ltd. . . . . . . . . . . . . . . . . . . . . . . . . . . 44,000 10,340Johnson Electric Holdings, Ltd. . . . . . . . . . . . . . . . . . . . . . . . . . 106,875 301,573Kader Holdings Co., Ltd. . . . . . . . . . . . . . . . . . . . . . . . . . . . . . 224,000 29,223Kam Hing International Holdings, Ltd. . . . . . . . . . . . . . . . . . . . . 196,000 18,018Karrie International Holdings, Ltd. . . . . . . . . . . . . . . . . . . . . . . 140,000 18,060
Security Description Shares Value
Hong Kong—(Continued)Keck Seng Investments . . . . . . . . . . . . . . . . . . . . . . . . . . . . . . 72,000 $ 59,063Kerry Logistics Network, Ltd. . . . . . . . . . . . . . . . . . . . . . . . . . . . 107,000 178,242Kin Yat Holdings, Ltd. . . . . . . . . . . . . . . . . . . . . . . . . . . . . . . . 46,000 9,336Kingmaker Footwear Holdings, Ltd. . . . . . . . . . . . . . . . . . . . . . . 102,000 24,500Kingston Financial Group, Ltd. . . . . . . . . . . . . . . . . . . . . . . . . . . 162,000 43,136Kowloon Development Co., Ltd. . . . . . . . . . . . . . . . . . . . . . . . . . 159,000 170,918Kwan On Holdings, Ltd. (b) . . . . . . . . . . . . . . . . . . . . . . . . . . . . 50,000 4,243Lai Sun Development Co., Ltd. . . . . . . . . . . . . . . . . . . . . . . . . . . 109,413 156,469Lai Sun Garment International, Ltd. . . . . . . . . . . . . . . . . . . . . . . 99,760 127,283Lam Soon Hong Kong, Ltd. . . . . . . . . . . . . . . . . . . . . . . . . . . . . 15,000 24,479Landing International Development, Ltd. (b) . . . . . . . . . . . . . . . . 200,400 64,508Landsea Green Group Co., Ltd. (b) . . . . . . . . . . . . . . . . . . . . . . . 268,000 32,412Lifestyle International Holdings, Ltd. . . . . . . . . . . . . . . . . . . . . . 181,500 356,210Lippo China Resources, Ltd. . . . . . . . . . . . . . . . . . . . . . . . . . . . 2,106,000 57,831Lippo, Ltd. . . . . . . . . . . . . . . . . . . . . . . . . . . . . . . . . . . . . . . . 122,000 43,032Liu Chong Hing Investment, Ltd. . . . . . . . . . . . . . . . . . . . . . . . . 86,000 129,605Luk Fook Holdings International, Ltd. . . . . . . . . . . . . . . . . . . . . . 135,000 466,648Luks Group Vietnam Holdings Co., Ltd. . . . . . . . . . . . . . . . . . . . . 68,000 19,942Lung Kee Bermuda Holdings . . . . . . . . . . . . . . . . . . . . . . . . . . . 90,000 41,303Magnificent Hotel Investment, Ltd. . . . . . . . . . . . . . . . . . . . . . . . 1,310,000 34,070Man Sang International, Ltd. (b) . . . . . . . . . . . . . . . . . . . . . . . . 150,000 9,196Man Wah Holdings, Ltd. . . . . . . . . . . . . . . . . . . . . . . . . . . . . . . 382,400 229,254Mandarin Oriental International, Ltd. . . . . . . . . . . . . . . . . . . . . . 21,200 43,461Mason Group Holdings, Ltd. (b) . . . . . . . . . . . . . . . . . . . . . . . . . 5,445,000 99,397Matrix Holdings, Ltd. (c) . . . . . . . . . . . . . . . . . . . . . . . . . . . . . 36,000 9,105Midland Holdings, Ltd. . . . . . . . . . . . . . . . . . . . . . . . . . . . . . . . 246,000 65,495Midland IC&I, Ltd. (b) . . . . . . . . . . . . . . . . . . . . . . . . . . . . . . . 151,000 5,557Ming Fai International Holdings, Ltd. . . . . . . . . . . . . . . . . . . . . . 145,000 18,492Miramar Hotel & Investment . . . . . . . . . . . . . . . . . . . . . . . . . . . 19,000 35,606Mongolian Mining Corp. (b) . . . . . . . . . . . . . . . . . . . . . . . . . . . 661,000 13,624Nameson Holdings, Ltd. . . . . . . . . . . . . . . . . . . . . . . . . . . . . . . 130,000 17,397National Electronic Holdings, Ltd. . . . . . . . . . . . . . . . . . . . . . . . . 182,600 26,088New Century Group Hong Kong, Ltd. (b) . . . . . . . . . . . . . . . . . . . 912,000 14,906New Times Energy Corp., Ltd. (b) . . . . . . . . . . . . . . . . . . . . . . . . 459,450 7,714Newocean Energy Holdings, Ltd. (b) . . . . . . . . . . . . . . . . . . . . . . 398,000 122,952Noble Century Investment Holdings, Ltd. (b) . . . . . . . . . . . . . . . . 240,000 18,406OP Financial, Ltd. . . . . . . . . . . . . . . . . . . . . . . . . . . . . . . . . . . 240,000 84,082Orange Sky Golden Harvest Entertainment Holdings, Ltd. . . . . . . . . 375,882 14,792Oriental Watch Holdings . . . . . . . . . . . . . . . . . . . . . . . . . . . . . . 215,600 49,906Pacific Andes International Holdings, Ltd. (a) (b) (c) (d) . . . . . . . . . 1,819,984 6,370Pacific Basin Shipping, Ltd. . . . . . . . . . . . . . . . . . . . . . . . . . . . . 1,138,000 270,413Pacific Textiles Holdings, Ltd. . . . . . . . . . . . . . . . . . . . . . . . . . . 240,000 204,324Paliburg Holdings, Ltd. . . . . . . . . . . . . . . . . . . . . . . . . . . . . . . 208,000 81,728Paradise Entertainment, Ltd. (b) . . . . . . . . . . . . . . . . . . . . . . . . 168,000 18,244PC Partner Group, Ltd. . . . . . . . . . . . . . . . . . . . . . . . . . . . . . . . 54,000 26,521Perfect Shape Beauty Technology, Ltd. . . . . . . . . . . . . . . . . . . . . 108,000 26,760Pico Far East Holdings, Ltd. . . . . . . . . . . . . . . . . . . . . . . . . . . . . 318,000 124,779Playmates Holdings, Ltd. . . . . . . . . . . . . . . . . . . . . . . . . . . . . . 460,000 59,983Playmates Toys, Ltd. . . . . . . . . . . . . . . . . . . . . . . . . . . . . . . . . 236,000 20,802Polytec Asset Holdings, Ltd. . . . . . . . . . . . . . . . . . . . . . . . . . . . 565,000 54,127Public Financial Holdings, Ltd. . . . . . . . . . . . . . . . . . . . . . . . . . . 166,000 69,257PYI Corp., Ltd. (b) . . . . . . . . . . . . . . . . . . . . . . . . . . . . . . . . . . 2,140,366 36,078Rare Earth Magnesium Technology Group Holdings, Ltd. (b) . . . . . . 500,000 28,104Realord Group Holdings, Ltd. (b) . . . . . . . . . . . . . . . . . . . . . . . . 116,000 64,313Regal Hotels International Holdings, Ltd. . . . . . . . . . . . . . . . . . . . 126,000 69,047Regina Miracle International Holdings, Ltd. (144A) . . . . . . . . . . . . 22,000 14,671Sa Sa International Holdings, Ltd. . . . . . . . . . . . . . . . . . . . . . . . 261,776 145,020
BHFTII-72
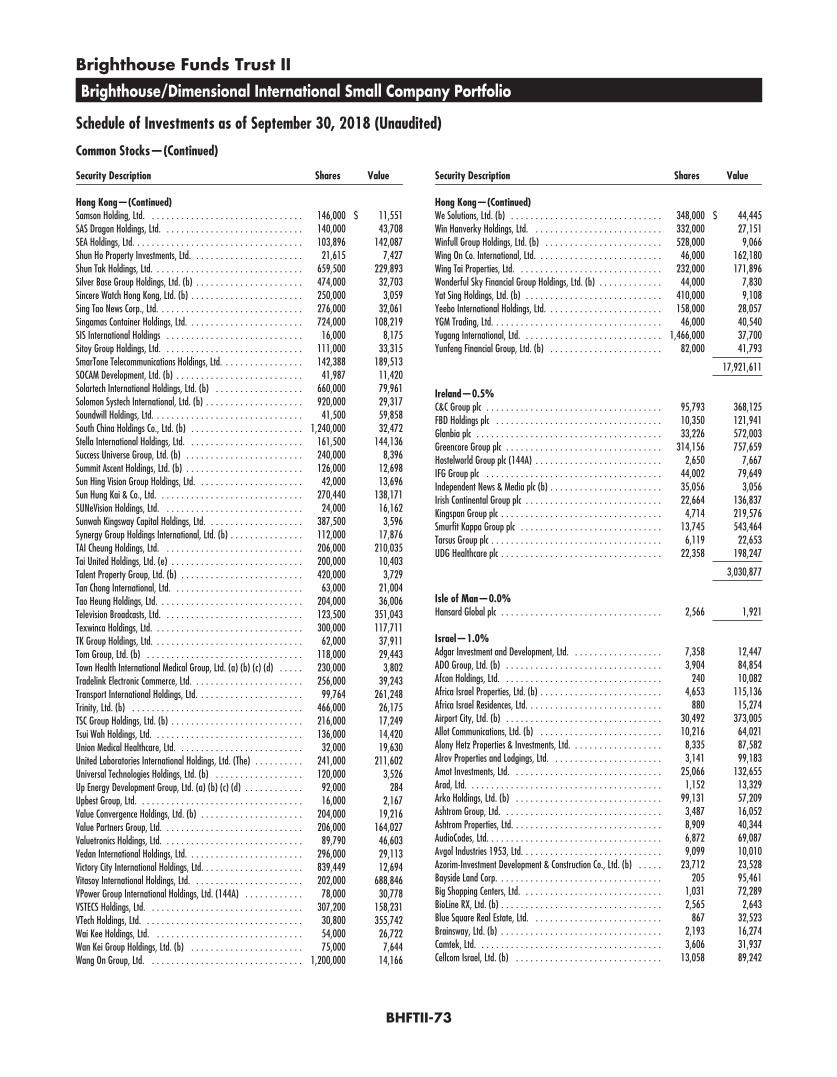
Brighthouse Funds Trust II
Brighthouse/Dimensional International Small Company Portfolio
Schedule of Investments as of September 30, 2018 (Unaudited)
Common Stocks—(Continued)
Security Description Shares Value
Hong Kong—(Continued)Samson Holding, Ltd. . . . . . . . . . . . . . . . . . . . . . . . . . . . . . . . 146,000 $ 11,551SAS Dragon Holdings, Ltd. . . . . . . . . . . . . . . . . . . . . . . . . . . . . 140,000 43,708SEA Holdings, Ltd. . . . . . . . . . . . . . . . . . . . . . . . . . . . . . . . . . . 103,896 142,087Shun Ho Property Investments, Ltd. . . . . . . . . . . . . . . . . . . . . . . 21,615 7,427Shun Tak Holdings, Ltd. . . . . . . . . . . . . . . . . . . . . . . . . . . . . . . 659,500 229,893Silver Base Group Holdings, Ltd. (b) . . . . . . . . . . . . . . . . . . . . . . 474,000 32,703Sincere Watch Hong Kong, Ltd. (b) . . . . . . . . . . . . . . . . . . . . . . . 250,000 3,059Sing Tao News Corp., Ltd. . . . . . . . . . . . . . . . . . . . . . . . . . . . . . 276,000 32,061Singamas Container Holdings, Ltd. . . . . . . . . . . . . . . . . . . . . . . . 724,000 108,219SIS International Holdings . . . . . . . . . . . . . . . . . . . . . . . . . . . . 16,000 8,175Sitoy Group Holdings, Ltd. . . . . . . . . . . . . . . . . . . . . . . . . . . . . 111,000 33,315SmarTone Telecommunications Holdings, Ltd. . . . . . . . . . . . . . . . . 142,388 189,513SOCAM Development, Ltd. (b) . . . . . . . . . . . . . . . . . . . . . . . . . . 41,987 11,420Solartech International Holdings, Ltd. (b) . . . . . . . . . . . . . . . . . . 660,000 79,961Solomon Systech International, Ltd. (b) . . . . . . . . . . . . . . . . . . . . 920,000 29,317Soundwill Holdings, Ltd. . . . . . . . . . . . . . . . . . . . . . . . . . . . . . . 41,500 59,858South China Holdings Co., Ltd. (b) . . . . . . . . . . . . . . . . . . . . . . . 1,240,000 32,472Stella International Holdings, Ltd. . . . . . . . . . . . . . . . . . . . . . . . 161,500 144,136Success Universe Group, Ltd. (b) . . . . . . . . . . . . . . . . . . . . . . . . 240,000 8,396Summit Ascent Holdings, Ltd. (b) . . . . . . . . . . . . . . . . . . . . . . . . 126,000 12,698Sun Hing Vision Group Holdings, Ltd. . . . . . . . . . . . . . . . . . . . . . 42,000 13,696Sun Hung Kai & Co., Ltd. . . . . . . . . . . . . . . . . . . . . . . . . . . . . . 270,440 138,171SUNeVision Holdings, Ltd. . . . . . . . . . . . . . . . . . . . . . . . . . . . . 24,000 16,162Sunwah Kingsway Capital Holdings, Ltd. . . . . . . . . . . . . . . . . . . . 387,500 3,596Synergy Group Holdings International, Ltd. (b) . . . . . . . . . . . . . . . 112,000 17,876TAI Cheung Holdings, Ltd. . . . . . . . . . . . . . . . . . . . . . . . . . . . . 206,000 210,035Tai United Holdings, Ltd. (e) . . . . . . . . . . . . . . . . . . . . . . . . . . . 200,000 10,403Talent Property Group, Ltd. (b) . . . . . . . . . . . . . . . . . . . . . . . . . 420,000 3,729Tan Chong International, Ltd. . . . . . . . . . . . . . . . . . . . . . . . . . . 63,000 21,004Tao Heung Holdings, Ltd. . . . . . . . . . . . . . . . . . . . . . . . . . . . . . 204,000 36,006Television Broadcasts, Ltd. . . . . . . . . . . . . . . . . . . . . . . . . . . . . 123,500 351,043Texwinca Holdings, Ltd. . . . . . . . . . . . . . . . . . . . . . . . . . . . . . . 300,000 117,711TK Group Holdings, Ltd. . . . . . . . . . . . . . . . . . . . . . . . . . . . . . . 62,000 37,911Tom Group, Ltd. (b) . . . . . . . . . . . . . . . . . . . . . . . . . . . . . . . . 118,000 29,443Town Health International Medical Group, Ltd. (a) (b) (c) (d) . . . . . 230,000 3,802Tradelink Electronic Commerce, Ltd. . . . . . . . . . . . . . . . . . . . . . . 256,000 39,243Transport International Holdings, Ltd. . . . . . . . . . . . . . . . . . . . . . 99,764 261,248Trinity, Ltd. (b) . . . . . . . . . . . . . . . . . . . . . . . . . . . . . . . . . . . 466,000 26,175TSC Group Holdings, Ltd. (b) . . . . . . . . . . . . . . . . . . . . . . . . . . . 216,000 17,249Tsui Wah Holdings, Ltd. . . . . . . . . . . . . . . . . . . . . . . . . . . . . . . 136,000 14,420Union Medical Healthcare, Ltd. . . . . . . . . . . . . . . . . . . . . . . . . . 32,000 19,630United Laboratories International Holdings, Ltd. (The) . . . . . . . . . . 241,000 211,602Universal Technologies Holdings, Ltd. (b) . . . . . . . . . . . . . . . . . . 120,000 3,526Up Energy Development Group, Ltd. (a) (b) (c) (d) . . . . . . . . . . . . 92,000 284Upbest Group, Ltd. . . . . . . . . . . . . . . . . . . . . . . . . . . . . . . . . . 16,000 2,167Value Convergence Holdings, Ltd. (b) . . . . . . . . . . . . . . . . . . . . . 204,000 19,216Value Partners Group, Ltd. . . . . . . . . . . . . . . . . . . . . . . . . . . . . 206,000 164,027Valuetronics Holdings, Ltd. . . . . . . . . . . . . . . . . . . . . . . . . . . . . 89,790 46,603Vedan International Holdings, Ltd. . . . . . . . . . . . . . . . . . . . . . . . 296,000 29,113Victory City International Holdings, Ltd. . . . . . . . . . . . . . . . . . . . . 839,449 12,694Vitasoy International Holdings, Ltd. . . . . . . . . . . . . . . . . . . . . . . 202,000 688,846VPower Group International Holdings, Ltd. (144A) . . . . . . . . . . . . 78,000 30,778VSTECS Holdings, Ltd. . . . . . . . . . . . . . . . . . . . . . . . . . . . . . . . 307,200 158,231VTech Holdings, Ltd. . . . . . . . . . . . . . . . . . . . . . . . . . . . . . . . . 30,800 355,742Wai Kee Holdings, Ltd. . . . . . . . . . . . . . . . . . . . . . . . . . . . . . . 54,000 26,722Wan Kei Group Holdings, Ltd. (b) . . . . . . . . . . . . . . . . . . . . . . . 75,000 7,644Wang On Group, Ltd. . . . . . . . . . . . . . . . . . . . . . . . . . . . . . . . 1,200,000 14,166
Security Description Shares Value
Hong Kong—(Continued)We Solutions, Ltd. (b) . . . . . . . . . . . . . . . . . . . . . . . . . . . . . . . 348,000 $ 44,445Win Hanverky Holdings, Ltd. . . . . . . . . . . . . . . . . . . . . . . . . . . 332,000 27,151Winfull Group Holdings, Ltd. (b) . . . . . . . . . . . . . . . . . . . . . . . . 528,000 9,066Wing On Co. International, Ltd. . . . . . . . . . . . . . . . . . . . . . . . . . 46,000 162,180Wing Tai Properties, Ltd. . . . . . . . . . . . . . . . . . . . . . . . . . . . . . 232,000 171,896Wonderful Sky Financial Group Holdings, Ltd. (b) . . . . . . . . . . . . . 44,000 7,830Yat Sing Holdings, Ltd. (b) . . . . . . . . . . . . . . . . . . . . . . . . . . . . 410,000 9,108Yeebo International Holdings, Ltd. . . . . . . . . . . . . . . . . . . . . . . . 158,000 28,057YGM Trading, Ltd. . . . . . . . . . . . . . . . . . . . . . . . . . . . . . . . . . . 46,000 40,540Yugang International, Ltd. . . . . . . . . . . . . . . . . . . . . . . . . . . . . 1,466,000 37,700Yunfeng Financial Group, Ltd. (b) . . . . . . . . . . . . . . . . . . . . . . . 82,000 41,793
17,921,611
Ireland—0.5%C&C Group plc . . . . . . . . . . . . . . . . . . . . . . . . . . . . . . . . . . . . 95,793 368,125FBD Holdings plc . . . . . . . . . . . . . . . . . . . . . . . . . . . . . . . . . . 10,350 121,941Glanbia plc . . . . . . . . . . . . . . . . . . . . . . . . . . . . . . . . . . . . . . 33,226 572,003Greencore Group plc . . . . . . . . . . . . . . . . . . . . . . . . . . . . . . . . 314,156 757,659Hostelworld Group plc (144A) . . . . . . . . . . . . . . . . . . . . . . . . . . 2,650 7,667IFG Group plc . . . . . . . . . . . . . . . . . . . . . . . . . . . . . . . . . . . . 44,002 79,649Independent News & Media plc (b) . . . . . . . . . . . . . . . . . . . . . . . 35,056 3,056Irish Continental Group plc . . . . . . . . . . . . . . . . . . . . . . . . . . . . 22,664 136,837Kingspan Group plc . . . . . . . . . . . . . . . . . . . . . . . . . . . . . . . . . 4,714 219,576Smurfit Kappa Group plc . . . . . . . . . . . . . . . . . . . . . . . . . . . . . 13,745 543,464Tarsus Group plc . . . . . . . . . . . . . . . . . . . . . . . . . . . . . . . . . . . 6,119 22,653UDG Healthcare plc . . . . . . . . . . . . . . . . . . . . . . . . . . . . . . . . . 22,358 198,247
3,030,877
Isle of Man—0.0%Hansard Global plc . . . . . . . . . . . . . . . . . . . . . . . . . . . . . . . . . 2,566 1,921
Israel—1.0%Adgar Investment and Development, Ltd. . . . . . . . . . . . . . . . . . . 7,358 12,447ADO Group, Ltd. (b) . . . . . . . . . . . . . . . . . . . . . . . . . . . . . . . . 3,904 84,854Afcon Holdings, Ltd. . . . . . . . . . . . . . . . . . . . . . . . . . . . . . . . . 240 10,082Africa Israel Properties, Ltd. (b) . . . . . . . . . . . . . . . . . . . . . . . . . 4,653 115,136Africa Israel Residences, Ltd. . . . . . . . . . . . . . . . . . . . . . . . . . . . 880 15,274Airport City, Ltd. (b) . . . . . . . . . . . . . . . . . . . . . . . . . . . . . . . . 30,492 373,005Allot Communications, Ltd. (b) . . . . . . . . . . . . . . . . . . . . . . . . . 10,216 64,021Alony Hetz Properties & Investments, Ltd. . . . . . . . . . . . . . . . . . . 8,335 87,582Alrov Properties and Lodgings, Ltd. . . . . . . . . . . . . . . . . . . . . . . 3,141 99,183Amot Investments, Ltd. . . . . . . . . . . . . . . . . . . . . . . . . . . . . . . 25,066 132,655Arad, Ltd. . . . . . . . . . . . . . . . . . . . . . . . . . . . . . . . . . . . . . . . 1,152 13,329Arko Holdings, Ltd. (b) . . . . . . . . . . . . . . . . . . . . . . . . . . . . . . 99,131 57,209Ashtrom Group, Ltd. . . . . . . . . . . . . . . . . . . . . . . . . . . . . . . . . 3,487 16,052Ashtrom Properties, Ltd. . . . . . . . . . . . . . . . . . . . . . . . . . . . . . . 8,909 40,344AudioCodes, Ltd. . . . . . . . . . . . . . . . . . . . . . . . . . . . . . . . . . . . 6,872 69,087Avgol Industries 1953, Ltd. . . . . . . . . . . . . . . . . . . . . . . . . . . . . 9,099 10,010Azorim-Investment Development & Construction Co., Ltd. (b) . . . . . 23,712 23,528Bayside Land Corp. . . . . . . . . . . . . . . . . . . . . . . . . . . . . . . . . . 205 95,461Big Shopping Centers, Ltd. . . . . . . . . . . . . . . . . . . . . . . . . . . . . 1,031 72,289BioLine RX, Ltd. (b) . . . . . . . . . . . . . . . . . . . . . . . . . . . . . . . . . 2,565 2,643Blue Square Real Estate, Ltd. . . . . . . . . . . . . . . . . . . . . . . . . . . 867 32,523Brainsway, Ltd. (b) . . . . . . . . . . . . . . . . . . . . . . . . . . . . . . . . . 2,193 16,274Camtek, Ltd. . . . . . . . . . . . . . . . . . . . . . . . . . . . . . . . . . . . . . 3,606 31,937Cellcom Israel, Ltd. (b) . . . . . . . . . . . . . . . . . . . . . . . . . . . . . . 13,058 89,242
BHFTII-73
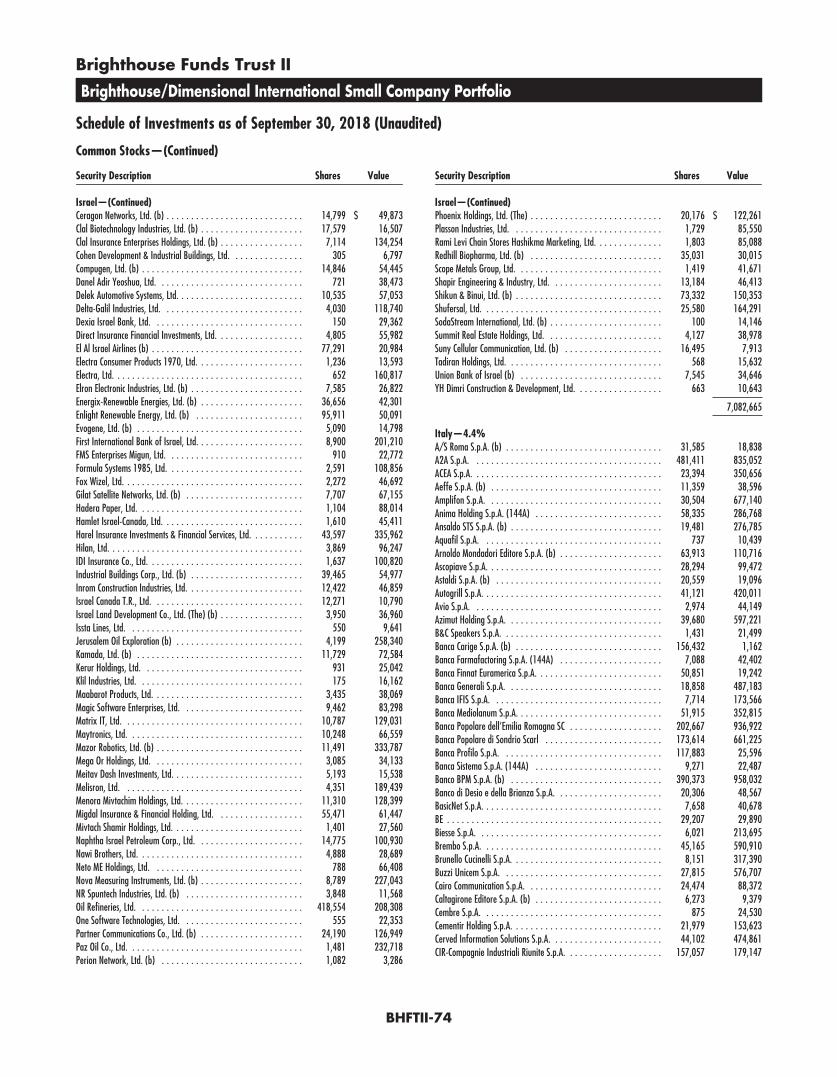
Brighthouse Funds Trust II
Brighthouse/Dimensional International Small Company Portfolio
Schedule of Investments as of September 30, 2018 (Unaudited)
Common Stocks—(Continued)
Security Description Shares Value
Israel—(Continued)Ceragon Networks, Ltd. (b) . . . . . . . . . . . . . . . . . . . . . . . . . . . . 14,799 $ 49,873Clal Biotechnology Industries, Ltd. (b) . . . . . . . . . . . . . . . . . . . . . 17,579 16,507Clal Insurance Enterprises Holdings, Ltd. (b) . . . . . . . . . . . . . . . . . 7,114 134,254Cohen Development & Industrial Buildings, Ltd. . . . . . . . . . . . . . . 305 6,797Compugen, Ltd. (b) . . . . . . . . . . . . . . . . . . . . . . . . . . . . . . . . . 14,846 54,445Danel Adir Yeoshua, Ltd. . . . . . . . . . . . . . . . . . . . . . . . . . . . . . 721 38,473Delek Automotive Systems, Ltd. . . . . . . . . . . . . . . . . . . . . . . . . . 10,535 57,053Delta-Galil Industries, Ltd. . . . . . . . . . . . . . . . . . . . . . . . . . . . . 4,030 118,740Dexia Israel Bank, Ltd. . . . . . . . . . . . . . . . . . . . . . . . . . . . . . . 150 29,362Direct Insurance Financial Investments, Ltd. . . . . . . . . . . . . . . . . . 4,805 55,982El Al Israel Airlines (b) . . . . . . . . . . . . . . . . . . . . . . . . . . . . . . . 77,291 20,984Electra Consumer Products 1970, Ltd. . . . . . . . . . . . . . . . . . . . . . 1,236 13,593Electra, Ltd. . . . . . . . . . . . . . . . . . . . . . . . . . . . . . . . . . . . . . . 652 160,817Elron Electronic Industries, Ltd. (b) . . . . . . . . . . . . . . . . . . . . . . . 7,585 26,822Energix-Renewable Energies, Ltd. (b) . . . . . . . . . . . . . . . . . . . . . 36,656 42,301Enlight Renewable Energy, Ltd. (b) . . . . . . . . . . . . . . . . . . . . . . 95,911 50,091Evogene, Ltd. (b) . . . . . . . . . . . . . . . . . . . . . . . . . . . . . . . . . . 5,090 14,798First International Bank of Israel, Ltd. . . . . . . . . . . . . . . . . . . . . . 8,900 201,210FMS Enterprises Migun, Ltd. . . . . . . . . . . . . . . . . . . . . . . . . . . . 910 22,772Formula Systems 1985, Ltd. . . . . . . . . . . . . . . . . . . . . . . . . . . . 2,591 108,856Fox Wizel, Ltd. . . . . . . . . . . . . . . . . . . . . . . . . . . . . . . . . . . . . 2,272 46,692Gilat Satellite Networks, Ltd. (b) . . . . . . . . . . . . . . . . . . . . . . . . 7,707 67,155Hadera Paper, Ltd. . . . . . . . . . . . . . . . . . . . . . . . . . . . . . . . . . 1,104 88,014Hamlet Israel-Canada, Ltd. . . . . . . . . . . . . . . . . . . . . . . . . . . . . 1,610 45,411Harel Insurance Investments & Financial Services, Ltd. . . . . . . . . . . 43,597 335,962Hilan, Ltd. . . . . . . . . . . . . . . . . . . . . . . . . . . . . . . . . . . . . . . . 3,869 96,247IDI Insurance Co., Ltd. . . . . . . . . . . . . . . . . . . . . . . . . . . . . . . . 1,637 100,820Industrial Buildings Corp., Ltd. (b) . . . . . . . . . . . . . . . . . . . . . . . 39,465 54,977Inrom Construction Industries, Ltd. . . . . . . . . . . . . . . . . . . . . . . . 12,422 46,859Israel Canada T.R., Ltd. . . . . . . . . . . . . . . . . . . . . . . . . . . . . . . 12,271 10,790Israel Land Development Co., Ltd. (The) (b) . . . . . . . . . . . . . . . . . 3,950 36,960Issta Lines, Ltd. . . . . . . . . . . . . . . . . . . . . . . . . . . . . . . . . . . . 550 9,641Jerusalem Oil Exploration (b) . . . . . . . . . . . . . . . . . . . . . . . . . . 4,199 258,340Kamada, Ltd. (b) . . . . . . . . . . . . . . . . . . . . . . . . . . . . . . . . . . 11,729 72,584Kerur Holdings, Ltd. . . . . . . . . . . . . . . . . . . . . . . . . . . . . . . . . 931 25,042Klil Industries, Ltd. . . . . . . . . . . . . . . . . . . . . . . . . . . . . . . . . . 175 16,162Maabarot Products, Ltd. . . . . . . . . . . . . . . . . . . . . . . . . . . . . . . 3,435 38,069Magic Software Enterprises, Ltd. . . . . . . . . . . . . . . . . . . . . . . . . 9,462 83,298Matrix IT, Ltd. . . . . . . . . . . . . . . . . . . . . . . . . . . . . . . . . . . . . 10,787 129,031Maytronics, Ltd. . . . . . . . . . . . . . . . . . . . . . . . . . . . . . . . . . . . 10,248 66,559Mazor Robotics, Ltd. (b) . . . . . . . . . . . . . . . . . . . . . . . . . . . . . . 11,491 333,787Mega Or Holdings, Ltd. . . . . . . . . . . . . . . . . . . . . . . . . . . . . . . 3,085 34,133Meitav Dash Investments, Ltd. . . . . . . . . . . . . . . . . . . . . . . . . . . 5,193 15,538Melisron, Ltd. . . . . . . . . . . . . . . . . . . . . . . . . . . . . . . . . . . . . 4,351 189,439Menora Mivtachim Holdings, Ltd. . . . . . . . . . . . . . . . . . . . . . . . . 11,310 128,399Migdal Insurance & Financial Holding, Ltd. . . . . . . . . . . . . . . . . . 55,471 61,447Mivtach Shamir Holdings, Ltd. . . . . . . . . . . . . . . . . . . . . . . . . . . 1,401 27,560Naphtha Israel Petroleum Corp., Ltd. . . . . . . . . . . . . . . . . . . . . . 14,775 100,930Nawi Brothers, Ltd. . . . . . . . . . . . . . . . . . . . . . . . . . . . . . . . . . 4,888 28,689Neto ME Holdings, Ltd. . . . . . . . . . . . . . . . . . . . . . . . . . . . . . . 788 66,408Nova Measuring Instruments, Ltd. (b) . . . . . . . . . . . . . . . . . . . . . 8,789 227,043NR Spuntech Industries, Ltd. (b) . . . . . . . . . . . . . . . . . . . . . . . . 3,848 11,568Oil Refineries, Ltd. . . . . . . . . . . . . . . . . . . . . . . . . . . . . . . . . . 418,554 208,308One Software Technologies, Ltd. . . . . . . . . . . . . . . . . . . . . . . . . 555 22,353Partner Communications Co., Ltd. (b) . . . . . . . . . . . . . . . . . . . . . 24,190 126,949Paz Oil Co., Ltd. . . . . . . . . . . . . . . . . . . . . . . . . . . . . . . . . . . . 1,481 232,718Perion Network, Ltd. (b) . . . . . . . . . . . . . . . . . . . . . . . . . . . . . 1,082 3,286
Security Description Shares Value
Israel—(Continued)Phoenix Holdings, Ltd. (The) . . . . . . . . . . . . . . . . . . . . . . . . . . . 20,176 $ 122,261Plasson Industries, Ltd. . . . . . . . . . . . . . . . . . . . . . . . . . . . . . . 1,729 85,550Rami Levi Chain Stores Hashikma Marketing, Ltd. . . . . . . . . . . . . . 1,803 85,088Redhill Biopharma, Ltd. (b) . . . . . . . . . . . . . . . . . . . . . . . . . . . 35,031 30,015Scope Metals Group, Ltd. . . . . . . . . . . . . . . . . . . . . . . . . . . . . . 1,419 41,671Shapir Engineering & Industry, Ltd. . . . . . . . . . . . . . . . . . . . . . . 13,184 46,413Shikun & Binui, Ltd. (b) . . . . . . . . . . . . . . . . . . . . . . . . . . . . . . 73,332 150,353Shufersal, Ltd. . . . . . . . . . . . . . . . . . . . . . . . . . . . . . . . . . . . . 25,580 164,291SodaStream International, Ltd. (b) . . . . . . . . . . . . . . . . . . . . . . . 100 14,146Summit Real Estate Holdings, Ltd. . . . . . . . . . . . . . . . . . . . . . . . 4,127 38,978Suny Cellular Communication, Ltd. (b) . . . . . . . . . . . . . . . . . . . . 16,495 7,913Tadiran Holdings, Ltd. . . . . . . . . . . . . . . . . . . . . . . . . . . . . . . . 568 15,632Union Bank of Israel (b) . . . . . . . . . . . . . . . . . . . . . . . . . . . . . 7,545 34,646YH Dimri Construction & Development, Ltd. . . . . . . . . . . . . . . . . . 663 10,643
7,082,665
Italy—4.4%A/S Roma S.p.A. (b) . . . . . . . . . . . . . . . . . . . . . . . . . . . . . . . . 31,585 18,838A2A S.p.A. . . . . . . . . . . . . . . . . . . . . . . . . . . . . . . . . . . . . . . 481,411 835,052ACEA S.p.A. . . . . . . . . . . . . . . . . . . . . . . . . . . . . . . . . . . . . . . 23,394 350,656Aeffe S.p.A. (b) . . . . . . . . . . . . . . . . . . . . . . . . . . . . . . . . . . . 11,359 38,596Amplifon S.p.A. . . . . . . . . . . . . . . . . . . . . . . . . . . . . . . . . . . . 30,504 677,140Anima Holding S.p.A. (144A) . . . . . . . . . . . . . . . . . . . . . . . . . . 58,335 286,768Ansaldo STS S.p.A. (b) . . . . . . . . . . . . . . . . . . . . . . . . . . . . . . . 19,481 276,785Aquafil S.p.A. . . . . . . . . . . . . . . . . . . . . . . . . . . . . . . . . . . . . 737 10,439Arnoldo Mondadori Editore S.p.A. (b) . . . . . . . . . . . . . . . . . . . . . 63,913 110,716Ascopiave S.p.A. . . . . . . . . . . . . . . . . . . . . . . . . . . . . . . . . . . . 28,294 99,472Astaldi S.p.A. (b) . . . . . . . . . . . . . . . . . . . . . . . . . . . . . . . . . . 20,559 19,096Autogrill S.p.A. . . . . . . . . . . . . . . . . . . . . . . . . . . . . . . . . . . . . 41,121 420,011Avio S.p.A. . . . . . . . . . . . . . . . . . . . . . . . . . . . . . . . . . . . . . . 2,974 44,149Azimut Holding S.p.A. . . . . . . . . . . . . . . . . . . . . . . . . . . . . . . . 39,680 597,221B&C Speakers S.p.A. . . . . . . . . . . . . . . . . . . . . . . . . . . . . . . . . 1,431 21,499Banca Carige S.p.A. (b) . . . . . . . . . . . . . . . . . . . . . . . . . . . . . . 156,432 1,162Banca Farmafactoring S.p.A. (144A) . . . . . . . . . . . . . . . . . . . . . 7,088 42,402Banca Finnat Euramerica S.p.A. . . . . . . . . . . . . . . . . . . . . . . . . . 50,851 19,242Banca Generali S.p.A. . . . . . . . . . . . . . . . . . . . . . . . . . . . . . . . 18,858 487,183Banca IFIS S.p.A. . . . . . . . . . . . . . . . . . . . . . . . . . . . . . . . . . . 7,714 173,566Banca Mediolanum S.p.A. . . . . . . . . . . . . . . . . . . . . . . . . . . . . . 51,915 352,815Banca Popolare dell’Emilia Romagna SC . . . . . . . . . . . . . . . . . . . 202,667 936,922Banca Popolare di Sondrio Scarl . . . . . . . . . . . . . . . . . . . . . . . . 173,614 661,225Banca Profilo S.p.A. . . . . . . . . . . . . . . . . . . . . . . . . . . . . . . . . 117,883 25,596Banca Sistema S.p.A. (144A) . . . . . . . . . . . . . . . . . . . . . . . . . . 9,271 22,487Banco BPM S.p.A. (b) . . . . . . . . . . . . . . . . . . . . . . . . . . . . . . . 390,373 958,032Banco di Desio e della Brianza S.p.A. . . . . . . . . . . . . . . . . . . . . . 20,306 48,567BasicNet S.p.A. . . . . . . . . . . . . . . . . . . . . . . . . . . . . . . . . . . . . 7,658 40,678BE . . . . . . . . . . . . . . . . . . . . . . . . . . . . . . . . . . . . . . . . . . . . 29,207 29,890Biesse S.p.A. . . . . . . . . . . . . . . . . . . . . . . . . . . . . . . . . . . . . . 6,021 213,695Brembo S.p.A. . . . . . . . . . . . . . . . . . . . . . . . . . . . . . . . . . . . . 45,165 590,910Brunello Cucinelli S.p.A. . . . . . . . . . . . . . . . . . . . . . . . . . . . . . . 8,151 317,390Buzzi Unicem S.p.A. . . . . . . . . . . . . . . . . . . . . . . . . . . . . . . . . 27,815 576,707Cairo Communication S.p.A. . . . . . . . . . . . . . . . . . . . . . . . . . . . 24,474 88,372Caltagirone Editore S.p.A. (b) . . . . . . . . . . . . . . . . . . . . . . . . . . 6,273 9,379Cembre S.p.A. . . . . . . . . . . . . . . . . . . . . . . . . . . . . . . . . . . . . 875 24,530Cementir Holding S.p.A. . . . . . . . . . . . . . . . . . . . . . . . . . . . . . . 21,979 153,623Cerved Information Solutions S.p.A. . . . . . . . . . . . . . . . . . . . . . . 44,102 474,861CIR-Compagnie Industriali Riunite S.p.A. . . . . . . . . . . . . . . . . . . . 157,057 179,147
BHFTII-74

Brighthouse Funds Trust II
Brighthouse/Dimensional International Small Company Portfolio
Schedule of Investments as of September 30, 2018 (Unaudited)
Common Stocks—(Continued)
Security Description Shares Value
Italy—(Continued)Credito Emiliano S.p.A. . . . . . . . . . . . . . . . . . . . . . . . . . . . . . . 35,381 $ 232,408Credito Valtellinese S.p.A. (b) . . . . . . . . . . . . . . . . . . . . . . . . . . 2,927,424 366,787d’Amico International Shipping S.A. (b) . . . . . . . . . . . . . . . . . . . . 60,320 12,578Danieli & C Officine Meccaniche S.p.A. . . . . . . . . . . . . . . . . . . . . 4,846 129,127Datalogic S.p.A. . . . . . . . . . . . . . . . . . . . . . . . . . . . . . . . . . . . 8,028 290,346De’Longhi S.p.A. . . . . . . . . . . . . . . . . . . . . . . . . . . . . . . . . . . 16,896 530,003DeA Capital S.p.A. . . . . . . . . . . . . . . . . . . . . . . . . . . . . . . . . . 18,071 26,648DiaSorin S.p.A. . . . . . . . . . . . . . . . . . . . . . . . . . . . . . . . . . . . . 6,863 721,862Digital Bros S.p.A. . . . . . . . . . . . . . . . . . . . . . . . . . . . . . . . . . . 1,166 12,847Ei Towers S.p.A. . . . . . . . . . . . . . . . . . . . . . . . . . . . . . . . . . . . 7,035 463,891El.En. S.p.A. . . . . . . . . . . . . . . . . . . . . . . . . . . . . . . . . . . . . . . 507 12,468Emak S.p.A. . . . . . . . . . . . . . . . . . . . . . . . . . . . . . . . . . . . . . 8,807 13,661Enav S.p.A. (144A) . . . . . . . . . . . . . . . . . . . . . . . . . . . . . . . . . 45,852 223,299ERG S.p.A. . . . . . . . . . . . . . . . . . . . . . . . . . . . . . . . . . . . . . . 21,603 439,941Esprinet S.p.A. . . . . . . . . . . . . . . . . . . . . . . . . . . . . . . . . . . . . 14,507 64,186Eurotech S.p.A. (b) . . . . . . . . . . . . . . . . . . . . . . . . . . . . . . . . . 13,076 57,691Falck Renewables S.p.A. . . . . . . . . . . . . . . . . . . . . . . . . . . . . . . 34,815 75,185Fila S.p.A. . . . . . . . . . . . . . . . . . . . . . . . . . . . . . . . . . . . . . . . 1,813 36,820Fincantieri S.p.A. (b) . . . . . . . . . . . . . . . . . . . . . . . . . . . . . . . . 93,136 151,174FinecoBank Banca Fineco S.p.A. . . . . . . . . . . . . . . . . . . . . . . . . . 72,092 962,485FNM S.p.A. . . . . . . . . . . . . . . . . . . . . . . . . . . . . . . . . . . . . . . 55,327 36,423Geox S.p.A. . . . . . . . . . . . . . . . . . . . . . . . . . . . . . . . . . . . . . . 34,378 86,581Gruppo Editoriale L’Espresso S.p.A. (b) (e) . . . . . . . . . . . . . . . . . . 52,528 23,633Gruppo MutuiOnline S.p.A. . . . . . . . . . . . . . . . . . . . . . . . . . . . . 6,461 126,326Hera S.p.A. . . . . . . . . . . . . . . . . . . . . . . . . . . . . . . . . . . . . . . 231,619 721,247IMMSI S.p.A. (b) . . . . . . . . . . . . . . . . . . . . . . . . . . . . . . . . . . . 100,436 55,235Industria Macchine Automatiche S.p.A. . . . . . . . . . . . . . . . . . . . . 5,461 456,842Infrastrutture Wireless Italiane S.p.A. (144A) . . . . . . . . . . . . . . . . 27,392 202,941Intek Group S.p.A. (b) . . . . . . . . . . . . . . . . . . . . . . . . . . . . . . . 80,757 32,815Interpump Group S.p.A. . . . . . . . . . . . . . . . . . . . . . . . . . . . . . . 22,700 743,235Iren S.p.A. . . . . . . . . . . . . . . . . . . . . . . . . . . . . . . . . . . . . . . 231,134 567,309Italgas S.p.A. . . . . . . . . . . . . . . . . . . . . . . . . . . . . . . . . . . . . . 95,428 517,338Italmobiliare S.p.A. . . . . . . . . . . . . . . . . . . . . . . . . . . . . . . . . . 3,185 76,732IVS Group S.A. . . . . . . . . . . . . . . . . . . . . . . . . . . . . . . . . . . . . 1,749 24,485Juventus Football Club S.p.A. (b) . . . . . . . . . . . . . . . . . . . . . . . . 147,435 250,890La Doria S.p.A. . . . . . . . . . . . . . . . . . . . . . . . . . . . . . . . . . . . . 3,877 50,909Leonardo S.p.A. . . . . . . . . . . . . . . . . . . . . . . . . . . . . . . . . . . . 35,075 422,714Maire Tecnimont S.p.A. . . . . . . . . . . . . . . . . . . . . . . . . . . . . . . 35,567 159,980MARR S.p.A. . . . . . . . . . . . . . . . . . . . . . . . . . . . . . . . . . . . . . 13,428 393,400Massimo Zanetti Beverage Group S.p.A. (144A) . . . . . . . . . . . . . . 1,925 15,690Mediaset S.p.A. (b) . . . . . . . . . . . . . . . . . . . . . . . . . . . . . . . . . 192,042 599,312Moncler S.p.A. . . . . . . . . . . . . . . . . . . . . . . . . . . . . . . . . . . . . 27,092 1,165,745Nice S.p.A. . . . . . . . . . . . . . . . . . . . . . . . . . . . . . . . . . . . . . . 9,890 33,402Openjobmetis S.p.A. agenzia per il lavoro (b) . . . . . . . . . . . . . . . . 1,209 12,167OVS S.p.A. (144A) (b) . . . . . . . . . . . . . . . . . . . . . . . . . . . . . . . 23,352 66,969Parmalat S.p.A. . . . . . . . . . . . . . . . . . . . . . . . . . . . . . . . . . . . 13,351 44,023Piaggio & C S.p.A. . . . . . . . . . . . . . . . . . . . . . . . . . . . . . . . . . 71,430 163,463Prima Industrie S.p.A. . . . . . . . . . . . . . . . . . . . . . . . . . . . . . . . 1,853 62,885Prysmian S.p.A. . . . . . . . . . . . . . . . . . . . . . . . . . . . . . . . . . . . 33,800 784,722RAI Way S.p.A. (144A) . . . . . . . . . . . . . . . . . . . . . . . . . . . . . . 12,094 61,433Reno de Medici S.p.A. . . . . . . . . . . . . . . . . . . . . . . . . . . . . . . . 46,743 51,962Reply S.p.A. . . . . . . . . . . . . . . . . . . . . . . . . . . . . . . . . . . . . . 6,572 452,172Retelit S.p.A. . . . . . . . . . . . . . . . . . . . . . . . . . . . . . . . . . . . . . 36,769 64,207Rizzoli Corriere Della Sera Mediagroup S.p.A. (b) . . . . . . . . . . . . . 19,560 22,595Sabaf S.p.A. . . . . . . . . . . . . . . . . . . . . . . . . . . . . . . . . . . . . . 3,059 56,116SAES Getters S.p.A. . . . . . . . . . . . . . . . . . . . . . . . . . . . . . . . . . 1,416 33,894Safilo Group S.p.A. (b) . . . . . . . . . . . . . . . . . . . . . . . . . . . . . . 12,212 29,888
Security Description Shares Value
Italy—(Continued)Saipem S.p.A. (b) . . . . . . . . . . . . . . . . . . . . . . . . . . . . . . . . . . 186,651 $ 1,148,510Salini Impregilo S.p.A. (e) . . . . . . . . . . . . . . . . . . . . . . . . . . . . 70,140 172,701Salvatore Ferragamo S.p.A. . . . . . . . . . . . . . . . . . . . . . . . . . . . 16,352 391,671Saras S.p.A. . . . . . . . . . . . . . . . . . . . . . . . . . . . . . . . . . . . . . . 134,526 288,824Servizi Italia S.p.A. . . . . . . . . . . . . . . . . . . . . . . . . . . . . . . . . . 1,701 7,978Sesa S.p.A. . . . . . . . . . . . . . . . . . . . . . . . . . . . . . . . . . . . . . . 1,672 53,187Societa Cattolica di Assicurazioni SC . . . . . . . . . . . . . . . . . . . . . . 61,974 532,753Societa Iniziative Autostradali e Servizi S.p.A. . . . . . . . . . . . . . . . . 25,981 383,452Sogefi S.p.A. (b) . . . . . . . . . . . . . . . . . . . . . . . . . . . . . . . . . . . 24,822 56,108SOL S.p.A. . . . . . . . . . . . . . . . . . . . . . . . . . . . . . . . . . . . . . . . 11,001 131,794Tamburi Investment Partners S.p.A. . . . . . . . . . . . . . . . . . . . . . . 25,760 194,107Technogym S.p.A. (144A) . . . . . . . . . . . . . . . . . . . . . . . . . . . . 13,407 164,184Tecnoinvestimenti S.p.A. . . . . . . . . . . . . . . . . . . . . . . . . . . . . . 462 3,482Tiscali S.p.A. (b) (e) . . . . . . . . . . . . . . . . . . . . . . . . . . . . . . . . 802,477 15,094Tod’s S.p.A. . . . . . . . . . . . . . . . . . . . . . . . . . . . . . . . . . . . . . . 3,954 269,524Trevi Finanziaria Industriale S.p.A. (b) . . . . . . . . . . . . . . . . . . . . 31,414 11,015TXT e-solutions S.p.A. . . . . . . . . . . . . . . . . . . . . . . . . . . . . . . . 980 10,821Uni Land S.p.A. (a) (b) (c) (d) . . . . . . . . . . . . . . . . . . . . . . . . . . 4,937 0Unieuro S.p.A. (144A) (b) . . . . . . . . . . . . . . . . . . . . . . . . . . . . 902 11,991Unione di Banche Italiane S.p.A. . . . . . . . . . . . . . . . . . . . . . . . . 325,151 1,303,638Unipol Gruppo Finanziario S.p.A. . . . . . . . . . . . . . . . . . . . . . . . . 126,457 563,213UnipolSai Assicurazioni S.p.A. (e) . . . . . . . . . . . . . . . . . . . . . . . . 127,672 300,319Zignago Vetro S.p.A. . . . . . . . . . . . . . . . . . . . . . . . . . . . . . . . . 11,476 113,922
29,856,194
Japan—25.1%77 Bank, Ltd. (The) . . . . . . . . . . . . . . . . . . . . . . . . . . . . . . . . 12,800 304,379A&A Material Corp. . . . . . . . . . . . . . . . . . . . . . . . . . . . . . . . . . 1,200 12,802A&D Co., Ltd. . . . . . . . . . . . . . . . . . . . . . . . . . . . . . . . . . . . . . 3,000 27,776A/S One Corp. . . . . . . . . . . . . . . . . . . . . . . . . . . . . . . . . . . . . 3,500 261,546Abist Co., Ltd. . . . . . . . . . . . . . . . . . . . . . . . . . . . . . . . . . . . . 600 22,170Achilles Corp. . . . . . . . . . . . . . . . . . . . . . . . . . . . . . . . . . . . . . 6,500 135,866Adastria Co., Ltd. . . . . . . . . . . . . . . . . . . . . . . . . . . . . . . . . . . 9,240 123,465ADEKA Corp. . . . . . . . . . . . . . . . . . . . . . . . . . . . . . . . . . . . . . 34,600 593,789Adtec Plasma Technology Co., Ltd. . . . . . . . . . . . . . . . . . . . . . . . 600 6,720Advan Co., Ltd. . . . . . . . . . . . . . . . . . . . . . . . . . . . . . . . . . . . 6,700 58,082Advanex, Inc. . . . . . . . . . . . . . . . . . . . . . . . . . . . . . . . . . . . . 900 16,787Advantage Risk Management Co., Ltd. . . . . . . . . . . . . . . . . . . . . 1,300 13,787Adventure, Inc. . . . . . . . . . . . . . . . . . . . . . . . . . . . . . . . . . . . 600 51,411Aeon Delight Co., Ltd. . . . . . . . . . . . . . . . . . . . . . . . . . . . . . . . 3,900 142,273Aeon Fantasy Co., Ltd. . . . . . . . . . . . . . . . . . . . . . . . . . . . . . . . 2,400 89,454Aeon Hokkaido Corp. . . . . . . . . . . . . . . . . . . . . . . . . . . . . . . . 2,600 19,383Aeria, Inc. . . . . . . . . . . . . . . . . . . . . . . . . . . . . . . . . . . . . . . . 2,200 15,869AGORA Hospitality Group Co., Ltd. (b) . . . . . . . . . . . . . . . . . . . . 27,000 8,089Agro-Kanesho Co., Ltd. . . . . . . . . . . . . . . . . . . . . . . . . . . . . . . 2,900 65,094Ahresty Corp. . . . . . . . . . . . . . . . . . . . . . . . . . . . . . . . . . . . . . 9,200 68,759Ai Holdings Corp. . . . . . . . . . . . . . . . . . . . . . . . . . . . . . . . . . . 12,200 282,603Aichi Bank, Ltd. (The) . . . . . . . . . . . . . . . . . . . . . . . . . . . . . . . 2,600 116,260Aichi Corp. . . . . . . . . . . . . . . . . . . . . . . . . . . . . . . . . . . . . . . 10,800 58,836Aichi Steel Corp. . . . . . . . . . . . . . . . . . . . . . . . . . . . . . . . . . . . 4,300 164,087Aichi Tokei Denki Co., Ltd. . . . . . . . . . . . . . . . . . . . . . . . . . . . . 1,900 79,105Aida Engineering, Ltd. . . . . . . . . . . . . . . . . . . . . . . . . . . . . . . . 20,700 185,090Aiphone Co., Ltd. . . . . . . . . . . . . . . . . . . . . . . . . . . . . . . . . . . 4,600 69,027Airport Facilities Co., Ltd. . . . . . . . . . . . . . . . . . . . . . . . . . . . . . 7,500 43,097Aisan Industry Co., Ltd. . . . . . . . . . . . . . . . . . . . . . . . . . . . . . . 10,400 90,429AIT Corp. . . . . . . . . . . . . . . . . . . . . . . . . . . . . . . . . . . . . . . . 900 8,405
BHFTII-75
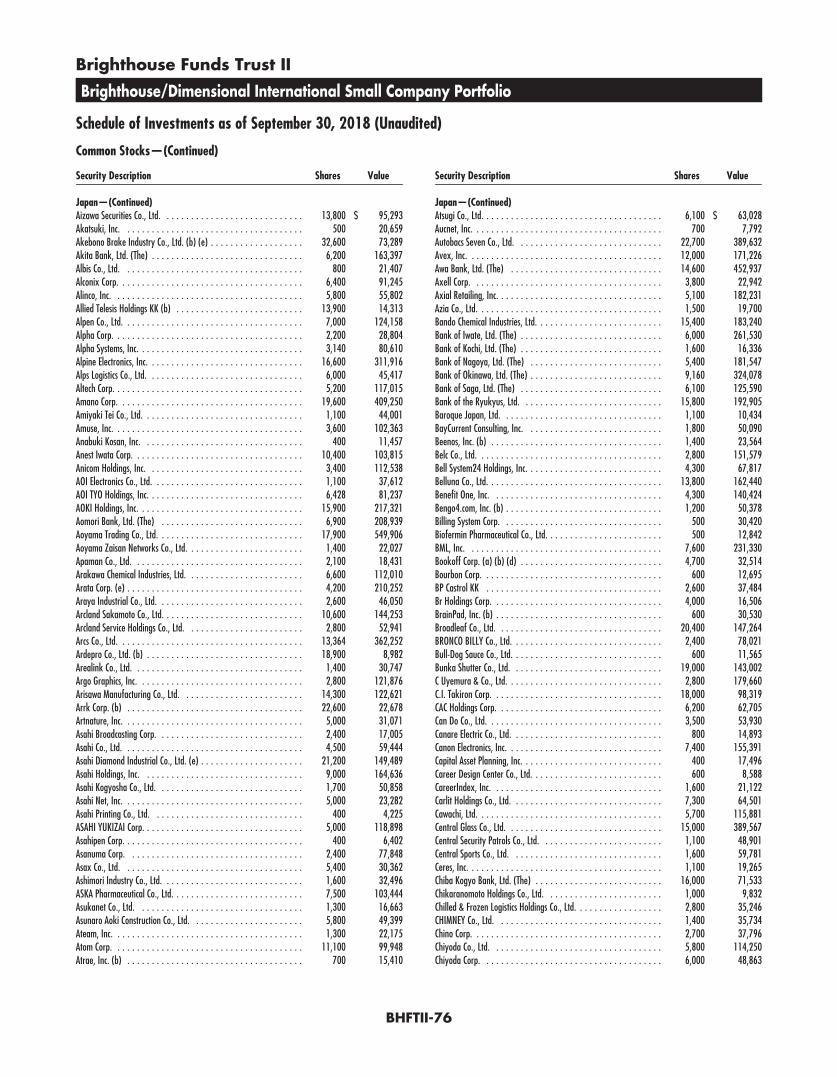
Brighthouse Funds Trust II
Brighthouse/Dimensional International Small Company Portfolio
Schedule of Investments as of September 30, 2018 (Unaudited)
Common Stocks—(Continued)
Security Description Shares Value
Japan—(Continued)Aizawa Securities Co., Ltd. . . . . . . . . . . . . . . . . . . . . . . . . . . . . 13,800 $ 95,293Akatsuki, Inc. . . . . . . . . . . . . . . . . . . . . . . . . . . . . . . . . . . . . 500 20,659Akebono Brake Industry Co., Ltd. (b) (e) . . . . . . . . . . . . . . . . . . . 32,600 73,289Akita Bank, Ltd. (The) . . . . . . . . . . . . . . . . . . . . . . . . . . . . . . . 6,200 163,397Albis Co., Ltd. . . . . . . . . . . . . . . . . . . . . . . . . . . . . . . . . . . . . 800 21,407Alconix Corp. . . . . . . . . . . . . . . . . . . . . . . . . . . . . . . . . . . . . . 6,400 91,245Alinco, Inc. . . . . . . . . . . . . . . . . . . . . . . . . . . . . . . . . . . . . . . 5,800 55,802Allied Telesis Holdings KK (b) . . . . . . . . . . . . . . . . . . . . . . . . . . 13,900 14,313Alpen Co., Ltd. . . . . . . . . . . . . . . . . . . . . . . . . . . . . . . . . . . . . 7,000 124,158Alpha Corp. . . . . . . . . . . . . . . . . . . . . . . . . . . . . . . . . . . . . . . 2,200 28,804Alpha Systems, Inc. . . . . . . . . . . . . . . . . . . . . . . . . . . . . . . . . . 3,140 80,610Alpine Electronics, Inc. . . . . . . . . . . . . . . . . . . . . . . . . . . . . . . . 16,600 311,916Alps Logistics Co., Ltd. . . . . . . . . . . . . . . . . . . . . . . . . . . . . . . . 6,000 45,417Altech Corp. . . . . . . . . . . . . . . . . . . . . . . . . . . . . . . . . . . . . . . 5,200 117,015Amano Corp. . . . . . . . . . . . . . . . . . . . . . . . . . . . . . . . . . . . . . 19,600 409,250Amiyaki Tei Co., Ltd. . . . . . . . . . . . . . . . . . . . . . . . . . . . . . . . . 1,100 44,001Amuse, Inc. . . . . . . . . . . . . . . . . . . . . . . . . . . . . . . . . . . . . . . 3,600 102,363Anabuki Kosan, Inc. . . . . . . . . . . . . . . . . . . . . . . . . . . . . . . . . 400 11,457Anest Iwata Corp. . . . . . . . . . . . . . . . . . . . . . . . . . . . . . . . . . . 10,400 103,815Anicom Holdings, Inc. . . . . . . . . . . . . . . . . . . . . . . . . . . . . . . . 3,400 112,538AOI Electronics Co., Ltd. . . . . . . . . . . . . . . . . . . . . . . . . . . . . . . 1,100 37,612AOI TYO Holdings, Inc. . . . . . . . . . . . . . . . . . . . . . . . . . . . . . . . 6,428 81,237AOKI Holdings, Inc. . . . . . . . . . . . . . . . . . . . . . . . . . . . . . . . . . 15,900 217,321Aomori Bank, Ltd. (The) . . . . . . . . . . . . . . . . . . . . . . . . . . . . . 6,900 208,939Aoyama Trading Co., Ltd. . . . . . . . . . . . . . . . . . . . . . . . . . . . . . 17,900 549,906Aoyama Zaisan Networks Co., Ltd. . . . . . . . . . . . . . . . . . . . . . . . 1,400 22,027Apaman Co., Ltd. . . . . . . . . . . . . . . . . . . . . . . . . . . . . . . . . . . 2,100 18,431Arakawa Chemical Industries, Ltd. . . . . . . . . . . . . . . . . . . . . . . . 6,600 112,010Arata Corp. (e) . . . . . . . . . . . . . . . . . . . . . . . . . . . . . . . . . . . . 4,200 210,252Araya Industrial Co., Ltd. . . . . . . . . . . . . . . . . . . . . . . . . . . . . . 2,600 46,050Arcland Sakamoto Co., Ltd. . . . . . . . . . . . . . . . . . . . . . . . . . . . . 10,600 144,253Arcland Service Holdings Co., Ltd. . . . . . . . . . . . . . . . . . . . . . . . 2,800 52,941Arcs Co., Ltd. . . . . . . . . . . . . . . . . . . . . . . . . . . . . . . . . . . . . . 13,364 362,252Ardepro Co., Ltd. (b) . . . . . . . . . . . . . . . . . . . . . . . . . . . . . . . . 18,900 8,982Arealink Co., Ltd. . . . . . . . . . . . . . . . . . . . . . . . . . . . . . . . . . . 1,400 30,747Argo Graphics, Inc. . . . . . . . . . . . . . . . . . . . . . . . . . . . . . . . . . 2,800 121,876Arisawa Manufacturing Co., Ltd. . . . . . . . . . . . . . . . . . . . . . . . . 14,300 122,621Arrk Corp. (b) . . . . . . . . . . . . . . . . . . . . . . . . . . . . . . . . . . . . 22,600 22,678Artnature, Inc. . . . . . . . . . . . . . . . . . . . . . . . . . . . . . . . . . . . . 5,000 31,071Asahi Broadcasting Corp. . . . . . . . . . . . . . . . . . . . . . . . . . . . . . 2,400 17,005Asahi Co., Ltd. . . . . . . . . . . . . . . . . . . . . . . . . . . . . . . . . . . . . 4,500 59,444Asahi Diamond Industrial Co., Ltd. (e) . . . . . . . . . . . . . . . . . . . . . 21,200 149,489Asahi Holdings, Inc. . . . . . . . . . . . . . . . . . . . . . . . . . . . . . . . . 9,000 164,636Asahi Kogyosha Co., Ltd. . . . . . . . . . . . . . . . . . . . . . . . . . . . . . 1,700 50,858Asahi Net, Inc. . . . . . . . . . . . . . . . . . . . . . . . . . . . . . . . . . . . . 5,000 23,282Asahi Printing Co., Ltd. . . . . . . . . . . . . . . . . . . . . . . . . . . . . . . 400 4,225ASAHI YUKIZAI Corp. . . . . . . . . . . . . . . . . . . . . . . . . . . . . . . . . 5,000 118,898Asahipen Corp. . . . . . . . . . . . . . . . . . . . . . . . . . . . . . . . . . . . . 400 6,402Asanuma Corp. . . . . . . . . . . . . . . . . . . . . . . . . . . . . . . . . . . . 2,400 77,848Asax Co., Ltd. . . . . . . . . . . . . . . . . . . . . . . . . . . . . . . . . . . . . 5,400 30,362Ashimori Industry Co., Ltd. . . . . . . . . . . . . . . . . . . . . . . . . . . . . 1,600 32,496ASKA Pharmaceutical Co., Ltd. . . . . . . . . . . . . . . . . . . . . . . . . . . 7,500 103,444Asukanet Co., Ltd. . . . . . . . . . . . . . . . . . . . . . . . . . . . . . . . . . 1,300 16,663Asunaro Aoki Construction Co., Ltd. . . . . . . . . . . . . . . . . . . . . . . 5,800 49,399Ateam, Inc. . . . . . . . . . . . . . . . . . . . . . . . . . . . . . . . . . . . . . . 1,300 22,175Atom Corp. . . . . . . . . . . . . . . . . . . . . . . . . . . . . . . . . . . . . . . 11,100 99,948Atrae, Inc. (b) . . . . . . . . . . . . . . . . . . . . . . . . . . . . . . . . . . . . 700 15,410
Security Description Shares Value
Japan—(Continued)Atsugi Co., Ltd. . . . . . . . . . . . . . . . . . . . . . . . . . . . . . . . . . . . . 6,100 $ 63,028Aucnet, Inc. . . . . . . . . . . . . . . . . . . . . . . . . . . . . . . . . . . . . . . 700 7,792Autobacs Seven Co., Ltd. . . . . . . . . . . . . . . . . . . . . . . . . . . . . . 22,700 389,632Avex, Inc. . . . . . . . . . . . . . . . . . . . . . . . . . . . . . . . . . . . . . . . 12,000 171,226Awa Bank, Ltd. (The) . . . . . . . . . . . . . . . . . . . . . . . . . . . . . . . 14,600 452,937Axell Corp. . . . . . . . . . . . . . . . . . . . . . . . . . . . . . . . . . . . . . . 3,800 22,942Axial Retailing, Inc. . . . . . . . . . . . . . . . . . . . . . . . . . . . . . . . . . 5,100 182,231Azia Co., Ltd. . . . . . . . . . . . . . . . . . . . . . . . . . . . . . . . . . . . . . 1,500 19,700Bando Chemical Industries, Ltd. . . . . . . . . . . . . . . . . . . . . . . . . . 15,400 183,240Bank of Iwate, Ltd. (The) . . . . . . . . . . . . . . . . . . . . . . . . . . . . . 6,000 261,530Bank of Kochi, Ltd. (The) . . . . . . . . . . . . . . . . . . . . . . . . . . . . . 1,600 16,336Bank of Nagoya, Ltd. (The) . . . . . . . . . . . . . . . . . . . . . . . . . . . 5,400 181,547Bank of Okinawa, Ltd. (The) . . . . . . . . . . . . . . . . . . . . . . . . . . . 9,160 324,078Bank of Saga, Ltd. (The) . . . . . . . . . . . . . . . . . . . . . . . . . . . . . 6,100 125,590Bank of the Ryukyus, Ltd. . . . . . . . . . . . . . . . . . . . . . . . . . . . . 15,800 192,905Baroque Japan, Ltd. . . . . . . . . . . . . . . . . . . . . . . . . . . . . . . . . 1,100 10,434BayCurrent Consulting, Inc. . . . . . . . . . . . . . . . . . . . . . . . . . . . 1,800 50,090Beenos, Inc. (b) . . . . . . . . . . . . . . . . . . . . . . . . . . . . . . . . . . . 1,400 23,564Belc Co., Ltd. . . . . . . . . . . . . . . . . . . . . . . . . . . . . . . . . . . . . . 2,800 151,579Bell System24 Holdings, Inc. . . . . . . . . . . . . . . . . . . . . . . . . . . . 4,300 67,817Belluna Co., Ltd. . . . . . . . . . . . . . . . . . . . . . . . . . . . . . . . . . . . 13,800 162,440Benefit One, Inc. . . . . . . . . . . . . . . . . . . . . . . . . . . . . . . . . . . 4,300 140,424Bengo4.com, Inc. (b) . . . . . . . . . . . . . . . . . . . . . . . . . . . . . . . . 1,200 50,378Billing System Corp. . . . . . . . . . . . . . . . . . . . . . . . . . . . . . . . . 500 30,420Biofermin Pharmaceutical Co., Ltd. . . . . . . . . . . . . . . . . . . . . . . . 500 12,842BML, Inc. . . . . . . . . . . . . . . . . . . . . . . . . . . . . . . . . . . . . . . . 7,600 231,330Bookoff Corp. (a) (b) (d) . . . . . . . . . . . . . . . . . . . . . . . . . . . . . 4,700 32,514Bourbon Corp. . . . . . . . . . . . . . . . . . . . . . . . . . . . . . . . . . . . . 600 12,695BP Castrol KK . . . . . . . . . . . . . . . . . . . . . . . . . . . . . . . . . . . . 2,600 37,484Br Holdings Corp. . . . . . . . . . . . . . . . . . . . . . . . . . . . . . . . . . . 4,000 16,506BrainPad, Inc. (b) . . . . . . . . . . . . . . . . . . . . . . . . . . . . . . . . . . 600 30,530Broadleaf Co., Ltd. . . . . . . . . . . . . . . . . . . . . . . . . . . . . . . . . . 20,400 147,264BRONCO BILLY Co., Ltd. . . . . . . . . . . . . . . . . . . . . . . . . . . . . . . 2,400 78,021Bull-Dog Sauce Co., Ltd. . . . . . . . . . . . . . . . . . . . . . . . . . . . . . . 600 11,565Bunka Shutter Co., Ltd. . . . . . . . . . . . . . . . . . . . . . . . . . . . . . . 19,000 143,002C Uyemura & Co., Ltd. . . . . . . . . . . . . . . . . . . . . . . . . . . . . . . . 2,800 179,660C.I. Takiron Corp. . . . . . . . . . . . . . . . . . . . . . . . . . . . . . . . . . . 18,000 98,319CAC Holdings Corp. . . . . . . . . . . . . . . . . . . . . . . . . . . . . . . . . . 6,200 62,705Can Do Co., Ltd. . . . . . . . . . . . . . . . . . . . . . . . . . . . . . . . . . . . 3,500 53,930Canare Electric Co., Ltd. . . . . . . . . . . . . . . . . . . . . . . . . . . . . . . 800 14,893Canon Electronics, Inc. . . . . . . . . . . . . . . . . . . . . . . . . . . . . . . . 7,400 155,391Capital Asset Planning, Inc. . . . . . . . . . . . . . . . . . . . . . . . . . . . . 400 17,496Career Design Center Co., Ltd. . . . . . . . . . . . . . . . . . . . . . . . . . . 600 8,588CareerIndex, Inc. . . . . . . . . . . . . . . . . . . . . . . . . . . . . . . . . . . 1,600 21,122Carlit Holdings Co., Ltd. . . . . . . . . . . . . . . . . . . . . . . . . . . . . . . 7,300 64,501Cawachi, Ltd. . . . . . . . . . . . . . . . . . . . . . . . . . . . . . . . . . . . . . 5,700 115,881Central Glass Co., Ltd. . . . . . . . . . . . . . . . . . . . . . . . . . . . . . . . 15,000 389,567Central Security Patrols Co., Ltd. . . . . . . . . . . . . . . . . . . . . . . . . 1,100 48,901Central Sports Co., Ltd. . . . . . . . . . . . . . . . . . . . . . . . . . . . . . . 1,600 59,781Ceres, Inc. . . . . . . . . . . . . . . . . . . . . . . . . . . . . . . . . . . . . . . . 1,100 19,265Chiba Kogyo Bank, Ltd. (The) . . . . . . . . . . . . . . . . . . . . . . . . . . 16,000 71,533Chikaranomoto Holdings Co., Ltd. . . . . . . . . . . . . . . . . . . . . . . . 1,000 9,832Chilled & Frozen Logistics Holdings Co., Ltd. . . . . . . . . . . . . . . . . . 2,800 35,246CHIMNEY Co., Ltd. . . . . . . . . . . . . . . . . . . . . . . . . . . . . . . . . . 1,400 35,734Chino Corp. . . . . . . . . . . . . . . . . . . . . . . . . . . . . . . . . . . . . . . 2,700 37,796Chiyoda Co., Ltd. . . . . . . . . . . . . . . . . . . . . . . . . . . . . . . . . . . 5,800 114,250Chiyoda Corp. . . . . . . . . . . . . . . . . . . . . . . . . . . . . . . . . . . . . 6,000 48,863
BHFTII-76
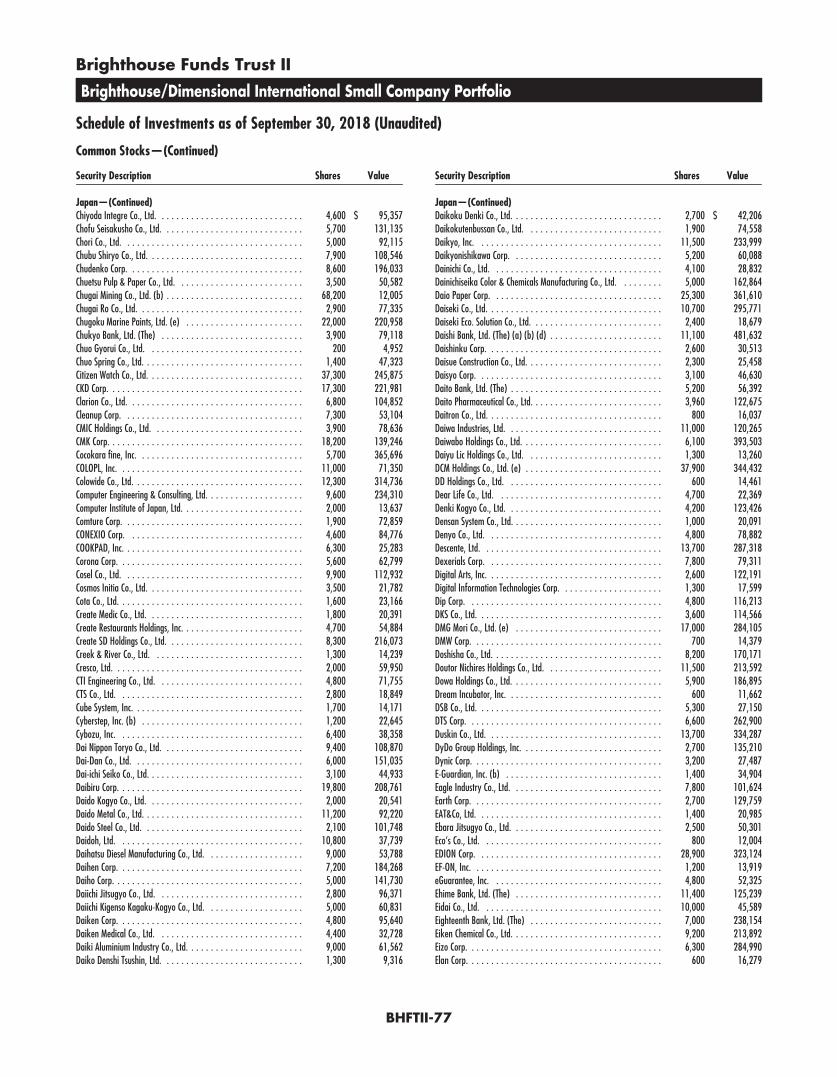
Brighthouse Funds Trust II
Brighthouse/Dimensional International Small Company Portfolio
Schedule of Investments as of September 30, 2018 (Unaudited)
Common Stocks—(Continued)
Security Description Shares Value
Japan—(Continued)Chiyoda Integre Co., Ltd. . . . . . . . . . . . . . . . . . . . . . . . . . . . . . 4,600 $ 95,357Chofu Seisakusho Co., Ltd. . . . . . . . . . . . . . . . . . . . . . . . . . . . . 5,700 131,135Chori Co., Ltd. . . . . . . . . . . . . . . . . . . . . . . . . . . . . . . . . . . . . 5,000 92,115Chubu Shiryo Co., Ltd. . . . . . . . . . . . . . . . . . . . . . . . . . . . . . . . 7,900 108,546Chudenko Corp. . . . . . . . . . . . . . . . . . . . . . . . . . . . . . . . . . . . 8,600 196,033Chuetsu Pulp & Paper Co., Ltd. . . . . . . . . . . . . . . . . . . . . . . . . . 3,500 50,582Chugai Mining Co., Ltd. (b) . . . . . . . . . . . . . . . . . . . . . . . . . . . . 68,200 12,005Chugai Ro Co., Ltd. . . . . . . . . . . . . . . . . . . . . . . . . . . . . . . . . . 2,900 77,335Chugoku Marine Paints, Ltd. (e) . . . . . . . . . . . . . . . . . . . . . . . . 22,000 220,958Chukyo Bank, Ltd. (The) . . . . . . . . . . . . . . . . . . . . . . . . . . . . . 3,900 79,118Chuo Gyorui Co., Ltd. . . . . . . . . . . . . . . . . . . . . . . . . . . . . . . . 200 4,952Chuo Spring Co., Ltd. . . . . . . . . . . . . . . . . . . . . . . . . . . . . . . . . 1,400 47,323Citizen Watch Co., Ltd. . . . . . . . . . . . . . . . . . . . . . . . . . . . . . . . 37,300 245,875CKD Corp. . . . . . . . . . . . . . . . . . . . . . . . . . . . . . . . . . . . . . . . 17,300 221,981Clarion Co., Ltd. . . . . . . . . . . . . . . . . . . . . . . . . . . . . . . . . . . . 6,800 104,852Cleanup Corp. . . . . . . . . . . . . . . . . . . . . . . . . . . . . . . . . . . . . 7,300 53,104CMIC Holdings Co., Ltd. . . . . . . . . . . . . . . . . . . . . . . . . . . . . . . 3,900 78,636CMK Corp. . . . . . . . . . . . . . . . . . . . . . . . . . . . . . . . . . . . . . . . 18,200 139,246Cocokara fine, Inc. . . . . . . . . . . . . . . . . . . . . . . . . . . . . . . . . . 5,700 365,696COLOPL, Inc. . . . . . . . . . . . . . . . . . . . . . . . . . . . . . . . . . . . . . 11,000 71,350Colowide Co., Ltd. . . . . . . . . . . . . . . . . . . . . . . . . . . . . . . . . . . 12,300 314,736Computer Engineering & Consulting, Ltd. . . . . . . . . . . . . . . . . . . . 9,600 234,310Computer Institute of Japan, Ltd. . . . . . . . . . . . . . . . . . . . . . . . . 2,000 13,637Comture Corp. . . . . . . . . . . . . . . . . . . . . . . . . . . . . . . . . . . . . 1,900 72,859CONEXIO Corp. . . . . . . . . . . . . . . . . . . . . . . . . . . . . . . . . . . . 4,600 84,776COOKPAD, Inc. . . . . . . . . . . . . . . . . . . . . . . . . . . . . . . . . . . . . 6,300 25,283Corona Corp. . . . . . . . . . . . . . . . . . . . . . . . . . . . . . . . . . . . . . 5,600 62,799Cosel Co., Ltd. . . . . . . . . . . . . . . . . . . . . . . . . . . . . . . . . . . . . 9,900 112,932Cosmos Initia Co., Ltd. . . . . . . . . . . . . . . . . . . . . . . . . . . . . . . . 3,500 21,782Cota Co., Ltd. . . . . . . . . . . . . . . . . . . . . . . . . . . . . . . . . . . . . . 1,600 23,166Create Medic Co., Ltd. . . . . . . . . . . . . . . . . . . . . . . . . . . . . . . . 1,800 20,391Create Restaurants Holdings, Inc. . . . . . . . . . . . . . . . . . . . . . . . . 4,700 54,884Create SD Holdings Co., Ltd. . . . . . . . . . . . . . . . . . . . . . . . . . . . 8,300 216,073Creek & River Co., Ltd. . . . . . . . . . . . . . . . . . . . . . . . . . . . . . . 1,300 14,239Cresco, Ltd. . . . . . . . . . . . . . . . . . . . . . . . . . . . . . . . . . . . . . . 2,000 59,950CTI Engineering Co., Ltd. . . . . . . . . . . . . . . . . . . . . . . . . . . . . . 4,800 71,755CTS Co., Ltd. . . . . . . . . . . . . . . . . . . . . . . . . . . . . . . . . . . . . . 2,800 18,849Cube System, Inc. . . . . . . . . . . . . . . . . . . . . . . . . . . . . . . . . . . 1,700 14,171Cyberstep, Inc. (b) . . . . . . . . . . . . . . . . . . . . . . . . . . . . . . . . . 1,200 22,645Cybozu, Inc. . . . . . . . . . . . . . . . . . . . . . . . . . . . . . . . . . . . . . 6,400 38,358Dai Nippon Toryo Co., Ltd. . . . . . . . . . . . . . . . . . . . . . . . . . . . . 9,400 108,870Dai-Dan Co., Ltd. . . . . . . . . . . . . . . . . . . . . . . . . . . . . . . . . . . 6,000 151,035Dai-ichi Seiko Co., Ltd. . . . . . . . . . . . . . . . . . . . . . . . . . . . . . . . 3,100 44,933Daibiru Corp. . . . . . . . . . . . . . . . . . . . . . . . . . . . . . . . . . . . . . 19,800 208,761Daido Kogyo Co., Ltd. . . . . . . . . . . . . . . . . . . . . . . . . . . . . . . . 2,000 20,541Daido Metal Co., Ltd. . . . . . . . . . . . . . . . . . . . . . . . . . . . . . . . . 11,200 92,220Daido Steel Co., Ltd. . . . . . . . . . . . . . . . . . . . . . . . . . . . . . . . . 2,100 101,748Daidoh, Ltd. . . . . . . . . . . . . . . . . . . . . . . . . . . . . . . . . . . . . . 10,800 37,739Daihatsu Diesel Manufacturing Co., Ltd. . . . . . . . . . . . . . . . . . . . 9,000 53,788Daihen Corp. . . . . . . . . . . . . . . . . . . . . . . . . . . . . . . . . . . . . . 7,200 184,268Daiho Corp. . . . . . . . . . . . . . . . . . . . . . . . . . . . . . . . . . . . . . . 5,000 141,730Daiichi Jitsugyo Co., Ltd. . . . . . . . . . . . . . . . . . . . . . . . . . . . . . 2,800 96,371Daiichi Kigenso Kagaku-Kogyo Co., Ltd. . . . . . . . . . . . . . . . . . . . 5,000 60,831Daiken Corp. . . . . . . . . . . . . . . . . . . . . . . . . . . . . . . . . . . . . . 4,800 95,640Daiken Medical Co., Ltd. . . . . . . . . . . . . . . . . . . . . . . . . . . . . . 4,400 32,728Daiki Aluminium Industry Co., Ltd. . . . . . . . . . . . . . . . . . . . . . . . 9,000 61,562Daiko Denshi Tsushin, Ltd. . . . . . . . . . . . . . . . . . . . . . . . . . . . . 1,300 9,316
Security Description Shares Value
Japan—(Continued)Daikoku Denki Co., Ltd. . . . . . . . . . . . . . . . . . . . . . . . . . . . . . . 2,700 $ 42,206Daikokutenbussan Co., Ltd. . . . . . . . . . . . . . . . . . . . . . . . . . . . 1,900 74,558Daikyo, Inc. . . . . . . . . . . . . . . . . . . . . . . . . . . . . . . . . . . . . . 11,500 233,999Daikyonishikawa Corp. . . . . . . . . . . . . . . . . . . . . . . . . . . . . . . 5,200 60,088Dainichi Co., Ltd. . . . . . . . . . . . . . . . . . . . . . . . . . . . . . . . . . . 4,100 28,832Dainichiseika Color & Chemicals Manufacturing Co., Ltd. . . . . . . . . 5,000 162,864Daio Paper Corp. . . . . . . . . . . . . . . . . . . . . . . . . . . . . . . . . . . 25,300 361,610Daiseki Co., Ltd. . . . . . . . . . . . . . . . . . . . . . . . . . . . . . . . . . . . 10,700 295,771Daiseki Eco. Solution Co., Ltd. . . . . . . . . . . . . . . . . . . . . . . . . . . 2,400 18,679Daishi Bank, Ltd. (The) (a) (b) (d) . . . . . . . . . . . . . . . . . . . . . . . 11,100 481,632Daishinku Corp. . . . . . . . . . . . . . . . . . . . . . . . . . . . . . . . . . . . 2,600 30,513Daisue Construction Co., Ltd. . . . . . . . . . . . . . . . . . . . . . . . . . . . 2,300 25,458Daisyo Corp. . . . . . . . . . . . . . . . . . . . . . . . . . . . . . . . . . . . . . 3,100 46,630Daito Bank, Ltd. (The) . . . . . . . . . . . . . . . . . . . . . . . . . . . . . . . 5,200 56,392Daito Pharmaceutical Co., Ltd. . . . . . . . . . . . . . . . . . . . . . . . . . . 3,960 122,675Daitron Co., Ltd. . . . . . . . . . . . . . . . . . . . . . . . . . . . . . . . . . . . 800 16,037Daiwa Industries, Ltd. . . . . . . . . . . . . . . . . . . . . . . . . . . . . . . . 11,000 120,265Daiwabo Holdings Co., Ltd. . . . . . . . . . . . . . . . . . . . . . . . . . . . . 6,100 393,503Daiyu Lic Holdings Co., Ltd. . . . . . . . . . . . . . . . . . . . . . . . . . . . 1,300 13,260DCM Holdings Co., Ltd. (e) . . . . . . . . . . . . . . . . . . . . . . . . . . . . 37,900 344,432DD Holdings Co., Ltd. . . . . . . . . . . . . . . . . . . . . . . . . . . . . . . . 600 14,461Dear Life Co., Ltd. . . . . . . . . . . . . . . . . . . . . . . . . . . . . . . . . . 4,700 22,369Denki Kogyo Co., Ltd. . . . . . . . . . . . . . . . . . . . . . . . . . . . . . . . 4,200 123,426Densan System Co., Ltd. . . . . . . . . . . . . . . . . . . . . . . . . . . . . . . 1,000 20,091Denyo Co., Ltd. . . . . . . . . . . . . . . . . . . . . . . . . . . . . . . . . . . . 4,800 78,882Descente, Ltd. . . . . . . . . . . . . . . . . . . . . . . . . . . . . . . . . . . . . 13,700 287,318Dexerials Corp. . . . . . . . . . . . . . . . . . . . . . . . . . . . . . . . . . . . 7,800 79,311Digital Arts, Inc. . . . . . . . . . . . . . . . . . . . . . . . . . . . . . . . . . . . 2,600 122,191Digital Information Technologies Corp. . . . . . . . . . . . . . . . . . . . . 1,300 17,599Dip Corp. . . . . . . . . . . . . . . . . . . . . . . . . . . . . . . . . . . . . . . . 4,800 116,213DKS Co., Ltd. . . . . . . . . . . . . . . . . . . . . . . . . . . . . . . . . . . . . . 3,600 114,566DMG Mori Co., Ltd. (e) . . . . . . . . . . . . . . . . . . . . . . . . . . . . . . 17,000 284,105DMW Corp. . . . . . . . . . . . . . . . . . . . . . . . . . . . . . . . . . . . . . . 700 14,379Doshisha Co., Ltd. . . . . . . . . . . . . . . . . . . . . . . . . . . . . . . . . . . 8,200 170,171Doutor Nichires Holdings Co., Ltd. . . . . . . . . . . . . . . . . . . . . . . . 11,500 213,592Dowa Holdings Co., Ltd. . . . . . . . . . . . . . . . . . . . . . . . . . . . . . . 5,900 186,895Dream Incubator, Inc. . . . . . . . . . . . . . . . . . . . . . . . . . . . . . . . 600 11,662DSB Co., Ltd. . . . . . . . . . . . . . . . . . . . . . . . . . . . . . . . . . . . . . 5,300 27,150DTS Corp. . . . . . . . . . . . . . . . . . . . . . . . . . . . . . . . . . . . . . . . 6,600 262,900Duskin Co., Ltd. . . . . . . . . . . . . . . . . . . . . . . . . . . . . . . . . . . . 13,700 334,287DyDo Group Holdings, Inc. . . . . . . . . . . . . . . . . . . . . . . . . . . . . 2,700 135,210Dynic Corp. . . . . . . . . . . . . . . . . . . . . . . . . . . . . . . . . . . . . . . 3,200 27,487E-Guardian, Inc. (b) . . . . . . . . . . . . . . . . . . . . . . . . . . . . . . . . 1,400 34,904Eagle Industry Co., Ltd. . . . . . . . . . . . . . . . . . . . . . . . . . . . . . . 7,800 101,624Earth Corp. . . . . . . . . . . . . . . . . . . . . . . . . . . . . . . . . . . . . . . 2,700 129,759EAT&Co, Ltd. . . . . . . . . . . . . . . . . . . . . . . . . . . . . . . . . . . . . . 1,400 20,985Ebara Jitsugyo Co., Ltd. . . . . . . . . . . . . . . . . . . . . . . . . . . . . . . 2,500 50,301Eco’s Co., Ltd. . . . . . . . . . . . . . . . . . . . . . . . . . . . . . . . . . . . . 800 12,004EDION Corp. . . . . . . . . . . . . . . . . . . . . . . . . . . . . . . . . . . . . . 28,900 323,124EF-ON, Inc. . . . . . . . . . . . . . . . . . . . . . . . . . . . . . . . . . . . . . . 1,200 13,919eGuarantee, Inc. . . . . . . . . . . . . . . . . . . . . . . . . . . . . . . . . . . 4,800 52,325Ehime Bank, Ltd. (The) . . . . . . . . . . . . . . . . . . . . . . . . . . . . . . 11,400 125,239Eidai Co., Ltd. . . . . . . . . . . . . . . . . . . . . . . . . . . . . . . . . . . . . 10,000 45,589Eighteenth Bank, Ltd. (The) . . . . . . . . . . . . . . . . . . . . . . . . . . . 7,000 238,154Eiken Chemical Co., Ltd. . . . . . . . . . . . . . . . . . . . . . . . . . . . . . . 9,200 213,892Eizo Corp. . . . . . . . . . . . . . . . . . . . . . . . . . . . . . . . . . . . . . . . 6,300 284,990Elan Corp. . . . . . . . . . . . . . . . . . . . . . . . . . . . . . . . . . . . . . . . 600 16,279
BHFTII-77

Brighthouse Funds Trust II
Brighthouse/Dimensional International Small Company Portfolio
Schedule of Investments as of September 30, 2018 (Unaudited)
Common Stocks—(Continued)
Security Description Shares Value
Japan—(Continued)Elecom Co., Ltd. . . . . . . . . . . . . . . . . . . . . . . . . . . . . . . . . . . . 5,100 $ 129,359Elematec Corp. . . . . . . . . . . . . . . . . . . . . . . . . . . . . . . . . . . . . 4,000 94,492EM Systems Co., Ltd. . . . . . . . . . . . . . . . . . . . . . . . . . . . . . . . . 3,600 39,578en-japan, Inc. . . . . . . . . . . . . . . . . . . . . . . . . . . . . . . . . . . . . 2,200 110,361Endo Lighting Corp. . . . . . . . . . . . . . . . . . . . . . . . . . . . . . . . . . 2,600 19,796Eneres Co., Ltd. (b) . . . . . . . . . . . . . . . . . . . . . . . . . . . . . . . . . 3,400 20,826Enigmo, Inc. (b) . . . . . . . . . . . . . . . . . . . . . . . . . . . . . . . . . . . 1,300 21,395Enplas Corp. . . . . . . . . . . . . . . . . . . . . . . . . . . . . . . . . . . . . . 3,400 97,548Enshu, Ltd. (b) . . . . . . . . . . . . . . . . . . . . . . . . . . . . . . . . . . . . 2,300 32,857EPS Holdings, Inc. . . . . . . . . . . . . . . . . . . . . . . . . . . . . . . . . . . 7,900 168,435eRex Co., Ltd. . . . . . . . . . . . . . . . . . . . . . . . . . . . . . . . . . . . . 6,100 56,177ES-Con Japan, Ltd. . . . . . . . . . . . . . . . . . . . . . . . . . . . . . . . . . 4,900 34,441Escrow Agent Japan, Inc. . . . . . . . . . . . . . . . . . . . . . . . . . . . . . 5,100 21,311ESPEC Corp. . . . . . . . . . . . . . . . . . . . . . . . . . . . . . . . . . . . . . . 7,100 135,950Excel Co., Ltd. . . . . . . . . . . . . . . . . . . . . . . . . . . . . . . . . . . . . 2,500 39,209Exedy Corp. . . . . . . . . . . . . . . . . . . . . . . . . . . . . . . . . . . . . . 11,600 384,501F-Tech, Inc. . . . . . . . . . . . . . . . . . . . . . . . . . . . . . . . . . . . . . . 3,600 42,435F@N Communications, Inc. . . . . . . . . . . . . . . . . . . . . . . . . . . . 9,600 58,804Faith, Inc. . . . . . . . . . . . . . . . . . . . . . . . . . . . . . . . . . . . . . . . 2,680 31,156FALCO HOLDINGS Co., Ltd. . . . . . . . . . . . . . . . . . . . . . . . . . . . . 3,100 51,434FCC Co., Ltd. . . . . . . . . . . . . . . . . . . . . . . . . . . . . . . . . . . . . . 12,600 378,791FDK Corp. (b) (e) . . . . . . . . . . . . . . . . . . . . . . . . . . . . . . . . . . 2,500 33,113Feed One Co., Ltd. . . . . . . . . . . . . . . . . . . . . . . . . . . . . . . . . . 41,380 77,225Ferrotec Holdings Corp. . . . . . . . . . . . . . . . . . . . . . . . . . . . . . . 10,400 100,661FFRI, Inc. (b) . . . . . . . . . . . . . . . . . . . . . . . . . . . . . . . . . . . . . 1,000 28,163FIDEA Holdings Co., Ltd. . . . . . . . . . . . . . . . . . . . . . . . . . . . . . . 62,510 94,075Fields Corp. . . . . . . . . . . . . . . . . . . . . . . . . . . . . . . . . . . . . . . 6,000 49,998Financial Products Group Co., Ltd. . . . . . . . . . . . . . . . . . . . . . . . 20,000 191,104FINDEX, Inc. . . . . . . . . . . . . . . . . . . . . . . . . . . . . . . . . . . . . . 3,900 27,013First Brothers Co., Ltd. . . . . . . . . . . . . . . . . . . . . . . . . . . . . . . . 900 11,697First Juken Co., Ltd. . . . . . . . . . . . . . . . . . . . . . . . . . . . . . . . . 3,400 44,082First-corp, Inc. . . . . . . . . . . . . . . . . . . . . . . . . . . . . . . . . . . . . 1,600 16,540Fixstars Corp. (e) . . . . . . . . . . . . . . . . . . . . . . . . . . . . . . . . . . 2,700 37,887Foster Electric Co., Ltd. (e) . . . . . . . . . . . . . . . . . . . . . . . . . . . . 8,800 110,727France Bed Holdings Co., Ltd. . . . . . . . . . . . . . . . . . . . . . . . . . . 9,300 80,131Freebit Co., Ltd. . . . . . . . . . . . . . . . . . . . . . . . . . . . . . . . . . . . 2,100 20,237Freund Corp. . . . . . . . . . . . . . . . . . . . . . . . . . . . . . . . . . . . . . 2,400 19,795Fronteo, Inc. (b) . . . . . . . . . . . . . . . . . . . . . . . . . . . . . . . . . . . 3,100 28,980FTGroup Co., Ltd. . . . . . . . . . . . . . . . . . . . . . . . . . . . . . . . . . . 1,500 23,044Fudo Tetra Corp. . . . . . . . . . . . . . . . . . . . . . . . . . . . . . . . . . . 6,030 111,884Fuji Co., Ltd. . . . . . . . . . . . . . . . . . . . . . . . . . . . . . . . . . . . . . 6,700 131,842Fuji Corp., Ltd. . . . . . . . . . . . . . . . . . . . . . . . . . . . . . . . . . . . . 8,600 67,711Fuji Kyuko Co., Ltd. . . . . . . . . . . . . . . . . . . . . . . . . . . . . . . . . . 6,500 212,519Fuji Machine Manufacturing Co., Ltd. . . . . . . . . . . . . . . . . . . . . . 12,100 193,983Fuji Oil Co., Ltd. . . . . . . . . . . . . . . . . . . . . . . . . . . . . . . . . . . . 21,100 89,343Fuji Pharma Co., Ltd. . . . . . . . . . . . . . . . . . . . . . . . . . . . . . . . . 4,600 72,473Fuji Seal International, Inc. . . . . . . . . . . . . . . . . . . . . . . . . . . . . 7,400 262,135Fuji Soft, Inc. . . . . . . . . . . . . . . . . . . . . . . . . . . . . . . . . . . . . . 7,300 369,202Fujibo Holdings, Inc. . . . . . . . . . . . . . . . . . . . . . . . . . . . . . . . . 3,700 113,830Fujicco Co., Ltd. . . . . . . . . . . . . . . . . . . . . . . . . . . . . . . . . . . . 7,100 146,728Fujikura Kasei Co., Ltd. . . . . . . . . . . . . . . . . . . . . . . . . . . . . . . 9,500 56,353Fujikura Rubber, Ltd. . . . . . . . . . . . . . . . . . . . . . . . . . . . . . . . 5,800 30,123Fujikura, Ltd. . . . . . . . . . . . . . . . . . . . . . . . . . . . . . . . . . . . . . 69,700 329,522Fujimi, Inc. . . . . . . . . . . . . . . . . . . . . . . . . . . . . . . . . . . . . . . 7,000 181,862Fujimori Kogyo Co., Ltd. . . . . . . . . . . . . . . . . . . . . . . . . . . . . . . 4,800 163,694Fujio Food System Co., Ltd. . . . . . . . . . . . . . . . . . . . . . . . . . . . . 600 10,989Fujisash Co., Ltd. . . . . . . . . . . . . . . . . . . . . . . . . . . . . . . . . . . 24,500 22,199
Security Description Shares Value
Japan—(Continued)Fujishoji Co., Ltd. . . . . . . . . . . . . . . . . . . . . . . . . . . . . . . . . . . 1,300 $ 12,751Fujita Kanko, Inc. . . . . . . . . . . . . . . . . . . . . . . . . . . . . . . . . . . 800 24,115Fujitec Co., Ltd. . . . . . . . . . . . . . . . . . . . . . . . . . . . . . . . . . . . 19,500 261,374Fujitsu Frontech, Ltd. . . . . . . . . . . . . . . . . . . . . . . . . . . . . . . . . 4,500 48,753Fujitsu General, Ltd. . . . . . . . . . . . . . . . . . . . . . . . . . . . . . . . . 9,700 162,826Fujiya Co., Ltd. . . . . . . . . . . . . . . . . . . . . . . . . . . . . . . . . . . . . 1,200 27,008FuKoKu Co., Ltd. . . . . . . . . . . . . . . . . . . . . . . . . . . . . . . . . . . . 5,100 44,877Fukuda Corp. . . . . . . . . . . . . . . . . . . . . . . . . . . . . . . . . . . . . . 1,600 79,996Fukui Bank, Ltd. (The) . . . . . . . . . . . . . . . . . . . . . . . . . . . . . . . 9,200 192,297Fukui Computer Holdings, Inc. . . . . . . . . . . . . . . . . . . . . . . . . . . 1,300 25,150Fukushima Bank, Ltd. (The) (b) . . . . . . . . . . . . . . . . . . . . . . . . . 11,200 71,864Fukushima Industries Corp. . . . . . . . . . . . . . . . . . . . . . . . . . . . 4,200 214,419Fukuyama Transporting Co., Ltd. . . . . . . . . . . . . . . . . . . . . . . . . 8,100 350,376FULLCAST Holdings Co., Ltd. . . . . . . . . . . . . . . . . . . . . . . . . . . . 4,300 99,387Fumakilla, Ltd. . . . . . . . . . . . . . . . . . . . . . . . . . . . . . . . . . . . . 2,500 34,769Funai Electric Co., Ltd. (b) (e) . . . . . . . . . . . . . . . . . . . . . . . . . . 7,900 45,749Funai Soken Holdings, Inc. . . . . . . . . . . . . . . . . . . . . . . . . . . . . 10,770 244,408Furukawa Battery Co., Ltd. (The) . . . . . . . . . . . . . . . . . . . . . . . . 5,000 39,258Furukawa Co., Ltd. (e) . . . . . . . . . . . . . . . . . . . . . . . . . . . . . . . 10,500 154,783Furuno Electric Co., Ltd. . . . . . . . . . . . . . . . . . . . . . . . . . . . . . . 10,500 137,603Furusato Industries, Ltd. . . . . . . . . . . . . . . . . . . . . . . . . . . . . . . 3,700 61,718Furuya Metal Co., Ltd. . . . . . . . . . . . . . . . . . . . . . . . . . . . . . . . 400 21,792Fuso Chemical Co., Ltd. . . . . . . . . . . . . . . . . . . . . . . . . . . . . . . 4,000 95,120Fuso Pharmaceutical Industries, Ltd. . . . . . . . . . . . . . . . . . . . . . . 2,600 67,568Futaba Corp. . . . . . . . . . . . . . . . . . . . . . . . . . . . . . . . . . . . . . 10,200 183,606Futaba Industrial Co., Ltd. . . . . . . . . . . . . . . . . . . . . . . . . . . . . 19,600 143,686Future Corp. . . . . . . . . . . . . . . . . . . . . . . . . . . . . . . . . . . . . . 8,400 136,519Fuyo General Lease Co., Ltd. . . . . . . . . . . . . . . . . . . . . . . . . . . . 5,600 340,561G-7 Holdings, Inc. . . . . . . . . . . . . . . . . . . . . . . . . . . . . . . . . . . 500 12,142G-Tekt Corp. . . . . . . . . . . . . . . . . . . . . . . . . . . . . . . . . . . . . . 7,700 127,423Gakken Holdings Co., Ltd. . . . . . . . . . . . . . . . . . . . . . . . . . . . . 1,600 79,848Gakkyusha Co., Ltd. . . . . . . . . . . . . . . . . . . . . . . . . . . . . . . . . 700 11,207Gakujo Co., Ltd. . . . . . . . . . . . . . . . . . . . . . . . . . . . . . . . . . . . 1,700 25,217Gecoss Corp. . . . . . . . . . . . . . . . . . . . . . . . . . . . . . . . . . . . . . 4,600 49,416Genki Sushi Co., Ltd. (e) . . . . . . . . . . . . . . . . . . . . . . . . . . . . . 1,600 91,116Genky DrugStores Co., Ltd. . . . . . . . . . . . . . . . . . . . . . . . . . . . . 2,400 92,489Geo Holdings Corp. . . . . . . . . . . . . . . . . . . . . . . . . . . . . . . . . . 12,300 186,084Giken, Ltd. . . . . . . . . . . . . . . . . . . . . . . . . . . . . . . . . . . . . . . 2,800 74,308GLOBERIDE, Inc. . . . . . . . . . . . . . . . . . . . . . . . . . . . . . . . . . . . 3,500 96,589Glory, Ltd. . . . . . . . . . . . . . . . . . . . . . . . . . . . . . . . . . . . . . . 7,900 193,077GMO Click Holdings, Inc. . . . . . . . . . . . . . . . . . . . . . . . . . . . . . 1,800 13,592GMO Cloud K.K. . . . . . . . . . . . . . . . . . . . . . . . . . . . . . . . . . . . 700 26,356Godo Steel, Ltd. . . . . . . . . . . . . . . . . . . . . . . . . . . . . . . . . . . . 4,100 84,436Goldcrest Co., Ltd. . . . . . . . . . . . . . . . . . . . . . . . . . . . . . . . . . . 7,230 118,254Golf Digest Online, Inc. . . . . . . . . . . . . . . . . . . . . . . . . . . . . . . 900 7,406Grace Technology, Inc. . . . . . . . . . . . . . . . . . . . . . . . . . . . . . . . 900 26,755Grandy House Corp. . . . . . . . . . . . . . . . . . . . . . . . . . . . . . . . . 3,600 15,496Gree, Inc. . . . . . . . . . . . . . . . . . . . . . . . . . . . . . . . . . . . . . . . 26,400 124,146GS Yuasa Corp. (e) . . . . . . . . . . . . . . . . . . . . . . . . . . . . . . . . . 14,000 344,622GSI Creos Corp. . . . . . . . . . . . . . . . . . . . . . . . . . . . . . . . . . . . 2,800 36,830Gumi, Inc. (b) . . . . . . . . . . . . . . . . . . . . . . . . . . . . . . . . . . . . 2,900 16,594Gun-Ei Chemical Industry Co., Ltd. . . . . . . . . . . . . . . . . . . . . . . . 1,800 52,959GungHo Online Entertainment, Inc. . . . . . . . . . . . . . . . . . . . . . . 12,600 25,940Gunosy, Inc. (b) . . . . . . . . . . . . . . . . . . . . . . . . . . . . . . . . . . . 2,000 35,221Gunze, Ltd. . . . . . . . . . . . . . . . . . . . . . . . . . . . . . . . . . . . . . . 6,900 346,675Gurunavi, Inc. . . . . . . . . . . . . . . . . . . . . . . . . . . . . . . . . . . . . 8,500 69,183H-One Co., Ltd. . . . . . . . . . . . . . . . . . . . . . . . . . . . . . . . . . . . 6,000 74,630
BHFTII-78
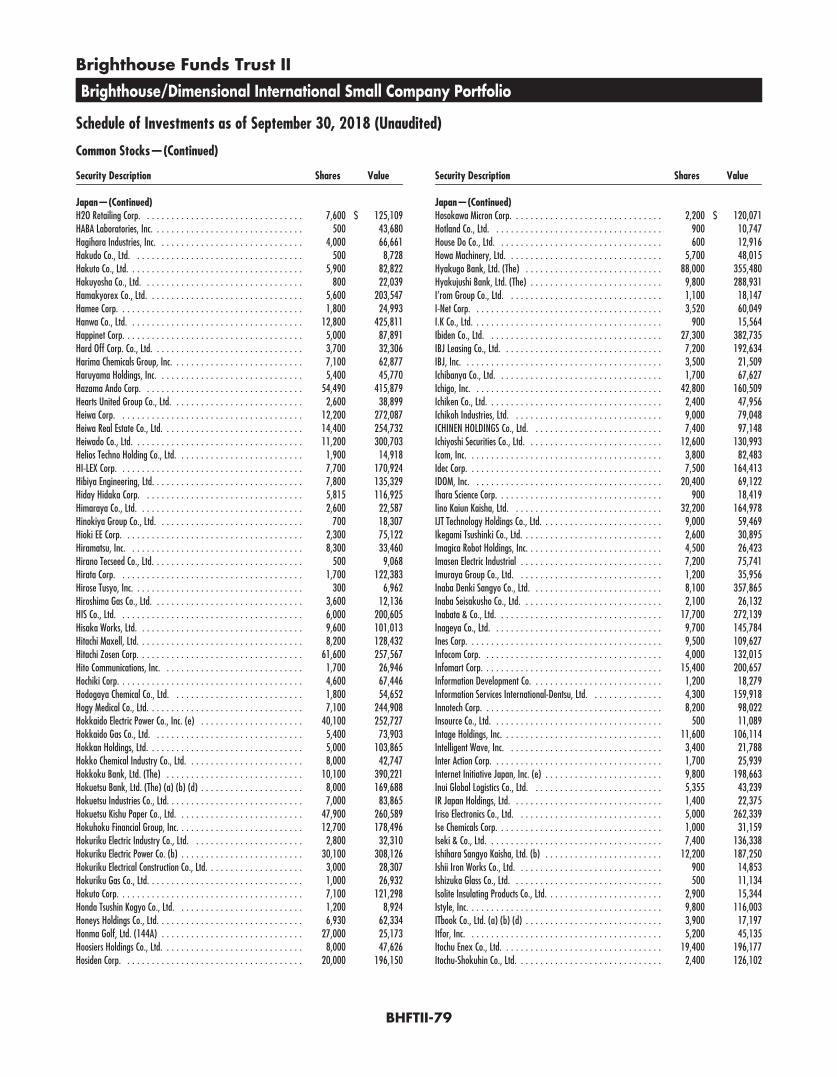
Brighthouse Funds Trust II
Brighthouse/Dimensional International Small Company Portfolio
Schedule of Investments as of September 30, 2018 (Unaudited)
Common Stocks—(Continued)
Security Description Shares Value
Japan—(Continued)H2O Retailing Corp. . . . . . . . . . . . . . . . . . . . . . . . . . . . . . . . . 7,600 $ 125,109HABA Laboratories, Inc. . . . . . . . . . . . . . . . . . . . . . . . . . . . . . . 500 43,680Hagihara Industries, Inc. . . . . . . . . . . . . . . . . . . . . . . . . . . . . . 4,000 66,661Hakudo Co., Ltd. . . . . . . . . . . . . . . . . . . . . . . . . . . . . . . . . . . 500 8,728Hakuto Co., Ltd. . . . . . . . . . . . . . . . . . . . . . . . . . . . . . . . . . . . 5,900 82,822Hakuyosha Co., Ltd. . . . . . . . . . . . . . . . . . . . . . . . . . . . . . . . . 800 22,039Hamakyorex Co., Ltd. . . . . . . . . . . . . . . . . . . . . . . . . . . . . . . . 5,600 203,547Hamee Corp. . . . . . . . . . . . . . . . . . . . . . . . . . . . . . . . . . . . . . 1,800 24,993Hanwa Co., Ltd. . . . . . . . . . . . . . . . . . . . . . . . . . . . . . . . . . . . 12,800 425,811Happinet Corp. . . . . . . . . . . . . . . . . . . . . . . . . . . . . . . . . . . . . 5,000 87,891Hard Off Corp. Co., Ltd. . . . . . . . . . . . . . . . . . . . . . . . . . . . . . . 3,700 32,306Harima Chemicals Group, Inc. . . . . . . . . . . . . . . . . . . . . . . . . . . 7,100 62,877Haruyama Holdings, Inc. . . . . . . . . . . . . . . . . . . . . . . . . . . . . . 5,400 45,770Hazama Ando Corp. . . . . . . . . . . . . . . . . . . . . . . . . . . . . . . . . 54,490 415,879Hearts United Group Co., Ltd. . . . . . . . . . . . . . . . . . . . . . . . . . . 2,600 38,899Heiwa Corp. . . . . . . . . . . . . . . . . . . . . . . . . . . . . . . . . . . . . . 12,200 272,087Heiwa Real Estate Co., Ltd. . . . . . . . . . . . . . . . . . . . . . . . . . . . . 14,400 254,732Heiwado Co., Ltd. . . . . . . . . . . . . . . . . . . . . . . . . . . . . . . . . . . 11,200 300,703Helios Techno Holding Co., Ltd. . . . . . . . . . . . . . . . . . . . . . . . . . 1,900 14,918HI-LEX Corp. . . . . . . . . . . . . . . . . . . . . . . . . . . . . . . . . . . . . . 7,700 170,924Hibiya Engineering, Ltd. . . . . . . . . . . . . . . . . . . . . . . . . . . . . . . 7,800 135,329Hiday Hidaka Corp. . . . . . . . . . . . . . . . . . . . . . . . . . . . . . . . . 5,815 116,925Himaraya Co., Ltd. . . . . . . . . . . . . . . . . . . . . . . . . . . . . . . . . . 2,600 22,587Hinokiya Group Co., Ltd. . . . . . . . . . . . . . . . . . . . . . . . . . . . . . 700 18,307Hioki EE Corp. . . . . . . . . . . . . . . . . . . . . . . . . . . . . . . . . . . . . 2,300 75,122Hiramatsu, Inc. . . . . . . . . . . . . . . . . . . . . . . . . . . . . . . . . . . . 8,300 33,460Hirano Tecseed Co., Ltd. . . . . . . . . . . . . . . . . . . . . . . . . . . . . . . 500 9,068Hirata Corp. . . . . . . . . . . . . . . . . . . . . . . . . . . . . . . . . . . . . . 1,700 122,383Hirose Tusyo, Inc. . . . . . . . . . . . . . . . . . . . . . . . . . . . . . . . . . . 300 6,962Hiroshima Gas Co., Ltd. . . . . . . . . . . . . . . . . . . . . . . . . . . . . . . 3,600 12,136HIS Co., Ltd. . . . . . . . . . . . . . . . . . . . . . . . . . . . . . . . . . . . . . 6,000 200,605Hisaka Works, Ltd. . . . . . . . . . . . . . . . . . . . . . . . . . . . . . . . . . 9,600 101,013Hitachi Maxell, Ltd. . . . . . . . . . . . . . . . . . . . . . . . . . . . . . . . . . 8,200 128,432Hitachi Zosen Corp. . . . . . . . . . . . . . . . . . . . . . . . . . . . . . . . . . 61,600 257,567Hito Communications, Inc. . . . . . . . . . . . . . . . . . . . . . . . . . . . . 1,700 26,946Hochiki Corp. . . . . . . . . . . . . . . . . . . . . . . . . . . . . . . . . . . . . . 4,600 67,446Hodogaya Chemical Co., Ltd. . . . . . . . . . . . . . . . . . . . . . . . . . . 1,800 54,652Hogy Medical Co., Ltd. . . . . . . . . . . . . . . . . . . . . . . . . . . . . . . . 7,100 244,908Hokkaido Electric Power Co., Inc. (e) . . . . . . . . . . . . . . . . . . . . . 40,100 252,727Hokkaido Gas Co., Ltd. . . . . . . . . . . . . . . . . . . . . . . . . . . . . . . 5,400 73,903Hokkan Holdings, Ltd. . . . . . . . . . . . . . . . . . . . . . . . . . . . . . . . 5,000 103,865Hokko Chemical Industry Co., Ltd. . . . . . . . . . . . . . . . . . . . . . . . 8,000 42,747Hokkoku Bank, Ltd. (The) . . . . . . . . . . . . . . . . . . . . . . . . . . . . 10,100 390,221Hokuetsu Bank, Ltd. (The) (a) (b) (d) . . . . . . . . . . . . . . . . . . . . . 8,000 169,688Hokuetsu Industries Co., Ltd. . . . . . . . . . . . . . . . . . . . . . . . . . . . 7,000 83,865Hokuetsu Kishu Paper Co., Ltd. . . . . . . . . . . . . . . . . . . . . . . . . . 47,900 260,589Hokuhoku Financial Group, Inc. . . . . . . . . . . . . . . . . . . . . . . . . . 12,700 178,496Hokuriku Electric Industry Co., Ltd. . . . . . . . . . . . . . . . . . . . . . . 2,800 32,310Hokuriku Electric Power Co. (b) . . . . . . . . . . . . . . . . . . . . . . . . . 30,100 308,126Hokuriku Electrical Construction Co., Ltd. . . . . . . . . . . . . . . . . . . . 3,000 28,307Hokuriku Gas Co., Ltd. . . . . . . . . . . . . . . . . . . . . . . . . . . . . . . . 1,000 26,932Hokuto Corp. . . . . . . . . . . . . . . . . . . . . . . . . . . . . . . . . . . . . . 7,100 121,298Honda Tsushin Kogyo Co., Ltd. . . . . . . . . . . . . . . . . . . . . . . . . . 1,200 8,924Honeys Holdings Co., Ltd. . . . . . . . . . . . . . . . . . . . . . . . . . . . . . 6,930 62,334Honma Golf, Ltd. (144A) . . . . . . . . . . . . . . . . . . . . . . . . . . . . . 27,000 25,173Hoosiers Holdings Co., Ltd. . . . . . . . . . . . . . . . . . . . . . . . . . . . . 8,000 47,626Hosiden Corp. . . . . . . . . . . . . . . . . . . . . . . . . . . . . . . . . . . . . 20,000 196,150
Security Description Shares Value
Japan—(Continued)Hosokawa Micron Corp. . . . . . . . . . . . . . . . . . . . . . . . . . . . . . . 2,200 $ 120,071Hotland Co., Ltd. . . . . . . . . . . . . . . . . . . . . . . . . . . . . . . . . . . 900 10,747House Do Co., Ltd. . . . . . . . . . . . . . . . . . . . . . . . . . . . . . . . . . 600 12,916Howa Machinery, Ltd. . . . . . . . . . . . . . . . . . . . . . . . . . . . . . . . 5,700 48,015Hyakugo Bank, Ltd. (The) . . . . . . . . . . . . . . . . . . . . . . . . . . . . 88,000 355,480Hyakujushi Bank, Ltd. (The) . . . . . . . . . . . . . . . . . . . . . . . . . . . 9,800 288,931I’rom Group Co., Ltd. . . . . . . . . . . . . . . . . . . . . . . . . . . . . . . . 1,100 18,147I-Net Corp. . . . . . . . . . . . . . . . . . . . . . . . . . . . . . . . . . . . . . . 3,520 60,049I.K Co., Ltd. . . . . . . . . . . . . . . . . . . . . . . . . . . . . . . . . . . . . . . 900 15,564Ibiden Co., Ltd. . . . . . . . . . . . . . . . . . . . . . . . . . . . . . . . . . . . 27,300 382,735IBJ Leasing Co., Ltd. . . . . . . . . . . . . . . . . . . . . . . . . . . . . . . . . 7,200 192,634IBJ, Inc. . . . . . . . . . . . . . . . . . . . . . . . . . . . . . . . . . . . . . . . . 3,500 21,509Ichibanya Co., Ltd. . . . . . . . . . . . . . . . . . . . . . . . . . . . . . . . . . 1,700 67,627Ichigo, Inc. . . . . . . . . . . . . . . . . . . . . . . . . . . . . . . . . . . . . . . 42,800 160,509Ichiken Co., Ltd. . . . . . . . . . . . . . . . . . . . . . . . . . . . . . . . . . . . 2,400 47,956Ichikoh Industries, Ltd. . . . . . . . . . . . . . . . . . . . . . . . . . . . . . . 9,000 79,048ICHINEN HOLDINGS Co., Ltd. . . . . . . . . . . . . . . . . . . . . . . . . . . 7,400 97,148Ichiyoshi Securities Co., Ltd. . . . . . . . . . . . . . . . . . . . . . . . . . . . 12,600 130,993Icom, Inc. . . . . . . . . . . . . . . . . . . . . . . . . . . . . . . . . . . . . . . . 3,800 82,483Idec Corp. . . . . . . . . . . . . . . . . . . . . . . . . . . . . . . . . . . . . . . . 7,500 164,413IDOM, Inc. . . . . . . . . . . . . . . . . . . . . . . . . . . . . . . . . . . . . . . 20,400 69,122Ihara Science Corp. . . . . . . . . . . . . . . . . . . . . . . . . . . . . . . . . . 900 18,419Iino Kaiun Kaisha, Ltd. . . . . . . . . . . . . . . . . . . . . . . . . . . . . . . 32,200 164,978IJT Technology Holdings Co., Ltd. . . . . . . . . . . . . . . . . . . . . . . . . 9,000 59,469Ikegami Tsushinki Co., Ltd. . . . . . . . . . . . . . . . . . . . . . . . . . . . . 2,600 30,895Imagica Robot Holdings, Inc. . . . . . . . . . . . . . . . . . . . . . . . . . . . 4,500 26,423Imasen Electric Industrial . . . . . . . . . . . . . . . . . . . . . . . . . . . . . 7,200 75,741Imuraya Group Co., Ltd. . . . . . . . . . . . . . . . . . . . . . . . . . . . . . 1,200 35,956Inaba Denki Sangyo Co., Ltd. . . . . . . . . . . . . . . . . . . . . . . . . . . 8,100 357,865Inaba Seisakusho Co., Ltd. . . . . . . . . . . . . . . . . . . . . . . . . . . . . 2,100 26,132Inabata & Co., Ltd. . . . . . . . . . . . . . . . . . . . . . . . . . . . . . . . . . 17,700 272,139Inageya Co., Ltd. . . . . . . . . . . . . . . . . . . . . . . . . . . . . . . . . . . 9,700 145,784Ines Corp. . . . . . . . . . . . . . . . . . . . . . . . . . . . . . . . . . . . . . . . 9,500 109,627Infocom Corp. . . . . . . . . . . . . . . . . . . . . . . . . . . . . . . . . . . . . 4,000 132,015Infomart Corp. . . . . . . . . . . . . . . . . . . . . . . . . . . . . . . . . . . . . 15,400 200,657Information Development Co. . . . . . . . . . . . . . . . . . . . . . . . . . . 1,200 18,279Information Services International-Dentsu, Ltd. . . . . . . . . . . . . . . 4,300 159,918Innotech Corp. . . . . . . . . . . . . . . . . . . . . . . . . . . . . . . . . . . . . 8,200 98,022Insource Co., Ltd. . . . . . . . . . . . . . . . . . . . . . . . . . . . . . . . . . . 500 11,089Intage Holdings, Inc. . . . . . . . . . . . . . . . . . . . . . . . . . . . . . . . . 11,600 106,114Intelligent Wave, Inc. . . . . . . . . . . . . . . . . . . . . . . . . . . . . . . . 3,400 21,788Inter Action Corp. . . . . . . . . . . . . . . . . . . . . . . . . . . . . . . . . . . 1,700 25,939Internet Initiative Japan, Inc. (e) . . . . . . . . . . . . . . . . . . . . . . . . 9,800 198,663Inui Global Logistics Co., Ltd. . . . . . . . . . . . . . . . . . . . . . . . . . . 5,355 43,239IR Japan Holdings, Ltd. . . . . . . . . . . . . . . . . . . . . . . . . . . . . . . 1,400 22,375Iriso Electronics Co., Ltd. . . . . . . . . . . . . . . . . . . . . . . . . . . . . . 5,000 262,339Ise Chemicals Corp. . . . . . . . . . . . . . . . . . . . . . . . . . . . . . . . . . 1,000 31,159Iseki & Co., Ltd. . . . . . . . . . . . . . . . . . . . . . . . . . . . . . . . . . . . 7,400 136,338Ishihara Sangyo Kaisha, Ltd. (b) . . . . . . . . . . . . . . . . . . . . . . . . 12,200 187,250Ishii Iron Works Co., Ltd. . . . . . . . . . . . . . . . . . . . . . . . . . . . . . 900 14,853Ishizuka Glass Co., Ltd. . . . . . . . . . . . . . . . . . . . . . . . . . . . . . . 500 11,134Isolite Insulating Products Co., Ltd. . . . . . . . . . . . . . . . . . . . . . . . 2,900 15,344Istyle, Inc. . . . . . . . . . . . . . . . . . . . . . . . . . . . . . . . . . . . . . . . 9,800 116,003ITbook Co., Ltd. (a) (b) (d) . . . . . . . . . . . . . . . . . . . . . . . . . . . . 3,900 17,197Itfor, Inc. . . . . . . . . . . . . . . . . . . . . . . . . . . . . . . . . . . . . . . . 5,200 45,135Itochu Enex Co., Ltd. . . . . . . . . . . . . . . . . . . . . . . . . . . . . . . . . 19,400 196,177Itochu-Shokuhin Co., Ltd. . . . . . . . . . . . . . . . . . . . . . . . . . . . . . 2,400 126,102
BHFTII-79

Brighthouse Funds Trust II
Brighthouse/Dimensional International Small Company Portfolio
Schedule of Investments as of September 30, 2018 (Unaudited)
Common Stocks—(Continued)
Security Description Shares Value
Japan—(Continued)Itoki Corp. . . . . . . . . . . . . . . . . . . . . . . . . . . . . . . . . . . . . . . . 15,600 $ 90,535Itokuro, Inc. (b) . . . . . . . . . . . . . . . . . . . . . . . . . . . . . . . . . . . 400 24,288IwaiCosmo Holdings, Inc. . . . . . . . . . . . . . . . . . . . . . . . . . . . . . 7,900 111,680Iwaki & Co., Ltd. . . . . . . . . . . . . . . . . . . . . . . . . . . . . . . . . . . 9,000 47,503Iwasaki Electric Co., Ltd. . . . . . . . . . . . . . . . . . . . . . . . . . . . . . . 2,500 35,693Iwatani Corp. . . . . . . . . . . . . . . . . . . . . . . . . . . . . . . . . . . . . . 11,600 413,041Iwatsuka Confectionery Co., Ltd. . . . . . . . . . . . . . . . . . . . . . . . . 500 21,539J Trust Co., Ltd. . . . . . . . . . . . . . . . . . . . . . . . . . . . . . . . . . . . 3,300 20,039J-Oil Mills, Inc. . . . . . . . . . . . . . . . . . . . . . . . . . . . . . . . . . . . . 4,000 137,119JAC Recruitment Co., Ltd. . . . . . . . . . . . . . . . . . . . . . . . . . . . . . 1,600 36,548Jaccs Co., Ltd. . . . . . . . . . . . . . . . . . . . . . . . . . . . . . . . . . . . . 1,500 31,696Jafco Co., Ltd. . . . . . . . . . . . . . . . . . . . . . . . . . . . . . . . . . . . . 6,400 248,957Jalux, Inc. . . . . . . . . . . . . . . . . . . . . . . . . . . . . . . . . . . . . . . . 2,400 60,214Jamco Corp. . . . . . . . . . . . . . . . . . . . . . . . . . . . . . . . . . . . . . 3,400 96,228Janome Sewing Machine Co., Ltd. . . . . . . . . . . . . . . . . . . . . . . . 7,099 44,055Japan Asia Investment Co., Ltd. (b) . . . . . . . . . . . . . . . . . . . . . . 4,900 13,838Japan Asset Marketing Co., Ltd. (b) . . . . . . . . . . . . . . . . . . . . . . 29,300 32,234Japan Aviation Electronics Industry, Ltd. . . . . . . . . . . . . . . . . . . . 8,000 134,796Japan Best Rescue System Co., Ltd. . . . . . . . . . . . . . . . . . . . . . . 2,900 31,687Japan Display, Inc. (b) (e) . . . . . . . . . . . . . . . . . . . . . . . . . . . . 81,900 90,117Japan Elevator Service Holdings Co., Ltd. . . . . . . . . . . . . . . . . . . . 2,400 35,824Japan Foundation Engineering Co., Ltd. . . . . . . . . . . . . . . . . . . . 10,200 36,477Japan Investment Adviser Co., Ltd. . . . . . . . . . . . . . . . . . . . . . . . 800 30,109Japan Lifeline Co., Ltd. (e) . . . . . . . . . . . . . . . . . . . . . . . . . . . . 10,000 211,617Japan Material Co., Ltd. . . . . . . . . . . . . . . . . . . . . . . . . . . . . . . 5,400 72,404Japan Meat Co., Ltd. . . . . . . . . . . . . . . . . . . . . . . . . . . . . . . . . 700 14,015Japan Medical Dynamic Marketing, Inc. . . . . . . . . . . . . . . . . . . . 3,000 33,064Japan Oil Transportation Co., Ltd. . . . . . . . . . . . . . . . . . . . . . . . 700 18,170Japan Petroleum Exploration Co., Ltd. . . . . . . . . . . . . . . . . . . . . 7,000 160,130Japan Property Management Center Co., Ltd. . . . . . . . . . . . . . . . . 2,000 23,527Japan Pulp & Paper Co., Ltd. . . . . . . . . . . . . . . . . . . . . . . . . . . 3,700 155,193Japan Securities Finance Co., Ltd. . . . . . . . . . . . . . . . . . . . . . . . . 5,400 32,365Japan Steel Works, Ltd. (The) . . . . . . . . . . . . . . . . . . . . . . . . . . 13,000 316,587Japan Transcity Corp. . . . . . . . . . . . . . . . . . . . . . . . . . . . . . . . 12,000 54,560Japan Wool Textile Co., Ltd. (The) . . . . . . . . . . . . . . . . . . . . . . . 19,700 162,976Jastec Co., Ltd. . . . . . . . . . . . . . . . . . . . . . . . . . . . . . . . . . . . . 5,100 54,044JBCC Holdings, Inc. . . . . . . . . . . . . . . . . . . . . . . . . . . . . . . . . . 7,000 90,890JCU Corp. . . . . . . . . . . . . . . . . . . . . . . . . . . . . . . . . . . . . . . . 6,400 153,992Jeol, Ltd. . . . . . . . . . . . . . . . . . . . . . . . . . . . . . . . . . . . . . . . 11,000 238,806JIG-SAW, Inc. (b) . . . . . . . . . . . . . . . . . . . . . . . . . . . . . . . . . . 900 27,359Jimoto Holdings, Inc. . . . . . . . . . . . . . . . . . . . . . . . . . . . . . . . . 67,900 111,170JINS, Inc. . . . . . . . . . . . . . . . . . . . . . . . . . . . . . . . . . . . . . . . 4,200 224,004JK Holdings Co., Ltd. . . . . . . . . . . . . . . . . . . . . . . . . . . . . . . . . 5,600 40,766JMS Co., Ltd. . . . . . . . . . . . . . . . . . . . . . . . . . . . . . . . . . . . . . 7,500 42,846Joban Kosan Co., Ltd. . . . . . . . . . . . . . . . . . . . . . . . . . . . . . . . 1,700 27,201Joshin Denki Co., Ltd. . . . . . . . . . . . . . . . . . . . . . . . . . . . . . . . 7,000 206,373JP-Holdings, Inc. . . . . . . . . . . . . . . . . . . . . . . . . . . . . . . . . . . 17,900 49,141JSP Corp. . . . . . . . . . . . . . . . . . . . . . . . . . . . . . . . . . . . . . . . 5,100 130,130Juki Corp. . . . . . . . . . . . . . . . . . . . . . . . . . . . . . . . . . . . . . . . 11,200 138,938Juroku Bank, Ltd. (The) . . . . . . . . . . . . . . . . . . . . . . . . . . . . . . 12,200 310,407Justsystems Corp. . . . . . . . . . . . . . . . . . . . . . . . . . . . . . . . . . . 9,700 224,710JVC Kenwood Corp. . . . . . . . . . . . . . . . . . . . . . . . . . . . . . . . . . 53,300 149,582K&O Energy Group, Inc. . . . . . . . . . . . . . . . . . . . . . . . . . . . . . . 5,400 84,168kabu.com Securities Co., Ltd. . . . . . . . . . . . . . . . . . . . . . . . . . . 47,800 161,571Kadokawa Dwango (b) . . . . . . . . . . . . . . . . . . . . . . . . . . . . . . 12,508 136,779Kaga Electronics Co., Ltd. . . . . . . . . . . . . . . . . . . . . . . . . . . . . . 7,200 149,430Kakiyasu Honten Co., Ltd. . . . . . . . . . . . . . . . . . . . . . . . . . . . . 3,800 87,780
Security Description Shares Value
Japan—(Continued)Kamakura Shinsho, Ltd. . . . . . . . . . . . . . . . . . . . . . . . . . . . . . . 2,400 $ 31,472Kameda Seika Co., Ltd. . . . . . . . . . . . . . . . . . . . . . . . . . . . . . . 4,100 193,078Kamei Corp. . . . . . . . . . . . . . . . . . . . . . . . . . . . . . . . . . . . . . 8,700 122,735Kanaden Corp. . . . . . . . . . . . . . . . . . . . . . . . . . . . . . . . . . . . . 7,200 78,900Kanagawa Chuo Kotsu Co., Ltd. . . . . . . . . . . . . . . . . . . . . . . . . . 2,400 81,640Kanamoto Co., Ltd. . . . . . . . . . . . . . . . . . . . . . . . . . . . . . . . . . 8,800 312,381Kandenko Co., Ltd. . . . . . . . . . . . . . . . . . . . . . . . . . . . . . . . . . 28,600 295,251Kanematsu Corp. . . . . . . . . . . . . . . . . . . . . . . . . . . . . . . . . . . 29,800 448,469Kanematsu Electronics, Ltd. . . . . . . . . . . . . . . . . . . . . . . . . . . . 3,900 133,000Kanemi Co., Ltd. . . . . . . . . . . . . . . . . . . . . . . . . . . . . . . . . . . . 100 2,671Kansai Mirai Financial Group, Inc. (b) . . . . . . . . . . . . . . . . . . . . . 23,031 215,665Kanto Denka Kogyo Co., Ltd. . . . . . . . . . . . . . . . . . . . . . . . . . . 15,000 161,484Kappa Create Co., Ltd. . . . . . . . . . . . . . . . . . . . . . . . . . . . . . . . 3,400 40,538Kasai Kogyo Co., Ltd. . . . . . . . . . . . . . . . . . . . . . . . . . . . . . . . 8,600 89,938Katakura & Co-op Agri Corp. . . . . . . . . . . . . . . . . . . . . . . . . . . . 1,600 16,604Katakura Industries Co., Ltd. . . . . . . . . . . . . . . . . . . . . . . . . . . . 9,500 117,579Kato Sangyo Co., Ltd. . . . . . . . . . . . . . . . . . . . . . . . . . . . . . . . 7,100 239,237Kato Works Co., Ltd. . . . . . . . . . . . . . . . . . . . . . . . . . . . . . . . . 3,800 117,196Kawada Technologies, Inc. . . . . . . . . . . . . . . . . . . . . . . . . . . . . 1,500 90,925Kawai Musical Instruments Manufacturing Co., Ltd. . . . . . . . . . . . . 2,600 120,556Kawasaki Kinkai Kisen Kaisha, Ltd. . . . . . . . . . . . . . . . . . . . . . . 700 22,111Kawasaki Kisen Kaisha, Ltd. (b) (e) . . . . . . . . . . . . . . . . . . . . . . 12,200 246,630Kawasumi Laboratories, Inc. . . . . . . . . . . . . . . . . . . . . . . . . . . . 4,900 29,628Keihanshin Building Co., Ltd. . . . . . . . . . . . . . . . . . . . . . . . . . . 14,500 110,385Keihin Co., Ltd./Minato-Ku Tokyo Japan . . . . . . . . . . . . . . . . . . . 2,300 33,139Keihin Corp. . . . . . . . . . . . . . . . . . . . . . . . . . . . . . . . . . . . . . 15,600 322,409Keiyo Bank, Ltd. (The) . . . . . . . . . . . . . . . . . . . . . . . . . . . . . . . 44,500 374,488Keiyo Co., Ltd. . . . . . . . . . . . . . . . . . . . . . . . . . . . . . . . . . . . . 14,400 69,713Kenko Mayonnaise Co., Ltd. . . . . . . . . . . . . . . . . . . . . . . . . . . . 3,200 80,152KEY Coffee, Inc. . . . . . . . . . . . . . . . . . . . . . . . . . . . . . . . . . . . 6,700 123,073KFC Holdings Japan, Ltd. . . . . . . . . . . . . . . . . . . . . . . . . . . . . . 4,000 69,973KH Neochem Co., Ltd. . . . . . . . . . . . . . . . . . . . . . . . . . . . . . . . 2,100 81,768Ki-Star Real Estate Co., Ltd. . . . . . . . . . . . . . . . . . . . . . . . . . . . 600 12,591Kimoto Co., Ltd. . . . . . . . . . . . . . . . . . . . . . . . . . . . . . . . . . . . 14,900 39,978Kimura Chemical Plants Co., Ltd. . . . . . . . . . . . . . . . . . . . . . . . . 3,300 13,387King Jim Co., Ltd. . . . . . . . . . . . . . . . . . . . . . . . . . . . . . . . . . . 5,800 51,100Kinki Sharyo Co., Ltd. (The) (b) . . . . . . . . . . . . . . . . . . . . . . . . . 1,200 27,251Kintetsu Department Store Co., Ltd. (b) . . . . . . . . . . . . . . . . . . . . 1,900 65,975Kintetsu World Express, Inc. . . . . . . . . . . . . . . . . . . . . . . . . . . . 10,800 207,088Kirindo Holdings Co., Ltd. . . . . . . . . . . . . . . . . . . . . . . . . . . . . . 800 13,427Kissei Pharmaceutical Co., Ltd. . . . . . . . . . . . . . . . . . . . . . . . . . 8,100 256,759Kita-Nippon Bank, Ltd. (The) . . . . . . . . . . . . . . . . . . . . . . . . . . 2,900 67,435Kitagawa Iron Works Co., Ltd. . . . . . . . . . . . . . . . . . . . . . . . . . . 3,100 82,550Kitano Construction Corp. . . . . . . . . . . . . . . . . . . . . . . . . . . . . . 1,400 50,009Kitanotatsujin Corp. . . . . . . . . . . . . . . . . . . . . . . . . . . . . . . . . 7,600 47,172Kito Corp. . . . . . . . . . . . . . . . . . . . . . . . . . . . . . . . . . . . . . . . 5,900 108,622Kitz Corp. . . . . . . . . . . . . . . . . . . . . . . . . . . . . . . . . . . . . . . . 31,200 269,707Kiyo Bank, Ltd. (The) . . . . . . . . . . . . . . . . . . . . . . . . . . . . . . . 25,000 400,659KLab, Inc. . . . . . . . . . . . . . . . . . . . . . . . . . . . . . . . . . . . . . . . 10,600 104,260KNT-CT Holdings Co., Ltd. (b) . . . . . . . . . . . . . . . . . . . . . . . . . . 3,300 38,140Koa Corp. . . . . . . . . . . . . . . . . . . . . . . . . . . . . . . . . . . . . . . . 10,200 176,002Koatsu Gas Kogyo Co., Ltd. . . . . . . . . . . . . . . . . . . . . . . . . . . . . 11,100 94,419Kobe Bussan Co., Ltd. . . . . . . . . . . . . . . . . . . . . . . . . . . . . . . . 2,400 136,450Kobe Electric Railway Co., Ltd. (b) . . . . . . . . . . . . . . . . . . . . . . . 500 17,692Kobelco Eco-Solutions Co., Ltd. . . . . . . . . . . . . . . . . . . . . . . . . . 1,200 20,415Kohnan Shoji Co., Ltd. . . . . . . . . . . . . . . . . . . . . . . . . . . . . . . . 10,400 262,742Kohsoku Corp. . . . . . . . . . . . . . . . . . . . . . . . . . . . . . . . . . . . . 4,000 47,039
BHFTII-80

Brighthouse Funds Trust II
Brighthouse/Dimensional International Small Company Portfolio
Schedule of Investments as of September 30, 2018 (Unaudited)
Common Stocks—(Continued)
Security Description Shares Value
Japan—(Continued)Koike Sanso Kogyo Co., Ltd. . . . . . . . . . . . . . . . . . . . . . . . . . . . 700 $ 16,439Kojima Co., Ltd. (b) (e) . . . . . . . . . . . . . . . . . . . . . . . . . . . . . . 12,000 55,039Kokusai Co., Ltd. . . . . . . . . . . . . . . . . . . . . . . . . . . . . . . . . . . 3,400 26,398Kokuyo Co., Ltd. . . . . . . . . . . . . . . . . . . . . . . . . . . . . . . . . . . . 26,100 469,788KOMAIHALTEC, Inc. . . . . . . . . . . . . . . . . . . . . . . . . . . . . . . . . . 1,800 38,690Komatsu Seiren Co., Ltd. . . . . . . . . . . . . . . . . . . . . . . . . . . . . . 10,200 95,872Komatsu Wall Industry Co., Ltd. . . . . . . . . . . . . . . . . . . . . . . . . . 2,700 52,524KOMEDA Holdings Co., Ltd. . . . . . . . . . . . . . . . . . . . . . . . . . . . . 6,900 139,545Komeri Co., Ltd. . . . . . . . . . . . . . . . . . . . . . . . . . . . . . . . . . . . 12,300 287,408Komori Corp. . . . . . . . . . . . . . . . . . . . . . . . . . . . . . . . . . . . . . 18,900 235,532Konaka Co., Ltd. . . . . . . . . . . . . . . . . . . . . . . . . . . . . . . . . . . . 7,300 32,769Kondotec, Inc. . . . . . . . . . . . . . . . . . . . . . . . . . . . . . . . . . . . . 7,900 79,916Konishi Co., Ltd. . . . . . . . . . . . . . . . . . . . . . . . . . . . . . . . . . . . 9,900 155,983Konoike Transport Co., Ltd. . . . . . . . . . . . . . . . . . . . . . . . . . . . 3,200 54,653Kosaido Co., Ltd. . . . . . . . . . . . . . . . . . . . . . . . . . . . . . . . . . . 3,700 17,196Koshidaka Holdings Co., Ltd. . . . . . . . . . . . . . . . . . . . . . . . . . . . 10,000 114,711Kotobuki Spirits Co., Ltd. . . . . . . . . . . . . . . . . . . . . . . . . . . . . . 6,000 282,503Kourakuen Holdings Corp. . . . . . . . . . . . . . . . . . . . . . . . . . . . . 2,900 42,677Kozo Keikaku Engineering, Inc. . . . . . . . . . . . . . . . . . . . . . . . . . 700 14,571Krosaki Harima Corp. . . . . . . . . . . . . . . . . . . . . . . . . . . . . . . . 1,900 146,512KRS Corp. . . . . . . . . . . . . . . . . . . . . . . . . . . . . . . . . . . . . . . . 2,200 56,480KU Holdings Co., Ltd. . . . . . . . . . . . . . . . . . . . . . . . . . . . . . . . 8,000 68,235Kumagai Gumi Co., Ltd. . . . . . . . . . . . . . . . . . . . . . . . . . . . . . . 9,100 251,876Kumiai Chemical Industry Co., Ltd. . . . . . . . . . . . . . . . . . . . . . . . 21,195 159,025Kura Corp. . . . . . . . . . . . . . . . . . . . . . . . . . . . . . . . . . . . . . . 3,300 214,339Kurabo Industries, Ltd. . . . . . . . . . . . . . . . . . . . . . . . . . . . . . . 7,600 206,374Kureha Corp. . . . . . . . . . . . . . . . . . . . . . . . . . . . . . . . . . . . . . 5,200 389,454Kurimoto, Ltd. . . . . . . . . . . . . . . . . . . . . . . . . . . . . . . . . . . . . 3,500 57,671Kusuri No. Aoki Holdings Co., Ltd. . . . . . . . . . . . . . . . . . . . . . . . 2,600 207,146KYB Corp. . . . . . . . . . . . . . . . . . . . . . . . . . . . . . . . . . . . . . . . 7,400 331,583Kyodo Printing Co., Ltd. . . . . . . . . . . . . . . . . . . . . . . . . . . . . . . 3,000 78,231Kyoei Steel, Ltd. . . . . . . . . . . . . . . . . . . . . . . . . . . . . . . . . . . . 6,100 119,001Kyokuto Boeki Kaisha, Ltd. . . . . . . . . . . . . . . . . . . . . . . . . . . . . 1,800 34,233Kyokuto Kaihatsu Kogyo Co., Ltd. . . . . . . . . . . . . . . . . . . . . . . . 11,400 180,595Kyokuto Securities Co., Ltd. . . . . . . . . . . . . . . . . . . . . . . . . . . . 7,600 96,667Kyokuyo Co., Ltd. . . . . . . . . . . . . . . . . . . . . . . . . . . . . . . . . . . 3,500 104,748KYORIN Holdings, Inc. . . . . . . . . . . . . . . . . . . . . . . . . . . . . . . . 15,500 319,895Kyoritsu Maintenance Co., Ltd. . . . . . . . . . . . . . . . . . . . . . . . . . 5,918 250,345Kyoritsu Printing Co., Ltd. . . . . . . . . . . . . . . . . . . . . . . . . . . . . . 6,800 20,408Kyosan Electric Manufacturing Co., Ltd. . . . . . . . . . . . . . . . . . . . . 16,000 85,084Kyowa Electronic Instruments Co., Ltd. . . . . . . . . . . . . . . . . . . . . 8,000 31,407Kyowa Leather Cloth Co., Ltd. . . . . . . . . . . . . . . . . . . . . . . . . . . 3,300 29,569Kyushu Financial Group, Inc. . . . . . . . . . . . . . . . . . . . . . . . . . . . 4,000 19,015LAC Co., Ltd. . . . . . . . . . . . . . . . . . . . . . . . . . . . . . . . . . . . . . 5,900 113,481Lasertec Corp. . . . . . . . . . . . . . . . . . . . . . . . . . . . . . . . . . . . . 12,200 406,004LEC, Inc. . . . . . . . . . . . . . . . . . . . . . . . . . . . . . . . . . . . . . . . . 8,800 228,312Leopalace21 Corp. . . . . . . . . . . . . . . . . . . . . . . . . . . . . . . . . . 82,400 459,177Life Corp. . . . . . . . . . . . . . . . . . . . . . . . . . . . . . . . . . . . . . . . 4,400 112,654LIFULL Co., Ltd. (e) . . . . . . . . . . . . . . . . . . . . . . . . . . . . . . . . . 17,000 94,280Like Co., Ltd. . . . . . . . . . . . . . . . . . . . . . . . . . . . . . . . . . . . . . 2,100 33,018Linical Co., Ltd. . . . . . . . . . . . . . . . . . . . . . . . . . . . . . . . . . . . 1,700 27,342Link And Motivation, Inc. . . . . . . . . . . . . . . . . . . . . . . . . . . . . . 8,900 110,759Lintec Corp. . . . . . . . . . . . . . . . . . . . . . . . . . . . . . . . . . . . . . . 13,700 350,865Litalico, Inc. (b) . . . . . . . . . . . . . . . . . . . . . . . . . . . . . . . . . . . 900 21,130Look Holdings, Inc. . . . . . . . . . . . . . . . . . . . . . . . . . . . . . . . . . 2,200 25,635Luckland Co., Ltd. . . . . . . . . . . . . . . . . . . . . . . . . . . . . . . . . . . 500 12,762M&A Capital Partners Co., Ltd. (b) . . . . . . . . . . . . . . . . . . . . . . . 1,200 72,552
Security Description Shares Value
Japan—(Continued)m-up, Inc. . . . . . . . . . . . . . . . . . . . . . . . . . . . . . . . . . . . . . . . 700 $ 18,201Macnica Fuji Electronics Holdings, Inc. (e) . . . . . . . . . . . . . . . . . . 14,550 257,055Maeda Corp. . . . . . . . . . . . . . . . . . . . . . . . . . . . . . . . . . . . . . 37,300 492,508Maeda Kosen Co., Ltd. . . . . . . . . . . . . . . . . . . . . . . . . . . . . . . . 5,700 121,430Maeda Road Construction Co., Ltd. . . . . . . . . . . . . . . . . . . . . . . . 21,000 427,111Maezawa Kasei Industries Co., Ltd. . . . . . . . . . . . . . . . . . . . . . . . 5,700 61,811Maezawa Kyuso Industries Co., Ltd. . . . . . . . . . . . . . . . . . . . . . . 3,900 68,369Makino Milling Machine Co., Ltd. . . . . . . . . . . . . . . . . . . . . . . . . 8,000 341,641Mamezou Holdings Co., Ltd. . . . . . . . . . . . . . . . . . . . . . . . . . . . 2,200 18,636Mamiya-Op Co., Ltd. . . . . . . . . . . . . . . . . . . . . . . . . . . . . . . . . 1,900 16,790Mandom Corp. . . . . . . . . . . . . . . . . . . . . . . . . . . . . . . . . . . . . 8,000 254,167Mani, Inc. . . . . . . . . . . . . . . . . . . . . . . . . . . . . . . . . . . . . . . . 5,700 277,913MarkLines Co., Ltd. . . . . . . . . . . . . . . . . . . . . . . . . . . . . . . . . . 1,600 27,838Mars Engineering Corp. . . . . . . . . . . . . . . . . . . . . . . . . . . . . . . 3,600 76,163Marubun Corp. . . . . . . . . . . . . . . . . . . . . . . . . . . . . . . . . . . . . 8,200 59,768Marudai Food Co., Ltd. . . . . . . . . . . . . . . . . . . . . . . . . . . . . . . 7,600 147,442Marufuji Sheet Piling Co., Ltd. . . . . . . . . . . . . . . . . . . . . . . . . . . 1,300 30,030Maruha Nichiro Corp. . . . . . . . . . . . . . . . . . . . . . . . . . . . . . . . 12,000 442,426Maruka Machinery Co., Ltd. . . . . . . . . . . . . . . . . . . . . . . . . . . . 900 17,070Marumae Co., Ltd. . . . . . . . . . . . . . . . . . . . . . . . . . . . . . . . . . 1,000 9,584Marusan Securities Co., Ltd. . . . . . . . . . . . . . . . . . . . . . . . . . . . 8,700 74,050Maruwa Co., Ltd. . . . . . . . . . . . . . . . . . . . . . . . . . . . . . . . . . . 3,700 246,933Maruwa Unyu Kikan Co., Ltd. . . . . . . . . . . . . . . . . . . . . . . . . . . 1,100 41,112Maruyama Manufacturing Co., Inc. . . . . . . . . . . . . . . . . . . . . . . 1,500 24,205Maruzen CHI Holdings Co., Ltd. (b) . . . . . . . . . . . . . . . . . . . . . . 11,900 39,624Maruzen Showa Unyu Co., Ltd. . . . . . . . . . . . . . . . . . . . . . . . . . 4,600 118,455Marvelous, Inc. . . . . . . . . . . . . . . . . . . . . . . . . . . . . . . . . . . . 9,500 77,748Matching Service Japan Co., Ltd. . . . . . . . . . . . . . . . . . . . . . . . . 1,200 25,158Matsuda Sangyo Co., Ltd. . . . . . . . . . . . . . . . . . . . . . . . . . . . . . 5,900 82,679Matsui Construction Co., Ltd. . . . . . . . . . . . . . . . . . . . . . . . . . . . 7,800 63,498Matsuya Foods Co., Ltd. . . . . . . . . . . . . . . . . . . . . . . . . . . . . . . 2,500 79,754Max Co., Ltd. . . . . . . . . . . . . . . . . . . . . . . . . . . . . . . . . . . . . . 11,000 164,285Maxvalu Nishinihon Co., Ltd. . . . . . . . . . . . . . . . . . . . . . . . . . . 2,400 39,344Maxvalu Tokai Co., Ltd. . . . . . . . . . . . . . . . . . . . . . . . . . . . . . . 3,500 77,807MCJ Co., Ltd. . . . . . . . . . . . . . . . . . . . . . . . . . . . . . . . . . . . . . 14,000 123,337MEC Co., Ltd. . . . . . . . . . . . . . . . . . . . . . . . . . . . . . . . . . . . . . 5,800 98,362Media Do Holdings Co., Ltd. . . . . . . . . . . . . . . . . . . . . . . . . . . . 1,000 23,469Medical Data Vision Co., Ltd. (b) (e) . . . . . . . . . . . . . . . . . . . . . . 3,800 63,845Medical System Network Co., Ltd. . . . . . . . . . . . . . . . . . . . . . . . 5,300 22,007Megachips Corp. (e) . . . . . . . . . . . . . . . . . . . . . . . . . . . . . . . . 2,500 52,585Megmilk Snow Brand Co., Ltd. . . . . . . . . . . . . . . . . . . . . . . . . . . 8,000 205,450Meidensha Corp. . . . . . . . . . . . . . . . . . . . . . . . . . . . . . . . . . . 11,600 189,888Meiji Shipping Co., Ltd. . . . . . . . . . . . . . . . . . . . . . . . . . . . . . . 8,500 31,423Meiko Electronics Co., Ltd. . . . . . . . . . . . . . . . . . . . . . . . . . . . . 7,500 206,507Meiko Network Japan Co., Ltd. . . . . . . . . . . . . . . . . . . . . . . . . . 7,200 66,780Meisei Industrial Co., Ltd. . . . . . . . . . . . . . . . . . . . . . . . . . . . . . 13,500 107,421Meitec Corp. . . . . . . . . . . . . . . . . . . . . . . . . . . . . . . . . . . . . . 7,700 370,687Meito Sangyo Co., Ltd. . . . . . . . . . . . . . . . . . . . . . . . . . . . . . . . 3,000 44,833Meiwa Corp. . . . . . . . . . . . . . . . . . . . . . . . . . . . . . . . . . . . . . 8,100 35,792Meiwa Estate Co., Ltd. . . . . . . . . . . . . . . . . . . . . . . . . . . . . . . . 5,200 29,797Menicon Co., Ltd. . . . . . . . . . . . . . . . . . . . . . . . . . . . . . . . . . . 2,700 65,858Mercuria Investment Co., Ltd. . . . . . . . . . . . . . . . . . . . . . . . . . . 2,100 18,203METAWATER Co., Ltd. . . . . . . . . . . . . . . . . . . . . . . . . . . . . . . . 600 17,243Michinoku Bank, Ltd. (The) . . . . . . . . . . . . . . . . . . . . . . . . . . . 5,700 89,956Micronics Japan Co., Ltd. . . . . . . . . . . . . . . . . . . . . . . . . . . . . . 1,400 9,835Mikuni Corp. . . . . . . . . . . . . . . . . . . . . . . . . . . . . . . . . . . . . . 3,000 20,058Milbon Co., Ltd. . . . . . . . . . . . . . . . . . . . . . . . . . . . . . . . . . . . 7,320 335,701
BHFTII-81
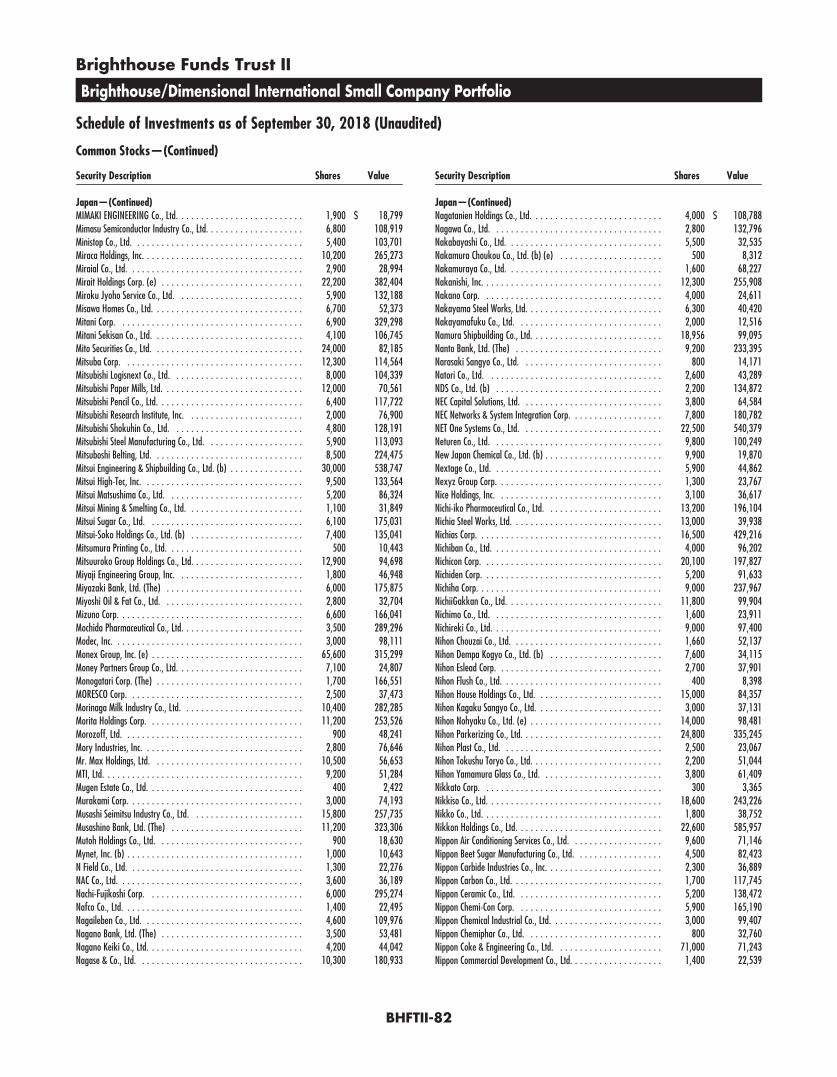
Brighthouse Funds Trust II
Brighthouse/Dimensional International Small Company Portfolio
Schedule of Investments as of September 30, 2018 (Unaudited)
Common Stocks—(Continued)
Security Description Shares Value
Japan—(Continued)MIMAKI ENGINEERING Co., Ltd. . . . . . . . . . . . . . . . . . . . . . . . . . 1,900 $ 18,799Mimasu Semiconductor Industry Co., Ltd. . . . . . . . . . . . . . . . . . . . 6,800 108,919Ministop Co., Ltd. . . . . . . . . . . . . . . . . . . . . . . . . . . . . . . . . . . 5,400 103,701Miraca Holdings, Inc. . . . . . . . . . . . . . . . . . . . . . . . . . . . . . . . . 10,200 265,273Miraial Co., Ltd. . . . . . . . . . . . . . . . . . . . . . . . . . . . . . . . . . . . 2,900 28,994Mirait Holdings Corp. (e) . . . . . . . . . . . . . . . . . . . . . . . . . . . . . 22,200 382,404Miroku Jyoho Service Co., Ltd. . . . . . . . . . . . . . . . . . . . . . . . . . 5,900 132,188Misawa Homes Co., Ltd. . . . . . . . . . . . . . . . . . . . . . . . . . . . . . . 6,700 52,373Mitani Corp. . . . . . . . . . . . . . . . . . . . . . . . . . . . . . . . . . . . . . 6,900 329,298Mitani Sekisan Co., Ltd. . . . . . . . . . . . . . . . . . . . . . . . . . . . . . . 4,100 106,745Mito Securities Co., Ltd. . . . . . . . . . . . . . . . . . . . . . . . . . . . . . . 24,000 82,185Mitsuba Corp. . . . . . . . . . . . . . . . . . . . . . . . . . . . . . . . . . . . . 12,300 114,564Mitsubishi Logisnext Co., Ltd. . . . . . . . . . . . . . . . . . . . . . . . . . . 8,000 104,339Mitsubishi Paper Mills, Ltd. . . . . . . . . . . . . . . . . . . . . . . . . . . . . 12,000 70,561Mitsubishi Pencil Co., Ltd. . . . . . . . . . . . . . . . . . . . . . . . . . . . . . 6,400 117,722Mitsubishi Research Institute, Inc. . . . . . . . . . . . . . . . . . . . . . . . 2,000 76,900Mitsubishi Shokuhin Co., Ltd. . . . . . . . . . . . . . . . . . . . . . . . . . . 4,800 128,191Mitsubishi Steel Manufacturing Co., Ltd. . . . . . . . . . . . . . . . . . . . 5,900 113,093Mitsuboshi Belting, Ltd. . . . . . . . . . . . . . . . . . . . . . . . . . . . . . . 8,500 224,475Mitsui Engineering & Shipbuilding Co., Ltd. (b) . . . . . . . . . . . . . . . 30,000 538,747Mitsui High-Tec, Inc. . . . . . . . . . . . . . . . . . . . . . . . . . . . . . . . . 9,500 133,564Mitsui Matsushima Co., Ltd. . . . . . . . . . . . . . . . . . . . . . . . . . . . 5,200 86,324Mitsui Mining & Smelting Co., Ltd. . . . . . . . . . . . . . . . . . . . . . . . 1,100 31,849Mitsui Sugar Co., Ltd. . . . . . . . . . . . . . . . . . . . . . . . . . . . . . . . 6,100 175,031Mitsui-Soko Holdings Co., Ltd. (b) . . . . . . . . . . . . . . . . . . . . . . . 7,400 135,041Mitsumura Printing Co., Ltd. . . . . . . . . . . . . . . . . . . . . . . . . . . . 500 10,443Mitsuuroko Group Holdings Co., Ltd. . . . . . . . . . . . . . . . . . . . . . . 12,900 94,698Miyaji Engineering Group, Inc. . . . . . . . . . . . . . . . . . . . . . . . . . 1,800 46,948Miyazaki Bank, Ltd. (The) . . . . . . . . . . . . . . . . . . . . . . . . . . . . 6,000 175,875Miyoshi Oil & Fat Co., Ltd. . . . . . . . . . . . . . . . . . . . . . . . . . . . . 2,800 32,704Mizuno Corp. . . . . . . . . . . . . . . . . . . . . . . . . . . . . . . . . . . . . . 6,600 166,041Mochida Pharmaceutical Co., Ltd. . . . . . . . . . . . . . . . . . . . . . . . . 3,500 289,296Modec, Inc. . . . . . . . . . . . . . . . . . . . . . . . . . . . . . . . . . . . . . . 3,000 98,111Monex Group, Inc. (e) . . . . . . . . . . . . . . . . . . . . . . . . . . . . . . . 65,600 315,299Money Partners Group Co., Ltd. . . . . . . . . . . . . . . . . . . . . . . . . . 7,100 24,807Monogatari Corp. (The) . . . . . . . . . . . . . . . . . . . . . . . . . . . . . . 1,700 166,551MORESCO Corp. . . . . . . . . . . . . . . . . . . . . . . . . . . . . . . . . . . . 2,500 37,473Morinaga Milk Industry Co., Ltd. . . . . . . . . . . . . . . . . . . . . . . . . 10,400 282,285Morita Holdings Corp. . . . . . . . . . . . . . . . . . . . . . . . . . . . . . . . 11,200 253,526Morozoff, Ltd. . . . . . . . . . . . . . . . . . . . . . . . . . . . . . . . . . . . . 900 48,241Mory Industries, Inc. . . . . . . . . . . . . . . . . . . . . . . . . . . . . . . . . 2,800 76,646Mr. Max Holdings, Ltd. . . . . . . . . . . . . . . . . . . . . . . . . . . . . . . 10,500 56,653MTI, Ltd. . . . . . . . . . . . . . . . . . . . . . . . . . . . . . . . . . . . . . . . . 9,200 51,284Mugen Estate Co., Ltd. . . . . . . . . . . . . . . . . . . . . . . . . . . . . . . . 400 2,422Murakami Corp. . . . . . . . . . . . . . . . . . . . . . . . . . . . . . . . . . . . 3,000 74,193Musashi Seimitsu Industry Co., Ltd. . . . . . . . . . . . . . . . . . . . . . . 15,800 257,735Musashino Bank, Ltd. (The) . . . . . . . . . . . . . . . . . . . . . . . . . . . 11,200 323,306Mutoh Holdings Co., Ltd. . . . . . . . . . . . . . . . . . . . . . . . . . . . . . 900 18,630Mynet, Inc. (b) . . . . . . . . . . . . . . . . . . . . . . . . . . . . . . . . . . . . 1,000 10,643N Field Co., Ltd. . . . . . . . . . . . . . . . . . . . . . . . . . . . . . . . . . . . 1,300 22,276NAC Co., Ltd. . . . . . . . . . . . . . . . . . . . . . . . . . . . . . . . . . . . . . 3,600 36,189Nachi-Fujikoshi Corp. . . . . . . . . . . . . . . . . . . . . . . . . . . . . . . . 6,000 295,274Nafco Co., Ltd. . . . . . . . . . . . . . . . . . . . . . . . . . . . . . . . . . . . . 1,400 22,495Nagaileben Co., Ltd. . . . . . . . . . . . . . . . . . . . . . . . . . . . . . . . . 4,600 109,976Nagano Bank, Ltd. (The) . . . . . . . . . . . . . . . . . . . . . . . . . . . . . 3,500 53,481Nagano Keiki Co., Ltd. . . . . . . . . . . . . . . . . . . . . . . . . . . . . . . . 4,200 44,042Nagase & Co., Ltd. . . . . . . . . . . . . . . . . . . . . . . . . . . . . . . . . . 10,300 180,933
Security Description Shares Value
Japan—(Continued)Nagatanien Holdings Co., Ltd. . . . . . . . . . . . . . . . . . . . . . . . . . . 4,000 $ 108,788Nagawa Co., Ltd. . . . . . . . . . . . . . . . . . . . . . . . . . . . . . . . . . . 2,800 132,796Nakabayashi Co., Ltd. . . . . . . . . . . . . . . . . . . . . . . . . . . . . . . . 5,500 32,535Nakamura Choukou Co., Ltd. (b) (e) . . . . . . . . . . . . . . . . . . . . . 500 8,312Nakamuraya Co., Ltd. . . . . . . . . . . . . . . . . . . . . . . . . . . . . . . . 1,600 68,227Nakanishi, Inc. . . . . . . . . . . . . . . . . . . . . . . . . . . . . . . . . . . . . 12,300 255,908Nakano Corp. . . . . . . . . . . . . . . . . . . . . . . . . . . . . . . . . . . . . 4,000 24,611Nakayama Steel Works, Ltd. . . . . . . . . . . . . . . . . . . . . . . . . . . . 6,300 40,420Nakayamafuku Co., Ltd. . . . . . . . . . . . . . . . . . . . . . . . . . . . . . 2,000 12,516Namura Shipbuilding Co., Ltd. . . . . . . . . . . . . . . . . . . . . . . . . . . 18,956 99,095Nanto Bank, Ltd. (The) . . . . . . . . . . . . . . . . . . . . . . . . . . . . . . 9,200 233,395Narasaki Sangyo Co., Ltd. . . . . . . . . . . . . . . . . . . . . . . . . . . . . 800 14,171Natori Co., Ltd. . . . . . . . . . . . . . . . . . . . . . . . . . . . . . . . . . . . 2,600 43,289NDS Co., Ltd. (b) . . . . . . . . . . . . . . . . . . . . . . . . . . . . . . . . . . 2,200 134,872NEC Capital Solutions, Ltd. . . . . . . . . . . . . . . . . . . . . . . . . . . . . 3,800 64,584NEC Networks & System Integration Corp. . . . . . . . . . . . . . . . . . . 7,800 180,782NET One Systems Co., Ltd. . . . . . . . . . . . . . . . . . . . . . . . . . . . . 22,500 540,379Neturen Co., Ltd. . . . . . . . . . . . . . . . . . . . . . . . . . . . . . . . . . . 9,800 100,249New Japan Chemical Co., Ltd. (b) . . . . . . . . . . . . . . . . . . . . . . . . 9,900 19,870Nextage Co., Ltd. . . . . . . . . . . . . . . . . . . . . . . . . . . . . . . . . . . 5,900 44,862Nexyz Group Corp. . . . . . . . . . . . . . . . . . . . . . . . . . . . . . . . . . 1,300 23,767Nice Holdings, Inc. . . . . . . . . . . . . . . . . . . . . . . . . . . . . . . . . . 3,100 36,617Nichi-iko Pharmaceutical Co., Ltd. . . . . . . . . . . . . . . . . . . . . . . . 13,200 196,104Nichia Steel Works, Ltd. . . . . . . . . . . . . . . . . . . . . . . . . . . . . . . 13,000 39,938Nichias Corp. . . . . . . . . . . . . . . . . . . . . . . . . . . . . . . . . . . . . . 16,500 429,216Nichiban Co., Ltd. . . . . . . . . . . . . . . . . . . . . . . . . . . . . . . . . . . 4,000 96,202Nichicon Corp. . . . . . . . . . . . . . . . . . . . . . . . . . . . . . . . . . . . . 20,100 197,827Nichiden Corp. . . . . . . . . . . . . . . . . . . . . . . . . . . . . . . . . . . . . 5,200 91,633Nichiha Corp. . . . . . . . . . . . . . . . . . . . . . . . . . . . . . . . . . . . . . 9,000 237,967NichiiGakkan Co., Ltd. . . . . . . . . . . . . . . . . . . . . . . . . . . . . . . . 11,800 99,904Nichimo Co., Ltd. . . . . . . . . . . . . . . . . . . . . . . . . . . . . . . . . . . 1,600 23,911Nichireki Co., Ltd. . . . . . . . . . . . . . . . . . . . . . . . . . . . . . . . . . . 9,000 97,400Nihon Chouzai Co., Ltd. . . . . . . . . . . . . . . . . . . . . . . . . . . . . . . 1,660 52,137Nihon Dempa Kogyo Co., Ltd. (b) . . . . . . . . . . . . . . . . . . . . . . . 7,600 34,115Nihon Eslead Corp. . . . . . . . . . . . . . . . . . . . . . . . . . . . . . . . . . 2,700 37,901Nihon Flush Co., Ltd. . . . . . . . . . . . . . . . . . . . . . . . . . . . . . . . . 400 8,398Nihon House Holdings Co., Ltd. . . . . . . . . . . . . . . . . . . . . . . . . . 15,000 84,357Nihon Kagaku Sangyo Co., Ltd. . . . . . . . . . . . . . . . . . . . . . . . . . 3,000 37,131Nihon Nohyaku Co., Ltd. (e) . . . . . . . . . . . . . . . . . . . . . . . . . . . 14,000 98,481Nihon Parkerizing Co., Ltd. . . . . . . . . . . . . . . . . . . . . . . . . . . . . 24,800 335,245Nihon Plast Co., Ltd. . . . . . . . . . . . . . . . . . . . . . . . . . . . . . . . . 2,500 23,067Nihon Tokushu Toryo Co., Ltd. . . . . . . . . . . . . . . . . . . . . . . . . . . 2,200 51,044Nihon Yamamura Glass Co., Ltd. . . . . . . . . . . . . . . . . . . . . . . . . 3,800 61,409Nikkato Corp. . . . . . . . . . . . . . . . . . . . . . . . . . . . . . . . . . . . . 300 3,365Nikkiso Co., Ltd. . . . . . . . . . . . . . . . . . . . . . . . . . . . . . . . . . . . 18,600 243,226Nikko Co., Ltd. . . . . . . . . . . . . . . . . . . . . . . . . . . . . . . . . . . . . 1,800 38,752Nikkon Holdings Co., Ltd. . . . . . . . . . . . . . . . . . . . . . . . . . . . . . 22,600 585,957Nippon Air Conditioning Services Co., Ltd. . . . . . . . . . . . . . . . . . . 9,600 71,146Nippon Beet Sugar Manufacturing Co., Ltd. . . . . . . . . . . . . . . . . . 4,500 82,423Nippon Carbide Industries Co., Inc. . . . . . . . . . . . . . . . . . . . . . . . 2,300 36,889Nippon Carbon Co., Ltd. . . . . . . . . . . . . . . . . . . . . . . . . . . . . . . 1,700 117,745Nippon Ceramic Co., Ltd. . . . . . . . . . . . . . . . . . . . . . . . . . . . . . 5,200 138,472Nippon Chemi-Con Corp. . . . . . . . . . . . . . . . . . . . . . . . . . . . . . 5,900 165,190Nippon Chemical Industrial Co., Ltd. . . . . . . . . . . . . . . . . . . . . . . 3,000 99,407Nippon Chemiphar Co., Ltd. . . . . . . . . . . . . . . . . . . . . . . . . . . . 800 32,760Nippon Coke & Engineering Co., Ltd. . . . . . . . . . . . . . . . . . . . . . 71,000 71,243Nippon Commercial Development Co., Ltd. . . . . . . . . . . . . . . . . . . 1,400 22,539
BHFTII-82
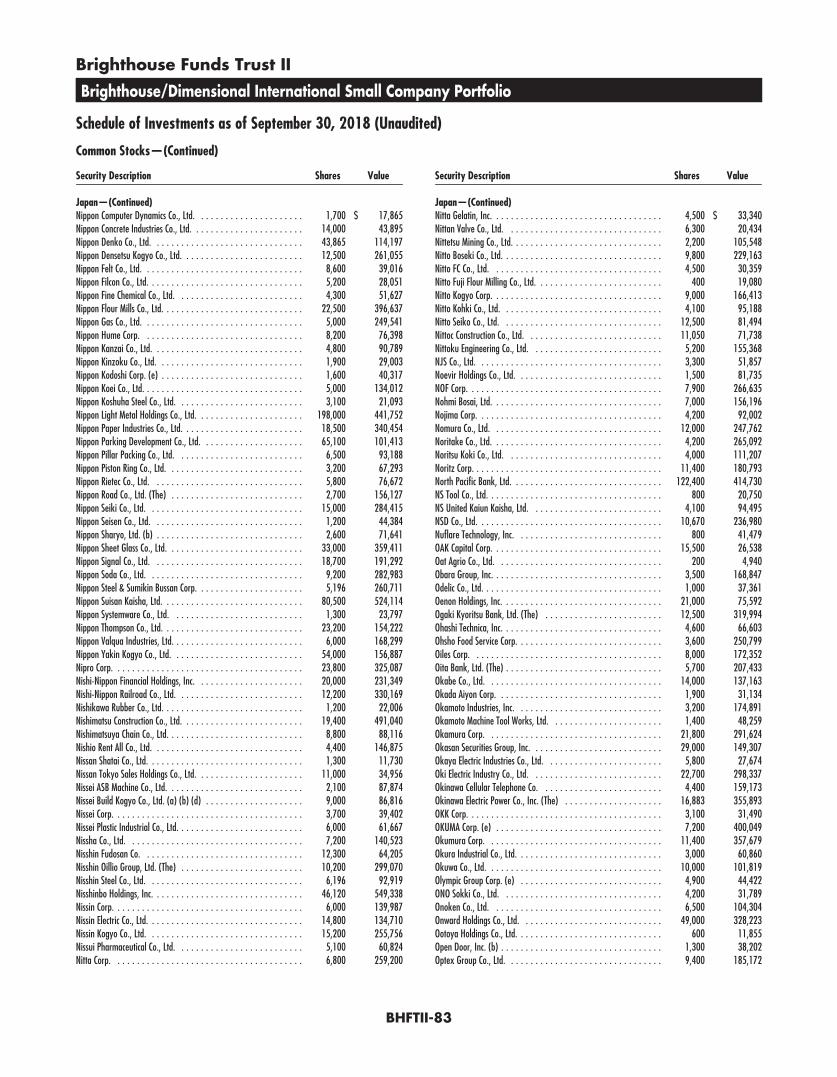
Brighthouse Funds Trust II
Brighthouse/Dimensional International Small Company Portfolio
Schedule of Investments as of September 30, 2018 (Unaudited)
Common Stocks—(Continued)
Security Description Shares Value
Japan—(Continued)Nippon Computer Dynamics Co., Ltd. . . . . . . . . . . . . . . . . . . . . . 1,700 $ 17,865Nippon Concrete Industries Co., Ltd. . . . . . . . . . . . . . . . . . . . . . . 14,000 43,895Nippon Denko Co., Ltd. . . . . . . . . . . . . . . . . . . . . . . . . . . . . . . 43,865 114,197Nippon Densetsu Kogyo Co., Ltd. . . . . . . . . . . . . . . . . . . . . . . . . 12,500 261,055Nippon Felt Co., Ltd. . . . . . . . . . . . . . . . . . . . . . . . . . . . . . . . . 8,600 39,016Nippon Filcon Co., Ltd. . . . . . . . . . . . . . . . . . . . . . . . . . . . . . . . 5,200 28,051Nippon Fine Chemical Co., Ltd. . . . . . . . . . . . . . . . . . . . . . . . . . 4,300 51,627Nippon Flour Mills Co., Ltd. . . . . . . . . . . . . . . . . . . . . . . . . . . . . 22,500 396,637Nippon Gas Co., Ltd. . . . . . . . . . . . . . . . . . . . . . . . . . . . . . . . . 5,000 249,541Nippon Hume Corp. . . . . . . . . . . . . . . . . . . . . . . . . . . . . . . . . 8,200 76,398Nippon Kanzai Co., Ltd. . . . . . . . . . . . . . . . . . . . . . . . . . . . . . . 4,800 90,789Nippon Kinzoku Co., Ltd. . . . . . . . . . . . . . . . . . . . . . . . . . . . . . 1,900 29,003Nippon Kodoshi Corp. (e) . . . . . . . . . . . . . . . . . . . . . . . . . . . . . 1,600 40,317Nippon Koei Co., Ltd. . . . . . . . . . . . . . . . . . . . . . . . . . . . . . . . . 5,000 134,012Nippon Koshuha Steel Co., Ltd. . . . . . . . . . . . . . . . . . . . . . . . . . 3,100 21,093Nippon Light Metal Holdings Co., Ltd. . . . . . . . . . . . . . . . . . . . . . 198,000 441,752Nippon Paper Industries Co., Ltd. . . . . . . . . . . . . . . . . . . . . . . . . 18,500 340,454Nippon Parking Development Co., Ltd. . . . . . . . . . . . . . . . . . . . . 65,100 101,413Nippon Pillar Packing Co., Ltd. . . . . . . . . . . . . . . . . . . . . . . . . . 6,500 93,188Nippon Piston Ring Co., Ltd. . . . . . . . . . . . . . . . . . . . . . . . . . . . 3,200 67,293Nippon Rietec Co., Ltd. . . . . . . . . . . . . . . . . . . . . . . . . . . . . . . 5,800 76,672Nippon Road Co., Ltd. (The) . . . . . . . . . . . . . . . . . . . . . . . . . . . 2,700 156,127Nippon Seiki Co., Ltd. . . . . . . . . . . . . . . . . . . . . . . . . . . . . . . . 15,000 284,415Nippon Seisen Co., Ltd. . . . . . . . . . . . . . . . . . . . . . . . . . . . . . . 1,200 44,384Nippon Sharyo, Ltd. (b) . . . . . . . . . . . . . . . . . . . . . . . . . . . . . . 2,600 71,641Nippon Sheet Glass Co., Ltd. . . . . . . . . . . . . . . . . . . . . . . . . . . . 33,000 359,411Nippon Signal Co., Ltd. . . . . . . . . . . . . . . . . . . . . . . . . . . . . . . 18,700 191,292Nippon Soda Co., Ltd. . . . . . . . . . . . . . . . . . . . . . . . . . . . . . . . 9,200 282,983Nippon Steel & Sumikin Bussan Corp. . . . . . . . . . . . . . . . . . . . . . 5,196 260,711Nippon Suisan Kaisha, Ltd. . . . . . . . . . . . . . . . . . . . . . . . . . . . . 80,500 524,114Nippon Systemware Co., Ltd. . . . . . . . . . . . . . . . . . . . . . . . . . . 1,300 23,797Nippon Thompson Co., Ltd. . . . . . . . . . . . . . . . . . . . . . . . . . . . . 23,200 154,222Nippon Valqua Industries, Ltd. . . . . . . . . . . . . . . . . . . . . . . . . . . 6,000 168,299Nippon Yakin Kogyo Co., Ltd. . . . . . . . . . . . . . . . . . . . . . . . . . . 54,000 156,887Nipro Corp. . . . . . . . . . . . . . . . . . . . . . . . . . . . . . . . . . . . . . . 23,800 325,087Nishi-Nippon Financial Holdings, Inc. . . . . . . . . . . . . . . . . . . . . . 20,000 231,349Nishi-Nippon Railroad Co., Ltd. . . . . . . . . . . . . . . . . . . . . . . . . . 12,200 330,169Nishikawa Rubber Co., Ltd. . . . . . . . . . . . . . . . . . . . . . . . . . . . . 1,200 22,006Nishimatsu Construction Co., Ltd. . . . . . . . . . . . . . . . . . . . . . . . . 19,400 491,040Nishimatsuya Chain Co., Ltd. . . . . . . . . . . . . . . . . . . . . . . . . . . . 8,800 88,116Nishio Rent All Co., Ltd. . . . . . . . . . . . . . . . . . . . . . . . . . . . . . . 4,400 146,875Nissan Shatai Co., Ltd. . . . . . . . . . . . . . . . . . . . . . . . . . . . . . . . 1,300 11,730Nissan Tokyo Sales Holdings Co., Ltd. . . . . . . . . . . . . . . . . . . . . . 11,000 34,956Nissei ASB Machine Co., Ltd. . . . . . . . . . . . . . . . . . . . . . . . . . . . 2,100 87,874Nissei Build Kogyo Co., Ltd. (a) (b) (d) . . . . . . . . . . . . . . . . . . . . 9,000 86,816Nissei Corp. . . . . . . . . . . . . . . . . . . . . . . . . . . . . . . . . . . . . . . 3,700 39,402Nissei Plastic Industrial Co., Ltd. . . . . . . . . . . . . . . . . . . . . . . . . . 6,000 61,667Nissha Co., Ltd. . . . . . . . . . . . . . . . . . . . . . . . . . . . . . . . . . . . 7,200 140,523Nisshin Fudosan Co. . . . . . . . . . . . . . . . . . . . . . . . . . . . . . . . . 12,300 64,205Nisshin Oillio Group, Ltd. (The) . . . . . . . . . . . . . . . . . . . . . . . . . 10,200 299,070Nisshin Steel Co., Ltd. . . . . . . . . . . . . . . . . . . . . . . . . . . . . . . . 6,196 92,919Nisshinbo Holdings, Inc. . . . . . . . . . . . . . . . . . . . . . . . . . . . . . . 46,120 549,338Nissin Corp. . . . . . . . . . . . . . . . . . . . . . . . . . . . . . . . . . . . . . . 6,000 139,987Nissin Electric Co., Ltd. . . . . . . . . . . . . . . . . . . . . . . . . . . . . . . . 14,800 134,710Nissin Kogyo Co., Ltd. . . . . . . . . . . . . . . . . . . . . . . . . . . . . . . . 15,200 255,756Nissui Pharmaceutical Co., Ltd. . . . . . . . . . . . . . . . . . . . . . . . . . 5,100 60,824Nitta Corp. . . . . . . . . . . . . . . . . . . . . . . . . . . . . . . . . . . . . . . 6,800 259,200
Security Description Shares Value
Japan—(Continued)Nitta Gelatin, Inc. . . . . . . . . . . . . . . . . . . . . . . . . . . . . . . . . . . 4,500 $ 33,340Nittan Valve Co., Ltd. . . . . . . . . . . . . . . . . . . . . . . . . . . . . . . . 6,300 20,434Nittetsu Mining Co., Ltd. . . . . . . . . . . . . . . . . . . . . . . . . . . . . . . 2,200 105,548Nitto Boseki Co., Ltd. . . . . . . . . . . . . . . . . . . . . . . . . . . . . . . . . 9,800 229,163Nitto FC Co., Ltd. . . . . . . . . . . . . . . . . . . . . . . . . . . . . . . . . . . 4,500 30,359Nitto Fuji Flour Milling Co., Ltd. . . . . . . . . . . . . . . . . . . . . . . . . . 400 19,080Nitto Kogyo Corp. . . . . . . . . . . . . . . . . . . . . . . . . . . . . . . . . . . 9,000 166,413Nitto Kohki Co., Ltd. . . . . . . . . . . . . . . . . . . . . . . . . . . . . . . . . 4,100 95,188Nitto Seiko Co., Ltd. . . . . . . . . . . . . . . . . . . . . . . . . . . . . . . . . 12,500 81,494Nittoc Construction Co., Ltd. . . . . . . . . . . . . . . . . . . . . . . . . . . . 11,050 71,738Nittoku Engineering Co., Ltd. . . . . . . . . . . . . . . . . . . . . . . . . . . 5,200 155,368NJS Co., Ltd. . . . . . . . . . . . . . . . . . . . . . . . . . . . . . . . . . . . . . 3,300 51,857Noevir Holdings Co., Ltd. . . . . . . . . . . . . . . . . . . . . . . . . . . . . . 1,500 81,735NOF Corp. . . . . . . . . . . . . . . . . . . . . . . . . . . . . . . . . . . . . . . . 7,900 266,635Nohmi Bosai, Ltd. . . . . . . . . . . . . . . . . . . . . . . . . . . . . . . . . . . 7,000 156,196Nojima Corp. . . . . . . . . . . . . . . . . . . . . . . . . . . . . . . . . . . . . . 4,200 92,002Nomura Co., Ltd. . . . . . . . . . . . . . . . . . . . . . . . . . . . . . . . . . . 12,000 247,762Noritake Co., Ltd. . . . . . . . . . . . . . . . . . . . . . . . . . . . . . . . . . . 4,200 265,092Noritsu Koki Co., Ltd. . . . . . . . . . . . . . . . . . . . . . . . . . . . . . . . 4,000 111,207Noritz Corp. . . . . . . . . . . . . . . . . . . . . . . . . . . . . . . . . . . . . . . 11,400 180,793North Pacific Bank, Ltd. . . . . . . . . . . . . . . . . . . . . . . . . . . . . . . 122,400 414,730NS Tool Co., Ltd. . . . . . . . . . . . . . . . . . . . . . . . . . . . . . . . . . . . 800 20,750NS United Kaiun Kaisha, Ltd. . . . . . . . . . . . . . . . . . . . . . . . . . . 4,100 94,495NSD Co., Ltd. . . . . . . . . . . . . . . . . . . . . . . . . . . . . . . . . . . . . . 10,670 236,980Nuflare Technology, Inc. . . . . . . . . . . . . . . . . . . . . . . . . . . . . . 800 41,479OAK Capital Corp. . . . . . . . . . . . . . . . . . . . . . . . . . . . . . . . . . . 15,500 26,538Oat Agrio Co., Ltd. . . . . . . . . . . . . . . . . . . . . . . . . . . . . . . . . . 200 4,940Obara Group, Inc. . . . . . . . . . . . . . . . . . . . . . . . . . . . . . . . . . . 3,500 168,847Odelic Co., Ltd. . . . . . . . . . . . . . . . . . . . . . . . . . . . . . . . . . . . . 1,000 37,361Oenon Holdings, Inc. . . . . . . . . . . . . . . . . . . . . . . . . . . . . . . . . 21,000 75,592Ogaki Kyoritsu Bank, Ltd. (The) . . . . . . . . . . . . . . . . . . . . . . . . 12,500 319,994Ohashi Technica, Inc. . . . . . . . . . . . . . . . . . . . . . . . . . . . . . . . . 4,600 66,603Ohsho Food Service Corp. . . . . . . . . . . . . . . . . . . . . . . . . . . . . . 3,600 250,799Oiles Corp. . . . . . . . . . . . . . . . . . . . . . . . . . . . . . . . . . . . . . . 8,000 172,352Oita Bank, Ltd. (The) . . . . . . . . . . . . . . . . . . . . . . . . . . . . . . . . 5,700 207,433Okabe Co., Ltd. . . . . . . . . . . . . . . . . . . . . . . . . . . . . . . . . . . . 14,000 137,163Okada Aiyon Corp. . . . . . . . . . . . . . . . . . . . . . . . . . . . . . . . . . 1,900 31,134Okamoto Industries, Inc. . . . . . . . . . . . . . . . . . . . . . . . . . . . . . 3,200 174,891Okamoto Machine Tool Works, Ltd. . . . . . . . . . . . . . . . . . . . . . . 1,400 48,259Okamura Corp. . . . . . . . . . . . . . . . . . . . . . . . . . . . . . . . . . . . 21,800 291,624Okasan Securities Group, Inc. . . . . . . . . . . . . . . . . . . . . . . . . . . 29,000 149,307Okaya Electric Industries Co., Ltd. . . . . . . . . . . . . . . . . . . . . . . . 5,800 27,674Oki Electric Industry Co., Ltd. . . . . . . . . . . . . . . . . . . . . . . . . . . 22,700 298,337Okinawa Cellular Telephone Co. . . . . . . . . . . . . . . . . . . . . . . . . 4,400 159,173Okinawa Electric Power Co., Inc. (The) . . . . . . . . . . . . . . . . . . . . 16,883 355,893OKK Corp. . . . . . . . . . . . . . . . . . . . . . . . . . . . . . . . . . . . . . . . 3,100 31,490OKUMA Corp. (e) . . . . . . . . . . . . . . . . . . . . . . . . . . . . . . . . . . 7,200 400,049Okumura Corp. . . . . . . . . . . . . . . . . . . . . . . . . . . . . . . . . . . . 11,400 357,679Okura Industrial Co., Ltd. . . . . . . . . . . . . . . . . . . . . . . . . . . . . . 3,000 60,860Okuwa Co., Ltd. . . . . . . . . . . . . . . . . . . . . . . . . . . . . . . . . . . . 10,000 101,819Olympic Group Corp. (e) . . . . . . . . . . . . . . . . . . . . . . . . . . . . . 4,900 44,422ONO Sokki Co., Ltd. . . . . . . . . . . . . . . . . . . . . . . . . . . . . . . . . 4,200 31,789Onoken Co., Ltd. . . . . . . . . . . . . . . . . . . . . . . . . . . . . . . . . . . 6,500 104,304Onward Holdings Co., Ltd. . . . . . . . . . . . . . . . . . . . . . . . . . . . . 49,000 328,223Ootoya Holdings Co., Ltd. . . . . . . . . . . . . . . . . . . . . . . . . . . . . . 600 11,855Open Door, Inc. (b) . . . . . . . . . . . . . . . . . . . . . . . . . . . . . . . . . 1,300 38,202Optex Group Co., Ltd. . . . . . . . . . . . . . . . . . . . . . . . . . . . . . . . 9,400 185,172
BHFTII-83

Brighthouse Funds Trust II
Brighthouse/Dimensional International Small Company Portfolio
Schedule of Investments as of September 30, 2018 (Unaudited)
Common Stocks—(Continued)
Security Description Shares Value
Japan—(Continued)Organo Corp. . . . . . . . . . . . . . . . . . . . . . . . . . . . . . . . . . . . . . 2,800 $ 78,009Origin Electric Co., Ltd. . . . . . . . . . . . . . . . . . . . . . . . . . . . . . . . 3,400 53,039Oro Co., Ltd. . . . . . . . . . . . . . . . . . . . . . . . . . . . . . . . . . . . . . 100 5,432Osaka Organic Chemical Industry, Ltd. . . . . . . . . . . . . . . . . . . . . 5,900 75,670Osaka Soda Co., Ltd. (e) . . . . . . . . . . . . . . . . . . . . . . . . . . . . . 5,000 132,675Osaka Steel Co., Ltd. . . . . . . . . . . . . . . . . . . . . . . . . . . . . . . . . 5,900 114,220OSAKA Titanium Technologies Co., Ltd. . . . . . . . . . . . . . . . . . . . . 4,100 65,742Osaki Electric Co., Ltd. . . . . . . . . . . . . . . . . . . . . . . . . . . . . . . . 11,000 84,825OSG Corp. . . . . . . . . . . . . . . . . . . . . . . . . . . . . . . . . . . . . . . . 14,800 336,963OSJB Holdings Corp. . . . . . . . . . . . . . . . . . . . . . . . . . . . . . . . . 7,600 20,598Otsuka Kagu, Ltd. (e) . . . . . . . . . . . . . . . . . . . . . . . . . . . . . . . 5,500 14,038OUG Holdings, Inc. . . . . . . . . . . . . . . . . . . . . . . . . . . . . . . . . . 700 17,099Outsourcing, Inc. (e) . . . . . . . . . . . . . . . . . . . . . . . . . . . . . . . . 15,500 227,221Oyo Corp. . . . . . . . . . . . . . . . . . . . . . . . . . . . . . . . . . . . . . . . 7,400 99,533Pacific Industrial Co., Ltd. . . . . . . . . . . . . . . . . . . . . . . . . . . . . . 16,700 276,129Pacific Metals Co., Ltd. (e) . . . . . . . . . . . . . . . . . . . . . . . . . . . . 6,100 226,880Pack Corp. (The) . . . . . . . . . . . . . . . . . . . . . . . . . . . . . . . . . . 4,600 170,233Pal Group Holdings Co., Ltd. . . . . . . . . . . . . . . . . . . . . . . . . . . . 3,800 95,514Paltac Corp. . . . . . . . . . . . . . . . . . . . . . . . . . . . . . . . . . . . . . . 1,950 106,590Paramount Bed Holdings Co., Ltd. . . . . . . . . . . . . . . . . . . . . . . . 6,000 295,776Parco Co., Ltd. . . . . . . . . . . . . . . . . . . . . . . . . . . . . . . . . . . . . 8,100 90,548Paris Miki Holdings, Inc. . . . . . . . . . . . . . . . . . . . . . . . . . . . . . 10,600 45,246Pasco Corp. (b) . . . . . . . . . . . . . . . . . . . . . . . . . . . . . . . . . . . 1,200 14,653Pasona Group, Inc. . . . . . . . . . . . . . . . . . . . . . . . . . . . . . . . . . 6,200 91,942PC Depot Corp. . . . . . . . . . . . . . . . . . . . . . . . . . . . . . . . . . . . . 1,900 9,259PCI Holdings, Inc. . . . . . . . . . . . . . . . . . . . . . . . . . . . . . . . . . . 900 23,546Penta-Ocean Construction Co., Ltd. . . . . . . . . . . . . . . . . . . . . . . . 90,500 603,058Pepper Food Service Co., Ltd. (e) . . . . . . . . . . . . . . . . . . . . . . . . 2,700 95,406Phil Co., Inc. (b) . . . . . . . . . . . . . . . . . . . . . . . . . . . . . . . . . . . 500 22,222PIA Corp. . . . . . . . . . . . . . . . . . . . . . . . . . . . . . . . . . . . . . . . 700 36,224Pilot Corp. . . . . . . . . . . . . . . . . . . . . . . . . . . . . . . . . . . . . . . . 4,900 294,537Piolax, Inc. . . . . . . . . . . . . . . . . . . . . . . . . . . . . . . . . . . . . . . 10,500 233,045Pioneer Corp. (b) (e) . . . . . . . . . . . . . . . . . . . . . . . . . . . . . . . . 117,700 120,163Plenus Co., Ltd. (e) . . . . . . . . . . . . . . . . . . . . . . . . . . . . . . . . . 7,800 127,151Poletowin Pitcrew Holdings, Inc. . . . . . . . . . . . . . . . . . . . . . . . . 2,900 77,227Press Kogyo Co., Ltd. . . . . . . . . . . . . . . . . . . . . . . . . . . . . . . . . 37,000 195,258Pressance Corp. . . . . . . . . . . . . . . . . . . . . . . . . . . . . . . . . . . . 10,400 132,991Prestige International, Inc. . . . . . . . . . . . . . . . . . . . . . . . . . . . . 13,400 160,554Prima Meat Packers, Ltd. . . . . . . . . . . . . . . . . . . . . . . . . . . . . . 9,600 226,512Pro-Ship, Inc. . . . . . . . . . . . . . . . . . . . . . . . . . . . . . . . . . . . . . 700 16,953Pronexus, Inc. . . . . . . . . . . . . . . . . . . . . . . . . . . . . . . . . . . . . 6,700 71,373Proto Corp. . . . . . . . . . . . . . . . . . . . . . . . . . . . . . . . . . . . . . . 4,400 62,075PS Mitsubishi Construction Co., Ltd. . . . . . . . . . . . . . . . . . . . . . . 8,800 45,531Punch Industry Co., Ltd. . . . . . . . . . . . . . . . . . . . . . . . . . . . . . . 2,700 18,730Qol Co., Ltd. . . . . . . . . . . . . . . . . . . . . . . . . . . . . . . . . . . . . . 3,400 74,436Quick Co., Ltd. . . . . . . . . . . . . . . . . . . . . . . . . . . . . . . . . . . . . 1,600 30,083Raccoon Co., Ltd. . . . . . . . . . . . . . . . . . . . . . . . . . . . . . . . . . . 2,300 12,325Raito Kogyo Co., Ltd. . . . . . . . . . . . . . . . . . . . . . . . . . . . . . . . . 16,900 241,530Rakus Co., Ltd. . . . . . . . . . . . . . . . . . . . . . . . . . . . . . . . . . . . . 2,900 62,346Rasa Industries, Ltd. . . . . . . . . . . . . . . . . . . . . . . . . . . . . . . . . 2,600 54,734Raysum Co., Ltd. . . . . . . . . . . . . . . . . . . . . . . . . . . . . . . . . . . 3,000 42,206RECOMM Co., Ltd. . . . . . . . . . . . . . . . . . . . . . . . . . . . . . . . . . . 14,500 32,915Remixpoint, Inc. . . . . . . . . . . . . . . . . . . . . . . . . . . . . . . . . . . . 6,300 54,303Renaissance, Inc. . . . . . . . . . . . . . . . . . . . . . . . . . . . . . . . . . . 2,800 58,133RENOVA, Inc. (b) . . . . . . . . . . . . . . . . . . . . . . . . . . . . . . . . . . 4,800 59,691Renown, Inc. (b) . . . . . . . . . . . . . . . . . . . . . . . . . . . . . . . . . . 29,200 32,641Resort Solution Co., Ltd. . . . . . . . . . . . . . . . . . . . . . . . . . . . . . . 400 15,791
Security Description Shares Value
Japan—(Continued)Resorttrust, Inc. (e) . . . . . . . . . . . . . . . . . . . . . . . . . . . . . . . . . 11,700 $ 192,923Retail Partners Co., Ltd. . . . . . . . . . . . . . . . . . . . . . . . . . . . . . . 1,300 17,025Rheon Automatic Machinery Co., Ltd. . . . . . . . . . . . . . . . . . . . . . 5,000 89,547Rhythm Watch Co., Ltd. . . . . . . . . . . . . . . . . . . . . . . . . . . . . . . 2,500 47,548Riberesute Corp. . . . . . . . . . . . . . . . . . . . . . . . . . . . . . . . . . . . 4,300 36,218Ricoh Leasing Co., Ltd. . . . . . . . . . . . . . . . . . . . . . . . . . . . . . . . 5,600 184,603Ride On Express Holdings Co., Ltd. . . . . . . . . . . . . . . . . . . . . . . . 600 8,533Right On Co., Ltd. . . . . . . . . . . . . . . . . . . . . . . . . . . . . . . . . . . 5,900 55,598Riken Corp. . . . . . . . . . . . . . . . . . . . . . . . . . . . . . . . . . . . . . . 3,500 194,981Riken Keiki Co., Ltd. . . . . . . . . . . . . . . . . . . . . . . . . . . . . . . . . 6,000 129,607Riken Technos Corp. . . . . . . . . . . . . . . . . . . . . . . . . . . . . . . . . 15,000 79,887Riken Vitamin Co., Ltd. . . . . . . . . . . . . . . . . . . . . . . . . . . . . . . 2,700 93,623Ringer Hut Co., Ltd. (e) . . . . . . . . . . . . . . . . . . . . . . . . . . . . . . 4,200 88,931Rion Co., Ltd. . . . . . . . . . . . . . . . . . . . . . . . . . . . . . . . . . . . . . 2,200 48,801Riso Kagaku Corp. . . . . . . . . . . . . . . . . . . . . . . . . . . . . . . . . . 9,458 228,467Riso Kyoiku Co., Ltd. . . . . . . . . . . . . . . . . . . . . . . . . . . . . . . . . 11,590 94,062Rock Field Co., Ltd. . . . . . . . . . . . . . . . . . . . . . . . . . . . . . . . . . 6,600 109,259Rokko Butter Co., Ltd. . . . . . . . . . . . . . . . . . . . . . . . . . . . . . . . 3,600 82,089Roland DG Corp. . . . . . . . . . . . . . . . . . . . . . . . . . . . . . . . . . . 3,000 72,542Rorze Corp. . . . . . . . . . . . . . . . . . . . . . . . . . . . . . . . . . . . . . . 1,900 39,094Round One Corp. . . . . . . . . . . . . . . . . . . . . . . . . . . . . . . . . . . 22,000 291,395Royal Holdings Co., Ltd. . . . . . . . . . . . . . . . . . . . . . . . . . . . . . . 8,300 216,556Rozetta Corp. (b) . . . . . . . . . . . . . . . . . . . . . . . . . . . . . . . . . . 200 3,860RS Technologies Co., Ltd. . . . . . . . . . . . . . . . . . . . . . . . . . . . . . 700 33,603Ryobi, Ltd. . . . . . . . . . . . . . . . . . . . . . . . . . . . . . . . . . . . . . . 9,400 369,209Ryoden Corp. . . . . . . . . . . . . . . . . . . . . . . . . . . . . . . . . . . . . . 4,500 68,152Ryosan Co., Ltd. . . . . . . . . . . . . . . . . . . . . . . . . . . . . . . . . . . . 10,800 392,629Ryoyo Electro Corp. . . . . . . . . . . . . . . . . . . . . . . . . . . . . . . . . . 7,800 120,481S Foods, Inc. . . . . . . . . . . . . . . . . . . . . . . . . . . . . . . . . . . . . . 4,100 176,486S&B Foods, Inc. . . . . . . . . . . . . . . . . . . . . . . . . . . . . . . . . . . . 600 45,838S-Pool, Inc. . . . . . . . . . . . . . . . . . . . . . . . . . . . . . . . . . . . . . . 700 12,208Sac’s Bar Holdings, Inc. . . . . . . . . . . . . . . . . . . . . . . . . . . . . . . 6,850 57,038Sagami Rubber Industries Co., Ltd. . . . . . . . . . . . . . . . . . . . . . . . 1,000 22,700Saibu Gas Co., Ltd. . . . . . . . . . . . . . . . . . . . . . . . . . . . . . . . . . 12,200 289,942Saizeriya Co., Ltd. . . . . . . . . . . . . . . . . . . . . . . . . . . . . . . . . . 9,200 179,744Sakai Chemical Industry Co., Ltd. . . . . . . . . . . . . . . . . . . . . . . . . 6,000 148,011Sakai Heavy Industries, Ltd. . . . . . . . . . . . . . . . . . . . . . . . . . . . 1,400 46,114Sakai Moving Service Co., Ltd. . . . . . . . . . . . . . . . . . . . . . . . . . 2,600 147,751Sakai Ovex Co., Ltd. . . . . . . . . . . . . . . . . . . . . . . . . . . . . . . . . 1,600 34,286Sakata INX Corp. . . . . . . . . . . . . . . . . . . . . . . . . . . . . . . . . . . 11,800 149,643Sakura Internet, Inc. . . . . . . . . . . . . . . . . . . . . . . . . . . . . . . . . 4,400 27,958Sala Corp. . . . . . . . . . . . . . . . . . . . . . . . . . . . . . . . . . . . . . . . 12,900 79,936SAMTY Co., Ltd. . . . . . . . . . . . . . . . . . . . . . . . . . . . . . . . . . . . 2,600 37,789San Holdings, Inc. . . . . . . . . . . . . . . . . . . . . . . . . . . . . . . . . . . 1,400 34,683San ju San Financial Group, Inc. . . . . . . . . . . . . . . . . . . . . . . . . 7,870 166,541San-A Co., Ltd. . . . . . . . . . . . . . . . . . . . . . . . . . . . . . . . . . . . . 5,700 254,844San-Ai Oil Co., Ltd. . . . . . . . . . . . . . . . . . . . . . . . . . . . . . . . . . 20,000 244,503San-In Godo Bank, Ltd. (The) . . . . . . . . . . . . . . . . . . . . . . . . . . 59,000 518,212Sanden Holdings Corp. (b) . . . . . . . . . . . . . . . . . . . . . . . . . . . . 8,400 115,323Sanei Architecture Planning Co., Ltd. . . . . . . . . . . . . . . . . . . . . . 3,500 54,090Sangetsu Corp. . . . . . . . . . . . . . . . . . . . . . . . . . . . . . . . . . . . . 17,200 337,623Sanix, Inc. (b) . . . . . . . . . . . . . . . . . . . . . . . . . . . . . . . . . . . . 7,800 18,251Sanken Electric Co., Ltd. . . . . . . . . . . . . . . . . . . . . . . . . . . . . . . 7,400 193,815Sanki Engineering Co., Ltd. . . . . . . . . . . . . . . . . . . . . . . . . . . . . 17,900 192,187Sanko Metal Industrial Co., Ltd. . . . . . . . . . . . . . . . . . . . . . . . . . 1,000 30,938Sankyo Frontier Co., Ltd. . . . . . . . . . . . . . . . . . . . . . . . . . . . . . 1,000 32,114Sankyo Seiko Co., Ltd. . . . . . . . . . . . . . . . . . . . . . . . . . . . . . . . 13,400 56,949
BHFTII-84

Brighthouse Funds Trust II
Brighthouse/Dimensional International Small Company Portfolio
Schedule of Investments as of September 30, 2018 (Unaudited)
Common Stocks—(Continued)
Security Description Shares Value
Japan—(Continued)Sankyo Tateyama, Inc. . . . . . . . . . . . . . . . . . . . . . . . . . . . . . . 9,600 $ 121,692Sanoh Industrial Co., Ltd. . . . . . . . . . . . . . . . . . . . . . . . . . . . . . 10,100 70,932Sanshin Electronics Co., Ltd. . . . . . . . . . . . . . . . . . . . . . . . . . . . 8,500 152,830Sanyo Chemical Industries, Ltd. . . . . . . . . . . . . . . . . . . . . . . . . . 4,200 214,066Sanyo Denki Co., Ltd. . . . . . . . . . . . . . . . . . . . . . . . . . . . . . . . 1,800 86,073Sanyo Electric Railway Co., Ltd. . . . . . . . . . . . . . . . . . . . . . . . . . 4,000 88,292Sanyo Housing Nagoya Co., Ltd. . . . . . . . . . . . . . . . . . . . . . . . . 3,000 29,680Sanyo Industries, Ltd. . . . . . . . . . . . . . . . . . . . . . . . . . . . . . . . 1,300 24,843Sanyo Shokai, Ltd. . . . . . . . . . . . . . . . . . . . . . . . . . . . . . . . . . 5,100 99,564Sanyo Special Steel Co., Ltd. . . . . . . . . . . . . . . . . . . . . . . . . . . . 8,600 209,885Sapporo Holdings, Ltd. . . . . . . . . . . . . . . . . . . . . . . . . . . . . . . 13,200 274,319Sata Construction Co., Ltd. . . . . . . . . . . . . . . . . . . . . . . . . . . . . 2,600 9,975Sato Holdings Corp. . . . . . . . . . . . . . . . . . . . . . . . . . . . . . . . . 6,900 228,635Sato Shoji Corp. . . . . . . . . . . . . . . . . . . . . . . . . . . . . . . . . . . . 6,500 70,717Satori Electric Co., Ltd. . . . . . . . . . . . . . . . . . . . . . . . . . . . . . . . 5,500 49,335Sawada Holdings Co., Ltd. . . . . . . . . . . . . . . . . . . . . . . . . . . . . 10,300 99,809Sawai Pharmaceutical Co., Ltd. (e) . . . . . . . . . . . . . . . . . . . . . . . 8,600 463,867Saxa Holdings, Inc. . . . . . . . . . . . . . . . . . . . . . . . . . . . . . . . . . 2,400 47,779SBS Holdings, Inc. . . . . . . . . . . . . . . . . . . . . . . . . . . . . . . . . . . 6,900 97,484Scala, Inc. . . . . . . . . . . . . . . . . . . . . . . . . . . . . . . . . . . . . . . . 2,300 24,072Scroll Corp. . . . . . . . . . . . . . . . . . . . . . . . . . . . . . . . . . . . . . . 13,100 80,166Secom Joshinetsu Co., Ltd. . . . . . . . . . . . . . . . . . . . . . . . . . . . . 900 27,088Seed Co., Ltd. . . . . . . . . . . . . . . . . . . . . . . . . . . . . . . . . . . . . 1,700 30,353Seibu Electric Industry Co., Ltd. (b) . . . . . . . . . . . . . . . . . . . . . . . 2,400 90,602Seika Corp. . . . . . . . . . . . . . . . . . . . . . . . . . . . . . . . . . . . . . . 4,200 74,201Seikagaku Corp. . . . . . . . . . . . . . . . . . . . . . . . . . . . . . . . . . . . 700 10,654Seikitokyu Kogyo Co., Ltd. (b) . . . . . . . . . . . . . . . . . . . . . . . . . . 12,500 77,789Seiko Holdings Corp. . . . . . . . . . . . . . . . . . . . . . . . . . . . . . . . . 8,800 247,800Seiren Co., Ltd. . . . . . . . . . . . . . . . . . . . . . . . . . . . . . . . . . . . 19,100 323,753Sekisui Jushi Corp. . . . . . . . . . . . . . . . . . . . . . . . . . . . . . . . . . 10,200 193,490Sekisui Plastics Co., Ltd. . . . . . . . . . . . . . . . . . . . . . . . . . . . . . . 10,300 100,104Senko Group Holdings Co., Ltd. . . . . . . . . . . . . . . . . . . . . . . . . . 31,000 257,938Senshu Electric Co., Ltd. . . . . . . . . . . . . . . . . . . . . . . . . . . . . . . 2,400 66,324Senshu Ikeda Holdings, Inc. . . . . . . . . . . . . . . . . . . . . . . . . . . . 84,000 281,669Senshukai Co., Ltd. (b) . . . . . . . . . . . . . . . . . . . . . . . . . . . . . . 11,000 41,849SFP Holdings Co., Ltd. . . . . . . . . . . . . . . . . . . . . . . . . . . . . . . . 700 11,157Shibaura Electronics Co., Ltd. . . . . . . . . . . . . . . . . . . . . . . . . . . 2,800 130,810Shibaura Mechatronics Corp. . . . . . . . . . . . . . . . . . . . . . . . . . . . 900 30,940Shibusawa Warehouse Co., Ltd. (The) . . . . . . . . . . . . . . . . . . . . . 4,200 65,735Shibuya Corp. . . . . . . . . . . . . . . . . . . . . . . . . . . . . . . . . . . . . 4,800 178,904Shidax Corp. . . . . . . . . . . . . . . . . . . . . . . . . . . . . . . . . . . . . . 9,600 32,023SHIFT, Inc. (b) . . . . . . . . . . . . . . . . . . . . . . . . . . . . . . . . . . . . 1,300 58,023Shiga Bank, Ltd. (The) (e) . . . . . . . . . . . . . . . . . . . . . . . . . . . . 17,800 458,064Shikibo, Ltd. . . . . . . . . . . . . . . . . . . . . . . . . . . . . . . . . . . . . . 4,700 55,379Shikoku Bank, Ltd. (The) . . . . . . . . . . . . . . . . . . . . . . . . . . . . . 14,000 170,943Shikoku Chemicals Corp. . . . . . . . . . . . . . . . . . . . . . . . . . . . . . 13,000 180,465Shima Seiki Manufacturing, Ltd. . . . . . . . . . . . . . . . . . . . . . . . . 4,600 203,226Shimachu Co., Ltd. . . . . . . . . . . . . . . . . . . . . . . . . . . . . . . . . . 19,600 631,341Shimane Bank, Ltd. (The) . . . . . . . . . . . . . . . . . . . . . . . . . . . . . 2,500 26,867Shimizu Bank, Ltd. (The) . . . . . . . . . . . . . . . . . . . . . . . . . . . . . 3,400 63,983Shimojima Co., Ltd. . . . . . . . . . . . . . . . . . . . . . . . . . . . . . . . . . 6,300 62,713Shin Nippon Air Technologies Co., Ltd. . . . . . . . . . . . . . . . . . . . . 4,600 68,749Shin Nippon Biomedical Laboratories, Ltd. (b) . . . . . . . . . . . . . . . 2,500 13,665Shin-Etsu Polymer Co., Ltd. . . . . . . . . . . . . . . . . . . . . . . . . . . . . 16,900 138,807Shin-Keisei Electric Railway Co., Ltd. . . . . . . . . . . . . . . . . . . . . . . 2,900 58,248Shinagawa Refractories Co., Ltd. . . . . . . . . . . . . . . . . . . . . . . . . 2,000 89,348Shindengen Electric Manufacturing Co., Ltd. . . . . . . . . . . . . . . . . . 2,800 133,851
Security Description Shares Value
Japan—(Continued)Shinkawa, Ltd. (b) . . . . . . . . . . . . . . . . . . . . . . . . . . . . . . . . . 5,300 $ 27,261Shinko Electric Industries Co., Ltd. . . . . . . . . . . . . . . . . . . . . . . . 27,600 232,212Shinko Plantech Co., Ltd. . . . . . . . . . . . . . . . . . . . . . . . . . . . . . 16,100 167,495Shinko Shoji Co., Ltd. . . . . . . . . . . . . . . . . . . . . . . . . . . . . . . . 7,700 112,376Shinko Wire Co., Ltd. . . . . . . . . . . . . . . . . . . . . . . . . . . . . . . . . 1,200 14,659Shinmaywa Industries, Ltd. . . . . . . . . . . . . . . . . . . . . . . . . . . . . 34,000 460,813Shinnihon Corp. . . . . . . . . . . . . . . . . . . . . . . . . . . . . . . . . . . . 10,200 111,163Shinoken Group Co., Ltd. (e) . . . . . . . . . . . . . . . . . . . . . . . . . . . 4,900 51,921Shinsho Corp. . . . . . . . . . . . . . . . . . . . . . . . . . . . . . . . . . . . . 1,400 39,191Shinwa Co., Ltd. . . . . . . . . . . . . . . . . . . . . . . . . . . . . . . . . . . . 3,900 75,217Ship Healthcare Holdings, Inc. . . . . . . . . . . . . . . . . . . . . . . . . . . 12,000 463,989Shizuki Electric Co., Inc. . . . . . . . . . . . . . . . . . . . . . . . . . . . . . . 8,000 55,955Shizuoka Gas Co., Ltd. . . . . . . . . . . . . . . . . . . . . . . . . . . . . . . . 21,300 188,815Shobunsha Publications, Inc. . . . . . . . . . . . . . . . . . . . . . . . . . . . 4,800 28,263Shoei Co., Ltd. . . . . . . . . . . . . . . . . . . . . . . . . . . . . . . . . . . . . 2,600 112,253Shoei Foods Corp. . . . . . . . . . . . . . . . . . . . . . . . . . . . . . . . . . . 3,400 125,523Shofu, Inc. . . . . . . . . . . . . . . . . . . . . . . . . . . . . . . . . . . . . . . 3,900 47,061Shoko Co., Ltd. (b) . . . . . . . . . . . . . . . . . . . . . . . . . . . . . . . . . 1,900 16,105Showa Aircraft Industry Co., Ltd. . . . . . . . . . . . . . . . . . . . . . . . . 4,000 45,766Showa Corp. . . . . . . . . . . . . . . . . . . . . . . . . . . . . . . . . . . . . . 17,600 269,405Showa Sangyo Co., Ltd. . . . . . . . . . . . . . . . . . . . . . . . . . . . . . . 6,600 170,091SIGMAXYZ, Inc. . . . . . . . . . . . . . . . . . . . . . . . . . . . . . . . . . . . 1,200 13,796Siix Corp. . . . . . . . . . . . . . . . . . . . . . . . . . . . . . . . . . . . . . . . 9,600 167,155Sinanen Holdings Co., Ltd. . . . . . . . . . . . . . . . . . . . . . . . . . . . . 2,900 74,407Sinfonia Technology Co., Ltd. . . . . . . . . . . . . . . . . . . . . . . . . . . 8,400 125,264Sinko Industries, Ltd. . . . . . . . . . . . . . . . . . . . . . . . . . . . . . . . . 6,400 106,194Sintokogio, Ltd. . . . . . . . . . . . . . . . . . . . . . . . . . . . . . . . . . . . 16,800 169,934SKY Perfect JSAT Holdings, Inc. . . . . . . . . . . . . . . . . . . . . . . . . . 29,800 143,755SMK Corp. . . . . . . . . . . . . . . . . . . . . . . . . . . . . . . . . . . . . . . . 2,300 62,967SMS Co., Ltd. . . . . . . . . . . . . . . . . . . . . . . . . . . . . . . . . . . . . . 14,600 290,526SNT Corp. . . . . . . . . . . . . . . . . . . . . . . . . . . . . . . . . . . . . . . . 15,600 69,211Soda Nikka Co., Ltd. . . . . . . . . . . . . . . . . . . . . . . . . . . . . . . . . 7,000 42,508Sodick Co., Ltd. . . . . . . . . . . . . . . . . . . . . . . . . . . . . . . . . . . . 16,800 152,627Soft99 Corp. . . . . . . . . . . . . . . . . . . . . . . . . . . . . . . . . . . . . . 5,100 48,648Softbank Technology Corp. . . . . . . . . . . . . . . . . . . . . . . . . . . . . 3,200 78,038Softbrain Co., Ltd. . . . . . . . . . . . . . . . . . . . . . . . . . . . . . . . . . . 3,500 15,032Softcreate Holdings Corp. . . . . . . . . . . . . . . . . . . . . . . . . . . . . . 700 10,671Software Service, Inc. . . . . . . . . . . . . . . . . . . . . . . . . . . . . . . . 1,200 112,426Sogo Medical Co., Ltd. (a) (b) (d) . . . . . . . . . . . . . . . . . . . . . . . . 4,800 105,879Solasto Corp. . . . . . . . . . . . . . . . . . . . . . . . . . . . . . . . . . . . . . 8,400 109,251Soliton Systems KK . . . . . . . . . . . . . . . . . . . . . . . . . . . . . . . . . 600 5,567Sotoh Co., Ltd. . . . . . . . . . . . . . . . . . . . . . . . . . . . . . . . . . . . . 3,100 27,584Sourcenext Corp. . . . . . . . . . . . . . . . . . . . . . . . . . . . . . . . . . . 5,900 61,390Space Co., Ltd. . . . . . . . . . . . . . . . . . . . . . . . . . . . . . . . . . . . . 5,060 63,278Sparx Group Co., Ltd. . . . . . . . . . . . . . . . . . . . . . . . . . . . . . . . 35,900 93,767SPK Corp. . . . . . . . . . . . . . . . . . . . . . . . . . . . . . . . . . . . . . . . 1,700 38,275SRA Holdings . . . . . . . . . . . . . . . . . . . . . . . . . . . . . . . . . . . . . 3,100 94,958Srg Takamiya Co., Ltd. . . . . . . . . . . . . . . . . . . . . . . . . . . . . . . 5,200 30,924ST Corp. . . . . . . . . . . . . . . . . . . . . . . . . . . . . . . . . . . . . . . . . 600 11,134St. Marc Holdings Co., Ltd. . . . . . . . . . . . . . . . . . . . . . . . . . . . . 5,100 119,047Star Mica Co., Ltd. . . . . . . . . . . . . . . . . . . . . . . . . . . . . . . . . . 2,400 37,365Star Micronics Co., Ltd. . . . . . . . . . . . . . . . . . . . . . . . . . . . . . . 4,400 78,253Starts Corp., Inc. . . . . . . . . . . . . . . . . . . . . . . . . . . . . . . . . . . . 5,800 128,000Starzen Co., Ltd. . . . . . . . . . . . . . . . . . . . . . . . . . . . . . . . . . . . 2,500 107,700Stella Chemifa Corp. . . . . . . . . . . . . . . . . . . . . . . . . . . . . . . . . 3,600 130,941Step Co., Ltd. . . . . . . . . . . . . . . . . . . . . . . . . . . . . . . . . . . . . . 4,100 55,212Strike Co., Ltd. . . . . . . . . . . . . . . . . . . . . . . . . . . . . . . . . . . . . 1,300 43,959
BHFTII-85
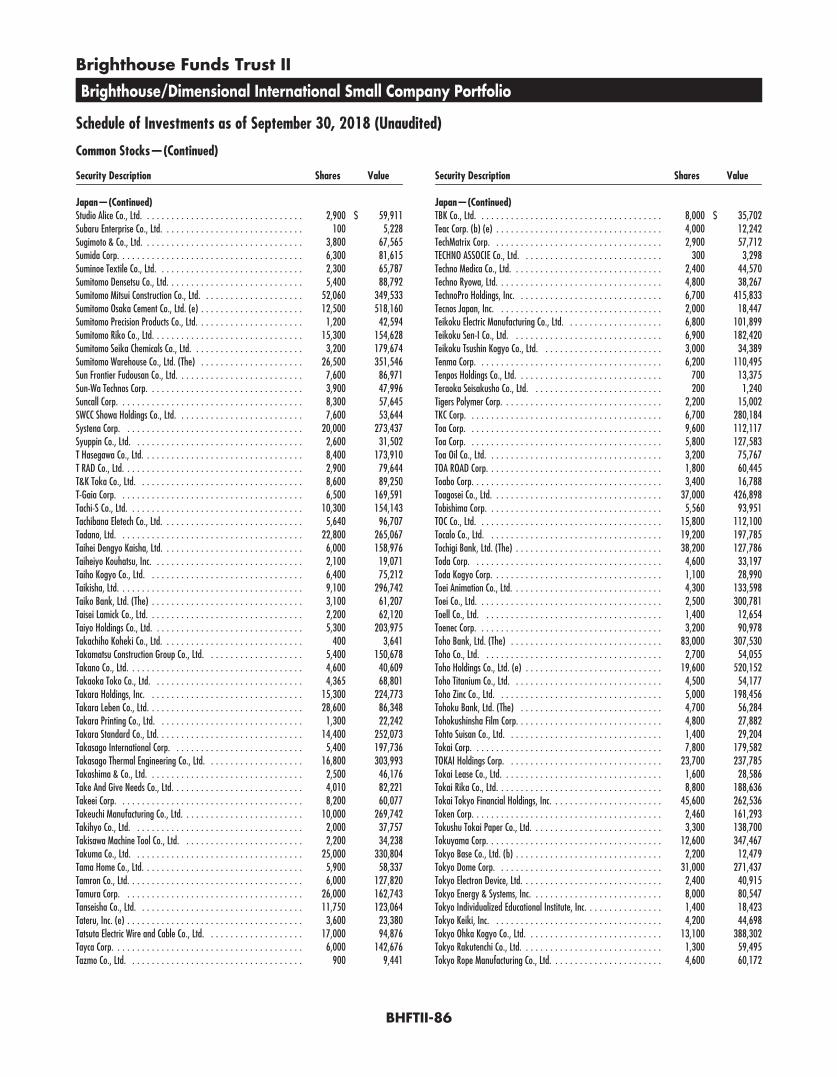
Brighthouse Funds Trust II
Brighthouse/Dimensional International Small Company Portfolio
Schedule of Investments as of September 30, 2018 (Unaudited)
Common Stocks—(Continued)
Security Description Shares Value
Japan—(Continued)Studio Alice Co., Ltd. . . . . . . . . . . . . . . . . . . . . . . . . . . . . . . . . 2,900 $ 59,911Subaru Enterprise Co., Ltd. . . . . . . . . . . . . . . . . . . . . . . . . . . . . 100 5,228Sugimoto & Co., Ltd. . . . . . . . . . . . . . . . . . . . . . . . . . . . . . . . . 3,800 67,565Sumida Corp. . . . . . . . . . . . . . . . . . . . . . . . . . . . . . . . . . . . . . 6,300 81,615Suminoe Textile Co., Ltd. . . . . . . . . . . . . . . . . . . . . . . . . . . . . . 2,300 65,787Sumitomo Densetsu Co., Ltd. . . . . . . . . . . . . . . . . . . . . . . . . . . . 5,400 88,792Sumitomo Mitsui Construction Co., Ltd. . . . . . . . . . . . . . . . . . . . . 52,060 349,533Sumitomo Osaka Cement Co., Ltd. (e) . . . . . . . . . . . . . . . . . . . . . 12,500 518,160Sumitomo Precision Products Co., Ltd. . . . . . . . . . . . . . . . . . . . . . 1,200 42,594Sumitomo Riko Co., Ltd. . . . . . . . . . . . . . . . . . . . . . . . . . . . . . . 15,300 154,628Sumitomo Seika Chemicals Co., Ltd. . . . . . . . . . . . . . . . . . . . . . . 3,200 179,674Sumitomo Warehouse Co., Ltd. (The) . . . . . . . . . . . . . . . . . . . . . 26,500 351,546Sun Frontier Fudousan Co., Ltd. . . . . . . . . . . . . . . . . . . . . . . . . . 7,600 86,971Sun-Wa Technos Corp. . . . . . . . . . . . . . . . . . . . . . . . . . . . . . . . 3,900 47,996Suncall Corp. . . . . . . . . . . . . . . . . . . . . . . . . . . . . . . . . . . . . . 8,300 57,645SWCC Showa Holdings Co., Ltd. . . . . . . . . . . . . . . . . . . . . . . . . . 7,600 53,644Systena Corp. . . . . . . . . . . . . . . . . . . . . . . . . . . . . . . . . . . . . 20,000 273,437Syuppin Co., Ltd. . . . . . . . . . . . . . . . . . . . . . . . . . . . . . . . . . . 2,600 31,502T Hasegawa Co., Ltd. . . . . . . . . . . . . . . . . . . . . . . . . . . . . . . . . 8,400 173,910T RAD Co., Ltd. . . . . . . . . . . . . . . . . . . . . . . . . . . . . . . . . . . . . 2,900 79,644T&K Toka Co., Ltd. . . . . . . . . . . . . . . . . . . . . . . . . . . . . . . . . . 8,600 89,250T-Gaia Corp. . . . . . . . . . . . . . . . . . . . . . . . . . . . . . . . . . . . . . 6,500 169,591Tachi-S Co., Ltd. . . . . . . . . . . . . . . . . . . . . . . . . . . . . . . . . . . . 10,300 154,143Tachibana Eletech Co., Ltd. . . . . . . . . . . . . . . . . . . . . . . . . . . . . 5,640 96,707Tadano, Ltd. . . . . . . . . . . . . . . . . . . . . . . . . . . . . . . . . . . . . . 22,800 265,067Taihei Dengyo Kaisha, Ltd. . . . . . . . . . . . . . . . . . . . . . . . . . . . . 6,000 158,976Taiheiyo Kouhatsu, Inc. . . . . . . . . . . . . . . . . . . . . . . . . . . . . . . 2,100 19,071Taiho Kogyo Co., Ltd. . . . . . . . . . . . . . . . . . . . . . . . . . . . . . . . 6,400 75,212Taikisha, Ltd. . . . . . . . . . . . . . . . . . . . . . . . . . . . . . . . . . . . . . 9,100 296,742Taiko Bank, Ltd. (The) . . . . . . . . . . . . . . . . . . . . . . . . . . . . . . . 3,100 61,207Taisei Lamick Co., Ltd. . . . . . . . . . . . . . . . . . . . . . . . . . . . . . . . 2,200 62,120Taiyo Holdings Co., Ltd. . . . . . . . . . . . . . . . . . . . . . . . . . . . . . . 5,300 203,975Takachiho Koheki Co., Ltd. . . . . . . . . . . . . . . . . . . . . . . . . . . . . 400 3,641Takamatsu Construction Group Co., Ltd. . . . . . . . . . . . . . . . . . . . 5,400 150,678Takano Co., Ltd. . . . . . . . . . . . . . . . . . . . . . . . . . . . . . . . . . . . 4,600 40,609Takaoka Toko Co., Ltd. . . . . . . . . . . . . . . . . . . . . . . . . . . . . . . 4,365 68,801Takara Holdings, Inc. . . . . . . . . . . . . . . . . . . . . . . . . . . . . . . . 15,300 224,773Takara Leben Co., Ltd. . . . . . . . . . . . . . . . . . . . . . . . . . . . . . . . 28,600 86,348Takara Printing Co., Ltd. . . . . . . . . . . . . . . . . . . . . . . . . . . . . . 1,300 22,242Takara Standard Co., Ltd. . . . . . . . . . . . . . . . . . . . . . . . . . . . . . 14,400 252,073Takasago International Corp. . . . . . . . . . . . . . . . . . . . . . . . . . . 5,400 197,736Takasago Thermal Engineering Co., Ltd. . . . . . . . . . . . . . . . . . . . 16,800 303,993Takashima & Co., Ltd. . . . . . . . . . . . . . . . . . . . . . . . . . . . . . . . 2,500 46,176Take And Give Needs Co., Ltd. . . . . . . . . . . . . . . . . . . . . . . . . . . 4,010 82,221Takeei Corp. . . . . . . . . . . . . . . . . . . . . . . . . . . . . . . . . . . . . . 8,200 60,077Takeuchi Manufacturing Co., Ltd. . . . . . . . . . . . . . . . . . . . . . . . . 10,000 269,742Takihyo Co., Ltd. . . . . . . . . . . . . . . . . . . . . . . . . . . . . . . . . . . 2,000 37,757Takisawa Machine Tool Co., Ltd. . . . . . . . . . . . . . . . . . . . . . . . . 2,200 34,238Takuma Co., Ltd. . . . . . . . . . . . . . . . . . . . . . . . . . . . . . . . . . . 25,000 330,804Tama Home Co., Ltd. . . . . . . . . . . . . . . . . . . . . . . . . . . . . . . . . 5,900 58,337Tamron Co., Ltd. . . . . . . . . . . . . . . . . . . . . . . . . . . . . . . . . . . . 6,000 127,820Tamura Corp. . . . . . . . . . . . . . . . . . . . . . . . . . . . . . . . . . . . . 26,000 162,743Tanseisha Co., Ltd. . . . . . . . . . . . . . . . . . . . . . . . . . . . . . . . . . 11,750 123,064Tateru, Inc. (e) . . . . . . . . . . . . . . . . . . . . . . . . . . . . . . . . . . . . 3,600 23,380Tatsuta Electric Wire and Cable Co., Ltd. . . . . . . . . . . . . . . . . . . . 17,000 94,876Tayca Corp. . . . . . . . . . . . . . . . . . . . . . . . . . . . . . . . . . . . . . . 6,000 142,676Tazmo Co., Ltd. . . . . . . . . . . . . . . . . . . . . . . . . . . . . . . . . . . . 900 9,441
Security Description Shares Value
Japan—(Continued)TBK Co., Ltd. . . . . . . . . . . . . . . . . . . . . . . . . . . . . . . . . . . . . . 8,000 $ 35,702Teac Corp. (b) (e) . . . . . . . . . . . . . . . . . . . . . . . . . . . . . . . . . . 4,000 12,242TechMatrix Corp. . . . . . . . . . . . . . . . . . . . . . . . . . . . . . . . . . . 2,900 57,712TECHNO ASSOCIE Co., Ltd. . . . . . . . . . . . . . . . . . . . . . . . . . . . . 300 3,298Techno Medica Co., Ltd. . . . . . . . . . . . . . . . . . . . . . . . . . . . . . . 2,400 44,570Techno Ryowa, Ltd. . . . . . . . . . . . . . . . . . . . . . . . . . . . . . . . . . 4,800 38,267TechnoPro Holdings, Inc. . . . . . . . . . . . . . . . . . . . . . . . . . . . . . 6,700 415,833Tecnos Japan, Inc. . . . . . . . . . . . . . . . . . . . . . . . . . . . . . . . . . 2,000 18,447Teikoku Electric Manufacturing Co., Ltd. . . . . . . . . . . . . . . . . . . . 6,800 101,899Teikoku Sen-I Co., Ltd. . . . . . . . . . . . . . . . . . . . . . . . . . . . . . . 6,900 182,420Teikoku Tsushin Kogyo Co., Ltd. . . . . . . . . . . . . . . . . . . . . . . . . 3,000 34,389Tenma Corp. . . . . . . . . . . . . . . . . . . . . . . . . . . . . . . . . . . . . . 6,200 110,495Tenpos Holdings Co., Ltd. . . . . . . . . . . . . . . . . . . . . . . . . . . . . . 700 13,375Teraoka Seisakusho Co., Ltd. . . . . . . . . . . . . . . . . . . . . . . . . . . 200 1,240Tigers Polymer Corp. . . . . . . . . . . . . . . . . . . . . . . . . . . . . . . . . 2,200 15,002TKC Corp. . . . . . . . . . . . . . . . . . . . . . . . . . . . . . . . . . . . . . . . 6,700 280,184Toa Corp. . . . . . . . . . . . . . . . . . . . . . . . . . . . . . . . . . . . . . . . 9,600 112,117Toa Corp. . . . . . . . . . . . . . . . . . . . . . . . . . . . . . . . . . . . . . . . 5,800 127,583Toa Oil Co., Ltd. . . . . . . . . . . . . . . . . . . . . . . . . . . . . . . . . . . . 3,200 75,767TOA ROAD Corp. . . . . . . . . . . . . . . . . . . . . . . . . . . . . . . . . . . . 1,800 60,445Toabo Corp. . . . . . . . . . . . . . . . . . . . . . . . . . . . . . . . . . . . . . . 3,400 16,788Toagosei Co., Ltd. . . . . . . . . . . . . . . . . . . . . . . . . . . . . . . . . . . 37,000 426,898Tobishima Corp. . . . . . . . . . . . . . . . . . . . . . . . . . . . . . . . . . . . 5,560 93,951TOC Co., Ltd. . . . . . . . . . . . . . . . . . . . . . . . . . . . . . . . . . . . . . 15,800 112,100Tocalo Co., Ltd. . . . . . . . . . . . . . . . . . . . . . . . . . . . . . . . . . . . 19,200 197,785Tochigi Bank, Ltd. (The) . . . . . . . . . . . . . . . . . . . . . . . . . . . . . . 38,200 127,786Toda Corp. . . . . . . . . . . . . . . . . . . . . . . . . . . . . . . . . . . . . . . 4,600 33,197Toda Kogyo Corp. . . . . . . . . . . . . . . . . . . . . . . . . . . . . . . . . . . 1,100 28,990Toei Animation Co., Ltd. . . . . . . . . . . . . . . . . . . . . . . . . . . . . . . 4,300 133,598Toei Co., Ltd. . . . . . . . . . . . . . . . . . . . . . . . . . . . . . . . . . . . . . 2,500 300,781Toell Co., Ltd. . . . . . . . . . . . . . . . . . . . . . . . . . . . . . . . . . . . . 1,400 12,654Toenec Corp. . . . . . . . . . . . . . . . . . . . . . . . . . . . . . . . . . . . . . 3,200 90,978Toho Bank, Ltd. (The) . . . . . . . . . . . . . . . . . . . . . . . . . . . . . . . 83,000 307,530Toho Co., Ltd. . . . . . . . . . . . . . . . . . . . . . . . . . . . . . . . . . . . . 2,700 54,055Toho Holdings Co., Ltd. (e) . . . . . . . . . . . . . . . . . . . . . . . . . . . . 19,600 520,152Toho Titanium Co., Ltd. . . . . . . . . . . . . . . . . . . . . . . . . . . . . . . 4,500 54,177Toho Zinc Co., Ltd. . . . . . . . . . . . . . . . . . . . . . . . . . . . . . . . . . 5,000 198,456Tohoku Bank, Ltd. (The) . . . . . . . . . . . . . . . . . . . . . . . . . . . . . 4,700 56,284Tohokushinsha Film Corp. . . . . . . . . . . . . . . . . . . . . . . . . . . . . . 4,800 27,882Tohto Suisan Co., Ltd. . . . . . . . . . . . . . . . . . . . . . . . . . . . . . . . 1,400 29,204Tokai Corp. . . . . . . . . . . . . . . . . . . . . . . . . . . . . . . . . . . . . . . 7,800 179,582TOKAI Holdings Corp. . . . . . . . . . . . . . . . . . . . . . . . . . . . . . . . 23,700 237,785Tokai Lease Co., Ltd. . . . . . . . . . . . . . . . . . . . . . . . . . . . . . . . . 1,600 28,586Tokai Rika Co., Ltd. . . . . . . . . . . . . . . . . . . . . . . . . . . . . . . . . . 8,800 188,636Tokai Tokyo Financial Holdings, Inc. . . . . . . . . . . . . . . . . . . . . . . 45,600 262,536Token Corp. . . . . . . . . . . . . . . . . . . . . . . . . . . . . . . . . . . . . . . 2,460 161,293Tokushu Tokai Paper Co., Ltd. . . . . . . . . . . . . . . . . . . . . . . . . . . 3,300 138,700Tokuyama Corp. . . . . . . . . . . . . . . . . . . . . . . . . . . . . . . . . . . . 12,600 347,467Tokyo Base Co., Ltd. (b) . . . . . . . . . . . . . . . . . . . . . . . . . . . . . . 2,200 12,479Tokyo Dome Corp. . . . . . . . . . . . . . . . . . . . . . . . . . . . . . . . . . 31,000 271,437Tokyo Electron Device, Ltd. . . . . . . . . . . . . . . . . . . . . . . . . . . . . 2,400 40,915Tokyo Energy & Systems, Inc. . . . . . . . . . . . . . . . . . . . . . . . . . . 8,000 80,547Tokyo Individualized Educational Institute, Inc. . . . . . . . . . . . . . . . 1,400 18,423Tokyo Keiki, Inc. . . . . . . . . . . . . . . . . . . . . . . . . . . . . . . . . . . 4,200 44,698Tokyo Ohka Kogyo Co., Ltd. . . . . . . . . . . . . . . . . . . . . . . . . . . . 13,100 388,302Tokyo Rakutenchi Co., Ltd. . . . . . . . . . . . . . . . . . . . . . . . . . . . . 1,300 59,495Tokyo Rope Manufacturing Co., Ltd. . . . . . . . . . . . . . . . . . . . . . . 4,600 60,172
BHFTII-86
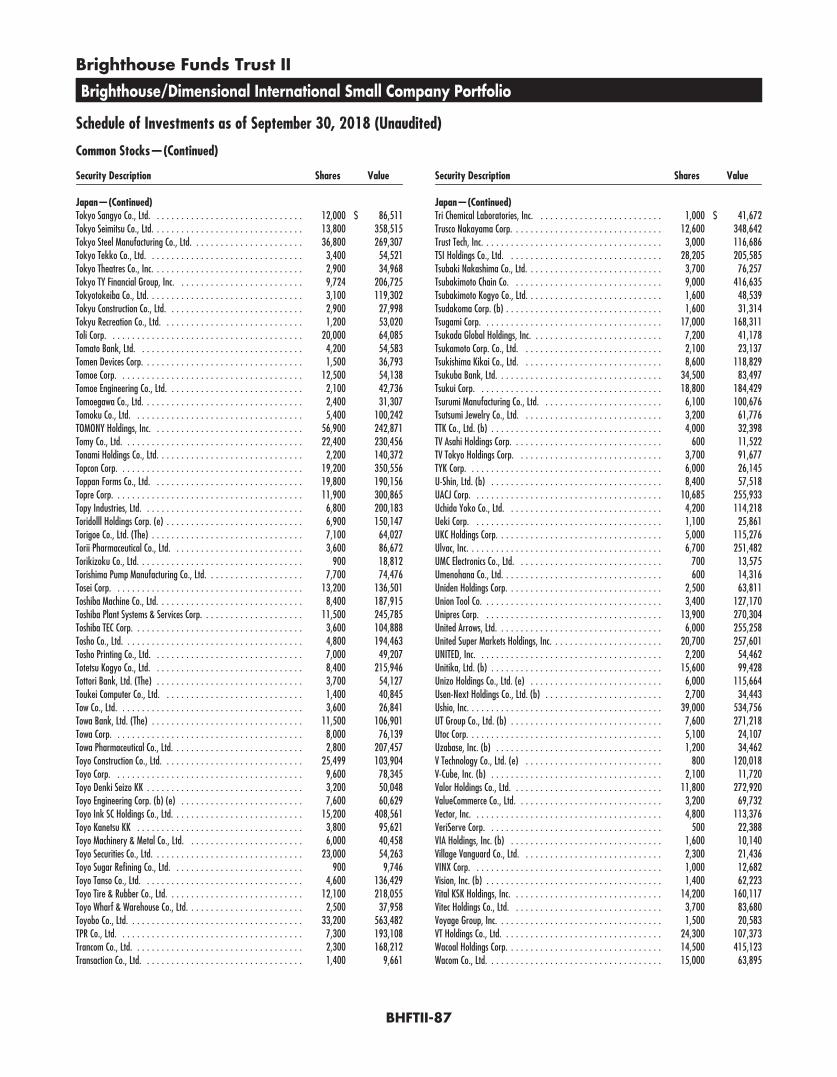
Brighthouse Funds Trust II
Brighthouse/Dimensional International Small Company Portfolio
Schedule of Investments as of September 30, 2018 (Unaudited)
Common Stocks—(Continued)
Security Description Shares Value
Japan—(Continued)Tokyo Sangyo Co., Ltd. . . . . . . . . . . . . . . . . . . . . . . . . . . . . . . 12,000 $ 86,511Tokyo Seimitsu Co., Ltd. . . . . . . . . . . . . . . . . . . . . . . . . . . . . . . 13,800 358,515Tokyo Steel Manufacturing Co., Ltd. . . . . . . . . . . . . . . . . . . . . . . 36,800 269,307Tokyo Tekko Co., Ltd. . . . . . . . . . . . . . . . . . . . . . . . . . . . . . . . 3,400 54,521Tokyo Theatres Co., Inc. . . . . . . . . . . . . . . . . . . . . . . . . . . . . . . 2,900 34,968Tokyo TY Financial Group, Inc. . . . . . . . . . . . . . . . . . . . . . . . . . 9,724 206,725Tokyotokeiba Co., Ltd. . . . . . . . . . . . . . . . . . . . . . . . . . . . . . . . 3,100 119,302Tokyu Construction Co., Ltd. . . . . . . . . . . . . . . . . . . . . . . . . . . . 2,900 27,998Tokyu Recreation Co., Ltd. . . . . . . . . . . . . . . . . . . . . . . . . . . . . 1,200 53,020Toli Corp. . . . . . . . . . . . . . . . . . . . . . . . . . . . . . . . . . . . . . . . 20,000 64,085Tomato Bank, Ltd. . . . . . . . . . . . . . . . . . . . . . . . . . . . . . . . . . 4,200 54,583Tomen Devices Corp. . . . . . . . . . . . . . . . . . . . . . . . . . . . . . . . . 1,500 36,793Tomoe Corp. . . . . . . . . . . . . . . . . . . . . . . . . . . . . . . . . . . . . . 12,500 54,138Tomoe Engineering Co., Ltd. . . . . . . . . . . . . . . . . . . . . . . . . . . . 2,100 42,736Tomoegawa Co., Ltd. . . . . . . . . . . . . . . . . . . . . . . . . . . . . . . . . 2,400 31,307Tomoku Co., Ltd. . . . . . . . . . . . . . . . . . . . . . . . . . . . . . . . . . . 5,400 100,242TOMONY Holdings, Inc. . . . . . . . . . . . . . . . . . . . . . . . . . . . . . . 56,900 242,871Tomy Co., Ltd. . . . . . . . . . . . . . . . . . . . . . . . . . . . . . . . . . . . . 22,400 230,456Tonami Holdings Co., Ltd. . . . . . . . . . . . . . . . . . . . . . . . . . . . . . 2,200 140,372Topcon Corp. . . . . . . . . . . . . . . . . . . . . . . . . . . . . . . . . . . . . . 19,200 350,556Toppan Forms Co., Ltd. . . . . . . . . . . . . . . . . . . . . . . . . . . . . . . 19,800 190,156Topre Corp. . . . . . . . . . . . . . . . . . . . . . . . . . . . . . . . . . . . . . . 11,900 300,865Topy Industries, Ltd. . . . . . . . . . . . . . . . . . . . . . . . . . . . . . . . . 6,800 200,183Toridolll Holdings Corp. (e) . . . . . . . . . . . . . . . . . . . . . . . . . . . . 6,900 150,147Torigoe Co., Ltd. (The) . . . . . . . . . . . . . . . . . . . . . . . . . . . . . . . 7,100 64,027Torii Pharmaceutical Co., Ltd. . . . . . . . . . . . . . . . . . . . . . . . . . . 3,600 86,672Torikizoku Co., Ltd. . . . . . . . . . . . . . . . . . . . . . . . . . . . . . . . . . 900 18,812Torishima Pump Manufacturing Co., Ltd. . . . . . . . . . . . . . . . . . . . 7,700 74,476Tosei Corp. . . . . . . . . . . . . . . . . . . . . . . . . . . . . . . . . . . . . . . 13,200 136,501Toshiba Machine Co., Ltd. . . . . . . . . . . . . . . . . . . . . . . . . . . . . . 8,400 187,915Toshiba Plant Systems & Services Corp. . . . . . . . . . . . . . . . . . . . . 11,500 245,785Toshiba TEC Corp. . . . . . . . . . . . . . . . . . . . . . . . . . . . . . . . . . . 3,600 104,888Tosho Co., Ltd. . . . . . . . . . . . . . . . . . . . . . . . . . . . . . . . . . . . . 4,800 194,463Tosho Printing Co., Ltd. . . . . . . . . . . . . . . . . . . . . . . . . . . . . . . 7,000 49,207Totetsu Kogyo Co., Ltd. . . . . . . . . . . . . . . . . . . . . . . . . . . . . . . 8,400 215,946Tottori Bank, Ltd. (The) . . . . . . . . . . . . . . . . . . . . . . . . . . . . . . 3,700 54,127Toukei Computer Co., Ltd. . . . . . . . . . . . . . . . . . . . . . . . . . . . . 1,400 40,845Tow Co., Ltd. . . . . . . . . . . . . . . . . . . . . . . . . . . . . . . . . . . . . . 3,600 26,841Towa Bank, Ltd. (The) . . . . . . . . . . . . . . . . . . . . . . . . . . . . . . . 11,500 106,901Towa Corp. . . . . . . . . . . . . . . . . . . . . . . . . . . . . . . . . . . . . . . 8,000 76,139Towa Pharmaceutical Co., Ltd. . . . . . . . . . . . . . . . . . . . . . . . . . . 2,800 207,457Toyo Construction Co., Ltd. . . . . . . . . . . . . . . . . . . . . . . . . . . . . 25,499 103,904Toyo Corp. . . . . . . . . . . . . . . . . . . . . . . . . . . . . . . . . . . . . . . 9,600 78,345Toyo Denki Seizo KK . . . . . . . . . . . . . . . . . . . . . . . . . . . . . . . . 3,200 50,048Toyo Engineering Corp. (b) (e) . . . . . . . . . . . . . . . . . . . . . . . . . 7,600 60,629Toyo Ink SC Holdings Co., Ltd. . . . . . . . . . . . . . . . . . . . . . . . . . . 15,200 408,561Toyo Kanetsu KK . . . . . . . . . . . . . . . . . . . . . . . . . . . . . . . . . . 3,800 95,621Toyo Machinery & Metal Co., Ltd. . . . . . . . . . . . . . . . . . . . . . . . 6,000 40,458Toyo Securities Co., Ltd. . . . . . . . . . . . . . . . . . . . . . . . . . . . . . . 23,000 54,263Toyo Sugar Refining Co., Ltd. . . . . . . . . . . . . . . . . . . . . . . . . . . 900 9,746Toyo Tanso Co., Ltd. . . . . . . . . . . . . . . . . . . . . . . . . . . . . . . . . 4,600 136,429Toyo Tire & Rubber Co., Ltd. . . . . . . . . . . . . . . . . . . . . . . . . . . . 12,100 218,055Toyo Wharf & Warehouse Co., Ltd. . . . . . . . . . . . . . . . . . . . . . . . 2,500 37,958Toyobo Co., Ltd. . . . . . . . . . . . . . . . . . . . . . . . . . . . . . . . . . . . 33,200 563,482TPR Co., Ltd. . . . . . . . . . . . . . . . . . . . . . . . . . . . . . . . . . . . . . 7,300 193,108Trancom Co., Ltd. . . . . . . . . . . . . . . . . . . . . . . . . . . . . . . . . . . 2,300 168,212Transaction Co., Ltd. . . . . . . . . . . . . . . . . . . . . . . . . . . . . . . . . 1,400 9,661
Security Description Shares Value
Japan—(Continued)Tri Chemical Laboratories, Inc. . . . . . . . . . . . . . . . . . . . . . . . . . 1,000 $ 41,672Trusco Nakayama Corp. . . . . . . . . . . . . . . . . . . . . . . . . . . . . . . 12,600 348,642Trust Tech, Inc. . . . . . . . . . . . . . . . . . . . . . . . . . . . . . . . . . . . . 3,000 116,686TSI Holdings Co., Ltd. . . . . . . . . . . . . . . . . . . . . . . . . . . . . . . . 28,205 205,585Tsubaki Nakashima Co., Ltd. . . . . . . . . . . . . . . . . . . . . . . . . . . . 3,700 76,257Tsubakimoto Chain Co. . . . . . . . . . . . . . . . . . . . . . . . . . . . . . . 9,000 416,635Tsubakimoto Kogyo Co., Ltd. . . . . . . . . . . . . . . . . . . . . . . . . . . . 1,600 48,539Tsudakoma Corp. (b) . . . . . . . . . . . . . . . . . . . . . . . . . . . . . . . . 1,600 31,314Tsugami Corp. . . . . . . . . . . . . . . . . . . . . . . . . . . . . . . . . . . . . 17,000 168,311Tsukada Global Holdings, Inc. . . . . . . . . . . . . . . . . . . . . . . . . . . 7,200 41,178Tsukamoto Corp. Co., Ltd. . . . . . . . . . . . . . . . . . . . . . . . . . . . . 2,100 23,137Tsukishima Kikai Co., Ltd. . . . . . . . . . . . . . . . . . . . . . . . . . . . . 8,600 118,829Tsukuba Bank, Ltd. . . . . . . . . . . . . . . . . . . . . . . . . . . . . . . . . . 34,500 83,497Tsukui Corp. . . . . . . . . . . . . . . . . . . . . . . . . . . . . . . . . . . . . . 18,800 184,429Tsurumi Manufacturing Co., Ltd. . . . . . . . . . . . . . . . . . . . . . . . . 6,100 100,676Tsutsumi Jewelry Co., Ltd. . . . . . . . . . . . . . . . . . . . . . . . . . . . . 3,200 61,776TTK Co., Ltd. (b) . . . . . . . . . . . . . . . . . . . . . . . . . . . . . . . . . . . 4,000 32,398TV Asahi Holdings Corp. . . . . . . . . . . . . . . . . . . . . . . . . . . . . . . 600 11,522TV Tokyo Holdings Corp. . . . . . . . . . . . . . . . . . . . . . . . . . . . . . 3,700 91,677TYK Corp. . . . . . . . . . . . . . . . . . . . . . . . . . . . . . . . . . . . . . . . 6,000 26,145U-Shin, Ltd. (b) . . . . . . . . . . . . . . . . . . . . . . . . . . . . . . . . . . . 8,400 57,518UACJ Corp. . . . . . . . . . . . . . . . . . . . . . . . . . . . . . . . . . . . . . . 10,685 255,933Uchida Yoko Co., Ltd. . . . . . . . . . . . . . . . . . . . . . . . . . . . . . . . 4,200 114,218Ueki Corp. . . . . . . . . . . . . . . . . . . . . . . . . . . . . . . . . . . . . . . 1,100 25,861UKC Holdings Corp. . . . . . . . . . . . . . . . . . . . . . . . . . . . . . . . . . 5,000 115,276Ulvac, Inc. . . . . . . . . . . . . . . . . . . . . . . . . . . . . . . . . . . . . . . . 6,700 251,482UMC Electronics Co., Ltd. . . . . . . . . . . . . . . . . . . . . . . . . . . . . . 700 13,575Umenohana Co., Ltd. . . . . . . . . . . . . . . . . . . . . . . . . . . . . . . . . 600 14,316Uniden Holdings Corp. . . . . . . . . . . . . . . . . . . . . . . . . . . . . . . . 2,500 63,811Union Tool Co. . . . . . . . . . . . . . . . . . . . . . . . . . . . . . . . . . . . . 3,400 127,170Unipres Corp. . . . . . . . . . . . . . . . . . . . . . . . . . . . . . . . . . . . . 13,900 270,304United Arrows, Ltd. . . . . . . . . . . . . . . . . . . . . . . . . . . . . . . . . . 6,000 255,258United Super Markets Holdings, Inc. . . . . . . . . . . . . . . . . . . . . . . 20,700 257,601UNITED, Inc. . . . . . . . . . . . . . . . . . . . . . . . . . . . . . . . . . . . . . 2,200 54,462Unitika, Ltd. (b) . . . . . . . . . . . . . . . . . . . . . . . . . . . . . . . . . . . 15,600 99,428Unizo Holdings Co., Ltd. (e) . . . . . . . . . . . . . . . . . . . . . . . . . . . 6,000 115,664Usen-Next Holdings Co., Ltd. (b) . . . . . . . . . . . . . . . . . . . . . . . . 2,700 34,443Ushio, Inc. . . . . . . . . . . . . . . . . . . . . . . . . . . . . . . . . . . . . . . . 39,000 534,756UT Group Co., Ltd. (b) . . . . . . . . . . . . . . . . . . . . . . . . . . . . . . . 7,600 271,218Utoc Corp. . . . . . . . . . . . . . . . . . . . . . . . . . . . . . . . . . . . . . . . 5,100 24,107Uzabase, Inc. (b) . . . . . . . . . . . . . . . . . . . . . . . . . . . . . . . . . . 1,200 34,462V Technology Co., Ltd. (e) . . . . . . . . . . . . . . . . . . . . . . . . . . . . 800 120,018V-Cube, Inc. (b) . . . . . . . . . . . . . . . . . . . . . . . . . . . . . . . . . . . 2,100 11,720Valor Holdings Co., Ltd. . . . . . . . . . . . . . . . . . . . . . . . . . . . . . . 11,800 272,920ValueCommerce Co., Ltd. . . . . . . . . . . . . . . . . . . . . . . . . . . . . . 3,200 69,732Vector, Inc. . . . . . . . . . . . . . . . . . . . . . . . . . . . . . . . . . . . . . . 4,800 113,376VeriServe Corp. . . . . . . . . . . . . . . . . . . . . . . . . . . . . . . . . . . . 500 22,388VIA Holdings, Inc. (b) . . . . . . . . . . . . . . . . . . . . . . . . . . . . . . . 1,600 10,140Village Vanguard Co., Ltd. . . . . . . . . . . . . . . . . . . . . . . . . . . . . 2,300 21,436VINX Corp. . . . . . . . . . . . . . . . . . . . . . . . . . . . . . . . . . . . . . . 1,000 12,682Vision, Inc. (b) . . . . . . . . . . . . . . . . . . . . . . . . . . . . . . . . . . . . 1,400 62,223Vital KSK Holdings, Inc. . . . . . . . . . . . . . . . . . . . . . . . . . . . . . . 14,200 160,117Vitec Holdings Co., Ltd. . . . . . . . . . . . . . . . . . . . . . . . . . . . . . . 3,700 83,680Voyage Group, Inc. . . . . . . . . . . . . . . . . . . . . . . . . . . . . . . . . . 1,500 20,583VT Holdings Co., Ltd. . . . . . . . . . . . . . . . . . . . . . . . . . . . . . . . . 24,300 107,373Wacoal Holdings Corp. . . . . . . . . . . . . . . . . . . . . . . . . . . . . . . . 14,500 415,123Wacom Co., Ltd. . . . . . . . . . . . . . . . . . . . . . . . . . . . . . . . . . . . 15,000 63,895
BHFTII-87
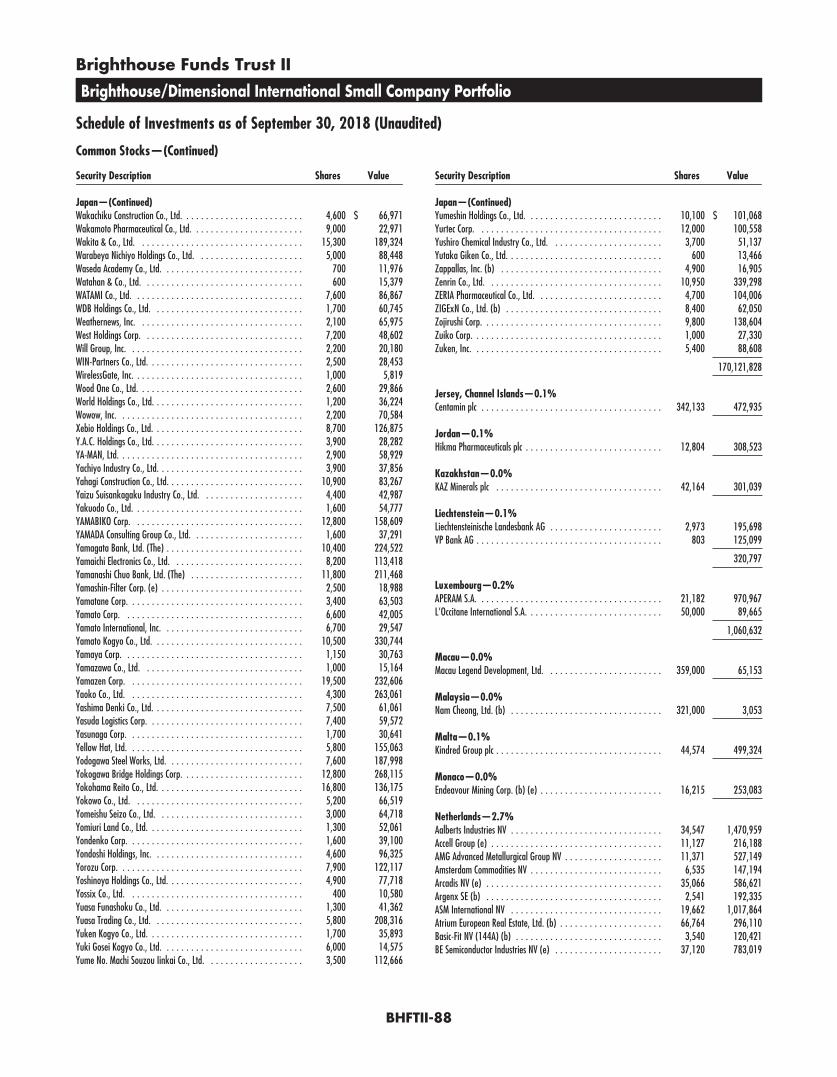
Brighthouse Funds Trust II
Brighthouse/Dimensional International Small Company Portfolio
Schedule of Investments as of September 30, 2018 (Unaudited)
Common Stocks—(Continued)
Security Description Shares Value
Japan—(Continued)Wakachiku Construction Co., Ltd. . . . . . . . . . . . . . . . . . . . . . . . . 4,600 $ 66,971Wakamoto Pharmaceutical Co., Ltd. . . . . . . . . . . . . . . . . . . . . . . 9,000 22,971Wakita & Co., Ltd. . . . . . . . . . . . . . . . . . . . . . . . . . . . . . . . . . 15,300 189,324Warabeya Nichiyo Holdings Co., Ltd. . . . . . . . . . . . . . . . . . . . . . 5,000 88,448Waseda Academy Co., Ltd. . . . . . . . . . . . . . . . . . . . . . . . . . . . . 700 11,976Watahan & Co., Ltd. . . . . . . . . . . . . . . . . . . . . . . . . . . . . . . . . 600 15,379WATAMI Co., Ltd. . . . . . . . . . . . . . . . . . . . . . . . . . . . . . . . . . . 7,600 86,867WDB Holdings Co., Ltd. . . . . . . . . . . . . . . . . . . . . . . . . . . . . . . 1,700 60,745Weathernews, Inc. . . . . . . . . . . . . . . . . . . . . . . . . . . . . . . . . . 2,100 65,975West Holdings Corp. . . . . . . . . . . . . . . . . . . . . . . . . . . . . . . . . 7,200 48,602Will Group, Inc. . . . . . . . . . . . . . . . . . . . . . . . . . . . . . . . . . . . 2,200 20,180WIN-Partners Co., Ltd. . . . . . . . . . . . . . . . . . . . . . . . . . . . . . . . 2,500 28,453WirelessGate, Inc. . . . . . . . . . . . . . . . . . . . . . . . . . . . . . . . . . . 1,000 5,819Wood One Co., Ltd. . . . . . . . . . . . . . . . . . . . . . . . . . . . . . . . . . 2,600 29,866World Holdings Co., Ltd. . . . . . . . . . . . . . . . . . . . . . . . . . . . . . . 1,200 36,224Wowow, Inc. . . . . . . . . . . . . . . . . . . . . . . . . . . . . . . . . . . . . . 2,200 70,584Xebio Holdings Co., Ltd. . . . . . . . . . . . . . . . . . . . . . . . . . . . . . . 8,700 126,875Y.A.C. Holdings Co., Ltd. . . . . . . . . . . . . . . . . . . . . . . . . . . . . . . 3,900 28,282YA-MAN, Ltd. . . . . . . . . . . . . . . . . . . . . . . . . . . . . . . . . . . . . . 2,900 58,929Yachiyo Industry Co., Ltd. . . . . . . . . . . . . . . . . . . . . . . . . . . . . . 3,900 37,856Yahagi Construction Co., Ltd. . . . . . . . . . . . . . . . . . . . . . . . . . . . 10,900 83,267Yaizu Suisankagaku Industry Co., Ltd. . . . . . . . . . . . . . . . . . . . . 4,400 42,987Yakuodo Co., Ltd. . . . . . . . . . . . . . . . . . . . . . . . . . . . . . . . . . . 1,600 54,777YAMABIKO Corp. . . . . . . . . . . . . . . . . . . . . . . . . . . . . . . . . . . 12,800 158,609YAMADA Consulting Group Co., Ltd. . . . . . . . . . . . . . . . . . . . . . . 1,600 37,291Yamagata Bank, Ltd. (The) . . . . . . . . . . . . . . . . . . . . . . . . . . . . 10,400 224,522Yamaichi Electronics Co., Ltd. . . . . . . . . . . . . . . . . . . . . . . . . . . 8,200 113,418Yamanashi Chuo Bank, Ltd. (The) . . . . . . . . . . . . . . . . . . . . . . . 11,800 211,468Yamashin-Filter Corp. (e) . . . . . . . . . . . . . . . . . . . . . . . . . . . . . 2,500 18,988Yamatane Corp. . . . . . . . . . . . . . . . . . . . . . . . . . . . . . . . . . . . 3,400 63,503Yamato Corp. . . . . . . . . . . . . . . . . . . . . . . . . . . . . . . . . . . . . 6,600 42,005Yamato International, Inc. . . . . . . . . . . . . . . . . . . . . . . . . . . . . 6,700 29,547Yamato Kogyo Co., Ltd. . . . . . . . . . . . . . . . . . . . . . . . . . . . . . . 10,500 330,744Yamaya Corp. . . . . . . . . . . . . . . . . . . . . . . . . . . . . . . . . . . . . 1,150 30,763Yamazawa Co., Ltd. . . . . . . . . . . . . . . . . . . . . . . . . . . . . . . . . 1,000 15,164Yamazen Corp. . . . . . . . . . . . . . . . . . . . . . . . . . . . . . . . . . . . 19,500 232,606Yaoko Co., Ltd. . . . . . . . . . . . . . . . . . . . . . . . . . . . . . . . . . . . 4,300 263,061Yashima Denki Co., Ltd. . . . . . . . . . . . . . . . . . . . . . . . . . . . . . . 7,500 61,061Yasuda Logistics Corp. . . . . . . . . . . . . . . . . . . . . . . . . . . . . . . . 7,400 59,572Yasunaga Corp. . . . . . . . . . . . . . . . . . . . . . . . . . . . . . . . . . . . 1,700 30,641Yellow Hat, Ltd. . . . . . . . . . . . . . . . . . . . . . . . . . . . . . . . . . . . 5,800 155,063Yodogawa Steel Works, Ltd. . . . . . . . . . . . . . . . . . . . . . . . . . . . 7,600 187,998Yokogawa Bridge Holdings Corp. . . . . . . . . . . . . . . . . . . . . . . . . 12,800 268,115Yokohama Reito Co., Ltd. . . . . . . . . . . . . . . . . . . . . . . . . . . . . . 16,800 136,175Yokowo Co., Ltd. . . . . . . . . . . . . . . . . . . . . . . . . . . . . . . . . . . 5,200 66,519Yomeishu Seizo Co., Ltd. . . . . . . . . . . . . . . . . . . . . . . . . . . . . . 3,000 64,718Yomiuri Land Co., Ltd. . . . . . . . . . . . . . . . . . . . . . . . . . . . . . . . 1,300 52,061Yondenko Corp. . . . . . . . . . . . . . . . . . . . . . . . . . . . . . . . . . . . 1,600 39,100Yondoshi Holdings, Inc. . . . . . . . . . . . . . . . . . . . . . . . . . . . . . . 4,600 96,325Yorozu Corp. . . . . . . . . . . . . . . . . . . . . . . . . . . . . . . . . . . . . . 7,900 122,117Yoshinoya Holdings Co., Ltd. . . . . . . . . . . . . . . . . . . . . . . . . . . . 4,900 77,718Yossix Co., Ltd. . . . . . . . . . . . . . . . . . . . . . . . . . . . . . . . . . . . 400 10,580Yuasa Funashoku Co., Ltd. . . . . . . . . . . . . . . . . . . . . . . . . . . . . 1,300 41,362Yuasa Trading Co., Ltd. . . . . . . . . . . . . . . . . . . . . . . . . . . . . . . 5,800 208,316Yuken Kogyo Co., Ltd. . . . . . . . . . . . . . . . . . . . . . . . . . . . . . . . 1,700 35,893Yuki Gosei Kogyo Co., Ltd. . . . . . . . . . . . . . . . . . . . . . . . . . . . . 6,000 14,575Yume No. Machi Souzou Iinkai Co., Ltd. . . . . . . . . . . . . . . . . . . . 3,500 112,666
Security Description Shares Value
Japan—(Continued)Yumeshin Holdings Co., Ltd. . . . . . . . . . . . . . . . . . . . . . . . . . . . 10,100 $ 101,068Yurtec Corp. . . . . . . . . . . . . . . . . . . . . . . . . . . . . . . . . . . . . . 12,000 100,558Yushiro Chemical Industry Co., Ltd. . . . . . . . . . . . . . . . . . . . . . . 3,700 51,137Yutaka Giken Co., Ltd. . . . . . . . . . . . . . . . . . . . . . . . . . . . . . . . 600 13,466Zappallas, Inc. (b) . . . . . . . . . . . . . . . . . . . . . . . . . . . . . . . . . 4,900 16,905Zenrin Co., Ltd. . . . . . . . . . . . . . . . . . . . . . . . . . . . . . . . . . . . 10,950 339,298ZERIA Pharmaceutical Co., Ltd. . . . . . . . . . . . . . . . . . . . . . . . . . 4,700 104,006ZIGExN Co., Ltd. (b) . . . . . . . . . . . . . . . . . . . . . . . . . . . . . . . . 8,400 62,050Zojirushi Corp. . . . . . . . . . . . . . . . . . . . . . . . . . . . . . . . . . . . . 9,800 138,604Zuiko Corp. . . . . . . . . . . . . . . . . . . . . . . . . . . . . . . . . . . . . . . 1,000 27,330Zuken, Inc. . . . . . . . . . . . . . . . . . . . . . . . . . . . . . . . . . . . . . . 5,400 88,608
170,121,828
Jersey, Channel Islands—0.1%Centamin plc . . . . . . . . . . . . . . . . . . . . . . . . . . . . . . . . . . . . . 342,133 472,935
Jordan—0.1%Hikma Pharmaceuticals plc . . . . . . . . . . . . . . . . . . . . . . . . . . . . 12,804 308,523
Kazakhstan—0.0%KAZ Minerals plc . . . . . . . . . . . . . . . . . . . . . . . . . . . . . . . . . . 42,164 301,039
Liechtenstein—0.1%Liechtensteinische Landesbank AG . . . . . . . . . . . . . . . . . . . . . . . 2,973 195,698VP Bank AG . . . . . . . . . . . . . . . . . . . . . . . . . . . . . . . . . . . . . . 803 125,099
320,797
Luxembourg—0.2%APERAM S.A. . . . . . . . . . . . . . . . . . . . . . . . . . . . . . . . . . . . . . 21,182 970,967L’Occitane International S.A. . . . . . . . . . . . . . . . . . . . . . . . . . . . 50,000 89,665
1,060,632
Macau—0.0%Macau Legend Development, Ltd. . . . . . . . . . . . . . . . . . . . . . . . 359,000 65,153
Malaysia—0.0%Nam Cheong, Ltd. (b) . . . . . . . . . . . . . . . . . . . . . . . . . . . . . . . 321,000 3,053
Malta—0.1%Kindred Group plc . . . . . . . . . . . . . . . . . . . . . . . . . . . . . . . . . . 44,574 499,324
Monaco—0.0%Endeavour Mining Corp. (b) (e) . . . . . . . . . . . . . . . . . . . . . . . . . 16,215 253,083
Netherlands—2.7%Aalberts Industries NV . . . . . . . . . . . . . . . . . . . . . . . . . . . . . . . 34,547 1,470,959Accell Group (e) . . . . . . . . . . . . . . . . . . . . . . . . . . . . . . . . . . . 11,127 216,188AMG Advanced Metallurgical Group NV . . . . . . . . . . . . . . . . . . . . 11,371 527,149Amsterdam Commodities NV . . . . . . . . . . . . . . . . . . . . . . . . . . . 6,535 147,194Arcadis NV (e) . . . . . . . . . . . . . . . . . . . . . . . . . . . . . . . . . . . . 35,066 586,621Argenx SE (b) . . . . . . . . . . . . . . . . . . . . . . . . . . . . . . . . . . . . 2,541 192,335ASM International NV . . . . . . . . . . . . . . . . . . . . . . . . . . . . . . . 19,662 1,017,864Atrium European Real Estate, Ltd. (b) . . . . . . . . . . . . . . . . . . . . . 66,764 296,110Basic-Fit NV (144A) (b) . . . . . . . . . . . . . . . . . . . . . . . . . . . . . . 3,540 120,421BE Semiconductor Industries NV (e) . . . . . . . . . . . . . . . . . . . . . . 37,120 783,019
BHFTII-88
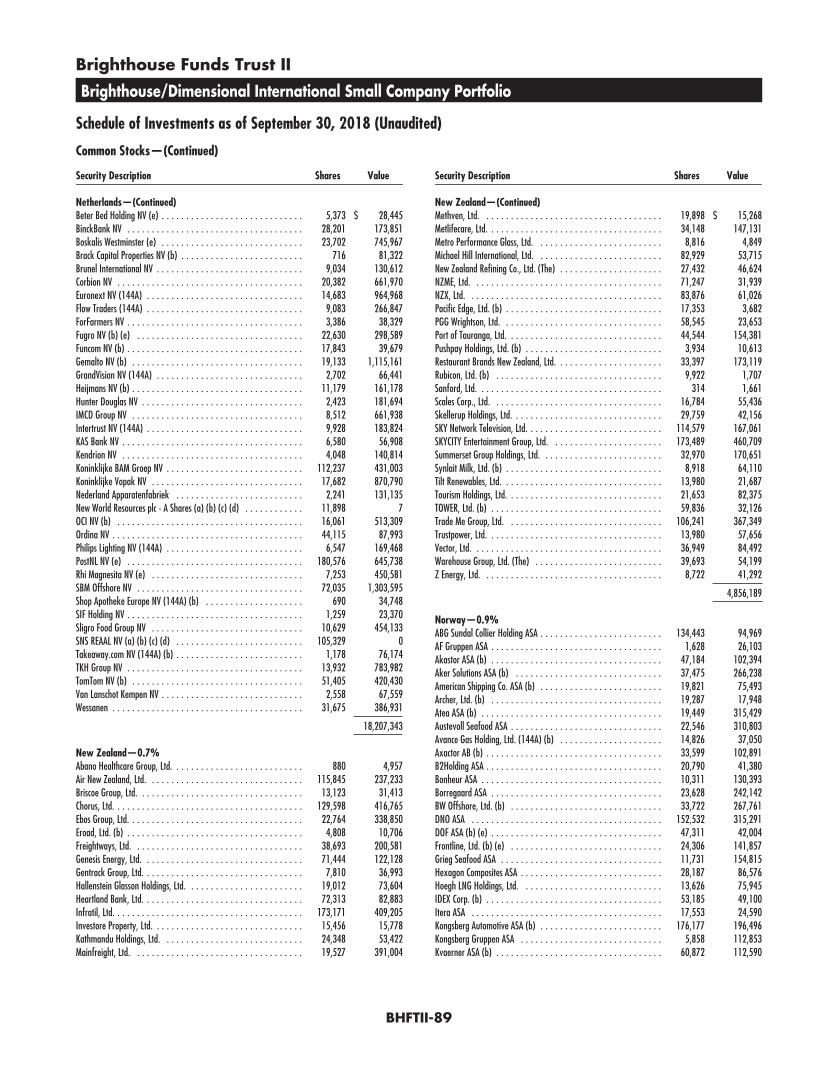
Brighthouse Funds Trust II
Brighthouse/Dimensional International Small Company Portfolio
Schedule of Investments as of September 30, 2018 (Unaudited)
Common Stocks—(Continued)
Security Description Shares Value
Netherlands—(Continued)Beter Bed Holding NV (e) . . . . . . . . . . . . . . . . . . . . . . . . . . . . . 5,373 $ 28,445BinckBank NV . . . . . . . . . . . . . . . . . . . . . . . . . . . . . . . . . . . . 28,201 173,851Boskalis Westminster (e) . . . . . . . . . . . . . . . . . . . . . . . . . . . . . 23,702 745,967Brack Capital Properties NV (b) . . . . . . . . . . . . . . . . . . . . . . . . . 716 81,322Brunel International NV . . . . . . . . . . . . . . . . . . . . . . . . . . . . . . 9,034 130,612Corbion NV . . . . . . . . . . . . . . . . . . . . . . . . . . . . . . . . . . . . . . 20,382 661,970Euronext NV (144A) . . . . . . . . . . . . . . . . . . . . . . . . . . . . . . . . 14,683 964,968Flow Traders (144A) . . . . . . . . . . . . . . . . . . . . . . . . . . . . . . . . 9,083 266,847ForFarmers NV . . . . . . . . . . . . . . . . . . . . . . . . . . . . . . . . . . . . 3,386 38,329Fugro NV (b) (e) . . . . . . . . . . . . . . . . . . . . . . . . . . . . . . . . . . 22,630 298,589Funcom NV (b) . . . . . . . . . . . . . . . . . . . . . . . . . . . . . . . . . . . . 17,843 39,679Gemalto NV (b) . . . . . . . . . . . . . . . . . . . . . . . . . . . . . . . . . . . 19,133 1,115,161GrandVision NV (144A) . . . . . . . . . . . . . . . . . . . . . . . . . . . . . . 2,702 66,441Heijmans NV (b) . . . . . . . . . . . . . . . . . . . . . . . . . . . . . . . . . . . 11,179 161,178Hunter Douglas NV . . . . . . . . . . . . . . . . . . . . . . . . . . . . . . . . . 2,423 181,694IMCD Group NV . . . . . . . . . . . . . . . . . . . . . . . . . . . . . . . . . . . 8,512 661,938Intertrust NV (144A) . . . . . . . . . . . . . . . . . . . . . . . . . . . . . . . . 9,928 183,824KAS Bank NV . . . . . . . . . . . . . . . . . . . . . . . . . . . . . . . . . . . . . 6,580 56,908Kendrion NV . . . . . . . . . . . . . . . . . . . . . . . . . . . . . . . . . . . . . 4,048 140,814Koninklijke BAM Groep NV . . . . . . . . . . . . . . . . . . . . . . . . . . . . 112,237 431,003Koninklijke Vopak NV . . . . . . . . . . . . . . . . . . . . . . . . . . . . . . . 17,682 870,790Nederland Apparatenfabriek . . . . . . . . . . . . . . . . . . . . . . . . . . 2,241 131,135New World Resources plc - A Shares (a) (b) (c) (d) . . . . . . . . . . . . 11,898 7OCI NV (b) . . . . . . . . . . . . . . . . . . . . . . . . . . . . . . . . . . . . . . 16,061 513,309Ordina NV . . . . . . . . . . . . . . . . . . . . . . . . . . . . . . . . . . . . . . . 44,115 87,993Philips Lighting NV (144A) . . . . . . . . . . . . . . . . . . . . . . . . . . . . 6,547 169,468PostNL NV (e) . . . . . . . . . . . . . . . . . . . . . . . . . . . . . . . . . . . . 180,576 645,738Rhi Magnesita NV (e) . . . . . . . . . . . . . . . . . . . . . . . . . . . . . . . 7,253 450,581SBM Offshore NV . . . . . . . . . . . . . . . . . . . . . . . . . . . . . . . . . . 72,035 1,303,595Shop Apotheke Europe NV (144A) (b) . . . . . . . . . . . . . . . . . . . . 690 34,748SIF Holding NV . . . . . . . . . . . . . . . . . . . . . . . . . . . . . . . . . . . . 1,259 23,370Sligro Food Group NV . . . . . . . . . . . . . . . . . . . . . . . . . . . . . . . 10,629 454,133SNS REAAL NV (a) (b) (c) (d) . . . . . . . . . . . . . . . . . . . . . . . . . . 105,329 0Takeaway.com NV (144A) (b) . . . . . . . . . . . . . . . . . . . . . . . . . . 1,178 76,174TKH Group NV . . . . . . . . . . . . . . . . . . . . . . . . . . . . . . . . . . . . 13,932 783,982TomTom NV (b) . . . . . . . . . . . . . . . . . . . . . . . . . . . . . . . . . . . 51,405 420,430Van Lanschot Kempen NV . . . . . . . . . . . . . . . . . . . . . . . . . . . . . 2,558 67,559Wessanen . . . . . . . . . . . . . . . . . . . . . . . . . . . . . . . . . . . . . . . 31,675 386,931
18,207,343
New Zealand—0.7%Abano Healthcare Group, Ltd. . . . . . . . . . . . . . . . . . . . . . . . . . . 880 4,957Air New Zealand, Ltd. . . . . . . . . . . . . . . . . . . . . . . . . . . . . . . . 115,845 237,233Briscoe Group, Ltd. . . . . . . . . . . . . . . . . . . . . . . . . . . . . . . . . . 13,123 31,413Chorus, Ltd. . . . . . . . . . . . . . . . . . . . . . . . . . . . . . . . . . . . . . . 129,598 416,765Ebos Group, Ltd. . . . . . . . . . . . . . . . . . . . . . . . . . . . . . . . . . . . 22,764 338,850Eroad, Ltd. (b) . . . . . . . . . . . . . . . . . . . . . . . . . . . . . . . . . . . . 4,808 10,706Freightways, Ltd. . . . . . . . . . . . . . . . . . . . . . . . . . . . . . . . . . . 38,693 200,581Genesis Energy, Ltd. . . . . . . . . . . . . . . . . . . . . . . . . . . . . . . . . 71,444 122,128Gentrack Group, Ltd. . . . . . . . . . . . . . . . . . . . . . . . . . . . . . . . . 7,810 36,993Hallenstein Glasson Holdings, Ltd. . . . . . . . . . . . . . . . . . . . . . . . 19,012 73,604Heartland Bank, Ltd. . . . . . . . . . . . . . . . . . . . . . . . . . . . . . . . . 72,313 82,883Infratil, Ltd. . . . . . . . . . . . . . . . . . . . . . . . . . . . . . . . . . . . . . . 173,171 409,205Investore Property, Ltd. . . . . . . . . . . . . . . . . . . . . . . . . . . . . . . 15,456 15,778Kathmandu Holdings, Ltd. . . . . . . . . . . . . . . . . . . . . . . . . . . . . 24,348 53,422Mainfreight, Ltd. . . . . . . . . . . . . . . . . . . . . . . . . . . . . . . . . . . 19,527 391,004
Security Description Shares Value
New Zealand—(Continued)Methven, Ltd. . . . . . . . . . . . . . . . . . . . . . . . . . . . . . . . . . . . . 19,898 $ 15,268Metlifecare, Ltd. . . . . . . . . . . . . . . . . . . . . . . . . . . . . . . . . . . . 34,148 147,131Metro Performance Glass, Ltd. . . . . . . . . . . . . . . . . . . . . . . . . . 8,816 4,849Michael Hill International, Ltd. . . . . . . . . . . . . . . . . . . . . . . . . . 82,929 53,715New Zealand Refining Co., Ltd. (The) . . . . . . . . . . . . . . . . . . . . . 27,432 46,624NZME, Ltd. . . . . . . . . . . . . . . . . . . . . . . . . . . . . . . . . . . . . . . 71,247 31,939NZX, Ltd. . . . . . . . . . . . . . . . . . . . . . . . . . . . . . . . . . . . . . . . 83,876 61,026Pacific Edge, Ltd. (b) . . . . . . . . . . . . . . . . . . . . . . . . . . . . . . . . 17,353 3,682PGG Wrightson, Ltd. . . . . . . . . . . . . . . . . . . . . . . . . . . . . . . . . 58,545 23,653Port of Tauranga, Ltd. . . . . . . . . . . . . . . . . . . . . . . . . . . . . . . . 44,544 154,381Pushpay Holdings, Ltd. (b) . . . . . . . . . . . . . . . . . . . . . . . . . . . . 3,934 10,613Restaurant Brands New Zealand, Ltd. . . . . . . . . . . . . . . . . . . . . . 33,397 173,119Rubicon, Ltd. (b) . . . . . . . . . . . . . . . . . . . . . . . . . . . . . . . . . . 9,922 1,707Sanford, Ltd. . . . . . . . . . . . . . . . . . . . . . . . . . . . . . . . . . . . . . 314 1,661Scales Corp., Ltd. . . . . . . . . . . . . . . . . . . . . . . . . . . . . . . . . . . 16,784 55,436Skellerup Holdings, Ltd. . . . . . . . . . . . . . . . . . . . . . . . . . . . . . . 29,759 42,156SKY Network Television, Ltd. . . . . . . . . . . . . . . . . . . . . . . . . . . . 114,579 167,061SKYCITY Entertainment Group, Ltd. . . . . . . . . . . . . . . . . . . . . . . 173,489 460,709Summerset Group Holdings, Ltd. . . . . . . . . . . . . . . . . . . . . . . . . 32,970 170,651Synlait Milk, Ltd. (b) . . . . . . . . . . . . . . . . . . . . . . . . . . . . . . . . 8,918 64,110Tilt Renewables, Ltd. . . . . . . . . . . . . . . . . . . . . . . . . . . . . . . . . 13,980 21,687Tourism Holdings, Ltd. . . . . . . . . . . . . . . . . . . . . . . . . . . . . . . . 21,653 82,375TOWER, Ltd. (b) . . . . . . . . . . . . . . . . . . . . . . . . . . . . . . . . . . . 59,836 32,126Trade Me Group, Ltd. . . . . . . . . . . . . . . . . . . . . . . . . . . . . . . . 106,241 367,349Trustpower, Ltd. . . . . . . . . . . . . . . . . . . . . . . . . . . . . . . . . . . . 13,980 57,656Vector, Ltd. . . . . . . . . . . . . . . . . . . . . . . . . . . . . . . . . . . . . . . 36,949 84,492Warehouse Group, Ltd. (The) . . . . . . . . . . . . . . . . . . . . . . . . . . 39,693 54,199Z Energy, Ltd. . . . . . . . . . . . . . . . . . . . . . . . . . . . . . . . . . . . . 8,722 41,292
4,856,189
Norway—0.9%ABG Sundal Collier Holding ASA . . . . . . . . . . . . . . . . . . . . . . . . . 134,443 94,969AF Gruppen ASA . . . . . . . . . . . . . . . . . . . . . . . . . . . . . . . . . . . 1,628 26,103Akastor ASA (b) . . . . . . . . . . . . . . . . . . . . . . . . . . . . . . . . . . . 47,184 102,394Aker Solutions ASA (b) . . . . . . . . . . . . . . . . . . . . . . . . . . . . . . 37,475 266,238American Shipping Co. ASA (b) . . . . . . . . . . . . . . . . . . . . . . . . . 19,821 75,493Archer, Ltd. (b) . . . . . . . . . . . . . . . . . . . . . . . . . . . . . . . . . . . 19,287 17,948Atea ASA (b) . . . . . . . . . . . . . . . . . . . . . . . . . . . . . . . . . . . . . 19,449 315,429Austevoll Seafood ASA . . . . . . . . . . . . . . . . . . . . . . . . . . . . . . . 22,546 310,803Avance Gas Holding, Ltd. (144A) (b) . . . . . . . . . . . . . . . . . . . . . 14,826 37,050Axactor AB (b) . . . . . . . . . . . . . . . . . . . . . . . . . . . . . . . . . . . . 33,599 102,891B2Holding ASA . . . . . . . . . . . . . . . . . . . . . . . . . . . . . . . . . . . . 20,790 41,380Bonheur ASA . . . . . . . . . . . . . . . . . . . . . . . . . . . . . . . . . . . . . 10,311 130,393Borregaard ASA . . . . . . . . . . . . . . . . . . . . . . . . . . . . . . . . . . . 23,628 242,142BW Offshore, Ltd. (b) . . . . . . . . . . . . . . . . . . . . . . . . . . . . . . . 33,722 267,761DNO ASA . . . . . . . . . . . . . . . . . . . . . . . . . . . . . . . . . . . . . . . 152,532 315,291DOF ASA (b) (e) . . . . . . . . . . . . . . . . . . . . . . . . . . . . . . . . . . . 47,311 42,004Frontline, Ltd. (b) (e) . . . . . . . . . . . . . . . . . . . . . . . . . . . . . . . 24,306 141,857Grieg Seafood ASA . . . . . . . . . . . . . . . . . . . . . . . . . . . . . . . . . 11,731 154,815Hexagon Composites ASA . . . . . . . . . . . . . . . . . . . . . . . . . . . . . 28,187 86,576Hoegh LNG Holdings, Ltd. . . . . . . . . . . . . . . . . . . . . . . . . . . . . 13,626 75,945IDEX Corp. (b) . . . . . . . . . . . . . . . . . . . . . . . . . . . . . . . . . . . . 53,185 49,100Itera ASA . . . . . . . . . . . . . . . . . . . . . . . . . . . . . . . . . . . . . . . 17,553 24,590Kongsberg Automotive ASA (b) . . . . . . . . . . . . . . . . . . . . . . . . . 176,177 196,496Kongsberg Gruppen ASA . . . . . . . . . . . . . . . . . . . . . . . . . . . . . 5,858 112,853Kvaerner ASA (b) . . . . . . . . . . . . . . . . . . . . . . . . . . . . . . . . . . 60,872 112,590
BHFTII-89

Brighthouse Funds Trust II
Brighthouse/Dimensional International Small Company Portfolio
Schedule of Investments as of September 30, 2018 (Unaudited)
Common Stocks—(Continued)
Security Description Shares Value
Norway—(Continued)NEL ASA (b) (e) . . . . . . . . . . . . . . . . . . . . . . . . . . . . . . . . . . . 221,285 $ 105,227Nordic Nanovector ASA (b) . . . . . . . . . . . . . . . . . . . . . . . . . . . . 7,828 49,926Nordic Semiconductor ASA (b) . . . . . . . . . . . . . . . . . . . . . . . . . . 36,041 208,190Norway Royal Salmon ASA . . . . . . . . . . . . . . . . . . . . . . . . . . . . 3,880 93,637Norwegian Air Shuttle ASA (b) (e) . . . . . . . . . . . . . . . . . . . . . . . 8,756 263,667Norwegian Finans Holding ASA (b) . . . . . . . . . . . . . . . . . . . . . . . 10,170 124,335Norwegian Property ASA . . . . . . . . . . . . . . . . . . . . . . . . . . . . . 23,988 31,697Ocean Yield ASA . . . . . . . . . . . . . . . . . . . . . . . . . . . . . . . . . . . 12,183 99,692Odfjell Drilling, Ltd. (b) . . . . . . . . . . . . . . . . . . . . . . . . . . . . . . 15,318 67,753Odfjell SE - A Shares . . . . . . . . . . . . . . . . . . . . . . . . . . . . . . . . 1,949 7,465Olav Thon Eiendomsselskap ASA . . . . . . . . . . . . . . . . . . . . . . . . 1,135 20,834Otello Corp. ASA (b) . . . . . . . . . . . . . . . . . . . . . . . . . . . . . . . . 21,316 46,461Panoro Energy ASA (b) . . . . . . . . . . . . . . . . . . . . . . . . . . . . . . 16,444 46,264Petroleum Geo-Services ASA (b) . . . . . . . . . . . . . . . . . . . . . . . . 73,446 330,328PhotoCure ASA (b) . . . . . . . . . . . . . . . . . . . . . . . . . . . . . . . . . 5,477 37,953ProSafe SE (b) . . . . . . . . . . . . . . . . . . . . . . . . . . . . . . . . . . . . 16,437 60,577Protector Forsikring ASA (b) (e) . . . . . . . . . . . . . . . . . . . . . . . . . 13,480 87,781Q-Free ASA (b) . . . . . . . . . . . . . . . . . . . . . . . . . . . . . . . . . . . . 24,256 23,780Sbanken ASA (144A) . . . . . . . . . . . . . . . . . . . . . . . . . . . . . . . 12,388 134,991Scatec Solar ASA (144A) . . . . . . . . . . . . . . . . . . . . . . . . . . . . . 23,944 177,099Selvaag Bolig ASA . . . . . . . . . . . . . . . . . . . . . . . . . . . . . . . . . 7,900 37,597Sevan Marine ASA (b) . . . . . . . . . . . . . . . . . . . . . . . . . . . . . . . 16,466 35,111Solstad Farstad ASA (b) (e) . . . . . . . . . . . . . . . . . . . . . . . . . . . . 53,910 32,460Spectrum ASA . . . . . . . . . . . . . . . . . . . . . . . . . . . . . . . . . . . . 8,433 63,834Stolt-Nielsen, Ltd. . . . . . . . . . . . . . . . . . . . . . . . . . . . . . . . . . . 7,397 113,251Treasure ASA . . . . . . . . . . . . . . . . . . . . . . . . . . . . . . . . . . . . . 21,003 33,158Veidekke ASA . . . . . . . . . . . . . . . . . . . . . . . . . . . . . . . . . . . . 27,432 299,480Wilh Wilhelmsen Holding ASA - Class A . . . . . . . . . . . . . . . . . . . . 4,777 105,149XXL ASA (144A) (e) . . . . . . . . . . . . . . . . . . . . . . . . . . . . . . . . 17,225 88,694
6,169,502
Peru—0.0%Hochschild Mining plc . . . . . . . . . . . . . . . . . . . . . . . . . . . . . . . 74,658 159,174
Philippines—0.0%Del Monte Pacific, Ltd. . . . . . . . . . . . . . . . . . . . . . . . . . . . . . . . 77,636 9,830
Portugal—0.4%Altri SGPS S.A. . . . . . . . . . . . . . . . . . . . . . . . . . . . . . . . . . . . . 27,747 265,871Banco Comercial Portugues S.A. - Class R (b) . . . . . . . . . . . . . . . . 2,143,248 633,569Banco Espirito Santo S.A. (a) (b) (c) (d) . . . . . . . . . . . . . . . . . . . 89,078 0CTT-Correios de Portugal S.A. (e) . . . . . . . . . . . . . . . . . . . . . . . . 34,069 133,451Mota-Engil SGPS S.A. (b) . . . . . . . . . . . . . . . . . . . . . . . . . . . . . 40,942 99,772Navigator Co. S.A. (The) . . . . . . . . . . . . . . . . . . . . . . . . . . . . . 71,289 348,876NOS SGPS S.A. . . . . . . . . . . . . . . . . . . . . . . . . . . . . . . . . . . . . 73,113 437,868Novabase SGPS S.A. . . . . . . . . . . . . . . . . . . . . . . . . . . . . . . . . 7,827 24,264REN - Redes Energeticas Nacionais SGPS S.A. . . . . . . . . . . . . . . . . 122,322 344,952Semapa-Sociedade de Investimento e Gestao . . . . . . . . . . . . . . . . 4,163 82,721Sonae SGPS S.A. . . . . . . . . . . . . . . . . . . . . . . . . . . . . . . . . . . . 280,308 290,417Teixeira Duarte S.A. (b) . . . . . . . . . . . . . . . . . . . . . . . . . . . . . . 59,382 14,340
2,676,101
Russia—0.0%Evraz plc . . . . . . . . . . . . . . . . . . . . . . . . . . . . . . . . . . . . . . . . 13,430 98,996Petropavlovsk plc (b) . . . . . . . . . . . . . . . . . . . . . . . . . . . . . . . 192,556 15,937
114,933
Security Description Shares Value
Singapore—1.1%Abterra, Ltd. (a) (b) (c) (d) . . . . . . . . . . . . . . . . . . . . . . . . . . . . 51,720 $ 1,135Accordia Golf Trust . . . . . . . . . . . . . . . . . . . . . . . . . . . . . . . . . 74,500 29,684AEM Holdings, Ltd. . . . . . . . . . . . . . . . . . . . . . . . . . . . . . . . . . 46,900 26,085Ascendas India Trust . . . . . . . . . . . . . . . . . . . . . . . . . . . . . . . . 171,500 136,738ASL Marine Holdings, Ltd. (b) . . . . . . . . . . . . . . . . . . . . . . . . . . 52,500 3,380Baker Technology, Ltd. (b) . . . . . . . . . . . . . . . . . . . . . . . . . . . . 33,200 13,003Banyan Tree Holdings, Ltd. . . . . . . . . . . . . . . . . . . . . . . . . . . . . 97,700 37,517Best World International, Ltd. . . . . . . . . . . . . . . . . . . . . . . . . . . 80,000 85,997Bonvests Holdings, Ltd. . . . . . . . . . . . . . . . . . . . . . . . . . . . . . . 18,000 16,985Boustead Projects, Ltd. . . . . . . . . . . . . . . . . . . . . . . . . . . . . . . . 24,607 15,476Boustead Singapore, Ltd. . . . . . . . . . . . . . . . . . . . . . . . . . . . . . 82,025 47,688BreadTalk Group, Ltd. . . . . . . . . . . . . . . . . . . . . . . . . . . . . . . . 54,200 40,043Bukit Sembawang Estates, Ltd. . . . . . . . . . . . . . . . . . . . . . . . . . 69,100 291,638BW LPG, Ltd. (144A) (b) . . . . . . . . . . . . . . . . . . . . . . . . . . . . . 25,142 110,056Centurion Corp., Ltd. . . . . . . . . . . . . . . . . . . . . . . . . . . . . . . . . 38,000 12,216China Aviation Oil Singapore Corp., Ltd. . . . . . . . . . . . . . . . . . . . 94,800 106,054Chip Eng Seng Corp., Ltd. . . . . . . . . . . . . . . . . . . . . . . . . . . . . . 157,000 95,865Chuan Hup Holdings, Ltd. . . . . . . . . . . . . . . . . . . . . . . . . . . . . . 125,000 30,932CITIC Envirotech, Ltd. . . . . . . . . . . . . . . . . . . . . . . . . . . . . . . . . 207,500 83,474CNQC International Holdings, Ltd. . . . . . . . . . . . . . . . . . . . . . . . 82,500 18,915COSCO Shipping International Singapore Co., Ltd. (b) . . . . . . . . . . 272,500 82,650Creative Technology, Ltd. (b) . . . . . . . . . . . . . . . . . . . . . . . . . . 16,300 74,868CSE Global, Ltd. . . . . . . . . . . . . . . . . . . . . . . . . . . . . . . . . . . . 197,000 71,932CW Group Holdings, Ltd. (a) (c) (d) . . . . . . . . . . . . . . . . . . . . . . 106,000 3,128Delfi, Ltd. . . . . . . . . . . . . . . . . . . . . . . . . . . . . . . . . . . . . . . . 66,000 54,088Dyna-Mac Holdings, Ltd. (b) . . . . . . . . . . . . . . . . . . . . . . . . . . . 98,000 8,453Elec & Eltek International Co., Ltd. . . . . . . . . . . . . . . . . . . . . . . . 23,000 30,206Ezion Holdings, Ltd. (b) . . . . . . . . . . . . . . . . . . . . . . . . . . . . . . 753,729 40,663Ezra Holdings, Ltd. (a) (b) (c) (d) . . . . . . . . . . . . . . . . . . . . . . . 1,000,703 7,599Far East Orchard, Ltd. . . . . . . . . . . . . . . . . . . . . . . . . . . . . . . . 74,044 71,404First Resources, Ltd. . . . . . . . . . . . . . . . . . . . . . . . . . . . . . . . . 86,700 106,382Food Empire Holdings, Ltd. . . . . . . . . . . . . . . . . . . . . . . . . . . . . 54,000 22,468Fragrance Group, Ltd. (b) . . . . . . . . . . . . . . . . . . . . . . . . . . . . . 752,800 78,727Gallant Venture, Ltd. (b) . . . . . . . . . . . . . . . . . . . . . . . . . . . . . 126,000 11,520Geo Energy Resources, Ltd. . . . . . . . . . . . . . . . . . . . . . . . . . . . . 155,000 26,066GK Goh Holdings, Ltd. . . . . . . . . . . . . . . . . . . . . . . . . . . . . . . . 12,000 8,345GL, Ltd. . . . . . . . . . . . . . . . . . . . . . . . . . . . . . . . . . . . . . . . . 188,000 103,053Golden Agri-Resources, Ltd. . . . . . . . . . . . . . . . . . . . . . . . . . . . 988,100 180,546Golden Energy & Resources, Ltd. . . . . . . . . . . . . . . . . . . . . . . . . 69,000 12,831GuocoLand, Ltd. . . . . . . . . . . . . . . . . . . . . . . . . . . . . . . . . . . . 35,500 49,077Halcyon Agri Corp., Ltd. . . . . . . . . . . . . . . . . . . . . . . . . . . . . . . 188,713 69,698Hanwell Holdings, Ltd. . . . . . . . . . . . . . . . . . . . . . . . . . . . . . . . 19,000 3,057Haw Par Corp., Ltd. . . . . . . . . . . . . . . . . . . . . . . . . . . . . . . . . . 15,900 157,108Hi-P International, Ltd. . . . . . . . . . . . . . . . . . . . . . . . . . . . . . . 50,200 36,981Hiap Hoe, Ltd. . . . . . . . . . . . . . . . . . . . . . . . . . . . . . . . . . . . . 58,000 36,912Ho Bee Land, Ltd. . . . . . . . . . . . . . . . . . . . . . . . . . . . . . . . . . . 67,200 125,351Hong Fok Corp., Ltd. . . . . . . . . . . . . . . . . . . . . . . . . . . . . . . . . 146,740 74,517Hong Leong Asia, Ltd. (b) . . . . . . . . . . . . . . . . . . . . . . . . . . . . . 41,000 16,709Hotel Grand Central, Ltd. . . . . . . . . . . . . . . . . . . . . . . . . . . . . . 25,900 26,130Hour Glass, Ltd. (The) . . . . . . . . . . . . . . . . . . . . . . . . . . . . . . . 129,000 62,729Hwa Hong Corp., Ltd. . . . . . . . . . . . . . . . . . . . . . . . . . . . . . . . 138,000 31,779Hyflux, Ltd. (a) (b) (d) . . . . . . . . . . . . . . . . . . . . . . . . . . . . . . 179,500 1,795iFAST Corp., Ltd. . . . . . . . . . . . . . . . . . . . . . . . . . . . . . . . . . . . 25,500 22,189IGG, Inc. . . . . . . . . . . . . . . . . . . . . . . . . . . . . . . . . . . . . . . . . 238,000 296,577Indofood Agri Resources, Ltd. . . . . . . . . . . . . . . . . . . . . . . . . . . 152,000 21,005Japfa, Ltd. . . . . . . . . . . . . . . . . . . . . . . . . . . . . . . . . . . . . . . 89,700 42,966k1 Ventures, Ltd. (a) (b) (c) (d) . . . . . . . . . . . . . . . . . . . . . . . . . 80,800 5,792
BHFTII-90
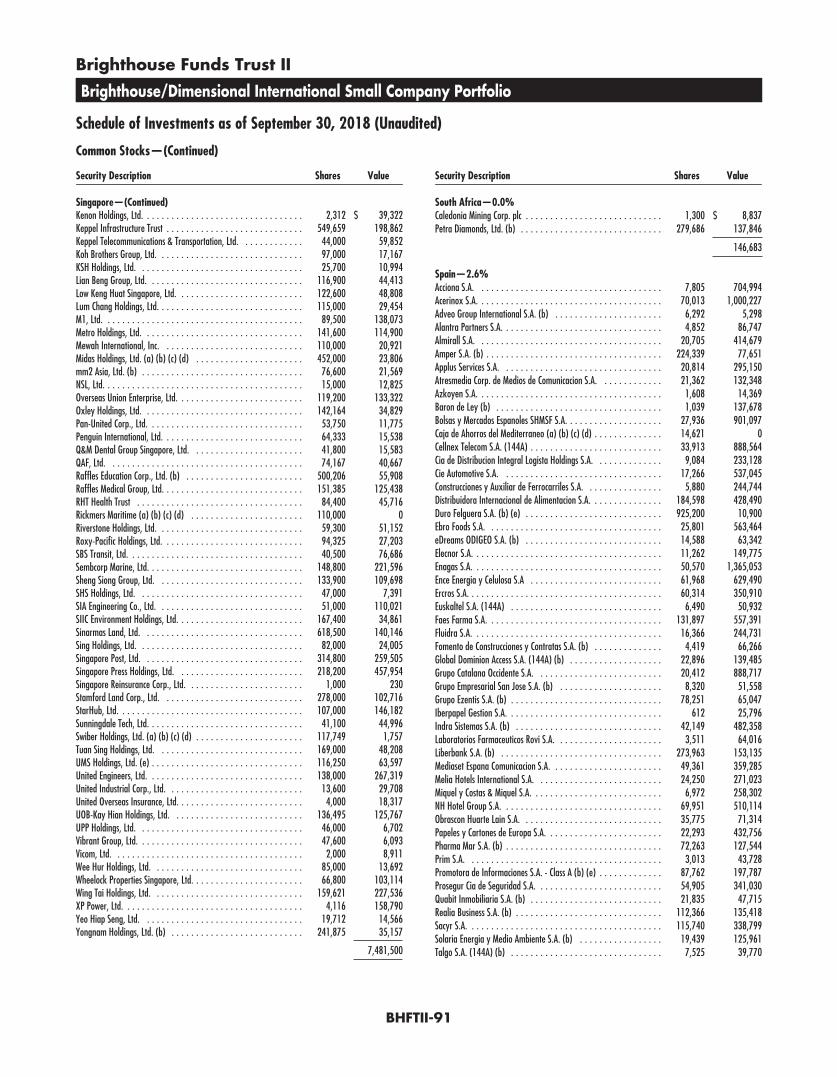
Brighthouse Funds Trust II
Brighthouse/Dimensional International Small Company Portfolio
Schedule of Investments as of September 30, 2018 (Unaudited)
Common Stocks—(Continued)
Security Description Shares Value
Singapore—(Continued)Kenon Holdings, Ltd. . . . . . . . . . . . . . . . . . . . . . . . . . . . . . . . . 2,312 $ 39,322Keppel Infrastructure Trust . . . . . . . . . . . . . . . . . . . . . . . . . . . . 549,659 198,862Keppel Telecommunications & Transportation, Ltd. . . . . . . . . . . . . 44,000 59,852Koh Brothers Group, Ltd. . . . . . . . . . . . . . . . . . . . . . . . . . . . . . 97,000 17,167KSH Holdings, Ltd. . . . . . . . . . . . . . . . . . . . . . . . . . . . . . . . . . 25,700 10,994Lian Beng Group, Ltd. . . . . . . . . . . . . . . . . . . . . . . . . . . . . . . . 116,900 44,413Low Keng Huat Singapore, Ltd. . . . . . . . . . . . . . . . . . . . . . . . . . 122,600 48,808Lum Chang Holdings, Ltd. . . . . . . . . . . . . . . . . . . . . . . . . . . . . . 115,000 29,454M1, Ltd. . . . . . . . . . . . . . . . . . . . . . . . . . . . . . . . . . . . . . . . . 89,500 138,073Metro Holdings, Ltd. . . . . . . . . . . . . . . . . . . . . . . . . . . . . . . . . 141,600 114,900Mewah International, Inc. . . . . . . . . . . . . . . . . . . . . . . . . . . . . 110,000 20,921Midas Holdings, Ltd. (a) (b) (c) (d) . . . . . . . . . . . . . . . . . . . . . . 452,000 23,806mm2 Asia, Ltd. (b) . . . . . . . . . . . . . . . . . . . . . . . . . . . . . . . . . 76,600 21,569NSL, Ltd. . . . . . . . . . . . . . . . . . . . . . . . . . . . . . . . . . . . . . . . . 15,000 12,825Overseas Union Enterprise, Ltd. . . . . . . . . . . . . . . . . . . . . . . . . . 119,200 133,322Oxley Holdings, Ltd. . . . . . . . . . . . . . . . . . . . . . . . . . . . . . . . . 142,164 34,829Pan-United Corp., Ltd. . . . . . . . . . . . . . . . . . . . . . . . . . . . . . . . 53,750 11,775Penguin International, Ltd. . . . . . . . . . . . . . . . . . . . . . . . . . . . . 64,333 15,538Q&M Dental Group Singapore, Ltd. . . . . . . . . . . . . . . . . . . . . . . 41,800 15,583QAF, Ltd. . . . . . . . . . . . . . . . . . . . . . . . . . . . . . . . . . . . . . . . 74,167 40,667Raffles Education Corp., Ltd. (b) . . . . . . . . . . . . . . . . . . . . . . . . 500,206 55,908Raffles Medical Group, Ltd. . . . . . . . . . . . . . . . . . . . . . . . . . . . . 151,385 125,438RHT Health Trust . . . . . . . . . . . . . . . . . . . . . . . . . . . . . . . . . . 84,400 45,716Rickmers Maritime (a) (b) (c) (d) . . . . . . . . . . . . . . . . . . . . . . . 110,000 0Riverstone Holdings, Ltd. . . . . . . . . . . . . . . . . . . . . . . . . . . . . . 59,300 51,152Roxy-Pacific Holdings, Ltd. . . . . . . . . . . . . . . . . . . . . . . . . . . . . 94,325 27,203SBS Transit, Ltd. . . . . . . . . . . . . . . . . . . . . . . . . . . . . . . . . . . . 40,500 76,686Sembcorp Marine, Ltd. . . . . . . . . . . . . . . . . . . . . . . . . . . . . . . . 148,800 221,596Sheng Siong Group, Ltd. . . . . . . . . . . . . . . . . . . . . . . . . . . . . . 133,900 109,698SHS Holdings, Ltd. . . . . . . . . . . . . . . . . . . . . . . . . . . . . . . . . . 47,000 7,391SIA Engineering Co., Ltd. . . . . . . . . . . . . . . . . . . . . . . . . . . . . . 51,000 110,021SIIC Environment Holdings, Ltd. . . . . . . . . . . . . . . . . . . . . . . . . . 167,400 34,861Sinarmas Land, Ltd. . . . . . . . . . . . . . . . . . . . . . . . . . . . . . . . . 618,500 140,146Sing Holdings, Ltd. . . . . . . . . . . . . . . . . . . . . . . . . . . . . . . . . . 82,000 24,005Singapore Post, Ltd. . . . . . . . . . . . . . . . . . . . . . . . . . . . . . . . . 314,800 259,505Singapore Press Holdings, Ltd. . . . . . . . . . . . . . . . . . . . . . . . . . 218,200 457,954Singapore Reinsurance Corp., Ltd. . . . . . . . . . . . . . . . . . . . . . . . 1,000 230Stamford Land Corp., Ltd. . . . . . . . . . . . . . . . . . . . . . . . . . . . . 278,000 102,716StarHub, Ltd. . . . . . . . . . . . . . . . . . . . . . . . . . . . . . . . . . . . . . 107,000 146,182Sunningdale Tech, Ltd. . . . . . . . . . . . . . . . . . . . . . . . . . . . . . . . 41,100 44,996Swiber Holdings, Ltd. (a) (b) (c) (d) . . . . . . . . . . . . . . . . . . . . . . 117,749 1,757Tuan Sing Holdings, Ltd. . . . . . . . . . . . . . . . . . . . . . . . . . . . . . 169,000 48,208UMS Holdings, Ltd. (e) . . . . . . . . . . . . . . . . . . . . . . . . . . . . . . . 116,250 63,597United Engineers, Ltd. . . . . . . . . . . . . . . . . . . . . . . . . . . . . . . . 138,000 267,319United Industrial Corp., Ltd. . . . . . . . . . . . . . . . . . . . . . . . . . . . 13,600 29,708United Overseas Insurance, Ltd. . . . . . . . . . . . . . . . . . . . . . . . . . 4,000 18,317UOB-Kay Hian Holdings, Ltd. . . . . . . . . . . . . . . . . . . . . . . . . . . 136,495 125,767UPP Holdings, Ltd. . . . . . . . . . . . . . . . . . . . . . . . . . . . . . . . . . 46,000 6,702Vibrant Group, Ltd. . . . . . . . . . . . . . . . . . . . . . . . . . . . . . . . . . 47,600 6,093Vicom, Ltd. . . . . . . . . . . . . . . . . . . . . . . . . . . . . . . . . . . . . . . 2,000 8,911Wee Hur Holdings, Ltd. . . . . . . . . . . . . . . . . . . . . . . . . . . . . . . 85,000 13,692Wheelock Properties Singapore, Ltd. . . . . . . . . . . . . . . . . . . . . . . 66,800 103,114Wing Tai Holdings, Ltd. . . . . . . . . . . . . . . . . . . . . . . . . . . . . . . 159,621 227,536XP Power, Ltd. . . . . . . . . . . . . . . . . . . . . . . . . . . . . . . . . . . . . 4,116 158,790Yeo Hiap Seng, Ltd. . . . . . . . . . . . . . . . . . . . . . . . . . . . . . . . . 19,712 14,566Yongnam Holdings, Ltd. (b) . . . . . . . . . . . . . . . . . . . . . . . . . . . 241,875 35,157
7,481,500
Security Description Shares Value
South Africa—0.0%Caledonia Mining Corp. plc . . . . . . . . . . . . . . . . . . . . . . . . . . . . 1,300 $ 8,837Petra Diamonds, Ltd. (b) . . . . . . . . . . . . . . . . . . . . . . . . . . . . . 279,686 137,846
146,683
Spain—2.6%Acciona S.A. . . . . . . . . . . . . . . . . . . . . . . . . . . . . . . . . . . . . . 7,805 704,994Acerinox S.A. . . . . . . . . . . . . . . . . . . . . . . . . . . . . . . . . . . . . . 70,013 1,000,227Adveo Group International S.A. (b) . . . . . . . . . . . . . . . . . . . . . . 6,292 5,298Alantra Partners S.A. . . . . . . . . . . . . . . . . . . . . . . . . . . . . . . . . 4,852 86,747Almirall S.A. . . . . . . . . . . . . . . . . . . . . . . . . . . . . . . . . . . . . . 20,705 414,679Amper S.A. (b) . . . . . . . . . . . . . . . . . . . . . . . . . . . . . . . . . . . . 224,339 77,651Applus Services S.A. . . . . . . . . . . . . . . . . . . . . . . . . . . . . . . . . 20,814 295,150Atresmedia Corp. de Medios de Comunicacion S.A. . . . . . . . . . . . . 21,362 132,348Azkoyen S.A. . . . . . . . . . . . . . . . . . . . . . . . . . . . . . . . . . . . . . 1,608 14,369Baron de Ley (b) . . . . . . . . . . . . . . . . . . . . . . . . . . . . . . . . . . 1,039 137,678Bolsas y Mercados Espanoles SHMSF S.A. . . . . . . . . . . . . . . . . . . . 27,936 901,097Caja de Ahorros del Mediterraneo (a) (b) (c) (d) . . . . . . . . . . . . . . 14,621 0Cellnex Telecom S.A. (144A) . . . . . . . . . . . . . . . . . . . . . . . . . . . 33,913 888,564Cia de Distribucion Integral Logista Holdings S.A. . . . . . . . . . . . . . 9,084 233,128Cie Automotive S.A. . . . . . . . . . . . . . . . . . . . . . . . . . . . . . . . . 17,266 537,045Construcciones y Auxiliar de Ferrocarriles S.A. . . . . . . . . . . . . . . . 5,880 244,744Distribuidora Internacional de Alimentacion S.A. . . . . . . . . . . . . . . 184,598 428,490Duro Felguera S.A. (b) (e) . . . . . . . . . . . . . . . . . . . . . . . . . . . . 925,200 10,900Ebro Foods S.A. . . . . . . . . . . . . . . . . . . . . . . . . . . . . . . . . . . . 25,801 563,464eDreams ODIGEO S.A. (b) . . . . . . . . . . . . . . . . . . . . . . . . . . . . 14,588 63,342Elecnor S.A. . . . . . . . . . . . . . . . . . . . . . . . . . . . . . . . . . . . . . . 11,262 149,775Enagas S.A. . . . . . . . . . . . . . . . . . . . . . . . . . . . . . . . . . . . . . . 50,570 1,365,053Ence Energia y Celulosa S.A . . . . . . . . . . . . . . . . . . . . . . . . . . . 61,968 629,490Ercros S.A. . . . . . . . . . . . . . . . . . . . . . . . . . . . . . . . . . . . . . . . 60,314 350,910Euskaltel S.A. (144A) . . . . . . . . . . . . . . . . . . . . . . . . . . . . . . . 6,490 50,932Faes Farma S.A. . . . . . . . . . . . . . . . . . . . . . . . . . . . . . . . . . . . 131,897 557,391Fluidra S.A. . . . . . . . . . . . . . . . . . . . . . . . . . . . . . . . . . . . . . . 16,366 244,731Fomento de Construcciones y Contratas S.A. (b) . . . . . . . . . . . . . . 4,419 66,266Global Dominion Access S.A. (144A) (b) . . . . . . . . . . . . . . . . . . . 22,896 139,485Grupo Catalana Occidente S.A. . . . . . . . . . . . . . . . . . . . . . . . . . 20,412 888,717Grupo Empresarial San Jose S.A. (b) . . . . . . . . . . . . . . . . . . . . . 8,320 51,558Grupo Ezentis S.A. (b) . . . . . . . . . . . . . . . . . . . . . . . . . . . . . . . 78,251 65,047Iberpapel Gestion S.A. . . . . . . . . . . . . . . . . . . . . . . . . . . . . . . . 612 25,796Indra Sistemas S.A. (b) . . . . . . . . . . . . . . . . . . . . . . . . . . . . . . 42,149 482,358Laboratorios Farmaceuticos Rovi S.A. . . . . . . . . . . . . . . . . . . . . . 3,511 64,016Liberbank S.A. (b) . . . . . . . . . . . . . . . . . . . . . . . . . . . . . . . . . 273,963 153,135Mediaset Espana Comunicacion S.A. . . . . . . . . . . . . . . . . . . . . . . 49,361 359,285Melia Hotels International S.A. . . . . . . . . . . . . . . . . . . . . . . . . . 24,250 271,023Miquel y Costas & Miquel S.A. . . . . . . . . . . . . . . . . . . . . . . . . . . 6,972 258,302NH Hotel Group S.A. . . . . . . . . . . . . . . . . . . . . . . . . . . . . . . . . 69,951 510,114Obrascon Huarte Lain S.A. . . . . . . . . . . . . . . . . . . . . . . . . . . . . 35,775 71,314Papeles y Cartones de Europa S.A. . . . . . . . . . . . . . . . . . . . . . . . 22,293 432,756Pharma Mar S.A. (b) . . . . . . . . . . . . . . . . . . . . . . . . . . . . . . . . 72,263 127,544Prim S.A. . . . . . . . . . . . . . . . . . . . . . . . . . . . . . . . . . . . . . . . 3,013 43,728Promotora de Informaciones S.A. - Class A (b) (e) . . . . . . . . . . . . . 87,762 197,787Prosegur Cia de Seguridad S.A. . . . . . . . . . . . . . . . . . . . . . . . . . 54,905 341,030Quabit Inmobiliaria S.A. (b) . . . . . . . . . . . . . . . . . . . . . . . . . . . 21,835 47,715Realia Business S.A. (b) . . . . . . . . . . . . . . . . . . . . . . . . . . . . . . 112,366 135,418Sacyr S.A. . . . . . . . . . . . . . . . . . . . . . . . . . . . . . . . . . . . . . . . 115,740 338,799Solaria Energia y Medio Ambiente S.A. (b) . . . . . . . . . . . . . . . . . 19,439 125,961Talgo S.A. (144A) (b) . . . . . . . . . . . . . . . . . . . . . . . . . . . . . . . 7,525 39,770
BHFTII-91
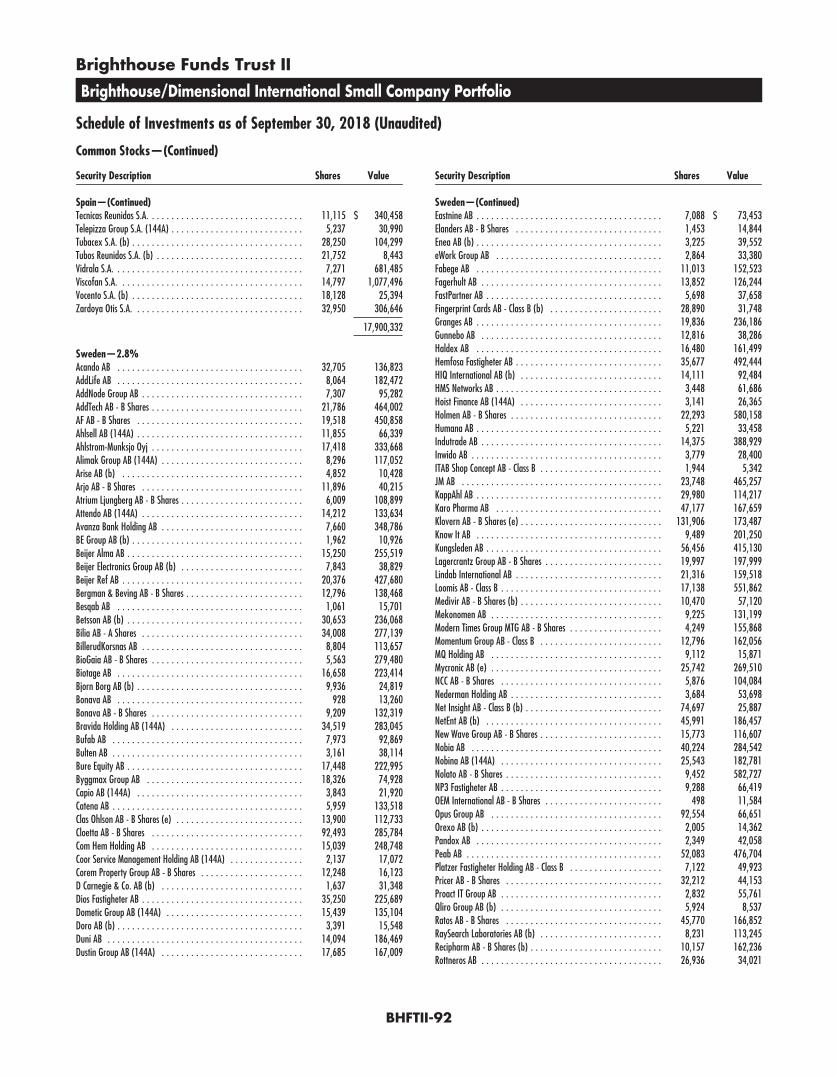
Brighthouse Funds Trust II
Brighthouse/Dimensional International Small Company Portfolio
Schedule of Investments as of September 30, 2018 (Unaudited)
Common Stocks—(Continued)
Security Description Shares Value
Spain—(Continued)Tecnicas Reunidas S.A. . . . . . . . . . . . . . . . . . . . . . . . . . . . . . . . 11,115 $ 340,458Telepizza Group S.A. (144A) . . . . . . . . . . . . . . . . . . . . . . . . . . . 5,237 30,990Tubacex S.A. (b) . . . . . . . . . . . . . . . . . . . . . . . . . . . . . . . . . . . 28,250 104,299Tubos Reunidos S.A. (b) . . . . . . . . . . . . . . . . . . . . . . . . . . . . . . 21,752 8,443Vidrala S.A. . . . . . . . . . . . . . . . . . . . . . . . . . . . . . . . . . . . . . . 7,271 681,485Viscofan S.A. . . . . . . . . . . . . . . . . . . . . . . . . . . . . . . . . . . . . . 14,797 1,077,496Vocento S.A. (b) . . . . . . . . . . . . . . . . . . . . . . . . . . . . . . . . . . . 18,128 25,394Zardoya Otis S.A. . . . . . . . . . . . . . . . . . . . . . . . . . . . . . . . . . . 32,950 306,646
17,900,332
Sweden—2.8%Acando AB . . . . . . . . . . . . . . . . . . . . . . . . . . . . . . . . . . . . . . 32,705 136,823AddLife AB . . . . . . . . . . . . . . . . . . . . . . . . . . . . . . . . . . . . . . 8,064 182,472AddNode Group AB . . . . . . . . . . . . . . . . . . . . . . . . . . . . . . . . . 7,307 95,282AddTech AB - B Shares . . . . . . . . . . . . . . . . . . . . . . . . . . . . . . . 21,786 464,002AF AB - B Shares . . . . . . . . . . . . . . . . . . . . . . . . . . . . . . . . . . 19,518 450,858Ahlsell AB (144A) . . . . . . . . . . . . . . . . . . . . . . . . . . . . . . . . . . 11,855 66,339Ahlstrom-Munksjo Oyj . . . . . . . . . . . . . . . . . . . . . . . . . . . . . . . 17,418 333,668Alimak Group AB (144A) . . . . . . . . . . . . . . . . . . . . . . . . . . . . . 8,296 117,052Arise AB (b) . . . . . . . . . . . . . . . . . . . . . . . . . . . . . . . . . . . . . 4,852 10,428Arjo AB - B Shares . . . . . . . . . . . . . . . . . . . . . . . . . . . . . . . . . 11,896 40,215Atrium Ljungberg AB - B Shares . . . . . . . . . . . . . . . . . . . . . . . . . 6,009 108,899Attendo AB (144A) . . . . . . . . . . . . . . . . . . . . . . . . . . . . . . . . . 14,212 133,634Avanza Bank Holding AB . . . . . . . . . . . . . . . . . . . . . . . . . . . . . 7,660 348,786BE Group AB (b) . . . . . . . . . . . . . . . . . . . . . . . . . . . . . . . . . . . 1,962 10,926Beijer Alma AB . . . . . . . . . . . . . . . . . . . . . . . . . . . . . . . . . . . . 15,250 255,519Beijer Electronics Group AB (b) . . . . . . . . . . . . . . . . . . . . . . . . . 7,843 38,829Beijer Ref AB . . . . . . . . . . . . . . . . . . . . . . . . . . . . . . . . . . . . . 20,376 427,680Bergman & Beving AB - B Shares . . . . . . . . . . . . . . . . . . . . . . . . 12,796 138,468Besqab AB . . . . . . . . . . . . . . . . . . . . . . . . . . . . . . . . . . . . . . 1,061 15,701Betsson AB (b) . . . . . . . . . . . . . . . . . . . . . . . . . . . . . . . . . . . . 30,653 236,068Bilia AB - A Shares . . . . . . . . . . . . . . . . . . . . . . . . . . . . . . . . . 34,008 277,139BillerudKorsnas AB . . . . . . . . . . . . . . . . . . . . . . . . . . . . . . . . . 8,804 113,657BioGaia AB - B Shares . . . . . . . . . . . . . . . . . . . . . . . . . . . . . . . 5,563 279,480Biotage AB . . . . . . . . . . . . . . . . . . . . . . . . . . . . . . . . . . . . . . 16,658 223,414Bjorn Borg AB (b) . . . . . . . . . . . . . . . . . . . . . . . . . . . . . . . . . . 9,936 24,819Bonava AB . . . . . . . . . . . . . . . . . . . . . . . . . . . . . . . . . . . . . . 928 13,260Bonava AB - B Shares . . . . . . . . . . . . . . . . . . . . . . . . . . . . . . . 9,209 132,319Bravida Holding AB (144A) . . . . . . . . . . . . . . . . . . . . . . . . . . . 34,519 283,045Bufab AB . . . . . . . . . . . . . . . . . . . . . . . . . . . . . . . . . . . . . . . 7,973 92,869Bulten AB . . . . . . . . . . . . . . . . . . . . . . . . . . . . . . . . . . . . . . . 3,161 38,114Bure Equity AB . . . . . . . . . . . . . . . . . . . . . . . . . . . . . . . . . . . . 17,448 222,995Byggmax Group AB . . . . . . . . . . . . . . . . . . . . . . . . . . . . . . . . 18,326 74,928Capio AB (144A) . . . . . . . . . . . . . . . . . . . . . . . . . . . . . . . . . . 3,843 21,920Catena AB . . . . . . . . . . . . . . . . . . . . . . . . . . . . . . . . . . . . . . . 5,959 133,518Clas Ohlson AB - B Shares (e) . . . . . . . . . . . . . . . . . . . . . . . . . . 13,900 112,733Cloetta AB - B Shares . . . . . . . . . . . . . . . . . . . . . . . . . . . . . . . 92,493 285,784Com Hem Holding AB . . . . . . . . . . . . . . . . . . . . . . . . . . . . . . . 15,039 248,748Coor Service Management Holding AB (144A) . . . . . . . . . . . . . . . 2,137 17,072Corem Property Group AB - B Shares . . . . . . . . . . . . . . . . . . . . . 12,248 16,123D Carnegie & Co. AB (b) . . . . . . . . . . . . . . . . . . . . . . . . . . . . . 1,637 31,348Dios Fastigheter AB . . . . . . . . . . . . . . . . . . . . . . . . . . . . . . . . . 35,250 225,689Dometic Group AB (144A) . . . . . . . . . . . . . . . . . . . . . . . . . . . . 15,439 135,104Doro AB (b) . . . . . . . . . . . . . . . . . . . . . . . . . . . . . . . . . . . . . . 3,391 15,548Duni AB . . . . . . . . . . . . . . . . . . . . . . . . . . . . . . . . . . . . . . . . 14,094 186,469Dustin Group AB (144A) . . . . . . . . . . . . . . . . . . . . . . . . . . . . . 17,685 167,009
Security Description Shares Value
Sweden—(Continued)Eastnine AB . . . . . . . . . . . . . . . . . . . . . . . . . . . . . . . . . . . . . . 7,088 $ 73,453Elanders AB - B Shares . . . . . . . . . . . . . . . . . . . . . . . . . . . . . . 1,453 14,844Enea AB (b) . . . . . . . . . . . . . . . . . . . . . . . . . . . . . . . . . . . . . . 3,225 39,552eWork Group AB . . . . . . . . . . . . . . . . . . . . . . . . . . . . . . . . . . 2,864 33,380Fabege AB . . . . . . . . . . . . . . . . . . . . . . . . . . . . . . . . . . . . . . 11,013 152,523Fagerhult AB . . . . . . . . . . . . . . . . . . . . . . . . . . . . . . . . . . . . . 13,852 126,244FastPartner AB . . . . . . . . . . . . . . . . . . . . . . . . . . . . . . . . . . . . 5,698 37,658Fingerprint Cards AB - Class B (b) . . . . . . . . . . . . . . . . . . . . . . . 28,890 31,748Granges AB . . . . . . . . . . . . . . . . . . . . . . . . . . . . . . . . . . . . . . 19,836 236,186Gunnebo AB . . . . . . . . . . . . . . . . . . . . . . . . . . . . . . . . . . . . . 12,816 38,286Haldex AB . . . . . . . . . . . . . . . . . . . . . . . . . . . . . . . . . . . . . . 16,480 161,499Hemfosa Fastigheter AB . . . . . . . . . . . . . . . . . . . . . . . . . . . . . . 35,677 492,444HIQ International AB (b) . . . . . . . . . . . . . . . . . . . . . . . . . . . . . 14,111 92,484HMS Networks AB . . . . . . . . . . . . . . . . . . . . . . . . . . . . . . . . . . 3,448 61,686Hoist Finance AB (144A) . . . . . . . . . . . . . . . . . . . . . . . . . . . . . 3,141 26,365Holmen AB - B Shares . . . . . . . . . . . . . . . . . . . . . . . . . . . . . . . 22,293 580,158Humana AB . . . . . . . . . . . . . . . . . . . . . . . . . . . . . . . . . . . . . . 5,221 33,458Indutrade AB . . . . . . . . . . . . . . . . . . . . . . . . . . . . . . . . . . . . . 14,375 388,929Inwido AB . . . . . . . . . . . . . . . . . . . . . . . . . . . . . . . . . . . . . . . 3,779 28,400ITAB Shop Concept AB - Class B . . . . . . . . . . . . . . . . . . . . . . . . . 1,944 5,342JM AB . . . . . . . . . . . . . . . . . . . . . . . . . . . . . . . . . . . . . . . . . 23,748 465,257KappAhl AB . . . . . . . . . . . . . . . . . . . . . . . . . . . . . . . . . . . . . . 29,980 114,217Karo Pharma AB . . . . . . . . . . . . . . . . . . . . . . . . . . . . . . . . . . 47,177 167,659Klovern AB - B Shares (e) . . . . . . . . . . . . . . . . . . . . . . . . . . . . . 131,906 173,487Know It AB . . . . . . . . . . . . . . . . . . . . . . . . . . . . . . . . . . . . . . 9,489 201,250Kungsleden AB . . . . . . . . . . . . . . . . . . . . . . . . . . . . . . . . . . . . 56,456 415,130Lagercrantz Group AB - B Shares . . . . . . . . . . . . . . . . . . . . . . . . 19,997 197,999Lindab International AB . . . . . . . . . . . . . . . . . . . . . . . . . . . . . . 21,316 159,518Loomis AB - Class B . . . . . . . . . . . . . . . . . . . . . . . . . . . . . . . . . 17,138 551,862Medivir AB - B Shares (b) . . . . . . . . . . . . . . . . . . . . . . . . . . . . . 10,470 57,120Mekonomen AB . . . . . . . . . . . . . . . . . . . . . . . . . . . . . . . . . . . 9,225 131,199Modern Times Group MTG AB - B Shares . . . . . . . . . . . . . . . . . . . 4,249 155,868Momentum Group AB - Class B . . . . . . . . . . . . . . . . . . . . . . . . . 12,796 162,056MQ Holding AB . . . . . . . . . . . . . . . . . . . . . . . . . . . . . . . . . . . 9,112 15,871Mycronic AB (e) . . . . . . . . . . . . . . . . . . . . . . . . . . . . . . . . . . . 25,742 269,510NCC AB - B Shares . . . . . . . . . . . . . . . . . . . . . . . . . . . . . . . . . 5,876 104,084Nederman Holding AB . . . . . . . . . . . . . . . . . . . . . . . . . . . . . . . 3,684 53,698Net Insight AB - Class B (b) . . . . . . . . . . . . . . . . . . . . . . . . . . . . 74,697 25,887NetEnt AB (b) . . . . . . . . . . . . . . . . . . . . . . . . . . . . . . . . . . . . 45,991 186,457New Wave Group AB - B Shares . . . . . . . . . . . . . . . . . . . . . . . . . 15,773 116,607Nobia AB . . . . . . . . . . . . . . . . . . . . . . . . . . . . . . . . . . . . . . . 40,224 284,542Nobina AB (144A) . . . . . . . . . . . . . . . . . . . . . . . . . . . . . . . . . 25,543 182,781Nolato AB - B Shares . . . . . . . . . . . . . . . . . . . . . . . . . . . . . . . . 9,452 582,727NP3 Fastigheter AB . . . . . . . . . . . . . . . . . . . . . . . . . . . . . . . . . 9,288 66,419OEM International AB - B Shares . . . . . . . . . . . . . . . . . . . . . . . . 498 11,584Opus Group AB . . . . . . . . . . . . . . . . . . . . . . . . . . . . . . . . . . . 92,554 66,651Orexo AB (b) . . . . . . . . . . . . . . . . . . . . . . . . . . . . . . . . . . . . . 2,005 14,362Pandox AB . . . . . . . . . . . . . . . . . . . . . . . . . . . . . . . . . . . . . . 2,349 42,058Peab AB . . . . . . . . . . . . . . . . . . . . . . . . . . . . . . . . . . . . . . . . 52,083 476,704Platzer Fastigheter Holding AB - Class B . . . . . . . . . . . . . . . . . . . 7,122 49,923Pricer AB - B Shares . . . . . . . . . . . . . . . . . . . . . . . . . . . . . . . . 32,212 44,153Proact IT Group AB . . . . . . . . . . . . . . . . . . . . . . . . . . . . . . . . . 2,832 55,761Qliro Group AB (b) . . . . . . . . . . . . . . . . . . . . . . . . . . . . . . . . . 5,924 8,537Ratos AB - B Shares . . . . . . . . . . . . . . . . . . . . . . . . . . . . . . . . 45,770 166,852RaySearch Laboratories AB (b) . . . . . . . . . . . . . . . . . . . . . . . . . 8,231 113,245Recipharm AB - B Shares (b) . . . . . . . . . . . . . . . . . . . . . . . . . . . 10,157 162,236Rottneros AB . . . . . . . . . . . . . . . . . . . . . . . . . . . . . . . . . . . . . 26,936 34,021
BHFTII-92
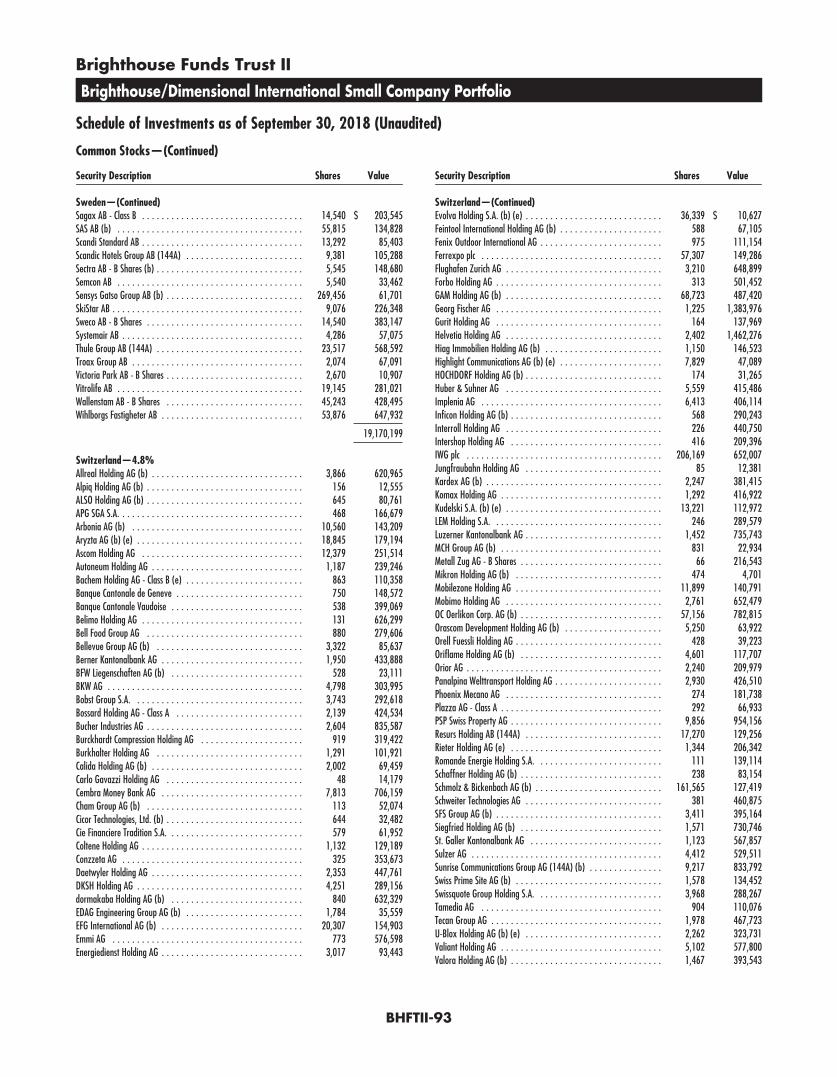
Brighthouse Funds Trust II
Brighthouse/Dimensional International Small Company Portfolio
Schedule of Investments as of September 30, 2018 (Unaudited)
Common Stocks—(Continued)
Security Description Shares Value
Sweden—(Continued)Sagax AB - Class B . . . . . . . . . . . . . . . . . . . . . . . . . . . . . . . . . 14,540 $ 203,545SAS AB (b) . . . . . . . . . . . . . . . . . . . . . . . . . . . . . . . . . . . . . . 55,815 134,828Scandi Standard AB . . . . . . . . . . . . . . . . . . . . . . . . . . . . . . . . . 13,292 85,403Scandic Hotels Group AB (144A) . . . . . . . . . . . . . . . . . . . . . . . . 9,381 105,288Sectra AB - B Shares (b) . . . . . . . . . . . . . . . . . . . . . . . . . . . . . . 5,545 148,680Semcon AB . . . . . . . . . . . . . . . . . . . . . . . . . . . . . . . . . . . . . . 5,540 33,462Sensys Gatso Group AB (b) . . . . . . . . . . . . . . . . . . . . . . . . . . . . 269,456 61,701SkiStar AB . . . . . . . . . . . . . . . . . . . . . . . . . . . . . . . . . . . . . . . 9,076 226,348Sweco AB - B Shares . . . . . . . . . . . . . . . . . . . . . . . . . . . . . . . . 14,540 383,147Systemair AB . . . . . . . . . . . . . . . . . . . . . . . . . . . . . . . . . . . . . 4,286 57,075Thule Group AB (144A) . . . . . . . . . . . . . . . . . . . . . . . . . . . . . . 23,517 568,592Troax Group AB . . . . . . . . . . . . . . . . . . . . . . . . . . . . . . . . . . . 2,074 67,091Victoria Park AB - B Shares . . . . . . . . . . . . . . . . . . . . . . . . . . . . 2,670 10,907Vitrolife AB . . . . . . . . . . . . . . . . . . . . . . . . . . . . . . . . . . . . . . 19,145 281,021Wallenstam AB - B Shares . . . . . . . . . . . . . . . . . . . . . . . . . . . . 45,243 428,495Wihlborgs Fastigheter AB . . . . . . . . . . . . . . . . . . . . . . . . . . . . . 53,876 647,932
19,170,199
Switzerland—4.8%Allreal Holding AG (b) . . . . . . . . . . . . . . . . . . . . . . . . . . . . . . . 3,866 620,965Alpiq Holding AG (b) . . . . . . . . . . . . . . . . . . . . . . . . . . . . . . . . 156 12,555ALSO Holding AG (b) . . . . . . . . . . . . . . . . . . . . . . . . . . . . . . . . 645 80,761APG SGA S.A. . . . . . . . . . . . . . . . . . . . . . . . . . . . . . . . . . . . . . 468 166,679Arbonia AG (b) . . . . . . . . . . . . . . . . . . . . . . . . . . . . . . . . . . . 10,560 143,209Aryzta AG (b) (e) . . . . . . . . . . . . . . . . . . . . . . . . . . . . . . . . . . 18,845 179,194Ascom Holding AG . . . . . . . . . . . . . . . . . . . . . . . . . . . . . . . . . 12,379 251,514Autoneum Holding AG . . . . . . . . . . . . . . . . . . . . . . . . . . . . . . . 1,187 239,246Bachem Holding AG - Class B (e) . . . . . . . . . . . . . . . . . . . . . . . . 863 110,358Banque Cantonale de Geneve . . . . . . . . . . . . . . . . . . . . . . . . . . 750 148,572Banque Cantonale Vaudoise . . . . . . . . . . . . . . . . . . . . . . . . . . . 538 399,069Belimo Holding AG . . . . . . . . . . . . . . . . . . . . . . . . . . . . . . . . . 131 626,299Bell Food Group AG . . . . . . . . . . . . . . . . . . . . . . . . . . . . . . . . 880 279,606Bellevue Group AG (b) . . . . . . . . . . . . . . . . . . . . . . . . . . . . . . 3,322 85,637Berner Kantonalbank AG . . . . . . . . . . . . . . . . . . . . . . . . . . . . . 1,950 433,888BFW Liegenschaften AG (b) . . . . . . . . . . . . . . . . . . . . . . . . . . . 528 23,111BKW AG . . . . . . . . . . . . . . . . . . . . . . . . . . . . . . . . . . . . . . . . 4,798 303,995Bobst Group S.A. . . . . . . . . . . . . . . . . . . . . . . . . . . . . . . . . . . 3,743 292,618Bossard Holding AG - Class A . . . . . . . . . . . . . . . . . . . . . . . . . . 2,139 424,534Bucher Industries AG . . . . . . . . . . . . . . . . . . . . . . . . . . . . . . . . 2,604 835,587Burckhardt Compression Holding AG . . . . . . . . . . . . . . . . . . . . . 919 319,422Burkhalter Holding AG . . . . . . . . . . . . . . . . . . . . . . . . . . . . . . 1,291 101,921Calida Holding AG (b) . . . . . . . . . . . . . . . . . . . . . . . . . . . . . . . 2,002 69,459Carlo Gavazzi Holding AG . . . . . . . . . . . . . . . . . . . . . . . . . . . . 48 14,179Cembra Money Bank AG . . . . . . . . . . . . . . . . . . . . . . . . . . . . . 7,813 706,159Cham Group AG (b) . . . . . . . . . . . . . . . . . . . . . . . . . . . . . . . . 113 52,074Cicor Technologies, Ltd. (b) . . . . . . . . . . . . . . . . . . . . . . . . . . . . 644 32,482Cie Financiere Tradition S.A. . . . . . . . . . . . . . . . . . . . . . . . . . . . 579 61,952Coltene Holding AG . . . . . . . . . . . . . . . . . . . . . . . . . . . . . . . . . 1,132 129,189Conzzeta AG . . . . . . . . . . . . . . . . . . . . . . . . . . . . . . . . . . . . . 325 353,673Daetwyler Holding AG . . . . . . . . . . . . . . . . . . . . . . . . . . . . . . . 2,353 447,761DKSH Holding AG . . . . . . . . . . . . . . . . . . . . . . . . . . . . . . . . . . 4,251 289,156dormakaba Holding AG (b) . . . . . . . . . . . . . . . . . . . . . . . . . . . 840 632,329EDAG Engineering Group AG (b) . . . . . . . . . . . . . . . . . . . . . . . . 1,784 35,559EFG International AG (b) . . . . . . . . . . . . . . . . . . . . . . . . . . . . . 20,307 154,903Emmi AG . . . . . . . . . . . . . . . . . . . . . . . . . . . . . . . . . . . . . . . 773 576,598Energiedienst Holding AG . . . . . . . . . . . . . . . . . . . . . . . . . . . . . 3,017 93,443
Security Description Shares Value
Switzerland—(Continued)Evolva Holding S.A. (b) (e) . . . . . . . . . . . . . . . . . . . . . . . . . . . . 36,339 $ 10,627Feintool International Holding AG (b) . . . . . . . . . . . . . . . . . . . . . 588 67,105Fenix Outdoor International AG . . . . . . . . . . . . . . . . . . . . . . . . . 975 111,154Ferrexpo plc . . . . . . . . . . . . . . . . . . . . . . . . . . . . . . . . . . . . . 57,307 149,286Flughafen Zurich AG . . . . . . . . . . . . . . . . . . . . . . . . . . . . . . . . 3,210 648,899Forbo Holding AG . . . . . . . . . . . . . . . . . . . . . . . . . . . . . . . . . . 313 501,452GAM Holding AG (b) . . . . . . . . . . . . . . . . . . . . . . . . . . . . . . . . 68,723 487,420Georg Fischer AG . . . . . . . . . . . . . . . . . . . . . . . . . . . . . . . . . . 1,225 1,383,976Gurit Holding AG . . . . . . . . . . . . . . . . . . . . . . . . . . . . . . . . . . 164 137,969Helvetia Holding AG . . . . . . . . . . . . . . . . . . . . . . . . . . . . . . . . 2,402 1,462,276Hiag Immobilien Holding AG (b) . . . . . . . . . . . . . . . . . . . . . . . . 1,150 146,523Highlight Communications AG (b) (e) . . . . . . . . . . . . . . . . . . . . . 7,829 47,089HOCHDORF Holding AG (b) . . . . . . . . . . . . . . . . . . . . . . . . . . . . 174 31,265Huber & Suhner AG . . . . . . . . . . . . . . . . . . . . . . . . . . . . . . . . 5,559 415,486Implenia AG . . . . . . . . . . . . . . . . . . . . . . . . . . . . . . . . . . . . . 6,413 406,114Inficon Holding AG (b) . . . . . . . . . . . . . . . . . . . . . . . . . . . . . . . 568 290,243Interroll Holding AG . . . . . . . . . . . . . . . . . . . . . . . . . . . . . . . . 226 440,750Intershop Holding AG . . . . . . . . . . . . . . . . . . . . . . . . . . . . . . . 416 209,396IWG plc . . . . . . . . . . . . . . . . . . . . . . . . . . . . . . . . . . . . . . . . 206,169 652,007Jungfraubahn Holding AG . . . . . . . . . . . . . . . . . . . . . . . . . . . . 85 12,381Kardex AG (b) . . . . . . . . . . . . . . . . . . . . . . . . . . . . . . . . . . . . 2,247 381,415Komax Holding AG . . . . . . . . . . . . . . . . . . . . . . . . . . . . . . . . . 1,292 416,922Kudelski S.A. (b) (e) . . . . . . . . . . . . . . . . . . . . . . . . . . . . . . . . 13,221 112,972LEM Holding S.A. . . . . . . . . . . . . . . . . . . . . . . . . . . . . . . . . . . 246 289,579Luzerner Kantonalbank AG . . . . . . . . . . . . . . . . . . . . . . . . . . . . 1,452 735,743MCH Group AG (b) . . . . . . . . . . . . . . . . . . . . . . . . . . . . . . . . . 831 22,934Metall Zug AG - B Shares . . . . . . . . . . . . . . . . . . . . . . . . . . . . . 66 216,543Mikron Holding AG (b) . . . . . . . . . . . . . . . . . . . . . . . . . . . . . . 474 4,701Mobilezone Holding AG . . . . . . . . . . . . . . . . . . . . . . . . . . . . . . 11,899 140,791Mobimo Holding AG . . . . . . . . . . . . . . . . . . . . . . . . . . . . . . . . 2,761 652,479OC Oerlikon Corp. AG (b) . . . . . . . . . . . . . . . . . . . . . . . . . . . . . 57,156 782,815Orascom Development Holding AG (b) . . . . . . . . . . . . . . . . . . . . 5,250 63,922Orell Fuessli Holding AG . . . . . . . . . . . . . . . . . . . . . . . . . . . . . . 428 39,223Oriflame Holding AG (b) . . . . . . . . . . . . . . . . . . . . . . . . . . . . . 4,601 117,707Orior AG . . . . . . . . . . . . . . . . . . . . . . . . . . . . . . . . . . . . . . . . 2,240 209,979Panalpina Welttransport Holding AG . . . . . . . . . . . . . . . . . . . . . . 2,930 426,510Phoenix Mecano AG . . . . . . . . . . . . . . . . . . . . . . . . . . . . . . . . 274 181,738Plazza AG - Class A . . . . . . . . . . . . . . . . . . . . . . . . . . . . . . . . . 292 66,933PSP Swiss Property AG . . . . . . . . . . . . . . . . . . . . . . . . . . . . . . . 9,856 954,156Resurs Holding AB (144A) . . . . . . . . . . . . . . . . . . . . . . . . . . . . 17,270 129,256Rieter Holding AG (e) . . . . . . . . . . . . . . . . . . . . . . . . . . . . . . . 1,344 206,342Romande Energie Holding S.A. . . . . . . . . . . . . . . . . . . . . . . . . . 111 139,114Schaffner Holding AG (b) . . . . . . . . . . . . . . . . . . . . . . . . . . . . . 238 83,154Schmolz & Bickenbach AG (b) . . . . . . . . . . . . . . . . . . . . . . . . . . 161,565 127,419Schweiter Technologies AG . . . . . . . . . . . . . . . . . . . . . . . . . . . . 381 460,875SFS Group AG (b) . . . . . . . . . . . . . . . . . . . . . . . . . . . . . . . . . . 3,411 395,164Siegfried Holding AG (b) . . . . . . . . . . . . . . . . . . . . . . . . . . . . . 1,571 730,746St. Galler Kantonalbank AG . . . . . . . . . . . . . . . . . . . . . . . . . . . 1,123 567,857Sulzer AG . . . . . . . . . . . . . . . . . . . . . . . . . . . . . . . . . . . . . . . 4,412 529,511Sunrise Communications Group AG (144A) (b) . . . . . . . . . . . . . . . 9,217 833,792Swiss Prime Site AG (b) . . . . . . . . . . . . . . . . . . . . . . . . . . . . . . 1,578 134,452Swissquote Group Holding S.A. . . . . . . . . . . . . . . . . . . . . . . . . . 3,968 288,267Tamedia AG . . . . . . . . . . . . . . . . . . . . . . . . . . . . . . . . . . . . . 904 110,076Tecan Group AG . . . . . . . . . . . . . . . . . . . . . . . . . . . . . . . . . . . 1,978 467,723U-Blox Holding AG (b) (e) . . . . . . . . . . . . . . . . . . . . . . . . . . . . 2,262 323,731Valiant Holding AG . . . . . . . . . . . . . . . . . . . . . . . . . . . . . . . . . 5,102 577,800Valora Holding AG (b) . . . . . . . . . . . . . . . . . . . . . . . . . . . . . . . 1,467 393,543
BHFTII-93
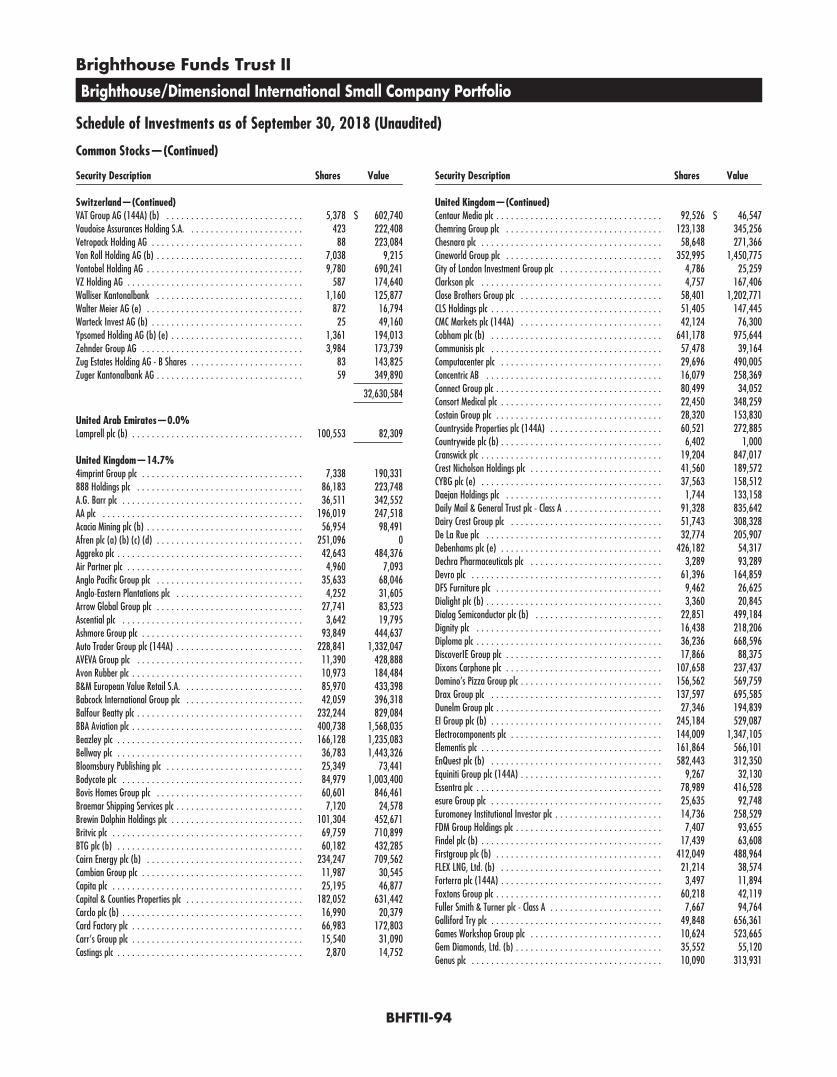
Brighthouse Funds Trust II
Brighthouse/Dimensional International Small Company Portfolio
Schedule of Investments as of September 30, 2018 (Unaudited)
Common Stocks—(Continued)
Security Description Shares Value
Switzerland—(Continued)VAT Group AG (144A) (b) . . . . . . . . . . . . . . . . . . . . . . . . . . . . 5,378 $ 602,740Vaudoise Assurances Holding S.A. . . . . . . . . . . . . . . . . . . . . . . . 423 222,408Vetropack Holding AG . . . . . . . . . . . . . . . . . . . . . . . . . . . . . . . 88 223,084Von Roll Holding AG (b) . . . . . . . . . . . . . . . . . . . . . . . . . . . . . . 7,038 9,215Vontobel Holding AG . . . . . . . . . . . . . . . . . . . . . . . . . . . . . . . . 9,780 690,241VZ Holding AG . . . . . . . . . . . . . . . . . . . . . . . . . . . . . . . . . . . . 587 174,640Walliser Kantonalbank . . . . . . . . . . . . . . . . . . . . . . . . . . . . . . 1,160 125,877Walter Meier AG (e) . . . . . . . . . . . . . . . . . . . . . . . . . . . . . . . . 872 16,794Warteck Invest AG (b) . . . . . . . . . . . . . . . . . . . . . . . . . . . . . . . 25 49,160Ypsomed Holding AG (b) (e) . . . . . . . . . . . . . . . . . . . . . . . . . . . 1,361 194,013Zehnder Group AG . . . . . . . . . . . . . . . . . . . . . . . . . . . . . . . . . 3,984 173,739Zug Estates Holding AG - B Shares . . . . . . . . . . . . . . . . . . . . . . . 83 143,825Zuger Kantonalbank AG . . . . . . . . . . . . . . . . . . . . . . . . . . . . . . 59 349,890
32,630,584
United Arab Emirates—0.0%Lamprell plc (b) . . . . . . . . . . . . . . . . . . . . . . . . . . . . . . . . . . . 100,553 82,309
United Kingdom—14.7%4imprint Group plc . . . . . . . . . . . . . . . . . . . . . . . . . . . . . . . . . 7,338 190,331888 Holdings plc . . . . . . . . . . . . . . . . . . . . . . . . . . . . . . . . . . 86,183 223,748A.G. Barr plc . . . . . . . . . . . . . . . . . . . . . . . . . . . . . . . . . . . . . 36,511 342,552AA plc . . . . . . . . . . . . . . . . . . . . . . . . . . . . . . . . . . . . . . . . . 196,019 247,518Acacia Mining plc (b) . . . . . . . . . . . . . . . . . . . . . . . . . . . . . . . . 56,954 98,491Afren plc (a) (b) (c) (d) . . . . . . . . . . . . . . . . . . . . . . . . . . . . . . 251,096 0Aggreko plc . . . . . . . . . . . . . . . . . . . . . . . . . . . . . . . . . . . . . . 42,643 484,376Air Partner plc . . . . . . . . . . . . . . . . . . . . . . . . . . . . . . . . . . . . 4,960 7,093Anglo Pacific Group plc . . . . . . . . . . . . . . . . . . . . . . . . . . . . . . 35,633 68,046Anglo-Eastern Plantations plc . . . . . . . . . . . . . . . . . . . . . . . . . . 4,252 31,605Arrow Global Group plc . . . . . . . . . . . . . . . . . . . . . . . . . . . . . . 27,741 83,523Ascential plc . . . . . . . . . . . . . . . . . . . . . . . . . . . . . . . . . . . . . 3,642 19,795Ashmore Group plc . . . . . . . . . . . . . . . . . . . . . . . . . . . . . . . . . 93,849 444,637Auto Trader Group plc (144A) . . . . . . . . . . . . . . . . . . . . . . . . . . 228,841 1,332,047AVEVA Group plc . . . . . . . . . . . . . . . . . . . . . . . . . . . . . . . . . . 11,390 428,888Avon Rubber plc . . . . . . . . . . . . . . . . . . . . . . . . . . . . . . . . . . . 10,973 184,484B&M European Value Retail S.A. . . . . . . . . . . . . . . . . . . . . . . . . 85,970 433,398Babcock International Group plc . . . . . . . . . . . . . . . . . . . . . . . . 42,059 396,318Balfour Beatty plc . . . . . . . . . . . . . . . . . . . . . . . . . . . . . . . . . . 232,244 829,084BBA Aviation plc . . . . . . . . . . . . . . . . . . . . . . . . . . . . . . . . . . . 400,738 1,568,035Beazley plc . . . . . . . . . . . . . . . . . . . . . . . . . . . . . . . . . . . . . . 166,128 1,235,083Bellway plc . . . . . . . . . . . . . . . . . . . . . . . . . . . . . . . . . . . . . . 36,783 1,443,326Bloomsbury Publishing plc . . . . . . . . . . . . . . . . . . . . . . . . . . . . 25,349 73,441Bodycote plc . . . . . . . . . . . . . . . . . . . . . . . . . . . . . . . . . . . . . 84,979 1,003,400Bovis Homes Group plc . . . . . . . . . . . . . . . . . . . . . . . . . . . . . . 60,601 846,461Braemar Shipping Services plc . . . . . . . . . . . . . . . . . . . . . . . . . . 7,120 24,578Brewin Dolphin Holdings plc . . . . . . . . . . . . . . . . . . . . . . . . . . . 101,304 452,671Britvic plc . . . . . . . . . . . . . . . . . . . . . . . . . . . . . . . . . . . . . . . 69,759 710,899BTG plc (b) . . . . . . . . . . . . . . . . . . . . . . . . . . . . . . . . . . . . . . 60,182 432,285Cairn Energy plc (b) . . . . . . . . . . . . . . . . . . . . . . . . . . . . . . . . 234,247 709,562Cambian Group plc . . . . . . . . . . . . . . . . . . . . . . . . . . . . . . . . . 11,987 30,545Capita plc . . . . . . . . . . . . . . . . . . . . . . . . . . . . . . . . . . . . . . . 25,195 46,877Capital & Counties Properties plc . . . . . . . . . . . . . . . . . . . . . . . . 182,052 631,442Carclo plc (b) . . . . . . . . . . . . . . . . . . . . . . . . . . . . . . . . . . . . . 16,990 20,379Card Factory plc . . . . . . . . . . . . . . . . . . . . . . . . . . . . . . . . . . . 66,983 172,803Carr’s Group plc . . . . . . . . . . . . . . . . . . . . . . . . . . . . . . . . . . . 15,540 31,090Castings plc . . . . . . . . . . . . . . . . . . . . . . . . . . . . . . . . . . . . . . 2,870 14,752
Security Description Shares Value
United Kingdom—(Continued)Centaur Media plc . . . . . . . . . . . . . . . . . . . . . . . . . . . . . . . . . . 92,526 $ 46,547Chemring Group plc . . . . . . . . . . . . . . . . . . . . . . . . . . . . . . . . 123,138 345,256Chesnara plc . . . . . . . . . . . . . . . . . . . . . . . . . . . . . . . . . . . . . 58,648 271,366Cineworld Group plc . . . . . . . . . . . . . . . . . . . . . . . . . . . . . . . . 352,995 1,450,775City of London Investment Group plc . . . . . . . . . . . . . . . . . . . . . 4,786 25,259Clarkson plc . . . . . . . . . . . . . . . . . . . . . . . . . . . . . . . . . . . . . 4,757 167,406Close Brothers Group plc . . . . . . . . . . . . . . . . . . . . . . . . . . . . . 58,401 1,202,771CLS Holdings plc . . . . . . . . . . . . . . . . . . . . . . . . . . . . . . . . . . . 51,405 147,445CMC Markets plc (144A) . . . . . . . . . . . . . . . . . . . . . . . . . . . . . 42,124 76,300Cobham plc (b) . . . . . . . . . . . . . . . . . . . . . . . . . . . . . . . . . . . 641,178 975,644Communisis plc . . . . . . . . . . . . . . . . . . . . . . . . . . . . . . . . . . . 57,478 39,164Computacenter plc . . . . . . . . . . . . . . . . . . . . . . . . . . . . . . . . . 29,696 490,005Concentric AB . . . . . . . . . . . . . . . . . . . . . . . . . . . . . . . . . . . . 16,079 258,369Connect Group plc . . . . . . . . . . . . . . . . . . . . . . . . . . . . . . . . . . 80,499 34,052Consort Medical plc . . . . . . . . . . . . . . . . . . . . . . . . . . . . . . . . . 22,450 348,259Costain Group plc . . . . . . . . . . . . . . . . . . . . . . . . . . . . . . . . . . 28,320 153,830Countryside Properties plc (144A) . . . . . . . . . . . . . . . . . . . . . . . 60,521 272,885Countrywide plc (b) . . . . . . . . . . . . . . . . . . . . . . . . . . . . . . . . . 6,402 1,000Cranswick plc . . . . . . . . . . . . . . . . . . . . . . . . . . . . . . . . . . . . . 19,204 847,017Crest Nicholson Holdings plc . . . . . . . . . . . . . . . . . . . . . . . . . . . 41,560 189,572CYBG plc (e) . . . . . . . . . . . . . . . . . . . . . . . . . . . . . . . . . . . . . 37,563 158,512Daejan Holdings plc . . . . . . . . . . . . . . . . . . . . . . . . . . . . . . . . 1,744 133,158Daily Mail & General Trust plc - Class A . . . . . . . . . . . . . . . . . . . . 91,328 835,642Dairy Crest Group plc . . . . . . . . . . . . . . . . . . . . . . . . . . . . . . . 51,743 308,328De La Rue plc . . . . . . . . . . . . . . . . . . . . . . . . . . . . . . . . . . . . 32,774 205,907Debenhams plc (e) . . . . . . . . . . . . . . . . . . . . . . . . . . . . . . . . . 426,182 54,317Dechra Pharmaceuticals plc . . . . . . . . . . . . . . . . . . . . . . . . . . . 3,289 93,289Devro plc . . . . . . . . . . . . . . . . . . . . . . . . . . . . . . . . . . . . . . . 61,396 164,859DFS Furniture plc . . . . . . . . . . . . . . . . . . . . . . . . . . . . . . . . . . 9,462 26,625Dialight plc (b) . . . . . . . . . . . . . . . . . . . . . . . . . . . . . . . . . . . . 3,360 20,845Dialog Semiconductor plc (b) . . . . . . . . . . . . . . . . . . . . . . . . . . 22,851 499,184Dignity plc . . . . . . . . . . . . . . . . . . . . . . . . . . . . . . . . . . . . . . 16,438 218,206Diploma plc . . . . . . . . . . . . . . . . . . . . . . . . . . . . . . . . . . . . . . 36,236 668,596DiscoverIE Group plc . . . . . . . . . . . . . . . . . . . . . . . . . . . . . . . . 17,866 88,375Dixons Carphone plc . . . . . . . . . . . . . . . . . . . . . . . . . . . . . . . . 107,658 237,437Domino’s Pizza Group plc . . . . . . . . . . . . . . . . . . . . . . . . . . . . . 156,562 569,759Drax Group plc . . . . . . . . . . . . . . . . . . . . . . . . . . . . . . . . . . . 137,597 695,585Dunelm Group plc . . . . . . . . . . . . . . . . . . . . . . . . . . . . . . . . . . 27,346 194,839EI Group plc (b) . . . . . . . . . . . . . . . . . . . . . . . . . . . . . . . . . . . 245,184 529,087Electrocomponents plc . . . . . . . . . . . . . . . . . . . . . . . . . . . . . . . 144,009 1,347,105Elementis plc . . . . . . . . . . . . . . . . . . . . . . . . . . . . . . . . . . . . . 161,864 566,101EnQuest plc (b) . . . . . . . . . . . . . . . . . . . . . . . . . . . . . . . . . . . 582,443 312,350Equiniti Group plc (144A) . . . . . . . . . . . . . . . . . . . . . . . . . . . . . 9,267 32,130Essentra plc . . . . . . . . . . . . . . . . . . . . . . . . . . . . . . . . . . . . . . 78,989 416,528esure Group plc . . . . . . . . . . . . . . . . . . . . . . . . . . . . . . . . . . . 25,635 92,748Euromoney Institutional Investor plc . . . . . . . . . . . . . . . . . . . . . . 14,736 258,529FDM Group Holdings plc . . . . . . . . . . . . . . . . . . . . . . . . . . . . . . 7,407 93,655Findel plc (b) . . . . . . . . . . . . . . . . . . . . . . . . . . . . . . . . . . . . . 17,439 63,608Firstgroup plc (b) . . . . . . . . . . . . . . . . . . . . . . . . . . . . . . . . . . 412,049 488,964FLEX LNG, Ltd. (b) . . . . . . . . . . . . . . . . . . . . . . . . . . . . . . . . . 21,214 38,574Forterra plc (144A) . . . . . . . . . . . . . . . . . . . . . . . . . . . . . . . . . 3,497 11,894Foxtons Group plc . . . . . . . . . . . . . . . . . . . . . . . . . . . . . . . . . . 60,218 42,119Fuller Smith & Turner plc - Class A . . . . . . . . . . . . . . . . . . . . . . . 7,667 94,764Galliford Try plc . . . . . . . . . . . . . . . . . . . . . . . . . . . . . . . . . . . 49,848 656,361Games Workshop Group plc . . . . . . . . . . . . . . . . . . . . . . . . . . . 10,624 523,665Gem Diamonds, Ltd. (b) . . . . . . . . . . . . . . . . . . . . . . . . . . . . . . 35,552 55,120Genus plc . . . . . . . . . . . . . . . . . . . . . . . . . . . . . . . . . . . . . . . 10,090 313,931
BHFTII-94
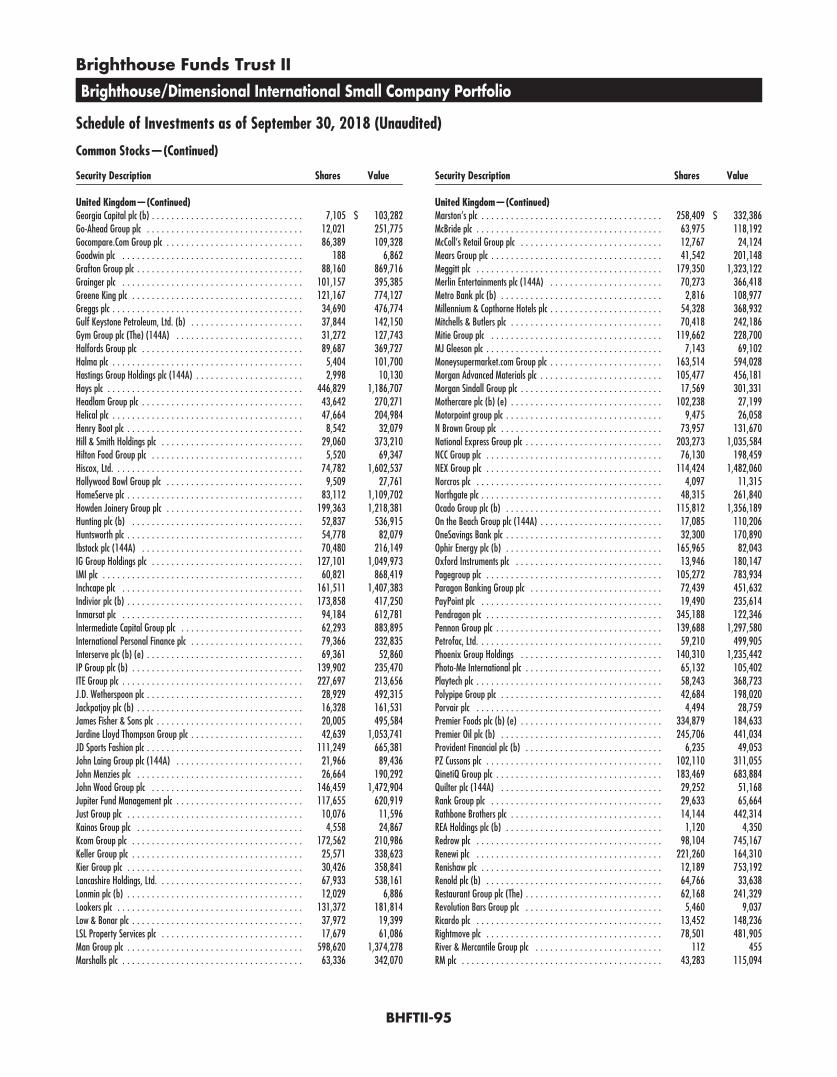
Brighthouse Funds Trust II
Brighthouse/Dimensional International Small Company Portfolio
Schedule of Investments as of September 30, 2018 (Unaudited)
Common Stocks—(Continued)
Security Description Shares Value
United Kingdom—(Continued)Georgia Capital plc (b) . . . . . . . . . . . . . . . . . . . . . . . . . . . . . . . 7,105 $ 103,282Go-Ahead Group plc . . . . . . . . . . . . . . . . . . . . . . . . . . . . . . . . 12,021 251,775Gocompare.Com Group plc . . . . . . . . . . . . . . . . . . . . . . . . . . . . 86,389 109,328Goodwin plc . . . . . . . . . . . . . . . . . . . . . . . . . . . . . . . . . . . . . 188 6,862Grafton Group plc . . . . . . . . . . . . . . . . . . . . . . . . . . . . . . . . . . 88,160 869,716Grainger plc . . . . . . . . . . . . . . . . . . . . . . . . . . . . . . . . . . . . . 101,157 395,385Greene King plc . . . . . . . . . . . . . . . . . . . . . . . . . . . . . . . . . . . 121,167 774,127Greggs plc . . . . . . . . . . . . . . . . . . . . . . . . . . . . . . . . . . . . . . . 34,690 476,774Gulf Keystone Petroleum, Ltd. (b) . . . . . . . . . . . . . . . . . . . . . . . 37,844 142,150Gym Group plc (The) (144A) . . . . . . . . . . . . . . . . . . . . . . . . . . 31,272 127,743Halfords Group plc . . . . . . . . . . . . . . . . . . . . . . . . . . . . . . . . . 89,687 369,727Halma plc . . . . . . . . . . . . . . . . . . . . . . . . . . . . . . . . . . . . . . . 5,404 101,700Hastings Group Holdings plc (144A) . . . . . . . . . . . . . . . . . . . . . . 2,998 10,130Hays plc . . . . . . . . . . . . . . . . . . . . . . . . . . . . . . . . . . . . . . . . 446,829 1,186,707Headlam Group plc . . . . . . . . . . . . . . . . . . . . . . . . . . . . . . . . . 43,642 270,271Helical plc . . . . . . . . . . . . . . . . . . . . . . . . . . . . . . . . . . . . . . . 47,664 204,984Henry Boot plc . . . . . . . . . . . . . . . . . . . . . . . . . . . . . . . . . . . . 8,542 32,079Hill & Smith Holdings plc . . . . . . . . . . . . . . . . . . . . . . . . . . . . . 29,060 373,210Hilton Food Group plc . . . . . . . . . . . . . . . . . . . . . . . . . . . . . . . 5,520 69,347Hiscox, Ltd. . . . . . . . . . . . . . . . . . . . . . . . . . . . . . . . . . . . . . . 74,782 1,602,537Hollywood Bowl Group plc . . . . . . . . . . . . . . . . . . . . . . . . . . . . 9,509 27,761HomeServe plc . . . . . . . . . . . . . . . . . . . . . . . . . . . . . . . . . . . . 83,112 1,109,702Howden Joinery Group plc . . . . . . . . . . . . . . . . . . . . . . . . . . . . 199,363 1,218,381Hunting plc (b) . . . . . . . . . . . . . . . . . . . . . . . . . . . . . . . . . . . 52,837 536,915Huntsworth plc . . . . . . . . . . . . . . . . . . . . . . . . . . . . . . . . . . . . 54,778 82,079Ibstock plc (144A) . . . . . . . . . . . . . . . . . . . . . . . . . . . . . . . . . 70,480 216,149IG Group Holdings plc . . . . . . . . . . . . . . . . . . . . . . . . . . . . . . . 127,101 1,049,973IMI plc . . . . . . . . . . . . . . . . . . . . . . . . . . . . . . . . . . . . . . . . . 60,821 868,419Inchcape plc . . . . . . . . . . . . . . . . . . . . . . . . . . . . . . . . . . . . . 161,511 1,407,383Indivior plc (b) . . . . . . . . . . . . . . . . . . . . . . . . . . . . . . . . . . . . 173,858 417,250Inmarsat plc . . . . . . . . . . . . . . . . . . . . . . . . . . . . . . . . . . . . . 94,184 612,781Intermediate Capital Group plc . . . . . . . . . . . . . . . . . . . . . . . . . 62,293 883,895International Personal Finance plc . . . . . . . . . . . . . . . . . . . . . . . 79,366 232,835Interserve plc (b) (e) . . . . . . . . . . . . . . . . . . . . . . . . . . . . . . . . 69,361 52,860IP Group plc (b) . . . . . . . . . . . . . . . . . . . . . . . . . . . . . . . . . . . 139,902 235,470ITE Group plc . . . . . . . . . . . . . . . . . . . . . . . . . . . . . . . . . . . . . 227,697 213,656J.D. Wetherspoon plc . . . . . . . . . . . . . . . . . . . . . . . . . . . . . . . . 28,929 492,315Jackpotjoy plc (b) . . . . . . . . . . . . . . . . . . . . . . . . . . . . . . . . . . 16,328 161,531James Fisher & Sons plc . . . . . . . . . . . . . . . . . . . . . . . . . . . . . . 20,005 495,584Jardine Lloyd Thompson Group plc . . . . . . . . . . . . . . . . . . . . . . . 42,639 1,053,741JD Sports Fashion plc . . . . . . . . . . . . . . . . . . . . . . . . . . . . . . . . 111,249 665,381John Laing Group plc (144A) . . . . . . . . . . . . . . . . . . . . . . . . . . 21,966 89,436John Menzies plc . . . . . . . . . . . . . . . . . . . . . . . . . . . . . . . . . . 26,664 190,292John Wood Group plc . . . . . . . . . . . . . . . . . . . . . . . . . . . . . . . 146,459 1,472,904Jupiter Fund Management plc . . . . . . . . . . . . . . . . . . . . . . . . . . 117,655 620,919Just Group plc . . . . . . . . . . . . . . . . . . . . . . . . . . . . . . . . . . . . 10,076 11,596Kainos Group plc . . . . . . . . . . . . . . . . . . . . . . . . . . . . . . . . . . 4,558 24,867Kcom Group plc . . . . . . . . . . . . . . . . . . . . . . . . . . . . . . . . . . . 172,562 210,986Keller Group plc . . . . . . . . . . . . . . . . . . . . . . . . . . . . . . . . . . . 25,571 338,623Kier Group plc . . . . . . . . . . . . . . . . . . . . . . . . . . . . . . . . . . . . 30,426 358,841Lancashire Holdings, Ltd. . . . . . . . . . . . . . . . . . . . . . . . . . . . . . 67,933 538,161Lonmin plc (b) . . . . . . . . . . . . . . . . . . . . . . . . . . . . . . . . . . . . 12,029 6,886Lookers plc . . . . . . . . . . . . . . . . . . . . . . . . . . . . . . . . . . . . . . 131,372 181,814Low & Bonar plc . . . . . . . . . . . . . . . . . . . . . . . . . . . . . . . . . . . 37,972 19,399LSL Property Services plc . . . . . . . . . . . . . . . . . . . . . . . . . . . . . 17,679 61,086Man Group plc . . . . . . . . . . . . . . . . . . . . . . . . . . . . . . . . . . . . 598,620 1,374,278Marshalls plc . . . . . . . . . . . . . . . . . . . . . . . . . . . . . . . . . . . . . 63,336 342,070
Security Description Shares Value
United Kingdom—(Continued)Marston’s plc . . . . . . . . . . . . . . . . . . . . . . . . . . . . . . . . . . . . . 258,409 $ 332,386McBride plc . . . . . . . . . . . . . . . . . . . . . . . . . . . . . . . . . . . . . . 63,975 118,192McColl’s Retail Group plc . . . . . . . . . . . . . . . . . . . . . . . . . . . . . 12,767 24,124Mears Group plc . . . . . . . . . . . . . . . . . . . . . . . . . . . . . . . . . . . 41,542 201,148Meggitt plc . . . . . . . . . . . . . . . . . . . . . . . . . . . . . . . . . . . . . . 179,350 1,323,122Merlin Entertainments plc (144A) . . . . . . . . . . . . . . . . . . . . . . . 70,273 366,418Metro Bank plc (b) . . . . . . . . . . . . . . . . . . . . . . . . . . . . . . . . . 2,816 108,977Millennium & Copthorne Hotels plc . . . . . . . . . . . . . . . . . . . . . . . 54,328 368,932Mitchells & Butlers plc . . . . . . . . . . . . . . . . . . . . . . . . . . . . . . . 70,418 242,186Mitie Group plc . . . . . . . . . . . . . . . . . . . . . . . . . . . . . . . . . . . 119,662 228,700MJ Gleeson plc . . . . . . . . . . . . . . . . . . . . . . . . . . . . . . . . . . . . 7,143 69,102Moneysupermarket.com Group plc . . . . . . . . . . . . . . . . . . . . . . . 163,514 594,028Morgan Advanced Materials plc . . . . . . . . . . . . . . . . . . . . . . . . . 105,477 456,181Morgan Sindall Group plc . . . . . . . . . . . . . . . . . . . . . . . . . . . . . 17,569 301,331Mothercare plc (b) (e) . . . . . . . . . . . . . . . . . . . . . . . . . . . . . . . 102,238 27,199Motorpoint group plc . . . . . . . . . . . . . . . . . . . . . . . . . . . . . . . . 9,475 26,058N Brown Group plc . . . . . . . . . . . . . . . . . . . . . . . . . . . . . . . . . 73,957 131,670National Express Group plc . . . . . . . . . . . . . . . . . . . . . . . . . . . . 203,273 1,035,584NCC Group plc . . . . . . . . . . . . . . . . . . . . . . . . . . . . . . . . . . . . 76,130 198,459NEX Group plc . . . . . . . . . . . . . . . . . . . . . . . . . . . . . . . . . . . . 114,424 1,482,060Norcros plc . . . . . . . . . . . . . . . . . . . . . . . . . . . . . . . . . . . . . . 4,097 11,315Northgate plc . . . . . . . . . . . . . . . . . . . . . . . . . . . . . . . . . . . . . 48,315 261,840Ocado Group plc (b) . . . . . . . . . . . . . . . . . . . . . . . . . . . . . . . . 115,812 1,356,189On the Beach Group plc (144A) . . . . . . . . . . . . . . . . . . . . . . . . . 17,085 110,206OneSavings Bank plc . . . . . . . . . . . . . . . . . . . . . . . . . . . . . . . . 32,300 170,890Ophir Energy plc (b) . . . . . . . . . . . . . . . . . . . . . . . . . . . . . . . . 165,965 82,043Oxford Instruments plc . . . . . . . . . . . . . . . . . . . . . . . . . . . . . . 13,946 180,147Pagegroup plc . . . . . . . . . . . . . . . . . . . . . . . . . . . . . . . . . . . . 105,272 783,934Paragon Banking Group plc . . . . . . . . . . . . . . . . . . . . . . . . . . . 72,439 451,632PayPoint plc . . . . . . . . . . . . . . . . . . . . . . . . . . . . . . . . . . . . . 19,490 235,614Pendragon plc . . . . . . . . . . . . . . . . . . . . . . . . . . . . . . . . . . . . 345,188 122,346Pennon Group plc . . . . . . . . . . . . . . . . . . . . . . . . . . . . . . . . . . 139,688 1,297,580Petrofac, Ltd. . . . . . . . . . . . . . . . . . . . . . . . . . . . . . . . . . . . . . 59,210 499,905Phoenix Group Holdings . . . . . . . . . . . . . . . . . . . . . . . . . . . . . 140,310 1,235,442Photo-Me International plc . . . . . . . . . . . . . . . . . . . . . . . . . . . . 65,132 105,402Playtech plc . . . . . . . . . . . . . . . . . . . . . . . . . . . . . . . . . . . . . . 58,243 368,723Polypipe Group plc . . . . . . . . . . . . . . . . . . . . . . . . . . . . . . . . . 42,684 198,020Porvair plc . . . . . . . . . . . . . . . . . . . . . . . . . . . . . . . . . . . . . . 4,494 28,759Premier Foods plc (b) (e) . . . . . . . . . . . . . . . . . . . . . . . . . . . . . 334,879 184,633Premier Oil plc (b) . . . . . . . . . . . . . . . . . . . . . . . . . . . . . . . . . 245,706 441,034Provident Financial plc (b) . . . . . . . . . . . . . . . . . . . . . . . . . . . . 6,235 49,053PZ Cussons plc . . . . . . . . . . . . . . . . . . . . . . . . . . . . . . . . . . . . 102,110 311,055QinetiQ Group plc . . . . . . . . . . . . . . . . . . . . . . . . . . . . . . . . . . 183,469 683,884Quilter plc (144A) . . . . . . . . . . . . . . . . . . . . . . . . . . . . . . . . . 29,252 51,168Rank Group plc . . . . . . . . . . . . . . . . . . . . . . . . . . . . . . . . . . . 29,633 65,664Rathbone Brothers plc . . . . . . . . . . . . . . . . . . . . . . . . . . . . . . . 14,144 442,314REA Holdings plc (b) . . . . . . . . . . . . . . . . . . . . . . . . . . . . . . . . 1,120 4,350Redrow plc . . . . . . . . . . . . . . . . . . . . . . . . . . . . . . . . . . . . . . 98,104 745,167Renewi plc . . . . . . . . . . . . . . . . . . . . . . . . . . . . . . . . . . . . . . 221,260 164,310Renishaw plc . . . . . . . . . . . . . . . . . . . . . . . . . . . . . . . . . . . . . 12,189 753,192Renold plc (b) . . . . . . . . . . . . . . . . . . . . . . . . . . . . . . . . . . . . 64,766 33,638Restaurant Group plc (The) . . . . . . . . . . . . . . . . . . . . . . . . . . . . 62,168 241,329Revolution Bars Group plc . . . . . . . . . . . . . . . . . . . . . . . . . . . . 5,460 9,037Ricardo plc . . . . . . . . . . . . . . . . . . . . . . . . . . . . . . . . . . . . . . 13,452 148,236Rightmove plc . . . . . . . . . . . . . . . . . . . . . . . . . . . . . . . . . . . . 78,501 481,905River & Mercantile Group plc . . . . . . . . . . . . . . . . . . . . . . . . . . 112 455RM plc . . . . . . . . . . . . . . . . . . . . . . . . . . . . . . . . . . . . . . . . . 43,283 115,094
BHFTII-95
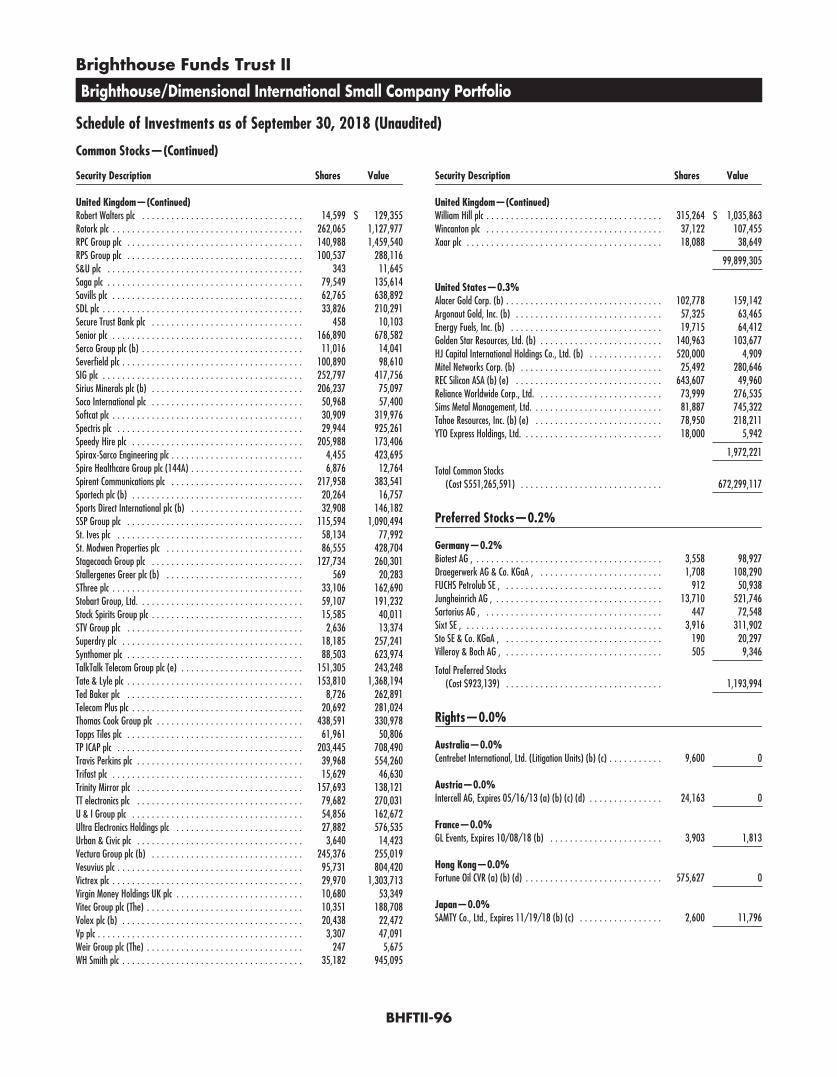
Brighthouse Funds Trust II
Brighthouse/Dimensional International Small Company Portfolio
Schedule of Investments as of September 30, 2018 (Unaudited)
Common Stocks—(Continued)
Security Description Shares Value
United Kingdom—(Continued)Robert Walters plc . . . . . . . . . . . . . . . . . . . . . . . . . . . . . . . . . 14,599 $ 129,355Rotork plc . . . . . . . . . . . . . . . . . . . . . . . . . . . . . . . . . . . . . . . 262,065 1,127,977RPC Group plc . . . . . . . . . . . . . . . . . . . . . . . . . . . . . . . . . . . . 140,988 1,459,540RPS Group plc . . . . . . . . . . . . . . . . . . . . . . . . . . . . . . . . . . . . 100,537 288,116S&U plc . . . . . . . . . . . . . . . . . . . . . . . . . . . . . . . . . . . . . . . . 343 11,645Saga plc . . . . . . . . . . . . . . . . . . . . . . . . . . . . . . . . . . . . . . . . 79,549 135,614Savills plc . . . . . . . . . . . . . . . . . . . . . . . . . . . . . . . . . . . . . . . 62,765 638,892SDL plc . . . . . . . . . . . . . . . . . . . . . . . . . . . . . . . . . . . . . . . . . 33,826 210,291Secure Trust Bank plc . . . . . . . . . . . . . . . . . . . . . . . . . . . . . . . 458 10,103Senior plc . . . . . . . . . . . . . . . . . . . . . . . . . . . . . . . . . . . . . . . 166,890 678,582Serco Group plc (b) . . . . . . . . . . . . . . . . . . . . . . . . . . . . . . . . . 11,016 14,041Severfield plc . . . . . . . . . . . . . . . . . . . . . . . . . . . . . . . . . . . . . 100,890 98,610SIG plc . . . . . . . . . . . . . . . . . . . . . . . . . . . . . . . . . . . . . . . . . 252,797 417,756Sirius Minerals plc (b) . . . . . . . . . . . . . . . . . . . . . . . . . . . . . . . 206,237 75,097Soco International plc . . . . . . . . . . . . . . . . . . . . . . . . . . . . . . . 50,968 57,400Softcat plc . . . . . . . . . . . . . . . . . . . . . . . . . . . . . . . . . . . . . . . 30,909 319,976Spectris plc . . . . . . . . . . . . . . . . . . . . . . . . . . . . . . . . . . . . . . 29,944 925,261Speedy Hire plc . . . . . . . . . . . . . . . . . . . . . . . . . . . . . . . . . . . 205,988 173,406Spirax-Sarco Engineering plc . . . . . . . . . . . . . . . . . . . . . . . . . . . 4,455 423,695Spire Healthcare Group plc (144A) . . . . . . . . . . . . . . . . . . . . . . . 6,876 12,764Spirent Communications plc . . . . . . . . . . . . . . . . . . . . . . . . . . . 217,958 383,541Sportech plc (b) . . . . . . . . . . . . . . . . . . . . . . . . . . . . . . . . . . . 20,264 16,757Sports Direct International plc (b) . . . . . . . . . . . . . . . . . . . . . . . 32,908 146,182SSP Group plc . . . . . . . . . . . . . . . . . . . . . . . . . . . . . . . . . . . . 115,594 1,090,494St. Ives plc . . . . . . . . . . . . . . . . . . . . . . . . . . . . . . . . . . . . . . 58,134 77,992St. Modwen Properties plc . . . . . . . . . . . . . . . . . . . . . . . . . . . . 86,555 428,704Stagecoach Group plc . . . . . . . . . . . . . . . . . . . . . . . . . . . . . . . 127,734 260,301Stallergenes Greer plc (b) . . . . . . . . . . . . . . . . . . . . . . . . . . . . 569 20,283SThree plc . . . . . . . . . . . . . . . . . . . . . . . . . . . . . . . . . . . . . . . 33,106 162,690Stobart Group, Ltd. . . . . . . . . . . . . . . . . . . . . . . . . . . . . . . . . . 59,107 191,232Stock Spirits Group plc . . . . . . . . . . . . . . . . . . . . . . . . . . . . . . . 15,585 40,011STV Group plc . . . . . . . . . . . . . . . . . . . . . . . . . . . . . . . . . . . . 2,636 13,374Superdry plc . . . . . . . . . . . . . . . . . . . . . . . . . . . . . . . . . . . . . 18,185 257,241Synthomer plc . . . . . . . . . . . . . . . . . . . . . . . . . . . . . . . . . . . . 88,503 623,974TalkTalk Telecom Group plc (e) . . . . . . . . . . . . . . . . . . . . . . . . . 151,305 243,248Tate & Lyle plc . . . . . . . . . . . . . . . . . . . . . . . . . . . . . . . . . . . . 153,810 1,368,194Ted Baker plc . . . . . . . . . . . . . . . . . . . . . . . . . . . . . . . . . . . . 8,726 262,891Telecom Plus plc . . . . . . . . . . . . . . . . . . . . . . . . . . . . . . . . . . . 20,692 281,024Thomas Cook Group plc . . . . . . . . . . . . . . . . . . . . . . . . . . . . . . 438,591 330,978Topps Tiles plc . . . . . . . . . . . . . . . . . . . . . . . . . . . . . . . . . . . . 61,961 50,806TP ICAP plc . . . . . . . . . . . . . . . . . . . . . . . . . . . . . . . . . . . . . . 203,445 708,490Travis Perkins plc . . . . . . . . . . . . . . . . . . . . . . . . . . . . . . . . . . 39,968 554,260Trifast plc . . . . . . . . . . . . . . . . . . . . . . . . . . . . . . . . . . . . . . . 15,629 46,630Trinity Mirror plc . . . . . . . . . . . . . . . . . . . . . . . . . . . . . . . . . . 157,693 138,121TT electronics plc . . . . . . . . . . . . . . . . . . . . . . . . . . . . . . . . . . 79,682 270,031U & I Group plc . . . . . . . . . . . . . . . . . . . . . . . . . . . . . . . . . . . 54,856 162,672Ultra Electronics Holdings plc . . . . . . . . . . . . . . . . . . . . . . . . . . 27,882 576,535Urban & Civic plc . . . . . . . . . . . . . . . . . . . . . . . . . . . . . . . . . . 3,640 14,423Vectura Group plc (b) . . . . . . . . . . . . . . . . . . . . . . . . . . . . . . . 245,376 255,019Vesuvius plc . . . . . . . . . . . . . . . . . . . . . . . . . . . . . . . . . . . . . . 95,731 804,420Victrex plc . . . . . . . . . . . . . . . . . . . . . . . . . . . . . . . . . . . . . . . 29,970 1,303,713Virgin Money Holdings UK plc . . . . . . . . . . . . . . . . . . . . . . . . . . 10,680 53,349Vitec Group plc (The) . . . . . . . . . . . . . . . . . . . . . . . . . . . . . . . . 10,351 188,708Volex plc (b) . . . . . . . . . . . . . . . . . . . . . . . . . . . . . . . . . . . . . 20,438 22,472Vp plc . . . . . . . . . . . . . . . . . . . . . . . . . . . . . . . . . . . . . . . . . . 3,307 47,091Weir Group plc (The) . . . . . . . . . . . . . . . . . . . . . . . . . . . . . . . . 247 5,675WH Smith plc . . . . . . . . . . . . . . . . . . . . . . . . . . . . . . . . . . . . . 35,182 945,095
Security Description Shares Value
United Kingdom—(Continued)William Hill plc . . . . . . . . . . . . . . . . . . . . . . . . . . . . . . . . . . . . 315,264 $ 1,035,863Wincanton plc . . . . . . . . . . . . . . . . . . . . . . . . . . . . . . . . . . . . 37,122 107,455Xaar plc . . . . . . . . . . . . . . . . . . . . . . . . . . . . . . . . . . . . . . . . 18,088 38,649
99,899,305
United States—0.3%Alacer Gold Corp. (b) . . . . . . . . . . . . . . . . . . . . . . . . . . . . . . . . 102,778 159,142Argonaut Gold, Inc. (b) . . . . . . . . . . . . . . . . . . . . . . . . . . . . . . 57,325 63,465Energy Fuels, Inc. (b) . . . . . . . . . . . . . . . . . . . . . . . . . . . . . . . 19,715 64,412Golden Star Resources, Ltd. (b) . . . . . . . . . . . . . . . . . . . . . . . . . 140,963 103,677HJ Capital International Holdings Co., Ltd. (b) . . . . . . . . . . . . . . . 520,000 4,909Mitel Networks Corp. (b) . . . . . . . . . . . . . . . . . . . . . . . . . . . . . 25,492 280,646REC Silicon ASA (b) (e) . . . . . . . . . . . . . . . . . . . . . . . . . . . . . . 643,607 49,960Reliance Worldwide Corp., Ltd. . . . . . . . . . . . . . . . . . . . . . . . . . 73,999 276,535Sims Metal Management, Ltd. . . . . . . . . . . . . . . . . . . . . . . . . . . 81,887 745,322Tahoe Resources, Inc. (b) (e) . . . . . . . . . . . . . . . . . . . . . . . . . . 78,950 218,211YTO Express Holdings, Ltd. . . . . . . . . . . . . . . . . . . . . . . . . . . . . 18,000 5,942
1,972,221
Total Common Stocks(Cost $551,265,591) . . . . . . . . . . . . . . . . . . . . . . . . . . . . . 672,299,117
Preferred Stocks—0.2%
Germany—0.2%Biotest AG , . . . . . . . . . . . . . . . . . . . . . . . . . . . . . . . . . . . . . . 3,558 98,927Draegerwerk AG & Co. KGaA , . . . . . . . . . . . . . . . . . . . . . . . . . 1,708 108,290FUCHS Petrolub SE , . . . . . . . . . . . . . . . . . . . . . . . . . . . . . . . . 912 50,938Jungheinrich AG , . . . . . . . . . . . . . . . . . . . . . . . . . . . . . . . . . . 13,710 521,746Sartorius AG , . . . . . . . . . . . . . . . . . . . . . . . . . . . . . . . . . . . . 447 72,548Sixt SE , . . . . . . . . . . . . . . . . . . . . . . . . . . . . . . . . . . . . . . . . 3,916 311,902Sto SE & Co. KGaA , . . . . . . . . . . . . . . . . . . . . . . . . . . . . . . . . 190 20,297Villeroy & Boch AG , . . . . . . . . . . . . . . . . . . . . . . . . . . . . . . . . 505 9,346
Total Preferred Stocks(Cost $923,139) . . . . . . . . . . . . . . . . . . . . . . . . . . . . . . . . 1,193,994
Rights—0.0%
Australia—0.0%Centrebet International, Ltd. (Litigation Units) (b) (c) . . . . . . . . . . . 9,600 0
Austria—0.0%Intercell AG, Expires 05/16/13 (a) (b) (c) (d) . . . . . . . . . . . . . . . 24,163 0
France—0.0%GL Events, Expires 10/08/18 (b) . . . . . . . . . . . . . . . . . . . . . . . 3,903 1,813
Hong Kong—0.0%Fortune Oil CVR (a) (b) (d) . . . . . . . . . . . . . . . . . . . . . . . . . . . . 575,627 0
Japan—0.0%SAMTY Co., Ltd., Expires 11/19/18 (b) (c) . . . . . . . . . . . . . . . . . 2,600 11,796
BHFTII-96

Brighthouse Funds Trust II
Brighthouse/Dimensional International Small Company Portfolio
Schedule of Investments as of September 30, 2018 (Unaudited)
Rights—(Continued)
Security Description
Shares/PrincipalAmount* Value
Singapore—0.0%Hong Leong Asia, Ltd., Expires 10/19/18 (b) (c) . . . . . . . . . . . . . 41,000 $ 600
Sweden—0.0%Mekonomen AB, Expires 10/18/18 (b) . . . . . . . . . . . . . . . . . . . 36,900 28,113
United Kingdom—0.0%Ladbrokes Coral Group . . . . . . . . . . . . . . . . . . . . . . . . . . . . . . 312,983 44,180
Total Rights(Cost $34,364) . . . . . . . . . . . . . . . . . . . . . . . . . . . . . . . . . 86,502
Warrant—0.0%
Canada—0.0%Tervita Corp., Expires 07/19/20 (b) (e) . . . . . . . . . . . . . . . . . . . 733 142
Israel—0.0%Space Communication, Ltd., Expires 10/23/18 (b) . . . . . . . . . . . . 1 0
Singapore—0.0%Ezion Holdings, Ltd., Expires 04/16/23 (a) (b) (c) (d) . . . . . . . . . . 309,737 0
Total Warrants(Cost $2) . . . . . . . . . . . . . . . . . . . . . . . . . . . . . . . . . . . . . 142
Short-Term Investment—0.2%
Repurchase Agreement—0.2%Fixed Income Clearing Corp.
Repurchase Agreement dated 09/28/18 at 1.000%, due on10/01/18 with a maturity value of $1,370,746; collateralizedby U.S. Treasury Note at 2.375%, maturing 08/15/24, with amarket value of $1,401,124. . . . . . . . . . . . . . . . . . . . . . . . . 1,370,631 1,370,631
Total Short-Term Investments(Cost $1,370,631) . . . . . . . . . . . . . . . . . . . . . . . . . . . . . . . 1,370,631
Securities Lending Reinvestments (f)—3.2%
Certificates of Deposit—0.7%Banco Del Estado De Chile New York
2.419%, 3M LIBOR + 0.100%, 11/14/18 (g) . . . . . . . . . . . . . 500,000 499,991Bank of Nova Scotia
2.618%, 3M LIBOR + 0.280%, 03/20/19 (g) . . . . . . . . . . . . . 500,000 500,477Barclays Bank plc
2.304%, 1M LIBOR + 0.200%, 02/04/19 (g) . . . . . . . . . . . . . 500,000 499,899Credit Agricole S.A.
2.463%, 1M LIBOR + 0.330%, 10/09/18 (g) . . . . . . . . . . . . . 500,000 500,020Landesbank Baden-Wuettertemberg
2.180%, 10/02/18 . . . . . . . . . . . . . . . . . . . . . . . . . . . . . . 1,000,000 1,000,002Mizuho Bank, Ltd., New York
2.468%, 1M LIBOR + 0.250%, 11/26/18 (g) . . . . . . . . . . . . . 500,000 499,983Wells Fargo Bank N.A.
2.475%, 3M LIBOR + 0.140%, 10/26/18 (g) . . . . . . . . . . . . . 500,000 500,083Westpac Banking Corp.
2.630%, FEDEFF PRV + 0.450%, 02/15/19 (g) . . . . . . . . . . . . 500,000 500,266
4,500,721
Security DescriptionPrincipalAmount* Value
Commercial Paper—0.1%Starbird Funding Corp.
2.280%, 11/08/18 . . . . . . . . . . . . . . . . . . . . . . . . . . . . . . 497,150 $ 498,723
Repurchase Agreements—2.1%Citigroup Global Markets, Inc.
Repurchase Agreement dated 05/03/18 at 2.440%, due on10/05/18 with a maturity value of $1,010,506; collateralizedby U.S. Treasury Obligations with rates ranging from 1.625% -2.250%, maturity dates ranging from 11/30/19 - 11/15/27,and various Common Stock with an aggregate market value of$1,054,286. . . . . . . . . . . . . . . . . . . . . . . . . . . . . . . . . . . . 1,000,000 1,000,000
Citigroup Global Markets, Ltd.Repurchase Agreement dated 09/28/18 at 2.240%, due on10/01/18 with a maturity value of $500,093; collateralized byU.S. Treasury and Foreign Obligations with rates ranging from0.625% - 2.875%, maturity dates ranging from 01/15/19 -02/15/43, and an aggregate market value of $510,000. . . . . . 500,000 500,000Repurchase Agreement dated 09/28/18 at 2.240%, due on10/01/18 with a maturity value of $300,056; collateralized byU.S. Treasury and Foreign Obligations with rates ranging from1.750% - 2.875%, maturity dates ranging from 10/15/20 -05/15/27, and an aggregate market value of $306,000. . . . . . 300,000 300,000Repurchase Agreement dated 09/28/18 at 2.240%, due on10/01/18 with a maturity value of $500,093; collateralized byU.S. Treasury and Foreign Obligations with rates ranging from0.375% - 3.125%, maturity dates ranging from 12/17/18 -02/15/43, and an aggregate market value of $510,000. . . . . . 500,000 500,000
Deutsche Bank AG, LondonRepurchase Agreement dated 08/24/18 at 2.560%, due on10/01/18 with a maturity value of $1,704,594; collateralizedby various Common Stock with an aggregate market value of$1,892,648. . . . . . . . . . . . . . . . . . . . . . . . . . . . . . . . . . . . 1,700,000 1,700,000Repurchase Agreement dated 01/09/18 at 2.560%, due on10/01/18 with a maturity value of $305,653; collateralized byvarious Common Stock with an aggregate market value of$333,997. . . . . . . . . . . . . . . . . . . . . . . . . . . . . . . . . . . . . 300,000 300,000
ING Bank NV, LondonRepurchase Agreement dated 08/03/18 at 2.420%, due on10/01/18 with a maturity value of $301,190; collateralized byvarious Common Stock with an aggregate market value of$333,374. . . . . . . . . . . . . . . . . . . . . . . . . . . . . . . . . . . . . 300,000 300,000
Macquarie Bank, Ltd., LondonRepurchase Agreement dated 09/28/18 at 2.200%, due on10/01/18 with a maturity value of $1,136,924; collateralizedby U.S. Treasury Obligations with rates ranging from 0.125% -5.500%, maturity dates ranging from 08/31/19 - 05/15/48,and an aggregate market value of $1,158,566. . . . . . . . . . . . 1,136,715 1,136,715
Merrill Lynch, Pierce, Fenner & Smith, Inc.Repurchase Agreement dated 10/26/16 at 2.720%, due on12/31/18 with a maturity value of $318,043; collateralized byvarious Common Stock with an aggregate market value of$330,000. . . . . . . . . . . . . . . . . . . . . . . . . . . . . . . . . . . . . 300,000 300,000Repurchase Agreement dated 08/01/17 at 2.720%, due on12/31/18 with a maturity value of $1,039,062; collateralizedby various Common Stock with an aggregate market value of$1,100,000. . . . . . . . . . . . . . . . . . . . . . . . . . . . . . . . . . . . 1,000,000 1,000,000
BHFTII-97
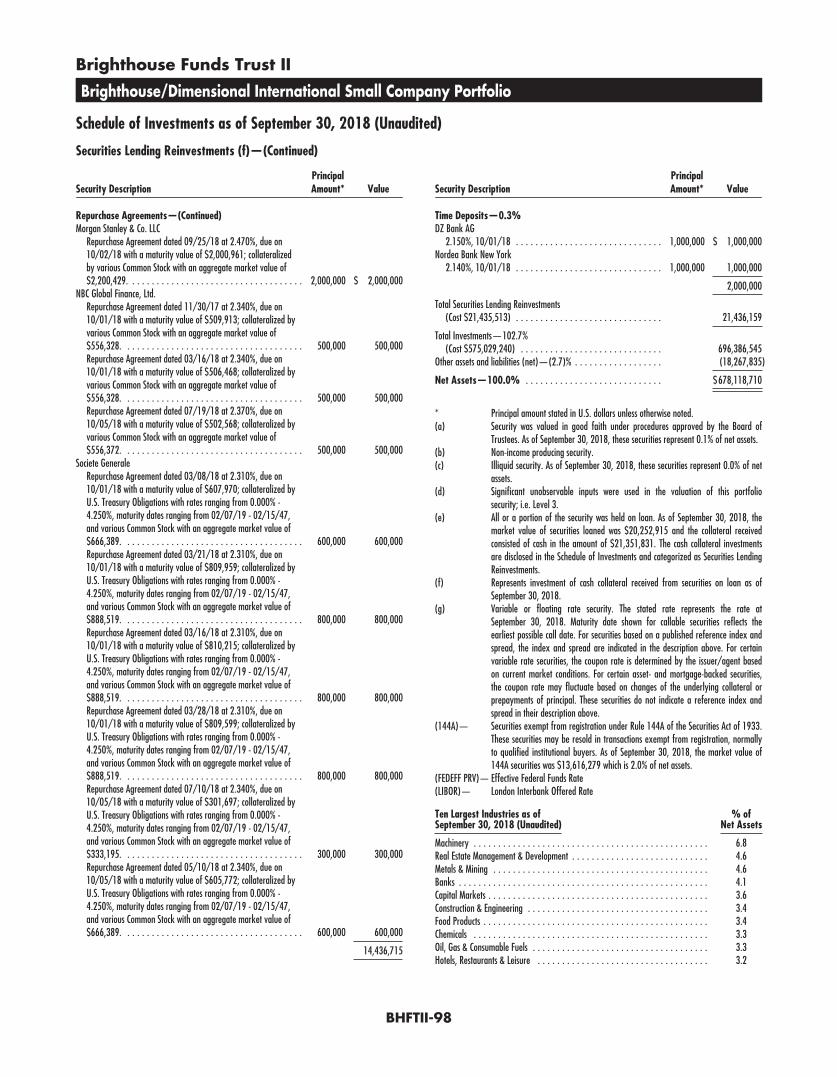
Brighthouse Funds Trust II
Brighthouse/Dimensional International Small Company Portfolio
Schedule of Investments as of September 30, 2018 (Unaudited)
Securities Lending Reinvestments (f)—(Continued)
Security DescriptionPrincipalAmount* Value
Repurchase Agreements—(Continued)Morgan Stanley & Co. LLC
Repurchase Agreement dated 09/25/18 at 2.470%, due on10/02/18 with a maturity value of $2,000,961; collateralizedby various Common Stock with an aggregate market value of$2,200,429. . . . . . . . . . . . . . . . . . . . . . . . . . . . . . . . . . . . 2,000,000 $ 2,000,000
NBC Global Finance, Ltd.Repurchase Agreement dated 11/30/17 at 2.340%, due on10/01/18 with a maturity value of $509,913; collateralized byvarious Common Stock with an aggregate market value of$556,328. . . . . . . . . . . . . . . . . . . . . . . . . . . . . . . . . . . . . 500,000 500,000Repurchase Agreement dated 03/16/18 at 2.340%, due on10/01/18 with a maturity value of $506,468; collateralized byvarious Common Stock with an aggregate market value of$556,328. . . . . . . . . . . . . . . . . . . . . . . . . . . . . . . . . . . . . 500,000 500,000Repurchase Agreement dated 07/19/18 at 2.370%, due on10/05/18 with a maturity value of $502,568; collateralized byvarious Common Stock with an aggregate market value of$556,372. . . . . . . . . . . . . . . . . . . . . . . . . . . . . . . . . . . . . 500,000 500,000
Societe GeneraleRepurchase Agreement dated 03/08/18 at 2.310%, due on10/01/18 with a maturity value of $607,970; collateralized byU.S. Treasury Obligations with rates ranging from 0.000% -4.250%, maturity dates ranging from 02/07/19 - 02/15/47,and various Common Stock with an aggregate market value of$666,389. . . . . . . . . . . . . . . . . . . . . . . . . . . . . . . . . . . . . 600,000 600,000Repurchase Agreement dated 03/21/18 at 2.310%, due on10/01/18 with a maturity value of $809,959; collateralized byU.S. Treasury Obligations with rates ranging from 0.000% -4.250%, maturity dates ranging from 02/07/19 - 02/15/47,and various Common Stock with an aggregate market value of$888,519. . . . . . . . . . . . . . . . . . . . . . . . . . . . . . . . . . . . . 800,000 800,000Repurchase Agreement dated 03/16/18 at 2.310%, due on10/01/18 with a maturity value of $810,215; collateralized byU.S. Treasury Obligations with rates ranging from 0.000% -4.250%, maturity dates ranging from 02/07/19 - 02/15/47,and various Common Stock with an aggregate market value of$888,519. . . . . . . . . . . . . . . . . . . . . . . . . . . . . . . . . . . . . 800,000 800,000Repurchase Agreement dated 03/28/18 at 2.310%, due on10/01/18 with a maturity value of $809,599; collateralized byU.S. Treasury Obligations with rates ranging from 0.000% -4.250%, maturity dates ranging from 02/07/19 - 02/15/47,and various Common Stock with an aggregate market value of$888,519. . . . . . . . . . . . . . . . . . . . . . . . . . . . . . . . . . . . . 800,000 800,000Repurchase Agreement dated 07/10/18 at 2.340%, due on10/05/18 with a maturity value of $301,697; collateralized byU.S. Treasury Obligations with rates ranging from 0.000% -4.250%, maturity dates ranging from 02/07/19 - 02/15/47,and various Common Stock with an aggregate market value of$333,195. . . . . . . . . . . . . . . . . . . . . . . . . . . . . . . . . . . . . 300,000 300,000Repurchase Agreement dated 05/10/18 at 2.340%, due on10/05/18 with a maturity value of $605,772; collateralized byU.S. Treasury Obligations with rates ranging from 0.000% -4.250%, maturity dates ranging from 02/07/19 - 02/15/47,and various Common Stock with an aggregate market value of$666,389. . . . . . . . . . . . . . . . . . . . . . . . . . . . . . . . . . . . . 600,000 600,000
14,436,715
Security DescriptionPrincipalAmount* Value
Time Deposits—0.3%DZ Bank AG
2.150%, 10/01/18 . . . . . . . . . . . . . . . . . . . . . . . . . . . . . . 1,000,000 $ 1,000,000Nordea Bank New York
2.140%, 10/01/18 . . . . . . . . . . . . . . . . . . . . . . . . . . . . . . 1,000,000 1,000,000
2,000,000
Total Securities Lending Reinvestments(Cost $21,435,513) . . . . . . . . . . . . . . . . . . . . . . . . . . . . . . 21,436,159
Total Investments—102.7%(Cost $575,029,240) . . . . . . . . . . . . . . . . . . . . . . . . . . . . . 696,386,545
Other assets and liabilities (net)—(2.7)% . . . . . . . . . . . . . . . . . . (18,267,835)
Net Assets—100.0% . . . . . . . . . . . . . . . . . . . . . . . . . . . . $678,118,710
* Principal amount stated in U.S. dollars unless otherwise noted.(a) Security was valued in good faith under procedures approved by the Board of
Trustees. As of September 30, 2018, these securities represent 0.1% of net assets.(b) Non-income producing security.(c) Illiquid security. As of September 30, 2018, these securities represent 0.0% of net
assets.(d) Significant unobservable inputs were used in the valuation of this portfolio
security; i.e. Level 3.(e) All or a portion of the security was held on loan. As of September 30, 2018, the
market value of securities loaned was $20,252,915 and the collateral receivedconsisted of cash in the amount of $21,351,831. The cash collateral investmentsare disclosed in the Schedule of Investments and categorized as Securities LendingReinvestments.
(f) Represents investment of cash collateral received from securities on loan as ofSeptember 30, 2018.
(g) Variable or floating rate security. The stated rate represents the rate atSeptember 30, 2018. Maturity date shown for callable securities reflects theearliest possible call date. For securities based on a published reference index andspread, the index and spread are indicated in the description above. For certainvariable rate securities, the coupon rate is determined by the issuer/agent basedon current market conditions. For certain asset- and mortgage-backed securities,the coupon rate may fluctuate based on changes of the underlying collateral orprepayments of principal. These securities do not indicate a reference index andspread in their description above.
(144A)— Securities exempt from registration under Rule 144A of the Securities Act of 1933.These securities may be resold in transactions exempt from registration, normallyto qualified institutional buyers. As of September 30, 2018, the market value of144A securities was $13,616,279 which is 2.0% of net assets.
(FEDEFF PRV)— Effective Federal Funds Rate(LIBOR)— London Interbank Offered Rate
Ten Largest Industries as ofSeptember 30, 2018 (Unaudited)
% ofNet Assets
Machinery . . . . . . . . . . . . . . . . . . . . . . . . . . . . . . . . . . . . . . . . . . . . . . . . 6.8Real Estate Management & Development . . . . . . . . . . . . . . . . . . . . . . . . . . . . 4.6Metals & Mining . . . . . . . . . . . . . . . . . . . . . . . . . . . . . . . . . . . . . . . . . . . . 4.6Banks . . . . . . . . . . . . . . . . . . . . . . . . . . . . . . . . . . . . . . . . . . . . . . . . . . . 4.1Capital Markets . . . . . . . . . . . . . . . . . . . . . . . . . . . . . . . . . . . . . . . . . . . . . 3.6Construction & Engineering . . . . . . . . . . . . . . . . . . . . . . . . . . . . . . . . . . . . . 3.4Food Products . . . . . . . . . . . . . . . . . . . . . . . . . . . . . . . . . . . . . . . . . . . . . . 3.4Chemicals . . . . . . . . . . . . . . . . . . . . . . . . . . . . . . . . . . . . . . . . . . . . . . . . 3.3Oil, Gas & Consumable Fuels . . . . . . . . . . . . . . . . . . . . . . . . . . . . . . . . . . . . 3.3Hotels, Restaurants & Leisure . . . . . . . . . . . . . . . . . . . . . . . . . . . . . . . . . . . 3.2
BHFTII-98
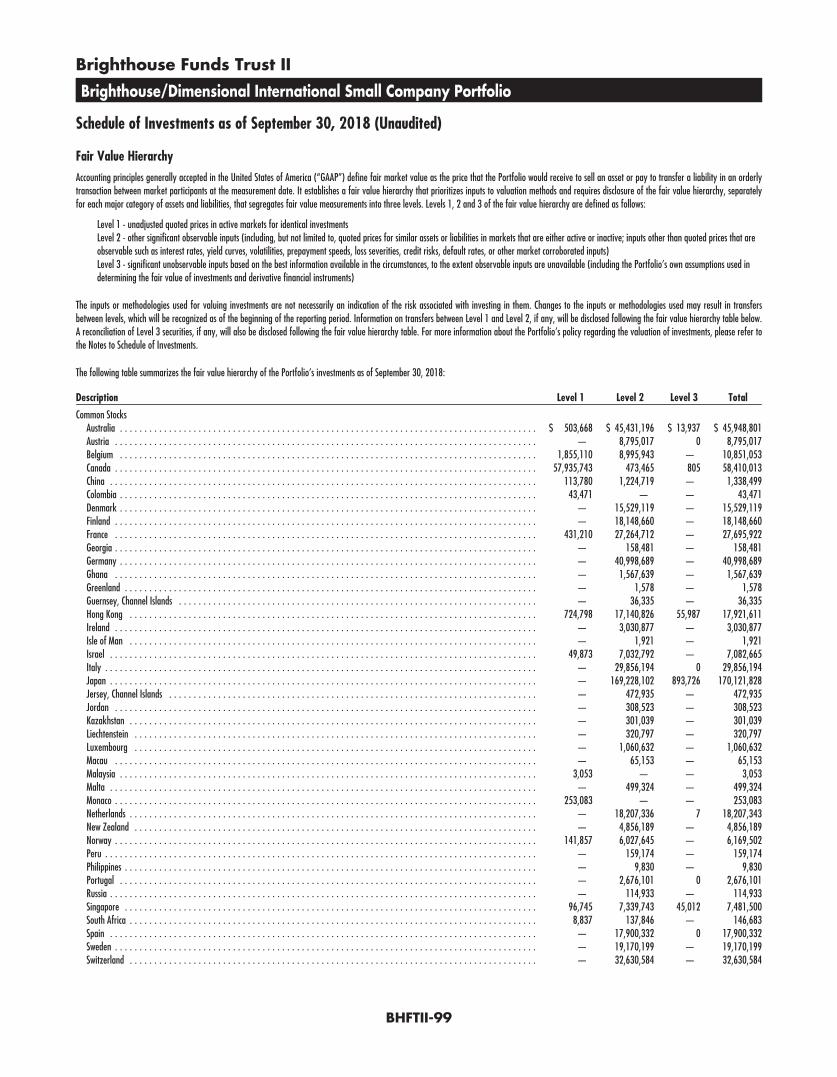
Brighthouse Funds Trust II
Brighthouse/Dimensional International Small Company Portfolio
Schedule of Investments as of September 30, 2018 (Unaudited)
Fair Value HierarchyAccounting principles generally accepted in the United States of America (“GAAP”) define fair market value as the price that the Portfolio would receive to sell an asset or pay to transfer a liability in an orderlytransaction between market participants at the measurement date. It establishes a fair value hierarchy that prioritizes inputs to valuation methods and requires disclosure of the fair value hierarchy, separatelyfor each major category of assets and liabilities, that segregates fair value measurements into three levels. Levels 1, 2 and 3 of the fair value hierarchy are defined as follows:
Level 1 - unadjusted quoted prices in active markets for identical investmentsLevel 2 - other significant observable inputs (including, but not limited to, quoted prices for similar assets or liabilities in markets that are either active or inactive; inputs other than quoted prices that areobservable such as interest rates, yield curves, volatilities, prepayment speeds, loss severities, credit risks, default rates, or other market corroborated inputs)Level 3 - significant unobservable inputs based on the best information available in the circumstances, to the extent observable inputs are unavailable (including the Portfolio’s own assumptions used indetermining the fair value of investments and derivative financial instruments)
The inputs or methodologies used for valuing investments are not necessarily an indication of the risk associated with investing in them. Changes to the inputs or methodologies used may result in transfersbetween levels, which will be recognized as of the beginning of the reporting period. Information on transfers between Level 1 and Level 2, if any, will be disclosed following the fair value hierarchy table below.A reconciliation of Level 3 securities, if any, will also be disclosed following the fair value hierarchy table. For more information about the Portfolio’s policy regarding the valuation of investments, please refer tothe Notes to Schedule of Investments.
The following table summarizes the fair value hierarchy of the Portfolio’s investments as of September 30, 2018:
Description Level 1 Level 2 Level 3 Total
Common StocksAustralia . . . . . . . . . . . . . . . . . . . . . . . . . . . . . . . . . . . . . . . . . . . . . . . . . . . . . . . . . . . . . . . . . . . . . . . . . . . . . . . . . . . . . $ 503,668 $ 45,431,196 $ 13,937 $ 45,948,801Austria . . . . . . . . . . . . . . . . . . . . . . . . . . . . . . . . . . . . . . . . . . . . . . . . . . . . . . . . . . . . . . . . . . . . . . . . . . . . . . . . . . . . . . — 8,795,017 0 8,795,017Belgium . . . . . . . . . . . . . . . . . . . . . . . . . . . . . . . . . . . . . . . . . . . . . . . . . . . . . . . . . . . . . . . . . . . . . . . . . . . . . . . . . . . . . 1,855,110 8,995,943 — 10,851,053Canada . . . . . . . . . . . . . . . . . . . . . . . . . . . . . . . . . . . . . . . . . . . . . . . . . . . . . . . . . . . . . . . . . . . . . . . . . . . . . . . . . . . . . . 57,935,743 473,465 805 58,410,013China . . . . . . . . . . . . . . . . . . . . . . . . . . . . . . . . . . . . . . . . . . . . . . . . . . . . . . . . . . . . . . . . . . . . . . . . . . . . . . . . . . . . . . . 113,780 1,224,719 — 1,338,499Colombia . . . . . . . . . . . . . . . . . . . . . . . . . . . . . . . . . . . . . . . . . . . . . . . . . . . . . . . . . . . . . . . . . . . . . . . . . . . . . . . . . . . . . 43,471 — — 43,471Denmark . . . . . . . . . . . . . . . . . . . . . . . . . . . . . . . . . . . . . . . . . . . . . . . . . . . . . . . . . . . . . . . . . . . . . . . . . . . . . . . . . . . . . — 15,529,119 — 15,529,119Finland . . . . . . . . . . . . . . . . . . . . . . . . . . . . . . . . . . . . . . . . . . . . . . . . . . . . . . . . . . . . . . . . . . . . . . . . . . . . . . . . . . . . . . — 18,148,660 — 18,148,660France . . . . . . . . . . . . . . . . . . . . . . . . . . . . . . . . . . . . . . . . . . . . . . . . . . . . . . . . . . . . . . . . . . . . . . . . . . . . . . . . . . . . . . 431,210 27,264,712 — 27,695,922Georgia . . . . . . . . . . . . . . . . . . . . . . . . . . . . . . . . . . . . . . . . . . . . . . . . . . . . . . . . . . . . . . . . . . . . . . . . . . . . . . . . . . . . . . — 158,481 — 158,481Germany . . . . . . . . . . . . . . . . . . . . . . . . . . . . . . . . . . . . . . . . . . . . . . . . . . . . . . . . . . . . . . . . . . . . . . . . . . . . . . . . . . . . . — 40,998,689 — 40,998,689Ghana . . . . . . . . . . . . . . . . . . . . . . . . . . . . . . . . . . . . . . . . . . . . . . . . . . . . . . . . . . . . . . . . . . . . . . . . . . . . . . . . . . . . . . — 1,567,639 — 1,567,639Greenland . . . . . . . . . . . . . . . . . . . . . . . . . . . . . . . . . . . . . . . . . . . . . . . . . . . . . . . . . . . . . . . . . . . . . . . . . . . . . . . . . . . . — 1,578 — 1,578Guernsey, Channel Islands . . . . . . . . . . . . . . . . . . . . . . . . . . . . . . . . . . . . . . . . . . . . . . . . . . . . . . . . . . . . . . . . . . . . . . . . . — 36,335 — 36,335Hong Kong . . . . . . . . . . . . . . . . . . . . . . . . . . . . . . . . . . . . . . . . . . . . . . . . . . . . . . . . . . . . . . . . . . . . . . . . . . . . . . . . . . . 724,798 17,140,826 55,987 17,921,611Ireland . . . . . . . . . . . . . . . . . . . . . . . . . . . . . . . . . . . . . . . . . . . . . . . . . . . . . . . . . . . . . . . . . . . . . . . . . . . . . . . . . . . . . . — 3,030,877 — 3,030,877Isle of Man . . . . . . . . . . . . . . . . . . . . . . . . . . . . . . . . . . . . . . . . . . . . . . . . . . . . . . . . . . . . . . . . . . . . . . . . . . . . . . . . . . . — 1,921 — 1,921Israel . . . . . . . . . . . . . . . . . . . . . . . . . . . . . . . . . . . . . . . . . . . . . . . . . . . . . . . . . . . . . . . . . . . . . . . . . . . . . . . . . . . . . . . 49,873 7,032,792 — 7,082,665Italy . . . . . . . . . . . . . . . . . . . . . . . . . . . . . . . . . . . . . . . . . . . . . . . . . . . . . . . . . . . . . . . . . . . . . . . . . . . . . . . . . . . . . . . . — 29,856,194 0 29,856,194Japan . . . . . . . . . . . . . . . . . . . . . . . . . . . . . . . . . . . . . . . . . . . . . . . . . . . . . . . . . . . . . . . . . . . . . . . . . . . . . . . . . . . . . . . — 169,228,102 893,726 170,121,828Jersey, Channel Islands . . . . . . . . . . . . . . . . . . . . . . . . . . . . . . . . . . . . . . . . . . . . . . . . . . . . . . . . . . . . . . . . . . . . . . . . . . . — 472,935 — 472,935Jordan . . . . . . . . . . . . . . . . . . . . . . . . . . . . . . . . . . . . . . . . . . . . . . . . . . . . . . . . . . . . . . . . . . . . . . . . . . . . . . . . . . . . . . — 308,523 — 308,523Kazakhstan . . . . . . . . . . . . . . . . . . . . . . . . . . . . . . . . . . . . . . . . . . . . . . . . . . . . . . . . . . . . . . . . . . . . . . . . . . . . . . . . . . . — 301,039 — 301,039Liechtenstein . . . . . . . . . . . . . . . . . . . . . . . . . . . . . . . . . . . . . . . . . . . . . . . . . . . . . . . . . . . . . . . . . . . . . . . . . . . . . . . . . . — 320,797 — 320,797Luxembourg . . . . . . . . . . . . . . . . . . . . . . . . . . . . . . . . . . . . . . . . . . . . . . . . . . . . . . . . . . . . . . . . . . . . . . . . . . . . . . . . . . — 1,060,632 — 1,060,632Macau . . . . . . . . . . . . . . . . . . . . . . . . . . . . . . . . . . . . . . . . . . . . . . . . . . . . . . . . . . . . . . . . . . . . . . . . . . . . . . . . . . . . . . — 65,153 — 65,153Malaysia . . . . . . . . . . . . . . . . . . . . . . . . . . . . . . . . . . . . . . . . . . . . . . . . . . . . . . . . . . . . . . . . . . . . . . . . . . . . . . . . . . . . . 3,053 — — 3,053Malta . . . . . . . . . . . . . . . . . . . . . . . . . . . . . . . . . . . . . . . . . . . . . . . . . . . . . . . . . . . . . . . . . . . . . . . . . . . . . . . . . . . . . . . — 499,324 — 499,324Monaco . . . . . . . . . . . . . . . . . . . . . . . . . . . . . . . . . . . . . . . . . . . . . . . . . . . . . . . . . . . . . . . . . . . . . . . . . . . . . . . . . . . . . . 253,083 — — 253,083Netherlands . . . . . . . . . . . . . . . . . . . . . . . . . . . . . . . . . . . . . . . . . . . . . . . . . . . . . . . . . . . . . . . . . . . . . . . . . . . . . . . . . . . — 18,207,336 7 18,207,343New Zealand . . . . . . . . . . . . . . . . . . . . . . . . . . . . . . . . . . . . . . . . . . . . . . . . . . . . . . . . . . . . . . . . . . . . . . . . . . . . . . . . . . — 4,856,189 — 4,856,189Norway . . . . . . . . . . . . . . . . . . . . . . . . . . . . . . . . . . . . . . . . . . . . . . . . . . . . . . . . . . . . . . . . . . . . . . . . . . . . . . . . . . . . . . 141,857 6,027,645 — 6,169,502Peru . . . . . . . . . . . . . . . . . . . . . . . . . . . . . . . . . . . . . . . . . . . . . . . . . . . . . . . . . . . . . . . . . . . . . . . . . . . . . . . . . . . . . . . . — 159,174 — 159,174Philippines . . . . . . . . . . . . . . . . . . . . . . . . . . . . . . . . . . . . . . . . . . . . . . . . . . . . . . . . . . . . . . . . . . . . . . . . . . . . . . . . . . . . — 9,830 — 9,830Portugal . . . . . . . . . . . . . . . . . . . . . . . . . . . . . . . . . . . . . . . . . . . . . . . . . . . . . . . . . . . . . . . . . . . . . . . . . . . . . . . . . . . . . — 2,676,101 0 2,676,101Russia . . . . . . . . . . . . . . . . . . . . . . . . . . . . . . . . . . . . . . . . . . . . . . . . . . . . . . . . . . . . . . . . . . . . . . . . . . . . . . . . . . . . . . . — 114,933 — 114,933Singapore . . . . . . . . . . . . . . . . . . . . . . . . . . . . . . . . . . . . . . . . . . . . . . . . . . . . . . . . . . . . . . . . . . . . . . . . . . . . . . . . . . . . 96,745 7,339,743 45,012 7,481,500South Africa . . . . . . . . . . . . . . . . . . . . . . . . . . . . . . . . . . . . . . . . . . . . . . . . . . . . . . . . . . . . . . . . . . . . . . . . . . . . . . . . . . . 8,837 137,846 — 146,683Spain . . . . . . . . . . . . . . . . . . . . . . . . . . . . . . . . . . . . . . . . . . . . . . . . . . . . . . . . . . . . . . . . . . . . . . . . . . . . . . . . . . . . . . . — 17,900,332 0 17,900,332Sweden . . . . . . . . . . . . . . . . . . . . . . . . . . . . . . . . . . . . . . . . . . . . . . . . . . . . . . . . . . . . . . . . . . . . . . . . . . . . . . . . . . . . . . — 19,170,199 — 19,170,199Switzerland . . . . . . . . . . . . . . . . . . . . . . . . . . . . . . . . . . . . . . . . . . . . . . . . . . . . . . . . . . . . . . . . . . . . . . . . . . . . . . . . . . . — 32,630,584 — 32,630,584
BHFTII-99
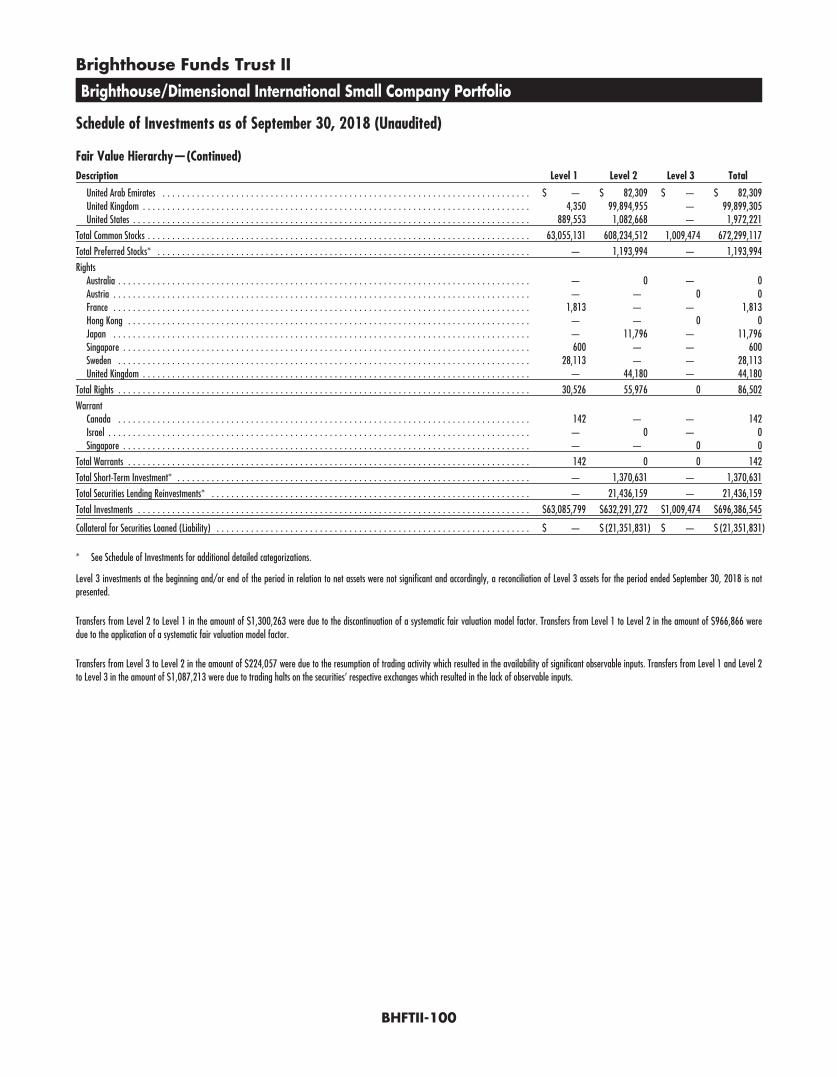
Brighthouse Funds Trust II
Brighthouse/Dimensional International Small Company Portfolio
Schedule of Investments as of September 30, 2018 (Unaudited)
Fair Value Hierarchy—(Continued)Description Level 1 Level 2 Level 3 Total
United Arab Emirates . . . . . . . . . . . . . . . . . . . . . . . . . . . . . . . . . . . . . . . . . . . . . . . . . . . . . . . . . . . . . . . . . . . . . . . . . . . $ — $ 82,309 $ — $ 82,309United Kingdom . . . . . . . . . . . . . . . . . . . . . . . . . . . . . . . . . . . . . . . . . . . . . . . . . . . . . . . . . . . . . . . . . . . . . . . . . . . . . . . 4,350 99,894,955 — 99,899,305United States . . . . . . . . . . . . . . . . . . . . . . . . . . . . . . . . . . . . . . . . . . . . . . . . . . . . . . . . . . . . . . . . . . . . . . . . . . . . . . . . . 889,553 1,082,668 — 1,972,221
Total Common Stocks . . . . . . . . . . . . . . . . . . . . . . . . . . . . . . . . . . . . . . . . . . . . . . . . . . . . . . . . . . . . . . . . . . . . . . . . . . . . . . 63,055,131 608,234,512 1,009,474 672,299,117
Total Preferred Stocks* . . . . . . . . . . . . . . . . . . . . . . . . . . . . . . . . . . . . . . . . . . . . . . . . . . . . . . . . . . . . . . . . . . . . . . . . . . . . — 1,193,994 — 1,193,994
RightsAustralia . . . . . . . . . . . . . . . . . . . . . . . . . . . . . . . . . . . . . . . . . . . . . . . . . . . . . . . . . . . . . . . . . . . . . . . . . . . . . . . . . . . . — 0 — 0Austria . . . . . . . . . . . . . . . . . . . . . . . . . . . . . . . . . . . . . . . . . . . . . . . . . . . . . . . . . . . . . . . . . . . . . . . . . . . . . . . . . . . . . — — 0 0France . . . . . . . . . . . . . . . . . . . . . . . . . . . . . . . . . . . . . . . . . . . . . . . . . . . . . . . . . . . . . . . . . . . . . . . . . . . . . . . . . . . . . 1,813 — — 1,813Hong Kong . . . . . . . . . . . . . . . . . . . . . . . . . . . . . . . . . . . . . . . . . . . . . . . . . . . . . . . . . . . . . . . . . . . . . . . . . . . . . . . . . . — — 0 0Japan . . . . . . . . . . . . . . . . . . . . . . . . . . . . . . . . . . . . . . . . . . . . . . . . . . . . . . . . . . . . . . . . . . . . . . . . . . . . . . . . . . . . . — 11,796 — 11,796Singapore . . . . . . . . . . . . . . . . . . . . . . . . . . . . . . . . . . . . . . . . . . . . . . . . . . . . . . . . . . . . . . . . . . . . . . . . . . . . . . . . . . . 600 — — 600Sweden . . . . . . . . . . . . . . . . . . . . . . . . . . . . . . . . . . . . . . . . . . . . . . . . . . . . . . . . . . . . . . . . . . . . . . . . . . . . . . . . . . . . 28,113 — — 28,113United Kingdom . . . . . . . . . . . . . . . . . . . . . . . . . . . . . . . . . . . . . . . . . . . . . . . . . . . . . . . . . . . . . . . . . . . . . . . . . . . . . . . — 44,180 — 44,180
Total Rights . . . . . . . . . . . . . . . . . . . . . . . . . . . . . . . . . . . . . . . . . . . . . . . . . . . . . . . . . . . . . . . . . . . . . . . . . . . . . . . . . . . . 30,526 55,976 0 86,502
WarrantCanada . . . . . . . . . . . . . . . . . . . . . . . . . . . . . . . . . . . . . . . . . . . . . . . . . . . . . . . . . . . . . . . . . . . . . . . . . . . . . . . . . . . . 142 — — 142Israel . . . . . . . . . . . . . . . . . . . . . . . . . . . . . . . . . . . . . . . . . . . . . . . . . . . . . . . . . . . . . . . . . . . . . . . . . . . . . . . . . . . . . . — 0 — 0Singapore . . . . . . . . . . . . . . . . . . . . . . . . . . . . . . . . . . . . . . . . . . . . . . . . . . . . . . . . . . . . . . . . . . . . . . . . . . . . . . . . . . . — — 0 0
Total Warrants . . . . . . . . . . . . . . . . . . . . . . . . . . . . . . . . . . . . . . . . . . . . . . . . . . . . . . . . . . . . . . . . . . . . . . . . . . . . . . . . . . 142 0 0 142
Total Short-Term Investment* . . . . . . . . . . . . . . . . . . . . . . . . . . . . . . . . . . . . . . . . . . . . . . . . . . . . . . . . . . . . . . . . . . . . . . . . — 1,370,631 — 1,370,631
Total Securities Lending Reinvestments* . . . . . . . . . . . . . . . . . . . . . . . . . . . . . . . . . . . . . . . . . . . . . . . . . . . . . . . . . . . . . . . . . — 21,436,159 — 21,436,159
Total Investments . . . . . . . . . . . . . . . . . . . . . . . . . . . . . . . . . . . . . . . . . . . . . . . . . . . . . . . . . . . . . . . . . . . . . . . . . . . . . . . . $63,085,799 $632,291,272 $1,009,474 $696,386,545
Collateral for Securities Loaned (Liability) . . . . . . . . . . . . . . . . . . . . . . . . . . . . . . . . . . . . . . . . . . . . . . . . . . . . . . . . . . . . . . . . $ — $ (21,351,831) $ — $ (21,351,831)
* See Schedule of Investments for additional detailed categorizations.
Level 3 investments at the beginning and/or end of the period in relation to net assets were not significant and accordingly, a reconciliation of Level 3 assets for the period ended September 30, 2018 is notpresented.
Transfers from Level 2 to Level 1 in the amount of $1,300,263 were due to the discontinuation of a systematic fair valuation model factor. Transfers from Level 1 to Level 2 in the amount of $966,866 weredue to the application of a systematic fair valuation model factor.
Transfers from Level 3 to Level 2 in the amount of $224,057 were due to the resumption of trading activity which resulted in the availability of significant observable inputs. Transfers from Level 1 and Level 2to Level 3 in the amount of $1,087,213 were due to trading halts on the securities’ respective exchanges which resulted in the lack of observable inputs.
BHFTII-100
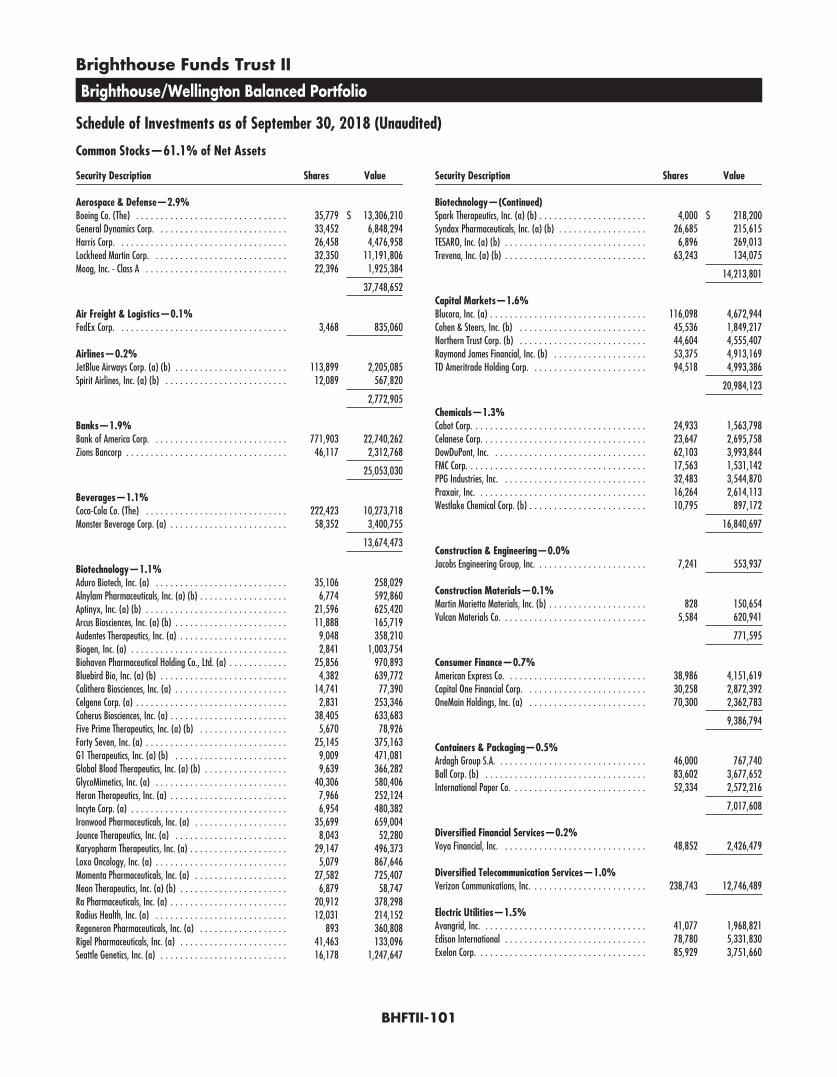
Brighthouse Funds Trust II
Brighthouse/Wellington Balanced Portfolio
Schedule of Investments as of September 30, 2018 (Unaudited)
Common Stocks—61.1% of Net Assets
Security Description Shares Value
Aerospace & Defense—2.9%Boeing Co. (The) . . . . . . . . . . . . . . . . . . . . . . . . . . . . . . . 35,779 $ 13,306,210General Dynamics Corp. . . . . . . . . . . . . . . . . . . . . . . . . . . 33,452 6,848,294Harris Corp. . . . . . . . . . . . . . . . . . . . . . . . . . . . . . . . . . . 26,458 4,476,958Lockheed Martin Corp. . . . . . . . . . . . . . . . . . . . . . . . . . . . 32,350 11,191,806Moog, Inc. - Class A . . . . . . . . . . . . . . . . . . . . . . . . . . . . . 22,396 1,925,384
37,748,652
Air Freight & Logistics—0.1%FedEx Corp. . . . . . . . . . . . . . . . . . . . . . . . . . . . . . . . . . . 3,468 835,060
Airlines—0.2%JetBlue Airways Corp. (a) (b) . . . . . . . . . . . . . . . . . . . . . . . 113,899 2,205,085Spirit Airlines, Inc. (a) (b) . . . . . . . . . . . . . . . . . . . . . . . . . 12,089 567,820
2,772,905
Banks—1.9%Bank of America Corp. . . . . . . . . . . . . . . . . . . . . . . . . . . . 771,903 22,740,262Zions Bancorp . . . . . . . . . . . . . . . . . . . . . . . . . . . . . . . . . 46,117 2,312,768
25,053,030
Beverages—1.1%Coca-Cola Co. (The) . . . . . . . . . . . . . . . . . . . . . . . . . . . . . 222,423 10,273,718Monster Beverage Corp. (a) . . . . . . . . . . . . . . . . . . . . . . . . 58,352 3,400,755
13,674,473
Biotechnology—1.1%Aduro Biotech, Inc. (a) . . . . . . . . . . . . . . . . . . . . . . . . . . . 35,106 258,029Alnylam Pharmaceuticals, Inc. (a) (b) . . . . . . . . . . . . . . . . . . 6,774 592,860Aptinyx, Inc. (a) (b) . . . . . . . . . . . . . . . . . . . . . . . . . . . . . 21,596 625,420Arcus Biosciences, Inc. (a) (b) . . . . . . . . . . . . . . . . . . . . . . . 11,888 165,719Audentes Therapeutics, Inc. (a) . . . . . . . . . . . . . . . . . . . . . . 9,048 358,210Biogen, Inc. (a) . . . . . . . . . . . . . . . . . . . . . . . . . . . . . . . . 2,841 1,003,754Biohaven Pharmaceutical Holding Co., Ltd. (a) . . . . . . . . . . . . 25,856 970,893Bluebird Bio, Inc. (a) (b) . . . . . . . . . . . . . . . . . . . . . . . . . . 4,382 639,772Calithera Biosciences, Inc. (a) . . . . . . . . . . . . . . . . . . . . . . . 14,741 77,390Celgene Corp. (a) . . . . . . . . . . . . . . . . . . . . . . . . . . . . . . . 2,831 253,346Coherus Biosciences, Inc. (a) . . . . . . . . . . . . . . . . . . . . . . . . 38,405 633,683Five Prime Therapeutics, Inc. (a) (b) . . . . . . . . . . . . . . . . . . 5,670 78,926Forty Seven, Inc. (a) . . . . . . . . . . . . . . . . . . . . . . . . . . . . . 25,145 375,163G1 Therapeutics, Inc. (a) (b) . . . . . . . . . . . . . . . . . . . . . . . 9,009 471,081Global Blood Therapeutics, Inc. (a) (b) . . . . . . . . . . . . . . . . . 9,639 366,282GlycoMimetics, Inc. (a) . . . . . . . . . . . . . . . . . . . . . . . . . . . 40,306 580,406Heron Therapeutics, Inc. (a) . . . . . . . . . . . . . . . . . . . . . . . . 7,966 252,124Incyte Corp. (a) . . . . . . . . . . . . . . . . . . . . . . . . . . . . . . . . 6,954 480,382Ironwood Pharmaceuticals, Inc. (a) . . . . . . . . . . . . . . . . . . . 35,699 659,004Jounce Therapeutics, Inc. (a) . . . . . . . . . . . . . . . . . . . . . . . 8,043 52,280Karyopharm Therapeutics, Inc. (a) . . . . . . . . . . . . . . . . . . . . 29,147 496,373Loxo Oncology, Inc. (a) . . . . . . . . . . . . . . . . . . . . . . . . . . . 5,079 867,646Momenta Pharmaceuticals, Inc. (a) . . . . . . . . . . . . . . . . . . . 27,582 725,407Neon Therapeutics, Inc. (a) (b) . . . . . . . . . . . . . . . . . . . . . . 6,879 58,747Ra Pharmaceuticals, Inc. (a) . . . . . . . . . . . . . . . . . . . . . . . . 20,912 378,298Radius Health, Inc. (a) . . . . . . . . . . . . . . . . . . . . . . . . . . . 12,031 214,152Regeneron Pharmaceuticals, Inc. (a) . . . . . . . . . . . . . . . . . . 893 360,808Rigel Pharmaceuticals, Inc. (a) . . . . . . . . . . . . . . . . . . . . . . 41,463 133,096Seattle Genetics, Inc. (a) . . . . . . . . . . . . . . . . . . . . . . . . . . 16,178 1,247,647
Security Description Shares Value
Biotechnology—(Continued)Spark Therapeutics, Inc. (a) (b) . . . . . . . . . . . . . . . . . . . . . . 4,000 $ 218,200Syndax Pharmaceuticals, Inc. (a) (b) . . . . . . . . . . . . . . . . . . 26,685 215,615TESARO, Inc. (a) (b) . . . . . . . . . . . . . . . . . . . . . . . . . . . . . 6,896 269,013Trevena, Inc. (a) (b) . . . . . . . . . . . . . . . . . . . . . . . . . . . . . 63,243 134,075
14,213,801
Capital Markets—1.6%Blucora, Inc. (a) . . . . . . . . . . . . . . . . . . . . . . . . . . . . . . . . 116,098 4,672,944Cohen & Steers, Inc. (b) . . . . . . . . . . . . . . . . . . . . . . . . . . 45,536 1,849,217Northern Trust Corp. (b) . . . . . . . . . . . . . . . . . . . . . . . . . . 44,604 4,555,407Raymond James Financial, Inc. (b) . . . . . . . . . . . . . . . . . . . 53,375 4,913,169TD Ameritrade Holding Corp. . . . . . . . . . . . . . . . . . . . . . . . 94,518 4,993,386
20,984,123
Chemicals—1.3%Cabot Corp. . . . . . . . . . . . . . . . . . . . . . . . . . . . . . . . . . . . 24,933 1,563,798Celanese Corp. . . . . . . . . . . . . . . . . . . . . . . . . . . . . . . . . . 23,647 2,695,758DowDuPont, Inc. . . . . . . . . . . . . . . . . . . . . . . . . . . . . . . . 62,103 3,993,844FMC Corp. . . . . . . . . . . . . . . . . . . . . . . . . . . . . . . . . . . . . 17,563 1,531,142PPG Industries, Inc. . . . . . . . . . . . . . . . . . . . . . . . . . . . . . 32,483 3,544,870Praxair, Inc. . . . . . . . . . . . . . . . . . . . . . . . . . . . . . . . . . . 16,264 2,614,113Westlake Chemical Corp. (b) . . . . . . . . . . . . . . . . . . . . . . . . 10,795 897,172
16,840,697
Construction & Engineering—0.0%Jacobs Engineering Group, Inc. . . . . . . . . . . . . . . . . . . . . . . 7,241 553,937
Construction Materials—0.1%Martin Marietta Materials, Inc. (b) . . . . . . . . . . . . . . . . . . . . 828 150,654Vulcan Materials Co. . . . . . . . . . . . . . . . . . . . . . . . . . . . . . 5,584 620,941
771,595
Consumer Finance—0.7%American Express Co. . . . . . . . . . . . . . . . . . . . . . . . . . . . . 38,986 4,151,619Capital One Financial Corp. . . . . . . . . . . . . . . . . . . . . . . . . 30,258 2,872,392OneMain Holdings, Inc. (a) . . . . . . . . . . . . . . . . . . . . . . . . 70,300 2,362,783
9,386,794
Containers & Packaging—0.5%Ardagh Group S.A. . . . . . . . . . . . . . . . . . . . . . . . . . . . . . . 46,000 767,740Ball Corp. (b) . . . . . . . . . . . . . . . . . . . . . . . . . . . . . . . . . 83,602 3,677,652International Paper Co. . . . . . . . . . . . . . . . . . . . . . . . . . . . 52,334 2,572,216
7,017,608
Diversified Financial Services—0.2%Voya Financial, Inc. . . . . . . . . . . . . . . . . . . . . . . . . . . . . . 48,852 2,426,479
Diversified Telecommunication Services—1.0%Verizon Communications, Inc. . . . . . . . . . . . . . . . . . . . . . . . 238,743 12,746,489
Electric Utilities—1.5%Avangrid, Inc. . . . . . . . . . . . . . . . . . . . . . . . . . . . . . . . . . 41,077 1,968,821Edison International . . . . . . . . . . . . . . . . . . . . . . . . . . . . . 78,780 5,331,830Exelon Corp. . . . . . . . . . . . . . . . . . . . . . . . . . . . . . . . . . . 85,929 3,751,660
BHFTII-101
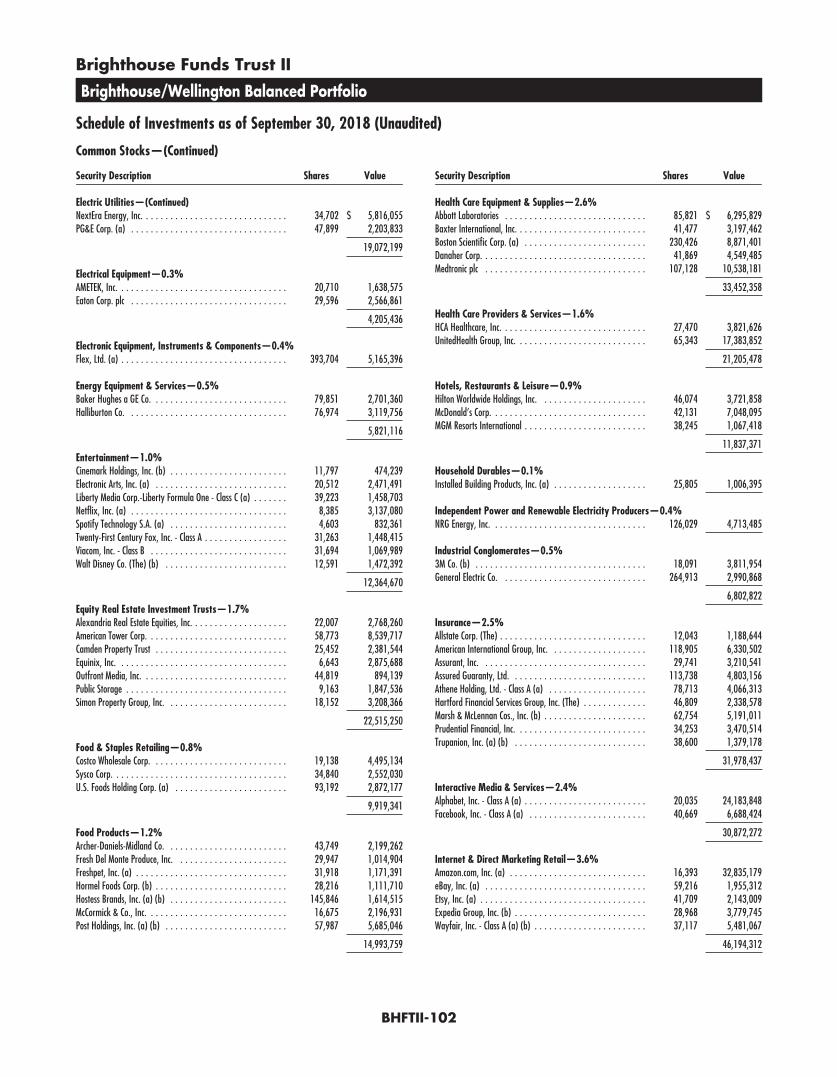
Brighthouse Funds Trust II
Brighthouse/Wellington Balanced Portfolio
Schedule of Investments as of September 30, 2018 (Unaudited)
Common Stocks—(Continued)
Security Description Shares Value
Electric Utilities—(Continued)NextEra Energy, Inc. . . . . . . . . . . . . . . . . . . . . . . . . . . . . . 34,702 $ 5,816,055PG&E Corp. (a) . . . . . . . . . . . . . . . . . . . . . . . . . . . . . . . . 47,899 2,203,833
19,072,199
Electrical Equipment—0.3%AMETEK, Inc. . . . . . . . . . . . . . . . . . . . . . . . . . . . . . . . . . . 20,710 1,638,575Eaton Corp. plc . . . . . . . . . . . . . . . . . . . . . . . . . . . . . . . . 29,596 2,566,861
4,205,436
Electronic Equipment, Instruments & Components—0.4%Flex, Ltd. (a) . . . . . . . . . . . . . . . . . . . . . . . . . . . . . . . . . . 393,704 5,165,396
Energy Equipment & Services—0.5%Baker Hughes a GE Co. . . . . . . . . . . . . . . . . . . . . . . . . . . . 79,851 2,701,360Halliburton Co. . . . . . . . . . . . . . . . . . . . . . . . . . . . . . . . . 76,974 3,119,756
5,821,116
Entertainment—1.0%Cinemark Holdings, Inc. (b) . . . . . . . . . . . . . . . . . . . . . . . . 11,797 474,239Electronic Arts, Inc. (a) . . . . . . . . . . . . . . . . . . . . . . . . . . . 20,512 2,471,491Liberty Media Corp.-Liberty Formula One - Class C (a) . . . . . . . 39,223 1,458,703Netflix, Inc. (a) . . . . . . . . . . . . . . . . . . . . . . . . . . . . . . . . 8,385 3,137,080Spotify Technology S.A. (a) . . . . . . . . . . . . . . . . . . . . . . . . 4,603 832,361Twenty-First Century Fox, Inc. - Class A . . . . . . . . . . . . . . . . . 31,263 1,448,415Viacom, Inc. - Class B . . . . . . . . . . . . . . . . . . . . . . . . . . . . 31,694 1,069,989Walt Disney Co. (The) (b) . . . . . . . . . . . . . . . . . . . . . . . . . 12,591 1,472,392
12,364,670
Equity Real Estate Investment Trusts—1.7%Alexandria Real Estate Equities, Inc. . . . . . . . . . . . . . . . . . . . 22,007 2,768,260American Tower Corp. . . . . . . . . . . . . . . . . . . . . . . . . . . . . 58,773 8,539,717Camden Property Trust . . . . . . . . . . . . . . . . . . . . . . . . . . . 25,452 2,381,544Equinix, Inc. . . . . . . . . . . . . . . . . . . . . . . . . . . . . . . . . . . 6,643 2,875,688Outfront Media, Inc. . . . . . . . . . . . . . . . . . . . . . . . . . . . . . 44,819 894,139Public Storage . . . . . . . . . . . . . . . . . . . . . . . . . . . . . . . . . 9,163 1,847,536Simon Property Group, Inc. . . . . . . . . . . . . . . . . . . . . . . . . 18,152 3,208,366
22,515,250
Food & Staples Retailing—0.8%Costco Wholesale Corp. . . . . . . . . . . . . . . . . . . . . . . . . . . . 19,138 4,495,134Sysco Corp. . . . . . . . . . . . . . . . . . . . . . . . . . . . . . . . . . . . 34,840 2,552,030U.S. Foods Holding Corp. (a) . . . . . . . . . . . . . . . . . . . . . . . 93,192 2,872,177
9,919,341
Food Products—1.2%Archer-Daniels-Midland Co. . . . . . . . . . . . . . . . . . . . . . . . . 43,749 2,199,262Fresh Del Monte Produce, Inc. . . . . . . . . . . . . . . . . . . . . . . 29,947 1,014,904Freshpet, Inc. (a) . . . . . . . . . . . . . . . . . . . . . . . . . . . . . . . 31,918 1,171,391Hormel Foods Corp. (b) . . . . . . . . . . . . . . . . . . . . . . . . . . . 28,216 1,111,710Hostess Brands, Inc. (a) (b) . . . . . . . . . . . . . . . . . . . . . . . . 145,846 1,614,515McCormick & Co., Inc. . . . . . . . . . . . . . . . . . . . . . . . . . . . . 16,675 2,196,931Post Holdings, Inc. (a) (b) . . . . . . . . . . . . . . . . . . . . . . . . . 57,987 5,685,046
14,993,759
Security Description Shares Value
Health Care Equipment & Supplies—2.6%Abbott Laboratories . . . . . . . . . . . . . . . . . . . . . . . . . . . . . 85,821 $ 6,295,829Baxter International, Inc. . . . . . . . . . . . . . . . . . . . . . . . . . . 41,477 3,197,462Boston Scientific Corp. (a) . . . . . . . . . . . . . . . . . . . . . . . . . 230,426 8,871,401Danaher Corp. . . . . . . . . . . . . . . . . . . . . . . . . . . . . . . . . . 41,869 4,549,485Medtronic plc . . . . . . . . . . . . . . . . . . . . . . . . . . . . . . . . . 107,128 10,538,181
33,452,358
Health Care Providers & Services—1.6%HCA Healthcare, Inc. . . . . . . . . . . . . . . . . . . . . . . . . . . . . . 27,470 3,821,626UnitedHealth Group, Inc. . . . . . . . . . . . . . . . . . . . . . . . . . . 65,343 17,383,852
21,205,478
Hotels, Restaurants & Leisure—0.9%Hilton Worldwide Holdings, Inc. . . . . . . . . . . . . . . . . . . . . . 46,074 3,721,858McDonald’s Corp. . . . . . . . . . . . . . . . . . . . . . . . . . . . . . . . 42,131 7,048,095MGM Resorts International . . . . . . . . . . . . . . . . . . . . . . . . . 38,245 1,067,418
11,837,371
Household Durables—0.1%Installed Building Products, Inc. (a) . . . . . . . . . . . . . . . . . . . 25,805 1,006,395
Independent Power and Renewable Electricity Producers—0.4%NRG Energy, Inc. . . . . . . . . . . . . . . . . . . . . . . . . . . . . . . . 126,029 4,713,485
Industrial Conglomerates—0.5%3M Co. (b) . . . . . . . . . . . . . . . . . . . . . . . . . . . . . . . . . . . 18,091 3,811,954General Electric Co. . . . . . . . . . . . . . . . . . . . . . . . . . . . . . 264,913 2,990,868
6,802,822
Insurance—2.5%Allstate Corp. (The) . . . . . . . . . . . . . . . . . . . . . . . . . . . . . . 12,043 1,188,644American International Group, Inc. . . . . . . . . . . . . . . . . . . . 118,905 6,330,502Assurant, Inc. . . . . . . . . . . . . . . . . . . . . . . . . . . . . . . . . . 29,741 3,210,541Assured Guaranty, Ltd. . . . . . . . . . . . . . . . . . . . . . . . . . . . 113,738 4,803,156Athene Holding, Ltd. - Class A (a) . . . . . . . . . . . . . . . . . . . . 78,713 4,066,313Hartford Financial Services Group, Inc. (The) . . . . . . . . . . . . . 46,809 2,338,578Marsh & McLennan Cos., Inc. (b) . . . . . . . . . . . . . . . . . . . . . 62,754 5,191,011Prudential Financial, Inc. . . . . . . . . . . . . . . . . . . . . . . . . . . 34,253 3,470,514Trupanion, Inc. (a) (b) . . . . . . . . . . . . . . . . . . . . . . . . . . . 38,600 1,379,178
31,978,437
Interactive Media & Services—2.4%Alphabet, Inc. - Class A (a) . . . . . . . . . . . . . . . . . . . . . . . . . 20,035 24,183,848Facebook, Inc. - Class A (a) . . . . . . . . . . . . . . . . . . . . . . . . 40,669 6,688,424
30,872,272
Internet & Direct Marketing Retail—3.6%Amazon.com, Inc. (a) . . . . . . . . . . . . . . . . . . . . . . . . . . . . 16,393 32,835,179eBay, Inc. (a) . . . . . . . . . . . . . . . . . . . . . . . . . . . . . . . . . 59,216 1,955,312Etsy, Inc. (a) . . . . . . . . . . . . . . . . . . . . . . . . . . . . . . . . . . 41,709 2,143,009Expedia Group, Inc. (b) . . . . . . . . . . . . . . . . . . . . . . . . . . . 28,968 3,779,745Wayfair, Inc. - Class A (a) (b) . . . . . . . . . . . . . . . . . . . . . . . 37,117 5,481,067
46,194,312
BHFTII-102
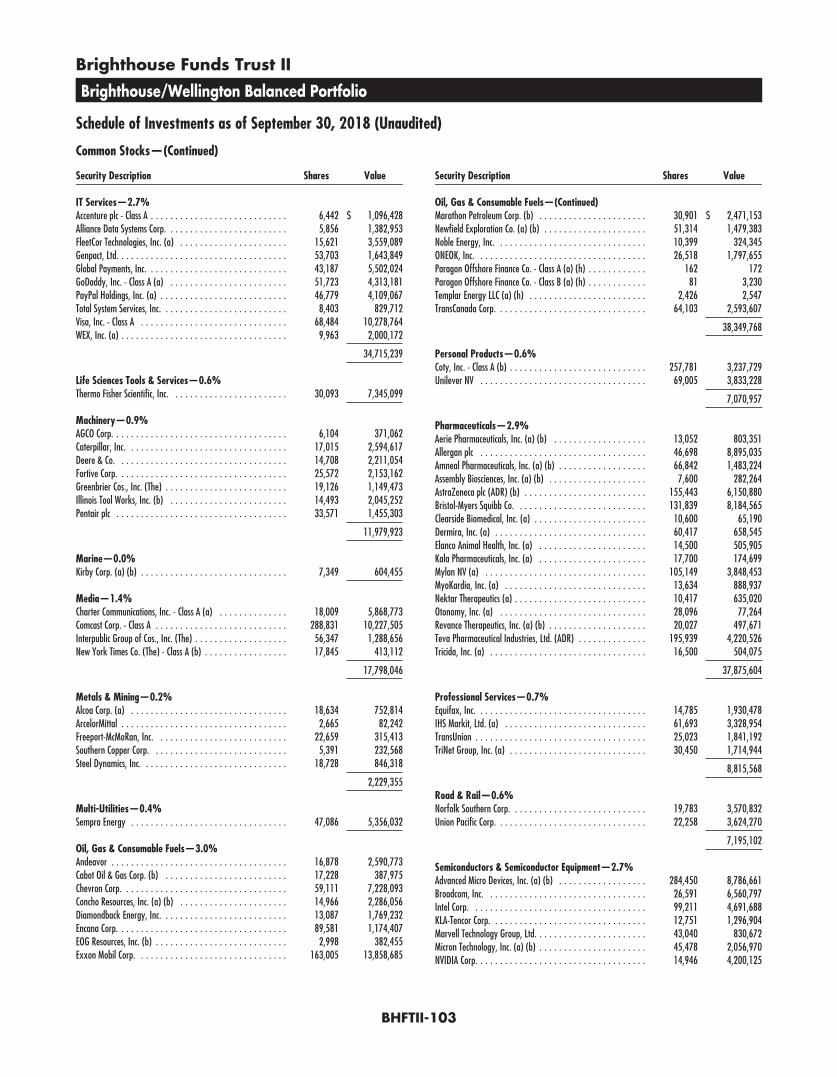
Brighthouse Funds Trust II
Brighthouse/Wellington Balanced Portfolio
Schedule of Investments as of September 30, 2018 (Unaudited)
Common Stocks—(Continued)
Security Description Shares Value
IT Services—2.7%Accenture plc - Class A . . . . . . . . . . . . . . . . . . . . . . . . . . . . 6,442 $ 1,096,428Alliance Data Systems Corp. . . . . . . . . . . . . . . . . . . . . . . . . 5,856 1,382,953FleetCor Technologies, Inc. (a) . . . . . . . . . . . . . . . . . . . . . . 15,621 3,559,089Genpact, Ltd. . . . . . . . . . . . . . . . . . . . . . . . . . . . . . . . . . . 53,703 1,643,849Global Payments, Inc. . . . . . . . . . . . . . . . . . . . . . . . . . . . . 43,187 5,502,024GoDaddy, Inc. - Class A (a) . . . . . . . . . . . . . . . . . . . . . . . . 51,723 4,313,181PayPal Holdings, Inc. (a) . . . . . . . . . . . . . . . . . . . . . . . . . . 46,779 4,109,067Total System Services, Inc. . . . . . . . . . . . . . . . . . . . . . . . . . 8,403 829,712Visa, Inc. - Class A . . . . . . . . . . . . . . . . . . . . . . . . . . . . . . 68,484 10,278,764WEX, Inc. (a) . . . . . . . . . . . . . . . . . . . . . . . . . . . . . . . . . . 9,963 2,000,172
34,715,239
Life Sciences Tools & Services—0.6%Thermo Fisher Scientific, Inc. . . . . . . . . . . . . . . . . . . . . . . . 30,093 7,345,099
Machinery—0.9%AGCO Corp. . . . . . . . . . . . . . . . . . . . . . . . . . . . . . . . . . . . 6,104 371,062Caterpillar, Inc. . . . . . . . . . . . . . . . . . . . . . . . . . . . . . . . . 17,015 2,594,617Deere & Co. . . . . . . . . . . . . . . . . . . . . . . . . . . . . . . . . . . 14,708 2,211,054Fortive Corp. . . . . . . . . . . . . . . . . . . . . . . . . . . . . . . . . . . 25,572 2,153,162Greenbrier Cos., Inc. (The) . . . . . . . . . . . . . . . . . . . . . . . . . 19,126 1,149,473Illinois Tool Works, Inc. (b) . . . . . . . . . . . . . . . . . . . . . . . . 14,493 2,045,252Pentair plc . . . . . . . . . . . . . . . . . . . . . . . . . . . . . . . . . . . 33,571 1,455,303
11,979,923
Marine—0.0%Kirby Corp. (a) (b) . . . . . . . . . . . . . . . . . . . . . . . . . . . . . . 7,349 604,455
Media—1.4%Charter Communications, Inc. - Class A (a) . . . . . . . . . . . . . . 18,009 5,868,773Comcast Corp. - Class A . . . . . . . . . . . . . . . . . . . . . . . . . . . 288,831 10,227,505Interpublic Group of Cos., Inc. (The) . . . . . . . . . . . . . . . . . . . 56,347 1,288,656New York Times Co. (The) - Class A (b) . . . . . . . . . . . . . . . . . 17,845 413,112
17,798,046
Metals & Mining—0.2%Alcoa Corp. (a) . . . . . . . . . . . . . . . . . . . . . . . . . . . . . . . . 18,634 752,814ArcelorMittal . . . . . . . . . . . . . . . . . . . . . . . . . . . . . . . . . . 2,665 82,242Freeport-McMoRan, Inc. . . . . . . . . . . . . . . . . . . . . . . . . . . 22,659 315,413Southern Copper Corp. . . . . . . . . . . . . . . . . . . . . . . . . . . . 5,391 232,568Steel Dynamics, Inc. . . . . . . . . . . . . . . . . . . . . . . . . . . . . . 18,728 846,318
2,229,355
Multi-Utilities—0.4%Sempra Energy . . . . . . . . . . . . . . . . . . . . . . . . . . . . . . . . 47,086 5,356,032
Oil, Gas & Consumable Fuels—3.0%Andeavor . . . . . . . . . . . . . . . . . . . . . . . . . . . . . . . . . . . . 16,878 2,590,773Cabot Oil & Gas Corp. (b) . . . . . . . . . . . . . . . . . . . . . . . . . 17,228 387,975Chevron Corp. . . . . . . . . . . . . . . . . . . . . . . . . . . . . . . . . . 59,111 7,228,093Concho Resources, Inc. (a) (b) . . . . . . . . . . . . . . . . . . . . . . 14,966 2,286,056Diamondback Energy, Inc. . . . . . . . . . . . . . . . . . . . . . . . . . 13,087 1,769,232Encana Corp. . . . . . . . . . . . . . . . . . . . . . . . . . . . . . . . . . . 89,581 1,174,407EOG Resources, Inc. (b) . . . . . . . . . . . . . . . . . . . . . . . . . . . 2,998 382,455Exxon Mobil Corp. . . . . . . . . . . . . . . . . . . . . . . . . . . . . . . 163,005 13,858,685
Security Description Shares Value
Oil, Gas & Consumable Fuels—(Continued)Marathon Petroleum Corp. (b) . . . . . . . . . . . . . . . . . . . . . . 30,901 $ 2,471,153Newfield Exploration Co. (a) (b) . . . . . . . . . . . . . . . . . . . . . 51,314 1,479,383Noble Energy, Inc. . . . . . . . . . . . . . . . . . . . . . . . . . . . . . . 10,399 324,345ONEOK, Inc. . . . . . . . . . . . . . . . . . . . . . . . . . . . . . . . . . . 26,518 1,797,655Paragon Offshore Finance Co. - Class A (a) (h) . . . . . . . . . . . . 162 172Paragon Offshore Finance Co. - Class B (a) (h) . . . . . . . . . . . . 81 3,230Templar Energy LLC (a) (h) . . . . . . . . . . . . . . . . . . . . . . . . 2,426 2,547TransCanada Corp. . . . . . . . . . . . . . . . . . . . . . . . . . . . . . . 64,103 2,593,607
38,349,768
Personal Products—0.6%Coty, Inc. - Class A (b) . . . . . . . . . . . . . . . . . . . . . . . . . . . . 257,781 3,237,729Unilever NV . . . . . . . . . . . . . . . . . . . . . . . . . . . . . . . . . . 69,005 3,833,228
7,070,957
Pharmaceuticals—2.9%Aerie Pharmaceuticals, Inc. (a) (b) . . . . . . . . . . . . . . . . . . . 13,052 803,351Allergan plc . . . . . . . . . . . . . . . . . . . . . . . . . . . . . . . . . . 46,698 8,895,035Amneal Pharmaceuticals, Inc. (a) (b) . . . . . . . . . . . . . . . . . . 66,842 1,483,224Assembly Biosciences, Inc. (a) (b) . . . . . . . . . . . . . . . . . . . . 7,600 282,264AstraZeneca plc (ADR) (b) . . . . . . . . . . . . . . . . . . . . . . . . . 155,443 6,150,880Bristol-Myers Squibb Co. . . . . . . . . . . . . . . . . . . . . . . . . . . 131,839 8,184,565Clearside Biomedical, Inc. (a) . . . . . . . . . . . . . . . . . . . . . . . 10,600 65,190Dermira, Inc. (a) . . . . . . . . . . . . . . . . . . . . . . . . . . . . . . . 60,417 658,545Elanco Animal Health, Inc. (a) . . . . . . . . . . . . . . . . . . . . . . 14,500 505,905Kala Pharmaceuticals, Inc. (a) . . . . . . . . . . . . . . . . . . . . . . 17,700 174,699Mylan NV (a) . . . . . . . . . . . . . . . . . . . . . . . . . . . . . . . . . 105,149 3,848,453MyoKardia, Inc. (a) . . . . . . . . . . . . . . . . . . . . . . . . . . . . . 13,634 888,937Nektar Therapeutics (a) . . . . . . . . . . . . . . . . . . . . . . . . . . . 10,417 635,020Otonomy, Inc. (a) . . . . . . . . . . . . . . . . . . . . . . . . . . . . . . 28,096 77,264Revance Therapeutics, Inc. (a) (b) . . . . . . . . . . . . . . . . . . . . 20,027 497,671Teva Pharmaceutical Industries, Ltd. (ADR) . . . . . . . . . . . . . . 195,939 4,220,526Tricida, Inc. (a) . . . . . . . . . . . . . . . . . . . . . . . . . . . . . . . . 16,500 504,075
37,875,604
Professional Services—0.7%Equifax, Inc. . . . . . . . . . . . . . . . . . . . . . . . . . . . . . . . . . . 14,785 1,930,478IHS Markit, Ltd. (a) . . . . . . . . . . . . . . . . . . . . . . . . . . . . . 61,693 3,328,954TransUnion . . . . . . . . . . . . . . . . . . . . . . . . . . . . . . . . . . . 25,023 1,841,192TriNet Group, Inc. (a) . . . . . . . . . . . . . . . . . . . . . . . . . . . . 30,450 1,714,944
8,815,568
Road & Rail—0.6%Norfolk Southern Corp. . . . . . . . . . . . . . . . . . . . . . . . . . . . 19,783 3,570,832Union Pacific Corp. . . . . . . . . . . . . . . . . . . . . . . . . . . . . . . 22,258 3,624,270
7,195,102
Semiconductors & Semiconductor Equipment—2.7%Advanced Micro Devices, Inc. (a) (b) . . . . . . . . . . . . . . . . . . 284,450 8,786,661Broadcom, Inc. . . . . . . . . . . . . . . . . . . . . . . . . . . . . . . . . 26,591 6,560,797Intel Corp. . . . . . . . . . . . . . . . . . . . . . . . . . . . . . . . . . . . 99,211 4,691,688KLA-Tencor Corp. . . . . . . . . . . . . . . . . . . . . . . . . . . . . . . . 12,751 1,296,904Marvell Technology Group, Ltd. . . . . . . . . . . . . . . . . . . . . . . 43,040 830,672Micron Technology, Inc. (a) (b) . . . . . . . . . . . . . . . . . . . . . . 45,478 2,056,970NVIDIA Corp. . . . . . . . . . . . . . . . . . . . . . . . . . . . . . . . . . . 14,946 4,200,125
BHFTII-103
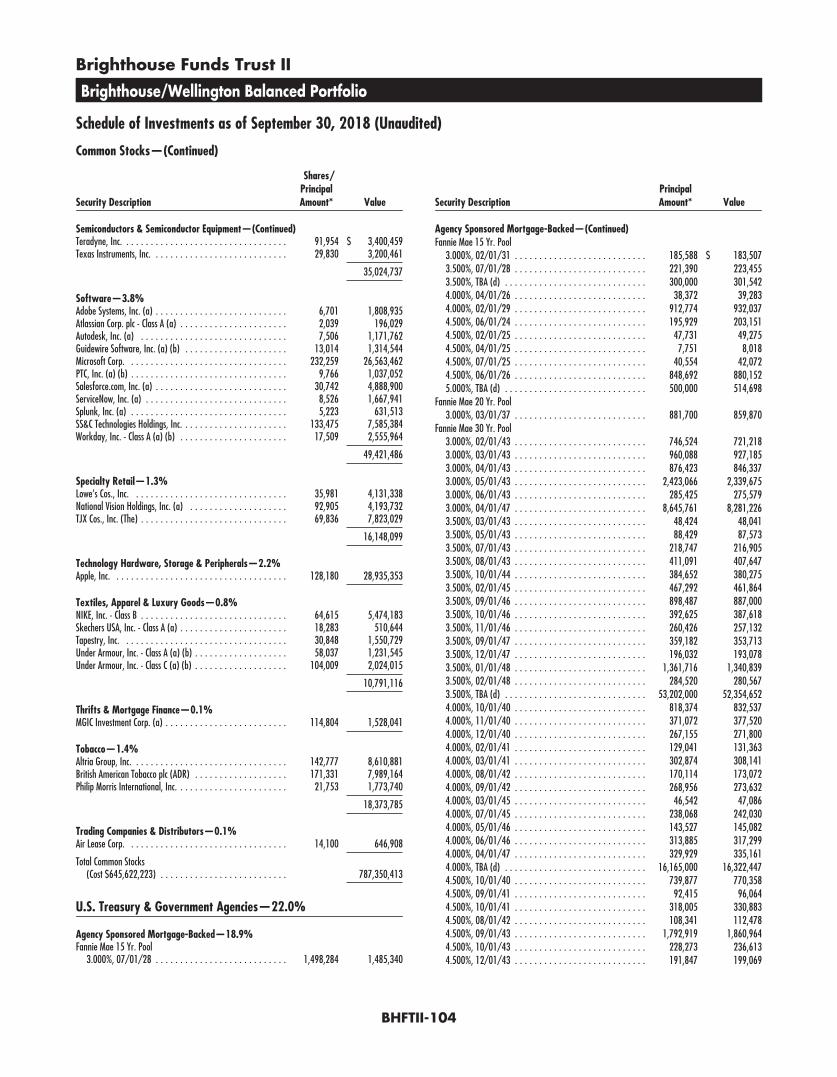
Brighthouse Funds Trust II
Brighthouse/Wellington Balanced Portfolio
Schedule of Investments as of September 30, 2018 (Unaudited)
Common Stocks—(Continued)
Security Description
Shares/PrincipalAmount* Value
Semiconductors & Semiconductor Equipment—(Continued)Teradyne, Inc. . . . . . . . . . . . . . . . . . . . . . . . . . . . . . . . . . 91,954 $ 3,400,459Texas Instruments, Inc. . . . . . . . . . . . . . . . . . . . . . . . . . . . 29,830 3,200,461
35,024,737
Software—3.8%Adobe Systems, Inc. (a) . . . . . . . . . . . . . . . . . . . . . . . . . . . 6,701 1,808,935Atlassian Corp. plc - Class A (a) . . . . . . . . . . . . . . . . . . . . . . 2,039 196,029Autodesk, Inc. (a) . . . . . . . . . . . . . . . . . . . . . . . . . . . . . . 7,506 1,171,762Guidewire Software, Inc. (a) (b) . . . . . . . . . . . . . . . . . . . . . 13,014 1,314,544Microsoft Corp. . . . . . . . . . . . . . . . . . . . . . . . . . . . . . . . . 232,259 26,563,462PTC, Inc. (a) (b) . . . . . . . . . . . . . . . . . . . . . . . . . . . . . . . . 9,766 1,037,052Salesforce.com, Inc. (a) . . . . . . . . . . . . . . . . . . . . . . . . . . . 30,742 4,888,900ServiceNow, Inc. (a) . . . . . . . . . . . . . . . . . . . . . . . . . . . . . 8,526 1,667,941Splunk, Inc. (a) . . . . . . . . . . . . . . . . . . . . . . . . . . . . . . . . 5,223 631,513SS&C Technologies Holdings, Inc. . . . . . . . . . . . . . . . . . . . . . 133,475 7,585,384Workday, Inc. - Class A (a) (b) . . . . . . . . . . . . . . . . . . . . . . 17,509 2,555,964
49,421,486
Specialty Retail—1.3%Lowe’s Cos., Inc. . . . . . . . . . . . . . . . . . . . . . . . . . . . . . . . 35,981 4,131,338National Vision Holdings, Inc. (a) . . . . . . . . . . . . . . . . . . . . 92,905 4,193,732TJX Cos., Inc. (The) . . . . . . . . . . . . . . . . . . . . . . . . . . . . . . 69,836 7,823,029
16,148,099
Technology Hardware, Storage & Peripherals—2.2%Apple, Inc. . . . . . . . . . . . . . . . . . . . . . . . . . . . . . . . . . . . 128,180 28,935,353
Textiles, Apparel & Luxury Goods—0.8%NIKE, Inc. - Class B . . . . . . . . . . . . . . . . . . . . . . . . . . . . . . 64,615 5,474,183Skechers USA, Inc. - Class A (a) . . . . . . . . . . . . . . . . . . . . . . 18,283 510,644Tapestry, Inc. . . . . . . . . . . . . . . . . . . . . . . . . . . . . . . . . . 30,848 1,550,729Under Armour, Inc. - Class A (a) (b) . . . . . . . . . . . . . . . . . . . 58,037 1,231,545Under Armour, Inc. - Class C (a) (b) . . . . . . . . . . . . . . . . . . . 104,009 2,024,015
10,791,116
Thrifts & Mortgage Finance—0.1%MGIC Investment Corp. (a) . . . . . . . . . . . . . . . . . . . . . . . . . 114,804 1,528,041
Tobacco—1.4%Altria Group, Inc. . . . . . . . . . . . . . . . . . . . . . . . . . . . . . . . 142,777 8,610,881British American Tobacco plc (ADR) . . . . . . . . . . . . . . . . . . . 171,331 7,989,164Philip Morris International, Inc. . . . . . . . . . . . . . . . . . . . . . . 21,753 1,773,740
18,373,785
Trading Companies & Distributors—0.1%Air Lease Corp. . . . . . . . . . . . . . . . . . . . . . . . . . . . . . . . . 14,100 646,908
Total Common Stocks(Cost $645,622,223) . . . . . . . . . . . . . . . . . . . . . . . . . . 787,350,413
U.S. Treasury & Government Agencies—22.0%
Agency Sponsored Mortgage-Backed—18.9%Fannie Mae 15 Yr. Pool
3.000%, 07/01/28 . . . . . . . . . . . . . . . . . . . . . . . . . . . 1,498,284 1,485,340
Security DescriptionPrincipalAmount* Value
Agency Sponsored Mortgage-Backed—(Continued)Fannie Mae 15 Yr. Pool
3.000%, 02/01/31 . . . . . . . . . . . . . . . . . . . . . . . . . . . 185,588 $ 183,5073.500%, 07/01/28 . . . . . . . . . . . . . . . . . . . . . . . . . . . 221,390 223,4553.500%, TBA (d) . . . . . . . . . . . . . . . . . . . . . . . . . . . . . 300,000 301,5424.000%, 04/01/26 . . . . . . . . . . . . . . . . . . . . . . . . . . . 38,372 39,2834.000%, 02/01/29 . . . . . . . . . . . . . . . . . . . . . . . . . . . 912,774 932,0374.500%, 06/01/24 . . . . . . . . . . . . . . . . . . . . . . . . . . . 195,929 203,1514.500%, 02/01/25 . . . . . . . . . . . . . . . . . . . . . . . . . . . 47,731 49,2754.500%, 04/01/25 . . . . . . . . . . . . . . . . . . . . . . . . . . . 7,751 8,0184.500%, 07/01/25 . . . . . . . . . . . . . . . . . . . . . . . . . . . 40,554 42,0724.500%, 06/01/26 . . . . . . . . . . . . . . . . . . . . . . . . . . . 848,692 880,1525.000%, TBA (d) . . . . . . . . . . . . . . . . . . . . . . . . . . . . . 500,000 514,698
Fannie Mae 20 Yr. Pool3.000%, 03/01/37 . . . . . . . . . . . . . . . . . . . . . . . . . . . 881,700 859,870
Fannie Mae 30 Yr. Pool3.000%, 02/01/43 . . . . . . . . . . . . . . . . . . . . . . . . . . . 746,524 721,2183.000%, 03/01/43 . . . . . . . . . . . . . . . . . . . . . . . . . . . 960,088 927,1853.000%, 04/01/43 . . . . . . . . . . . . . . . . . . . . . . . . . . . 876,423 846,3373.000%, 05/01/43 . . . . . . . . . . . . . . . . . . . . . . . . . . . 2,423,066 2,339,6753.000%, 06/01/43 . . . . . . . . . . . . . . . . . . . . . . . . . . . 285,425 275,5793.000%, 04/01/47 . . . . . . . . . . . . . . . . . . . . . . . . . . . 8,645,761 8,281,2263.500%, 03/01/43 . . . . . . . . . . . . . . . . . . . . . . . . . . . 48,424 48,0413.500%, 05/01/43 . . . . . . . . . . . . . . . . . . . . . . . . . . . 88,429 87,5733.500%, 07/01/43 . . . . . . . . . . . . . . . . . . . . . . . . . . . 218,747 216,9053.500%, 08/01/43 . . . . . . . . . . . . . . . . . . . . . . . . . . . 411,091 407,6473.500%, 10/01/44 . . . . . . . . . . . . . . . . . . . . . . . . . . . 384,652 380,2753.500%, 02/01/45 . . . . . . . . . . . . . . . . . . . . . . . . . . . 467,292 461,8643.500%, 09/01/46 . . . . . . . . . . . . . . . . . . . . . . . . . . . 898,487 887,0003.500%, 10/01/46 . . . . . . . . . . . . . . . . . . . . . . . . . . . 392,625 387,6183.500%, 11/01/46 . . . . . . . . . . . . . . . . . . . . . . . . . . . 260,426 257,1323.500%, 09/01/47 . . . . . . . . . . . . . . . . . . . . . . . . . . . 359,182 353,7133.500%, 12/01/47 . . . . . . . . . . . . . . . . . . . . . . . . . . . 196,032 193,0783.500%, 01/01/48 . . . . . . . . . . . . . . . . . . . . . . . . . . . 1,361,716 1,340,8393.500%, 02/01/48 . . . . . . . . . . . . . . . . . . . . . . . . . . . 284,520 280,5673.500%, TBA (d) . . . . . . . . . . . . . . . . . . . . . . . . . . . . . 53,202,000 52,354,6524.000%, 10/01/40 . . . . . . . . . . . . . . . . . . . . . . . . . . . 818,374 832,5374.000%, 11/01/40 . . . . . . . . . . . . . . . . . . . . . . . . . . . 371,072 377,5204.000%, 12/01/40 . . . . . . . . . . . . . . . . . . . . . . . . . . . 267,155 271,8004.000%, 02/01/41 . . . . . . . . . . . . . . . . . . . . . . . . . . . 129,041 131,3634.000%, 03/01/41 . . . . . . . . . . . . . . . . . . . . . . . . . . . 302,874 308,1414.000%, 08/01/42 . . . . . . . . . . . . . . . . . . . . . . . . . . . 170,114 173,0724.000%, 09/01/42 . . . . . . . . . . . . . . . . . . . . . . . . . . . 268,956 273,6324.000%, 03/01/45 . . . . . . . . . . . . . . . . . . . . . . . . . . . 46,542 47,0864.000%, 07/01/45 . . . . . . . . . . . . . . . . . . . . . . . . . . . 238,068 242,0304.000%, 05/01/46 . . . . . . . . . . . . . . . . . . . . . . . . . . . 143,527 145,0824.000%, 06/01/46 . . . . . . . . . . . . . . . . . . . . . . . . . . . 313,885 317,2994.000%, 04/01/47 . . . . . . . . . . . . . . . . . . . . . . . . . . . 329,929 335,1614.000%, TBA (d) . . . . . . . . . . . . . . . . . . . . . . . . . . . . . 16,165,000 16,322,4474.500%, 10/01/40 . . . . . . . . . . . . . . . . . . . . . . . . . . . 739,877 770,3584.500%, 09/01/41 . . . . . . . . . . . . . . . . . . . . . . . . . . . 92,415 96,0644.500%, 10/01/41 . . . . . . . . . . . . . . . . . . . . . . . . . . . 318,005 330,8834.500%, 08/01/42 . . . . . . . . . . . . . . . . . . . . . . . . . . . 108,341 112,4784.500%, 09/01/43 . . . . . . . . . . . . . . . . . . . . . . . . . . . 1,792,919 1,860,9644.500%, 10/01/43 . . . . . . . . . . . . . . . . . . . . . . . . . . . 228,273 236,6134.500%, 12/01/43 . . . . . . . . . . . . . . . . . . . . . . . . . . . 191,847 199,069
BHFTII-104
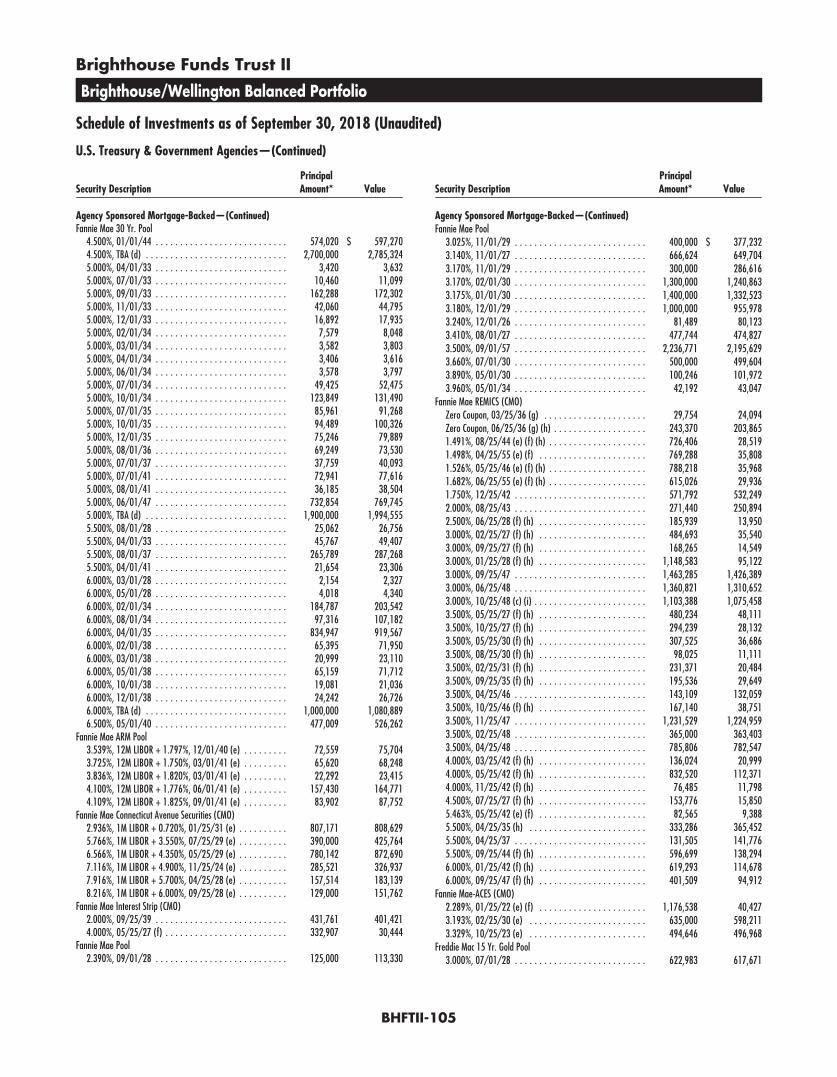
Brighthouse Funds Trust II
Brighthouse/Wellington Balanced Portfolio
Schedule of Investments as of September 30, 2018 (Unaudited)
U.S. Treasury & Government Agencies—(Continued)
Security DescriptionPrincipalAmount* Value
Agency Sponsored Mortgage-Backed—(Continued)Fannie Mae 30 Yr. Pool
4.500%, 01/01/44 . . . . . . . . . . . . . . . . . . . . . . . . . . . 574,020 $ 597,2704.500%, TBA (d) . . . . . . . . . . . . . . . . . . . . . . . . . . . . . 2,700,000 2,785,3245.000%, 04/01/33 . . . . . . . . . . . . . . . . . . . . . . . . . . . 3,420 3,6325.000%, 07/01/33 . . . . . . . . . . . . . . . . . . . . . . . . . . . 10,460 11,0995.000%, 09/01/33 . . . . . . . . . . . . . . . . . . . . . . . . . . . 162,288 172,3025.000%, 11/01/33 . . . . . . . . . . . . . . . . . . . . . . . . . . . 42,060 44,7955.000%, 12/01/33 . . . . . . . . . . . . . . . . . . . . . . . . . . . 16,892 17,9355.000%, 02/01/34 . . . . . . . . . . . . . . . . . . . . . . . . . . . 7,579 8,0485.000%, 03/01/34 . . . . . . . . . . . . . . . . . . . . . . . . . . . 3,582 3,8035.000%, 04/01/34 . . . . . . . . . . . . . . . . . . . . . . . . . . . 3,406 3,6165.000%, 06/01/34 . . . . . . . . . . . . . . . . . . . . . . . . . . . 3,578 3,7975.000%, 07/01/34 . . . . . . . . . . . . . . . . . . . . . . . . . . . 49,425 52,4755.000%, 10/01/34 . . . . . . . . . . . . . . . . . . . . . . . . . . . 123,849 131,4905.000%, 07/01/35 . . . . . . . . . . . . . . . . . . . . . . . . . . . 85,961 91,2685.000%, 10/01/35 . . . . . . . . . . . . . . . . . . . . . . . . . . . 94,489 100,3265.000%, 12/01/35 . . . . . . . . . . . . . . . . . . . . . . . . . . . 75,246 79,8895.000%, 08/01/36 . . . . . . . . . . . . . . . . . . . . . . . . . . . 69,249 73,5305.000%, 07/01/37 . . . . . . . . . . . . . . . . . . . . . . . . . . . 37,759 40,0935.000%, 07/01/41 . . . . . . . . . . . . . . . . . . . . . . . . . . . 72,941 77,6165.000%, 08/01/41 . . . . . . . . . . . . . . . . . . . . . . . . . . . 36,185 38,5045.000%, 06/01/47 . . . . . . . . . . . . . . . . . . . . . . . . . . . 732,854 769,7455.000%, TBA (d) . . . . . . . . . . . . . . . . . . . . . . . . . . . . . 1,900,000 1,994,5555.500%, 08/01/28 . . . . . . . . . . . . . . . . . . . . . . . . . . . 25,062 26,7565.500%, 04/01/33 . . . . . . . . . . . . . . . . . . . . . . . . . . . 45,767 49,4075.500%, 08/01/37 . . . . . . . . . . . . . . . . . . . . . . . . . . . 265,789 287,2685.500%, 04/01/41 . . . . . . . . . . . . . . . . . . . . . . . . . . . 21,654 23,3066.000%, 03/01/28 . . . . . . . . . . . . . . . . . . . . . . . . . . . 2,154 2,3276.000%, 05/01/28 . . . . . . . . . . . . . . . . . . . . . . . . . . . 4,018 4,3406.000%, 02/01/34 . . . . . . . . . . . . . . . . . . . . . . . . . . . 184,787 203,5426.000%, 08/01/34 . . . . . . . . . . . . . . . . . . . . . . . . . . . 97,316 107,1826.000%, 04/01/35 . . . . . . . . . . . . . . . . . . . . . . . . . . . 834,947 919,5676.000%, 02/01/38 . . . . . . . . . . . . . . . . . . . . . . . . . . . 65,395 71,9506.000%, 03/01/38 . . . . . . . . . . . . . . . . . . . . . . . . . . . 20,999 23,1106.000%, 05/01/38 . . . . . . . . . . . . . . . . . . . . . . . . . . . 65,159 71,7126.000%, 10/01/38 . . . . . . . . . . . . . . . . . . . . . . . . . . . 19,081 21,0366.000%, 12/01/38 . . . . . . . . . . . . . . . . . . . . . . . . . . . 24,242 26,7266.000%, TBA (d) . . . . . . . . . . . . . . . . . . . . . . . . . . . . . 1,000,000 1,080,8896.500%, 05/01/40 . . . . . . . . . . . . . . . . . . . . . . . . . . . 477,009 526,262
Fannie Mae ARM Pool3.539%, 12M LIBOR + 1.797%, 12/01/40 (e) . . . . . . . . . 72,559 75,7043.725%, 12M LIBOR + 1.750%, 03/01/41 (e) . . . . . . . . . 65,620 68,2483.836%, 12M LIBOR + 1.820%, 03/01/41 (e) . . . . . . . . . 22,292 23,4154.100%, 12M LIBOR + 1.776%, 06/01/41 (e) . . . . . . . . . 157,430 164,7714.109%, 12M LIBOR + 1.825%, 09/01/41 (e) . . . . . . . . . 83,902 87,752
Fannie Mae Connecticut Avenue Securities (CMO)2.936%, 1M LIBOR + 0.720%, 01/25/31 (e) . . . . . . . . . . 807,171 808,6295.766%, 1M LIBOR + 3.550%, 07/25/29 (e) . . . . . . . . . . 390,000 425,7646.566%, 1M LIBOR + 4.350%, 05/25/29 (e) . . . . . . . . . . 780,142 872,6907.116%, 1M LIBOR + 4.900%, 11/25/24 (e) . . . . . . . . . . 285,521 326,9377.916%, 1M LIBOR + 5.700%, 04/25/28 (e) . . . . . . . . . . 157,514 183,1398.216%, 1M LIBOR + 6.000%, 09/25/28 (e) . . . . . . . . . . 129,000 151,762
Fannie Mae Interest Strip (CMO)2.000%, 09/25/39 . . . . . . . . . . . . . . . . . . . . . . . . . . . 431,761 401,4214.000%, 05/25/27 (f) . . . . . . . . . . . . . . . . . . . . . . . . . 332,907 30,444
Fannie Mae Pool2.390%, 09/01/28 . . . . . . . . . . . . . . . . . . . . . . . . . . . 125,000 113,330
Security DescriptionPrincipalAmount* Value
Agency Sponsored Mortgage-Backed—(Continued)Fannie Mae Pool
3.025%, 11/01/29 . . . . . . . . . . . . . . . . . . . . . . . . . . . 400,000 $ 377,2323.140%, 11/01/27 . . . . . . . . . . . . . . . . . . . . . . . . . . . 666,624 649,7043.170%, 11/01/29 . . . . . . . . . . . . . . . . . . . . . . . . . . . 300,000 286,6163.170%, 02/01/30 . . . . . . . . . . . . . . . . . . . . . . . . . . . 1,300,000 1,240,8633.175%, 01/01/30 . . . . . . . . . . . . . . . . . . . . . . . . . . . 1,400,000 1,332,5233.180%, 12/01/29 . . . . . . . . . . . . . . . . . . . . . . . . . . . 1,000,000 955,9783.240%, 12/01/26 . . . . . . . . . . . . . . . . . . . . . . . . . . . 81,489 80,1233.410%, 08/01/27 . . . . . . . . . . . . . . . . . . . . . . . . . . . 477,744 474,8273.500%, 09/01/57 . . . . . . . . . . . . . . . . . . . . . . . . . . . 2,236,771 2,195,6293.660%, 07/01/30 . . . . . . . . . . . . . . . . . . . . . . . . . . . 500,000 499,6043.890%, 05/01/30 . . . . . . . . . . . . . . . . . . . . . . . . . . . 100,246 101,9723.960%, 05/01/34 . . . . . . . . . . . . . . . . . . . . . . . . . . . 42,192 43,047
Fannie Mae REMICS (CMO)Zero Coupon, 03/25/36 (g) . . . . . . . . . . . . . . . . . . . . . 29,754 24,094Zero Coupon, 06/25/36 (g) (h) . . . . . . . . . . . . . . . . . . . 243,370 203,8651.491%, 08/25/44 (e) (f) (h) . . . . . . . . . . . . . . . . . . . . 726,406 28,5191.498%, 04/25/55 (e) (f) . . . . . . . . . . . . . . . . . . . . . . 769,288 35,8081.526%, 05/25/46 (e) (f) (h) . . . . . . . . . . . . . . . . . . . . 788,218 35,9681.682%, 06/25/55 (e) (f) (h) . . . . . . . . . . . . . . . . . . . . 615,026 29,9361.750%, 12/25/42 . . . . . . . . . . . . . . . . . . . . . . . . . . . 571,792 532,2492.000%, 08/25/43 . . . . . . . . . . . . . . . . . . . . . . . . . . . 271,440 250,8942.500%, 06/25/28 (f) (h) . . . . . . . . . . . . . . . . . . . . . . 185,939 13,9503.000%, 02/25/27 (f) (h) . . . . . . . . . . . . . . . . . . . . . . 484,693 35,5403.000%, 09/25/27 (f) (h) . . . . . . . . . . . . . . . . . . . . . . 168,265 14,5493.000%, 01/25/28 (f) (h) . . . . . . . . . . . . . . . . . . . . . . 1,148,583 95,1223.000%, 09/25/47 . . . . . . . . . . . . . . . . . . . . . . . . . . . 1,463,285 1,426,3893.000%, 06/25/48 . . . . . . . . . . . . . . . . . . . . . . . . . . . 1,360,821 1,310,6523.000%, 10/25/48 (c) (i) . . . . . . . . . . . . . . . . . . . . . . . 1,103,388 1,075,4583.500%, 05/25/27 (f) (h) . . . . . . . . . . . . . . . . . . . . . . 480,234 48,1113.500%, 10/25/27 (f) (h) . . . . . . . . . . . . . . . . . . . . . . 294,239 28,1323.500%, 05/25/30 (f) (h) . . . . . . . . . . . . . . . . . . . . . . 307,525 36,6863.500%, 08/25/30 (f) (h) . . . . . . . . . . . . . . . . . . . . . . 98,025 11,1113.500%, 02/25/31 (f) (h) . . . . . . . . . . . . . . . . . . . . . . 231,371 20,4843.500%, 09/25/35 (f) (h) . . . . . . . . . . . . . . . . . . . . . . 195,536 29,6493.500%, 04/25/46 . . . . . . . . . . . . . . . . . . . . . . . . . . . 143,109 132,0593.500%, 10/25/46 (f) (h) . . . . . . . . . . . . . . . . . . . . . . 167,140 38,7513.500%, 11/25/47 . . . . . . . . . . . . . . . . . . . . . . . . . . . 1,231,529 1,224,9593.500%, 02/25/48 . . . . . . . . . . . . . . . . . . . . . . . . . . . 365,000 363,4033.500%, 04/25/48 . . . . . . . . . . . . . . . . . . . . . . . . . . . 785,806 782,5474.000%, 03/25/42 (f) (h) . . . . . . . . . . . . . . . . . . . . . . 136,024 20,9994.000%, 05/25/42 (f) (h) . . . . . . . . . . . . . . . . . . . . . . 832,520 112,3714.000%, 11/25/42 (f) (h) . . . . . . . . . . . . . . . . . . . . . . 76,485 11,7984.500%, 07/25/27 (f) (h) . . . . . . . . . . . . . . . . . . . . . . 153,776 15,8505.463%, 05/25/42 (e) (f) . . . . . . . . . . . . . . . . . . . . . . 82,565 9,3885.500%, 04/25/35 (h) . . . . . . . . . . . . . . . . . . . . . . . . 333,286 365,4525.500%, 04/25/37 . . . . . . . . . . . . . . . . . . . . . . . . . . . 131,505 141,7765.500%, 09/25/44 (f) (h) . . . . . . . . . . . . . . . . . . . . . . 596,699 138,2946.000%, 01/25/42 (f) (h) . . . . . . . . . . . . . . . . . . . . . . 619,293 114,6786.000%, 09/25/47 (f) (h) . . . . . . . . . . . . . . . . . . . . . . 401,509 94,912
Fannie Mae-ACES (CMO)2.289%, 01/25/22 (e) (f) . . . . . . . . . . . . . . . . . . . . . . 1,176,538 40,4273.193%, 02/25/30 (e) . . . . . . . . . . . . . . . . . . . . . . . . 635,000 598,2113.329%, 10/25/23 (e) . . . . . . . . . . . . . . . . . . . . . . . . 494,646 496,968
Freddie Mac 15 Yr. Gold Pool3.000%, 07/01/28 . . . . . . . . . . . . . . . . . . . . . . . . . . . 622,983 617,671
BHFTII-105
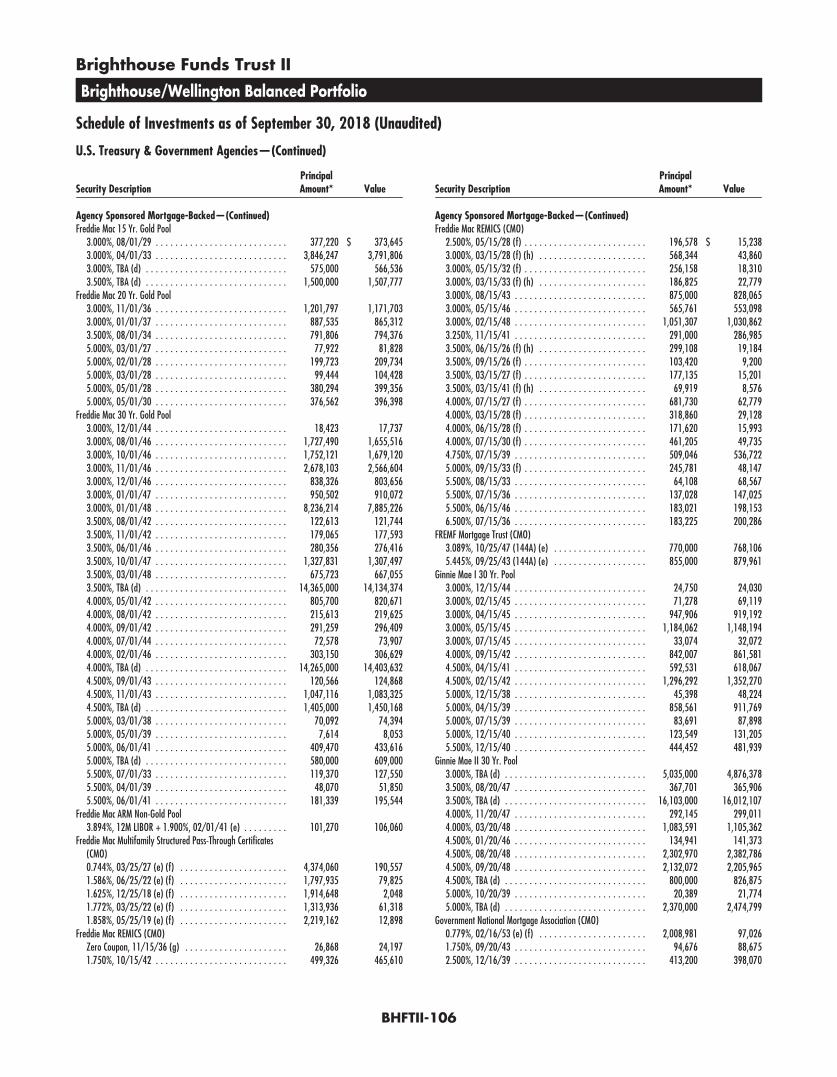
Brighthouse Funds Trust II
Brighthouse/Wellington Balanced Portfolio
Schedule of Investments as of September 30, 2018 (Unaudited)
U.S. Treasury & Government Agencies—(Continued)
Security DescriptionPrincipalAmount* Value
Agency Sponsored Mortgage-Backed—(Continued)Freddie Mac 15 Yr. Gold Pool
3.000%, 08/01/29 . . . . . . . . . . . . . . . . . . . . . . . . . . . 377,220 $ 373,6453.000%, 04/01/33 . . . . . . . . . . . . . . . . . . . . . . . . . . . 3,846,247 3,791,8063.000%, TBA (d) . . . . . . . . . . . . . . . . . . . . . . . . . . . . . 575,000 566,5363.500%, TBA (d) . . . . . . . . . . . . . . . . . . . . . . . . . . . . . 1,500,000 1,507,777
Freddie Mac 20 Yr. Gold Pool3.000%, 11/01/36 . . . . . . . . . . . . . . . . . . . . . . . . . . . 1,201,797 1,171,7033.000%, 01/01/37 . . . . . . . . . . . . . . . . . . . . . . . . . . . 887,535 865,3123.500%, 08/01/34 . . . . . . . . . . . . . . . . . . . . . . . . . . . 791,806 794,3765.000%, 03/01/27 . . . . . . . . . . . . . . . . . . . . . . . . . . . 77,922 81,8285.000%, 02/01/28 . . . . . . . . . . . . . . . . . . . . . . . . . . . 199,723 209,7345.000%, 03/01/28 . . . . . . . . . . . . . . . . . . . . . . . . . . . 99,444 104,4285.000%, 05/01/28 . . . . . . . . . . . . . . . . . . . . . . . . . . . 380,294 399,3565.000%, 05/01/30 . . . . . . . . . . . . . . . . . . . . . . . . . . . 376,562 396,398
Freddie Mac 30 Yr. Gold Pool3.000%, 12/01/44 . . . . . . . . . . . . . . . . . . . . . . . . . . . 18,423 17,7373.000%, 08/01/46 . . . . . . . . . . . . . . . . . . . . . . . . . . . 1,727,490 1,655,5163.000%, 10/01/46 . . . . . . . . . . . . . . . . . . . . . . . . . . . 1,752,121 1,679,1203.000%, 11/01/46 . . . . . . . . . . . . . . . . . . . . . . . . . . . 2,678,103 2,566,6043.000%, 12/01/46 . . . . . . . . . . . . . . . . . . . . . . . . . . . 838,326 803,6563.000%, 01/01/47 . . . . . . . . . . . . . . . . . . . . . . . . . . . 950,502 910,0723.000%, 01/01/48 . . . . . . . . . . . . . . . . . . . . . . . . . . . 8,236,214 7,885,2263.500%, 08/01/42 . . . . . . . . . . . . . . . . . . . . . . . . . . . 122,613 121,7443.500%, 11/01/42 . . . . . . . . . . . . . . . . . . . . . . . . . . . 179,065 177,5933.500%, 06/01/46 . . . . . . . . . . . . . . . . . . . . . . . . . . . 280,356 276,4163.500%, 10/01/47 . . . . . . . . . . . . . . . . . . . . . . . . . . . 1,327,831 1,307,4973.500%, 03/01/48 . . . . . . . . . . . . . . . . . . . . . . . . . . . 675,723 667,0553.500%, TBA (d) . . . . . . . . . . . . . . . . . . . . . . . . . . . . . 14,365,000 14,134,3744.000%, 05/01/42 . . . . . . . . . . . . . . . . . . . . . . . . . . . 805,700 820,6714.000%, 08/01/42 . . . . . . . . . . . . . . . . . . . . . . . . . . . 215,613 219,6254.000%, 09/01/42 . . . . . . . . . . . . . . . . . . . . . . . . . . . 291,259 296,4094.000%, 07/01/44 . . . . . . . . . . . . . . . . . . . . . . . . . . . 72,578 73,9074.000%, 02/01/46 . . . . . . . . . . . . . . . . . . . . . . . . . . . 303,150 306,6294.000%, TBA (d) . . . . . . . . . . . . . . . . . . . . . . . . . . . . . 14,265,000 14,403,6324.500%, 09/01/43 . . . . . . . . . . . . . . . . . . . . . . . . . . . 120,566 124,8684.500%, 11/01/43 . . . . . . . . . . . . . . . . . . . . . . . . . . . 1,047,116 1,083,3254.500%, TBA (d) . . . . . . . . . . . . . . . . . . . . . . . . . . . . . 1,405,000 1,450,1685.000%, 03/01/38 . . . . . . . . . . . . . . . . . . . . . . . . . . . 70,092 74,3945.000%, 05/01/39 . . . . . . . . . . . . . . . . . . . . . . . . . . . 7,614 8,0535.000%, 06/01/41 . . . . . . . . . . . . . . . . . . . . . . . . . . . 409,470 433,6165.000%, TBA (d) . . . . . . . . . . . . . . . . . . . . . . . . . . . . . 580,000 609,0005.500%, 07/01/33 . . . . . . . . . . . . . . . . . . . . . . . . . . . 119,370 127,5505.500%, 04/01/39 . . . . . . . . . . . . . . . . . . . . . . . . . . . 48,070 51,8505.500%, 06/01/41 . . . . . . . . . . . . . . . . . . . . . . . . . . . 181,339 195,544
Freddie Mac ARM Non-Gold Pool3.894%, 12M LIBOR + 1.900%, 02/01/41 (e) . . . . . . . . . 101,270 106,060
Freddie Mac Multifamily Structured Pass-Through Certificates(CMO)0.744%, 03/25/27 (e) (f) . . . . . . . . . . . . . . . . . . . . . . 4,374,060 190,5571.586%, 06/25/22 (e) (f) . . . . . . . . . . . . . . . . . . . . . . 1,797,935 79,8251.625%, 12/25/18 (e) (f) . . . . . . . . . . . . . . . . . . . . . . 1,914,648 2,0481.772%, 03/25/22 (e) (f) . . . . . . . . . . . . . . . . . . . . . . 1,313,936 61,3181.858%, 05/25/19 (e) (f) . . . . . . . . . . . . . . . . . . . . . . 2,219,162 12,898
Freddie Mac REMICS (CMO)Zero Coupon, 11/15/36 (g) . . . . . . . . . . . . . . . . . . . . . 26,868 24,1971.750%, 10/15/42 . . . . . . . . . . . . . . . . . . . . . . . . . . . 499,326 465,610
Security DescriptionPrincipalAmount* Value
Agency Sponsored Mortgage-Backed—(Continued)Freddie Mac REMICS (CMO)
2.500%, 05/15/28 (f) . . . . . . . . . . . . . . . . . . . . . . . . . 196,578 $ 15,2383.000%, 03/15/28 (f) (h) . . . . . . . . . . . . . . . . . . . . . . 568,344 43,8603.000%, 05/15/32 (f) . . . . . . . . . . . . . . . . . . . . . . . . . 256,158 18,3103.000%, 03/15/33 (f) (h) . . . . . . . . . . . . . . . . . . . . . . 186,825 22,7793.000%, 08/15/43 . . . . . . . . . . . . . . . . . . . . . . . . . . . 875,000 828,0653.000%, 05/15/46 . . . . . . . . . . . . . . . . . . . . . . . . . . . 565,761 553,0983.000%, 02/15/48 . . . . . . . . . . . . . . . . . . . . . . . . . . . 1,051,307 1,030,8623.250%, 11/15/41 . . . . . . . . . . . . . . . . . . . . . . . . . . . 291,000 286,9853.500%, 06/15/26 (f) (h) . . . . . . . . . . . . . . . . . . . . . . 299,108 19,1843.500%, 09/15/26 (f) . . . . . . . . . . . . . . . . . . . . . . . . . 103,420 9,2003.500%, 03/15/27 (f) . . . . . . . . . . . . . . . . . . . . . . . . . 177,135 15,2013.500%, 03/15/41 (f) (h) . . . . . . . . . . . . . . . . . . . . . . 69,919 8,5764.000%, 07/15/27 (f) . . . . . . . . . . . . . . . . . . . . . . . . . 681,730 62,7794.000%, 03/15/28 (f) . . . . . . . . . . . . . . . . . . . . . . . . . 318,860 29,1284.000%, 06/15/28 (f) . . . . . . . . . . . . . . . . . . . . . . . . . 171,620 15,9934.000%, 07/15/30 (f) . . . . . . . . . . . . . . . . . . . . . . . . . 461,205 49,7354.750%, 07/15/39 . . . . . . . . . . . . . . . . . . . . . . . . . . . 509,046 536,7225.000%, 09/15/33 (f) . . . . . . . . . . . . . . . . . . . . . . . . . 245,781 48,1475.500%, 08/15/33 . . . . . . . . . . . . . . . . . . . . . . . . . . . 64,108 68,5675.500%, 07/15/36 . . . . . . . . . . . . . . . . . . . . . . . . . . . 137,028 147,0255.500%, 06/15/46 . . . . . . . . . . . . . . . . . . . . . . . . . . . 183,021 198,1536.500%, 07/15/36 . . . . . . . . . . . . . . . . . . . . . . . . . . . 183,225 200,286
FREMF Mortgage Trust (CMO)3.089%, 10/25/47 (144A) (e) . . . . . . . . . . . . . . . . . . . 770,000 768,1065.445%, 09/25/43 (144A) (e) . . . . . . . . . . . . . . . . . . . 855,000 879,961
Ginnie Mae I 30 Yr. Pool3.000%, 12/15/44 . . . . . . . . . . . . . . . . . . . . . . . . . . . 24,750 24,0303.000%, 02/15/45 . . . . . . . . . . . . . . . . . . . . . . . . . . . 71,278 69,1193.000%, 04/15/45 . . . . . . . . . . . . . . . . . . . . . . . . . . . 947,906 919,1923.000%, 05/15/45 . . . . . . . . . . . . . . . . . . . . . . . . . . . 1,184,062 1,148,1943.000%, 07/15/45 . . . . . . . . . . . . . . . . . . . . . . . . . . . 33,074 32,0724.000%, 09/15/42 . . . . . . . . . . . . . . . . . . . . . . . . . . . 842,007 861,5814.500%, 04/15/41 . . . . . . . . . . . . . . . . . . . . . . . . . . . 592,531 618,0674.500%, 02/15/42 . . . . . . . . . . . . . . . . . . . . . . . . . . . 1,296,292 1,352,2705.000%, 12/15/38 . . . . . . . . . . . . . . . . . . . . . . . . . . . 45,398 48,2245.000%, 04/15/39 . . . . . . . . . . . . . . . . . . . . . . . . . . . 858,561 911,7695.000%, 07/15/39 . . . . . . . . . . . . . . . . . . . . . . . . . . . 83,691 87,8985.000%, 12/15/40 . . . . . . . . . . . . . . . . . . . . . . . . . . . 123,549 131,2055.500%, 12/15/40 . . . . . . . . . . . . . . . . . . . . . . . . . . . 444,452 481,939
Ginnie Mae II 30 Yr. Pool3.000%, TBA (d) . . . . . . . . . . . . . . . . . . . . . . . . . . . . . 5,035,000 4,876,3783.500%, 08/20/47 . . . . . . . . . . . . . . . . . . . . . . . . . . . 367,701 365,9063.500%, TBA (d) . . . . . . . . . . . . . . . . . . . . . . . . . . . . . 16,103,000 16,012,1074.000%, 11/20/47 . . . . . . . . . . . . . . . . . . . . . . . . . . . 292,145 299,0114.000%, 03/20/48 . . . . . . . . . . . . . . . . . . . . . . . . . . . 1,083,591 1,105,3624.500%, 01/20/46 . . . . . . . . . . . . . . . . . . . . . . . . . . . 134,941 141,3734.500%, 08/20/48 . . . . . . . . . . . . . . . . . . . . . . . . . . . 2,302,970 2,382,7864.500%, 09/20/48 . . . . . . . . . . . . . . . . . . . . . . . . . . . 2,132,072 2,205,9654.500%, TBA (d) . . . . . . . . . . . . . . . . . . . . . . . . . . . . . 800,000 826,8755.000%, 10/20/39 . . . . . . . . . . . . . . . . . . . . . . . . . . . 20,389 21,7745.000%, TBA (d) . . . . . . . . . . . . . . . . . . . . . . . . . . . . . 2,370,000 2,474,799
Government National Mortgage Association (CMO)0.779%, 02/16/53 (e) (f) . . . . . . . . . . . . . . . . . . . . . . 2,008,981 97,0261.750%, 09/20/43 . . . . . . . . . . . . . . . . . . . . . . . . . . . 94,676 88,6752.500%, 12/16/39 . . . . . . . . . . . . . . . . . . . . . . . . . . . 413,200 398,070
BHFTII-106

Brighthouse Funds Trust II
Brighthouse/Wellington Balanced Portfolio
Schedule of Investments as of September 30, 2018 (Unaudited)
U.S. Treasury & Government Agencies—(Continued)
Security DescriptionPrincipalAmount* Value
Agency Sponsored Mortgage-Backed—(Continued)Government National Mortgage Association (CMO)
3.000%, 09/20/28 (f) . . . . . . . . . . . . . . . . . . . . . . . . . 216,157 $ 18,5653.000%, 02/16/43 (f) . . . . . . . . . . . . . . . . . . . . . . . . . 131,815 20,6433.000%, 03/20/47 . . . . . . . . . . . . . . . . . . . . . . . . . . . 158,322 133,3453.500%, 02/16/27 (f) . . . . . . . . . . . . . . . . . . . . . . . . . 92,526 8,2523.500%, 03/20/27 (f) . . . . . . . . . . . . . . . . . . . . . . . . . 228,329 22,4263.500%, 10/20/29 (f) . . . . . . . . . . . . . . . . . . . . . . . . . 1,214,175 137,7723.500%, 07/20/40 (f) . . . . . . . . . . . . . . . . . . . . . . . . . 221,732 24,4043.500%, 02/20/41 (f) . . . . . . . . . . . . . . . . . . . . . . . . . 317,635 37,4993.500%, 04/20/42 (f) . . . . . . . . . . . . . . . . . . . . . . . . . 539,041 68,3903.500%, 10/20/42 (f) . . . . . . . . . . . . . . . . . . . . . . . . . 813,317 150,0943.500%, 05/20/43 (f) (h) . . . . . . . . . . . . . . . . . . . . . . 113,949 20,3003.500%, 07/20/43 (f) (h) . . . . . . . . . . . . . . . . . . . . . . 440,865 69,0583.500%, 01/20/46 . . . . . . . . . . . . . . . . . . . . . . . . . . . 508,000 481,6834.000%, 12/16/26 (f) . . . . . . . . . . . . . . . . . . . . . . . . . 63,610 6,3564.000%, 05/20/29 (f) . . . . . . . . . . . . . . . . . . . . . . . . . 943,866 94,8784.000%, 05/16/42 (f) (h) . . . . . . . . . . . . . . . . . . . . . . 96,364 13,5054.000%, 03/20/43 (f) . . . . . . . . . . . . . . . . . . . . . . . . . 151,984 32,8444.000%, 01/20/44 (f) (h) . . . . . . . . . . . . . . . . . . . . . . 69,014 16,2274.000%, 11/20/44 (f) (h) . . . . . . . . . . . . . . . . . . . . . . 1,137,100 201,2764.000%, 03/20/47 (f) . . . . . . . . . . . . . . . . . . . . . . . . . 549,273 100,9404.000%, 07/20/47 (f) . . . . . . . . . . . . . . . . . . . . . . . . . 828,781 149,7534.500%, 04/20/45 (f) (h) . . . . . . . . . . . . . . . . . . . . . . 243,025 59,3595.000%, 02/16/40 (f) . . . . . . . . . . . . . . . . . . . . . . . . . 636,697 152,1605.000%, 10/16/41 (f) (h) . . . . . . . . . . . . . . . . . . . . . . 366,948 55,3905.000%, 01/16/47 (f) . . . . . . . . . . . . . . . . . . . . . . . . . 162,845 35,8695.500%, 03/20/39 (f) (h) . . . . . . . . . . . . . . . . . . . . . . 458,752 104,8855.500%, 02/16/47 (f) . . . . . . . . . . . . . . . . . . . . . . . . . 443,023 100,1835.500%, 02/20/47 (f) . . . . . . . . . . . . . . . . . . . . . . . . . 273,026 60,4236.000%, 09/20/40 (f) . . . . . . . . . . . . . . . . . . . . . . . . . 488,514 116,6566.000%, 02/20/46 (f) . . . . . . . . . . . . . . . . . . . . . . . . . 422,294 98,021
243,396,465
U.S. Treasury—3.1%U.S. Treasury Bonds
2.875%, 11/15/46 (j) . . . . . . . . . . . . . . . . . . . . . . . . . 1,600,000 1,504,1253.000%, 11/15/45 (j) (k) . . . . . . . . . . . . . . . . . . . . . . 1,980,000 1,908,8443.000%, 02/15/47 (k) . . . . . . . . . . . . . . . . . . . . . . . . 1,500,000 1,444,7463.000%, 02/15/48 (k) . . . . . . . . . . . . . . . . . . . . . . . . 2,840,000 2,731,9473.750%, 11/15/43 (k) . . . . . . . . . . . . . . . . . . . . . . . . 7,910,000 8,658,360
U.S. Treasury Inflation Indexed Notes0.250%, 01/15/25 (k) (l) (m) . . . . . . . . . . . . . . . . . . . 8,536,231 8,192,5650.625%, 01/15/26 (b) (l) . . . . . . . . . . . . . . . . . . . . . . 2,810,537 2,750,703
U.S. Treasury Notes1.625%, 11/15/22 . . . . . . . . . . . . . . . . . . . . . . . . . . . 7,650,000 7,263,0181.875%, 11/30/21 . . . . . . . . . . . . . . . . . . . . . . . . . . . 5,110,000 4,954,504
39,408,812
Total U.S. Treasury & Government Agencies(Cost $288,464,852) . . . . . . . . . . . . . . . . . . . . . . . . . . 282,805,277
Corporate Bonds & Notes—11.4%
Aerospace/Defense—0.2%Lockheed Martin Corp.
4.090%, 09/15/52 . . . . . . . . . . . . . . . . . . . . . . . . . . . 920,000 874,131
Security DescriptionPrincipalAmount* Value
Aerospace/Defense—(Continued)United Technologies Corp.
2.800%, 05/04/24 . . . . . . . . . . . . . . . . . . . . . . . . . . . 25,000 $ 23,6993.650%, 08/16/23 (b) . . . . . . . . . . . . . . . . . . . . . . . . 1,195,000 1,189,0583.950%, 08/16/25 . . . . . . . . . . . . . . . . . . . . . . . . . . . 345,000 342,8104.625%, 11/16/48 . . . . . . . . . . . . . . . . . . . . . . . . . . . 90,000 90,006
2,519,704
Agriculture—0.4%Altria Group, Inc.
2.850%, 08/09/22 . . . . . . . . . . . . . . . . . . . . . . . . . . . 1,150,000 1,123,6533.875%, 09/16/46 . . . . . . . . . . . . . . . . . . . . . . . . . . . 530,000 464,977
BAT Capital Corp.2.297%, 08/14/20 (144A) . . . . . . . . . . . . . . . . . . . . . . 2,810,000 2,753,6243.222%, 08/15/24 (144A) . . . . . . . . . . . . . . . . . . . . . . 380,000 362,0934.390%, 08/15/37 (144A) . . . . . . . . . . . . . . . . . . . . . . 665,000 617,954
Imperial Brands Finance plc3.750%, 07/21/22 (144A) . . . . . . . . . . . . . . . . . . . . . . 310,000 308,554
5,630,855
Airlines—0.0%Delta Air Lines, Inc.
3.625%, 03/15/22 . . . . . . . . . . . . . . . . . . . . . . . . . . . 185,000 182,6843.800%, 04/19/23 . . . . . . . . . . . . . . . . . . . . . . . . . . . 280,000 274,252
456,936
Auto Manufacturers—0.3%Daimler Canada Finance, Inc.
1.420%, 10/02/18 (CAD) (h) . . . . . . . . . . . . . . . . . . . . 205,000 158,6802.689%, 3M CDOR + 0.830%, 07/08/19 (CAD) (e) (h) . . . 335,000 258,801
Ford Credit Canada Co.2.939%, 02/19/19 (CAD) . . . . . . . . . . . . . . . . . . . . . . . 270,000 209,298
Ford Motor Co.5.291%, 12/08/46 (b) . . . . . . . . . . . . . . . . . . . . . . . . 140,000 124,519
Ford Motor Credit Co. LLC3.815%, 11/02/27 (b) . . . . . . . . . . . . . . . . . . . . . . . . 200,000 178,815
General Motors Co.5.400%, 04/01/48 (b) . . . . . . . . . . . . . . . . . . . . . . . . 460,000 428,7465.950%, 04/01/49 . . . . . . . . . . . . . . . . . . . . . . . . . . . 315,000 312,4226.250%, 10/02/43 . . . . . . . . . . . . . . . . . . . . . . . . . . . 195,000 199,7116.750%, 04/01/46 . . . . . . . . . . . . . . . . . . . . . . . . . . . 250,000 270,254
General Motors Financial Co., Inc.3.613%, 3M LIBOR + 1.270%, 10/04/19 (e) . . . . . . . . . . 100,000 100,7623.700%, 05/09/23 . . . . . . . . . . . . . . . . . . . . . . . . . . . 300,000 293,3823.899%, 3M LIBOR + 1.560%, 01/15/20 (b) (e) . . . . . . . 200,000 202,6033.950%, 04/13/24 . . . . . . . . . . . . . . . . . . . . . . . . . . . 165,000 160,654
Toyota Credit Canada, Inc.2.800%, 11/21/18 (CAD) . . . . . . . . . . . . . . . . . . . . . . . 270,000 209,355
Toyota Motor Credit Corp.2.459%, 3M LIBOR + 0.140%, 11/14/19 (e) . . . . . . . . . . 100,000 100,064
3,208,066
Auto Parts & Equipment—0.0%Goodyear Tire & Rubber Co. (The)
5.000%, 05/31/26 . . . . . . . . . . . . . . . . . . . . . . . . . . . 60,000 56,415
BHFTII-107
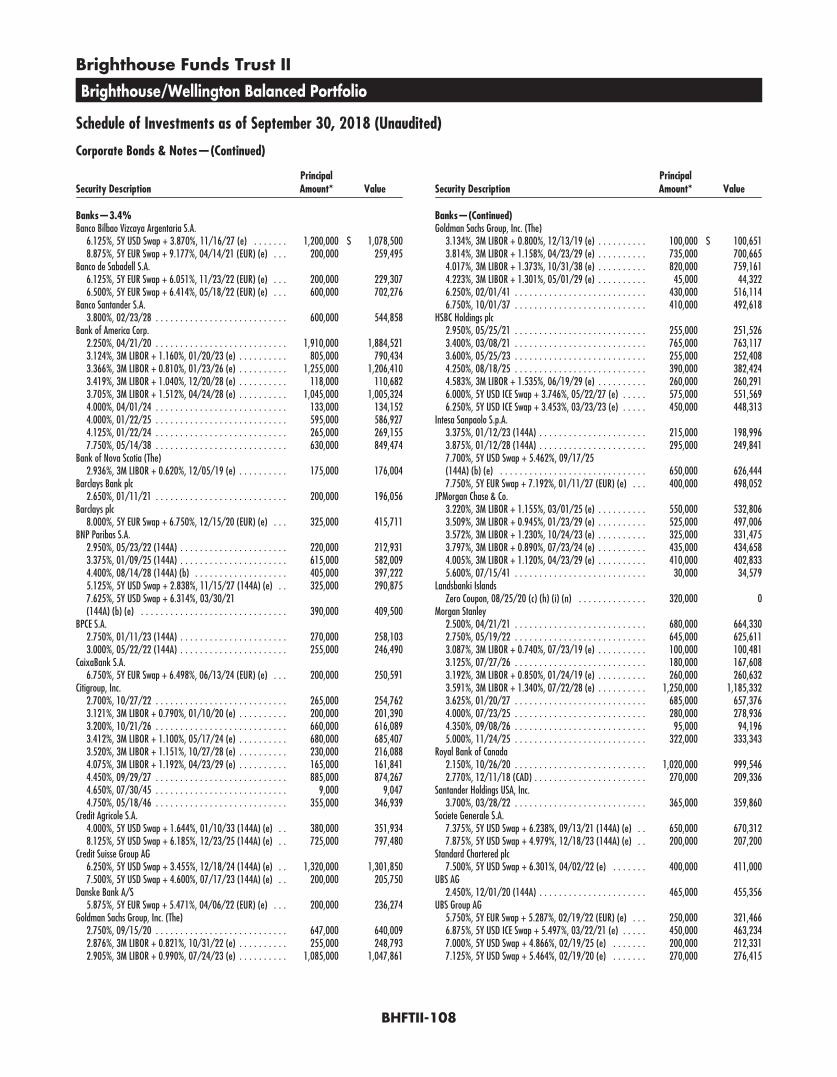
Brighthouse Funds Trust II
Brighthouse/Wellington Balanced Portfolio
Schedule of Investments as of September 30, 2018 (Unaudited)
Corporate Bonds & Notes—(Continued)
Security DescriptionPrincipalAmount* Value
Banks—3.4%Banco Bilbao Vizcaya Argentaria S.A.
6.125%, 5Y USD Swap + 3.870%, 11/16/27 (e) . . . . . . . 1,200,000 $ 1,078,5008.875%, 5Y EUR Swap + 9.177%, 04/14/21 (EUR) (e) . . . 200,000 259,495
Banco de Sabadell S.A.6.125%, 5Y EUR Swap + 6.051%, 11/23/22 (EUR) (e) . . . 200,000 229,3076.500%, 5Y EUR Swap + 6.414%, 05/18/22 (EUR) (e) . . . 600,000 702,276
Banco Santander S.A.3.800%, 02/23/28 . . . . . . . . . . . . . . . . . . . . . . . . . . . 600,000 544,858
Bank of America Corp.2.250%, 04/21/20 . . . . . . . . . . . . . . . . . . . . . . . . . . . 1,910,000 1,884,5213.124%, 3M LIBOR + 1.160%, 01/20/23 (e) . . . . . . . . . . 805,000 790,4343.366%, 3M LIBOR + 0.810%, 01/23/26 (e) . . . . . . . . . . 1,255,000 1,206,4103.419%, 3M LIBOR + 1.040%, 12/20/28 (e) . . . . . . . . . . 118,000 110,6823.705%, 3M LIBOR + 1.512%, 04/24/28 (e) . . . . . . . . . . 1,045,000 1,005,3244.000%, 04/01/24 . . . . . . . . . . . . . . . . . . . . . . . . . . . 133,000 134,1524.000%, 01/22/25 . . . . . . . . . . . . . . . . . . . . . . . . . . . 595,000 586,9274.125%, 01/22/24 . . . . . . . . . . . . . . . . . . . . . . . . . . . 265,000 269,1557.750%, 05/14/38 . . . . . . . . . . . . . . . . . . . . . . . . . . . 630,000 849,474
Bank of Nova Scotia (The)2.936%, 3M LIBOR + 0.620%, 12/05/19 (e) . . . . . . . . . . 175,000 176,004
Barclays Bank plc2.650%, 01/11/21 . . . . . . . . . . . . . . . . . . . . . . . . . . . 200,000 196,056
Barclays plc8.000%, 5Y EUR Swap + 6.750%, 12/15/20 (EUR) (e) . . . 325,000 415,711
BNP Paribas S.A.2.950%, 05/23/22 (144A) . . . . . . . . . . . . . . . . . . . . . . 220,000 212,9313.375%, 01/09/25 (144A) . . . . . . . . . . . . . . . . . . . . . . 615,000 582,0094.400%, 08/14/28 (144A) (b) . . . . . . . . . . . . . . . . . . . 405,000 397,2225.125%, 5Y USD Swap + 2.838%, 11/15/27 (144A) (e) . . 325,000 290,8757.625%, 5Y USD Swap + 6.314%, 03/30/21(144A) (b) (e) . . . . . . . . . . . . . . . . . . . . . . . . . . . . . . 390,000 409,500
BPCE S.A.2.750%, 01/11/23 (144A) . . . . . . . . . . . . . . . . . . . . . . 270,000 258,1033.000%, 05/22/22 (144A) . . . . . . . . . . . . . . . . . . . . . . 255,000 246,490
CaixaBank S.A.6.750%, 5Y EUR Swap + 6.498%, 06/13/24 (EUR) (e) . . . 200,000 250,591
Citigroup, Inc.2.700%, 10/27/22 . . . . . . . . . . . . . . . . . . . . . . . . . . . 265,000 254,7623.121%, 3M LIBOR + 0.790%, 01/10/20 (e) . . . . . . . . . . 200,000 201,3903.200%, 10/21/26 . . . . . . . . . . . . . . . . . . . . . . . . . . . 660,000 616,0893.412%, 3M LIBOR + 1.100%, 05/17/24 (e) . . . . . . . . . . 680,000 685,4073.520%, 3M LIBOR + 1.151%, 10/27/28 (e) . . . . . . . . . . 230,000 216,0884.075%, 3M LIBOR + 1.192%, 04/23/29 (e) . . . . . . . . . . 165,000 161,8414.450%, 09/29/27 . . . . . . . . . . . . . . . . . . . . . . . . . . . 885,000 874,2674.650%, 07/30/45 . . . . . . . . . . . . . . . . . . . . . . . . . . . 9,000 9,0474.750%, 05/18/46 . . . . . . . . . . . . . . . . . . . . . . . . . . . 355,000 346,939
Credit Agricole S.A.4.000%, 5Y USD Swap + 1.644%, 01/10/33 (144A) (e) . . 380,000 351,9348.125%, 5Y USD Swap + 6.185%, 12/23/25 (144A) (e) . . 725,000 797,480
Credit Suisse Group AG6.250%, 5Y USD Swap + 3.455%, 12/18/24 (144A) (e) . . 1,320,000 1,301,8507.500%, 5Y USD Swap + 4.600%, 07/17/23 (144A) (e) . . 200,000 205,750
Danske Bank A/S5.875%, 5Y EUR Swap + 5.471%, 04/06/22 (EUR) (e) . . . 200,000 236,274
Goldman Sachs Group, Inc. (The)2.750%, 09/15/20 . . . . . . . . . . . . . . . . . . . . . . . . . . . 647,000 640,0092.876%, 3M LIBOR + 0.821%, 10/31/22 (e) . . . . . . . . . . 255,000 248,7932.905%, 3M LIBOR + 0.990%, 07/24/23 (e) . . . . . . . . . . 1,085,000 1,047,861
Security DescriptionPrincipalAmount* Value
Banks—(Continued)Goldman Sachs Group, Inc. (The)
3.134%, 3M LIBOR + 0.800%, 12/13/19 (e) . . . . . . . . . . 100,000 $ 100,6513.814%, 3M LIBOR + 1.158%, 04/23/29 (e) . . . . . . . . . . 735,000 700,6654.017%, 3M LIBOR + 1.373%, 10/31/38 (e) . . . . . . . . . . 820,000 759,1614.223%, 3M LIBOR + 1.301%, 05/01/29 (e) . . . . . . . . . . 45,000 44,3226.250%, 02/01/41 . . . . . . . . . . . . . . . . . . . . . . . . . . . 430,000 516,1146.750%, 10/01/37 . . . . . . . . . . . . . . . . . . . . . . . . . . . 410,000 492,618
HSBC Holdings plc2.950%, 05/25/21 . . . . . . . . . . . . . . . . . . . . . . . . . . . 255,000 251,5263.400%, 03/08/21 . . . . . . . . . . . . . . . . . . . . . . . . . . . 765,000 763,1173.600%, 05/25/23 . . . . . . . . . . . . . . . . . . . . . . . . . . . 255,000 252,4084.250%, 08/18/25 . . . . . . . . . . . . . . . . . . . . . . . . . . . 390,000 382,4244.583%, 3M LIBOR + 1.535%, 06/19/29 (e) . . . . . . . . . . 260,000 260,2916.000%, 5Y USD ICE Swap + 3.746%, 05/22/27 (e) . . . . . 575,000 551,5696.250%, 5Y USD ICE Swap + 3.453%, 03/23/23 (e) . . . . . 450,000 448,313
Intesa Sanpaolo S.p.A.3.375%, 01/12/23 (144A) . . . . . . . . . . . . . . . . . . . . . . 215,000 198,9963.875%, 01/12/28 (144A) . . . . . . . . . . . . . . . . . . . . . . 295,000 249,8417.700%, 5Y USD Swap + 5.462%, 09/17/25(144A) (b) (e) . . . . . . . . . . . . . . . . . . . . . . . . . . . . . . 650,000 626,4447.750%, 5Y EUR Swap + 7.192%, 01/11/27 (EUR) (e) . . . 400,000 498,052
JPMorgan Chase & Co.3.220%, 3M LIBOR + 1.155%, 03/01/25 (e) . . . . . . . . . . 550,000 532,8063.509%, 3M LIBOR + 0.945%, 01/23/29 (e) . . . . . . . . . . 525,000 497,0063.572%, 3M LIBOR + 1.230%, 10/24/23 (e) . . . . . . . . . . 325,000 331,4753.797%, 3M LIBOR + 0.890%, 07/23/24 (e) . . . . . . . . . . 435,000 434,6584.005%, 3M LIBOR + 1.120%, 04/23/29 (e) . . . . . . . . . . 410,000 402,8335.600%, 07/15/41 . . . . . . . . . . . . . . . . . . . . . . . . . . . 30,000 34,579
Landsbanki IslandsZero Coupon, 08/25/20 (c) (h) (i) (n) . . . . . . . . . . . . . . 320,000 0
Morgan Stanley2.500%, 04/21/21 . . . . . . . . . . . . . . . . . . . . . . . . . . . 680,000 664,3302.750%, 05/19/22 . . . . . . . . . . . . . . . . . . . . . . . . . . . 645,000 625,6113.087%, 3M LIBOR + 0.740%, 07/23/19 (e) . . . . . . . . . . 100,000 100,4813.125%, 07/27/26 . . . . . . . . . . . . . . . . . . . . . . . . . . . 180,000 167,6083.192%, 3M LIBOR + 0.850%, 01/24/19 (e) . . . . . . . . . . 260,000 260,6323.591%, 3M LIBOR + 1.340%, 07/22/28 (e) . . . . . . . . . . 1,250,000 1,185,3323.625%, 01/20/27 . . . . . . . . . . . . . . . . . . . . . . . . . . . 685,000 657,3764.000%, 07/23/25 . . . . . . . . . . . . . . . . . . . . . . . . . . . 280,000 278,9364.350%, 09/08/26 . . . . . . . . . . . . . . . . . . . . . . . . . . . 95,000 94,1965.000%, 11/24/25 . . . . . . . . . . . . . . . . . . . . . . . . . . . 322,000 333,343
Royal Bank of Canada2.150%, 10/26/20 . . . . . . . . . . . . . . . . . . . . . . . . . . . 1,020,000 999,5462.770%, 12/11/18 (CAD) . . . . . . . . . . . . . . . . . . . . . . . 270,000 209,336
Santander Holdings USA, Inc.3.700%, 03/28/22 . . . . . . . . . . . . . . . . . . . . . . . . . . . 365,000 359,860
Societe Generale S.A.7.375%, 5Y USD Swap + 6.238%, 09/13/21 (144A) (e) . . 650,000 670,3127.875%, 5Y USD Swap + 4.979%, 12/18/23 (144A) (e) . . 200,000 207,200
Standard Chartered plc7.500%, 5Y USD Swap + 6.301%, 04/02/22 (e) . . . . . . . 400,000 411,000
UBS AG2.450%, 12/01/20 (144A) . . . . . . . . . . . . . . . . . . . . . . 465,000 455,356
UBS Group AG5.750%, 5Y EUR Swap + 5.287%, 02/19/22 (EUR) (e) . . . 250,000 321,4666.875%, 5Y USD ICE Swap + 5.497%, 03/22/21 (e) . . . . . 450,000 463,2347.000%, 5Y USD Swap + 4.866%, 02/19/25 (e) . . . . . . . 200,000 212,3317.125%, 5Y USD Swap + 5.464%, 02/19/20 (e) . . . . . . . 270,000 276,415
BHFTII-108
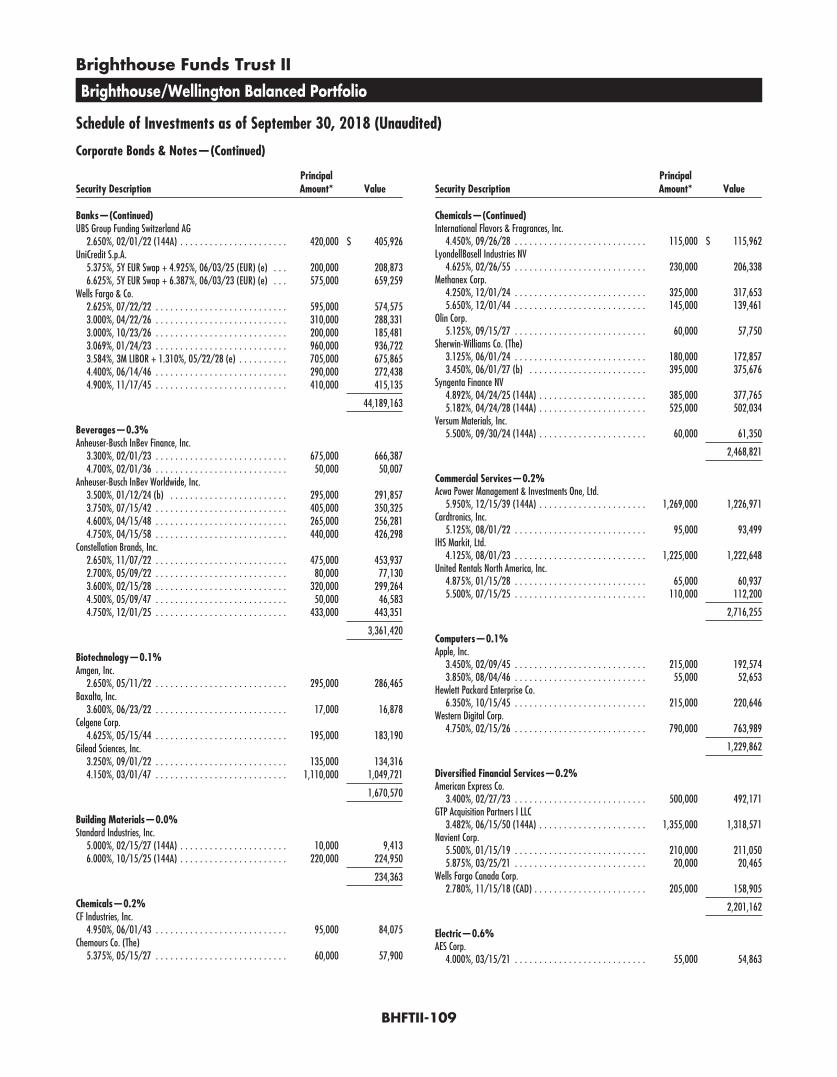
Brighthouse Funds Trust II
Brighthouse/Wellington Balanced Portfolio
Schedule of Investments as of September 30, 2018 (Unaudited)
Corporate Bonds & Notes—(Continued)
Security DescriptionPrincipalAmount* Value
Banks—(Continued)UBS Group Funding Switzerland AG
2.650%, 02/01/22 (144A) . . . . . . . . . . . . . . . . . . . . . . 420,000 $ 405,926UniCredit S.p.A.
5.375%, 5Y EUR Swap + 4.925%, 06/03/25 (EUR) (e) . . . 200,000 208,8736.625%, 5Y EUR Swap + 6.387%, 06/03/23 (EUR) (e) . . . 575,000 659,259
Wells Fargo & Co.2.625%, 07/22/22 . . . . . . . . . . . . . . . . . . . . . . . . . . . 595,000 574,5753.000%, 04/22/26 . . . . . . . . . . . . . . . . . . . . . . . . . . . 310,000 288,3313.000%, 10/23/26 . . . . . . . . . . . . . . . . . . . . . . . . . . . 200,000 185,4813.069%, 01/24/23 . . . . . . . . . . . . . . . . . . . . . . . . . . . 960,000 936,7223.584%, 3M LIBOR + 1.310%, 05/22/28 (e) . . . . . . . . . . 705,000 675,8654.400%, 06/14/46 . . . . . . . . . . . . . . . . . . . . . . . . . . . 290,000 272,4384.900%, 11/17/45 . . . . . . . . . . . . . . . . . . . . . . . . . . . 410,000 415,135
44,189,163
Beverages—0.3%Anheuser-Busch InBev Finance, Inc.
3.300%, 02/01/23 . . . . . . . . . . . . . . . . . . . . . . . . . . . 675,000 666,3874.700%, 02/01/36 . . . . . . . . . . . . . . . . . . . . . . . . . . . 50,000 50,007
Anheuser-Busch InBev Worldwide, Inc.3.500%, 01/12/24 (b) . . . . . . . . . . . . . . . . . . . . . . . . 295,000 291,8573.750%, 07/15/42 . . . . . . . . . . . . . . . . . . . . . . . . . . . 405,000 350,3254.600%, 04/15/48 . . . . . . . . . . . . . . . . . . . . . . . . . . . 265,000 256,2814.750%, 04/15/58 . . . . . . . . . . . . . . . . . . . . . . . . . . . 440,000 426,298
Constellation Brands, Inc.2.650%, 11/07/22 . . . . . . . . . . . . . . . . . . . . . . . . . . . 475,000 453,9372.700%, 05/09/22 . . . . . . . . . . . . . . . . . . . . . . . . . . . 80,000 77,1303.600%, 02/15/28 . . . . . . . . . . . . . . . . . . . . . . . . . . . 320,000 299,2644.500%, 05/09/47 . . . . . . . . . . . . . . . . . . . . . . . . . . . 50,000 46,5834.750%, 12/01/25 . . . . . . . . . . . . . . . . . . . . . . . . . . . 433,000 443,351
3,361,420
Biotechnology—0.1%Amgen, Inc.
2.650%, 05/11/22 . . . . . . . . . . . . . . . . . . . . . . . . . . . 295,000 286,465Baxalta, Inc.
3.600%, 06/23/22 . . . . . . . . . . . . . . . . . . . . . . . . . . . 17,000 16,878Celgene Corp.
4.625%, 05/15/44 . . . . . . . . . . . . . . . . . . . . . . . . . . . 195,000 183,190Gilead Sciences, Inc.
3.250%, 09/01/22 . . . . . . . . . . . . . . . . . . . . . . . . . . . 135,000 134,3164.150%, 03/01/47 . . . . . . . . . . . . . . . . . . . . . . . . . . . 1,110,000 1,049,721
1,670,570
Building Materials—0.0%Standard Industries, Inc.
5.000%, 02/15/27 (144A) . . . . . . . . . . . . . . . . . . . . . . 10,000 9,4136.000%, 10/15/25 (144A) . . . . . . . . . . . . . . . . . . . . . . 220,000 224,950
234,363
Chemicals—0.2%CF Industries, Inc.
4.950%, 06/01/43 . . . . . . . . . . . . . . . . . . . . . . . . . . . 95,000 84,075Chemours Co. (The)
5.375%, 05/15/27 . . . . . . . . . . . . . . . . . . . . . . . . . . . 60,000 57,900
Security DescriptionPrincipalAmount* Value
Chemicals—(Continued)International Flavors & Fragrances, Inc.
4.450%, 09/26/28 . . . . . . . . . . . . . . . . . . . . . . . . . . . 115,000 $ 115,962LyondellBasell Industries NV
4.625%, 02/26/55 . . . . . . . . . . . . . . . . . . . . . . . . . . . 230,000 206,338Methanex Corp.
4.250%, 12/01/24 . . . . . . . . . . . . . . . . . . . . . . . . . . . 325,000 317,6535.650%, 12/01/44 . . . . . . . . . . . . . . . . . . . . . . . . . . . 145,000 139,461
Olin Corp.5.125%, 09/15/27 . . . . . . . . . . . . . . . . . . . . . . . . . . . 60,000 57,750
Sherwin-Williams Co. (The)3.125%, 06/01/24 . . . . . . . . . . . . . . . . . . . . . . . . . . . 180,000 172,8573.450%, 06/01/27 (b) . . . . . . . . . . . . . . . . . . . . . . . . 395,000 375,676
Syngenta Finance NV4.892%, 04/24/25 (144A) . . . . . . . . . . . . . . . . . . . . . . 385,000 377,7655.182%, 04/24/28 (144A) . . . . . . . . . . . . . . . . . . . . . . 525,000 502,034
Versum Materials, Inc.5.500%, 09/30/24 (144A) . . . . . . . . . . . . . . . . . . . . . . 60,000 61,350
2,468,821
Commercial Services—0.2%Acwa Power Management & Investments One, Ltd.
5.950%, 12/15/39 (144A) . . . . . . . . . . . . . . . . . . . . . . 1,269,000 1,226,971Cardtronics, Inc.
5.125%, 08/01/22 . . . . . . . . . . . . . . . . . . . . . . . . . . . 95,000 93,499IHS Markit, Ltd.
4.125%, 08/01/23 . . . . . . . . . . . . . . . . . . . . . . . . . . . 1,225,000 1,222,648United Rentals North America, Inc.
4.875%, 01/15/28 . . . . . . . . . . . . . . . . . . . . . . . . . . . 65,000 60,9375.500%, 07/15/25 . . . . . . . . . . . . . . . . . . . . . . . . . . . 110,000 112,200
2,716,255
Computers—0.1%Apple, Inc.
3.450%, 02/09/45 . . . . . . . . . . . . . . . . . . . . . . . . . . . 215,000 192,5743.850%, 08/04/46 . . . . . . . . . . . . . . . . . . . . . . . . . . . 55,000 52,653
Hewlett Packard Enterprise Co.6.350%, 10/15/45 . . . . . . . . . . . . . . . . . . . . . . . . . . . 215,000 220,646
Western Digital Corp.4.750%, 02/15/26 . . . . . . . . . . . . . . . . . . . . . . . . . . . 790,000 763,989
1,229,862
Diversified Financial Services—0.2%American Express Co.
3.400%, 02/27/23 . . . . . . . . . . . . . . . . . . . . . . . . . . . 500,000 492,171GTP Acquisition Partners I LLC
3.482%, 06/15/50 (144A) . . . . . . . . . . . . . . . . . . . . . . 1,355,000 1,318,571Navient Corp.
5.500%, 01/15/19 . . . . . . . . . . . . . . . . . . . . . . . . . . . 210,000 211,0505.875%, 03/25/21 . . . . . . . . . . . . . . . . . . . . . . . . . . . 20,000 20,465
Wells Fargo Canada Corp.2.780%, 11/15/18 (CAD) . . . . . . . . . . . . . . . . . . . . . . . 205,000 158,905
2,201,162
Electric—0.6%AES Corp.
4.000%, 03/15/21 . . . . . . . . . . . . . . . . . . . . . . . . . . . 55,000 54,863
BHFTII-109
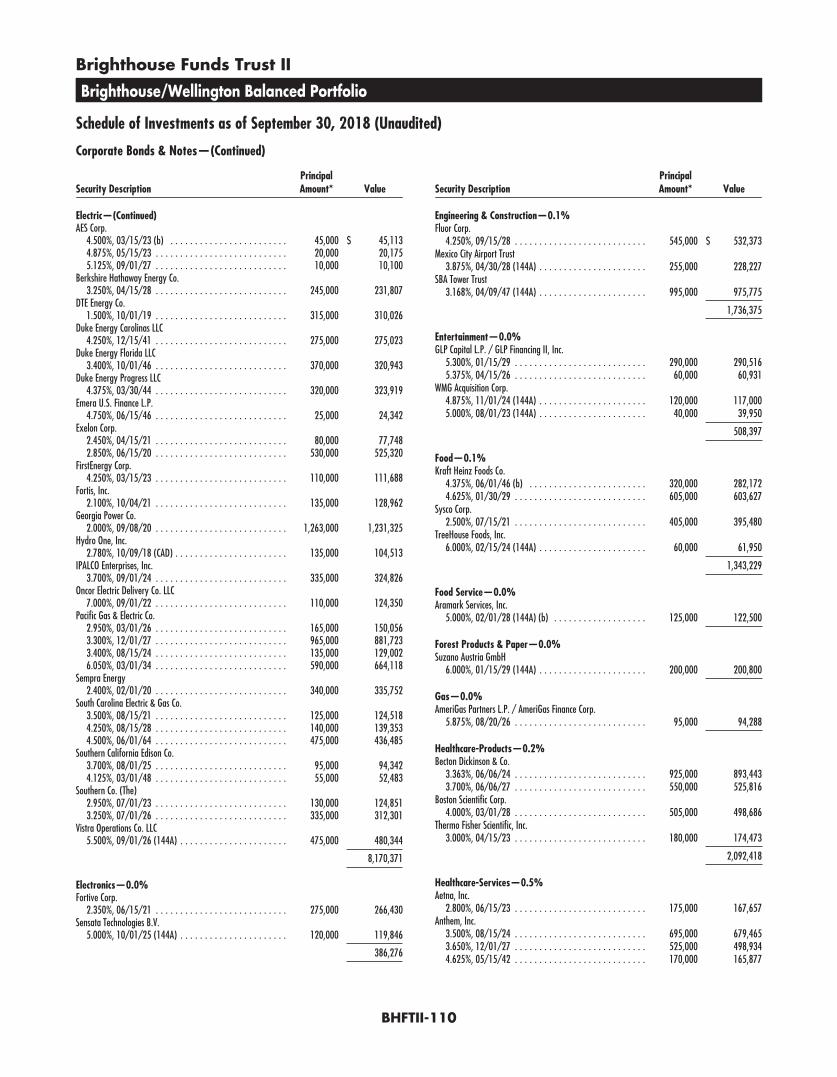
Brighthouse Funds Trust II
Brighthouse/Wellington Balanced Portfolio
Schedule of Investments as of September 30, 2018 (Unaudited)
Corporate Bonds & Notes—(Continued)
Security DescriptionPrincipalAmount* Value
Electric—(Continued)AES Corp.
4.500%, 03/15/23 (b) . . . . . . . . . . . . . . . . . . . . . . . . 45,000 $ 45,1134.875%, 05/15/23 . . . . . . . . . . . . . . . . . . . . . . . . . . . 20,000 20,1755.125%, 09/01/27 . . . . . . . . . . . . . . . . . . . . . . . . . . . 10,000 10,100
Berkshire Hathaway Energy Co.3.250%, 04/15/28 . . . . . . . . . . . . . . . . . . . . . . . . . . . 245,000 231,807
DTE Energy Co.1.500%, 10/01/19 . . . . . . . . . . . . . . . . . . . . . . . . . . . 315,000 310,026
Duke Energy Carolinas LLC4.250%, 12/15/41 . . . . . . . . . . . . . . . . . . . . . . . . . . . 275,000 275,023
Duke Energy Florida LLC3.400%, 10/01/46 . . . . . . . . . . . . . . . . . . . . . . . . . . . 370,000 320,943
Duke Energy Progress LLC4.375%, 03/30/44 . . . . . . . . . . . . . . . . . . . . . . . . . . . 320,000 323,919
Emera U.S. Finance L.P.4.750%, 06/15/46 . . . . . . . . . . . . . . . . . . . . . . . . . . . 25,000 24,342
Exelon Corp.2.450%, 04/15/21 . . . . . . . . . . . . . . . . . . . . . . . . . . . 80,000 77,7482.850%, 06/15/20 . . . . . . . . . . . . . . . . . . . . . . . . . . . 530,000 525,320
FirstEnergy Corp.4.250%, 03/15/23 . . . . . . . . . . . . . . . . . . . . . . . . . . . 110,000 111,688
Fortis, Inc.2.100%, 10/04/21 . . . . . . . . . . . . . . . . . . . . . . . . . . . 135,000 128,962
Georgia Power Co.2.000%, 09/08/20 . . . . . . . . . . . . . . . . . . . . . . . . . . . 1,263,000 1,231,325
Hydro One, Inc.2.780%, 10/09/18 (CAD) . . . . . . . . . . . . . . . . . . . . . . . 135,000 104,513
IPALCO Enterprises, Inc.3.700%, 09/01/24 . . . . . . . . . . . . . . . . . . . . . . . . . . . 335,000 324,826
Oncor Electric Delivery Co. LLC7.000%, 09/01/22 . . . . . . . . . . . . . . . . . . . . . . . . . . . 110,000 124,350
Pacific Gas & Electric Co.2.950%, 03/01/26 . . . . . . . . . . . . . . . . . . . . . . . . . . . 165,000 150,0563.300%, 12/01/27 . . . . . . . . . . . . . . . . . . . . . . . . . . . 965,000 881,7233.400%, 08/15/24 . . . . . . . . . . . . . . . . . . . . . . . . . . . 135,000 129,0026.050%, 03/01/34 . . . . . . . . . . . . . . . . . . . . . . . . . . . 590,000 664,118
Sempra Energy2.400%, 02/01/20 . . . . . . . . . . . . . . . . . . . . . . . . . . . 340,000 335,752
South Carolina Electric & Gas Co.3.500%, 08/15/21 . . . . . . . . . . . . . . . . . . . . . . . . . . . 125,000 124,5184.250%, 08/15/28 . . . . . . . . . . . . . . . . . . . . . . . . . . . 140,000 139,3534.500%, 06/01/64 . . . . . . . . . . . . . . . . . . . . . . . . . . . 475,000 436,485
Southern California Edison Co.3.700%, 08/01/25 . . . . . . . . . . . . . . . . . . . . . . . . . . . 95,000 94,3424.125%, 03/01/48 . . . . . . . . . . . . . . . . . . . . . . . . . . . 55,000 52,483
Southern Co. (The)2.950%, 07/01/23 . . . . . . . . . . . . . . . . . . . . . . . . . . . 130,000 124,8513.250%, 07/01/26 . . . . . . . . . . . . . . . . . . . . . . . . . . . 335,000 312,301
Vistra Operations Co. LLC5.500%, 09/01/26 (144A) . . . . . . . . . . . . . . . . . . . . . . 475,000 480,344
8,170,371
Electronics—0.0%Fortive Corp.
2.350%, 06/15/21 . . . . . . . . . . . . . . . . . . . . . . . . . . . 275,000 266,430Sensata Technologies B.V.
5.000%, 10/01/25 (144A) . . . . . . . . . . . . . . . . . . . . . . 120,000 119,846
386,276
Security DescriptionPrincipalAmount* Value
Engineering & Construction—0.1%Fluor Corp.
4.250%, 09/15/28 . . . . . . . . . . . . . . . . . . . . . . . . . . . 545,000 $ 532,373Mexico City Airport Trust
3.875%, 04/30/28 (144A) . . . . . . . . . . . . . . . . . . . . . . 255,000 228,227SBA Tower Trust
3.168%, 04/09/47 (144A) . . . . . . . . . . . . . . . . . . . . . . 995,000 975,775
1,736,375
Entertainment—0.0%GLP Capital L.P. / GLP Financing II, Inc.
5.300%, 01/15/29 . . . . . . . . . . . . . . . . . . . . . . . . . . . 290,000 290,5165.375%, 04/15/26 . . . . . . . . . . . . . . . . . . . . . . . . . . . 60,000 60,931
WMG Acquisition Corp.4.875%, 11/01/24 (144A) . . . . . . . . . . . . . . . . . . . . . . 120,000 117,0005.000%, 08/01/23 (144A) . . . . . . . . . . . . . . . . . . . . . . 40,000 39,950
508,397
Food—0.1%Kraft Heinz Foods Co.
4.375%, 06/01/46 (b) . . . . . . . . . . . . . . . . . . . . . . . . 320,000 282,1724.625%, 01/30/29 . . . . . . . . . . . . . . . . . . . . . . . . . . . 605,000 603,627
Sysco Corp.2.500%, 07/15/21 . . . . . . . . . . . . . . . . . . . . . . . . . . . 405,000 395,480
TreeHouse Foods, Inc.6.000%, 02/15/24 (144A) . . . . . . . . . . . . . . . . . . . . . . 60,000 61,950
1,343,229
Food Service—0.0%Aramark Services, Inc.
5.000%, 02/01/28 (144A) (b) . . . . . . . . . . . . . . . . . . . 125,000 122,500
Forest Products & Paper—0.0%Suzano Austria GmbH
6.000%, 01/15/29 (144A) . . . . . . . . . . . . . . . . . . . . . . 200,000 200,800
Gas—0.0%AmeriGas Partners L.P. / AmeriGas Finance Corp.
5.875%, 08/20/26 . . . . . . . . . . . . . . . . . . . . . . . . . . . 95,000 94,288
Healthcare-Products—0.2%Becton Dickinson & Co.
3.363%, 06/06/24 . . . . . . . . . . . . . . . . . . . . . . . . . . . 925,000 893,4433.700%, 06/06/27 . . . . . . . . . . . . . . . . . . . . . . . . . . . 550,000 525,816
Boston Scientific Corp.4.000%, 03/01/28 . . . . . . . . . . . . . . . . . . . . . . . . . . . 505,000 498,686
Thermo Fisher Scientific, Inc.3.000%, 04/15/23 . . . . . . . . . . . . . . . . . . . . . . . . . . . 180,000 174,473
2,092,418
Healthcare-Services—0.5%Aetna, Inc.
2.800%, 06/15/23 . . . . . . . . . . . . . . . . . . . . . . . . . . . 175,000 167,657Anthem, Inc.
3.500%, 08/15/24 . . . . . . . . . . . . . . . . . . . . . . . . . . . 695,000 679,4653.650%, 12/01/27 . . . . . . . . . . . . . . . . . . . . . . . . . . . 525,000 498,9344.625%, 05/15/42 . . . . . . . . . . . . . . . . . . . . . . . . . . . 170,000 165,877
BHFTII-110
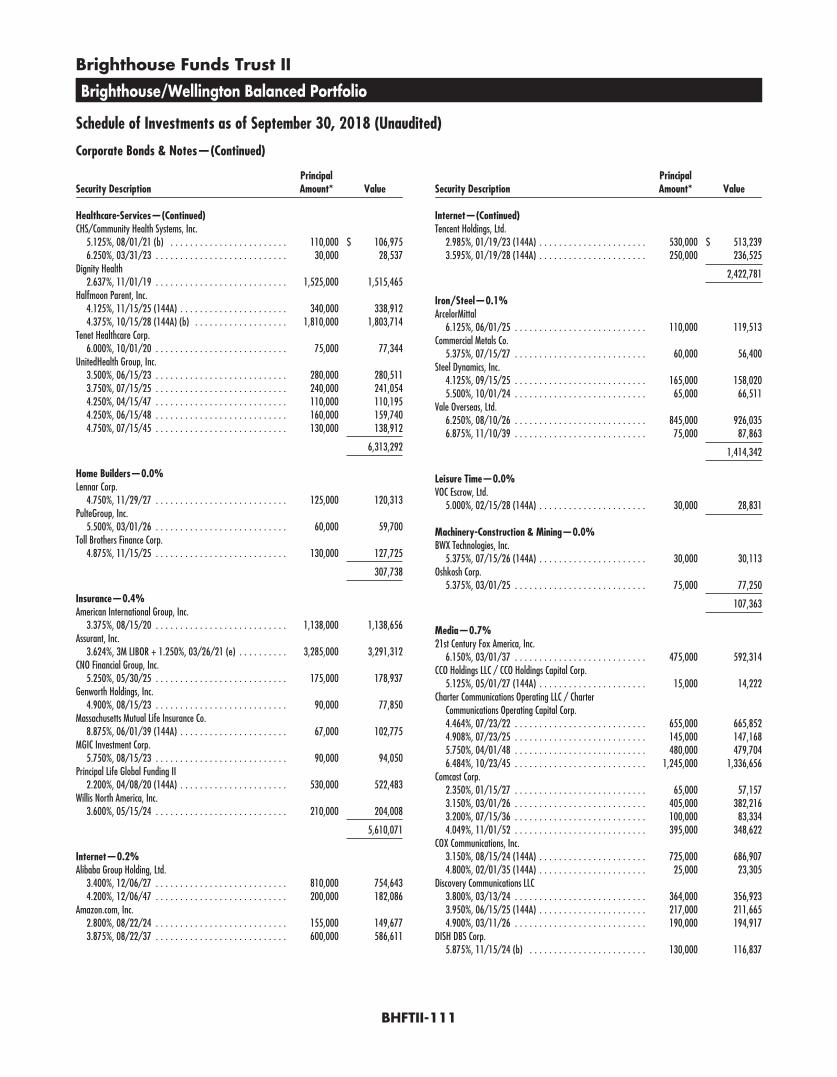
Brighthouse Funds Trust II
Brighthouse/Wellington Balanced Portfolio
Schedule of Investments as of September 30, 2018 (Unaudited)
Corporate Bonds & Notes—(Continued)
Security DescriptionPrincipalAmount* Value
Healthcare-Services—(Continued)CHS/Community Health Systems, Inc.
5.125%, 08/01/21 (b) . . . . . . . . . . . . . . . . . . . . . . . . 110,000 $ 106,9756.250%, 03/31/23 . . . . . . . . . . . . . . . . . . . . . . . . . . . 30,000 28,537
Dignity Health2.637%, 11/01/19 . . . . . . . . . . . . . . . . . . . . . . . . . . . 1,525,000 1,515,465
Halfmoon Parent, Inc.4.125%, 11/15/25 (144A) . . . . . . . . . . . . . . . . . . . . . . 340,000 338,9124.375%, 10/15/28 (144A) (b) . . . . . . . . . . . . . . . . . . . 1,810,000 1,803,714
Tenet Healthcare Corp.6.000%, 10/01/20 . . . . . . . . . . . . . . . . . . . . . . . . . . . 75,000 77,344
UnitedHealth Group, Inc.3.500%, 06/15/23 . . . . . . . . . . . . . . . . . . . . . . . . . . . 280,000 280,5113.750%, 07/15/25 . . . . . . . . . . . . . . . . . . . . . . . . . . . 240,000 241,0544.250%, 04/15/47 . . . . . . . . . . . . . . . . . . . . . . . . . . . 110,000 110,1954.250%, 06/15/48 . . . . . . . . . . . . . . . . . . . . . . . . . . . 160,000 159,7404.750%, 07/15/45 . . . . . . . . . . . . . . . . . . . . . . . . . . . 130,000 138,912
6,313,292
Home Builders—0.0%Lennar Corp.
4.750%, 11/29/27 . . . . . . . . . . . . . . . . . . . . . . . . . . . 125,000 120,313PulteGroup, Inc.
5.500%, 03/01/26 . . . . . . . . . . . . . . . . . . . . . . . . . . . 60,000 59,700Toll Brothers Finance Corp.
4.875%, 11/15/25 . . . . . . . . . . . . . . . . . . . . . . . . . . . 130,000 127,725
307,738
Insurance—0.4%American International Group, Inc.
3.375%, 08/15/20 . . . . . . . . . . . . . . . . . . . . . . . . . . . 1,138,000 1,138,656Assurant, Inc.
3.624%, 3M LIBOR + 1.250%, 03/26/21 (e) . . . . . . . . . . 3,285,000 3,291,312CNO Financial Group, Inc.
5.250%, 05/30/25 . . . . . . . . . . . . . . . . . . . . . . . . . . . 175,000 178,937Genworth Holdings, Inc.
4.900%, 08/15/23 . . . . . . . . . . . . . . . . . . . . . . . . . . . 90,000 77,850Massachusetts Mutual Life Insurance Co.
8.875%, 06/01/39 (144A) . . . . . . . . . . . . . . . . . . . . . . 67,000 102,775MGIC Investment Corp.
5.750%, 08/15/23 . . . . . . . . . . . . . . . . . . . . . . . . . . . 90,000 94,050Principal Life Global Funding II
2.200%, 04/08/20 (144A) . . . . . . . . . . . . . . . . . . . . . . 530,000 522,483Willis North America, Inc.
3.600%, 05/15/24 . . . . . . . . . . . . . . . . . . . . . . . . . . . 210,000 204,008
5,610,071
Internet—0.2%Alibaba Group Holding, Ltd.
3.400%, 12/06/27 . . . . . . . . . . . . . . . . . . . . . . . . . . . 810,000 754,6434.200%, 12/06/47 . . . . . . . . . . . . . . . . . . . . . . . . . . . 200,000 182,086
Amazon.com, Inc.2.800%, 08/22/24 . . . . . . . . . . . . . . . . . . . . . . . . . . . 155,000 149,6773.875%, 08/22/37 . . . . . . . . . . . . . . . . . . . . . . . . . . . 600,000 586,611
Security DescriptionPrincipalAmount* Value
Internet—(Continued)Tencent Holdings, Ltd.
2.985%, 01/19/23 (144A) . . . . . . . . . . . . . . . . . . . . . . 530,000 $ 513,2393.595%, 01/19/28 (144A) . . . . . . . . . . . . . . . . . . . . . . 250,000 236,525
2,422,781
Iron/Steel—0.1%ArcelorMittal
6.125%, 06/01/25 . . . . . . . . . . . . . . . . . . . . . . . . . . . 110,000 119,513Commercial Metals Co.
5.375%, 07/15/27 . . . . . . . . . . . . . . . . . . . . . . . . . . . 60,000 56,400Steel Dynamics, Inc.
4.125%, 09/15/25 . . . . . . . . . . . . . . . . . . . . . . . . . . . 165,000 158,0205.500%, 10/01/24 . . . . . . . . . . . . . . . . . . . . . . . . . . . 65,000 66,511
Vale Overseas, Ltd.6.250%, 08/10/26 . . . . . . . . . . . . . . . . . . . . . . . . . . . 845,000 926,0356.875%, 11/10/39 . . . . . . . . . . . . . . . . . . . . . . . . . . . 75,000 87,863
1,414,342
Leisure Time—0.0%VOC Escrow, Ltd.
5.000%, 02/15/28 (144A) . . . . . . . . . . . . . . . . . . . . . . 30,000 28,831
Machinery-Construction & Mining—0.0%BWX Technologies, Inc.
5.375%, 07/15/26 (144A) . . . . . . . . . . . . . . . . . . . . . . 30,000 30,113Oshkosh Corp.
5.375%, 03/01/25 . . . . . . . . . . . . . . . . . . . . . . . . . . . 75,000 77,250
107,363
Media—0.7%21st Century Fox America, Inc.
6.150%, 03/01/37 . . . . . . . . . . . . . . . . . . . . . . . . . . . 475,000 592,314CCO Holdings LLC / CCO Holdings Capital Corp.
5.125%, 05/01/27 (144A) . . . . . . . . . . . . . . . . . . . . . . 15,000 14,222Charter Communications Operating LLC / Charter
Communications Operating Capital Corp.4.464%, 07/23/22 . . . . . . . . . . . . . . . . . . . . . . . . . . . 655,000 665,8524.908%, 07/23/25 . . . . . . . . . . . . . . . . . . . . . . . . . . . 145,000 147,1685.750%, 04/01/48 . . . . . . . . . . . . . . . . . . . . . . . . . . . 480,000 479,7046.484%, 10/23/45 . . . . . . . . . . . . . . . . . . . . . . . . . . . 1,245,000 1,336,656
Comcast Corp.2.350%, 01/15/27 . . . . . . . . . . . . . . . . . . . . . . . . . . . 65,000 57,1573.150%, 03/01/26 . . . . . . . . . . . . . . . . . . . . . . . . . . . 405,000 382,2163.200%, 07/15/36 . . . . . . . . . . . . . . . . . . . . . . . . . . . 100,000 83,3344.049%, 11/01/52 . . . . . . . . . . . . . . . . . . . . . . . . . . . 395,000 348,622
COX Communications, Inc.3.150%, 08/15/24 (144A) . . . . . . . . . . . . . . . . . . . . . . 725,000 686,9074.800%, 02/01/35 (144A) . . . . . . . . . . . . . . . . . . . . . . 25,000 23,305
Discovery Communications LLC3.800%, 03/13/24 . . . . . . . . . . . . . . . . . . . . . . . . . . . 364,000 356,9233.950%, 06/15/25 (144A) . . . . . . . . . . . . . . . . . . . . . . 217,000 211,6654.900%, 03/11/26 . . . . . . . . . . . . . . . . . . . . . . . . . . . 190,000 194,917
DISH DBS Corp.5.875%, 11/15/24 (b) . . . . . . . . . . . . . . . . . . . . . . . . 130,000 116,837
BHFTII-111
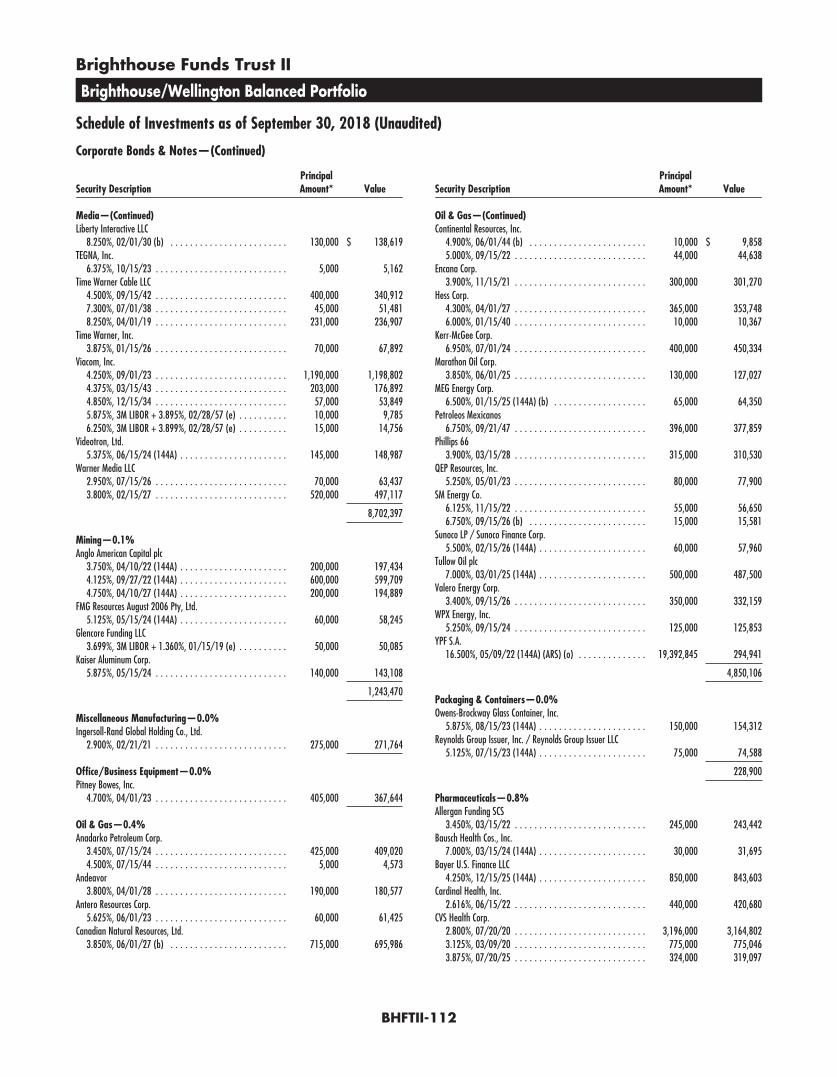
Brighthouse Funds Trust II
Brighthouse/Wellington Balanced Portfolio
Schedule of Investments as of September 30, 2018 (Unaudited)
Corporate Bonds & Notes—(Continued)
Security DescriptionPrincipalAmount* Value
Media—(Continued)Liberty Interactive LLC
8.250%, 02/01/30 (b) . . . . . . . . . . . . . . . . . . . . . . . . 130,000 $ 138,619TEGNA, Inc.
6.375%, 10/15/23 . . . . . . . . . . . . . . . . . . . . . . . . . . . 5,000 5,162Time Warner Cable LLC
4.500%, 09/15/42 . . . . . . . . . . . . . . . . . . . . . . . . . . . 400,000 340,9127.300%, 07/01/38 . . . . . . . . . . . . . . . . . . . . . . . . . . . 45,000 51,4818.250%, 04/01/19 . . . . . . . . . . . . . . . . . . . . . . . . . . . 231,000 236,907
Time Warner, Inc.3.875%, 01/15/26 . . . . . . . . . . . . . . . . . . . . . . . . . . . 70,000 67,892
Viacom, Inc.4.250%, 09/01/23 . . . . . . . . . . . . . . . . . . . . . . . . . . . 1,190,000 1,198,8024.375%, 03/15/43 . . . . . . . . . . . . . . . . . . . . . . . . . . . 203,000 176,8924.850%, 12/15/34 . . . . . . . . . . . . . . . . . . . . . . . . . . . 57,000 53,8495.875%, 3M LIBOR + 3.895%, 02/28/57 (e) . . . . . . . . . . 10,000 9,7856.250%, 3M LIBOR + 3.899%, 02/28/57 (e) . . . . . . . . . . 15,000 14,756
Videotron, Ltd.5.375%, 06/15/24 (144A) . . . . . . . . . . . . . . . . . . . . . . 145,000 148,987
Warner Media LLC2.950%, 07/15/26 . . . . . . . . . . . . . . . . . . . . . . . . . . . 70,000 63,4373.800%, 02/15/27 . . . . . . . . . . . . . . . . . . . . . . . . . . . 520,000 497,117
8,702,397
Mining—0.1%Anglo American Capital plc
3.750%, 04/10/22 (144A) . . . . . . . . . . . . . . . . . . . . . . 200,000 197,4344.125%, 09/27/22 (144A) . . . . . . . . . . . . . . . . . . . . . . 600,000 599,7094.750%, 04/10/27 (144A) . . . . . . . . . . . . . . . . . . . . . . 200,000 194,889
FMG Resources August 2006 Pty, Ltd.5.125%, 05/15/24 (144A) . . . . . . . . . . . . . . . . . . . . . . 60,000 58,245
Glencore Funding LLC3.699%, 3M LIBOR + 1.360%, 01/15/19 (e) . . . . . . . . . . 50,000 50,085
Kaiser Aluminum Corp.5.875%, 05/15/24 . . . . . . . . . . . . . . . . . . . . . . . . . . . 140,000 143,108
1,243,470
Miscellaneous Manufacturing—0.0%Ingersoll-Rand Global Holding Co., Ltd.
2.900%, 02/21/21 . . . . . . . . . . . . . . . . . . . . . . . . . . . 275,000 271,764
Office/Business Equipment—0.0%Pitney Bowes, Inc.
4.700%, 04/01/23 . . . . . . . . . . . . . . . . . . . . . . . . . . . 405,000 367,644
Oil & Gas—0.4%Anadarko Petroleum Corp.
3.450%, 07/15/24 . . . . . . . . . . . . . . . . . . . . . . . . . . . 425,000 409,0204.500%, 07/15/44 . . . . . . . . . . . . . . . . . . . . . . . . . . . 5,000 4,573
Andeavor3.800%, 04/01/28 . . . . . . . . . . . . . . . . . . . . . . . . . . . 190,000 180,577
Antero Resources Corp.5.625%, 06/01/23 . . . . . . . . . . . . . . . . . . . . . . . . . . . 60,000 61,425
Canadian Natural Resources, Ltd.3.850%, 06/01/27 (b) . . . . . . . . . . . . . . . . . . . . . . . . 715,000 695,986
Security DescriptionPrincipalAmount* Value
Oil & Gas—(Continued)Continental Resources, Inc.
4.900%, 06/01/44 (b) . . . . . . . . . . . . . . . . . . . . . . . . 10,000 $ 9,8585.000%, 09/15/22 . . . . . . . . . . . . . . . . . . . . . . . . . . . 44,000 44,638
Encana Corp.3.900%, 11/15/21 . . . . . . . . . . . . . . . . . . . . . . . . . . . 300,000 301,270
Hess Corp.4.300%, 04/01/27 . . . . . . . . . . . . . . . . . . . . . . . . . . . 365,000 353,7486.000%, 01/15/40 . . . . . . . . . . . . . . . . . . . . . . . . . . . 10,000 10,367
Kerr-McGee Corp.6.950%, 07/01/24 . . . . . . . . . . . . . . . . . . . . . . . . . . . 400,000 450,334
Marathon Oil Corp.3.850%, 06/01/25 . . . . . . . . . . . . . . . . . . . . . . . . . . . 130,000 127,027
MEG Energy Corp.6.500%, 01/15/25 (144A) (b) . . . . . . . . . . . . . . . . . . . 65,000 64,350
Petroleos Mexicanos6.750%, 09/21/47 . . . . . . . . . . . . . . . . . . . . . . . . . . . 396,000 377,859
Phillips 663.900%, 03/15/28 . . . . . . . . . . . . . . . . . . . . . . . . . . . 315,000 310,530
QEP Resources, Inc.5.250%, 05/01/23 . . . . . . . . . . . . . . . . . . . . . . . . . . . 80,000 77,900
SM Energy Co.6.125%, 11/15/22 . . . . . . . . . . . . . . . . . . . . . . . . . . . 55,000 56,6506.750%, 09/15/26 (b) . . . . . . . . . . . . . . . . . . . . . . . . 15,000 15,581
Sunoco LP / Sunoco Finance Corp.5.500%, 02/15/26 (144A) . . . . . . . . . . . . . . . . . . . . . . 60,000 57,960
Tullow Oil plc7.000%, 03/01/25 (144A) . . . . . . . . . . . . . . . . . . . . . . 500,000 487,500
Valero Energy Corp.3.400%, 09/15/26 . . . . . . . . . . . . . . . . . . . . . . . . . . . 350,000 332,159
WPX Energy, Inc.5.250%, 09/15/24 . . . . . . . . . . . . . . . . . . . . . . . . . . . 125,000 125,853
YPF S.A.16.500%, 05/09/22 (144A) (ARS) (o) . . . . . . . . . . . . . . 19,392,845 294,941
4,850,106
Packaging & Containers—0.0%Owens-Brockway Glass Container, Inc.
5.875%, 08/15/23 (144A) . . . . . . . . . . . . . . . . . . . . . . 150,000 154,312Reynolds Group Issuer, Inc. / Reynolds Group Issuer LLC
5.125%, 07/15/23 (144A) . . . . . . . . . . . . . . . . . . . . . . 75,000 74,588
228,900
Pharmaceuticals—0.8%Allergan Funding SCS
3.450%, 03/15/22 . . . . . . . . . . . . . . . . . . . . . . . . . . . 245,000 243,442Bausch Health Cos., Inc.
7.000%, 03/15/24 (144A) . . . . . . . . . . . . . . . . . . . . . . 30,000 31,695Bayer U.S. Finance LLC
4.250%, 12/15/25 (144A) . . . . . . . . . . . . . . . . . . . . . . 850,000 843,603Cardinal Health, Inc.
2.616%, 06/15/22 . . . . . . . . . . . . . . . . . . . . . . . . . . . 440,000 420,680CVS Health Corp.
2.800%, 07/20/20 . . . . . . . . . . . . . . . . . . . . . . . . . . . 3,196,000 3,164,8023.125%, 03/09/20 . . . . . . . . . . . . . . . . . . . . . . . . . . . 775,000 775,0463.875%, 07/20/25 . . . . . . . . . . . . . . . . . . . . . . . . . . . 324,000 319,097
BHFTII-112
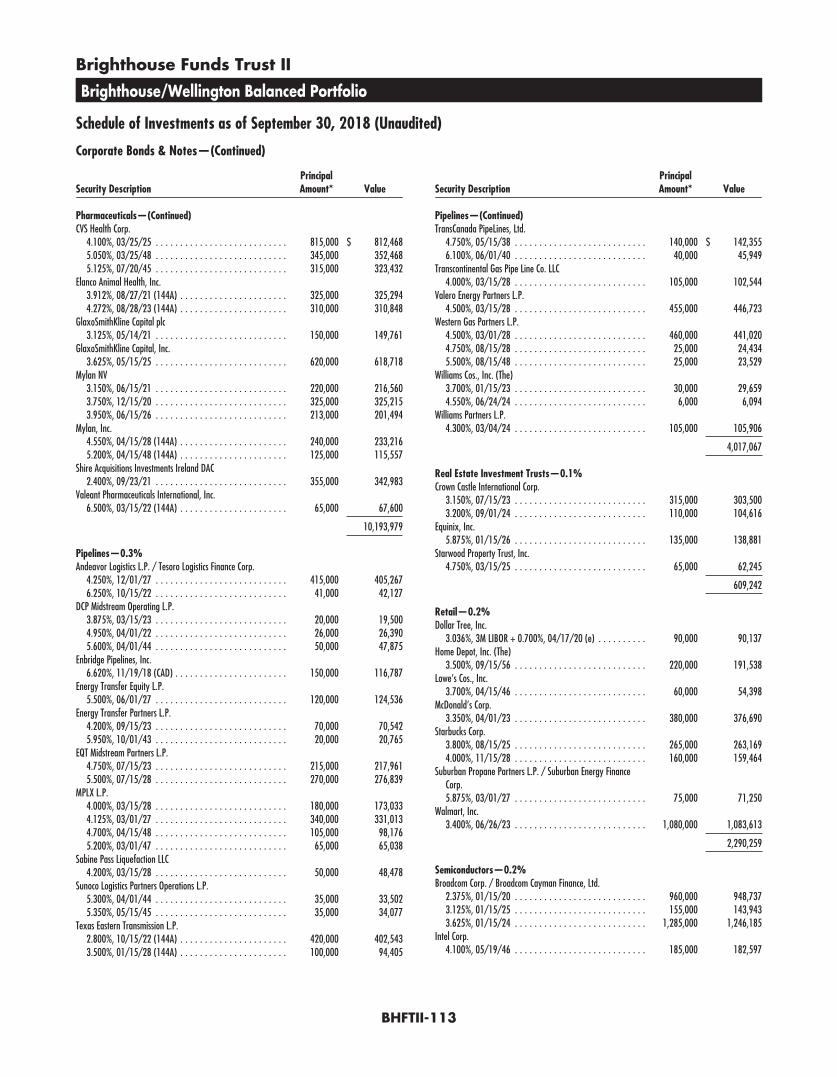
Brighthouse Funds Trust II
Brighthouse/Wellington Balanced Portfolio
Schedule of Investments as of September 30, 2018 (Unaudited)
Corporate Bonds & Notes—(Continued)
Security DescriptionPrincipalAmount* Value
Pharmaceuticals—(Continued)CVS Health Corp.
4.100%, 03/25/25 . . . . . . . . . . . . . . . . . . . . . . . . . . . 815,000 $ 812,4685.050%, 03/25/48 . . . . . . . . . . . . . . . . . . . . . . . . . . . 345,000 352,4685.125%, 07/20/45 . . . . . . . . . . . . . . . . . . . . . . . . . . . 315,000 323,432
Elanco Animal Health, Inc.3.912%, 08/27/21 (144A) . . . . . . . . . . . . . . . . . . . . . . 325,000 325,2944.272%, 08/28/23 (144A) . . . . . . . . . . . . . . . . . . . . . . 310,000 310,848
GlaxoSmithKline Capital plc3.125%, 05/14/21 . . . . . . . . . . . . . . . . . . . . . . . . . . . 150,000 149,761
GlaxoSmithKline Capital, Inc.3.625%, 05/15/25 . . . . . . . . . . . . . . . . . . . . . . . . . . . 620,000 618,718
Mylan NV3.150%, 06/15/21 . . . . . . . . . . . . . . . . . . . . . . . . . . . 220,000 216,5603.750%, 12/15/20 . . . . . . . . . . . . . . . . . . . . . . . . . . . 325,000 325,2153.950%, 06/15/26 . . . . . . . . . . . . . . . . . . . . . . . . . . . 213,000 201,494
Mylan, Inc.4.550%, 04/15/28 (144A) . . . . . . . . . . . . . . . . . . . . . . 240,000 233,2165.200%, 04/15/48 (144A) . . . . . . . . . . . . . . . . . . . . . . 125,000 115,557
Shire Acquisitions Investments Ireland DAC2.400%, 09/23/21 . . . . . . . . . . . . . . . . . . . . . . . . . . . 355,000 342,983
Valeant Pharmaceuticals International, Inc.6.500%, 03/15/22 (144A) . . . . . . . . . . . . . . . . . . . . . . 65,000 67,600
10,193,979
Pipelines—0.3%Andeavor Logistics L.P. / Tesoro Logistics Finance Corp.
4.250%, 12/01/27 . . . . . . . . . . . . . . . . . . . . . . . . . . . 415,000 405,2676.250%, 10/15/22 . . . . . . . . . . . . . . . . . . . . . . . . . . . 41,000 42,127
DCP Midstream Operating L.P.3.875%, 03/15/23 . . . . . . . . . . . . . . . . . . . . . . . . . . . 20,000 19,5004.950%, 04/01/22 . . . . . . . . . . . . . . . . . . . . . . . . . . . 26,000 26,3905.600%, 04/01/44 . . . . . . . . . . . . . . . . . . . . . . . . . . . 50,000 47,875
Enbridge Pipelines, Inc.6.620%, 11/19/18 (CAD) . . . . . . . . . . . . . . . . . . . . . . . 150,000 116,787
Energy Transfer Equity L.P.5.500%, 06/01/27 . . . . . . . . . . . . . . . . . . . . . . . . . . . 120,000 124,536
Energy Transfer Partners L.P.4.200%, 09/15/23 . . . . . . . . . . . . . . . . . . . . . . . . . . . 70,000 70,5425.950%, 10/01/43 . . . . . . . . . . . . . . . . . . . . . . . . . . . 20,000 20,765
EQT Midstream Partners L.P.4.750%, 07/15/23 . . . . . . . . . . . . . . . . . . . . . . . . . . . 215,000 217,9615.500%, 07/15/28 . . . . . . . . . . . . . . . . . . . . . . . . . . . 270,000 276,839
MPLX L.P.4.000%, 03/15/28 . . . . . . . . . . . . . . . . . . . . . . . . . . . 180,000 173,0334.125%, 03/01/27 . . . . . . . . . . . . . . . . . . . . . . . . . . . 340,000 331,0134.700%, 04/15/48 . . . . . . . . . . . . . . . . . . . . . . . . . . . 105,000 98,1765.200%, 03/01/47 . . . . . . . . . . . . . . . . . . . . . . . . . . . 65,000 65,038
Sabine Pass Liquefaction LLC4.200%, 03/15/28 . . . . . . . . . . . . . . . . . . . . . . . . . . . 50,000 48,478
Sunoco Logistics Partners Operations L.P.5.300%, 04/01/44 . . . . . . . . . . . . . . . . . . . . . . . . . . . 35,000 33,5025.350%, 05/15/45 . . . . . . . . . . . . . . . . . . . . . . . . . . . 35,000 34,077
Texas Eastern Transmission L.P.2.800%, 10/15/22 (144A) . . . . . . . . . . . . . . . . . . . . . . 420,000 402,5433.500%, 01/15/28 (144A) . . . . . . . . . . . . . . . . . . . . . . 100,000 94,405
Security DescriptionPrincipalAmount* Value
Pipelines—(Continued)TransCanada PipeLines, Ltd.
4.750%, 05/15/38 . . . . . . . . . . . . . . . . . . . . . . . . . . . 140,000 $ 142,3556.100%, 06/01/40 . . . . . . . . . . . . . . . . . . . . . . . . . . . 40,000 45,949
Transcontinental Gas Pipe Line Co. LLC4.000%, 03/15/28 . . . . . . . . . . . . . . . . . . . . . . . . . . . 105,000 102,544
Valero Energy Partners L.P.4.500%, 03/15/28 . . . . . . . . . . . . . . . . . . . . . . . . . . . 455,000 446,723
Western Gas Partners L.P.4.500%, 03/01/28 . . . . . . . . . . . . . . . . . . . . . . . . . . . 460,000 441,0204.750%, 08/15/28 . . . . . . . . . . . . . . . . . . . . . . . . . . . 25,000 24,4345.500%, 08/15/48 . . . . . . . . . . . . . . . . . . . . . . . . . . . 25,000 23,529
Williams Cos., Inc. (The)3.700%, 01/15/23 . . . . . . . . . . . . . . . . . . . . . . . . . . . 30,000 29,6594.550%, 06/24/24 . . . . . . . . . . . . . . . . . . . . . . . . . . . 6,000 6,094
Williams Partners L.P.4.300%, 03/04/24 . . . . . . . . . . . . . . . . . . . . . . . . . . . 105,000 105,906
4,017,067
Real Estate Investment Trusts—0.1%Crown Castle International Corp.
3.150%, 07/15/23 . . . . . . . . . . . . . . . . . . . . . . . . . . . 315,000 303,5003.200%, 09/01/24 . . . . . . . . . . . . . . . . . . . . . . . . . . . 110,000 104,616
Equinix, Inc.5.875%, 01/15/26 . . . . . . . . . . . . . . . . . . . . . . . . . . . 135,000 138,881
Starwood Property Trust, Inc.4.750%, 03/15/25 . . . . . . . . . . . . . . . . . . . . . . . . . . . 65,000 62,245
609,242
Retail—0.2%Dollar Tree, Inc.
3.036%, 3M LIBOR + 0.700%, 04/17/20 (e) . . . . . . . . . . 90,000 90,137Home Depot, Inc. (The)
3.500%, 09/15/56 . . . . . . . . . . . . . . . . . . . . . . . . . . . 220,000 191,538Lowe’s Cos., Inc.
3.700%, 04/15/46 . . . . . . . . . . . . . . . . . . . . . . . . . . . 60,000 54,398McDonald’s Corp.
3.350%, 04/01/23 . . . . . . . . . . . . . . . . . . . . . . . . . . . 380,000 376,690Starbucks Corp.
3.800%, 08/15/25 . . . . . . . . . . . . . . . . . . . . . . . . . . . 265,000 263,1694.000%, 11/15/28 . . . . . . . . . . . . . . . . . . . . . . . . . . . 160,000 159,464
Suburban Propane Partners L.P. / Suburban Energy FinanceCorp.5.875%, 03/01/27 . . . . . . . . . . . . . . . . . . . . . . . . . . . 75,000 71,250
Walmart, Inc.3.400%, 06/26/23 . . . . . . . . . . . . . . . . . . . . . . . . . . . 1,080,000 1,083,613
2,290,259
Semiconductors—0.2%Broadcom Corp. / Broadcom Cayman Finance, Ltd.
2.375%, 01/15/20 . . . . . . . . . . . . . . . . . . . . . . . . . . . 960,000 948,7373.125%, 01/15/25 . . . . . . . . . . . . . . . . . . . . . . . . . . . 155,000 143,9433.625%, 01/15/24 . . . . . . . . . . . . . . . . . . . . . . . . . . . 1,285,000 1,246,185
Intel Corp.4.100%, 05/19/46 . . . . . . . . . . . . . . . . . . . . . . . . . . . 185,000 182,597
BHFTII-113

Brighthouse Funds Trust II
Brighthouse/Wellington Balanced Portfolio
Schedule of Investments as of September 30, 2018 (Unaudited)
Corporate Bonds & Notes—(Continued)
Security DescriptionPrincipalAmount* Value
Semiconductors—(Continued)Microchip Technology, Inc.
4.333%, 06/01/23 (144A) . . . . . . . . . . . . . . . . . . . . . . 380,000 $ 377,558
2,899,020
Software—0.2%CDK Global, Inc.
5.875%, 06/15/26 . . . . . . . . . . . . . . . . . . . . . . . . . . . 5,000 5,164Fidelity National Information Services, Inc.
4.250%, 05/15/28 . . . . . . . . . . . . . . . . . . . . . . . . . . . 195,000 195,273First Data Corp.
5.000%, 01/15/24 (144A) . . . . . . . . . . . . . . . . . . . . . . 40,000 40,2305.375%, 08/15/23 (144A) . . . . . . . . . . . . . . . . . . . . . . 90,000 91,373
Microsoft Corp.3.700%, 08/08/46 . . . . . . . . . . . . . . . . . . . . . . . . . . . 330,000 316,2443.950%, 08/08/56 . . . . . . . . . . . . . . . . . . . . . . . . . . . 400,000 390,620
MSCI, Inc.5.250%, 11/15/24 (144A) . . . . . . . . . . . . . . . . . . . . . . 75,000 76,8005.750%, 08/15/25 (144A) . . . . . . . . . . . . . . . . . . . . . . 65,000 68,102
Open Text Corp.5.875%, 06/01/26 (144A) . . . . . . . . . . . . . . . . . . . . . . 15,000 15,478
Oracle Corp.4.000%, 11/15/47 . . . . . . . . . . . . . . . . . . . . . . . . . . . 195,000 184,785
Quintiles IMS, Inc.4.875%, 05/15/23 (144A) . . . . . . . . . . . . . . . . . . . . . . 95,000 95,475
salesforce.com, Inc.3.250%, 04/11/23 . . . . . . . . . . . . . . . . . . . . . . . . . . . 250,000 248,1293.700%, 04/11/28 . . . . . . . . . . . . . . . . . . . . . . . . . . . 170,000 168,439
1,896,112
Telecommunications—0.7%AT&T, Inc.
2.989%, 3M LIBOR + 0.650%, 01/15/20 (e) . . . . . . . . . . 155,000 155,6984.100%, 02/15/28 (144A) . . . . . . . . . . . . . . . . . . . . . . 260,000 251,9744.250%, 03/01/27 . . . . . . . . . . . . . . . . . . . . . . . . . . . 150,000 147,9804.300%, 02/15/30 (144A) . . . . . . . . . . . . . . . . . . . . . . 801,000 769,7804.750%, 05/15/46 . . . . . . . . . . . . . . . . . . . . . . . . . . . 545,000 497,1615.150%, 03/15/42 . . . . . . . . . . . . . . . . . . . . . . . . . . . 164,000 158,081
Nokia Oyj4.375%, 06/12/27 . . . . . . . . . . . . . . . . . . . . . . . . . . . 260,000 250,2506.625%, 05/15/39 (b) . . . . . . . . . . . . . . . . . . . . . . . . 110,000 118,525
Sprint Communications, Inc.7.000%, 03/01/20 (144A) . . . . . . . . . . . . . . . . . . . . . . 90,000 93,375
Sprint Corp.7.125%, 06/15/24 . . . . . . . . . . . . . . . . . . . . . . . . . . . 100,000 103,875
Sprint Spectrum Co. LLC / Sprint Spectrum Co. II LLC / SprintSpectrum Co. III LLC5.152%, 03/20/28 (144A) . . . . . . . . . . . . . . . . . . . . . . 530,000 532,597
Telecom Italia Capital S.A.6.000%, 09/30/34 (b) . . . . . . . . . . . . . . . . . . . . . . . . 45,000 42,9537.721%, 06/04/38 . . . . . . . . . . . . . . . . . . . . . . . . . . . 50,000 53,000
Telecom Italia S.p.A.5.303%, 05/30/24 (144A) . . . . . . . . . . . . . . . . . . . . . . 925,000 898,406
Telefonica Emisiones S.A.U.4.665%, 03/06/38 . . . . . . . . . . . . . . . . . . . . . . . . . . . 150,000 140,7474.895%, 03/06/48 . . . . . . . . . . . . . . . . . . . . . . . . . . . 335,000 311,539
Security DescriptionPrincipalAmount* Value
Telecommunications—(Continued)Verizon Communications, Inc.
2.860%, 3M LIBOR + 0.550%, 05/22/20 (e) . . . . . . . . . . 155,000 $ 155,8844.400%, 11/01/34 . . . . . . . . . . . . . . . . . . . . . . . . . . . 535,000 521,1234.500%, 08/10/33 . . . . . . . . . . . . . . . . . . . . . . . . . . . 775,000 768,6704.522%, 09/15/48 . . . . . . . . . . . . . . . . . . . . . . . . . . . 635,000 604,2254.862%, 08/21/46 . . . . . . . . . . . . . . . . . . . . . . . . . . . 110,000 110,0185.012%, 08/21/54 . . . . . . . . . . . . . . . . . . . . . . . . . . . 523,000 523,9765.250%, 03/16/37 . . . . . . . . . . . . . . . . . . . . . . . . . . . 425,000 452,584
Vodafone Group plc4.375%, 05/30/28 . . . . . . . . . . . . . . . . . . . . . . . . . . . 815,000 802,524
8,464,945
Transportation—0.1%CSX Corp.
3.250%, 06/01/27 . . . . . . . . . . . . . . . . . . . . . . . . . . . 620,000 587,216FedEx Corp.
4.050%, 02/15/48 . . . . . . . . . . . . . . . . . . . . . . . . . . . 200,000 179,0274.550%, 04/01/46 . . . . . . . . . . . . . . . . . . . . . . . . . . . 30,000 29,3614.750%, 11/15/45 . . . . . . . . . . . . . . . . . . . . . . . . . . . 125,000 124,979
Union Pacific Corp.4.375%, 09/10/38 . . . . . . . . . . . . . . . . . . . . . . . . . . . 700,000 710,970
1,631,553
Trucking & Leasing—0.0%DAE Funding LLC
4.500%, 08/01/22 (144A) . . . . . . . . . . . . . . . . . . . . . . 15,000 14,6255.000%, 08/01/24 (144A) . . . . . . . . . . . . . . . . . . . . . . 15,000 14,681
29,306
Total Corporate Bonds & Notes(Cost $152,272,886) . . . . . . . . . . . . . . . . . . . . . . . . . . 148,498,428
Asset-Backed Securities—8.2%
Asset-Backed - Automobile—0.2%CIG Auto Receivables Trust
2.710%, 05/15/23 (144A) . . . . . . . . . . . . . . . . . . . . . . 192,099 190,792Credit Acceptance Auto Loan Trust
2.650%, 06/15/26 (144A) . . . . . . . . . . . . . . . . . . . . . . 545,000 538,780Honor Automobile Trust Securitization
2.940%, 11/15/19 (144A) . . . . . . . . . . . . . . . . . . . . . . 66,355 66,355Skopos Auto Receivables Trust
3.190%, 09/15/21 (144A) (o) . . . . . . . . . . . . . . . . . . . 657,325 656,720Westlake Automobile Receivables Trust
3.280%, 12/15/22 (144A) . . . . . . . . . . . . . . . . . . . . . . 1,015,000 1,007,760
2,460,407
Asset-Backed - Home Equity—0.2%GSAA Home Equity Trust
2.266%, 1M LIBOR + 0.050%, 12/25/46 (e) (h) . . . . . . . 89,484 62,7312.316%, 1M LIBOR + 0.100%, 03/25/37 (e) (h) . . . . . . . 935,400 473,7762.456%, 1M LIBOR + 0.240%, 11/25/36 (e) (h) . . . . . . . 269,558 158,5872.516%, 1M LIBOR + 0.300%, 03/25/36 (e) (h) . . . . . . . 978,468 723,6995.985%, 06/25/36 (e) (h) . . . . . . . . . . . . . . . . . . . . . . 568,544 271,808
BHFTII-114
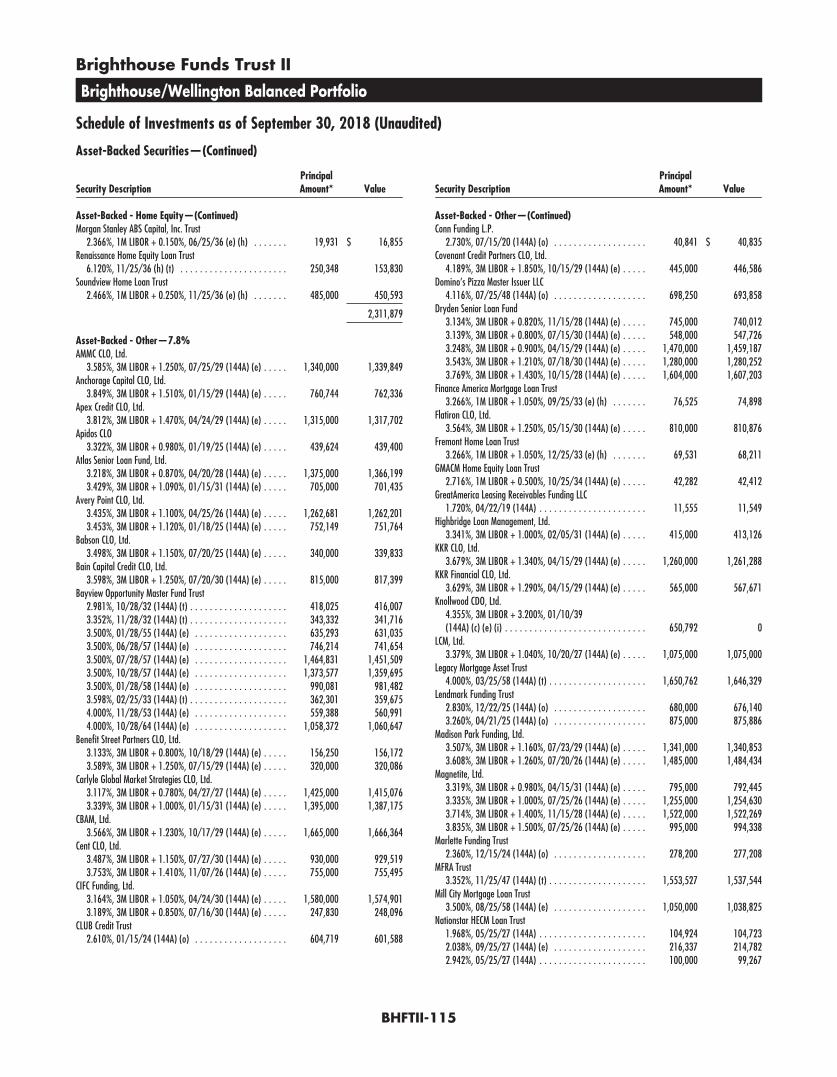
Brighthouse Funds Trust II
Brighthouse/Wellington Balanced Portfolio
Schedule of Investments as of September 30, 2018 (Unaudited)
Asset-Backed Securities—(Continued)
Security DescriptionPrincipalAmount* Value
Asset-Backed - Home Equity—(Continued)Morgan Stanley ABS Capital, Inc. Trust
2.366%, 1M LIBOR + 0.150%, 06/25/36 (e) (h) . . . . . . . 19,931 $ 16,855Renaissance Home Equity Loan Trust
6.120%, 11/25/36 (h) (t) . . . . . . . . . . . . . . . . . . . . . . 250,348 153,830Soundview Home Loan Trust
2.466%, 1M LIBOR + 0.250%, 11/25/36 (e) (h) . . . . . . . 485,000 450,593
2,311,879
Asset-Backed - Other—7.8%AMMC CLO, Ltd.
3.585%, 3M LIBOR + 1.250%, 07/25/29 (144A) (e) . . . . . 1,340,000 1,339,849Anchorage Capital CLO, Ltd.
3.849%, 3M LIBOR + 1.510%, 01/15/29 (144A) (e) . . . . . 760,744 762,336Apex Credit CLO, Ltd.
3.812%, 3M LIBOR + 1.470%, 04/24/29 (144A) (e) . . . . . 1,315,000 1,317,702Apidos CLO
3.322%, 3M LIBOR + 0.980%, 01/19/25 (144A) (e) . . . . . 439,624 439,400Atlas Senior Loan Fund, Ltd.
3.218%, 3M LIBOR + 0.870%, 04/20/28 (144A) (e) . . . . . 1,375,000 1,366,1993.429%, 3M LIBOR + 1.090%, 01/15/31 (144A) (e) . . . . . 705,000 701,435
Avery Point CLO, Ltd.3.435%, 3M LIBOR + 1.100%, 04/25/26 (144A) (e) . . . . . 1,262,681 1,262,2013.453%, 3M LIBOR + 1.120%, 01/18/25 (144A) (e) . . . . . 752,149 751,764
Babson CLO, Ltd.3.498%, 3M LIBOR + 1.150%, 07/20/25 (144A) (e) . . . . . 340,000 339,833
Bain Capital Credit CLO, Ltd.3.598%, 3M LIBOR + 1.250%, 07/20/30 (144A) (e) . . . . . 815,000 817,399
Bayview Opportunity Master Fund Trust2.981%, 10/28/32 (144A) (t) . . . . . . . . . . . . . . . . . . . . 418,025 416,0073.352%, 11/28/32 (144A) (t) . . . . . . . . . . . . . . . . . . . . 343,332 341,7163.500%, 01/28/55 (144A) (e) . . . . . . . . . . . . . . . . . . . 635,293 631,0353.500%, 06/28/57 (144A) (e) . . . . . . . . . . . . . . . . . . . 746,214 741,6543.500%, 07/28/57 (144A) (e) . . . . . . . . . . . . . . . . . . . 1,464,831 1,451,5093.500%, 10/28/57 (144A) (e) . . . . . . . . . . . . . . . . . . . 1,373,577 1,359,6953.500%, 01/28/58 (144A) (e) . . . . . . . . . . . . . . . . . . . 990,081 981,4823.598%, 02/25/33 (144A) (t) . . . . . . . . . . . . . . . . . . . . 362,301 359,6754.000%, 11/28/53 (144A) (e) . . . . . . . . . . . . . . . . . . . 559,388 560,9914.000%, 10/28/64 (144A) (e) . . . . . . . . . . . . . . . . . . . 1,058,372 1,060,647
Benefit Street Partners CLO, Ltd.3.133%, 3M LIBOR + 0.800%, 10/18/29 (144A) (e) . . . . . 156,250 156,1723.589%, 3M LIBOR + 1.250%, 07/15/29 (144A) (e) . . . . . 320,000 320,086
Carlyle Global Market Strategies CLO, Ltd.3.117%, 3M LIBOR + 0.780%, 04/27/27 (144A) (e) . . . . . 1,425,000 1,415,0763.339%, 3M LIBOR + 1.000%, 01/15/31 (144A) (e) . . . . . 1,395,000 1,387,175
CBAM, Ltd.3.566%, 3M LIBOR + 1.230%, 10/17/29 (144A) (e) . . . . . 1,665,000 1,666,364
Cent CLO, Ltd.3.487%, 3M LIBOR + 1.150%, 07/27/30 (144A) (e) . . . . . 930,000 929,5193.753%, 3M LIBOR + 1.410%, 11/07/26 (144A) (e) . . . . . 755,000 755,495
CIFC Funding, Ltd.3.164%, 3M LIBOR + 1.050%, 04/24/30 (144A) (e) . . . . . 1,580,000 1,574,9013.189%, 3M LIBOR + 0.850%, 07/16/30 (144A) (e) . . . . . 247,830 248,096
CLUB Credit Trust2.610%, 01/15/24 (144A) (o) . . . . . . . . . . . . . . . . . . . 604,719 601,588
Security DescriptionPrincipalAmount* Value
Asset-Backed - Other—(Continued)Conn Funding L.P.
2.730%, 07/15/20 (144A) (o) . . . . . . . . . . . . . . . . . . . 40,841 $ 40,835Covenant Credit Partners CLO, Ltd.
4.189%, 3M LIBOR + 1.850%, 10/15/29 (144A) (e) . . . . . 445,000 446,586Domino’s Pizza Master Issuer LLC
4.116%, 07/25/48 (144A) (o) . . . . . . . . . . . . . . . . . . . 698,250 693,858Dryden Senior Loan Fund
3.134%, 3M LIBOR + 0.820%, 11/15/28 (144A) (e) . . . . . 745,000 740,0123.139%, 3M LIBOR + 0.800%, 07/15/30 (144A) (e) . . . . . 548,000 547,7263.248%, 3M LIBOR + 0.900%, 04/15/29 (144A) (e) . . . . . 1,470,000 1,459,1873.543%, 3M LIBOR + 1.210%, 07/18/30 (144A) (e) . . . . . 1,280,000 1,280,2523.769%, 3M LIBOR + 1.430%, 10/15/28 (144A) (e) . . . . . 1,604,000 1,607,203
Finance America Mortgage Loan Trust3.266%, 1M LIBOR + 1.050%, 09/25/33 (e) (h) . . . . . . . 76,525 74,898
Flatiron CLO, Ltd.3.564%, 3M LIBOR + 1.250%, 05/15/30 (144A) (e) . . . . . 810,000 810,876
Fremont Home Loan Trust3.266%, 1M LIBOR + 1.050%, 12/25/33 (e) (h) . . . . . . . 69,531 68,211
GMACM Home Equity Loan Trust2.716%, 1M LIBOR + 0.500%, 10/25/34 (144A) (e) . . . . . 42,282 42,412
GreatAmerica Leasing Receivables Funding LLC1.720%, 04/22/19 (144A) . . . . . . . . . . . . . . . . . . . . . . 11,555 11,549
Highbridge Loan Management, Ltd.3.341%, 3M LIBOR + 1.000%, 02/05/31 (144A) (e) . . . . . 415,000 413,126
KKR CLO, Ltd.3.679%, 3M LIBOR + 1.340%, 04/15/29 (144A) (e) . . . . . 1,260,000 1,261,288
KKR Financial CLO, Ltd.3.629%, 3M LIBOR + 1.290%, 04/15/29 (144A) (e) . . . . . 565,000 567,671
Knollwood CDO, Ltd.4.355%, 3M LIBOR + 3.200%, 01/10/39(144A) (c) (e) (i) . . . . . . . . . . . . . . . . . . . . . . . . . . . . . 650,792 0
LCM, Ltd.3.379%, 3M LIBOR + 1.040%, 10/20/27 (144A) (e) . . . . . 1,075,000 1,075,000
Legacy Mortgage Asset Trust4.000%, 03/25/58 (144A) (t) . . . . . . . . . . . . . . . . . . . . 1,650,762 1,646,329
Lendmark Funding Trust2.830%, 12/22/25 (144A) (o) . . . . . . . . . . . . . . . . . . . 680,000 676,1403.260%, 04/21/25 (144A) (o) . . . . . . . . . . . . . . . . . . . 875,000 875,886
Madison Park Funding, Ltd.3.507%, 3M LIBOR + 1.160%, 07/23/29 (144A) (e) . . . . . 1,341,000 1,340,8533.608%, 3M LIBOR + 1.260%, 07/20/26 (144A) (e) . . . . . 1,485,000 1,484,434
Magnetite, Ltd.3.319%, 3M LIBOR + 0.980%, 04/15/31 (144A) (e) . . . . . 795,000 792,4453.335%, 3M LIBOR + 1.000%, 07/25/26 (144A) (e) . . . . . 1,255,000 1,254,6303.714%, 3M LIBOR + 1.400%, 11/15/28 (144A) (e) . . . . . 1,522,000 1,522,2693.835%, 3M LIBOR + 1.500%, 07/25/26 (144A) (e) . . . . . 995,000 994,338
Marlette Funding Trust2.360%, 12/15/24 (144A) (o) . . . . . . . . . . . . . . . . . . . 278,200 277,208
MFRA Trust3.352%, 11/25/47 (144A) (t) . . . . . . . . . . . . . . . . . . . . 1,553,527 1,537,544
Mill City Mortgage Loan Trust3.500%, 08/25/58 (144A) (e) . . . . . . . . . . . . . . . . . . . 1,050,000 1,038,825
Nationstar HECM Loan Trust1.968%, 05/25/27 (144A) . . . . . . . . . . . . . . . . . . . . . . 104,924 104,7232.038%, 09/25/27 (144A) (e) . . . . . . . . . . . . . . . . . . . 216,337 214,7822.942%, 05/25/27 (144A) . . . . . . . . . . . . . . . . . . . . . . 100,000 99,267
BHFTII-115

Brighthouse Funds Trust II
Brighthouse/Wellington Balanced Portfolio
Schedule of Investments as of September 30, 2018 (Unaudited)
Asset-Backed Securities—(Continued)
Security DescriptionPrincipalAmount* Value
Asset-Backed - Other—(Continued)Neuberger Berman CLO, Ltd.
3.139%, 3M LIBOR + 0.800%, 01/15/28 (144A) (e) . . . . . 1,480,000 $ 1,476,756New Residential Advance Receivables Trust
2.575%, 10/15/49 (144A) . . . . . . . . . . . . . . . . . . . . . . 624,500 619,1763.214%, 02/15/51 (144A) . . . . . . . . . . . . . . . . . . . . . . 1,065,000 1,054,078
New Residential Mortgage LLC3.790%, 07/25/54 (144A) . . . . . . . . . . . . . . . . . . . . . . 1,575,180 1,574,132
NRZ Advance Receivables Trust3.107%, 12/15/50 (144A) . . . . . . . . . . . . . . . . . . . . . . 1,195,000 1,180,413
NRZ Excess Spread-Collateralized Notes3.193%, 01/25/23 (144A) . . . . . . . . . . . . . . . . . . . . . . 1,021,291 1,015,7703.265%, 02/25/23 (144A) . . . . . . . . . . . . . . . . . . . . . . 632,847 629,002
Oak Hill Advisors Residential Loan Trust3.000%, 06/25/57 (144A) (t) . . . . . . . . . . . . . . . . . . . . 441,012 434,362
Oak Hill Credit Partners, Ltd.3.478%, 3M LIBOR + 1.130%, 07/20/26 (144A) (e) . . . . . 455,000 455,043
OCP CLO, Ltd.3.186%, 3M LIBOR + 0.850%, 04/17/27 (144A) (e) . . . . . 1,230,000 1,226,7383.710%, 3M LIBOR + 1.400%, 11/22/25 (144A) (e) . . . . . 901,182 901,679
Octagon Investment Partners, Ltd.3.212%, 3M LIBOR + 0.900%, 05/21/27 (144A) (e) . . . . . 489,000 488,4233.668%, 3M LIBOR + 1.320%, 03/17/30 (144A) (e) . . . . . 725,000 728,275
OHA Loan Funding, Ltd.3.350%, 3M LIBOR + 1.040%, 05/23/31 (144A) (e) . . . . . 695,000 692,779
OneMain Financial Issuance Trust2.370%, 09/14/32 (144A) . . . . . . . . . . . . . . . . . . . . . . 1,648,000 1,619,7604.100%, 03/20/28 (144A) . . . . . . . . . . . . . . . . . . . . . . 828,991 833,364
OZLM Funding, Ltd.3.247%, 3M LIBOR + 0.900%, 07/22/29 (144A) (e) . . . . . 125,000 125,0783.597%, 3M LIBOR + 1.250%, 10/22/30 (144A) (e) . . . . . 1,205,000 1,205,512
OZLM, Ltd.3.241%, 3M LIBOR + 1.050%, 04/30/27 (144A) (e) . . . . . 1,360,000 1,357,9273.346%, 3M LIBOR + 1.010%, 07/17/29 (144A) (e) . . . . . 335,000 333,643
Palmer Square Loan Funding, Ltd.Zero Coupon, -1 x 3M LIBOR + 1.450%, 11/15/26(144A) (e) . . . . . . . . . . . . . . . . . . . . . . . . . . . . . . . . . 735,000 735,000
Pretium Mortgage Credit Partners LLC3.327%, 12/30/32 (144A) (e) . . . . . . . . . . . . . . . . . . . 178,518 177,5543.375%, 01/27/33 (144A) (t) . . . . . . . . . . . . . . . . . . . . 254,842 252,299
Prosper Marketplace Issuance Trust2.360%, 11/15/23 (144A) . . . . . . . . . . . . . . . . . . . . . . 254,466 253,762
PRPM LLC4.000%, 08/25/23 (144A) (e) . . . . . . . . . . . . . . . . . . . 1,018,119 1,009,998
Regional Management Issuance Trust3.830%, 07/15/27 (144A) (o) . . . . . . . . . . . . . . . . . . . 950,000 947,118
SBA Tower Trust2.898%, 10/15/44 (144A) (t) . . . . . . . . . . . . . . . . . . . . 845,000 843,321
Seneca Park CLO, Ltd.3.456%, 3M LIBOR + 1.120%, 07/17/26 (144A) (e) . . . . . 1,095,000 1,094,440
Shackleton CLO, Ltd.3.356%, 3M LIBOR + 1.020%, 07/17/28 (144A) (e) . . . . . 1,100,000 1,094,918
SoFi Consumer Loan Program LLC2.500%, 05/26/26 (144A) . . . . . . . . . . . . . . . . . . . . . . 331,920 327,9412.770%, 05/25/26 (144A) . . . . . . . . . . . . . . . . . . . . . . 168,954 167,4103.090%, 10/27/25 (144A) (o) . . . . . . . . . . . . . . . . . . . 308,860 307,9323.280%, 01/26/26 (144A) (o) . . . . . . . . . . . . . . . . . . . 276,007 275,639
Security DescriptionPrincipalAmount* Value
Asset-Backed - Other—(Continued)Sound Point CLO, Ltd.
3.238%, 3M LIBOR + 0.890%, 01/20/28 (144A) (e) . . . . . 1,440,000 $ 1,434,2993.354%, 3M LIBOR + 1.000%, 04/15/31 (144A) (e) . . . . . 1,435,000 1,425,8993.651%, 3M LIBOR + 1.150%, 04/18/31 (144A) (e) . . . . . 1,125,000 1,123,2153.737%, 3M LIBOR + 1.390%, 01/23/29 (144A) (e) . . . . . 505,000 505,554
Springleaf Funding Trust2.680%, 07/15/30 (144A) . . . . . . . . . . . . . . . . . . . . . . 1,705,000 1,670,8082.900%, 11/15/29 (144A) . . . . . . . . . . . . . . . . . . . . . . 1,225,000 1,221,704
SPS Servicer Advance Receivables Trust2.750%, 11/15/49 (144A) . . . . . . . . . . . . . . . . . . . . . . 1,020,000 1,013,712
Symphony CLO, Ltd.3.619%, 3M LIBOR + 1.280%, 07/14/26 (144A) (e) . . . . . 1,295,000 1,295,8433.847%, 1M LIBOR + 1.750%, 01/09/23 (144A) (e) . . . . . 1,024,986 1,025,053
Towd Point Mortgage Trust2.750%, 02/25/55 (144A) (e) . . . . . . . . . . . . . . . . . . . 172,410 169,7482.750%, 08/25/55 (144A) (e) . . . . . . . . . . . . . . . . . . . 626,296 613,7522.750%, 04/25/57 (144A) (e) . . . . . . . . . . . . . . . . . . . 455,443 446,9602.750%, 06/25/57 (144A) (e) . . . . . . . . . . . . . . . . . . . 1,233,999 1,199,4322.816%, 1M LIBOR + 0.600%, 02/25/57 (144A) (e) . . . . . 1,202,683 1,203,7613.000%, 03/25/54 (144A) (e) . . . . . . . . . . . . . . . . . . . 40,496 40,184
Treman Park CLO, Ltd.3.718%, 3M LIBOR + 1.370%, 04/20/27 (144A) (e) . . . . . 1,300,000 1,299,809
U.S. Residential Opportunity Fund Trust3.352%, 11/27/37 (144A) (t) . . . . . . . . . . . . . . . . . . . . 479,314 475,148
Vericrest Opportunity Loan Trust LLC3.000%, 10/25/47 (144A) (t) . . . . . . . . . . . . . . . . . . . . 657,906 650,5523.125%, 09/25/47 (144A) (t) . . . . . . . . . . . . . . . . . . . . 276,113 272,8163.250%, 06/25/47 (144A) (o) (t) . . . . . . . . . . . . . . . . . 272,720 270,9083.375%, 10/25/47 (144A) (t) . . . . . . . . . . . . . . . . . . . . 1,283,370 1,275,5404.115%, 09/25/48 (144A) (t) . . . . . . . . . . . . . . . . . . . . 840,000 839,6974.336%, 05/25/48 (144A) (t) . . . . . . . . . . . . . . . . . . . . 748,828 747,179
Vibrant CLO, Ltd.3.578%, 3M LIBOR + 1.240%, 06/20/29 (144A) (e) . . . . . 1,515,000 1,516,280
Voya CLO, Ltd.3.233%, 3M LIBOR + 0.900%, 01/18/29 (144A) (e) . . . . . 1,610,000 1,603,9223.583%, 3M LIBOR + 1.250%, 01/18/29 (144A) (e) . . . . . 440,000 433,814
Wendys Funding LLC3.884%, 03/15/48 (144A) (o) . . . . . . . . . . . . . . . . . . . 431,738 414,421
100,686,616
Total Asset-Backed Securities(Cost $106,724,308) . . . . . . . . . . . . . . . . . . . . . . . . . . 105,458,902
Mortgage-Backed Securities—3.9%
Collateralized Mortgage Obligations—2.2%Adjustable Rate Mortgage Trust
2.716%, 1M LIBOR + 0.500%, 01/25/36 (e) . . . . . . . . . . 172,031 164,7532.756%, 1M LIBOR + 0.540%, 11/25/35 (e) . . . . . . . . . . 178,850 177,520
Angel Oak Mortgage Trust LLC2.478%, 07/25/47 (144A) (e) . . . . . . . . . . . . . . . . . . . 454,101 446,2202.708%, 11/25/47 (144A) (e) . . . . . . . . . . . . . . . . . . . 366,417 363,9072.810%, 01/25/47 (144A) (e) . . . . . . . . . . . . . . . . . . . 99,653 98,838
Bear Stearns Adjustable Rate Mortgage Trust4.001%, 07/25/36 (e) . . . . . . . . . . . . . . . . . . . . . . . . 378,814 341,548
BHFTII-116
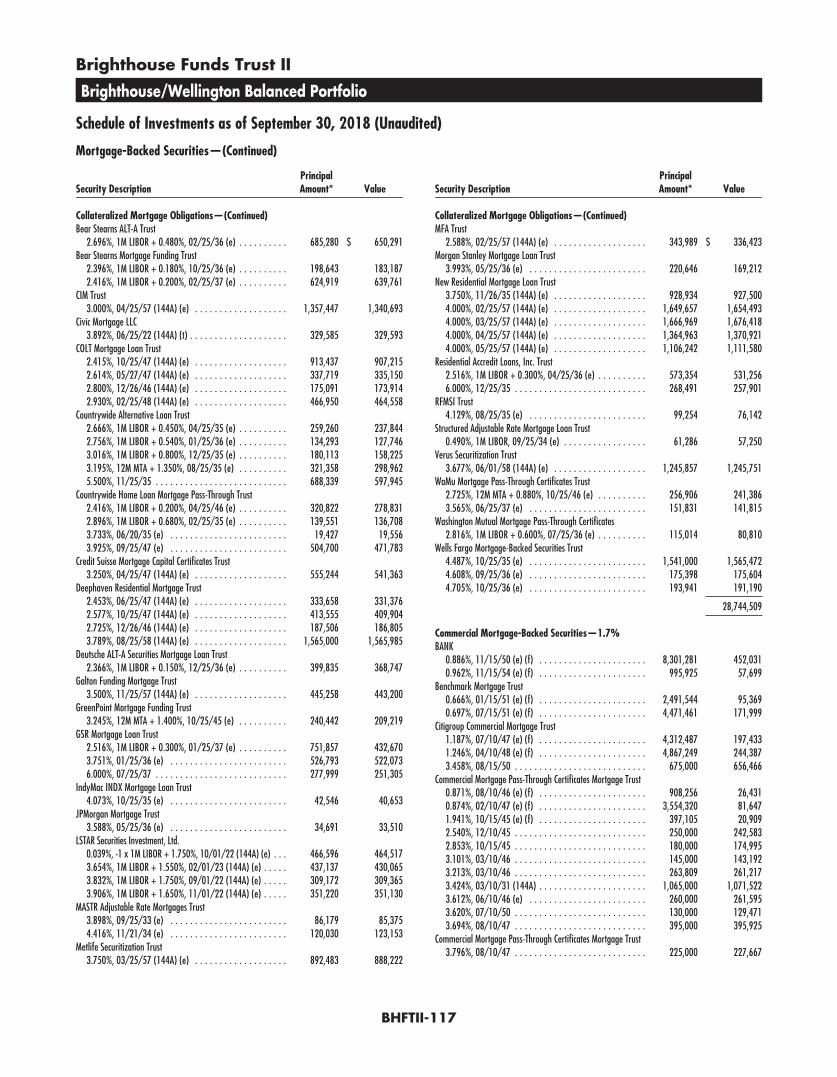
Brighthouse Funds Trust II
Brighthouse/Wellington Balanced Portfolio
Schedule of Investments as of September 30, 2018 (Unaudited)
Mortgage-Backed Securities—(Continued)
Security DescriptionPrincipalAmount* Value
Collateralized Mortgage Obligations—(Continued)Bear Stearns ALT-A Trust
2.696%, 1M LIBOR + 0.480%, 02/25/36 (e) . . . . . . . . . . 685,280 $ 650,291Bear Stearns Mortgage Funding Trust
2.396%, 1M LIBOR + 0.180%, 10/25/36 (e) . . . . . . . . . . 198,643 183,1872.416%, 1M LIBOR + 0.200%, 02/25/37 (e) . . . . . . . . . . 624,919 639,761
CIM Trust3.000%, 04/25/57 (144A) (e) . . . . . . . . . . . . . . . . . . . 1,357,447 1,340,693
Civic Mortgage LLC3.892%, 06/25/22 (144A) (t) . . . . . . . . . . . . . . . . . . . . 329,585 329,593
COLT Mortgage Loan Trust2.415%, 10/25/47 (144A) (e) . . . . . . . . . . . . . . . . . . . 913,437 907,2152.614%, 05/27/47 (144A) (e) . . . . . . . . . . . . . . . . . . . 337,719 335,1502.800%, 12/26/46 (144A) (e) . . . . . . . . . . . . . . . . . . . 175,091 173,9142.930%, 02/25/48 (144A) (e) . . . . . . . . . . . . . . . . . . . 466,950 464,558
Countrywide Alternative Loan Trust2.666%, 1M LIBOR + 0.450%, 04/25/35 (e) . . . . . . . . . . 259,260 237,8442.756%, 1M LIBOR + 0.540%, 01/25/36 (e) . . . . . . . . . . 134,293 127,7463.016%, 1M LIBOR + 0.800%, 12/25/35 (e) . . . . . . . . . . 180,113 158,2253.195%, 12M MTA + 1.350%, 08/25/35 (e) . . . . . . . . . . 321,358 298,9625.500%, 11/25/35 . . . . . . . . . . . . . . . . . . . . . . . . . . . 688,339 597,945
Countrywide Home Loan Mortgage Pass-Through Trust2.416%, 1M LIBOR + 0.200%, 04/25/46 (e) . . . . . . . . . . 320,822 278,8312.896%, 1M LIBOR + 0.680%, 02/25/35 (e) . . . . . . . . . . 139,551 136,7083.733%, 06/20/35 (e) . . . . . . . . . . . . . . . . . . . . . . . . 19,427 19,5563.925%, 09/25/47 (e) . . . . . . . . . . . . . . . . . . . . . . . . 504,700 471,783
Credit Suisse Mortgage Capital Certificates Trust3.250%, 04/25/47 (144A) (e) . . . . . . . . . . . . . . . . . . . 555,244 541,363
Deephaven Residential Mortgage Trust2.453%, 06/25/47 (144A) (e) . . . . . . . . . . . . . . . . . . . 333,658 331,3762.577%, 10/25/47 (144A) (e) . . . . . . . . . . . . . . . . . . . 413,555 409,9042.725%, 12/26/46 (144A) (e) . . . . . . . . . . . . . . . . . . . 187,506 186,8053.789%, 08/25/58 (144A) (e) . . . . . . . . . . . . . . . . . . . 1,565,000 1,565,985
Deutsche ALT-A Securities Mortgage Loan Trust2.366%, 1M LIBOR + 0.150%, 12/25/36 (e) . . . . . . . . . . 399,835 368,747
Galton Funding Mortgage Trust3.500%, 11/25/57 (144A) (e) . . . . . . . . . . . . . . . . . . . 445,258 443,200
GreenPoint Mortgage Funding Trust3.245%, 12M MTA + 1.400%, 10/25/45 (e) . . . . . . . . . . 240,442 209,219
GSR Mortgage Loan Trust2.516%, 1M LIBOR + 0.300%, 01/25/37 (e) . . . . . . . . . . 751,857 432,6703.751%, 01/25/36 (e) . . . . . . . . . . . . . . . . . . . . . . . . 526,793 522,0736.000%, 07/25/37 . . . . . . . . . . . . . . . . . . . . . . . . . . . 277,999 251,305
IndyMac INDX Mortgage Loan Trust4.073%, 10/25/35 (e) . . . . . . . . . . . . . . . . . . . . . . . . 42,546 40,653
JPMorgan Mortgage Trust3.588%, 05/25/36 (e) . . . . . . . . . . . . . . . . . . . . . . . . 34,691 33,510
LSTAR Securities Investment, Ltd.0.039%, -1 x 1M LIBOR + 1.750%, 10/01/22 (144A) (e) . . . 466,596 464,5173.654%, 1M LIBOR + 1.550%, 02/01/23 (144A) (e) . . . . . 437,137 430,0653.832%, 1M LIBOR + 1.750%, 09/01/22 (144A) (e) . . . . . 309,172 309,3653.906%, 1M LIBOR + 1.650%, 11/01/22 (144A) (e) . . . . . 351,220 351,130
MASTR Adjustable Rate Mortgages Trust3.898%, 09/25/33 (e) . . . . . . . . . . . . . . . . . . . . . . . . 86,179 85,3754.416%, 11/21/34 (e) . . . . . . . . . . . . . . . . . . . . . . . . 120,030 123,153
Metlife Securitization Trust3.750%, 03/25/57 (144A) (e) . . . . . . . . . . . . . . . . . . . 892,483 888,222
Security DescriptionPrincipalAmount* Value
Collateralized Mortgage Obligations—(Continued)MFA Trust
2.588%, 02/25/57 (144A) (e) . . . . . . . . . . . . . . . . . . . 343,989 $ 336,423Morgan Stanley Mortgage Loan Trust
3.993%, 05/25/36 (e) . . . . . . . . . . . . . . . . . . . . . . . . 220,646 169,212New Residential Mortgage Loan Trust
3.750%, 11/26/35 (144A) (e) . . . . . . . . . . . . . . . . . . . 928,934 927,5004.000%, 02/25/57 (144A) (e) . . . . . . . . . . . . . . . . . . . 1,649,657 1,654,4934.000%, 03/25/57 (144A) (e) . . . . . . . . . . . . . . . . . . . 1,666,969 1,676,4184.000%, 04/25/57 (144A) (e) . . . . . . . . . . . . . . . . . . . 1,364,963 1,370,9214.000%, 05/25/57 (144A) (e) . . . . . . . . . . . . . . . . . . . 1,106,242 1,111,580
Residential Accredit Loans, Inc. Trust2.516%, 1M LIBOR + 0.300%, 04/25/36 (e) . . . . . . . . . . 573,354 531,2566.000%, 12/25/35 . . . . . . . . . . . . . . . . . . . . . . . . . . . 268,491 257,901
RFMSI Trust4.129%, 08/25/35 (e) . . . . . . . . . . . . . . . . . . . . . . . . 99,254 76,142
Structured Adjustable Rate Mortgage Loan Trust0.490%, 1M LIBOR, 09/25/34 (e) . . . . . . . . . . . . . . . . . 61,286 57,250
Verus Securitization Trust3.677%, 06/01/58 (144A) (e) . . . . . . . . . . . . . . . . . . . 1,245,857 1,245,751
WaMu Mortgage Pass-Through Certificates Trust2.725%, 12M MTA + 0.880%, 10/25/46 (e) . . . . . . . . . . 256,906 241,3863.565%, 06/25/37 (e) . . . . . . . . . . . . . . . . . . . . . . . . 151,831 141,815
Washington Mutual Mortgage Pass-Through Certificates2.816%, 1M LIBOR + 0.600%, 07/25/36 (e) . . . . . . . . . . 115,014 80,810
Wells Fargo Mortgage-Backed Securities Trust4.487%, 10/25/35 (e) . . . . . . . . . . . . . . . . . . . . . . . . 1,541,000 1,565,4724.608%, 09/25/36 (e) . . . . . . . . . . . . . . . . . . . . . . . . 175,398 175,6044.705%, 10/25/36 (e) . . . . . . . . . . . . . . . . . . . . . . . . 193,941 191,190
28,744,509
Commercial Mortgage-Backed Securities—1.7%BANK
0.886%, 11/15/50 (e) (f) . . . . . . . . . . . . . . . . . . . . . . 8,301,281 452,0310.962%, 11/15/54 (e) (f) . . . . . . . . . . . . . . . . . . . . . . 995,925 57,699
Benchmark Mortgage Trust0.666%, 01/15/51 (e) (f) . . . . . . . . . . . . . . . . . . . . . . 2,491,544 95,3690.697%, 07/15/51 (e) (f) . . . . . . . . . . . . . . . . . . . . . . 4,471,461 171,999
Citigroup Commercial Mortgage Trust1.187%, 07/10/47 (e) (f) . . . . . . . . . . . . . . . . . . . . . . 4,312,487 197,4331.246%, 04/10/48 (e) (f) . . . . . . . . . . . . . . . . . . . . . . 4,867,249 244,3873.458%, 08/15/50 . . . . . . . . . . . . . . . . . . . . . . . . . . . 675,000 656,466
Commercial Mortgage Pass-Through Certificates Mortgage Trust0.871%, 08/10/46 (e) (f) . . . . . . . . . . . . . . . . . . . . . . 908,256 26,4310.874%, 02/10/47 (e) (f) . . . . . . . . . . . . . . . . . . . . . . 3,554,320 81,6471.941%, 10/15/45 (e) (f) . . . . . . . . . . . . . . . . . . . . . . 397,105 20,9092.540%, 12/10/45 . . . . . . . . . . . . . . . . . . . . . . . . . . . 250,000 242,5832.853%, 10/15/45 . . . . . . . . . . . . . . . . . . . . . . . . . . . 180,000 174,9953.101%, 03/10/46 . . . . . . . . . . . . . . . . . . . . . . . . . . . 145,000 143,1923.213%, 03/10/46 . . . . . . . . . . . . . . . . . . . . . . . . . . . 263,809 261,2173.424%, 03/10/31 (144A) . . . . . . . . . . . . . . . . . . . . . . 1,065,000 1,071,5223.612%, 06/10/46 (e) . . . . . . . . . . . . . . . . . . . . . . . . 260,000 261,5953.620%, 07/10/50 . . . . . . . . . . . . . . . . . . . . . . . . . . . 130,000 129,4713.694%, 08/10/47 . . . . . . . . . . . . . . . . . . . . . . . . . . . 395,000 395,925
Commercial Mortgage Pass-Through Certificates Mortgage Trust3.796%, 08/10/47 . . . . . . . . . . . . . . . . . . . . . . . . . . . 225,000 227,667
BHFTII-117
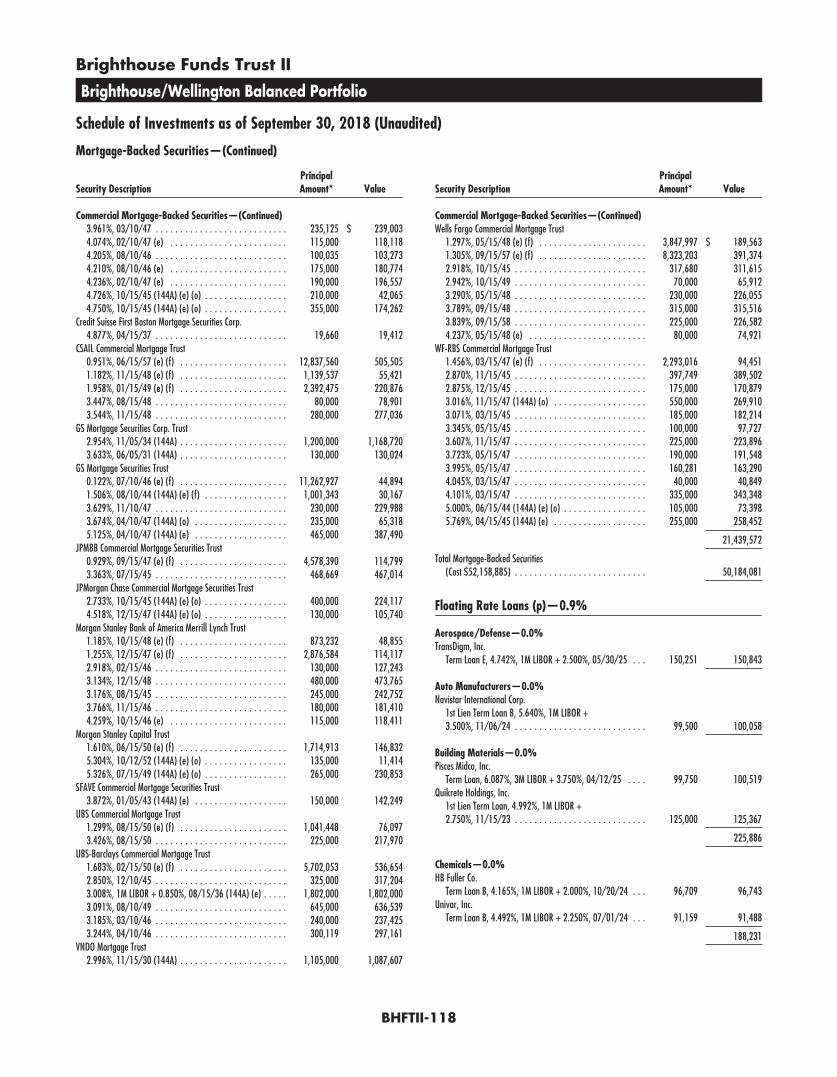
Brighthouse Funds Trust II
Brighthouse/Wellington Balanced Portfolio
Schedule of Investments as of September 30, 2018 (Unaudited)
Mortgage-Backed Securities—(Continued)
Security DescriptionPrincipalAmount* Value
Commercial Mortgage-Backed Securities—(Continued)3.961%, 03/10/47 . . . . . . . . . . . . . . . . . . . . . . . . . . . 235,125 $ 239,0034.074%, 02/10/47 (e) . . . . . . . . . . . . . . . . . . . . . . . . 115,000 118,1184.205%, 08/10/46 . . . . . . . . . . . . . . . . . . . . . . . . . . . 100,035 103,2734.210%, 08/10/46 (e) . . . . . . . . . . . . . . . . . . . . . . . . 175,000 180,7744.236%, 02/10/47 (e) . . . . . . . . . . . . . . . . . . . . . . . . 190,000 196,5574.726%, 10/15/45 (144A) (e) (o) . . . . . . . . . . . . . . . . . 210,000 42,0654.750%, 10/15/45 (144A) (e) (o) . . . . . . . . . . . . . . . . . 355,000 174,262
Credit Suisse First Boston Mortgage Securities Corp.4.877%, 04/15/37 . . . . . . . . . . . . . . . . . . . . . . . . . . . 19,660 19,412
CSAIL Commercial Mortgage Trust0.951%, 06/15/57 (e) (f) . . . . . . . . . . . . . . . . . . . . . . 12,837,560 505,5051.182%, 11/15/48 (e) (f) . . . . . . . . . . . . . . . . . . . . . . 1,139,537 55,4211.958%, 01/15/49 (e) (f) . . . . . . . . . . . . . . . . . . . . . . 2,392,475 220,8763.447%, 08/15/48 . . . . . . . . . . . . . . . . . . . . . . . . . . . 80,000 78,9013.544%, 11/15/48 . . . . . . . . . . . . . . . . . . . . . . . . . . . 280,000 277,036
GS Mortgage Securities Corp. Trust2.954%, 11/05/34 (144A) . . . . . . . . . . . . . . . . . . . . . . 1,200,000 1,168,7203.633%, 06/05/31 (144A) . . . . . . . . . . . . . . . . . . . . . . 130,000 130,024
GS Mortgage Securities Trust0.122%, 07/10/46 (e) (f) . . . . . . . . . . . . . . . . . . . . . . 11,262,927 44,8941.506%, 08/10/44 (144A) (e) (f) . . . . . . . . . . . . . . . . . 1,001,343 30,1673.629%, 11/10/47 . . . . . . . . . . . . . . . . . . . . . . . . . . . 230,000 229,9883.674%, 04/10/47 (144A) (o) . . . . . . . . . . . . . . . . . . . 235,000 65,3185.125%, 04/10/47 (144A) (e) . . . . . . . . . . . . . . . . . . . 465,000 387,490
JPMBB Commercial Mortgage Securities Trust0.929%, 09/15/47 (e) (f) . . . . . . . . . . . . . . . . . . . . . . 4,578,390 114,7993.363%, 07/15/45 . . . . . . . . . . . . . . . . . . . . . . . . . . . 468,669 467,014
JPMorgan Chase Commercial Mortgage Securities Trust2.733%, 10/15/45 (144A) (e) (o) . . . . . . . . . . . . . . . . . 400,000 224,1174.518%, 12/15/47 (144A) (e) (o) . . . . . . . . . . . . . . . . . 130,000 105,740
Morgan Stanley Bank of America Merrill Lynch Trust1.185%, 10/15/48 (e) (f) . . . . . . . . . . . . . . . . . . . . . . 873,232 48,8551.255%, 12/15/47 (e) (f) . . . . . . . . . . . . . . . . . . . . . . 2,876,584 114,1172.918%, 02/15/46 . . . . . . . . . . . . . . . . . . . . . . . . . . . 130,000 127,2433.134%, 12/15/48 . . . . . . . . . . . . . . . . . . . . . . . . . . . 480,000 473,7653.176%, 08/15/45 . . . . . . . . . . . . . . . . . . . . . . . . . . . 245,000 242,7523.766%, 11/15/46 . . . . . . . . . . . . . . . . . . . . . . . . . . . 180,000 181,4104.259%, 10/15/46 (e) . . . . . . . . . . . . . . . . . . . . . . . . 115,000 118,411
Morgan Stanley Capital Trust1.610%, 06/15/50 (e) (f) . . . . . . . . . . . . . . . . . . . . . . 1,714,913 146,8325.304%, 10/12/52 (144A) (e) (o) . . . . . . . . . . . . . . . . . 135,000 11,4145.326%, 07/15/49 (144A) (e) (o) . . . . . . . . . . . . . . . . . 265,000 230,853
SFAVE Commercial Mortgage Securities Trust3.872%, 01/05/43 (144A) (e) . . . . . . . . . . . . . . . . . . . 150,000 142,249
UBS Commercial Mortgage Trust1.299%, 08/15/50 (e) (f) . . . . . . . . . . . . . . . . . . . . . . 1,041,448 76,0973.426%, 08/15/50 . . . . . . . . . . . . . . . . . . . . . . . . . . . 225,000 217,970
UBS-Barclays Commercial Mortgage Trust1.683%, 02/15/50 (e) (f) . . . . . . . . . . . . . . . . . . . . . . 5,702,053 536,6542.850%, 12/10/45 . . . . . . . . . . . . . . . . . . . . . . . . . . . 325,000 317,2043.008%, 1M LIBOR + 0.850%, 08/15/36 (144A) (e) . . . . . 1,802,000 1,802,0003.091%, 08/10/49 . . . . . . . . . . . . . . . . . . . . . . . . . . . 645,000 636,5393.185%, 03/10/46 . . . . . . . . . . . . . . . . . . . . . . . . . . . 240,000 237,4253.244%, 04/10/46 . . . . . . . . . . . . . . . . . . . . . . . . . . . 300,119 297,161
VNDO Mortgage Trust2.996%, 11/15/30 (144A) . . . . . . . . . . . . . . . . . . . . . . 1,105,000 1,087,607
Security DescriptionPrincipalAmount* Value
Commercial Mortgage-Backed Securities—(Continued)Wells Fargo Commercial Mortgage Trust
1.297%, 05/15/48 (e) (f) . . . . . . . . . . . . . . . . . . . . . . 3,847,997 $ 189,5631.305%, 09/15/57 (e) (f) . . . . . . . . . . . . . . . . . . . . . . 8,323,203 391,3742.918%, 10/15/45 . . . . . . . . . . . . . . . . . . . . . . . . . . . 317,680 311,6152.942%, 10/15/49 . . . . . . . . . . . . . . . . . . . . . . . . . . . 70,000 65,9123.290%, 05/15/48 . . . . . . . . . . . . . . . . . . . . . . . . . . . 230,000 226,0553.789%, 09/15/48 . . . . . . . . . . . . . . . . . . . . . . . . . . . 315,000 315,5163.839%, 09/15/58 . . . . . . . . . . . . . . . . . . . . . . . . . . . 225,000 226,5824.237%, 05/15/48 (e) . . . . . . . . . . . . . . . . . . . . . . . . 80,000 74,921
WF-RBS Commercial Mortgage Trust1.456%, 03/15/47 (e) (f) . . . . . . . . . . . . . . . . . . . . . . 2,293,016 94,4512.870%, 11/15/45 . . . . . . . . . . . . . . . . . . . . . . . . . . . 397,749 389,5022.875%, 12/15/45 . . . . . . . . . . . . . . . . . . . . . . . . . . . 175,000 170,8793.016%, 11/15/47 (144A) (o) . . . . . . . . . . . . . . . . . . . 550,000 269,9103.071%, 03/15/45 . . . . . . . . . . . . . . . . . . . . . . . . . . . 185,000 182,2143.345%, 05/15/45 . . . . . . . . . . . . . . . . . . . . . . . . . . . 100,000 97,7273.607%, 11/15/47 . . . . . . . . . . . . . . . . . . . . . . . . . . . 225,000 223,8963.723%, 05/15/47 . . . . . . . . . . . . . . . . . . . . . . . . . . . 190,000 191,5483.995%, 05/15/47 . . . . . . . . . . . . . . . . . . . . . . . . . . . 160,281 163,2904.045%, 03/15/47 . . . . . . . . . . . . . . . . . . . . . . . . . . . 40,000 40,8494.101%, 03/15/47 . . . . . . . . . . . . . . . . . . . . . . . . . . . 335,000 343,3485.000%, 06/15/44 (144A) (e) (o) . . . . . . . . . . . . . . . . . 105,000 73,3985.769%, 04/15/45 (144A) (e) . . . . . . . . . . . . . . . . . . . 255,000 258,452
21,439,572
Total Mortgage-Backed Securities(Cost $52,158,885) . . . . . . . . . . . . . . . . . . . . . . . . . . . 50,184,081
Floating Rate Loans (p)—0.9%
Aerospace/Defense—0.0%TransDigm, Inc.
Term Loan E, 4.742%, 1M LIBOR + 2.500%, 05/30/25 . . . 150,251 150,843
Auto Manufacturers—0.0%Navistar International Corp.
1st Lien Term Loan B, 5.640%, 1M LIBOR +3.500%, 11/06/24 . . . . . . . . . . . . . . . . . . . . . . . . . . . 99,500 100,058
Building Materials—0.0%Pisces Midco, Inc.
Term Loan, 6.087%, 3M LIBOR + 3.750%, 04/12/25 . . . . 99,750 100,519Quikrete Holdings, Inc.
1st Lien Term Loan, 4.992%, 1M LIBOR +2.750%, 11/15/23 . . . . . . . . . . . . . . . . . . . . . . . . . . . 125,000 125,367
225,886
Chemicals—0.0%HB Fuller Co.
Term Loan B, 4.165%, 1M LIBOR + 2.000%, 10/20/24 . . . 96,709 96,743Univar, Inc.
Term Loan B, 4.492%, 1M LIBOR + 2.250%, 07/01/24 . . . 91,159 91,488
188,231
BHFTII-118
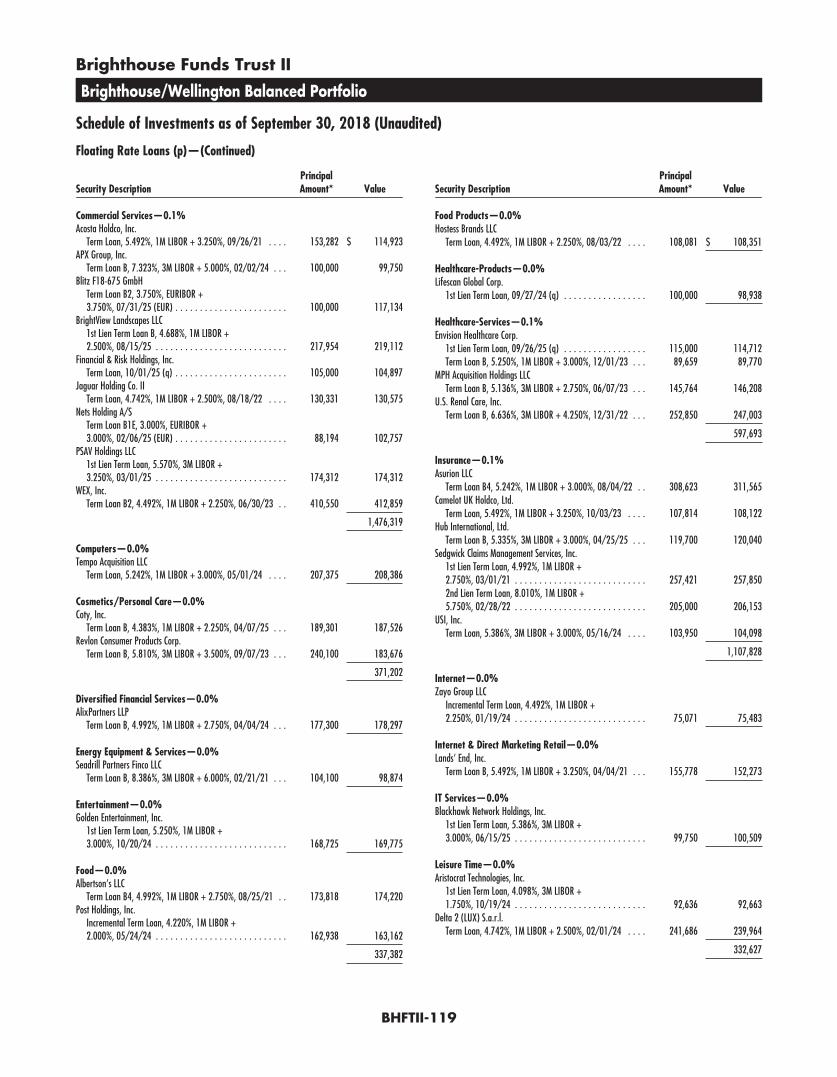
Brighthouse Funds Trust II
Brighthouse/Wellington Balanced Portfolio
Schedule of Investments as of September 30, 2018 (Unaudited)
Floating Rate Loans (p)—(Continued)
Security DescriptionPrincipalAmount* Value
Commercial Services—0.1%Acosta Holdco, Inc.
Term Loan, 5.492%, 1M LIBOR + 3.250%, 09/26/21 . . . . 153,282 $ 114,923APX Group, Inc.
Term Loan B, 7.323%, 3M LIBOR + 5.000%, 02/02/24 . . . 100,000 99,750Blitz F18-675 GmbH
Term Loan B2, 3.750%, EURIBOR +3.750%, 07/31/25 (EUR) . . . . . . . . . . . . . . . . . . . . . . . 100,000 117,134
BrightView Landscapes LLC1st Lien Term Loan B, 4.688%, 1M LIBOR +2.500%, 08/15/25 . . . . . . . . . . . . . . . . . . . . . . . . . . . 217,954 219,112
Financial & Risk Holdings, Inc.Term Loan, 10/01/25 (q) . . . . . . . . . . . . . . . . . . . . . . . 105,000 104,897
Jaguar Holding Co. IITerm Loan, 4.742%, 1M LIBOR + 2.500%, 08/18/22 . . . . 130,331 130,575
Nets Holding A/STerm Loan B1E, 3.000%, EURIBOR +3.000%, 02/06/25 (EUR) . . . . . . . . . . . . . . . . . . . . . . . 88,194 102,757
PSAV Holdings LLC1st Lien Term Loan, 5.570%, 3M LIBOR +3.250%, 03/01/25 . . . . . . . . . . . . . . . . . . . . . . . . . . . 174,312 174,312
WEX, Inc.Term Loan B2, 4.492%, 1M LIBOR + 2.250%, 06/30/23 . . 410,550 412,859
1,476,319
Computers—0.0%Tempo Acquisition LLC
Term Loan, 5.242%, 1M LIBOR + 3.000%, 05/01/24 . . . . 207,375 208,386
Cosmetics/Personal Care—0.0%Coty, Inc.
Term Loan B, 4.383%, 1M LIBOR + 2.250%, 04/07/25 . . . 189,301 187,526Revlon Consumer Products Corp.
Term Loan B, 5.810%, 3M LIBOR + 3.500%, 09/07/23 . . . 240,100 183,676
371,202
Diversified Financial Services—0.0%AlixPartners LLP
Term Loan B, 4.992%, 1M LIBOR + 2.750%, 04/04/24 . . . 177,300 178,297
Energy Equipment & Services—0.0%Seadrill Partners Finco LLC
Term Loan B, 8.386%, 3M LIBOR + 6.000%, 02/21/21 . . . 104,100 98,874
Entertainment—0.0%Golden Entertainment, Inc.
1st Lien Term Loan, 5.250%, 1M LIBOR +3.000%, 10/20/24 . . . . . . . . . . . . . . . . . . . . . . . . . . . 168,725 169,775
Food—0.0%Albertson’s LLC
Term Loan B4, 4.992%, 1M LIBOR + 2.750%, 08/25/21 . . 173,818 174,220Post Holdings, Inc.
Incremental Term Loan, 4.220%, 1M LIBOR +2.000%, 05/24/24 . . . . . . . . . . . . . . . . . . . . . . . . . . . 162,938 163,162
337,382
Security DescriptionPrincipalAmount* Value
Food Products—0.0%Hostess Brands LLC
Term Loan, 4.492%, 1M LIBOR + 2.250%, 08/03/22 . . . . 108,081 $ 108,351
Healthcare-Products—0.0%Lifescan Global Corp.
1st Lien Term Loan, 09/27/24 (q) . . . . . . . . . . . . . . . . . 100,000 98,938
Healthcare-Services—0.1%Envision Healthcare Corp.
1st Lien Term Loan, 09/26/25 (q) . . . . . . . . . . . . . . . . . 115,000 114,712Term Loan B, 5.250%, 1M LIBOR + 3.000%, 12/01/23 . . . 89,659 89,770
MPH Acquisition Holdings LLCTerm Loan B, 5.136%, 3M LIBOR + 2.750%, 06/07/23 . . . 145,764 146,208
U.S. Renal Care, Inc.Term Loan B, 6.636%, 3M LIBOR + 4.250%, 12/31/22 . . . 252,850 247,003
597,693
Insurance—0.1%Asurion LLC
Term Loan B4, 5.242%, 1M LIBOR + 3.000%, 08/04/22 . . 308,623 311,565Camelot UK Holdco, Ltd.
Term Loan, 5.492%, 1M LIBOR + 3.250%, 10/03/23 . . . . 107,814 108,122Hub International, Ltd.
Term Loan B, 5.335%, 3M LIBOR + 3.000%, 04/25/25 . . . 119,700 120,040Sedgwick Claims Management Services, Inc.
1st Lien Term Loan, 4.992%, 1M LIBOR +2.750%, 03/01/21 . . . . . . . . . . . . . . . . . . . . . . . . . . . 257,421 257,8502nd Lien Term Loan, 8.010%, 1M LIBOR +5.750%, 02/28/22 . . . . . . . . . . . . . . . . . . . . . . . . . . . 205,000 206,153
USI, Inc.Term Loan, 5.386%, 3M LIBOR + 3.000%, 05/16/24 . . . . 103,950 104,098
1,107,828
Internet—0.0%Zayo Group LLC
Incremental Term Loan, 4.492%, 1M LIBOR +2.250%, 01/19/24 . . . . . . . . . . . . . . . . . . . . . . . . . . . 75,071 75,483
Internet & Direct Marketing Retail—0.0%Lands’ End, Inc.
Term Loan B, 5.492%, 1M LIBOR + 3.250%, 04/04/21 . . . 155,778 152,273
IT Services—0.0%Blackhawk Network Holdings, Inc.
1st Lien Term Loan, 5.386%, 3M LIBOR +3.000%, 06/15/25 . . . . . . . . . . . . . . . . . . . . . . . . . . . 99,750 100,509
Leisure Time—0.0%Aristocrat Technologies, Inc.
1st Lien Term Loan, 4.098%, 3M LIBOR +1.750%, 10/19/24 . . . . . . . . . . . . . . . . . . . . . . . . . . . 92,636 92,663
Delta 2 (LUX) S.a.r.l.Term Loan, 4.742%, 1M LIBOR + 2.500%, 02/01/24 . . . . 241,686 239,964
332,627
BHFTII-119
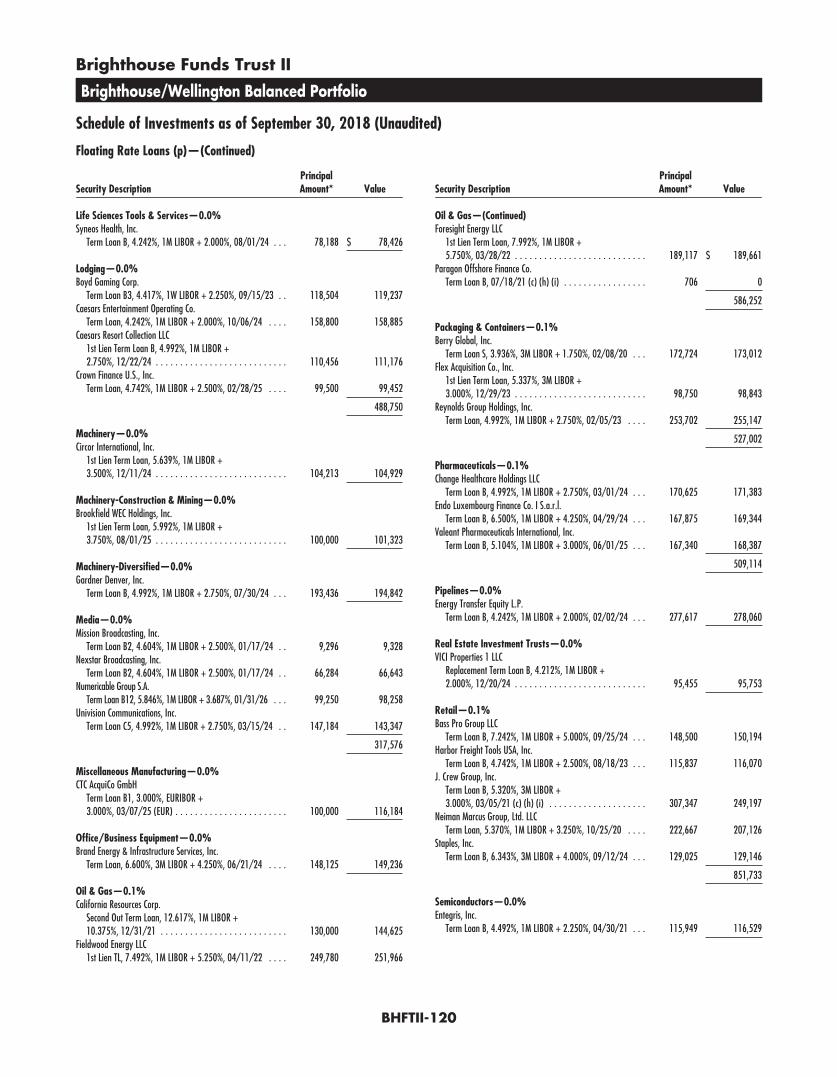
Brighthouse Funds Trust II
Brighthouse/Wellington Balanced Portfolio
Schedule of Investments as of September 30, 2018 (Unaudited)
Floating Rate Loans (p)—(Continued)
Security DescriptionPrincipalAmount* Value
Life Sciences Tools & Services—0.0%Syneos Health, Inc.
Term Loan B, 4.242%, 1M LIBOR + 2.000%, 08/01/24 . . . 78,188 $ 78,426
Lodging—0.0%Boyd Gaming Corp.
Term Loan B3, 4.417%, 1W LIBOR + 2.250%, 09/15/23 . . 118,504 119,237Caesars Entertainment Operating Co.
Term Loan, 4.242%, 1M LIBOR + 2.000%, 10/06/24 . . . . 158,800 158,885Caesars Resort Collection LLC
1st Lien Term Loan B, 4.992%, 1M LIBOR +2.750%, 12/22/24 . . . . . . . . . . . . . . . . . . . . . . . . . . . 110,456 111,176
Crown Finance U.S., Inc.Term Loan, 4.742%, 1M LIBOR + 2.500%, 02/28/25 . . . . 99,500 99,452
488,750
Machinery—0.0%Circor International, Inc.
1st Lien Term Loan, 5.639%, 1M LIBOR +3.500%, 12/11/24 . . . . . . . . . . . . . . . . . . . . . . . . . . . 104,213 104,929
Machinery-Construction & Mining—0.0%Brookfield WEC Holdings, Inc.
1st Lien Term Loan, 5.992%, 1M LIBOR +3.750%, 08/01/25 . . . . . . . . . . . . . . . . . . . . . . . . . . . 100,000 101,323
Machinery-Diversified—0.0%Gardner Denver, Inc.
Term Loan B, 4.992%, 1M LIBOR + 2.750%, 07/30/24 . . . 193,436 194,842
Media—0.0%Mission Broadcasting, Inc.
Term Loan B2, 4.604%, 1M LIBOR + 2.500%, 01/17/24 . . 9,296 9,328Nexstar Broadcasting, Inc.
Term Loan B2, 4.604%, 1M LIBOR + 2.500%, 01/17/24 . . 66,284 66,643Numericable Group S.A.
Term Loan B12, 5.846%, 1M LIBOR + 3.687%, 01/31/26 . . . 99,250 98,258Univision Communications, Inc.
Term Loan C5, 4.992%, 1M LIBOR + 2.750%, 03/15/24 . . 147,184 143,347
317,576
Miscellaneous Manufacturing—0.0%CTC AcquiCo GmbH
Term Loan B1, 3.000%, EURIBOR +3.000%, 03/07/25 (EUR) . . . . . . . . . . . . . . . . . . . . . . . 100,000 116,184
Office/Business Equipment—0.0%Brand Energy & Infrastructure Services, Inc.
Term Loan, 6.600%, 3M LIBOR + 4.250%, 06/21/24 . . . . 148,125 149,236
Oil & Gas—0.1%California Resources Corp.
Second Out Term Loan, 12.617%, 1M LIBOR +10.375%, 12/31/21 . . . . . . . . . . . . . . . . . . . . . . . . . . 130,000 144,625
Fieldwood Energy LLC1st Lien TL, 7.492%, 1M LIBOR + 5.250%, 04/11/22 . . . . 249,780 251,966
Security DescriptionPrincipalAmount* Value
Oil & Gas—(Continued)Foresight Energy LLC
1st Lien Term Loan, 7.992%, 1M LIBOR +5.750%, 03/28/22 . . . . . . . . . . . . . . . . . . . . . . . . . . . 189,117 $ 189,661
Paragon Offshore Finance Co.Term Loan B, 07/18/21 (c) (h) (i) . . . . . . . . . . . . . . . . . 706 0
586,252
Packaging & Containers—0.1%Berry Global, Inc.
Term Loan S, 3.936%, 3M LIBOR + 1.750%, 02/08/20 . . . 172,724 173,012Flex Acquisition Co., Inc.
1st Lien Term Loan, 5.337%, 3M LIBOR +3.000%, 12/29/23 . . . . . . . . . . . . . . . . . . . . . . . . . . . 98,750 98,843
Reynolds Group Holdings, Inc.Term Loan, 4.992%, 1M LIBOR + 2.750%, 02/05/23 . . . . 253,702 255,147
527,002
Pharmaceuticals—0.1%Change Healthcare Holdings LLC
Term Loan B, 4.992%, 1M LIBOR + 2.750%, 03/01/24 . . . 170,625 171,383Endo Luxembourg Finance Co. I S.a.r.l.
Term Loan B, 6.500%, 1M LIBOR + 4.250%, 04/29/24 . . . 167,875 169,344Valeant Pharmaceuticals International, Inc.
Term Loan B, 5.104%, 1M LIBOR + 3.000%, 06/01/25 . . . 167,340 168,387
509,114
Pipelines—0.0%Energy Transfer Equity L.P.
Term Loan B, 4.242%, 1M LIBOR + 2.000%, 02/02/24 . . . 277,617 278,060
Real Estate Investment Trusts—0.0%VICI Properties 1 LLC
Replacement Term Loan B, 4.212%, 1M LIBOR +2.000%, 12/20/24 . . . . . . . . . . . . . . . . . . . . . . . . . . . 95,455 95,753
Retail—0.1%Bass Pro Group LLC
Term Loan B, 7.242%, 1M LIBOR + 5.000%, 09/25/24 . . . 148,500 150,194Harbor Freight Tools USA, Inc.
Term Loan B, 4.742%, 1M LIBOR + 2.500%, 08/18/23 . . . 115,837 116,070J. Crew Group, Inc.
Term Loan B, 5.320%, 3M LIBOR +3.000%, 03/05/21 (c) (h) (i) . . . . . . . . . . . . . . . . . . . . 307,347 249,197
Neiman Marcus Group, Ltd. LLCTerm Loan, 5.370%, 1M LIBOR + 3.250%, 10/25/20 . . . . 222,667 207,126
Staples, Inc.Term Loan B, 6.343%, 3M LIBOR + 4.000%, 09/12/24 . . . 129,025 129,146
851,733
Semiconductors—0.0%Entegris, Inc.
Term Loan B, 4.492%, 1M LIBOR + 2.250%, 04/30/21 . . . 115,949 116,529
BHFTII-120
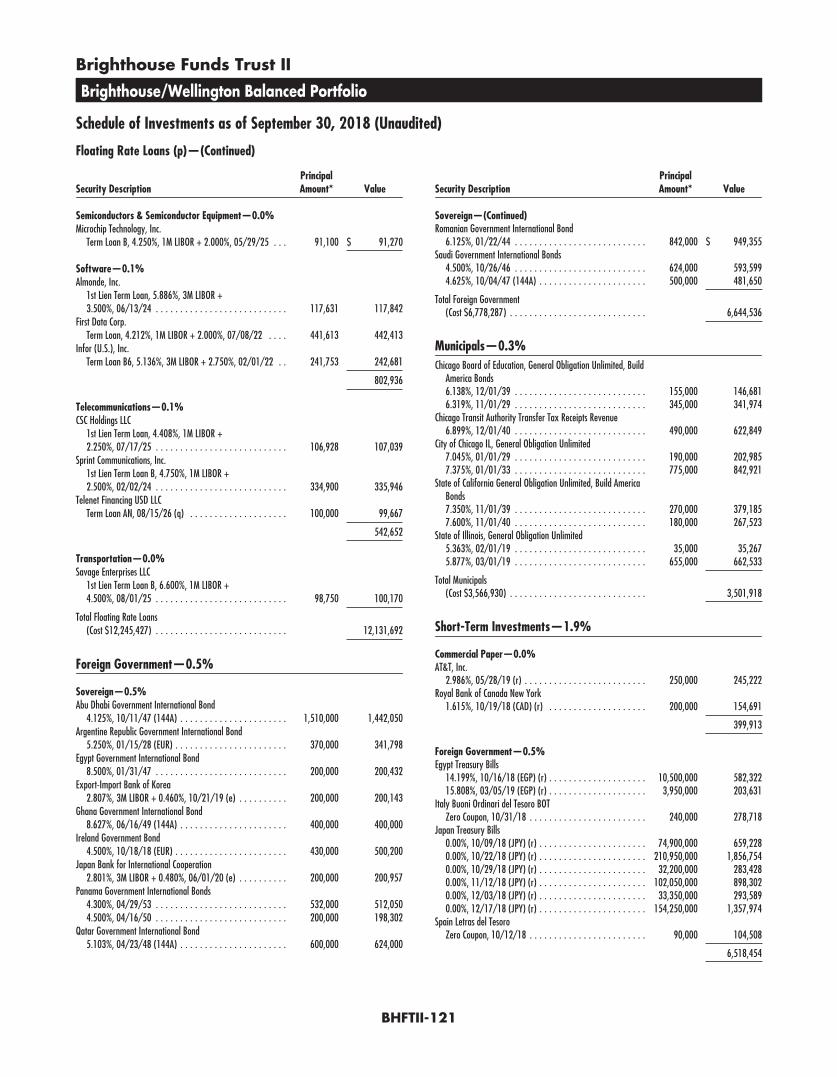
Brighthouse Funds Trust II
Brighthouse/Wellington Balanced Portfolio
Schedule of Investments as of September 30, 2018 (Unaudited)
Floating Rate Loans (p)—(Continued)
Security DescriptionPrincipalAmount* Value
Semiconductors & Semiconductor Equipment—0.0%Microchip Technology, Inc.
Term Loan B, 4.250%, 1M LIBOR + 2.000%, 05/29/25 . . . 91,100 $ 91,270
Software—0.1%Almonde, Inc.
1st Lien Term Loan, 5.886%, 3M LIBOR +3.500%, 06/13/24 . . . . . . . . . . . . . . . . . . . . . . . . . . . 117,631 117,842
First Data Corp.Term Loan, 4.212%, 1M LIBOR + 2.000%, 07/08/22 . . . . 441,613 442,413
Infor (U.S.), Inc.Term Loan B6, 5.136%, 3M LIBOR + 2.750%, 02/01/22 . . 241,753 242,681
802,936
Telecommunications—0.1%CSC Holdings LLC
1st Lien Term Loan, 4.408%, 1M LIBOR +2.250%, 07/17/25 . . . . . . . . . . . . . . . . . . . . . . . . . . . 106,928 107,039
Sprint Communications, Inc.1st Lien Term Loan B, 4.750%, 1M LIBOR +2.500%, 02/02/24 . . . . . . . . . . . . . . . . . . . . . . . . . . . 334,900 335,946
Telenet Financing USD LLCTerm Loan AN, 08/15/26 (q) . . . . . . . . . . . . . . . . . . . . 100,000 99,667
542,652
Transportation—0.0%Savage Enterprises LLC
1st Lien Term Loan B, 6.600%, 1M LIBOR +4.500%, 08/01/25 . . . . . . . . . . . . . . . . . . . . . . . . . . . 98,750 100,170
Total Floating Rate Loans(Cost $12,245,427) . . . . . . . . . . . . . . . . . . . . . . . . . . . 12,131,692
Foreign Government—0.5%
Sovereign—0.5%Abu Dhabi Government International Bond
4.125%, 10/11/47 (144A) . . . . . . . . . . . . . . . . . . . . . . 1,510,000 1,442,050Argentine Republic Government International Bond
5.250%, 01/15/28 (EUR) . . . . . . . . . . . . . . . . . . . . . . . 370,000 341,798Egypt Government International Bond
8.500%, 01/31/47 . . . . . . . . . . . . . . . . . . . . . . . . . . . 200,000 200,432Export-Import Bank of Korea
2.807%, 3M LIBOR + 0.460%, 10/21/19 (e) . . . . . . . . . . 200,000 200,143Ghana Government International Bond
8.627%, 06/16/49 (144A) . . . . . . . . . . . . . . . . . . . . . . 400,000 400,000Ireland Government Bond
4.500%, 10/18/18 (EUR) . . . . . . . . . . . . . . . . . . . . . . . 430,000 500,200Japan Bank for International Cooperation
2.801%, 3M LIBOR + 0.480%, 06/01/20 (e) . . . . . . . . . . 200,000 200,957Panama Government International Bonds
4.300%, 04/29/53 . . . . . . . . . . . . . . . . . . . . . . . . . . . 532,000 512,0504.500%, 04/16/50 . . . . . . . . . . . . . . . . . . . . . . . . . . . 200,000 198,302
Qatar Government International Bond5.103%, 04/23/48 (144A) . . . . . . . . . . . . . . . . . . . . . . 600,000 624,000
Security DescriptionPrincipalAmount* Value
Sovereign—(Continued)Romanian Government International Bond
6.125%, 01/22/44 . . . . . . . . . . . . . . . . . . . . . . . . . . . 842,000 $ 949,355Saudi Government International Bonds
4.500%, 10/26/46 . . . . . . . . . . . . . . . . . . . . . . . . . . . 624,000 593,5994.625%, 10/04/47 (144A) . . . . . . . . . . . . . . . . . . . . . . 500,000 481,650
Total Foreign Government(Cost $6,778,287) . . . . . . . . . . . . . . . . . . . . . . . . . . . . 6,644,536
Municipals—0.3%Chicago Board of Education, General Obligation Unlimited, Build
America Bonds6.138%, 12/01/39 . . . . . . . . . . . . . . . . . . . . . . . . . . . 155,000 146,6816.319%, 11/01/29 . . . . . . . . . . . . . . . . . . . . . . . . . . . 345,000 341,974
Chicago Transit Authority Transfer Tax Receipts Revenue6.899%, 12/01/40 . . . . . . . . . . . . . . . . . . . . . . . . . . . 490,000 622,849
City of Chicago IL, General Obligation Unlimited7.045%, 01/01/29 . . . . . . . . . . . . . . . . . . . . . . . . . . . 190,000 202,9857.375%, 01/01/33 . . . . . . . . . . . . . . . . . . . . . . . . . . . 775,000 842,921
State of California General Obligation Unlimited, Build AmericaBonds7.350%, 11/01/39 . . . . . . . . . . . . . . . . . . . . . . . . . . . 270,000 379,1857.600%, 11/01/40 . . . . . . . . . . . . . . . . . . . . . . . . . . . 180,000 267,523
State of Illinois, General Obligation Unlimited5.363%, 02/01/19 . . . . . . . . . . . . . . . . . . . . . . . . . . . 35,000 35,2675.877%, 03/01/19 . . . . . . . . . . . . . . . . . . . . . . . . . . . 655,000 662,533
Total Municipals(Cost $3,566,930) . . . . . . . . . . . . . . . . . . . . . . . . . . . . 3,501,918
Short-Term Investments—1.9%
Commercial Paper—0.0%AT&T, Inc.
2.986%, 05/28/19 (r) . . . . . . . . . . . . . . . . . . . . . . . . . 250,000 245,222Royal Bank of Canada New York
1.615%, 10/19/18 (CAD) (r) . . . . . . . . . . . . . . . . . . . . 200,000 154,691
399,913
Foreign Government—0.5%Egypt Treasury Bills
14.199%, 10/16/18 (EGP) (r) . . . . . . . . . . . . . . . . . . . . 10,500,000 582,32215.808%, 03/05/19 (EGP) (r) . . . . . . . . . . . . . . . . . . . . 3,950,000 203,631
Italy Buoni Ordinari del Tesoro BOTZero Coupon, 10/31/18 . . . . . . . . . . . . . . . . . . . . . . . . 240,000 278,718
Japan Treasury Bills0.00%, 10/09/18 (JPY) (r) . . . . . . . . . . . . . . . . . . . . . . 74,900,000 659,2280.00%, 10/22/18 (JPY) (r) . . . . . . . . . . . . . . . . . . . . . . 210,950,000 1,856,7540.00%, 10/29/18 (JPY) (r) . . . . . . . . . . . . . . . . . . . . . . 32,200,000 283,4280.00%, 11/12/18 (JPY) (r) . . . . . . . . . . . . . . . . . . . . . . 102,050,000 898,3020.00%, 12/03/18 (JPY) (r) . . . . . . . . . . . . . . . . . . . . . . 33,350,000 293,5890.00%, 12/17/18 (JPY) (r) . . . . . . . . . . . . . . . . . . . . . . 154,250,000 1,357,974
Spain Letras del TesoroZero Coupon, 10/12/18 . . . . . . . . . . . . . . . . . . . . . . . . 90,000 104,508
6,518,454
BHFTII-121
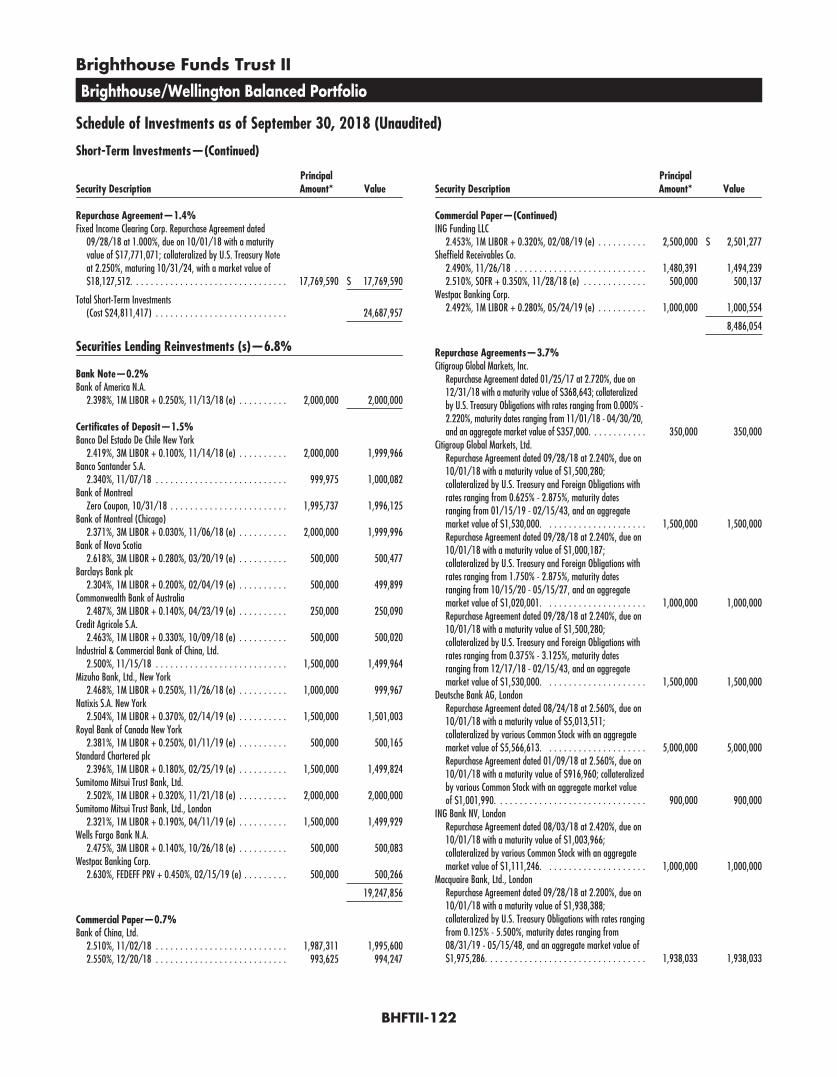
Brighthouse Funds Trust II
Brighthouse/Wellington Balanced Portfolio
Schedule of Investments as of September 30, 2018 (Unaudited)
Short-Term Investments—(Continued)
Security DescriptionPrincipalAmount* Value
Repurchase Agreement—1.4%Fixed Income Clearing Corp. Repurchase Agreement dated
09/28/18 at 1.000%, due on 10/01/18 with a maturityvalue of $17,771,071; collateralized by U.S. Treasury Noteat 2.250%, maturing 10/31/24, with a market value of$18,127,512. . . . . . . . . . . . . . . . . . . . . . . . . . . . . . . . 17,769,590 $ 17,769,590
Total Short-Term Investments(Cost $24,811,417) . . . . . . . . . . . . . . . . . . . . . . . . . . . 24,687,957
Securities Lending Reinvestments (s)—6.8%
Bank Note—0.2%Bank of America N.A.
2.398%, 1M LIBOR + 0.250%, 11/13/18 (e) . . . . . . . . . . 2,000,000 2,000,000
Certificates of Deposit—1.5%Banco Del Estado De Chile New York
2.419%, 3M LIBOR + 0.100%, 11/14/18 (e) . . . . . . . . . . 2,000,000 1,999,966Banco Santander S.A.
2.340%, 11/07/18 . . . . . . . . . . . . . . . . . . . . . . . . . . . 999,975 1,000,082Bank of Montreal
Zero Coupon, 10/31/18 . . . . . . . . . . . . . . . . . . . . . . . . 1,995,737 1,996,125Bank of Montreal (Chicago)
2.371%, 3M LIBOR + 0.030%, 11/06/18 (e) . . . . . . . . . . 2,000,000 1,999,996Bank of Nova Scotia
2.618%, 3M LIBOR + 0.280%, 03/20/19 (e) . . . . . . . . . . 500,000 500,477Barclays Bank plc
2.304%, 1M LIBOR + 0.200%, 02/04/19 (e) . . . . . . . . . . 500,000 499,899Commonwealth Bank of Australia
2.487%, 3M LIBOR + 0.140%, 04/23/19 (e) . . . . . . . . . . 250,000 250,090Credit Agricole S.A.
2.463%, 1M LIBOR + 0.330%, 10/09/18 (e) . . . . . . . . . . 500,000 500,020Industrial & Commercial Bank of China, Ltd.
2.500%, 11/15/18 . . . . . . . . . . . . . . . . . . . . . . . . . . . 1,500,000 1,499,964Mizuho Bank, Ltd., New York
2.468%, 1M LIBOR + 0.250%, 11/26/18 (e) . . . . . . . . . . 1,000,000 999,967Natixis S.A. New York
2.504%, 1M LIBOR + 0.370%, 02/14/19 (e) . . . . . . . . . . 1,500,000 1,501,003Royal Bank of Canada New York
2.381%, 1M LIBOR + 0.250%, 01/11/19 (e) . . . . . . . . . . 500,000 500,165Standard Chartered plc
2.396%, 1M LIBOR + 0.180%, 02/25/19 (e) . . . . . . . . . . 1,500,000 1,499,824Sumitomo Mitsui Trust Bank, Ltd.
2.502%, 1M LIBOR + 0.320%, 11/21/18 (e) . . . . . . . . . . 2,000,000 2,000,000Sumitomo Mitsui Trust Bank, Ltd., London
2.321%, 1M LIBOR + 0.190%, 04/11/19 (e) . . . . . . . . . . 1,500,000 1,499,929Wells Fargo Bank N.A.
2.475%, 3M LIBOR + 0.140%, 10/26/18 (e) . . . . . . . . . . 500,000 500,083Westpac Banking Corp.
2.630%, FEDEFF PRV + 0.450%, 02/15/19 (e) . . . . . . . . . 500,000 500,266
19,247,856
Commercial Paper—0.7%Bank of China, Ltd.
2.510%, 11/02/18 . . . . . . . . . . . . . . . . . . . . . . . . . . . 1,987,311 1,995,6002.550%, 12/20/18 . . . . . . . . . . . . . . . . . . . . . . . . . . . 993,625 994,247
Security DescriptionPrincipalAmount* Value
Commercial Paper—(Continued)ING Funding LLC
2.453%, 1M LIBOR + 0.320%, 02/08/19 (e) . . . . . . . . . . 2,500,000 $ 2,501,277Sheffield Receivables Co.
2.490%, 11/26/18 . . . . . . . . . . . . . . . . . . . . . . . . . . . 1,480,391 1,494,2392.510%, SOFR + 0.350%, 11/28/18 (e) . . . . . . . . . . . . . 500,000 500,137
Westpac Banking Corp.2.492%, 1M LIBOR + 0.280%, 05/24/19 (e) . . . . . . . . . . 1,000,000 1,000,554
8,486,054
Repurchase Agreements—3.7%Citigroup Global Markets, Inc.
Repurchase Agreement dated 01/25/17 at 2.720%, due on12/31/18 with a maturity value of $368,643; collateralizedby U.S. Treasury Obligations with rates ranging from 0.000% -2.220%, maturity dates ranging from 11/01/18 - 04/30/20,and an aggregate market value of $357,000. . . . . . . . . . . . 350,000 350,000
Citigroup Global Markets, Ltd.Repurchase Agreement dated 09/28/18 at 2.240%, due on10/01/18 with a maturity value of $1,500,280;collateralized by U.S. Treasury and Foreign Obligations withrates ranging from 0.625% - 2.875%, maturity datesranging from 01/15/19 - 02/15/43, and an aggregatemarket value of $1,530,000. . . . . . . . . . . . . . . . . . . . . 1,500,000 1,500,000Repurchase Agreement dated 09/28/18 at 2.240%, due on10/01/18 with a maturity value of $1,000,187;collateralized by U.S. Treasury and Foreign Obligations withrates ranging from 1.750% - 2.875%, maturity datesranging from 10/15/20 - 05/15/27, and an aggregatemarket value of $1,020,001. . . . . . . . . . . . . . . . . . . . . 1,000,000 1,000,000Repurchase Agreement dated 09/28/18 at 2.240%, due on10/01/18 with a maturity value of $1,500,280;collateralized by U.S. Treasury and Foreign Obligations withrates ranging from 0.375% - 3.125%, maturity datesranging from 12/17/18 - 02/15/43, and an aggregatemarket value of $1,530,000. . . . . . . . . . . . . . . . . . . . . 1,500,000 1,500,000
Deutsche Bank AG, LondonRepurchase Agreement dated 08/24/18 at 2.560%, due on10/01/18 with a maturity value of $5,013,511;collateralized by various Common Stock with an aggregatemarket value of $5,566,613. . . . . . . . . . . . . . . . . . . . . 5,000,000 5,000,000Repurchase Agreement dated 01/09/18 at 2.560%, due on10/01/18 with a maturity value of $916,960; collateralizedby various Common Stock with an aggregate market valueof $1,001,990. . . . . . . . . . . . . . . . . . . . . . . . . . . . . . . 900,000 900,000
ING Bank NV, LondonRepurchase Agreement dated 08/03/18 at 2.420%, due on10/01/18 with a maturity value of $1,003,966;collateralized by various Common Stock with an aggregatemarket value of $1,111,246. . . . . . . . . . . . . . . . . . . . . 1,000,000 1,000,000
Macquaire Bank, Ltd., LondonRepurchase Agreement dated 09/28/18 at 2.200%, due on10/01/18 with a maturity value of $1,938,388;collateralized by U.S. Treasury Obligations with rates rangingfrom 0.125% - 5.500%, maturity dates ranging from08/31/19 - 05/15/48, and an aggregate market value of$1,975,286. . . . . . . . . . . . . . . . . . . . . . . . . . . . . . . . . 1,938,033 1,938,033
BHFTII-122
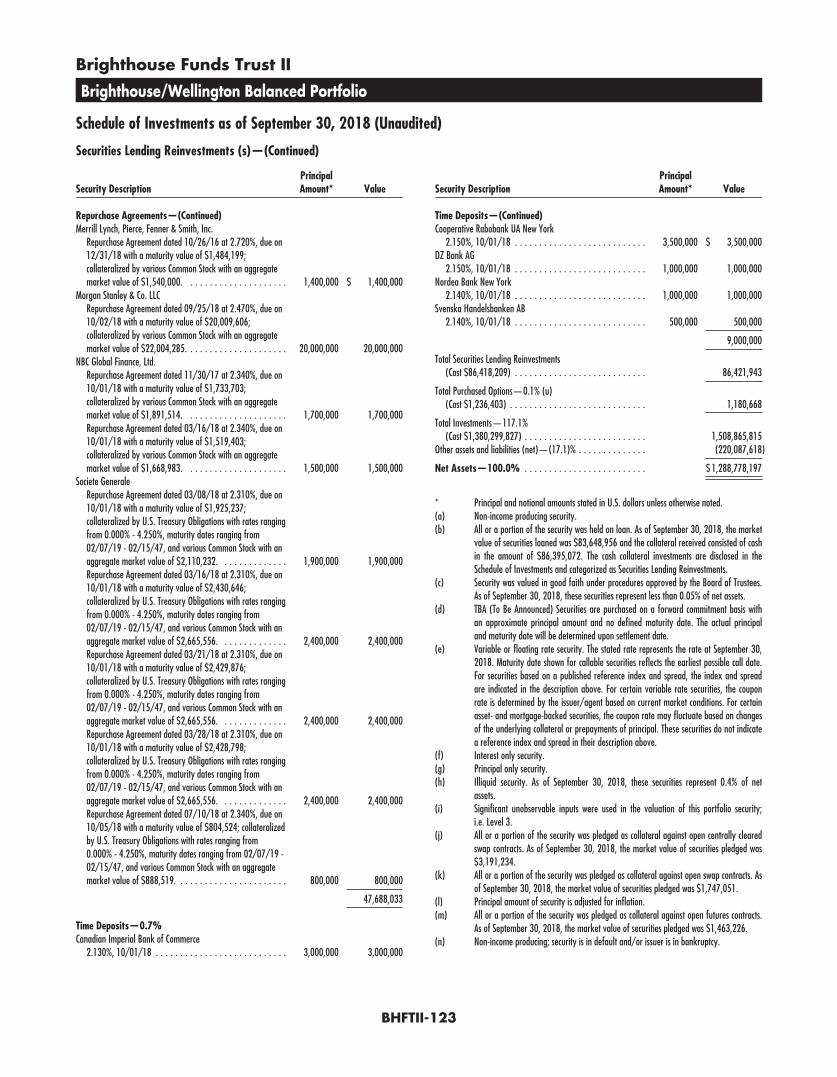
Brighthouse Funds Trust II
Brighthouse/Wellington Balanced Portfolio
Schedule of Investments as of September 30, 2018 (Unaudited)
Securities Lending Reinvestments (s)—(Continued)
Security DescriptionPrincipalAmount* Value
Repurchase Agreements—(Continued)Merrill Lynch, Pierce, Fenner & Smith, Inc.
Repurchase Agreement dated 10/26/16 at 2.720%, due on12/31/18 with a maturity value of $1,484,199;collateralized by various Common Stock with an aggregatemarket value of $1,540,000. . . . . . . . . . . . . . . . . . . . . 1,400,000 $ 1,400,000
Morgan Stanley & Co. LLCRepurchase Agreement dated 09/25/18 at 2.470%, due on10/02/18 with a maturity value of $20,009,606;collateralized by various Common Stock with an aggregatemarket value of $22,004,285. . . . . . . . . . . . . . . . . . . . . 20,000,000 20,000,000
NBC Global Finance, Ltd.Repurchase Agreement dated 11/30/17 at 2.340%, due on10/01/18 with a maturity value of $1,733,703;collateralized by various Common Stock with an aggregatemarket value of $1,891,514. . . . . . . . . . . . . . . . . . . . . 1,700,000 1,700,000Repurchase Agreement dated 03/16/18 at 2.340%, due on10/01/18 with a maturity value of $1,519,403;collateralized by various Common Stock with an aggregatemarket value of $1,668,983. . . . . . . . . . . . . . . . . . . . . 1,500,000 1,500,000
Societe GeneraleRepurchase Agreement dated 03/08/18 at 2.310%, due on10/01/18 with a maturity value of $1,925,237;collateralized by U.S. Treasury Obligations with rates rangingfrom 0.000% - 4.250%, maturity dates ranging from02/07/19 - 02/15/47, and various Common Stock with anaggregate market value of $2,110,232. . . . . . . . . . . . . . 1,900,000 1,900,000Repurchase Agreement dated 03/16/18 at 2.310%, due on10/01/18 with a maturity value of $2,430,646;collateralized by U.S. Treasury Obligations with rates rangingfrom 0.000% - 4.250%, maturity dates ranging from02/07/19 - 02/15/47, and various Common Stock with anaggregate market value of $2,665,556. . . . . . . . . . . . . . 2,400,000 2,400,000Repurchase Agreement dated 03/21/18 at 2.310%, due on10/01/18 with a maturity value of $2,429,876;collateralized by U.S. Treasury Obligations with rates rangingfrom 0.000% - 4.250%, maturity dates ranging from02/07/19 - 02/15/47, and various Common Stock with anaggregate market value of $2,665,556. . . . . . . . . . . . . . 2,400,000 2,400,000Repurchase Agreement dated 03/28/18 at 2.310%, due on10/01/18 with a maturity value of $2,428,798;collateralized by U.S. Treasury Obligations with rates rangingfrom 0.000% - 4.250%, maturity dates ranging from02/07/19 - 02/15/47, and various Common Stock with anaggregate market value of $2,665,556. . . . . . . . . . . . . . 2,400,000 2,400,000Repurchase Agreement dated 07/10/18 at 2.340%, due on10/05/18 with a maturity value of $804,524; collateralizedby U.S. Treasury Obligations with rates ranging from0.000% - 4.250%, maturity dates ranging from 02/07/19 -02/15/47, and various Common Stock with an aggregatemarket value of $888,519. . . . . . . . . . . . . . . . . . . . . . . 800,000 800,000
47,688,033
Time Deposits—0.7%Canadian Imperial Bank of Commerce
2.130%, 10/01/18 . . . . . . . . . . . . . . . . . . . . . . . . . . . 3,000,000 3,000,000
Security DescriptionPrincipalAmount* Value
Time Deposits—(Continued)Cooperative Rabobank UA New York
2.150%, 10/01/18 . . . . . . . . . . . . . . . . . . . . . . . . . . . 3,500,000 $ 3,500,000DZ Bank AG
2.150%, 10/01/18 . . . . . . . . . . . . . . . . . . . . . . . . . . . 1,000,000 1,000,000Nordea Bank New York
2.140%, 10/01/18 . . . . . . . . . . . . . . . . . . . . . . . . . . . 1,000,000 1,000,000Svenska Handelsbanken AB
2.140%, 10/01/18 . . . . . . . . . . . . . . . . . . . . . . . . . . . 500,000 500,000
9,000,000
Total Securities Lending Reinvestments(Cost $86,418,209) . . . . . . . . . . . . . . . . . . . . . . . . . . . 86,421,943
Total Purchased Options—0.1% (u)(Cost $1,236,403) . . . . . . . . . . . . . . . . . . . . . . . . . . . . 1,180,668
Total Investments—117.1%(Cost $1,380,299,827) . . . . . . . . . . . . . . . . . . . . . . . . . 1,508,865,815
Other assets and liabilities (net)—(17.1)% . . . . . . . . . . . . . . (220,087,618)
Net Assets—100.0% . . . . . . . . . . . . . . . . . . . . . . . . . $ 1,288,778,197
* Principal and notional amounts stated in U.S. dollars unless otherwise noted.(a) Non-income producing security.(b) All or a portion of the security was held on loan. As of September 30, 2018, the market
value of securities loaned was $83,648,956 and the collateral received consisted of cashin the amount of $86,395,072. The cash collateral investments are disclosed in theSchedule of Investments and categorized as Securities Lending Reinvestments.
(c) Security was valued in good faith under procedures approved by the Board of Trustees.As of September 30, 2018, these securities represent less than 0.05% of net assets.
(d) TBA (To Be Announced) Securities are purchased on a forward commitment basis withan approximate principal amount and no defined maturity date. The actual principaland maturity date will be determined upon settlement date.
(e) Variable or floating rate security. The stated rate represents the rate at September 30,2018. Maturity date shown for callable securities reflects the earliest possible call date.For securities based on a published reference index and spread, the index and spreadare indicated in the description above. For certain variable rate securities, the couponrate is determined by the issuer/agent based on current market conditions. For certainasset- and mortgage-backed securities, the coupon rate may fluctuate based on changesof the underlying collateral or prepayments of principal. These securities do not indicatea reference index and spread in their description above.
(f) Interest only security.(g) Principal only security.(h) Illiquid security. As of September 30, 2018, these securities represent 0.4% of net
assets.(i) Significant unobservable inputs were used in the valuation of this portfolio security;
i.e. Level 3.(j) All or a portion of the security was pledged as collateral against open centrally cleared
swap contracts. As of September 30, 2018, the market value of securities pledged was$3,191,234.
(k) All or a portion of the security was pledged as collateral against open swap contracts. Asof September 30, 2018, the market value of securities pledged was $1,747,051.
(l) Principal amount of security is adjusted for inflation.(m) All or a portion of the security was pledged as collateral against open futures contracts.
As of September 30, 2018, the market value of securities pledged was $1,463,226.(n) Non-income producing; security is in default and/or issuer is in bankruptcy.
BHFTII-123
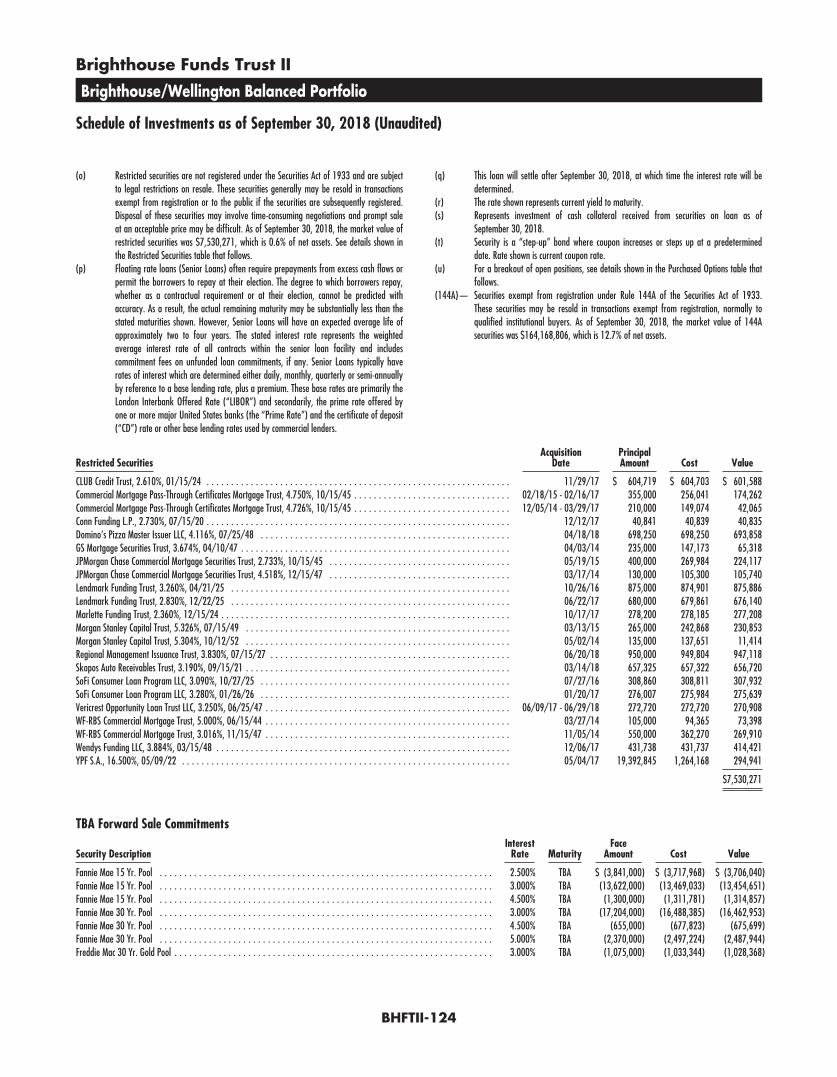
Brighthouse Funds Trust II
Brighthouse/Wellington Balanced Portfolio
Schedule of Investments as of September 30, 2018 (Unaudited)
(o) Restricted securities are not registered under the Securities Act of 1933 and are subjectto legal restrictions on resale. These securities generally may be resold in transactionsexempt from registration or to the public if the securities are subsequently registered.Disposal of these securities may involve time-consuming negotiations and prompt saleat an acceptable price may be difficult. As of September 30, 2018, the market value ofrestricted securities was $7,530,271, which is 0.6% of net assets. See details shown inthe Restricted Securities table that follows.
(p) Floating rate loans (Senior Loans) often require prepayments from excess cash flows orpermit the borrowers to repay at their election. The degree to which borrowers repay,whether as a contractual requirement or at their election, cannot be predicted withaccuracy. As a result, the actual remaining maturity may be substantially less than thestated maturities shown. However, Senior Loans will have an expected average life ofapproximately two to four years. The stated interest rate represents the weightedaverage interest rate of all contracts within the senior loan facility and includescommitment fees on unfunded loan commitments, if any. Senior Loans typically haverates of interest which are determined either daily, monthly, quarterly or semi-annuallyby reference to a base lending rate, plus a premium. These base rates are primarily theLondon Interbank Offered Rate (“LIBOR”) and secondarily, the prime rate offered byone or more major United States banks (the “Prime Rate”) and the certificate of deposit(“CD”) rate or other base lending rates used by commercial lenders.
(q) This loan will settle after September 30, 2018, at which time the interest rate will bedetermined.
(r) The rate shown represents current yield to maturity.(s) Represents investment of cash collateral received from securities on loan as of
September 30, 2018.(t) Security is a “step-up” bond where coupon increases or steps up at a predetermined
date. Rate shown is current coupon rate.(u) For a breakout of open positions, see details shown in the Purchased Options table that
follows.(144A)— Securities exempt from registration under Rule 144A of the Securities Act of 1933.
These securities may be resold in transactions exempt from registration, normally toqualified institutional buyers. As of September 30, 2018, the market value of 144Asecurities was $164,168,806, which is 12.7% of net assets.
Restricted SecuritiesAcquisition
DatePrincipalAmount Cost Value
CLUB Credit Trust, 2.610%, 01/15/24 . . . . . . . . . . . . . . . . . . . . . . . . . . . . . . . . . . . . . . . . . . . . . . . . . . . . . . . . . . . . . . 11/29/17 $ 604,719 $ 604,703 $ 601,588Commercial Mortgage Pass-Through Certificates Mortgage Trust, 4.750%, 10/15/45 . . . . . . . . . . . . . . . . . . . . . . . . . . . . . . . . 02/18/15 - 02/16/17 355,000 256,041 174,262Commercial Mortgage Pass-Through Certificates Mortgage Trust, 4.726%, 10/15/45 . . . . . . . . . . . . . . . . . . . . . . . . . . . . . . . . 12/05/14 - 03/29/17 210,000 149,074 42,065Conn Funding L.P., 2.730%, 07/15/20 . . . . . . . . . . . . . . . . . . . . . . . . . . . . . . . . . . . . . . . . . . . . . . . . . . . . . . . . . . . . . . 12/12/17 40,841 40,839 40,835Domino’s Pizza Master Issuer LLC, 4.116%, 07/25/48 . . . . . . . . . . . . . . . . . . . . . . . . . . . . . . . . . . . . . . . . . . . . . . . . . . . 04/18/18 698,250 698,250 693,858GS Mortgage Securities Trust, 3.674%, 04/10/47 . . . . . . . . . . . . . . . . . . . . . . . . . . . . . . . . . . . . . . . . . . . . . . . . . . . . . . . 04/03/14 235,000 147,173 65,318JPMorgan Chase Commercial Mortgage Securities Trust, 2.733%, 10/15/45 . . . . . . . . . . . . . . . . . . . . . . . . . . . . . . . . . . . . . 05/19/15 400,000 269,984 224,117JPMorgan Chase Commercial Mortgage Securities Trust, 4.518%, 12/15/47 . . . . . . . . . . . . . . . . . . . . . . . . . . . . . . . . . . . . . 03/17/14 130,000 105,300 105,740Lendmark Funding Trust, 3.260%, 04/21/25 . . . . . . . . . . . . . . . . . . . . . . . . . . . . . . . . . . . . . . . . . . . . . . . . . . . . . . . . . 10/26/16 875,000 874,901 875,886Lendmark Funding Trust, 2.830%, 12/22/25 . . . . . . . . . . . . . . . . . . . . . . . . . . . . . . . . . . . . . . . . . . . . . . . . . . . . . . . . . 06/22/17 680,000 679,861 676,140Marlette Funding Trust, 2.360%, 12/15/24 . . . . . . . . . . . . . . . . . . . . . . . . . . . . . . . . . . . . . . . . . . . . . . . . . . . . . . . . . . . 10/17/17 278,200 278,185 277,208Morgan Stanley Capital Trust, 5.326%, 07/15/49 . . . . . . . . . . . . . . . . . . . . . . . . . . . . . . . . . . . . . . . . . . . . . . . . . . . . . . 03/13/15 265,000 242,868 230,853Morgan Stanley Capital Trust, 5.304%, 10/12/52 . . . . . . . . . . . . . . . . . . . . . . . . . . . . . . . . . . . . . . . . . . . . . . . . . . . . . . 05/02/14 135,000 137,651 11,414Regional Management Issuance Trust, 3.830%, 07/15/27 . . . . . . . . . . . . . . . . . . . . . . . . . . . . . . . . . . . . . . . . . . . . . . . . . 06/20/18 950,000 949,804 947,118Skopos Auto Receivables Trust, 3.190%, 09/15/21 . . . . . . . . . . . . . . . . . . . . . . . . . . . . . . . . . . . . . . . . . . . . . . . . . . . . . . 03/14/18 657,325 657,322 656,720SoFi Consumer Loan Program LLC, 3.090%, 10/27/25 . . . . . . . . . . . . . . . . . . . . . . . . . . . . . . . . . . . . . . . . . . . . . . . . . . . 07/27/16 308,860 308,811 307,932SoFi Consumer Loan Program LLC, 3.280%, 01/26/26 . . . . . . . . . . . . . . . . . . . . . . . . . . . . . . . . . . . . . . . . . . . . . . . . . . . 01/20/17 276,007 275,984 275,639Vericrest Opportunity Loan Trust LLC, 3.250%, 06/25/47 . . . . . . . . . . . . . . . . . . . . . . . . . . . . . . . . . . . . . . . . . . . . . . . . . . 06/09/17 - 06/29/18 272,720 272,720 270,908WF-RBS Commercial Mortgage Trust, 5.000%, 06/15/44 . . . . . . . . . . . . . . . . . . . . . . . . . . . . . . . . . . . . . . . . . . . . . . . . . . 03/27/14 105,000 94,365 73,398WF-RBS Commercial Mortgage Trust, 3.016%, 11/15/47 . . . . . . . . . . . . . . . . . . . . . . . . . . . . . . . . . . . . . . . . . . . . . . . . . . 11/05/14 550,000 362,270 269,910Wendys Funding LLC, 3.884%, 03/15/48 . . . . . . . . . . . . . . . . . . . . . . . . . . . . . . . . . . . . . . . . . . . . . . . . . . . . . . . . . . . . 12/06/17 431,738 431,737 414,421YPF S.A., 16.500%, 05/09/22 . . . . . . . . . . . . . . . . . . . . . . . . . . . . . . . . . . . . . . . . . . . . . . . . . . . . . . . . . . . . . . . . . . . 05/04/17 19,392,845 1,264,168 294,941
$7,530,271
TBA Forward Sale Commitments
Security DescriptionInterest
Rate MaturityFace
Amount Cost Value
Fannie Mae 15 Yr. Pool . . . . . . . . . . . . . . . . . . . . . . . . . . . . . . . . . . . . . . . . . . . . . . . . . . . . . . . . . . . . . . . . . . . . 2.500% TBA $ (3,841,000) $ (3,717,968) $ (3,706,040)Fannie Mae 15 Yr. Pool . . . . . . . . . . . . . . . . . . . . . . . . . . . . . . . . . . . . . . . . . . . . . . . . . . . . . . . . . . . . . . . . . . . . 3.000% TBA (13,622,000) (13,469,033) (13,454,651)Fannie Mae 15 Yr. Pool . . . . . . . . . . . . . . . . . . . . . . . . . . . . . . . . . . . . . . . . . . . . . . . . . . . . . . . . . . . . . . . . . . . . 4.500% TBA (1,300,000) (1,311,781) (1,314,857)Fannie Mae 30 Yr. Pool . . . . . . . . . . . . . . . . . . . . . . . . . . . . . . . . . . . . . . . . . . . . . . . . . . . . . . . . . . . . . . . . . . . . 3.000% TBA (17,204,000) (16,488,385) (16,462,953)Fannie Mae 30 Yr. Pool . . . . . . . . . . . . . . . . . . . . . . . . . . . . . . . . . . . . . . . . . . . . . . . . . . . . . . . . . . . . . . . . . . . . 4.500% TBA (655,000) (677,823) (675,699)Fannie Mae 30 Yr. Pool . . . . . . . . . . . . . . . . . . . . . . . . . . . . . . . . . . . . . . . . . . . . . . . . . . . . . . . . . . . . . . . . . . . . 5.000% TBA (2,370,000) (2,497,224) (2,487,944)Freddie Mac 30 Yr. Gold Pool . . . . . . . . . . . . . . . . . . . . . . . . . . . . . . . . . . . . . . . . . . . . . . . . . . . . . . . . . . . . . . . . . 3.000% TBA (1,075,000) (1,033,344) (1,028,368)
BHFTII-124
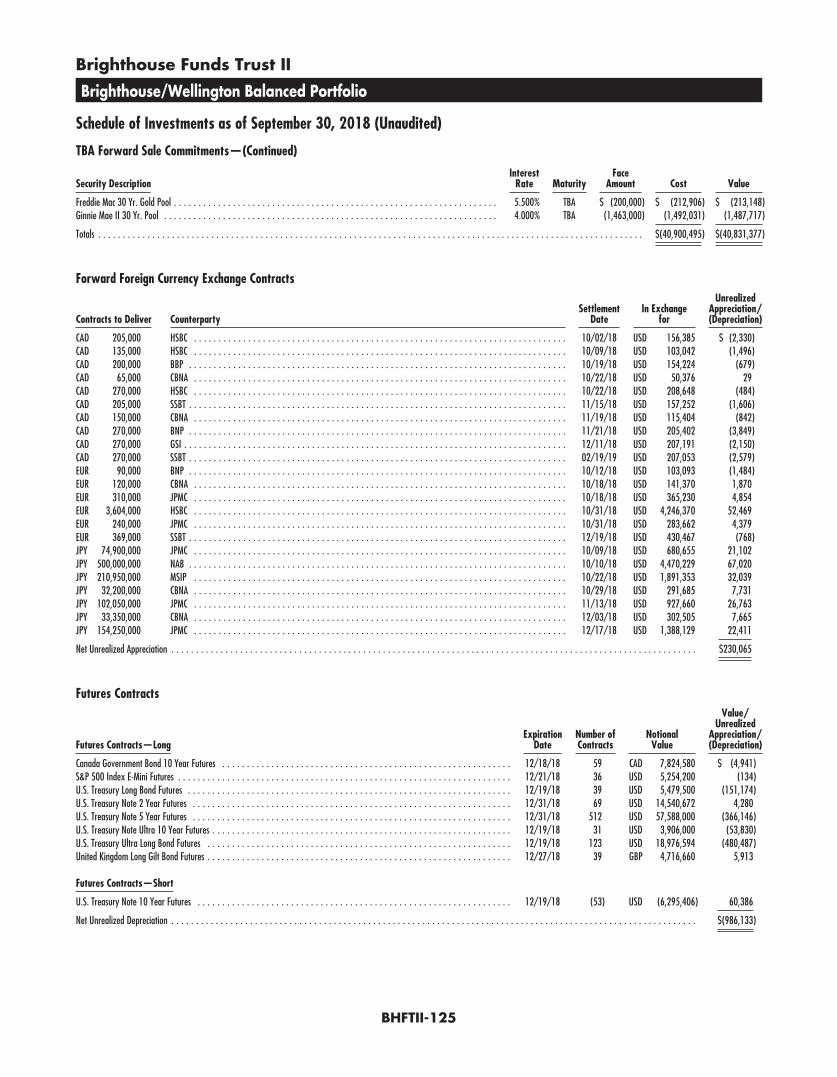
Brighthouse Funds Trust II
Brighthouse/Wellington Balanced Portfolio
Schedule of Investments as of September 30, 2018 (Unaudited)
TBA Forward Sale Commitments—(Continued)
Security DescriptionInterest
Rate MaturityFace
Amount Cost Value
Freddie Mac 30 Yr. Gold Pool . . . . . . . . . . . . . . . . . . . . . . . . . . . . . . . . . . . . . . . . . . . . . . . . . . . . . . . . . . . . . . . . . . 5.500% TBA $ (200,000) $ (212,906) $ (213,148)Ginnie Mae II 30 Yr. Pool . . . . . . . . . . . . . . . . . . . . . . . . . . . . . . . . . . . . . . . . . . . . . . . . . . . . . . . . . . . . . . . . . . . . 4.000% TBA (1,463,000) (1,492,031) (1,487,717)
Totals . . . . . . . . . . . . . . . . . . . . . . . . . . . . . . . . . . . . . . . . . . . . . . . . . . . . . . . . . . . . . . . . . . . . . . . . . . . . . . . . . . . . . . . . . . . . . . . . . . . . . . . . . . . . . . . $(40,900,495) $(40,831,377)
Forward Foreign Currency Exchange Contracts
Contracts to Deliver CounterpartySettlement
DateIn Exchange
for
UnrealizedAppreciation/(Depreciation)
CAD 205,000 HSBC . . . . . . . . . . . . . . . . . . . . . . . . . . . . . . . . . . . . . . . . . . . . . . . . . . . . . . . . . . . . . . . . . . . . . . . . . . . . 10/02/18 USD 156,385 $ (2,330)CAD 135,000 HSBC . . . . . . . . . . . . . . . . . . . . . . . . . . . . . . . . . . . . . . . . . . . . . . . . . . . . . . . . . . . . . . . . . . . . . . . . . . . . 10/09/18 USD 103,042 (1,496)CAD 200,000 BBP . . . . . . . . . . . . . . . . . . . . . . . . . . . . . . . . . . . . . . . . . . . . . . . . . . . . . . . . . . . . . . . . . . . . . . . . . . . . . 10/19/18 USD 154,224 (679)CAD 65,000 CBNA . . . . . . . . . . . . . . . . . . . . . . . . . . . . . . . . . . . . . . . . . . . . . . . . . . . . . . . . . . . . . . . . . . . . . . . . . . . . 10/22/18 USD 50,376 29CAD 270,000 HSBC . . . . . . . . . . . . . . . . . . . . . . . . . . . . . . . . . . . . . . . . . . . . . . . . . . . . . . . . . . . . . . . . . . . . . . . . . . . . 10/22/18 USD 208,648 (484)CAD 205,000 SSBT . . . . . . . . . . . . . . . . . . . . . . . . . . . . . . . . . . . . . . . . . . . . . . . . . . . . . . . . . . . . . . . . . . . . . . . . . . . . . 11/15/18 USD 157,252 (1,606)CAD 150,000 CBNA . . . . . . . . . . . . . . . . . . . . . . . . . . . . . . . . . . . . . . . . . . . . . . . . . . . . . . . . . . . . . . . . . . . . . . . . . . . . 11/19/18 USD 115,404 (842)CAD 270,000 BNP . . . . . . . . . . . . . . . . . . . . . . . . . . . . . . . . . . . . . . . . . . . . . . . . . . . . . . . . . . . . . . . . . . . . . . . . . . . . . 11/21/18 USD 205,402 (3,849)CAD 270,000 GSI . . . . . . . . . . . . . . . . . . . . . . . . . . . . . . . . . . . . . . . . . . . . . . . . . . . . . . . . . . . . . . . . . . . . . . . . . . . . . . 12/11/18 USD 207,191 (2,150)CAD 270,000 SSBT . . . . . . . . . . . . . . . . . . . . . . . . . . . . . . . . . . . . . . . . . . . . . . . . . . . . . . . . . . . . . . . . . . . . . . . . . . . . . 02/19/19 USD 207,053 (2,579)EUR 90,000 BNP . . . . . . . . . . . . . . . . . . . . . . . . . . . . . . . . . . . . . . . . . . . . . . . . . . . . . . . . . . . . . . . . . . . . . . . . . . . . . 10/12/18 USD 103,093 (1,484)EUR 120,000 CBNA . . . . . . . . . . . . . . . . . . . . . . . . . . . . . . . . . . . . . . . . . . . . . . . . . . . . . . . . . . . . . . . . . . . . . . . . . . . . 10/18/18 USD 141,370 1,870EUR 310,000 JPMC . . . . . . . . . . . . . . . . . . . . . . . . . . . . . . . . . . . . . . . . . . . . . . . . . . . . . . . . . . . . . . . . . . . . . . . . . . . . 10/18/18 USD 365,230 4,854EUR 3,604,000 HSBC . . . . . . . . . . . . . . . . . . . . . . . . . . . . . . . . . . . . . . . . . . . . . . . . . . . . . . . . . . . . . . . . . . . . . . . . . . . . 10/31/18 USD 4,246,370 52,469EUR 240,000 JPMC . . . . . . . . . . . . . . . . . . . . . . . . . . . . . . . . . . . . . . . . . . . . . . . . . . . . . . . . . . . . . . . . . . . . . . . . . . . . 10/31/18 USD 283,662 4,379EUR 369,000 SSBT . . . . . . . . . . . . . . . . . . . . . . . . . . . . . . . . . . . . . . . . . . . . . . . . . . . . . . . . . . . . . . . . . . . . . . . . . . . . . 12/19/18 USD 430,467 (768)JPY 74,900,000 JPMC . . . . . . . . . . . . . . . . . . . . . . . . . . . . . . . . . . . . . . . . . . . . . . . . . . . . . . . . . . . . . . . . . . . . . . . . . . . . 10/09/18 USD 680,655 21,102JPY 500,000,000 NAB . . . . . . . . . . . . . . . . . . . . . . . . . . . . . . . . . . . . . . . . . . . . . . . . . . . . . . . . . . . . . . . . . . . . . . . . . . . . . 10/10/18 USD 4,470,229 67,020JPY 210,950,000 MSIP . . . . . . . . . . . . . . . . . . . . . . . . . . . . . . . . . . . . . . . . . . . . . . . . . . . . . . . . . . . . . . . . . . . . . . . . . . . . 10/22/18 USD 1,891,353 32,039JPY 32,200,000 CBNA . . . . . . . . . . . . . . . . . . . . . . . . . . . . . . . . . . . . . . . . . . . . . . . . . . . . . . . . . . . . . . . . . . . . . . . . . . . . 10/29/18 USD 291,685 7,731JPY 102,050,000 JPMC . . . . . . . . . . . . . . . . . . . . . . . . . . . . . . . . . . . . . . . . . . . . . . . . . . . . . . . . . . . . . . . . . . . . . . . . . . . . 11/13/18 USD 927,660 26,763JPY 33,350,000 CBNA . . . . . . . . . . . . . . . . . . . . . . . . . . . . . . . . . . . . . . . . . . . . . . . . . . . . . . . . . . . . . . . . . . . . . . . . . . . . 12/03/18 USD 302,505 7,665JPY 154,250,000 JPMC . . . . . . . . . . . . . . . . . . . . . . . . . . . . . . . . . . . . . . . . . . . . . . . . . . . . . . . . . . . . . . . . . . . . . . . . . . . . 12/17/18 USD 1,388,129 22,411
Net Unrealized Appreciation . . . . . . . . . . . . . . . . . . . . . . . . . . . . . . . . . . . . . . . . . . . . . . . . . . . . . . . . . . . . . . . . . . . . . . . . . . . . . . . . . . . . . . . . . . . . . . . . . . . . . . . . . . . $230,065
Futures Contracts
Futures Contracts—LongExpiration
DateNumber ofContracts
NotionalValue
Value/Unrealized
Appreciation/(Depreciation)
Canada Government Bond 10 Year Futures . . . . . . . . . . . . . . . . . . . . . . . . . . . . . . . . . . . . . . . . . . . . . . . . . . . . . . . . . . . 12/18/18 59 CAD 7,824,580 $ (4,941)S&P 500 Index E-Mini Futures . . . . . . . . . . . . . . . . . . . . . . . . . . . . . . . . . . . . . . . . . . . . . . . . . . . . . . . . . . . . . . . . . . . . 12/21/18 36 USD 5,254,200 (134)U.S. Treasury Long Bond Futures . . . . . . . . . . . . . . . . . . . . . . . . . . . . . . . . . . . . . . . . . . . . . . . . . . . . . . . . . . . . . . . . . . 12/19/18 39 USD 5,479,500 (151,174)U.S. Treasury Note 2 Year Futures . . . . . . . . . . . . . . . . . . . . . . . . . . . . . . . . . . . . . . . . . . . . . . . . . . . . . . . . . . . . . . . . . 12/31/18 69 USD 14,540,672 4,280U.S. Treasury Note 5 Year Futures . . . . . . . . . . . . . . . . . . . . . . . . . . . . . . . . . . . . . . . . . . . . . . . . . . . . . . . . . . . . . . . . . 12/31/18 512 USD 57,588,000 (366,146)U.S. Treasury Note Ultra 10 Year Futures . . . . . . . . . . . . . . . . . . . . . . . . . . . . . . . . . . . . . . . . . . . . . . . . . . . . . . . . . . . . . 12/19/18 31 USD 3,906,000 (53,830)U.S. Treasury Ultra Long Bond Futures . . . . . . . . . . . . . . . . . . . . . . . . . . . . . . . . . . . . . . . . . . . . . . . . . . . . . . . . . . . . . . 12/19/18 123 USD 18,976,594 (480,487)United Kingdom Long Gilt Bond Futures . . . . . . . . . . . . . . . . . . . . . . . . . . . . . . . . . . . . . . . . . . . . . . . . . . . . . . . . . . . . . . 12/27/18 39 GBP 4,716,660 5,913
Futures Contracts—Short
U.S. Treasury Note 10 Year Futures . . . . . . . . . . . . . . . . . . . . . . . . . . . . . . . . . . . . . . . . . . . . . . . . . . . . . . . . . . . . . . . . 12/19/18 (53) USD (6,295,406) 60,386
Net Unrealized Depreciation . . . . . . . . . . . . . . . . . . . . . . . . . . . . . . . . . . . . . . . . . . . . . . . . . . . . . . . . . . . . . . . . . . . . . . . . . . . . . . . . . . . . . . . . . . . . . . . . . . . . . . . . . . . $(986,133)
BHFTII-125
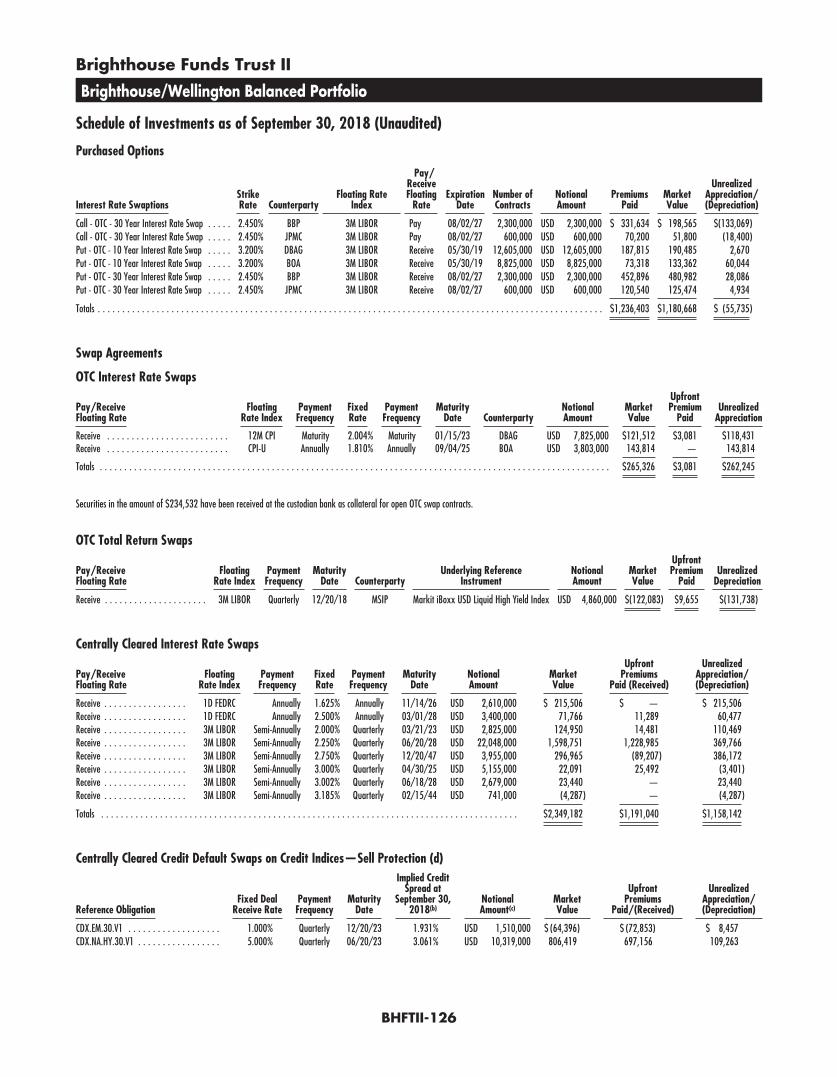
Brighthouse Funds Trust II
Brighthouse/Wellington Balanced Portfolio
Schedule of Investments as of September 30, 2018 (Unaudited)
Purchased Options
Interest Rate SwaptionsStrikeRate Counterparty
Floating RateIndex
Pay/ReceiveFloating
RateExpiration
DateNumber ofContracts
NotionalAmount
PremiumsPaid
MarketValue
UnrealizedAppreciation/(Depreciation)
Call - OTC - 30 Year Interest Rate Swap . . . . . 2.450% BBP 3M LIBOR Pay 08/02/27 2,300,000 USD 2,300,000 $ 331,634 $ 198,565 $(133,069)Call - OTC - 30 Year Interest Rate Swap . . . . . 2.450% JPMC 3M LIBOR Pay 08/02/27 600,000 USD 600,000 70,200 51,800 (18,400)Put - OTC - 10 Year Interest Rate Swap . . . . . 3.200% DBAG 3M LIBOR Receive 05/30/19 12,605,000 USD 12,605,000 187,815 190,485 2,670Put - OTC - 10 Year Interest Rate Swap . . . . . 3.200% BOA 3M LIBOR Receive 05/30/19 8,825,000 USD 8,825,000 73,318 133,362 60,044Put - OTC - 30 Year Interest Rate Swap . . . . . 2.450% BBP 3M LIBOR Receive 08/02/27 2,300,000 USD 2,300,000 452,896 480,982 28,086Put - OTC - 30 Year Interest Rate Swap . . . . . 2.450% JPMC 3M LIBOR Receive 08/02/27 600,000 USD 600,000 120,540 125,474 4,934
Totals . . . . . . . . . . . . . . . . . . . . . . . . . . . . . . . . . . . . . . . . . . . . . . . . . . . . . . . . . . . . . . . . . . . . . . . . . . . . . . . . . . . . . . . . . . . . . . . . . . . . . . . $1,236,403 $1,180,668 $ (55,735)
Swap Agreements
OTC Interest Rate Swaps
Pay/ReceiveFloating Rate
FloatingRate Index
PaymentFrequency
FixedRate
PaymentFrequency
MaturityDate Counterparty
NotionalAmount
MarketValue
UpfrontPremium
PaidUnrealized
Appreciation
Receive . . . . . . . . . . . . . . . . . . . . . . . . . 12M CPI Maturity 2.004% Maturity 01/15/23 DBAG USD 7,825,000 $121,512 $3,081 $118,431Receive . . . . . . . . . . . . . . . . . . . . . . . . . CPI-U Annually 1.810% Annually 09/04/25 BOA USD 3,803,000 143,814 — 143,814
Totals . . . . . . . . . . . . . . . . . . . . . . . . . . . . . . . . . . . . . . . . . . . . . . . . . . . . . . . . . . . . . . . . . . . . . . . . . . . . . . . . . . . . . . . . . . . . . . . . . . . . . . . . $265,326 $3,081 $262,245
Securities in the amount of $234,532 have been received at the custodian bank as collateral for open OTC swap contracts.
OTC Total Return Swaps
Pay/ReceiveFloating Rate
FloatingRate Index
PaymentFrequency
MaturityDate Counterparty
Underlying ReferenceInstrument
NotionalAmount
MarketValue
UpfrontPremium
PaidUnrealized
Depreciation
Receive . . . . . . . . . . . . . . . . . . . . . 3M LIBOR Quarterly 12/20/18 MSIP Markit iBoxx USD Liquid High Yield Index USD 4,860,000 $(122,083) $9,655 $(131,738)
Centrally Cleared Interest Rate Swaps
Pay/ReceiveFloating Rate
FloatingRate Index
PaymentFrequency
FixedRate
PaymentFrequency
MaturityDate
NotionalAmount
MarketValue
UpfrontPremiums
Paid (Received)
UnrealizedAppreciation/(Depreciation)
Receive . . . . . . . . . . . . . . . . . 1D FEDRC Annually 1.625% Annually 11/14/26 USD 2,610,000 $ 215,506 $ — $ 215,506Receive . . . . . . . . . . . . . . . . . 1D FEDRC Annually 2.500% Annually 03/01/28 USD 3,400,000 71,766 11,289 60,477Receive . . . . . . . . . . . . . . . . . 3M LIBOR Semi-Annually 2.000% Quarterly 03/21/23 USD 2,825,000 124,950 14,481 110,469Receive . . . . . . . . . . . . . . . . . 3M LIBOR Semi-Annually 2.250% Quarterly 06/20/28 USD 22,048,000 1,598,751 1,228,985 369,766Receive . . . . . . . . . . . . . . . . . 3M LIBOR Semi-Annually 2.750% Quarterly 12/20/47 USD 3,955,000 296,965 (89,207) 386,172Receive . . . . . . . . . . . . . . . . . 3M LIBOR Semi-Annually 3.000% Quarterly 04/30/25 USD 5,155,000 22,091 25,492 (3,401)Receive . . . . . . . . . . . . . . . . . 3M LIBOR Semi-Annually 3.002% Quarterly 06/18/28 USD 2,679,000 23,440 — 23,440Receive . . . . . . . . . . . . . . . . . 3M LIBOR Semi-Annually 3.185% Quarterly 02/15/44 USD 741,000 (4,287) — (4,287)
Totals . . . . . . . . . . . . . . . . . . . . . . . . . . . . . . . . . . . . . . . . . . . . . . . . . . . . . . . . . . . . . . . . . . . . . . . . . . . . . . . . . . . . . $2,349,182 $1,191,040 $1,158,142
Centrally Cleared Credit Default Swaps on Credit Indices—Sell Protection (d)
Reference ObligationFixed Deal
Receive RatePaymentFrequency
MaturityDate
Implied CreditSpread at
September 30,2018(b)
NotionalAmount(c)
MarketValue
UpfrontPremiums
Paid/(Received)
UnrealizedAppreciation/(Depreciation)
CDX.EM.30.V1 . . . . . . . . . . . . . . . . . . . 1.000% Quarterly 12/20/23 1.931% USD 1,510,000 $ (64,396) $ (72,853) $ 8,457CDX.NA.HY.30.V1 . . . . . . . . . . . . . . . . . 5.000% Quarterly 06/20/23 3.061% USD 10,319,000 806,419 697,156 109,263
BHFTII-126
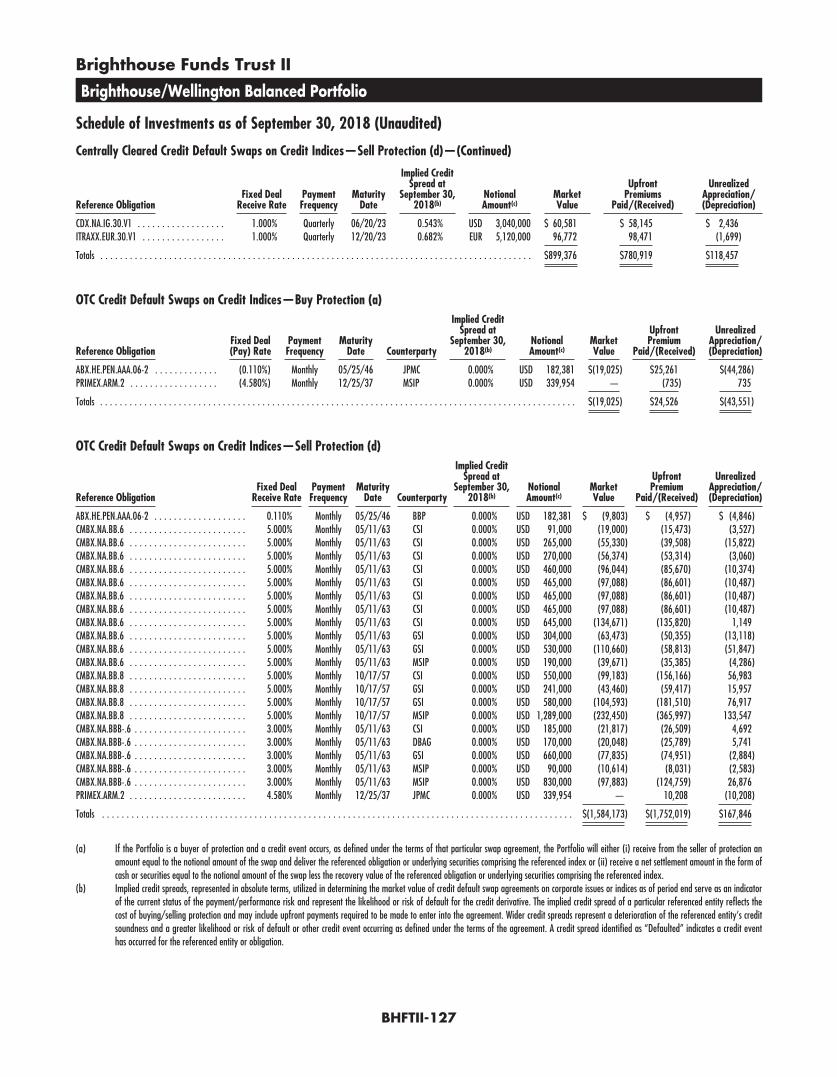
Brighthouse Funds Trust II
Brighthouse/Wellington Balanced Portfolio
Schedule of Investments as of September 30, 2018 (Unaudited)
Centrally Cleared Credit Default Swaps on Credit Indices—Sell Protection (d)—(Continued)
Reference ObligationFixed Deal
Receive RatePaymentFrequency
MaturityDate
Implied CreditSpread at
September 30,2018(b)
NotionalAmount(c)
MarketValue
UpfrontPremiums
Paid/(Received)
UnrealizedAppreciation/(Depreciation)
CDX.NA.IG.30.V1 . . . . . . . . . . . . . . . . . . 1.000% Quarterly 06/20/23 0.543% USD 3,040,000 $ 60,581 $ 58,145 $ 2,436ITRAXX.EUR.30.V1 . . . . . . . . . . . . . . . . . 1.000% Quarterly 12/20/23 0.682% EUR 5,120,000 96,772 98,471 (1,699)
Totals . . . . . . . . . . . . . . . . . . . . . . . . . . . . . . . . . . . . . . . . . . . . . . . . . . . . . . . . . . . . . . . . . . . . . . . . . . . . . . . . . . . . . . . . $899,376 $780,919 $118,457
OTC Credit Default Swaps on Credit Indices—Buy Protection (a)
Reference ObligationFixed Deal(Pay) Rate
PaymentFrequency
MaturityDate Counterparty
Implied CreditSpread at
September 30,2018(b)
NotionalAmount(c)
MarketValue
UpfrontPremium
Paid/(Received)
UnrealizedAppreciation/(Depreciation)
ABX.HE.PEN.AAA.06-2 . . . . . . . . . . . . . (0.110%) Monthly 05/25/46 JPMC 0.000% USD 182,381 $(19,025) $25,261 $(44,286)PRIMEX.ARM.2 . . . . . . . . . . . . . . . . . . (4.580%) Monthly 12/25/37 MSIP 0.000% USD 339,954 — (735) 735
Totals . . . . . . . . . . . . . . . . . . . . . . . . . . . . . . . . . . . . . . . . . . . . . . . . . . . . . . . . . . . . . . . . . . . . . . . . . . . . . . . . . . . . . . . . . . . . . . . . . $(19,025) $24,526 $(43,551)
OTC Credit Default Swaps on Credit Indices—Sell Protection (d)
Reference ObligationFixed Deal
Receive RatePaymentFrequency
MaturityDate Counterparty
Implied CreditSpread at
September 30,2018(b)
NotionalAmount(c)
MarketValue
UpfrontPremium
Paid/(Received)
UnrealizedAppreciation/(Depreciation)
ABX.HE.PEN.AAA.06-2 . . . . . . . . . . . . . . . . . . . 0.110% Monthly 05/25/46 BBP 0.000% USD 182,381 $ (9,803) $ (4,957) $ (4,846)CMBX.NA.BB.6 . . . . . . . . . . . . . . . . . . . . . . . . 5.000% Monthly 05/11/63 CSI 0.000% USD 91,000 (19,000) (15,473) (3,527)CMBX.NA.BB.6 . . . . . . . . . . . . . . . . . . . . . . . . 5.000% Monthly 05/11/63 CSI 0.000% USD 265,000 (55,330) (39,508) (15,822)CMBX.NA.BB.6 . . . . . . . . . . . . . . . . . . . . . . . . 5.000% Monthly 05/11/63 CSI 0.000% USD 270,000 (56,374) (53,314) (3,060)CMBX.NA.BB.6 . . . . . . . . . . . . . . . . . . . . . . . . 5.000% Monthly 05/11/63 CSI 0.000% USD 460,000 (96,044) (85,670) (10,374)CMBX.NA.BB.6 . . . . . . . . . . . . . . . . . . . . . . . . 5.000% Monthly 05/11/63 CSI 0.000% USD 465,000 (97,088) (86,601) (10,487)CMBX.NA.BB.6 . . . . . . . . . . . . . . . . . . . . . . . . 5.000% Monthly 05/11/63 CSI 0.000% USD 465,000 (97,088) (86,601) (10,487)CMBX.NA.BB.6 . . . . . . . . . . . . . . . . . . . . . . . . 5.000% Monthly 05/11/63 CSI 0.000% USD 465,000 (97,088) (86,601) (10,487)CMBX.NA.BB.6 . . . . . . . . . . . . . . . . . . . . . . . . 5.000% Monthly 05/11/63 CSI 0.000% USD 645,000 (134,671) (135,820) 1,149CMBX.NA.BB.6 . . . . . . . . . . . . . . . . . . . . . . . . 5.000% Monthly 05/11/63 GSI 0.000% USD 304,000 (63,473) (50,355) (13,118)CMBX.NA.BB.6 . . . . . . . . . . . . . . . . . . . . . . . . 5.000% Monthly 05/11/63 GSI 0.000% USD 530,000 (110,660) (58,813) (51,847)CMBX.NA.BB.6 . . . . . . . . . . . . . . . . . . . . . . . . 5.000% Monthly 05/11/63 MSIP 0.000% USD 190,000 (39,671) (35,385) (4,286)CMBX.NA.BB.8 . . . . . . . . . . . . . . . . . . . . . . . . 5.000% Monthly 10/17/57 CSI 0.000% USD 550,000 (99,183) (156,166) 56,983CMBX.NA.BB.8 . . . . . . . . . . . . . . . . . . . . . . . . 5.000% Monthly 10/17/57 GSI 0.000% USD 241,000 (43,460) (59,417) 15,957CMBX.NA.BB.8 . . . . . . . . . . . . . . . . . . . . . . . . 5.000% Monthly 10/17/57 GSI 0.000% USD 580,000 (104,593) (181,510) 76,917CMBX.NA.BB.8 . . . . . . . . . . . . . . . . . . . . . . . . 5.000% Monthly 10/17/57 MSIP 0.000% USD 1,289,000 (232,450) (365,997) 133,547CMBX.NA.BBB-.6 . . . . . . . . . . . . . . . . . . . . . . . 3.000% Monthly 05/11/63 CSI 0.000% USD 185,000 (21,817) (26,509) 4,692CMBX.NA.BBB-.6 . . . . . . . . . . . . . . . . . . . . . . . 3.000% Monthly 05/11/63 DBAG 0.000% USD 170,000 (20,048) (25,789) 5,741CMBX.NA.BBB-.6 . . . . . . . . . . . . . . . . . . . . . . . 3.000% Monthly 05/11/63 GSI 0.000% USD 660,000 (77,835) (74,951) (2,884)CMBX.NA.BBB-.6 . . . . . . . . . . . . . . . . . . . . . . . 3.000% Monthly 05/11/63 MSIP 0.000% USD 90,000 (10,614) (8,031) (2,583)CMBX.NA.BBB-.6 . . . . . . . . . . . . . . . . . . . . . . . 3.000% Monthly 05/11/63 MSIP 0.000% USD 830,000 (97,883) (124,759) 26,876PRIMEX.ARM.2 . . . . . . . . . . . . . . . . . . . . . . . . 4.580% Monthly 12/25/37 JPMC 0.000% USD 339,954 — 10,208 (10,208)
Totals . . . . . . . . . . . . . . . . . . . . . . . . . . . . . . . . . . . . . . . . . . . . . . . . . . . . . . . . . . . . . . . . . . . . . . . . . . . . . . . . . . . . . . . . . . . . . . . . $(1,584,173) $(1,752,019) $167,846
(a) If the Portfolio is a buyer of protection and a credit event occurs, as defined under the terms of that particular swap agreement, the Portfolio will either (i) receive from the seller of protection anamount equal to the notional amount of the swap and deliver the referenced obligation or underlying securities comprising the referenced index or (ii) receive a net settlement amount in the form ofcash or securities equal to the notional amount of the swap less the recovery value of the referenced obligation or underlying securities comprising the referenced index.
(b) Implied credit spreads, represented in absolute terms, utilized in determining the market value of credit default swap agreements on corporate issues or indices as of period end serve as an indicatorof the current status of the payment/performance risk and represent the likelihood or risk of default for the credit derivative. The implied credit spread of a particular referenced entity reflects thecost of buying/selling protection and may include upfront payments required to be made to enter into the agreement. Wider credit spreads represent a deterioration of the referenced entity’s creditsoundness and a greater likelihood or risk of default or other credit event occurring as defined under the terms of the agreement. A credit spread identified as “Defaulted” indicates a credit eventhas occurred for the referenced entity or obligation.
BHFTII-127
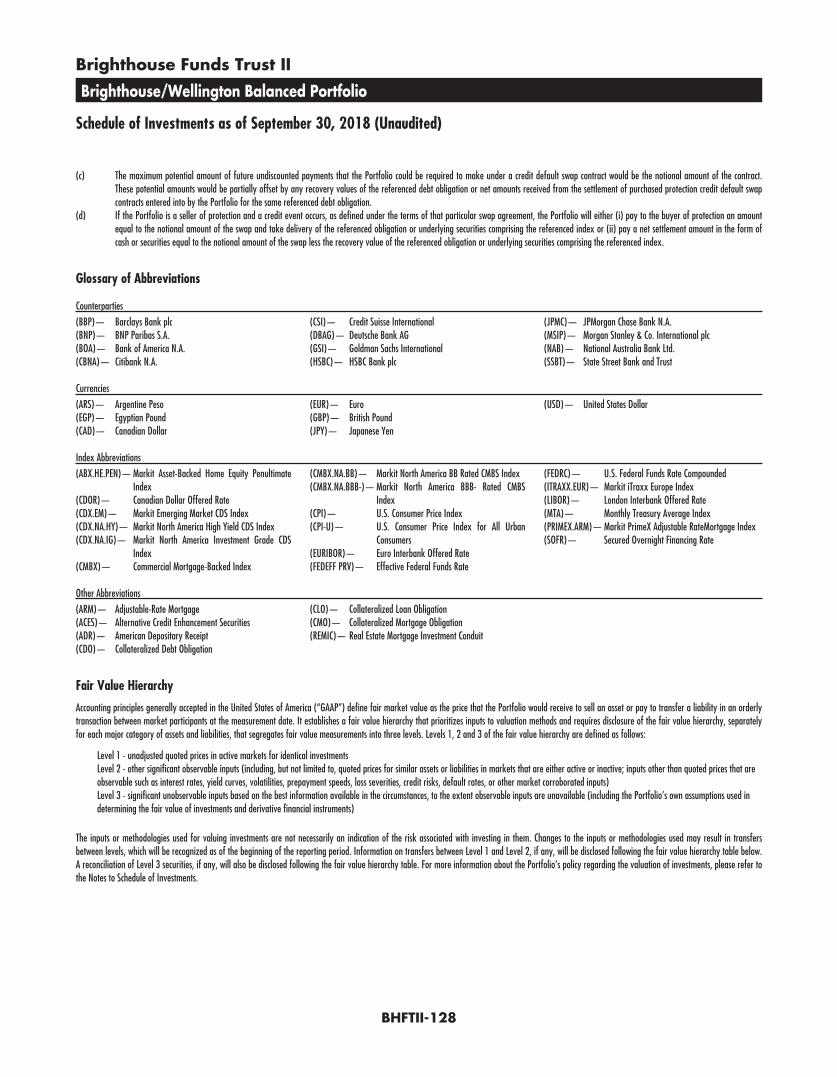
Brighthouse Funds Trust II
Brighthouse/Wellington Balanced Portfolio
Schedule of Investments as of September 30, 2018 (Unaudited)
(c) The maximum potential amount of future undiscounted payments that the Portfolio could be required to make under a credit default swap contract would be the notional amount of the contract.These potential amounts would be partially offset by any recovery values of the referenced debt obligation or net amounts received from the settlement of purchased protection credit default swapcontracts entered into by the Portfolio for the same referenced debt obligation.
(d) If the Portfolio is a seller of protection and a credit event occurs, as defined under the terms of that particular swap agreement, the Portfolio will either (i) pay to the buyer of protection an amountequal to the notional amount of the swap and take delivery of the referenced obligation or underlying securities comprising the referenced index or (ii) pay a net settlement amount in the form ofcash or securities equal to the notional amount of the swap less the recovery value of the referenced obligation or underlying securities comprising the referenced index.
Glossary of Abbreviations
Counterparties
(BBP)— Barclays Bank plc(BNP)— BNP Paribas S.A.(BOA)— Bank of America N.A.(CBNA)— Citibank N.A.
(CSI)— Credit Suisse International(DBAG)— Deutsche Bank AG(GSI)— Goldman Sachs International(HSBC)— HSBC Bank plc
(JPMC)— JPMorgan Chase Bank N.A.(MSIP)— Morgan Stanley & Co. International plc(NAB)— National Australia Bank Ltd.(SSBT)— State Street Bank and Trust
Currencies
(ARS)— Argentine Peso(EGP)— Egyptian Pound(CAD)— Canadian Dollar
(EUR)— Euro(GBP)— British Pound(JPY)— Japanese Yen
(USD)— United States Dollar
Index Abbreviations
(ABX.HE.PEN)— Markit Asset-Backed Home Equity PenultimateIndex
(CDOR)— Canadian Dollar Offered Rate(CDX.EM)— Markit Emerging Market CDS Index(CDX.NA.HY)— Markit North America High Yield CDS Index(CDX.NA.IG)— Markit North America Investment Grade CDS
Index(CMBX)— Commercial Mortgage-Backed Index
(CMBX.NA.BB)— Markit North America BB Rated CMBS Index(CMBX.NA.BBB-)— Markit North America BBB- Rated CMBS
Index(CPI)— U.S. Consumer Price Index(CPI-U)— U.S. Consumer Price Index for All Urban
Consumers(EURIBOR)— Euro Interbank Offered Rate(FEDEFF PRV)— Effective Federal Funds Rate
(FEDRC)— U.S. Federal Funds Rate Compounded(ITRAXX.EUR)— Markit iTraxx Europe Index(LIBOR)— London Interbank Offered Rate(MTA)— Monthly Treasury Average Index(PRIMEX.ARM)— Markit PrimeX Adjustable RateMortgage Index(SOFR)— Secured Overnight Financing Rate
Other Abbreviations
(ARM)— Adjustable-Rate Mortgage(ACES)— Alternative Credit Enhancement Securities(ADR)— American Depositary Receipt(CDO)— Collateralized Debt Obligation
(CLO)— Collateralized Loan Obligation(CMO)— Collateralized Mortgage Obligation(REMIC)— Real Estate Mortgage Investment Conduit
Fair Value Hierarchy
Accounting principles generally accepted in the United States of America (“GAAP”) define fair market value as the price that the Portfolio would receive to sell an asset or pay to transfer a liability in an orderlytransaction between market participants at the measurement date. It establishes a fair value hierarchy that prioritizes inputs to valuation methods and requires disclosure of the fair value hierarchy, separatelyfor each major category of assets and liabilities, that segregates fair value measurements into three levels. Levels 1, 2 and 3 of the fair value hierarchy are defined as follows:
Level 1 - unadjusted quoted prices in active markets for identical investmentsLevel 2 - other significant observable inputs (including, but not limited to, quoted prices for similar assets or liabilities in markets that are either active or inactive; inputs other than quoted prices that areobservable such as interest rates, yield curves, volatilities, prepayment speeds, loss severities, credit risks, default rates, or other market corroborated inputs)Level 3 - significant unobservable inputs based on the best information available in the circumstances, to the extent observable inputs are unavailable (including the Portfolio’s own assumptions used indetermining the fair value of investments and derivative financial instruments)
The inputs or methodologies used for valuing investments are not necessarily an indication of the risk associated with investing in them. Changes to the inputs or methodologies used may result in transfersbetween levels, which will be recognized as of the beginning of the reporting period. Information on transfers between Level 1 and Level 2, if any, will be disclosed following the fair value hierarchy table below.A reconciliation of Level 3 securities, if any, will also be disclosed following the fair value hierarchy table. For more information about the Portfolio’s policy regarding the valuation of investments, please refer tothe Notes to Schedule of Investments.
BHFTII-128
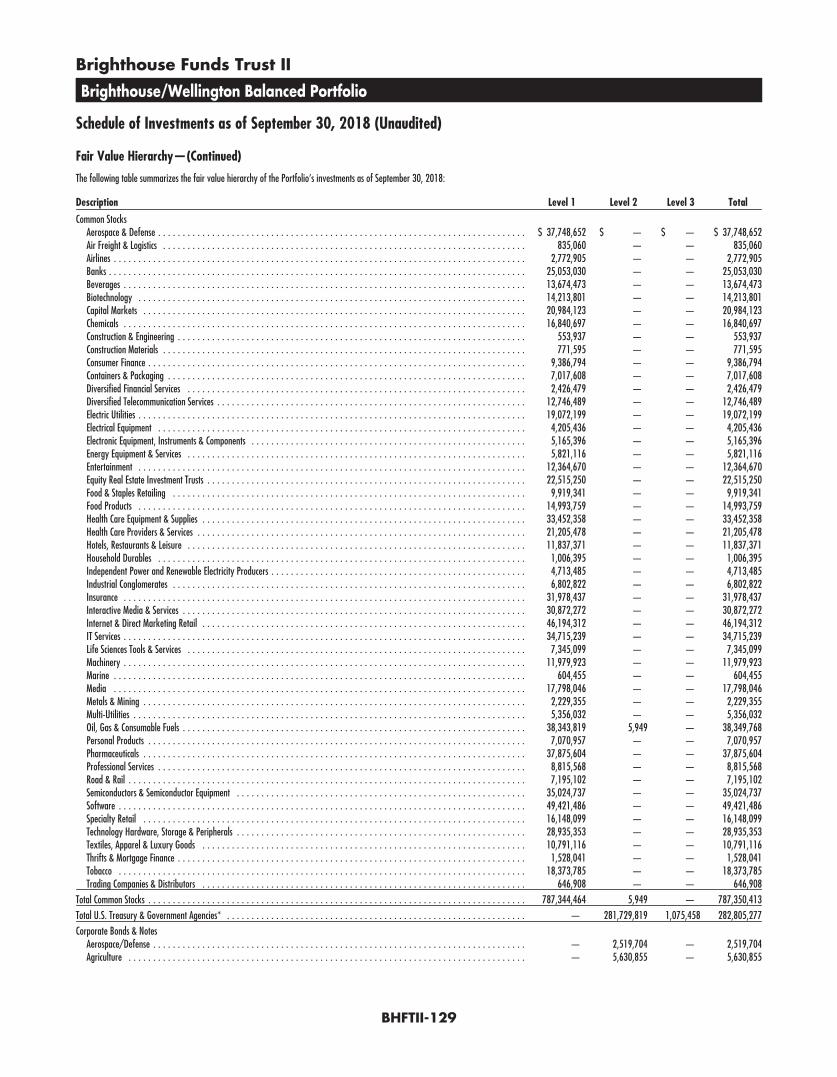
Brighthouse Funds Trust II
Brighthouse/Wellington Balanced Portfolio
Schedule of Investments as of September 30, 2018 (Unaudited)
Fair Value Hierarchy—(Continued)
The following table summarizes the fair value hierarchy of the Portfolio’s investments as of September 30, 2018:
Description Level 1 Level 2 Level 3 Total
Common StocksAerospace & Defense . . . . . . . . . . . . . . . . . . . . . . . . . . . . . . . . . . . . . . . . . . . . . . . . . . . . . . . . . . . . . . . . . . . . . . . . . . . $ 37,748,652 $ — $ — $ 37,748,652Air Freight & Logistics . . . . . . . . . . . . . . . . . . . . . . . . . . . . . . . . . . . . . . . . . . . . . . . . . . . . . . . . . . . . . . . . . . . . . . . . . . 835,060 — — 835,060Airlines . . . . . . . . . . . . . . . . . . . . . . . . . . . . . . . . . . . . . . . . . . . . . . . . . . . . . . . . . . . . . . . . . . . . . . . . . . . . . . . . . . . . 2,772,905 — — 2,772,905Banks . . . . . . . . . . . . . . . . . . . . . . . . . . . . . . . . . . . . . . . . . . . . . . . . . . . . . . . . . . . . . . . . . . . . . . . . . . . . . . . . . . . . . 25,053,030 — — 25,053,030Beverages . . . . . . . . . . . . . . . . . . . . . . . . . . . . . . . . . . . . . . . . . . . . . . . . . . . . . . . . . . . . . . . . . . . . . . . . . . . . . . . . . . 13,674,473 — — 13,674,473Biotechnology . . . . . . . . . . . . . . . . . . . . . . . . . . . . . . . . . . . . . . . . . . . . . . . . . . . . . . . . . . . . . . . . . . . . . . . . . . . . . . . 14,213,801 — — 14,213,801Capital Markets . . . . . . . . . . . . . . . . . . . . . . . . . . . . . . . . . . . . . . . . . . . . . . . . . . . . . . . . . . . . . . . . . . . . . . . . . . . . . . 20,984,123 — — 20,984,123Chemicals . . . . . . . . . . . . . . . . . . . . . . . . . . . . . . . . . . . . . . . . . . . . . . . . . . . . . . . . . . . . . . . . . . . . . . . . . . . . . . . . . . 16,840,697 — — 16,840,697Construction & Engineering . . . . . . . . . . . . . . . . . . . . . . . . . . . . . . . . . . . . . . . . . . . . . . . . . . . . . . . . . . . . . . . . . . . . . . . 553,937 — — 553,937Construction Materials . . . . . . . . . . . . . . . . . . . . . . . . . . . . . . . . . . . . . . . . . . . . . . . . . . . . . . . . . . . . . . . . . . . . . . . . . . 771,595 — — 771,595Consumer Finance . . . . . . . . . . . . . . . . . . . . . . . . . . . . . . . . . . . . . . . . . . . . . . . . . . . . . . . . . . . . . . . . . . . . . . . . . . . . . 9,386,794 — — 9,386,794Containers & Packaging . . . . . . . . . . . . . . . . . . . . . . . . . . . . . . . . . . . . . . . . . . . . . . . . . . . . . . . . . . . . . . . . . . . . . . . . . 7,017,608 — — 7,017,608Diversified Financial Services . . . . . . . . . . . . . . . . . . . . . . . . . . . . . . . . . . . . . . . . . . . . . . . . . . . . . . . . . . . . . . . . . . . . . 2,426,479 — — 2,426,479Diversified Telecommunication Services . . . . . . . . . . . . . . . . . . . . . . . . . . . . . . . . . . . . . . . . . . . . . . . . . . . . . . . . . . . . . . . 12,746,489 — — 12,746,489Electric Utilities . . . . . . . . . . . . . . . . . . . . . . . . . . . . . . . . . . . . . . . . . . . . . . . . . . . . . . . . . . . . . . . . . . . . . . . . . . . . . . . 19,072,199 — — 19,072,199Electrical Equipment . . . . . . . . . . . . . . . . . . . . . . . . . . . . . . . . . . . . . . . . . . . . . . . . . . . . . . . . . . . . . . . . . . . . . . . . . . . 4,205,436 — — 4,205,436Electronic Equipment, Instruments & Components . . . . . . . . . . . . . . . . . . . . . . . . . . . . . . . . . . . . . . . . . . . . . . . . . . . . . . . . 5,165,396 — — 5,165,396Energy Equipment & Services . . . . . . . . . . . . . . . . . . . . . . . . . . . . . . . . . . . . . . . . . . . . . . . . . . . . . . . . . . . . . . . . . . . . . 5,821,116 — — 5,821,116Entertainment . . . . . . . . . . . . . . . . . . . . . . . . . . . . . . . . . . . . . . . . . . . . . . . . . . . . . . . . . . . . . . . . . . . . . . . . . . . . . . . 12,364,670 — — 12,364,670Equity Real Estate Investment Trusts . . . . . . . . . . . . . . . . . . . . . . . . . . . . . . . . . . . . . . . . . . . . . . . . . . . . . . . . . . . . . . . . . 22,515,250 — — 22,515,250Food & Staples Retailing . . . . . . . . . . . . . . . . . . . . . . . . . . . . . . . . . . . . . . . . . . . . . . . . . . . . . . . . . . . . . . . . . . . . . . . . 9,919,341 — — 9,919,341Food Products . . . . . . . . . . . . . . . . . . . . . . . . . . . . . . . . . . . . . . . . . . . . . . . . . . . . . . . . . . . . . . . . . . . . . . . . . . . . . . . 14,993,759 — — 14,993,759Health Care Equipment & Supplies . . . . . . . . . . . . . . . . . . . . . . . . . . . . . . . . . . . . . . . . . . . . . . . . . . . . . . . . . . . . . . . . . . 33,452,358 — — 33,452,358Health Care Providers & Services . . . . . . . . . . . . . . . . . . . . . . . . . . . . . . . . . . . . . . . . . . . . . . . . . . . . . . . . . . . . . . . . . . . 21,205,478 — — 21,205,478Hotels, Restaurants & Leisure . . . . . . . . . . . . . . . . . . . . . . . . . . . . . . . . . . . . . . . . . . . . . . . . . . . . . . . . . . . . . . . . . . . . . 11,837,371 — — 11,837,371Household Durables . . . . . . . . . . . . . . . . . . . . . . . . . . . . . . . . . . . . . . . . . . . . . . . . . . . . . . . . . . . . . . . . . . . . . . . . . . . 1,006,395 — — 1,006,395Independent Power and Renewable Electricity Producers . . . . . . . . . . . . . . . . . . . . . . . . . . . . . . . . . . . . . . . . . . . . . . . . . . . . 4,713,485 — — 4,713,485Industrial Conglomerates . . . . . . . . . . . . . . . . . . . . . . . . . . . . . . . . . . . . . . . . . . . . . . . . . . . . . . . . . . . . . . . . . . . . . . . . 6,802,822 — — 6,802,822Insurance . . . . . . . . . . . . . . . . . . . . . . . . . . . . . . . . . . . . . . . . . . . . . . . . . . . . . . . . . . . . . . . . . . . . . . . . . . . . . . . . . . 31,978,437 — — 31,978,437Interactive Media & Services . . . . . . . . . . . . . . . . . . . . . . . . . . . . . . . . . . . . . . . . . . . . . . . . . . . . . . . . . . . . . . . . . . . . . . 30,872,272 — — 30,872,272Internet & Direct Marketing Retail . . . . . . . . . . . . . . . . . . . . . . . . . . . . . . . . . . . . . . . . . . . . . . . . . . . . . . . . . . . . . . . . . . 46,194,312 — — 46,194,312IT Services . . . . . . . . . . . . . . . . . . . . . . . . . . . . . . . . . . . . . . . . . . . . . . . . . . . . . . . . . . . . . . . . . . . . . . . . . . . . . . . . . . 34,715,239 — — 34,715,239Life Sciences Tools & Services . . . . . . . . . . . . . . . . . . . . . . . . . . . . . . . . . . . . . . . . . . . . . . . . . . . . . . . . . . . . . . . . . . . . . 7,345,099 — — 7,345,099Machinery . . . . . . . . . . . . . . . . . . . . . . . . . . . . . . . . . . . . . . . . . . . . . . . . . . . . . . . . . . . . . . . . . . . . . . . . . . . . . . . . . . 11,979,923 — — 11,979,923Marine . . . . . . . . . . . . . . . . . . . . . . . . . . . . . . . . . . . . . . . . . . . . . . . . . . . . . . . . . . . . . . . . . . . . . . . . . . . . . . . . . . . . 604,455 — — 604,455Media . . . . . . . . . . . . . . . . . . . . . . . . . . . . . . . . . . . . . . . . . . . . . . . . . . . . . . . . . . . . . . . . . . . . . . . . . . . . . . . . . . . . 17,798,046 — — 17,798,046Metals & Mining . . . . . . . . . . . . . . . . . . . . . . . . . . . . . . . . . . . . . . . . . . . . . . . . . . . . . . . . . . . . . . . . . . . . . . . . . . . . . . 2,229,355 — — 2,229,355Multi-Utilities . . . . . . . . . . . . . . . . . . . . . . . . . . . . . . . . . . . . . . . . . . . . . . . . . . . . . . . . . . . . . . . . . . . . . . . . . . . . . . . . 5,356,032 — — 5,356,032Oil, Gas & Consumable Fuels . . . . . . . . . . . . . . . . . . . . . . . . . . . . . . . . . . . . . . . . . . . . . . . . . . . . . . . . . . . . . . . . . . . . . . 38,343,819 5,949 — 38,349,768Personal Products . . . . . . . . . . . . . . . . . . . . . . . . . . . . . . . . . . . . . . . . . . . . . . . . . . . . . . . . . . . . . . . . . . . . . . . . . . . . . 7,070,957 — — 7,070,957Pharmaceuticals . . . . . . . . . . . . . . . . . . . . . . . . . . . . . . . . . . . . . . . . . . . . . . . . . . . . . . . . . . . . . . . . . . . . . . . . . . . . . . 37,875,604 — — 37,875,604Professional Services . . . . . . . . . . . . . . . . . . . . . . . . . . . . . . . . . . . . . . . . . . . . . . . . . . . . . . . . . . . . . . . . . . . . . . . . . . . 8,815,568 — — 8,815,568Road & Rail . . . . . . . . . . . . . . . . . . . . . . . . . . . . . . . . . . . . . . . . . . . . . . . . . . . . . . . . . . . . . . . . . . . . . . . . . . . . . . . . . 7,195,102 — — 7,195,102Semiconductors & Semiconductor Equipment . . . . . . . . . . . . . . . . . . . . . . . . . . . . . . . . . . . . . . . . . . . . . . . . . . . . . . . . . . . 35,024,737 — — 35,024,737Software . . . . . . . . . . . . . . . . . . . . . . . . . . . . . . . . . . . . . . . . . . . . . . . . . . . . . . . . . . . . . . . . . . . . . . . . . . . . . . . . . . . 49,421,486 — — 49,421,486Specialty Retail . . . . . . . . . . . . . . . . . . . . . . . . . . . . . . . . . . . . . . . . . . . . . . . . . . . . . . . . . . . . . . . . . . . . . . . . . . . . . . 16,148,099 — — 16,148,099Technology Hardware, Storage & Peripherals . . . . . . . . . . . . . . . . . . . . . . . . . . . . . . . . . . . . . . . . . . . . . . . . . . . . . . . . . . . 28,935,353 — — 28,935,353Textiles, Apparel & Luxury Goods . . . . . . . . . . . . . . . . . . . . . . . . . . . . . . . . . . . . . . . . . . . . . . . . . . . . . . . . . . . . . . . . . . 10,791,116 — — 10,791,116Thrifts & Mortgage Finance . . . . . . . . . . . . . . . . . . . . . . . . . . . . . . . . . . . . . . . . . . . . . . . . . . . . . . . . . . . . . . . . . . . . . . . 1,528,041 — — 1,528,041Tobacco . . . . . . . . . . . . . . . . . . . . . . . . . . . . . . . . . . . . . . . . . . . . . . . . . . . . . . . . . . . . . . . . . . . . . . . . . . . . . . . . . . . 18,373,785 — — 18,373,785Trading Companies & Distributors . . . . . . . . . . . . . . . . . . . . . . . . . . . . . . . . . . . . . . . . . . . . . . . . . . . . . . . . . . . . . . . . . . 646,908 — — 646,908
Total Common Stocks . . . . . . . . . . . . . . . . . . . . . . . . . . . . . . . . . . . . . . . . . . . . . . . . . . . . . . . . . . . . . . . . . . . . . . . . . . . . . 787,344,464 5,949 — 787,350,413Total U.S. Treasury & Government Agencies* . . . . . . . . . . . . . . . . . . . . . . . . . . . . . . . . . . . . . . . . . . . . . . . . . . . . . . . . . . . . . — 281,729,819 1,075,458 282,805,277Corporate Bonds & Notes
Aerospace/Defense . . . . . . . . . . . . . . . . . . . . . . . . . . . . . . . . . . . . . . . . . . . . . . . . . . . . . . . . . . . . . . . . . . . . . . . . . . . . — 2,519,704 — 2,519,704Agriculture . . . . . . . . . . . . . . . . . . . . . . . . . . . . . . . . . . . . . . . . . . . . . . . . . . . . . . . . . . . . . . . . . . . . . . . . . . . . . . . . . — 5,630,855 — 5,630,855
BHFTII-129

Brighthouse Funds Trust II
Brighthouse/Wellington Balanced Portfolio
Schedule of Investments as of September 30, 2018 (Unaudited)
Fair Value Hierarchy—(Continued)Description Level 1 Level 2 Level 3 Total
Airlines . . . . . . . . . . . . . . . . . . . . . . . . . . . . . . . . . . . . . . . . . . . . . . . . . . . . . . . . . . . . . . . . . . . . . . . . . . . . . . . . . . $ — $ 456,936 $ — $ 456,936Auto Manufacturers . . . . . . . . . . . . . . . . . . . . . . . . . . . . . . . . . . . . . . . . . . . . . . . . . . . . . . . . . . . . . . . . . . . . . . . . . . — 3,208,066 — 3,208,066Auto Parts & Equipment . . . . . . . . . . . . . . . . . . . . . . . . . . . . . . . . . . . . . . . . . . . . . . . . . . . . . . . . . . . . . . . . . . . . . . . — 56,415 — 56,415Banks . . . . . . . . . . . . . . . . . . . . . . . . . . . . . . . . . . . . . . . . . . . . . . . . . . . . . . . . . . . . . . . . . . . . . . . . . . . . . . . . . . . — 44,189,163 — 44,189,163Beverages . . . . . . . . . . . . . . . . . . . . . . . . . . . . . . . . . . . . . . . . . . . . . . . . . . . . . . . . . . . . . . . . . . . . . . . . . . . . . . . . — 3,361,420 — 3,361,420Biotechnology . . . . . . . . . . . . . . . . . . . . . . . . . . . . . . . . . . . . . . . . . . . . . . . . . . . . . . . . . . . . . . . . . . . . . . . . . . . . . . — 1,670,570 — 1,670,570Building Materials . . . . . . . . . . . . . . . . . . . . . . . . . . . . . . . . . . . . . . . . . . . . . . . . . . . . . . . . . . . . . . . . . . . . . . . . . . . — 234,363 — 234,363Chemicals . . . . . . . . . . . . . . . . . . . . . . . . . . . . . . . . . . . . . . . . . . . . . . . . . . . . . . . . . . . . . . . . . . . . . . . . . . . . . . . . . — 2,468,821 — 2,468,821Commercial Services . . . . . . . . . . . . . . . . . . . . . . . . . . . . . . . . . . . . . . . . . . . . . . . . . . . . . . . . . . . . . . . . . . . . . . . . . . — 2,716,255 — 2,716,255Computers . . . . . . . . . . . . . . . . . . . . . . . . . . . . . . . . . . . . . . . . . . . . . . . . . . . . . . . . . . . . . . . . . . . . . . . . . . . . . . . . — 1,229,862 — 1,229,862Diversified Financial Services . . . . . . . . . . . . . . . . . . . . . . . . . . . . . . . . . . . . . . . . . . . . . . . . . . . . . . . . . . . . . . . . . . . . — 2,201,162 — 2,201,162Electric . . . . . . . . . . . . . . . . . . . . . . . . . . . . . . . . . . . . . . . . . . . . . . . . . . . . . . . . . . . . . . . . . . . . . . . . . . . . . . . . . . . — 8,170,371 — 8,170,371Electronics . . . . . . . . . . . . . . . . . . . . . . . . . . . . . . . . . . . . . . . . . . . . . . . . . . . . . . . . . . . . . . . . . . . . . . . . . . . . . . . . — 386,276 — 386,276Engineering & Construction . . . . . . . . . . . . . . . . . . . . . . . . . . . . . . . . . . . . . . . . . . . . . . . . . . . . . . . . . . . . . . . . . . . . . — 1,736,375 — 1,736,375Entertainment . . . . . . . . . . . . . . . . . . . . . . . . . . . . . . . . . . . . . . . . . . . . . . . . . . . . . . . . . . . . . . . . . . . . . . . . . . . . . . — 508,397 — 508,397Food . . . . . . . . . . . . . . . . . . . . . . . . . . . . . . . . . . . . . . . . . . . . . . . . . . . . . . . . . . . . . . . . . . . . . . . . . . . . . . . . . . . . — 1,343,229 — 1,343,229Food Service . . . . . . . . . . . . . . . . . . . . . . . . . . . . . . . . . . . . . . . . . . . . . . . . . . . . . . . . . . . . . . . . . . . . . . . . . . . . . . . — 122,500 — 122,500Forest Products & Paper . . . . . . . . . . . . . . . . . . . . . . . . . . . . . . . . . . . . . . . . . . . . . . . . . . . . . . . . . . . . . . . . . . . . . . . — 200,800 — 200,800Gas . . . . . . . . . . . . . . . . . . . . . . . . . . . . . . . . . . . . . . . . . . . . . . . . . . . . . . . . . . . . . . . . . . . . . . . . . . . . . . . . . . . . . — 94,288 — 94,288Healthcare - Products . . . . . . . . . . . . . . . . . . . . . . . . . . . . . . . . . . . . . . . . . . . . . . . . . . . . . . . . . . . . . . . . . . . . . . . . . — 2,092,418 — 2,092,418Healthcare - Services . . . . . . . . . . . . . . . . . . . . . . . . . . . . . . . . . . . . . . . . . . . . . . . . . . . . . . . . . . . . . . . . . . . . . . . . . — 6,313,292 — 6,313,292Home Builders . . . . . . . . . . . . . . . . . . . . . . . . . . . . . . . . . . . . . . . . . . . . . . . . . . . . . . . . . . . . . . . . . . . . . . . . . . . . . . — 307,738 — 307,738Insurance . . . . . . . . . . . . . . . . . . . . . . . . . . . . . . . . . . . . . . . . . . . . . . . . . . . . . . . . . . . . . . . . . . . . . . . . . . . . . . . . . — 5,610,071 — 5,610,071Internet . . . . . . . . . . . . . . . . . . . . . . . . . . . . . . . . . . . . . . . . . . . . . . . . . . . . . . . . . . . . . . . . . . . . . . . . . . . . . . . . . . — 2,422,781 — 2,422,781Iron/Steel . . . . . . . . . . . . . . . . . . . . . . . . . . . . . . . . . . . . . . . . . . . . . . . . . . . . . . . . . . . . . . . . . . . . . . . . . . . . . . . . — 1,414,342 — 1,414,342Leisure Time . . . . . . . . . . . . . . . . . . . . . . . . . . . . . . . . . . . . . . . . . . . . . . . . . . . . . . . . . . . . . . . . . . . . . . . . . . . . . . . — 28,831 — 28,831Machinery - Construction & Mining . . . . . . . . . . . . . . . . . . . . . . . . . . . . . . . . . . . . . . . . . . . . . . . . . . . . . . . . . . . . . . . . — 107,363 — 107,363Media . . . . . . . . . . . . . . . . . . . . . . . . . . . . . . . . . . . . . . . . . . . . . . . . . . . . . . . . . . . . . . . . . . . . . . . . . . . . . . . . . . . — 8,702,397 — 8,702,397Mining . . . . . . . . . . . . . . . . . . . . . . . . . . . . . . . . . . . . . . . . . . . . . . . . . . . . . . . . . . . . . . . . . . . . . . . . . . . . . . . . . . . — 1,243,470 — 1,243,470Miscellaneous Manufacturing . . . . . . . . . . . . . . . . . . . . . . . . . . . . . . . . . . . . . . . . . . . . . . . . . . . . . . . . . . . . . . . . . . . . — 271,764 — 271,764Office/Business Equipment . . . . . . . . . . . . . . . . . . . . . . . . . . . . . . . . . . . . . . . . . . . . . . . . . . . . . . . . . . . . . . . . . . . . . — 367,644 — 367,644Oil & Gas . . . . . . . . . . . . . . . . . . . . . . . . . . . . . . . . . . . . . . . . . . . . . . . . . . . . . . . . . . . . . . . . . . . . . . . . . . . . . . . . . — 4,850,106 — 4,850,106Packaging & Containers . . . . . . . . . . . . . . . . . . . . . . . . . . . . . . . . . . . . . . . . . . . . . . . . . . . . . . . . . . . . . . . . . . . . . . . — 228,900 — 228,900Pharmaceuticals . . . . . . . . . . . . . . . . . . . . . . . . . . . . . . . . . . . . . . . . . . . . . . . . . . . . . . . . . . . . . . . . . . . . . . . . . . . . . — 10,193,979 — 10,193,979Pipelines . . . . . . . . . . . . . . . . . . . . . . . . . . . . . . . . . . . . . . . . . . . . . . . . . . . . . . . . . . . . . . . . . . . . . . . . . . . . . . . . . — 4,017,067 — 4,017,067Real Estate Investment Trusts . . . . . . . . . . . . . . . . . . . . . . . . . . . . . . . . . . . . . . . . . . . . . . . . . . . . . . . . . . . . . . . . . . . . — 609,242 — 609,242Retail . . . . . . . . . . . . . . . . . . . . . . . . . . . . . . . . . . . . . . . . . . . . . . . . . . . . . . . . . . . . . . . . . . . . . . . . . . . . . . . . . . . — 2,290,259 — 2,290,259Semiconductors . . . . . . . . . . . . . . . . . . . . . . . . . . . . . . . . . . . . . . . . . . . . . . . . . . . . . . . . . . . . . . . . . . . . . . . . . . . . . — 2,899,020 — 2,899,020Software . . . . . . . . . . . . . . . . . . . . . . . . . . . . . . . . . . . . . . . . . . . . . . . . . . . . . . . . . . . . . . . . . . . . . . . . . . . . . . . . . — 1,896,112 — 1,896,112Telecommunications . . . . . . . . . . . . . . . . . . . . . . . . . . . . . . . . . . . . . . . . . . . . . . . . . . . . . . . . . . . . . . . . . . . . . . . . . . — 8,464,945 — 8,464,945Transportation . . . . . . . . . . . . . . . . . . . . . . . . . . . . . . . . . . . . . . . . . . . . . . . . . . . . . . . . . . . . . . . . . . . . . . . . . . . . . . — 1,631,553 — 1,631,553Trucking & Leasing . . . . . . . . . . . . . . . . . . . . . . . . . . . . . . . . . . . . . . . . . . . . . . . . . . . . . . . . . . . . . . . . . . . . . . . . . . . — 29,306 — 29,306
Total Corporate Bonds & Notes . . . . . . . . . . . . . . . . . . . . . . . . . . . . . . . . . . . . . . . . . . . . . . . . . . . . . . . . . . . . . . . . . . . . . — 148,498,428 — 148,498,428Total Asset-Backed Securities* . . . . . . . . . . . . . . . . . . . . . . . . . . . . . . . . . . . . . . . . . . . . . . . . . . . . . . . . . . . . . . . . . . . . . . — 105,458,902 — 105,458,902Total Mortgage-Backed Securities* . . . . . . . . . . . . . . . . . . . . . . . . . . . . . . . . . . . . . . . . . . . . . . . . . . . . . . . . . . . . . . . . . . . — 50,184,081 — 50,184,081Floating Rate Loans
Aerospace/Defense . . . . . . . . . . . . . . . . . . . . . . . . . . . . . . . . . . . . . . . . . . . . . . . . . . . . . . . . . . . . . . . . . . . . . . . . . . — 150,843 — 150,843Auto Manufacturers . . . . . . . . . . . . . . . . . . . . . . . . . . . . . . . . . . . . . . . . . . . . . . . . . . . . . . . . . . . . . . . . . . . . . . . . . . — 100,058 — 100,058Building Materials . . . . . . . . . . . . . . . . . . . . . . . . . . . . . . . . . . . . . . . . . . . . . . . . . . . . . . . . . . . . . . . . . . . . . . . . . . . — 225,886 — 225,886Chemicals . . . . . . . . . . . . . . . . . . . . . . . . . . . . . . . . . . . . . . . . . . . . . . . . . . . . . . . . . . . . . . . . . . . . . . . . . . . . . . . . . — 188,231 — 188,231Commercial Services . . . . . . . . . . . . . . . . . . . . . . . . . . . . . . . . . . . . . . . . . . . . . . . . . . . . . . . . . . . . . . . . . . . . . . . . . . — 1,476,319 — 1,476,319Computers . . . . . . . . . . . . . . . . . . . . . . . . . . . . . . . . . . . . . . . . . . . . . . . . . . . . . . . . . . . . . . . . . . . . . . . . . . . . . . . . — 208,386 — 208,386Cosmetics/Personal Care . . . . . . . . . . . . . . . . . . . . . . . . . . . . . . . . . . . . . . . . . . . . . . . . . . . . . . . . . . . . . . . . . . . . . . . — 371,202 — 371,202Diversified Financial Services . . . . . . . . . . . . . . . . . . . . . . . . . . . . . . . . . . . . . . . . . . . . . . . . . . . . . . . . . . . . . . . . . . . . — 178,297 — 178,297Energy Equipment & Services . . . . . . . . . . . . . . . . . . . . . . . . . . . . . . . . . . . . . . . . . . . . . . . . . . . . . . . . . . . . . . . . . . . . — 98,874 — 98,874Entertainment . . . . . . . . . . . . . . . . . . . . . . . . . . . . . . . . . . . . . . . . . . . . . . . . . . . . . . . . . . . . . . . . . . . . . . . . . . . . . . — 169,775 — 169,775Food . . . . . . . . . . . . . . . . . . . . . . . . . . . . . . . . . . . . . . . . . . . . . . . . . . . . . . . . . . . . . . . . . . . . . . . . . . . . . . . . . . . . — 337,382 — 337,382Food Products . . . . . . . . . . . . . . . . . . . . . . . . . . . . . . . . . . . . . . . . . . . . . . . . . . . . . . . . . . . . . . . . . . . . . . . . . . . . . . — 108,351 — 108,351Healthcare-Products . . . . . . . . . . . . . . . . . . . . . . . . . . . . . . . . . . . . . . . . . . . . . . . . . . . . . . . . . . . . . . . . . . . . . . . . . . — 98,938 — 98,938
BHFTII-130

Brighthouse Funds Trust II
Brighthouse/Wellington Balanced Portfolio
Schedule of Investments as of September 30, 2018 (Unaudited)
Fair Value Hierarchy—(Continued)Description Level 1 Level 2 Level 3 Total
Healthcare-Services . . . . . . . . . . . . . . . . . . . . . . . . . . . . . . . . . . . . . . . . . . . . . . . . . . . . . . . . . . . . . . . . . . . . . . . . . . $ — $ 597,693 $ — $ 597,693Insurance . . . . . . . . . . . . . . . . . . . . . . . . . . . . . . . . . . . . . . . . . . . . . . . . . . . . . . . . . . . . . . . . . . . . . . . . . . . . . . . . . — 1,107,828 — 1,107,828Internet . . . . . . . . . . . . . . . . . . . . . . . . . . . . . . . . . . . . . . . . . . . . . . . . . . . . . . . . . . . . . . . . . . . . . . . . . . . . . . . . . . — 75,483 — 75,483Internet & Direct Marketing Retail . . . . . . . . . . . . . . . . . . . . . . . . . . . . . . . . . . . . . . . . . . . . . . . . . . . . . . . . . . . . . . . . . — 152,273 — 152,273IT Services . . . . . . . . . . . . . . . . . . . . . . . . . . . . . . . . . . . . . . . . . . . . . . . . . . . . . . . . . . . . . . . . . . . . . . . . . . . . . . . . — 100,509 — 100,509Leisure Time . . . . . . . . . . . . . . . . . . . . . . . . . . . . . . . . . . . . . . . . . . . . . . . . . . . . . . . . . . . . . . . . . . . . . . . . . . . . . . . — 332,627 — 332,627Life Sciences Tools & Services . . . . . . . . . . . . . . . . . . . . . . . . . . . . . . . . . . . . . . . . . . . . . . . . . . . . . . . . . . . . . . . . . . . . — 78,426 — 78,426Lodging . . . . . . . . . . . . . . . . . . . . . . . . . . . . . . . . . . . . . . . . . . . . . . . . . . . . . . . . . . . . . . . . . . . . . . . . . . . . . . . . . . — 488,750 — 488,750Machinery . . . . . . . . . . . . . . . . . . . . . . . . . . . . . . . . . . . . . . . . . . . . . . . . . . . . . . . . . . . . . . . . . . . . . . . . . . . . . . . . — 104,929 — 104,929Machinery-Construction & Mining . . . . . . . . . . . . . . . . . . . . . . . . . . . . . . . . . . . . . . . . . . . . . . . . . . . . . . . . . . . . . . . . . — 101,323 — 101,323Machinery-Diversified . . . . . . . . . . . . . . . . . . . . . . . . . . . . . . . . . . . . . . . . . . . . . . . . . . . . . . . . . . . . . . . . . . . . . . . . . — 194,842 — 194,842Media . . . . . . . . . . . . . . . . . . . . . . . . . . . . . . . . . . . . . . . . . . . . . . . . . . . . . . . . . . . . . . . . . . . . . . . . . . . . . . . . . . . — 317,576 — 317,576Miscellaneous Manufacturing . . . . . . . . . . . . . . . . . . . . . . . . . . . . . . . . . . . . . . . . . . . . . . . . . . . . . . . . . . . . . . . . . . . . — 116,184 — 116,184Office/Business Equipment . . . . . . . . . . . . . . . . . . . . . . . . . . . . . . . . . . . . . . . . . . . . . . . . . . . . . . . . . . . . . . . . . . . . . — 149,236 — 149,236Oil & Gas . . . . . . . . . . . . . . . . . . . . . . . . . . . . . . . . . . . . . . . . . . . . . . . . . . . . . . . . . . . . . . . . . . . . . . . . . . . . . . . . . — 586,252 — 586,252Packaging & Containers . . . . . . . . . . . . . . . . . . . . . . . . . . . . . . . . . . . . . . . . . . . . . . . . . . . . . . . . . . . . . . . . . . . . . . . — 527,002 — 527,002Pharmaceuticals . . . . . . . . . . . . . . . . . . . . . . . . . . . . . . . . . . . . . . . . . . . . . . . . . . . . . . . . . . . . . . . . . . . . . . . . . . . . . — 509,114 — 509,114Pipelines . . . . . . . . . . . . . . . . . . . . . . . . . . . . . . . . . . . . . . . . . . . . . . . . . . . . . . . . . . . . . . . . . . . . . . . . . . . . . . . . . — 278,060 — 278,060Real Estate Investment Trusts . . . . . . . . . . . . . . . . . . . . . . . . . . . . . . . . . . . . . . . . . . . . . . . . . . . . . . . . . . . . . . . . . . . . — 95,753 — 95,753Retail . . . . . . . . . . . . . . . . . . . . . . . . . . . . . . . . . . . . . . . . . . . . . . . . . . . . . . . . . . . . . . . . . . . . . . . . . . . . . . . . . . . — 602,536 249,197 851,733Semiconductors . . . . . . . . . . . . . . . . . . . . . . . . . . . . . . . . . . . . . . . . . . . . . . . . . . . . . . . . . . . . . . . . . . . . . . . . . . . . . — 116,529 — 116,529Semiconductors & Semiconductor Equipment . . . . . . . . . . . . . . . . . . . . . . . . . . . . . . . . . . . . . . . . . . . . . . . . . . . . . . . . . . — 91,270 — 91,270Software . . . . . . . . . . . . . . . . . . . . . . . . . . . . . . . . . . . . . . . . . . . . . . . . . . . . . . . . . . . . . . . . . . . . . . . . . . . . . . . . . — 802,936 — 802,936Telecommunications . . . . . . . . . . . . . . . . . . . . . . . . . . . . . . . . . . . . . . . . . . . . . . . . . . . . . . . . . . . . . . . . . . . . . . . . . . — 542,652 — 542,652Transportation . . . . . . . . . . . . . . . . . . . . . . . . . . . . . . . . . . . . . . . . . . . . . . . . . . . . . . . . . . . . . . . . . . . . . . . . . . . . . . — 100,170 — 100,170
Total Floating Rate Loans . . . . . . . . . . . . . . . . . . . . . . . . . . . . . . . . . . . . . . . . . . . . . . . . . . . . . . . . . . . . . . . . . . . . . . . . . — 11,882,495 249,197 12,131,692Total Foreign Government* . . . . . . . . . . . . . . . . . . . . . . . . . . . . . . . . . . . . . . . . . . . . . . . . . . . . . . . . . . . . . . . . . . . . . . . — 6,644,536 — 6,644,536Total Municipals . . . . . . . . . . . . . . . . . . . . . . . . . . . . . . . . . . . . . . . . . . . . . . . . . . . . . . . . . . . . . . . . . . . . . . . . . . . . . . . — 3,501,918 — 3,501,918Total Short-Term Investments* . . . . . . . . . . . . . . . . . . . . . . . . . . . . . . . . . . . . . . . . . . . . . . . . . . . . . . . . . . . . . . . . . . . . . — 24,687,957 — 24,687,957Total Securities Lending Reinvestments* . . . . . . . . . . . . . . . . . . . . . . . . . . . . . . . . . . . . . . . . . . . . . . . . . . . . . . . . . . . . . . . — 86,421,943 — 86,421,943Purchased Options at Value . . . . . . . . . . . . . . . . . . . . . . . . . . . . . . . . . . . . . . . . . . . . . . . . . . . . . . . . . . . . . . . . . . . . . . . $ — $ 1,180,668 $ — $ 1,180,668Total Investments . . . . . . . . . . . . . . . . . . . . . . . . . . . . . . . . . . . . . . . . . . . . . . . . . . . . . . . . . . . . . . . . . . . . . . . . . . . . . . $787,344,464 $720,196,696 $1,324,655 $1,508,865,815
Collateral for Securities Loaned (Liability) . . . . . . . . . . . . . . . . . . . . . . . . . . . . . . . . . . . . . . . . . . . . . . . . . . . . . . . . . . . . . . $ — $ (86,395,072) $ — $ (86,395,072)TBA Forward Sales Commitments . . . . . . . . . . . . . . . . . . . . . . . . . . . . . . . . . . . . . . . . . . . . . . . . . . . . . . . . . . . . . . . . . . . . $ — $ (40,831,377) $ — $ (40,831,377)Forward Contracts
Forward Foreign Currency Exchange Contracts (Unrealized Appreciation) . . . . . . . . . . . . . . . . . . . . . . . . . . . . . . . . . . . . . . . $ — $ 248,332 $ — $ 248,332Forward Foreign Currency Exchange Contracts (Unrealized Depreciation) . . . . . . . . . . . . . . . . . . . . . . . . . . . . . . . . . . . . . . . — (18,267) — (18,267)
Total Forward Contracts . . . . . . . . . . . . . . . . . . . . . . . . . . . . . . . . . . . . . . . . . . . . . . . . . . . . . . . . . . . . . . . . . . . . . . . . . . $ — $ 230,065 $ — $ 230,065Futures Contracts
Futures Contracts (Unrealized Appreciation) . . . . . . . . . . . . . . . . . . . . . . . . . . . . . . . . . . . . . . . . . . . . . . . . . . . . . . . . . . $ 70,579 $ — $ — $ 70,579Futures Contracts (Unrealized Depreciation) . . . . . . . . . . . . . . . . . . . . . . . . . . . . . . . . . . . . . . . . . . . . . . . . . . . . . . . . . . (1,056,712) — — (1,056,712)
Total Futures Contracts . . . . . . . . . . . . . . . . . . . . . . . . . . . . . . . . . . . . . . . . . . . . . . . . . . . . . . . . . . . . . . . . . . . . . . . . . . $ (986,133) $ — $ — $ (986,133)Centrally Cleared Swap Contracts
Centrally Cleared Swap Contracts (Unrealized Appreciation) . . . . . . . . . . . . . . . . . . . . . . . . . . . . . . . . . . . . . . . . . . . . . . . . $ — $ 1,285,986 $ — $ 1,285,986Centrally Cleared Swap Contracts (Unrealized Depreciation) . . . . . . . . . . . . . . . . . . . . . . . . . . . . . . . . . . . . . . . . . . . . . . . . — (9,387) — (9,387)
Total Centrally Cleared Swap Contracts . . . . . . . . . . . . . . . . . . . . . . . . . . . . . . . . . . . . . . . . . . . . . . . . . . . . . . . . . . . . . . . . $ — $ 1,276,599 $ — $ 1,276,599OTC Swap Contracts
OTC Swap Contracts at Value (Assets) . . . . . . . . . . . . . . . . . . . . . . . . . . . . . . . . . . . . . . . . . . . . . . . . . . . . . . . . . . . . . . . $ — $ 265,326 $ — $ 265,326OTC Swap Contracts at Value (Liabilities) . . . . . . . . . . . . . . . . . . . . . . . . . . . . . . . . . . . . . . . . . . . . . . . . . . . . . . . . . . . . . — (1,696,453) (28,828) (1,725,281)
Total OTC Swap Contracts . . . . . . . . . . . . . . . . . . . . . . . . . . . . . . . . . . . . . . . . . . . . . . . . . . . . . . . . . . . . . . . . . . . . . . . . . $ — $ (1,431,127) $ (28,828) $ (1,459,955)
* See Schedule of Investments for additional detailed categorizations.
Level 3 investments at the beginning and/or end of the period in relation to net assets were not significant and accordingly, a reconciliation of Level 3 assets for the period ended September 30, 2018 is notpresented.
Transfers from Level 3 to Level 2 in the amount of $3,955 were due to the initiation of trading activity which resulted in the availability of significant observable inputs.
BHFTII-131
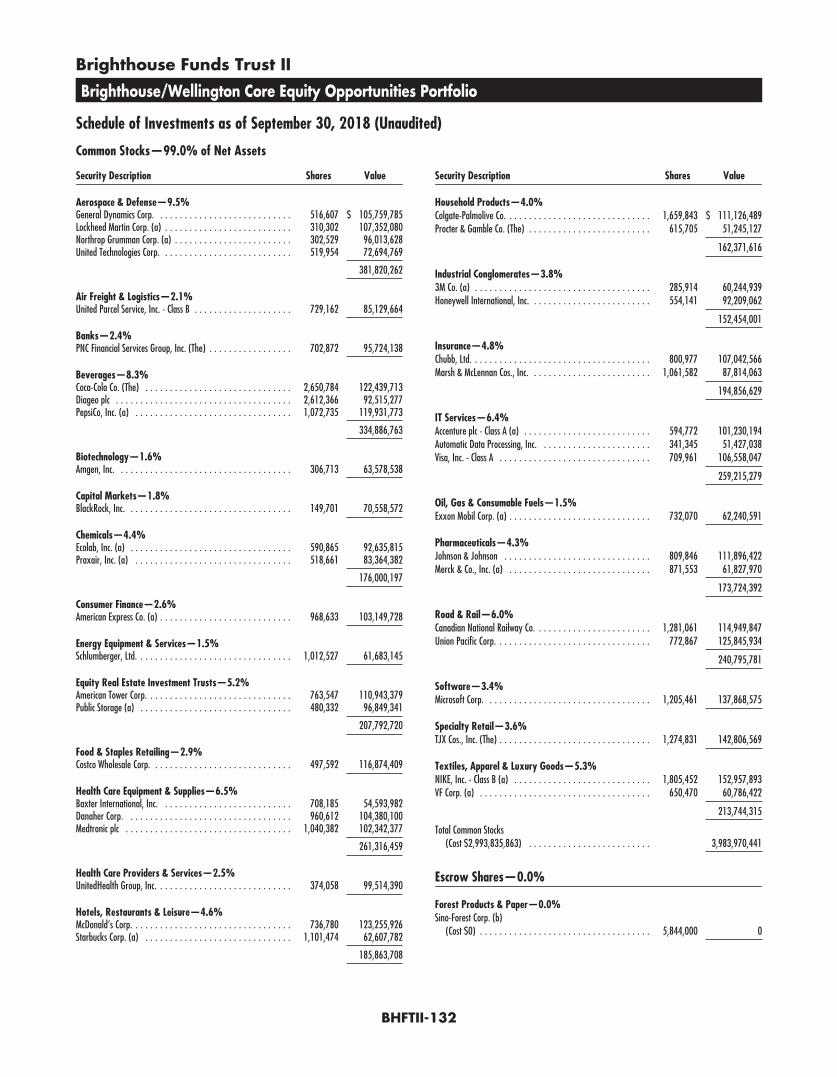
Brighthouse Funds Trust II
Brighthouse/Wellington Core Equity Opportunities Portfolio
Schedule of Investments as of September 30, 2018 (Unaudited)
Common Stocks—99.0% of Net Assets
Security Description Shares Value
Aerospace & Defense—9.5%General Dynamics Corp. . . . . . . . . . . . . . . . . . . . . . . . . . . . 516,607 $ 105,759,785Lockheed Martin Corp. (a) . . . . . . . . . . . . . . . . . . . . . . . . . . 310,302 107,352,080Northrop Grumman Corp. (a) . . . . . . . . . . . . . . . . . . . . . . . . 302,529 96,013,628United Technologies Corp. . . . . . . . . . . . . . . . . . . . . . . . . . . 519,954 72,694,769
381,820,262
Air Freight & Logistics—2.1%United Parcel Service, Inc. - Class B . . . . . . . . . . . . . . . . . . . . 729,162 85,129,664
Banks—2.4%PNC Financial Services Group, Inc. (The) . . . . . . . . . . . . . . . . . 702,872 95,724,138
Beverages—8.3%Coca-Cola Co. (The) . . . . . . . . . . . . . . . . . . . . . . . . . . . . . . 2,650,784 122,439,713Diageo plc . . . . . . . . . . . . . . . . . . . . . . . . . . . . . . . . . . . . 2,612,366 92,515,277PepsiCo, Inc. (a) . . . . . . . . . . . . . . . . . . . . . . . . . . . . . . . . 1,072,735 119,931,773
334,886,763
Biotechnology—1.6%Amgen, Inc. . . . . . . . . . . . . . . . . . . . . . . . . . . . . . . . . . . . 306,713 63,578,538
Capital Markets—1.8%BlackRock, Inc. . . . . . . . . . . . . . . . . . . . . . . . . . . . . . . . . . 149,701 70,558,572
Chemicals—4.4%Ecolab, Inc. (a) . . . . . . . . . . . . . . . . . . . . . . . . . . . . . . . . . 590,865 92,635,815Praxair, Inc. (a) . . . . . . . . . . . . . . . . . . . . . . . . . . . . . . . . 518,661 83,364,382
176,000,197
Consumer Finance—2.6%American Express Co. (a) . . . . . . . . . . . . . . . . . . . . . . . . . . . 968,633 103,149,728
Energy Equipment & Services—1.5%Schlumberger, Ltd. . . . . . . . . . . . . . . . . . . . . . . . . . . . . . . . 1,012,527 61,683,145
Equity Real Estate Investment Trusts—5.2%American Tower Corp. . . . . . . . . . . . . . . . . . . . . . . . . . . . . . 763,547 110,943,379Public Storage (a) . . . . . . . . . . . . . . . . . . . . . . . . . . . . . . . 480,332 96,849,341
207,792,720
Food & Staples Retailing—2.9%Costco Wholesale Corp. . . . . . . . . . . . . . . . . . . . . . . . . . . . . 497,592 116,874,409
Health Care Equipment & Supplies—6.5%Baxter International, Inc. . . . . . . . . . . . . . . . . . . . . . . . . . . 708,185 54,593,982Danaher Corp. . . . . . . . . . . . . . . . . . . . . . . . . . . . . . . . . . 960,612 104,380,100Medtronic plc . . . . . . . . . . . . . . . . . . . . . . . . . . . . . . . . . . 1,040,382 102,342,377
261,316,459
Health Care Providers & Services—2.5%UnitedHealth Group, Inc. . . . . . . . . . . . . . . . . . . . . . . . . . . . 374,058 99,514,390
Hotels, Restaurants & Leisure—4.6%McDonald’s Corp. . . . . . . . . . . . . . . . . . . . . . . . . . . . . . . . . 736,780 123,255,926Starbucks Corp. (a) . . . . . . . . . . . . . . . . . . . . . . . . . . . . . . 1,101,474 62,607,782
185,863,708
Security Description Shares Value
Household Products—4.0%Colgate-Palmolive Co. . . . . . . . . . . . . . . . . . . . . . . . . . . . . . 1,659,843 $ 111,126,489Procter & Gamble Co. (The) . . . . . . . . . . . . . . . . . . . . . . . . . 615,705 51,245,127
162,371,616
Industrial Conglomerates—3.8%3M Co. (a) . . . . . . . . . . . . . . . . . . . . . . . . . . . . . . . . . . . . 285,914 60,244,939Honeywell International, Inc. . . . . . . . . . . . . . . . . . . . . . . . . 554,141 92,209,062
152,454,001
Insurance—4.8%Chubb, Ltd. . . . . . . . . . . . . . . . . . . . . . . . . . . . . . . . . . . . . 800,977 107,042,566Marsh & McLennan Cos., Inc. . . . . . . . . . . . . . . . . . . . . . . . . 1,061,582 87,814,063
194,856,629
IT Services—6.4%Accenture plc - Class A (a) . . . . . . . . . . . . . . . . . . . . . . . . . . 594,772 101,230,194Automatic Data Processing, Inc. . . . . . . . . . . . . . . . . . . . . . . 341,345 51,427,038Visa, Inc. - Class A . . . . . . . . . . . . . . . . . . . . . . . . . . . . . . . 709,961 106,558,047
259,215,279
Oil, Gas & Consumable Fuels—1.5%Exxon Mobil Corp. (a) . . . . . . . . . . . . . . . . . . . . . . . . . . . . . 732,070 62,240,591
Pharmaceuticals—4.3%Johnson & Johnson . . . . . . . . . . . . . . . . . . . . . . . . . . . . . . 809,846 111,896,422Merck & Co., Inc. (a) . . . . . . . . . . . . . . . . . . . . . . . . . . . . . 871,553 61,827,970
173,724,392
Road & Rail—6.0%Canadian National Railway Co. . . . . . . . . . . . . . . . . . . . . . . . 1,281,061 114,949,847Union Pacific Corp. . . . . . . . . . . . . . . . . . . . . . . . . . . . . . . . 772,867 125,845,934
240,795,781
Software—3.4%Microsoft Corp. . . . . . . . . . . . . . . . . . . . . . . . . . . . . . . . . . 1,205,461 137,868,575
Specialty Retail—3.6%TJX Cos., Inc. (The) . . . . . . . . . . . . . . . . . . . . . . . . . . . . . . . 1,274,831 142,806,569
Textiles, Apparel & Luxury Goods—5.3%NIKE, Inc. - Class B (a) . . . . . . . . . . . . . . . . . . . . . . . . . . . . 1,805,452 152,957,893VF Corp. (a) . . . . . . . . . . . . . . . . . . . . . . . . . . . . . . . . . . . 650,470 60,786,422
213,744,315
Total Common Stocks(Cost $2,993,835,863) . . . . . . . . . . . . . . . . . . . . . . . . . 3,983,970,441
Escrow Shares—0.0%
Forest Products & Paper—0.0%Sino-Forest Corp. (b)
(Cost $0) . . . . . . . . . . . . . . . . . . . . . . . . . . . . . . . . . . . 5,844,000 0
BHFTII-132

Brighthouse Funds Trust II
Brighthouse/Wellington Core Equity Opportunities Portfolio
Schedule of Investments as of September 30, 2018 (Unaudited)
Short-Term Investment—1.0%
Security DescriptionPrincipalAmount* Value
Repurchase Agreement—1.0%Fixed Income Clearing Corp.
Repurchase Agreement dated 09/28/18 at 1.000%, due on10/01/18 with a maturity value of $40,713,217;collateralized by U.S. Treasury Note at 2.375%, maturing08/15/24, with a market value of $41,524,662. . . . . . . . $40,709,824 $ 40,709,824
Total Short-Term Investments(Cost $40,709,824) . . . . . . . . . . . . . . . . . . . . . . . . . . . 40,709,824
Securities Lending Reinvestments (c)—8.1%
Certificates of Deposit—3.2%Banco Del Estado De Chile New York
2.419%, 3M LIBOR + 0.100%, 11/14/18 (d) . . . . . . . . . . 7,000,000 6,999,881Banco Santander S.A.
2.340%, 11/07/18 . . . . . . . . . . . . . . . . . . . . . . . . . . . 2,000,000 2,000,164Bank of Montreal
Zero Coupon, 10/31/18 . . . . . . . . . . . . . . . . . . . . . . . . 2,494,672 2,495,156Bank of Montreal (Chicago)
2.371%, 3M LIBOR + 0.030%, 11/06/18 (d) . . . . . . . . . . 3,000,000 2,999,994Bank of Nova Scotia
2.618%, 3M LIBOR + 0.280%, 03/20/19 (d) . . . . . . . . . . 6,000,000 6,005,724BNP Paribas S.A. New York
2.574%, 1M LIBOR + 0.470%, 12/04/18 (d) . . . . . . . . . . 7,000,000 7,004,109Commonwealth Bank of Australia
2.358%, 1M LIBOR + 0.210%, 09/13/19 (d) . . . . . . . . . . 7,000,000 7,000,0002.487%, 3M LIBOR + 0.140%, 04/23/19 (d) . . . . . . . . . . 2,000,000 2,000,716
Cooperative Rabobank UA2.479%, 3M LIBOR + 0.140%, 10/16/18 (d) . . . . . . . . . . 5,000,000 5,000,3742.543%, 3M LIBOR + 0.200%, 04/05/19 (d) . . . . . . . . . . 2,000,000 2,001,532
Credit Industriel et Commercial (NY)Zero Coupon, 01/25/19 . . . . . . . . . . . . . . . . . . . . . . . . 4,936,141 4,960,150
Industrial & Commercial Bank of China, Ltd.2.500%, 10/24/18 . . . . . . . . . . . . . . . . . . . . . . . . . . . 1,000,000 1,000,0132.500%, 11/15/18 . . . . . . . . . . . . . . . . . . . . . . . . . . . 6,000,000 5,999,8562.530%, 12/24/18 . . . . . . . . . . . . . . . . . . . . . . . . . . . 5,000,000 4,999,890
KBC Bank NV2.400%, 12/27/18 . . . . . . . . . . . . . . . . . . . . . . . . . . . 10,000,000 10,000,000
Landesbank Baden-Wuettertemberg2.180%, 10/02/18 . . . . . . . . . . . . . . . . . . . . . . . . . . . 20,000,000 20,000,040
Mitsubishi UFJ Trust and Banking Corp.Zero Coupon, 01/15/19 . . . . . . . . . . . . . . . . . . . . . . . . 3,969,950 3,970,777
Natixis S.A. New York2.431%, 3M LIBOR + 0.090%, 05/10/19 (d) . . . . . . . . . . 2,500,000 2,499,803
Standard Chartered plc2.396%, 1M LIBOR + 0.180%, 02/25/19 (d) . . . . . . . . . . 7,000,000 6,999,1812.551%, 1M LIBOR + 0.420%, 10/11/18 (d) . . . . . . . . . . 3,000,000 3,000,150
Sumitomo Mitsui Trust Bank, Ltd., London2.528%, 1M LIBOR + 0.310%, 11/26/18 (d) . . . . . . . . . . 6,000,000 6,000,000
Svenska Handelsbanken AB2.439%, 3M LIBOR + 0.100%, 04/30/19 (d) . . . . . . . . . . 3,500,000 3,500,4172.554%, 1M LIBOR + 0.450%, 04/03/19 (d) . . . . . . . . . . 5,000,000 5,007,375
Wells Fargo Bank N.A.2.473%, 3M LIBOR + 0.140%, 07/11/19 (d) . . . . . . . . . . 4,000,000 4,000,456
Security DescriptionPrincipalAmount* Value
Certificates of Deposit—(Continued)Westpac Banking Corp.
2.630%, FEDEFF PRV + 0.450%, 02/15/19 (d) . . . . . . . . . $ 4,000,000 $ 4,002,124
129,447,882
Commercial Paper—1.0%Bank of China, Ltd.
2.550%, 10/19/18 . . . . . . . . . . . . . . . . . . . . . . . . . . . 3,975,350 3,994,864ING Funding LLC
2.453%, 1M LIBOR + 0.320%, 02/08/19 (d) . . . . . . . . . . 12,000,000 12,006,132Sheffield Receivables Co.
2.490%, 11/26/18 . . . . . . . . . . . . . . . . . . . . . . . . . . . 8,882,348 8,965,4312.510%, SOFR + 0.350%, 11/28/18 (d) . . . . . . . . . . . . . 500,000 500,137
Sinopec Century Bright Capital Investment, Ltd.2.400%, 11/01/18 . . . . . . . . . . . . . . . . . . . . . . . . . . . 1,988,000 1,995,668
UBS AG2.534%, 1M LIBOR + 0.430%, 02/01/19 (d) . . . . . . . . . . 12,000,000 12,011,076
39,473,308
Repurchase Agreements—3.7%Citigroup Global Markets, Inc.
Repurchase Agreement dated 07/25/18 at 2.570%, due on11/02/18 with a maturity value of $1,510,708;collateralized by various Common Stock with an aggregatemarket value of $1,650,000. . . . . . . . . . . . . . . . . . . . . 1,500,000 1,500,000Repurchase Agreement dated 01/25/17 at 2.720%, due on12/31/18 with a maturity value of $684,623; collateralizedby U.S. Treasury Obligations with rates ranging from 0.000%- 2.220%, maturity dates ranging from 11/01/18 -04/30/20, and an aggregate market value of $663,000. . . 650,000 650,000
Deutsche Bank AG, LondonRepurchase Agreement dated 09/28/18 at 2.250%, due on10/01/18 with a maturity value of $4,000,750;collateralized by Foreign Obligations with rates ranging from1.750% - 2.375%, maturity dates ranging from 03/31/20 -03/24/26, and an aggregate market value of$4,080,038. . . . . . . . . . . . . . . . . . . . . . . . . . . . . . . . . 4,000,000 4,000,000Repurchase Agreement dated 08/24/18 at 2.560%, due on10/01/18 with a maturity value of $10,027,022;collateralized by various Common Stock with an aggregatemarket value of $11,133,225. . . . . . . . . . . . . . . . . . . . . 10,000,000 10,000,000Repurchase Agreement dated 01/09/18 at 2.560%, due on10/01/18 with a maturity value of $2,037,689;collateralized by various Common Stock with an aggregatemarket value of $2,226,645. . . . . . . . . . . . . . . . . . . . . 2,000,000 2,000,000
ING Bank NV, LondonRepurchase Agreement dated 08/03/18 at 2.420%, due on10/01/18 with a maturity value of $4,919,434;collateralized by various Common Stock with an aggregatemarket value of $5,445,105. . . . . . . . . . . . . . . . . . . . . 4,900,000 4,900,000
Macquarie Bank, Ltd., LondonRepurchase Agreement dated 09/28/18 at 2.200%, due on10/01/18 with a maturity value of $7,059,762;collateralized by U.S. Treasury Obligations with rates rangingfrom 0.125% - 5.500%, maturity dates ranging from08/31/19 - 05/15/48, and an aggregate market value of$7,194,148. . . . . . . . . . . . . . . . . . . . . . . . . . . . . . . . . 7,058,468 7,058,468
BHFTII-133
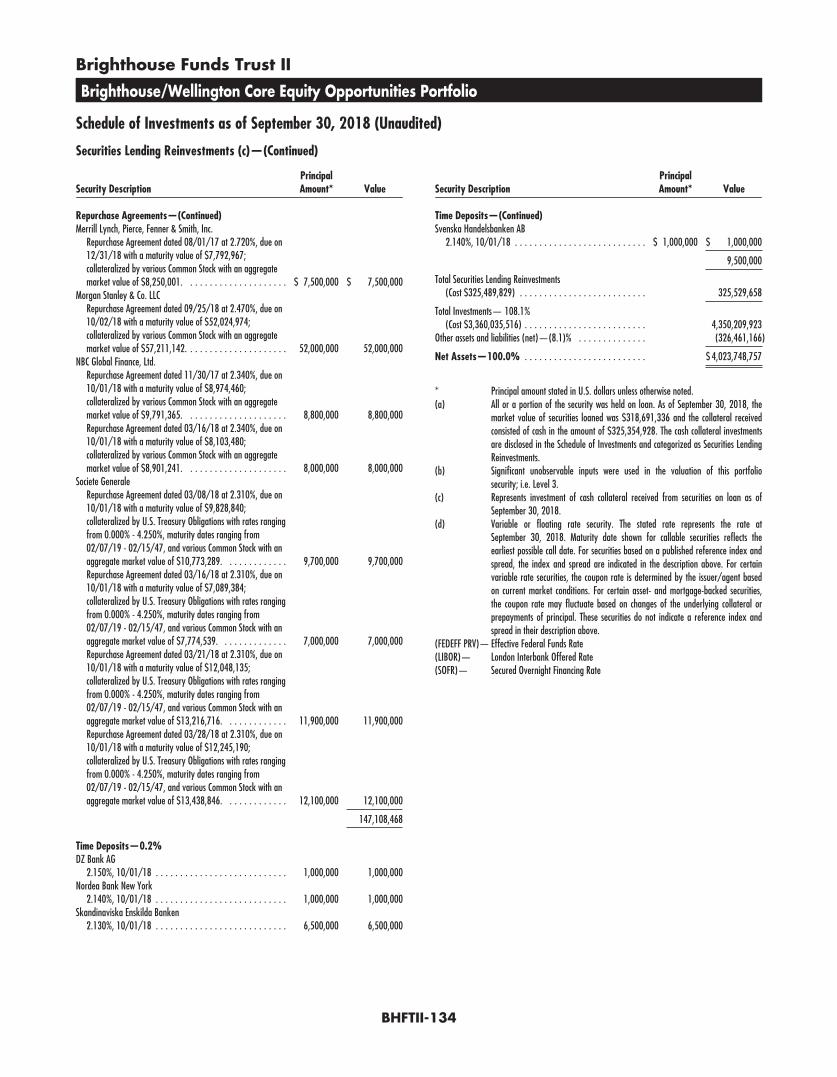
Brighthouse Funds Trust II
Brighthouse/Wellington Core Equity Opportunities Portfolio
Schedule of Investments as of September 30, 2018 (Unaudited)
Securities Lending Reinvestments (c)—(Continued)
Security DescriptionPrincipalAmount* Value
Repurchase Agreements—(Continued)Merrill Lynch, Pierce, Fenner & Smith, Inc.
Repurchase Agreement dated 08/01/17 at 2.720%, due on12/31/18 with a maturity value of $7,792,967;collateralized by various Common Stock with an aggregatemarket value of $8,250,001. . . . . . . . . . . . . . . . . . . . . $ 7,500,000 $ 7,500,000
Morgan Stanley & Co. LLCRepurchase Agreement dated 09/25/18 at 2.470%, due on10/02/18 with a maturity value of $52,024,974;collateralized by various Common Stock with an aggregatemarket value of $57,211,142. . . . . . . . . . . . . . . . . . . . . 52,000,000 52,000,000
NBC Global Finance, Ltd.Repurchase Agreement dated 11/30/17 at 2.340%, due on10/01/18 with a maturity value of $8,974,460;collateralized by various Common Stock with an aggregatemarket value of $9,791,365. . . . . . . . . . . . . . . . . . . . . 8,800,000 8,800,000Repurchase Agreement dated 03/16/18 at 2.340%, due on10/01/18 with a maturity value of $8,103,480;collateralized by various Common Stock with an aggregatemarket value of $8,901,241. . . . . . . . . . . . . . . . . . . . . 8,000,000 8,000,000
Societe GeneraleRepurchase Agreement dated 03/08/18 at 2.310%, due on10/01/18 with a maturity value of $9,828,840;collateralized by U.S. Treasury Obligations with rates rangingfrom 0.000% - 4.250%, maturity dates ranging from02/07/19 - 02/15/47, and various Common Stock with anaggregate market value of $10,773,289. . . . . . . . . . . . . 9,700,000 9,700,000Repurchase Agreement dated 03/16/18 at 2.310%, due on10/01/18 with a maturity value of $7,089,384;collateralized by U.S. Treasury Obligations with rates rangingfrom 0.000% - 4.250%, maturity dates ranging from02/07/19 - 02/15/47, and various Common Stock with anaggregate market value of $7,774,539. . . . . . . . . . . . . . 7,000,000 7,000,000Repurchase Agreement dated 03/21/18 at 2.310%, due on10/01/18 with a maturity value of $12,048,135;collateralized by U.S. Treasury Obligations with rates rangingfrom 0.000% - 4.250%, maturity dates ranging from02/07/19 - 02/15/47, and various Common Stock with anaggregate market value of $13,216,716. . . . . . . . . . . . . 11,900,000 11,900,000Repurchase Agreement dated 03/28/18 at 2.310%, due on10/01/18 with a maturity value of $12,245,190;collateralized by U.S. Treasury Obligations with rates rangingfrom 0.000% - 4.250%, maturity dates ranging from02/07/19 - 02/15/47, and various Common Stock with anaggregate market value of $13,438,846. . . . . . . . . . . . . 12,100,000 12,100,000
147,108,468
Time Deposits—0.2%DZ Bank AG
2.150%, 10/01/18 . . . . . . . . . . . . . . . . . . . . . . . . . . . 1,000,000 1,000,000Nordea Bank New York
2.140%, 10/01/18 . . . . . . . . . . . . . . . . . . . . . . . . . . . 1,000,000 1,000,000Skandinaviska Enskilda Banken
2.130%, 10/01/18 . . . . . . . . . . . . . . . . . . . . . . . . . . . 6,500,000 6,500,000
Security DescriptionPrincipalAmount* Value
Time Deposits—(Continued)Svenska Handelsbanken AB
2.140%, 10/01/18 . . . . . . . . . . . . . . . . . . . . . . . . . . . $ 1,000,000 $ 1,000,000
9,500,000
Total Securities Lending Reinvestments(Cost $325,489,829) . . . . . . . . . . . . . . . . . . . . . . . . . . 325,529,658
Total Investments— 108.1%(Cost $3,360,035,516) . . . . . . . . . . . . . . . . . . . . . . . . . 4,350,209,923
Other assets and liabilities (net)—(8.1)% . . . . . . . . . . . . . . (326,461,166)
Net Assets—100.0% . . . . . . . . . . . . . . . . . . . . . . . . . $ 4,023,748,757
* Principal amount stated in U.S. dollars unless otherwise noted.(a) All or a portion of the security was held on loan. As of September 30, 2018, the
market value of securities loaned was $318,691,336 and the collateral receivedconsisted of cash in the amount of $325,354,928. The cash collateral investmentsare disclosed in the Schedule of Investments and categorized as Securities LendingReinvestments.
(b) Significant unobservable inputs were used in the valuation of this portfoliosecurity; i.e. Level 3.
(c) Represents investment of cash collateral received from securities on loan as ofSeptember 30, 2018.
(d) Variable or floating rate security. The stated rate represents the rate atSeptember 30, 2018. Maturity date shown for callable securities reflects theearliest possible call date. For securities based on a published reference index andspread, the index and spread are indicated in the description above. For certainvariable rate securities, the coupon rate is determined by the issuer/agent basedon current market conditions. For certain asset- and mortgage-backed securities,the coupon rate may fluctuate based on changes of the underlying collateral orprepayments of principal. These securities do not indicate a reference index andspread in their description above.
(FEDEFF PRV)— Effective Federal Funds Rate(LIBOR)— London Interbank Offered Rate(SOFR)— Secured Overnight Financing Rate
BHFTII-134

Brighthouse Funds Trust II
Brighthouse/Wellington Core Equity Opportunities Portfolio
Schedule of Investments as of September 30, 2018 (Unaudited)
Fair Value Hierarchy
Accounting principles generally accepted in the United States of America (“GAAP”) define fair market value as the price that the Portfolio would receive to sell an asset or pay to transfer a liability in an orderlytransaction between market participants at the measurement date. It establishes a fair value hierarchy that prioritizes inputs to valuation methods and requires disclosure of the fair value hierarchy, separatelyfor each major category of assets and liabilities, that segregates fair value measurements into three levels. Levels 1, 2 and 3 of the fair value hierarchy are defined as follows:
Level 1 - unadjusted quoted prices in active markets for identical investmentsLevel 2 - other significant observable inputs (including, but not limited to, quoted prices for similar assets or liabilities in markets that are either active or inactive; inputs other than quoted prices that areobservable such as interest rates, yield curves, volatilities, prepayment speeds, loss severities, credit risks, default rates, or other market corroborated inputs)Level 3 - significant unobservable inputs based on the best information available in the circumstances, to the extent observable inputs are unavailable (including the Portfolio’s own assumptions used indetermining the fair value of investments and derivative financial instruments)
The inputs or methodologies used for valuing investments are not necessarily an indication of the risk associated with investing in them. Changes to the inputs or methodologies used may result in transfersbetween levels, which will be recognized as of the beginning of the reporting period. Information on transfers between Level 1 and Level 2, if any, will be disclosed following the fair value hierarchy table below.A reconciliation of Level 3 securities, if any, will also be disclosed following the fair value hierarchy table. For more information about the Portfolio’s policy regarding the valuation of investments, please refer tothe Notes to Schedule of Investments.
The following table summarizes the fair value hierarchy of the Portfolio’s investments as of September 30, 2018:
Description Level 1 Level 2 Level 3 Total
Common StocksAerospace & Defense . . . . . . . . . . . . . . . . . . . . . . . . . . . . . . . . . . . . . . . . . . . . . . . . . . . . . . . . . . . . . . . . . . . . . . . . . . $ 381,820,262 $ — $— $ 381,820,262Air Freight & Logistics . . . . . . . . . . . . . . . . . . . . . . . . . . . . . . . . . . . . . . . . . . . . . . . . . . . . . . . . . . . . . . . . . . . . . . . . . 85,129,664 — — 85,129,664Banks . . . . . . . . . . . . . . . . . . . . . . . . . . . . . . . . . . . . . . . . . . . . . . . . . . . . . . . . . . . . . . . . . . . . . . . . . . . . . . . . . . . . 95,724,138 — — 95,724,138Beverages . . . . . . . . . . . . . . . . . . . . . . . . . . . . . . . . . . . . . . . . . . . . . . . . . . . . . . . . . . . . . . . . . . . . . . . . . . . . . . . . . 242,371,486 92,515,277 — 334,886,763Biotechnology . . . . . . . . . . . . . . . . . . . . . . . . . . . . . . . . . . . . . . . . . . . . . . . . . . . . . . . . . . . . . . . . . . . . . . . . . . . . . . 63,578,538 — — 63,578,538Capital Markets . . . . . . . . . . . . . . . . . . . . . . . . . . . . . . . . . . . . . . . . . . . . . . . . . . . . . . . . . . . . . . . . . . . . . . . . . . . . . 70,558,572 — — 70,558,572Chemicals . . . . . . . . . . . . . . . . . . . . . . . . . . . . . . . . . . . . . . . . . . . . . . . . . . . . . . . . . . . . . . . . . . . . . . . . . . . . . . . . . 176,000,197 — — 176,000,197Consumer Finance . . . . . . . . . . . . . . . . . . . . . . . . . . . . . . . . . . . . . . . . . . . . . . . . . . . . . . . . . . . . . . . . . . . . . . . . . . . . 103,149,728 — — 103,149,728Energy Equipment & Services . . . . . . . . . . . . . . . . . . . . . . . . . . . . . . . . . . . . . . . . . . . . . . . . . . . . . . . . . . . . . . . . . . . . 61,683,145 — — 61,683,145Equity Real Estate Investment Trusts . . . . . . . . . . . . . . . . . . . . . . . . . . . . . . . . . . . . . . . . . . . . . . . . . . . . . . . . . . . . . . . . 207,792,720 — — 207,792,720Food & Staples Retailing . . . . . . . . . . . . . . . . . . . . . . . . . . . . . . . . . . . . . . . . . . . . . . . . . . . . . . . . . . . . . . . . . . . . . . . . 116,874,409 — — 116,874,409Health Care Equipment & Supplies . . . . . . . . . . . . . . . . . . . . . . . . . . . . . . . . . . . . . . . . . . . . . . . . . . . . . . . . . . . . . . . . . 261,316,459 — — 261,316,459Health Care Providers & Services . . . . . . . . . . . . . . . . . . . . . . . . . . . . . . . . . . . . . . . . . . . . . . . . . . . . . . . . . . . . . . . . . . 99,514,390 — — 99,514,390Hotels, Restaurants & Leisure . . . . . . . . . . . . . . . . . . . . . . . . . . . . . . . . . . . . . . . . . . . . . . . . . . . . . . . . . . . . . . . . . . . . 185,863,708 — — 185,863,708Household Products . . . . . . . . . . . . . . . . . . . . . . . . . . . . . . . . . . . . . . . . . . . . . . . . . . . . . . . . . . . . . . . . . . . . . . . . . . . 162,371,616 — — 162,371,616Industrial Conglomerates . . . . . . . . . . . . . . . . . . . . . . . . . . . . . . . . . . . . . . . . . . . . . . . . . . . . . . . . . . . . . . . . . . . . . . . 152,454,001 — — 152,454,001Insurance . . . . . . . . . . . . . . . . . . . . . . . . . . . . . . . . . . . . . . . . . . . . . . . . . . . . . . . . . . . . . . . . . . . . . . . . . . . . . . . . . 194,856,629 — — 194,856,629IT Services . . . . . . . . . . . . . . . . . . . . . . . . . . . . . . . . . . . . . . . . . . . . . . . . . . . . . . . . . . . . . . . . . . . . . . . . . . . . . . . . . 259,215,279 — — 259,215,279Oil, Gas & Consumable Fuels . . . . . . . . . . . . . . . . . . . . . . . . . . . . . . . . . . . . . . . . . . . . . . . . . . . . . . . . . . . . . . . . . . . . . 62,240,591 — — 62,240,591Pharmaceuticals . . . . . . . . . . . . . . . . . . . . . . . . . . . . . . . . . . . . . . . . . . . . . . . . . . . . . . . . . . . . . . . . . . . . . . . . . . . . . 173,724,392 — — 173,724,392Road & Rail . . . . . . . . . . . . . . . . . . . . . . . . . . . . . . . . . . . . . . . . . . . . . . . . . . . . . . . . . . . . . . . . . . . . . . . . . . . . . . . . 240,795,781 — — 240,795,781Software . . . . . . . . . . . . . . . . . . . . . . . . . . . . . . . . . . . . . . . . . . . . . . . . . . . . . . . . . . . . . . . . . . . . . . . . . . . . . . . . . . 137,868,575 — — 137,868,575Specialty Retail . . . . . . . . . . . . . . . . . . . . . . . . . . . . . . . . . . . . . . . . . . . . . . . . . . . . . . . . . . . . . . . . . . . . . . . . . . . . . . 142,806,569 — — 142,806,569Textiles, Apparel & Luxury Goods . . . . . . . . . . . . . . . . . . . . . . . . . . . . . . . . . . . . . . . . . . . . . . . . . . . . . . . . . . . . . . . . . . 213,744,315 — — 213,744,315
Total Common Stocks . . . . . . . . . . . . . . . . . . . . . . . . . . . . . . . . . . . . . . . . . . . . . . . . . . . . . . . . . . . . . . . . . . . . . . . . . . . . 3,891,455,164 92,515,277 — 3,983,970,441
Total Escrow Shares* . . . . . . . . . . . . . . . . . . . . . . . . . . . . . . . . . . . . . . . . . . . . . . . . . . . . . . . . . . . . . . . . . . . . . . . . . . . . — — 0 0
Total Short-Term Investment* . . . . . . . . . . . . . . . . . . . . . . . . . . . . . . . . . . . . . . . . . . . . . . . . . . . . . . . . . . . . . . . . . . . . . . — 40,709,824 — 40,709,824
Total Securities Lending Reinvestments* . . . . . . . . . . . . . . . . . . . . . . . . . . . . . . . . . . . . . . . . . . . . . . . . . . . . . . . . . . . . . . . . — 325,529,658 — 325,529,658
Total Investments . . . . . . . . . . . . . . . . . . . . . . . . . . . . . . . . . . . . . . . . . . . . . . . . . . . . . . . . . . . . . . . . . . . . . . . . . . . . . . $3,891,455,164 $ 458,754,759 $ 0 $4,350,209,923
Collateral for Securities Loaned (Liability) . . . . . . . . . . . . . . . . . . . . . . . . . . . . . . . . . . . . . . . . . . . . . . . . . . . . . . . . . . . . . . $ — $(325,354,928) $— $ (325,354,928)
* See Schedule of Investments for additional detailed categorizations.
Level 3 investments at the beginning and/or end of the period in relation to net assets were not significant and accordingly, a reconciliation of Level 3 assets for the six months ended September 30, 2018 is notpresented.
BHFTII-135

Brighthouse Funds Trust II
Brighthouse Asset Allocation 20 Portfolio
Schedule of Investments as of September 30, 2018 (Unaudited)
Mutual Funds—100.1% of Net Assets
Security Description Shares Value
Affiliated Investment Companies—100.1%Baillie Gifford International Stock Portfolio (Class A) (a) . . . . . . . . . 658,997 $ 8,468,108BlackRock Bond Income Portfolio (Class A) (a) . . . . . . . . . . . . . . . 697,003 70,975,849BlackRock Capital Appreciation Portfolio (Class A) (a) . . . . . . . . . . . 92,774 4,262,972BlackRock High Yield Portfolio (Class A) (b) . . . . . . . . . . . . . . . . . 371,712 2,839,881Brighthouse Small Cap Value Portfolio (Class A) (b) . . . . . . . . . . . . 170,104 2,837,331Brighthouse/Aberdeen Emerging Markets Equity Portfolio
(Class A) (b) . . . . . . . . . . . . . . . . . . . . . . . . . . . . . . . . . . . 144,254 1,420,906Brighthouse/Artisan International Portfolio (Class A) (b) . . . . . . . . . 500,147 5,601,644Brighthouse/Artisan Mid Cap Value Portfolio (Class A) (a) . . . . . . . . 5,597 1,418,889Brighthouse/Eaton Vance Floating Rate Portfolio (Class A) (b) . . . . . 1,097,402 11,358,108Brighthouse/Franklin Low Duration Total Return Portfolio
(Class A) (b) . . . . . . . . . . . . . . . . . . . . . . . . . . . . . . . . . . . 2,985,902 28,395,928Brighthouse/Templeton International Bond Portfolio
(Class A) (b) (c) . . . . . . . . . . . . . . . . . . . . . . . . . . . . . . . . . 1,408,222 14,237,128Brighthouse/Wellington Core Equity Opportunities Portfolio
(Class A) (a) . . . . . . . . . . . . . . . . . . . . . . . . . . . . . . . . . . . 301,215 9,940,096Brighthouse/Wellington Large Cap Research Portfolio (Class A) (b) . . 364,320 5,687,037Clarion Global Real Estate Portfolio (Class A) (b) . . . . . . . . . . . . . . 249,104 2,842,277Harris Oakmark International Portfolio (Class A) (b) . . . . . . . . . . . 576,055 8,404,641Invesco Comstock Portfolio (Class A) (b) . . . . . . . . . . . . . . . . . . . 714,388 11,323,057Jennison Growth Portfolio (Class A) (a) . . . . . . . . . . . . . . . . . . . . 247,072 4,264,458JPMorgan Core Bond Portfolio (Class A) (b) . . . . . . . . . . . . . . . . . 4,900,731 48,272,203JPMorgan Small Cap Value Portfolio (Class A) (b) . . . . . . . . . . . . . 163,542 2,839,089MFS Research International Portfolio (Class A) (b) . . . . . . . . . . . . . 337,597 4,216,587MFS Value Portfolio (Class A) (a) . . . . . . . . . . . . . . . . . . . . . . . . 814,866 12,736,352Neuberger Berman Genesis Portfolio (Class A) (a) . . . . . . . . . . . . . 127,696 2,837,397
Security Description Shares Value
Affiliated Investment Companies—(Continued)Oppenheimer Global Equity Portfolio (Class A) (b) . . . . . . . . . . . . . 57,864 $ 1,404,929PIMCO Inflation Protected Bond Portfolio (Class A) (b) . . . . . . . . . . 5,280,759 51,064,940PIMCO Total Return Portfolio (Class A) (b) . . . . . . . . . . . . . . . . . . 6,050,717 68,191,578T. Rowe Price Large Cap Growth Portfolio (Class A) (a) . . . . . . . . . . 176,870 4,260,804T. Rowe Price Large Cap Value Portfolio (Class A) (b) . . . . . . . . . . . 261,002 8,500,832T. Rowe Price Mid Cap Growth Portfolio (Class A) (b) . . . . . . . . . . . 120,969 1,418,961T. Rowe Price Small Cap Growth Portfolio (Class A) (a) . . . . . . . . . . 162,160 4,264,808TCW Core Fixed Income Portfolio (Class A) (b) . . . . . . . . . . . . . . . 5,497,700 53,932,433Van Eck Global Natural Resources Portfolio (Class A) (a) . . . . . . . . . 707,965 7,100,890Western Asset Management Strategic Bond Opportunities Portfolio
(Class A) (a) . . . . . . . . . . . . . . . . . . . . . . . . . . . . . . . . . . . 2,201,815 28,403,413Western Asset Management U.S. Government Portfolio
(Class A) (a) . . . . . . . . . . . . . . . . . . . . . . . . . . . . . . . . . . . 6,521,694 73,825,573
Total Mutual Funds(Cost $582,069,116) . . . . . . . . . . . . . . . . . . . . . . . . . . . . . 567,549,099
Total Investments—100.1%(Cost $582,069,116) . . . . . . . . . . . . . . . . . . . . . . . . . . . . . 567,549,099
Other assets and liabilities (net)—(0.1)% . . . . . . . . . . . . . . . . . . (313,889)
Net Assets—100.0% . . . . . . . . . . . . . . . . . . . . . . . . . . . . $567,235,210
(a) A Portfolio of Brighthouse Funds Trust II.(b) A Portfolio of Brighthouse Funds Trust I.(c) Non-income producing security.
Fair Value Hierarchy
Accounting principles generally accepted in the United States of America (“GAAP”) define fair market value as the price that the Portfolio would receive to sell an asset or pay to transfer a liability in an orderlytransaction between market participants at the measurement date. It establishes a fair value hierarchy that prioritizes inputs to valuation methods and requires disclosure of the fair value hierarchy, separatelyfor each major category of assets and liabilities, that segregates fair value measurements into three levels. Levels 1, 2 and 3 of the fair value hierarchy are defined as follows:
Level 1 - unadjusted quoted prices in active markets for identical investmentsLevel 2 - other significant observable inputs (including, but not limited to, quoted prices for similar assets or liabilities in markets that are either active or inactive; inputs other than quoted prices that areobservable such as interest rates, yield curves, volatilities, prepayment speeds, loss severities, credit risks, default rates, or other market corroborated inputs)Level 3 - significant unobservable inputs based on the best information available in the circumstances, to the extent observable inputs are unavailable (including the Portfolio’s own assumptions used indetermining the fair value of investments and derivative financial instruments)
The inputs or methodologies used for valuing investments are not necessarily an indication of the risk associated with investing in them. Changes to the inputs or methodologies used may result in transfersbetween levels, which will be recognized as of the beginning of the reporting period. Information on transfers between Level 1 and Level 2, if any, will be disclosed following the fair value hierarchy table below.A reconciliation of Level 3 securities, if any, will also be disclosed following the fair value hierarchy table. For more information about the Portfolio’s policy regarding the valuation of investments, please refer tothe Notes to Schedule of Investments.
The following table summarizes the fair value hierarchy of the Portfolio’s investments as of September 30, 2018:
Description Level 1 Level 2 Level 3 Total
Mutual FundsAffiliated Investment Companies . . . . . . . . . . . . . . . . . . . . . . . . . . . . . . . . . . . . . . . . . . . . . . . . . . . . . . . . . . . . . . . . . . . . . . . . . . $567,549,099 $— $— $567,549,099
Total Investments . . . . . . . . . . . . . . . . . . . . . . . . . . . . . . . . . . . . . . . . . . . . . . . . . . . . . . . . . . . . . . . . . . . . . . . . . . . . . . . . . . . . . . $567,549,099 $— $— $567,549,099
BHFTII-136
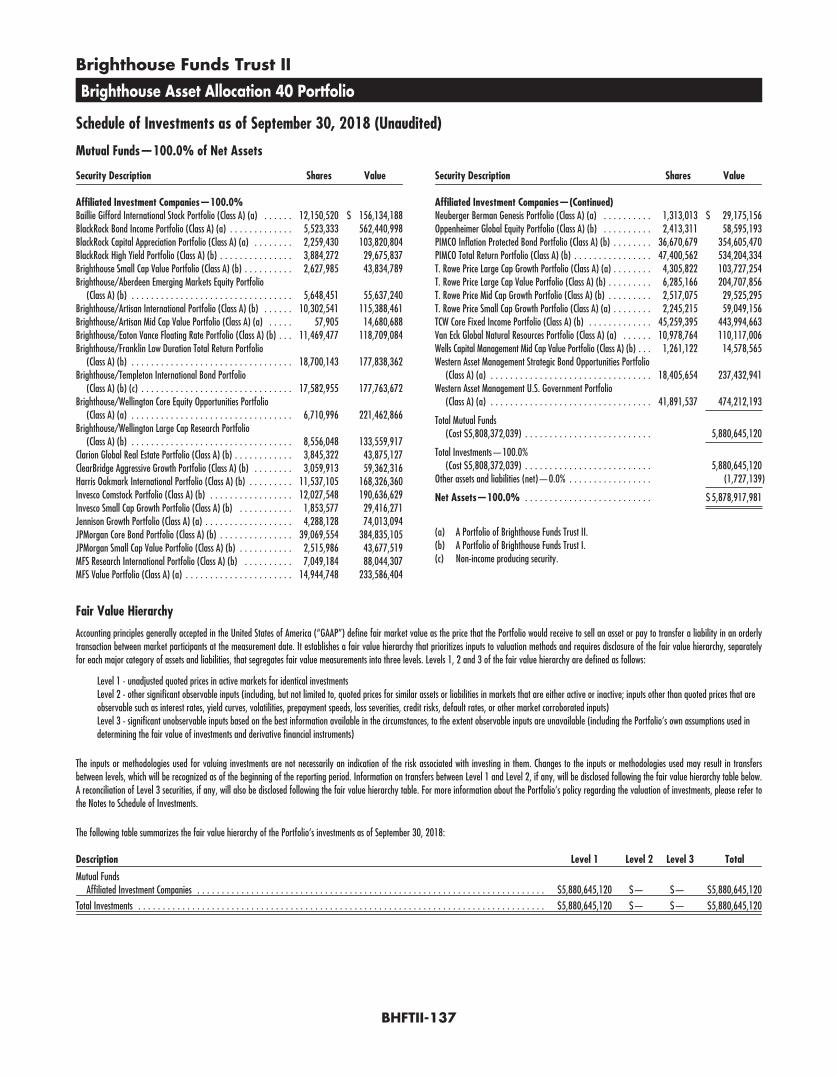
Brighthouse Funds Trust II
Brighthouse Asset Allocation 40 Portfolio
Schedule of Investments as of September 30, 2018 (Unaudited)
Mutual Funds—100.0% of Net Assets
Security Description Shares Value
Affiliated Investment Companies—100.0%Baillie Gifford International Stock Portfolio (Class A) (a) . . . . . . 12,150,520 $ 156,134,188BlackRock Bond Income Portfolio (Class A) (a) . . . . . . . . . . . . . 5,523,333 562,440,998BlackRock Capital Appreciation Portfolio (Class A) (a) . . . . . . . . 2,259,430 103,820,804BlackRock High Yield Portfolio (Class A) (b) . . . . . . . . . . . . . . . 3,884,272 29,675,837Brighthouse Small Cap Value Portfolio (Class A) (b) . . . . . . . . . . 2,627,985 43,834,789Brighthouse/Aberdeen Emerging Markets Equity Portfolio
(Class A) (b) . . . . . . . . . . . . . . . . . . . . . . . . . . . . . . . . . 5,648,451 55,637,240Brighthouse/Artisan International Portfolio (Class A) (b) . . . . . . 10,302,541 115,388,461Brighthouse/Artisan Mid Cap Value Portfolio (Class A) (a) . . . . . 57,905 14,680,688Brighthouse/Eaton Vance Floating Rate Portfolio (Class A) (b) . . . 11,469,477 118,709,084Brighthouse/Franklin Low Duration Total Return Portfolio
(Class A) (b) . . . . . . . . . . . . . . . . . . . . . . . . . . . . . . . . . 18,700,143 177,838,362Brighthouse/Templeton International Bond Portfolio
(Class A) (b) (c) . . . . . . . . . . . . . . . . . . . . . . . . . . . . . . . 17,582,955 177,763,672Brighthouse/Wellington Core Equity Opportunities Portfolio
(Class A) (a) . . . . . . . . . . . . . . . . . . . . . . . . . . . . . . . . . 6,710,996 221,462,866Brighthouse/Wellington Large Cap Research Portfolio
(Class A) (b) . . . . . . . . . . . . . . . . . . . . . . . . . . . . . . . . . 8,556,048 133,559,917Clarion Global Real Estate Portfolio (Class A) (b) . . . . . . . . . . . . 3,845,322 43,875,127ClearBridge Aggressive Growth Portfolio (Class A) (b) . . . . . . . . 3,059,913 59,362,316Harris Oakmark International Portfolio (Class A) (b) . . . . . . . . . 11,537,105 168,326,360Invesco Comstock Portfolio (Class A) (b) . . . . . . . . . . . . . . . . . 12,027,548 190,636,629Invesco Small Cap Growth Portfolio (Class A) (b) . . . . . . . . . . . 1,853,577 29,416,271Jennison Growth Portfolio (Class A) (a) . . . . . . . . . . . . . . . . . . 4,288,128 74,013,094JPMorgan Core Bond Portfolio (Class A) (b) . . . . . . . . . . . . . . . 39,069,554 384,835,105JPMorgan Small Cap Value Portfolio (Class A) (b) . . . . . . . . . . . 2,515,986 43,677,519MFS Research International Portfolio (Class A) (b) . . . . . . . . . . 7,049,184 88,044,307MFS Value Portfolio (Class A) (a) . . . . . . . . . . . . . . . . . . . . . . 14,944,748 233,586,404
Security Description Shares Value
Affiliated Investment Companies—(Continued)Neuberger Berman Genesis Portfolio (Class A) (a) . . . . . . . . . . 1,313,013 $ 29,175,156Oppenheimer Global Equity Portfolio (Class A) (b) . . . . . . . . . . 2,413,311 58,595,193PIMCO Inflation Protected Bond Portfolio (Class A) (b) . . . . . . . . 36,670,679 354,605,470PIMCO Total Return Portfolio (Class A) (b) . . . . . . . . . . . . . . . . 47,400,562 534,204,334T. Rowe Price Large Cap Growth Portfolio (Class A) (a) . . . . . . . . 4,305,822 103,727,254T. Rowe Price Large Cap Value Portfolio (Class A) (b) . . . . . . . . . 6,285,166 204,707,856T. Rowe Price Mid Cap Growth Portfolio (Class A) (b) . . . . . . . . . 2,517,075 29,525,295T. Rowe Price Small Cap Growth Portfolio (Class A) (a) . . . . . . . . 2,245,215 59,049,156TCW Core Fixed Income Portfolio (Class A) (b) . . . . . . . . . . . . . 45,259,395 443,994,663Van Eck Global Natural Resources Portfolio (Class A) (a) . . . . . . 10,978,764 110,117,006Wells Capital Management Mid Cap Value Portfolio (Class A) (b) . . . 1,261,122 14,578,565Western Asset Management Strategic Bond Opportunities Portfolio
(Class A) (a) . . . . . . . . . . . . . . . . . . . . . . . . . . . . . . . . . 18,405,654 237,432,941Western Asset Management U.S. Government Portfolio
(Class A) (a) . . . . . . . . . . . . . . . . . . . . . . . . . . . . . . . . . 41,891,537 474,212,193
Total Mutual Funds(Cost $5,808,372,039) . . . . . . . . . . . . . . . . . . . . . . . . . . 5,880,645,120
Total Investments—100.0%(Cost $5,808,372,039) . . . . . . . . . . . . . . . . . . . . . . . . . . 5,880,645,120
Other assets and liabilities (net)—0.0% . . . . . . . . . . . . . . . . . (1,727,139)
Net Assets—100.0% . . . . . . . . . . . . . . . . . . . . . . . . . . $ 5,878,917,981
(a) A Portfolio of Brighthouse Funds Trust II.(b) A Portfolio of Brighthouse Funds Trust I.(c) Non-income producing security.
Fair Value Hierarchy
Accounting principles generally accepted in the United States of America (“GAAP”) define fair market value as the price that the Portfolio would receive to sell an asset or pay to transfer a liability in an orderlytransaction between market participants at the measurement date. It establishes a fair value hierarchy that prioritizes inputs to valuation methods and requires disclosure of the fair value hierarchy, separatelyfor each major category of assets and liabilities, that segregates fair value measurements into three levels. Levels 1, 2 and 3 of the fair value hierarchy are defined as follows:
Level 1 - unadjusted quoted prices in active markets for identical investmentsLevel 2 - other significant observable inputs (including, but not limited to, quoted prices for similar assets or liabilities in markets that are either active or inactive; inputs other than quoted prices that areobservable such as interest rates, yield curves, volatilities, prepayment speeds, loss severities, credit risks, default rates, or other market corroborated inputs)Level 3 - significant unobservable inputs based on the best information available in the circumstances, to the extent observable inputs are unavailable (including the Portfolio’s own assumptions used indetermining the fair value of investments and derivative financial instruments)
The inputs or methodologies used for valuing investments are not necessarily an indication of the risk associated with investing in them. Changes to the inputs or methodologies used may result in transfersbetween levels, which will be recognized as of the beginning of the reporting period. Information on transfers between Level 1 and Level 2, if any, will be disclosed following the fair value hierarchy table below.A reconciliation of Level 3 securities, if any, will also be disclosed following the fair value hierarchy table. For more information about the Portfolio’s policy regarding the valuation of investments, please refer tothe Notes to Schedule of Investments.
The following table summarizes the fair value hierarchy of the Portfolio’s investments as of September 30, 2018:
Description Level 1 Level 2 Level 3 Total
Mutual FundsAffiliated Investment Companies . . . . . . . . . . . . . . . . . . . . . . . . . . . . . . . . . . . . . . . . . . . . . . . . . . . . . . . . . . . . . . . . . . . . . . . $5,880,645,120 $— $— $5,880,645,120
Total Investments . . . . . . . . . . . . . . . . . . . . . . . . . . . . . . . . . . . . . . . . . . . . . . . . . . . . . . . . . . . . . . . . . . . . . . . . . . . . . . . . . . . $5,880,645,120 $— $— $5,880,645,120
BHFTII-137

Brighthouse Funds Trust II
Brighthouse Asset Allocation 60 Portfolio
Schedule of Investments as of September 30, 2018 (Unaudited)
Mutual Funds—100.0% of Net Assets
Security Description Shares Value
Affiliated Investment Companies—100.0%Baillie Gifford International Stock Portfolio (Class A) (a) . . . . . . 35,263,815 $ 453,140,027BlackRock Bond Income Portfolio (Class A) (a) . . . . . . . . . . . . 8,696,117 885,525,619BlackRock Capital Appreciation Portfolio (Class A) (a) . . . . . . . 8,206,673 377,096,604BlackRock High Yield Portfolio (Class A) (b) . . . . . . . . . . . . . . 10,745,696 82,097,116Brighthouse Small Cap Value Portfolio (Class A) (b) . . . . . . . . . 10,082,466 168,175,527Brighthouse/Aberdeen Emerging Markets Equity Portfolio
(Class A) (b) . . . . . . . . . . . . . . . . . . . . . . . . . . . . . . . . 22,538,251 222,001,776Brighthouse/Artisan International Portfolio (Class A) (b) . . . . . 35,246,422 394,759,932Brighthouse/Artisan Mid Cap Value Portfolio (Class A) (a) . . . . 134,033 33,981,404Brighthouse/Dimensional International Small Company Portfolio
(Class A) (a) . . . . . . . . . . . . . . . . . . . . . . . . . . . . . . . . 9,932,323 131,901,244Brighthouse/Eaton Vance Floating Rate Portfolio (Class A) (b) . . 26,428,794 273,538,019Brighthouse/Franklin Low Duration Total Return Portfolio
(Class A) (b) . . . . . . . . . . . . . . . . . . . . . . . . . . . . . . . . 28,750,974 273,421,759Brighthouse/Templeton International Bond Portfolio
(Class A) (b) (c) . . . . . . . . . . . . . . . . . . . . . . . . . . . . . . 40,176,966 406,189,126Brighthouse/Wellington Core Equity Opportunities Portfolio
(Class A) (a) . . . . . . . . . . . . . . . . . . . . . . . . . . . . . . . . 18,663,899 615,908,665Brighthouse/Wellington Large Cap Research Portfolio
(Class A) (b) . . . . . . . . . . . . . . . . . . . . . . . . . . . . . . . . 26,335,294 411,093,945Clarion Global Real Estate Portfolio (Class A) (b) . . . . . . . . . . . 17,776,117 202,825,496ClearBridge Aggressive Growth Portfolio (Class A) (b) . . . . . . . 19,470,841 377,734,314Harris Oakmark International Portfolio (Class A) (b) . . . . . . . . 32,895,470 479,944,905Invesco Comstock Portfolio (Class A) (b) . . . . . . . . . . . . . . . . 36,510,712 578,694,778Invesco Small Cap Growth Portfolio (Class A) (b) . . . . . . . . . . . 10,742,587 170,484,848Jennison Growth Portfolio (Class A) (a) . . . . . . . . . . . . . . . . . 25,834,314 445,900,252JPMorgan Core Bond Portfolio (Class A) (b) . . . . . . . . . . . . . . 62,254,089 613,202,774JPMorgan Small Cap Value Portfolio (Class A) (b) . . . . . . . . . . 5,786,359 100,451,196Loomis Sayles Small Cap Growth Portfolio (Class A) (a) . . . . . . 4,161,989 68,131,760MFS Research International Portfolio (Class A) (b) . . . . . . . . . . 21,714,774 271,217,523
Security Description Shares Value
Affiliated Investment Companies—(Continued)MFS Value Portfolio (Class A) (a) . . . . . . . . . . . . . . . . . . . . . 47,805,260 $ 747,196,219Neuberger Berman Genesis Portfolio (Class A) (a) . . . . . . . . . . 4,566,143 101,459,697Oppenheimer Global Equity Portfolio (Class A) (b) . . . . . . . . . 5,574,290 135,343,763PIMCO Inflation Protected Bond Portfolio (Class A) (b) . . . . . . . 42,161,150 407,698,319PIMCO Total Return Portfolio (Class A) (b) . . . . . . . . . . . . . . . 72,753,974 819,937,283T. Rowe Price Large Cap Growth Portfolio (Class A) (a) . . . . . . . 15,632,475 376,586,332T. Rowe Price Large Cap Value Portfolio (Class A) (b) . . . . . . . . 18,744,764 610,516,958T. Rowe Price Mid Cap Growth Portfolio (Class A) (b) . . . . . . . . 8,732,110 102,427,647T. Rowe Price Small Cap Growth Portfolio (Class A) (a) . . . . . . . 7,793,390 204,966,152TCW Core Fixed Income Portfolio (Class A) (b) . . . . . . . . . . . . 74,974,151 735,496,421Van Eck Global Natural Resources Portfolio (Class A) (a) . . . . . 37,568,057 376,807,611Wells Capital Management Mid Cap Value Portfolio
(Class A) (b) . . . . . . . . . . . . . . . . . . . . . . . . . . . . . . . . 2,916,312 33,712,562Western Asset Management Strategic Bond Opportunities
Portfolio (Class A) (a) . . . . . . . . . . . . . . . . . . . . . . . . . . 21,193,488 273,395,995Western Asset Management U.S. Government Portfolio
(Class A) (a) . . . . . . . . . . . . . . . . . . . . . . . . . . . . . . . . 48,253,138 546,225,527
Total Mutual Funds(Cost $12,882,344,472) . . . . . . . . . . . . . . . . . . . . . . . . 13,509,189,095
Total Investments—100.0%(Cost $12,882,344,472) . . . . . . . . . . . . . . . . . . . . . . . . 13,509,189,095
Other assets and liabilities (net)—0.0% . . . . . . . . . . . . . . . . (3,515,854)
Net Assets—100.0% . . . . . . . . . . . . . . . . . . . . . . . . . $ 13,505,673,241
(a) A Portfolio of Brighthouse Funds Trust II.(b) A Portfolio of Brighthouse Funds Trust I.(c) Non-income producing security.
Fair Value Hierarchy
Accounting principles generally accepted in the United States of America (“GAAP”) define fair market value as the price that the Portfolio would receive to sell an asset or pay to transfer a liability in an orderlytransaction between market participants at the measurement date. It establishes a fair value hierarchy that prioritizes inputs to valuation methods and requires disclosure of the fair value hierarchy, separatelyfor each major category of assets and liabilities, that segregates fair value measurements into three levels. Levels 1, 2 and 3 of the fair value hierarchy are defined as follows:
Level 1 - unadjusted quoted prices in active markets for identical investmentsLevel 2 - other significant observable inputs (including, but not limited to, quoted prices for similar assets or liabilities in markets that are either active or inactive; inputs other than quoted prices that areobservable such as interest rates, yield curves, volatilities, prepayment speeds, loss severities, credit risks, default rates, or other market corroborated inputs)Level 3 - significant unobservable inputs based on the best information available in the circumstances, to the extent observable inputs are unavailable (including the Portfolio’s own assumptions used indetermining the fair value of investments and derivative financial instruments)
The inputs or methodologies used for valuing investments are not necessarily an indication of the risk associated with investing in them. Changes to the inputs or methodologies used may result in transfersbetween levels, which will be recognized as of the beginning of the reporting period. Information on transfers between Level 1 and Level 2, if any, will be disclosed following the fair value hierarchy table below.A reconciliation of Level 3 securities, if any, will also be disclosed following the fair value hierarchy table. For more information about the Portfolio’s policy regarding the valuation of investments, please refer tothe Notes to Schedule of Investments.
The following table summarizes the fair value hierarchy of the Portfolio’s investments as of September 30, 2018:
Description Level 1 Level 2 Level 3 Total
Mutual FundsAffiliated Investment Companies . . . . . . . . . . . . . . . . . . . . . . . . . . . . . . . . . . . . . . . . . . . . . . . . . . . . . . . . . . . . . . . . . . . . . $13,509,189,095 $— $— $13,509,189,095
Total Investments . . . . . . . . . . . . . . . . . . . . . . . . . . . . . . . . . . . . . . . . . . . . . . . . . . . . . . . . . . . . . . . . . . . . . . . . . . . . . . . . . $13,509,189,095 $— $— $13,509,189,095
BHFTII-138
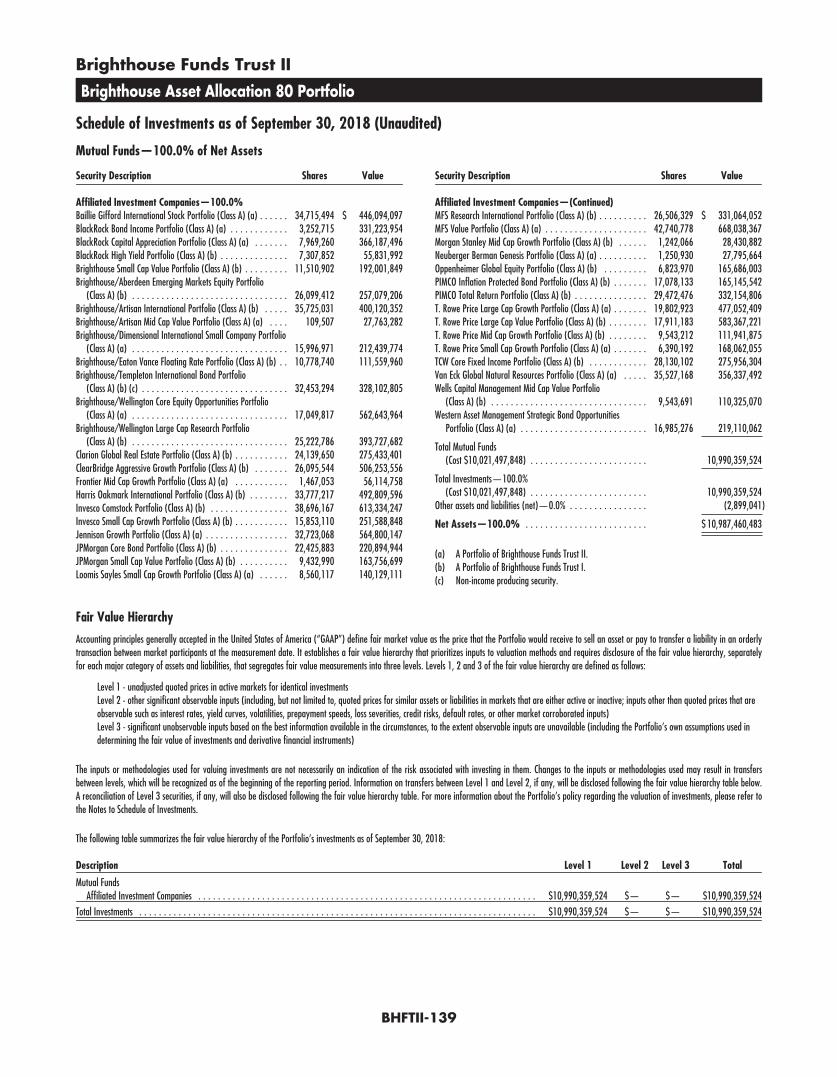
Brighthouse Funds Trust II
Brighthouse Asset Allocation 80 Portfolio
Schedule of Investments as of September 30, 2018 (Unaudited)
Mutual Funds—100.0% of Net Assets
Security Description Shares Value
Affiliated Investment Companies—100.0%Baillie Gifford International Stock Portfolio (Class A) (a) . . . . . . 34,715,494 $ 446,094,097BlackRock Bond Income Portfolio (Class A) (a) . . . . . . . . . . . . 3,252,715 331,223,954BlackRock Capital Appreciation Portfolio (Class A) (a) . . . . . . . 7,969,260 366,187,496BlackRock High Yield Portfolio (Class A) (b) . . . . . . . . . . . . . . 7,307,852 55,831,992Brighthouse Small Cap Value Portfolio (Class A) (b) . . . . . . . . . 11,510,902 192,001,849Brighthouse/Aberdeen Emerging Markets Equity Portfolio
(Class A) (b) . . . . . . . . . . . . . . . . . . . . . . . . . . . . . . . . 26,099,412 257,079,206Brighthouse/Artisan International Portfolio (Class A) (b) . . . . . 35,725,031 400,120,352Brighthouse/Artisan Mid Cap Value Portfolio (Class A) (a) . . . . 109,507 27,763,282Brighthouse/Dimensional International Small Company Portfolio
(Class A) (a) . . . . . . . . . . . . . . . . . . . . . . . . . . . . . . . . 15,996,971 212,439,774Brighthouse/Eaton Vance Floating Rate Portfolio (Class A) (b) . . 10,778,740 111,559,960Brighthouse/Templeton International Bond Portfolio
(Class A) (b) (c) . . . . . . . . . . . . . . . . . . . . . . . . . . . . . . 32,453,294 328,102,805Brighthouse/Wellington Core Equity Opportunities Portfolio
(Class A) (a) . . . . . . . . . . . . . . . . . . . . . . . . . . . . . . . . 17,049,817 562,643,964Brighthouse/Wellington Large Cap Research Portfolio
(Class A) (b) . . . . . . . . . . . . . . . . . . . . . . . . . . . . . . . . 25,222,786 393,727,682Clarion Global Real Estate Portfolio (Class A) (b) . . . . . . . . . . . 24,139,650 275,433,401ClearBridge Aggressive Growth Portfolio (Class A) (b) . . . . . . . 26,095,544 506,253,556Frontier Mid Cap Growth Portfolio (Class A) (a) . . . . . . . . . . . 1,467,053 56,114,758Harris Oakmark International Portfolio (Class A) (b) . . . . . . . . 33,777,217 492,809,596Invesco Comstock Portfolio (Class A) (b) . . . . . . . . . . . . . . . . 38,696,167 613,334,247Invesco Small Cap Growth Portfolio (Class A) (b) . . . . . . . . . . . 15,853,110 251,588,848Jennison Growth Portfolio (Class A) (a) . . . . . . . . . . . . . . . . . 32,723,068 564,800,147JPMorgan Core Bond Portfolio (Class A) (b) . . . . . . . . . . . . . . 22,425,883 220,894,944JPMorgan Small Cap Value Portfolio (Class A) (b) . . . . . . . . . . 9,432,990 163,756,699Loomis Sayles Small Cap Growth Portfolio (Class A) (a) . . . . . . 8,560,117 140,129,111
Security Description Shares Value
Affiliated Investment Companies—(Continued)MFS Research International Portfolio (Class A) (b) . . . . . . . . . . 26,506,329 $ 331,064,052MFS Value Portfolio (Class A) (a) . . . . . . . . . . . . . . . . . . . . . 42,740,778 668,038,367Morgan Stanley Mid Cap Growth Portfolio (Class A) (b) . . . . . . 1,242,066 28,430,882Neuberger Berman Genesis Portfolio (Class A) (a) . . . . . . . . . . 1,250,930 27,795,664Oppenheimer Global Equity Portfolio (Class A) (b) . . . . . . . . . 6,823,970 165,686,003PIMCO Inflation Protected Bond Portfolio (Class A) (b) . . . . . . . 17,078,133 165,145,542PIMCO Total Return Portfolio (Class A) (b) . . . . . . . . . . . . . . . 29,472,476 332,154,806T. Rowe Price Large Cap Growth Portfolio (Class A) (a) . . . . . . . 19,802,923 477,052,409T. Rowe Price Large Cap Value Portfolio (Class A) (b) . . . . . . . . 17,911,183 583,367,221T. Rowe Price Mid Cap Growth Portfolio (Class A) (b) . . . . . . . . 9,543,212 111,941,875T. Rowe Price Small Cap Growth Portfolio (Class A) (a) . . . . . . . 6,390,192 168,062,055TCW Core Fixed Income Portfolio (Class A) (b) . . . . . . . . . . . . 28,130,102 275,956,304Van Eck Global Natural Resources Portfolio (Class A) (a) . . . . . 35,527,168 356,337,492Wells Capital Management Mid Cap Value Portfolio
(Class A) (b) . . . . . . . . . . . . . . . . . . . . . . . . . . . . . . . . 9,543,691 110,325,070Western Asset Management Strategic Bond Opportunities
Portfolio (Class A) (a) . . . . . . . . . . . . . . . . . . . . . . . . . . 16,985,276 219,110,062
Total Mutual Funds(Cost $10,021,497,848) . . . . . . . . . . . . . . . . . . . . . . . . 10,990,359,524
Total Investments—100.0%(Cost $10,021,497,848) . . . . . . . . . . . . . . . . . . . . . . . . 10,990,359,524
Other assets and liabilities (net)—0.0% . . . . . . . . . . . . . . . . (2,899,041)
Net Assets—100.0% . . . . . . . . . . . . . . . . . . . . . . . . . $ 10,987,460,483
(a) A Portfolio of Brighthouse Funds Trust II.(b) A Portfolio of Brighthouse Funds Trust I.(c) Non-income producing security.
Fair Value Hierarchy
Accounting principles generally accepted in the United States of America (“GAAP”) define fair market value as the price that the Portfolio would receive to sell an asset or pay to transfer a liability in an orderlytransaction between market participants at the measurement date. It establishes a fair value hierarchy that prioritizes inputs to valuation methods and requires disclosure of the fair value hierarchy, separatelyfor each major category of assets and liabilities, that segregates fair value measurements into three levels. Levels 1, 2 and 3 of the fair value hierarchy are defined as follows:
Level 1 - unadjusted quoted prices in active markets for identical investmentsLevel 2 - other significant observable inputs (including, but not limited to, quoted prices for similar assets or liabilities in markets that are either active or inactive; inputs other than quoted prices that areobservable such as interest rates, yield curves, volatilities, prepayment speeds, loss severities, credit risks, default rates, or other market corroborated inputs)Level 3 - significant unobservable inputs based on the best information available in the circumstances, to the extent observable inputs are unavailable (including the Portfolio’s own assumptions used indetermining the fair value of investments and derivative financial instruments)
The inputs or methodologies used for valuing investments are not necessarily an indication of the risk associated with investing in them. Changes to the inputs or methodologies used may result in transfersbetween levels, which will be recognized as of the beginning of the reporting period. Information on transfers between Level 1 and Level 2, if any, will be disclosed following the fair value hierarchy table below.A reconciliation of Level 3 securities, if any, will also be disclosed following the fair value hierarchy table. For more information about the Portfolio’s policy regarding the valuation of investments, please refer tothe Notes to Schedule of Investments.
The following table summarizes the fair value hierarchy of the Portfolio’s investments as of September 30, 2018:
Description Level 1 Level 2 Level 3 Total
Mutual FundsAffiliated Investment Companies . . . . . . . . . . . . . . . . . . . . . . . . . . . . . . . . . . . . . . . . . . . . . . . . . . . . . . . . . . . . . . . . . . . . . $10,990,359,524 $— $— $10,990,359,524
Total Investments . . . . . . . . . . . . . . . . . . . . . . . . . . . . . . . . . . . . . . . . . . . . . . . . . . . . . . . . . . . . . . . . . . . . . . . . . . . . . . . . . $10,990,359,524 $— $— $10,990,359,524
BHFTII-139
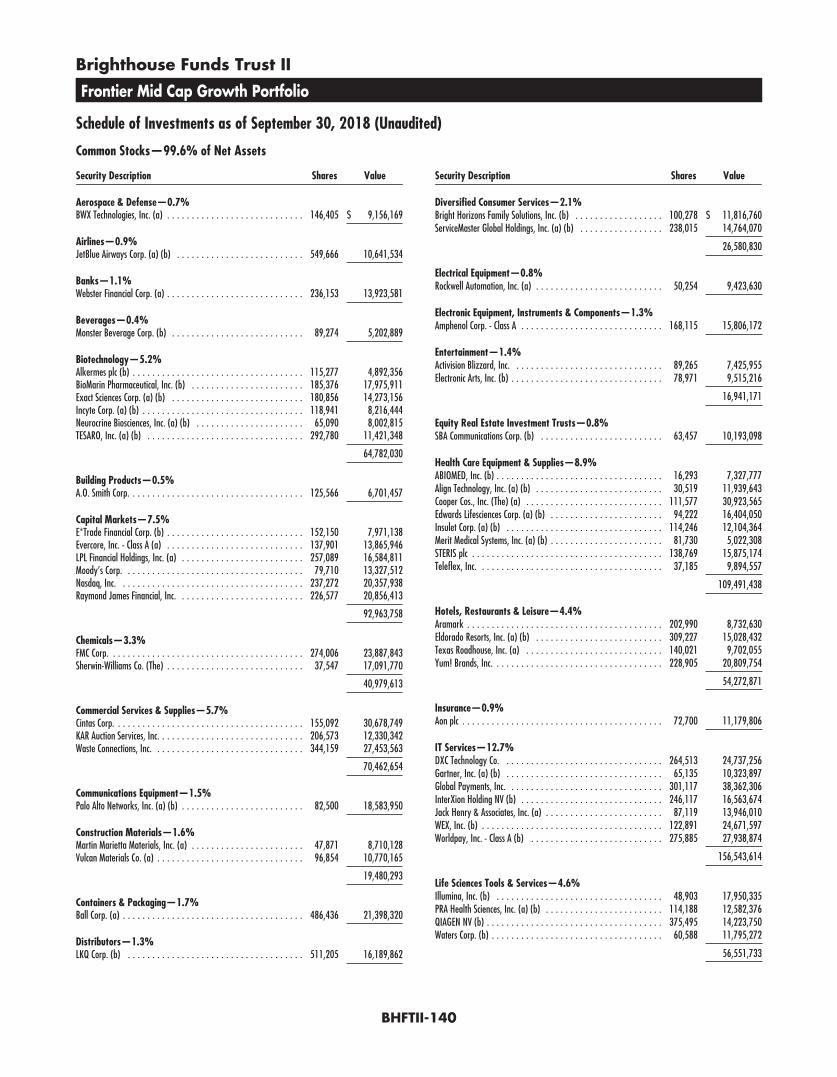
Brighthouse Funds Trust II
Frontier Mid Cap Growth Portfolio
Schedule of Investments as of September 30, 2018 (Unaudited)
Common Stocks—99.6% of Net Assets
Security Description Shares Value
Aerospace & Defense—0.7%BWX Technologies, Inc. (a) . . . . . . . . . . . . . . . . . . . . . . . . . . . . 146,405 $ 9,156,169
Airlines—0.9%JetBlue Airways Corp. (a) (b) . . . . . . . . . . . . . . . . . . . . . . . . . . 549,666 10,641,534
Banks—1.1%Webster Financial Corp. (a) . . . . . . . . . . . . . . . . . . . . . . . . . . . . 236,153 13,923,581
Beverages—0.4%Monster Beverage Corp. (b) . . . . . . . . . . . . . . . . . . . . . . . . . . . 89,274 5,202,889
Biotechnology—5.2%Alkermes plc (b) . . . . . . . . . . . . . . . . . . . . . . . . . . . . . . . . . . . 115,277 4,892,356BioMarin Pharmaceutical, Inc. (b) . . . . . . . . . . . . . . . . . . . . . . . 185,376 17,975,911Exact Sciences Corp. (a) (b) . . . . . . . . . . . . . . . . . . . . . . . . . . . 180,856 14,273,156Incyte Corp. (a) (b) . . . . . . . . . . . . . . . . . . . . . . . . . . . . . . . . . 118,941 8,216,444Neurocrine Biosciences, Inc. (a) (b) . . . . . . . . . . . . . . . . . . . . . . 65,090 8,002,815TESARO, Inc. (a) (b) . . . . . . . . . . . . . . . . . . . . . . . . . . . . . . . . 292,780 11,421,348
64,782,030
Building Products—0.5%A.O. Smith Corp. . . . . . . . . . . . . . . . . . . . . . . . . . . . . . . . . . . . 125,566 6,701,457
Capital Markets—7.5%E*Trade Financial Corp. (b) . . . . . . . . . . . . . . . . . . . . . . . . . . . . 152,150 7,971,138Evercore, Inc. - Class A (a) . . . . . . . . . . . . . . . . . . . . . . . . . . . . 137,901 13,865,946LPL Financial Holdings, Inc. (a) . . . . . . . . . . . . . . . . . . . . . . . . . 257,089 16,584,811Moody’s Corp. . . . . . . . . . . . . . . . . . . . . . . . . . . . . . . . . . . . . 79,710 13,327,512Nasdaq, Inc. . . . . . . . . . . . . . . . . . . . . . . . . . . . . . . . . . . . . . 237,272 20,357,938Raymond James Financial, Inc. . . . . . . . . . . . . . . . . . . . . . . . . . 226,577 20,856,413
92,963,758
Chemicals—3.3%FMC Corp. . . . . . . . . . . . . . . . . . . . . . . . . . . . . . . . . . . . . . . . 274,006 23,887,843Sherwin-Williams Co. (The) . . . . . . . . . . . . . . . . . . . . . . . . . . . . 37,547 17,091,770
40,979,613
Commercial Services & Supplies—5.7%Cintas Corp. . . . . . . . . . . . . . . . . . . . . . . . . . . . . . . . . . . . . . . 155,092 30,678,749KAR Auction Services, Inc. . . . . . . . . . . . . . . . . . . . . . . . . . . . . . 206,573 12,330,342Waste Connections, Inc. . . . . . . . . . . . . . . . . . . . . . . . . . . . . . . 344,159 27,453,563
70,462,654
Communications Equipment—1.5%Palo Alto Networks, Inc. (a) (b) . . . . . . . . . . . . . . . . . . . . . . . . . 82,500 18,583,950
Construction Materials—1.6%Martin Marietta Materials, Inc. (a) . . . . . . . . . . . . . . . . . . . . . . . 47,871 8,710,128Vulcan Materials Co. (a) . . . . . . . . . . . . . . . . . . . . . . . . . . . . . . 96,854 10,770,165
19,480,293
Containers & Packaging—1.7%Ball Corp. (a) . . . . . . . . . . . . . . . . . . . . . . . . . . . . . . . . . . . . . 486,436 21,398,320
Distributors—1.3%LKQ Corp. (b) . . . . . . . . . . . . . . . . . . . . . . . . . . . . . . . . . . . . 511,205 16,189,862
Security Description Shares Value
Diversified Consumer Services—2.1%Bright Horizons Family Solutions, Inc. (b) . . . . . . . . . . . . . . . . . . 100,278 $ 11,816,760ServiceMaster Global Holdings, Inc. (a) (b) . . . . . . . . . . . . . . . . . 238,015 14,764,070
26,580,830
Electrical Equipment—0.8%Rockwell Automation, Inc. (a) . . . . . . . . . . . . . . . . . . . . . . . . . . 50,254 9,423,630
Electronic Equipment, Instruments & Components—1.3%Amphenol Corp. - Class A . . . . . . . . . . . . . . . . . . . . . . . . . . . . . 168,115 15,806,172
Entertainment—1.4%Activision Blizzard, Inc. . . . . . . . . . . . . . . . . . . . . . . . . . . . . . . 89,265 7,425,955Electronic Arts, Inc. (b) . . . . . . . . . . . . . . . . . . . . . . . . . . . . . . . 78,971 9,515,216
16,941,171
Equity Real Estate Investment Trusts—0.8%SBA Communications Corp. (b) . . . . . . . . . . . . . . . . . . . . . . . . . 63,457 10,193,098
Health Care Equipment & Supplies—8.9%ABIOMED, Inc. (b) . . . . . . . . . . . . . . . . . . . . . . . . . . . . . . . . . . 16,293 7,327,777Align Technology, Inc. (a) (b) . . . . . . . . . . . . . . . . . . . . . . . . . . 30,519 11,939,643Cooper Cos., Inc. (The) (a) . . . . . . . . . . . . . . . . . . . . . . . . . . . . 111,577 30,923,565Edwards Lifesciences Corp. (a) (b) . . . . . . . . . . . . . . . . . . . . . . . 94,222 16,404,050Insulet Corp. (a) (b) . . . . . . . . . . . . . . . . . . . . . . . . . . . . . . . . 114,246 12,104,364Merit Medical Systems, Inc. (a) (b) . . . . . . . . . . . . . . . . . . . . . . . 81,730 5,022,308STERIS plc . . . . . . . . . . . . . . . . . . . . . . . . . . . . . . . . . . . . . . . 138,769 15,875,174Teleflex, Inc. . . . . . . . . . . . . . . . . . . . . . . . . . . . . . . . . . . . . . 37,185 9,894,557
109,491,438
Hotels, Restaurants & Leisure—4.4%Aramark . . . . . . . . . . . . . . . . . . . . . . . . . . . . . . . . . . . . . . . . 202,990 8,732,630Eldorado Resorts, Inc. (a) (b) . . . . . . . . . . . . . . . . . . . . . . . . . . 309,227 15,028,432Texas Roadhouse, Inc. (a) . . . . . . . . . . . . . . . . . . . . . . . . . . . . 140,021 9,702,055Yum! Brands, Inc. . . . . . . . . . . . . . . . . . . . . . . . . . . . . . . . . . . 228,905 20,809,754
54,272,871
Insurance—0.9%Aon plc . . . . . . . . . . . . . . . . . . . . . . . . . . . . . . . . . . . . . . . . . 72,700 11,179,806
IT Services—12.7%DXC Technology Co. . . . . . . . . . . . . . . . . . . . . . . . . . . . . . . . . 264,513 24,737,256Gartner, Inc. (a) (b) . . . . . . . . . . . . . . . . . . . . . . . . . . . . . . . . 65,135 10,323,897Global Payments, Inc. . . . . . . . . . . . . . . . . . . . . . . . . . . . . . . . 301,117 38,362,306InterXion Holding NV (b) . . . . . . . . . . . . . . . . . . . . . . . . . . . . . 246,117 16,563,674Jack Henry & Associates, Inc. (a) . . . . . . . . . . . . . . . . . . . . . . . . 87,119 13,946,010WEX, Inc. (b) . . . . . . . . . . . . . . . . . . . . . . . . . . . . . . . . . . . . . 122,891 24,671,597Worldpay, Inc. - Class A (b) . . . . . . . . . . . . . . . . . . . . . . . . . . . 275,885 27,938,874
156,543,614
Life Sciences Tools & Services—4.6%Illumina, Inc. (b) . . . . . . . . . . . . . . . . . . . . . . . . . . . . . . . . . . 48,903 17,950,335PRA Health Sciences, Inc. (a) (b) . . . . . . . . . . . . . . . . . . . . . . . . 114,188 12,582,376QIAGEN NV (b) . . . . . . . . . . . . . . . . . . . . . . . . . . . . . . . . . . . . 375,495 14,223,750Waters Corp. (b) . . . . . . . . . . . . . . . . . . . . . . . . . . . . . . . . . . . 60,588 11,795,272
56,551,733
BHFTII-140

Brighthouse Funds Trust II
Frontier Mid Cap Growth Portfolio
Schedule of Investments as of September 30, 2018 (Unaudited)
Common Stocks—(Continued)
Security Description Shares Value
Metals & Mining—1.3%Allegheny Technologies, Inc. (a) (b) . . . . . . . . . . . . . . . . . . . . . . 525,664 $ 15,533,371
Multiline Retail—2.3%Dollar General Corp. . . . . . . . . . . . . . . . . . . . . . . . . . . . . . . . . 160,328 17,523,851Dollar Tree, Inc. (a) (b) . . . . . . . . . . . . . . . . . . . . . . . . . . . . . . 127,226 10,375,280
27,899,131
Oil, Gas & Consumable Fuels—1.5%Carrizo Oil & Gas, Inc. (a) (b) . . . . . . . . . . . . . . . . . . . . . . . . . . 383,467 9,663,369Concho Resources, Inc. (a) (b) . . . . . . . . . . . . . . . . . . . . . . . . . . 59,183 9,040,203
18,703,572
Pharmaceuticals—0.7%Nektar Therapeutics (a) (b) . . . . . . . . . . . . . . . . . . . . . . . . . . . 136,193 8,302,325
Road & Rail—0.8%Knight-Swift Transportation Holdings, Inc. (a) . . . . . . . . . . . . . . . . 304,588 10,502,194
Semiconductors & Semiconductor Equipment—7.6%Lam Research Corp. . . . . . . . . . . . . . . . . . . . . . . . . . . . . . . . . 67,380 10,221,546Marvell Technology Group, Ltd. . . . . . . . . . . . . . . . . . . . . . . . . . 813,437 15,699,334Monolithic Power Systems, Inc. (a) . . . . . . . . . . . . . . . . . . . . . . . 90,729 11,389,211Qorvo, Inc. (a) (b) . . . . . . . . . . . . . . . . . . . . . . . . . . . . . . . . . 272,214 20,930,534Semtech Corp. (a) (b) . . . . . . . . . . . . . . . . . . . . . . . . . . . . . . . 341,565 18,991,014Silicon Laboratories, Inc. (a) (b) . . . . . . . . . . . . . . . . . . . . . . . . 69,266 6,358,619Universal Display Corp. (a) . . . . . . . . . . . . . . . . . . . . . . . . . . . . 89,384 10,538,374
94,128,632
Software—8.3%2U, Inc. (b) . . . . . . . . . . . . . . . . . . . . . . . . . . . . . . . . . . . . . . 57,495 4,323,049CDK Global, Inc. . . . . . . . . . . . . . . . . . . . . . . . . . . . . . . . . . . . 109,813 6,869,901Fortinet, Inc. (a) (b) . . . . . . . . . . . . . . . . . . . . . . . . . . . . . . . . 111,975 10,331,933Guidewire Software, Inc. (a) (b) . . . . . . . . . . . . . . . . . . . . . . . . 58,785 5,937,873Nutanix, Inc. - Class A (a) (b) . . . . . . . . . . . . . . . . . . . . . . . . . . 148,154 6,329,139ServiceNow, Inc. (b) . . . . . . . . . . . . . . . . . . . . . . . . . . . . . . . . 81,442 15,932,499Splunk, Inc. (b) . . . . . . . . . . . . . . . . . . . . . . . . . . . . . . . . . . . 133,851 16,183,924SS&C Technologies Holdings, Inc. . . . . . . . . . . . . . . . . . . . . . . . . 455,914 25,909,593Workday, Inc. - Class A (b) . . . . . . . . . . . . . . . . . . . . . . . . . . . . 69,509 10,146,924
101,964,835
Specialty Retail—6.6%Advance Auto Parts, Inc. . . . . . . . . . . . . . . . . . . . . . . . . . . . . . . 95,158 16,017,946Carvana Co. (a) (b) . . . . . . . . . . . . . . . . . . . . . . . . . . . . . . . . . 114,285 6,753,101O’Reilly Automotive, Inc. (b) . . . . . . . . . . . . . . . . . . . . . . . . . . . 84,604 29,384,661Ross Stores, Inc. . . . . . . . . . . . . . . . . . . . . . . . . . . . . . . . . . . . 165,449 16,395,996Ulta Salon Cosmetics & Fragrance, Inc. (b) . . . . . . . . . . . . . . . . . . 45,628 12,872,571
81,424,275
Trading Companies & Distributors—1.2%Beacon Roofing Supply, Inc. (a) (b) . . . . . . . . . . . . . . . . . . . . . . 135,223 4,893,720HD Supply Holdings, Inc. (b) . . . . . . . . . . . . . . . . . . . . . . . . . . . 223,126 9,547,562
14,441,282
Total Common Stocks(Cost $903,340,843) . . . . . . . . . . . . . . . . . . . . . . . . . . . . . 1,230,350,090
Short-Term Investment—0.8%
Security DescriptionPrincipalAmount* Value
Repurchase Agreement—0.8%Fixed Income Clearing Corp.
Repurchase Agreement dated 09/28/18 at 1.000%, due on10/01/18 with a maturity value of $9,325,209; collateralized byU.S. Treasury Note at 2.250%, maturing 10/31/24, with a marketvalue of $9,513,798. . . . . . . . . . . . . . . . . . . . . . . . . . . . . . . . 9,324,432 $9,324,432
Total Short-Term Investments(Cost $9,324,432) . . . . . . . . . . . . . . . . . . . . . . . . . . . . . . . . . 9,324,432
Securities Lending Reinvestments (c)—19.0%
Certificates of Deposit—11.3%Banco Del Estado De Chile New York
2.419%, 3M LIBOR + 0.100%, 11/14/18 (d) . . . . . . . . . . . . . . . 2,000,000 1,999,9662.466%, 1M LIBOR + 0.250%, 03/20/19 (d) . . . . . . . . . . . . . . . 4,000,000 3,999,792
Banco Santander S.A.2.340%, 11/07/18 . . . . . . . . . . . . . . . . . . . . . . . . . . . . . . . . 5,000,000 5,000,410
Bank of MontrealZero Coupon, 10/31/18 . . . . . . . . . . . . . . . . . . . . . . . . . . . . . 4,989,344 4,990,312
Bank of Montreal (Chicago)2.371%, 3M LIBOR + 0.030%, 11/06/18 (d) . . . . . . . . . . . . . . . 2,000,000 1,999,996
Bank of Nova Scotia2.618%, 3M LIBOR + 0.280%, 03/20/19 (d) . . . . . . . . . . . . . . . 4,750,000 4,754,532
Barclays Bank plc2.304%, 1M LIBOR + 0.200%, 02/04/19 (d) . . . . . . . . . . . . . . . 3,000,000 2,999,3912.500%, 02/01/19 . . . . . . . . . . . . . . . . . . . . . . . . . . . . . . . . 2,000,000 1,999,972
BNP Paribas S.A. New York2.574%, 1M LIBOR + 0.470%, 12/04/18 (d) . . . . . . . . . . . . . . . 4,000,000 4,002,348
Canadian Imperial Bank of Commerce2.459%, 3M LIBOR + 0.120%, 01/14/19 (d) . . . . . . . . . . . . . . . 4,000,000 4,001,188
Commonwealth Bank of Australia2.358%, 1M LIBOR + 0.210%, 09/13/19 (d) . . . . . . . . . . . . . . . 4,000,000 4,000,0002.487%, 3M LIBOR + 0.140%, 04/23/19 (d) . . . . . . . . . . . . . . . 1,000,000 1,000,358
Cooperative Rabobank UA2.479%, 3M LIBOR + 0.140%, 10/16/18 (d) . . . . . . . . . . . . . . . 3,500,000 3,500,2622.543%, 3M LIBOR + 0.200%, 04/05/19 (d) . . . . . . . . . . . . . . . 3,000,000 3,002,298
Credit Agricole S.A.2.463%, 1M LIBOR + 0.330%, 10/09/18 (d) . . . . . . . . . . . . . . . 2,500,000 2,500,100
Credit Industriel et Commercial (NY)Zero Coupon, 01/25/19 . . . . . . . . . . . . . . . . . . . . . . . . . . . . . 2,961,684 2,976,0902.364%, 1M LIBOR + 0.250%, 02/05/19 (d) . . . . . . . . . . . . . . . 3,500,000 3,501,656
Industrial & Commercial Bank of China, Ltd.2.500%, 10/24/18 . . . . . . . . . . . . . . . . . . . . . . . . . . . . . . . . 2,000,000 2,000,0262.500%, 11/15/18 . . . . . . . . . . . . . . . . . . . . . . . . . . . . . . . . 6,000,000 5,999,856
KBC Bank NV2.400%, 12/27/18 . . . . . . . . . . . . . . . . . . . . . . . . . . . . . . . . 3,000,000 3,000,000
Landesbank Baden-Wuettertemberg2.180%, 10/02/18 . . . . . . . . . . . . . . . . . . . . . . . . . . . . . . . . 4,000,000 4,000,008
Mitsubishi UFJ Trust and Banking Corp.Zero Coupon, 01/15/19 . . . . . . . . . . . . . . . . . . . . . . . . . . . . . 3,969,950 3,970,777
Mizuho Bank, Ltd., New York2.468%, 1M LIBOR + 0.250%, 11/26/18 (d) . . . . . . . . . . . . . . . 3,000,000 2,999,901
Natixis S.A. New York2.431%, 3M LIBOR + 0.090%, 05/10/19 (d) . . . . . . . . . . . . . . . 1,000,000 999,9212.504%, 1M LIBOR + 0.370%, 02/14/19 (d) . . . . . . . . . . . . . . . 2,000,000 2,001,338
BHFTII-141
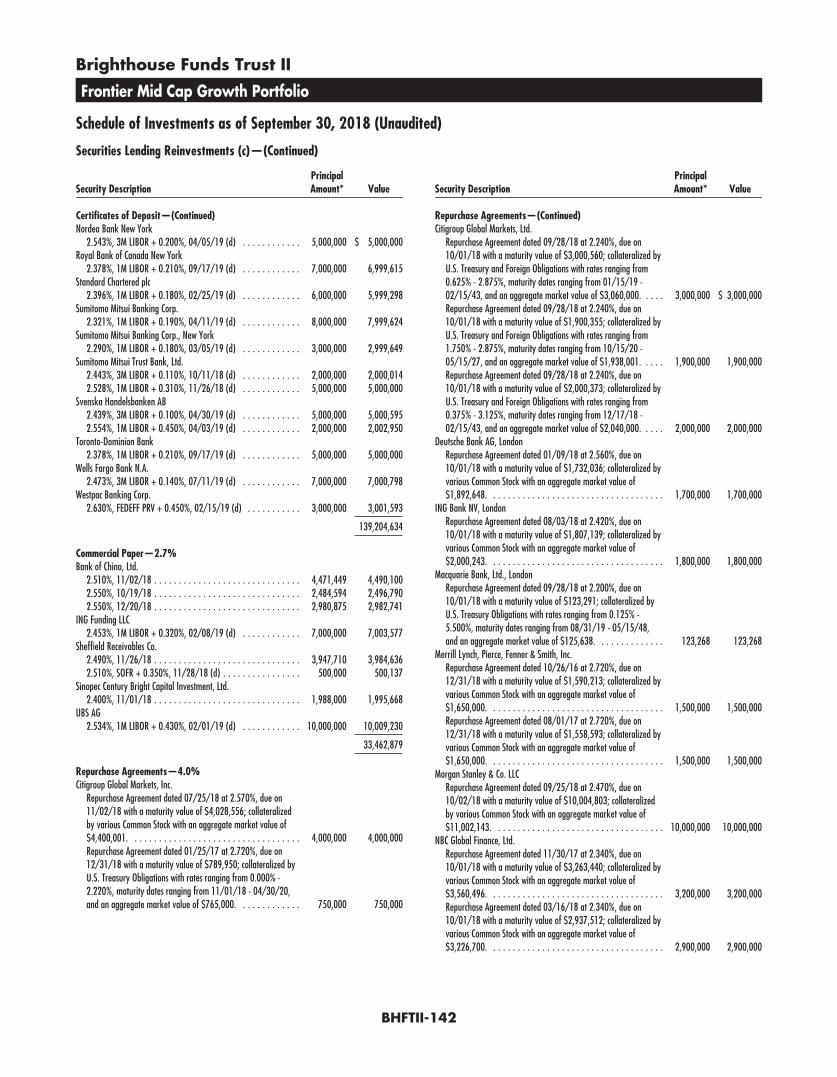
Brighthouse Funds Trust II
Frontier Mid Cap Growth Portfolio
Schedule of Investments as of September 30, 2018 (Unaudited)
Securities Lending Reinvestments (c)—(Continued)
Security DescriptionPrincipalAmount* Value
Certificates of Deposit—(Continued)Nordea Bank New York
2.543%, 3M LIBOR + 0.200%, 04/05/19 (d) . . . . . . . . . . . . 5,000,000 $ 5,000,000Royal Bank of Canada New York
2.378%, 1M LIBOR + 0.210%, 09/17/19 (d) . . . . . . . . . . . . 7,000,000 6,999,615Standard Chartered plc
2.396%, 1M LIBOR + 0.180%, 02/25/19 (d) . . . . . . . . . . . . 6,000,000 5,999,298Sumitomo Mitsui Banking Corp.
2.321%, 1M LIBOR + 0.190%, 04/11/19 (d) . . . . . . . . . . . . 8,000,000 7,999,624Sumitomo Mitsui Banking Corp., New York
2.290%, 1M LIBOR + 0.180%, 03/05/19 (d) . . . . . . . . . . . . 3,000,000 2,999,649Sumitomo Mitsui Trust Bank, Ltd.
2.443%, 3M LIBOR + 0.110%, 10/11/18 (d) . . . . . . . . . . . . 2,000,000 2,000,0142.528%, 1M LIBOR + 0.310%, 11/26/18 (d) . . . . . . . . . . . . 5,000,000 5,000,000
Svenska Handelsbanken AB2.439%, 3M LIBOR + 0.100%, 04/30/19 (d) . . . . . . . . . . . . 5,000,000 5,000,5952.554%, 1M LIBOR + 0.450%, 04/03/19 (d) . . . . . . . . . . . . 2,000,000 2,002,950
Toronto-Dominion Bank2.378%, 1M LIBOR + 0.210%, 09/17/19 (d) . . . . . . . . . . . . 5,000,000 5,000,000
Wells Fargo Bank N.A.2.473%, 3M LIBOR + 0.140%, 07/11/19 (d) . . . . . . . . . . . . 7,000,000 7,000,798
Westpac Banking Corp.2.630%, FEDEFF PRV + 0.450%, 02/15/19 (d) . . . . . . . . . . . 3,000,000 3,001,593
139,204,634
Commercial Paper—2.7%Bank of China, Ltd.
2.510%, 11/02/18 . . . . . . . . . . . . . . . . . . . . . . . . . . . . . . 4,471,449 4,490,1002.550%, 10/19/18 . . . . . . . . . . . . . . . . . . . . . . . . . . . . . . 2,484,594 2,496,7902.550%, 12/20/18 . . . . . . . . . . . . . . . . . . . . . . . . . . . . . . 2,980,875 2,982,741
ING Funding LLC2.453%, 1M LIBOR + 0.320%, 02/08/19 (d) . . . . . . . . . . . . 7,000,000 7,003,577
Sheffield Receivables Co.2.490%, 11/26/18 . . . . . . . . . . . . . . . . . . . . . . . . . . . . . . 3,947,710 3,984,6362.510%, SOFR + 0.350%, 11/28/18 (d) . . . . . . . . . . . . . . . . 500,000 500,137
Sinopec Century Bright Capital Investment, Ltd.2.400%, 11/01/18 . . . . . . . . . . . . . . . . . . . . . . . . . . . . . . 1,988,000 1,995,668
UBS AG2.534%, 1M LIBOR + 0.430%, 02/01/19 (d) . . . . . . . . . . . . 10,000,000 10,009,230
33,462,879
Repurchase Agreements—4.0%Citigroup Global Markets, Inc.
Repurchase Agreement dated 07/25/18 at 2.570%, due on11/02/18 with a maturity value of $4,028,556; collateralizedby various Common Stock with an aggregate market value of$4,400,001. . . . . . . . . . . . . . . . . . . . . . . . . . . . . . . . . . . 4,000,000 4,000,000Repurchase Agreement dated 01/25/17 at 2.720%, due on12/31/18 with a maturity value of $789,950; collateralized byU.S. Treasury Obligations with rates ranging from 0.000% -2.220%, maturity dates ranging from 11/01/18 - 04/30/20,and an aggregate market value of $765,000. . . . . . . . . . . . . 750,000 750,000
Security DescriptionPrincipalAmount* Value
Repurchase Agreements—(Continued)Citigroup Global Markets, Ltd.
Repurchase Agreement dated 09/28/18 at 2.240%, due on10/01/18 with a maturity value of $3,000,560; collateralized byU.S. Treasury and Foreign Obligations with rates ranging from0.625% - 2.875%, maturity dates ranging from 01/15/19 -02/15/43, and an aggregate market value of $3,060,000. . . . . 3,000,000 $ 3,000,000Repurchase Agreement dated 09/28/18 at 2.240%, due on10/01/18 with a maturity value of $1,900,355; collateralized byU.S. Treasury and Foreign Obligations with rates ranging from1.750% - 2.875%, maturity dates ranging from 10/15/20 -05/15/27, and an aggregate market value of $1,938,001. . . . . 1,900,000 1,900,000Repurchase Agreement dated 09/28/18 at 2.240%, due on10/01/18 with a maturity value of $2,000,373; collateralized byU.S. Treasury and Foreign Obligations with rates ranging from0.375% - 3.125%, maturity dates ranging from 12/17/18 -02/15/43, and an aggregate market value of $2,040,000. . . . . 2,000,000 2,000,000
Deutsche Bank AG, LondonRepurchase Agreement dated 01/09/18 at 2.560%, due on10/01/18 with a maturity value of $1,732,036; collateralized byvarious Common Stock with an aggregate market value of$1,892,648. . . . . . . . . . . . . . . . . . . . . . . . . . . . . . . . . . . . 1,700,000 1,700,000
ING Bank NV, LondonRepurchase Agreement dated 08/03/18 at 2.420%, due on10/01/18 with a maturity value of $1,807,139; collateralized byvarious Common Stock with an aggregate market value of$2,000,243. . . . . . . . . . . . . . . . . . . . . . . . . . . . . . . . . . . . 1,800,000 1,800,000
Macquarie Bank, Ltd., LondonRepurchase Agreement dated 09/28/18 at 2.200%, due on10/01/18 with a maturity value of $123,291; collateralized byU.S. Treasury Obligations with rates ranging from 0.125% -5.500%, maturity dates ranging from 08/31/19 - 05/15/48,and an aggregate market value of $125,638. . . . . . . . . . . . . . 123,268 123,268
Merrill Lynch, Pierce, Fenner & Smith, Inc.Repurchase Agreement dated 10/26/16 at 2.720%, due on12/31/18 with a maturity value of $1,590,213; collateralized byvarious Common Stock with an aggregate market value of$1,650,000. . . . . . . . . . . . . . . . . . . . . . . . . . . . . . . . . . . . 1,500,000 1,500,000Repurchase Agreement dated 08/01/17 at 2.720%, due on12/31/18 with a maturity value of $1,558,593; collateralized byvarious Common Stock with an aggregate market value of$1,650,000. . . . . . . . . . . . . . . . . . . . . . . . . . . . . . . . . . . . 1,500,000 1,500,000
Morgan Stanley & Co. LLCRepurchase Agreement dated 09/25/18 at 2.470%, due on10/02/18 with a maturity value of $10,004,803; collateralizedby various Common Stock with an aggregate market value of$11,002,143. . . . . . . . . . . . . . . . . . . . . . . . . . . . . . . . . . . 10,000,000 10,000,000
NBC Global Finance, Ltd.Repurchase Agreement dated 11/30/17 at 2.340%, due on10/01/18 with a maturity value of $3,263,440; collateralized byvarious Common Stock with an aggregate market value of$3,560,496. . . . . . . . . . . . . . . . . . . . . . . . . . . . . . . . . . . . 3,200,000 3,200,000Repurchase Agreement dated 03/16/18 at 2.340%, due on10/01/18 with a maturity value of $2,937,512; collateralized byvarious Common Stock with an aggregate market value of$3,226,700. . . . . . . . . . . . . . . . . . . . . . . . . . . . . . . . . . . . 2,900,000 2,900,000
BHFTII-142

Brighthouse Funds Trust II
Frontier Mid Cap Growth Portfolio
Schedule of Investments as of September 30, 2018 (Unaudited)
Securities Lending Reinvestments (c)—(Continued)
Security DescriptionPrincipalAmount* Value
Repurchase Agreements—(Continued)Societe Generale
Repurchase Agreement dated 03/08/18 at 2.310%, due on10/01/18 with a maturity value of $3,850,474; collateralized byU.S. Treasury Obligations with rates ranging from 0.000% -4.250%, maturity dates ranging from 02/07/19 - 02/15/47, andvarious Common Stock with an aggregate market value of$4,220,464. . . . . . . . . . . . . . . . . . . . . . . . . . . . . . . . . . . . . 3,800,000 $ 3,800,000Repurchase Agreement dated 03/16/18 at 2.310%, due on10/01/18 with a maturity value of $4,658,738; collateralized byU.S. Treasury Obligations with rates ranging from 0.000% -4.250%, maturity dates ranging from 02/07/19 - 02/15/47, andvarious Common Stock with an aggregate market value of$5,108,983. . . . . . . . . . . . . . . . . . . . . . . . . . . . . . . . . . . . . 4,600,000 4,600,000Repurchase Agreement dated 03/21/18 at 2.310%, due on10/01/18 with a maturity value of $2,024,897; collateralized byU.S. Treasury Obligations with rates ranging from 0.000% -4.250%, maturity dates ranging from 02/07/19 - 02/15/47, andvarious Common Stock with an aggregate market value of$2,221,297. . . . . . . . . . . . . . . . . . . . . . . . . . . . . . . . . . . . . 2,000,000 2,000,000Repurchase Agreement dated 03/28/18 at 2.310%, due on10/01/18 with a maturity value of $4,756,396; collateralized byU.S. Treasury Obligations with rates ranging from 0.000% -4.250%, maturity dates ranging from 02/07/19 - 02/15/47, andvarious Common Stock with an aggregate market value of$5,220,047. . . . . . . . . . . . . . . . . . . . . . . . . . . . . . . . . . . . . 4,700,000 4,700,000
49,473,268
Time Deposits—1.0%Canadian Imperial Bank of Commerce
2.130%, 10/01/18 . . . . . . . . . . . . . . . . . . . . . . . . . . . . . . . 5,000,000 5,000,000Cooperative Rabobank UA New York
2.150%, 10/01/18 . . . . . . . . . . . . . . . . . . . . . . . . . . . . . . . 5,000,000 5,000,000DZ Bank AG
2.150%, 10/01/18 . . . . . . . . . . . . . . . . . . . . . . . . . . . . . . . 1,000,000 1,000,000
Security DescriptionPrincipalAmount* Value
Time Deposits—(Continued)Nordea Bank New York
2.140%, 10/01/18 . . . . . . . . . . . . . . . . . . . . . . . . . . . . . 1,000,000 $ 1,000,000Svenska Handelsbanken AB
2.140%, 10/01/18 . . . . . . . . . . . . . . . . . . . . . . . . . . . . . 1,000,000 1,000,000
13,000,000
Total Securities Lending Reinvestments(Cost $235,110,218) . . . . . . . . . . . . . . . . . . . . . . . . . . . . 235,140,781
Total Investments—119.4%(Cost $1,147,775,493) . . . . . . . . . . . . . . . . . . . . . . . . . . . 1,474,815,303
Other assets and liabilities (net)—(19.4)% . . . . . . . . . . . . . . . . (239,469,291)
Net Assets—100.0% . . . . . . . . . . . . . . . . . . . . . . . . . . . $1,235,346,012
* Principal amount stated in U.S. dollars unless otherwise noted.(a) All or a portion of the security was held on loan. As of September 30, 2018, the
market value of securities loaned was $230,439,306 and the collateral receivedconsisted of cash in the amount of $235,016,874. The cash collateral investmentsare disclosed in the Schedule of Investments and categorized as Securities LendingReinvestments.
(b) Non-income producing security.(c) Represents investment of cash collateral received from securities on loan as of
September 30, 2018.(d) Variable or floating rate security. The stated rate represents the rate at
September 30, 2018. Maturity date shown for callable securities reflects theearliest possible call date. For securities based on a published reference index andspread, the index and spread are indicated in the description above. For certainvariable rate securities, the coupon rate is determined by the issuer/agent basedon current market conditions. For certain asset- and mortgage-backed securities,the coupon rate may fluctuate based on changes of the underlying collateral orprepayments of principal. These securities do not indicate a reference index andspread in their description above.
(FEDEFF PRV)— Effective Federal Funds Rate(LIBOR)— London Interbank Offered Rate(SOFR)— Secured Overnight Financing Rate
BHFTII-143
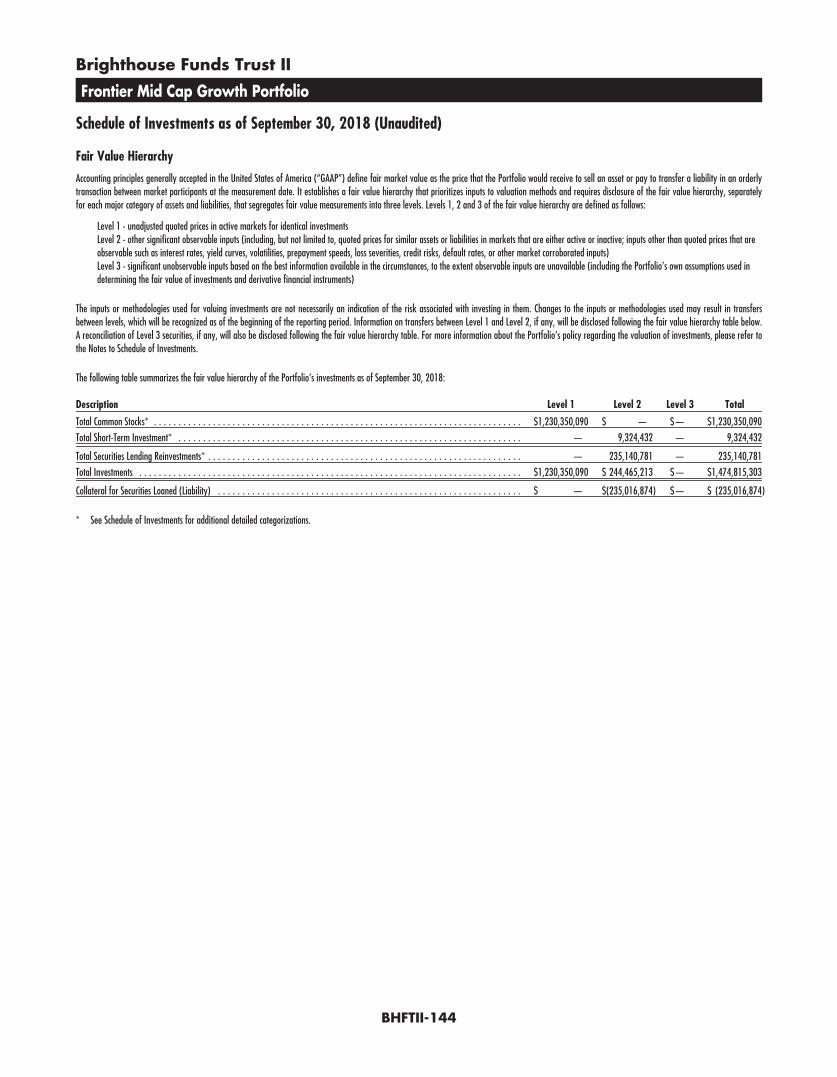
Brighthouse Funds Trust II
Frontier Mid Cap Growth Portfolio
Schedule of Investments as of September 30, 2018 (Unaudited)
Fair Value Hierarchy
Accounting principles generally accepted in the United States of America (“GAAP”) define fair market value as the price that the Portfolio would receive to sell an asset or pay to transfer a liability in an orderlytransaction between market participants at the measurement date. It establishes a fair value hierarchy that prioritizes inputs to valuation methods and requires disclosure of the fair value hierarchy, separatelyfor each major category of assets and liabilities, that segregates fair value measurements into three levels. Levels 1, 2 and 3 of the fair value hierarchy are defined as follows:
Level 1 - unadjusted quoted prices in active markets for identical investmentsLevel 2 - other significant observable inputs (including, but not limited to, quoted prices for similar assets or liabilities in markets that are either active or inactive; inputs other than quoted prices that areobservable such as interest rates, yield curves, volatilities, prepayment speeds, loss severities, credit risks, default rates, or other market corroborated inputs)Level 3 - significant unobservable inputs based on the best information available in the circumstances, to the extent observable inputs are unavailable (including the Portfolio’s own assumptions used indetermining the fair value of investments and derivative financial instruments)
The inputs or methodologies used for valuing investments are not necessarily an indication of the risk associated with investing in them. Changes to the inputs or methodologies used may result in transfersbetween levels, which will be recognized as of the beginning of the reporting period. Information on transfers between Level 1 and Level 2, if any, will be disclosed following the fair value hierarchy table below.A reconciliation of Level 3 securities, if any, will also be disclosed following the fair value hierarchy table. For more information about the Portfolio’s policy regarding the valuation of investments, please refer tothe Notes to Schedule of Investments.
The following table summarizes the fair value hierarchy of the Portfolio’s investments as of September 30, 2018:
Description Level 1 Level 2 Level 3 Total
Total Common Stocks* . . . . . . . . . . . . . . . . . . . . . . . . . . . . . . . . . . . . . . . . . . . . . . . . . . . . . . . . . . . . . . . . . . . . . . . . . . . $1,230,350,090 $ — $— $1,230,350,090
Total Short-Term Investment* . . . . . . . . . . . . . . . . . . . . . . . . . . . . . . . . . . . . . . . . . . . . . . . . . . . . . . . . . . . . . . . . . . . . . . — 9,324,432 — 9,324,432
Total Securities Lending Reinvestments* . . . . . . . . . . . . . . . . . . . . . . . . . . . . . . . . . . . . . . . . . . . . . . . . . . . . . . . . . . . . . . . . — 235,140,781 — 235,140,781
Total Investments . . . . . . . . . . . . . . . . . . . . . . . . . . . . . . . . . . . . . . . . . . . . . . . . . . . . . . . . . . . . . . . . . . . . . . . . . . . . . . $1,230,350,090 $ 244,465,213 $— $1,474,815,303
Collateral for Securities Loaned (Liability) . . . . . . . . . . . . . . . . . . . . . . . . . . . . . . . . . . . . . . . . . . . . . . . . . . . . . . . . . . . . . . $ — $(235,016,874) $— $ (235,016,874)
* See Schedule of Investments for additional detailed categorizations.
BHFTII-144
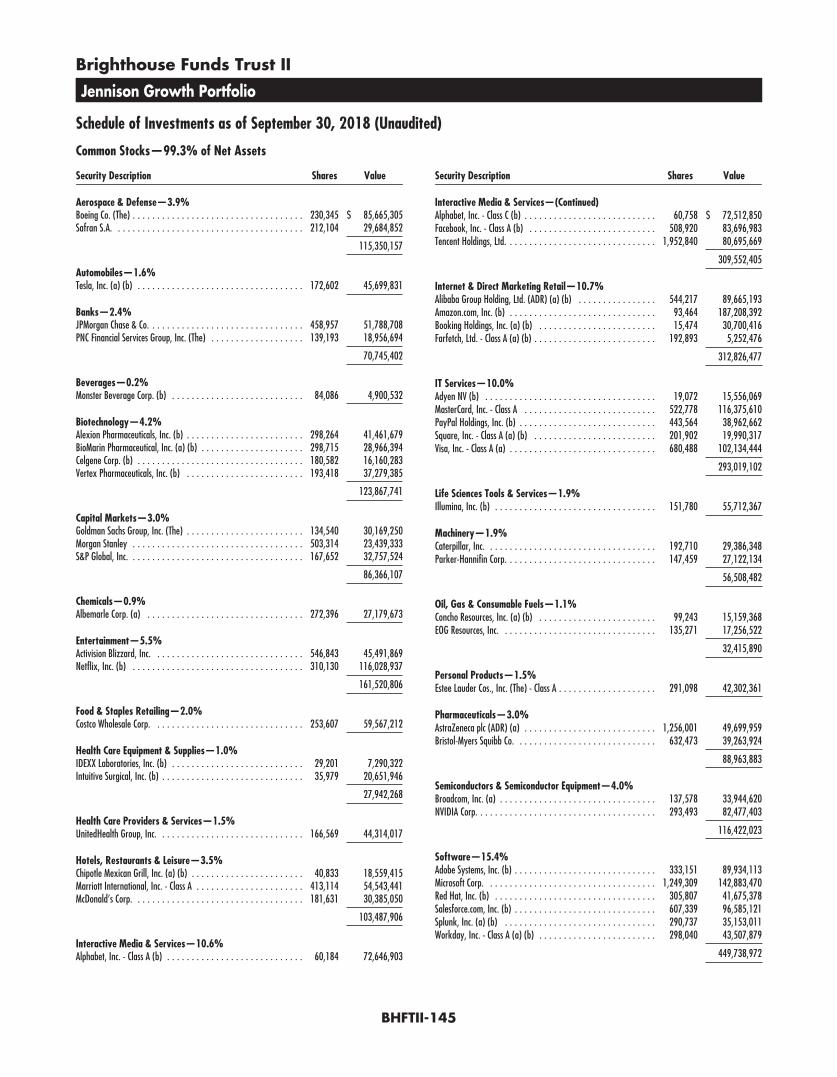
Brighthouse Funds Trust II
Jennison Growth Portfolio
Schedule of Investments as of September 30, 2018 (Unaudited)
Common Stocks—99.3% of Net Assets
Security Description Shares Value
Aerospace & Defense—3.9%Boeing Co. (The) . . . . . . . . . . . . . . . . . . . . . . . . . . . . . . . . . . . 230,345 $ 85,665,305Safran S.A. . . . . . . . . . . . . . . . . . . . . . . . . . . . . . . . . . . . . . . 212,104 29,684,852
115,350,157
Automobiles—1.6%Tesla, Inc. (a) (b) . . . . . . . . . . . . . . . . . . . . . . . . . . . . . . . . . . 172,602 45,699,831
Banks—2.4%JPMorgan Chase & Co. . . . . . . . . . . . . . . . . . . . . . . . . . . . . . . . 458,957 51,788,708PNC Financial Services Group, Inc. (The) . . . . . . . . . . . . . . . . . . . 139,193 18,956,694
70,745,402
Beverages—0.2%Monster Beverage Corp. (b) . . . . . . . . . . . . . . . . . . . . . . . . . . . 84,086 4,900,532
Biotechnology—4.2%Alexion Pharmaceuticals, Inc. (b) . . . . . . . . . . . . . . . . . . . . . . . . 298,264 41,461,679BioMarin Pharmaceutical, Inc. (a) (b) . . . . . . . . . . . . . . . . . . . . . 298,715 28,966,394Celgene Corp. (b) . . . . . . . . . . . . . . . . . . . . . . . . . . . . . . . . . . 180,582 16,160,283Vertex Pharmaceuticals, Inc. (b) . . . . . . . . . . . . . . . . . . . . . . . . 193,418 37,279,385
123,867,741
Capital Markets—3.0%Goldman Sachs Group, Inc. (The) . . . . . . . . . . . . . . . . . . . . . . . . 134,540 30,169,250Morgan Stanley . . . . . . . . . . . . . . . . . . . . . . . . . . . . . . . . . . . 503,314 23,439,333S&P Global, Inc. . . . . . . . . . . . . . . . . . . . . . . . . . . . . . . . . . . . 167,652 32,757,524
86,366,107
Chemicals—0.9%Albemarle Corp. (a) . . . . . . . . . . . . . . . . . . . . . . . . . . . . . . . . 272,396 27,179,673
Entertainment—5.5%Activision Blizzard, Inc. . . . . . . . . . . . . . . . . . . . . . . . . . . . . . . 546,843 45,491,869Netflix, Inc. (b) . . . . . . . . . . . . . . . . . . . . . . . . . . . . . . . . . . . 310,130 116,028,937
161,520,806
Food & Staples Retailing—2.0%Costco Wholesale Corp. . . . . . . . . . . . . . . . . . . . . . . . . . . . . . . 253,607 59,567,212
Health Care Equipment & Supplies—1.0%IDEXX Laboratories, Inc. (b) . . . . . . . . . . . . . . . . . . . . . . . . . . . 29,201 7,290,322Intuitive Surgical, Inc. (b) . . . . . . . . . . . . . . . . . . . . . . . . . . . . . 35,979 20,651,946
27,942,268
Health Care Providers & Services—1.5%UnitedHealth Group, Inc. . . . . . . . . . . . . . . . . . . . . . . . . . . . . . 166,569 44,314,017
Hotels, Restaurants & Leisure—3.5%Chipotle Mexican Grill, Inc. (a) (b) . . . . . . . . . . . . . . . . . . . . . . . 40,833 18,559,415Marriott International, Inc. - Class A . . . . . . . . . . . . . . . . . . . . . . 413,114 54,543,441McDonald’s Corp. . . . . . . . . . . . . . . . . . . . . . . . . . . . . . . . . . . 181,631 30,385,050
103,487,906
Interactive Media & Services—10.6%Alphabet, Inc. - Class A (b) . . . . . . . . . . . . . . . . . . . . . . . . . . . . 60,184 72,646,903
Security Description Shares Value
Interactive Media & Services—(Continued)Alphabet, Inc. - Class C (b) . . . . . . . . . . . . . . . . . . . . . . . . . . . 60,758 $ 72,512,850Facebook, Inc. - Class A (b) . . . . . . . . . . . . . . . . . . . . . . . . . . 508,920 83,696,983Tencent Holdings, Ltd. . . . . . . . . . . . . . . . . . . . . . . . . . . . . . . 1,952,840 80,695,669
309,552,405
Internet & Direct Marketing Retail—10.7%Alibaba Group Holding, Ltd. (ADR) (a) (b) . . . . . . . . . . . . . . . . 544,217 89,665,193Amazon.com, Inc. (b) . . . . . . . . . . . . . . . . . . . . . . . . . . . . . . 93,464 187,208,392Booking Holdings, Inc. (a) (b) . . . . . . . . . . . . . . . . . . . . . . . . 15,474 30,700,416Farfetch, Ltd. - Class A (a) (b) . . . . . . . . . . . . . . . . . . . . . . . . . 192,893 5,252,476
312,826,477
IT Services—10.0%Adyen NV (b) . . . . . . . . . . . . . . . . . . . . . . . . . . . . . . . . . . . 19,072 15,556,069MasterCard, Inc. - Class A . . . . . . . . . . . . . . . . . . . . . . . . . . . 522,778 116,375,610PayPal Holdings, Inc. (b) . . . . . . . . . . . . . . . . . . . . . . . . . . . . 443,564 38,962,662Square, Inc. - Class A (a) (b) . . . . . . . . . . . . . . . . . . . . . . . . . 201,902 19,990,317Visa, Inc. - Class A (a) . . . . . . . . . . . . . . . . . . . . . . . . . . . . . . 680,488 102,134,444
293,019,102
Life Sciences Tools & Services—1.9%Illumina, Inc. (b) . . . . . . . . . . . . . . . . . . . . . . . . . . . . . . . . . 151,780 55,712,367
Machinery—1.9%Caterpillar, Inc. . . . . . . . . . . . . . . . . . . . . . . . . . . . . . . . . . . 192,710 29,386,348Parker-Hannifin Corp. . . . . . . . . . . . . . . . . . . . . . . . . . . . . . . 147,459 27,122,134
56,508,482
Oil, Gas & Consumable Fuels—1.1%Concho Resources, Inc. (a) (b) . . . . . . . . . . . . . . . . . . . . . . . . 99,243 15,159,368EOG Resources, Inc. . . . . . . . . . . . . . . . . . . . . . . . . . . . . . . . 135,271 17,256,522
32,415,890
Personal Products—1.5%Estee Lauder Cos., Inc. (The) - Class A . . . . . . . . . . . . . . . . . . . . 291,098 42,302,361
Pharmaceuticals—3.0%AstraZeneca plc (ADR) (a) . . . . . . . . . . . . . . . . . . . . . . . . . . . 1,256,001 49,699,959Bristol-Myers Squibb Co. . . . . . . . . . . . . . . . . . . . . . . . . . . . . 632,473 39,263,924
88,963,883
Semiconductors & Semiconductor Equipment—4.0%Broadcom, Inc. (a) . . . . . . . . . . . . . . . . . . . . . . . . . . . . . . . . 137,578 33,944,620NVIDIA Corp. . . . . . . . . . . . . . . . . . . . . . . . . . . . . . . . . . . . . 293,493 82,477,403
116,422,023
Software—15.4%Adobe Systems, Inc. (b) . . . . . . . . . . . . . . . . . . . . . . . . . . . . . 333,151 89,934,113Microsoft Corp. . . . . . . . . . . . . . . . . . . . . . . . . . . . . . . . . . . 1,249,309 142,883,470Red Hat, Inc. (b) . . . . . . . . . . . . . . . . . . . . . . . . . . . . . . . . . 305,807 41,675,378Salesforce.com, Inc. (b) . . . . . . . . . . . . . . . . . . . . . . . . . . . . . 607,339 96,585,121Splunk, Inc. (a) (b) . . . . . . . . . . . . . . . . . . . . . . . . . . . . . . . 290,737 35,153,011Workday, Inc. - Class A (a) (b) . . . . . . . . . . . . . . . . . . . . . . . . 298,040 43,507,879
449,738,972
BHFTII-145

Brighthouse Funds Trust II
Jennison Growth Portfolio
Schedule of Investments as of September 30, 2018 (Unaudited)
Common Stocks—(Continued)
Security Description
Shares/PrincipalAmount* Value
Specialty Retail—1.8%Home Depot, Inc. (The) . . . . . . . . . . . . . . . . . . . . . . . . . . . . . 254,127 $ 52,642,408
Technology Hardware, Storage & Peripherals—5.1%Apple, Inc. . . . . . . . . . . . . . . . . . . . . . . . . . . . . . . . . . . . . . 654,282 147,697,619
Textiles, Apparel & Luxury Goods—2.6%Kering . . . . . . . . . . . . . . . . . . . . . . . . . . . . . . . . . . . . . . . . 68,621 36,693,100NIKE, Inc. - Class B . . . . . . . . . . . . . . . . . . . . . . . . . . . . . . . . 472,804 40,055,955
76,749,055
Total Common Stocks(Cost $1,635,658,221) . . . . . . . . . . . . . . . . . . . . . . . . . . . 2,905,492,696
Securities Lending Reinvestments (c)—13.9%
Bank Note—0.3%Bank of America N.A.
2.398%, 1M LIBOR + 0.250%, 11/13/18 (d) . . . . . . . . . . . . 8,000,000 8,000,000
Certificates of Deposit—5.9%Banco Del Estado De Chile New York
2.419%, 3M LIBOR + 0.100%, 11/14/18 (d) . . . . . . . . . . . . 6,000,000 5,999,8982.466%, 1M LIBOR + 0.250%, 03/20/19 (d) . . . . . . . . . . . . 3,000,000 2,999,844
Banco Santander S.A.2.340%, 11/07/18 . . . . . . . . . . . . . . . . . . . . . . . . . . . . . 5,000,000 5,000,410
Bank of MontrealZero Coupon, 10/31/18 . . . . . . . . . . . . . . . . . . . . . . . . . . 6,985,081 6,986,437
Bank of Montreal (Chicago)2.371%, 3M LIBOR + 0.030%, 11/06/18 (d) . . . . . . . . . . . . 3,000,000 2,999,994
Bank of Nova Scotia2.618%, 3M LIBOR + 0.280%, 03/20/19 (d) . . . . . . . . . . . . 5,000,000 5,004,770
Barclays Bank plc2.304%, 1M LIBOR + 0.200%, 02/04/19 (d) . . . . . . . . . . . . 3,500,000 3,499,2902.500%, 02/01/19 . . . . . . . . . . . . . . . . . . . . . . . . . . . . . 3,000,000 2,999,958
BNP Paribas S.A. New York2.574%, 1M LIBOR + 0.470%, 12/04/18 (d) . . . . . . . . . . . . 4,000,000 4,002,348
Canadian Imperial Bank of Commerce2.459%, 3M LIBOR + 0.120%, 01/14/19 (d) . . . . . . . . . . . . 4,000,000 4,001,188
Chiba Bank, Ltd., New York2.190%, 10/05/18 . . . . . . . . . . . . . . . . . . . . . . . . . . . . . 4,000,000 3,999,924
Commonwealth Bank of Australia2.358%, 1M LIBOR + 0.210%, 09/13/19 (d) . . . . . . . . . . . . 4,500,000 4,500,0002.487%, 3M LIBOR + 0.140%, 04/23/19 (d) . . . . . . . . . . . . 2,000,000 2,000,716
Cooperative Rabobank UA2.479%, 3M LIBOR + 0.140%, 10/16/18 (d) . . . . . . . . . . . . 7,500,000 7,500,5622.543%, 3M LIBOR + 0.200%, 04/05/19 (d) . . . . . . . . . . . . 3,000,000 3,002,298
Credit Agricole S.A.2.463%, 1M LIBOR + 0.330%, 10/09/18 (d) . . . . . . . . . . . . 3,000,000 3,000,120
Credit Industriel et CommercialZero Coupon, 01/25/19 . . . . . . . . . . . . . . . . . . . . . . . . . . 7,330,169 7,365,823
Industrial & Commercial Bank of China, Ltd.2.500%, 10/24/18 . . . . . . . . . . . . . . . . . . . . . . . . . . . . . 3,000,000 3,000,0392.530%, 12/24/18 . . . . . . . . . . . . . . . . . . . . . . . . . . . . . 5,000,000 4,999,890
Security DescriptionPrincipalAmount* Value
Certificates of Deposit—(Continued)KBC Bank NV
2.400%, 12/27/18 . . . . . . . . . . . . . . . . . . . . . . . . . . . . 5,000,000 $ 5,000,000Landesbank Baden-Wuettertemberg
2.180%, 10/02/18 . . . . . . . . . . . . . . . . . . . . . . . . . . . . 10,000,000 10,000,020Mitsubishi UFJ Trust and Banking Corp.
Zero Coupon, 01/15/19 . . . . . . . . . . . . . . . . . . . . . . . . . 4,962,437 4,963,471Mizuho Bank, Ltd., New York
2.468%, 1M LIBOR + 0.250%, 11/26/18 (d) . . . . . . . . . . . 5,000,000 4,999,835Natixis S.A. New York
2.431%, 3M LIBOR + 0.090%, 05/10/19 (d) . . . . . . . . . . . 3,000,000 2,999,7632.533%, 3M LIBOR + 0.190%, 02/01/19 (d) . . . . . . . . . . . 2,000,000 2,000,162
Royal Bank of Canada New York2.378%, 1M LIBOR + 0.210%, 09/17/19 (d) . . . . . . . . . . . 6,000,000 5,999,6702.381%, 1M LIBOR + 0.250%, 01/11/19 (d) . . . . . . . . . . . 4,000,000 4,001,320
Standard Chartered plc2.396%, 1M LIBOR + 0.180%, 02/25/19 (d) . . . . . . . . . . . 10,000,000 9,998,8302.551%, 1M LIBOR + 0.420%, 10/11/18 (d) . . . . . . . . . . . 2,000,000 2,000,100
Sumitomo Mitsui Banking Corp.2.321%, 1M LIBOR + 0.190%, 04/11/19 (d) . . . . . . . . . . . 7,000,000 6,999,671
Sumitomo Mitsui Banking Corp., New York2.276%, 1M LIBOR + 0.200%, 04/03/19 (d) . . . . . . . . . . . 2,001,364 1,999,7422.290%, 1M LIBOR + 0.180%, 03/05/19 (d) . . . . . . . . . . . 4,000,000 3,999,532
Sumitomo Mitsui Trust Bank, Ltd (NY)2.423%, 3M LIBOR + 0.090%, 10/18/18 (d) . . . . . . . . . . . 5,000,628 4,999,965
Sumitomo Mitsui Trust Bank, Ltd., London2.528%, 1M LIBOR + 0.310%, 11/26/18 (d) . . . . . . . . . . . 6,000,000 6,000,000
Svenska Handelsbanken AB2.439%, 3M LIBOR + 0.100%, 04/30/19 (d) . . . . . . . . . . . 5,000,000 5,000,595
Toronto-Dominion Bank2.378%, 1M LIBOR + 0.210%, 09/17/19 (d) . . . . . . . . . . . 3,000,000 3,000,000
Westpac Banking Corp.2.630%, FEDEFF PRV + 0.450%, 02/15/19 (d) . . . . . . . . . . 5,000,000 5,002,655
171,828,840
Commercial Paper—2.1%Bank of China, Ltd.
2.510%, 11/02/18 . . . . . . . . . . . . . . . . . . . . . . . . . . . . 8,942,897 8,980,2002.550%, 10/19/18 . . . . . . . . . . . . . . . . . . . . . . . . . . . . 3,975,350 3,994,8642.550%, 12/20/18 . . . . . . . . . . . . . . . . . . . . . . . . . . . . 2,980,875 2,982,741
ING Funding LLC2.453%, 1M LIBOR + 0.320%, 02/08/19 (d) . . . . . . . . . . . 10,000,000 10,005,110
LMA S.A. & LMA Americas2.470%, 11/13/18 . . . . . . . . . . . . . . . . . . . . . . . . . . . . 4,939,965 4,985,545
Sheffield Receivables Co.2.490%, 11/26/18 . . . . . . . . . . . . . . . . . . . . . . . . . . . . 6,908,493 6,973,1132.510%, SOFR + 0.350%, 11/28/18 (d) . . . . . . . . . . . . . . 500,000 500,137
Sinopec Century Bright Capital Investment, Ltd.2.400%, 11/01/18 . . . . . . . . . . . . . . . . . . . . . . . . . . . . 2,982,000 2,993,502
UBS AG2.534%, 1M LIBOR + 0.430%, 02/01/19 (d) . . . . . . . . . . . 15,000,000 15,013,845
Westpac Banking Corp.2.492%, 1M LIBOR + 0.280%, 05/24/19 (d) . . . . . . . . . . . 5,000,000 5,002,770
61,431,827
BHFTII-146

Brighthouse Funds Trust II
Jennison Growth Portfolio
Schedule of Investments as of September 30, 2018 (Unaudited)
Securities Lending Reinvestments (c)—(Continued)
Security DescriptionPrincipalAmount* Value
Master Demand Notes—0.1%Natixis Financial Products LLC
2.420%, OBFR + 0.250%, 10/01/18 (d) . . . . . . . . . . . . . . 4,000,000 $ 4,000,000
Repurchase Agreements—4.2%Citigroup Global Markets, Inc.
Repurchase Agreement dated 05/03/18 at 2.440%, due on10/05/18 with a maturity value of $10,105,056;collateralized by U.S. Treasury Obligations with rates rangingfrom 1.625% - 2.250%, maturity dates ranging from11/30/19 - 11/15/27, and various Common Stock with anaggregate market value of $10,542,861. . . . . . . . . . . . . . 10,000,000 10,000,000Repurchase Agreement dated 07/25/18 at 2.570%, due on11/02/18 with a maturity value of $6,042,833;collateralized by various Common Stock with an aggregatemarket value of $6,600,001. . . . . . . . . . . . . . . . . . . . . . . 6,000,000 6,000,000
Citigroup Global Markets, Ltd.Repurchase Agreement dated 09/28/18 at 2.240%, due on10/01/18 with a maturity value of $4,300,803;collateralized by U.S. Treasury and Foreign Obligations withrates ranging from 0.625% - 2.875%, maturity dates rangingfrom 01/15/19 - 02/15/43, and an aggregate market valueof $4,386,001. . . . . . . . . . . . . . . . . . . . . . . . . . . . . . . . 4,300,000 4,300,000Repurchase Agreement dated 09/28/18 at 2.240%, due on10/01/18 with a maturity value of $2,800,523;collateralized by U.S. Treasury and Foreign Obligations withrates ranging from 1.750% - 2.875%, maturity dates rangingfrom 10/15/20 - 05/15/27, and an aggregate market valueof $2,856,002. . . . . . . . . . . . . . . . . . . . . . . . . . . . . . . . 2,800,000 2,800,000Repurchase Agreement dated 09/28/18 at 2.240%, due on10/01/18 with a maturity value of $3,900,728;collateralized by U.S. Treasury and Foreign Obligations withrates ranging from 0.375% - 3.125%, maturity dates rangingfrom 12/17/18 - 02/15/43, and an aggregate market valueof $3,978,000. . . . . . . . . . . . . . . . . . . . . . . . . . . . . . . . 3,900,000 3,900,000
Deutsche Bank AG, LondonRepurchase Agreement dated 01/09/18 at 2.560%, due on10/01/18 with a maturity value of $2,445,227;collateralized by various Common Stock with an aggregatemarket value of $2,671,974. . . . . . . . . . . . . . . . . . . . . . . 2,400,000 2,400,000
ING Bank NV, LondonRepurchase Agreement dated 08/03/18 at 2.420%, due on10/01/18 with a maturity value of $1,003,966;collateralized by various Common Stock with an aggregatemarket value of $1,111,246. . . . . . . . . . . . . . . . . . . . . . . 1,000,000 1,000,000
Macquarie Bank, Ltd., LondonRepurchase Agreement dated 09/28/18 at 2.200%, due on10/01/18 with a maturity value of $1,191,428;collateralized by U.S. Treasury Obligations with rates rangingfrom 0.125% - 5.500%, maturity dates ranging from08/31/19 - 05/15/48, and an aggregate market value of$1,214,108. . . . . . . . . . . . . . . . . . . . . . . . . . . . . . . . . . 1,191,210 1,191,210
Merrill Lynch, Pierce, Fenner & Smith, Inc.Repurchase Agreement dated 10/26/16 at 2.720%, due on12/31/18 with a maturity value of $4,770,640;collateralized by various Common Stock with an aggregatemarket value of $4,950,001. . . . . . . . . . . . . . . . . . . . . . . 4,500,000 4,500,000
Security DescriptionPrincipalAmount* Value
Repurchase Agreements—(Continued)Merrill Lynch, Pierce, Fenner & Smith, Inc.
Repurchase Agreement dated 08/01/17 at 2.720%, due on12/31/18 with a maturity value of $8,832,029;collateralized by various Common Stock with an aggregatemarket value of $9,350,001. . . . . . . . . . . . . . . . . . . . . . . 8,500,000 $ 8,500,000
Morgan Stanley & Co. LLCRepurchase Agreement dated 09/25/18 at 2.470%, due on10/02/18 with a maturity value of $20,009,606;collateralized by various Common Stock with an aggregatemarket value of $22,004,285. . . . . . . . . . . . . . . . . . . . . . 20,000,000 20,000,000
NBC Global Finance, Ltd.Repurchase Agreement dated 11/30/17 at 2.340%, due on10/01/18 with a maturity value of $4,691,195;collateralized by various Common Stock with an aggregatemarket value of $5,118,214. . . . . . . . . . . . . . . . . . . . . . . 4,600,000 4,600,000Repurchase Agreement dated 03/16/18 at 2.340%, due on10/01/18 with a maturity value of $4,254,327;collateralized by various Common Stock with an aggregatemarket value of $4,673,152. . . . . . . . . . . . . . . . . . . . . . . 4,200,000 4,200,000Repurchase Agreement dated 07/18/18 at 2.370%, due on10/05/18 with a maturity value of $5,026,004;collateralized by various Common Stock with an aggregatemarket value of $5,563,721. . . . . . . . . . . . . . . . . . . . . . . 5,000,000 5,000,000Repurchase Agreement dated 07/19/18 at 2.370%, due on10/05/18 with a maturity value of $7,538,513;collateralized by various Common Stock with an aggregatemarket value of $8,345,581. . . . . . . . . . . . . . . . . . . . . . . 7,500,000 7,500,000
Societe GeneraleRepurchase Agreement dated 03/28/18 at 2.310%, due on10/01/18 with a maturity value of $1,011,999;collateralized by U.S. Treasury Obligations with rates rangingfrom 0.000% - 4.250%, maturity dates ranging from02/07/19 - 02/15/47, and various Common Stock with anaggregate market value of $1,110,648. . . . . . . . . . . . . . . 1,000,000 1,000,000Repurchase Agreement dated 03/08/18 at 2.310%, due on10/01/18 with a maturity value of $5,471,726;collateralized by U.S. Treasury Obligations with rates rangingfrom 0.000% - 4.250%, maturity dates ranging from02/07/19 - 02/15/47, and various Common Stock with anaggregate market value of $5,997,501. . . . . . . . . . . . . . . 5,400,000 5,400,000Repurchase Agreement dated 03/16/18 at 2.310%, due on10/01/18 with a maturity value of $6,583,000;collateralized by U.S. Treasury Obligations with rates rangingfrom 0.000% - 4.250%, maturity dates ranging from02/07/19 - 02/15/47, and various Common Stock with anaggregate market value of $7,219,215. . . . . . . . . . . . . . . 6,500,000 6,500,000Repurchase Agreement dated 03/21/18 at 2.310%, due on10/01/18 with a maturity value of $2,024,897;collateralized by U.S. Treasury Obligations with rates rangingfrom 0.000% - 4.250%, maturity dates ranging from02/07/19 - 02/15/47, and various Common Stock with anaggregate market value of $2,221,297. . . . . . . . . . . . . . . 2,000,000 2,000,000Repurchase Agreement dated 04/18/18 at 2.340%, due on10/05/18 with a maturity value of $3,538,675;collateralized by U.S. Treasury Obligations with rates rangingfrom 0.000% - 4.250%, maturity dates ranging from02/07/19 - 02/15/47, and various Common Stock with anaggregate market value of $3,887,269. . . . . . . . . . . . . . . 3,500,000 3,500,000
BHFTII-147
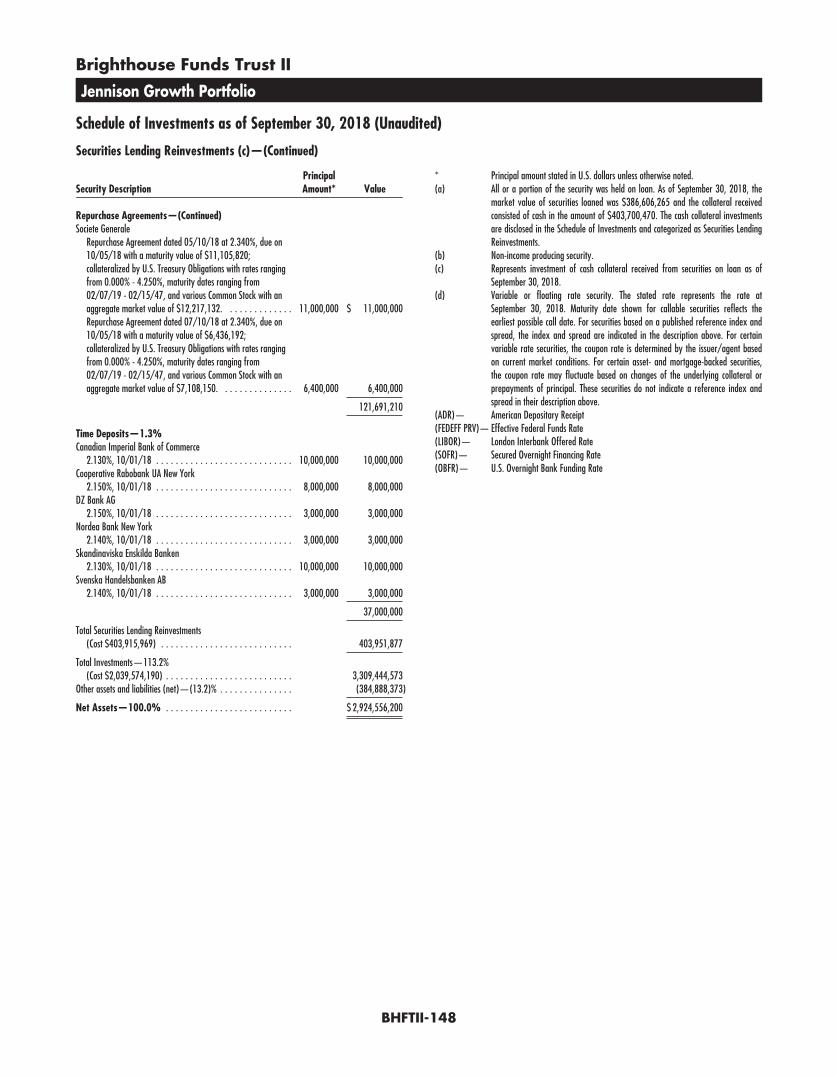
Brighthouse Funds Trust II
Jennison Growth Portfolio
Schedule of Investments as of September 30, 2018 (Unaudited)
Securities Lending Reinvestments (c)—(Continued)
Security DescriptionPrincipalAmount* Value
Repurchase Agreements—(Continued)Societe Generale
Repurchase Agreement dated 05/10/18 at 2.340%, due on10/05/18 with a maturity value of $11,105,820;collateralized by U.S. Treasury Obligations with rates rangingfrom 0.000% - 4.250%, maturity dates ranging from02/07/19 - 02/15/47, and various Common Stock with anaggregate market value of $12,217,132. . . . . . . . . . . . . . 11,000,000 $ 11,000,000Repurchase Agreement dated 07/10/18 at 2.340%, due on10/05/18 with a maturity value of $6,436,192;collateralized by U.S. Treasury Obligations with rates rangingfrom 0.000% - 4.250%, maturity dates ranging from02/07/19 - 02/15/47, and various Common Stock with anaggregate market value of $7,108,150. . . . . . . . . . . . . . . 6,400,000 6,400,000
121,691,210
Time Deposits—1.3%Canadian Imperial Bank of Commerce
2.130%, 10/01/18 . . . . . . . . . . . . . . . . . . . . . . . . . . . . 10,000,000 10,000,000Cooperative Rabobank UA New York
2.150%, 10/01/18 . . . . . . . . . . . . . . . . . . . . . . . . . . . . 8,000,000 8,000,000DZ Bank AG
2.150%, 10/01/18 . . . . . . . . . . . . . . . . . . . . . . . . . . . . 3,000,000 3,000,000Nordea Bank New York
2.140%, 10/01/18 . . . . . . . . . . . . . . . . . . . . . . . . . . . . 3,000,000 3,000,000Skandinaviska Enskilda Banken
2.130%, 10/01/18 . . . . . . . . . . . . . . . . . . . . . . . . . . . . 10,000,000 10,000,000Svenska Handelsbanken AB
2.140%, 10/01/18 . . . . . . . . . . . . . . . . . . . . . . . . . . . . 3,000,000 3,000,000
37,000,000
Total Securities Lending Reinvestments(Cost $403,915,969) . . . . . . . . . . . . . . . . . . . . . . . . . . . 403,951,877
Total Investments—113.2%(Cost $2,039,574,190) . . . . . . . . . . . . . . . . . . . . . . . . . . 3,309,444,573
Other assets and liabilities (net)—(13.2)% . . . . . . . . . . . . . . . (384,888,373)
Net Assets—100.0% . . . . . . . . . . . . . . . . . . . . . . . . . . $ 2,924,556,200
* Principal amount stated in U.S. dollars unless otherwise noted.(a) All or a portion of the security was held on loan. As of September 30, 2018, the
market value of securities loaned was $386,606,265 and the collateral receivedconsisted of cash in the amount of $403,700,470. The cash collateral investmentsare disclosed in the Schedule of Investments and categorized as Securities LendingReinvestments.
(b) Non-income producing security.(c) Represents investment of cash collateral received from securities on loan as of
September 30, 2018.(d) Variable or floating rate security. The stated rate represents the rate at
September 30, 2018. Maturity date shown for callable securities reflects theearliest possible call date. For securities based on a published reference index andspread, the index and spread are indicated in the description above. For certainvariable rate securities, the coupon rate is determined by the issuer/agent basedon current market conditions. For certain asset- and mortgage-backed securities,the coupon rate may fluctuate based on changes of the underlying collateral orprepayments of principal. These securities do not indicate a reference index andspread in their description above.
(ADR)— American Depositary Receipt(FEDEFF PRV)— Effective Federal Funds Rate(LIBOR)— London Interbank Offered Rate(SOFR)— Secured Overnight Financing Rate(OBFR)— U.S. Overnight Bank Funding Rate
BHFTII-148
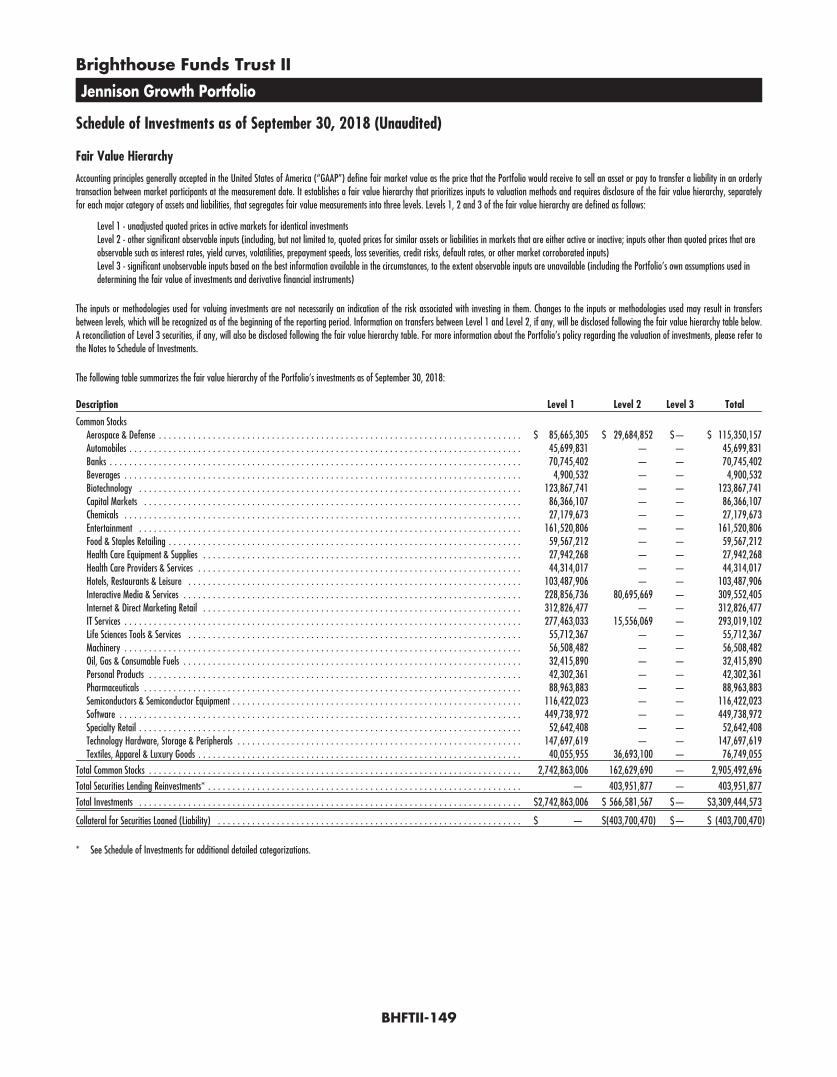
Brighthouse Funds Trust II
Jennison Growth Portfolio
Schedule of Investments as of September 30, 2018 (Unaudited)
Fair Value Hierarchy
Accounting principles generally accepted in the United States of America (“GAAP”) define fair market value as the price that the Portfolio would receive to sell an asset or pay to transfer a liability in an orderlytransaction between market participants at the measurement date. It establishes a fair value hierarchy that prioritizes inputs to valuation methods and requires disclosure of the fair value hierarchy, separatelyfor each major category of assets and liabilities, that segregates fair value measurements into three levels. Levels 1, 2 and 3 of the fair value hierarchy are defined as follows:
Level 1 - unadjusted quoted prices in active markets for identical investmentsLevel 2 - other significant observable inputs (including, but not limited to, quoted prices for similar assets or liabilities in markets that are either active or inactive; inputs other than quoted prices that areobservable such as interest rates, yield curves, volatilities, prepayment speeds, loss severities, credit risks, default rates, or other market corroborated inputs)Level 3 - significant unobservable inputs based on the best information available in the circumstances, to the extent observable inputs are unavailable (including the Portfolio’s own assumptions used indetermining the fair value of investments and derivative financial instruments)
The inputs or methodologies used for valuing investments are not necessarily an indication of the risk associated with investing in them. Changes to the inputs or methodologies used may result in transfersbetween levels, which will be recognized as of the beginning of the reporting period. Information on transfers between Level 1 and Level 2, if any, will be disclosed following the fair value hierarchy table below.A reconciliation of Level 3 securities, if any, will also be disclosed following the fair value hierarchy table. For more information about the Portfolio’s policy regarding the valuation of investments, please refer tothe Notes to Schedule of Investments.
The following table summarizes the fair value hierarchy of the Portfolio’s investments as of September 30, 2018:
Description Level 1 Level 2 Level 3 Total
Common StocksAerospace & Defense . . . . . . . . . . . . . . . . . . . . . . . . . . . . . . . . . . . . . . . . . . . . . . . . . . . . . . . . . . . . . . . . . . . . . . . . . . $ 85,665,305 $ 29,684,852 $— $ 115,350,157Automobiles . . . . . . . . . . . . . . . . . . . . . . . . . . . . . . . . . . . . . . . . . . . . . . . . . . . . . . . . . . . . . . . . . . . . . . . . . . . . . . . . 45,699,831 — — 45,699,831Banks . . . . . . . . . . . . . . . . . . . . . . . . . . . . . . . . . . . . . . . . . . . . . . . . . . . . . . . . . . . . . . . . . . . . . . . . . . . . . . . . . . . . 70,745,402 — — 70,745,402Beverages . . . . . . . . . . . . . . . . . . . . . . . . . . . . . . . . . . . . . . . . . . . . . . . . . . . . . . . . . . . . . . . . . . . . . . . . . . . . . . . . . 4,900,532 — — 4,900,532Biotechnology . . . . . . . . . . . . . . . . . . . . . . . . . . . . . . . . . . . . . . . . . . . . . . . . . . . . . . . . . . . . . . . . . . . . . . . . . . . . . . 123,867,741 — — 123,867,741Capital Markets . . . . . . . . . . . . . . . . . . . . . . . . . . . . . . . . . . . . . . . . . . . . . . . . . . . . . . . . . . . . . . . . . . . . . . . . . . . . . 86,366,107 — — 86,366,107Chemicals . . . . . . . . . . . . . . . . . . . . . . . . . . . . . . . . . . . . . . . . . . . . . . . . . . . . . . . . . . . . . . . . . . . . . . . . . . . . . . . . . 27,179,673 — — 27,179,673Entertainment . . . . . . . . . . . . . . . . . . . . . . . . . . . . . . . . . . . . . . . . . . . . . . . . . . . . . . . . . . . . . . . . . . . . . . . . . . . . . . 161,520,806 — — 161,520,806Food & Staples Retailing . . . . . . . . . . . . . . . . . . . . . . . . . . . . . . . . . . . . . . . . . . . . . . . . . . . . . . . . . . . . . . . . . . . . . . . . 59,567,212 — — 59,567,212Health Care Equipment & Supplies . . . . . . . . . . . . . . . . . . . . . . . . . . . . . . . . . . . . . . . . . . . . . . . . . . . . . . . . . . . . . . . . . 27,942,268 — — 27,942,268Health Care Providers & Services . . . . . . . . . . . . . . . . . . . . . . . . . . . . . . . . . . . . . . . . . . . . . . . . . . . . . . . . . . . . . . . . . . 44,314,017 — — 44,314,017Hotels, Restaurants & Leisure . . . . . . . . . . . . . . . . . . . . . . . . . . . . . . . . . . . . . . . . . . . . . . . . . . . . . . . . . . . . . . . . . . . . 103,487,906 — — 103,487,906Interactive Media & Services . . . . . . . . . . . . . . . . . . . . . . . . . . . . . . . . . . . . . . . . . . . . . . . . . . . . . . . . . . . . . . . . . . . . . 228,856,736 80,695,669 — 309,552,405Internet & Direct Marketing Retail . . . . . . . . . . . . . . . . . . . . . . . . . . . . . . . . . . . . . . . . . . . . . . . . . . . . . . . . . . . . . . . . . 312,826,477 — — 312,826,477IT Services . . . . . . . . . . . . . . . . . . . . . . . . . . . . . . . . . . . . . . . . . . . . . . . . . . . . . . . . . . . . . . . . . . . . . . . . . . . . . . . . . 277,463,033 15,556,069 — 293,019,102Life Sciences Tools & Services . . . . . . . . . . . . . . . . . . . . . . . . . . . . . . . . . . . . . . . . . . . . . . . . . . . . . . . . . . . . . . . . . . . . 55,712,367 — — 55,712,367Machinery . . . . . . . . . . . . . . . . . . . . . . . . . . . . . . . . . . . . . . . . . . . . . . . . . . . . . . . . . . . . . . . . . . . . . . . . . . . . . . . . . 56,508,482 — — 56,508,482Oil, Gas & Consumable Fuels . . . . . . . . . . . . . . . . . . . . . . . . . . . . . . . . . . . . . . . . . . . . . . . . . . . . . . . . . . . . . . . . . . . . . 32,415,890 — — 32,415,890Personal Products . . . . . . . . . . . . . . . . . . . . . . . . . . . . . . . . . . . . . . . . . . . . . . . . . . . . . . . . . . . . . . . . . . . . . . . . . . . . 42,302,361 — — 42,302,361Pharmaceuticals . . . . . . . . . . . . . . . . . . . . . . . . . . . . . . . . . . . . . . . . . . . . . . . . . . . . . . . . . . . . . . . . . . . . . . . . . . . . . 88,963,883 — — 88,963,883Semiconductors & Semiconductor Equipment . . . . . . . . . . . . . . . . . . . . . . . . . . . . . . . . . . . . . . . . . . . . . . . . . . . . . . . . . . . 116,422,023 — — 116,422,023Software . . . . . . . . . . . . . . . . . . . . . . . . . . . . . . . . . . . . . . . . . . . . . . . . . . . . . . . . . . . . . . . . . . . . . . . . . . . . . . . . . . 449,738,972 — — 449,738,972Specialty Retail . . . . . . . . . . . . . . . . . . . . . . . . . . . . . . . . . . . . . . . . . . . . . . . . . . . . . . . . . . . . . . . . . . . . . . . . . . . . . . 52,642,408 — — 52,642,408Technology Hardware, Storage & Peripherals . . . . . . . . . . . . . . . . . . . . . . . . . . . . . . . . . . . . . . . . . . . . . . . . . . . . . . . . . . 147,697,619 — — 147,697,619Textiles, Apparel & Luxury Goods . . . . . . . . . . . . . . . . . . . . . . . . . . . . . . . . . . . . . . . . . . . . . . . . . . . . . . . . . . . . . . . . . . 40,055,955 36,693,100 — 76,749,055
Total Common Stocks . . . . . . . . . . . . . . . . . . . . . . . . . . . . . . . . . . . . . . . . . . . . . . . . . . . . . . . . . . . . . . . . . . . . . . . . . . . . 2,742,863,006 162,629,690 — 2,905,492,696
Total Securities Lending Reinvestments* . . . . . . . . . . . . . . . . . . . . . . . . . . . . . . . . . . . . . . . . . . . . . . . . . . . . . . . . . . . . . . . . — 403,951,877 — 403,951,877
Total Investments . . . . . . . . . . . . . . . . . . . . . . . . . . . . . . . . . . . . . . . . . . . . . . . . . . . . . . . . . . . . . . . . . . . . . . . . . . . . . . $2,742,863,006 $ 566,581,567 $— $3,309,444,573
Collateral for Securities Loaned (Liability) . . . . . . . . . . . . . . . . . . . . . . . . . . . . . . . . . . . . . . . . . . . . . . . . . . . . . . . . . . . . . . $ — $(403,700,470) $— $ (403,700,470)
* See Schedule of Investments for additional detailed categorizations.
BHFTII-149
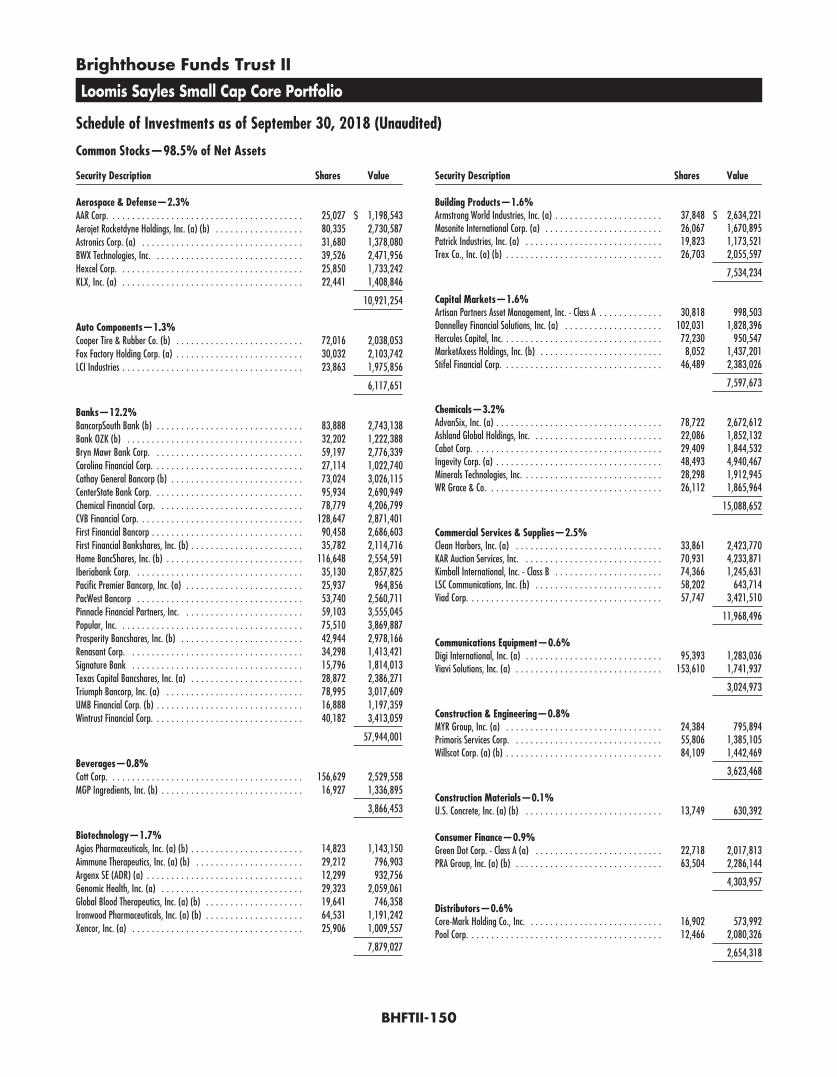
Brighthouse Funds Trust II
Loomis Sayles Small Cap Core Portfolio
Schedule of Investments as of September 30, 2018 (Unaudited)
Common Stocks—98.5% of Net Assets
Security Description Shares Value
Aerospace & Defense—2.3%AAR Corp. . . . . . . . . . . . . . . . . . . . . . . . . . . . . . . . . . . . . . . . 25,027 $ 1,198,543Aerojet Rocketdyne Holdings, Inc. (a) (b) . . . . . . . . . . . . . . . . . . 80,335 2,730,587Astronics Corp. (a) . . . . . . . . . . . . . . . . . . . . . . . . . . . . . . . . . 31,680 1,378,080BWX Technologies, Inc. . . . . . . . . . . . . . . . . . . . . . . . . . . . . . . 39,526 2,471,956Hexcel Corp. . . . . . . . . . . . . . . . . . . . . . . . . . . . . . . . . . . . . . 25,850 1,733,242KLX, Inc. (a) . . . . . . . . . . . . . . . . . . . . . . . . . . . . . . . . . . . . . 22,441 1,408,846
10,921,254
Auto Components—1.3%Cooper Tire & Rubber Co. (b) . . . . . . . . . . . . . . . . . . . . . . . . . . 72,016 2,038,053Fox Factory Holding Corp. (a) . . . . . . . . . . . . . . . . . . . . . . . . . . 30,032 2,103,742LCI Industries . . . . . . . . . . . . . . . . . . . . . . . . . . . . . . . . . . . . . 23,863 1,975,856
6,117,651
Banks—12.2%BancorpSouth Bank (b) . . . . . . . . . . . . . . . . . . . . . . . . . . . . . . 83,888 2,743,138Bank OZK (b) . . . . . . . . . . . . . . . . . . . . . . . . . . . . . . . . . . . . 32,202 1,222,388Bryn Mawr Bank Corp. . . . . . . . . . . . . . . . . . . . . . . . . . . . . . . 59,197 2,776,339Carolina Financial Corp. . . . . . . . . . . . . . . . . . . . . . . . . . . . . . . 27,114 1,022,740Cathay General Bancorp (b) . . . . . . . . . . . . . . . . . . . . . . . . . . . 73,024 3,026,115CenterState Bank Corp. . . . . . . . . . . . . . . . . . . . . . . . . . . . . . . 95,934 2,690,949Chemical Financial Corp. . . . . . . . . . . . . . . . . . . . . . . . . . . . . . 78,779 4,206,799CVB Financial Corp. . . . . . . . . . . . . . . . . . . . . . . . . . . . . . . . . . 128,647 2,871,401First Financial Bancorp . . . . . . . . . . . . . . . . . . . . . . . . . . . . . . . 90,458 2,686,603First Financial Bankshares, Inc. (b) . . . . . . . . . . . . . . . . . . . . . . . 35,782 2,114,716Home BancShares, Inc. (b) . . . . . . . . . . . . . . . . . . . . . . . . . . . . 116,648 2,554,591Iberiabank Corp. . . . . . . . . . . . . . . . . . . . . . . . . . . . . . . . . . . 35,130 2,857,825Pacific Premier Bancorp, Inc. (a) . . . . . . . . . . . . . . . . . . . . . . . . 25,937 964,856PacWest Bancorp . . . . . . . . . . . . . . . . . . . . . . . . . . . . . . . . . . 53,740 2,560,711Pinnacle Financial Partners, Inc. . . . . . . . . . . . . . . . . . . . . . . . . 59,103 3,555,045Popular, Inc. . . . . . . . . . . . . . . . . . . . . . . . . . . . . . . . . . . . . . 75,510 3,869,887Prosperity Bancshares, Inc. (b) . . . . . . . . . . . . . . . . . . . . . . . . . 42,944 2,978,166Renasant Corp. . . . . . . . . . . . . . . . . . . . . . . . . . . . . . . . . . . . 34,298 1,413,421Signature Bank . . . . . . . . . . . . . . . . . . . . . . . . . . . . . . . . . . . 15,796 1,814,013Texas Capital Bancshares, Inc. (a) . . . . . . . . . . . . . . . . . . . . . . . 28,872 2,386,271Triumph Bancorp, Inc. (a) . . . . . . . . . . . . . . . . . . . . . . . . . . . . 78,995 3,017,609UMB Financial Corp. (b) . . . . . . . . . . . . . . . . . . . . . . . . . . . . . . 16,888 1,197,359Wintrust Financial Corp. . . . . . . . . . . . . . . . . . . . . . . . . . . . . . . 40,182 3,413,059
57,944,001
Beverages—0.8%Cott Corp. . . . . . . . . . . . . . . . . . . . . . . . . . . . . . . . . . . . . . . . 156,629 2,529,558MGP Ingredients, Inc. (b) . . . . . . . . . . . . . . . . . . . . . . . . . . . . . 16,927 1,336,895
3,866,453
Biotechnology—1.7%Agios Pharmaceuticals, Inc. (a) (b) . . . . . . . . . . . . . . . . . . . . . . . 14,823 1,143,150Aimmune Therapeutics, Inc. (a) (b) . . . . . . . . . . . . . . . . . . . . . . 29,212 796,903Argenx SE (ADR) (a) . . . . . . . . . . . . . . . . . . . . . . . . . . . . . . . . 12,299 932,756Genomic Health, Inc. (a) . . . . . . . . . . . . . . . . . . . . . . . . . . . . . 29,323 2,059,061Global Blood Therapeutics, Inc. (a) (b) . . . . . . . . . . . . . . . . . . . . 19,641 746,358Ironwood Pharmaceuticals, Inc. (a) (b) . . . . . . . . . . . . . . . . . . . . 64,531 1,191,242Xencor, Inc. (a) . . . . . . . . . . . . . . . . . . . . . . . . . . . . . . . . . . . 25,906 1,009,557
7,879,027
Security Description Shares Value
Building Products—1.6%Armstrong World Industries, Inc. (a) . . . . . . . . . . . . . . . . . . . . . . 37,848 $ 2,634,221Masonite International Corp. (a) . . . . . . . . . . . . . . . . . . . . . . . . 26,067 1,670,895Patrick Industries, Inc. (a) . . . . . . . . . . . . . . . . . . . . . . . . . . . . 19,823 1,173,521Trex Co., Inc. (a) (b) . . . . . . . . . . . . . . . . . . . . . . . . . . . . . . . . 26,703 2,055,597
7,534,234
Capital Markets—1.6%Artisan Partners Asset Management, Inc. - Class A . . . . . . . . . . . . . 30,818 998,503Donnelley Financial Solutions, Inc. (a) . . . . . . . . . . . . . . . . . . . . 102,031 1,828,396Hercules Capital, Inc. . . . . . . . . . . . . . . . . . . . . . . . . . . . . . . . . 72,230 950,547MarketAxess Holdings, Inc. (b) . . . . . . . . . . . . . . . . . . . . . . . . . 8,052 1,437,201Stifel Financial Corp. . . . . . . . . . . . . . . . . . . . . . . . . . . . . . . . . 46,489 2,383,026
7,597,673
Chemicals—3.2%AdvanSix, Inc. (a) . . . . . . . . . . . . . . . . . . . . . . . . . . . . . . . . . . 78,722 2,672,612Ashland Global Holdings, Inc. . . . . . . . . . . . . . . . . . . . . . . . . . . 22,086 1,852,132Cabot Corp. . . . . . . . . . . . . . . . . . . . . . . . . . . . . . . . . . . . . . . 29,409 1,844,532Ingevity Corp. (a) . . . . . . . . . . . . . . . . . . . . . . . . . . . . . . . . . . 48,493 4,940,467Minerals Technologies, Inc. . . . . . . . . . . . . . . . . . . . . . . . . . . . . 28,298 1,912,945WR Grace & Co. . . . . . . . . . . . . . . . . . . . . . . . . . . . . . . . . . . . 26,112 1,865,964
15,088,652
Commercial Services & Supplies—2.5%Clean Harbors, Inc. (a) . . . . . . . . . . . . . . . . . . . . . . . . . . . . . . 33,861 2,423,770KAR Auction Services, Inc. . . . . . . . . . . . . . . . . . . . . . . . . . . . . 70,931 4,233,871Kimball International, Inc. - Class B . . . . . . . . . . . . . . . . . . . . . . 74,366 1,245,631LSC Communications, Inc. (b) . . . . . . . . . . . . . . . . . . . . . . . . . . 58,202 643,714Viad Corp. . . . . . . . . . . . . . . . . . . . . . . . . . . . . . . . . . . . . . . . 57,747 3,421,510
11,968,496
Communications Equipment—0.6%Digi International, Inc. (a) . . . . . . . . . . . . . . . . . . . . . . . . . . . . 95,393 1,283,036Viavi Solutions, Inc. (a) . . . . . . . . . . . . . . . . . . . . . . . . . . . . . . 153,610 1,741,937
3,024,973
Construction & Engineering—0.8%MYR Group, Inc. (a) . . . . . . . . . . . . . . . . . . . . . . . . . . . . . . . . 24,384 795,894Primoris Services Corp. . . . . . . . . . . . . . . . . . . . . . . . . . . . . . . 55,806 1,385,105Willscot Corp. (a) (b) . . . . . . . . . . . . . . . . . . . . . . . . . . . . . . . . 84,109 1,442,469
3,623,468
Construction Materials—0.1%U.S. Concrete, Inc. (a) (b) . . . . . . . . . . . . . . . . . . . . . . . . . . . . 13,749 630,392
Consumer Finance—0.9%Green Dot Corp. - Class A (a) . . . . . . . . . . . . . . . . . . . . . . . . . . 22,718 2,017,813PRA Group, Inc. (a) (b) . . . . . . . . . . . . . . . . . . . . . . . . . . . . . . 63,504 2,286,144
4,303,957
Distributors—0.6%Core-Mark Holding Co., Inc. . . . . . . . . . . . . . . . . . . . . . . . . . . . 16,902 573,992Pool Corp. . . . . . . . . . . . . . . . . . . . . . . . . . . . . . . . . . . . . . . . 12,466 2,080,326
2,654,318
BHFTII-150
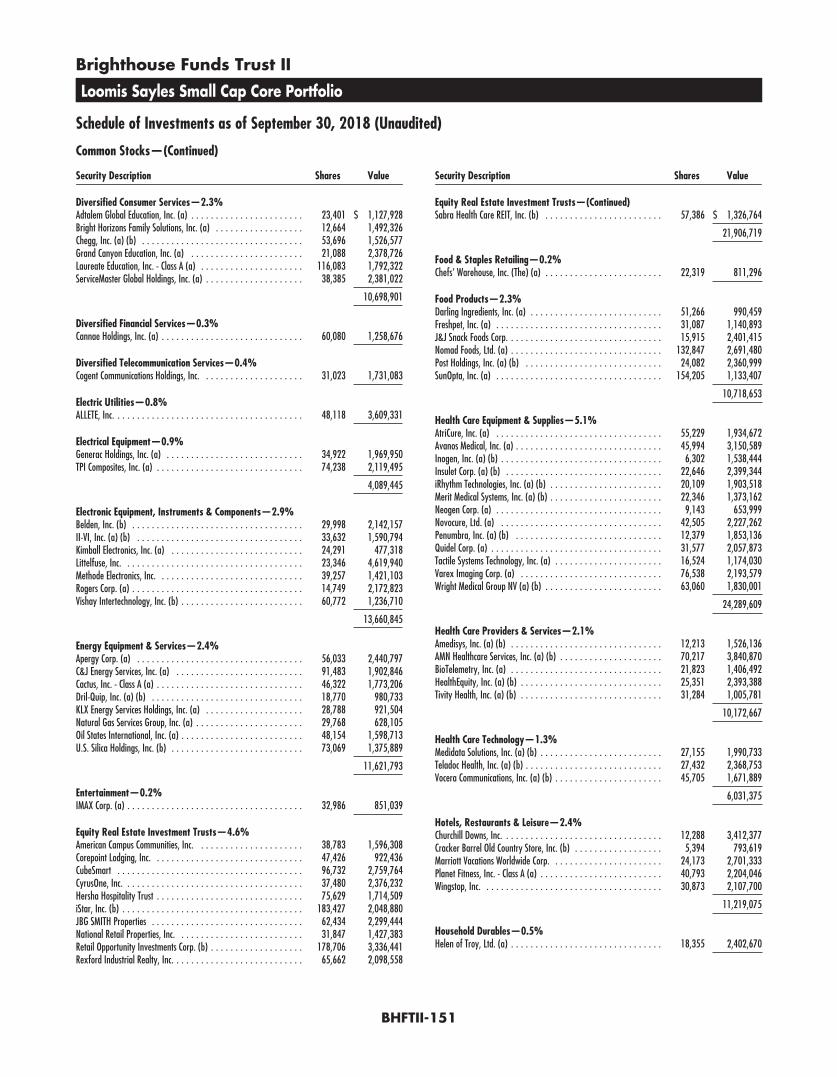
Brighthouse Funds Trust II
Loomis Sayles Small Cap Core Portfolio
Schedule of Investments as of September 30, 2018 (Unaudited)
Common Stocks—(Continued)
Security Description Shares Value
Diversified Consumer Services—2.3%Adtalem Global Education, Inc. (a) . . . . . . . . . . . . . . . . . . . . . . . 23,401 $ 1,127,928Bright Horizons Family Solutions, Inc. (a) . . . . . . . . . . . . . . . . . . 12,664 1,492,326Chegg, Inc. (a) (b) . . . . . . . . . . . . . . . . . . . . . . . . . . . . . . . . . 53,696 1,526,577Grand Canyon Education, Inc. (a) . . . . . . . . . . . . . . . . . . . . . . . 21,088 2,378,726Laureate Education, Inc. - Class A (a) . . . . . . . . . . . . . . . . . . . . . 116,083 1,792,322ServiceMaster Global Holdings, Inc. (a) . . . . . . . . . . . . . . . . . . . . 38,385 2,381,022
10,698,901
Diversified Financial Services—0.3%Cannae Holdings, Inc. (a) . . . . . . . . . . . . . . . . . . . . . . . . . . . . . 60,080 1,258,676
Diversified Telecommunication Services—0.4%Cogent Communications Holdings, Inc. . . . . . . . . . . . . . . . . . . . . 31,023 1,731,083
Electric Utilities—0.8%ALLETE, Inc. . . . . . . . . . . . . . . . . . . . . . . . . . . . . . . . . . . . . . . 48,118 3,609,331
Electrical Equipment—0.9%Generac Holdings, Inc. (a) . . . . . . . . . . . . . . . . . . . . . . . . . . . . 34,922 1,969,950TPI Composites, Inc. (a) . . . . . . . . . . . . . . . . . . . . . . . . . . . . . . 74,238 2,119,495
4,089,445
Electronic Equipment, Instruments & Components—2.9%Belden, Inc. (b) . . . . . . . . . . . . . . . . . . . . . . . . . . . . . . . . . . . 29,998 2,142,157II-VI, Inc. (a) (b) . . . . . . . . . . . . . . . . . . . . . . . . . . . . . . . . . . 33,632 1,590,794Kimball Electronics, Inc. (a) . . . . . . . . . . . . . . . . . . . . . . . . . . . 24,291 477,318Littelfuse, Inc. . . . . . . . . . . . . . . . . . . . . . . . . . . . . . . . . . . . . 23,346 4,619,940Methode Electronics, Inc. . . . . . . . . . . . . . . . . . . . . . . . . . . . . . 39,257 1,421,103Rogers Corp. (a) . . . . . . . . . . . . . . . . . . . . . . . . . . . . . . . . . . . 14,749 2,172,823Vishay Intertechnology, Inc. (b) . . . . . . . . . . . . . . . . . . . . . . . . . 60,772 1,236,710
13,660,845
Energy Equipment & Services—2.4%Apergy Corp. (a) . . . . . . . . . . . . . . . . . . . . . . . . . . . . . . . . . . 56,033 2,440,797C&J Energy Services, Inc. (a) . . . . . . . . . . . . . . . . . . . . . . . . . . 91,483 1,902,846Cactus, Inc. - Class A (a) . . . . . . . . . . . . . . . . . . . . . . . . . . . . . . 46,322 1,773,206Dril-Quip, Inc. (a) (b) . . . . . . . . . . . . . . . . . . . . . . . . . . . . . . . 18,770 980,733KLX Energy Services Holdings, Inc. (a) . . . . . . . . . . . . . . . . . . . . 28,788 921,504Natural Gas Services Group, Inc. (a) . . . . . . . . . . . . . . . . . . . . . . 29,768 628,105Oil States International, Inc. (a) . . . . . . . . . . . . . . . . . . . . . . . . . 48,154 1,598,713U.S. Silica Holdings, Inc. (b) . . . . . . . . . . . . . . . . . . . . . . . . . . . 73,069 1,375,889
11,621,793
Entertainment—0.2%IMAX Corp. (a) . . . . . . . . . . . . . . . . . . . . . . . . . . . . . . . . . . . . 32,986 851,039
Equity Real Estate Investment Trusts—4.6%American Campus Communities, Inc. . . . . . . . . . . . . . . . . . . . . . 38,783 1,596,308Corepoint Lodging, Inc. . . . . . . . . . . . . . . . . . . . . . . . . . . . . . . 47,426 922,436CubeSmart . . . . . . . . . . . . . . . . . . . . . . . . . . . . . . . . . . . . . . 96,732 2,759,764CyrusOne, Inc. . . . . . . . . . . . . . . . . . . . . . . . . . . . . . . . . . . . . 37,480 2,376,232Hersha Hospitality Trust . . . . . . . . . . . . . . . . . . . . . . . . . . . . . . 75,629 1,714,509iStar, Inc. (b) . . . . . . . . . . . . . . . . . . . . . . . . . . . . . . . . . . . . . 183,427 2,048,880JBG SMITH Properties . . . . . . . . . . . . . . . . . . . . . . . . . . . . . . . 62,434 2,299,444National Retail Properties, Inc. . . . . . . . . . . . . . . . . . . . . . . . . . 31,847 1,427,383Retail Opportunity Investments Corp. (b) . . . . . . . . . . . . . . . . . . . 178,706 3,336,441Rexford Industrial Realty, Inc. . . . . . . . . . . . . . . . . . . . . . . . . . . 65,662 2,098,558
Security Description Shares Value
Equity Real Estate Investment Trusts—(Continued)Sabra Health Care REIT, Inc. (b) . . . . . . . . . . . . . . . . . . . . . . . . 57,386 $ 1,326,764
21,906,719
Food & Staples Retailing—0.2%Chefs’ Warehouse, Inc. (The) (a) . . . . . . . . . . . . . . . . . . . . . . . . 22,319 811,296
Food Products—2.3%Darling Ingredients, Inc. (a) . . . . . . . . . . . . . . . . . . . . . . . . . . . 51,266 990,459Freshpet, Inc. (a) . . . . . . . . . . . . . . . . . . . . . . . . . . . . . . . . . . 31,087 1,140,893J&J Snack Foods Corp. . . . . . . . . . . . . . . . . . . . . . . . . . . . . . . . 15,915 2,401,415Nomad Foods, Ltd. (a) . . . . . . . . . . . . . . . . . . . . . . . . . . . . . . . 132,847 2,691,480Post Holdings, Inc. (a) (b) . . . . . . . . . . . . . . . . . . . . . . . . . . . . 24,082 2,360,999SunOpta, Inc. (a) . . . . . . . . . . . . . . . . . . . . . . . . . . . . . . . . . . 154,205 1,133,407
10,718,653
Health Care Equipment & Supplies—5.1%AtriCure, Inc. (a) . . . . . . . . . . . . . . . . . . . . . . . . . . . . . . . . . . 55,229 1,934,672Avanos Medical, Inc. (a) . . . . . . . . . . . . . . . . . . . . . . . . . . . . . . 45,994 3,150,589Inogen, Inc. (a) (b) . . . . . . . . . . . . . . . . . . . . . . . . . . . . . . . . . 6,302 1,538,444Insulet Corp. (a) (b) . . . . . . . . . . . . . . . . . . . . . . . . . . . . . . . . 22,646 2,399,344iRhythm Technologies, Inc. (a) (b) . . . . . . . . . . . . . . . . . . . . . . . 20,109 1,903,518Merit Medical Systems, Inc. (a) (b) . . . . . . . . . . . . . . . . . . . . . . . 22,346 1,373,162Neogen Corp. (a) . . . . . . . . . . . . . . . . . . . . . . . . . . . . . . . . . . 9,143 653,999Novocure, Ltd. (a) . . . . . . . . . . . . . . . . . . . . . . . . . . . . . . . . . 42,505 2,227,262Penumbra, Inc. (a) (b) . . . . . . . . . . . . . . . . . . . . . . . . . . . . . . 12,379 1,853,136Quidel Corp. (a) . . . . . . . . . . . . . . . . . . . . . . . . . . . . . . . . . . . 31,577 2,057,873Tactile Systems Technology, Inc. (a) . . . . . . . . . . . . . . . . . . . . . . 16,524 1,174,030Varex Imaging Corp. (a) . . . . . . . . . . . . . . . . . . . . . . . . . . . . . 76,538 2,193,579Wright Medical Group NV (a) (b) . . . . . . . . . . . . . . . . . . . . . . . . 63,060 1,830,001
24,289,609
Health Care Providers & Services—2.1%Amedisys, Inc. (a) (b) . . . . . . . . . . . . . . . . . . . . . . . . . . . . . . . 12,213 1,526,136AMN Healthcare Services, Inc. (a) (b) . . . . . . . . . . . . . . . . . . . . . 70,217 3,840,870BioTelemetry, Inc. (a) . . . . . . . . . . . . . . . . . . . . . . . . . . . . . . . 21,823 1,406,492HealthEquity, Inc. (a) (b) . . . . . . . . . . . . . . . . . . . . . . . . . . . . . 25,351 2,393,388Tivity Health, Inc. (a) (b) . . . . . . . . . . . . . . . . . . . . . . . . . . . . . 31,284 1,005,781
10,172,667
Health Care Technology—1.3%Medidata Solutions, Inc. (a) (b) . . . . . . . . . . . . . . . . . . . . . . . . . 27,155 1,990,733Teladoc Health, Inc. (a) (b) . . . . . . . . . . . . . . . . . . . . . . . . . . . . 27,432 2,368,753Vocera Communications, Inc. (a) (b) . . . . . . . . . . . . . . . . . . . . . . 45,705 1,671,889
6,031,375
Hotels, Restaurants & Leisure—2.4%Churchill Downs, Inc. . . . . . . . . . . . . . . . . . . . . . . . . . . . . . . . . 12,288 3,412,377Cracker Barrel Old Country Store, Inc. (b) . . . . . . . . . . . . . . . . . . 5,394 793,619Marriott Vacations Worldwide Corp. . . . . . . . . . . . . . . . . . . . . . . 24,173 2,701,333Planet Fitness, Inc. - Class A (a) . . . . . . . . . . . . . . . . . . . . . . . . . 40,793 2,204,046Wingstop, Inc. . . . . . . . . . . . . . . . . . . . . . . . . . . . . . . . . . . . . 30,873 2,107,700
11,219,075
Household Durables—0.5%Helen of Troy, Ltd. (a) . . . . . . . . . . . . . . . . . . . . . . . . . . . . . . . 18,355 2,402,670
BHFTII-151

Brighthouse Funds Trust II
Loomis Sayles Small Cap Core Portfolio
Schedule of Investments as of September 30, 2018 (Unaudited)
Common Stocks—(Continued)
Security Description Shares Value
Household Products—0.4%Spectrum Brands Holdings, Inc. . . . . . . . . . . . . . . . . . . . . . . . . . 23,190 $ 1,732,757
Independent Power and Renewable Electricity Producers—0.4%NextEra Energy Partners LP (b) . . . . . . . . . . . . . . . . . . . . . . . . . 43,045 2,087,683
Industrial Conglomerates—0.6%Raven Industries, Inc. . . . . . . . . . . . . . . . . . . . . . . . . . . . . . . . 59,151 2,706,158
Insurance—3.1%Employers Holdings, Inc. . . . . . . . . . . . . . . . . . . . . . . . . . . . . . 75,036 3,399,131First American Financial Corp. . . . . . . . . . . . . . . . . . . . . . . . . . . 42,713 2,203,564Kinsale Capital Group, Inc. (b) . . . . . . . . . . . . . . . . . . . . . . . . . 29,148 1,861,391ProAssurance Corp. . . . . . . . . . . . . . . . . . . . . . . . . . . . . . . . . . 40,245 1,889,503Reinsurance Group of America, Inc. . . . . . . . . . . . . . . . . . . . . . . 19,152 2,768,613Stewart Information Services Corp. . . . . . . . . . . . . . . . . . . . . . . . 19,533 879,180Trupanion, Inc. (a) (b) . . . . . . . . . . . . . . . . . . . . . . . . . . . . . . . 41,845 1,495,122
14,496,504
Interactive Media & Services—0.3%IAC/InterActiveCorp (a) . . . . . . . . . . . . . . . . . . . . . . . . . . . . . . 6,242 1,352,766
IT Services—4.9%Conduent, Inc. (a) . . . . . . . . . . . . . . . . . . . . . . . . . . . . . . . . . . 122,016 2,747,800CSG Systems International, Inc. . . . . . . . . . . . . . . . . . . . . . . . . . 30,989 1,243,899Euronet Worldwide, Inc. (a) . . . . . . . . . . . . . . . . . . . . . . . . . . . 47,271 4,737,500Evo Payments, Inc. - Class A (a) (b) . . . . . . . . . . . . . . . . . . . . . . 32,645 780,216Genpact, Ltd. . . . . . . . . . . . . . . . . . . . . . . . . . . . . . . . . . . . . . 45,715 1,399,336InterXion Holding NV (a) . . . . . . . . . . . . . . . . . . . . . . . . . . . . . 32,273 2,171,973Perspecta, Inc. . . . . . . . . . . . . . . . . . . . . . . . . . . . . . . . . . . . . 107,352 2,761,093Virtusa Corp. (a) . . . . . . . . . . . . . . . . . . . . . . . . . . . . . . . . . . . 35,406 1,901,656WEX, Inc. (a) . . . . . . . . . . . . . . . . . . . . . . . . . . . . . . . . . . . . . 16,345 3,281,422WNS Holdings, Ltd. (ADR) (a) . . . . . . . . . . . . . . . . . . . . . . . . . . 41,181 2,089,936
23,114,831
Leisure Products—0.1%Malibu Boats, Inc. - Class A (a) . . . . . . . . . . . . . . . . . . . . . . . . . 12,893 705,505
Life Sciences Tools & Services—1.1%Cambrex Corp. (a) (b) . . . . . . . . . . . . . . . . . . . . . . . . . . . . . . . 42,016 2,873,894PRA Health Sciences, Inc. (a) . . . . . . . . . . . . . . . . . . . . . . . . . . 23,532 2,592,991
5,466,885
Machinery—5.8%Alamo Group, Inc. . . . . . . . . . . . . . . . . . . . . . . . . . . . . . . . . . 14,965 1,370,944Albany International Corp. - Class A . . . . . . . . . . . . . . . . . . . . . . 34,402 2,734,959Altra Industrial Motion Corp. (b) . . . . . . . . . . . . . . . . . . . . . . . . 37,221 1,537,227Columbus McKinnon Corp. . . . . . . . . . . . . . . . . . . . . . . . . . . . . 60,543 2,393,870EnPro Industries, Inc. . . . . . . . . . . . . . . . . . . . . . . . . . . . . . . . 30,064 2,192,568Evoqua Water Technologies Corp. (a) (b) . . . . . . . . . . . . . . . . . . . 63,538 1,129,706Harsco Corp. (a) . . . . . . . . . . . . . . . . . . . . . . . . . . . . . . . . . . . 73,117 2,087,490John Bean Technologies Corp. (b) . . . . . . . . . . . . . . . . . . . . . . . 20,134 2,401,986Kadant, Inc. . . . . . . . . . . . . . . . . . . . . . . . . . . . . . . . . . . . . . 8,246 889,331Proto Labs, Inc. (a) . . . . . . . . . . . . . . . . . . . . . . . . . . . . . . . . . 14,168 2,291,674RBC Bearings, Inc. (a) . . . . . . . . . . . . . . . . . . . . . . . . . . . . . . . 24,759 3,722,763Standex International Corp. . . . . . . . . . . . . . . . . . . . . . . . . . . . 25,571 2,665,777WABCO Holdings, Inc. (a) . . . . . . . . . . . . . . . . . . . . . . . . . . . . . 19,927 2,350,190
27,768,485
Security Description Shares Value
Marine—0.3%Kirby Corp. (a) (b) . . . . . . . . . . . . . . . . . . . . . . . . . . . . . . . . . 17,389 $ 1,430,245
Media—1.8%Emerald Expositions Events, Inc. . . . . . . . . . . . . . . . . . . . . . . . . 42,010 692,325GCI Liberty, Inc. - Class A (a) . . . . . . . . . . . . . . . . . . . . . . . . . . 53,435 2,725,185Gray Television, Inc. (a) . . . . . . . . . . . . . . . . . . . . . . . . . . . . . . 186,742 3,267,985John Wiley & Sons, Inc. - Class A . . . . . . . . . . . . . . . . . . . . . . . . 30,665 1,858,299
8,543,794
Metals & Mining—0.3%Ferroglobe Representation & Warranty Insurance Trust (a) (c) . . . . . 141,548 0Haynes International, Inc. (b) . . . . . . . . . . . . . . . . . . . . . . . . . . 37,282 1,323,511
1,323,511
Multi-Utilities—0.5%NorthWestern Corp. . . . . . . . . . . . . . . . . . . . . . . . . . . . . . . . . 42,410 2,487,771
Multiline Retail—0.8%Big Lots, Inc. . . . . . . . . . . . . . . . . . . . . . . . . . . . . . . . . . . . . . 37,690 1,575,065Ollie’s Bargain Outlet Holdings, Inc. (a) (b) . . . . . . . . . . . . . . . . . 22,583 2,170,226
3,745,291
Oil, Gas & Consumable Fuels—1.2%Arch Coal, Inc. - Class A (b) . . . . . . . . . . . . . . . . . . . . . . . . . . . . 1,538 137,497Gulfport Energy Corp. (a) (b) . . . . . . . . . . . . . . . . . . . . . . . . . . 109,785 1,142,862PDC Energy, Inc. (a) . . . . . . . . . . . . . . . . . . . . . . . . . . . . . . . . 24,482 1,198,639QEP Resources, Inc. (a) . . . . . . . . . . . . . . . . . . . . . . . . . . . . . . 147,913 1,674,375SRC Energy, Inc. (a) (b) . . . . . . . . . . . . . . . . . . . . . . . . . . . . . . 196,779 1,749,365
5,902,738
Pharmaceuticals—1.6%Aerie Pharmaceuticals, Inc. (a) . . . . . . . . . . . . . . . . . . . . . . . . . 22,488 1,384,136Catalent, Inc. (a) . . . . . . . . . . . . . . . . . . . . . . . . . . . . . . . . . . 55,032 2,506,707Prestige Brands Holdings, Inc. (a) (b) . . . . . . . . . . . . . . . . . . . . . 57,057 2,161,890Supernus Pharmaceuticals, Inc. (a) (b) . . . . . . . . . . . . . . . . . . . . 34,725 1,748,404
7,801,137
Professional Services—1.1%Insperity, Inc. . . . . . . . . . . . . . . . . . . . . . . . . . . . . . . . . . . . . 22,037 2,599,264Korn/Ferry International . . . . . . . . . . . . . . . . . . . . . . . . . . . . . 55,349 2,725,385
5,324,649
Road & Rail—1.0%Genesee & Wyoming, Inc. - Class A (a) (b) . . . . . . . . . . . . . . . . . . 25,532 2,323,157Old Dominion Freight Line, Inc. . . . . . . . . . . . . . . . . . . . . . . . . . 16,160 2,605,961
4,929,118
Semiconductors & Semiconductor Equipment—2.7%Advanced Energy Industries, Inc. (a) . . . . . . . . . . . . . . . . . . . . . 31,560 1,630,074Mellanox Technologies, Ltd. (a) . . . . . . . . . . . . . . . . . . . . . . . . . 40,582 2,980,748MKS Instruments, Inc. . . . . . . . . . . . . . . . . . . . . . . . . . . . . . . . 13,589 1,089,159Monolithic Power Systems, Inc. . . . . . . . . . . . . . . . . . . . . . . . . . 13,827 1,735,703Semtech Corp. (a) . . . . . . . . . . . . . . . . . . . . . . . . . . . . . . . . . . 31,332 1,742,059Silicon Laboratories, Inc. (a) . . . . . . . . . . . . . . . . . . . . . . . . . . . 17,489 1,605,490
BHFTII-152
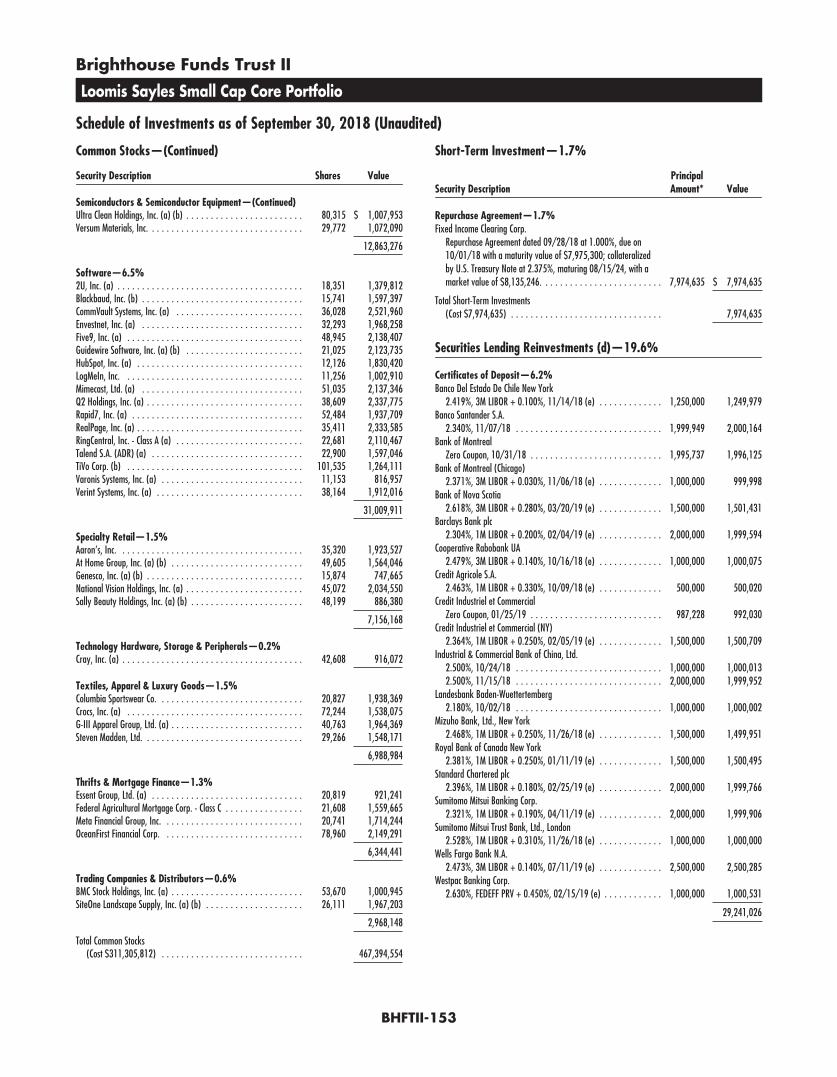
Brighthouse Funds Trust II
Loomis Sayles Small Cap Core Portfolio
Schedule of Investments as of September 30, 2018 (Unaudited)
Common Stocks—(Continued)
Security Description Shares Value
Semiconductors & Semiconductor Equipment—(Continued)Ultra Clean Holdings, Inc. (a) (b) . . . . . . . . . . . . . . . . . . . . . . . . 80,315 $ 1,007,953Versum Materials, Inc. . . . . . . . . . . . . . . . . . . . . . . . . . . . . . . . 29,772 1,072,090
12,863,276
Software—6.5%2U, Inc. (a) . . . . . . . . . . . . . . . . . . . . . . . . . . . . . . . . . . . . . . 18,351 1,379,812Blackbaud, Inc. (b) . . . . . . . . . . . . . . . . . . . . . . . . . . . . . . . . . 15,741 1,597,397CommVault Systems, Inc. (a) . . . . . . . . . . . . . . . . . . . . . . . . . . 36,028 2,521,960Envestnet, Inc. (a) . . . . . . . . . . . . . . . . . . . . . . . . . . . . . . . . . 32,293 1,968,258Five9, Inc. (a) . . . . . . . . . . . . . . . . . . . . . . . . . . . . . . . . . . . . 48,945 2,138,407Guidewire Software, Inc. (a) (b) . . . . . . . . . . . . . . . . . . . . . . . . 21,025 2,123,735HubSpot, Inc. (a) . . . . . . . . . . . . . . . . . . . . . . . . . . . . . . . . . . 12,126 1,830,420LogMeIn, Inc. . . . . . . . . . . . . . . . . . . . . . . . . . . . . . . . . . . . . 11,256 1,002,910Mimecast, Ltd. (a) . . . . . . . . . . . . . . . . . . . . . . . . . . . . . . . . . 51,035 2,137,346Q2 Holdings, Inc. (a) . . . . . . . . . . . . . . . . . . . . . . . . . . . . . . . . 38,609 2,337,775Rapid7, Inc. (a) . . . . . . . . . . . . . . . . . . . . . . . . . . . . . . . . . . . 52,484 1,937,709RealPage, Inc. (a) . . . . . . . . . . . . . . . . . . . . . . . . . . . . . . . . . . 35,411 2,333,585RingCentral, Inc. - Class A (a) . . . . . . . . . . . . . . . . . . . . . . . . . . 22,681 2,110,467Talend S.A. (ADR) (a) . . . . . . . . . . . . . . . . . . . . . . . . . . . . . . . 22,900 1,597,046TiVo Corp. (b) . . . . . . . . . . . . . . . . . . . . . . . . . . . . . . . . . . . . 101,535 1,264,111Varonis Systems, Inc. (a) . . . . . . . . . . . . . . . . . . . . . . . . . . . . . 11,153 816,957Verint Systems, Inc. (a) . . . . . . . . . . . . . . . . . . . . . . . . . . . . . . 38,164 1,912,016
31,009,911
Specialty Retail—1.5%Aaron’s, Inc. . . . . . . . . . . . . . . . . . . . . . . . . . . . . . . . . . . . . . 35,320 1,923,527At Home Group, Inc. (a) (b) . . . . . . . . . . . . . . . . . . . . . . . . . . . 49,605 1,564,046Genesco, Inc. (a) (b) . . . . . . . . . . . . . . . . . . . . . . . . . . . . . . . . 15,874 747,665National Vision Holdings, Inc. (a) . . . . . . . . . . . . . . . . . . . . . . . . 45,072 2,034,550Sally Beauty Holdings, Inc. (a) (b) . . . . . . . . . . . . . . . . . . . . . . . 48,199 886,380
7,156,168
Technology Hardware, Storage & Peripherals—0.2%Cray, Inc. (a) . . . . . . . . . . . . . . . . . . . . . . . . . . . . . . . . . . . . . 42,608 916,072
Textiles, Apparel & Luxury Goods—1.5%Columbia Sportswear Co. . . . . . . . . . . . . . . . . . . . . . . . . . . . . . 20,827 1,938,369Crocs, Inc. (a) . . . . . . . . . . . . . . . . . . . . . . . . . . . . . . . . . . . . 72,244 1,538,075G-III Apparel Group, Ltd. (a) . . . . . . . . . . . . . . . . . . . . . . . . . . . 40,763 1,964,369Steven Madden, Ltd. . . . . . . . . . . . . . . . . . . . . . . . . . . . . . . . . 29,266 1,548,171
6,988,984
Thrifts & Mortgage Finance—1.3%Essent Group, Ltd. (a) . . . . . . . . . . . . . . . . . . . . . . . . . . . . . . . 20,819 921,241Federal Agricultural Mortgage Corp. - Class C . . . . . . . . . . . . . . . . 21,608 1,559,665Meta Financial Group, Inc. . . . . . . . . . . . . . . . . . . . . . . . . . . . . 20,741 1,714,244OceanFirst Financial Corp. . . . . . . . . . . . . . . . . . . . . . . . . . . . . 78,960 2,149,291
6,344,441
Trading Companies & Distributors—0.6%BMC Stock Holdings, Inc. (a) . . . . . . . . . . . . . . . . . . . . . . . . . . . 53,670 1,000,945SiteOne Landscape Supply, Inc. (a) (b) . . . . . . . . . . . . . . . . . . . . 26,111 1,967,203
2,968,148
Total Common Stocks(Cost $311,305,812) . . . . . . . . . . . . . . . . . . . . . . . . . . . . . 467,394,554
Short-Term Investment—1.7%
Security DescriptionPrincipalAmount* Value
Repurchase Agreement—1.7%Fixed Income Clearing Corp.
Repurchase Agreement dated 09/28/18 at 1.000%, due on10/01/18 with a maturity value of $7,975,300; collateralizedby U.S. Treasury Note at 2.375%, maturing 08/15/24, with amarket value of $8,135,246. . . . . . . . . . . . . . . . . . . . . . . . . 7,974,635 $ 7,974,635
Total Short-Term Investments(Cost $7,974,635) . . . . . . . . . . . . . . . . . . . . . . . . . . . . . . . 7,974,635
Securities Lending Reinvestments (d)—19.6%
Certificates of Deposit—6.2%Banco Del Estado De Chile New York
2.419%, 3M LIBOR + 0.100%, 11/14/18 (e) . . . . . . . . . . . . . 1,250,000 1,249,979Banco Santander S.A.
2.340%, 11/07/18 . . . . . . . . . . . . . . . . . . . . . . . . . . . . . . 1,999,949 2,000,164Bank of Montreal
Zero Coupon, 10/31/18 . . . . . . . . . . . . . . . . . . . . . . . . . . . 1,995,737 1,996,125Bank of Montreal (Chicago)
2.371%, 3M LIBOR + 0.030%, 11/06/18 (e) . . . . . . . . . . . . . 1,000,000 999,998Bank of Nova Scotia
2.618%, 3M LIBOR + 0.280%, 03/20/19 (e) . . . . . . . . . . . . . 1,500,000 1,501,431Barclays Bank plc
2.304%, 1M LIBOR + 0.200%, 02/04/19 (e) . . . . . . . . . . . . . 2,000,000 1,999,594Cooperative Rabobank UA
2.479%, 3M LIBOR + 0.140%, 10/16/18 (e) . . . . . . . . . . . . . 1,000,000 1,000,075Credit Agricole S.A.
2.463%, 1M LIBOR + 0.330%, 10/09/18 (e) . . . . . . . . . . . . . 500,000 500,020Credit Industriel et Commercial
Zero Coupon, 01/25/19 . . . . . . . . . . . . . . . . . . . . . . . . . . . 987,228 992,030Credit Industriel et Commercial (NY)
2.364%, 1M LIBOR + 0.250%, 02/05/19 (e) . . . . . . . . . . . . . 1,500,000 1,500,709Industrial & Commercial Bank of China, Ltd.
2.500%, 10/24/18 . . . . . . . . . . . . . . . . . . . . . . . . . . . . . . 1,000,000 1,000,0132.500%, 11/15/18 . . . . . . . . . . . . . . . . . . . . . . . . . . . . . . 2,000,000 1,999,952
Landesbank Baden-Wuettertemberg2.180%, 10/02/18 . . . . . . . . . . . . . . . . . . . . . . . . . . . . . . 1,000,000 1,000,002
Mizuho Bank, Ltd., New York2.468%, 1M LIBOR + 0.250%, 11/26/18 (e) . . . . . . . . . . . . . 1,500,000 1,499,951
Royal Bank of Canada New York2.381%, 1M LIBOR + 0.250%, 01/11/19 (e) . . . . . . . . . . . . . 1,500,000 1,500,495
Standard Chartered plc2.396%, 1M LIBOR + 0.180%, 02/25/19 (e) . . . . . . . . . . . . . 2,000,000 1,999,766
Sumitomo Mitsui Banking Corp.2.321%, 1M LIBOR + 0.190%, 04/11/19 (e) . . . . . . . . . . . . . 2,000,000 1,999,906
Sumitomo Mitsui Trust Bank, Ltd., London2.528%, 1M LIBOR + 0.310%, 11/26/18 (e) . . . . . . . . . . . . . 1,000,000 1,000,000
Wells Fargo Bank N.A.2.473%, 3M LIBOR + 0.140%, 07/11/19 (e) . . . . . . . . . . . . . 2,500,000 2,500,285
Westpac Banking Corp.2.630%, FEDEFF PRV + 0.450%, 02/15/19 (e) . . . . . . . . . . . . 1,000,000 1,000,531
29,241,026
BHFTII-153

Brighthouse Funds Trust II
Loomis Sayles Small Cap Core Portfolio
Schedule of Investments as of September 30, 2018 (Unaudited)
Securities Lending Reinvestments (d)—(Continued)
Security DescriptionPrincipalAmount* Value
Commercial Paper—2.5%Bank of China, Ltd.
2.510%, 11/02/18 . . . . . . . . . . . . . . . . . . . . . . . . . . . . . . 993,655 $ 997,8002.550%, 10/19/18 . . . . . . . . . . . . . . . . . . . . . . . . . . . . . . 1,490,756 1,498,074
ING Funding LLC2.448%, 3M LIBOR + 0.110%, 05/10/19 (e) . . . . . . . . . . . . . 3,000,000 3,000,309
Sheffield Receivables Co.2.490%, 11/26/18 . . . . . . . . . . . . . . . . . . . . . . . . . . . . . . 493,464 498,0802.510%, SOFR + 0.350%, 11/28/18 (e) . . . . . . . . . . . . . . . . 500,000 500,137
Starbird Funding Corp.2.280%, 11/08/18 . . . . . . . . . . . . . . . . . . . . . . . . . . . . . . 1,988,600 1,994,892
UBS AG2.534%, 1M LIBOR + 0.430%, 02/01/19 (e) . . . . . . . . . . . . . 1,500,000 1,501,384
Westpac Banking Corp.2.492%, 1M LIBOR + 0.280%, 05/24/19 (e) . . . . . . . . . . . . . 2,000,000 2,001,108
11,991,784
Repurchase Agreements—9.0%Citigroup Global Markets, Inc.
Repurchase Agreement dated 05/03/18 at 2.440%, due on10/05/18 with a maturity value of $1,010,506; collateralizedby U.S. Treasury Obligations with rates ranging from 1.625% -2.250%, maturity dates ranging from 11/30/19 - 11/15/27,and various Common Stock with an aggregate market value of$1,054,286. . . . . . . . . . . . . . . . . . . . . . . . . . . . . . . . . . . . 1,000,000 1,000,000Repurchase Agreement dated 07/25/18 at 2.570%, due on11/02/18 with a maturity value of $1,007,139; collateralizedby various Common Stock with an aggregate market value of$1,100,000. . . . . . . . . . . . . . . . . . . . . . . . . . . . . . . . . . . . 1,000,000 1,000,000Repurchase Agreement dated 01/25/17 at 2.720%, due on12/31/18 with a maturity value of $210,653; collateralized byU.S. Treasury Obligations with rates ranging from 0.000% -2.220%, maturity dates ranging from 11/01/18 - 04/30/20,and an aggregate market value of $204,000. . . . . . . . . . . . . . 200,000 200,000
Citigroup Global Markets, Ltd.Repurchase Agreement dated 09/28/18 at 2.240%, due on10/01/18 with a maturity value of $1,700,317; collateralizedby U.S. Treasury and Foreign Obligations with rates ranging from0.625% - 2.875%, maturity dates ranging from 01/15/19 -02/15/43, and an aggregate market value of $1,734,000. . . . 1,700,000 1,700,000Repurchase Agreement dated 09/28/18 at 2.240%, due on10/01/18 with a maturity value of $1,100,205; collateralizedby U.S. Treasury and Foreign Obligations with rates ranging from1.750% - 2.875%, maturity dates ranging from 10/15/20 -05/15/27, and an aggregate market value of $1,122,001. . . . 1,100,000 1,100,000Repurchase Agreement dated 09/28/18 at 2.240%, due on10/01/18 with a maturity value of $1,600,299; collateralizedby U.S. Treasury and Foreign Obligations with rates ranging from0.375% - 3.125%, maturity dates ranging from 12/17/18 -02/15/43, and an aggregate market value of $1,632,000. . . . 1,600,000 1,600,000
Deutsche Bank AG, LondonRepurchase Agreement dated 01/09/18 at 2.560%, due on10/01/18 with a maturity value of $916,960; collateralized byvarious Common Stock with an aggregate market value of$1,001,990. . . . . . . . . . . . . . . . . . . . . . . . . . . . . . . . . . . . 900,000 900,000
Security DescriptionPrincipalAmount* Value
Repurchase Agreements—(Continued)ING Bank NV, London
Repurchase Agreement dated 08/03/18 at 2.420%, due on10/01/18 with a maturity value of $1,003,966; collateralizedby various Common Stock with an aggregate market value of$1,111,246. . . . . . . . . . . . . . . . . . . . . . . . . . . . . . . . . . . 1,000,000 $ 1,000,000
Macquarie Bank, Ltd., LondonRepurchase Agreement dated 09/28/18 at 2.200%, due on10/01/18 with a maturity value of $2,269,796; collateralizedby U.S. Treasury Obligations with rates ranging from 0.125% -5.500%, maturity dates ranging from 08/31/19 - 05/15/48,and an aggregate market value of $2,313,002. . . . . . . . . . . . 2,269,380 2,269,380
Merrill Lynch, Pierce, Fenner & Smith, Inc.Repurchase Agreement dated 10/26/16 at 2.720%, due on12/31/18 with a maturity value of $212,028; collateralized byvarious Common Stock with an aggregate market value of$220,000. . . . . . . . . . . . . . . . . . . . . . . . . . . . . . . . . . . . 200,000 200,000Repurchase Agreement dated 08/01/17 at 2.720%, due on12/31/18 with a maturity value of $2,337,890; collateralizedby various Common Stock with an aggregate market value of$2,475,000. . . . . . . . . . . . . . . . . . . . . . . . . . . . . . . . . . . 2,250,000 2,250,000
Morgan Stanley & Co. LLCRepurchase Agreement dated 09/25/18 at 2.470%, due on10/02/18 with a maturity value of $10,004,803; collateralizedby various Common Stock with an aggregate market value of$11,002,143. . . . . . . . . . . . . . . . . . . . . . . . . . . . . . . . . . 10,000,000 10,000,000
NBC Global Finance, Ltd.Repurchase Agreement dated 11/30/17 at 2.340%, due on10/01/18 with a maturity value of $1,835,685; collateralizedby various Common Stock with an aggregate market value of$2,002,779. . . . . . . . . . . . . . . . . . . . . . . . . . . . . . . . . . . 1,800,000 1,800,000Repurchase Agreement dated 03/16/18 at 2.340%, due on10/01/18 with a maturity value of $1,620,696; collateralizedby various Common Stock with an aggregate market value of$1,780,248. . . . . . . . . . . . . . . . . . . . . . . . . . . . . . . . . . . 1,600,000 1,600,000Repurchase Agreement dated 07/18/18 at 2.370%, due on10/05/18 with a maturity value of $1,005,201; collateralizedby various Common Stock with an aggregate market value of$1,112,744. . . . . . . . . . . . . . . . . . . . . . . . . . . . . . . . . . . 1,000,000 1,000,000Repurchase Agreement dated 07/19/18 at 2.370%, due on10/05/18 with a maturity value of $1,507,703; collateralizedby various Common Stock with an aggregate market value of$1,669,116. . . . . . . . . . . . . . . . . . . . . . . . . . . . . . . . . . . 1,500,000 1,500,000
Societe GeneraleRepurchase Agreement dated 03/08/18 at 2.310%, due on10/01/18 with a maturity value of $2,127,893; collateralizedby U.S. Treasury Obligations with rates ranging from 0.000% -4.250%, maturity dates ranging from 02/07/19 - 02/15/47,and various Common Stock with an aggregate market value of$2,332,362. . . . . . . . . . . . . . . . . . . . . . . . . . . . . . . . . . . 2,100,000 2,100,000Repurchase Agreement dated 03/21/18 at 2.310%, due on10/01/18 with a maturity value of $2,632,366; collateralizedby U.S. Treasury Obligations with rates ranging from 0.000% -4.250%, maturity dates ranging from 02/07/19 - 02/15/47,and various Common Stock with an aggregate market value of$2,887,686. . . . . . . . . . . . . . . . . . . . . . . . . . . . . . . . . . . 2,600,000 2,600,000
BHFTII-154
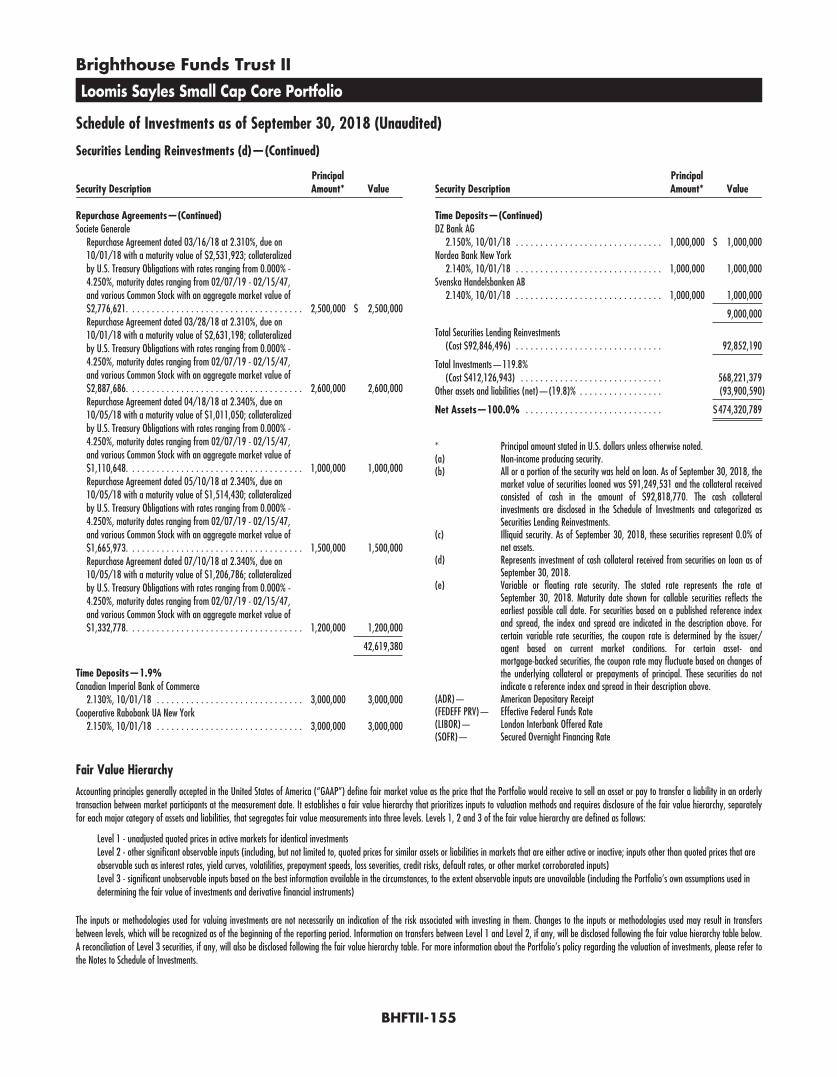
Brighthouse Funds Trust II
Loomis Sayles Small Cap Core Portfolio
Schedule of Investments as of September 30, 2018 (Unaudited)
Securities Lending Reinvestments (d)—(Continued)
Security DescriptionPrincipalAmount* Value
Repurchase Agreements—(Continued)Societe Generale
Repurchase Agreement dated 03/16/18 at 2.310%, due on10/01/18 with a maturity value of $2,531,923; collateralizedby U.S. Treasury Obligations with rates ranging from 0.000% -4.250%, maturity dates ranging from 02/07/19 - 02/15/47,and various Common Stock with an aggregate market value of$2,776,621. . . . . . . . . . . . . . . . . . . . . . . . . . . . . . . . . . . . 2,500,000 $ 2,500,000Repurchase Agreement dated 03/28/18 at 2.310%, due on10/01/18 with a maturity value of $2,631,198; collateralizedby U.S. Treasury Obligations with rates ranging from 0.000% -4.250%, maturity dates ranging from 02/07/19 - 02/15/47,and various Common Stock with an aggregate market value of$2,887,686. . . . . . . . . . . . . . . . . . . . . . . . . . . . . . . . . . . . 2,600,000 2,600,000Repurchase Agreement dated 04/18/18 at 2.340%, due on10/05/18 with a maturity value of $1,011,050; collateralizedby U.S. Treasury Obligations with rates ranging from 0.000% -4.250%, maturity dates ranging from 02/07/19 - 02/15/47,and various Common Stock with an aggregate market value of$1,110,648. . . . . . . . . . . . . . . . . . . . . . . . . . . . . . . . . . . . 1,000,000 1,000,000Repurchase Agreement dated 05/10/18 at 2.340%, due on10/05/18 with a maturity value of $1,514,430; collateralizedby U.S. Treasury Obligations with rates ranging from 0.000% -4.250%, maturity dates ranging from 02/07/19 - 02/15/47,and various Common Stock with an aggregate market value of$1,665,973. . . . . . . . . . . . . . . . . . . . . . . . . . . . . . . . . . . . 1,500,000 1,500,000Repurchase Agreement dated 07/10/18 at 2.340%, due on10/05/18 with a maturity value of $1,206,786; collateralizedby U.S. Treasury Obligations with rates ranging from 0.000% -4.250%, maturity dates ranging from 02/07/19 - 02/15/47,and various Common Stock with an aggregate market value of$1,332,778. . . . . . . . . . . . . . . . . . . . . . . . . . . . . . . . . . . . 1,200,000 1,200,000
42,619,380
Time Deposits—1.9%Canadian Imperial Bank of Commerce
2.130%, 10/01/18 . . . . . . . . . . . . . . . . . . . . . . . . . . . . . . 3,000,000 3,000,000Cooperative Rabobank UA New York
2.150%, 10/01/18 . . . . . . . . . . . . . . . . . . . . . . . . . . . . . . 3,000,000 3,000,000
Security DescriptionPrincipalAmount* Value
Time Deposits—(Continued)DZ Bank AG
2.150%, 10/01/18 . . . . . . . . . . . . . . . . . . . . . . . . . . . . . . 1,000,000 $ 1,000,000Nordea Bank New York
2.140%, 10/01/18 . . . . . . . . . . . . . . . . . . . . . . . . . . . . . . 1,000,000 1,000,000Svenska Handelsbanken AB
2.140%, 10/01/18 . . . . . . . . . . . . . . . . . . . . . . . . . . . . . . 1,000,000 1,000,000
9,000,000
Total Securities Lending Reinvestments(Cost $92,846,496) . . . . . . . . . . . . . . . . . . . . . . . . . . . . . . 92,852,190
Total Investments—119.8%(Cost $412,126,943) . . . . . . . . . . . . . . . . . . . . . . . . . . . . . 568,221,379
Other assets and liabilities (net)—(19.8)% . . . . . . . . . . . . . . . . . (93,900,590)
Net Assets—100.0% . . . . . . . . . . . . . . . . . . . . . . . . . . . . $474,320,789
* Principal amount stated in U.S. dollars unless otherwise noted.(a) Non-income producing security.(b) All or a portion of the security was held on loan. As of September 30, 2018, the
market value of securities loaned was $91,249,531 and the collateral receivedconsisted of cash in the amount of $92,818,770. The cash collateralinvestments are disclosed in the Schedule of Investments and categorized asSecurities Lending Reinvestments.
(c) Illiquid security. As of September 30, 2018, these securities represent 0.0% ofnet assets.
(d) Represents investment of cash collateral received from securities on loan as ofSeptember 30, 2018.
(e) Variable or floating rate security. The stated rate represents the rate atSeptember 30, 2018. Maturity date shown for callable securities reflects theearliest possible call date. For securities based on a published reference indexand spread, the index and spread are indicated in the description above. Forcertain variable rate securities, the coupon rate is determined by the issuer/agent based on current market conditions. For certain asset- andmortgage-backed securities, the coupon rate may fluctuate based on changes ofthe underlying collateral or prepayments of principal. These securities do notindicate a reference index and spread in their description above.
(ADR)— American Depositary Receipt(FEDEFF PRV)— Effective Federal Funds Rate(LIBOR)— London Interbank Offered Rate(SOFR)— Secured Overnight Financing Rate
Fair Value HierarchyAccounting principles generally accepted in the United States of America (“GAAP”) define fair market value as the price that the Portfolio would receive to sell an asset or pay to transfer a liability in an orderlytransaction between market participants at the measurement date. It establishes a fair value hierarchy that prioritizes inputs to valuation methods and requires disclosure of the fair value hierarchy, separatelyfor each major category of assets and liabilities, that segregates fair value measurements into three levels. Levels 1, 2 and 3 of the fair value hierarchy are defined as follows:
Level 1 - unadjusted quoted prices in active markets for identical investmentsLevel 2 - other significant observable inputs (including, but not limited to, quoted prices for similar assets or liabilities in markets that are either active or inactive; inputs other than quoted prices that areobservable such as interest rates, yield curves, volatilities, prepayment speeds, loss severities, credit risks, default rates, or other market corroborated inputs)Level 3 - significant unobservable inputs based on the best information available in the circumstances, to the extent observable inputs are unavailable (including the Portfolio’s own assumptions used indetermining the fair value of investments and derivative financial instruments)
The inputs or methodologies used for valuing investments are not necessarily an indication of the risk associated with investing in them. Changes to the inputs or methodologies used may result in transfersbetween levels, which will be recognized as of the beginning of the reporting period. Information on transfers between Level 1 and Level 2, if any, will be disclosed following the fair value hierarchy table below.A reconciliation of Level 3 securities, if any, will also be disclosed following the fair value hierarchy table. For more information about the Portfolio’s policy regarding the valuation of investments, please refer tothe Notes to Schedule of Investments.
BHFTII-155

Brighthouse Funds Trust II
Loomis Sayles Small Cap Core Portfolio
Schedule of Investments as of September 30, 2018 (Unaudited)The following table summarizes the fair value hierarchy of the Portfolio’s investments as of September 30, 2018:
Description Level 1 Level 2 Level 3 TotalCommon Stocks
Aerospace & Defense . . . . . . . . . . . . . . . . . . . . . . . . . . . . . . . . . . . . . . . . . . . . . . . . . . . . . . . . . . . . . . . . . . . . . . . . . . . . . $ 10,921,254 $ — $— $ 10,921,254Auto Components . . . . . . . . . . . . . . . . . . . . . . . . . . . . . . . . . . . . . . . . . . . . . . . . . . . . . . . . . . . . . . . . . . . . . . . . . . . . . . . 6,117,651 — — 6,117,651Banks . . . . . . . . . . . . . . . . . . . . . . . . . . . . . . . . . . . . . . . . . . . . . . . . . . . . . . . . . . . . . . . . . . . . . . . . . . . . . . . . . . . . . . . 57,944,001 — — 57,944,001Beverages . . . . . . . . . . . . . . . . . . . . . . . . . . . . . . . . . . . . . . . . . . . . . . . . . . . . . . . . . . . . . . . . . . . . . . . . . . . . . . . . . . . . 3,866,453 — — 3,866,453Biotechnology . . . . . . . . . . . . . . . . . . . . . . . . . . . . . . . . . . . . . . . . . . . . . . . . . . . . . . . . . . . . . . . . . . . . . . . . . . . . . . . . . . 7,879,027 — — 7,879,027Building Products . . . . . . . . . . . . . . . . . . . . . . . . . . . . . . . . . . . . . . . . . . . . . . . . . . . . . . . . . . . . . . . . . . . . . . . . . . . . . . . . 7,534,234 — — 7,534,234Capital Markets . . . . . . . . . . . . . . . . . . . . . . . . . . . . . . . . . . . . . . . . . . . . . . . . . . . . . . . . . . . . . . . . . . . . . . . . . . . . . . . . . 7,597,673 — — 7,597,673Chemicals . . . . . . . . . . . . . . . . . . . . . . . . . . . . . . . . . . . . . . . . . . . . . . . . . . . . . . . . . . . . . . . . . . . . . . . . . . . . . . . . . . . . 15,088,652 — — 15,088,652Commercial Services & Supplies . . . . . . . . . . . . . . . . . . . . . . . . . . . . . . . . . . . . . . . . . . . . . . . . . . . . . . . . . . . . . . . . . . . . . . 11,968,496 — — 11,968,496Communications Equipment . . . . . . . . . . . . . . . . . . . . . . . . . . . . . . . . . . . . . . . . . . . . . . . . . . . . . . . . . . . . . . . . . . . . . . . . . 3,024,973 — — 3,024,973Construction & Engineering . . . . . . . . . . . . . . . . . . . . . . . . . . . . . . . . . . . . . . . . . . . . . . . . . . . . . . . . . . . . . . . . . . . . . . . . . 3,623,468 — — 3,623,468Construction Materials . . . . . . . . . . . . . . . . . . . . . . . . . . . . . . . . . . . . . . . . . . . . . . . . . . . . . . . . . . . . . . . . . . . . . . . . . . . . 630,392 — — 630,392Consumer Finance . . . . . . . . . . . . . . . . . . . . . . . . . . . . . . . . . . . . . . . . . . . . . . . . . . . . . . . . . . . . . . . . . . . . . . . . . . . . . . . 4,303,957 — — 4,303,957Distributors . . . . . . . . . . . . . . . . . . . . . . . . . . . . . . . . . . . . . . . . . . . . . . . . . . . . . . . . . . . . . . . . . . . . . . . . . . . . . . . . . . . 2,654,318 — — 2,654,318Diversified Consumer Services . . . . . . . . . . . . . . . . . . . . . . . . . . . . . . . . . . . . . . . . . . . . . . . . . . . . . . . . . . . . . . . . . . . . . . . 10,698,901 — — 10,698,901Diversified Financial Services . . . . . . . . . . . . . . . . . . . . . . . . . . . . . . . . . . . . . . . . . . . . . . . . . . . . . . . . . . . . . . . . . . . . . . . . 1,258,676 — — 1,258,676Diversified Telecommunication Services . . . . . . . . . . . . . . . . . . . . . . . . . . . . . . . . . . . . . . . . . . . . . . . . . . . . . . . . . . . . . . . . . 1,731,083 — — 1,731,083Electric Utilities . . . . . . . . . . . . . . . . . . . . . . . . . . . . . . . . . . . . . . . . . . . . . . . . . . . . . . . . . . . . . . . . . . . . . . . . . . . . . . . . . 3,609,331 — — 3,609,331Electrical Equipment . . . . . . . . . . . . . . . . . . . . . . . . . . . . . . . . . . . . . . . . . . . . . . . . . . . . . . . . . . . . . . . . . . . . . . . . . . . . . . 4,089,445 — — 4,089,445Electronic Equipment, Instruments & Components . . . . . . . . . . . . . . . . . . . . . . . . . . . . . . . . . . . . . . . . . . . . . . . . . . . . . . . . . . . 13,660,845 — — 13,660,845Energy Equipment & Services . . . . . . . . . . . . . . . . . . . . . . . . . . . . . . . . . . . . . . . . . . . . . . . . . . . . . . . . . . . . . . . . . . . . . . . . 11,621,793 — — 11,621,793Entertainment . . . . . . . . . . . . . . . . . . . . . . . . . . . . . . . . . . . . . . . . . . . . . . . . . . . . . . . . . . . . . . . . . . . . . . . . . . . . . . . . . . 851,039 — — 851,039Equity Real Estate Investment Trusts . . . . . . . . . . . . . . . . . . . . . . . . . . . . . . . . . . . . . . . . . . . . . . . . . . . . . . . . . . . . . . . . . . . 21,906,719 — — 21,906,719Food & Staples Retailing . . . . . . . . . . . . . . . . . . . . . . . . . . . . . . . . . . . . . . . . . . . . . . . . . . . . . . . . . . . . . . . . . . . . . . . . . . . 811,296 — — 811,296Food Products . . . . . . . . . . . . . . . . . . . . . . . . . . . . . . . . . . . . . . . . . . . . . . . . . . . . . . . . . . . . . . . . . . . . . . . . . . . . . . . . . . 10,718,653 — — 10,718,653Health Care Equipment & Supplies . . . . . . . . . . . . . . . . . . . . . . . . . . . . . . . . . . . . . . . . . . . . . . . . . . . . . . . . . . . . . . . . . . . . 24,289,609 — — 24,289,609Health Care Providers & Services . . . . . . . . . . . . . . . . . . . . . . . . . . . . . . . . . . . . . . . . . . . . . . . . . . . . . . . . . . . . . . . . . . . . . 10,172,667 — — 10,172,667Health Care Technology . . . . . . . . . . . . . . . . . . . . . . . . . . . . . . . . . . . . . . . . . . . . . . . . . . . . . . . . . . . . . . . . . . . . . . . . . . . 6,031,375 — — 6,031,375Hotels, Restaurants & Leisure . . . . . . . . . . . . . . . . . . . . . . . . . . . . . . . . . . . . . . . . . . . . . . . . . . . . . . . . . . . . . . . . . . . . . . . . 11,219,075 — — 11,219,075Household Durables . . . . . . . . . . . . . . . . . . . . . . . . . . . . . . . . . . . . . . . . . . . . . . . . . . . . . . . . . . . . . . . . . . . . . . . . . . . . . . 2,402,670 — — 2,402,670Household Products . . . . . . . . . . . . . . . . . . . . . . . . . . . . . . . . . . . . . . . . . . . . . . . . . . . . . . . . . . . . . . . . . . . . . . . . . . . . . . 1,732,757 — — 1,732,757Independent Power and Renewable Electricity Producers . . . . . . . . . . . . . . . . . . . . . . . . . . . . . . . . . . . . . . . . . . . . . . . . . . . . . . 2,087,683 — — 2,087,683Industrial Conglomerates . . . . . . . . . . . . . . . . . . . . . . . . . . . . . . . . . . . . . . . . . . . . . . . . . . . . . . . . . . . . . . . . . . . . . . . . . . 2,706,158 — — 2,706,158Insurance . . . . . . . . . . . . . . . . . . . . . . . . . . . . . . . . . . . . . . . . . . . . . . . . . . . . . . . . . . . . . . . . . . . . . . . . . . . . . . . . . . . . . 14,496,504 — — 14,496,504Interactive Media & Services . . . . . . . . . . . . . . . . . . . . . . . . . . . . . . . . . . . . . . . . . . . . . . . . . . . . . . . . . . . . . . . . . . . . . . . . 1,352,766 — — 1,352,766IT Services . . . . . . . . . . . . . . . . . . . . . . . . . . . . . . . . . . . . . . . . . . . . . . . . . . . . . . . . . . . . . . . . . . . . . . . . . . . . . . . . . . . . 23,114,831 — — 23,114,831Leisure Products . . . . . . . . . . . . . . . . . . . . . . . . . . . . . . . . . . . . . . . . . . . . . . . . . . . . . . . . . . . . . . . . . . . . . . . . . . . . . . . . 705,505 — — 705,505Life Sciences Tools & Services . . . . . . . . . . . . . . . . . . . . . . . . . . . . . . . . . . . . . . . . . . . . . . . . . . . . . . . . . . . . . . . . . . . . . . . . 5,466,885 — — 5,466,885Machinery . . . . . . . . . . . . . . . . . . . . . . . . . . . . . . . . . . . . . . . . . . . . . . . . . . . . . . . . . . . . . . . . . . . . . . . . . . . . . . . . . . . . 27,768,485 — — 27,768,485Marine . . . . . . . . . . . . . . . . . . . . . . . . . . . . . . . . . . . . . . . . . . . . . . . . . . . . . . . . . . . . . . . . . . . . . . . . . . . . . . . . . . . . . . 1,430,245 — — 1,430,245Media . . . . . . . . . . . . . . . . . . . . . . . . . . . . . . . . . . . . . . . . . . . . . . . . . . . . . . . . . . . . . . . . . . . . . . . . . . . . . . . . . . . . . . . 8,543,794 — — 8,543,794Metals & Mining . . . . . . . . . . . . . . . . . . . . . . . . . . . . . . . . . . . . . . . . . . . . . . . . . . . . . . . . . . . . . . . . . . . . . . . . . . . . . . . . 1,323,511 0 — 1,323,511Multi-Utilities . . . . . . . . . . . . . . . . . . . . . . . . . . . . . . . . . . . . . . . . . . . . . . . . . . . . . . . . . . . . . . . . . . . . . . . . . . . . . . . . . . 2,487,771 — — 2,487,771Multiline Retail . . . . . . . . . . . . . . . . . . . . . . . . . . . . . . . . . . . . . . . . . . . . . . . . . . . . . . . . . . . . . . . . . . . . . . . . . . . . . . . . . 3,745,291 — — 3,745,291Oil, Gas & Consumable Fuels . . . . . . . . . . . . . . . . . . . . . . . . . . . . . . . . . . . . . . . . . . . . . . . . . . . . . . . . . . . . . . . . . . . . . . . . 5,902,738 — — 5,902,738Pharmaceuticals . . . . . . . . . . . . . . . . . . . . . . . . . . . . . . . . . . . . . . . . . . . . . . . . . . . . . . . . . . . . . . . . . . . . . . . . . . . . . . . . 7,801,137 — — 7,801,137Professional Services . . . . . . . . . . . . . . . . . . . . . . . . . . . . . . . . . . . . . . . . . . . . . . . . . . . . . . . . . . . . . . . . . . . . . . . . . . . . . 5,324,649 — — 5,324,649Road & Rail . . . . . . . . . . . . . . . . . . . . . . . . . . . . . . . . . . . . . . . . . . . . . . . . . . . . . . . . . . . . . . . . . . . . . . . . . . . . . . . . . . . 4,929,118 — — 4,929,118Semiconductors & Semiconductor Equipment . . . . . . . . . . . . . . . . . . . . . . . . . . . . . . . . . . . . . . . . . . . . . . . . . . . . . . . . . . . . . . 12,863,276 — — 12,863,276Software . . . . . . . . . . . . . . . . . . . . . . . . . . . . . . . . . . . . . . . . . . . . . . . . . . . . . . . . . . . . . . . . . . . . . . . . . . . . . . . . . . . . . 31,009,911 — — 31,009,911Specialty Retail . . . . . . . . . . . . . . . . . . . . . . . . . . . . . . . . . . . . . . . . . . . . . . . . . . . . . . . . . . . . . . . . . . . . . . . . . . . . . . . . . 7,156,168 — — 7,156,168Technology Hardware, Storage & Peripherals . . . . . . . . . . . . . . . . . . . . . . . . . . . . . . . . . . . . . . . . . . . . . . . . . . . . . . . . . . . . . 916,072 — — 916,072Textiles, Apparel & Luxury Goods . . . . . . . . . . . . . . . . . . . . . . . . . . . . . . . . . . . . . . . . . . . . . . . . . . . . . . . . . . . . . . . . . . . . . 6,988,984 — — 6,988,984Thrifts & Mortgage Finance . . . . . . . . . . . . . . . . . . . . . . . . . . . . . . . . . . . . . . . . . . . . . . . . . . . . . . . . . . . . . . . . . . . . . . . . . 6,344,441 — — 6,344,441Trading Companies & Distributors . . . . . . . . . . . . . . . . . . . . . . . . . . . . . . . . . . . . . . . . . . . . . . . . . . . . . . . . . . . . . . . . . . . . . 2,968,148 — — 2,968,148
Total Common Stocks . . . . . . . . . . . . . . . . . . . . . . . . . . . . . . . . . . . . . . . . . . . . . . . . . . . . . . . . . . . . . . . . . . . . . . . . . . . . . . . 467,394,554 0 — 467,394,554Total Short-Term Investment* . . . . . . . . . . . . . . . . . . . . . . . . . . . . . . . . . . . . . . . . . . . . . . . . . . . . . . . . . . . . . . . . . . . . . . . . . . — 7,974,635 — 7,974,635
Total Securities Lending Reinvestments* . . . . . . . . . . . . . . . . . . . . . . . . . . . . . . . . . . . . . . . . . . . . . . . . . . . . . . . . . . . . . . . . . . . — 92,852,190 — 92,852,190Total Investments . . . . . . . . . . . . . . . . . . . . . . . . . . . . . . . . . . . . . . . . . . . . . . . . . . . . . . . . . . . . . . . . . . . . . . . . . . . . . . . . . . $467,394,554 $100,826,825 $— $568,221,379
Collateral for Securities Loaned (Liability) . . . . . . . . . . . . . . . . . . . . . . . . . . . . . . . . . . . . . . . . . . . . . . . . . . . . . . . . . . . . . . . . . . $ — $ (92,818,770) $— $ (92,818,770)
* See Schedule of Investments for additional detailed categorizations.
BHFTII-156
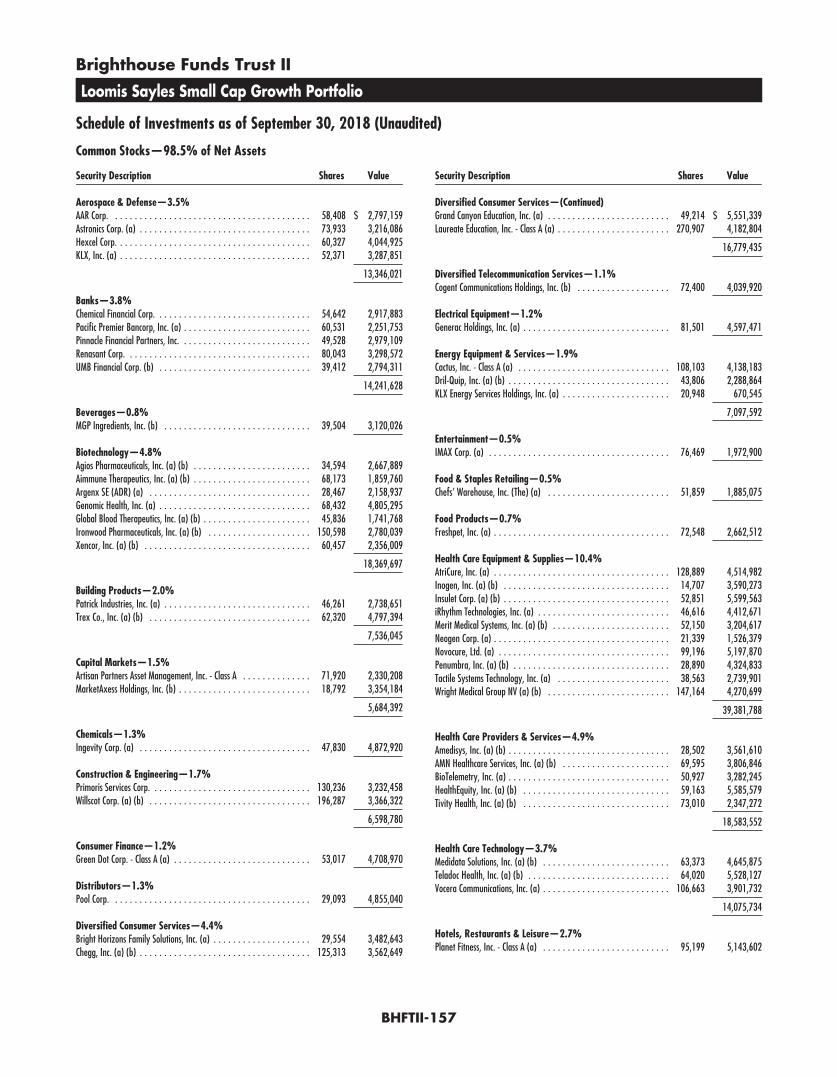
Brighthouse Funds Trust II
Loomis Sayles Small Cap Growth Portfolio
Schedule of Investments as of September 30, 2018 (Unaudited)
Common Stocks—98.5% of Net Assets
Security Description Shares Value
Aerospace & Defense—3.5%AAR Corp. . . . . . . . . . . . . . . . . . . . . . . . . . . . . . . . . . . . . . . . . 58,408 $ 2,797,159Astronics Corp. (a) . . . . . . . . . . . . . . . . . . . . . . . . . . . . . . . . . . . 73,933 3,216,086Hexcel Corp. . . . . . . . . . . . . . . . . . . . . . . . . . . . . . . . . . . . . . . . 60,327 4,044,925KLX, Inc. (a) . . . . . . . . . . . . . . . . . . . . . . . . . . . . . . . . . . . . . . . 52,371 3,287,851
13,346,021
Banks—3.8%Chemical Financial Corp. . . . . . . . . . . . . . . . . . . . . . . . . . . . . . . . 54,642 2,917,883Pacific Premier Bancorp, Inc. (a) . . . . . . . . . . . . . . . . . . . . . . . . . . 60,531 2,251,753Pinnacle Financial Partners, Inc. . . . . . . . . . . . . . . . . . . . . . . . . . . 49,528 2,979,109Renasant Corp. . . . . . . . . . . . . . . . . . . . . . . . . . . . . . . . . . . . . . 80,043 3,298,572UMB Financial Corp. (b) . . . . . . . . . . . . . . . . . . . . . . . . . . . . . . . 39,412 2,794,311
14,241,628
Beverages—0.8%MGP Ingredients, Inc. (b) . . . . . . . . . . . . . . . . . . . . . . . . . . . . . . 39,504 3,120,026
Biotechnology—4.8%Agios Pharmaceuticals, Inc. (a) (b) . . . . . . . . . . . . . . . . . . . . . . . . 34,594 2,667,889Aimmune Therapeutics, Inc. (a) (b) . . . . . . . . . . . . . . . . . . . . . . . . 68,173 1,859,760Argenx SE (ADR) (a) . . . . . . . . . . . . . . . . . . . . . . . . . . . . . . . . . 28,467 2,158,937Genomic Health, Inc. (a) . . . . . . . . . . . . . . . . . . . . . . . . . . . . . . . 68,432 4,805,295Global Blood Therapeutics, Inc. (a) (b) . . . . . . . . . . . . . . . . . . . . . . 45,836 1,741,768Ironwood Pharmaceuticals, Inc. (a) (b) . . . . . . . . . . . . . . . . . . . . . 150,598 2,780,039Xencor, Inc. (a) (b) . . . . . . . . . . . . . . . . . . . . . . . . . . . . . . . . . . 60,457 2,356,009
18,369,697
Building Products—2.0%Patrick Industries, Inc. (a) . . . . . . . . . . . . . . . . . . . . . . . . . . . . . . 46,261 2,738,651Trex Co., Inc. (a) (b) . . . . . . . . . . . . . . . . . . . . . . . . . . . . . . . . . 62,320 4,797,394
7,536,045
Capital Markets—1.5%Artisan Partners Asset Management, Inc. - Class A . . . . . . . . . . . . . . 71,920 2,330,208MarketAxess Holdings, Inc. (b) . . . . . . . . . . . . . . . . . . . . . . . . . . . 18,792 3,354,184
5,684,392
Chemicals—1.3%Ingevity Corp. (a) . . . . . . . . . . . . . . . . . . . . . . . . . . . . . . . . . . . 47,830 4,872,920
Construction & Engineering—1.7%Primoris Services Corp. . . . . . . . . . . . . . . . . . . . . . . . . . . . . . . . . 130,236 3,232,458Willscot Corp. (a) (b) . . . . . . . . . . . . . . . . . . . . . . . . . . . . . . . . . 196,287 3,366,322
6,598,780
Consumer Finance—1.2%Green Dot Corp. - Class A (a) . . . . . . . . . . . . . . . . . . . . . . . . . . . . 53,017 4,708,970
Distributors—1.3%Pool Corp. . . . . . . . . . . . . . . . . . . . . . . . . . . . . . . . . . . . . . . . . 29,093 4,855,040
Diversified Consumer Services—4.4%Bright Horizons Family Solutions, Inc. (a) . . . . . . . . . . . . . . . . . . . . 29,554 3,482,643Chegg, Inc. (a) (b) . . . . . . . . . . . . . . . . . . . . . . . . . . . . . . . . . . . 125,313 3,562,649
Security Description Shares Value
Diversified Consumer Services—(Continued)Grand Canyon Education, Inc. (a) . . . . . . . . . . . . . . . . . . . . . . . . . 49,214 $ 5,551,339Laureate Education, Inc. - Class A (a) . . . . . . . . . . . . . . . . . . . . . . . 270,907 4,182,804
16,779,435
Diversified Telecommunication Services—1.1%Cogent Communications Holdings, Inc. (b) . . . . . . . . . . . . . . . . . . . 72,400 4,039,920
Electrical Equipment—1.2%Generac Holdings, Inc. (a) . . . . . . . . . . . . . . . . . . . . . . . . . . . . . . 81,501 4,597,471
Energy Equipment & Services—1.9%Cactus, Inc. - Class A (a) . . . . . . . . . . . . . . . . . . . . . . . . . . . . . . . 108,103 4,138,183Dril-Quip, Inc. (a) (b) . . . . . . . . . . . . . . . . . . . . . . . . . . . . . . . . . 43,806 2,288,864KLX Energy Services Holdings, Inc. (a) . . . . . . . . . . . . . . . . . . . . . . 20,948 670,545
7,097,592
Entertainment—0.5%IMAX Corp. (a) . . . . . . . . . . . . . . . . . . . . . . . . . . . . . . . . . . . . . 76,469 1,972,900
Food & Staples Retailing—0.5%Chefs’ Warehouse, Inc. (The) (a) . . . . . . . . . . . . . . . . . . . . . . . . . 51,859 1,885,075
Food Products—0.7%Freshpet, Inc. (a) . . . . . . . . . . . . . . . . . . . . . . . . . . . . . . . . . . . . 72,548 2,662,512
Health Care Equipment & Supplies—10.4%AtriCure, Inc. (a) . . . . . . . . . . . . . . . . . . . . . . . . . . . . . . . . . . . . 128,889 4,514,982Inogen, Inc. (a) (b) . . . . . . . . . . . . . . . . . . . . . . . . . . . . . . . . . . 14,707 3,590,273Insulet Corp. (a) (b) . . . . . . . . . . . . . . . . . . . . . . . . . . . . . . . . . . 52,851 5,599,563iRhythm Technologies, Inc. (a) . . . . . . . . . . . . . . . . . . . . . . . . . . . 46,616 4,412,671Merit Medical Systems, Inc. (a) (b) . . . . . . . . . . . . . . . . . . . . . . . . 52,150 3,204,617Neogen Corp. (a) . . . . . . . . . . . . . . . . . . . . . . . . . . . . . . . . . . . . 21,339 1,526,379Novocure, Ltd. (a) . . . . . . . . . . . . . . . . . . . . . . . . . . . . . . . . . . . 99,196 5,197,870Penumbra, Inc. (a) (b) . . . . . . . . . . . . . . . . . . . . . . . . . . . . . . . . 28,890 4,324,833Tactile Systems Technology, Inc. (a) . . . . . . . . . . . . . . . . . . . . . . . 38,563 2,739,901Wright Medical Group NV (a) (b) . . . . . . . . . . . . . . . . . . . . . . . . . 147,164 4,270,699
39,381,788
Health Care Providers & Services—4.9%Amedisys, Inc. (a) (b) . . . . . . . . . . . . . . . . . . . . . . . . . . . . . . . . . 28,502 3,561,610AMN Healthcare Services, Inc. (a) (b) . . . . . . . . . . . . . . . . . . . . . . 69,595 3,806,846BioTelemetry, Inc. (a) . . . . . . . . . . . . . . . . . . . . . . . . . . . . . . . . . 50,927 3,282,245HealthEquity, Inc. (a) (b) . . . . . . . . . . . . . . . . . . . . . . . . . . . . . . 59,163 5,585,579Tivity Health, Inc. (a) (b) . . . . . . . . . . . . . . . . . . . . . . . . . . . . . . 73,010 2,347,272
18,583,552
Health Care Technology—3.7%Medidata Solutions, Inc. (a) (b) . . . . . . . . . . . . . . . . . . . . . . . . . . 63,373 4,645,875Teladoc Health, Inc. (a) (b) . . . . . . . . . . . . . . . . . . . . . . . . . . . . . 64,020 5,528,127Vocera Communications, Inc. (a) . . . . . . . . . . . . . . . . . . . . . . . . . . 106,663 3,901,732
14,075,734
Hotels, Restaurants & Leisure—2.7%Planet Fitness, Inc. - Class A (a) . . . . . . . . . . . . . . . . . . . . . . . . . . 95,199 5,143,602
BHFTII-157
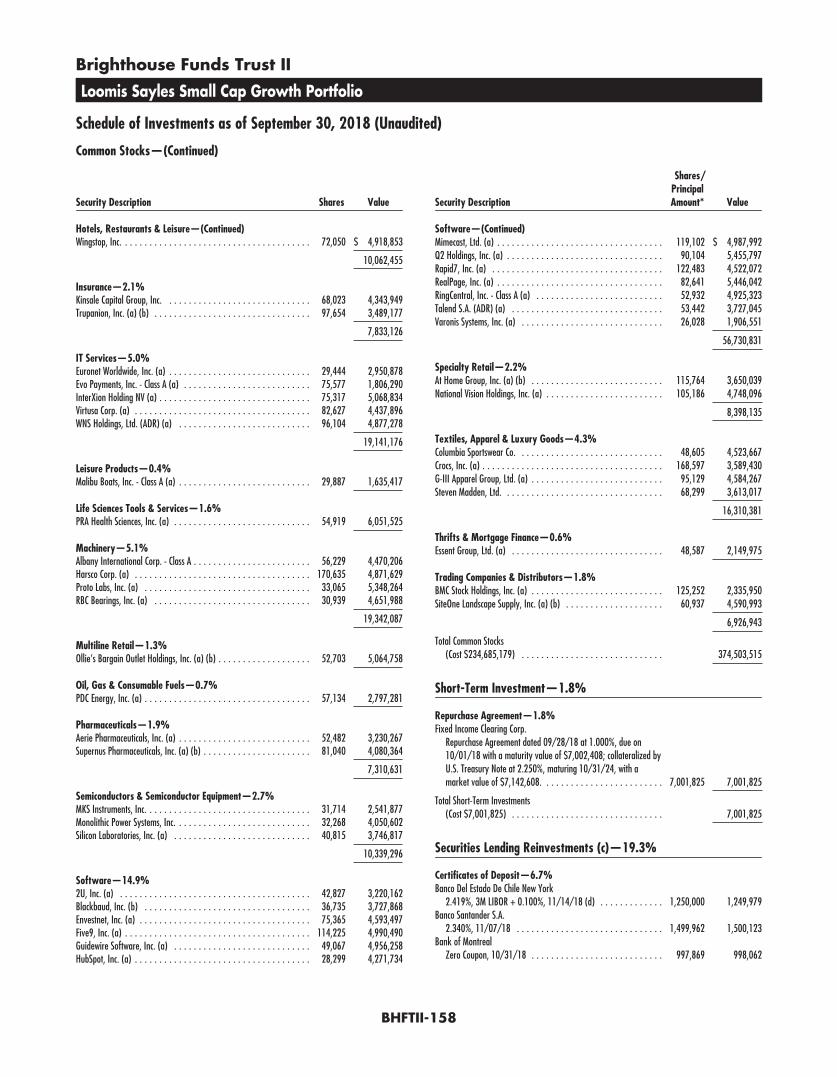
Brighthouse Funds Trust II
Loomis Sayles Small Cap Growth Portfolio
Schedule of Investments as of September 30, 2018 (Unaudited)
Common Stocks—(Continued)
Security Description Shares Value
Hotels, Restaurants & Leisure—(Continued)Wingstop, Inc. . . . . . . . . . . . . . . . . . . . . . . . . . . . . . . . . . . . . . . 72,050 $ 4,918,853
10,062,455
Insurance—2.1%Kinsale Capital Group, Inc. . . . . . . . . . . . . . . . . . . . . . . . . . . . . . 68,023 4,343,949Trupanion, Inc. (a) (b) . . . . . . . . . . . . . . . . . . . . . . . . . . . . . . . . 97,654 3,489,177
7,833,126
IT Services—5.0%Euronet Worldwide, Inc. (a) . . . . . . . . . . . . . . . . . . . . . . . . . . . . . 29,444 2,950,878Evo Payments, Inc. - Class A (a) . . . . . . . . . . . . . . . . . . . . . . . . . . 75,577 1,806,290InterXion Holding NV (a) . . . . . . . . . . . . . . . . . . . . . . . . . . . . . . . 75,317 5,068,834Virtusa Corp. (a) . . . . . . . . . . . . . . . . . . . . . . . . . . . . . . . . . . . . 82,627 4,437,896WNS Holdings, Ltd. (ADR) (a) . . . . . . . . . . . . . . . . . . . . . . . . . . . 96,104 4,877,278
19,141,176
Leisure Products—0.4%Malibu Boats, Inc. - Class A (a) . . . . . . . . . . . . . . . . . . . . . . . . . . . 29,887 1,635,417
Life Sciences Tools & Services—1.6%PRA Health Sciences, Inc. (a) . . . . . . . . . . . . . . . . . . . . . . . . . . . . 54,919 6,051,525
Machinery—5.1%Albany International Corp. - Class A . . . . . . . . . . . . . . . . . . . . . . . . 56,229 4,470,206Harsco Corp. (a) . . . . . . . . . . . . . . . . . . . . . . . . . . . . . . . . . . . . 170,635 4,871,629Proto Labs, Inc. (a) . . . . . . . . . . . . . . . . . . . . . . . . . . . . . . . . . . 33,065 5,348,264RBC Bearings, Inc. (a) . . . . . . . . . . . . . . . . . . . . . . . . . . . . . . . . 30,939 4,651,988
19,342,087
Multiline Retail—1.3%Ollie’s Bargain Outlet Holdings, Inc. (a) (b) . . . . . . . . . . . . . . . . . . . 52,703 5,064,758
Oil, Gas & Consumable Fuels—0.7%PDC Energy, Inc. (a) . . . . . . . . . . . . . . . . . . . . . . . . . . . . . . . . . . 57,134 2,797,281
Pharmaceuticals—1.9%Aerie Pharmaceuticals, Inc. (a) . . . . . . . . . . . . . . . . . . . . . . . . . . . 52,482 3,230,267Supernus Pharmaceuticals, Inc. (a) (b) . . . . . . . . . . . . . . . . . . . . . . 81,040 4,080,364
7,310,631
Semiconductors & Semiconductor Equipment—2.7%MKS Instruments, Inc. . . . . . . . . . . . . . . . . . . . . . . . . . . . . . . . . . 31,714 2,541,877Monolithic Power Systems, Inc. . . . . . . . . . . . . . . . . . . . . . . . . . . . 32,268 4,050,602Silicon Laboratories, Inc. (a) . . . . . . . . . . . . . . . . . . . . . . . . . . . . 40,815 3,746,817
10,339,296
Software—14.9%2U, Inc. (a) . . . . . . . . . . . . . . . . . . . . . . . . . . . . . . . . . . . . . . . 42,827 3,220,162Blackbaud, Inc. (b) . . . . . . . . . . . . . . . . . . . . . . . . . . . . . . . . . . 36,735 3,727,868Envestnet, Inc. (a) . . . . . . . . . . . . . . . . . . . . . . . . . . . . . . . . . . . 75,365 4,593,497Five9, Inc. (a) . . . . . . . . . . . . . . . . . . . . . . . . . . . . . . . . . . . . . . 114,225 4,990,490Guidewire Software, Inc. (a) . . . . . . . . . . . . . . . . . . . . . . . . . . . . 49,067 4,956,258HubSpot, Inc. (a) . . . . . . . . . . . . . . . . . . . . . . . . . . . . . . . . . . . . 28,299 4,271,734
Security Description
Shares/PrincipalAmount* Value
Software—(Continued)Mimecast, Ltd. (a) . . . . . . . . . . . . . . . . . . . . . . . . . . . . . . . . . . 119,102 $ 4,987,992Q2 Holdings, Inc. (a) . . . . . . . . . . . . . . . . . . . . . . . . . . . . . . . . 90,104 5,455,797Rapid7, Inc. (a) . . . . . . . . . . . . . . . . . . . . . . . . . . . . . . . . . . . 122,483 4,522,072RealPage, Inc. (a) . . . . . . . . . . . . . . . . . . . . . . . . . . . . . . . . . . 82,641 5,446,042RingCentral, Inc. - Class A (a) . . . . . . . . . . . . . . . . . . . . . . . . . . 52,932 4,925,323Talend S.A. (ADR) (a) . . . . . . . . . . . . . . . . . . . . . . . . . . . . . . . 53,442 3,727,045Varonis Systems, Inc. (a) . . . . . . . . . . . . . . . . . . . . . . . . . . . . . 26,028 1,906,551
56,730,831
Specialty Retail—2.2%At Home Group, Inc. (a) (b) . . . . . . . . . . . . . . . . . . . . . . . . . . . 115,764 3,650,039National Vision Holdings, Inc. (a) . . . . . . . . . . . . . . . . . . . . . . . . 105,186 4,748,096
8,398,135
Textiles, Apparel & Luxury Goods—4.3%Columbia Sportswear Co. . . . . . . . . . . . . . . . . . . . . . . . . . . . . . 48,605 4,523,667Crocs, Inc. (a) . . . . . . . . . . . . . . . . . . . . . . . . . . . . . . . . . . . . . 168,597 3,589,430G-III Apparel Group, Ltd. (a) . . . . . . . . . . . . . . . . . . . . . . . . . . . 95,129 4,584,267Steven Madden, Ltd. . . . . . . . . . . . . . . . . . . . . . . . . . . . . . . . . 68,299 3,613,017
16,310,381
Thrifts & Mortgage Finance—0.6%Essent Group, Ltd. (a) . . . . . . . . . . . . . . . . . . . . . . . . . . . . . . . 48,587 2,149,975
Trading Companies & Distributors—1.8%BMC Stock Holdings, Inc. (a) . . . . . . . . . . . . . . . . . . . . . . . . . . . 125,252 2,335,950SiteOne Landscape Supply, Inc. (a) (b) . . . . . . . . . . . . . . . . . . . . 60,937 4,590,993
6,926,943
Total Common Stocks(Cost $234,685,179) . . . . . . . . . . . . . . . . . . . . . . . . . . . . . 374,503,515
Short-Term Investment—1.8%
Repurchase Agreement—1.8%Fixed Income Clearing Corp.
Repurchase Agreement dated 09/28/18 at 1.000%, due on10/01/18 with a maturity value of $7,002,408; collateralized byU.S. Treasury Note at 2.250%, maturing 10/31/24, with amarket value of $7,142,608. . . . . . . . . . . . . . . . . . . . . . . . . 7,001,825 7,001,825
Total Short-Term Investments(Cost $7,001,825) . . . . . . . . . . . . . . . . . . . . . . . . . . . . . . . 7,001,825
Securities Lending Reinvestments (c)—19.3%
Certificates of Deposit—6.7%Banco Del Estado De Chile New York
2.419%, 3M LIBOR + 0.100%, 11/14/18 (d) . . . . . . . . . . . . . 1,250,000 1,249,979Banco Santander S.A.
2.340%, 11/07/18 . . . . . . . . . . . . . . . . . . . . . . . . . . . . . . 1,499,962 1,500,123Bank of Montreal
Zero Coupon, 10/31/18 . . . . . . . . . . . . . . . . . . . . . . . . . . . 997,869 998,062
BHFTII-158
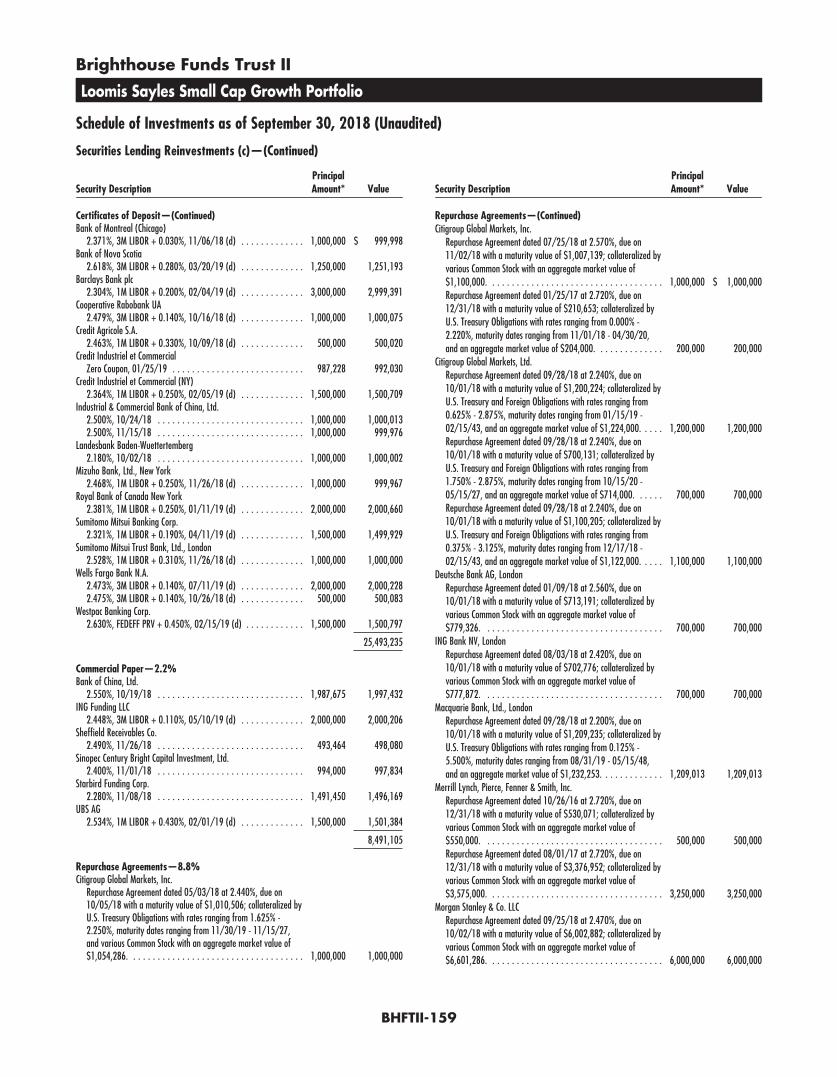
Brighthouse Funds Trust II
Loomis Sayles Small Cap Growth Portfolio
Schedule of Investments as of September 30, 2018 (Unaudited)
Securities Lending Reinvestments (c)—(Continued)
Security DescriptionPrincipalAmount* Value
Certificates of Deposit—(Continued)Bank of Montreal (Chicago)
2.371%, 3M LIBOR + 0.030%, 11/06/18 (d) . . . . . . . . . . . . . 1,000,000 $ 999,998Bank of Nova Scotia
2.618%, 3M LIBOR + 0.280%, 03/20/19 (d) . . . . . . . . . . . . . 1,250,000 1,251,193Barclays Bank plc
2.304%, 1M LIBOR + 0.200%, 02/04/19 (d) . . . . . . . . . . . . . 3,000,000 2,999,391Cooperative Rabobank UA
2.479%, 3M LIBOR + 0.140%, 10/16/18 (d) . . . . . . . . . . . . . 1,000,000 1,000,075Credit Agricole S.A.
2.463%, 1M LIBOR + 0.330%, 10/09/18 (d) . . . . . . . . . . . . . 500,000 500,020Credit Industriel et Commercial
Zero Coupon, 01/25/19 . . . . . . . . . . . . . . . . . . . . . . . . . . . 987,228 992,030Credit Industriel et Commercial (NY)
2.364%, 1M LIBOR + 0.250%, 02/05/19 (d) . . . . . . . . . . . . . 1,500,000 1,500,709Industrial & Commercial Bank of China, Ltd.
2.500%, 10/24/18 . . . . . . . . . . . . . . . . . . . . . . . . . . . . . . 1,000,000 1,000,0132.500%, 11/15/18 . . . . . . . . . . . . . . . . . . . . . . . . . . . . . . 1,000,000 999,976
Landesbank Baden-Wuettertemberg2.180%, 10/02/18 . . . . . . . . . . . . . . . . . . . . . . . . . . . . . . 1,000,000 1,000,002
Mizuho Bank, Ltd., New York2.468%, 1M LIBOR + 0.250%, 11/26/18 (d) . . . . . . . . . . . . . 1,000,000 999,967
Royal Bank of Canada New York2.381%, 1M LIBOR + 0.250%, 01/11/19 (d) . . . . . . . . . . . . . 2,000,000 2,000,660
Sumitomo Mitsui Banking Corp.2.321%, 1M LIBOR + 0.190%, 04/11/19 (d) . . . . . . . . . . . . . 1,500,000 1,499,929
Sumitomo Mitsui Trust Bank, Ltd., London2.528%, 1M LIBOR + 0.310%, 11/26/18 (d) . . . . . . . . . . . . . 1,000,000 1,000,000
Wells Fargo Bank N.A.2.473%, 3M LIBOR + 0.140%, 07/11/19 (d) . . . . . . . . . . . . . 2,000,000 2,000,2282.475%, 3M LIBOR + 0.140%, 10/26/18 (d) . . . . . . . . . . . . . 500,000 500,083
Westpac Banking Corp.2.630%, FEDEFF PRV + 0.450%, 02/15/19 (d) . . . . . . . . . . . . 1,500,000 1,500,797
25,493,235
Commercial Paper—2.2%Bank of China, Ltd.
2.550%, 10/19/18 . . . . . . . . . . . . . . . . . . . . . . . . . . . . . . 1,987,675 1,997,432ING Funding LLC
2.448%, 3M LIBOR + 0.110%, 05/10/19 (d) . . . . . . . . . . . . . 2,000,000 2,000,206Sheffield Receivables Co.
2.490%, 11/26/18 . . . . . . . . . . . . . . . . . . . . . . . . . . . . . . 493,464 498,080Sinopec Century Bright Capital Investment, Ltd.
2.400%, 11/01/18 . . . . . . . . . . . . . . . . . . . . . . . . . . . . . . 994,000 997,834Starbird Funding Corp.
2.280%, 11/08/18 . . . . . . . . . . . . . . . . . . . . . . . . . . . . . . 1,491,450 1,496,169UBS AG
2.534%, 1M LIBOR + 0.430%, 02/01/19 (d) . . . . . . . . . . . . . 1,500,000 1,501,384
8,491,105
Repurchase Agreements—8.8%Citigroup Global Markets, Inc.
Repurchase Agreement dated 05/03/18 at 2.440%, due on10/05/18 with a maturity value of $1,010,506; collateralized byU.S. Treasury Obligations with rates ranging from 1.625% -2.250%, maturity dates ranging from 11/30/19 - 11/15/27,and various Common Stock with an aggregate market value of$1,054,286. . . . . . . . . . . . . . . . . . . . . . . . . . . . . . . . . . . . 1,000,000 1,000,000
Security DescriptionPrincipalAmount* Value
Repurchase Agreements—(Continued)Citigroup Global Markets, Inc.
Repurchase Agreement dated 07/25/18 at 2.570%, due on11/02/18 with a maturity value of $1,007,139; collateralized byvarious Common Stock with an aggregate market value of$1,100,000. . . . . . . . . . . . . . . . . . . . . . . . . . . . . . . . . . . . 1,000,000 $ 1,000,000Repurchase Agreement dated 01/25/17 at 2.720%, due on12/31/18 with a maturity value of $210,653; collateralized byU.S. Treasury Obligations with rates ranging from 0.000% -2.220%, maturity dates ranging from 11/01/18 - 04/30/20,and an aggregate market value of $204,000. . . . . . . . . . . . . . 200,000 200,000
Citigroup Global Markets, Ltd.Repurchase Agreement dated 09/28/18 at 2.240%, due on10/01/18 with a maturity value of $1,200,224; collateralized byU.S. Treasury and Foreign Obligations with rates ranging from0.625% - 2.875%, maturity dates ranging from 01/15/19 -02/15/43, and an aggregate market value of $1,224,000. . . . . 1,200,000 1,200,000Repurchase Agreement dated 09/28/18 at 2.240%, due on10/01/18 with a maturity value of $700,131; collateralized byU.S. Treasury and Foreign Obligations with rates ranging from1.750% - 2.875%, maturity dates ranging from 10/15/20 -05/15/27, and an aggregate market value of $714,000. . . . . . 700,000 700,000Repurchase Agreement dated 09/28/18 at 2.240%, due on10/01/18 with a maturity value of $1,100,205; collateralized byU.S. Treasury and Foreign Obligations with rates ranging from0.375% - 3.125%, maturity dates ranging from 12/17/18 -02/15/43, and an aggregate market value of $1,122,000. . . . . 1,100,000 1,100,000
Deutsche Bank AG, LondonRepurchase Agreement dated 01/09/18 at 2.560%, due on10/01/18 with a maturity value of $713,191; collateralized byvarious Common Stock with an aggregate market value of$779,326. . . . . . . . . . . . . . . . . . . . . . . . . . . . . . . . . . . . . 700,000 700,000
ING Bank NV, LondonRepurchase Agreement dated 08/03/18 at 2.420%, due on10/01/18 with a maturity value of $702,776; collateralized byvarious Common Stock with an aggregate market value of$777,872. . . . . . . . . . . . . . . . . . . . . . . . . . . . . . . . . . . . . 700,000 700,000
Macquarie Bank, Ltd., LondonRepurchase Agreement dated 09/28/18 at 2.200%, due on10/01/18 with a maturity value of $1,209,235; collateralized byU.S. Treasury Obligations with rates ranging from 0.125% -5.500%, maturity dates ranging from 08/31/19 - 05/15/48,and an aggregate market value of $1,232,253. . . . . . . . . . . . . 1,209,013 1,209,013
Merrill Lynch, Pierce, Fenner & Smith, Inc.Repurchase Agreement dated 10/26/16 at 2.720%, due on12/31/18 with a maturity value of $530,071; collateralized byvarious Common Stock with an aggregate market value of$550,000. . . . . . . . . . . . . . . . . . . . . . . . . . . . . . . . . . . . . 500,000 500,000Repurchase Agreement dated 08/01/17 at 2.720%, due on12/31/18 with a maturity value of $3,376,952; collateralized byvarious Common Stock with an aggregate market value of$3,575,000. . . . . . . . . . . . . . . . . . . . . . . . . . . . . . . . . . . . 3,250,000 3,250,000
Morgan Stanley & Co. LLCRepurchase Agreement dated 09/25/18 at 2.470%, due on10/02/18 with a maturity value of $6,002,882; collateralized byvarious Common Stock with an aggregate market value of$6,601,286. . . . . . . . . . . . . . . . . . . . . . . . . . . . . . . . . . . . 6,000,000 6,000,000
BHFTII-159
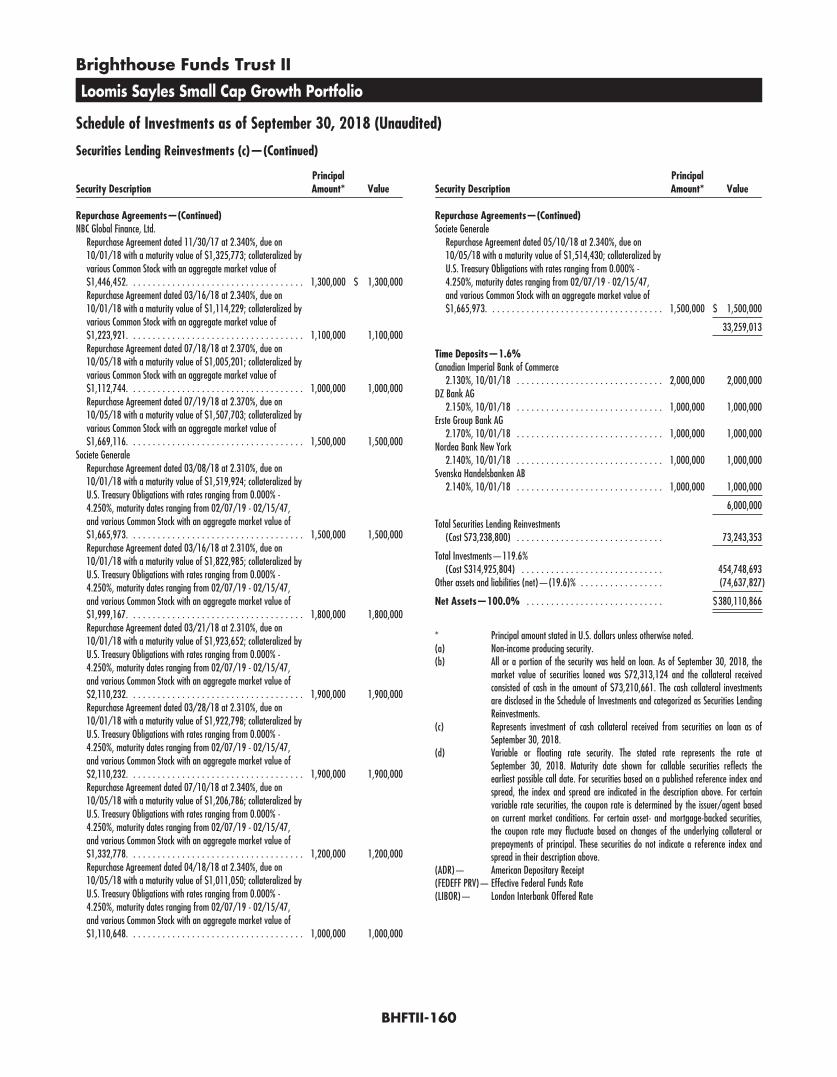
Brighthouse Funds Trust II
Loomis Sayles Small Cap Growth Portfolio
Schedule of Investments as of September 30, 2018 (Unaudited)
Securities Lending Reinvestments (c)—(Continued)
Security DescriptionPrincipalAmount* Value
Repurchase Agreements—(Continued)NBC Global Finance, Ltd.
Repurchase Agreement dated 11/30/17 at 2.340%, due on10/01/18 with a maturity value of $1,325,773; collateralized byvarious Common Stock with an aggregate market value of$1,446,452. . . . . . . . . . . . . . . . . . . . . . . . . . . . . . . . . . . . 1,300,000 $ 1,300,000Repurchase Agreement dated 03/16/18 at 2.340%, due on10/01/18 with a maturity value of $1,114,229; collateralized byvarious Common Stock with an aggregate market value of$1,223,921. . . . . . . . . . . . . . . . . . . . . . . . . . . . . . . . . . . . 1,100,000 1,100,000Repurchase Agreement dated 07/18/18 at 2.370%, due on10/05/18 with a maturity value of $1,005,201; collateralized byvarious Common Stock with an aggregate market value of$1,112,744. . . . . . . . . . . . . . . . . . . . . . . . . . . . . . . . . . . . 1,000,000 1,000,000Repurchase Agreement dated 07/19/18 at 2.370%, due on10/05/18 with a maturity value of $1,507,703; collateralized byvarious Common Stock with an aggregate market value of$1,669,116. . . . . . . . . . . . . . . . . . . . . . . . . . . . . . . . . . . . 1,500,000 1,500,000
Societe GeneraleRepurchase Agreement dated 03/08/18 at 2.310%, due on10/01/18 with a maturity value of $1,519,924; collateralized byU.S. Treasury Obligations with rates ranging from 0.000% -4.250%, maturity dates ranging from 02/07/19 - 02/15/47,and various Common Stock with an aggregate market value of$1,665,973. . . . . . . . . . . . . . . . . . . . . . . . . . . . . . . . . . . . 1,500,000 1,500,000Repurchase Agreement dated 03/16/18 at 2.310%, due on10/01/18 with a maturity value of $1,822,985; collateralized byU.S. Treasury Obligations with rates ranging from 0.000% -4.250%, maturity dates ranging from 02/07/19 - 02/15/47,and various Common Stock with an aggregate market value of$1,999,167. . . . . . . . . . . . . . . . . . . . . . . . . . . . . . . . . . . . 1,800,000 1,800,000Repurchase Agreement dated 03/21/18 at 2.310%, due on10/01/18 with a maturity value of $1,923,652; collateralized byU.S. Treasury Obligations with rates ranging from 0.000% -4.250%, maturity dates ranging from 02/07/19 - 02/15/47,and various Common Stock with an aggregate market value of$2,110,232. . . . . . . . . . . . . . . . . . . . . . . . . . . . . . . . . . . . 1,900,000 1,900,000Repurchase Agreement dated 03/28/18 at 2.310%, due on10/01/18 with a maturity value of $1,922,798; collateralized byU.S. Treasury Obligations with rates ranging from 0.000% -4.250%, maturity dates ranging from 02/07/19 - 02/15/47,and various Common Stock with an aggregate market value of$2,110,232. . . . . . . . . . . . . . . . . . . . . . . . . . . . . . . . . . . . 1,900,000 1,900,000Repurchase Agreement dated 07/10/18 at 2.340%, due on10/05/18 with a maturity value of $1,206,786; collateralized byU.S. Treasury Obligations with rates ranging from 0.000% -4.250%, maturity dates ranging from 02/07/19 - 02/15/47,and various Common Stock with an aggregate market value of$1,332,778. . . . . . . . . . . . . . . . . . . . . . . . . . . . . . . . . . . . 1,200,000 1,200,000Repurchase Agreement dated 04/18/18 at 2.340%, due on10/05/18 with a maturity value of $1,011,050; collateralized byU.S. Treasury Obligations with rates ranging from 0.000% -4.250%, maturity dates ranging from 02/07/19 - 02/15/47,and various Common Stock with an aggregate market value of$1,110,648. . . . . . . . . . . . . . . . . . . . . . . . . . . . . . . . . . . . 1,000,000 1,000,000
Security DescriptionPrincipalAmount* Value
Repurchase Agreements—(Continued)Societe Generale
Repurchase Agreement dated 05/10/18 at 2.340%, due on10/05/18 with a maturity value of $1,514,430; collateralized byU.S. Treasury Obligations with rates ranging from 0.000% -4.250%, maturity dates ranging from 02/07/19 - 02/15/47,and various Common Stock with an aggregate market value of$1,665,973. . . . . . . . . . . . . . . . . . . . . . . . . . . . . . . . . . . . 1,500,000 $ 1,500,000
33,259,013
Time Deposits—1.6%Canadian Imperial Bank of Commerce
2.130%, 10/01/18 . . . . . . . . . . . . . . . . . . . . . . . . . . . . . . 2,000,000 2,000,000DZ Bank AG
2.150%, 10/01/18 . . . . . . . . . . . . . . . . . . . . . . . . . . . . . . 1,000,000 1,000,000Erste Group Bank AG
2.170%, 10/01/18 . . . . . . . . . . . . . . . . . . . . . . . . . . . . . . 1,000,000 1,000,000Nordea Bank New York
2.140%, 10/01/18 . . . . . . . . . . . . . . . . . . . . . . . . . . . . . . 1,000,000 1,000,000Svenska Handelsbanken AB
2.140%, 10/01/18 . . . . . . . . . . . . . . . . . . . . . . . . . . . . . . 1,000,000 1,000,000
6,000,000
Total Securities Lending Reinvestments(Cost $73,238,800) . . . . . . . . . . . . . . . . . . . . . . . . . . . . . . 73,243,353
Total Investments—119.6%(Cost $314,925,804) . . . . . . . . . . . . . . . . . . . . . . . . . . . . . 454,748,693
Other assets and liabilities (net)—(19.6)% . . . . . . . . . . . . . . . . . (74,637,827)
Net Assets—100.0% . . . . . . . . . . . . . . . . . . . . . . . . . . . . $380,110,866
* Principal amount stated in U.S. dollars unless otherwise noted.(a) Non-income producing security.(b) All or a portion of the security was held on loan. As of September 30, 2018, the
market value of securities loaned was $72,313,124 and the collateral receivedconsisted of cash in the amount of $73,210,661. The cash collateral investmentsare disclosed in the Schedule of Investments and categorized as Securities LendingReinvestments.
(c) Represents investment of cash collateral received from securities on loan as ofSeptember 30, 2018.
(d) Variable or floating rate security. The stated rate represents the rate atSeptember 30, 2018. Maturity date shown for callable securities reflects theearliest possible call date. For securities based on a published reference index andspread, the index and spread are indicated in the description above. For certainvariable rate securities, the coupon rate is determined by the issuer/agent basedon current market conditions. For certain asset- and mortgage-backed securities,the coupon rate may fluctuate based on changes of the underlying collateral orprepayments of principal. These securities do not indicate a reference index andspread in their description above.
(ADR)— American Depositary Receipt(FEDEFF PRV)— Effective Federal Funds Rate(LIBOR)— London Interbank Offered Rate
BHFTII-160

Brighthouse Funds Trust II
Loomis Sayles Small Cap Growth Portfolio
Schedule of Investments as of September 30, 2018 (Unaudited)
Fair Value Hierarchy
Accounting principles generally accepted in the United States of America (“GAAP”) define fair market value as the price that the Portfolio would receive to sell an asset or pay to transfer a liability in an orderlytransaction between market participants at the measurement date. It establishes a fair value hierarchy that prioritizes inputs to valuation methods and requires disclosure of the fair value hierarchy, separatelyfor each major category of assets and liabilities, that segregates fair value measurements into three levels. Levels 1, 2 and 3 of the fair value hierarchy are defined as follows:
Level 1 - unadjusted quoted prices in active markets for identical investmentsLevel 2 - other significant observable inputs (including, but not limited to, quoted prices for similar assets or liabilities in markets that are either active or inactive; inputs other than quoted prices that areobservable such as interest rates, yield curves, volatilities, prepayment speeds, loss severities, credit risks, default rates, or other market corroborated inputs)Level 3 - significant unobservable inputs based on the best information available in the circumstances, to the extent observable inputs are unavailable (including the Portfolio’s own assumptions used indetermining the fair value of investments and derivative financial instruments)
The inputs or methodologies used for valuing investments are not necessarily an indication of the risk associated with investing in them. Changes to the inputs or methodologies used may result in transfersbetween levels, which will be recognized as of the beginning of the reporting period. Information on transfers between Level 1 and Level 2, if any, will be disclosed following the fair value hierarchy table below.A reconciliation of Level 3 securities, if any, will also be disclosed following the fair value hierarchy table. For more information about the Portfolio’s policy regarding the valuation of investments, please refer tothe Notes to Schedule of Investments.
The following table summarizes the fair value hierarchy of the Portfolio’s investments as of September 30, 2018:
Description Level 1 Level 2 Level 3 Total
Total Common Stocks* . . . . . . . . . . . . . . . . . . . . . . . . . . . . . . . . . . . . . . . . . . . . . . . . . . . . . . . . . . . . . . . . . . . . . . . . . . . . . . . $374,503,515 $ — $— $374,503,515
Total Short-Term Investment* . . . . . . . . . . . . . . . . . . . . . . . . . . . . . . . . . . . . . . . . . . . . . . . . . . . . . . . . . . . . . . . . . . . . . . . . . . — 7,001,825 — 7,001,825
Total Securities Lending Reinvestments* . . . . . . . . . . . . . . . . . . . . . . . . . . . . . . . . . . . . . . . . . . . . . . . . . . . . . . . . . . . . . . . . . . . — 73,243,353 — 73,243,353
Total Investments . . . . . . . . . . . . . . . . . . . . . . . . . . . . . . . . . . . . . . . . . . . . . . . . . . . . . . . . . . . . . . . . . . . . . . . . . . . . . . . . . . $374,503,515 $ 80,245,178 $— $454,748,693
Collateral for Securities Loaned (Liability) . . . . . . . . . . . . . . . . . . . . . . . . . . . . . . . . . . . . . . . . . . . . . . . . . . . . . . . . . . . . . . . . . . $ — $(73,210,661) $— $ (73,210,661)
* See Schedule of Investments for additional detailed categorizations.
BHFTII-161
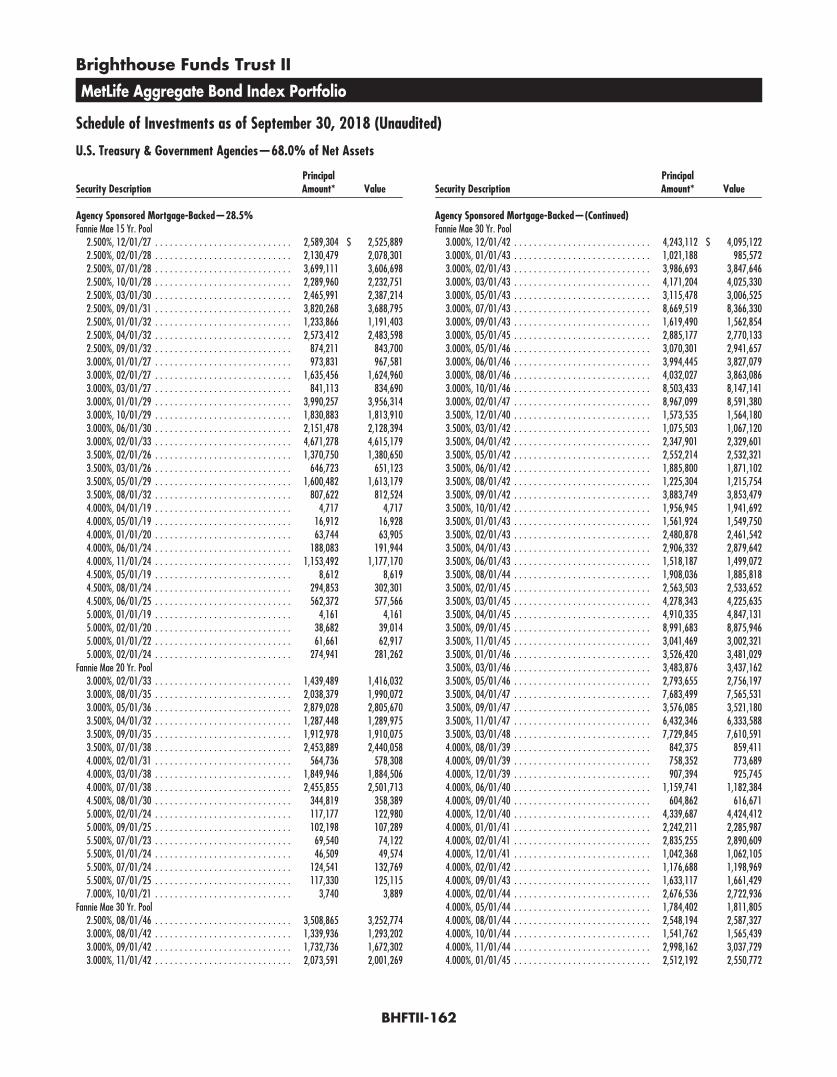
Brighthouse Funds Trust II
MetLife Aggregate Bond Index Portfolio
Schedule of Investments as of September 30, 2018 (Unaudited)
U.S. Treasury & Government Agencies—68.0% of Net Assets
Security DescriptionPrincipalAmount* Value
Agency Sponsored Mortgage-Backed—28.5%Fannie Mae 15 Yr. Pool
2.500%, 12/01/27 . . . . . . . . . . . . . . . . . . . . . . . . . . . . 2,589,304 $ 2,525,8892.500%, 02/01/28 . . . . . . . . . . . . . . . . . . . . . . . . . . . . 2,130,479 2,078,3012.500%, 07/01/28 . . . . . . . . . . . . . . . . . . . . . . . . . . . . 3,699,111 3,606,6982.500%, 10/01/28 . . . . . . . . . . . . . . . . . . . . . . . . . . . . 2,289,960 2,232,7512.500%, 03/01/30 . . . . . . . . . . . . . . . . . . . . . . . . . . . . 2,465,991 2,387,2142.500%, 09/01/31 . . . . . . . . . . . . . . . . . . . . . . . . . . . . 3,820,268 3,688,7952.500%, 01/01/32 . . . . . . . . . . . . . . . . . . . . . . . . . . . . 1,233,866 1,191,4032.500%, 04/01/32 . . . . . . . . . . . . . . . . . . . . . . . . . . . . 2,573,412 2,483,5982.500%, 09/01/32 . . . . . . . . . . . . . . . . . . . . . . . . . . . . 874,211 843,7003.000%, 01/01/27 . . . . . . . . . . . . . . . . . . . . . . . . . . . . 973,831 967,5813.000%, 02/01/27 . . . . . . . . . . . . . . . . . . . . . . . . . . . . 1,635,456 1,624,9603.000%, 03/01/27 . . . . . . . . . . . . . . . . . . . . . . . . . . . . 841,113 834,6903.000%, 01/01/29 . . . . . . . . . . . . . . . . . . . . . . . . . . . . 3,990,257 3,956,3143.000%, 10/01/29 . . . . . . . . . . . . . . . . . . . . . . . . . . . . 1,830,883 1,813,9103.000%, 06/01/30 . . . . . . . . . . . . . . . . . . . . . . . . . . . . 2,151,478 2,128,3943.000%, 02/01/33 . . . . . . . . . . . . . . . . . . . . . . . . . . . . 4,671,278 4,615,1793.500%, 02/01/26 . . . . . . . . . . . . . . . . . . . . . . . . . . . . 1,370,750 1,380,6503.500%, 03/01/26 . . . . . . . . . . . . . . . . . . . . . . . . . . . . 646,723 651,1233.500%, 05/01/29 . . . . . . . . . . . . . . . . . . . . . . . . . . . . 1,600,482 1,613,1793.500%, 08/01/32 . . . . . . . . . . . . . . . . . . . . . . . . . . . . 807,622 812,5244.000%, 04/01/19 . . . . . . . . . . . . . . . . . . . . . . . . . . . . 4,717 4,7174.000%, 05/01/19 . . . . . . . . . . . . . . . . . . . . . . . . . . . . 16,912 16,9284.000%, 01/01/20 . . . . . . . . . . . . . . . . . . . . . . . . . . . . 63,744 63,9054.000%, 06/01/24 . . . . . . . . . . . . . . . . . . . . . . . . . . . . 188,083 191,9444.000%, 11/01/24 . . . . . . . . . . . . . . . . . . . . . . . . . . . . 1,153,492 1,177,1704.500%, 05/01/19 . . . . . . . . . . . . . . . . . . . . . . . . . . . . 8,612 8,6194.500%, 08/01/24 . . . . . . . . . . . . . . . . . . . . . . . . . . . . 294,853 302,3014.500%, 06/01/25 . . . . . . . . . . . . . . . . . . . . . . . . . . . . 562,372 577,5665.000%, 01/01/19 . . . . . . . . . . . . . . . . . . . . . . . . . . . . 4,161 4,1615.000%, 02/01/20 . . . . . . . . . . . . . . . . . . . . . . . . . . . . 38,682 39,0145.000%, 01/01/22 . . . . . . . . . . . . . . . . . . . . . . . . . . . . 61,661 62,9175.000%, 02/01/24 . . . . . . . . . . . . . . . . . . . . . . . . . . . . 274,941 281,262
Fannie Mae 20 Yr. Pool3.000%, 02/01/33 . . . . . . . . . . . . . . . . . . . . . . . . . . . . 1,439,489 1,416,0323.000%, 08/01/35 . . . . . . . . . . . . . . . . . . . . . . . . . . . . 2,038,379 1,990,0723.000%, 05/01/36 . . . . . . . . . . . . . . . . . . . . . . . . . . . . 2,879,028 2,805,6703.500%, 04/01/32 . . . . . . . . . . . . . . . . . . . . . . . . . . . . 1,287,448 1,289,9753.500%, 09/01/35 . . . . . . . . . . . . . . . . . . . . . . . . . . . . 1,912,978 1,910,0753.500%, 07/01/38 . . . . . . . . . . . . . . . . . . . . . . . . . . . . 2,453,889 2,440,0584.000%, 02/01/31 . . . . . . . . . . . . . . . . . . . . . . . . . . . . 564,736 578,3084.000%, 03/01/38 . . . . . . . . . . . . . . . . . . . . . . . . . . . . 1,849,946 1,884,5064.000%, 07/01/38 . . . . . . . . . . . . . . . . . . . . . . . . . . . . 2,455,855 2,501,7134.500%, 08/01/30 . . . . . . . . . . . . . . . . . . . . . . . . . . . . 344,819 358,3895.000%, 02/01/24 . . . . . . . . . . . . . . . . . . . . . . . . . . . . 117,177 122,9805.000%, 09/01/25 . . . . . . . . . . . . . . . . . . . . . . . . . . . . 102,198 107,2895.500%, 07/01/23 . . . . . . . . . . . . . . . . . . . . . . . . . . . . 69,540 74,1225.500%, 01/01/24 . . . . . . . . . . . . . . . . . . . . . . . . . . . . 46,509 49,5745.500%, 07/01/24 . . . . . . . . . . . . . . . . . . . . . . . . . . . . 124,541 132,7695.500%, 07/01/25 . . . . . . . . . . . . . . . . . . . . . . . . . . . . 117,330 125,1157.000%, 10/01/21 . . . . . . . . . . . . . . . . . . . . . . . . . . . . 3,740 3,889
Fannie Mae 30 Yr. Pool2.500%, 08/01/46 . . . . . . . . . . . . . . . . . . . . . . . . . . . . 3,508,865 3,252,7743.000%, 08/01/42 . . . . . . . . . . . . . . . . . . . . . . . . . . . . 1,339,936 1,293,2023.000%, 09/01/42 . . . . . . . . . . . . . . . . . . . . . . . . . . . . 1,732,736 1,672,3023.000%, 11/01/42 . . . . . . . . . . . . . . . . . . . . . . . . . . . . 2,073,591 2,001,269
Security DescriptionPrincipalAmount* Value
Agency Sponsored Mortgage-Backed—(Continued)Fannie Mae 30 Yr. Pool
3.000%, 12/01/42 . . . . . . . . . . . . . . . . . . . . . . . . . . . . 4,243,112 $ 4,095,1223.000%, 01/01/43 . . . . . . . . . . . . . . . . . . . . . . . . . . . . 1,021,188 985,5723.000%, 02/01/43 . . . . . . . . . . . . . . . . . . . . . . . . . . . . 3,986,693 3,847,6463.000%, 03/01/43 . . . . . . . . . . . . . . . . . . . . . . . . . . . . 4,171,204 4,025,3303.000%, 05/01/43 . . . . . . . . . . . . . . . . . . . . . . . . . . . . 3,115,478 3,006,5253.000%, 07/01/43 . . . . . . . . . . . . . . . . . . . . . . . . . . . . 8,669,519 8,366,3303.000%, 09/01/43 . . . . . . . . . . . . . . . . . . . . . . . . . . . . 1,619,490 1,562,8543.000%, 05/01/45 . . . . . . . . . . . . . . . . . . . . . . . . . . . . 2,885,177 2,770,1333.000%, 05/01/46 . . . . . . . . . . . . . . . . . . . . . . . . . . . . 3,070,301 2,941,6573.000%, 06/01/46 . . . . . . . . . . . . . . . . . . . . . . . . . . . . 3,994,445 3,827,0793.000%, 08/01/46 . . . . . . . . . . . . . . . . . . . . . . . . . . . . 4,032,027 3,863,0863.000%, 10/01/46 . . . . . . . . . . . . . . . . . . . . . . . . . . . . 8,503,433 8,147,1413.000%, 02/01/47 . . . . . . . . . . . . . . . . . . . . . . . . . . . . 8,967,099 8,591,3803.500%, 12/01/40 . . . . . . . . . . . . . . . . . . . . . . . . . . . . 1,573,535 1,564,1803.500%, 03/01/42 . . . . . . . . . . . . . . . . . . . . . . . . . . . . 1,075,503 1,067,1203.500%, 04/01/42 . . . . . . . . . . . . . . . . . . . . . . . . . . . . 2,347,901 2,329,6013.500%, 05/01/42 . . . . . . . . . . . . . . . . . . . . . . . . . . . . 2,552,214 2,532,3213.500%, 06/01/42 . . . . . . . . . . . . . . . . . . . . . . . . . . . . 1,885,800 1,871,1023.500%, 08/01/42 . . . . . . . . . . . . . . . . . . . . . . . . . . . . 1,225,304 1,215,7543.500%, 09/01/42 . . . . . . . . . . . . . . . . . . . . . . . . . . . . 3,883,749 3,853,4793.500%, 10/01/42 . . . . . . . . . . . . . . . . . . . . . . . . . . . . 1,956,945 1,941,6923.500%, 01/01/43 . . . . . . . . . . . . . . . . . . . . . . . . . . . . 1,561,924 1,549,7503.500%, 02/01/43 . . . . . . . . . . . . . . . . . . . . . . . . . . . . 2,480,878 2,461,5423.500%, 04/01/43 . . . . . . . . . . . . . . . . . . . . . . . . . . . . 2,906,332 2,879,6423.500%, 06/01/43 . . . . . . . . . . . . . . . . . . . . . . . . . . . . 1,518,187 1,499,0723.500%, 08/01/44 . . . . . . . . . . . . . . . . . . . . . . . . . . . . 1,908,036 1,885,8183.500%, 02/01/45 . . . . . . . . . . . . . . . . . . . . . . . . . . . . 2,563,503 2,533,6523.500%, 03/01/45 . . . . . . . . . . . . . . . . . . . . . . . . . . . . 4,278,343 4,225,6353.500%, 04/01/45 . . . . . . . . . . . . . . . . . . . . . . . . . . . . 4,910,335 4,847,1313.500%, 09/01/45 . . . . . . . . . . . . . . . . . . . . . . . . . . . . 8,991,683 8,875,9463.500%, 11/01/45 . . . . . . . . . . . . . . . . . . . . . . . . . . . . 3,041,469 3,002,3213.500%, 01/01/46 . . . . . . . . . . . . . . . . . . . . . . . . . . . . 3,526,420 3,481,0293.500%, 03/01/46 . . . . . . . . . . . . . . . . . . . . . . . . . . . . 3,483,876 3,437,1623.500%, 05/01/46 . . . . . . . . . . . . . . . . . . . . . . . . . . . . 2,793,655 2,756,1973.500%, 04/01/47 . . . . . . . . . . . . . . . . . . . . . . . . . . . . 7,683,499 7,565,5313.500%, 09/01/47 . . . . . . . . . . . . . . . . . . . . . . . . . . . . 3,576,085 3,521,1803.500%, 11/01/47 . . . . . . . . . . . . . . . . . . . . . . . . . . . . 6,432,346 6,333,5883.500%, 03/01/48 . . . . . . . . . . . . . . . . . . . . . . . . . . . . 7,729,845 7,610,5914.000%, 08/01/39 . . . . . . . . . . . . . . . . . . . . . . . . . . . . 842,375 859,4114.000%, 09/01/39 . . . . . . . . . . . . . . . . . . . . . . . . . . . . 758,352 773,6894.000%, 12/01/39 . . . . . . . . . . . . . . . . . . . . . . . . . . . . 907,394 925,7454.000%, 06/01/40 . . . . . . . . . . . . . . . . . . . . . . . . . . . . 1,159,741 1,182,3844.000%, 09/01/40 . . . . . . . . . . . . . . . . . . . . . . . . . . . . 604,862 616,6714.000%, 12/01/40 . . . . . . . . . . . . . . . . . . . . . . . . . . . . 4,339,687 4,424,4124.000%, 01/01/41 . . . . . . . . . . . . . . . . . . . . . . . . . . . . 2,242,211 2,285,9874.000%, 02/01/41 . . . . . . . . . . . . . . . . . . . . . . . . . . . . 2,835,255 2,890,6094.000%, 12/01/41 . . . . . . . . . . . . . . . . . . . . . . . . . . . . 1,042,368 1,062,1054.000%, 02/01/42 . . . . . . . . . . . . . . . . . . . . . . . . . . . . 1,176,688 1,198,9694.000%, 09/01/43 . . . . . . . . . . . . . . . . . . . . . . . . . . . . 1,633,117 1,661,4294.000%, 02/01/44 . . . . . . . . . . . . . . . . . . . . . . . . . . . . 2,676,536 2,722,9364.000%, 05/01/44 . . . . . . . . . . . . . . . . . . . . . . . . . . . . 1,784,402 1,811,8054.000%, 08/01/44 . . . . . . . . . . . . . . . . . . . . . . . . . . . . 2,548,194 2,587,3274.000%, 10/01/44 . . . . . . . . . . . . . . . . . . . . . . . . . . . . 1,541,762 1,565,4394.000%, 11/01/44 . . . . . . . . . . . . . . . . . . . . . . . . . . . . 2,998,162 3,037,7294.000%, 01/01/45 . . . . . . . . . . . . . . . . . . . . . . . . . . . . 2,512,192 2,550,772
BHFTII-162
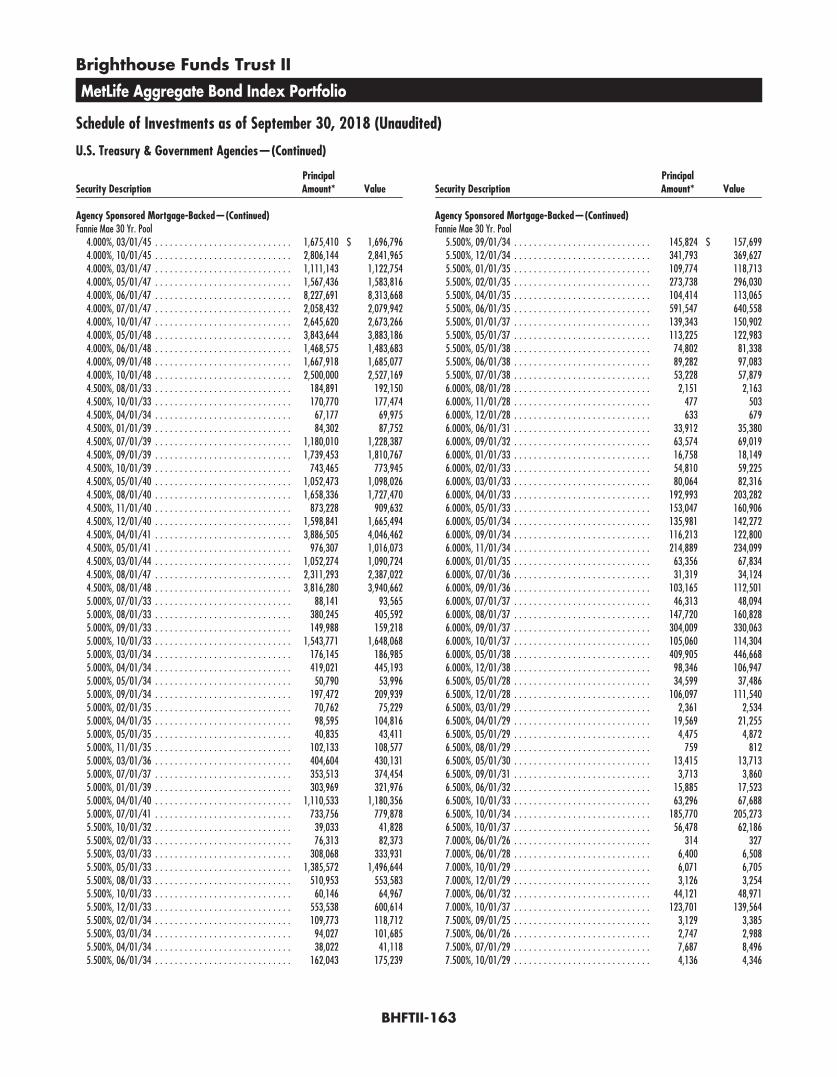
Brighthouse Funds Trust II
MetLife Aggregate Bond Index Portfolio
Schedule of Investments as of September 30, 2018 (Unaudited)
U.S. Treasury & Government Agencies—(Continued)
Security DescriptionPrincipalAmount* Value
Agency Sponsored Mortgage-Backed—(Continued)Fannie Mae 30 Yr. Pool
4.000%, 03/01/45 . . . . . . . . . . . . . . . . . . . . . . . . . . . . 1,675,410 $ 1,696,7964.000%, 10/01/45 . . . . . . . . . . . . . . . . . . . . . . . . . . . . 2,806,144 2,841,9654.000%, 03/01/47 . . . . . . . . . . . . . . . . . . . . . . . . . . . . 1,111,143 1,122,7544.000%, 05/01/47 . . . . . . . . . . . . . . . . . . . . . . . . . . . . 1,567,436 1,583,8164.000%, 06/01/47 . . . . . . . . . . . . . . . . . . . . . . . . . . . . 8,227,691 8,313,6684.000%, 07/01/47 . . . . . . . . . . . . . . . . . . . . . . . . . . . . 2,058,432 2,079,9424.000%, 10/01/47 . . . . . . . . . . . . . . . . . . . . . . . . . . . . 2,645,620 2,673,2664.000%, 05/01/48 . . . . . . . . . . . . . . . . . . . . . . . . . . . . 3,843,644 3,883,1864.000%, 06/01/48 . . . . . . . . . . . . . . . . . . . . . . . . . . . . 1,468,575 1,483,6834.000%, 09/01/48 . . . . . . . . . . . . . . . . . . . . . . . . . . . . 1,667,918 1,685,0774.000%, 10/01/48 . . . . . . . . . . . . . . . . . . . . . . . . . . . . 2,500,000 2,527,1694.500%, 08/01/33 . . . . . . . . . . . . . . . . . . . . . . . . . . . . 184,891 192,1504.500%, 10/01/33 . . . . . . . . . . . . . . . . . . . . . . . . . . . . 170,770 177,4744.500%, 04/01/34 . . . . . . . . . . . . . . . . . . . . . . . . . . . . 67,177 69,9754.500%, 01/01/39 . . . . . . . . . . . . . . . . . . . . . . . . . . . . 84,302 87,7524.500%, 07/01/39 . . . . . . . . . . . . . . . . . . . . . . . . . . . . 1,180,010 1,228,3874.500%, 09/01/39 . . . . . . . . . . . . . . . . . . . . . . . . . . . . 1,739,453 1,810,7674.500%, 10/01/39 . . . . . . . . . . . . . . . . . . . . . . . . . . . . 743,465 773,9454.500%, 05/01/40 . . . . . . . . . . . . . . . . . . . . . . . . . . . . 1,052,473 1,098,0264.500%, 08/01/40 . . . . . . . . . . . . . . . . . . . . . . . . . . . . 1,658,336 1,727,4704.500%, 11/01/40 . . . . . . . . . . . . . . . . . . . . . . . . . . . . 873,228 909,6324.500%, 12/01/40 . . . . . . . . . . . . . . . . . . . . . . . . . . . . 1,598,841 1,665,4944.500%, 04/01/41 . . . . . . . . . . . . . . . . . . . . . . . . . . . . 3,886,505 4,046,4624.500%, 05/01/41 . . . . . . . . . . . . . . . . . . . . . . . . . . . . 976,307 1,016,0734.500%, 03/01/44 . . . . . . . . . . . . . . . . . . . . . . . . . . . . 1,052,274 1,090,7244.500%, 08/01/47 . . . . . . . . . . . . . . . . . . . . . . . . . . . . 2,311,293 2,387,0224.500%, 08/01/48 . . . . . . . . . . . . . . . . . . . . . . . . . . . . 3,816,280 3,940,6625.000%, 07/01/33 . . . . . . . . . . . . . . . . . . . . . . . . . . . . 88,141 93,5655.000%, 08/01/33 . . . . . . . . . . . . . . . . . . . . . . . . . . . . 380,245 405,5925.000%, 09/01/33 . . . . . . . . . . . . . . . . . . . . . . . . . . . . 149,988 159,2185.000%, 10/01/33 . . . . . . . . . . . . . . . . . . . . . . . . . . . . 1,543,771 1,648,0685.000%, 03/01/34 . . . . . . . . . . . . . . . . . . . . . . . . . . . . 176,145 186,9855.000%, 04/01/34 . . . . . . . . . . . . . . . . . . . . . . . . . . . . 419,021 445,1935.000%, 05/01/34 . . . . . . . . . . . . . . . . . . . . . . . . . . . . 50,790 53,9965.000%, 09/01/34 . . . . . . . . . . . . . . . . . . . . . . . . . . . . 197,472 209,9395.000%, 02/01/35 . . . . . . . . . . . . . . . . . . . . . . . . . . . . 70,762 75,2295.000%, 04/01/35 . . . . . . . . . . . . . . . . . . . . . . . . . . . . 98,595 104,8165.000%, 05/01/35 . . . . . . . . . . . . . . . . . . . . . . . . . . . . 40,835 43,4115.000%, 11/01/35 . . . . . . . . . . . . . . . . . . . . . . . . . . . . 102,133 108,5775.000%, 03/01/36 . . . . . . . . . . . . . . . . . . . . . . . . . . . . 404,604 430,1315.000%, 07/01/37 . . . . . . . . . . . . . . . . . . . . . . . . . . . . 353,513 374,4545.000%, 01/01/39 . . . . . . . . . . . . . . . . . . . . . . . . . . . . 303,969 321,9765.000%, 04/01/40 . . . . . . . . . . . . . . . . . . . . . . . . . . . . 1,110,533 1,180,3565.000%, 07/01/41 . . . . . . . . . . . . . . . . . . . . . . . . . . . . 733,756 779,8785.500%, 10/01/32 . . . . . . . . . . . . . . . . . . . . . . . . . . . . 39,033 41,8285.500%, 02/01/33 . . . . . . . . . . . . . . . . . . . . . . . . . . . . 76,313 82,3735.500%, 03/01/33 . . . . . . . . . . . . . . . . . . . . . . . . . . . . 308,068 333,9315.500%, 05/01/33 . . . . . . . . . . . . . . . . . . . . . . . . . . . . 1,385,572 1,496,6445.500%, 08/01/33 . . . . . . . . . . . . . . . . . . . . . . . . . . . . 510,953 553,5835.500%, 10/01/33 . . . . . . . . . . . . . . . . . . . . . . . . . . . . 60,146 64,9675.500%, 12/01/33 . . . . . . . . . . . . . . . . . . . . . . . . . . . . 553,538 600,6145.500%, 02/01/34 . . . . . . . . . . . . . . . . . . . . . . . . . . . . 109,773 118,7125.500%, 03/01/34 . . . . . . . . . . . . . . . . . . . . . . . . . . . . 94,027 101,6855.500%, 04/01/34 . . . . . . . . . . . . . . . . . . . . . . . . . . . . 38,022 41,1185.500%, 06/01/34 . . . . . . . . . . . . . . . . . . . . . . . . . . . . 162,043 175,239
Security DescriptionPrincipalAmount* Value
Agency Sponsored Mortgage-Backed—(Continued)Fannie Mae 30 Yr. Pool
5.500%, 09/01/34 . . . . . . . . . . . . . . . . . . . . . . . . . . . . 145,824 $ 157,6995.500%, 12/01/34 . . . . . . . . . . . . . . . . . . . . . . . . . . . . 341,793 369,6275.500%, 01/01/35 . . . . . . . . . . . . . . . . . . . . . . . . . . . . 109,774 118,7135.500%, 02/01/35 . . . . . . . . . . . . . . . . . . . . . . . . . . . . 273,738 296,0305.500%, 04/01/35 . . . . . . . . . . . . . . . . . . . . . . . . . . . . 104,414 113,0655.500%, 06/01/35 . . . . . . . . . . . . . . . . . . . . . . . . . . . . 591,547 640,5585.500%, 01/01/37 . . . . . . . . . . . . . . . . . . . . . . . . . . . . 139,343 150,9025.500%, 05/01/37 . . . . . . . . . . . . . . . . . . . . . . . . . . . . 113,225 122,9835.500%, 05/01/38 . . . . . . . . . . . . . . . . . . . . . . . . . . . . 74,802 81,3385.500%, 06/01/38 . . . . . . . . . . . . . . . . . . . . . . . . . . . . 89,282 97,0835.500%, 07/01/38 . . . . . . . . . . . . . . . . . . . . . . . . . . . . 53,228 57,8796.000%, 08/01/28 . . . . . . . . . . . . . . . . . . . . . . . . . . . . 2,151 2,1636.000%, 11/01/28 . . . . . . . . . . . . . . . . . . . . . . . . . . . . 477 5036.000%, 12/01/28 . . . . . . . . . . . . . . . . . . . . . . . . . . . . 633 6796.000%, 06/01/31 . . . . . . . . . . . . . . . . . . . . . . . . . . . . 33,912 35,3806.000%, 09/01/32 . . . . . . . . . . . . . . . . . . . . . . . . . . . . 63,574 69,0196.000%, 01/01/33 . . . . . . . . . . . . . . . . . . . . . . . . . . . . 16,758 18,1496.000%, 02/01/33 . . . . . . . . . . . . . . . . . . . . . . . . . . . . 54,810 59,2256.000%, 03/01/33 . . . . . . . . . . . . . . . . . . . . . . . . . . . . 80,064 82,3166.000%, 04/01/33 . . . . . . . . . . . . . . . . . . . . . . . . . . . . 192,993 203,2826.000%, 05/01/33 . . . . . . . . . . . . . . . . . . . . . . . . . . . . 153,047 160,9066.000%, 05/01/34 . . . . . . . . . . . . . . . . . . . . . . . . . . . . 135,981 142,2726.000%, 09/01/34 . . . . . . . . . . . . . . . . . . . . . . . . . . . . 116,213 122,8006.000%, 11/01/34 . . . . . . . . . . . . . . . . . . . . . . . . . . . . 214,889 234,0996.000%, 01/01/35 . . . . . . . . . . . . . . . . . . . . . . . . . . . . 63,356 67,8346.000%, 07/01/36 . . . . . . . . . . . . . . . . . . . . . . . . . . . . 31,319 34,1246.000%, 09/01/36 . . . . . . . . . . . . . . . . . . . . . . . . . . . . 103,165 112,5016.000%, 07/01/37 . . . . . . . . . . . . . . . . . . . . . . . . . . . . 46,313 48,0946.000%, 08/01/37 . . . . . . . . . . . . . . . . . . . . . . . . . . . . 147,720 160,8286.000%, 09/01/37 . . . . . . . . . . . . . . . . . . . . . . . . . . . . 304,009 330,0636.000%, 10/01/37 . . . . . . . . . . . . . . . . . . . . . . . . . . . . 105,060 114,3046.000%, 05/01/38 . . . . . . . . . . . . . . . . . . . . . . . . . . . . 409,905 446,6686.000%, 12/01/38 . . . . . . . . . . . . . . . . . . . . . . . . . . . . 98,346 106,9476.500%, 05/01/28 . . . . . . . . . . . . . . . . . . . . . . . . . . . . 34,599 37,4866.500%, 12/01/28 . . . . . . . . . . . . . . . . . . . . . . . . . . . . 106,097 111,5406.500%, 03/01/29 . . . . . . . . . . . . . . . . . . . . . . . . . . . . 2,361 2,5346.500%, 04/01/29 . . . . . . . . . . . . . . . . . . . . . . . . . . . . 19,569 21,2556.500%, 05/01/29 . . . . . . . . . . . . . . . . . . . . . . . . . . . . 4,475 4,8726.500%, 08/01/29 . . . . . . . . . . . . . . . . . . . . . . . . . . . . 759 8126.500%, 05/01/30 . . . . . . . . . . . . . . . . . . . . . . . . . . . . 13,415 13,7136.500%, 09/01/31 . . . . . . . . . . . . . . . . . . . . . . . . . . . . 3,713 3,8606.500%, 06/01/32 . . . . . . . . . . . . . . . . . . . . . . . . . . . . 15,885 17,5236.500%, 10/01/33 . . . . . . . . . . . . . . . . . . . . . . . . . . . . 63,296 67,6886.500%, 10/01/34 . . . . . . . . . . . . . . . . . . . . . . . . . . . . 185,770 205,2736.500%, 10/01/37 . . . . . . . . . . . . . . . . . . . . . . . . . . . . 56,478 62,1867.000%, 06/01/26 . . . . . . . . . . . . . . . . . . . . . . . . . . . . 314 3277.000%, 06/01/28 . . . . . . . . . . . . . . . . . . . . . . . . . . . . 6,400 6,5087.000%, 10/01/29 . . . . . . . . . . . . . . . . . . . . . . . . . . . . 6,071 6,7057.000%, 12/01/29 . . . . . . . . . . . . . . . . . . . . . . . . . . . . 3,126 3,2547.000%, 06/01/32 . . . . . . . . . . . . . . . . . . . . . . . . . . . . 44,121 48,9717.000%, 10/01/37 . . . . . . . . . . . . . . . . . . . . . . . . . . . . 123,701 139,5647.500%, 09/01/25 . . . . . . . . . . . . . . . . . . . . . . . . . . . . 3,129 3,3857.500%, 06/01/26 . . . . . . . . . . . . . . . . . . . . . . . . . . . . 2,747 2,9887.500%, 07/01/29 . . . . . . . . . . . . . . . . . . . . . . . . . . . . 7,687 8,4967.500%, 10/01/29 . . . . . . . . . . . . . . . . . . . . . . . . . . . . 4,136 4,346
BHFTII-163

Brighthouse Funds Trust II
MetLife Aggregate Bond Index Portfolio
Schedule of Investments as of September 30, 2018 (Unaudited)
U.S. Treasury & Government Agencies—(Continued)
Security DescriptionPrincipalAmount* Value
Agency Sponsored Mortgage-Backed—(Continued)Fannie Mae 30 Yr. Pool
8.000%, 11/01/29 . . . . . . . . . . . . . . . . . . . . . . . . . . . . 93 $ 1058.000%, 05/01/30 . . . . . . . . . . . . . . . . . . . . . . . . . . . . 15,457 16,2888.000%, 11/01/30 . . . . . . . . . . . . . . . . . . . . . . . . . . . . 1,950 2,1868.000%, 01/01/31 . . . . . . . . . . . . . . . . . . . . . . . . . . . . 1,592 1,7618.000%, 02/01/31 . . . . . . . . . . . . . . . . . . . . . . . . . . . . 3,899 4,414
Fannie Mae-ACES (CMO)2.679%, 05/25/21 (a) . . . . . . . . . . . . . . . . . . . . . . . . . 4,390,730 4,335,399
Freddie Mac 15 Yr. Gold Pool2.500%, 12/01/27 . . . . . . . . . . . . . . . . . . . . . . . . . . . . 1,203,352 1,173,3662.500%, 02/01/28 . . . . . . . . . . . . . . . . . . . . . . . . . . . . 1,994,082 1,943,3852.500%, 04/01/28 . . . . . . . . . . . . . . . . . . . . . . . . . . . . 1,665,601 1,623,2552.500%, 12/01/29 . . . . . . . . . . . . . . . . . . . . . . . . . . . . 2,462,152 2,387,6592.500%, 01/01/31 . . . . . . . . . . . . . . . . . . . . . . . . . . . . 3,260,621 3,155,0932.500%, 01/01/32 . . . . . . . . . . . . . . . . . . . . . . . . . . . . 4,967,284 4,794,1223.000%, 03/01/27 . . . . . . . . . . . . . . . . . . . . . . . . . . . . 913,267 905,3883.000%, 05/01/27 . . . . . . . . . . . . . . . . . . . . . . . . . . . . 1,224,917 1,212,8593.000%, 11/01/28 . . . . . . . . . . . . . . . . . . . . . . . . . . . . 1,511,966 1,495,7583.000%, 12/01/29 . . . . . . . . . . . . . . . . . . . . . . . . . . . . 2,720,285 2,689,0393.000%, 05/01/31 . . . . . . . . . . . . . . . . . . . . . . . . . . . . 3,235,816 3,190,9663.000%, 10/01/32 . . . . . . . . . . . . . . . . . . . . . . . . . . . . 1,776,382 1,751,0823.500%, 12/01/25 . . . . . . . . . . . . . . . . . . . . . . . . . . . . 965,879 972,5443.500%, 05/01/26 . . . . . . . . . . . . . . . . . . . . . . . . . . . . 339,197 341,3953.500%, 09/01/30 . . . . . . . . . . . . . . . . . . . . . . . . . . . . 2,170,747 2,186,2754.000%, 06/01/19 . . . . . . . . . . . . . . . . . . . . . . . . . . . . 19,374 19,3874.000%, 05/01/25 . . . . . . . . . . . . . . . . . . . . . . . . . . . . 513,023 523,6884.000%, 08/01/25 . . . . . . . . . . . . . . . . . . . . . . . . . . . . 234,388 239,2614.000%, 10/01/25 . . . . . . . . . . . . . . . . . . . . . . . . . . . . 258,928 264,4904.500%, 04/01/19 . . . . . . . . . . . . . . . . . . . . . . . . . . . . 21,639 21,6884.500%, 06/01/19 . . . . . . . . . . . . . . . . . . . . . . . . . . . . 21,127 21,1504.500%, 08/01/19 . . . . . . . . . . . . . . . . . . . . . . . . . . . . 3,894 3,9055.000%, 06/01/19 . . . . . . . . . . . . . . . . . . . . . . . . . . . . 21,528 21,6285.500%, 01/01/24 . . . . . . . . . . . . . . . . . . . . . . . . . . . . 219,853 228,204
Freddie Mac 20 Yr. Gold Pool3.000%, 04/01/33 . . . . . . . . . . . . . . . . . . . . . . . . . . . . 2,245,073 2,205,5163.000%, 02/01/37 . . . . . . . . . . . . . . . . . . . . . . . . . . . . 2,569,402 2,503,7893.500%, 04/01/32 . . . . . . . . . . . . . . . . . . . . . . . . . . . . 1,659,696 1,663,2414.000%, 01/01/31 . . . . . . . . . . . . . . . . . . . . . . . . . . . . 631,072 646,2614.000%, 08/01/31 . . . . . . . . . . . . . . . . . . . . . . . . . . . . 623,383 637,0754.500%, 05/01/29 . . . . . . . . . . . . . . . . . . . . . . . . . . . . 160,149 166,4105.000%, 03/01/27 . . . . . . . . . . . . . . . . . . . . . . . . . . . . 84,864 89,425
Freddie Mac 30 Yr. Gold Pool2.500%, 07/01/43 . . . . . . . . . . . . . . . . . . . . . . . . . . . . 2,308,282 2,154,7603.000%, 10/01/42 . . . . . . . . . . . . . . . . . . . . . . . . . . . . 2,100,463 2,027,0743.000%, 01/01/43 . . . . . . . . . . . . . . . . . . . . . . . . . . . . 2,011,887 1,941,5933.000%, 03/01/43 . . . . . . . . . . . . . . . . . . . . . . . . . . . . 5,277,999 5,093,2373.000%, 04/01/43 . . . . . . . . . . . . . . . . . . . . . . . . . . . . 3,661,296 3,533,0143.000%, 06/01/43 . . . . . . . . . . . . . . . . . . . . . . . . . . . . 1,678,639 1,619,8243.000%, 07/01/43 . . . . . . . . . . . . . . . . . . . . . . . . . . . . 3,236,592 3,123,1913.000%, 06/01/45 . . . . . . . . . . . . . . . . . . . . . . . . . . . . 3,625,030 3,480,2143.000%, 01/01/46 . . . . . . . . . . . . . . . . . . . . . . . . . . . . 2,264,900 2,174,4203.000%, 06/01/46 . . . . . . . . . . . . . . . . . . . . . . . . . . . . 3,959,086 3,792,9983.000%, 10/01/46 . . . . . . . . . . . . . . . . . . . . . . . . . . . . 3,292,174 3,154,0633.000%, 11/01/46 . . . . . . . . . . . . . . . . . . . . . . . . . . . . 4,183,961 4,008,4393.000%, 01/01/47 . . . . . . . . . . . . . . . . . . . . . . . . . . . . 6,680,860 6,400,5893.000%, 02/01/47 . . . . . . . . . . . . . . . . . . . . . . . . . . . . 3,673,634 3,519,521
Security DescriptionPrincipalAmount* Value
Agency Sponsored Mortgage-Backed—(Continued)Freddie Mac 30 Yr. Gold Pool
3.500%, 01/01/42 . . . . . . . . . . . . . . . . . . . . . . . . . . . . 1,127,825 $ 1,119,2553.500%, 03/01/42 . . . . . . . . . . . . . . . . . . . . . . . . . . . . 1,020,831 1,013,0563.500%, 08/01/42 . . . . . . . . . . . . . . . . . . . . . . . . . . . . 2,690,662 2,670,1703.500%, 02/01/43 . . . . . . . . . . . . . . . . . . . . . . . . . . . . 1,485,762 1,474,4473.500%, 05/01/43 . . . . . . . . . . . . . . . . . . . . . . . . . . . . 2,287,661 2,267,0673.500%, 06/01/43 . . . . . . . . . . . . . . . . . . . . . . . . . . . . 1,325,090 1,313,1613.500%, 06/01/44 . . . . . . . . . . . . . . . . . . . . . . . . . . . . 1,669,815 1,650,6713.500%, 10/01/44 . . . . . . . . . . . . . . . . . . . . . . . . . . . . 1,801,000 1,780,3523.500%, 11/01/44 . . . . . . . . . . . . . . . . . . . . . . . . . . . . 2,582,192 2,552,5893.500%, 12/01/44 . . . . . . . . . . . . . . . . . . . . . . . . . . . . 2,417,920 2,390,2003.500%, 05/01/45 . . . . . . . . . . . . . . . . . . . . . . . . . . . . 2,990,876 2,952,9403.500%, 08/01/45 . . . . . . . . . . . . . . . . . . . . . . . . . . . . 3,287,038 3,245,3463.500%, 11/01/45 . . . . . . . . . . . . . . . . . . . . . . . . . . . . 3,183,936 3,143,5523.500%, 12/01/45 . . . . . . . . . . . . . . . . . . . . . . . . . . . . 1,931,216 1,906,7203.500%, 03/01/46 . . . . . . . . . . . . . . . . . . . . . . . . . . . . 5,944,618 5,867,7693.500%, 02/01/47 . . . . . . . . . . . . . . . . . . . . . . . . . . . . 4,144,020 4,089,2503.500%, 06/01/47 . . . . . . . . . . . . . . . . . . . . . . . . . . . . 3,479,318 3,426,5303.500%, 08/01/47 . . . . . . . . . . . . . . . . . . . . . . . . . . . . 2,219,216 2,185,5463.500%, 10/01/47 . . . . . . . . . . . . . . . . . . . . . . . . . . . . 2,763,596 2,721,6673.500%, 11/01/47 . . . . . . . . . . . . . . . . . . . . . . . . . . . . 2,732,998 2,691,5333.500%, 01/01/48 . . . . . . . . . . . . . . . . . . . . . . . . . . . . 2,807,610 2,765,0133.500%, 02/01/48 . . . . . . . . . . . . . . . . . . . . . . . . . . . . 5,751,933 5,664,6654.000%, 06/01/39 . . . . . . . . . . . . . . . . . . . . . . . . . . . . 574,382 586,0064.000%, 12/01/39 . . . . . . . . . . . . . . . . . . . . . . . . . . . . 876,356 894,0914.000%, 11/01/40 . . . . . . . . . . . . . . . . . . . . . . . . . . . . 905,931 923,6364.000%, 04/01/41 . . . . . . . . . . . . . . . . . . . . . . . . . . . . 924,126 941,6504.000%, 09/01/41 . . . . . . . . . . . . . . . . . . . . . . . . . . . . 940,336 958,1684.000%, 10/01/41 . . . . . . . . . . . . . . . . . . . . . . . . . . . . 2,099,349 2,139,1604.000%, 11/01/41 . . . . . . . . . . . . . . . . . . . . . . . . . . . . 861,850 878,1944.000%, 10/01/43 . . . . . . . . . . . . . . . . . . . . . . . . . . . . 2,574,950 2,619,6734.000%, 07/01/44 . . . . . . . . . . . . . . . . . . . . . . . . . . . . 2,562,977 2,602,4314.000%, 10/01/44 . . . . . . . . . . . . . . . . . . . . . . . . . . . . 1,948,711 1,978,7094.000%, 07/01/45 . . . . . . . . . . . . . . . . . . . . . . . . . . . . 3,084,669 3,124,1214.000%, 01/01/46 . . . . . . . . . . . . . . . . . . . . . . . . . . . . 3,115,703 3,155,5514.000%, 02/01/46 . . . . . . . . . . . . . . . . . . . . . . . . . . . . 1,672,513 1,693,9034.000%, 06/01/47 . . . . . . . . . . . . . . . . . . . . . . . . . . . . 3,672,635 3,711,1014.000%, 10/01/47 . . . . . . . . . . . . . . . . . . . . . . . . . . . . 1,757,160 1,776,2144.000%, 11/01/47 . . . . . . . . . . . . . . . . . . . . . . . . . . . . 1,757,125 1,775,5284.000%, 03/01/48 . . . . . . . . . . . . . . . . . . . . . . . . . . . . 2,797,534 2,826,8344.000%, 05/01/48 . . . . . . . . . . . . . . . . . . . . . . . . . . . . 1,925,071 1,944,9354.500%, 10/01/35 . . . . . . . . . . . . . . . . . . . . . . . . . . . . 278,167 290,0494.500%, 06/01/38 . . . . . . . . . . . . . . . . . . . . . . . . . . . . 420,313 438,2664.500%, 02/01/39 . . . . . . . . . . . . . . . . . . . . . . . . . . . . 317,392 330,6634.500%, 03/01/39 . . . . . . . . . . . . . . . . . . . . . . . . . . . . 256,355 267,0304.500%, 04/01/39 . . . . . . . . . . . . . . . . . . . . . . . . . . . . 475,374 495,1704.500%, 09/01/39 . . . . . . . . . . . . . . . . . . . . . . . . . . . . 524,609 546,4554.500%, 10/01/39 . . . . . . . . . . . . . . . . . . . . . . . . . . . . 1,370,262 1,427,3234.500%, 11/01/39 . . . . . . . . . . . . . . . . . . . . . . . . . . . . 401,955 418,6944.500%, 01/01/40 . . . . . . . . . . . . . . . . . . . . . . . . . . . . 313,307 326,3544.500%, 05/01/40 . . . . . . . . . . . . . . . . . . . . . . . . . . . . 530,785 553,2504.500%, 11/01/40 . . . . . . . . . . . . . . . . . . . . . . . . . . . . 816,572 851,1334.500%, 02/01/41 . . . . . . . . . . . . . . . . . . . . . . . . . . . . 198,348 206,5594.500%, 05/01/41 . . . . . . . . . . . . . . . . . . . . . . . . . . . . 471,707 491,2334.500%, 06/01/41 . . . . . . . . . . . . . . . . . . . . . . . . . . . . 343,402 357,6164.500%, 12/01/43 . . . . . . . . . . . . . . . . . . . . . . . . . . . . 771,542 801,257
BHFTII-164
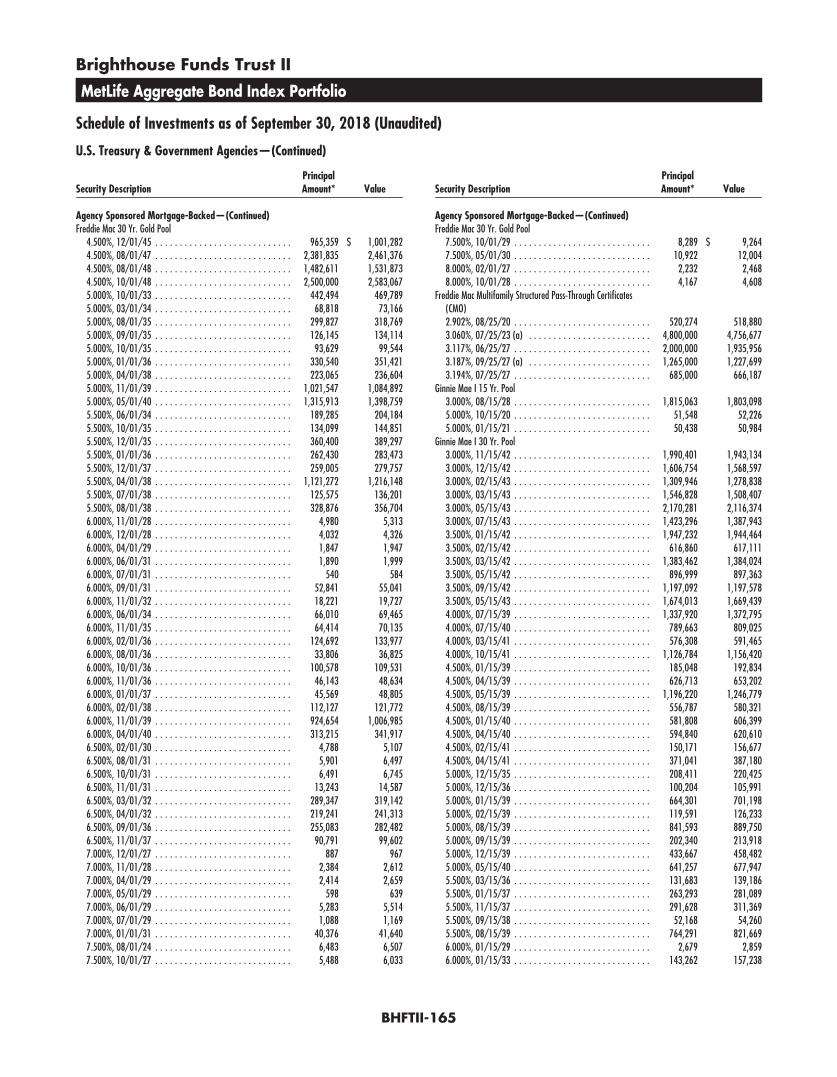
Brighthouse Funds Trust II
MetLife Aggregate Bond Index Portfolio
Schedule of Investments as of September 30, 2018 (Unaudited)
U.S. Treasury & Government Agencies—(Continued)
Security DescriptionPrincipalAmount* Value
Agency Sponsored Mortgage-Backed—(Continued)Freddie Mac 30 Yr. Gold Pool
4.500%, 12/01/45 . . . . . . . . . . . . . . . . . . . . . . . . . . . . 965,359 $ 1,001,2824.500%, 08/01/47 . . . . . . . . . . . . . . . . . . . . . . . . . . . . 2,381,835 2,461,3764.500%, 08/01/48 . . . . . . . . . . . . . . . . . . . . . . . . . . . . 1,482,611 1,531,8734.500%, 10/01/48 . . . . . . . . . . . . . . . . . . . . . . . . . . . . 2,500,000 2,583,0675.000%, 10/01/33 . . . . . . . . . . . . . . . . . . . . . . . . . . . . 442,494 469,7895.000%, 03/01/34 . . . . . . . . . . . . . . . . . . . . . . . . . . . . 68,818 73,1665.000%, 08/01/35 . . . . . . . . . . . . . . . . . . . . . . . . . . . . 299,827 318,7695.000%, 09/01/35 . . . . . . . . . . . . . . . . . . . . . . . . . . . . 126,145 134,1145.000%, 10/01/35 . . . . . . . . . . . . . . . . . . . . . . . . . . . . 93,629 99,5445.000%, 01/01/36 . . . . . . . . . . . . . . . . . . . . . . . . . . . . 330,540 351,4215.000%, 04/01/38 . . . . . . . . . . . . . . . . . . . . . . . . . . . . 223,065 236,6045.000%, 11/01/39 . . . . . . . . . . . . . . . . . . . . . . . . . . . . 1,021,547 1,084,8925.000%, 05/01/40 . . . . . . . . . . . . . . . . . . . . . . . . . . . . 1,315,913 1,398,7595.500%, 06/01/34 . . . . . . . . . . . . . . . . . . . . . . . . . . . . 189,285 204,1845.500%, 10/01/35 . . . . . . . . . . . . . . . . . . . . . . . . . . . . 134,099 144,8515.500%, 12/01/35 . . . . . . . . . . . . . . . . . . . . . . . . . . . . 360,400 389,2975.500%, 01/01/36 . . . . . . . . . . . . . . . . . . . . . . . . . . . . 262,430 283,4735.500%, 12/01/37 . . . . . . . . . . . . . . . . . . . . . . . . . . . . 259,005 279,7575.500%, 04/01/38 . . . . . . . . . . . . . . . . . . . . . . . . . . . . 1,121,272 1,216,1485.500%, 07/01/38 . . . . . . . . . . . . . . . . . . . . . . . . . . . . 125,575 136,2015.500%, 08/01/38 . . . . . . . . . . . . . . . . . . . . . . . . . . . . 328,876 356,7046.000%, 11/01/28 . . . . . . . . . . . . . . . . . . . . . . . . . . . . 4,980 5,3136.000%, 12/01/28 . . . . . . . . . . . . . . . . . . . . . . . . . . . . 4,032 4,3266.000%, 04/01/29 . . . . . . . . . . . . . . . . . . . . . . . . . . . . 1,847 1,9476.000%, 06/01/31 . . . . . . . . . . . . . . . . . . . . . . . . . . . . 1,890 1,9996.000%, 07/01/31 . . . . . . . . . . . . . . . . . . . . . . . . . . . . 540 5846.000%, 09/01/31 . . . . . . . . . . . . . . . . . . . . . . . . . . . . 52,841 55,0416.000%, 11/01/32 . . . . . . . . . . . . . . . . . . . . . . . . . . . . 18,221 19,7276.000%, 06/01/34 . . . . . . . . . . . . . . . . . . . . . . . . . . . . 66,010 69,4656.000%, 11/01/35 . . . . . . . . . . . . . . . . . . . . . . . . . . . . 64,414 70,1356.000%, 02/01/36 . . . . . . . . . . . . . . . . . . . . . . . . . . . . 124,692 133,9776.000%, 08/01/36 . . . . . . . . . . . . . . . . . . . . . . . . . . . . 33,806 36,8256.000%, 10/01/36 . . . . . . . . . . . . . . . . . . . . . . . . . . . . 100,578 109,5316.000%, 11/01/36 . . . . . . . . . . . . . . . . . . . . . . . . . . . . 46,143 48,6346.000%, 01/01/37 . . . . . . . . . . . . . . . . . . . . . . . . . . . . 45,569 48,8056.000%, 02/01/38 . . . . . . . . . . . . . . . . . . . . . . . . . . . . 112,127 121,7726.000%, 11/01/39 . . . . . . . . . . . . . . . . . . . . . . . . . . . . 924,654 1,006,9856.000%, 04/01/40 . . . . . . . . . . . . . . . . . . . . . . . . . . . . 313,215 341,9176.500%, 02/01/30 . . . . . . . . . . . . . . . . . . . . . . . . . . . . 4,788 5,1076.500%, 08/01/31 . . . . . . . . . . . . . . . . . . . . . . . . . . . . 5,901 6,4976.500%, 10/01/31 . . . . . . . . . . . . . . . . . . . . . . . . . . . . 6,491 6,7456.500%, 11/01/31 . . . . . . . . . . . . . . . . . . . . . . . . . . . . 13,243 14,5876.500%, 03/01/32 . . . . . . . . . . . . . . . . . . . . . . . . . . . . 289,347 319,1426.500%, 04/01/32 . . . . . . . . . . . . . . . . . . . . . . . . . . . . 219,241 241,3136.500%, 09/01/36 . . . . . . . . . . . . . . . . . . . . . . . . . . . . 255,083 282,4826.500%, 11/01/37 . . . . . . . . . . . . . . . . . . . . . . . . . . . . 90,791 99,6027.000%, 12/01/27 . . . . . . . . . . . . . . . . . . . . . . . . . . . . 887 9677.000%, 11/01/28 . . . . . . . . . . . . . . . . . . . . . . . . . . . . 2,384 2,6127.000%, 04/01/29 . . . . . . . . . . . . . . . . . . . . . . . . . . . . 2,414 2,6597.000%, 05/01/29 . . . . . . . . . . . . . . . . . . . . . . . . . . . . 598 6397.000%, 06/01/29 . . . . . . . . . . . . . . . . . . . . . . . . . . . . 5,283 5,5147.000%, 07/01/29 . . . . . . . . . . . . . . . . . . . . . . . . . . . . 1,088 1,1697.000%, 01/01/31 . . . . . . . . . . . . . . . . . . . . . . . . . . . . 40,376 41,6407.500%, 08/01/24 . . . . . . . . . . . . . . . . . . . . . . . . . . . . 6,483 6,5077.500%, 10/01/27 . . . . . . . . . . . . . . . . . . . . . . . . . . . . 5,488 6,033
Security DescriptionPrincipalAmount* Value
Agency Sponsored Mortgage-Backed—(Continued)Freddie Mac 30 Yr. Gold Pool
7.500%, 10/01/29 . . . . . . . . . . . . . . . . . . . . . . . . . . . . 8,289 $ 9,2647.500%, 05/01/30 . . . . . . . . . . . . . . . . . . . . . . . . . . . . 10,922 12,0048.000%, 02/01/27 . . . . . . . . . . . . . . . . . . . . . . . . . . . . 2,232 2,4688.000%, 10/01/28 . . . . . . . . . . . . . . . . . . . . . . . . . . . . 4,167 4,608
Freddie Mac Multifamily Structured Pass-Through Certificates(CMO)2.902%, 08/25/20 . . . . . . . . . . . . . . . . . . . . . . . . . . . . 520,274 518,8803.060%, 07/25/23 (a) . . . . . . . . . . . . . . . . . . . . . . . . . 4,800,000 4,756,6773.117%, 06/25/27 . . . . . . . . . . . . . . . . . . . . . . . . . . . . 2,000,000 1,935,9563.187%, 09/25/27 (a) . . . . . . . . . . . . . . . . . . . . . . . . . 1,265,000 1,227,6993.194%, 07/25/27 . . . . . . . . . . . . . . . . . . . . . . . . . . . . 685,000 666,187
Ginnie Mae I 15 Yr. Pool3.000%, 08/15/28 . . . . . . . . . . . . . . . . . . . . . . . . . . . . 1,815,063 1,803,0985.000%, 10/15/20 . . . . . . . . . . . . . . . . . . . . . . . . . . . . 51,548 52,2265.000%, 01/15/21 . . . . . . . . . . . . . . . . . . . . . . . . . . . . 50,438 50,984
Ginnie Mae I 30 Yr. Pool3.000%, 11/15/42 . . . . . . . . . . . . . . . . . . . . . . . . . . . . 1,990,401 1,943,1343.000%, 12/15/42 . . . . . . . . . . . . . . . . . . . . . . . . . . . . 1,606,754 1,568,5973.000%, 02/15/43 . . . . . . . . . . . . . . . . . . . . . . . . . . . . 1,309,946 1,278,8383.000%, 03/15/43 . . . . . . . . . . . . . . . . . . . . . . . . . . . . 1,546,828 1,508,4073.000%, 05/15/43 . . . . . . . . . . . . . . . . . . . . . . . . . . . . 2,170,281 2,116,3743.000%, 07/15/43 . . . . . . . . . . . . . . . . . . . . . . . . . . . . 1,423,296 1,387,9433.500%, 01/15/42 . . . . . . . . . . . . . . . . . . . . . . . . . . . . 1,947,232 1,944,4643.500%, 02/15/42 . . . . . . . . . . . . . . . . . . . . . . . . . . . . 616,860 617,1113.500%, 03/15/42 . . . . . . . . . . . . . . . . . . . . . . . . . . . . 1,383,462 1,384,0243.500%, 05/15/42 . . . . . . . . . . . . . . . . . . . . . . . . . . . . 896,999 897,3633.500%, 09/15/42 . . . . . . . . . . . . . . . . . . . . . . . . . . . . 1,197,092 1,197,5783.500%, 05/15/43 . . . . . . . . . . . . . . . . . . . . . . . . . . . . 1,674,013 1,669,4394.000%, 07/15/39 . . . . . . . . . . . . . . . . . . . . . . . . . . . . 1,337,920 1,372,7954.000%, 07/15/40 . . . . . . . . . . . . . . . . . . . . . . . . . . . . 789,663 809,0254.000%, 03/15/41 . . . . . . . . . . . . . . . . . . . . . . . . . . . . 576,308 591,4654.000%, 10/15/41 . . . . . . . . . . . . . . . . . . . . . . . . . . . . 1,126,784 1,156,4204.500%, 01/15/39 . . . . . . . . . . . . . . . . . . . . . . . . . . . . 185,048 192,8344.500%, 04/15/39 . . . . . . . . . . . . . . . . . . . . . . . . . . . . 626,713 653,2024.500%, 05/15/39 . . . . . . . . . . . . . . . . . . . . . . . . . . . . 1,196,220 1,246,7794.500%, 08/15/39 . . . . . . . . . . . . . . . . . . . . . . . . . . . . 556,787 580,3214.500%, 01/15/40 . . . . . . . . . . . . . . . . . . . . . . . . . . . . 581,808 606,3994.500%, 04/15/40 . . . . . . . . . . . . . . . . . . . . . . . . . . . . 594,840 620,6104.500%, 02/15/41 . . . . . . . . . . . . . . . . . . . . . . . . . . . . 150,171 156,6774.500%, 04/15/41 . . . . . . . . . . . . . . . . . . . . . . . . . . . . 371,041 387,1805.000%, 12/15/35 . . . . . . . . . . . . . . . . . . . . . . . . . . . . 208,411 220,4255.000%, 12/15/36 . . . . . . . . . . . . . . . . . . . . . . . . . . . . 100,204 105,9915.000%, 01/15/39 . . . . . . . . . . . . . . . . . . . . . . . . . . . . 664,301 701,1985.000%, 02/15/39 . . . . . . . . . . . . . . . . . . . . . . . . . . . . 119,591 126,2335.000%, 08/15/39 . . . . . . . . . . . . . . . . . . . . . . . . . . . . 841,593 889,7505.000%, 09/15/39 . . . . . . . . . . . . . . . . . . . . . . . . . . . . 202,340 213,9185.000%, 12/15/39 . . . . . . . . . . . . . . . . . . . . . . . . . . . . 433,667 458,4825.000%, 05/15/40 . . . . . . . . . . . . . . . . . . . . . . . . . . . . 641,257 677,9475.500%, 03/15/36 . . . . . . . . . . . . . . . . . . . . . . . . . . . . 131,683 139,1865.500%, 01/15/37 . . . . . . . . . . . . . . . . . . . . . . . . . . . . 263,293 281,0895.500%, 11/15/37 . . . . . . . . . . . . . . . . . . . . . . . . . . . . 291,628 311,3695.500%, 09/15/38 . . . . . . . . . . . . . . . . . . . . . . . . . . . . 52,168 54,2605.500%, 08/15/39 . . . . . . . . . . . . . . . . . . . . . . . . . . . . 764,291 821,6696.000%, 01/15/29 . . . . . . . . . . . . . . . . . . . . . . . . . . . . 2,679 2,8596.000%, 01/15/33 . . . . . . . . . . . . . . . . . . . . . . . . . . . . 143,262 157,238
BHFTII-165

Brighthouse Funds Trust II
MetLife Aggregate Bond Index Portfolio
Schedule of Investments as of September 30, 2018 (Unaudited)
U.S. Treasury & Government Agencies—(Continued)
Security DescriptionPrincipalAmount* Value
Agency Sponsored Mortgage-Backed—(Continued)Ginnie Mae I 30 Yr. Pool
6.000%, 03/15/35 . . . . . . . . . . . . . . . . . . . . . . . . . . . . 148,976 $ 164,1196.000%, 12/15/35 . . . . . . . . . . . . . . . . . . . . . . . . . . . . 138,673 151,6136.000%, 06/15/36 . . . . . . . . . . . . . . . . . . . . . . . . . . . . 98,564 107,7636.000%, 09/15/36 . . . . . . . . . . . . . . . . . . . . . . . . . . . . 110,378 120,8556.000%, 07/15/38 . . . . . . . . . . . . . . . . . . . . . . . . . . . . 661,080 723,4206.500%, 05/15/23 . . . . . . . . . . . . . . . . . . . . . . . . . . . . 862 8646.500%, 02/15/27 . . . . . . . . . . . . . . . . . . . . . . . . . . . . 18,944 20,2906.500%, 07/15/28 . . . . . . . . . . . . . . . . . . . . . . . . . . . . 7,741 8,3176.500%, 08/15/28 . . . . . . . . . . . . . . . . . . . . . . . . . . . . 8,160 8,8336.500%, 11/15/28 . . . . . . . . . . . . . . . . . . . . . . . . . . . . 5,852 6,3786.500%, 12/15/28 . . . . . . . . . . . . . . . . . . . . . . . . . . . . 7,986 8,4146.500%, 07/15/29 . . . . . . . . . . . . . . . . . . . . . . . . . . . . 1,841 1,9036.500%, 05/15/36 . . . . . . . . . . . . . . . . . . . . . . . . . . . . 107,995 118,9867.000%, 01/15/28 . . . . . . . . . . . . . . . . . . . . . . . . . . . . 1,153 1,2527.000%, 05/15/28 . . . . . . . . . . . . . . . . . . . . . . . . . . . . 7,155 7,5207.000%, 06/15/28 . . . . . . . . . . . . . . . . . . . . . . . . . . . . 6,463 7,1357.000%, 10/15/28 . . . . . . . . . . . . . . . . . . . . . . . . . . . . 6,477 7,0497.000%, 09/15/29 . . . . . . . . . . . . . . . . . . . . . . . . . . . . 1,927 1,9627.000%, 01/15/31 . . . . . . . . . . . . . . . . . . . . . . . . . . . . 1,205 1,2437.000%, 03/15/31 . . . . . . . . . . . . . . . . . . . . . . . . . . . . 11,145 11,5367.000%, 07/15/31 . . . . . . . . . . . . . . . . . . . . . . . . . . . . 284,423 319,4367.000%, 08/15/31 . . . . . . . . . . . . . . . . . . . . . . . . . . . . 50,300 56,4677.000%, 02/15/32 . . . . . . . . . . . . . . . . . . . . . . . . . . . . 8,340 8,4617.000%, 07/15/32 . . . . . . . . . . . . . . . . . . . . . . . . . . . . 13,544 15,3358.000%, 08/15/26 . . . . . . . . . . . . . . . . . . . . . . . . . . . . 2,336 2,5548.000%, 09/15/26 . . . . . . . . . . . . . . . . . . . . . . . . . . . . 2,245 2,4308.000%, 06/15/29 . . . . . . . . . . . . . . . . . . . . . . . . . . . . 20,140 21,4399.000%, 11/15/24 . . . . . . . . . . . . . . . . . . . . . . . . . . . . 2,134 2,222
Ginnie Mae II 30 Yr. Pool3.000%, 12/20/42 . . . . . . . . . . . . . . . . . . . . . . . . . . . . 1,874,819 1,834,8203.000%, 03/20/43 . . . . . . . . . . . . . . . . . . . . . . . . . . . . 2,721,138 2,655,2823.000%, 12/20/44 . . . . . . . . . . . . . . . . . . . . . . . . . . . . 2,378,809 2,318,0743.000%, 04/20/45 . . . . . . . . . . . . . . . . . . . . . . . . . . . . 2,233,388 2,172,9933.000%, 08/20/45 . . . . . . . . . . . . . . . . . . . . . . . . . . . . 3,365,062 3,274,0653.000%, 11/20/45 . . . . . . . . . . . . . . . . . . . . . . . . . . . . 1,918,619 1,866,7363.000%, 01/20/46 . . . . . . . . . . . . . . . . . . . . . . . . . . . . 3,351,469 3,260,8393.000%, 09/20/46 . . . . . . . . . . . . . . . . . . . . . . . . . . . . 3,868,432 3,756,3683.000%, 10/20/46 . . . . . . . . . . . . . . . . . . . . . . . . . . . . 3,933,908 3,819,9483.000%, 11/20/46 . . . . . . . . . . . . . . . . . . . . . . . . . . . . 4,077,333 3,959,2183.000%, 01/20/47 . . . . . . . . . . . . . . . . . . . . . . . . . . . . 9,229,452 8,962,0863.000%, 04/20/47 . . . . . . . . . . . . . . . . . . . . . . . . . . . . 1,676,158 1,624,3603.000%, 02/20/48 . . . . . . . . . . . . . . . . . . . . . . . . . . . . 2,991,492 2,899,0483.500%, 12/20/41 . . . . . . . . . . . . . . . . . . . . . . . . . . . . 1,141,865 1,144,3613.500%, 03/20/42 . . . . . . . . . . . . . . . . . . . . . . . . . . . . 2,296,655 2,300,6843.500%, 08/20/42 . . . . . . . . . . . . . . . . . . . . . . . . . . . . 1,107,007 1,108,9493.500%, 01/20/43 . . . . . . . . . . . . . . . . . . . . . . . . . . . . 3,267,073 3,272,8043.500%, 04/20/43 . . . . . . . . . . . . . . . . . . . . . . . . . . . . 1,288,675 1,290,6953.500%, 05/20/43 . . . . . . . . . . . . . . . . . . . . . . . . . . . . 2,227,638 2,231,1293.500%, 07/20/44 . . . . . . . . . . . . . . . . . . . . . . . . . . . . 2,878,226 2,875,3273.500%, 02/20/45 . . . . . . . . . . . . . . . . . . . . . . . . . . . . 3,117,693 3,114,5533.500%, 06/20/45 . . . . . . . . . . . . . . . . . . . . . . . . . . . . 1,995,902 1,991,9413.500%, 08/20/45 . . . . . . . . . . . . . . . . . . . . . . . . . . . . 4,636,495 4,627,2953.500%, 09/20/45 . . . . . . . . . . . . . . . . . . . . . . . . . . . . 5,340,225 5,329,6273.500%, 10/20/45 . . . . . . . . . . . . . . . . . . . . . . . . . . . . 3,157,810 3,151,5433.500%, 12/20/45 . . . . . . . . . . . . . . . . . . . . . . . . . . . . 2,800,510 2,794,953
Security DescriptionPrincipalAmount* Value
Agency Sponsored Mortgage-Backed—(Continued)Ginnie Mae II 30 Yr. Pool
3.500%, 01/20/46 . . . . . . . . . . . . . . . . . . . . . . . . . . . . 2,787,492 $ 2,781,9613.500%, 02/20/46 . . . . . . . . . . . . . . . . . . . . . . . . . . . . 2,302,844 2,298,2743.500%, 05/20/46 . . . . . . . . . . . . . . . . . . . . . . . . . . . . 3,181,745 3,171,3633.500%, 06/20/46 . . . . . . . . . . . . . . . . . . . . . . . . . . . . 2,698,855 2,690,0493.500%, 02/20/47 . . . . . . . . . . . . . . . . . . . . . . . . . . . . 4,396,198 4,381,8533.500%, 03/20/47 . . . . . . . . . . . . . . . . . . . . . . . . . . . . 3,976,054 3,955,7353.500%, 06/20/47 . . . . . . . . . . . . . . . . . . . . . . . . . . . . 5,079,436 5,053,4793.500%, 09/20/47 . . . . . . . . . . . . . . . . . . . . . . . . . . . . 1,809,347 1,800,1013.500%, 11/20/47 . . . . . . . . . . . . . . . . . . . . . . . . . . . . 1,836,171 1,826,7883.500%, 12/20/47 . . . . . . . . . . . . . . . . . . . . . . . . . . . . 8,520,891 8,477,3473.500%, 03/20/48 . . . . . . . . . . . . . . . . . . . . . . . . . . . . 3,417,151 3,399,3154.000%, 11/20/40 . . . . . . . . . . . . . . . . . . . . . . . . . . . . 1,085,089 1,113,2604.000%, 12/20/40 . . . . . . . . . . . . . . . . . . . . . . . . . . . . 1,286,339 1,319,7354.000%, 05/20/43 . . . . . . . . . . . . . . . . . . . . . . . . . . . . 2,017,042 2,065,5014.000%, 11/20/43 . . . . . . . . . . . . . . . . . . . . . . . . . . . . 781,760 800,5414.000%, 02/20/44 . . . . . . . . . . . . . . . . . . . . . . . . . . . . 2,722,053 2,787,4504.000%, 04/20/44 . . . . . . . . . . . . . . . . . . . . . . . . . . . . 1,094,065 1,118,5144.000%, 05/20/44 . . . . . . . . . . . . . . . . . . . . . . . . . . . . 1,328,756 1,358,4504.000%, 09/20/44 . . . . . . . . . . . . . . . . . . . . . . . . . . . . 2,073,566 2,119,9044.000%, 10/20/44 . . . . . . . . . . . . . . . . . . . . . . . . . . . . 2,967,501 3,033,8154.000%, 11/20/44 . . . . . . . . . . . . . . . . . . . . . . . . . . . . 580,562 593,5364.000%, 10/20/45 . . . . . . . . . . . . . . . . . . . . . . . . . . . . 2,410,495 2,463,3004.000%, 11/20/45 . . . . . . . . . . . . . . . . . . . . . . . . . . . . 1,267,176 1,294,9364.000%, 02/20/47 . . . . . . . . . . . . . . . . . . . . . . . . . . . . 3,231,695 3,300,7924.000%, 03/20/47 . . . . . . . . . . . . . . . . . . . . . . . . . . . . 684,412 699,0454.000%, 04/20/47 . . . . . . . . . . . . . . . . . . . . . . . . . . . . 2,792,359 2,841,6254.000%, 05/20/47 . . . . . . . . . . . . . . . . . . . . . . . . . . . . 3,008,152 3,061,2264.000%, 09/20/47 . . . . . . . . . . . . . . . . . . . . . . . . . . . . 2,591,409 2,637,1314.000%, 07/20/48 . . . . . . . . . . . . . . . . . . . . . . . . . . . . 2,384,745 2,426,5784.000%, 08/20/48 . . . . . . . . . . . . . . . . . . . . . . . . . . . . 1,660,122 1,689,2444.000%, 09/20/48 . . . . . . . . . . . . . . . . . . . . . . . . . . . . 3,000,000 3,051,5634.500%, 08/20/40 . . . . . . . . . . . . . . . . . . . . . . . . . . . . 913,264 953,9924.500%, 12/20/40 . . . . . . . . . . . . . . . . . . . . . . . . . . . . 584,301 610,3584.500%, 04/20/41 . . . . . . . . . . . . . . . . . . . . . . . . . . . . 501,568 524,7684.500%, 03/20/42 . . . . . . . . . . . . . . . . . . . . . . . . . . . . 422,423 441,9624.500%, 10/20/43 . . . . . . . . . . . . . . . . . . . . . . . . . . . . 635,435 661,2964.500%, 02/20/44 . . . . . . . . . . . . . . . . . . . . . . . . . . . . 1,267,678 1,319,2714.500%, 04/20/45 . . . . . . . . . . . . . . . . . . . . . . . . . . . . 1,170,844 1,218,4964.500%, 03/20/47 . . . . . . . . . . . . . . . . . . . . . . . . . . . . 1,628,880 1,691,3824.500%, 11/20/47 . . . . . . . . . . . . . . . . . . . . . . . . . . . . 1,767,830 1,829,1944.500%, 08/20/48 . . . . . . . . . . . . . . . . . . . . . . . . . . . . 1,696,686 1,755,7145.000%, 08/20/40 . . . . . . . . . . . . . . . . . . . . . . . . . . . . 414,924 441,6605.000%, 10/20/40 . . . . . . . . . . . . . . . . . . . . . . . . . . . . 433,954 461,9165.000%, 06/20/44 . . . . . . . . . . . . . . . . . . . . . . . . . . . . 961,103 1,023,0336.500%, 06/20/31 . . . . . . . . . . . . . . . . . . . . . . . . . . . . 17,054 18,7966.500%, 11/20/38 . . . . . . . . . . . . . . . . . . . . . . . . . . . . 352,302 389,4587.500%, 02/20/28 . . . . . . . . . . . . . . . . . . . . . . . . . . . . 1,766 1,940
734,230,588
Federal Agencies—1.7%Federal Home Loan Bank
1.750%, 06/12/20 (b) . . . . . . . . . . . . . . . . . . . . . . . . . 14,700,000 14,443,044Federal Home Loan Mortgage Corp.
1.125%, 08/12/21 (b) . . . . . . . . . . . . . . . . . . . . . . . . . 5,200,000 4,944,8881.375%, 05/01/20 (b) . . . . . . . . . . . . . . . . . . . . . . . . . 5,145,000 5,032,479
BHFTII-166
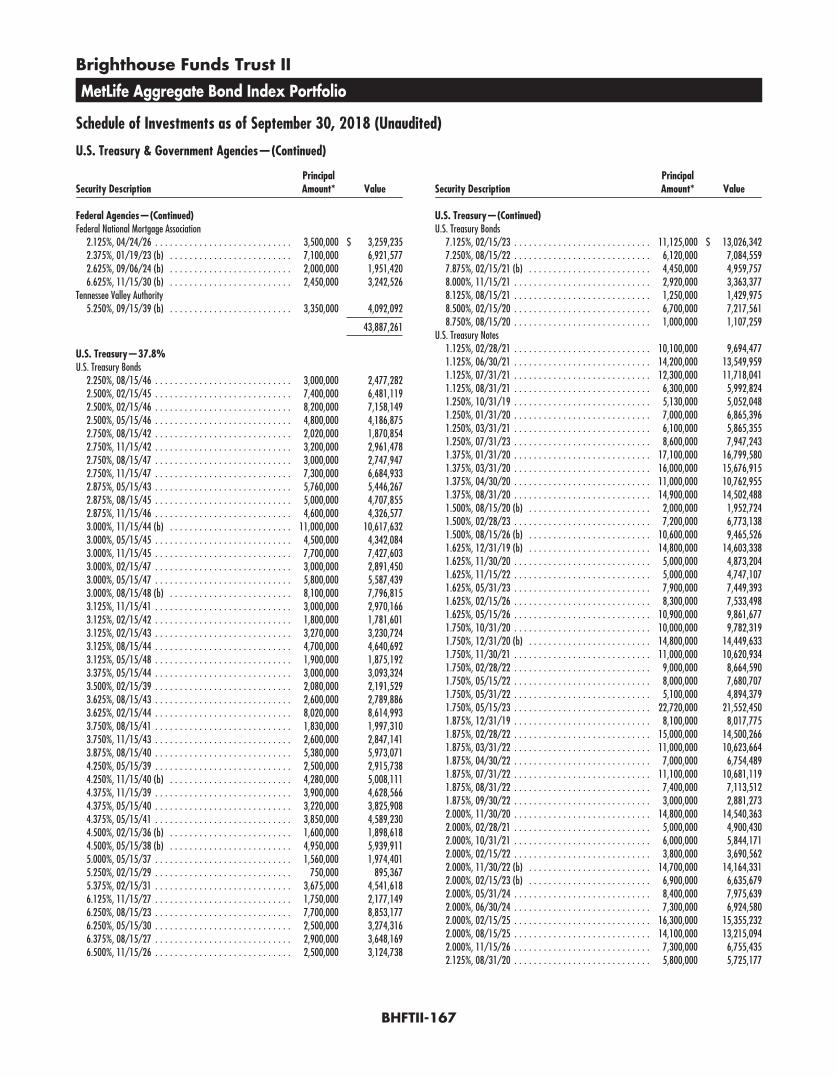
Brighthouse Funds Trust II
MetLife Aggregate Bond Index Portfolio
Schedule of Investments as of September 30, 2018 (Unaudited)
U.S. Treasury & Government Agencies—(Continued)
Security DescriptionPrincipalAmount* Value
Federal Agencies—(Continued)Federal National Mortgage Association
2.125%, 04/24/26 . . . . . . . . . . . . . . . . . . . . . . . . . . . . 3,500,000 $ 3,259,2352.375%, 01/19/23 (b) . . . . . . . . . . . . . . . . . . . . . . . . . 7,100,000 6,921,5772.625%, 09/06/24 (b) . . . . . . . . . . . . . . . . . . . . . . . . . 2,000,000 1,951,4206.625%, 11/15/30 (b) . . . . . . . . . . . . . . . . . . . . . . . . . 2,450,000 3,242,526
Tennessee Valley Authority5.250%, 09/15/39 (b) . . . . . . . . . . . . . . . . . . . . . . . . . 3,350,000 4,092,092
43,887,261
U.S. Treasury—37.8%U.S. Treasury Bonds
2.250%, 08/15/46 . . . . . . . . . . . . . . . . . . . . . . . . . . . . 3,000,000 2,477,2822.500%, 02/15/45 . . . . . . . . . . . . . . . . . . . . . . . . . . . . 7,400,000 6,481,1192.500%, 02/15/46 . . . . . . . . . . . . . . . . . . . . . . . . . . . . 8,200,000 7,158,1492.500%, 05/15/46 . . . . . . . . . . . . . . . . . . . . . . . . . . . . 4,800,000 4,186,8752.750%, 08/15/42 . . . . . . . . . . . . . . . . . . . . . . . . . . . . 2,020,000 1,870,8542.750%, 11/15/42 . . . . . . . . . . . . . . . . . . . . . . . . . . . . 3,200,000 2,961,4782.750%, 08/15/47 . . . . . . . . . . . . . . . . . . . . . . . . . . . . 3,000,000 2,747,9472.750%, 11/15/47 . . . . . . . . . . . . . . . . . . . . . . . . . . . . 7,300,000 6,684,9332.875%, 05/15/43 . . . . . . . . . . . . . . . . . . . . . . . . . . . . 5,760,000 5,446,2672.875%, 08/15/45 . . . . . . . . . . . . . . . . . . . . . . . . . . . . 5,000,000 4,707,8552.875%, 11/15/46 . . . . . . . . . . . . . . . . . . . . . . . . . . . . 4,600,000 4,326,5773.000%, 11/15/44 (b) . . . . . . . . . . . . . . . . . . . . . . . . . 11,000,000 10,617,6323.000%, 05/15/45 . . . . . . . . . . . . . . . . . . . . . . . . . . . . 4,500,000 4,342,0843.000%, 11/15/45 . . . . . . . . . . . . . . . . . . . . . . . . . . . . 7,700,000 7,427,6033.000%, 02/15/47 . . . . . . . . . . . . . . . . . . . . . . . . . . . . 3,000,000 2,891,4503.000%, 05/15/47 . . . . . . . . . . . . . . . . . . . . . . . . . . . . 5,800,000 5,587,4393.000%, 08/15/48 (b) . . . . . . . . . . . . . . . . . . . . . . . . . 8,100,000 7,796,8153.125%, 11/15/41 . . . . . . . . . . . . . . . . . . . . . . . . . . . . 3,000,000 2,970,1663.125%, 02/15/42 . . . . . . . . . . . . . . . . . . . . . . . . . . . . 1,800,000 1,781,6013.125%, 02/15/43 . . . . . . . . . . . . . . . . . . . . . . . . . . . . 3,270,000 3,230,7243.125%, 08/15/44 . . . . . . . . . . . . . . . . . . . . . . . . . . . . 4,700,000 4,640,6923.125%, 05/15/48 . . . . . . . . . . . . . . . . . . . . . . . . . . . . 1,900,000 1,875,1923.375%, 05/15/44 . . . . . . . . . . . . . . . . . . . . . . . . . . . . 3,000,000 3,093,3243.500%, 02/15/39 . . . . . . . . . . . . . . . . . . . . . . . . . . . . 2,080,000 2,191,5293.625%, 08/15/43 . . . . . . . . . . . . . . . . . . . . . . . . . . . . 2,600,000 2,789,8863.625%, 02/15/44 . . . . . . . . . . . . . . . . . . . . . . . . . . . . 8,020,000 8,614,9933.750%, 08/15/41 . . . . . . . . . . . . . . . . . . . . . . . . . . . . 1,830,000 1,997,3103.750%, 11/15/43 . . . . . . . . . . . . . . . . . . . . . . . . . . . . 2,600,000 2,847,1413.875%, 08/15/40 . . . . . . . . . . . . . . . . . . . . . . . . . . . . 5,380,000 5,973,0714.250%, 05/15/39 . . . . . . . . . . . . . . . . . . . . . . . . . . . . 2,500,000 2,915,7384.250%, 11/15/40 (b) . . . . . . . . . . . . . . . . . . . . . . . . . 4,280,000 5,008,1114.375%, 11/15/39 . . . . . . . . . . . . . . . . . . . . . . . . . . . . 3,900,000 4,628,5664.375%, 05/15/40 . . . . . . . . . . . . . . . . . . . . . . . . . . . . 3,220,000 3,825,9084.375%, 05/15/41 . . . . . . . . . . . . . . . . . . . . . . . . . . . . 3,850,000 4,589,2304.500%, 02/15/36 (b) . . . . . . . . . . . . . . . . . . . . . . . . . 1,600,000 1,898,6184.500%, 05/15/38 (b) . . . . . . . . . . . . . . . . . . . . . . . . . 4,950,000 5,939,9115.000%, 05/15/37 . . . . . . . . . . . . . . . . . . . . . . . . . . . . 1,560,000 1,974,4015.250%, 02/15/29 . . . . . . . . . . . . . . . . . . . . . . . . . . . . 750,000 895,3675.375%, 02/15/31 . . . . . . . . . . . . . . . . . . . . . . . . . . . . 3,675,000 4,541,6186.125%, 11/15/27 . . . . . . . . . . . . . . . . . . . . . . . . . . . . 1,750,000 2,177,1496.250%, 08/15/23 . . . . . . . . . . . . . . . . . . . . . . . . . . . . 7,700,000 8,853,1776.250%, 05/15/30 . . . . . . . . . . . . . . . . . . . . . . . . . . . . 2,500,000 3,274,3166.375%, 08/15/27 . . . . . . . . . . . . . . . . . . . . . . . . . . . . 2,900,000 3,648,1696.500%, 11/15/26 . . . . . . . . . . . . . . . . . . . . . . . . . . . . 2,500,000 3,124,738
Security DescriptionPrincipalAmount* Value
U.S. Treasury—(Continued)U.S. Treasury Bonds
7.125%, 02/15/23 . . . . . . . . . . . . . . . . . . . . . . . . . . . . 11,125,000 $ 13,026,3427.250%, 08/15/22 . . . . . . . . . . . . . . . . . . . . . . . . . . . . 6,120,000 7,084,5597.875%, 02/15/21 (b) . . . . . . . . . . . . . . . . . . . . . . . . . 4,450,000 4,959,7578.000%, 11/15/21 . . . . . . . . . . . . . . . . . . . . . . . . . . . . 2,920,000 3,363,3778.125%, 08/15/21 . . . . . . . . . . . . . . . . . . . . . . . . . . . . 1,250,000 1,429,9758.500%, 02/15/20 . . . . . . . . . . . . . . . . . . . . . . . . . . . . 6,700,000 7,217,5618.750%, 08/15/20 . . . . . . . . . . . . . . . . . . . . . . . . . . . . 1,000,000 1,107,259
U.S. Treasury Notes1.125%, 02/28/21 . . . . . . . . . . . . . . . . . . . . . . . . . . . . 10,100,000 9,694,4771.125%, 06/30/21 . . . . . . . . . . . . . . . . . . . . . . . . . . . . 14,200,000 13,549,9591.125%, 07/31/21 . . . . . . . . . . . . . . . . . . . . . . . . . . . . 12,300,000 11,718,0411.125%, 08/31/21 . . . . . . . . . . . . . . . . . . . . . . . . . . . . 6,300,000 5,992,8241.250%, 10/31/19 . . . . . . . . . . . . . . . . . . . . . . . . . . . . 5,130,000 5,052,0481.250%, 01/31/20 . . . . . . . . . . . . . . . . . . . . . . . . . . . . 7,000,000 6,865,3961.250%, 03/31/21 . . . . . . . . . . . . . . . . . . . . . . . . . . . . 6,100,000 5,865,3551.250%, 07/31/23 . . . . . . . . . . . . . . . . . . . . . . . . . . . . 8,600,000 7,947,2431.375%, 01/31/20 . . . . . . . . . . . . . . . . . . . . . . . . . . . . 17,100,000 16,799,5801.375%, 03/31/20 . . . . . . . . . . . . . . . . . . . . . . . . . . . . 16,000,000 15,676,9151.375%, 04/30/20 . . . . . . . . . . . . . . . . . . . . . . . . . . . . 11,000,000 10,762,9551.375%, 08/31/20 . . . . . . . . . . . . . . . . . . . . . . . . . . . . 14,900,000 14,502,4881.500%, 08/15/20 (b) . . . . . . . . . . . . . . . . . . . . . . . . . 2,000,000 1,952,7241.500%, 02/28/23 . . . . . . . . . . . . . . . . . . . . . . . . . . . . 7,200,000 6,773,1381.500%, 08/15/26 (b) . . . . . . . . . . . . . . . . . . . . . . . . . 10,600,000 9,465,5261.625%, 12/31/19 (b) . . . . . . . . . . . . . . . . . . . . . . . . . 14,800,000 14,603,3381.625%, 11/30/20 . . . . . . . . . . . . . . . . . . . . . . . . . . . . 5,000,000 4,873,2041.625%, 11/15/22 . . . . . . . . . . . . . . . . . . . . . . . . . . . . 5,000,000 4,747,1071.625%, 05/31/23 . . . . . . . . . . . . . . . . . . . . . . . . . . . . 7,900,000 7,449,3931.625%, 02/15/26 . . . . . . . . . . . . . . . . . . . . . . . . . . . . 8,300,000 7,533,4981.625%, 05/15/26 . . . . . . . . . . . . . . . . . . . . . . . . . . . . 10,900,000 9,861,6771.750%, 10/31/20 . . . . . . . . . . . . . . . . . . . . . . . . . . . . 10,000,000 9,782,3191.750%, 12/31/20 (b) . . . . . . . . . . . . . . . . . . . . . . . . . 14,800,000 14,449,6331.750%, 11/30/21 . . . . . . . . . . . . . . . . . . . . . . . . . . . . 11,000,000 10,620,9341.750%, 02/28/22 . . . . . . . . . . . . . . . . . . . . . . . . . . . . 9,000,000 8,664,5901.750%, 05/15/22 . . . . . . . . . . . . . . . . . . . . . . . . . . . . 8,000,000 7,680,7071.750%, 05/31/22 . . . . . . . . . . . . . . . . . . . . . . . . . . . . 5,100,000 4,894,3791.750%, 05/15/23 . . . . . . . . . . . . . . . . . . . . . . . . . . . . 22,720,000 21,552,4501.875%, 12/31/19 . . . . . . . . . . . . . . . . . . . . . . . . . . . . 8,100,000 8,017,7751.875%, 02/28/22 . . . . . . . . . . . . . . . . . . . . . . . . . . . . 15,000,000 14,500,2661.875%, 03/31/22 . . . . . . . . . . . . . . . . . . . . . . . . . . . . 11,000,000 10,623,6641.875%, 04/30/22 . . . . . . . . . . . . . . . . . . . . . . . . . . . . 7,000,000 6,754,4891.875%, 07/31/22 . . . . . . . . . . . . . . . . . . . . . . . . . . . . 11,100,000 10,681,1191.875%, 08/31/22 . . . . . . . . . . . . . . . . . . . . . . . . . . . . 7,400,000 7,113,5121.875%, 09/30/22 . . . . . . . . . . . . . . . . . . . . . . . . . . . . 3,000,000 2,881,2732.000%, 11/30/20 . . . . . . . . . . . . . . . . . . . . . . . . . . . . 14,800,000 14,540,3632.000%, 02/28/21 . . . . . . . . . . . . . . . . . . . . . . . . . . . . 5,000,000 4,900,4302.000%, 10/31/21 . . . . . . . . . . . . . . . . . . . . . . . . . . . . 6,000,000 5,844,1712.000%, 02/15/22 . . . . . . . . . . . . . . . . . . . . . . . . . . . . 3,800,000 3,690,5622.000%, 11/30/22 (b) . . . . . . . . . . . . . . . . . . . . . . . . . 14,700,000 14,164,3312.000%, 02/15/23 (b) . . . . . . . . . . . . . . . . . . . . . . . . . 6,900,000 6,635,6792.000%, 05/31/24 . . . . . . . . . . . . . . . . . . . . . . . . . . . . 8,400,000 7,975,6392.000%, 06/30/24 . . . . . . . . . . . . . . . . . . . . . . . . . . . . 7,300,000 6,924,5802.000%, 02/15/25 . . . . . . . . . . . . . . . . . . . . . . . . . . . . 16,300,000 15,355,2322.000%, 08/15/25 . . . . . . . . . . . . . . . . . . . . . . . . . . . . 14,100,000 13,215,0942.000%, 11/15/26 . . . . . . . . . . . . . . . . . . . . . . . . . . . . 7,300,000 6,755,4352.125%, 08/31/20 . . . . . . . . . . . . . . . . . . . . . . . . . . . . 5,800,000 5,725,177
BHFTII-167

Brighthouse Funds Trust II
MetLife Aggregate Bond Index Portfolio
Schedule of Investments as of September 30, 2018 (Unaudited)
U.S. Treasury & Government Agencies—(Continued)
Security DescriptionPrincipalAmount* Value
U.S. Treasury—(Continued)U.S. Treasury Notes
2.125%, 06/30/21 . . . . . . . . . . . . . . . . . . . . . . . . . . . . 12,000,000 $ 11,765,0102.125%, 08/15/21 . . . . . . . . . . . . . . . . . . . . . . . . . . . . 8,710,000 8,529,7542.125%, 12/31/21 . . . . . . . . . . . . . . . . . . . . . . . . . . . . 11,900,000 11,616,8002.125%, 12/31/22 . . . . . . . . . . . . . . . . . . . . . . . . . . . . 7,200,000 6,966,9372.125%, 02/29/24 . . . . . . . . . . . . . . . . . . . . . . . . . . . . 12,000,000 11,497,7012.125%, 03/31/24 . . . . . . . . . . . . . . . . . . . . . . . . . . . . 6,200,000 5,936,3432.125%, 05/15/25 . . . . . . . . . . . . . . . . . . . . . . . . . . . . 11,100,000 10,513,0252.250%, 02/15/21 . . . . . . . . . . . . . . . . . . . . . . . . . . . . 11,000,000 10,847,8782.250%, 07/31/21 (b) . . . . . . . . . . . . . . . . . . . . . . . . . 13,000,000 12,779,0442.250%, 11/15/24 . . . . . . . . . . . . . . . . . . . . . . . . . . . . 18,100,000 17,350,2172.250%, 11/15/25 . . . . . . . . . . . . . . . . . . . . . . . . . . . . 10,800,000 10,267,6482.250%, 02/15/27 . . . . . . . . . . . . . . . . . . . . . . . . . . . . 9,900,000 9,319,6862.250%, 08/15/27 . . . . . . . . . . . . . . . . . . . . . . . . . . . . 2,100,000 1,969,4012.250%, 11/15/27 . . . . . . . . . . . . . . . . . . . . . . . . . . . . 15,600,000 14,602,1132.375%, 12/31/20 . . . . . . . . . . . . . . . . . . . . . . . . . . . . 7,600,000 7,522,9722.375%, 08/15/24 . . . . . . . . . . . . . . . . . . . . . . . . . . . . 15,900,000 15,378,9852.375%, 05/15/27 (b) . . . . . . . . . . . . . . . . . . . . . . . . . 8,000,000 7,595,9992.500%, 06/30/20 (b) . . . . . . . . . . . . . . . . . . . . . . . . . 7,000,000 6,965,1222.500%, 08/15/23 . . . . . . . . . . . . . . . . . . . . . . . . . . . . 14,400,000 14,109,0212.500%, 05/15/24 . . . . . . . . . . . . . . . . . . . . . . . . . . . . 10,000,000 9,756,1292.625%, 08/15/20 . . . . . . . . . . . . . . . . . . . . . . . . . . . . 6,000,000 5,979,3162.750%, 09/30/20 . . . . . . . . . . . . . . . . . . . . . . . . . . . . 16,000,000 15,979,4072.750%, 11/15/23 . . . . . . . . . . . . . . . . . . . . . . . . . . . . 19,335,000 19,151,4192.750%, 02/15/24 . . . . . . . . . . . . . . . . . . . . . . . . . . . . 5,600,000 5,541,2872.750%, 02/15/28 . . . . . . . . . . . . . . . . . . . . . . . . . . . . 9,100,000 8,873,1432.875%, 05/15/28 . . . . . . . . . . . . . . . . . . . . . . . . . . . . 6,000,000 5,909,8983.375%, 11/15/19 . . . . . . . . . . . . . . . . . . . . . . . . . . . . 4,350,000 4,382,3373.500%, 05/15/20 (b) . . . . . . . . . . . . . . . . . . . . . . . . . 25,390,000 25,674,9423.625%, 02/15/20 . . . . . . . . . . . . . . . . . . . . . . . . . . . . 17,190,000 17,392,7463.625%, 02/15/21 . . . . . . . . . . . . . . . . . . . . . . . . . . . . 1,500,000 1,525,998
976,532,802
Total U.S. Treasury & Government Agencies(Cost $1,818,785,935) . . . . . . . . . . . . . . . . . . . . . . . . . 1,754,650,651
Corporate Bonds & Notes—27.2%
Aerospace/Defense—0.5%Boeing Co. (The)
7.250%, 06/15/25 . . . . . . . . . . . . . . . . . . . . . . . . . . . . 460,000 550,422Lockheed Martin Corp.
3.550%, 01/15/26 . . . . . . . . . . . . . . . . . . . . . . . . . . . . 1,000,000 988,6704.090%, 09/15/52 . . . . . . . . . . . . . . . . . . . . . . . . . . . . 3,454,000 3,304,338
Northrop Grumman Corp.3.250%, 01/15/28 . . . . . . . . . . . . . . . . . . . . . . . . . . . . 1,100,000 1,034,033
Northrop Grumman Systems Corp.7.750%, 02/15/31 . . . . . . . . . . . . . . . . . . . . . . . . . . . . 515,000 680,526
Raytheon Co.3.125%, 10/15/20 (b) . . . . . . . . . . . . . . . . . . . . . . . . . 1,000,000 999,860
United Technologies Corp.3.125%, 05/04/27 (b) . . . . . . . . . . . . . . . . . . . . . . . . . 2,000,000 1,865,5804.500%, 06/01/42 . . . . . . . . . . . . . . . . . . . . . . . . . . . . 2,645,000 2,612,1237.500%, 09/15/29 . . . . . . . . . . . . . . . . . . . . . . . . . . . . 200,000 253,740
12,289,292
Security DescriptionPrincipalAmount* Value
Agriculture—0.4%Altria Group, Inc.
4.000%, 01/31/24 . . . . . . . . . . . . . . . . . . . . . . . . . . . . 1,000,000 $ 1,014,120Archer-Daniels-Midland Co.
4.479%, 03/01/21 (b) . . . . . . . . . . . . . . . . . . . . . . . . . 2,000,000 2,056,740Philip Morris International, Inc.
3.250%, 11/10/24 (b) . . . . . . . . . . . . . . . . . . . . . . . . . 3,000,000 2,932,9804.500%, 03/26/20 . . . . . . . . . . . . . . . . . . . . . . . . . . . . 925,000 943,778
Reynolds American, Inc.4.450%, 06/12/25 . . . . . . . . . . . . . . . . . . . . . . . . . . . . 3,800,000 3,824,358
10,771,976
Auto Manufacturers—0.6%American Honda Finance Corp.
2.300%, 09/09/26 . . . . . . . . . . . . . . . . . . . . . . . . . . . . 1,100,000 990,627Daimler Finance North America LLC
8.500%, 01/18/31 . . . . . . . . . . . . . . . . . . . . . . . . . . . . 1,050,000 1,461,527Ford Motor Co.
7.450%, 07/16/31 . . . . . . . . . . . . . . . . . . . . . . . . . . . . 2,200,000 2,445,058Ford Motor Credit Co. LLC
2.597%, 11/04/19 . . . . . . . . . . . . . . . . . . . . . . . . . . . . 3,000,000 2,973,240General Motors Financial Co., Inc.
2.400%, 05/09/19 . . . . . . . . . . . . . . . . . . . . . . . . . . . . 2,500,000 2,492,800Toyota Motor Credit Corp.
3.300%, 01/12/22 . . . . . . . . . . . . . . . . . . . . . . . . . . . . 4,000,000 3,999,280
14,362,532
Banks—6.3%Bank of America Corp.
2.625%, 04/19/21 (b) . . . . . . . . . . . . . . . . . . . . . . . . . 1,000,000 983,1703.300%, 01/11/23 . . . . . . . . . . . . . . . . . . . . . . . . . . . . 4,075,000 4,016,5644.100%, 07/24/23 (b) . . . . . . . . . . . . . . . . . . . . . . . . . 2,905,000 2,960,6024.200%, 08/26/24 . . . . . . . . . . . . . . . . . . . . . . . . . . . . 3,000,000 3,010,2905.875%, 02/07/42 . . . . . . . . . . . . . . . . . . . . . . . . . . . . 3,000,000 3,543,840
Bank of Montreal1.900%, 08/27/21 . . . . . . . . . . . . . . . . . . . . . . . . . . . . 1,000,000 960,340
Bank of Nova Scotia (The)2.700%, 03/07/22 (b) . . . . . . . . . . . . . . . . . . . . . . . . . 3,000,000 2,925,390
Barclays plc4.375%, 01/12/26 . . . . . . . . . . . . . . . . . . . . . . . . . . . . 3,500,000 3,389,085
BNP Paribas S.A.5.000%, 01/15/21 . . . . . . . . . . . . . . . . . . . . . . . . . . . . 3,225,000 3,335,843
Branch Banking & Trust Co.2.850%, 04/01/21 . . . . . . . . . . . . . . . . . . . . . . . . . . . . 3,400,000 3,359,064
Capital One N.A.2.250%, 09/13/21 (b) . . . . . . . . . . . . . . . . . . . . . . . . . 3,000,000 2,885,340
Citigroup, Inc.2.700%, 03/30/21 (b) . . . . . . . . . . . . . . . . . . . . . . . . . 2,000,000 1,965,3203.200%, 10/21/26 . . . . . . . . . . . . . . . . . . . . . . . . . . . . 1,700,000 1,587,0354.125%, 07/25/28 . . . . . . . . . . . . . . . . . . . . . . . . . . . . 3,000,000 2,895,0304.750%, 05/18/46 . . . . . . . . . . . . . . . . . . . . . . . . . . . . 4,400,000 4,304,3005.375%, 08/09/20 . . . . . . . . . . . . . . . . . . . . . . . . . . . . 2,200,000 2,281,796
Cooperatieve Rabobank UA5.250%, 05/24/41 . . . . . . . . . . . . . . . . . . . . . . . . . . . . 1,640,000 1,841,900
Credit Suisse AG4.375%, 08/05/20 . . . . . . . . . . . . . . . . . . . . . . . . . . . . 2,611,000 2,657,580
BHFTII-168
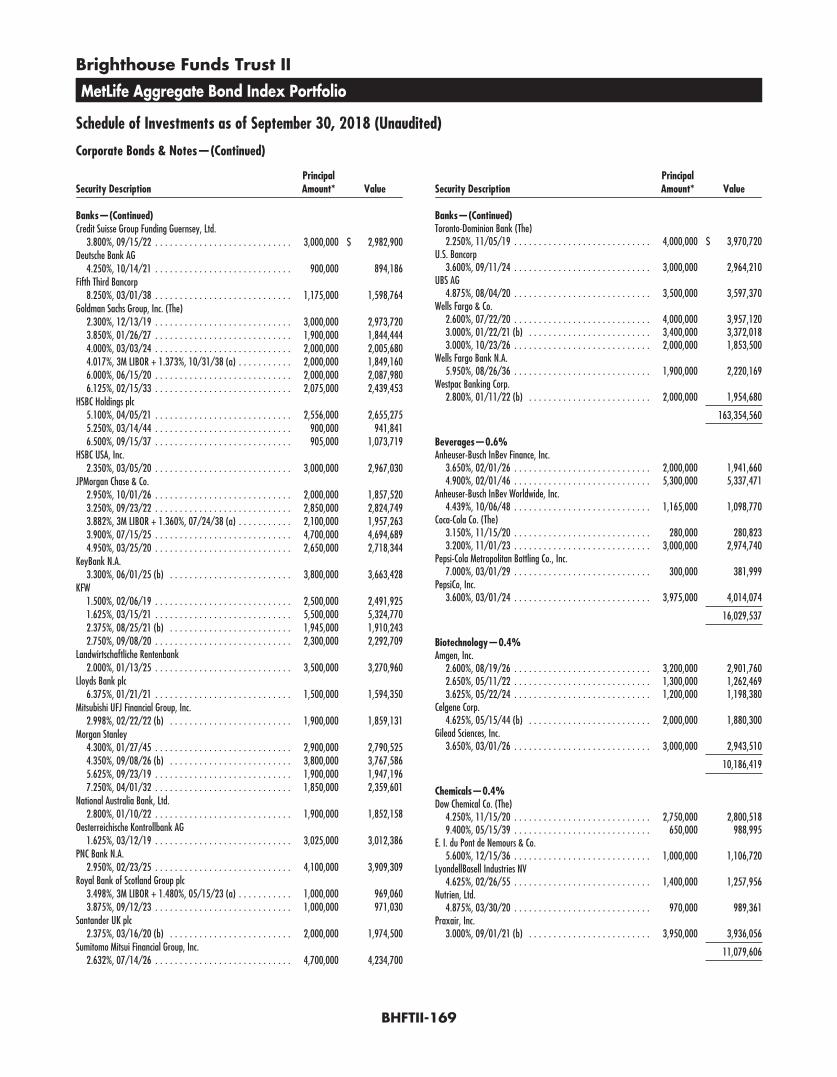
Brighthouse Funds Trust II
MetLife Aggregate Bond Index Portfolio
Schedule of Investments as of September 30, 2018 (Unaudited)
Corporate Bonds & Notes—(Continued)
Security DescriptionPrincipalAmount* Value
Banks—(Continued)Credit Suisse Group Funding Guernsey, Ltd.
3.800%, 09/15/22 . . . . . . . . . . . . . . . . . . . . . . . . . . . . 3,000,000 $ 2,982,900Deutsche Bank AG
4.250%, 10/14/21 . . . . . . . . . . . . . . . . . . . . . . . . . . . . 900,000 894,186Fifth Third Bancorp
8.250%, 03/01/38 . . . . . . . . . . . . . . . . . . . . . . . . . . . . 1,175,000 1,598,764Goldman Sachs Group, Inc. (The)
2.300%, 12/13/19 . . . . . . . . . . . . . . . . . . . . . . . . . . . . 3,000,000 2,973,7203.850%, 01/26/27 . . . . . . . . . . . . . . . . . . . . . . . . . . . . 1,900,000 1,844,4444.000%, 03/03/24 . . . . . . . . . . . . . . . . . . . . . . . . . . . . 2,000,000 2,005,6804.017%, 3M LIBOR + 1.373%, 10/31/38 (a) . . . . . . . . . . . 2,000,000 1,849,1606.000%, 06/15/20 . . . . . . . . . . . . . . . . . . . . . . . . . . . . 2,000,000 2,087,9806.125%, 02/15/33 . . . . . . . . . . . . . . . . . . . . . . . . . . . . 2,075,000 2,439,453
HSBC Holdings plc5.100%, 04/05/21 . . . . . . . . . . . . . . . . . . . . . . . . . . . . 2,556,000 2,655,2755.250%, 03/14/44 . . . . . . . . . . . . . . . . . . . . . . . . . . . . 900,000 941,8416.500%, 09/15/37 . . . . . . . . . . . . . . . . . . . . . . . . . . . . 905,000 1,073,719
HSBC USA, Inc.2.350%, 03/05/20 . . . . . . . . . . . . . . . . . . . . . . . . . . . . 3,000,000 2,967,030
JPMorgan Chase & Co.2.950%, 10/01/26 . . . . . . . . . . . . . . . . . . . . . . . . . . . . 2,000,000 1,857,5203.250%, 09/23/22 . . . . . . . . . . . . . . . . . . . . . . . . . . . . 2,850,000 2,824,7493.882%, 3M LIBOR + 1.360%, 07/24/38 (a) . . . . . . . . . . . 2,100,000 1,957,2633.900%, 07/15/25 . . . . . . . . . . . . . . . . . . . . . . . . . . . . 4,700,000 4,694,6894.950%, 03/25/20 . . . . . . . . . . . . . . . . . . . . . . . . . . . . 2,650,000 2,718,344
KeyBank N.A.3.300%, 06/01/25 (b) . . . . . . . . . . . . . . . . . . . . . . . . . 3,800,000 3,663,428
KFW1.500%, 02/06/19 . . . . . . . . . . . . . . . . . . . . . . . . . . . . 2,500,000 2,491,9251.625%, 03/15/21 . . . . . . . . . . . . . . . . . . . . . . . . . . . . 5,500,000 5,324,7702.375%, 08/25/21 (b) . . . . . . . . . . . . . . . . . . . . . . . . . 1,945,000 1,910,2432.750%, 09/08/20 . . . . . . . . . . . . . . . . . . . . . . . . . . . . 2,300,000 2,292,709
Landwirtschaftliche Rentenbank2.000%, 01/13/25 . . . . . . . . . . . . . . . . . . . . . . . . . . . . 3,500,000 3,270,960
Lloyds Bank plc6.375%, 01/21/21 . . . . . . . . . . . . . . . . . . . . . . . . . . . . 1,500,000 1,594,350
Mitsubishi UFJ Financial Group, Inc.2.998%, 02/22/22 (b) . . . . . . . . . . . . . . . . . . . . . . . . . 1,900,000 1,859,131
Morgan Stanley4.300%, 01/27/45 . . . . . . . . . . . . . . . . . . . . . . . . . . . . 2,900,000 2,790,5254.350%, 09/08/26 (b) . . . . . . . . . . . . . . . . . . . . . . . . . 3,800,000 3,767,5865.625%, 09/23/19 . . . . . . . . . . . . . . . . . . . . . . . . . . . . 1,900,000 1,947,1967.250%, 04/01/32 . . . . . . . . . . . . . . . . . . . . . . . . . . . . 1,850,000 2,359,601
National Australia Bank, Ltd.2.800%, 01/10/22 . . . . . . . . . . . . . . . . . . . . . . . . . . . . 1,900,000 1,852,158
Oesterreichische Kontrollbank AG1.625%, 03/12/19 . . . . . . . . . . . . . . . . . . . . . . . . . . . . 3,025,000 3,012,386
PNC Bank N.A.2.950%, 02/23/25 . . . . . . . . . . . . . . . . . . . . . . . . . . . . 4,100,000 3,909,309
Royal Bank of Scotland Group plc3.498%, 3M LIBOR + 1.480%, 05/15/23 (a) . . . . . . . . . . . 1,000,000 969,0603.875%, 09/12/23 . . . . . . . . . . . . . . . . . . . . . . . . . . . . 1,000,000 971,030
Santander UK plc2.375%, 03/16/20 (b) . . . . . . . . . . . . . . . . . . . . . . . . . 2,000,000 1,974,500
Sumitomo Mitsui Financial Group, Inc.2.632%, 07/14/26 . . . . . . . . . . . . . . . . . . . . . . . . . . . . 4,700,000 4,234,700
Security DescriptionPrincipalAmount* Value
Banks—(Continued)Toronto-Dominion Bank (The)
2.250%, 11/05/19 . . . . . . . . . . . . . . . . . . . . . . . . . . . . 4,000,000 $ 3,970,720U.S. Bancorp
3.600%, 09/11/24 . . . . . . . . . . . . . . . . . . . . . . . . . . . . 3,000,000 2,964,210UBS AG
4.875%, 08/04/20 . . . . . . . . . . . . . . . . . . . . . . . . . . . . 3,500,000 3,597,370Wells Fargo & Co.
2.600%, 07/22/20 . . . . . . . . . . . . . . . . . . . . . . . . . . . . 4,000,000 3,957,1203.000%, 01/22/21 (b) . . . . . . . . . . . . . . . . . . . . . . . . . 3,400,000 3,372,0183.000%, 10/23/26 . . . . . . . . . . . . . . . . . . . . . . . . . . . . 2,000,000 1,853,500
Wells Fargo Bank N.A.5.950%, 08/26/36 . . . . . . . . . . . . . . . . . . . . . . . . . . . . 1,900,000 2,220,169
Westpac Banking Corp.2.800%, 01/11/22 (b) . . . . . . . . . . . . . . . . . . . . . . . . . 2,000,000 1,954,680
163,354,560
Beverages—0.6%Anheuser-Busch InBev Finance, Inc.
3.650%, 02/01/26 . . . . . . . . . . . . . . . . . . . . . . . . . . . . 2,000,000 1,941,6604.900%, 02/01/46 . . . . . . . . . . . . . . . . . . . . . . . . . . . . 5,300,000 5,337,471
Anheuser-Busch InBev Worldwide, Inc.4.439%, 10/06/48 . . . . . . . . . . . . . . . . . . . . . . . . . . . . 1,165,000 1,098,770
Coca-Cola Co. (The)3.150%, 11/15/20 . . . . . . . . . . . . . . . . . . . . . . . . . . . . 280,000 280,8233.200%, 11/01/23 . . . . . . . . . . . . . . . . . . . . . . . . . . . . 3,000,000 2,974,740
Pepsi-Cola Metropolitan Bottling Co., Inc.7.000%, 03/01/29 . . . . . . . . . . . . . . . . . . . . . . . . . . . . 300,000 381,999
PepsiCo, Inc.3.600%, 03/01/24 . . . . . . . . . . . . . . . . . . . . . . . . . . . . 3,975,000 4,014,074
16,029,537
Biotechnology—0.4%Amgen, Inc.
2.600%, 08/19/26 . . . . . . . . . . . . . . . . . . . . . . . . . . . . 3,200,000 2,901,7602.650%, 05/11/22 . . . . . . . . . . . . . . . . . . . . . . . . . . . . 1,300,000 1,262,4693.625%, 05/22/24 . . . . . . . . . . . . . . . . . . . . . . . . . . . . 1,200,000 1,198,380
Celgene Corp.4.625%, 05/15/44 (b) . . . . . . . . . . . . . . . . . . . . . . . . . 2,000,000 1,880,300
Gilead Sciences, Inc.3.650%, 03/01/26 . . . . . . . . . . . . . . . . . . . . . . . . . . . . 3,000,000 2,943,510
10,186,419
Chemicals—0.4%Dow Chemical Co. (The)
4.250%, 11/15/20 . . . . . . . . . . . . . . . . . . . . . . . . . . . . 2,750,000 2,800,5189.400%, 05/15/39 . . . . . . . . . . . . . . . . . . . . . . . . . . . . 650,000 988,995
E. I. du Pont de Nemours & Co.5.600%, 12/15/36 . . . . . . . . . . . . . . . . . . . . . . . . . . . . 1,000,000 1,106,720
LyondellBasell Industries NV4.625%, 02/26/55 . . . . . . . . . . . . . . . . . . . . . . . . . . . . 1,400,000 1,257,956
Nutrien, Ltd.4.875%, 03/30/20 . . . . . . . . . . . . . . . . . . . . . . . . . . . . 970,000 989,361
Praxair, Inc.3.000%, 09/01/21 (b) . . . . . . . . . . . . . . . . . . . . . . . . . 3,950,000 3,936,056
11,079,606
BHFTII-169

Brighthouse Funds Trust II
MetLife Aggregate Bond Index Portfolio
Schedule of Investments as of September 30, 2018 (Unaudited)
Corporate Bonds & Notes—(Continued)
Security DescriptionPrincipalAmount* Value
Computers—0.6%Apple, Inc.
2.250%, 02/23/21 . . . . . . . . . . . . . . . . . . . . . . . . . . . . 3,000,000 $ 2,946,2702.400%, 05/03/23 . . . . . . . . . . . . . . . . . . . . . . . . . . . . 2,072,000 1,990,6744.450%, 05/06/44 . . . . . . . . . . . . . . . . . . . . . . . . . . . . 2,944,000 3,092,4954.650%, 02/23/46 . . . . . . . . . . . . . . . . . . . . . . . . . . . . 2,700,000 2,916,081
Hewlett Packard Enterprise Co.4.900%, 10/15/25 (b) . . . . . . . . . . . . . . . . . . . . . . . . . 1,400,000 1,439,802
International Business Machines Corp.4.000%, 06/20/42 . . . . . . . . . . . . . . . . . . . . . . . . . . . . 3,200,000 3,118,1128.375%, 11/01/19 . . . . . . . . . . . . . . . . . . . . . . . . . . . . 425,000 449,680
15,953,114
Cosmetics/Personal Care—0.3%Procter & Gamble Co. (The)
2.300%, 02/06/22 (b) . . . . . . . . . . . . . . . . . . . . . . . . . 3,600,000 3,500,064Unilever Capital Corp.
2.900%, 05/05/27 . . . . . . . . . . . . . . . . . . . . . . . . . . . . 1,500,000 1,408,8005.900%, 11/15/32 . . . . . . . . . . . . . . . . . . . . . . . . . . . . 1,500,000 1,829,040
6,737,904
Diversified Financial Services—0.6%AerCap Ireland Capital DAC / AerCap Global Aviation Trust
3.950%, 02/01/22 (b) . . . . . . . . . . . . . . . . . . . . . . . . . 1,800,000 1,795,320American Express Credit Corp.
3.300%, 05/03/27 . . . . . . . . . . . . . . . . . . . . . . . . . . . . 3,000,000 2,880,150BlackRock, Inc.
3.500%, 03/18/24 . . . . . . . . . . . . . . . . . . . . . . . . . . . . 3,800,000 3,805,928GE Capital International Funding Co.
4.418%, 11/15/35 . . . . . . . . . . . . . . . . . . . . . . . . . . . . 2,700,000 2,547,207HSBC Finance Corp.
6.676%, 01/15/21 . . . . . . . . . . . . . . . . . . . . . . . . . . . . 433,000 459,465Nomura Holdings, Inc.
6.700%, 03/04/20 . . . . . . . . . . . . . . . . . . . . . . . . . . . . 1,325,000 1,384,121Visa, Inc.
2.800%, 12/14/22 (b) . . . . . . . . . . . . . . . . . . . . . . . . . 3,000,000 2,939,400
15,811,591
Electric—1.7%Connecticut Light & Power Co. (The)
4.000%, 04/01/48 (b) . . . . . . . . . . . . . . . . . . . . . . . . . 1,000,000 983,100Consolidated Edison Co. of New York, Inc.
3.950%, 03/01/43 . . . . . . . . . . . . . . . . . . . . . . . . . . . . 3,070,000 2,931,605Dominion Energy, Inc.
3.900%, 10/01/25 . . . . . . . . . . . . . . . . . . . . . . . . . . . . 1,900,000 1,870,797DTE Electric Co.
3.700%, 03/15/45 . . . . . . . . . . . . . . . . . . . . . . . . . . . . 4,000,000 3,721,960Duke Energy Carolinas LLC
5.300%, 02/15/40 (b) . . . . . . . . . . . . . . . . . . . . . . . . . 2,000,000 2,281,960Duke Energy Corp.
3.050%, 08/15/22 . . . . . . . . . . . . . . . . . . . . . . . . . . . . 4,000,000 3,922,400Exelon Corp.
3.400%, 04/15/26 . . . . . . . . . . . . . . . . . . . . . . . . . . . . 3,000,000 2,863,7105.625%, 06/15/35 . . . . . . . . . . . . . . . . . . . . . . . . . . . . 1,500,000 1,666,365
FirstEnergy Corp.3.900%, 07/15/27 . . . . . . . . . . . . . . . . . . . . . . . . . . . . 2,000,000 1,946,660
Security DescriptionPrincipalAmount* Value
Electric—(Continued)Florida Power & Light Co.
5.950%, 02/01/38 . . . . . . . . . . . . . . . . . . . . . . . . . . . . 1,700,000 $ 2,079,559Georgia Power Co.
4.300%, 03/15/42 . . . . . . . . . . . . . . . . . . . . . . . . . . . . 2,000,000 1,896,560Northern States Power Co.
6.250%, 06/01/36 . . . . . . . . . . . . . . . . . . . . . . . . . . . . 2,200,000 2,745,336Ohio Power Co.
5.375%, 10/01/21 . . . . . . . . . . . . . . . . . . . . . . . . . . . . 1,640,000 1,735,661Oncor Electric Delivery Co. LLC
7.000%, 05/01/32 . . . . . . . . . . . . . . . . . . . . . . . . . . . . 950,000 1,230,839Pacific Gas & Electric Co.
5.400%, 01/15/40 . . . . . . . . . . . . . . . . . . . . . . . . . . . . 3,320,000 3,543,801PacifiCorp
2.950%, 02/01/22 . . . . . . . . . . . . . . . . . . . . . . . . . . . . 2,800,000 2,761,780PPL Capital Funding, Inc.
3.400%, 06/01/23 (b) . . . . . . . . . . . . . . . . . . . . . . . . . 2,000,000 1,962,860PSEG Power LLC
8.625%, 04/15/31 . . . . . . . . . . . . . . . . . . . . . . . . . . . . 1,000,000 1,304,330Sempra Energy
3.400%, 02/01/28 . . . . . . . . . . . . . . . . . . . . . . . . . . . . 2,100,000 1,962,408
43,411,691
Electrical Components & Equipment—0.1%Emerson Electric Co.
4.875%, 10/15/19 . . . . . . . . . . . . . . . . . . . . . . . . . . . . 1,800,000 1,836,252
Environmental Control—0.1%Waste Management, Inc.
7.000%, 07/15/28 . . . . . . . . . . . . . . . . . . . . . . . . . . . . 1,265,000 1,548,714
Food—0.5%General Mills, Inc.
4.200%, 04/17/28 . . . . . . . . . . . . . . . . . . . . . . . . . . . . 1,500,000 1,480,830Kraft Heinz Foods Co.
3.000%, 06/01/26 (b) . . . . . . . . . . . . . . . . . . . . . . . . . 3,300,000 3,004,419Kroger Co. (The)
3.300%, 01/15/21 . . . . . . . . . . . . . . . . . . . . . . . . . . . . 3,900,000 3,887,247Sysco Corp.
2.600%, 06/12/22 . . . . . . . . . . . . . . . . . . . . . . . . . . . . 2,400,000 2,319,048Tyson Foods, Inc.
3.550%, 06/02/27 . . . . . . . . . . . . . . . . . . . . . . . . . . . . 1,200,000 1,132,008
11,823,552
Forest Products & Paper—0.1%Georgia-Pacific LLC
8.000%, 01/15/24 . . . . . . . . . . . . . . . . . . . . . . . . . . . . 1,800,000 2,150,226International Paper Co.
3.000%, 02/15/27 (b) . . . . . . . . . . . . . . . . . . . . . . . . . 1,500,000 1,377,120
3,527,346
Gas—0.1%NiSource, Inc.
4.800%, 02/15/44 . . . . . . . . . . . . . . . . . . . . . . . . . . . . 1,500,000 1,516,230
BHFTII-170
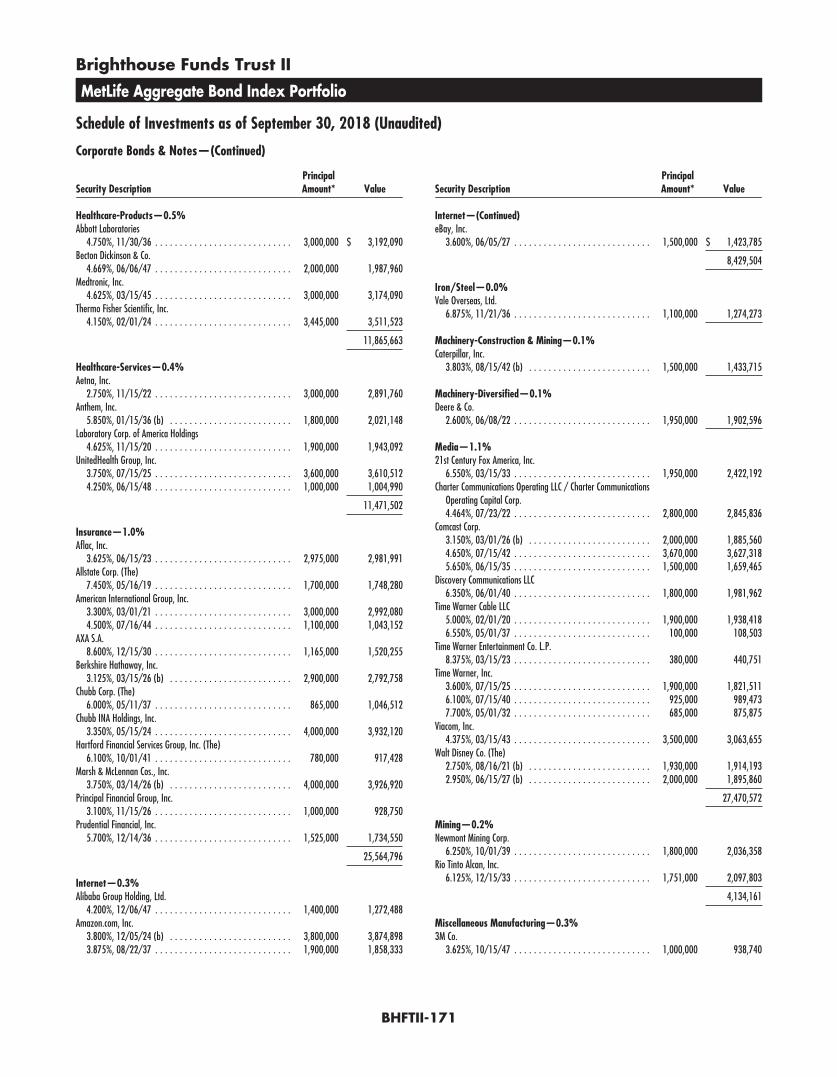
Brighthouse Funds Trust II
MetLife Aggregate Bond Index Portfolio
Schedule of Investments as of September 30, 2018 (Unaudited)
Corporate Bonds & Notes—(Continued)
Security DescriptionPrincipalAmount* Value
Healthcare-Products—0.5%Abbott Laboratories
4.750%, 11/30/36 . . . . . . . . . . . . . . . . . . . . . . . . . . . . 3,000,000 $ 3,192,090Becton Dickinson & Co.
4.669%, 06/06/47 . . . . . . . . . . . . . . . . . . . . . . . . . . . . 2,000,000 1,987,960Medtronic, Inc.
4.625%, 03/15/45 . . . . . . . . . . . . . . . . . . . . . . . . . . . . 3,000,000 3,174,090Thermo Fisher Scientific, Inc.
4.150%, 02/01/24 . . . . . . . . . . . . . . . . . . . . . . . . . . . . 3,445,000 3,511,523
11,865,663
Healthcare-Services—0.4%Aetna, Inc.
2.750%, 11/15/22 . . . . . . . . . . . . . . . . . . . . . . . . . . . . 3,000,000 2,891,760Anthem, Inc.
5.850%, 01/15/36 (b) . . . . . . . . . . . . . . . . . . . . . . . . . 1,800,000 2,021,148Laboratory Corp. of America Holdings
4.625%, 11/15/20 . . . . . . . . . . . . . . . . . . . . . . . . . . . . 1,900,000 1,943,092UnitedHealth Group, Inc.
3.750%, 07/15/25 . . . . . . . . . . . . . . . . . . . . . . . . . . . . 3,600,000 3,610,5124.250%, 06/15/48 . . . . . . . . . . . . . . . . . . . . . . . . . . . . 1,000,000 1,004,990
11,471,502
Insurance—1.0%Aflac, Inc.
3.625%, 06/15/23 . . . . . . . . . . . . . . . . . . . . . . . . . . . . 2,975,000 2,981,991Allstate Corp. (The)
7.450%, 05/16/19 . . . . . . . . . . . . . . . . . . . . . . . . . . . . 1,700,000 1,748,280American International Group, Inc.
3.300%, 03/01/21 . . . . . . . . . . . . . . . . . . . . . . . . . . . . 3,000,000 2,992,0804.500%, 07/16/44 . . . . . . . . . . . . . . . . . . . . . . . . . . . . 1,100,000 1,043,152
AXA S.A.8.600%, 12/15/30 . . . . . . . . . . . . . . . . . . . . . . . . . . . . 1,165,000 1,520,255
Berkshire Hathaway, Inc.3.125%, 03/15/26 (b) . . . . . . . . . . . . . . . . . . . . . . . . . 2,900,000 2,792,758
Chubb Corp. (The)6.000%, 05/11/37 . . . . . . . . . . . . . . . . . . . . . . . . . . . . 865,000 1,046,512
Chubb INA Holdings, Inc.3.350%, 05/15/24 . . . . . . . . . . . . . . . . . . . . . . . . . . . . 4,000,000 3,932,120
Hartford Financial Services Group, Inc. (The)6.100%, 10/01/41 . . . . . . . . . . . . . . . . . . . . . . . . . . . . 780,000 917,428
Marsh & McLennan Cos., Inc.3.750%, 03/14/26 (b) . . . . . . . . . . . . . . . . . . . . . . . . . 4,000,000 3,926,920
Principal Financial Group, Inc.3.100%, 11/15/26 . . . . . . . . . . . . . . . . . . . . . . . . . . . . 1,000,000 928,750
Prudential Financial, Inc.5.700%, 12/14/36 . . . . . . . . . . . . . . . . . . . . . . . . . . . . 1,525,000 1,734,550
25,564,796
Internet—0.3%Alibaba Group Holding, Ltd.
4.200%, 12/06/47 . . . . . . . . . . . . . . . . . . . . . . . . . . . . 1,400,000 1,272,488Amazon.com, Inc.
3.800%, 12/05/24 (b) . . . . . . . . . . . . . . . . . . . . . . . . . 3,800,000 3,874,8983.875%, 08/22/37 . . . . . . . . . . . . . . . . . . . . . . . . . . . . 1,900,000 1,858,333
Security DescriptionPrincipalAmount* Value
Internet—(Continued)eBay, Inc.
3.600%, 06/05/27 . . . . . . . . . . . . . . . . . . . . . . . . . . . . 1,500,000 $ 1,423,785
8,429,504
Iron/Steel—0.0%Vale Overseas, Ltd.
6.875%, 11/21/36 . . . . . . . . . . . . . . . . . . . . . . . . . . . . 1,100,000 1,274,273
Machinery-Construction & Mining—0.1%Caterpillar, Inc.
3.803%, 08/15/42 (b) . . . . . . . . . . . . . . . . . . . . . . . . . 1,500,000 1,433,715
Machinery-Diversified—0.1%Deere & Co.
2.600%, 06/08/22 . . . . . . . . . . . . . . . . . . . . . . . . . . . . 1,950,000 1,902,596
Media—1.1%21st Century Fox America, Inc.
6.550%, 03/15/33 . . . . . . . . . . . . . . . . . . . . . . . . . . . . 1,950,000 2,422,192Charter Communications Operating LLC / Charter Communications
Operating Capital Corp.4.464%, 07/23/22 . . . . . . . . . . . . . . . . . . . . . . . . . . . . 2,800,000 2,845,836
Comcast Corp.3.150%, 03/01/26 (b) . . . . . . . . . . . . . . . . . . . . . . . . . 2,000,000 1,885,5604.650%, 07/15/42 . . . . . . . . . . . . . . . . . . . . . . . . . . . . 3,670,000 3,627,3185.650%, 06/15/35 . . . . . . . . . . . . . . . . . . . . . . . . . . . . 1,500,000 1,659,465
Discovery Communications LLC6.350%, 06/01/40 . . . . . . . . . . . . . . . . . . . . . . . . . . . . 1,800,000 1,981,962
Time Warner Cable LLC5.000%, 02/01/20 . . . . . . . . . . . . . . . . . . . . . . . . . . . . 1,900,000 1,938,4186.550%, 05/01/37 . . . . . . . . . . . . . . . . . . . . . . . . . . . . 100,000 108,503
Time Warner Entertainment Co. L.P.8.375%, 03/15/23 . . . . . . . . . . . . . . . . . . . . . . . . . . . . 380,000 440,751
Time Warner, Inc.3.600%, 07/15/25 . . . . . . . . . . . . . . . . . . . . . . . . . . . . 1,900,000 1,821,5116.100%, 07/15/40 . . . . . . . . . . . . . . . . . . . . . . . . . . . . 925,000 989,4737.700%, 05/01/32 . . . . . . . . . . . . . . . . . . . . . . . . . . . . 685,000 875,875
Viacom, Inc.4.375%, 03/15/43 . . . . . . . . . . . . . . . . . . . . . . . . . . . . 3,500,000 3,063,655
Walt Disney Co. (The)2.750%, 08/16/21 (b) . . . . . . . . . . . . . . . . . . . . . . . . . 1,930,000 1,914,1932.950%, 06/15/27 (b) . . . . . . . . . . . . . . . . . . . . . . . . . 2,000,000 1,895,860
27,470,572
Mining—0.2%Newmont Mining Corp.
6.250%, 10/01/39 . . . . . . . . . . . . . . . . . . . . . . . . . . . . 1,800,000 2,036,358Rio Tinto Alcan, Inc.
6.125%, 12/15/33 . . . . . . . . . . . . . . . . . . . . . . . . . . . . 1,751,000 2,097,803
4,134,161
Miscellaneous Manufacturing—0.3%3M Co.
3.625%, 10/15/47 . . . . . . . . . . . . . . . . . . . . . . . . . . . . 1,000,000 938,740
BHFTII-171
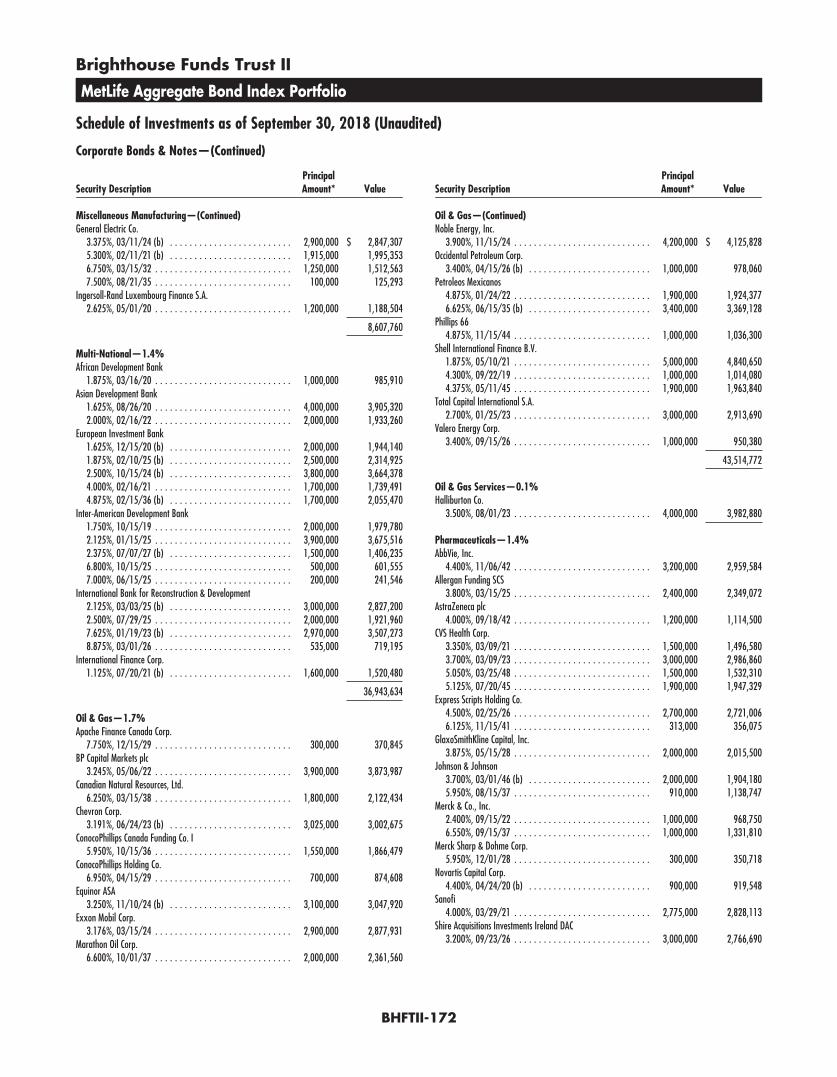
Brighthouse Funds Trust II
MetLife Aggregate Bond Index Portfolio
Schedule of Investments as of September 30, 2018 (Unaudited)
Corporate Bonds & Notes—(Continued)
Security DescriptionPrincipalAmount* Value
Miscellaneous Manufacturing—(Continued)General Electric Co.
3.375%, 03/11/24 (b) . . . . . . . . . . . . . . . . . . . . . . . . . 2,900,000 $ 2,847,3075.300%, 02/11/21 (b) . . . . . . . . . . . . . . . . . . . . . . . . . 1,915,000 1,995,3536.750%, 03/15/32 . . . . . . . . . . . . . . . . . . . . . . . . . . . . 1,250,000 1,512,5637.500%, 08/21/35 . . . . . . . . . . . . . . . . . . . . . . . . . . . . 100,000 125,293
Ingersoll-Rand Luxembourg Finance S.A.2.625%, 05/01/20 . . . . . . . . . . . . . . . . . . . . . . . . . . . . 1,200,000 1,188,504
8,607,760
Multi-National—1.4%African Development Bank
1.875%, 03/16/20 . . . . . . . . . . . . . . . . . . . . . . . . . . . . 1,000,000 985,910Asian Development Bank
1.625%, 08/26/20 . . . . . . . . . . . . . . . . . . . . . . . . . . . . 4,000,000 3,905,3202.000%, 02/16/22 . . . . . . . . . . . . . . . . . . . . . . . . . . . . 2,000,000 1,933,260
European Investment Bank1.625%, 12/15/20 (b) . . . . . . . . . . . . . . . . . . . . . . . . . 2,000,000 1,944,1401.875%, 02/10/25 (b) . . . . . . . . . . . . . . . . . . . . . . . . . 2,500,000 2,314,9252.500%, 10/15/24 (b) . . . . . . . . . . . . . . . . . . . . . . . . . 3,800,000 3,664,3784.000%, 02/16/21 . . . . . . . . . . . . . . . . . . . . . . . . . . . . 1,700,000 1,739,4914.875%, 02/15/36 (b) . . . . . . . . . . . . . . . . . . . . . . . . . 1,700,000 2,055,470
Inter-American Development Bank1.750%, 10/15/19 . . . . . . . . . . . . . . . . . . . . . . . . . . . . 2,000,000 1,979,7802.125%, 01/15/25 . . . . . . . . . . . . . . . . . . . . . . . . . . . . 3,900,000 3,675,5162.375%, 07/07/27 (b) . . . . . . . . . . . . . . . . . . . . . . . . . 1,500,000 1,406,2356.800%, 10/15/25 . . . . . . . . . . . . . . . . . . . . . . . . . . . . 500,000 601,5557.000%, 06/15/25 . . . . . . . . . . . . . . . . . . . . . . . . . . . . 200,000 241,546
International Bank for Reconstruction & Development2.125%, 03/03/25 (b) . . . . . . . . . . . . . . . . . . . . . . . . . 3,000,000 2,827,2002.500%, 07/29/25 . . . . . . . . . . . . . . . . . . . . . . . . . . . . 2,000,000 1,921,9607.625%, 01/19/23 (b) . . . . . . . . . . . . . . . . . . . . . . . . . 2,970,000 3,507,2738.875%, 03/01/26 . . . . . . . . . . . . . . . . . . . . . . . . . . . . 535,000 719,195
International Finance Corp.1.125%, 07/20/21 (b) . . . . . . . . . . . . . . . . . . . . . . . . . 1,600,000 1,520,480
36,943,634
Oil & Gas—1.7%Apache Finance Canada Corp.
7.750%, 12/15/29 . . . . . . . . . . . . . . . . . . . . . . . . . . . . 300,000 370,845BP Capital Markets plc
3.245%, 05/06/22 . . . . . . . . . . . . . . . . . . . . . . . . . . . . 3,900,000 3,873,987Canadian Natural Resources, Ltd.
6.250%, 03/15/38 . . . . . . . . . . . . . . . . . . . . . . . . . . . . 1,800,000 2,122,434Chevron Corp.
3.191%, 06/24/23 (b) . . . . . . . . . . . . . . . . . . . . . . . . . 3,025,000 3,002,675ConocoPhillips Canada Funding Co. I
5.950%, 10/15/36 . . . . . . . . . . . . . . . . . . . . . . . . . . . . 1,550,000 1,866,479ConocoPhillips Holding Co.
6.950%, 04/15/29 . . . . . . . . . . . . . . . . . . . . . . . . . . . . 700,000 874,608Equinor ASA
3.250%, 11/10/24 (b) . . . . . . . . . . . . . . . . . . . . . . . . . 3,100,000 3,047,920Exxon Mobil Corp.
3.176%, 03/15/24 . . . . . . . . . . . . . . . . . . . . . . . . . . . . 2,900,000 2,877,931Marathon Oil Corp.
6.600%, 10/01/37 . . . . . . . . . . . . . . . . . . . . . . . . . . . . 2,000,000 2,361,560
Security DescriptionPrincipalAmount* Value
Oil & Gas—(Continued)Noble Energy, Inc.
3.900%, 11/15/24 . . . . . . . . . . . . . . . . . . . . . . . . . . . . 4,200,000 $ 4,125,828Occidental Petroleum Corp.
3.400%, 04/15/26 (b) . . . . . . . . . . . . . . . . . . . . . . . . . 1,000,000 978,060Petroleos Mexicanos
4.875%, 01/24/22 . . . . . . . . . . . . . . . . . . . . . . . . . . . . 1,900,000 1,924,3776.625%, 06/15/35 (b) . . . . . . . . . . . . . . . . . . . . . . . . . 3,400,000 3,369,128
Phillips 664.875%, 11/15/44 . . . . . . . . . . . . . . . . . . . . . . . . . . . . 1,000,000 1,036,300
Shell International Finance B.V.1.875%, 05/10/21 . . . . . . . . . . . . . . . . . . . . . . . . . . . . 5,000,000 4,840,6504.300%, 09/22/19 . . . . . . . . . . . . . . . . . . . . . . . . . . . . 1,000,000 1,014,0804.375%, 05/11/45 . . . . . . . . . . . . . . . . . . . . . . . . . . . . 1,900,000 1,963,840
Total Capital International S.A.2.700%, 01/25/23 . . . . . . . . . . . . . . . . . . . . . . . . . . . . 3,000,000 2,913,690
Valero Energy Corp.3.400%, 09/15/26 . . . . . . . . . . . . . . . . . . . . . . . . . . . . 1,000,000 950,380
43,514,772
Oil & Gas Services—0.1%Halliburton Co.
3.500%, 08/01/23 . . . . . . . . . . . . . . . . . . . . . . . . . . . . 4,000,000 3,982,880
Pharmaceuticals—1.4%AbbVie, Inc.
4.400%, 11/06/42 . . . . . . . . . . . . . . . . . . . . . . . . . . . . 3,200,000 2,959,584Allergan Funding SCS
3.800%, 03/15/25 . . . . . . . . . . . . . . . . . . . . . . . . . . . . 2,400,000 2,349,072AstraZeneca plc
4.000%, 09/18/42 . . . . . . . . . . . . . . . . . . . . . . . . . . . . 1,200,000 1,114,500CVS Health Corp.
3.350%, 03/09/21 . . . . . . . . . . . . . . . . . . . . . . . . . . . . 1,500,000 1,496,5803.700%, 03/09/23 . . . . . . . . . . . . . . . . . . . . . . . . . . . . 3,000,000 2,986,8605.050%, 03/25/48 . . . . . . . . . . . . . . . . . . . . . . . . . . . . 1,500,000 1,532,3105.125%, 07/20/45 . . . . . . . . . . . . . . . . . . . . . . . . . . . . 1,900,000 1,947,329
Express Scripts Holding Co.4.500%, 02/25/26 . . . . . . . . . . . . . . . . . . . . . . . . . . . . 2,700,000 2,721,0066.125%, 11/15/41 . . . . . . . . . . . . . . . . . . . . . . . . . . . . 313,000 356,075
GlaxoSmithKline Capital, Inc.3.875%, 05/15/28 . . . . . . . . . . . . . . . . . . . . . . . . . . . . 2,000,000 2,015,500
Johnson & Johnson3.700%, 03/01/46 (b) . . . . . . . . . . . . . . . . . . . . . . . . . 2,000,000 1,904,1805.950%, 08/15/37 . . . . . . . . . . . . . . . . . . . . . . . . . . . . 910,000 1,138,747
Merck & Co., Inc.2.400%, 09/15/22 . . . . . . . . . . . . . . . . . . . . . . . . . . . . 1,000,000 968,7506.550%, 09/15/37 . . . . . . . . . . . . . . . . . . . . . . . . . . . . 1,000,000 1,331,810
Merck Sharp & Dohme Corp.5.950%, 12/01/28 . . . . . . . . . . . . . . . . . . . . . . . . . . . . 300,000 350,718
Novartis Capital Corp.4.400%, 04/24/20 (b) . . . . . . . . . . . . . . . . . . . . . . . . . 900,000 919,548
Sanofi4.000%, 03/29/21 . . . . . . . . . . . . . . . . . . . . . . . . . . . . 2,775,000 2,828,113
Shire Acquisitions Investments Ireland DAC3.200%, 09/23/26 . . . . . . . . . . . . . . . . . . . . . . . . . . . . 3,000,000 2,766,690
BHFTII-172
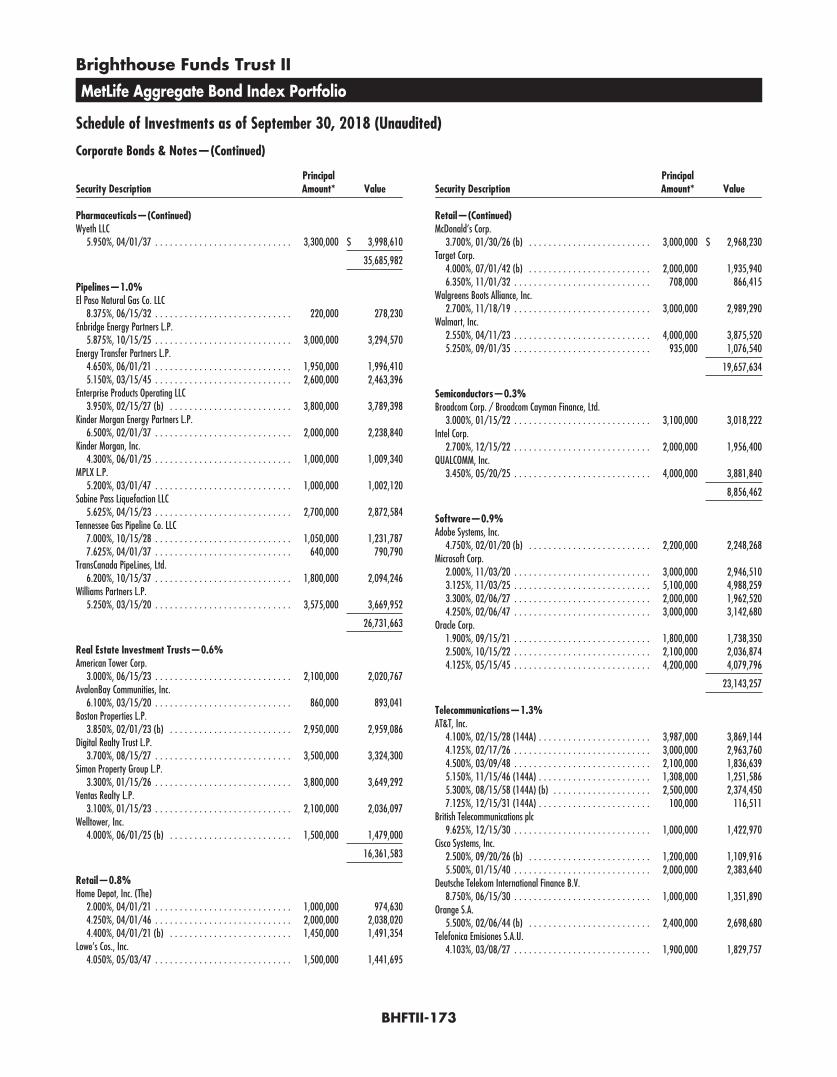
Brighthouse Funds Trust II
MetLife Aggregate Bond Index Portfolio
Schedule of Investments as of September 30, 2018 (Unaudited)
Corporate Bonds & Notes—(Continued)
Security DescriptionPrincipalAmount* Value
Pharmaceuticals—(Continued)Wyeth LLC
5.950%, 04/01/37 . . . . . . . . . . . . . . . . . . . . . . . . . . . . 3,300,000 $ 3,998,610
35,685,982
Pipelines—1.0%El Paso Natural Gas Co. LLC
8.375%, 06/15/32 . . . . . . . . . . . . . . . . . . . . . . . . . . . . 220,000 278,230Enbridge Energy Partners L.P.
5.875%, 10/15/25 . . . . . . . . . . . . . . . . . . . . . . . . . . . . 3,000,000 3,294,570Energy Transfer Partners L.P.
4.650%, 06/01/21 . . . . . . . . . . . . . . . . . . . . . . . . . . . . 1,950,000 1,996,4105.150%, 03/15/45 . . . . . . . . . . . . . . . . . . . . . . . . . . . . 2,600,000 2,463,396
Enterprise Products Operating LLC3.950%, 02/15/27 (b) . . . . . . . . . . . . . . . . . . . . . . . . . 3,800,000 3,789,398
Kinder Morgan Energy Partners L.P.6.500%, 02/01/37 . . . . . . . . . . . . . . . . . . . . . . . . . . . . 2,000,000 2,238,840
Kinder Morgan, Inc.4.300%, 06/01/25 . . . . . . . . . . . . . . . . . . . . . . . . . . . . 1,000,000 1,009,340
MPLX L.P.5.200%, 03/01/47 . . . . . . . . . . . . . . . . . . . . . . . . . . . . 1,000,000 1,002,120
Sabine Pass Liquefaction LLC5.625%, 04/15/23 . . . . . . . . . . . . . . . . . . . . . . . . . . . . 2,700,000 2,872,584
Tennessee Gas Pipeline Co. LLC7.000%, 10/15/28 . . . . . . . . . . . . . . . . . . . . . . . . . . . . 1,050,000 1,231,7877.625%, 04/01/37 . . . . . . . . . . . . . . . . . . . . . . . . . . . . 640,000 790,790
TransCanada PipeLines, Ltd.6.200%, 10/15/37 . . . . . . . . . . . . . . . . . . . . . . . . . . . . 1,800,000 2,094,246
Williams Partners L.P.5.250%, 03/15/20 . . . . . . . . . . . . . . . . . . . . . . . . . . . . 3,575,000 3,669,952
26,731,663
Real Estate Investment Trusts—0.6%American Tower Corp.
3.000%, 06/15/23 . . . . . . . . . . . . . . . . . . . . . . . . . . . . 2,100,000 2,020,767AvalonBay Communities, Inc.
6.100%, 03/15/20 . . . . . . . . . . . . . . . . . . . . . . . . . . . . 860,000 893,041Boston Properties L.P.
3.850%, 02/01/23 (b) . . . . . . . . . . . . . . . . . . . . . . . . . 2,950,000 2,959,086Digital Realty Trust L.P.
3.700%, 08/15/27 . . . . . . . . . . . . . . . . . . . . . . . . . . . . 3,500,000 3,324,300Simon Property Group L.P.
3.300%, 01/15/26 . . . . . . . . . . . . . . . . . . . . . . . . . . . . 3,800,000 3,649,292Ventas Realty L.P.
3.100%, 01/15/23 . . . . . . . . . . . . . . . . . . . . . . . . . . . . 2,100,000 2,036,097Welltower, Inc.
4.000%, 06/01/25 (b) . . . . . . . . . . . . . . . . . . . . . . . . . 1,500,000 1,479,000
16,361,583
Retail—0.8%Home Depot, Inc. (The)
2.000%, 04/01/21 . . . . . . . . . . . . . . . . . . . . . . . . . . . . 1,000,000 974,6304.250%, 04/01/46 . . . . . . . . . . . . . . . . . . . . . . . . . . . . 2,000,000 2,038,0204.400%, 04/01/21 (b) . . . . . . . . . . . . . . . . . . . . . . . . . 1,450,000 1,491,354
Lowe’s Cos., Inc.4.050%, 05/03/47 . . . . . . . . . . . . . . . . . . . . . . . . . . . . 1,500,000 1,441,695
Security DescriptionPrincipalAmount* Value
Retail—(Continued)McDonald’s Corp.
3.700%, 01/30/26 (b) . . . . . . . . . . . . . . . . . . . . . . . . . 3,000,000 $ 2,968,230Target Corp.
4.000%, 07/01/42 (b) . . . . . . . . . . . . . . . . . . . . . . . . . 2,000,000 1,935,9406.350%, 11/01/32 . . . . . . . . . . . . . . . . . . . . . . . . . . . . 708,000 866,415
Walgreens Boots Alliance, Inc.2.700%, 11/18/19 . . . . . . . . . . . . . . . . . . . . . . . . . . . . 3,000,000 2,989,290
Walmart, Inc.2.550%, 04/11/23 . . . . . . . . . . . . . . . . . . . . . . . . . . . . 4,000,000 3,875,5205.250%, 09/01/35 . . . . . . . . . . . . . . . . . . . . . . . . . . . . 935,000 1,076,540
19,657,634
Semiconductors—0.3%Broadcom Corp. / Broadcom Cayman Finance, Ltd.
3.000%, 01/15/22 . . . . . . . . . . . . . . . . . . . . . . . . . . . . 3,100,000 3,018,222Intel Corp.
2.700%, 12/15/22 . . . . . . . . . . . . . . . . . . . . . . . . . . . . 2,000,000 1,956,400QUALCOMM, Inc.
3.450%, 05/20/25 . . . . . . . . . . . . . . . . . . . . . . . . . . . . 4,000,000 3,881,840
8,856,462
Software—0.9%Adobe Systems, Inc.
4.750%, 02/01/20 (b) . . . . . . . . . . . . . . . . . . . . . . . . . 2,200,000 2,248,268Microsoft Corp.
2.000%, 11/03/20 . . . . . . . . . . . . . . . . . . . . . . . . . . . . 3,000,000 2,946,5103.125%, 11/03/25 . . . . . . . . . . . . . . . . . . . . . . . . . . . . 5,100,000 4,988,2593.300%, 02/06/27 . . . . . . . . . . . . . . . . . . . . . . . . . . . . 2,000,000 1,962,5204.250%, 02/06/47 . . . . . . . . . . . . . . . . . . . . . . . . . . . . 3,000,000 3,142,680
Oracle Corp.1.900%, 09/15/21 . . . . . . . . . . . . . . . . . . . . . . . . . . . . 1,800,000 1,738,3502.500%, 10/15/22 . . . . . . . . . . . . . . . . . . . . . . . . . . . . 2,100,000 2,036,8744.125%, 05/15/45 . . . . . . . . . . . . . . . . . . . . . . . . . . . . 4,200,000 4,079,796
23,143,257
Telecommunications—1.3%AT&T, Inc.
4.100%, 02/15/28 (144A) . . . . . . . . . . . . . . . . . . . . . . . 3,987,000 3,869,1444.125%, 02/17/26 . . . . . . . . . . . . . . . . . . . . . . . . . . . . 3,000,000 2,963,7604.500%, 03/09/48 . . . . . . . . . . . . . . . . . . . . . . . . . . . . 2,100,000 1,836,6395.150%, 11/15/46 (144A) . . . . . . . . . . . . . . . . . . . . . . . 1,308,000 1,251,5865.300%, 08/15/58 (144A) (b) . . . . . . . . . . . . . . . . . . . . 2,500,000 2,374,4507.125%, 12/15/31 (144A) . . . . . . . . . . . . . . . . . . . . . . . 100,000 116,511
British Telecommunications plc9.625%, 12/15/30 . . . . . . . . . . . . . . . . . . . . . . . . . . . . 1,000,000 1,422,970
Cisco Systems, Inc.2.500%, 09/20/26 (b) . . . . . . . . . . . . . . . . . . . . . . . . . 1,200,000 1,109,9165.500%, 01/15/40 . . . . . . . . . . . . . . . . . . . . . . . . . . . . 2,000,000 2,383,640
Deutsche Telekom International Finance B.V.8.750%, 06/15/30 . . . . . . . . . . . . . . . . . . . . . . . . . . . . 1,000,000 1,351,890
Orange S.A.5.500%, 02/06/44 (b) . . . . . . . . . . . . . . . . . . . . . . . . . 2,400,000 2,698,680
Telefonica Emisiones S.A.U.4.103%, 03/08/27 . . . . . . . . . . . . . . . . . . . . . . . . . . . . 1,900,000 1,829,757
BHFTII-173
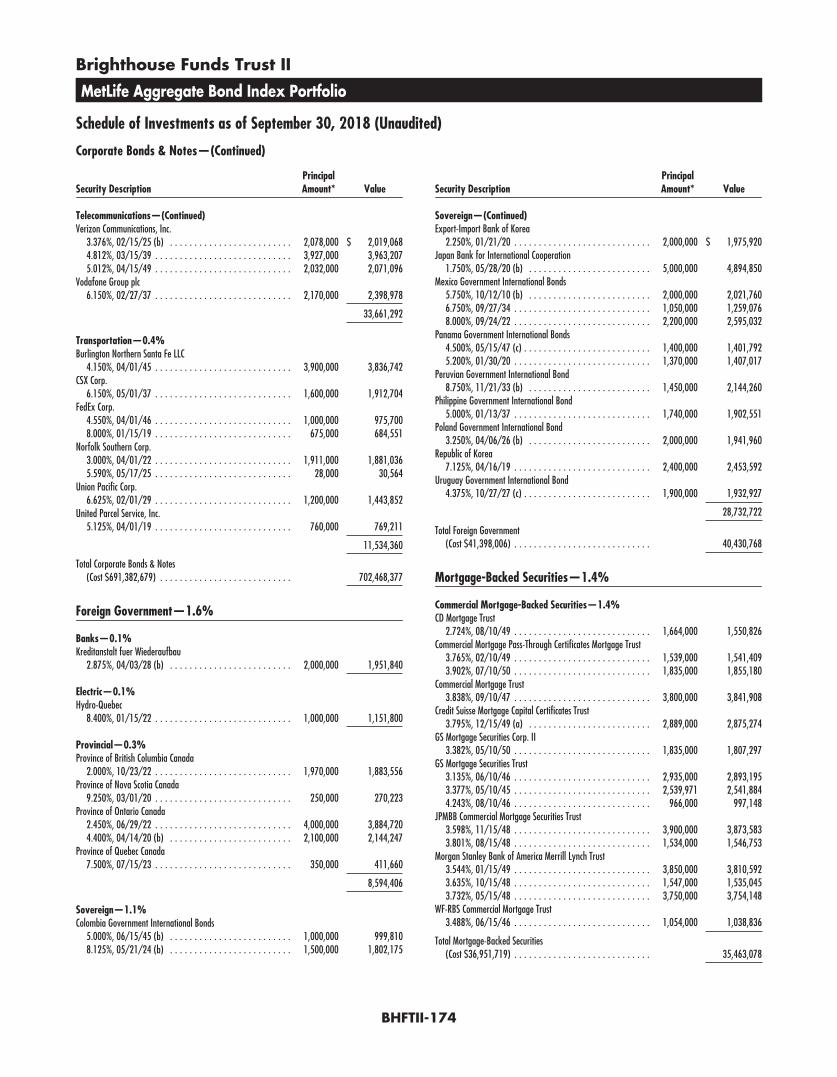
Brighthouse Funds Trust II
MetLife Aggregate Bond Index Portfolio
Schedule of Investments as of September 30, 2018 (Unaudited)
Corporate Bonds & Notes—(Continued)
Security DescriptionPrincipalAmount* Value
Telecommunications—(Continued)Verizon Communications, Inc.
3.376%, 02/15/25 (b) . . . . . . . . . . . . . . . . . . . . . . . . . 2,078,000 $ 2,019,0684.812%, 03/15/39 . . . . . . . . . . . . . . . . . . . . . . . . . . . . 3,927,000 3,963,2075.012%, 04/15/49 . . . . . . . . . . . . . . . . . . . . . . . . . . . . 2,032,000 2,071,096
Vodafone Group plc6.150%, 02/27/37 . . . . . . . . . . . . . . . . . . . . . . . . . . . . 2,170,000 2,398,978
33,661,292
Transportation—0.4%Burlington Northern Santa Fe LLC
4.150%, 04/01/45 . . . . . . . . . . . . . . . . . . . . . . . . . . . . 3,900,000 3,836,742CSX Corp.
6.150%, 05/01/37 . . . . . . . . . . . . . . . . . . . . . . . . . . . . 1,600,000 1,912,704FedEx Corp.
4.550%, 04/01/46 . . . . . . . . . . . . . . . . . . . . . . . . . . . . 1,000,000 975,7008.000%, 01/15/19 . . . . . . . . . . . . . . . . . . . . . . . . . . . . 675,000 684,551
Norfolk Southern Corp.3.000%, 04/01/22 . . . . . . . . . . . . . . . . . . . . . . . . . . . . 1,911,000 1,881,0365.590%, 05/17/25 . . . . . . . . . . . . . . . . . . . . . . . . . . . . 28,000 30,564
Union Pacific Corp.6.625%, 02/01/29 . . . . . . . . . . . . . . . . . . . . . . . . . . . . 1,200,000 1,443,852
United Parcel Service, Inc.5.125%, 04/01/19 . . . . . . . . . . . . . . . . . . . . . . . . . . . . 760,000 769,211
11,534,360
Total Corporate Bonds & Notes(Cost $691,382,679) . . . . . . . . . . . . . . . . . . . . . . . . . . . 702,468,377
Foreign Government—1.6%
Banks—0.1%Kreditanstalt fuer Wiederaufbau
2.875%, 04/03/28 (b) . . . . . . . . . . . . . . . . . . . . . . . . . 2,000,000 1,951,840
Electric—0.1%Hydro-Quebec
8.400%, 01/15/22 . . . . . . . . . . . . . . . . . . . . . . . . . . . . 1,000,000 1,151,800
Provincial—0.3%Province of British Columbia Canada
2.000%, 10/23/22 . . . . . . . . . . . . . . . . . . . . . . . . . . . . 1,970,000 1,883,556Province of Nova Scotia Canada
9.250%, 03/01/20 . . . . . . . . . . . . . . . . . . . . . . . . . . . . 250,000 270,223Province of Ontario Canada
2.450%, 06/29/22 . . . . . . . . . . . . . . . . . . . . . . . . . . . . 4,000,000 3,884,7204.400%, 04/14/20 (b) . . . . . . . . . . . . . . . . . . . . . . . . . 2,100,000 2,144,247
Province of Quebec Canada7.500%, 07/15/23 . . . . . . . . . . . . . . . . . . . . . . . . . . . . 350,000 411,660
8,594,406
Sovereign—1.1%Colombia Government International Bonds
5.000%, 06/15/45 (b) . . . . . . . . . . . . . . . . . . . . . . . . . 1,000,000 999,8108.125%, 05/21/24 (b) . . . . . . . . . . . . . . . . . . . . . . . . . 1,500,000 1,802,175
Security DescriptionPrincipalAmount* Value
Sovereign—(Continued)Export-Import Bank of Korea
2.250%, 01/21/20 . . . . . . . . . . . . . . . . . . . . . . . . . . . . 2,000,000 $ 1,975,920Japan Bank for International Cooperation
1.750%, 05/28/20 (b) . . . . . . . . . . . . . . . . . . . . . . . . . 5,000,000 4,894,850Mexico Government International Bonds
5.750%, 10/12/10 (b) . . . . . . . . . . . . . . . . . . . . . . . . . 2,000,000 2,021,7606.750%, 09/27/34 . . . . . . . . . . . . . . . . . . . . . . . . . . . . 1,050,000 1,259,0768.000%, 09/24/22 . . . . . . . . . . . . . . . . . . . . . . . . . . . . 2,200,000 2,595,032
Panama Government International Bonds4.500%, 05/15/47 (c) . . . . . . . . . . . . . . . . . . . . . . . . . . 1,400,000 1,401,7925.200%, 01/30/20 . . . . . . . . . . . . . . . . . . . . . . . . . . . . 1,370,000 1,407,017
Peruvian Government International Bond8.750%, 11/21/33 (b) . . . . . . . . . . . . . . . . . . . . . . . . . 1,450,000 2,144,260
Philippine Government International Bond5.000%, 01/13/37 . . . . . . . . . . . . . . . . . . . . . . . . . . . . 1,740,000 1,902,551
Poland Government International Bond3.250%, 04/06/26 (b) . . . . . . . . . . . . . . . . . . . . . . . . . 2,000,000 1,941,960
Republic of Korea7.125%, 04/16/19 . . . . . . . . . . . . . . . . . . . . . . . . . . . . 2,400,000 2,453,592
Uruguay Government International Bond4.375%, 10/27/27 (c) . . . . . . . . . . . . . . . . . . . . . . . . . . 1,900,000 1,932,927
28,732,722
Total Foreign Government(Cost $41,398,006) . . . . . . . . . . . . . . . . . . . . . . . . . . . . 40,430,768
Mortgage-Backed Securities—1.4%
Commercial Mortgage-Backed Securities—1.4%CD Mortgage Trust
2.724%, 08/10/49 . . . . . . . . . . . . . . . . . . . . . . . . . . . . 1,664,000 1,550,826Commercial Mortgage Pass-Through Certificates Mortgage Trust
3.765%, 02/10/49 . . . . . . . . . . . . . . . . . . . . . . . . . . . . 1,539,000 1,541,4093.902%, 07/10/50 . . . . . . . . . . . . . . . . . . . . . . . . . . . . 1,835,000 1,855,180
Commercial Mortgage Trust3.838%, 09/10/47 . . . . . . . . . . . . . . . . . . . . . . . . . . . . 3,800,000 3,841,908
Credit Suisse Mortgage Capital Certificates Trust3.795%, 12/15/49 (a) . . . . . . . . . . . . . . . . . . . . . . . . . 2,889,000 2,875,274
GS Mortgage Securities Corp. II3.382%, 05/10/50 . . . . . . . . . . . . . . . . . . . . . . . . . . . . 1,835,000 1,807,297
GS Mortgage Securities Trust3.135%, 06/10/46 . . . . . . . . . . . . . . . . . . . . . . . . . . . . 2,935,000 2,893,1953.377%, 05/10/45 . . . . . . . . . . . . . . . . . . . . . . . . . . . . 2,539,971 2,541,8844.243%, 08/10/46 . . . . . . . . . . . . . . . . . . . . . . . . . . . . 966,000 997,148
JPMBB Commercial Mortgage Securities Trust3.598%, 11/15/48 . . . . . . . . . . . . . . . . . . . . . . . . . . . . 3,900,000 3,873,5833.801%, 08/15/48 . . . . . . . . . . . . . . . . . . . . . . . . . . . . 1,534,000 1,546,753
Morgan Stanley Bank of America Merrill Lynch Trust3.544%, 01/15/49 . . . . . . . . . . . . . . . . . . . . . . . . . . . . 3,850,000 3,810,5923.635%, 10/15/48 . . . . . . . . . . . . . . . . . . . . . . . . . . . . 1,547,000 1,535,0453.732%, 05/15/48 . . . . . . . . . . . . . . . . . . . . . . . . . . . . 3,750,000 3,754,148
WF-RBS Commercial Mortgage Trust3.488%, 06/15/46 . . . . . . . . . . . . . . . . . . . . . . . . . . . . 1,054,000 1,038,836
Total Mortgage-Backed Securities(Cost $36,951,719) . . . . . . . . . . . . . . . . . . . . . . . . . . . . 35,463,078
BHFTII-174
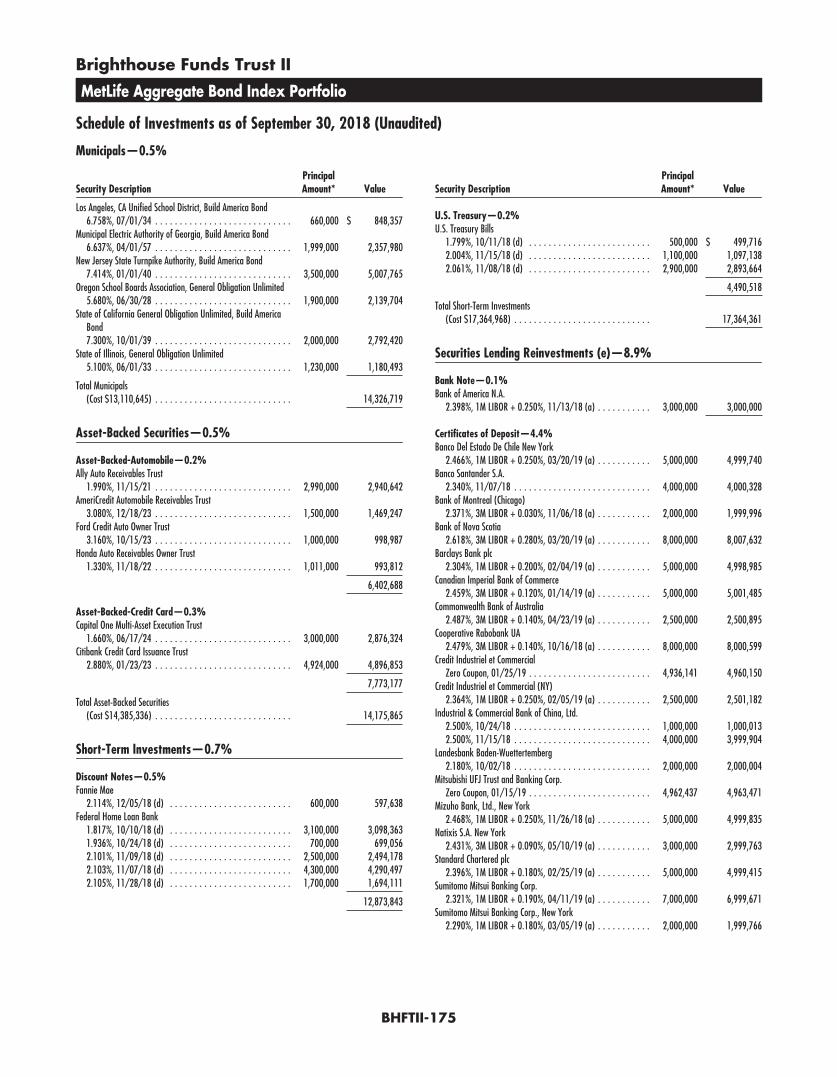
Brighthouse Funds Trust II
MetLife Aggregate Bond Index Portfolio
Schedule of Investments as of September 30, 2018 (Unaudited)
Municipals—0.5%
Security DescriptionPrincipalAmount* Value
Los Angeles, CA Unified School District, Build America Bond6.758%, 07/01/34 . . . . . . . . . . . . . . . . . . . . . . . . . . . . 660,000 $ 848,357
Municipal Electric Authority of Georgia, Build America Bond6.637%, 04/01/57 . . . . . . . . . . . . . . . . . . . . . . . . . . . . 1,999,000 2,357,980
New Jersey State Turnpike Authority, Build America Bond7.414%, 01/01/40 . . . . . . . . . . . . . . . . . . . . . . . . . . . . 3,500,000 5,007,765
Oregon School Boards Association, General Obligation Unlimited5.680%, 06/30/28 . . . . . . . . . . . . . . . . . . . . . . . . . . . . 1,900,000 2,139,704
State of California General Obligation Unlimited, Build AmericaBond7.300%, 10/01/39 . . . . . . . . . . . . . . . . . . . . . . . . . . . . 2,000,000 2,792,420
State of Illinois, General Obligation Unlimited5.100%, 06/01/33 . . . . . . . . . . . . . . . . . . . . . . . . . . . . 1,230,000 1,180,493
Total Municipals(Cost $13,110,645) . . . . . . . . . . . . . . . . . . . . . . . . . . . . 14,326,719
Asset-Backed Securities—0.5%
Asset-Backed-Automobile—0.2%Ally Auto Receivables Trust
1.990%, 11/15/21 . . . . . . . . . . . . . . . . . . . . . . . . . . . . 2,990,000 2,940,642AmeriCredit Automobile Receivables Trust
3.080%, 12/18/23 . . . . . . . . . . . . . . . . . . . . . . . . . . . . 1,500,000 1,469,247Ford Credit Auto Owner Trust
3.160%, 10/15/23 . . . . . . . . . . . . . . . . . . . . . . . . . . . . 1,000,000 998,987Honda Auto Receivables Owner Trust
1.330%, 11/18/22 . . . . . . . . . . . . . . . . . . . . . . . . . . . . 1,011,000 993,812
6,402,688
Asset-Backed-Credit Card—0.3%Capital One Multi-Asset Execution Trust
1.660%, 06/17/24 . . . . . . . . . . . . . . . . . . . . . . . . . . . . 3,000,000 2,876,324Citibank Credit Card Issuance Trust
2.880%, 01/23/23 . . . . . . . . . . . . . . . . . . . . . . . . . . . . 4,924,000 4,896,853
7,773,177
Total Asset-Backed Securities(Cost $14,385,336) . . . . . . . . . . . . . . . . . . . . . . . . . . . . 14,175,865
Short-Term Investments—0.7%
Discount Notes—0.5%Fannie Mae
2.114%, 12/05/18 (d) . . . . . . . . . . . . . . . . . . . . . . . . . 600,000 597,638Federal Home Loan Bank
1.817%, 10/10/18 (d) . . . . . . . . . . . . . . . . . . . . . . . . . 3,100,000 3,098,3631.936%, 10/24/18 (d) . . . . . . . . . . . . . . . . . . . . . . . . . 700,000 699,0562.101%, 11/09/18 (d) . . . . . . . . . . . . . . . . . . . . . . . . . 2,500,000 2,494,1782.103%, 11/07/18 (d) . . . . . . . . . . . . . . . . . . . . . . . . . 4,300,000 4,290,4972.105%, 11/28/18 (d) . . . . . . . . . . . . . . . . . . . . . . . . . 1,700,000 1,694,111
12,873,843
Security DescriptionPrincipalAmount* Value
U.S. Treasury—0.2%U.S. Treasury Bills
1.799%, 10/11/18 (d) . . . . . . . . . . . . . . . . . . . . . . . . . 500,000 $ 499,7162.004%, 11/15/18 (d) . . . . . . . . . . . . . . . . . . . . . . . . . 1,100,000 1,097,1382.061%, 11/08/18 (d) . . . . . . . . . . . . . . . . . . . . . . . . . 2,900,000 2,893,664
4,490,518
Total Short-Term Investments(Cost $17,364,968) . . . . . . . . . . . . . . . . . . . . . . . . . . . . 17,364,361
Securities Lending Reinvestments (e)—8.9%
Bank Note—0.1%Bank of America N.A.
2.398%, 1M LIBOR + 0.250%, 11/13/18 (a) . . . . . . . . . . . 3,000,000 3,000,000
Certificates of Deposit—4.4%Banco Del Estado De Chile New York
2.466%, 1M LIBOR + 0.250%, 03/20/19 (a) . . . . . . . . . . . 5,000,000 4,999,740Banco Santander S.A.
2.340%, 11/07/18 . . . . . . . . . . . . . . . . . . . . . . . . . . . . 4,000,000 4,000,328Bank of Montreal (Chicago)
2.371%, 3M LIBOR + 0.030%, 11/06/18 (a) . . . . . . . . . . . 2,000,000 1,999,996Bank of Nova Scotia
2.618%, 3M LIBOR + 0.280%, 03/20/19 (a) . . . . . . . . . . . 8,000,000 8,007,632Barclays Bank plc
2.304%, 1M LIBOR + 0.200%, 02/04/19 (a) . . . . . . . . . . . 5,000,000 4,998,985Canadian Imperial Bank of Commerce
2.459%, 3M LIBOR + 0.120%, 01/14/19 (a) . . . . . . . . . . . 5,000,000 5,001,485Commonwealth Bank of Australia
2.487%, 3M LIBOR + 0.140%, 04/23/19 (a) . . . . . . . . . . . 2,500,000 2,500,895Cooperative Rabobank UA
2.479%, 3M LIBOR + 0.140%, 10/16/18 (a) . . . . . . . . . . . 8,000,000 8,000,599Credit Industriel et Commercial
Zero Coupon, 01/25/19 . . . . . . . . . . . . . . . . . . . . . . . . . 4,936,141 4,960,150Credit Industriel et Commercial (NY)
2.364%, 1M LIBOR + 0.250%, 02/05/19 (a) . . . . . . . . . . . 2,500,000 2,501,182Industrial & Commercial Bank of China, Ltd.
2.500%, 10/24/18 . . . . . . . . . . . . . . . . . . . . . . . . . . . . 1,000,000 1,000,0132.500%, 11/15/18 . . . . . . . . . . . . . . . . . . . . . . . . . . . . 4,000,000 3,999,904
Landesbank Baden-Wuettertemberg2.180%, 10/02/18 . . . . . . . . . . . . . . . . . . . . . . . . . . . . 2,000,000 2,000,004
Mitsubishi UFJ Trust and Banking Corp.Zero Coupon, 01/15/19 . . . . . . . . . . . . . . . . . . . . . . . . . 4,962,437 4,963,471
Mizuho Bank, Ltd., New York2.468%, 1M LIBOR + 0.250%, 11/26/18 (a) . . . . . . . . . . . 5,000,000 4,999,835
Natixis S.A. New York2.431%, 3M LIBOR + 0.090%, 05/10/19 (a) . . . . . . . . . . . 3,000,000 2,999,763
Standard Chartered plc2.396%, 1M LIBOR + 0.180%, 02/25/19 (a) . . . . . . . . . . . 5,000,000 4,999,415
Sumitomo Mitsui Banking Corp.2.321%, 1M LIBOR + 0.190%, 04/11/19 (a) . . . . . . . . . . . 7,000,000 6,999,671
Sumitomo Mitsui Banking Corp., New York2.290%, 1M LIBOR + 0.180%, 03/05/19 (a) . . . . . . . . . . . 2,000,000 1,999,766
BHFTII-175
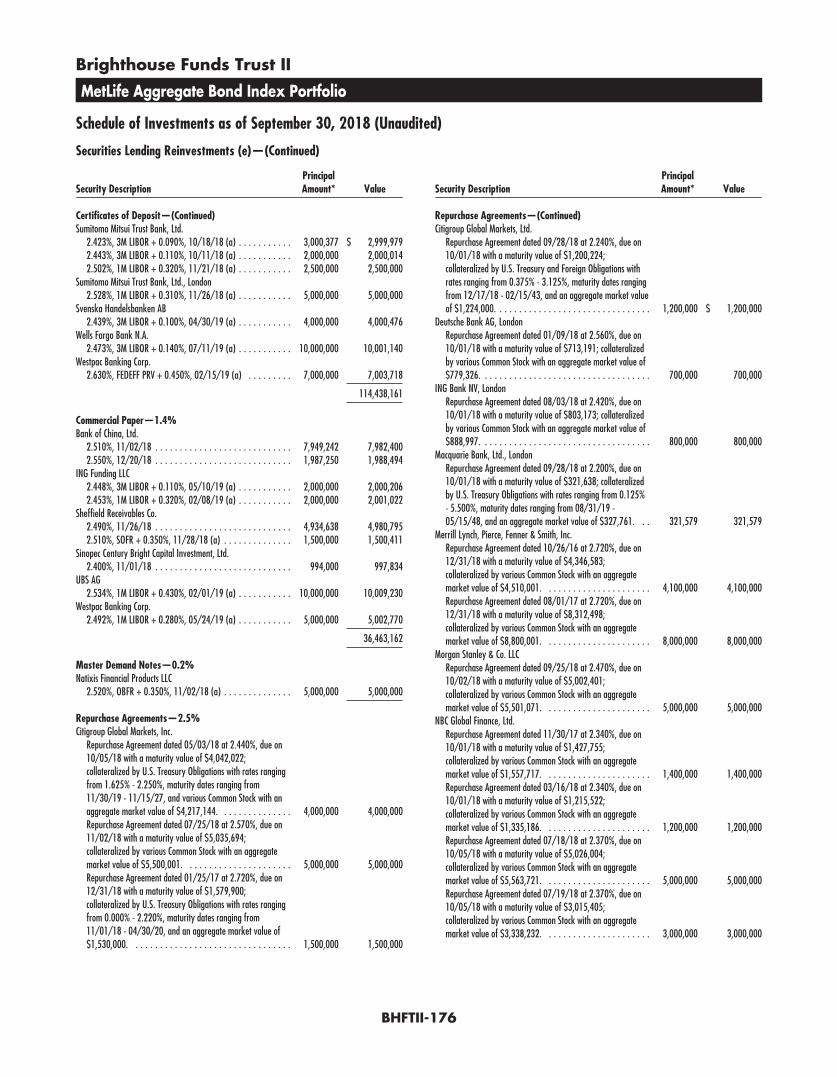
Brighthouse Funds Trust II
MetLife Aggregate Bond Index Portfolio
Schedule of Investments as of September 30, 2018 (Unaudited)
Securities Lending Reinvestments (e)—(Continued)
Security DescriptionPrincipalAmount* Value
Certificates of Deposit—(Continued)Sumitomo Mitsui Trust Bank, Ltd.
2.423%, 3M LIBOR + 0.090%, 10/18/18 (a) . . . . . . . . . . . 3,000,377 $ 2,999,9792.443%, 3M LIBOR + 0.110%, 10/11/18 (a) . . . . . . . . . . . 2,000,000 2,000,0142.502%, 1M LIBOR + 0.320%, 11/21/18 (a) . . . . . . . . . . . 2,500,000 2,500,000
Sumitomo Mitsui Trust Bank, Ltd., London2.528%, 1M LIBOR + 0.310%, 11/26/18 (a) . . . . . . . . . . . 5,000,000 5,000,000
Svenska Handelsbanken AB2.439%, 3M LIBOR + 0.100%, 04/30/19 (a) . . . . . . . . . . . 4,000,000 4,000,476
Wells Fargo Bank N.A.2.473%, 3M LIBOR + 0.140%, 07/11/19 (a) . . . . . . . . . . . 10,000,000 10,001,140
Westpac Banking Corp.2.630%, FEDEFF PRV + 0.450%, 02/15/19 (a) . . . . . . . . . 7,000,000 7,003,718
114,438,161
Commercial Paper—1.4%Bank of China, Ltd.
2.510%, 11/02/18 . . . . . . . . . . . . . . . . . . . . . . . . . . . . 7,949,242 7,982,4002.550%, 12/20/18 . . . . . . . . . . . . . . . . . . . . . . . . . . . . 1,987,250 1,988,494
ING Funding LLC2.448%, 3M LIBOR + 0.110%, 05/10/19 (a) . . . . . . . . . . . 2,000,000 2,000,2062.453%, 1M LIBOR + 0.320%, 02/08/19 (a) . . . . . . . . . . . 2,000,000 2,001,022
Sheffield Receivables Co.2.490%, 11/26/18 . . . . . . . . . . . . . . . . . . . . . . . . . . . . 4,934,638 4,980,7952.510%, SOFR + 0.350%, 11/28/18 (a) . . . . . . . . . . . . . . 1,500,000 1,500,411
Sinopec Century Bright Capital Investment, Ltd.2.400%, 11/01/18 . . . . . . . . . . . . . . . . . . . . . . . . . . . . 994,000 997,834
UBS AG2.534%, 1M LIBOR + 0.430%, 02/01/19 (a) . . . . . . . . . . . 10,000,000 10,009,230
Westpac Banking Corp.2.492%, 1M LIBOR + 0.280%, 05/24/19 (a) . . . . . . . . . . . 5,000,000 5,002,770
36,463,162
Master Demand Notes—0.2%Natixis Financial Products LLC
2.520%, OBFR + 0.350%, 11/02/18 (a) . . . . . . . . . . . . . . 5,000,000 5,000,000
Repurchase Agreements—2.5%Citigroup Global Markets, Inc.
Repurchase Agreement dated 05/03/18 at 2.440%, due on10/05/18 with a maturity value of $4,042,022;collateralized by U.S. Treasury Obligations with rates rangingfrom 1.625% - 2.250%, maturity dates ranging from11/30/19 - 11/15/27, and various Common Stock with anaggregate market value of $4,217,144. . . . . . . . . . . . . . . 4,000,000 4,000,000Repurchase Agreement dated 07/25/18 at 2.570%, due on11/02/18 with a maturity value of $5,035,694;collateralized by various Common Stock with an aggregatemarket value of $5,500,001. . . . . . . . . . . . . . . . . . . . . . 5,000,000 5,000,000Repurchase Agreement dated 01/25/17 at 2.720%, due on12/31/18 with a maturity value of $1,579,900;collateralized by U.S. Treasury Obligations with rates rangingfrom 0.000% - 2.220%, maturity dates ranging from11/01/18 - 04/30/20, and an aggregate market value of$1,530,000. . . . . . . . . . . . . . . . . . . . . . . . . . . . . . . . . 1,500,000 1,500,000
Security DescriptionPrincipalAmount* Value
Repurchase Agreements—(Continued)Citigroup Global Markets, Ltd.
Repurchase Agreement dated 09/28/18 at 2.240%, due on10/01/18 with a maturity value of $1,200,224;collateralized by U.S. Treasury and Foreign Obligations withrates ranging from 0.375% - 3.125%, maturity dates rangingfrom 12/17/18 - 02/15/43, and an aggregate market valueof $1,224,000. . . . . . . . . . . . . . . . . . . . . . . . . . . . . . . . 1,200,000 $ 1,200,000
Deutsche Bank AG, LondonRepurchase Agreement dated 01/09/18 at 2.560%, due on10/01/18 with a maturity value of $713,191; collateralizedby various Common Stock with an aggregate market value of$779,326. . . . . . . . . . . . . . . . . . . . . . . . . . . . . . . . . . . 700,000 700,000
ING Bank NV, LondonRepurchase Agreement dated 08/03/18 at 2.420%, due on10/01/18 with a maturity value of $803,173; collateralizedby various Common Stock with an aggregate market value of$888,997. . . . . . . . . . . . . . . . . . . . . . . . . . . . . . . . . . . 800,000 800,000
Macquarie Bank, Ltd., LondonRepurchase Agreement dated 09/28/18 at 2.200%, due on10/01/18 with a maturity value of $321,638; collateralizedby U.S. Treasury Obligations with rates ranging from 0.125%- 5.500%, maturity dates ranging from 08/31/19 -05/15/48, and an aggregate market value of $327,761. . . 321,579 321,579
Merrill Lynch, Pierce, Fenner & Smith, Inc.Repurchase Agreement dated 10/26/16 at 2.720%, due on12/31/18 with a maturity value of $4,346,583;collateralized by various Common Stock with an aggregatemarket value of $4,510,001. . . . . . . . . . . . . . . . . . . . . . 4,100,000 4,100,000Repurchase Agreement dated 08/01/17 at 2.720%, due on12/31/18 with a maturity value of $8,312,498;collateralized by various Common Stock with an aggregatemarket value of $8,800,001. . . . . . . . . . . . . . . . . . . . . . 8,000,000 8,000,000
Morgan Stanley & Co. LLCRepurchase Agreement dated 09/25/18 at 2.470%, due on10/02/18 with a maturity value of $5,002,401;collateralized by various Common Stock with an aggregatemarket value of $5,501,071. . . . . . . . . . . . . . . . . . . . . . 5,000,000 5,000,000
NBC Global Finance, Ltd.Repurchase Agreement dated 11/30/17 at 2.340%, due on10/01/18 with a maturity value of $1,427,755;collateralized by various Common Stock with an aggregatemarket value of $1,557,717. . . . . . . . . . . . . . . . . . . . . . 1,400,000 1,400,000Repurchase Agreement dated 03/16/18 at 2.340%, due on10/01/18 with a maturity value of $1,215,522;collateralized by various Common Stock with an aggregatemarket value of $1,335,186. . . . . . . . . . . . . . . . . . . . . . 1,200,000 1,200,000Repurchase Agreement dated 07/18/18 at 2.370%, due on10/05/18 with a maturity value of $5,026,004;collateralized by various Common Stock with an aggregatemarket value of $5,563,721. . . . . . . . . . . . . . . . . . . . . . 5,000,000 5,000,000Repurchase Agreement dated 07/19/18 at 2.370%, due on10/05/18 with a maturity value of $3,015,405;collateralized by various Common Stock with an aggregatemarket value of $3,338,232. . . . . . . . . . . . . . . . . . . . . . 3,000,000 3,000,000
BHFTII-176
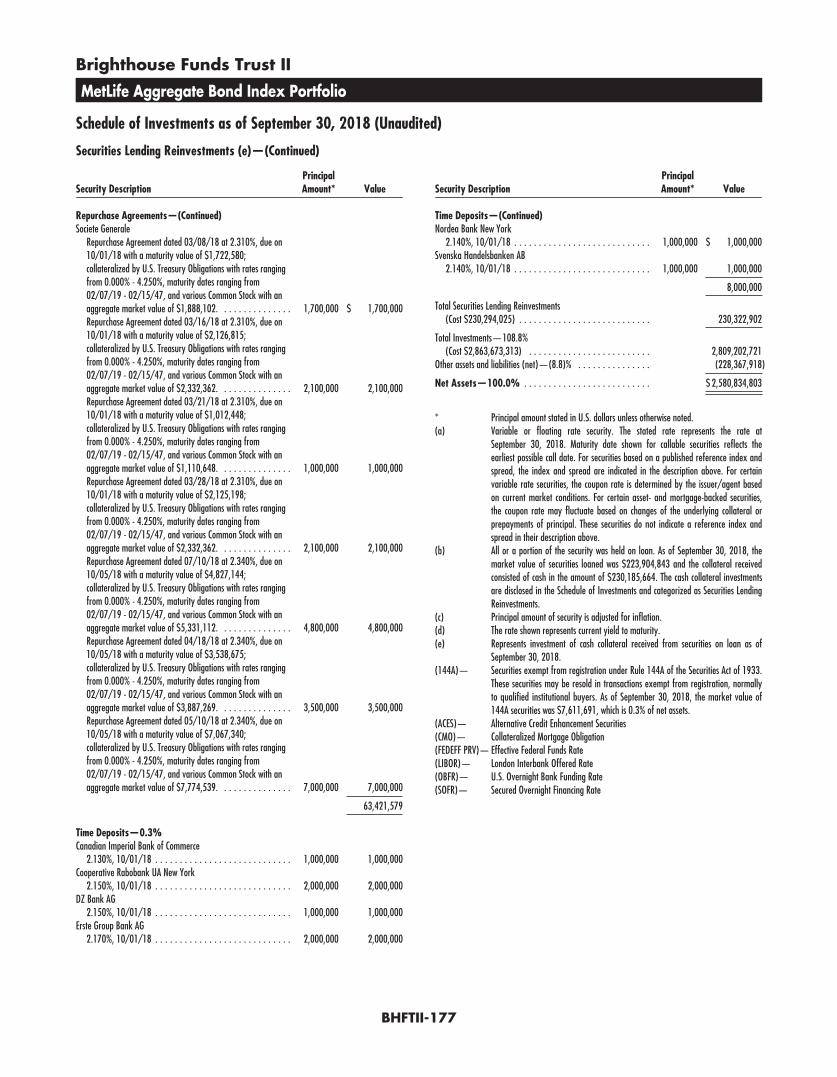
Brighthouse Funds Trust II
MetLife Aggregate Bond Index Portfolio
Schedule of Investments as of September 30, 2018 (Unaudited)
Securities Lending Reinvestments (e)—(Continued)
Security DescriptionPrincipalAmount* Value
Repurchase Agreements—(Continued)Societe Generale
Repurchase Agreement dated 03/08/18 at 2.310%, due on10/01/18 with a maturity value of $1,722,580;collateralized by U.S. Treasury Obligations with rates rangingfrom 0.000% - 4.250%, maturity dates ranging from02/07/19 - 02/15/47, and various Common Stock with anaggregate market value of $1,888,102. . . . . . . . . . . . . . . 1,700,000 $ 1,700,000Repurchase Agreement dated 03/16/18 at 2.310%, due on10/01/18 with a maturity value of $2,126,815;collateralized by U.S. Treasury Obligations with rates rangingfrom 0.000% - 4.250%, maturity dates ranging from02/07/19 - 02/15/47, and various Common Stock with anaggregate market value of $2,332,362. . . . . . . . . . . . . . . 2,100,000 2,100,000Repurchase Agreement dated 03/21/18 at 2.310%, due on10/01/18 with a maturity value of $1,012,448;collateralized by U.S. Treasury Obligations with rates rangingfrom 0.000% - 4.250%, maturity dates ranging from02/07/19 - 02/15/47, and various Common Stock with anaggregate market value of $1,110,648. . . . . . . . . . . . . . . 1,000,000 1,000,000Repurchase Agreement dated 03/28/18 at 2.310%, due on10/01/18 with a maturity value of $2,125,198;collateralized by U.S. Treasury Obligations with rates rangingfrom 0.000% - 4.250%, maturity dates ranging from02/07/19 - 02/15/47, and various Common Stock with anaggregate market value of $2,332,362. . . . . . . . . . . . . . . 2,100,000 2,100,000Repurchase Agreement dated 07/10/18 at 2.340%, due on10/05/18 with a maturity value of $4,827,144;collateralized by U.S. Treasury Obligations with rates rangingfrom 0.000% - 4.250%, maturity dates ranging from02/07/19 - 02/15/47, and various Common Stock with anaggregate market value of $5,331,112. . . . . . . . . . . . . . . 4,800,000 4,800,000Repurchase Agreement dated 04/18/18 at 2.340%, due on10/05/18 with a maturity value of $3,538,675;collateralized by U.S. Treasury Obligations with rates rangingfrom 0.000% - 4.250%, maturity dates ranging from02/07/19 - 02/15/47, and various Common Stock with anaggregate market value of $3,887,269. . . . . . . . . . . . . . . 3,500,000 3,500,000Repurchase Agreement dated 05/10/18 at 2.340%, due on10/05/18 with a maturity value of $7,067,340;collateralized by U.S. Treasury Obligations with rates rangingfrom 0.000% - 4.250%, maturity dates ranging from02/07/19 - 02/15/47, and various Common Stock with anaggregate market value of $7,774,539. . . . . . . . . . . . . . . 7,000,000 7,000,000
63,421,579
Time Deposits—0.3%Canadian Imperial Bank of Commerce
2.130%, 10/01/18 . . . . . . . . . . . . . . . . . . . . . . . . . . . . 1,000,000 1,000,000Cooperative Rabobank UA New York
2.150%, 10/01/18 . . . . . . . . . . . . . . . . . . . . . . . . . . . . 2,000,000 2,000,000DZ Bank AG
2.150%, 10/01/18 . . . . . . . . . . . . . . . . . . . . . . . . . . . . 1,000,000 1,000,000Erste Group Bank AG
2.170%, 10/01/18 . . . . . . . . . . . . . . . . . . . . . . . . . . . . 2,000,000 2,000,000
Security DescriptionPrincipalAmount* Value
Time Deposits—(Continued)Nordea Bank New York
2.140%, 10/01/18 . . . . . . . . . . . . . . . . . . . . . . . . . . . . 1,000,000 $ 1,000,000Svenska Handelsbanken AB
2.140%, 10/01/18 . . . . . . . . . . . . . . . . . . . . . . . . . . . . 1,000,000 1,000,000
8,000,000
Total Securities Lending Reinvestments(Cost $230,294,025) . . . . . . . . . . . . . . . . . . . . . . . . . . . 230,322,902
Total Investments—108.8%(Cost $2,863,673,313) . . . . . . . . . . . . . . . . . . . . . . . . . 2,809,202,721
Other assets and liabilities (net)—(8.8)% . . . . . . . . . . . . . . . (228,367,918)
Net Assets—100.0% . . . . . . . . . . . . . . . . . . . . . . . . . . $ 2,580,834,803
* Principal amount stated in U.S. dollars unless otherwise noted.(a) Variable or floating rate security. The stated rate represents the rate at
September 30, 2018. Maturity date shown for callable securities reflects theearliest possible call date. For securities based on a published reference index andspread, the index and spread are indicated in the description above. For certainvariable rate securities, the coupon rate is determined by the issuer/agent basedon current market conditions. For certain asset- and mortgage-backed securities,the coupon rate may fluctuate based on changes of the underlying collateral orprepayments of principal. These securities do not indicate a reference index andspread in their description above.
(b) All or a portion of the security was held on loan. As of September 30, 2018, themarket value of securities loaned was $223,904,843 and the collateral receivedconsisted of cash in the amount of $230,185,664. The cash collateral investmentsare disclosed in the Schedule of Investments and categorized as Securities LendingReinvestments.
(c) Principal amount of security is adjusted for inflation.(d) The rate shown represents current yield to maturity.(e) Represents investment of cash collateral received from securities on loan as of
September 30, 2018.(144A)— Securities exempt from registration under Rule 144A of the Securities Act of 1933.
These securities may be resold in transactions exempt from registration, normallyto qualified institutional buyers. As of September 30, 2018, the market value of144A securities was $7,611,691, which is 0.3% of net assets.
(ACES)— Alternative Credit Enhancement Securities(CMO)— Collateralized Mortgage Obligation(FEDEFF PRV)— Effective Federal Funds Rate(LIBOR)— London Interbank Offered Rate(OBFR)— U.S. Overnight Bank Funding Rate(SOFR)— Secured Overnight Financing Rate
BHFTII-177
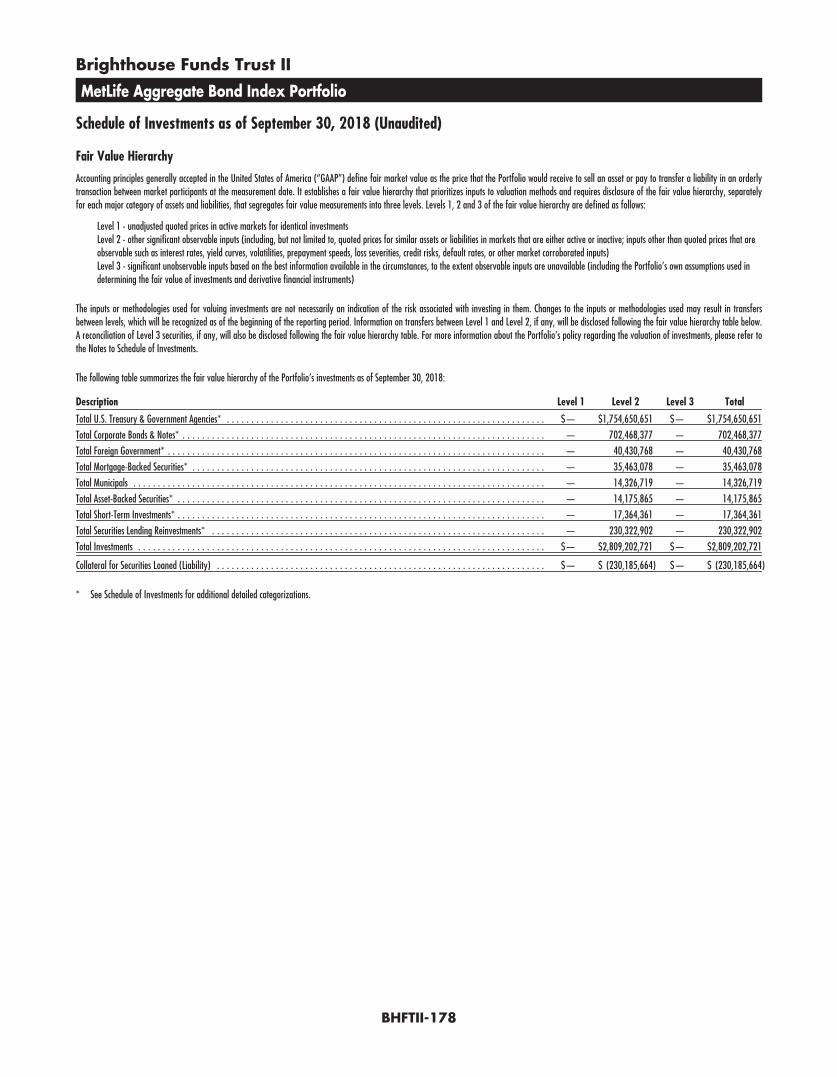
Brighthouse Funds Trust II
MetLife Aggregate Bond Index Portfolio
Schedule of Investments as of September 30, 2018 (Unaudited)
Fair Value Hierarchy
Accounting principles generally accepted in the United States of America (“GAAP”) define fair market value as the price that the Portfolio would receive to sell an asset or pay to transfer a liability in an orderlytransaction between market participants at the measurement date. It establishes a fair value hierarchy that prioritizes inputs to valuation methods and requires disclosure of the fair value hierarchy, separatelyfor each major category of assets and liabilities, that segregates fair value measurements into three levels. Levels 1, 2 and 3 of the fair value hierarchy are defined as follows:
Level 1 - unadjusted quoted prices in active markets for identical investmentsLevel 2 - other significant observable inputs (including, but not limited to, quoted prices for similar assets or liabilities in markets that are either active or inactive; inputs other than quoted prices that areobservable such as interest rates, yield curves, volatilities, prepayment speeds, loss severities, credit risks, default rates, or other market corroborated inputs)Level 3 - significant unobservable inputs based on the best information available in the circumstances, to the extent observable inputs are unavailable (including the Portfolio’s own assumptions used indetermining the fair value of investments and derivative financial instruments)
The inputs or methodologies used for valuing investments are not necessarily an indication of the risk associated with investing in them. Changes to the inputs or methodologies used may result in transfersbetween levels, which will be recognized as of the beginning of the reporting period. Information on transfers between Level 1 and Level 2, if any, will be disclosed following the fair value hierarchy table below.A reconciliation of Level 3 securities, if any, will also be disclosed following the fair value hierarchy table. For more information about the Portfolio’s policy regarding the valuation of investments, please refer tothe Notes to Schedule of Investments.
The following table summarizes the fair value hierarchy of the Portfolio’s investments as of September 30, 2018:
Description Level 1 Level 2 Level 3 Total
Total U.S. Treasury & Government Agencies* . . . . . . . . . . . . . . . . . . . . . . . . . . . . . . . . . . . . . . . . . . . . . . . . . . . . . . . . . . . . . . . . . $— $1,754,650,651 $— $1,754,650,651
Total Corporate Bonds & Notes* . . . . . . . . . . . . . . . . . . . . . . . . . . . . . . . . . . . . . . . . . . . . . . . . . . . . . . . . . . . . . . . . . . . . . . . . . . — 702,468,377 — 702,468,377
Total Foreign Government* . . . . . . . . . . . . . . . . . . . . . . . . . . . . . . . . . . . . . . . . . . . . . . . . . . . . . . . . . . . . . . . . . . . . . . . . . . . . . — 40,430,768 — 40,430,768
Total Mortgage-Backed Securities* . . . . . . . . . . . . . . . . . . . . . . . . . . . . . . . . . . . . . . . . . . . . . . . . . . . . . . . . . . . . . . . . . . . . . . . . — 35,463,078 — 35,463,078
Total Municipals . . . . . . . . . . . . . . . . . . . . . . . . . . . . . . . . . . . . . . . . . . . . . . . . . . . . . . . . . . . . . . . . . . . . . . . . . . . . . . . . . . . . — 14,326,719 — 14,326,719
Total Asset-Backed Securities* . . . . . . . . . . . . . . . . . . . . . . . . . . . . . . . . . . . . . . . . . . . . . . . . . . . . . . . . . . . . . . . . . . . . . . . . . . . — 14,175,865 — 14,175,865
Total Short-Term Investments* . . . . . . . . . . . . . . . . . . . . . . . . . . . . . . . . . . . . . . . . . . . . . . . . . . . . . . . . . . . . . . . . . . . . . . . . . . . — 17,364,361 — 17,364,361
Total Securities Lending Reinvestments* . . . . . . . . . . . . . . . . . . . . . . . . . . . . . . . . . . . . . . . . . . . . . . . . . . . . . . . . . . . . . . . . . . . . — 230,322,902 — 230,322,902
Total Investments . . . . . . . . . . . . . . . . . . . . . . . . . . . . . . . . . . . . . . . . . . . . . . . . . . . . . . . . . . . . . . . . . . . . . . . . . . . . . . . . . . . $— $2,809,202,721 $— $2,809,202,721
Collateral for Securities Loaned (Liability) . . . . . . . . . . . . . . . . . . . . . . . . . . . . . . . . . . . . . . . . . . . . . . . . . . . . . . . . . . . . . . . . . . . $— $ (230,185,664) $— $ (230,185,664)
* See Schedule of Investments for additional detailed categorizations.
BHFTII-178
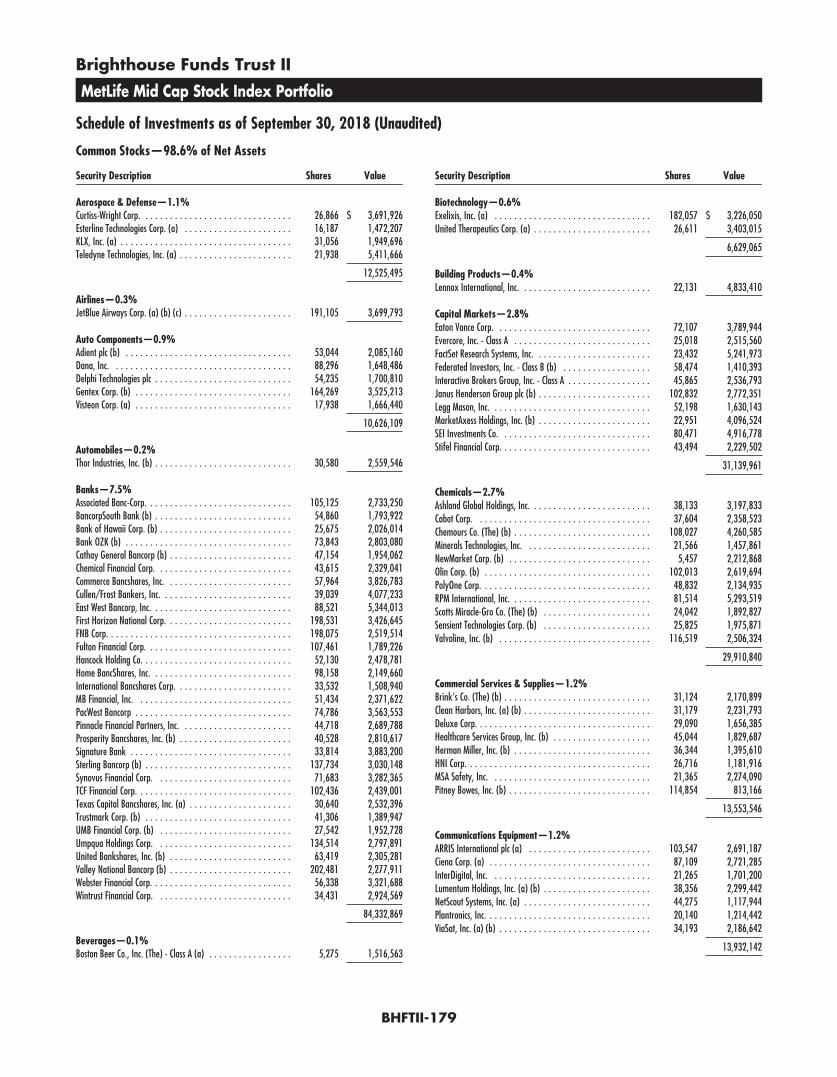
Brighthouse Funds Trust II
MetLife Mid Cap Stock Index Portfolio
Schedule of Investments as of September 30, 2018 (Unaudited)
Common Stocks—98.6% of Net Assets
Security Description Shares Value
Aerospace & Defense—1.1%Curtiss-Wright Corp. . . . . . . . . . . . . . . . . . . . . . . . . . . . . . . 26,866 $ 3,691,926Esterline Technologies Corp. (a) . . . . . . . . . . . . . . . . . . . . . . 16,187 1,472,207KLX, Inc. (a) . . . . . . . . . . . . . . . . . . . . . . . . . . . . . . . . . . . 31,056 1,949,696Teledyne Technologies, Inc. (a) . . . . . . . . . . . . . . . . . . . . . . . 21,938 5,411,666
12,525,495
Airlines—0.3%JetBlue Airways Corp. (a) (b) (c) . . . . . . . . . . . . . . . . . . . . . . 191,105 3,699,793
Auto Components—0.9%Adient plc (b) . . . . . . . . . . . . . . . . . . . . . . . . . . . . . . . . . . 53,044 2,085,160Dana, Inc. . . . . . . . . . . . . . . . . . . . . . . . . . . . . . . . . . . . . 88,296 1,648,486Delphi Technologies plc . . . . . . . . . . . . . . . . . . . . . . . . . . . . 54,235 1,700,810Gentex Corp. (b) . . . . . . . . . . . . . . . . . . . . . . . . . . . . . . . . 164,269 3,525,213Visteon Corp. (a) . . . . . . . . . . . . . . . . . . . . . . . . . . . . . . . . 17,938 1,666,440
10,626,109
Automobiles—0.2%Thor Industries, Inc. (b) . . . . . . . . . . . . . . . . . . . . . . . . . . . . 30,580 2,559,546
Banks—7.5%Associated Banc-Corp. . . . . . . . . . . . . . . . . . . . . . . . . . . . . . 105,125 2,733,250BancorpSouth Bank (b) . . . . . . . . . . . . . . . . . . . . . . . . . . . . 54,860 1,793,922Bank of Hawaii Corp. (b) . . . . . . . . . . . . . . . . . . . . . . . . . . . 25,675 2,026,014Bank OZK (b) . . . . . . . . . . . . . . . . . . . . . . . . . . . . . . . . . . 73,843 2,803,080Cathay General Bancorp (b) . . . . . . . . . . . . . . . . . . . . . . . . . 47,154 1,954,062Chemical Financial Corp. . . . . . . . . . . . . . . . . . . . . . . . . . . . 43,615 2,329,041Commerce Bancshares, Inc. . . . . . . . . . . . . . . . . . . . . . . . . . 57,964 3,826,783Cullen/Frost Bankers, Inc. . . . . . . . . . . . . . . . . . . . . . . . . . . 39,039 4,077,233East West Bancorp, Inc. . . . . . . . . . . . . . . . . . . . . . . . . . . . . 88,521 5,344,013First Horizon National Corp. . . . . . . . . . . . . . . . . . . . . . . . . . 198,531 3,426,645FNB Corp. . . . . . . . . . . . . . . . . . . . . . . . . . . . . . . . . . . . . . 198,075 2,519,514Fulton Financial Corp. . . . . . . . . . . . . . . . . . . . . . . . . . . . . . 107,461 1,789,226Hancock Holding Co. . . . . . . . . . . . . . . . . . . . . . . . . . . . . . . 52,130 2,478,781Home BancShares, Inc. . . . . . . . . . . . . . . . . . . . . . . . . . . . . 98,158 2,149,660International Bancshares Corp. . . . . . . . . . . . . . . . . . . . . . . . 33,532 1,508,940MB Financial, Inc. . . . . . . . . . . . . . . . . . . . . . . . . . . . . . . . 51,434 2,371,622PacWest Bancorp . . . . . . . . . . . . . . . . . . . . . . . . . . . . . . . . 74,786 3,563,553Pinnacle Financial Partners, Inc. . . . . . . . . . . . . . . . . . . . . . . 44,718 2,689,788Prosperity Bancshares, Inc. (b) . . . . . . . . . . . . . . . . . . . . . . . 40,528 2,810,617Signature Bank . . . . . . . . . . . . . . . . . . . . . . . . . . . . . . . . . 33,814 3,883,200Sterling Bancorp (b) . . . . . . . . . . . . . . . . . . . . . . . . . . . . . . 137,734 3,030,148Synovus Financial Corp. . . . . . . . . . . . . . . . . . . . . . . . . . . . 71,683 3,282,365TCF Financial Corp. . . . . . . . . . . . . . . . . . . . . . . . . . . . . . . . 102,436 2,439,001Texas Capital Bancshares, Inc. (a) . . . . . . . . . . . . . . . . . . . . . 30,640 2,532,396Trustmark Corp. (b) . . . . . . . . . . . . . . . . . . . . . . . . . . . . . . 41,306 1,389,947UMB Financial Corp. (b) . . . . . . . . . . . . . . . . . . . . . . . . . . . 27,542 1,952,728Umpqua Holdings Corp. . . . . . . . . . . . . . . . . . . . . . . . . . . . 134,514 2,797,891United Bankshares, Inc. (b) . . . . . . . . . . . . . . . . . . . . . . . . . 63,419 2,305,281Valley National Bancorp (b) . . . . . . . . . . . . . . . . . . . . . . . . . 202,481 2,277,911Webster Financial Corp. . . . . . . . . . . . . . . . . . . . . . . . . . . . . 56,338 3,321,688Wintrust Financial Corp. . . . . . . . . . . . . . . . . . . . . . . . . . . . 34,431 2,924,569
84,332,869
Beverages—0.1%Boston Beer Co., Inc. (The) - Class A (a) . . . . . . . . . . . . . . . . . 5,275 1,516,563
Security Description Shares Value
Biotechnology—0.6%Exelixis, Inc. (a) . . . . . . . . . . . . . . . . . . . . . . . . . . . . . . . . 182,057 $ 3,226,050United Therapeutics Corp. (a) . . . . . . . . . . . . . . . . . . . . . . . . 26,611 3,403,015
6,629,065
Building Products—0.4%Lennox International, Inc. . . . . . . . . . . . . . . . . . . . . . . . . . . 22,131 4,833,410
Capital Markets—2.8%Eaton Vance Corp. . . . . . . . . . . . . . . . . . . . . . . . . . . . . . . . 72,107 3,789,944Evercore, Inc. - Class A . . . . . . . . . . . . . . . . . . . . . . . . . . . . 25,018 2,515,560FactSet Research Systems, Inc. . . . . . . . . . . . . . . . . . . . . . . . 23,432 5,241,973Federated Investors, Inc. - Class B (b) . . . . . . . . . . . . . . . . . . 58,474 1,410,393Interactive Brokers Group, Inc. - Class A . . . . . . . . . . . . . . . . . 45,865 2,536,793Janus Henderson Group plc (b) . . . . . . . . . . . . . . . . . . . . . . . 102,832 2,772,351Legg Mason, Inc. . . . . . . . . . . . . . . . . . . . . . . . . . . . . . . . . 52,198 1,630,143MarketAxess Holdings, Inc. (b) . . . . . . . . . . . . . . . . . . . . . . . 22,951 4,096,524SEI Investments Co. . . . . . . . . . . . . . . . . . . . . . . . . . . . . . . 80,471 4,916,778Stifel Financial Corp. . . . . . . . . . . . . . . . . . . . . . . . . . . . . . . 43,494 2,229,502
31,139,961
Chemicals—2.7%Ashland Global Holdings, Inc. . . . . . . . . . . . . . . . . . . . . . . . . 38,133 3,197,833Cabot Corp. . . . . . . . . . . . . . . . . . . . . . . . . . . . . . . . . . . . 37,604 2,358,523Chemours Co. (The) (b) . . . . . . . . . . . . . . . . . . . . . . . . . . . . 108,027 4,260,585Minerals Technologies, Inc. . . . . . . . . . . . . . . . . . . . . . . . . . 21,566 1,457,861NewMarket Corp. (b) . . . . . . . . . . . . . . . . . . . . . . . . . . . . . 5,457 2,212,868Olin Corp. (b) . . . . . . . . . . . . . . . . . . . . . . . . . . . . . . . . . . 102,013 2,619,694PolyOne Corp. . . . . . . . . . . . . . . . . . . . . . . . . . . . . . . . . . . 48,832 2,134,935RPM International, Inc. . . . . . . . . . . . . . . . . . . . . . . . . . . . . 81,514 5,293,519Scotts Miracle-Gro Co. (The) (b) . . . . . . . . . . . . . . . . . . . . . . 24,042 1,892,827Sensient Technologies Corp. (b) . . . . . . . . . . . . . . . . . . . . . . 25,825 1,975,871Valvoline, Inc. (b) . . . . . . . . . . . . . . . . . . . . . . . . . . . . . . . 116,519 2,506,324
29,910,840
Commercial Services & Supplies—1.2%Brink’s Co. (The) (b) . . . . . . . . . . . . . . . . . . . . . . . . . . . . . . 31,124 2,170,899Clean Harbors, Inc. (a) (b) . . . . . . . . . . . . . . . . . . . . . . . . . . 31,179 2,231,793Deluxe Corp. . . . . . . . . . . . . . . . . . . . . . . . . . . . . . . . . . . . 29,090 1,656,385Healthcare Services Group, Inc. (b) . . . . . . . . . . . . . . . . . . . . 45,044 1,829,687Herman Miller, Inc. (b) . . . . . . . . . . . . . . . . . . . . . . . . . . . . 36,344 1,395,610HNI Corp. . . . . . . . . . . . . . . . . . . . . . . . . . . . . . . . . . . . . . 26,716 1,181,916MSA Safety, Inc. . . . . . . . . . . . . . . . . . . . . . . . . . . . . . . . . 21,365 2,274,090Pitney Bowes, Inc. (b) . . . . . . . . . . . . . . . . . . . . . . . . . . . . . 114,854 813,166
13,553,546
Communications Equipment—1.2%ARRIS International plc (a) . . . . . . . . . . . . . . . . . . . . . . . . . 103,547 2,691,187Ciena Corp. (a) . . . . . . . . . . . . . . . . . . . . . . . . . . . . . . . . . 87,109 2,721,285InterDigital, Inc. . . . . . . . . . . . . . . . . . . . . . . . . . . . . . . . . 21,265 1,701,200Lumentum Holdings, Inc. (a) (b) . . . . . . . . . . . . . . . . . . . . . . 38,356 2,299,442NetScout Systems, Inc. (a) . . . . . . . . . . . . . . . . . . . . . . . . . . 44,275 1,117,944Plantronics, Inc. . . . . . . . . . . . . . . . . . . . . . . . . . . . . . . . . . 20,140 1,214,442ViaSat, Inc. (a) (b) . . . . . . . . . . . . . . . . . . . . . . . . . . . . . . . 34,193 2,186,642
13,932,142
BHFTII-179
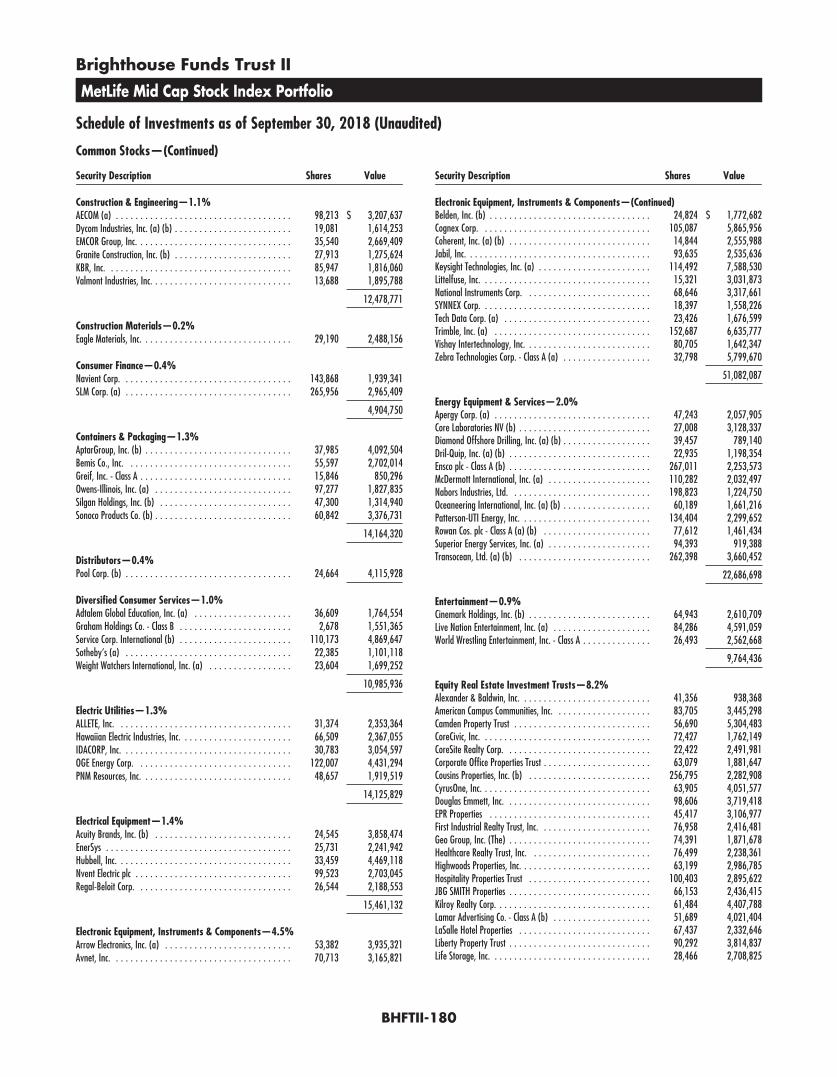
Brighthouse Funds Trust II
MetLife Mid Cap Stock Index Portfolio
Schedule of Investments as of September 30, 2018 (Unaudited)
Common Stocks—(Continued)
Security Description Shares Value
Construction & Engineering—1.1%AECOM (a) . . . . . . . . . . . . . . . . . . . . . . . . . . . . . . . . . . . . 98,213 $ 3,207,637Dycom Industries, Inc. (a) (b) . . . . . . . . . . . . . . . . . . . . . . . . 19,081 1,614,253EMCOR Group, Inc. . . . . . . . . . . . . . . . . . . . . . . . . . . . . . . . 35,540 2,669,409Granite Construction, Inc. (b) . . . . . . . . . . . . . . . . . . . . . . . . 27,913 1,275,624KBR, Inc. . . . . . . . . . . . . . . . . . . . . . . . . . . . . . . . . . . . . . 85,947 1,816,060Valmont Industries, Inc. . . . . . . . . . . . . . . . . . . . . . . . . . . . . 13,688 1,895,788
12,478,771
Construction Materials—0.2%Eagle Materials, Inc. . . . . . . . . . . . . . . . . . . . . . . . . . . . . . . 29,190 2,488,156
Consumer Finance—0.4%Navient Corp. . . . . . . . . . . . . . . . . . . . . . . . . . . . . . . . . . . 143,868 1,939,341SLM Corp. (a) . . . . . . . . . . . . . . . . . . . . . . . . . . . . . . . . . . 265,956 2,965,409
4,904,750
Containers & Packaging—1.3%AptarGroup, Inc. (b) . . . . . . . . . . . . . . . . . . . . . . . . . . . . . . 37,985 4,092,504Bemis Co., Inc. . . . . . . . . . . . . . . . . . . . . . . . . . . . . . . . . . 55,597 2,702,014Greif, Inc. - Class A . . . . . . . . . . . . . . . . . . . . . . . . . . . . . . . 15,846 850,296Owens-Illinois, Inc. (a) . . . . . . . . . . . . . . . . . . . . . . . . . . . . 97,277 1,827,835Silgan Holdings, Inc. (b) . . . . . . . . . . . . . . . . . . . . . . . . . . . 47,300 1,314,940Sonoco Products Co. (b) . . . . . . . . . . . . . . . . . . . . . . . . . . . . 60,842 3,376,731
14,164,320
Distributors—0.4%Pool Corp. (b) . . . . . . . . . . . . . . . . . . . . . . . . . . . . . . . . . . 24,664 4,115,928
Diversified Consumer Services—1.0%Adtalem Global Education, Inc. (a) . . . . . . . . . . . . . . . . . . . . 36,609 1,764,554Graham Holdings Co. - Class B . . . . . . . . . . . . . . . . . . . . . . . 2,678 1,551,365Service Corp. International (b) . . . . . . . . . . . . . . . . . . . . . . . 110,173 4,869,647Sotheby’s (a) . . . . . . . . . . . . . . . . . . . . . . . . . . . . . . . . . . 22,385 1,101,118Weight Watchers International, Inc. (a) . . . . . . . . . . . . . . . . . 23,604 1,699,252
10,985,936
Electric Utilities—1.3%ALLETE, Inc. . . . . . . . . . . . . . . . . . . . . . . . . . . . . . . . . . . . 31,374 2,353,364Hawaiian Electric Industries, Inc. . . . . . . . . . . . . . . . . . . . . . . 66,509 2,367,055IDACORP, Inc. . . . . . . . . . . . . . . . . . . . . . . . . . . . . . . . . . . 30,783 3,054,597OGE Energy Corp. . . . . . . . . . . . . . . . . . . . . . . . . . . . . . . . 122,007 4,431,294PNM Resources, Inc. . . . . . . . . . . . . . . . . . . . . . . . . . . . . . . 48,657 1,919,519
14,125,829
Electrical Equipment—1.4%Acuity Brands, Inc. (b) . . . . . . . . . . . . . . . . . . . . . . . . . . . . 24,545 3,858,474EnerSys . . . . . . . . . . . . . . . . . . . . . . . . . . . . . . . . . . . . . . 25,731 2,241,942Hubbell, Inc. . . . . . . . . . . . . . . . . . . . . . . . . . . . . . . . . . . . 33,459 4,469,118Nvent Electric plc . . . . . . . . . . . . . . . . . . . . . . . . . . . . . . . . 99,523 2,703,045Regal-Beloit Corp. . . . . . . . . . . . . . . . . . . . . . . . . . . . . . . . 26,544 2,188,553
15,461,132
Electronic Equipment, Instruments & Components—4.5%Arrow Electronics, Inc. (a) . . . . . . . . . . . . . . . . . . . . . . . . . . 53,382 3,935,321Avnet, Inc. . . . . . . . . . . . . . . . . . . . . . . . . . . . . . . . . . . . . 70,713 3,165,821
Security Description Shares Value
Electronic Equipment, Instruments & Components—(Continued)Belden, Inc. (b) . . . . . . . . . . . . . . . . . . . . . . . . . . . . . . . . . 24,824 $ 1,772,682Cognex Corp. . . . . . . . . . . . . . . . . . . . . . . . . . . . . . . . . . . 105,087 5,865,956Coherent, Inc. (a) (b) . . . . . . . . . . . . . . . . . . . . . . . . . . . . . 14,844 2,555,988Jabil, Inc. . . . . . . . . . . . . . . . . . . . . . . . . . . . . . . . . . . . . . 93,635 2,535,636Keysight Technologies, Inc. (a) . . . . . . . . . . . . . . . . . . . . . . . 114,492 7,588,530Littelfuse, Inc. . . . . . . . . . . . . . . . . . . . . . . . . . . . . . . . . . . 15,321 3,031,873National Instruments Corp. . . . . . . . . . . . . . . . . . . . . . . . . . 68,646 3,317,661SYNNEX Corp. . . . . . . . . . . . . . . . . . . . . . . . . . . . . . . . . . . 18,397 1,558,226Tech Data Corp. (a) . . . . . . . . . . . . . . . . . . . . . . . . . . . . . . 23,426 1,676,599Trimble, Inc. (a) . . . . . . . . . . . . . . . . . . . . . . . . . . . . . . . . 152,687 6,635,777Vishay Intertechnology, Inc. . . . . . . . . . . . . . . . . . . . . . . . . . 80,705 1,642,347Zebra Technologies Corp. - Class A (a) . . . . . . . . . . . . . . . . . . 32,798 5,799,670
51,082,087
Energy Equipment & Services—2.0%Apergy Corp. (a) . . . . . . . . . . . . . . . . . . . . . . . . . . . . . . . . 47,243 2,057,905Core Laboratories NV (b) . . . . . . . . . . . . . . . . . . . . . . . . . . . 27,008 3,128,337Diamond Offshore Drilling, Inc. (a) (b) . . . . . . . . . . . . . . . . . . 39,457 789,140Dril-Quip, Inc. (a) (b) . . . . . . . . . . . . . . . . . . . . . . . . . . . . . 22,935 1,198,354Ensco plc - Class A (b) . . . . . . . . . . . . . . . . . . . . . . . . . . . . . 267,011 2,253,573McDermott International, Inc. (a) . . . . . . . . . . . . . . . . . . . . . 110,282 2,032,497Nabors Industries, Ltd. . . . . . . . . . . . . . . . . . . . . . . . . . . . . 198,823 1,224,750Oceaneering International, Inc. (a) (b) . . . . . . . . . . . . . . . . . . 60,189 1,661,216Patterson-UTI Energy, Inc. . . . . . . . . . . . . . . . . . . . . . . . . . . 134,404 2,299,652Rowan Cos. plc - Class A (a) (b) . . . . . . . . . . . . . . . . . . . . . . 77,612 1,461,434Superior Energy Services, Inc. (a) . . . . . . . . . . . . . . . . . . . . . 94,393 919,388Transocean, Ltd. (a) (b) . . . . . . . . . . . . . . . . . . . . . . . . . . . 262,398 3,660,452
22,686,698
Entertainment—0.9%Cinemark Holdings, Inc. (b) . . . . . . . . . . . . . . . . . . . . . . . . . 64,943 2,610,709Live Nation Entertainment, Inc. (a) . . . . . . . . . . . . . . . . . . . . 84,286 4,591,059World Wrestling Entertainment, Inc. - Class A . . . . . . . . . . . . . . 26,493 2,562,668
9,764,436
Equity Real Estate Investment Trusts—8.2%Alexander & Baldwin, Inc. . . . . . . . . . . . . . . . . . . . . . . . . . . 41,356 938,368American Campus Communities, Inc. . . . . . . . . . . . . . . . . . . . 83,705 3,445,298Camden Property Trust . . . . . . . . . . . . . . . . . . . . . . . . . . . . 56,690 5,304,483CoreCivic, Inc. . . . . . . . . . . . . . . . . . . . . . . . . . . . . . . . . . . 72,427 1,762,149CoreSite Realty Corp. . . . . . . . . . . . . . . . . . . . . . . . . . . . . . 22,422 2,491,981Corporate Office Properties Trust . . . . . . . . . . . . . . . . . . . . . . 63,079 1,881,647Cousins Properties, Inc. (b) . . . . . . . . . . . . . . . . . . . . . . . . . 256,795 2,282,908CyrusOne, Inc. . . . . . . . . . . . . . . . . . . . . . . . . . . . . . . . . . . 63,905 4,051,577Douglas Emmett, Inc. . . . . . . . . . . . . . . . . . . . . . . . . . . . . . 98,606 3,719,418EPR Properties . . . . . . . . . . . . . . . . . . . . . . . . . . . . . . . . . 45,417 3,106,977First Industrial Realty Trust, Inc. . . . . . . . . . . . . . . . . . . . . . . 76,958 2,416,481Geo Group, Inc. (The) . . . . . . . . . . . . . . . . . . . . . . . . . . . . . 74,391 1,871,678Healthcare Realty Trust, Inc. . . . . . . . . . . . . . . . . . . . . . . . . 76,499 2,238,361Highwoods Properties, Inc. . . . . . . . . . . . . . . . . . . . . . . . . . . 63,199 2,986,785Hospitality Properties Trust . . . . . . . . . . . . . . . . . . . . . . . . . 100,403 2,895,622JBG SMITH Properties . . . . . . . . . . . . . . . . . . . . . . . . . . . . . 66,153 2,436,415Kilroy Realty Corp. . . . . . . . . . . . . . . . . . . . . . . . . . . . . . . . 61,484 4,407,788Lamar Advertising Co. - Class A (b) . . . . . . . . . . . . . . . . . . . . 51,689 4,021,404LaSalle Hotel Properties . . . . . . . . . . . . . . . . . . . . . . . . . . . 67,437 2,332,646Liberty Property Trust . . . . . . . . . . . . . . . . . . . . . . . . . . . . . 90,292 3,814,837Life Storage, Inc. . . . . . . . . . . . . . . . . . . . . . . . . . . . . . . . . 28,466 2,708,825
BHFTII-180
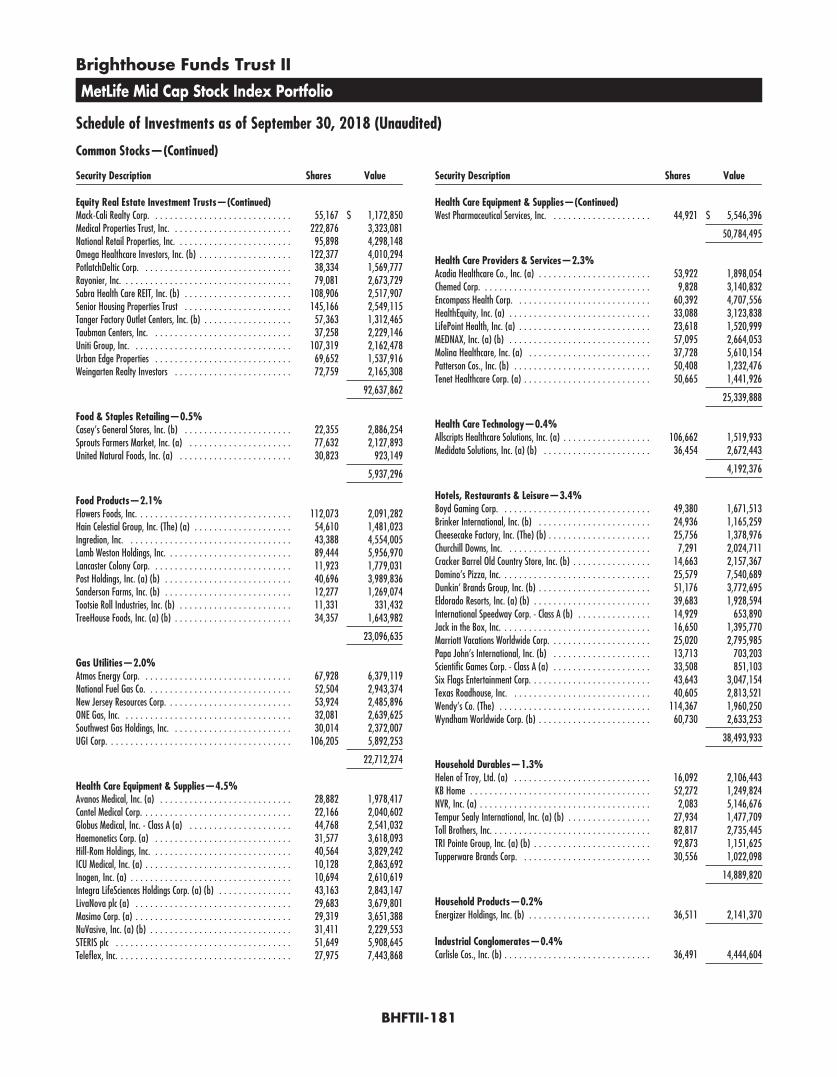
Brighthouse Funds Trust II
MetLife Mid Cap Stock Index Portfolio
Schedule of Investments as of September 30, 2018 (Unaudited)
Common Stocks—(Continued)
Security Description Shares Value
Equity Real Estate Investment Trusts—(Continued)Mack-Cali Realty Corp. . . . . . . . . . . . . . . . . . . . . . . . . . . . . 55,167 $ 1,172,850Medical Properties Trust, Inc. . . . . . . . . . . . . . . . . . . . . . . . . 222,876 3,323,081National Retail Properties, Inc. . . . . . . . . . . . . . . . . . . . . . . . 95,898 4,298,148Omega Healthcare Investors, Inc. (b) . . . . . . . . . . . . . . . . . . . 122,377 4,010,294PotlatchDeltic Corp. . . . . . . . . . . . . . . . . . . . . . . . . . . . . . . 38,334 1,569,777Rayonier, Inc. . . . . . . . . . . . . . . . . . . . . . . . . . . . . . . . . . . 79,081 2,673,729Sabra Health Care REIT, Inc. (b) . . . . . . . . . . . . . . . . . . . . . . 108,906 2,517,907Senior Housing Properties Trust . . . . . . . . . . . . . . . . . . . . . . 145,166 2,549,115Tanger Factory Outlet Centers, Inc. (b) . . . . . . . . . . . . . . . . . . 57,363 1,312,465Taubman Centers, Inc. . . . . . . . . . . . . . . . . . . . . . . . . . . . . 37,258 2,229,146Uniti Group, Inc. . . . . . . . . . . . . . . . . . . . . . . . . . . . . . . . . 107,319 2,162,478Urban Edge Properties . . . . . . . . . . . . . . . . . . . . . . . . . . . . 69,652 1,537,916Weingarten Realty Investors . . . . . . . . . . . . . . . . . . . . . . . . 72,759 2,165,308
92,637,862
Food & Staples Retailing—0.5%Casey’s General Stores, Inc. (b) . . . . . . . . . . . . . . . . . . . . . . 22,355 2,886,254Sprouts Farmers Market, Inc. (a) . . . . . . . . . . . . . . . . . . . . . 77,632 2,127,893United Natural Foods, Inc. (a) . . . . . . . . . . . . . . . . . . . . . . . 30,823 923,149
5,937,296
Food Products—2.1%Flowers Foods, Inc. . . . . . . . . . . . . . . . . . . . . . . . . . . . . . . . 112,073 2,091,282Hain Celestial Group, Inc. (The) (a) . . . . . . . . . . . . . . . . . . . . 54,610 1,481,023Ingredion, Inc. . . . . . . . . . . . . . . . . . . . . . . . . . . . . . . . . . 43,388 4,554,005Lamb Weston Holdings, Inc. . . . . . . . . . . . . . . . . . . . . . . . . . 89,444 5,956,970Lancaster Colony Corp. . . . . . . . . . . . . . . . . . . . . . . . . . . . . 11,923 1,779,031Post Holdings, Inc. (a) (b) . . . . . . . . . . . . . . . . . . . . . . . . . . 40,696 3,989,836Sanderson Farms, Inc. (b) . . . . . . . . . . . . . . . . . . . . . . . . . . 12,277 1,269,074Tootsie Roll Industries, Inc. (b) . . . . . . . . . . . . . . . . . . . . . . . 11,331 331,432TreeHouse Foods, Inc. (a) (b) . . . . . . . . . . . . . . . . . . . . . . . . 34,357 1,643,982
23,096,635
Gas Utilities—2.0%Atmos Energy Corp. . . . . . . . . . . . . . . . . . . . . . . . . . . . . . . 67,928 6,379,119National Fuel Gas Co. . . . . . . . . . . . . . . . . . . . . . . . . . . . . . 52,504 2,943,374New Jersey Resources Corp. . . . . . . . . . . . . . . . . . . . . . . . . . 53,924 2,485,896ONE Gas, Inc. . . . . . . . . . . . . . . . . . . . . . . . . . . . . . . . . . . 32,081 2,639,625Southwest Gas Holdings, Inc. . . . . . . . . . . . . . . . . . . . . . . . . 30,014 2,372,007UGI Corp. . . . . . . . . . . . . . . . . . . . . . . . . . . . . . . . . . . . . . 106,205 5,892,253
22,712,274
Health Care Equipment & Supplies—4.5%Avanos Medical, Inc. (a) . . . . . . . . . . . . . . . . . . . . . . . . . . . 28,882 1,978,417Cantel Medical Corp. . . . . . . . . . . . . . . . . . . . . . . . . . . . . . . 22,166 2,040,602Globus Medical, Inc. - Class A (a) . . . . . . . . . . . . . . . . . . . . . 44,768 2,541,032Haemonetics Corp. (a) . . . . . . . . . . . . . . . . . . . . . . . . . . . . 31,577 3,618,093Hill-Rom Holdings, Inc. . . . . . . . . . . . . . . . . . . . . . . . . . . . . 40,564 3,829,242ICU Medical, Inc. (a) . . . . . . . . . . . . . . . . . . . . . . . . . . . . . . 10,128 2,863,692Inogen, Inc. (a) . . . . . . . . . . . . . . . . . . . . . . . . . . . . . . . . . 10,694 2,610,619Integra LifeSciences Holdings Corp. (a) (b) . . . . . . . . . . . . . . . 43,163 2,843,147LivaNova plc (a) . . . . . . . . . . . . . . . . . . . . . . . . . . . . . . . . 29,683 3,679,801Masimo Corp. (a) . . . . . . . . . . . . . . . . . . . . . . . . . . . . . . . . 29,319 3,651,388NuVasive, Inc. (a) (b) . . . . . . . . . . . . . . . . . . . . . . . . . . . . . 31,411 2,229,553STERIS plc . . . . . . . . . . . . . . . . . . . . . . . . . . . . . . . . . . . . 51,649 5,908,645Teleflex, Inc. . . . . . . . . . . . . . . . . . . . . . . . . . . . . . . . . . . . 27,975 7,443,868
Security Description Shares Value
Health Care Equipment & Supplies—(Continued)West Pharmaceutical Services, Inc. . . . . . . . . . . . . . . . . . . . . 44,921 $ 5,546,396
50,784,495
Health Care Providers & Services—2.3%Acadia Healthcare Co., Inc. (a) . . . . . . . . . . . . . . . . . . . . . . . 53,922 1,898,054Chemed Corp. . . . . . . . . . . . . . . . . . . . . . . . . . . . . . . . . . . 9,828 3,140,832Encompass Health Corp. . . . . . . . . . . . . . . . . . . . . . . . . . . . 60,392 4,707,556HealthEquity, Inc. (a) . . . . . . . . . . . . . . . . . . . . . . . . . . . . . 33,088 3,123,838LifePoint Health, Inc. (a) . . . . . . . . . . . . . . . . . . . . . . . . . . . 23,618 1,520,999MEDNAX, Inc. (a) (b) . . . . . . . . . . . . . . . . . . . . . . . . . . . . . 57,095 2,664,053Molina Healthcare, Inc. (a) . . . . . . . . . . . . . . . . . . . . . . . . . 37,728 5,610,154Patterson Cos., Inc. (b) . . . . . . . . . . . . . . . . . . . . . . . . . . . . 50,408 1,232,476Tenet Healthcare Corp. (a) . . . . . . . . . . . . . . . . . . . . . . . . . . 50,665 1,441,926
25,339,888
Health Care Technology—0.4%Allscripts Healthcare Solutions, Inc. (a) . . . . . . . . . . . . . . . . . . 106,662 1,519,933Medidata Solutions, Inc. (a) (b) . . . . . . . . . . . . . . . . . . . . . . 36,454 2,672,443
4,192,376
Hotels, Restaurants & Leisure—3.4%Boyd Gaming Corp. . . . . . . . . . . . . . . . . . . . . . . . . . . . . . . 49,380 1,671,513Brinker International, Inc. (b) . . . . . . . . . . . . . . . . . . . . . . . 24,936 1,165,259Cheesecake Factory, Inc. (The) (b) . . . . . . . . . . . . . . . . . . . . . 25,756 1,378,976Churchill Downs, Inc. . . . . . . . . . . . . . . . . . . . . . . . . . . . . . 7,291 2,024,711Cracker Barrel Old Country Store, Inc. (b) . . . . . . . . . . . . . . . . 14,663 2,157,367Domino’s Pizza, Inc. . . . . . . . . . . . . . . . . . . . . . . . . . . . . . . 25,579 7,540,689Dunkin’ Brands Group, Inc. (b) . . . . . . . . . . . . . . . . . . . . . . . 51,176 3,772,695Eldorado Resorts, Inc. (a) (b) . . . . . . . . . . . . . . . . . . . . . . . . 39,683 1,928,594International Speedway Corp. - Class A (b) . . . . . . . . . . . . . . . 14,929 653,890Jack in the Box, Inc. . . . . . . . . . . . . . . . . . . . . . . . . . . . . . . 16,650 1,395,770Marriott Vacations Worldwide Corp. . . . . . . . . . . . . . . . . . . . . 25,020 2,795,985Papa John’s International, Inc. (b) . . . . . . . . . . . . . . . . . . . . 13,713 703,203Scientific Games Corp. - Class A (a) . . . . . . . . . . . . . . . . . . . . 33,508 851,103Six Flags Entertainment Corp. . . . . . . . . . . . . . . . . . . . . . . . . 43,643 3,047,154Texas Roadhouse, Inc. . . . . . . . . . . . . . . . . . . . . . . . . . . . . 40,605 2,813,521Wendy’s Co. (The) . . . . . . . . . . . . . . . . . . . . . . . . . . . . . . . 114,367 1,960,250Wyndham Worldwide Corp. (b) . . . . . . . . . . . . . . . . . . . . . . . 60,730 2,633,253
38,493,933
Household Durables—1.3%Helen of Troy, Ltd. (a) . . . . . . . . . . . . . . . . . . . . . . . . . . . . 16,092 2,106,443KB Home . . . . . . . . . . . . . . . . . . . . . . . . . . . . . . . . . . . . . 52,272 1,249,824NVR, Inc. (a) . . . . . . . . . . . . . . . . . . . . . . . . . . . . . . . . . . . 2,083 5,146,676Tempur Sealy International, Inc. (a) (b) . . . . . . . . . . . . . . . . . 27,934 1,477,709Toll Brothers, Inc. . . . . . . . . . . . . . . . . . . . . . . . . . . . . . . . . 82,817 2,735,445TRI Pointe Group, Inc. (a) (b) . . . . . . . . . . . . . . . . . . . . . . . . 92,873 1,151,625Tupperware Brands Corp. . . . . . . . . . . . . . . . . . . . . . . . . . . 30,556 1,022,098
14,889,820
Household Products—0.2%Energizer Holdings, Inc. (b) . . . . . . . . . . . . . . . . . . . . . . . . . 36,511 2,141,370
Industrial Conglomerates—0.4%Carlisle Cos., Inc. (b) . . . . . . . . . . . . . . . . . . . . . . . . . . . . . . 36,491 4,444,604
BHFTII-181
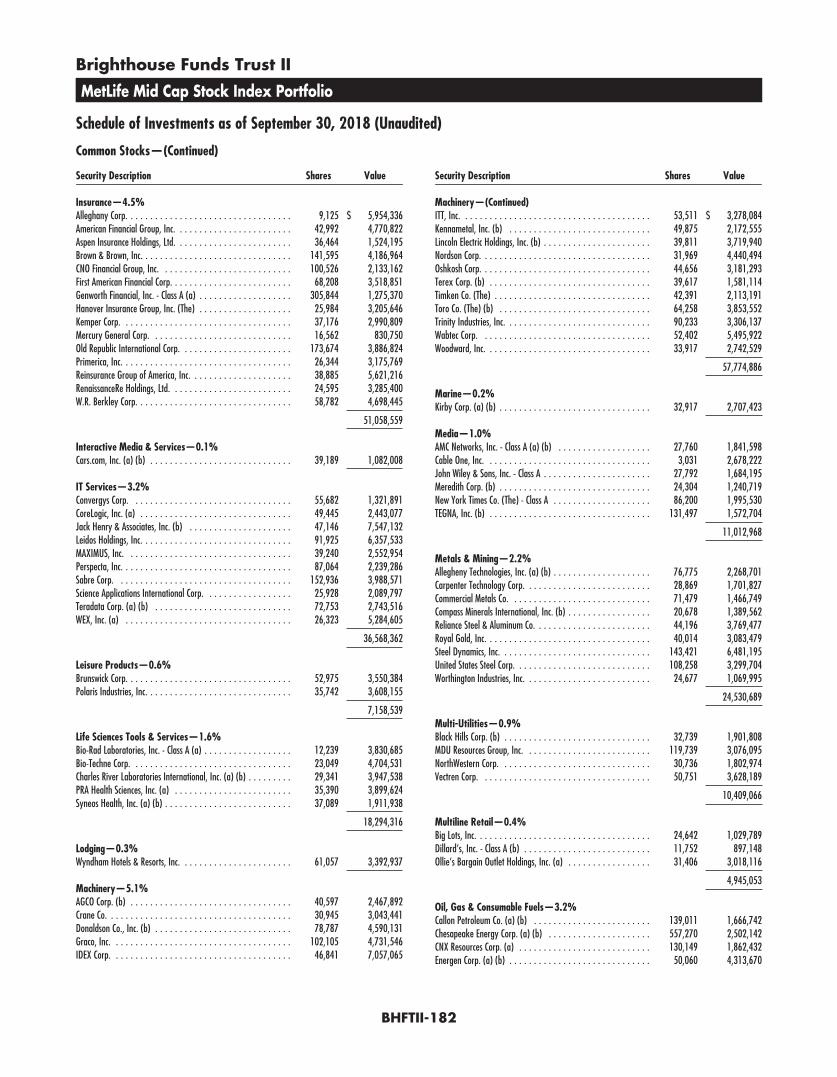
Brighthouse Funds Trust II
MetLife Mid Cap Stock Index Portfolio
Schedule of Investments as of September 30, 2018 (Unaudited)
Common Stocks—(Continued)
Security Description Shares Value
Insurance—4.5%Alleghany Corp. . . . . . . . . . . . . . . . . . . . . . . . . . . . . . . . . . 9,125 $ 5,954,336American Financial Group, Inc. . . . . . . . . . . . . . . . . . . . . . . . 42,992 4,770,822Aspen Insurance Holdings, Ltd. . . . . . . . . . . . . . . . . . . . . . . . 36,464 1,524,195Brown & Brown, Inc. . . . . . . . . . . . . . . . . . . . . . . . . . . . . . . 141,595 4,186,964CNO Financial Group, Inc. . . . . . . . . . . . . . . . . . . . . . . . . . . 100,526 2,133,162First American Financial Corp. . . . . . . . . . . . . . . . . . . . . . . . . 68,208 3,518,851Genworth Financial, Inc. - Class A (a) . . . . . . . . . . . . . . . . . . . 305,844 1,275,370Hanover Insurance Group, Inc. (The) . . . . . . . . . . . . . . . . . . . 25,984 3,205,646Kemper Corp. . . . . . . . . . . . . . . . . . . . . . . . . . . . . . . . . . . 37,176 2,990,809Mercury General Corp. . . . . . . . . . . . . . . . . . . . . . . . . . . . . 16,562 830,750Old Republic International Corp. . . . . . . . . . . . . . . . . . . . . . . 173,674 3,886,824Primerica, Inc. . . . . . . . . . . . . . . . . . . . . . . . . . . . . . . . . . . 26,344 3,175,769Reinsurance Group of America, Inc. . . . . . . . . . . . . . . . . . . . . 38,885 5,621,216RenaissanceRe Holdings, Ltd. . . . . . . . . . . . . . . . . . . . . . . . . 24,595 3,285,400W.R. Berkley Corp. . . . . . . . . . . . . . . . . . . . . . . . . . . . . . . . 58,782 4,698,445
51,058,559
Interactive Media & Services—0.1%Cars.com, Inc. (a) (b) . . . . . . . . . . . . . . . . . . . . . . . . . . . . . 39,189 1,082,008
IT Services—3.2%Convergys Corp. . . . . . . . . . . . . . . . . . . . . . . . . . . . . . . . . 55,682 1,321,891CoreLogic, Inc. (a) . . . . . . . . . . . . . . . . . . . . . . . . . . . . . . . 49,445 2,443,077Jack Henry & Associates, Inc. (b) . . . . . . . . . . . . . . . . . . . . . 47,146 7,547,132Leidos Holdings, Inc. . . . . . . . . . . . . . . . . . . . . . . . . . . . . . . 91,925 6,357,533MAXIMUS, Inc. . . . . . . . . . . . . . . . . . . . . . . . . . . . . . . . . . 39,240 2,552,954Perspecta, Inc. . . . . . . . . . . . . . . . . . . . . . . . . . . . . . . . . . . 87,064 2,239,286Sabre Corp. . . . . . . . . . . . . . . . . . . . . . . . . . . . . . . . . . . . 152,936 3,988,571Science Applications International Corp. . . . . . . . . . . . . . . . . . 25,928 2,089,797Teradata Corp. (a) (b) . . . . . . . . . . . . . . . . . . . . . . . . . . . . 72,753 2,743,516WEX, Inc. (a) . . . . . . . . . . . . . . . . . . . . . . . . . . . . . . . . . . 26,323 5,284,605
36,568,362
Leisure Products—0.6%Brunswick Corp. . . . . . . . . . . . . . . . . . . . . . . . . . . . . . . . . . 52,975 3,550,384Polaris Industries, Inc. . . . . . . . . . . . . . . . . . . . . . . . . . . . . . 35,742 3,608,155
7,158,539
Life Sciences Tools & Services—1.6%Bio-Rad Laboratories, Inc. - Class A (a) . . . . . . . . . . . . . . . . . . 12,239 3,830,685Bio-Techne Corp. . . . . . . . . . . . . . . . . . . . . . . . . . . . . . . . . 23,049 4,704,531Charles River Laboratories International, Inc. (a) (b) . . . . . . . . . 29,341 3,947,538PRA Health Sciences, Inc. (a) . . . . . . . . . . . . . . . . . . . . . . . . 35,390 3,899,624Syneos Health, Inc. (a) (b) . . . . . . . . . . . . . . . . . . . . . . . . . . 37,089 1,911,938
18,294,316
Lodging—0.3%Wyndham Hotels & Resorts, Inc. . . . . . . . . . . . . . . . . . . . . . . 61,057 3,392,937
Machinery—5.1%AGCO Corp. (b) . . . . . . . . . . . . . . . . . . . . . . . . . . . . . . . . . 40,597 2,467,892Crane Co. . . . . . . . . . . . . . . . . . . . . . . . . . . . . . . . . . . . . . 30,945 3,043,441Donaldson Co., Inc. (b) . . . . . . . . . . . . . . . . . . . . . . . . . . . . 78,787 4,590,131Graco, Inc. . . . . . . . . . . . . . . . . . . . . . . . . . . . . . . . . . . . . 102,105 4,731,546IDEX Corp. . . . . . . . . . . . . . . . . . . . . . . . . . . . . . . . . . . . . 46,841 7,057,065
Security Description Shares Value
Machinery—(Continued)ITT, Inc. . . . . . . . . . . . . . . . . . . . . . . . . . . . . . . . . . . . . . . 53,511 $ 3,278,084Kennametal, Inc. (b) . . . . . . . . . . . . . . . . . . . . . . . . . . . . . 49,875 2,172,555Lincoln Electric Holdings, Inc. (b) . . . . . . . . . . . . . . . . . . . . . . 39,811 3,719,940Nordson Corp. . . . . . . . . . . . . . . . . . . . . . . . . . . . . . . . . . . 31,969 4,440,494Oshkosh Corp. . . . . . . . . . . . . . . . . . . . . . . . . . . . . . . . . . . 44,656 3,181,293Terex Corp. (b) . . . . . . . . . . . . . . . . . . . . . . . . . . . . . . . . . 39,617 1,581,114Timken Co. (The) . . . . . . . . . . . . . . . . . . . . . . . . . . . . . . . . 42,391 2,113,191Toro Co. (The) (b) . . . . . . . . . . . . . . . . . . . . . . . . . . . . . . . 64,258 3,853,552Trinity Industries, Inc. . . . . . . . . . . . . . . . . . . . . . . . . . . . . . 90,233 3,306,137Wabtec Corp. . . . . . . . . . . . . . . . . . . . . . . . . . . . . . . . . . . 52,402 5,495,922Woodward, Inc. . . . . . . . . . . . . . . . . . . . . . . . . . . . . . . . . . 33,917 2,742,529
57,774,886
Marine—0.2%Kirby Corp. (a) (b) . . . . . . . . . . . . . . . . . . . . . . . . . . . . . . . 32,917 2,707,423
Media—1.0%AMC Networks, Inc. - Class A (a) (b) . . . . . . . . . . . . . . . . . . . 27,760 1,841,598Cable One, Inc. . . . . . . . . . . . . . . . . . . . . . . . . . . . . . . . . . 3,031 2,678,222John Wiley & Sons, Inc. - Class A . . . . . . . . . . . . . . . . . . . . . . 27,792 1,684,195Meredith Corp. (b) . . . . . . . . . . . . . . . . . . . . . . . . . . . . . . . 24,304 1,240,719New York Times Co. (The) - Class A . . . . . . . . . . . . . . . . . . . . 86,200 1,995,530TEGNA, Inc. (b) . . . . . . . . . . . . . . . . . . . . . . . . . . . . . . . . . 131,497 1,572,704
11,012,968
Metals & Mining—2.2%Allegheny Technologies, Inc. (a) (b) . . . . . . . . . . . . . . . . . . . . 76,775 2,268,701Carpenter Technology Corp. . . . . . . . . . . . . . . . . . . . . . . . . . 28,869 1,701,827Commercial Metals Co. . . . . . . . . . . . . . . . . . . . . . . . . . . . . 71,479 1,466,749Compass Minerals International, Inc. (b) . . . . . . . . . . . . . . . . . 20,678 1,389,562Reliance Steel & Aluminum Co. . . . . . . . . . . . . . . . . . . . . . . . 44,196 3,769,477Royal Gold, Inc. . . . . . . . . . . . . . . . . . . . . . . . . . . . . . . . . . 40,014 3,083,479Steel Dynamics, Inc. . . . . . . . . . . . . . . . . . . . . . . . . . . . . . . 143,421 6,481,195United States Steel Corp. . . . . . . . . . . . . . . . . . . . . . . . . . . . 108,258 3,299,704Worthington Industries, Inc. . . . . . . . . . . . . . . . . . . . . . . . . . 24,677 1,069,995
24,530,689
Multi-Utilities—0.9%Black Hills Corp. (b) . . . . . . . . . . . . . . . . . . . . . . . . . . . . . . 32,739 1,901,808MDU Resources Group, Inc. . . . . . . . . . . . . . . . . . . . . . . . . . 119,739 3,076,095NorthWestern Corp. . . . . . . . . . . . . . . . . . . . . . . . . . . . . . . 30,736 1,802,974Vectren Corp. . . . . . . . . . . . . . . . . . . . . . . . . . . . . . . . . . . 50,751 3,628,189
10,409,066
Multiline Retail—0.4%Big Lots, Inc. . . . . . . . . . . . . . . . . . . . . . . . . . . . . . . . . . . . 24,642 1,029,789Dillard’s, Inc. - Class A (b) . . . . . . . . . . . . . . . . . . . . . . . . . . 11,752 897,148Ollie’s Bargain Outlet Holdings, Inc. (a) . . . . . . . . . . . . . . . . . 31,406 3,018,116
4,945,053
Oil, Gas & Consumable Fuels—3.2%Callon Petroleum Co. (a) (b) . . . . . . . . . . . . . . . . . . . . . . . . 139,011 1,666,742Chesapeake Energy Corp. (a) (b) . . . . . . . . . . . . . . . . . . . . . 557,270 2,502,142CNX Resources Corp. (a) . . . . . . . . . . . . . . . . . . . . . . . . . . . 130,149 1,862,432Energen Corp. (a) (b) . . . . . . . . . . . . . . . . . . . . . . . . . . . . . 50,060 4,313,670
BHFTII-182

Brighthouse Funds Trust II
MetLife Mid Cap Stock Index Portfolio
Schedule of Investments as of September 30, 2018 (Unaudited)
Common Stocks—(Continued)
Security Description Shares Value
Oil, Gas & Consumable Fuels—(Continued)Gulfport Energy Corp. (a) (b) . . . . . . . . . . . . . . . . . . . . . . . . 96,335 $ 1,002,847Matador Resources Co. (a) (b) . . . . . . . . . . . . . . . . . . . . . . . 63,263 2,090,842Murphy Oil Corp. (b) . . . . . . . . . . . . . . . . . . . . . . . . . . . . . 99,364 3,312,796Oasis Petroleum, Inc. (a) (b) . . . . . . . . . . . . . . . . . . . . . . . . 163,170 2,313,751PBF Energy, Inc. - Class A . . . . . . . . . . . . . . . . . . . . . . . . . . 73,209 3,653,861QEP Resources, Inc. (a) (b) . . . . . . . . . . . . . . . . . . . . . . . . . 144,758 1,638,661Range Resources Corp. . . . . . . . . . . . . . . . . . . . . . . . . . . . . 126,476 2,148,827SM Energy Co. . . . . . . . . . . . . . . . . . . . . . . . . . . . . . . . . . . 63,020 1,987,021Southwestern Energy Co. (a) (b) . . . . . . . . . . . . . . . . . . . . . . 358,147 1,830,131World Fuel Services Corp. . . . . . . . . . . . . . . . . . . . . . . . . . . 41,504 1,148,831WPX Energy, Inc. (a) . . . . . . . . . . . . . . . . . . . . . . . . . . . . . 241,175 4,852,441
36,324,995
Paper & Forest Products—0.4%Domtar Corp. . . . . . . . . . . . . . . . . . . . . . . . . . . . . . . . . . . 38,420 2,004,371Louisiana-Pacific Corp. . . . . . . . . . . . . . . . . . . . . . . . . . . . . 87,179 2,309,372
4,313,743
Personal Products—0.4%Edgewell Personal Care Co. (a) (b) . . . . . . . . . . . . . . . . . . . . 33,010 1,526,052Nu Skin Enterprises, Inc. - Class A . . . . . . . . . . . . . . . . . . . . . 33,921 2,795,769
4,321,821
Pharmaceuticals—0.7%Akorn, Inc. (a) . . . . . . . . . . . . . . . . . . . . . . . . . . . . . . . . . 57,474 746,012Catalent, Inc. (a) . . . . . . . . . . . . . . . . . . . . . . . . . . . . . . . . 88,497 4,031,038Mallinckrodt plc (a) (b) . . . . . . . . . . . . . . . . . . . . . . . . . . . . 50,828 1,489,769Prestige Brands Holdings, Inc. (a) (b) . . . . . . . . . . . . . . . . . . 31,602 1,197,400
7,464,219
Professional Services—0.6%Dun & Bradstreet Corp. (The) . . . . . . . . . . . . . . . . . . . . . . . . 22,679 3,231,984ManpowerGroup, Inc. . . . . . . . . . . . . . . . . . . . . . . . . . . . . . 39,642 3,407,627
6,639,611
Real Estate Management & Development—0.5%Jones Lang LaSalle, Inc. . . . . . . . . . . . . . . . . . . . . . . . . . . . 27,817 4,014,549Realogy Holdings Corp. (b) . . . . . . . . . . . . . . . . . . . . . . . . . 75,759 1,563,666
5,578,215
Road & Rail—1.8%Avis Budget Group, Inc. (a) . . . . . . . . . . . . . . . . . . . . . . . . . 40,636 1,306,041Genesee & Wyoming, Inc. - Class A (a) . . . . . . . . . . . . . . . . . . 36,305 3,303,392Knight-Swift Transportation Holdings, Inc. (b) . . . . . . . . . . . . . 78,335 2,700,991Landstar System, Inc. . . . . . . . . . . . . . . . . . . . . . . . . . . . . . 25,102 3,062,444Old Dominion Freight Line, Inc. . . . . . . . . . . . . . . . . . . . . . . . 40,071 6,461,849Ryder System, Inc. . . . . . . . . . . . . . . . . . . . . . . . . . . . . . . . 32,433 2,369,879Werner Enterprises, Inc. (b) . . . . . . . . . . . . . . . . . . . . . . . . . 27,131 959,081
20,163,677
Semiconductors & Semiconductor Equipment—2.5%Cirrus Logic, Inc. (a) . . . . . . . . . . . . . . . . . . . . . . . . . . . . . . 37,275 1,438,815Cree, Inc. (a) (b) . . . . . . . . . . . . . . . . . . . . . . . . . . . . . . . . 62,179 2,354,719Cypress Semiconductor Corp. (b) . . . . . . . . . . . . . . . . . . . . . . 220,849 3,200,102
Security Description Shares Value
Semiconductors & Semiconductor Equipment—(Continued)First Solar, Inc. (a) . . . . . . . . . . . . . . . . . . . . . . . . . . . . . . . 46,093 $ 2,231,823Integrated Device Technology, Inc. (a) . . . . . . . . . . . . . . . . . . 79,013 3,714,401MKS Instruments, Inc. . . . . . . . . . . . . . . . . . . . . . . . . . . . . . 33,470 2,682,620Monolithic Power Systems, Inc. . . . . . . . . . . . . . . . . . . . . . . . 23,772 2,984,099Silicon Laboratories, Inc. (a) . . . . . . . . . . . . . . . . . . . . . . . . . 26,481 2,430,956Synaptics, Inc. (a) (b) . . . . . . . . . . . . . . . . . . . . . . . . . . . . . 21,601 985,438Teradyne, Inc. . . . . . . . . . . . . . . . . . . . . . . . . . . . . . . . . . . 113,887 4,211,541Versum Materials, Inc. . . . . . . . . . . . . . . . . . . . . . . . . . . . . 66,552 2,396,538
28,631,052
Software—4.6%ACI Worldwide, Inc. (a) . . . . . . . . . . . . . . . . . . . . . . . . . . . . 70,713 1,989,864Blackbaud, Inc. . . . . . . . . . . . . . . . . . . . . . . . . . . . . . . . . . 29,678 3,011,723CDK Global, Inc. . . . . . . . . . . . . . . . . . . . . . . . . . . . . . . . . 79,070 4,946,619CommVault Systems, Inc. (a) . . . . . . . . . . . . . . . . . . . . . . . . 23,467 1,642,690Fair Isaac Corp. (a) . . . . . . . . . . . . . . . . . . . . . . . . . . . . . . 17,803 4,068,876Fortinet, Inc. (a) (b) . . . . . . . . . . . . . . . . . . . . . . . . . . . . . . 87,821 8,103,244j2 Global, Inc. (b) . . . . . . . . . . . . . . . . . . . . . . . . . . . . . . . 28,576 2,367,522LiveRamp Holdings, Inc. (a) . . . . . . . . . . . . . . . . . . . . . . . . . 47,324 2,338,279LogMeIn, Inc. . . . . . . . . . . . . . . . . . . . . . . . . . . . . . . . . . . 31,685 2,823,133Manhattan Associates, Inc. (a) (b) . . . . . . . . . . . . . . . . . . . . . 40,170 2,193,282PTC, Inc. (a) (b) . . . . . . . . . . . . . . . . . . . . . . . . . . . . . . . . . 64,780 6,878,988Tyler Technologies, Inc. (a) . . . . . . . . . . . . . . . . . . . . . . . . . 23,611 5,786,112Ultimate Software Group, Inc. (The) (a) . . . . . . . . . . . . . . . . . 19,059 6,140,619
52,290,951
Specialty Retail—2.2%Aaron’s, Inc. . . . . . . . . . . . . . . . . . . . . . . . . . . . . . . . . . . . 42,256 2,301,262American Eagle Outfitters, Inc. . . . . . . . . . . . . . . . . . . . . . . . 102,928 2,555,702AutoNation, Inc. (a) (b) . . . . . . . . . . . . . . . . . . . . . . . . . . . . 35,132 1,459,735Bed Bath & Beyond, Inc. (b) . . . . . . . . . . . . . . . . . . . . . . . . 85,600 1,284,000Dick’s Sporting Goods, Inc. (b) . . . . . . . . . . . . . . . . . . . . . . . 46,747 1,658,584Five Below, Inc. (a) . . . . . . . . . . . . . . . . . . . . . . . . . . . . . . 34,041 4,427,372Michaels Cos., Inc. (The) (a) (b) . . . . . . . . . . . . . . . . . . . . . . 59,668 968,412Murphy USA, Inc. (a) . . . . . . . . . . . . . . . . . . . . . . . . . . . . . 18,279 1,562,123Sally Beauty Holdings, Inc. (a) (b) . . . . . . . . . . . . . . . . . . . . . 73,389 1,349,624Signet Jewelers, Ltd. . . . . . . . . . . . . . . . . . . . . . . . . . . . . . . 31,710 2,090,640Urban Outfitters, Inc. (a) (b) . . . . . . . . . . . . . . . . . . . . . . . . 46,587 1,905,408Williams-Sonoma, Inc. (b) . . . . . . . . . . . . . . . . . . . . . . . . . . 49,208 3,233,950
24,796,812
Technology Hardware, Storage & Peripherals—0.2%NCR Corp. (a) . . . . . . . . . . . . . . . . . . . . . . . . . . . . . . . . . . 72,020 2,046,088
Textiles, Apparel & Luxury Goods—0.7%Carter’s, Inc. (b) . . . . . . . . . . . . . . . . . . . . . . . . . . . . . . . . 28,387 2,798,958Deckers Outdoor Corp. (a) . . . . . . . . . . . . . . . . . . . . . . . . . . 18,371 2,178,433Skechers USA, Inc. - Class A (a) (b) . . . . . . . . . . . . . . . . . . . . 82,525 2,304,924
7,282,315
Thrifts & Mortgage Finance—0.5%LendingTree, Inc. (a) (b) . . . . . . . . . . . . . . . . . . . . . . . . . . . 4,541 1,044,884New York Community Bancorp, Inc. . . . . . . . . . . . . . . . . . . . . 299,541 3,106,240Washington Federal, Inc. (b) . . . . . . . . . . . . . . . . . . . . . . . . 51,029 1,632,928
5,784,052
BHFTII-183
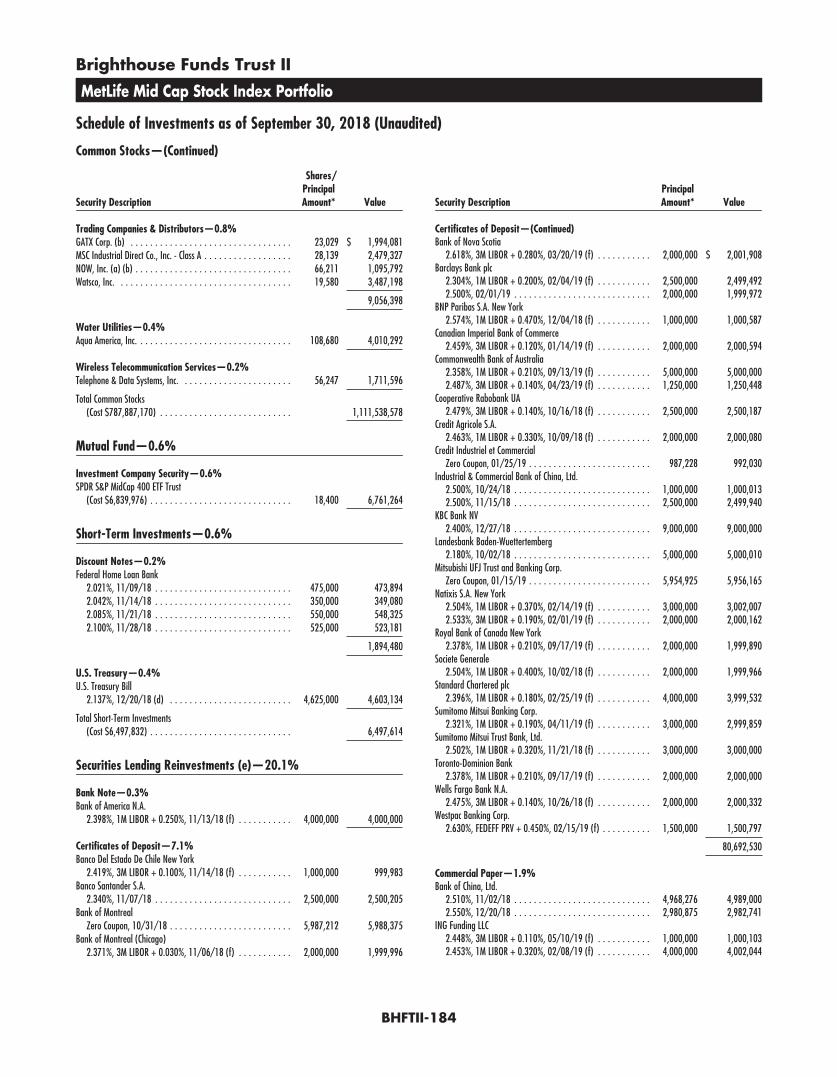
Brighthouse Funds Trust II
MetLife Mid Cap Stock Index Portfolio
Schedule of Investments as of September 30, 2018 (Unaudited)
Common Stocks—(Continued)
Security Description
Shares/PrincipalAmount* Value
Trading Companies & Distributors—0.8%GATX Corp. (b) . . . . . . . . . . . . . . . . . . . . . . . . . . . . . . . . . 23,029 $ 1,994,081MSC Industrial Direct Co., Inc. - Class A . . . . . . . . . . . . . . . . . . 28,139 2,479,327NOW, Inc. (a) (b) . . . . . . . . . . . . . . . . . . . . . . . . . . . . . . . . 66,211 1,095,792Watsco, Inc. . . . . . . . . . . . . . . . . . . . . . . . . . . . . . . . . . . . 19,580 3,487,198
9,056,398
Water Utilities—0.4%Aqua America, Inc. . . . . . . . . . . . . . . . . . . . . . . . . . . . . . . . 108,680 4,010,292
Wireless Telecommunication Services—0.2%Telephone & Data Systems, Inc. . . . . . . . . . . . . . . . . . . . . . . 56,247 1,711,596
Total Common Stocks(Cost $787,887,170) . . . . . . . . . . . . . . . . . . . . . . . . . . . 1,111,538,578
Mutual Fund—0.6%
Investment Company Security—0.6%SPDR S&P MidCap 400 ETF Trust
(Cost $6,839,976) . . . . . . . . . . . . . . . . . . . . . . . . . . . . . 18,400 6,761,264
Short-Term Investments—0.6%
Discount Notes—0.2%Federal Home Loan Bank
2.021%, 11/09/18 . . . . . . . . . . . . . . . . . . . . . . . . . . . . 475,000 473,8942.042%, 11/14/18 . . . . . . . . . . . . . . . . . . . . . . . . . . . . 350,000 349,0802.085%, 11/21/18 . . . . . . . . . . . . . . . . . . . . . . . . . . . . 550,000 548,3252.100%, 11/28/18 . . . . . . . . . . . . . . . . . . . . . . . . . . . . 525,000 523,181
1,894,480
U.S. Treasury—0.4%U.S. Treasury Bill
2.137%, 12/20/18 (d) . . . . . . . . . . . . . . . . . . . . . . . . . 4,625,000 4,603,134
Total Short-Term Investments(Cost $6,497,832) . . . . . . . . . . . . . . . . . . . . . . . . . . . . . 6,497,614
Securities Lending Reinvestments (e)—20.1%
Bank Note—0.3%Bank of America N.A.
2.398%, 1M LIBOR + 0.250%, 11/13/18 (f) . . . . . . . . . . . 4,000,000 4,000,000
Certificates of Deposit—7.1%Banco Del Estado De Chile New York
2.419%, 3M LIBOR + 0.100%, 11/14/18 (f) . . . . . . . . . . . 1,000,000 999,983Banco Santander S.A.
2.340%, 11/07/18 . . . . . . . . . . . . . . . . . . . . . . . . . . . . 2,500,000 2,500,205Bank of Montreal
Zero Coupon, 10/31/18 . . . . . . . . . . . . . . . . . . . . . . . . . 5,987,212 5,988,375Bank of Montreal (Chicago)
2.371%, 3M LIBOR + 0.030%, 11/06/18 (f) . . . . . . . . . . . 2,000,000 1,999,996
Security DescriptionPrincipalAmount* Value
Certificates of Deposit—(Continued)Bank of Nova Scotia
2.618%, 3M LIBOR + 0.280%, 03/20/19 (f) . . . . . . . . . . . 2,000,000 $ 2,001,908Barclays Bank plc
2.304%, 1M LIBOR + 0.200%, 02/04/19 (f) . . . . . . . . . . . 2,500,000 2,499,4922.500%, 02/01/19 . . . . . . . . . . . . . . . . . . . . . . . . . . . . 2,000,000 1,999,972
BNP Paribas S.A. New York2.574%, 1M LIBOR + 0.470%, 12/04/18 (f) . . . . . . . . . . . 1,000,000 1,000,587
Canadian Imperial Bank of Commerce2.459%, 3M LIBOR + 0.120%, 01/14/19 (f) . . . . . . . . . . . 2,000,000 2,000,594
Commonwealth Bank of Australia2.358%, 1M LIBOR + 0.210%, 09/13/19 (f) . . . . . . . . . . . 5,000,000 5,000,0002.487%, 3M LIBOR + 0.140%, 04/23/19 (f) . . . . . . . . . . . 1,250,000 1,250,448
Cooperative Rabobank UA2.479%, 3M LIBOR + 0.140%, 10/16/18 (f) . . . . . . . . . . . 2,500,000 2,500,187
Credit Agricole S.A.2.463%, 1M LIBOR + 0.330%, 10/09/18 (f) . . . . . . . . . . . 2,000,000 2,000,080
Credit Industriel et CommercialZero Coupon, 01/25/19 . . . . . . . . . . . . . . . . . . . . . . . . . 987,228 992,030
Industrial & Commercial Bank of China, Ltd.2.500%, 10/24/18 . . . . . . . . . . . . . . . . . . . . . . . . . . . . 1,000,000 1,000,0132.500%, 11/15/18 . . . . . . . . . . . . . . . . . . . . . . . . . . . . 2,500,000 2,499,940
KBC Bank NV2.400%, 12/27/18 . . . . . . . . . . . . . . . . . . . . . . . . . . . . 9,000,000 9,000,000
Landesbank Baden-Wuettertemberg2.180%, 10/02/18 . . . . . . . . . . . . . . . . . . . . . . . . . . . . 5,000,000 5,000,010
Mitsubishi UFJ Trust and Banking Corp.Zero Coupon, 01/15/19 . . . . . . . . . . . . . . . . . . . . . . . . . 5,954,925 5,956,165
Natixis S.A. New York2.504%, 1M LIBOR + 0.370%, 02/14/19 (f) . . . . . . . . . . . 3,000,000 3,002,0072.533%, 3M LIBOR + 0.190%, 02/01/19 (f) . . . . . . . . . . . 2,000,000 2,000,162
Royal Bank of Canada New York2.378%, 1M LIBOR + 0.210%, 09/17/19 (f) . . . . . . . . . . . 2,000,000 1,999,890
Societe Generale2.504%, 1M LIBOR + 0.400%, 10/02/18 (f) . . . . . . . . . . . 2,000,000 1,999,966
Standard Chartered plc2.396%, 1M LIBOR + 0.180%, 02/25/19 (f) . . . . . . . . . . . 4,000,000 3,999,532
Sumitomo Mitsui Banking Corp.2.321%, 1M LIBOR + 0.190%, 04/11/19 (f) . . . . . . . . . . . 3,000,000 2,999,859
Sumitomo Mitsui Trust Bank, Ltd.2.502%, 1M LIBOR + 0.320%, 11/21/18 (f) . . . . . . . . . . . 3,000,000 3,000,000
Toronto-Dominion Bank2.378%, 1M LIBOR + 0.210%, 09/17/19 (f) . . . . . . . . . . . 2,000,000 2,000,000
Wells Fargo Bank N.A.2.475%, 3M LIBOR + 0.140%, 10/26/18 (f) . . . . . . . . . . . 2,000,000 2,000,332
Westpac Banking Corp.2.630%, FEDEFF PRV + 0.450%, 02/15/19 (f) . . . . . . . . . . 1,500,000 1,500,797
80,692,530
Commercial Paper—1.9%Bank of China, Ltd.
2.510%, 11/02/18 . . . . . . . . . . . . . . . . . . . . . . . . . . . . 4,968,276 4,989,0002.550%, 12/20/18 . . . . . . . . . . . . . . . . . . . . . . . . . . . . 2,980,875 2,982,741
ING Funding LLC2.448%, 3M LIBOR + 0.110%, 05/10/19 (f) . . . . . . . . . . . 1,000,000 1,000,1032.453%, 1M LIBOR + 0.320%, 02/08/19 (f) . . . . . . . . . . . 4,000,000 4,002,044
BHFTII-184
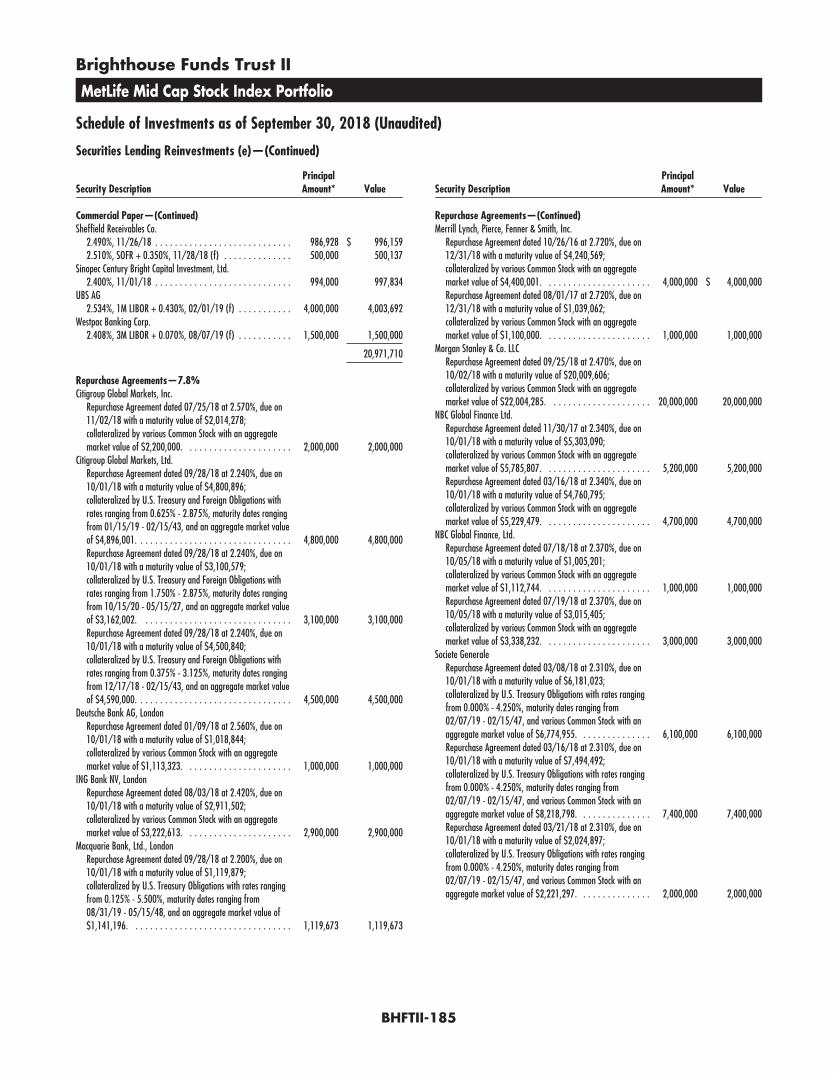
Brighthouse Funds Trust II
MetLife Mid Cap Stock Index Portfolio
Schedule of Investments as of September 30, 2018 (Unaudited)
Securities Lending Reinvestments (e)—(Continued)
Security DescriptionPrincipalAmount* Value
Commercial Paper—(Continued)Sheffield Receivables Co.
2.490%, 11/26/18 . . . . . . . . . . . . . . . . . . . . . . . . . . . . 986,928 $ 996,1592.510%, SOFR + 0.350%, 11/28/18 (f) . . . . . . . . . . . . . . 500,000 500,137
Sinopec Century Bright Capital Investment, Ltd.2.400%, 11/01/18 . . . . . . . . . . . . . . . . . . . . . . . . . . . . 994,000 997,834
UBS AG2.534%, 1M LIBOR + 0.430%, 02/01/19 (f) . . . . . . . . . . . 4,000,000 4,003,692
Westpac Banking Corp.2.408%, 3M LIBOR + 0.070%, 08/07/19 (f) . . . . . . . . . . . 1,500,000 1,500,000
20,971,710
Repurchase Agreements—7.8%Citigroup Global Markets, Inc.
Repurchase Agreement dated 07/25/18 at 2.570%, due on11/02/18 with a maturity value of $2,014,278;collateralized by various Common Stock with an aggregatemarket value of $2,200,000. . . . . . . . . . . . . . . . . . . . . . 2,000,000 2,000,000
Citigroup Global Markets, Ltd.Repurchase Agreement dated 09/28/18 at 2.240%, due on10/01/18 with a maturity value of $4,800,896;collateralized by U.S. Treasury and Foreign Obligations withrates ranging from 0.625% - 2.875%, maturity dates rangingfrom 01/15/19 - 02/15/43, and an aggregate market valueof $4,896,001. . . . . . . . . . . . . . . . . . . . . . . . . . . . . . . . 4,800,000 4,800,000Repurchase Agreement dated 09/28/18 at 2.240%, due on10/01/18 with a maturity value of $3,100,579;collateralized by U.S. Treasury and Foreign Obligations withrates ranging from 1.750% - 2.875%, maturity dates rangingfrom 10/15/20 - 05/15/27, and an aggregate market valueof $3,162,002. . . . . . . . . . . . . . . . . . . . . . . . . . . . . . . 3,100,000 3,100,000Repurchase Agreement dated 09/28/18 at 2.240%, due on10/01/18 with a maturity value of $4,500,840;collateralized by U.S. Treasury and Foreign Obligations withrates ranging from 0.375% - 3.125%, maturity dates rangingfrom 12/17/18 - 02/15/43, and an aggregate market valueof $4,590,000. . . . . . . . . . . . . . . . . . . . . . . . . . . . . . . . 4,500,000 4,500,000
Deutsche Bank AG, LondonRepurchase Agreement dated 01/09/18 at 2.560%, due on10/01/18 with a maturity value of $1,018,844;collateralized by various Common Stock with an aggregatemarket value of $1,113,323. . . . . . . . . . . . . . . . . . . . . . 1,000,000 1,000,000
ING Bank NV, LondonRepurchase Agreement dated 08/03/18 at 2.420%, due on10/01/18 with a maturity value of $2,911,502;collateralized by various Common Stock with an aggregatemarket value of $3,222,613. . . . . . . . . . . . . . . . . . . . . . 2,900,000 2,900,000
Macquarie Bank, Ltd., LondonRepurchase Agreement dated 09/28/18 at 2.200%, due on10/01/18 with a maturity value of $1,119,879;collateralized by U.S. Treasury Obligations with rates rangingfrom 0.125% - 5.500%, maturity dates ranging from08/31/19 - 05/15/48, and an aggregate market value of$1,141,196. . . . . . . . . . . . . . . . . . . . . . . . . . . . . . . . . 1,119,673 1,119,673
Security DescriptionPrincipalAmount* Value
Repurchase Agreements—(Continued)Merrill Lynch, Pierce, Fenner & Smith, Inc.
Repurchase Agreement dated 10/26/16 at 2.720%, due on12/31/18 with a maturity value of $4,240,569;collateralized by various Common Stock with an aggregatemarket value of $4,400,001. . . . . . . . . . . . . . . . . . . . . . 4,000,000 $ 4,000,000Repurchase Agreement dated 08/01/17 at 2.720%, due on12/31/18 with a maturity value of $1,039,062;collateralized by various Common Stock with an aggregatemarket value of $1,100,000. . . . . . . . . . . . . . . . . . . . . . 1,000,000 1,000,000
Morgan Stanley & Co. LLCRepurchase Agreement dated 09/25/18 at 2.470%, due on10/02/18 with a maturity value of $20,009,606;collateralized by various Common Stock with an aggregatemarket value of $22,004,285. . . . . . . . . . . . . . . . . . . . . 20,000,000 20,000,000
NBC Global Finance Ltd.Repurchase Agreement dated 11/30/17 at 2.340%, due on10/01/18 with a maturity value of $5,303,090;collateralized by various Common Stock with an aggregatemarket value of $5,785,807. . . . . . . . . . . . . . . . . . . . . . 5,200,000 5,200,000Repurchase Agreement dated 03/16/18 at 2.340%, due on10/01/18 with a maturity value of $4,760,795;collateralized by various Common Stock with an aggregatemarket value of $5,229,479. . . . . . . . . . . . . . . . . . . . . . 4,700,000 4,700,000
NBC Global Finance, Ltd.Repurchase Agreement dated 07/18/18 at 2.370%, due on10/05/18 with a maturity value of $1,005,201;collateralized by various Common Stock with an aggregatemarket value of $1,112,744. . . . . . . . . . . . . . . . . . . . . . 1,000,000 1,000,000Repurchase Agreement dated 07/19/18 at 2.370%, due on10/05/18 with a maturity value of $3,015,405;collateralized by various Common Stock with an aggregatemarket value of $3,338,232. . . . . . . . . . . . . . . . . . . . . . 3,000,000 3,000,000
Societe GeneraleRepurchase Agreement dated 03/08/18 at 2.310%, due on10/01/18 with a maturity value of $6,181,023;collateralized by U.S. Treasury Obligations with rates rangingfrom 0.000% - 4.250%, maturity dates ranging from02/07/19 - 02/15/47, and various Common Stock with anaggregate market value of $6,774,955. . . . . . . . . . . . . . . 6,100,000 6,100,000Repurchase Agreement dated 03/16/18 at 2.310%, due on10/01/18 with a maturity value of $7,494,492;collateralized by U.S. Treasury Obligations with rates rangingfrom 0.000% - 4.250%, maturity dates ranging from02/07/19 - 02/15/47, and various Common Stock with anaggregate market value of $8,218,798. . . . . . . . . . . . . . . 7,400,000 7,400,000Repurchase Agreement dated 03/21/18 at 2.310%, due on10/01/18 with a maturity value of $2,024,897;collateralized by U.S. Treasury Obligations with rates rangingfrom 0.000% - 4.250%, maturity dates ranging from02/07/19 - 02/15/47, and various Common Stock with anaggregate market value of $2,221,297. . . . . . . . . . . . . . . 2,000,000 2,000,000
BHFTII-185
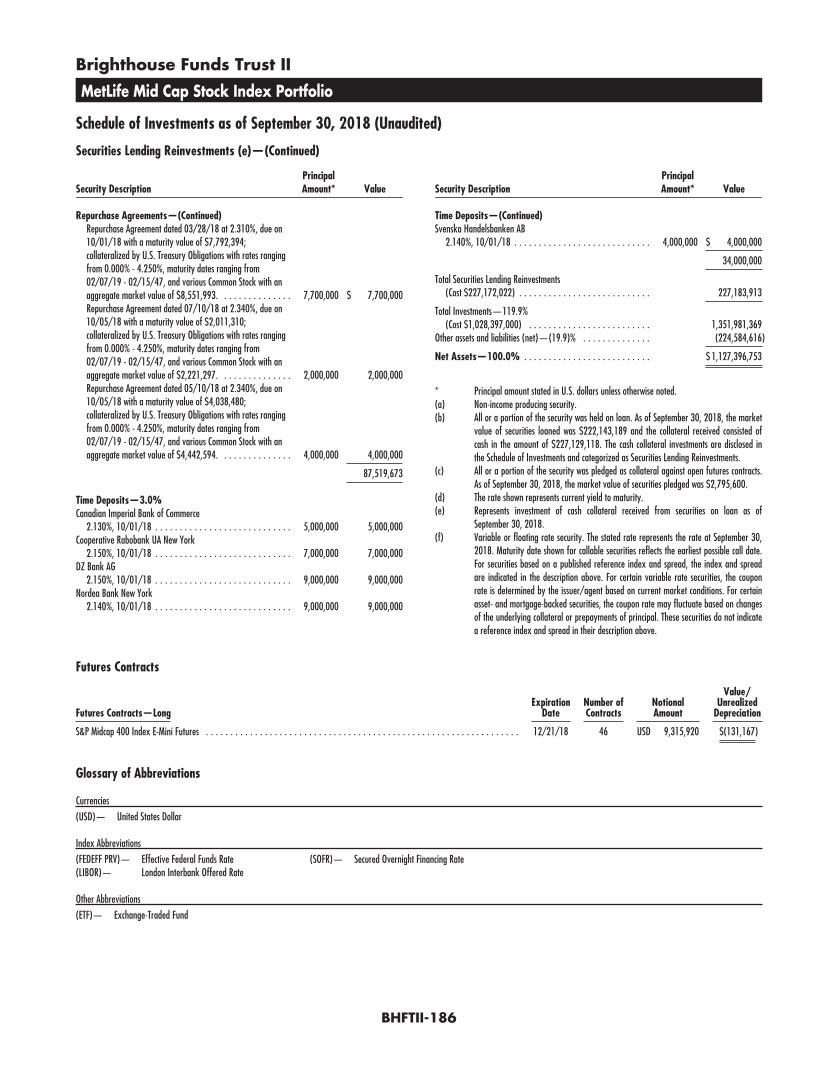
Brighthouse Funds Trust II
MetLife Mid Cap Stock Index Portfolio
Schedule of Investments as of September 30, 2018 (Unaudited)
Securities Lending Reinvestments (e)—(Continued)
Security DescriptionPrincipalAmount* Value
Repurchase Agreements—(Continued)Repurchase Agreement dated 03/28/18 at 2.310%, due on10/01/18 with a maturity value of $7,792,394;collateralized by U.S. Treasury Obligations with rates rangingfrom 0.000% - 4.250%, maturity dates ranging from02/07/19 - 02/15/47, and various Common Stock with anaggregate market value of $8,551,993. . . . . . . . . . . . . . . 7,700,000 $ 7,700,000Repurchase Agreement dated 07/10/18 at 2.340%, due on10/05/18 with a maturity value of $2,011,310;collateralized by U.S. Treasury Obligations with rates rangingfrom 0.000% - 4.250%, maturity dates ranging from02/07/19 - 02/15/47, and various Common Stock with anaggregate market value of $2,221,297. . . . . . . . . . . . . . . 2,000,000 2,000,000Repurchase Agreement dated 05/10/18 at 2.340%, due on10/05/18 with a maturity value of $4,038,480;collateralized by U.S. Treasury Obligations with rates rangingfrom 0.000% - 4.250%, maturity dates ranging from02/07/19 - 02/15/47, and various Common Stock with anaggregate market value of $4,442,594. . . . . . . . . . . . . . . 4,000,000 4,000,000
87,519,673
Time Deposits—3.0%Canadian Imperial Bank of Commerce
2.130%, 10/01/18 . . . . . . . . . . . . . . . . . . . . . . . . . . . . 5,000,000 5,000,000Cooperative Rabobank UA New York
2.150%, 10/01/18 . . . . . . . . . . . . . . . . . . . . . . . . . . . . 7,000,000 7,000,000DZ Bank AG
2.150%, 10/01/18 . . . . . . . . . . . . . . . . . . . . . . . . . . . . 9,000,000 9,000,000Nordea Bank New York
2.140%, 10/01/18 . . . . . . . . . . . . . . . . . . . . . . . . . . . . 9,000,000 9,000,000
Security DescriptionPrincipalAmount* Value
Time Deposits—(Continued)Svenska Handelsbanken AB
2.140%, 10/01/18 . . . . . . . . . . . . . . . . . . . . . . . . . . . . 4,000,000 $ 4,000,000
34,000,000
Total Securities Lending Reinvestments(Cost $227,172,022) . . . . . . . . . . . . . . . . . . . . . . . . . . . 227,183,913
Total Investments—119.9%(Cost $1,028,397,000) . . . . . . . . . . . . . . . . . . . . . . . . . 1,351,981,369
Other assets and liabilities (net)—(19.9)% . . . . . . . . . . . . . . (224,584,616)
Net Assets—100.0% . . . . . . . . . . . . . . . . . . . . . . . . . . $ 1,127,396,753
* Principal amount stated in U.S. dollars unless otherwise noted.(a) Non-income producing security.(b) All or a portion of the security was held on loan. As of September 30, 2018, the market
value of securities loaned was $222,143,189 and the collateral received consisted ofcash in the amount of $227,129,118. The cash collateral investments are disclosed inthe Schedule of Investments and categorized as Securities Lending Reinvestments.
(c) All or a portion of the security was pledged as collateral against open futures contracts.As of September 30, 2018, the market value of securities pledged was $2,795,600.
(d) The rate shown represents current yield to maturity.(e) Represents investment of cash collateral received from securities on loan as of
September 30, 2018.(f) Variable or floating rate security. The stated rate represents the rate at September 30,
2018. Maturity date shown for callable securities reflects the earliest possible call date.For securities based on a published reference index and spread, the index and spreadare indicated in the description above. For certain variable rate securities, the couponrate is determined by the issuer/agent based on current market conditions. For certainasset- and mortgage-backed securities, the coupon rate may fluctuate based on changesof the underlying collateral or prepayments of principal. These securities do not indicatea reference index and spread in their description above.
Futures Contracts
Futures Contracts—LongExpiration
DateNumber ofContracts
NotionalAmount
Value/Unrealized
Depreciation
S&P Midcap 400 Index E-Mini Futures . . . . . . . . . . . . . . . . . . . . . . . . . . . . . . . . . . . . . . . . . . . . . . . . . . . . . . . . . . . . . . . . 12/21/18 46 USD 9,315,920 $(131,167)
Glossary of Abbreviations
Currencies
(USD)— United States Dollar
Index Abbreviations
(FEDEFF PRV)— Effective Federal Funds Rate(LIBOR)— London Interbank Offered Rate
(SOFR)— Secured Overnight Financing Rate
Other Abbreviations
(ETF)— Exchange-Traded Fund
BHFTII-186
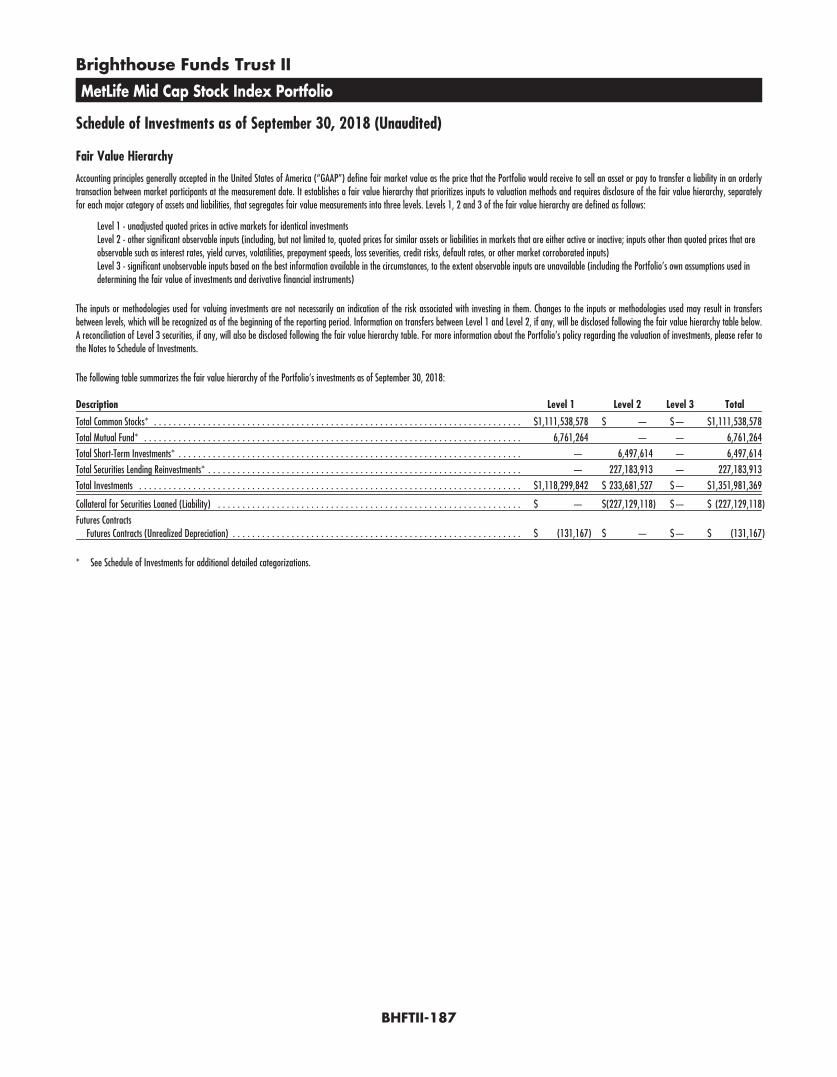
Brighthouse Funds Trust II
MetLife Mid Cap Stock Index Portfolio
Schedule of Investments as of September 30, 2018 (Unaudited)
Fair Value Hierarchy
Accounting principles generally accepted in the United States of America (“GAAP”) define fair market value as the price that the Portfolio would receive to sell an asset or pay to transfer a liability in an orderlytransaction between market participants at the measurement date. It establishes a fair value hierarchy that prioritizes inputs to valuation methods and requires disclosure of the fair value hierarchy, separatelyfor each major category of assets and liabilities, that segregates fair value measurements into three levels. Levels 1, 2 and 3 of the fair value hierarchy are defined as follows:
Level 1 - unadjusted quoted prices in active markets for identical investmentsLevel 2 - other significant observable inputs (including, but not limited to, quoted prices for similar assets or liabilities in markets that are either active or inactive; inputs other than quoted prices that areobservable such as interest rates, yield curves, volatilities, prepayment speeds, loss severities, credit risks, default rates, or other market corroborated inputs)Level 3 - significant unobservable inputs based on the best information available in the circumstances, to the extent observable inputs are unavailable (including the Portfolio’s own assumptions used indetermining the fair value of investments and derivative financial instruments)
The inputs or methodologies used for valuing investments are not necessarily an indication of the risk associated with investing in them. Changes to the inputs or methodologies used may result in transfersbetween levels, which will be recognized as of the beginning of the reporting period. Information on transfers between Level 1 and Level 2, if any, will be disclosed following the fair value hierarchy table below.A reconciliation of Level 3 securities, if any, will also be disclosed following the fair value hierarchy table. For more information about the Portfolio’s policy regarding the valuation of investments, please refer tothe Notes to Schedule of Investments.
The following table summarizes the fair value hierarchy of the Portfolio’s investments as of September 30, 2018:
Description Level 1 Level 2 Level 3 Total
Total Common Stocks* . . . . . . . . . . . . . . . . . . . . . . . . . . . . . . . . . . . . . . . . . . . . . . . . . . . . . . . . . . . . . . . . . . . . . . . . . . . $1,111,538,578 $ — $— $1,111,538,578
Total Mutual Fund* . . . . . . . . . . . . . . . . . . . . . . . . . . . . . . . . . . . . . . . . . . . . . . . . . . . . . . . . . . . . . . . . . . . . . . . . . . . . . 6,761,264 — — 6,761,264
Total Short-Term Investments* . . . . . . . . . . . . . . . . . . . . . . . . . . . . . . . . . . . . . . . . . . . . . . . . . . . . . . . . . . . . . . . . . . . . . . — 6,497,614 — 6,497,614
Total Securities Lending Reinvestments* . . . . . . . . . . . . . . . . . . . . . . . . . . . . . . . . . . . . . . . . . . . . . . . . . . . . . . . . . . . . . . . . — 227,183,913 — 227,183,913
Total Investments . . . . . . . . . . . . . . . . . . . . . . . . . . . . . . . . . . . . . . . . . . . . . . . . . . . . . . . . . . . . . . . . . . . . . . . . . . . . . . $1,118,299,842 $ 233,681,527 $— $1,351,981,369
Collateral for Securities Loaned (Liability) . . . . . . . . . . . . . . . . . . . . . . . . . . . . . . . . . . . . . . . . . . . . . . . . . . . . . . . . . . . . . . $ — $(227,129,118) $— $ (227,129,118)
Futures ContractsFutures Contracts (Unrealized Depreciation) . . . . . . . . . . . . . . . . . . . . . . . . . . . . . . . . . . . . . . . . . . . . . . . . . . . . . . . . . . . $ (131,167) $ — $— $ (131,167)
* See Schedule of Investments for additional detailed categorizations.
BHFTII-187
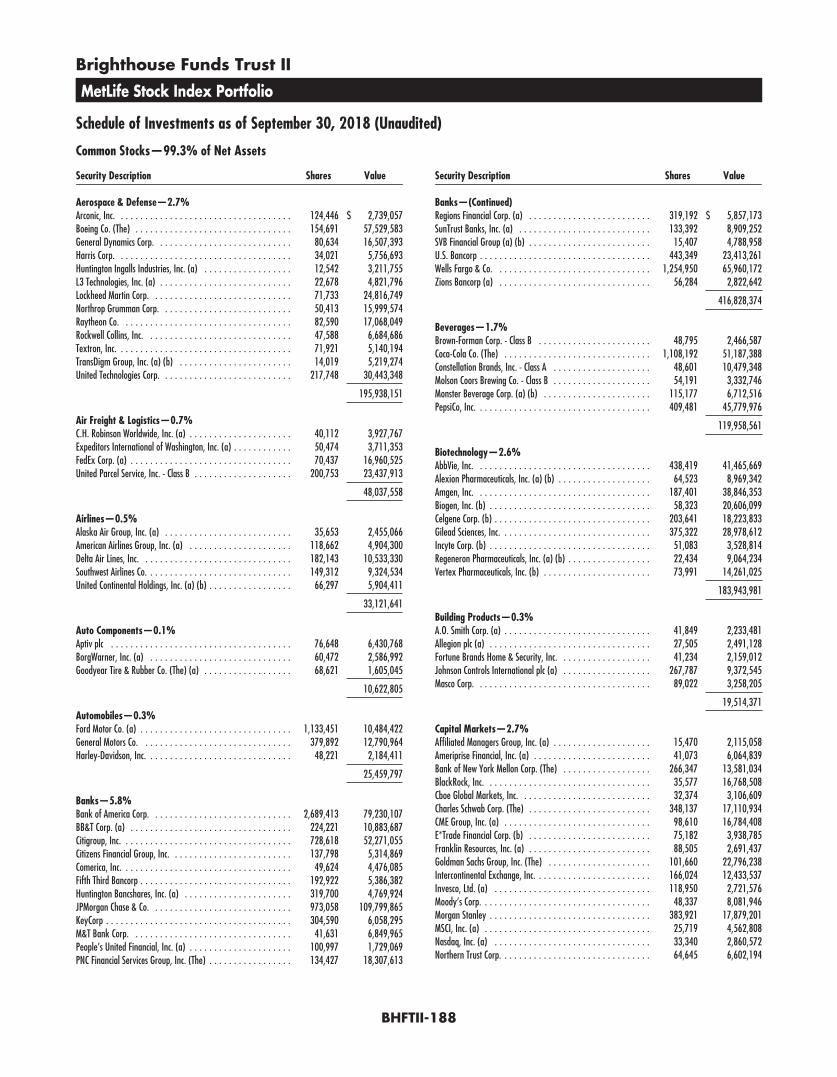
Brighthouse Funds Trust II
MetLife Stock Index Portfolio
Schedule of Investments as of September 30, 2018 (Unaudited)
Common Stocks—99.3% of Net Assets
Security Description Shares Value
Aerospace & Defense—2.7%Arconic, Inc. . . . . . . . . . . . . . . . . . . . . . . . . . . . . . . . . . . . 124,446 $ 2,739,057Boeing Co. (The) . . . . . . . . . . . . . . . . . . . . . . . . . . . . . . . . 154,691 57,529,583General Dynamics Corp. . . . . . . . . . . . . . . . . . . . . . . . . . . . 80,634 16,507,393Harris Corp. . . . . . . . . . . . . . . . . . . . . . . . . . . . . . . . . . . . 34,021 5,756,693Huntington Ingalls Industries, Inc. (a) . . . . . . . . . . . . . . . . . . 12,542 3,211,755L3 Technologies, Inc. (a) . . . . . . . . . . . . . . . . . . . . . . . . . . . 22,678 4,821,796Lockheed Martin Corp. . . . . . . . . . . . . . . . . . . . . . . . . . . . . 71,733 24,816,749Northrop Grumman Corp. . . . . . . . . . . . . . . . . . . . . . . . . . . 50,413 15,999,574Raytheon Co. . . . . . . . . . . . . . . . . . . . . . . . . . . . . . . . . . . 82,590 17,068,049Rockwell Collins, Inc. . . . . . . . . . . . . . . . . . . . . . . . . . . . . . 47,588 6,684,686Textron, Inc. . . . . . . . . . . . . . . . . . . . . . . . . . . . . . . . . . . . 71,921 5,140,194TransDigm Group, Inc. (a) (b) . . . . . . . . . . . . . . . . . . . . . . . 14,019 5,219,274United Technologies Corp. . . . . . . . . . . . . . . . . . . . . . . . . . . 217,748 30,443,348
195,938,151
Air Freight & Logistics—0.7%C.H. Robinson Worldwide, Inc. (a) . . . . . . . . . . . . . . . . . . . . . 40,112 3,927,767Expeditors International of Washington, Inc. (a) . . . . . . . . . . . . 50,474 3,711,353FedEx Corp. (a) . . . . . . . . . . . . . . . . . . . . . . . . . . . . . . . . . 70,437 16,960,525United Parcel Service, Inc. - Class B . . . . . . . . . . . . . . . . . . . . 200,753 23,437,913
48,037,558
Airlines—0.5%Alaska Air Group, Inc. (a) . . . . . . . . . . . . . . . . . . . . . . . . . . 35,653 2,455,066American Airlines Group, Inc. (a) . . . . . . . . . . . . . . . . . . . . . 118,662 4,904,300Delta Air Lines, Inc. . . . . . . . . . . . . . . . . . . . . . . . . . . . . . . 182,143 10,533,330Southwest Airlines Co. . . . . . . . . . . . . . . . . . . . . . . . . . . . . . 149,312 9,324,534United Continental Holdings, Inc. (a) (b) . . . . . . . . . . . . . . . . . 66,297 5,904,411
33,121,641
Auto Components—0.1%Aptiv plc . . . . . . . . . . . . . . . . . . . . . . . . . . . . . . . . . . . . . 76,648 6,430,768BorgWarner, Inc. (a) . . . . . . . . . . . . . . . . . . . . . . . . . . . . . 60,472 2,586,992Goodyear Tire & Rubber Co. (The) (a) . . . . . . . . . . . . . . . . . . 68,621 1,605,045
10,622,805
Automobiles—0.3%Ford Motor Co. (a) . . . . . . . . . . . . . . . . . . . . . . . . . . . . . . . 1,133,451 10,484,422General Motors Co. . . . . . . . . . . . . . . . . . . . . . . . . . . . . . . 379,892 12,790,964Harley-Davidson, Inc. . . . . . . . . . . . . . . . . . . . . . . . . . . . . . 48,221 2,184,411
25,459,797
Banks—5.8%Bank of America Corp. . . . . . . . . . . . . . . . . . . . . . . . . . . . . 2,689,413 79,230,107BB&T Corp. (a) . . . . . . . . . . . . . . . . . . . . . . . . . . . . . . . . . 224,221 10,883,687Citigroup, Inc. . . . . . . . . . . . . . . . . . . . . . . . . . . . . . . . . . . 728,618 52,271,055Citizens Financial Group, Inc. . . . . . . . . . . . . . . . . . . . . . . . . 137,798 5,314,869Comerica, Inc. . . . . . . . . . . . . . . . . . . . . . . . . . . . . . . . . . . 49,624 4,476,085Fifth Third Bancorp . . . . . . . . . . . . . . . . . . . . . . . . . . . . . . . 192,922 5,386,382Huntington Bancshares, Inc. (a) . . . . . . . . . . . . . . . . . . . . . . 319,700 4,769,924JPMorgan Chase & Co. . . . . . . . . . . . . . . . . . . . . . . . . . . . . 973,058 109,799,865KeyCorp . . . . . . . . . . . . . . . . . . . . . . . . . . . . . . . . . . . . . . 304,590 6,058,295M&T Bank Corp. . . . . . . . . . . . . . . . . . . . . . . . . . . . . . . . . 41,631 6,849,965People’s United Financial, Inc. (a) . . . . . . . . . . . . . . . . . . . . . 100,997 1,729,069PNC Financial Services Group, Inc. (The) . . . . . . . . . . . . . . . . . 134,427 18,307,613
Security Description Shares Value
Banks—(Continued)Regions Financial Corp. (a) . . . . . . . . . . . . . . . . . . . . . . . . . 319,192 $ 5,857,173SunTrust Banks, Inc. (a) . . . . . . . . . . . . . . . . . . . . . . . . . . . 133,392 8,909,252SVB Financial Group (a) (b) . . . . . . . . . . . . . . . . . . . . . . . . . 15,407 4,788,958U.S. Bancorp . . . . . . . . . . . . . . . . . . . . . . . . . . . . . . . . . . . 443,349 23,413,261Wells Fargo & Co. . . . . . . . . . . . . . . . . . . . . . . . . . . . . . . . 1,254,950 65,960,172Zions Bancorp (a) . . . . . . . . . . . . . . . . . . . . . . . . . . . . . . . 56,284 2,822,642
416,828,374
Beverages—1.7%Brown-Forman Corp. - Class B . . . . . . . . . . . . . . . . . . . . . . . 48,795 2,466,587Coca-Cola Co. (The) . . . . . . . . . . . . . . . . . . . . . . . . . . . . . . 1,108,192 51,187,388Constellation Brands, Inc. - Class A . . . . . . . . . . . . . . . . . . . . 48,601 10,479,348Molson Coors Brewing Co. - Class B . . . . . . . . . . . . . . . . . . . . 54,191 3,332,746Monster Beverage Corp. (a) (b) . . . . . . . . . . . . . . . . . . . . . . 115,177 6,712,516PepsiCo, Inc. . . . . . . . . . . . . . . . . . . . . . . . . . . . . . . . . . . . 409,481 45,779,976
119,958,561
Biotechnology—2.6%AbbVie, Inc. . . . . . . . . . . . . . . . . . . . . . . . . . . . . . . . . . . . 438,419 41,465,669Alexion Pharmaceuticals, Inc. (a) (b) . . . . . . . . . . . . . . . . . . . 64,523 8,969,342Amgen, Inc. . . . . . . . . . . . . . . . . . . . . . . . . . . . . . . . . . . . 187,401 38,846,353Biogen, Inc. (b) . . . . . . . . . . . . . . . . . . . . . . . . . . . . . . . . . 58,323 20,606,099Celgene Corp. (b) . . . . . . . . . . . . . . . . . . . . . . . . . . . . . . . . 203,641 18,223,833Gilead Sciences, Inc. . . . . . . . . . . . . . . . . . . . . . . . . . . . . . . 375,322 28,978,612Incyte Corp. (b) . . . . . . . . . . . . . . . . . . . . . . . . . . . . . . . . . 51,083 3,528,814Regeneron Pharmaceuticals, Inc. (a) (b) . . . . . . . . . . . . . . . . . 22,434 9,064,234Vertex Pharmaceuticals, Inc. (b) . . . . . . . . . . . . . . . . . . . . . . 73,991 14,261,025
183,943,981
Building Products—0.3%A.O. Smith Corp. (a) . . . . . . . . . . . . . . . . . . . . . . . . . . . . . . 41,849 2,233,481Allegion plc (a) . . . . . . . . . . . . . . . . . . . . . . . . . . . . . . . . . 27,505 2,491,128Fortune Brands Home & Security, Inc. . . . . . . . . . . . . . . . . . . 41,234 2,159,012Johnson Controls International plc (a) . . . . . . . . . . . . . . . . . . 267,787 9,372,545Masco Corp. . . . . . . . . . . . . . . . . . . . . . . . . . . . . . . . . . . . 89,022 3,258,205
19,514,371
Capital Markets—2.7%Affiliated Managers Group, Inc. (a) . . . . . . . . . . . . . . . . . . . . 15,470 2,115,058Ameriprise Financial, Inc. (a) . . . . . . . . . . . . . . . . . . . . . . . . 41,073 6,064,839Bank of New York Mellon Corp. (The) . . . . . . . . . . . . . . . . . . 266,347 13,581,034BlackRock, Inc. . . . . . . . . . . . . . . . . . . . . . . . . . . . . . . . . . 35,577 16,768,508Cboe Global Markets, Inc. . . . . . . . . . . . . . . . . . . . . . . . . . . 32,374 3,106,609Charles Schwab Corp. (The) . . . . . . . . . . . . . . . . . . . . . . . . . 348,137 17,110,934CME Group, Inc. (a) . . . . . . . . . . . . . . . . . . . . . . . . . . . . . . 98,610 16,784,408E*Trade Financial Corp. (b) . . . . . . . . . . . . . . . . . . . . . . . . . 75,182 3,938,785Franklin Resources, Inc. (a) . . . . . . . . . . . . . . . . . . . . . . . . . 88,505 2,691,437Goldman Sachs Group, Inc. (The) . . . . . . . . . . . . . . . . . . . . . 101,660 22,796,238Intercontinental Exchange, Inc. . . . . . . . . . . . . . . . . . . . . . . . 166,024 12,433,537Invesco, Ltd. (a) . . . . . . . . . . . . . . . . . . . . . . . . . . . . . . . . 118,950 2,721,576Moody’s Corp. . . . . . . . . . . . . . . . . . . . . . . . . . . . . . . . . . . 48,337 8,081,946Morgan Stanley . . . . . . . . . . . . . . . . . . . . . . . . . . . . . . . . . 383,921 17,879,201MSCI, Inc. (a) . . . . . . . . . . . . . . . . . . . . . . . . . . . . . . . . . . 25,719 4,562,808Nasdaq, Inc. (a) . . . . . . . . . . . . . . . . . . . . . . . . . . . . . . . . 33,340 2,860,572Northern Trust Corp. . . . . . . . . . . . . . . . . . . . . . . . . . . . . . . 64,645 6,602,194
BHFTII-188

Brighthouse Funds Trust II
MetLife Stock Index Portfolio
Schedule of Investments as of September 30, 2018 (Unaudited)
Common Stocks—(Continued)
Security Description Shares Value
Capital Markets—(Continued)Raymond James Financial, Inc. (a) . . . . . . . . . . . . . . . . . . . . 38,014 $ 3,499,189S&P Global, Inc. (a) . . . . . . . . . . . . . . . . . . . . . . . . . . . . . . 72,816 14,227,518State Street Corp. . . . . . . . . . . . . . . . . . . . . . . . . . . . . . . . . 109,850 9,203,233T. Rowe Price Group, Inc. . . . . . . . . . . . . . . . . . . . . . . . . . . . 70,410 7,687,364
194,716,988
Chemicals—1.8%Air Products & Chemicals, Inc. . . . . . . . . . . . . . . . . . . . . . . . . 63,485 10,605,169Albemarle Corp. (a) . . . . . . . . . . . . . . . . . . . . . . . . . . . . . . 31,399 3,132,992CF Industries Holdings, Inc. . . . . . . . . . . . . . . . . . . . . . . . . . 67,594 3,679,817DowDuPont, Inc. . . . . . . . . . . . . . . . . . . . . . . . . . . . . . . . . 668,042 42,961,781Eastman Chemical Co. (a) . . . . . . . . . . . . . . . . . . . . . . . . . . 40,904 3,915,331Ecolab, Inc. . . . . . . . . . . . . . . . . . . . . . . . . . . . . . . . . . . . . 73,607 11,540,106FMC Corp. (a) . . . . . . . . . . . . . . . . . . . . . . . . . . . . . . . . . . 38,978 3,398,102International Flavors & Fragrances, Inc. (a) . . . . . . . . . . . . . . . 26,554 3,694,193LyondellBasell Industries NV - Class A . . . . . . . . . . . . . . . . . . . 92,429 9,474,897Mosaic Co. (The) (a) . . . . . . . . . . . . . . . . . . . . . . . . . . . . . . 102,671 3,334,754PPG Industries, Inc. . . . . . . . . . . . . . . . . . . . . . . . . . . . . . . 70,070 7,646,739Praxair, Inc. . . . . . . . . . . . . . . . . . . . . . . . . . . . . . . . . . . . 83,260 13,382,380Sherwin-Williams Co. (The) . . . . . . . . . . . . . . . . . . . . . . . . . 23,792 10,830,356
127,596,617
Commercial Services & Supplies—0.4%Cintas Corp. . . . . . . . . . . . . . . . . . . . . . . . . . . . . . . . . . . . 24,924 4,930,216Copart, Inc. (b) . . . . . . . . . . . . . . . . . . . . . . . . . . . . . . . . . 59,180 3,049,545Republic Services, Inc. . . . . . . . . . . . . . . . . . . . . . . . . . . . . . 63,113 4,585,791Rollins, Inc. . . . . . . . . . . . . . . . . . . . . . . . . . . . . . . . . . . . . 28,425 1,725,028Stericycle, Inc. (b) . . . . . . . . . . . . . . . . . . . . . . . . . . . . . . . 24,866 1,459,137Waste Management, Inc. . . . . . . . . . . . . . . . . . . . . . . . . . . . 114,194 10,318,570
26,068,287
Communications Equipment—1.1%Arista Networks, Inc. (a) (b) . . . . . . . . . . . . . . . . . . . . . . . . . 14,948 3,974,075Cisco Systems, Inc. . . . . . . . . . . . . . . . . . . . . . . . . . . . . . . . 1,323,513 64,388,908F5 Networks, Inc. (a) (b) . . . . . . . . . . . . . . . . . . . . . . . . . . . 17,608 3,511,388Juniper Networks, Inc. . . . . . . . . . . . . . . . . . . . . . . . . . . . . 99,826 2,991,785Motorola Solutions, Inc. . . . . . . . . . . . . . . . . . . . . . . . . . . . . 46,980 6,113,977
80,980,133
Construction & Engineering—0.1%Fluor Corp. . . . . . . . . . . . . . . . . . . . . . . . . . . . . . . . . . . . . 40,712 2,365,367Jacobs Engineering Group, Inc. (a) . . . . . . . . . . . . . . . . . . . . 34,511 2,640,091Quanta Services, Inc. (a) (b) . . . . . . . . . . . . . . . . . . . . . . . . 43,083 1,438,111
6,443,569
Construction Materials—0.1%Martin Marietta Materials, Inc. (a) . . . . . . . . . . . . . . . . . . . . . 18,244 3,319,496Vulcan Materials Co. (a) . . . . . . . . . . . . . . . . . . . . . . . . . . . 38,295 4,258,404
7,577,900
Consumer Finance—0.7%American Express Co. . . . . . . . . . . . . . . . . . . . . . . . . . . . . . 204,423 21,769,005Capital One Financial Corp. . . . . . . . . . . . . . . . . . . . . . . . . . 138,516 13,149,324
Security Description Shares Value
Consumer Finance—(Continued)Discover Financial Services . . . . . . . . . . . . . . . . . . . . . . . . . . 99,208 $ 7,584,452Synchrony Financial . . . . . . . . . . . . . . . . . . . . . . . . . . . . . . 197,290 6,131,773
48,634,554
Containers & Packaging—0.3%Avery Dennison Corp. . . . . . . . . . . . . . . . . . . . . . . . . . . . . . 25,310 2,742,338Ball Corp. . . . . . . . . . . . . . . . . . . . . . . . . . . . . . . . . . . . . . 99,570 4,380,084International Paper Co. . . . . . . . . . . . . . . . . . . . . . . . . . . . . 118,380 5,818,377Packaging Corp. of America (a) . . . . . . . . . . . . . . . . . . . . . . 27,359 3,001,009Sealed Air Corp. . . . . . . . . . . . . . . . . . . . . . . . . . . . . . . . . . 45,979 1,846,057WestRock Co. . . . . . . . . . . . . . . . . . . . . . . . . . . . . . . . . . . 73,861 3,947,132
21,734,997
Distributors—0.1%Genuine Parts Co. (a) . . . . . . . . . . . . . . . . . . . . . . . . . . . . . 42,488 4,223,307LKQ Corp. (a) (b) . . . . . . . . . . . . . . . . . . . . . . . . . . . . . . . . 92,092 2,916,554
7,139,861
Diversified Consumer Services—0.0%H&R Block, Inc. (a) . . . . . . . . . . . . . . . . . . . . . . . . . . . . . . 59,503 1,532,202
Diversified Financial Services—1.7%Berkshire Hathaway, Inc. - Class B (b) . . . . . . . . . . . . . . . . . . 564,407 120,845,183Jefferies Financial Group, Inc. (a) . . . . . . . . . . . . . . . . . . . . . 83,961 1,843,783
122,688,966
Diversified Telecommunication Services—2.0%AT&T, Inc. . . . . . . . . . . . . . . . . . . . . . . . . . . . . . . . . . . . . 2,102,526 70,602,823CenturyLink, Inc. (a) . . . . . . . . . . . . . . . . . . . . . . . . . . . . . 275,195 5,834,134Verizon Communications, Inc. . . . . . . . . . . . . . . . . . . . . . . . . 1,196,296 63,870,244
140,307,201
Electric Utilities—1.7%Alliant Energy Corp. (a) . . . . . . . . . . . . . . . . . . . . . . . . . . . 67,683 2,881,265American Electric Power Co., Inc. . . . . . . . . . . . . . . . . . . . . . . 142,716 10,115,710Duke Energy Corp. (a) . . . . . . . . . . . . . . . . . . . . . . . . . . . . 206,244 16,503,645Edison International (a) . . . . . . . . . . . . . . . . . . . . . . . . . . . 94,330 6,384,255Entergy Corp. . . . . . . . . . . . . . . . . . . . . . . . . . . . . . . . . . . 52,362 4,248,129Evergy, Inc. . . . . . . . . . . . . . . . . . . . . . . . . . . . . . . . . . . . 78,660 4,320,007Eversource Energy . . . . . . . . . . . . . . . . . . . . . . . . . . . . . . . 91,746 5,636,874Exelon Corp. . . . . . . . . . . . . . . . . . . . . . . . . . . . . . . . . . . . 279,653 12,209,650FirstEnergy Corp. (a) . . . . . . . . . . . . . . . . . . . . . . . . . . . . . 140,714 5,230,339NextEra Energy, Inc. (a) . . . . . . . . . . . . . . . . . . . . . . . . . . . 136,541 22,884,272PG&E Corp. (b) . . . . . . . . . . . . . . . . . . . . . . . . . . . . . . . . . 149,727 6,888,939Pinnacle West Capital Corp. (a) . . . . . . . . . . . . . . . . . . . . . . . 32,419 2,566,937PPL Corp. . . . . . . . . . . . . . . . . . . . . . . . . . . . . . . . . . . . . . 202,542 5,926,379Southern Co. (The) (a) . . . . . . . . . . . . . . . . . . . . . . . . . . . . 293,617 12,801,701Xcel Energy, Inc. (a) . . . . . . . . . . . . . . . . . . . . . . . . . . . . . . 147,393 6,958,424
125,556,526
Electrical Equipment—0.5%AMETEK, Inc. . . . . . . . . . . . . . . . . . . . . . . . . . . . . . . . . . . . 67,140 5,312,117Eaton Corp. plc . . . . . . . . . . . . . . . . . . . . . . . . . . . . . . . . . 125,451 10,880,365
BHFTII-189
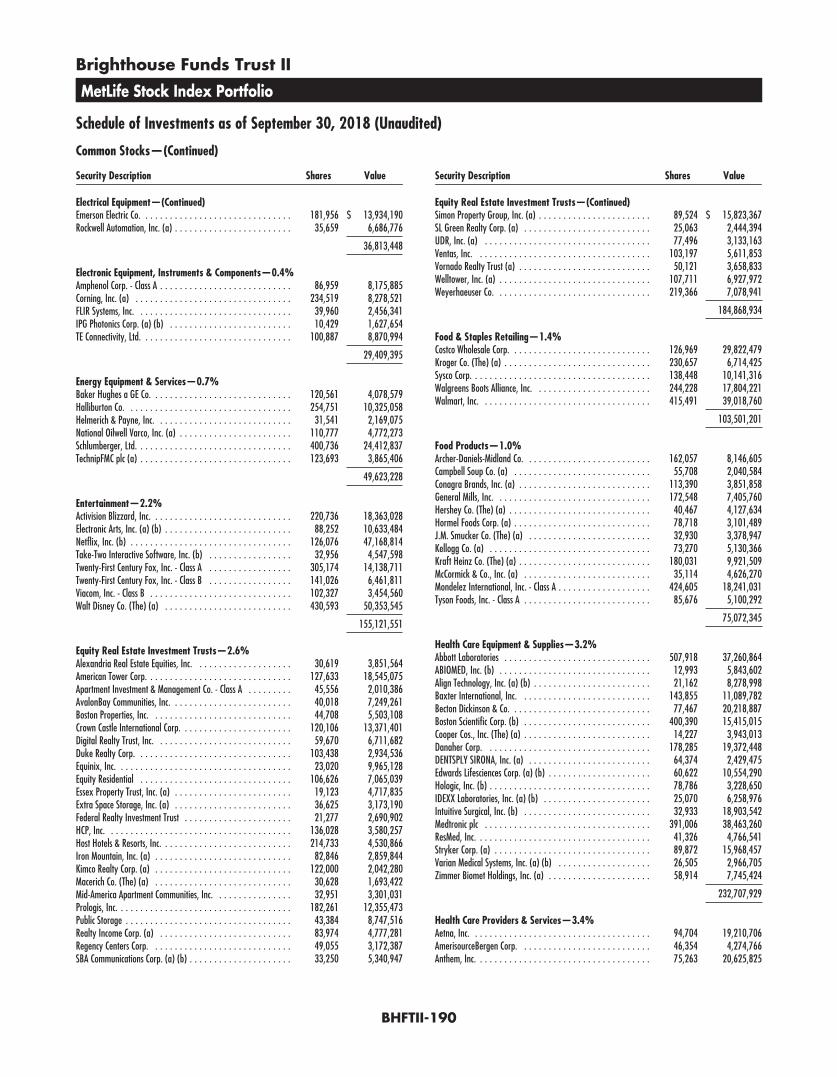
Brighthouse Funds Trust II
MetLife Stock Index Portfolio
Schedule of Investments as of September 30, 2018 (Unaudited)
Common Stocks—(Continued)
Security Description Shares Value
Electrical Equipment—(Continued)Emerson Electric Co. . . . . . . . . . . . . . . . . . . . . . . . . . . . . . . 181,956 $ 13,934,190Rockwell Automation, Inc. (a) . . . . . . . . . . . . . . . . . . . . . . . . 35,659 6,686,776
36,813,448
Electronic Equipment, Instruments & Components—0.4%Amphenol Corp. - Class A . . . . . . . . . . . . . . . . . . . . . . . . . . . 86,959 8,175,885Corning, Inc. (a) . . . . . . . . . . . . . . . . . . . . . . . . . . . . . . . . 234,519 8,278,521FLIR Systems, Inc. . . . . . . . . . . . . . . . . . . . . . . . . . . . . . . . 39,960 2,456,341IPG Photonics Corp. (a) (b) . . . . . . . . . . . . . . . . . . . . . . . . . 10,429 1,627,654TE Connectivity, Ltd. . . . . . . . . . . . . . . . . . . . . . . . . . . . . . . 100,887 8,870,994
29,409,395
Energy Equipment & Services—0.7%Baker Hughes a GE Co. . . . . . . . . . . . . . . . . . . . . . . . . . . . . 120,561 4,078,579Halliburton Co. . . . . . . . . . . . . . . . . . . . . . . . . . . . . . . . . . 254,751 10,325,058Helmerich & Payne, Inc. . . . . . . . . . . . . . . . . . . . . . . . . . . . 31,541 2,169,075National Oilwell Varco, Inc. (a) . . . . . . . . . . . . . . . . . . . . . . . 110,777 4,772,273Schlumberger, Ltd. . . . . . . . . . . . . . . . . . . . . . . . . . . . . . . . 400,736 24,412,837TechnipFMC plc (a) . . . . . . . . . . . . . . . . . . . . . . . . . . . . . . . 123,693 3,865,406
49,623,228
Entertainment—2.2%Activision Blizzard, Inc. . . . . . . . . . . . . . . . . . . . . . . . . . . . . 220,736 18,363,028Electronic Arts, Inc. (a) (b) . . . . . . . . . . . . . . . . . . . . . . . . . . 88,252 10,633,484Netflix, Inc. (b) . . . . . . . . . . . . . . . . . . . . . . . . . . . . . . . . . 126,076 47,168,814Take-Two Interactive Software, Inc. (b) . . . . . . . . . . . . . . . . . 32,956 4,547,598Twenty-First Century Fox, Inc. - Class A . . . . . . . . . . . . . . . . . 305,174 14,138,711Twenty-First Century Fox, Inc. - Class B . . . . . . . . . . . . . . . . . 141,026 6,461,811Viacom, Inc. - Class B . . . . . . . . . . . . . . . . . . . . . . . . . . . . . 102,327 3,454,560Walt Disney Co. (The) (a) . . . . . . . . . . . . . . . . . . . . . . . . . . 430,593 50,353,545
155,121,551
Equity Real Estate Investment Trusts—2.6%Alexandria Real Estate Equities, Inc. . . . . . . . . . . . . . . . . . . . 30,619 3,851,564American Tower Corp. . . . . . . . . . . . . . . . . . . . . . . . . . . . . . 127,633 18,545,075Apartment Investment & Management Co. - Class A . . . . . . . . . 45,556 2,010,386AvalonBay Communities, Inc. . . . . . . . . . . . . . . . . . . . . . . . . 40,018 7,249,261Boston Properties, Inc. . . . . . . . . . . . . . . . . . . . . . . . . . . . . 44,708 5,503,108Crown Castle International Corp. . . . . . . . . . . . . . . . . . . . . . . 120,106 13,371,401Digital Realty Trust, Inc. . . . . . . . . . . . . . . . . . . . . . . . . . . . 59,670 6,711,682Duke Realty Corp. . . . . . . . . . . . . . . . . . . . . . . . . . . . . . . . 103,438 2,934,536Equinix, Inc. . . . . . . . . . . . . . . . . . . . . . . . . . . . . . . . . . . . 23,020 9,965,128Equity Residential . . . . . . . . . . . . . . . . . . . . . . . . . . . . . . . 106,626 7,065,039Essex Property Trust, Inc. (a) . . . . . . . . . . . . . . . . . . . . . . . . 19,123 4,717,835Extra Space Storage, Inc. (a) . . . . . . . . . . . . . . . . . . . . . . . . 36,625 3,173,190Federal Realty Investment Trust . . . . . . . . . . . . . . . . . . . . . . 21,277 2,690,902HCP, Inc. . . . . . . . . . . . . . . . . . . . . . . . . . . . . . . . . . . . . . 136,028 3,580,257Host Hotels & Resorts, Inc. . . . . . . . . . . . . . . . . . . . . . . . . . . 214,733 4,530,866Iron Mountain, Inc. (a) . . . . . . . . . . . . . . . . . . . . . . . . . . . . 82,846 2,859,844Kimco Realty Corp. (a) . . . . . . . . . . . . . . . . . . . . . . . . . . . . 122,000 2,042,280Macerich Co. (The) (a) . . . . . . . . . . . . . . . . . . . . . . . . . . . . 30,628 1,693,422Mid-America Apartment Communities, Inc. . . . . . . . . . . . . . . . 32,951 3,301,031Prologis, Inc. . . . . . . . . . . . . . . . . . . . . . . . . . . . . . . . . . . . 182,261 12,355,473Public Storage . . . . . . . . . . . . . . . . . . . . . . . . . . . . . . . . . . 43,384 8,747,516Realty Income Corp. (a) . . . . . . . . . . . . . . . . . . . . . . . . . . . 83,974 4,777,281Regency Centers Corp. . . . . . . . . . . . . . . . . . . . . . . . . . . . . 49,055 3,172,387SBA Communications Corp. (a) (b) . . . . . . . . . . . . . . . . . . . . . 33,250 5,340,947
Security Description Shares Value
Equity Real Estate Investment Trusts—(Continued)Simon Property Group, Inc. (a) . . . . . . . . . . . . . . . . . . . . . . . 89,524 $ 15,823,367SL Green Realty Corp. (a) . . . . . . . . . . . . . . . . . . . . . . . . . . 25,063 2,444,394UDR, Inc. (a) . . . . . . . . . . . . . . . . . . . . . . . . . . . . . . . . . . 77,496 3,133,163Ventas, Inc. . . . . . . . . . . . . . . . . . . . . . . . . . . . . . . . . . . . 103,197 5,611,853Vornado Realty Trust (a) . . . . . . . . . . . . . . . . . . . . . . . . . . . 50,121 3,658,833Welltower, Inc. (a) . . . . . . . . . . . . . . . . . . . . . . . . . . . . . . . 107,711 6,927,972Weyerhaeuser Co. . . . . . . . . . . . . . . . . . . . . . . . . . . . . . . . 219,366 7,078,941
184,868,934
Food & Staples Retailing—1.4%Costco Wholesale Corp. . . . . . . . . . . . . . . . . . . . . . . . . . . . . 126,969 29,822,479Kroger Co. (The) (a) . . . . . . . . . . . . . . . . . . . . . . . . . . . . . . 230,657 6,714,425Sysco Corp. . . . . . . . . . . . . . . . . . . . . . . . . . . . . . . . . . . . . 138,448 10,141,316Walgreens Boots Alliance, Inc. . . . . . . . . . . . . . . . . . . . . . . . 244,228 17,804,221Walmart, Inc. . . . . . . . . . . . . . . . . . . . . . . . . . . . . . . . . . . 415,491 39,018,760
103,501,201
Food Products—1.0%Archer-Daniels-Midland Co. . . . . . . . . . . . . . . . . . . . . . . . . . 162,057 8,146,605Campbell Soup Co. (a) . . . . . . . . . . . . . . . . . . . . . . . . . . . . 55,708 2,040,584Conagra Brands, Inc. (a) . . . . . . . . . . . . . . . . . . . . . . . . . . . 113,390 3,851,858General Mills, Inc. . . . . . . . . . . . . . . . . . . . . . . . . . . . . . . . 172,548 7,405,760Hershey Co. (The) (a) . . . . . . . . . . . . . . . . . . . . . . . . . . . . . 40,467 4,127,634Hormel Foods Corp. (a) . . . . . . . . . . . . . . . . . . . . . . . . . . . . 78,718 3,101,489J.M. Smucker Co. (The) (a) . . . . . . . . . . . . . . . . . . . . . . . . . 32,930 3,378,947Kellogg Co. (a) . . . . . . . . . . . . . . . . . . . . . . . . . . . . . . . . . 73,270 5,130,366Kraft Heinz Co. (The) (a) . . . . . . . . . . . . . . . . . . . . . . . . . . . 180,031 9,921,509McCormick & Co., Inc. (a) . . . . . . . . . . . . . . . . . . . . . . . . . . 35,114 4,626,270Mondelez International, Inc. - Class A . . . . . . . . . . . . . . . . . . . 424,605 18,241,031Tyson Foods, Inc. - Class A . . . . . . . . . . . . . . . . . . . . . . . . . . 85,676 5,100,292
75,072,345
Health Care Equipment & Supplies—3.2%Abbott Laboratories . . . . . . . . . . . . . . . . . . . . . . . . . . . . . . 507,918 37,260,864ABIOMED, Inc. (b) . . . . . . . . . . . . . . . . . . . . . . . . . . . . . . . 12,993 5,843,602Align Technology, Inc. (a) (b) . . . . . . . . . . . . . . . . . . . . . . . . 21,162 8,278,998Baxter International, Inc. . . . . . . . . . . . . . . . . . . . . . . . . . . 143,855 11,089,782Becton Dickinson & Co. . . . . . . . . . . . . . . . . . . . . . . . . . . . . 77,467 20,218,887Boston Scientific Corp. (b) . . . . . . . . . . . . . . . . . . . . . . . . . . 400,390 15,415,015Cooper Cos., Inc. (The) (a) . . . . . . . . . . . . . . . . . . . . . . . . . . 14,227 3,943,013Danaher Corp. . . . . . . . . . . . . . . . . . . . . . . . . . . . . . . . . . 178,285 19,372,448DENTSPLY SIRONA, Inc. (a) . . . . . . . . . . . . . . . . . . . . . . . . . 64,374 2,429,475Edwards Lifesciences Corp. (a) (b) . . . . . . . . . . . . . . . . . . . . . 60,622 10,554,290Hologic, Inc. (b) . . . . . . . . . . . . . . . . . . . . . . . . . . . . . . . . . 78,786 3,228,650IDEXX Laboratories, Inc. (a) (b) . . . . . . . . . . . . . . . . . . . . . . 25,070 6,258,976Intuitive Surgical, Inc. (b) . . . . . . . . . . . . . . . . . . . . . . . . . . 32,933 18,903,542Medtronic plc . . . . . . . . . . . . . . . . . . . . . . . . . . . . . . . . . . 391,006 38,463,260ResMed, Inc. . . . . . . . . . . . . . . . . . . . . . . . . . . . . . . . . . . . 41,326 4,766,541Stryker Corp. (a) . . . . . . . . . . . . . . . . . . . . . . . . . . . . . . . . 89,872 15,968,457Varian Medical Systems, Inc. (a) (b) . . . . . . . . . . . . . . . . . . . 26,505 2,966,705Zimmer Biomet Holdings, Inc. (a) . . . . . . . . . . . . . . . . . . . . . 58,914 7,745,424
232,707,929
Health Care Providers & Services—3.4%Aetna, Inc. . . . . . . . . . . . . . . . . . . . . . . . . . . . . . . . . . . . . 94,704 19,210,706AmerisourceBergen Corp. . . . . . . . . . . . . . . . . . . . . . . . . . . 46,354 4,274,766Anthem, Inc. . . . . . . . . . . . . . . . . . . . . . . . . . . . . . . . . . . . 75,263 20,625,825
BHFTII-190
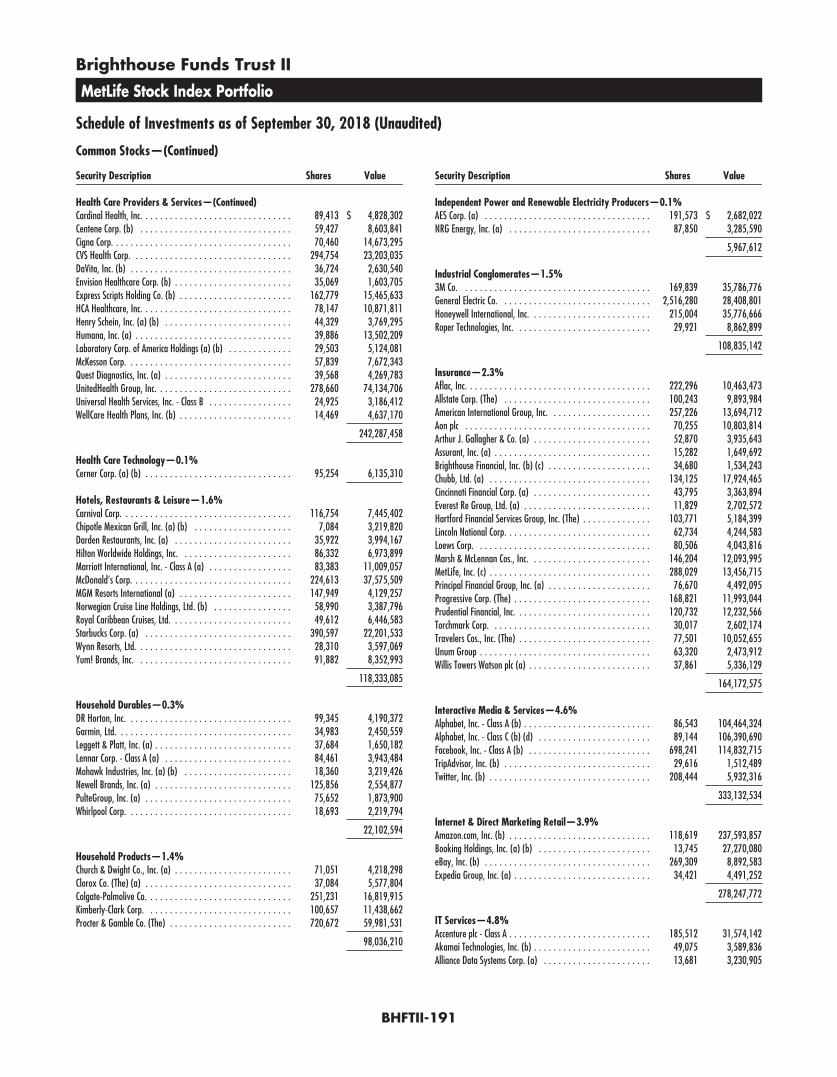
Brighthouse Funds Trust II
MetLife Stock Index Portfolio
Schedule of Investments as of September 30, 2018 (Unaudited)
Common Stocks—(Continued)
Security Description Shares Value
Health Care Providers & Services—(Continued)Cardinal Health, Inc. . . . . . . . . . . . . . . . . . . . . . . . . . . . . . . 89,413 $ 4,828,302Centene Corp. (b) . . . . . . . . . . . . . . . . . . . . . . . . . . . . . . . 59,427 8,603,841Cigna Corp. . . . . . . . . . . . . . . . . . . . . . . . . . . . . . . . . . . . . 70,460 14,673,295CVS Health Corp. . . . . . . . . . . . . . . . . . . . . . . . . . . . . . . . . 294,754 23,203,035DaVita, Inc. (b) . . . . . . . . . . . . . . . . . . . . . . . . . . . . . . . . . 36,724 2,630,540Envision Healthcare Corp. (b) . . . . . . . . . . . . . . . . . . . . . . . . 35,069 1,603,705Express Scripts Holding Co. (b) . . . . . . . . . . . . . . . . . . . . . . . 162,779 15,465,633HCA Healthcare, Inc. . . . . . . . . . . . . . . . . . . . . . . . . . . . . . . 78,147 10,871,811Henry Schein, Inc. (a) (b) . . . . . . . . . . . . . . . . . . . . . . . . . . 44,329 3,769,295Humana, Inc. (a) . . . . . . . . . . . . . . . . . . . . . . . . . . . . . . . . 39,886 13,502,209Laboratory Corp. of America Holdings (a) (b) . . . . . . . . . . . . . 29,503 5,124,081McKesson Corp. . . . . . . . . . . . . . . . . . . . . . . . . . . . . . . . . . 57,839 7,672,343Quest Diagnostics, Inc. (a) . . . . . . . . . . . . . . . . . . . . . . . . . . 39,568 4,269,783UnitedHealth Group, Inc. . . . . . . . . . . . . . . . . . . . . . . . . . . . 278,660 74,134,706Universal Health Services, Inc. - Class B . . . . . . . . . . . . . . . . . 24,925 3,186,412WellCare Health Plans, Inc. (b) . . . . . . . . . . . . . . . . . . . . . . . 14,469 4,637,170
242,287,458
Health Care Technology—0.1%Cerner Corp. (a) (b) . . . . . . . . . . . . . . . . . . . . . . . . . . . . . . 95,254 6,135,310
Hotels, Restaurants & Leisure—1.6%Carnival Corp. . . . . . . . . . . . . . . . . . . . . . . . . . . . . . . . . . . 116,754 7,445,402Chipotle Mexican Grill, Inc. (a) (b) . . . . . . . . . . . . . . . . . . . . 7,084 3,219,820Darden Restaurants, Inc. (a) . . . . . . . . . . . . . . . . . . . . . . . . 35,922 3,994,167Hilton Worldwide Holdings, Inc. . . . . . . . . . . . . . . . . . . . . . . 86,332 6,973,899Marriott International, Inc. - Class A (a) . . . . . . . . . . . . . . . . . 83,383 11,009,057McDonald’s Corp. . . . . . . . . . . . . . . . . . . . . . . . . . . . . . . . . 224,613 37,575,509MGM Resorts International (a) . . . . . . . . . . . . . . . . . . . . . . . 147,949 4,129,257Norwegian Cruise Line Holdings, Ltd. (b) . . . . . . . . . . . . . . . . 58,990 3,387,796Royal Caribbean Cruises, Ltd. . . . . . . . . . . . . . . . . . . . . . . . . 49,612 6,446,583Starbucks Corp. (a) . . . . . . . . . . . . . . . . . . . . . . . . . . . . . . 390,597 22,201,533Wynn Resorts, Ltd. . . . . . . . . . . . . . . . . . . . . . . . . . . . . . . . 28,310 3,597,069Yum! Brands, Inc. . . . . . . . . . . . . . . . . . . . . . . . . . . . . . . . 91,882 8,352,993
118,333,085
Household Durables—0.3%DR Horton, Inc. . . . . . . . . . . . . . . . . . . . . . . . . . . . . . . . . . 99,345 4,190,372Garmin, Ltd. . . . . . . . . . . . . . . . . . . . . . . . . . . . . . . . . . . . 34,983 2,450,559Leggett & Platt, Inc. (a) . . . . . . . . . . . . . . . . . . . . . . . . . . . . 37,684 1,650,182Lennar Corp. - Class A (a) . . . . . . . . . . . . . . . . . . . . . . . . . . 84,461 3,943,484Mohawk Industries, Inc. (a) (b) . . . . . . . . . . . . . . . . . . . . . . 18,360 3,219,426Newell Brands, Inc. (a) . . . . . . . . . . . . . . . . . . . . . . . . . . . . 125,856 2,554,877PulteGroup, Inc. (a) . . . . . . . . . . . . . . . . . . . . . . . . . . . . . . 75,652 1,873,900Whirlpool Corp. . . . . . . . . . . . . . . . . . . . . . . . . . . . . . . . . . 18,693 2,219,794
22,102,594
Household Products—1.4%Church & Dwight Co., Inc. (a) . . . . . . . . . . . . . . . . . . . . . . . . 71,051 4,218,298Clorox Co. (The) (a) . . . . . . . . . . . . . . . . . . . . . . . . . . . . . . 37,084 5,577,804Colgate-Palmolive Co. . . . . . . . . . . . . . . . . . . . . . . . . . . . . . 251,231 16,819,915Kimberly-Clark Corp. . . . . . . . . . . . . . . . . . . . . . . . . . . . . . 100,657 11,438,662Procter & Gamble Co. (The) . . . . . . . . . . . . . . . . . . . . . . . . . 720,672 59,981,531
98,036,210
Security Description Shares Value
Independent Power and Renewable Electricity Producers—0.1%AES Corp. (a) . . . . . . . . . . . . . . . . . . . . . . . . . . . . . . . . . . 191,573 $ 2,682,022NRG Energy, Inc. (a) . . . . . . . . . . . . . . . . . . . . . . . . . . . . . 87,850 3,285,590
5,967,612
Industrial Conglomerates—1.5%3M Co. . . . . . . . . . . . . . . . . . . . . . . . . . . . . . . . . . . . . . . 169,839 35,786,776General Electric Co. . . . . . . . . . . . . . . . . . . . . . . . . . . . . . . 2,516,280 28,408,801Honeywell International, Inc. . . . . . . . . . . . . . . . . . . . . . . . . 215,004 35,776,666Roper Technologies, Inc. . . . . . . . . . . . . . . . . . . . . . . . . . . . 29,921 8,862,899
108,835,142
Insurance—2.3%Aflac, Inc. . . . . . . . . . . . . . . . . . . . . . . . . . . . . . . . . . . . . . 222,296 10,463,473Allstate Corp. (The) . . . . . . . . . . . . . . . . . . . . . . . . . . . . . . 100,243 9,893,984American International Group, Inc. . . . . . . . . . . . . . . . . . . . . 257,226 13,694,712Aon plc . . . . . . . . . . . . . . . . . . . . . . . . . . . . . . . . . . . . . . 70,255 10,803,814Arthur J. Gallagher & Co. (a) . . . . . . . . . . . . . . . . . . . . . . . . 52,870 3,935,643Assurant, Inc. (a) . . . . . . . . . . . . . . . . . . . . . . . . . . . . . . . . 15,282 1,649,692Brighthouse Financial, Inc. (b) (c) . . . . . . . . . . . . . . . . . . . . . 34,680 1,534,243Chubb, Ltd. (a) . . . . . . . . . . . . . . . . . . . . . . . . . . . . . . . . . 134,125 17,924,465Cincinnati Financial Corp. (a) . . . . . . . . . . . . . . . . . . . . . . . . 43,795 3,363,894Everest Re Group, Ltd. (a) . . . . . . . . . . . . . . . . . . . . . . . . . . 11,829 2,702,572Hartford Financial Services Group, Inc. (The) . . . . . . . . . . . . . . 103,771 5,184,399Lincoln National Corp. . . . . . . . . . . . . . . . . . . . . . . . . . . . . . 62,734 4,244,583Loews Corp. . . . . . . . . . . . . . . . . . . . . . . . . . . . . . . . . . . . 80,506 4,043,816Marsh & McLennan Cos., Inc. . . . . . . . . . . . . . . . . . . . . . . . . 146,204 12,093,995MetLife, Inc. (c) . . . . . . . . . . . . . . . . . . . . . . . . . . . . . . . . . 288,029 13,456,715Principal Financial Group, Inc. (a) . . . . . . . . . . . . . . . . . . . . . 76,670 4,492,095Progressive Corp. (The) . . . . . . . . . . . . . . . . . . . . . . . . . . . . 168,821 11,993,044Prudential Financial, Inc. . . . . . . . . . . . . . . . . . . . . . . . . . . . 120,732 12,232,566Torchmark Corp. . . . . . . . . . . . . . . . . . . . . . . . . . . . . . . . . 30,017 2,602,174Travelers Cos., Inc. (The) . . . . . . . . . . . . . . . . . . . . . . . . . . . 77,501 10,052,655Unum Group . . . . . . . . . . . . . . . . . . . . . . . . . . . . . . . . . . . 63,320 2,473,912Willis Towers Watson plc (a) . . . . . . . . . . . . . . . . . . . . . . . . . 37,861 5,336,129
164,172,575
Interactive Media & Services—4.6%Alphabet, Inc. - Class A (b) . . . . . . . . . . . . . . . . . . . . . . . . . . 86,543 104,464,324Alphabet, Inc. - Class C (b) (d) . . . . . . . . . . . . . . . . . . . . . . . 89,144 106,390,690Facebook, Inc. - Class A (b) . . . . . . . . . . . . . . . . . . . . . . . . . 698,241 114,832,715TripAdvisor, Inc. (b) . . . . . . . . . . . . . . . . . . . . . . . . . . . . . . 29,616 1,512,489Twitter, Inc. (b) . . . . . . . . . . . . . . . . . . . . . . . . . . . . . . . . . 208,444 5,932,316
333,132,534
Internet & Direct Marketing Retail—3.9%Amazon.com, Inc. (b) . . . . . . . . . . . . . . . . . . . . . . . . . . . . . 118,619 237,593,857Booking Holdings, Inc. (a) (b) . . . . . . . . . . . . . . . . . . . . . . . 13,745 27,270,080eBay, Inc. (b) . . . . . . . . . . . . . . . . . . . . . . . . . . . . . . . . . . 269,309 8,892,583Expedia Group, Inc. (a) . . . . . . . . . . . . . . . . . . . . . . . . . . . . 34,421 4,491,252
278,247,772
IT Services—4.8%Accenture plc - Class A . . . . . . . . . . . . . . . . . . . . . . . . . . . . . 185,512 31,574,142Akamai Technologies, Inc. (b) . . . . . . . . . . . . . . . . . . . . . . . . 49,075 3,589,836Alliance Data Systems Corp. (a) . . . . . . . . . . . . . . . . . . . . . . 13,681 3,230,905
BHFTII-191

Brighthouse Funds Trust II
MetLife Stock Index Portfolio
Schedule of Investments as of September 30, 2018 (Unaudited)
Common Stocks—(Continued)
Security Description Shares Value
IT Services—(Continued)Automatic Data Processing, Inc. . . . . . . . . . . . . . . . . . . . . . . 126,836 $ 19,109,112Broadridge Financial Solutions, Inc. (a) . . . . . . . . . . . . . . . . . 33,679 4,443,944Cognizant Technology Solutions Corp. - Class A . . . . . . . . . . . . 167,992 12,960,583DXC Technology Co. . . . . . . . . . . . . . . . . . . . . . . . . . . . . . . 81,403 7,612,809Fidelity National Information Services, Inc. . . . . . . . . . . . . . . . 95,202 10,383,682Fiserv, Inc. (b) . . . . . . . . . . . . . . . . . . . . . . . . . . . . . . . . . . 117,236 9,657,902FleetCor Technologies, Inc. (b) . . . . . . . . . . . . . . . . . . . . . . . 25,591 5,830,653Gartner, Inc. (a) (b) . . . . . . . . . . . . . . . . . . . . . . . . . . . . . . 26,294 4,167,599Global Payments, Inc. (a) . . . . . . . . . . . . . . . . . . . . . . . . . . 45,798 5,834,665International Business Machines Corp. . . . . . . . . . . . . . . . . . . 264,269 39,960,115MasterCard, Inc. - Class A . . . . . . . . . . . . . . . . . . . . . . . . . . 264,133 58,798,647Paychex, Inc. (a) . . . . . . . . . . . . . . . . . . . . . . . . . . . . . . . . 92,684 6,826,177PayPal Holdings, Inc. (b) . . . . . . . . . . . . . . . . . . . . . . . . . . . 342,702 30,102,944Total System Services, Inc. . . . . . . . . . . . . . . . . . . . . . . . . . . 48,589 4,797,678VeriSign, Inc. (b) . . . . . . . . . . . . . . . . . . . . . . . . . . . . . . . . 31,063 4,973,808Visa, Inc. - Class A (a) . . . . . . . . . . . . . . . . . . . . . . . . . . . . . 514,386 77,204,195Western Union Co. (The) (a) . . . . . . . . . . . . . . . . . . . . . . . . . 129,490 2,468,079
343,527,475
Leisure Products—0.1%Hasbro, Inc. (a) . . . . . . . . . . . . . . . . . . . . . . . . . . . . . . . . . 33,812 3,554,317Mattel, Inc. (a) (b) . . . . . . . . . . . . . . . . . . . . . . . . . . . . . . . 99,640 1,564,348
5,118,665
Life Sciences Tools & Services—1.0%Agilent Technologies, Inc. . . . . . . . . . . . . . . . . . . . . . . . . . . 92,291 6,510,207Illumina, Inc. (b) . . . . . . . . . . . . . . . . . . . . . . . . . . . . . . . . 42,560 15,622,074IQVIA Holdings, Inc. (b) . . . . . . . . . . . . . . . . . . . . . . . . . . . 46,923 6,087,790Mettler-Toledo International, Inc. (a) (b) . . . . . . . . . . . . . . . . 7,300 4,445,554PerkinElmer, Inc. (a) . . . . . . . . . . . . . . . . . . . . . . . . . . . . . 32,060 3,118,476Thermo Fisher Scientific, Inc. . . . . . . . . . . . . . . . . . . . . . . . . 116,620 28,464,609Waters Corp. (a) (b) . . . . . . . . . . . . . . . . . . . . . . . . . . . . . . 22,313 4,343,895
68,592,605
Machinery—1.5%Caterpillar, Inc. . . . . . . . . . . . . . . . . . . . . . . . . . . . . . . . . . 172,072 26,239,259Cummins, Inc. (a) . . . . . . . . . . . . . . . . . . . . . . . . . . . . . . . 43,500 6,354,045Deere & Co. . . . . . . . . . . . . . . . . . . . . . . . . . . . . . . . . . . . 93,133 14,000,684Dover Corp. . . . . . . . . . . . . . . . . . . . . . . . . . . . . . . . . . . . 42,764 3,785,897Flowserve Corp. (a) . . . . . . . . . . . . . . . . . . . . . . . . . . . . . . 37,885 2,071,931Fortive Corp. (a) . . . . . . . . . . . . . . . . . . . . . . . . . . . . . . . . 89,049 7,497,926Illinois Tool Works, Inc. . . . . . . . . . . . . . . . . . . . . . . . . . . . . 89,326 12,605,685Ingersoll-Rand plc . . . . . . . . . . . . . . . . . . . . . . . . . . . . . . . 71,023 7,265,653PACCAR, Inc. . . . . . . . . . . . . . . . . . . . . . . . . . . . . . . . . . . . 101,490 6,920,603Parker-Hannifin Corp. . . . . . . . . . . . . . . . . . . . . . . . . . . . . . 38,322 7,048,565Pentair plc (a) . . . . . . . . . . . . . . . . . . . . . . . . . . . . . . . . . . 46,721 2,025,355Snap-on, Inc. (a) . . . . . . . . . . . . . . . . . . . . . . . . . . . . . . . . 16,330 2,998,188Stanley Black & Decker, Inc. . . . . . . . . . . . . . . . . . . . . . . . . 44,300 6,487,292Xylem, Inc. . . . . . . . . . . . . . . . . . . . . . . . . . . . . . . . . . . . . 52,004 4,153,560
109,454,643
Media—1.2%CBS Corp. - Class B . . . . . . . . . . . . . . . . . . . . . . . . . . . . . . . 98,011 5,630,732Charter Communications, Inc. - Class A (a) (b) . . . . . . . . . . . . . 51,691 16,845,063Comcast Corp. - Class A . . . . . . . . . . . . . . . . . . . . . . . . . . . . 1,323,847 46,877,422
Security Description Shares Value
Media—(Continued)Discovery, Inc. - Class A (a) (b) . . . . . . . . . . . . . . . . . . . . . . . 45,236 $ 1,447,552Discovery, Inc. - Class C (b) . . . . . . . . . . . . . . . . . . . . . . . . . 104,132 3,080,225DISH Network Corp. - Class A (a) (b) . . . . . . . . . . . . . . . . . . . 66,324 2,371,746Interpublic Group of Cos., Inc. (The) (a) . . . . . . . . . . . . . . . . . 111,115 2,541,200News Corp. - Class A (a) . . . . . . . . . . . . . . . . . . . . . . . . . . . 111,000 1,464,090News Corp. - Class B (a) . . . . . . . . . . . . . . . . . . . . . . . . . . . 35,834 487,342Omnicom Group, Inc. (a) . . . . . . . . . . . . . . . . . . . . . . . . . . . 64,961 4,418,647
85,164,019
Metals & Mining—0.2%Freeport-McMoRan, Inc. . . . . . . . . . . . . . . . . . . . . . . . . . . . 419,521 5,839,732Newmont Mining Corp. (a) . . . . . . . . . . . . . . . . . . . . . . . . . . 154,432 4,663,847Nucor Corp. (a) . . . . . . . . . . . . . . . . . . . . . . . . . . . . . . . . . 91,589 5,811,322
16,314,901
Multi-Utilities—0.9%Ameren Corp. (a) . . . . . . . . . . . . . . . . . . . . . . . . . . . . . . . . 70,655 4,466,809CenterPoint Energy, Inc. (a) . . . . . . . . . . . . . . . . . . . . . . . . . 142,476 3,939,461CMS Energy Corp. (a) . . . . . . . . . . . . . . . . . . . . . . . . . . . . . 82,012 4,018,588Consolidated Edison, Inc. (a) . . . . . . . . . . . . . . . . . . . . . . . . 90,072 6,862,586Dominion Energy, Inc. (a) . . . . . . . . . . . . . . . . . . . . . . . . . . 189,281 13,302,669DTE Energy Co. (a) . . . . . . . . . . . . . . . . . . . . . . . . . . . . . . . 52,628 5,743,294NiSource, Inc. (a) . . . . . . . . . . . . . . . . . . . . . . . . . . . . . . . . 105,108 2,619,291Public Service Enterprise Group, Inc. . . . . . . . . . . . . . . . . . . . 146,303 7,723,335SCANA Corp. (a) . . . . . . . . . . . . . . . . . . . . . . . . . . . . . . . . 41,293 1,605,885Sempra Energy (a) . . . . . . . . . . . . . . . . . . . . . . . . . . . . . . . 79,173 9,005,929WEC Energy Group, Inc. (a) . . . . . . . . . . . . . . . . . . . . . . . . . 91,354 6,098,793
65,386,640
Multiline Retail—0.5%Dollar General Corp. . . . . . . . . . . . . . . . . . . . . . . . . . . . . . . 76,879 8,402,875Dollar Tree, Inc. (b) . . . . . . . . . . . . . . . . . . . . . . . . . . . . . . 68,874 5,616,675Kohl’s Corp. (a) . . . . . . . . . . . . . . . . . . . . . . . . . . . . . . . . . 48,267 3,598,305Macy’s, Inc. (a) . . . . . . . . . . . . . . . . . . . . . . . . . . . . . . . . . 88,876 3,086,663Nordstrom, Inc. (a) . . . . . . . . . . . . . . . . . . . . . . . . . . . . . . 33,186 1,984,855Target Corp. . . . . . . . . . . . . . . . . . . . . . . . . . . . . . . . . . . . 152,391 13,442,410
36,131,783
Oil, Gas & Consumable Fuels—5.2%Anadarko Petroleum Corp. . . . . . . . . . . . . . . . . . . . . . . . . . . 148,258 9,994,072Apache Corp. (a) . . . . . . . . . . . . . . . . . . . . . . . . . . . . . . . . 110,739 5,278,928Cabot Oil & Gas Corp. (a) . . . . . . . . . . . . . . . . . . . . . . . . . . 127,731 2,876,502Chevron Corp. . . . . . . . . . . . . . . . . . . . . . . . . . . . . . . . . . . 554,771 67,837,398Cimarex Energy Co. (a) . . . . . . . . . . . . . . . . . . . . . . . . . . . . 27,608 2,565,888Concho Resources, Inc. (a) (b) . . . . . . . . . . . . . . . . . . . . . . . 57,981 8,856,598ConocoPhillips . . . . . . . . . . . . . . . . . . . . . . . . . . . . . . . . . . 336,455 26,041,617Devon Energy Corp. . . . . . . . . . . . . . . . . . . . . . . . . . . . . . . 147,310 5,883,561EOG Resources, Inc. . . . . . . . . . . . . . . . . . . . . . . . . . . . . . . 167,693 21,392,596EQT Corp. (a) . . . . . . . . . . . . . . . . . . . . . . . . . . . . . . . . . . 76,434 3,380,676Exxon Mobil Corp. . . . . . . . . . . . . . . . . . . . . . . . . . . . . . . . 1,225,791 104,216,751Hess Corp. . . . . . . . . . . . . . . . . . . . . . . . . . . . . . . . . . . . . 72,884 5,217,037HollyFrontier Corp. (a) . . . . . . . . . . . . . . . . . . . . . . . . . . . . 46,926 3,280,127Kinder Morgan, Inc. (a) . . . . . . . . . . . . . . . . . . . . . . . . . . . . 549,480 9,742,280Marathon Oil Corp. . . . . . . . . . . . . . . . . . . . . . . . . . . . . . . . 247,296 5,757,051Marathon Petroleum Corp. (a) . . . . . . . . . . . . . . . . . . . . . . . 194,121 15,523,856
BHFTII-192

Brighthouse Funds Trust II
MetLife Stock Index Portfolio
Schedule of Investments as of September 30, 2018 (Unaudited)
Common Stocks—(Continued)
Security Description Shares Value
Oil, Gas & Consumable Fuels—(Continued)Newfield Exploration Co. (a) (b) . . . . . . . . . . . . . . . . . . . . . . 57,863 $ 1,668,190Noble Energy, Inc. (a) . . . . . . . . . . . . . . . . . . . . . . . . . . . . . 139,874 4,362,670Occidental Petroleum Corp. . . . . . . . . . . . . . . . . . . . . . . . . . 221,405 18,192,849ONEOK, Inc. (a) . . . . . . . . . . . . . . . . . . . . . . . . . . . . . . . . . 119,066 8,071,484Phillips 66 . . . . . . . . . . . . . . . . . . . . . . . . . . . . . . . . . . . . 123,662 13,939,181Pioneer Natural Resources Co. . . . . . . . . . . . . . . . . . . . . . . . 49,335 8,593,664Valero Energy Corp. (a) . . . . . . . . . . . . . . . . . . . . . . . . . . . 123,742 14,075,652Williams Cos., Inc. (The) (a) . . . . . . . . . . . . . . . . . . . . . . . . . 350,142 9,520,361
376,268,989
Personal Products—0.1%Coty, Inc. - Class A (a) . . . . . . . . . . . . . . . . . . . . . . . . . . . . . 130,423 1,638,113Estee Lauder Cos., Inc. (The) - Class A . . . . . . . . . . . . . . . . . . 64,895 9,430,541
11,068,654
Pharmaceuticals—4.7%Allergan plc . . . . . . . . . . . . . . . . . . . . . . . . . . . . . . . . . . . 92,381 17,596,733Bristol-Myers Squibb Co. . . . . . . . . . . . . . . . . . . . . . . . . . . . 472,468 29,330,813Eli Lilly & Co. . . . . . . . . . . . . . . . . . . . . . . . . . . . . . . . . . . 276,742 29,697,184Johnson & Johnson . . . . . . . . . . . . . . . . . . . . . . . . . . . . . . 776,724 107,319,955Merck & Co., Inc. . . . . . . . . . . . . . . . . . . . . . . . . . . . . . . . . 769,997 54,623,587Mylan NV (b) . . . . . . . . . . . . . . . . . . . . . . . . . . . . . . . . . . 149,269 5,463,245Nektar Therapeutics (a) (b) . . . . . . . . . . . . . . . . . . . . . . . . . 49,933 3,043,916Perrigo Co. plc (a) . . . . . . . . . . . . . . . . . . . . . . . . . . . . . . . 36,447 2,580,448Pfizer, Inc. . . . . . . . . . . . . . . . . . . . . . . . . . . . . . . . . . . . . 1,697,224 74,796,662Zoetis, Inc. . . . . . . . . . . . . . . . . . . . . . . . . . . . . . . . . . . . . 139,500 12,772,620
337,225,163
Professional Services—0.3%Equifax, Inc. . . . . . . . . . . . . . . . . . . . . . . . . . . . . . . . . . . . 34,862 4,551,931IHS Markit, Ltd. (b) . . . . . . . . . . . . . . . . . . . . . . . . . . . . . . 103,283 5,573,151Nielsen Holdings plc (a) . . . . . . . . . . . . . . . . . . . . . . . . . . . 103,135 2,852,714Robert Half International, Inc. (a) . . . . . . . . . . . . . . . . . . . . . 35,450 2,494,971Verisk Analytics, Inc. (a) (b) . . . . . . . . . . . . . . . . . . . . . . . . . 47,687 5,748,668
21,221,435
Real Estate Management & Development—0.1%CBRE Group, Inc. - Class A (b) . . . . . . . . . . . . . . . . . . . . . . . . 91,493 4,034,841
Road & Rail—1.0%CSX Corp. . . . . . . . . . . . . . . . . . . . . . . . . . . . . . . . . . . . . . 236,214 17,491,647J.B. Hunt Transport Services, Inc. (a) . . . . . . . . . . . . . . . . . . . 25,326 3,012,274Kansas City Southern (a) . . . . . . . . . . . . . . . . . . . . . . . . . . . 29,577 3,350,482Norfolk Southern Corp. . . . . . . . . . . . . . . . . . . . . . . . . . . . . 81,076 14,634,218Union Pacific Corp. . . . . . . . . . . . . . . . . . . . . . . . . . . . . . . . 214,102 34,862,229
73,350,850
Semiconductors & Semiconductor Equipment—3.9%Advanced Micro Devices, Inc. (a) (b) . . . . . . . . . . . . . . . . . . . 248,379 7,672,427Analog Devices, Inc. . . . . . . . . . . . . . . . . . . . . . . . . . . . . . . 107,607 9,949,343Applied Materials, Inc. . . . . . . . . . . . . . . . . . . . . . . . . . . . . 284,599 10,999,751Broadcom, Inc. . . . . . . . . . . . . . . . . . . . . . . . . . . . . . . . . . 124,982 30,836,809Intel Corp. . . . . . . . . . . . . . . . . . . . . . . . . . . . . . . . . . . . . 1,334,997 63,132,008KLA-Tencor Corp. (a) . . . . . . . . . . . . . . . . . . . . . . . . . . . . . 45,202 4,597,495Lam Research Corp. . . . . . . . . . . . . . . . . . . . . . . . . . . . . . . 45,623 6,921,009
Security Description Shares Value
Semiconductors & Semiconductor Equipment—(Continued)Microchip Technology, Inc. (a) . . . . . . . . . . . . . . . . . . . . . . . 68,200 $ 5,381,662Micron Technology, Inc. (a) (b) . . . . . . . . . . . . . . . . . . . . . . . 335,793 15,187,917NVIDIA Corp. . . . . . . . . . . . . . . . . . . . . . . . . . . . . . . . . . . 176,031 49,468,232Qorvo, Inc. (a) (b) . . . . . . . . . . . . . . . . . . . . . . . . . . . . . . . 36,376 2,796,951QUALCOMM, Inc. (a) . . . . . . . . . . . . . . . . . . . . . . . . . . . . . 407,192 29,330,040Skyworks Solutions, Inc. . . . . . . . . . . . . . . . . . . . . . . . . . . . 51,819 4,700,502Texas Instruments, Inc. . . . . . . . . . . . . . . . . . . . . . . . . . . . . 281,474 30,199,346Xilinx, Inc. (a) . . . . . . . . . . . . . . . . . . . . . . . . . . . . . . . . . . 73,224 5,870,368
277,043,860
Software—6.0%Adobe Systems, Inc. (b) . . . . . . . . . . . . . . . . . . . . . . . . . . . . 141,770 38,270,812ANSYS, Inc. (b) . . . . . . . . . . . . . . . . . . . . . . . . . . . . . . . . . 24,406 4,556,112Autodesk, Inc. (b) . . . . . . . . . . . . . . . . . . . . . . . . . . . . . . . 63,295 9,880,983CA, Inc. (a) . . . . . . . . . . . . . . . . . . . . . . . . . . . . . . . . . . . . 90,803 4,008,952Cadence Design Systems, Inc. (a) (b) . . . . . . . . . . . . . . . . . . . 81,879 3,710,756Citrix Systems, Inc. (a) (b) . . . . . . . . . . . . . . . . . . . . . . . . . . 37,312 4,147,602Intuit, Inc. . . . . . . . . . . . . . . . . . . . . . . . . . . . . . . . . . . . . 74,892 17,030,441Microsoft Corp. . . . . . . . . . . . . . . . . . . . . . . . . . . . . . . . . . 2,220,136 253,916,954Oracle Corp. . . . . . . . . . . . . . . . . . . . . . . . . . . . . . . . . . . . 818,375 42,195,415Red Hat, Inc. (a) (b) . . . . . . . . . . . . . . . . . . . . . . . . . . . . . . 51,354 6,998,523Salesforce.com, Inc. (a) (b) . . . . . . . . . . . . . . . . . . . . . . . . . 219,083 34,840,770Symantec Corp. (a) . . . . . . . . . . . . . . . . . . . . . . . . . . . . . . 179,950 3,829,336Synopsys, Inc. (b) . . . . . . . . . . . . . . . . . . . . . . . . . . . . . . . 43,020 4,242,202
427,628,858
Specialty Retail—2.4%Advance Auto Parts, Inc. . . . . . . . . . . . . . . . . . . . . . . . . . . . 21,448 3,610,342AutoZone, Inc. (b) . . . . . . . . . . . . . . . . . . . . . . . . . . . . . . . 7,654 5,937,208Best Buy Co., Inc. (a) . . . . . . . . . . . . . . . . . . . . . . . . . . . . . 70,375 5,584,960CarMax, Inc. (a) (b) . . . . . . . . . . . . . . . . . . . . . . . . . . . . . . 51,119 3,817,056Foot Locker, Inc. (a) . . . . . . . . . . . . . . . . . . . . . . . . . . . . . . 33,848 1,725,571Gap, Inc. (The) (a) . . . . . . . . . . . . . . . . . . . . . . . . . . . . . . . 62,821 1,812,386Home Depot, Inc. (The) . . . . . . . . . . . . . . . . . . . . . . . . . . . . 331,256 68,619,680L Brands, Inc. (a) . . . . . . . . . . . . . . . . . . . . . . . . . . . . . . . . 66,099 2,002,799Lowe’s Cos., Inc. . . . . . . . . . . . . . . . . . . . . . . . . . . . . . . . . 234,804 26,960,195O’Reilly Automotive, Inc. (b) . . . . . . . . . . . . . . . . . . . . . . . . 23,325 8,101,239Ross Stores, Inc. (a) . . . . . . . . . . . . . . . . . . . . . . . . . . . . . . 109,018 10,803,684Tiffany & Co. . . . . . . . . . . . . . . . . . . . . . . . . . . . . . . . . . . 31,542 4,067,972TJX Cos., Inc. (The) . . . . . . . . . . . . . . . . . . . . . . . . . . . . . . . 181,553 20,337,567Tractor Supply Co. (a) . . . . . . . . . . . . . . . . . . . . . . . . . . . . . 35,265 3,204,883Ulta Salon Cosmetics & Fragrance, Inc. (b) . . . . . . . . . . . . . . . 16,440 4,638,053
171,223,595
Technology Hardware, Storage & Peripherals—4.7%Apple, Inc. . . . . . . . . . . . . . . . . . . . . . . . . . . . . . . . . . . . . 1,328,463 299,887,238Hewlett Packard Enterprise Co. . . . . . . . . . . . . . . . . . . . . . . . 426,078 6,949,332HP, Inc. . . . . . . . . . . . . . . . . . . . . . . . . . . . . . . . . . . . . . . 458,146 11,806,422NetApp, Inc. (a) . . . . . . . . . . . . . . . . . . . . . . . . . . . . . . . . . 75,064 6,447,247Seagate Technology plc (a) . . . . . . . . . . . . . . . . . . . . . . . . . 75,663 3,582,643Western Digital Corp. (a) . . . . . . . . . . . . . . . . . . . . . . . . . . . 84,354 4,938,083Xerox Corp. (a) . . . . . . . . . . . . . . . . . . . . . . . . . . . . . . . . . 64,256 1,733,627
335,344,592
BHFTII-193

Brighthouse Funds Trust II
MetLife Stock Index Portfolio
Schedule of Investments as of September 30, 2018 (Unaudited)
Common Stocks—(Continued)
Security Description
Shares/PrincipalAmount* Value
Textiles, Apparel & Luxury Goods—0.8%Hanesbrands, Inc. (a) . . . . . . . . . . . . . . . . . . . . . . . . . . . . . 104,375 $ 1,923,631Michael Kors Holdings, Ltd. (b) . . . . . . . . . . . . . . . . . . . . . . . 43,232 2,963,986NIKE, Inc. - Class B . . . . . . . . . . . . . . . . . . . . . . . . . . . . . . . 370,733 31,408,500PVH Corp. . . . . . . . . . . . . . . . . . . . . . . . . . . . . . . . . . . . . 22,211 3,207,269Ralph Lauren Corp. (a) . . . . . . . . . . . . . . . . . . . . . . . . . . . . 15,996 2,200,250Tapestry, Inc. . . . . . . . . . . . . . . . . . . . . . . . . . . . . . . . . . . 83,394 4,192,216Under Armour, Inc. - Class A (a) (b) . . . . . . . . . . . . . . . . . . . . 53,870 1,143,121Under Armour, Inc. - Class C (a) (b) . . . . . . . . . . . . . . . . . . . . 55,229 1,074,756VF Corp. . . . . . . . . . . . . . . . . . . . . . . . . . . . . . . . . . . . . . . 94,124 8,795,888
56,909,617
Tobacco—1.0%Altria Group, Inc. . . . . . . . . . . . . . . . . . . . . . . . . . . . . . . . . 545,804 32,917,439Philip Morris International, Inc. . . . . . . . . . . . . . . . . . . . . . . . 450,068 36,698,545
69,615,984
Trading Companies & Distributors—0.2%Fastenal Co. (a) . . . . . . . . . . . . . . . . . . . . . . . . . . . . . . . . . 83,078 4,820,185United Rentals, Inc. (b) . . . . . . . . . . . . . . . . . . . . . . . . . . . . 23,958 3,919,529WW Grainger, Inc. . . . . . . . . . . . . . . . . . . . . . . . . . . . . . . . 13,165 4,705,303
13,445,017
Water Utilities—0.1%American Water Works Co., Inc. (a) . . . . . . . . . . . . . . . . . . . . 52,257 4,597,048
Total Common Stocks(Cost $3,211,376,754) . . . . . . . . . . . . . . . . . . . . . . . . . 7,117,440,597
Mutual Fund—0.2%
Investment Company Security—0.2%SPDR S&P 500 ETF Trust (a)
(Cost $15,132,375) . . . . . . . . . . . . . . . . . . . . . . . . . . . . 53,000 15,408,160
Short-Term Investments—0.4%
Discount Notes—0.3%Fannie Mae
0.010%, 10/01/18 (e) . . . . . . . . . . . . . . . . . . . . . . . . . 550,000 550,000Federal Home Loan Bank
1.936%, 10/24/18 (e) . . . . . . . . . . . . . . . . . . . . . . . . . 1,325,000 1,323,2142.042%, 11/14/18 (e) . . . . . . . . . . . . . . . . . . . . . . . . . 1,225,000 1,221,7812.084%, 11/21/18 (e) . . . . . . . . . . . . . . . . . . . . . . . . . 3,650,000 3,638,8822.098%, 11/07/18 (e) . . . . . . . . . . . . . . . . . . . . . . . . . 300,000 299,3372.104%, 11/28/18 (e) . . . . . . . . . . . . . . . . . . . . . . . . . 7,525,000 7,498,9332.159%, 12/12/18 (e) . . . . . . . . . . . . . . . . . . . . . . . . . 2,200,000 2,190,408
Freddie Mac2.016%, 11/13/18 (e) . . . . . . . . . . . . . . . . . . . . . . . . . 5,200,000 5,186,6462.094%, 12/04/18 (e) . . . . . . . . . . . . . . . . . . . . . . . . . 750,000 747,093
22,656,294
Security DescriptionPrincipalAmount* Value
U.S. Treasury—0.1%U.S. Treasury Bills
2.041%, 11/29/18 (e) . . . . . . . . . . . . . . . . . . . . . . . . . 1,425,000 $ 1,420,0522.060%, 11/15/18 (e) . . . . . . . . . . . . . . . . . . . . . . . . . 375,000 374,0232.104%, 12/13/18 (e) . . . . . . . . . . . . . . . . . . . . . . . . . 3,475,000 3,460,044
5,254,119
Total Short-Term Investments(Cost $27,912,917) . . . . . . . . . . . . . . . . . . . . . . . . . . . . 27,910,413
Securities Lending Reinvestments (f)—11.0%
Bank Note—0.1%Bank of America N.A.
2.398%, 1M LIBOR + 0.250%, 11/13/18 (g) . . . . . . . . . . . 5,000,000 5,000,000
Certificates of Deposit—5.6%Banco Del Estado De Chile New York
2.419%, 3M LIBOR + 0.100%, 11/14/18 (g) . . . . . . . . . . . 5,000,000 4,999,9152.466%, 1M LIBOR + 0.250%, 03/20/19 (g) . . . . . . . . . . . 10,000,000 9,999,480
Banco Santander S.A.2.340%, 11/07/18 . . . . . . . . . . . . . . . . . . . . . . . . . . . . 15,000,000 15,001,230
Bank of MontrealZero Coupon, 10/31/18 . . . . . . . . . . . . . . . . . . . . . . . . . 11,974,425 11,976,750
Bank of Montreal (Chicago)2.371%, 3M LIBOR + 0.030%, 11/06/18 (g) . . . . . . . . . . . 5,000,000 4,999,990
Bank of Nova Scotia2.618%, 3M LIBOR + 0.280%, 03/20/19 (g) . . . . . . . . . . . 15,000,000 15,014,310
Barclays Bank plc2.304%, 1M LIBOR + 0.200%, 02/04/19 (g) . . . . . . . . . . . 5,000,000 4,998,9852.500%, 02/01/19 . . . . . . . . . . . . . . . . . . . . . . . . . . . . 8,000,000 7,999,888
BNP Paribas S.A. New York2.574%, 1M LIBOR + 0.470%, 12/04/18 (g) . . . . . . . . . . . 15,000,000 15,008,805
Chiba Bank, Ltd., New York2.190%, 10/05/18 . . . . . . . . . . . . . . . . . . . . . . . . . . . . 2,000,000 1,999,962
Commonwealth Bank of Australia2.358%, 1M LIBOR + 0.210%, 09/13/19 (g) . . . . . . . . . . . 12,000,000 12,000,0002.487%, 3M LIBOR + 0.140%, 04/23/19 (g) . . . . . . . . . . . 4,000,000 4,001,432
Cooperative Rabobank UA2.479%, 3M LIBOR + 0.140%, 10/16/18 (g) . . . . . . . . . . . 10,500,000 10,500,7862.543%, 3M LIBOR + 0.200%, 04/05/19 (g) . . . . . . . . . . . 10,000,000 10,007,660
Credit Agricole S.A.2.463%, 1M LIBOR + 0.330%, 10/09/18 (g) . . . . . . . . . . . 10,000,000 10,000,400
Industrial & Commercial Bank of China, Ltd.2.500%, 10/24/18 . . . . . . . . . . . . . . . . . . . . . . . . . . . . 7,500,000 7,500,0972.500%, 11/15/18 . . . . . . . . . . . . . . . . . . . . . . . . . . . . 20,000,000 19,999,5202.530%, 12/24/18 . . . . . . . . . . . . . . . . . . . . . . . . . . . . 3,000,000 2,999,934
KBC Bank NV2.400%, 12/27/18 . . . . . . . . . . . . . . . . . . . . . . . . . . . . 10,000,000 10,000,000
Landesbank Baden-Wuettertemberg2.180%, 10/02/18 . . . . . . . . . . . . . . . . . . . . . . . . . . . . 30,000,000 30,000,060
Mitsubishi UFJ Trust and Banking Corp.Zero Coupon, 01/15/19 . . . . . . . . . . . . . . . . . . . . . . . . . 7,939,899 7,941,554
Mizuho Bank, Ltd., New York2.468%, 1M LIBOR + 0.250%, 11/26/18 (g) . . . . . . . . . . . 10,000,000 9,999,670
BHFTII-194

Brighthouse Funds Trust II
MetLife Stock Index Portfolio
Schedule of Investments as of September 30, 2018 (Unaudited)
Securities Lending Reinvestments (f)—(Continued)
Security DescriptionPrincipalAmount* Value
Certificates of Deposit—(Continued)Natixis S.A. New York
2.431%, 3M LIBOR + 0.090%, 05/10/19 (g) . . . . . . . . . . . 5,000,000 $ 4,999,6052.504%, 1M LIBOR + 0.370%, 02/14/19 (g) . . . . . . . . . . . 10,000,000 10,006,6902.533%, 3M LIBOR + 0.190%, 02/01/19 (g) . . . . . . . . . . . 10,000,000 10,000,810
Nordea Bank New York2.543%, 3M LIBOR + 0.200%, 04/05/19 (g) . . . . . . . . . . . 10,000,000 10,000,000
Royal Bank of Canada New York2.378%, 1M LIBOR + 0.210%, 09/17/19 (g) . . . . . . . . . . . 15,000,000 14,999,175
Societe Generale2.504%, 1M LIBOR + 0.400%, 10/02/18 (g) . . . . . . . . . . . 10,000,000 9,999,830
Standard Chartered plc2.396%, 1M LIBOR + 0.180%, 02/25/19 (g) . . . . . . . . . . . 13,000,000 12,998,4792.551%, 1M LIBOR + 0.420%, 10/11/18 (g) . . . . . . . . . . . 10,000,000 10,000,500
Sumitomo Mitsui Banking Corp.2.321%, 1M LIBOR + 0.190%, 04/11/19 (g) . . . . . . . . . . . 15,000,000 14,999,295
Sumitomo Mitsui Banking Corp., New York2.290%, 1M LIBOR + 0.180%, 03/05/19 (g) . . . . . . . . . . . 5,000,000 4,999,415
Sumitomo Mitsui Trust Bank, Ltd.2.423%, 3M LIBOR + 0.090%, 10/18/18 (g) . . . . . . . . . . . 10,001,256 9,999,9302.443%, 3M LIBOR + 0.110%, 10/11/18 (g) . . . . . . . . . . . 8,000,000 8,000,0562.502%, 1M LIBOR + 0.320%, 11/21/18 (g) . . . . . . . . . . . 8,000,000 8,000,000
Sumitomo Mitsui Trust Bank, Ltd., London2.528%, 1M LIBOR + 0.310%, 11/26/18 (g) . . . . . . . . . . . 10,000,000 10,000,000
Svenska Handelsbanken AB2.439%, 3M LIBOR + 0.100%, 04/30/19 (g) . . . . . . . . . . . 15,000,000 15,001,7852.554%, 1M LIBOR + 0.450%, 04/03/19 (g) . . . . . . . . . . . 7,000,000 7,010,325
Toronto-Dominion Bank2.378%, 1M LIBOR + 0.210%, 09/17/19 (g) . . . . . . . . . . . 5,000,000 5,000,000
Westpac Banking Corp.2.630%, FEDEFF PRV + 0.450%, 02/15/19 (g) . . . . . . . . . 11,000,000 11,005,842
403,972,165
Commercial Paper—1.7%Bank of China, Ltd.
2.510%, 11/02/18 . . . . . . . . . . . . . . . . . . . . . . . . . . . . 20,866,761 20,953,8002.550%, 10/19/18 . . . . . . . . . . . . . . . . . . . . . . . . . . . . 4,969,188 4,993,5802.550%, 12/20/18 . . . . . . . . . . . . . . . . . . . . . . . . . . . . 4,968,125 4,971,235
ING Funding LLC2.448%, 3M LIBOR + 0.110%, 05/10/19 (g) . . . . . . . . . . . 10,000,000 10,001,0302.453%, 1M LIBOR + 0.320%, 02/08/19 (g) . . . . . . . . . . . 15,000,000 15,007,665
Mont Blanc Capital Corp.2.310%, 12/14/18 . . . . . . . . . . . . . . . . . . . . . . . . . . . . 8,060,136 8,066,657
Sheffield Receivables Co.2.490%, 11/26/18 . . . . . . . . . . . . . . . . . . . . . . . . . . . . 18,258,159 18,428,9422.510%, SOFR + 0.350%, 11/28/18 (g) . . . . . . . . . . . . . . 3,000,000 3,000,821
Sinopec Century Bright Capital Investment, Ltd.2.400%, 11/01/18 . . . . . . . . . . . . . . . . . . . . . . . . . . . . 9,940,000 9,978,340
Starbird Funding Corp.2.280%, 11/08/18 . . . . . . . . . . . . . . . . . . . . . . . . . . . . 9,943,000 9,974,460
Victory Receivables Corp.2.320%, 12/18/18 . . . . . . . . . . . . . . . . . . . . . . . . . . . . 9,942,000 9,947,040
Westpac Banking Corp.2.408%, 3M LIBOR + 0.070%, 08/07/19 (g) . . . . . . . . . . . 7,500,000 7,500,000
122,823,570
Security DescriptionPrincipalAmount* Value
Repurchase Agreements—3.1%Citigroup Global Markets, Inc.
Repurchase Agreement dated 05/03/18 at 2.440%, due on10/05/18 with a maturity value of $22,736,375;collateralized by U.S. Treasury Obligations with rates rangingfrom 1.625% - 2.250%, maturity dates ranging from11/30/19 - 11/15/27, and various Common Stock with anaggregate market value of $23,721,436. . . . . . . . . . . . . . 22,500,000 $ 22,500,000Repurchase Agreement dated 07/25/18 at 2.570%, due on11/02/18 with a maturity value of $18,128,500;collateralized by various Common Stock with an aggregatemarket value of $19,800,002. . . . . . . . . . . . . . . . . . . . . 18,000,000 18,000,000Repurchase Agreement dated 01/25/17 at 2.720%, due on12/31/18 with a maturity value of $1,053,267;collateralized by U.S. Treasury Obligations with rates rangingfrom 0.000% - 2.220%, maturity dates ranging from11/01/18 - 04/30/20, and an aggregate market value of$1,020,000. . . . . . . . . . . . . . . . . . . . . . . . . . . . . . . . . 1,000,000 1,000,000
Citigroup Global Markets, Ltd.Repurchase Agreement dated 09/28/18 at 2.240%, due on10/01/18 with a maturity value of $6,201,157;collateralized by U.S. Treasury and Foreign Obligations withrates ranging from 0.625% - 2.875%, maturity dates rangingfrom 01/15/19 - 02/15/43, and an aggregate market valueof $6,324,001. . . . . . . . . . . . . . . . . . . . . . . . . . . . . . . . 6,200,000 6,200,000
ING Bank NV, LondonRepurchase Agreement dated 08/03/18 at 2.420%, due on10/01/18 with a maturity value of $1,003,966;collateralized by various Common Stock with an aggregatemarket value of $1,111,246. . . . . . . . . . . . . . . . . . . . . . 1,000,000 1,000,000
Macquarie Bank, Ltd., LondonRepurchase Agreement dated 09/28/18 at 2.200%, due on10/01/18 with a maturity value of $2,641,247;collateralized by U.S. Treasury Obligations with rates rangingfrom 0.125% - 5.500%, maturity dates ranging from08/31/19 - 05/15/48, and an aggregate market value of$2,691,524. . . . . . . . . . . . . . . . . . . . . . . . . . . . . . . . . 2,640,763 2,640,763
Merrill Lynch, Pierce, Fenner & Smith, Inc.Repurchase Agreement dated 10/26/16 at 2.720%, due on12/31/18 with a maturity value of $11,767,579;collateralized by various Common Stock with an aggregatemarket value of $12,210,001. . . . . . . . . . . . . . . . . . . . . 11,100,000 11,100,000Repurchase Agreement dated 08/01/17 at 2.720%, due on12/31/18 with a maturity value of $12,468,747;collateralized by various Common Stock with an aggregatemarket value of $13,200,001. . . . . . . . . . . . . . . . . . . . . 12,000,000 12,000,000
Morgan Stanley & Co. LLCRepurchase Agreement dated 09/25/18 at 2.470%, due on10/02/18 with a maturity value of $20,009,606;collateralized by various Common Stock with an aggregatemarket value of $22,004,285. . . . . . . . . . . . . . . . . . . . . 20,000,000 20,000,000
NBC Global Finance Ltd.Repurchase Agreement dated 03/16/18 at 2.340%, due on10/01/18 with a maturity value of $6,178,904;collateralized by various Common Stock with an aggregatemarket value of $6,787,196. . . . . . . . . . . . . . . . . . . . . . 6,100,000 6,100,000
BHFTII-195

Brighthouse Funds Trust II
MetLife Stock Index Portfolio
Schedule of Investments as of September 30, 2018 (Unaudited)
Securities Lending Reinvestments (f)—(Continued)
Security DescriptionPrincipalAmount* Value
Repurchase Agreements—(Continued)NBC Global Finance, Ltd.
Repurchase Agreement dated 07/18/18 at 2.370%, due on10/05/18 with a maturity value of $18,897,776;collateralized by various Common Stock with an aggregatemarket value of $20,919,590. . . . . . . . . . . . . . . . . . . . . 18,800,000 $ 18,800,000Repurchase Agreement dated 07/19/18 at 2.370%, due on10/05/18 with a maturity value of $30,154,050;collateralized by various Common Stock with an aggregatemarket value of $33,382,324. . . . . . . . . . . . . . . . . . . . . 30,000,000 30,000,000
Societe GeneraleRepurchase Agreement dated 03/08/18 at 2.310%, due on10/01/18 with a maturity value of $4,053,130;collateralized by U.S. Treasury Obligations with rates rangingfrom 0.000% - 4.250%, maturity dates ranging from02/07/19 - 02/15/47, and various Common Stock with anaggregate market value of $4,442,594. . . . . . . . . . . . . . . 4,000,000 4,000,000Repurchase Agreement dated 03/21/18 at 2.310%, due on10/01/18 with a maturity value of $2,024,897;collateralized by U.S. Treasury Obligations with rates rangingfrom 0.000% - 4.250%, maturity dates ranging from02/07/19 - 02/15/47, and various Common Stock with anaggregate market value of $2,221,297. . . . . . . . . . . . . . . 2,000,000 2,000,000Repurchase Agreement dated 03/28/18 at 2.310%, due on10/01/18 with a maturity value of $1,011,999;collateralized by U.S. Treasury Obligations with rates rangingfrom 0.000% - 4.250%, maturity dates ranging from02/07/19 - 02/15/47, and various Common Stock with anaggregate market value of $1,110,648. . . . . . . . . . . . . . . 1,000,000 1,000,000Repurchase Agreement dated 07/10/18 at 2.340%, due on10/05/18 with a maturity value of $15,989,915;collateralized by U.S. Treasury Obligations with rates rangingfrom 0.000% - 4.250%, maturity dates ranging from02/07/19 - 02/15/47, and various Common Stock with anaggregate market value of $17,659,310. . . . . . . . . . . . . . 15,900,000 15,900,000Repurchase Agreement dated 04/18/18 at 2.340%, due on10/05/18 with a maturity value of $10,110,500;collateralized by U.S. Treasury Obligations with rates rangingfrom 0.000% - 4.250%, maturity dates ranging from02/07/19 - 02/15/47, and various Common Stock with anaggregate market value of $11,106,484. . . . . . . . . . . . . . 10,000,000 10,000,000Repurchase Agreement dated 05/10/18 at 2.340%, due on10/05/18 with a maturity value of $39,375,180;collateralized by U.S. Treasury Obligations with rates rangingfrom 0.000% - 4.250%, maturity dates ranging from02/07/19 - 02/15/47, and various Common Stock with anaggregate market value of $43,315,287. . . . . . . . . . . . . . 39,000,000 39,000,000
221,240,763
Security DescriptionPrincipalAmount* Value
Time Deposits—0.5%Cooperative Rabobank UA New York
2.150%, 10/01/18 . . . . . . . . . . . . . . . . . . . . . . . . . . . . 5,000,000 $ 5,000,000DZ Bank AG
2.150%, 10/01/18 . . . . . . . . . . . . . . . . . . . . . . . . . . . . 4,000,000 4,000,000Nordea Bank New York
2.140%, 10/01/18 . . . . . . . . . . . . . . . . . . . . . . . . . . . . 4,000,000 4,000,000Skandinaviska Enskilda Banken
2.130%, 10/01/18 . . . . . . . . . . . . . . . . . . . . . . . . . . . . 20,000,000 20,000,000Svenska Handelsbanken AB
2.140%, 10/01/18 . . . . . . . . . . . . . . . . . . . . . . . . . . . . 4,000,000 4,000,000
37,000,000
Total Securities Lending Reinvestments(Cost $789,980,581) . . . . . . . . . . . . . . . . . . . . . . . . . . . 790,036,498
Total Investments—110.9%(Cost $4,044,402,627) . . . . . . . . . . . . . . . . . . . . . . . . . 7,950,795,668
Other assets and liabilities (net)—(10.9)% . . . . . . . . . . . . . . (783,711,307)
Net Assets—100.0% . . . . . . . . . . . . . . . . . . . . . . . . . . $ 7,167,084,361
* Principal amount stated in U.S. dollars unless otherwise noted.(a) All or a portion of the security was held on loan. As of September 30, 2018, the market
value of securities loaned was $773,700,540 and the collateral received consisted ofcash in the amount of $789,603,711. The cash collateral investments are disclosed inthe Schedule of Investments and categorized as Securities Lending Reinvestments.
(b) Non-income producing security.(c) Affiliated Issuer.(d) All or a portion of the security was pledged as collateral against open futures contracts.
As of September 30, 2018, the market value of securities pledged was $23,935,041.(e) The rate shown represents current yield to maturity.(f) Represents investment of cash collateral received from securities on loan as of
September 30, 2018.(g) Variable or floating rate security. The stated rate represents the rate at September 30,
2018. Maturity date shown for callable securities reflects the earliest possible call date.For securities based on a published reference index and spread, the index and spreadare indicated in the description above. For certain variable rate securities, the couponrate is determined by the issuer/agent based on current market conditions. For certainasset- and mortgage-backed securities, the coupon rate may fluctuate based on changesof the underlying collateral or prepayments of principal. These securities do not indicatea reference index and spread in their description above.
Futures Contracts
Futures Contracts—LongExpiration
DateNumber ofContracts
NotionalAmount
Value/Unrealized
Appreciation
S&P 500 Index E-Mini Futures . . . . . . . . . . . . . . . . . . . . . . . . . . . . . . . . . . . . . . . . . . . . . . . . . . . . . . . . . . . . . . . . . . . . . 12/21/18 230 USD 33,568,500 $87,642
BHFTII-196

Brighthouse Funds Trust II
MetLife Stock Index Portfolio
Schedule of Investments as of September 30, 2018 (Unaudited)
Glossary of Abbreviations
Currencies
(USD)— United States Dollar
Index Abbreviations
(FEDEFF PRV)— Effective Federal Funds Rate(LIBOR)— London Interbank Offered Rate
(SOFR)— Secured Overnight Financing Rate
Other Abbreviations
(ETF)— Exchange-Traded Fund
Fair Value Hierarchy
Accounting principles generally accepted in the United States of America (“GAAP”) define fair market value as the price that the Portfolio would receive to sell an asset or pay to transfer a liability in an orderlytransaction between market participants at the measurement date. It establishes a fair value hierarchy that prioritizes inputs to valuation methods and requires disclosure of the fair value hierarchy, separatelyfor each major category of assets and liabilities, that segregates fair value measurements into three levels. Levels 1, 2 and 3 of the fair value hierarchy are defined as follows:
Level 1 - unadjusted quoted prices in active markets for identical investmentsLevel 2 - other significant observable inputs (including, but not limited to, quoted prices for similar assets or liabilities in markets that are either active or inactive; inputs other than quoted prices that areobservable such as interest rates, yield curves, volatilities, prepayment speeds, loss severities, credit risks, default rates, or other market corroborated inputs)Level 3 - significant unobservable inputs based on the best information available in the circumstances, to the extent observable inputs are unavailable (including the Portfolio’s own assumptions used indetermining the fair value of investments and derivative financial instruments)
The inputs or methodologies used for valuing investments are not necessarily an indication of the risk associated with investing in them. Changes to the inputs or methodologies used may result in transfersbetween levels, which will be recognized as of the beginning of the reporting period. Information on transfers between Level 1 and Level 2, if any, will be disclosed following the fair value hierarchy table below.A reconciliation of Level 3 securities, if any, will also be disclosed following the fair value hierarchy table. For more information about the Portfolio’s policy regarding the valuation of investments, please refer tothe Notes to Schedule of Investments.
The following table summarizes the fair value hierarchy of the Portfolio’s investments as of September 30, 2018:
Description Level 1 Level 2 Level 3 Total
Total Common Stocks* . . . . . . . . . . . . . . . . . . . . . . . . . . . . . . . . . . . . . . . . . . . . . . . . . . . . . . . . . . . . . . . . . . . . . . . . . . . $7,117,440,597 $ — $— $7,117,440,597
Total Mutual Fund* . . . . . . . . . . . . . . . . . . . . . . . . . . . . . . . . . . . . . . . . . . . . . . . . . . . . . . . . . . . . . . . . . . . . . . . . . . . . . 15,408,160 — — 15,408,160
Total Short-Term Investments* . . . . . . . . . . . . . . . . . . . . . . . . . . . . . . . . . . . . . . . . . . . . . . . . . . . . . . . . . . . . . . . . . . . . . . — 27,910,413 — 27,910,413
Total Securities Lending Reinvestments* . . . . . . . . . . . . . . . . . . . . . . . . . . . . . . . . . . . . . . . . . . . . . . . . . . . . . . . . . . . . . . . . — 790,036,498 — 790,036,498
Total Investments . . . . . . . . . . . . . . . . . . . . . . . . . . . . . . . . . . . . . . . . . . . . . . . . . . . . . . . . . . . . . . . . . . . . . . . . . . . . . . $7,132,848,757 $ 817,946,911 $— $7,950,795,668
Collateral for Securities Loaned (Liability) . . . . . . . . . . . . . . . . . . . . . . . . . . . . . . . . . . . . . . . . . . . . . . . . . . . . . . . . . . . . . . $ — $(789,603,711) $— $ (789,603,711)
Futures ContractsFutures Contracts (Unrealized Appreciation) . . . . . . . . . . . . . . . . . . . . . . . . . . . . . . . . . . . . . . . . . . . . . . . . . . . . . . . . . . . $ 87,642 $ — $— $ 87,642
* See Schedule of Investments for additional detailed categorizations.
BHFTII-197

Brighthouse Funds Trust II
MetLife MSCI EAFE Index Portfolio
Schedule of Investments as of September 30, 2018 (Unaudited)
Common Stocks—94.3% of Net Assets
Security Description Shares Value
Australia—6.7%AGL Energy, Ltd. . . . . . . . . . . . . . . . . . . . . . . . . . . . . . . . . . 45,920 $ 649,211Alumina, Ltd. . . . . . . . . . . . . . . . . . . . . . . . . . . . . . . . . . . . 191,453 382,767Amcor, Ltd. . . . . . . . . . . . . . . . . . . . . . . . . . . . . . . . . . . . . 83,280 822,487AMP, Ltd. . . . . . . . . . . . . . . . . . . . . . . . . . . . . . . . . . . . . . . 197,480 455,724APA Group . . . . . . . . . . . . . . . . . . . . . . . . . . . . . . . . . . . . . 80,604 583,635Aristocrat Leisure, Ltd. . . . . . . . . . . . . . . . . . . . . . . . . . . . . . 41,217 843,466ASX, Ltd. . . . . . . . . . . . . . . . . . . . . . . . . . . . . . . . . . . . . . . 14,426 662,077Aurizon Holdings, Ltd. . . . . . . . . . . . . . . . . . . . . . . . . . . . . . 157,842 468,869AusNet Services . . . . . . . . . . . . . . . . . . . . . . . . . . . . . . . . . . 135,720 159,973Australia & New Zealand Banking Group, Ltd. . . . . . . . . . . . . . . 210,073 4,274,169Bank of Queensland, Ltd. . . . . . . . . . . . . . . . . . . . . . . . . . . . 24,917 198,624Bendigo & Adelaide Bank, Ltd. . . . . . . . . . . . . . . . . . . . . . . . . 35,779 278,197BGP Holdings plc (a) (b) (c) (d) . . . . . . . . . . . . . . . . . . . . . . . 713,624 0BHP Billiton plc . . . . . . . . . . . . . . . . . . . . . . . . . . . . . . . . . . 154,705 3,363,633BHP Billiton, Ltd. . . . . . . . . . . . . . . . . . . . . . . . . . . . . . . . . . 234,635 5,846,337BlueScope Steel, Ltd. . . . . . . . . . . . . . . . . . . . . . . . . . . . . . . 45,759 560,514Boral, Ltd. . . . . . . . . . . . . . . . . . . . . . . . . . . . . . . . . . . . . . 86,560 430,426Brambles, Ltd. . . . . . . . . . . . . . . . . . . . . . . . . . . . . . . . . . . 109,798 866,016Caltex Australia, Ltd. . . . . . . . . . . . . . . . . . . . . . . . . . . . . . . 18,604 402,477Challenger, Ltd. . . . . . . . . . . . . . . . . . . . . . . . . . . . . . . . . . . 44,035 356,780CIMIC Group, Ltd. . . . . . . . . . . . . . . . . . . . . . . . . . . . . . . . . 8,428 312,213Coca-Cola Amatil, Ltd. . . . . . . . . . . . . . . . . . . . . . . . . . . . . . . 42,510 300,219Cochlear, Ltd. . . . . . . . . . . . . . . . . . . . . . . . . . . . . . . . . . . . 4,099 598,424Commonwealth Bank of Australia . . . . . . . . . . . . . . . . . . . . . . 127,215 6,570,841Computershare, Ltd. . . . . . . . . . . . . . . . . . . . . . . . . . . . . . . . 28,910 415,711Crown Resorts, Ltd. . . . . . . . . . . . . . . . . . . . . . . . . . . . . . . . 29,464 291,121CSL, Ltd. . . . . . . . . . . . . . . . . . . . . . . . . . . . . . . . . . . . . . . 32,919 4,764,474Dexus . . . . . . . . . . . . . . . . . . . . . . . . . . . . . . . . . . . . . . . . 77,269 590,223Domino’s Pizza Enterprises, Ltd. . . . . . . . . . . . . . . . . . . . . . . . 4,557 176,002Flight Centre Travel Group, Ltd. . . . . . . . . . . . . . . . . . . . . . . . 4,135 158,405Fortescue Metals Group, Ltd. . . . . . . . . . . . . . . . . . . . . . . . . . 125,869 357,053Goodman Group (REIT) . . . . . . . . . . . . . . . . . . . . . . . . . . . . . 118,280 889,336GPT Group (The) (REIT) . . . . . . . . . . . . . . . . . . . . . . . . . . . . . 140,241 527,127Healthscope, Ltd. . . . . . . . . . . . . . . . . . . . . . . . . . . . . . . . . . 130,293 197,736Incitec Pivot, Ltd. . . . . . . . . . . . . . . . . . . . . . . . . . . . . . . . . . 131,085 377,384Insurance Australia Group, Ltd. . . . . . . . . . . . . . . . . . . . . . . . . 184,566 977,371Lend Lease Group (REIT) . . . . . . . . . . . . . . . . . . . . . . . . . . . . 39,184 555,735Macquarie Group, Ltd. . . . . . . . . . . . . . . . . . . . . . . . . . . . . . 23,361 2,117,172Medibank Private, Ltd. . . . . . . . . . . . . . . . . . . . . . . . . . . . . . 199,900 420,864Mirvac Group (REIT) . . . . . . . . . . . . . . . . . . . . . . . . . . . . . . . 272,935 475,889National Australia Bank, Ltd. . . . . . . . . . . . . . . . . . . . . . . . . . 198,109 3,985,308Newcrest Mining, Ltd. . . . . . . . . . . . . . . . . . . . . . . . . . . . . . . 51,539 722,340Oil Search, Ltd. . . . . . . . . . . . . . . . . . . . . . . . . . . . . . . . . . . 104,563 680,062Orica, Ltd. . . . . . . . . . . . . . . . . . . . . . . . . . . . . . . . . . . . . . 26,176 321,238Origin Energy, Ltd. (b) . . . . . . . . . . . . . . . . . . . . . . . . . . . . . 119,590 711,202QBE Insurance Group, Ltd. . . . . . . . . . . . . . . . . . . . . . . . . . . . 110,125 885,951Ramsay Health Care, Ltd. . . . . . . . . . . . . . . . . . . . . . . . . . . . 10,616 421,862REA Group, Ltd. . . . . . . . . . . . . . . . . . . . . . . . . . . . . . . . . . . 4,158 258,431Rio Tinto, Ltd. . . . . . . . . . . . . . . . . . . . . . . . . . . . . . . . . . . . 31,207 1,769,348Santos, Ltd. . . . . . . . . . . . . . . . . . . . . . . . . . . . . . . . . . . . . 145,305 760,333Scentre Group (REIT) . . . . . . . . . . . . . . . . . . . . . . . . . . . . . . 367,395 1,051,016Seek, Ltd. . . . . . . . . . . . . . . . . . . . . . . . . . . . . . . . . . . . . . 22,233 332,659Sonic Healthcare, Ltd. . . . . . . . . . . . . . . . . . . . . . . . . . . . . . . 32,696 591,184South32, Ltd. . . . . . . . . . . . . . . . . . . . . . . . . . . . . . . . . . . . 363,229 1,025,898Stockland (REIT) . . . . . . . . . . . . . . . . . . . . . . . . . . . . . . . . . 162,137 485,723Suncorp Group, Ltd. . . . . . . . . . . . . . . . . . . . . . . . . . . . . . . . 95,658 997,576Sydney Airport . . . . . . . . . . . . . . . . . . . . . . . . . . . . . . . . . . 80,467 401,438
Security Description Shares Value
Australia—(Continued)Tabcorp Holdings, Ltd. . . . . . . . . . . . . . . . . . . . . . . . . . . . . . 153,298 $ 538,813Telstra Corp., Ltd. . . . . . . . . . . . . . . . . . . . . . . . . . . . . . . . . 309,539 714,481TPG Telecom, Ltd. . . . . . . . . . . . . . . . . . . . . . . . . . . . . . . . . 27,310 168,363Transurban Group . . . . . . . . . . . . . . . . . . . . . . . . . . . . . . . . 183,536 1,485,169Treasury Wine Estates, Ltd. . . . . . . . . . . . . . . . . . . . . . . . . . . 53,467 673,245Vicinity Centres (REIT) . . . . . . . . . . . . . . . . . . . . . . . . . . . . . 252,185 478,017Wesfarmers, Ltd. . . . . . . . . . . . . . . . . . . . . . . . . . . . . . . . . . 80,874 2,916,278Westpac Banking Corp. . . . . . . . . . . . . . . . . . . . . . . . . . . . . . 248,548 5,010,520Woodside Petroleum, Ltd. . . . . . . . . . . . . . . . . . . . . . . . . . . . 65,682 1,825,564Woolworths Group, Ltd. . . . . . . . . . . . . . . . . . . . . . . . . . . . . 97,245 1,970,448
73,861,149
Austria—0.2%Andritz AG . . . . . . . . . . . . . . . . . . . . . . . . . . . . . . . . . . . . . 5,828 340,146Erste Group Bank AG (b) . . . . . . . . . . . . . . . . . . . . . . . . . . . . 20,408 846,813OMV AG . . . . . . . . . . . . . . . . . . . . . . . . . . . . . . . . . . . . . . . 9,828 551,916Raiffeisen Bank International AG . . . . . . . . . . . . . . . . . . . . . . 9,390 270,119Voestalpine AG . . . . . . . . . . . . . . . . . . . . . . . . . . . . . . . . . . 9,525 435,382
2,444,376
Belgium—1.0%Ageas . . . . . . . . . . . . . . . . . . . . . . . . . . . . . . . . . . . . . . . . 12,505 672,360Anheuser-Busch InBev S.A. . . . . . . . . . . . . . . . . . . . . . . . . . . 55,258 4,838,001Colruyt S.A. (e) . . . . . . . . . . . . . . . . . . . . . . . . . . . . . . . . . . 4,373 247,429Groupe Bruxelles Lambert S.A. . . . . . . . . . . . . . . . . . . . . . . . . 5,864 614,580KBC Group NV . . . . . . . . . . . . . . . . . . . . . . . . . . . . . . . . . . . 17,769 1,321,523Proximus SADP . . . . . . . . . . . . . . . . . . . . . . . . . . . . . . . . . . 11,920 284,917Solvay S.A. . . . . . . . . . . . . . . . . . . . . . . . . . . . . . . . . . . . . . 5,735 768,582Telenet Group Holding NV (b) . . . . . . . . . . . . . . . . . . . . . . . . 4,184 230,447UCB S.A. . . . . . . . . . . . . . . . . . . . . . . . . . . . . . . . . . . . . . . 9,619 863,665Umicore S.A. . . . . . . . . . . . . . . . . . . . . . . . . . . . . . . . . . . . . 15,189 848,817
10,690,321
Chile—0.0%Antofagasta plc . . . . . . . . . . . . . . . . . . . . . . . . . . . . . . . . . . 26,957 299,851
China—0.1%BOC Hong Kong Holdings, Ltd. . . . . . . . . . . . . . . . . . . . . . . . . 258,465 1,221,138Minth Group, Ltd. . . . . . . . . . . . . . . . . . . . . . . . . . . . . . . . . 54,000 220,901
1,442,039
Denmark—1.6%AP Moller - Maersk A/S - Class A . . . . . . . . . . . . . . . . . . . . . . 274 359,327AP Moller - Maersk A/S - Class B . . . . . . . . . . . . . . . . . . . . . . 493 692,178Carlsberg A/S - Class B . . . . . . . . . . . . . . . . . . . . . . . . . . . . . 7,850 941,644Chr Hansen Holding A/S . . . . . . . . . . . . . . . . . . . . . . . . . . . . 7,473 758,021Coloplast A/S - Class B . . . . . . . . . . . . . . . . . . . . . . . . . . . . . 8,619 881,150Danske Bank A/S . . . . . . . . . . . . . . . . . . . . . . . . . . . . . . . . 53,890 1,414,401DSV A/S . . . . . . . . . . . . . . . . . . . . . . . . . . . . . . . . . . . . . . 14,050 1,277,241Genmab A/S (b) . . . . . . . . . . . . . . . . . . . . . . . . . . . . . . . . . 4,236 666,065H Lundbeck A/S . . . . . . . . . . . . . . . . . . . . . . . . . . . . . . . . . 5,421 334,544ISS A/S . . . . . . . . . . . . . . . . . . . . . . . . . . . . . . . . . . . . . . . 12,164 427,675Novo Nordisk A/S - Class B . . . . . . . . . . . . . . . . . . . . . . . . . . 132,271 6,228,999Novozymes A/S - B Shares . . . . . . . . . . . . . . . . . . . . . . . . . . 16,399 898,663Orsted A/S . . . . . . . . . . . . . . . . . . . . . . . . . . . . . . . . . . . . . 14,039 953,622
BHFTII-198
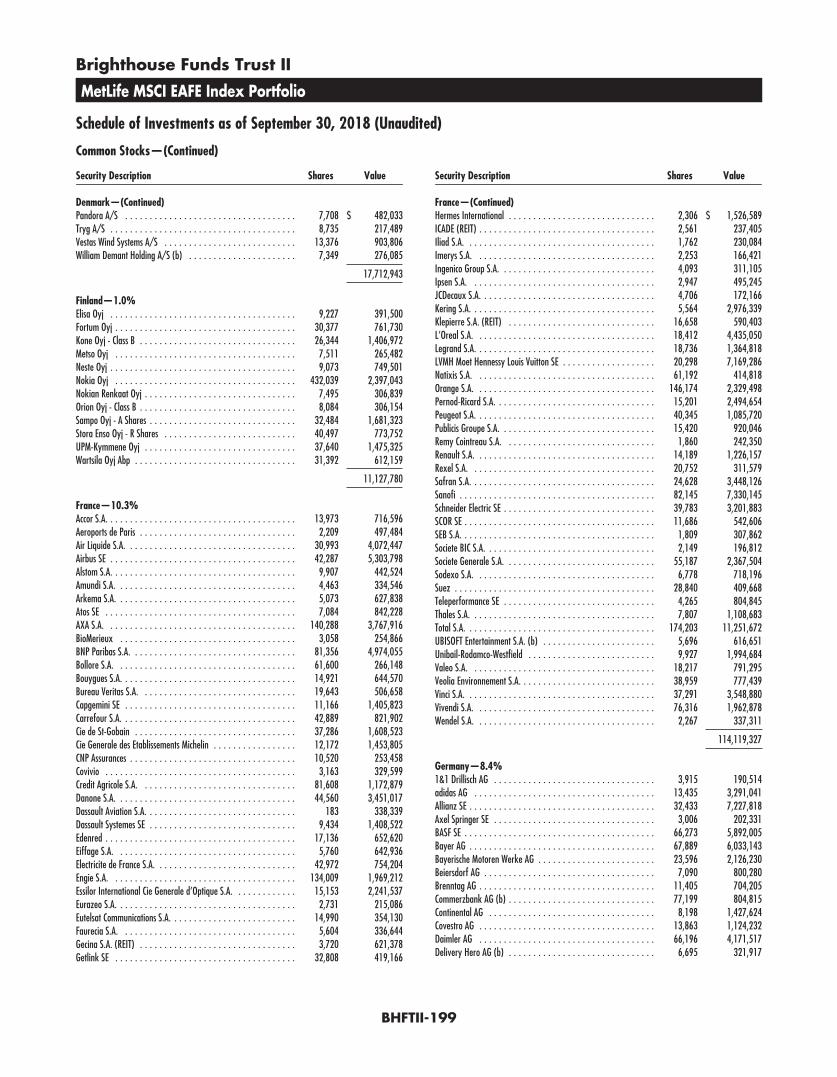
Brighthouse Funds Trust II
MetLife MSCI EAFE Index Portfolio
Schedule of Investments as of September 30, 2018 (Unaudited)
Common Stocks—(Continued)
Security Description Shares Value
Denmark—(Continued)Pandora A/S . . . . . . . . . . . . . . . . . . . . . . . . . . . . . . . . . . . 7,708 $ 482,033Tryg A/S . . . . . . . . . . . . . . . . . . . . . . . . . . . . . . . . . . . . . . 8,735 217,489Vestas Wind Systems A/S . . . . . . . . . . . . . . . . . . . . . . . . . . . 13,376 903,806William Demant Holding A/S (b) . . . . . . . . . . . . . . . . . . . . . . 7,349 276,085
17,712,943
Finland—1.0%Elisa Oyj . . . . . . . . . . . . . . . . . . . . . . . . . . . . . . . . . . . . . . 9,227 391,500Fortum Oyj . . . . . . . . . . . . . . . . . . . . . . . . . . . . . . . . . . . . . 30,377 761,730Kone Oyj - Class B . . . . . . . . . . . . . . . . . . . . . . . . . . . . . . . . 26,344 1,406,972Metso Oyj . . . . . . . . . . . . . . . . . . . . . . . . . . . . . . . . . . . . . 7,511 265,482Neste Oyj . . . . . . . . . . . . . . . . . . . . . . . . . . . . . . . . . . . . . . 9,073 749,501Nokia Oyj . . . . . . . . . . . . . . . . . . . . . . . . . . . . . . . . . . . . . 432,039 2,397,043Nokian Renkaat Oyj . . . . . . . . . . . . . . . . . . . . . . . . . . . . . . . 7,495 306,839Orion Oyj - Class B . . . . . . . . . . . . . . . . . . . . . . . . . . . . . . . . 8,084 306,154Sampo Oyj - A Shares . . . . . . . . . . . . . . . . . . . . . . . . . . . . . . 32,484 1,681,323Stora Enso Oyj - R Shares . . . . . . . . . . . . . . . . . . . . . . . . . . . 40,497 773,752UPM-Kymmene Oyj . . . . . . . . . . . . . . . . . . . . . . . . . . . . . . . 37,640 1,475,325Wartsila Oyj Abp . . . . . . . . . . . . . . . . . . . . . . . . . . . . . . . . . 31,392 612,159
11,127,780
France—10.3%Accor S.A. . . . . . . . . . . . . . . . . . . . . . . . . . . . . . . . . . . . . . . 13,973 716,596Aeroports de Paris . . . . . . . . . . . . . . . . . . . . . . . . . . . . . . . . 2,209 497,484Air Liquide S.A. . . . . . . . . . . . . . . . . . . . . . . . . . . . . . . . . . . 30,993 4,072,447Airbus SE . . . . . . . . . . . . . . . . . . . . . . . . . . . . . . . . . . . . . . 42,287 5,303,798Alstom S.A. . . . . . . . . . . . . . . . . . . . . . . . . . . . . . . . . . . . . . 9,907 442,524Amundi S.A. . . . . . . . . . . . . . . . . . . . . . . . . . . . . . . . . . . . . 4,463 334,546Arkema S.A. . . . . . . . . . . . . . . . . . . . . . . . . . . . . . . . . . . . . 5,073 627,838Atos SE . . . . . . . . . . . . . . . . . . . . . . . . . . . . . . . . . . . . . . . 7,084 842,228AXA S.A. . . . . . . . . . . . . . . . . . . . . . . . . . . . . . . . . . . . . . . 140,288 3,767,916BioMerieux . . . . . . . . . . . . . . . . . . . . . . . . . . . . . . . . . . . . 3,058 254,866BNP Paribas S.A. . . . . . . . . . . . . . . . . . . . . . . . . . . . . . . . . . 81,356 4,974,055Bollore S.A. . . . . . . . . . . . . . . . . . . . . . . . . . . . . . . . . . . . . 61,600 266,148Bouygues S.A. . . . . . . . . . . . . . . . . . . . . . . . . . . . . . . . . . . . 14,921 644,570Bureau Veritas S.A. . . . . . . . . . . . . . . . . . . . . . . . . . . . . . . . 19,643 506,658Capgemini SE . . . . . . . . . . . . . . . . . . . . . . . . . . . . . . . . . . . 11,166 1,405,823Carrefour S.A. . . . . . . . . . . . . . . . . . . . . . . . . . . . . . . . . . . . 42,889 821,902Cie de St-Gobain . . . . . . . . . . . . . . . . . . . . . . . . . . . . . . . . . 37,286 1,608,523Cie Generale des Etablissements Michelin . . . . . . . . . . . . . . . . . 12,172 1,453,805CNP Assurances . . . . . . . . . . . . . . . . . . . . . . . . . . . . . . . . . . 10,520 253,458Covivio . . . . . . . . . . . . . . . . . . . . . . . . . . . . . . . . . . . . . . . 3,163 329,599Credit Agricole S.A. . . . . . . . . . . . . . . . . . . . . . . . . . . . . . . . 81,608 1,172,879Danone S.A. . . . . . . . . . . . . . . . . . . . . . . . . . . . . . . . . . . . . 44,560 3,451,017Dassault Aviation S.A. . . . . . . . . . . . . . . . . . . . . . . . . . . . . . . 183 338,339Dassault Systemes SE . . . . . . . . . . . . . . . . . . . . . . . . . . . . . . 9,434 1,408,522Edenred . . . . . . . . . . . . . . . . . . . . . . . . . . . . . . . . . . . . . . . 17,136 652,620Eiffage S.A. . . . . . . . . . . . . . . . . . . . . . . . . . . . . . . . . . . . . 5,760 642,936Electricite de France S.A. . . . . . . . . . . . . . . . . . . . . . . . . . . . . 42,972 754,204Engie S.A. . . . . . . . . . . . . . . . . . . . . . . . . . . . . . . . . . . . . . 134,009 1,969,212Essilor International Cie Generale d’Optique S.A. . . . . . . . . . . . . 15,153 2,241,537Eurazeo S.A. . . . . . . . . . . . . . . . . . . . . . . . . . . . . . . . . . . . . 2,731 215,086Eutelsat Communications S.A. . . . . . . . . . . . . . . . . . . . . . . . . . 14,990 354,130Faurecia S.A. . . . . . . . . . . . . . . . . . . . . . . . . . . . . . . . . . . . 5,604 336,644Gecina S.A. (REIT) . . . . . . . . . . . . . . . . . . . . . . . . . . . . . . . . 3,720 621,378Getlink SE . . . . . . . . . . . . . . . . . . . . . . . . . . . . . . . . . . . . . 32,808 419,166
Security Description Shares Value
France—(Continued)Hermes International . . . . . . . . . . . . . . . . . . . . . . . . . . . . . . 2,306 $ 1,526,589ICADE (REIT) . . . . . . . . . . . . . . . . . . . . . . . . . . . . . . . . . . . . 2,561 237,405Iliad S.A. . . . . . . . . . . . . . . . . . . . . . . . . . . . . . . . . . . . . . . 1,762 230,084Imerys S.A. . . . . . . . . . . . . . . . . . . . . . . . . . . . . . . . . . . . . 2,253 166,421Ingenico Group S.A. . . . . . . . . . . . . . . . . . . . . . . . . . . . . . . . 4,093 311,105Ipsen S.A. . . . . . . . . . . . . . . . . . . . . . . . . . . . . . . . . . . . . . 2,947 495,245JCDecaux S.A. . . . . . . . . . . . . . . . . . . . . . . . . . . . . . . . . . . . 4,706 172,166Kering S.A. . . . . . . . . . . . . . . . . . . . . . . . . . . . . . . . . . . . . . 5,564 2,976,339Klepierre S.A. (REIT) . . . . . . . . . . . . . . . . . . . . . . . . . . . . . . 16,658 590,403L’Oreal S.A. . . . . . . . . . . . . . . . . . . . . . . . . . . . . . . . . . . . . 18,412 4,435,050Legrand S.A. . . . . . . . . . . . . . . . . . . . . . . . . . . . . . . . . . . . . 18,736 1,364,818LVMH Moet Hennessy Louis Vuitton SE . . . . . . . . . . . . . . . . . . . 20,298 7,169,286Natixis S.A. . . . . . . . . . . . . . . . . . . . . . . . . . . . . . . . . . . . . 61,192 414,818Orange S.A. . . . . . . . . . . . . . . . . . . . . . . . . . . . . . . . . . . . . 146,174 2,329,498Pernod-Ricard S.A. . . . . . . . . . . . . . . . . . . . . . . . . . . . . . . . . 15,201 2,494,654Peugeot S.A. . . . . . . . . . . . . . . . . . . . . . . . . . . . . . . . . . . . . 40,345 1,085,720Publicis Groupe S.A. . . . . . . . . . . . . . . . . . . . . . . . . . . . . . . . 15,420 920,046Remy Cointreau S.A. . . . . . . . . . . . . . . . . . . . . . . . . . . . . . . 1,860 242,350Renault S.A. . . . . . . . . . . . . . . . . . . . . . . . . . . . . . . . . . . . . 14,189 1,226,157Rexel S.A. . . . . . . . . . . . . . . . . . . . . . . . . . . . . . . . . . . . . . 20,752 311,579Safran S.A. . . . . . . . . . . . . . . . . . . . . . . . . . . . . . . . . . . . . . 24,628 3,448,126Sanofi . . . . . . . . . . . . . . . . . . . . . . . . . . . . . . . . . . . . . . . . 82,145 7,330,145Schneider Electric SE . . . . . . . . . . . . . . . . . . . . . . . . . . . . . . . 39,783 3,201,883SCOR SE . . . . . . . . . . . . . . . . . . . . . . . . . . . . . . . . . . . . . . . 11,686 542,606SEB S.A. . . . . . . . . . . . . . . . . . . . . . . . . . . . . . . . . . . . . . . . 1,809 307,862Societe BIC S.A. . . . . . . . . . . . . . . . . . . . . . . . . . . . . . . . . . . 2,149 196,812Societe Generale S.A. . . . . . . . . . . . . . . . . . . . . . . . . . . . . . . 55,187 2,367,504Sodexo S.A. . . . . . . . . . . . . . . . . . . . . . . . . . . . . . . . . . . . . 6,778 718,196Suez . . . . . . . . . . . . . . . . . . . . . . . . . . . . . . . . . . . . . . . . . 28,840 409,668Teleperformance SE . . . . . . . . . . . . . . . . . . . . . . . . . . . . . . . 4,265 804,845Thales S.A. . . . . . . . . . . . . . . . . . . . . . . . . . . . . . . . . . . . . . 7,807 1,108,683Total S.A. . . . . . . . . . . . . . . . . . . . . . . . . . . . . . . . . . . . . . . 174,203 11,251,672UBISOFT Entertainment S.A. (b) . . . . . . . . . . . . . . . . . . . . . . . 5,696 616,651Unibail-Rodamco-Westfield . . . . . . . . . . . . . . . . . . . . . . . . . . 9,927 1,994,684Valeo S.A. . . . . . . . . . . . . . . . . . . . . . . . . . . . . . . . . . . . . . 18,217 791,295Veolia Environnement S.A. . . . . . . . . . . . . . . . . . . . . . . . . . . . 38,959 777,439Vinci S.A. . . . . . . . . . . . . . . . . . . . . . . . . . . . . . . . . . . . . . . 37,291 3,548,880Vivendi S.A. . . . . . . . . . . . . . . . . . . . . . . . . . . . . . . . . . . . . 76,316 1,962,878Wendel S.A. . . . . . . . . . . . . . . . . . . . . . . . . . . . . . . . . . . . . 2,267 337,311
114,119,327
Germany—8.4%1&1 Drillisch AG . . . . . . . . . . . . . . . . . . . . . . . . . . . . . . . . . 3,915 190,514adidas AG . . . . . . . . . . . . . . . . . . . . . . . . . . . . . . . . . . . . . 13,435 3,291,041Allianz SE . . . . . . . . . . . . . . . . . . . . . . . . . . . . . . . . . . . . . . 32,433 7,227,818Axel Springer SE . . . . . . . . . . . . . . . . . . . . . . . . . . . . . . . . . 3,006 202,331BASF SE . . . . . . . . . . . . . . . . . . . . . . . . . . . . . . . . . . . . . . . 66,273 5,892,005Bayer AG . . . . . . . . . . . . . . . . . . . . . . . . . . . . . . . . . . . . . . 67,889 6,033,143Bayerische Motoren Werke AG . . . . . . . . . . . . . . . . . . . . . . . . 23,596 2,126,230Beiersdorf AG . . . . . . . . . . . . . . . . . . . . . . . . . . . . . . . . . . . 7,090 800,280Brenntag AG . . . . . . . . . . . . . . . . . . . . . . . . . . . . . . . . . . . . 11,405 704,205Commerzbank AG (b) . . . . . . . . . . . . . . . . . . . . . . . . . . . . . . 77,199 804,815Continental AG . . . . . . . . . . . . . . . . . . . . . . . . . . . . . . . . . . 8,198 1,427,624Covestro AG . . . . . . . . . . . . . . . . . . . . . . . . . . . . . . . . . . . . 13,863 1,124,232Daimler AG . . . . . . . . . . . . . . . . . . . . . . . . . . . . . . . . . . . . 66,196 4,171,517Delivery Hero AG (b) . . . . . . . . . . . . . . . . . . . . . . . . . . . . . . 6,695 321,917
BHFTII-199
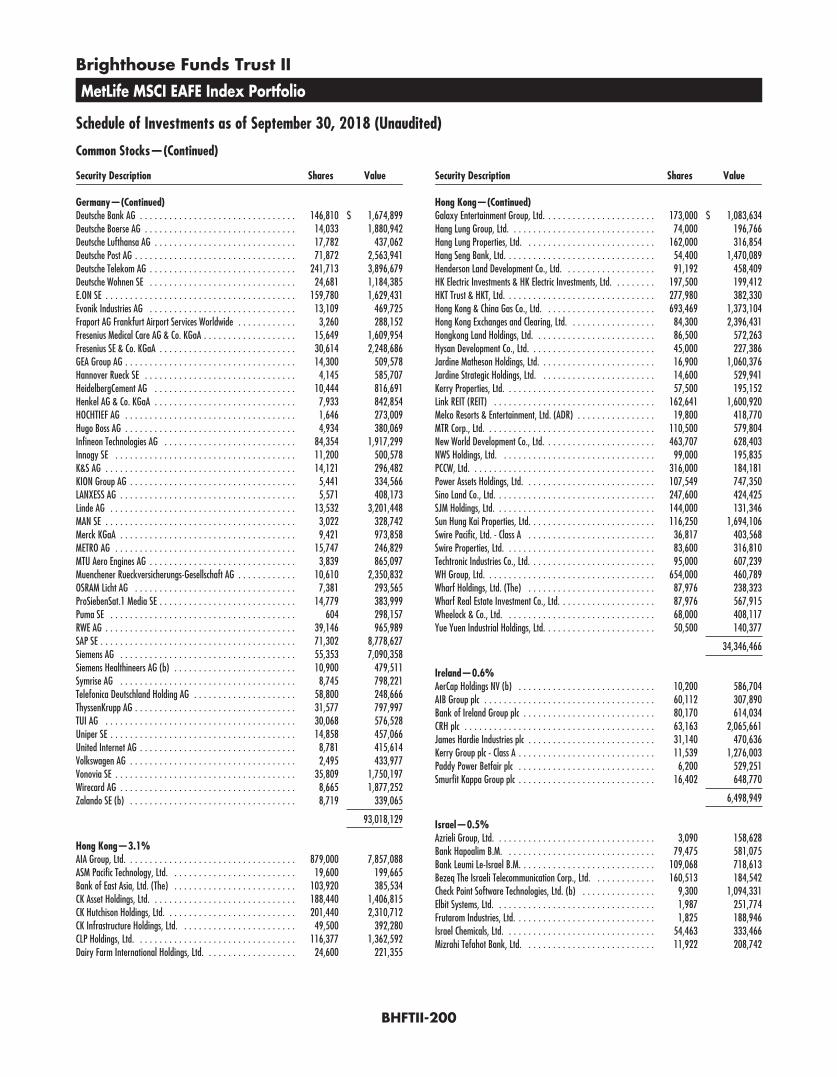
Brighthouse Funds Trust II
MetLife MSCI EAFE Index Portfolio
Schedule of Investments as of September 30, 2018 (Unaudited)
Common Stocks—(Continued)
Security Description Shares Value
Germany—(Continued)Deutsche Bank AG . . . . . . . . . . . . . . . . . . . . . . . . . . . . . . . . 146,810 $ 1,674,899Deutsche Boerse AG . . . . . . . . . . . . . . . . . . . . . . . . . . . . . . . 14,033 1,880,942Deutsche Lufthansa AG . . . . . . . . . . . . . . . . . . . . . . . . . . . . . 17,782 437,062Deutsche Post AG . . . . . . . . . . . . . . . . . . . . . . . . . . . . . . . . . 71,872 2,563,941Deutsche Telekom AG . . . . . . . . . . . . . . . . . . . . . . . . . . . . . . 241,713 3,896,679Deutsche Wohnen SE . . . . . . . . . . . . . . . . . . . . . . . . . . . . . . 24,681 1,184,385E.ON SE . . . . . . . . . . . . . . . . . . . . . . . . . . . . . . . . . . . . . . . 159,780 1,629,431Evonik Industries AG . . . . . . . . . . . . . . . . . . . . . . . . . . . . . . 13,109 469,725Fraport AG Frankfurt Airport Services Worldwide . . . . . . . . . . . . 3,260 288,152Fresenius Medical Care AG & Co. KGaA . . . . . . . . . . . . . . . . . . . 15,649 1,609,954Fresenius SE & Co. KGaA . . . . . . . . . . . . . . . . . . . . . . . . . . . . 30,614 2,248,686GEA Group AG . . . . . . . . . . . . . . . . . . . . . . . . . . . . . . . . . . . 14,300 509,578Hannover Rueck SE . . . . . . . . . . . . . . . . . . . . . . . . . . . . . . . 4,145 585,707HeidelbergCement AG . . . . . . . . . . . . . . . . . . . . . . . . . . . . . 10,444 816,691Henkel AG & Co. KGaA . . . . . . . . . . . . . . . . . . . . . . . . . . . . . 7,933 842,854HOCHTIEF AG . . . . . . . . . . . . . . . . . . . . . . . . . . . . . . . . . . . 1,646 273,009Hugo Boss AG . . . . . . . . . . . . . . . . . . . . . . . . . . . . . . . . . . . 4,934 380,069Infineon Technologies AG . . . . . . . . . . . . . . . . . . . . . . . . . . . 84,354 1,917,299Innogy SE . . . . . . . . . . . . . . . . . . . . . . . . . . . . . . . . . . . . . 11,200 500,578K&S AG . . . . . . . . . . . . . . . . . . . . . . . . . . . . . . . . . . . . . . . 14,121 296,482KION Group AG . . . . . . . . . . . . . . . . . . . . . . . . . . . . . . . . . . 5,441 334,566LANXESS AG . . . . . . . . . . . . . . . . . . . . . . . . . . . . . . . . . . . . 5,571 408,173Linde AG . . . . . . . . . . . . . . . . . . . . . . . . . . . . . . . . . . . . . . 13,532 3,201,448MAN SE . . . . . . . . . . . . . . . . . . . . . . . . . . . . . . . . . . . . . . . 3,022 328,742Merck KGaA . . . . . . . . . . . . . . . . . . . . . . . . . . . . . . . . . . . . 9,421 973,858METRO AG . . . . . . . . . . . . . . . . . . . . . . . . . . . . . . . . . . . . . 15,747 246,829MTU Aero Engines AG . . . . . . . . . . . . . . . . . . . . . . . . . . . . . . 3,839 865,097Muenchener Rueckversicherungs-Gesellschaft AG . . . . . . . . . . . . 10,610 2,350,832OSRAM Licht AG . . . . . . . . . . . . . . . . . . . . . . . . . . . . . . . . . 7,381 293,565ProSiebenSat.1 Media SE . . . . . . . . . . . . . . . . . . . . . . . . . . . . 14,779 383,999Puma SE . . . . . . . . . . . . . . . . . . . . . . . . . . . . . . . . . . . . . . 604 298,157RWE AG . . . . . . . . . . . . . . . . . . . . . . . . . . . . . . . . . . . . . . . 39,146 965,989SAP SE . . . . . . . . . . . . . . . . . . . . . . . . . . . . . . . . . . . . . . . . 71,302 8,778,627Siemens AG . . . . . . . . . . . . . . . . . . . . . . . . . . . . . . . . . . . . 55,353 7,090,358Siemens Healthineers AG (b) . . . . . . . . . . . . . . . . . . . . . . . . . 10,900 479,511Symrise AG . . . . . . . . . . . . . . . . . . . . . . . . . . . . . . . . . . . . 8,745 798,221Telefonica Deutschland Holding AG . . . . . . . . . . . . . . . . . . . . . 58,800 248,666ThyssenKrupp AG . . . . . . . . . . . . . . . . . . . . . . . . . . . . . . . . . 31,577 797,997TUI AG . . . . . . . . . . . . . . . . . . . . . . . . . . . . . . . . . . . . . . . 30,068 576,528Uniper SE . . . . . . . . . . . . . . . . . . . . . . . . . . . . . . . . . . . . . . 14,858 457,066United Internet AG . . . . . . . . . . . . . . . . . . . . . . . . . . . . . . . . 8,781 415,614Volkswagen AG . . . . . . . . . . . . . . . . . . . . . . . . . . . . . . . . . . 2,495 433,977Vonovia SE . . . . . . . . . . . . . . . . . . . . . . . . . . . . . . . . . . . . . 35,809 1,750,197Wirecard AG . . . . . . . . . . . . . . . . . . . . . . . . . . . . . . . . . . . . 8,665 1,877,252Zalando SE (b) . . . . . . . . . . . . . . . . . . . . . . . . . . . . . . . . . . 8,719 339,065
93,018,129
Hong Kong—3.1%AIA Group, Ltd. . . . . . . . . . . . . . . . . . . . . . . . . . . . . . . . . . . 879,000 7,857,088ASM Pacific Technology, Ltd. . . . . . . . . . . . . . . . . . . . . . . . . . 19,600 199,665Bank of East Asia, Ltd. (The) . . . . . . . . . . . . . . . . . . . . . . . . . 103,920 385,534CK Asset Holdings, Ltd. . . . . . . . . . . . . . . . . . . . . . . . . . . . . . 188,440 1,406,815CK Hutchison Holdings, Ltd. . . . . . . . . . . . . . . . . . . . . . . . . . . 201,440 2,310,712CK Infrastructure Holdings, Ltd. . . . . . . . . . . . . . . . . . . . . . . . 49,500 392,280CLP Holdings, Ltd. . . . . . . . . . . . . . . . . . . . . . . . . . . . . . . . . 116,377 1,362,592Dairy Farm International Holdings, Ltd. . . . . . . . . . . . . . . . . . . 24,600 221,355
Security Description Shares Value
Hong Kong—(Continued)Galaxy Entertainment Group, Ltd. . . . . . . . . . . . . . . . . . . . . . . 173,000 $ 1,083,634Hang Lung Group, Ltd. . . . . . . . . . . . . . . . . . . . . . . . . . . . . . 74,000 196,766Hang Lung Properties, Ltd. . . . . . . . . . . . . . . . . . . . . . . . . . . 162,000 316,854Hang Seng Bank, Ltd. . . . . . . . . . . . . . . . . . . . . . . . . . . . . . . 54,400 1,470,089Henderson Land Development Co., Ltd. . . . . . . . . . . . . . . . . . . 91,192 458,409HK Electric Investments & HK Electric Investments, Ltd. . . . . . . . . 197,500 199,412HKT Trust & HKT, Ltd. . . . . . . . . . . . . . . . . . . . . . . . . . . . . . . 277,980 382,330Hong Kong & China Gas Co., Ltd. . . . . . . . . . . . . . . . . . . . . . . 693,469 1,373,104Hong Kong Exchanges and Clearing, Ltd. . . . . . . . . . . . . . . . . . 84,300 2,396,431Hongkong Land Holdings, Ltd. . . . . . . . . . . . . . . . . . . . . . . . . 86,500 572,263Hysan Development Co., Ltd. . . . . . . . . . . . . . . . . . . . . . . . . . 45,000 227,386Jardine Matheson Holdings, Ltd. . . . . . . . . . . . . . . . . . . . . . . . 16,900 1,060,376Jardine Strategic Holdings, Ltd. . . . . . . . . . . . . . . . . . . . . . . . 14,600 529,941Kerry Properties, Ltd. . . . . . . . . . . . . . . . . . . . . . . . . . . . . . . 57,500 195,152Link REIT (REIT) . . . . . . . . . . . . . . . . . . . . . . . . . . . . . . . . . 162,641 1,600,920Melco Resorts & Entertainment, Ltd. (ADR) . . . . . . . . . . . . . . . . 19,800 418,770MTR Corp., Ltd. . . . . . . . . . . . . . . . . . . . . . . . . . . . . . . . . . . 110,500 579,804New World Development Co., Ltd. . . . . . . . . . . . . . . . . . . . . . . 463,707 628,403NWS Holdings, Ltd. . . . . . . . . . . . . . . . . . . . . . . . . . . . . . . . 99,000 195,835PCCW, Ltd. . . . . . . . . . . . . . . . . . . . . . . . . . . . . . . . . . . . . . 316,000 184,181Power Assets Holdings, Ltd. . . . . . . . . . . . . . . . . . . . . . . . . . . 107,549 747,350Sino Land Co., Ltd. . . . . . . . . . . . . . . . . . . . . . . . . . . . . . . . . 247,600 424,425SJM Holdings, Ltd. . . . . . . . . . . . . . . . . . . . . . . . . . . . . . . . . 144,000 131,346Sun Hung Kai Properties, Ltd. . . . . . . . . . . . . . . . . . . . . . . . . . 116,250 1,694,106Swire Pacific, Ltd. - Class A . . . . . . . . . . . . . . . . . . . . . . . . . . 36,817 403,568Swire Properties, Ltd. . . . . . . . . . . . . . . . . . . . . . . . . . . . . . . 83,600 316,810Techtronic Industries Co., Ltd. . . . . . . . . . . . . . . . . . . . . . . . . . 95,000 607,239WH Group, Ltd. . . . . . . . . . . . . . . . . . . . . . . . . . . . . . . . . . . 654,000 460,789Wharf Holdings, Ltd. (The) . . . . . . . . . . . . . . . . . . . . . . . . . . 87,976 238,323Wharf Real Estate Investment Co., Ltd. . . . . . . . . . . . . . . . . . . . 87,976 567,915Wheelock & Co., Ltd. . . . . . . . . . . . . . . . . . . . . . . . . . . . . . . 68,000 408,117Yue Yuen Industrial Holdings, Ltd. . . . . . . . . . . . . . . . . . . . . . . 50,500 140,377
34,346,466
Ireland—0.6%AerCap Holdings NV (b) . . . . . . . . . . . . . . . . . . . . . . . . . . . . 10,200 586,704AIB Group plc . . . . . . . . . . . . . . . . . . . . . . . . . . . . . . . . . . . 60,112 307,890Bank of Ireland Group plc . . . . . . . . . . . . . . . . . . . . . . . . . . . 80,170 614,034CRH plc . . . . . . . . . . . . . . . . . . . . . . . . . . . . . . . . . . . . . . . 63,163 2,065,661James Hardie Industries plc . . . . . . . . . . . . . . . . . . . . . . . . . . 31,140 470,636Kerry Group plc - Class A . . . . . . . . . . . . . . . . . . . . . . . . . . . . 11,539 1,276,003Paddy Power Betfair plc . . . . . . . . . . . . . . . . . . . . . . . . . . . . 6,200 529,251Smurfit Kappa Group plc . . . . . . . . . . . . . . . . . . . . . . . . . . . . 16,402 648,770
6,498,949
Israel—0.5%Azrieli Group, Ltd. . . . . . . . . . . . . . . . . . . . . . . . . . . . . . . . . 3,090 158,628Bank Hapoalim B.M. . . . . . . . . . . . . . . . . . . . . . . . . . . . . . . 79,475 581,075Bank Leumi Le-Israel B.M. . . . . . . . . . . . . . . . . . . . . . . . . . . . 109,068 718,613Bezeq The Israeli Telecommunication Corp., Ltd. . . . . . . . . . . . . 160,513 184,542Check Point Software Technologies, Ltd. (b) . . . . . . . . . . . . . . . 9,300 1,094,331Elbit Systems, Ltd. . . . . . . . . . . . . . . . . . . . . . . . . . . . . . . . . 1,987 251,774Frutarom Industries, Ltd. . . . . . . . . . . . . . . . . . . . . . . . . . . . . 1,825 188,946Israel Chemicals, Ltd. . . . . . . . . . . . . . . . . . . . . . . . . . . . . . . 54,463 333,466Mizrahi Tefahot Bank, Ltd. . . . . . . . . . . . . . . . . . . . . . . . . . . 11,922 208,742
BHFTII-200
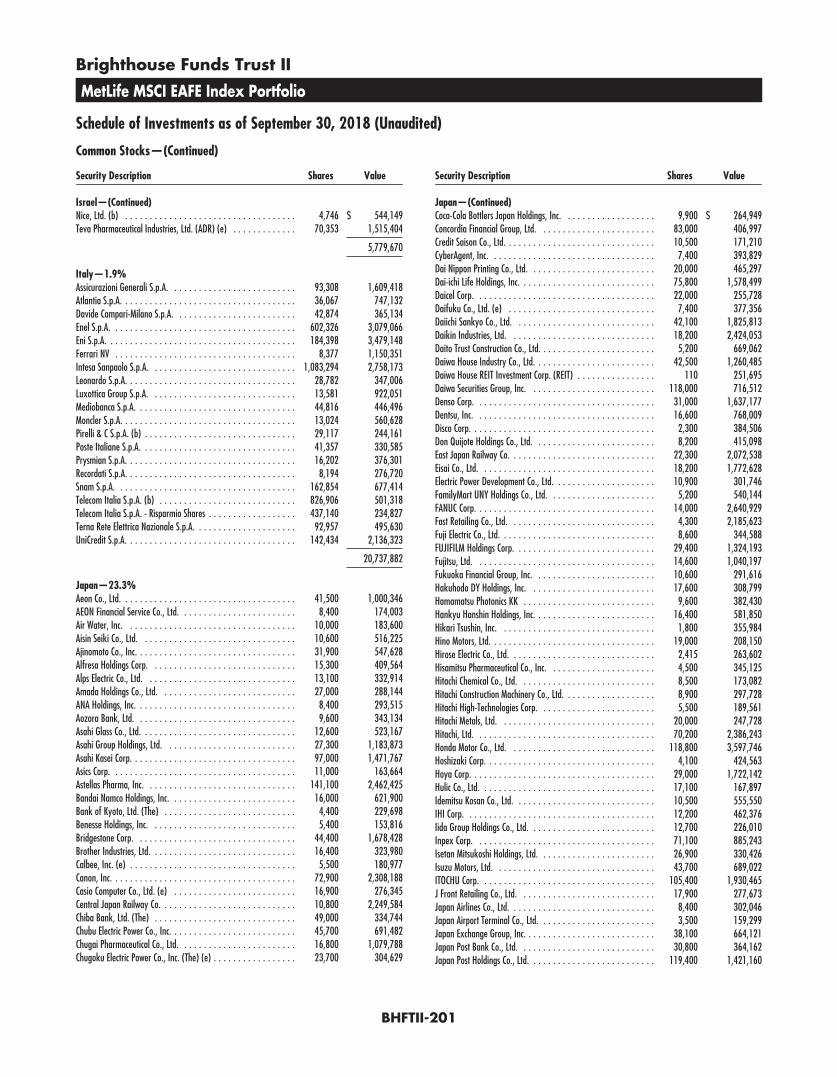
Brighthouse Funds Trust II
MetLife MSCI EAFE Index Portfolio
Schedule of Investments as of September 30, 2018 (Unaudited)
Common Stocks—(Continued)
Security Description Shares Value
Israel—(Continued)Nice, Ltd. (b) . . . . . . . . . . . . . . . . . . . . . . . . . . . . . . . . . . . 4,746 $ 544,149Teva Pharmaceutical Industries, Ltd. (ADR) (e) . . . . . . . . . . . . . 70,353 1,515,404
5,779,670
Italy—1.9%Assicurazioni Generali S.p.A. . . . . . . . . . . . . . . . . . . . . . . . . . 93,308 1,609,418Atlantia S.p.A. . . . . . . . . . . . . . . . . . . . . . . . . . . . . . . . . . . . 36,067 747,132Davide Campari-Milano S.p.A. . . . . . . . . . . . . . . . . . . . . . . . . 42,874 365,134Enel S.p.A. . . . . . . . . . . . . . . . . . . . . . . . . . . . . . . . . . . . . . 602,326 3,079,066Eni S.p.A. . . . . . . . . . . . . . . . . . . . . . . . . . . . . . . . . . . . . . . 184,398 3,479,148Ferrari NV . . . . . . . . . . . . . . . . . . . . . . . . . . . . . . . . . . . . . 8,377 1,150,351Intesa Sanpaolo S.p.A. . . . . . . . . . . . . . . . . . . . . . . . . . . . . . 1,083,294 2,758,173Leonardo S.p.A. . . . . . . . . . . . . . . . . . . . . . . . . . . . . . . . . . . 28,782 347,006Luxottica Group S.p.A. . . . . . . . . . . . . . . . . . . . . . . . . . . . . . 13,581 922,051Mediobanca S.p.A. . . . . . . . . . . . . . . . . . . . . . . . . . . . . . . . . 44,816 446,496Moncler S.p.A. . . . . . . . . . . . . . . . . . . . . . . . . . . . . . . . . . . . 13,024 560,628Pirelli & C S.p.A. (b) . . . . . . . . . . . . . . . . . . . . . . . . . . . . . . . 29,117 244,161Poste Italiane S.p.A. . . . . . . . . . . . . . . . . . . . . . . . . . . . . . . . 41,357 330,585Prysmian S.p.A. . . . . . . . . . . . . . . . . . . . . . . . . . . . . . . . . . . 16,202 376,301Recordati S.p.A. . . . . . . . . . . . . . . . . . . . . . . . . . . . . . . . . . . 8,194 276,720Snam S.p.A. . . . . . . . . . . . . . . . . . . . . . . . . . . . . . . . . . . . . 162,854 677,414Telecom Italia S.p.A. (b) . . . . . . . . . . . . . . . . . . . . . . . . . . . . 826,906 501,318Telecom Italia S.p.A. - Risparmio Shares . . . . . . . . . . . . . . . . . . 437,140 234,827Terna Rete Elettrica Nazionale S.p.A. . . . . . . . . . . . . . . . . . . . . 92,957 495,630UniCredit S.p.A. . . . . . . . . . . . . . . . . . . . . . . . . . . . . . . . . . . 142,434 2,136,323
20,737,882
Japan—23.3%Aeon Co., Ltd. . . . . . . . . . . . . . . . . . . . . . . . . . . . . . . . . . . . 41,500 1,000,346AEON Financial Service Co., Ltd. . . . . . . . . . . . . . . . . . . . . . . . 8,400 174,003Air Water, Inc. . . . . . . . . . . . . . . . . . . . . . . . . . . . . . . . . . . 10,000 183,600Aisin Seiki Co., Ltd. . . . . . . . . . . . . . . . . . . . . . . . . . . . . . . . 10,600 516,225Ajinomoto Co., Inc. . . . . . . . . . . . . . . . . . . . . . . . . . . . . . . . . 31,900 547,628Alfresa Holdings Corp. . . . . . . . . . . . . . . . . . . . . . . . . . . . . . 15,300 409,564Alps Electric Co., Ltd. . . . . . . . . . . . . . . . . . . . . . . . . . . . . . . 13,100 332,914Amada Holdings Co., Ltd. . . . . . . . . . . . . . . . . . . . . . . . . . . . 27,000 288,144ANA Holdings, Inc. . . . . . . . . . . . . . . . . . . . . . . . . . . . . . . . . 8,400 293,515Aozora Bank, Ltd. . . . . . . . . . . . . . . . . . . . . . . . . . . . . . . . . 9,600 343,134Asahi Glass Co., Ltd. . . . . . . . . . . . . . . . . . . . . . . . . . . . . . . . 12,600 523,167Asahi Group Holdings, Ltd. . . . . . . . . . . . . . . . . . . . . . . . . . . 27,300 1,183,873Asahi Kasei Corp. . . . . . . . . . . . . . . . . . . . . . . . . . . . . . . . . . 97,000 1,471,767Asics Corp. . . . . . . . . . . . . . . . . . . . . . . . . . . . . . . . . . . . . . 11,000 163,664Astellas Pharma, Inc. . . . . . . . . . . . . . . . . . . . . . . . . . . . . . . 141,100 2,462,425Bandai Namco Holdings, Inc. . . . . . . . . . . . . . . . . . . . . . . . . . 16,000 621,900Bank of Kyoto, Ltd. (The) . . . . . . . . . . . . . . . . . . . . . . . . . . . 4,400 229,698Benesse Holdings, Inc. . . . . . . . . . . . . . . . . . . . . . . . . . . . . . 5,400 153,816Bridgestone Corp. . . . . . . . . . . . . . . . . . . . . . . . . . . . . . . . . 44,400 1,678,428Brother Industries, Ltd. . . . . . . . . . . . . . . . . . . . . . . . . . . . . . 16,400 323,980Calbee, Inc. (e) . . . . . . . . . . . . . . . . . . . . . . . . . . . . . . . . . . 5,500 180,977Canon, Inc. . . . . . . . . . . . . . . . . . . . . . . . . . . . . . . . . . . . . . 72,900 2,308,188Casio Computer Co., Ltd. (e) . . . . . . . . . . . . . . . . . . . . . . . . . 16,900 276,345Central Japan Railway Co. . . . . . . . . . . . . . . . . . . . . . . . . . . . 10,800 2,249,584Chiba Bank, Ltd. (The) . . . . . . . . . . . . . . . . . . . . . . . . . . . . . 49,000 334,744Chubu Electric Power Co., Inc. . . . . . . . . . . . . . . . . . . . . . . . . . 45,700 691,482Chugai Pharmaceutical Co., Ltd. . . . . . . . . . . . . . . . . . . . . . . . 16,800 1,079,788Chugoku Electric Power Co., Inc. (The) (e) . . . . . . . . . . . . . . . . . 23,700 304,629
Security Description Shares Value
Japan—(Continued)Coca-Cola Bottlers Japan Holdings, Inc. . . . . . . . . . . . . . . . . . . 9,900 $ 264,949Concordia Financial Group, Ltd. . . . . . . . . . . . . . . . . . . . . . . . 83,000 406,997Credit Saison Co., Ltd. . . . . . . . . . . . . . . . . . . . . . . . . . . . . . . 10,500 171,210CyberAgent, Inc. . . . . . . . . . . . . . . . . . . . . . . . . . . . . . . . . . 7,400 393,829Dai Nippon Printing Co., Ltd. . . . . . . . . . . . . . . . . . . . . . . . . . 20,000 465,297Dai-ichi Life Holdings, Inc. . . . . . . . . . . . . . . . . . . . . . . . . . . . 75,800 1,578,499Daicel Corp. . . . . . . . . . . . . . . . . . . . . . . . . . . . . . . . . . . . . 22,000 255,728Daifuku Co., Ltd. (e) . . . . . . . . . . . . . . . . . . . . . . . . . . . . . . 7,400 377,356Daiichi Sankyo Co., Ltd. . . . . . . . . . . . . . . . . . . . . . . . . . . . . 42,100 1,825,813Daikin Industries, Ltd. . . . . . . . . . . . . . . . . . . . . . . . . . . . . . 18,200 2,424,053Daito Trust Construction Co., Ltd. . . . . . . . . . . . . . . . . . . . . . . . 5,200 669,062Daiwa House Industry Co., Ltd. . . . . . . . . . . . . . . . . . . . . . . . . 42,500 1,260,485Daiwa House REIT Investment Corp. (REIT) . . . . . . . . . . . . . . . . 110 251,695Daiwa Securities Group, Inc. . . . . . . . . . . . . . . . . . . . . . . . . . 118,000 716,512Denso Corp. . . . . . . . . . . . . . . . . . . . . . . . . . . . . . . . . . . . . 31,000 1,637,177Dentsu, Inc. . . . . . . . . . . . . . . . . . . . . . . . . . . . . . . . . . . . . 16,600 768,009Disco Corp. . . . . . . . . . . . . . . . . . . . . . . . . . . . . . . . . . . . . . 2,300 384,506Don Quijote Holdings Co., Ltd. . . . . . . . . . . . . . . . . . . . . . . . . 8,200 415,098East Japan Railway Co. . . . . . . . . . . . . . . . . . . . . . . . . . . . . . 22,300 2,072,538Eisai Co., Ltd. . . . . . . . . . . . . . . . . . . . . . . . . . . . . . . . . . . . 18,200 1,772,628Electric Power Development Co., Ltd. . . . . . . . . . . . . . . . . . . . . 10,900 301,746FamilyMart UNY Holdings Co., Ltd. . . . . . . . . . . . . . . . . . . . . . 5,200 540,144FANUC Corp. . . . . . . . . . . . . . . . . . . . . . . . . . . . . . . . . . . . . 14,000 2,640,929Fast Retailing Co., Ltd. . . . . . . . . . . . . . . . . . . . . . . . . . . . . . 4,300 2,185,623Fuji Electric Co., Ltd. . . . . . . . . . . . . . . . . . . . . . . . . . . . . . . . 8,600 344,588FUJIFILM Holdings Corp. . . . . . . . . . . . . . . . . . . . . . . . . . . . . 29,400 1,324,193Fujitsu, Ltd. . . . . . . . . . . . . . . . . . . . . . . . . . . . . . . . . . . . . 14,600 1,040,197Fukuoka Financial Group, Inc. . . . . . . . . . . . . . . . . . . . . . . . . 10,600 291,616Hakuhodo DY Holdings, Inc. . . . . . . . . . . . . . . . . . . . . . . . . . 17,600 308,799Hamamatsu Photonics KK . . . . . . . . . . . . . . . . . . . . . . . . . . . 9,600 382,430Hankyu Hanshin Holdings, Inc. . . . . . . . . . . . . . . . . . . . . . . . . 16,400 581,850Hikari Tsushin, Inc. . . . . . . . . . . . . . . . . . . . . . . . . . . . . . . . 1,800 355,984Hino Motors, Ltd. . . . . . . . . . . . . . . . . . . . . . . . . . . . . . . . . . 19,000 208,150Hirose Electric Co., Ltd. . . . . . . . . . . . . . . . . . . . . . . . . . . . . . 2,415 263,602Hisamitsu Pharmaceutical Co., Inc. . . . . . . . . . . . . . . . . . . . . . 4,500 345,125Hitachi Chemical Co., Ltd. . . . . . . . . . . . . . . . . . . . . . . . . . . . 8,500 173,082Hitachi Construction Machinery Co., Ltd. . . . . . . . . . . . . . . . . . . 8,900 297,728Hitachi High-Technologies Corp. . . . . . . . . . . . . . . . . . . . . . . . 5,500 189,561Hitachi Metals, Ltd. . . . . . . . . . . . . . . . . . . . . . . . . . . . . . . . 20,000 247,728Hitachi, Ltd. . . . . . . . . . . . . . . . . . . . . . . . . . . . . . . . . . . . . 70,200 2,386,243Honda Motor Co., Ltd. . . . . . . . . . . . . . . . . . . . . . . . . . . . . . 118,800 3,597,746Hoshizaki Corp. . . . . . . . . . . . . . . . . . . . . . . . . . . . . . . . . . . 4,100 424,563Hoya Corp. . . . . . . . . . . . . . . . . . . . . . . . . . . . . . . . . . . . . . 29,000 1,722,142Hulic Co., Ltd. . . . . . . . . . . . . . . . . . . . . . . . . . . . . . . . . . . . 17,100 167,897Idemitsu Kosan Co., Ltd. . . . . . . . . . . . . . . . . . . . . . . . . . . . . 10,500 555,550IHI Corp. . . . . . . . . . . . . . . . . . . . . . . . . . . . . . . . . . . . . . . 12,200 462,376Iida Group Holdings Co., Ltd. . . . . . . . . . . . . . . . . . . . . . . . . . 12,700 226,010Inpex Corp. . . . . . . . . . . . . . . . . . . . . . . . . . . . . . . . . . . . . 71,100 885,243Isetan Mitsukoshi Holdings, Ltd. . . . . . . . . . . . . . . . . . . . . . . . 26,900 330,426Isuzu Motors, Ltd. . . . . . . . . . . . . . . . . . . . . . . . . . . . . . . . . 43,700 689,022ITOCHU Corp. . . . . . . . . . . . . . . . . . . . . . . . . . . . . . . . . . . . 105,400 1,930,465J Front Retailing Co., Ltd. . . . . . . . . . . . . . . . . . . . . . . . . . . . 17,900 277,673Japan Airlines Co., Ltd. . . . . . . . . . . . . . . . . . . . . . . . . . . . . . 8,400 302,046Japan Airport Terminal Co., Ltd. . . . . . . . . . . . . . . . . . . . . . . . 3,500 159,299Japan Exchange Group, Inc. . . . . . . . . . . . . . . . . . . . . . . . . . . 38,100 664,121Japan Post Bank Co., Ltd. . . . . . . . . . . . . . . . . . . . . . . . . . . . 30,800 364,162Japan Post Holdings Co., Ltd. . . . . . . . . . . . . . . . . . . . . . . . . . 119,400 1,421,160
BHFTII-201

Brighthouse Funds Trust II
MetLife MSCI EAFE Index Portfolio
Schedule of Investments as of September 30, 2018 (Unaudited)
Common Stocks—(Continued)
Security Description Shares Value
Japan—(Continued)Japan Prime Realty Investment Corp. (REIT) . . . . . . . . . . . . . . . 51 $ 181,851Japan Real Estate Investment Corp. (REIT) . . . . . . . . . . . . . . . . 96 503,733Japan Retail Fund Investment Corp. (REIT) . . . . . . . . . . . . . . . . 202 366,529Japan Tobacco, Inc. . . . . . . . . . . . . . . . . . . . . . . . . . . . . . . . 79,300 2,070,936JFE Holdings, Inc. . . . . . . . . . . . . . . . . . . . . . . . . . . . . . . . . 35,100 801,615JGC Corp. . . . . . . . . . . . . . . . . . . . . . . . . . . . . . . . . . . . . . . 14,000 321,266JSR Corp. . . . . . . . . . . . . . . . . . . . . . . . . . . . . . . . . . . . . . . 11,000 205,395JTEKT Corp. . . . . . . . . . . . . . . . . . . . . . . . . . . . . . . . . . . . . 20,000 292,803JXTG Holdings, Inc. . . . . . . . . . . . . . . . . . . . . . . . . . . . . . . . 237,600 1,792,564Kajima Corp. . . . . . . . . . . . . . . . . . . . . . . . . . . . . . . . . . . . 32,000 465,109Kakaku.com, Inc. . . . . . . . . . . . . . . . . . . . . . . . . . . . . . . . . . 10,700 209,360Kamigumi Co., Ltd. . . . . . . . . . . . . . . . . . . . . . . . . . . . . . . . 8,500 187,415Kaneka Corp. . . . . . . . . . . . . . . . . . . . . . . . . . . . . . . . . . . . 4,400 203,361Kansai Electric Power Co., Inc. (The) . . . . . . . . . . . . . . . . . . . . 55,000 829,077Kansai Paint Co., Ltd. . . . . . . . . . . . . . . . . . . . . . . . . . . . . . . 10,300 189,876Kao Corp. . . . . . . . . . . . . . . . . . . . . . . . . . . . . . . . . . . . . . . 35,200 2,843,521Kawasaki Heavy Industries, Ltd. . . . . . . . . . . . . . . . . . . . . . . . 12,400 349,871KDDI Corp. . . . . . . . . . . . . . . . . . . . . . . . . . . . . . . . . . . . . . 127,000 3,510,140Keihan Holdings Co., Ltd. . . . . . . . . . . . . . . . . . . . . . . . . . . . 7,800 298,019Keikyu Corp. . . . . . . . . . . . . . . . . . . . . . . . . . . . . . . . . . . . 18,000 328,242Keio Corp. . . . . . . . . . . . . . . . . . . . . . . . . . . . . . . . . . . . . . 9,000 492,931Keisei Electric Railway Co., Ltd. . . . . . . . . . . . . . . . . . . . . . . . . 10,000 352,210Keyence Corp. . . . . . . . . . . . . . . . . . . . . . . . . . . . . . . . . . . . 7,100 4,120,282Kikkoman Corp. . . . . . . . . . . . . . . . . . . . . . . . . . . . . . . . . . 12,000 714,326Kintetsu Group Holdings Co., Ltd. . . . . . . . . . . . . . . . . . . . . . . 14,012 563,833Kirin Holdings Co., Ltd. . . . . . . . . . . . . . . . . . . . . . . . . . . . . . 60,300 1,545,608Kobayashi Pharmaceutical Co., Ltd. . . . . . . . . . . . . . . . . . . . . . 3,600 264,954Kobe Steel, Ltd. . . . . . . . . . . . . . . . . . . . . . . . . . . . . . . . . . . 27,200 241,926Koito Manufacturing Co., Ltd. . . . . . . . . . . . . . . . . . . . . . . . . . 7,700 505,169Komatsu, Ltd. . . . . . . . . . . . . . . . . . . . . . . . . . . . . . . . . . . . 65,500 1,993,758Konami Holdings Corp. . . . . . . . . . . . . . . . . . . . . . . . . . . . . . 7,300 286,056Konica Minolta, Inc. . . . . . . . . . . . . . . . . . . . . . . . . . . . . . . . 37,000 393,601Kose Corp. . . . . . . . . . . . . . . . . . . . . . . . . . . . . . . . . . . . . . 2,300 438,366Kubota Corp. . . . . . . . . . . . . . . . . . . . . . . . . . . . . . . . . . . . 70,700 1,196,693Kuraray Co., Ltd. . . . . . . . . . . . . . . . . . . . . . . . . . . . . . . . . . 24,500 368,495Kurita Water Industries, Ltd. . . . . . . . . . . . . . . . . . . . . . . . . . 7,100 206,763Kyocera Corp. . . . . . . . . . . . . . . . . . . . . . . . . . . . . . . . . . . . 22,700 1,363,360Kyowa Hakko Kirin Co., Ltd. . . . . . . . . . . . . . . . . . . . . . . . . . 20,000 375,327Kyushu Electric Power Co., Inc. . . . . . . . . . . . . . . . . . . . . . . . . 25,900 312,639Kyushu Railway Co. . . . . . . . . . . . . . . . . . . . . . . . . . . . . . . . 12,700 386,462Lawson, Inc. . . . . . . . . . . . . . . . . . . . . . . . . . . . . . . . . . . . . 3,800 231,478LINE Corp. (b) (e) . . . . . . . . . . . . . . . . . . . . . . . . . . . . . . . . 5,300 223,755Lion Corp. . . . . . . . . . . . . . . . . . . . . . . . . . . . . . . . . . . . . . 19,000 422,192LIXIL Group Corp. . . . . . . . . . . . . . . . . . . . . . . . . . . . . . . . . 19,000 366,057M3, Inc. . . . . . . . . . . . . . . . . . . . . . . . . . . . . . . . . . . . . . . . 31,400 712,197Makita Corp. . . . . . . . . . . . . . . . . . . . . . . . . . . . . . . . . . . . . 15,200 761,660Marubeni Corp. . . . . . . . . . . . . . . . . . . . . . . . . . . . . . . . . . . 122,800 1,124,616Marui Group Co., Ltd. (e) . . . . . . . . . . . . . . . . . . . . . . . . . . . 16,000 395,047Mazda Motor Corp. . . . . . . . . . . . . . . . . . . . . . . . . . . . . . . . 43,000 516,500McDonald’s Holdings Co. Japan, Ltd. . . . . . . . . . . . . . . . . . . . . 5,400 237,001Mebuki Financial Group, Inc. . . . . . . . . . . . . . . . . . . . . . . . . . 63,100 218,314Medipal Holdings Corp. . . . . . . . . . . . . . . . . . . . . . . . . . . . . . 10,700 223,395MEIJI Holdings Co., Ltd. . . . . . . . . . . . . . . . . . . . . . . . . . . . . 9,600 644,932Minebea Mitsumi, Inc. . . . . . . . . . . . . . . . . . . . . . . . . . . . . . 30,800 558,795MISUMI Group, Inc. . . . . . . . . . . . . . . . . . . . . . . . . . . . . . . . 22,200 574,124Mitsubishi Chemical Holdings Corp. . . . . . . . . . . . . . . . . . . . . . 93,700 897,069Mitsubishi Corp. . . . . . . . . . . . . . . . . . . . . . . . . . . . . . . . . . . 98,500 3,036,640
Security Description Shares Value
Japan—(Continued)Mitsubishi Electric Corp. . . . . . . . . . . . . . . . . . . . . . . . . . . . . . 131,200 $ 1,797,803Mitsubishi Estate Co., Ltd. . . . . . . . . . . . . . . . . . . . . . . . . . . . 82,300 1,400,142Mitsubishi Gas Chemical Co., Inc. . . . . . . . . . . . . . . . . . . . . . . 13,000 276,842Mitsubishi Heavy Industries, Ltd. . . . . . . . . . . . . . . . . . . . . . . . 20,800 803,517Mitsubishi Materials Corp. . . . . . . . . . . . . . . . . . . . . . . . . . . . 7,900 235,612Mitsubishi Motors Corp. . . . . . . . . . . . . . . . . . . . . . . . . . . . . . 44,999 317,817Mitsubishi Tanabe Pharma Corp. . . . . . . . . . . . . . . . . . . . . . . . 15,300 256,027Mitsubishi UFJ Financial Group, Inc. . . . . . . . . . . . . . . . . . . . . . 860,888 5,360,358Mitsubishi UFJ Lease & Finance Co., Ltd. . . . . . . . . . . . . . . . . . . 41,500 244,418Mitsui & Co., Ltd. . . . . . . . . . . . . . . . . . . . . . . . . . . . . . . . . . 118,417 2,104,983Mitsui Chemicals, Inc. . . . . . . . . . . . . . . . . . . . . . . . . . . . . . . 15,000 375,274Mitsui Fudosan Co., Ltd. . . . . . . . . . . . . . . . . . . . . . . . . . . . . 65,000 1,539,141Mitsui OSK Lines, Ltd. . . . . . . . . . . . . . . . . . . . . . . . . . . . . . . 7,500 218,878Mizuho Financial Group, Inc. . . . . . . . . . . . . . . . . . . . . . . . . . 1,752,400 3,056,649MS&AD Insurance Group Holdings, Inc. . . . . . . . . . . . . . . . . . . 35,900 1,195,681Murata Manufacturing Co., Ltd. . . . . . . . . . . . . . . . . . . . . . . . 12,900 1,978,808Nabtesco Corp. . . . . . . . . . . . . . . . . . . . . . . . . . . . . . . . . . . 7,500 199,471Nagoya Railroad Co., Ltd. . . . . . . . . . . . . . . . . . . . . . . . . . . . 14,800 366,650NEC Corp. . . . . . . . . . . . . . . . . . . . . . . . . . . . . . . . . . . . . . . 20,600 569,462Nexon Co., Ltd. (b) . . . . . . . . . . . . . . . . . . . . . . . . . . . . . . . 32,300 422,428NGK Insulators, Ltd. . . . . . . . . . . . . . . . . . . . . . . . . . . . . . . . 19,300 318,494NGK Spark Plug Co., Ltd. . . . . . . . . . . . . . . . . . . . . . . . . . . . . 12,000 349,786NH Foods, Ltd. . . . . . . . . . . . . . . . . . . . . . . . . . . . . . . . . . . 7,000 258,522Nidec Corp. . . . . . . . . . . . . . . . . . . . . . . . . . . . . . . . . . . . . 16,300 2,346,251Nikon Corp. . . . . . . . . . . . . . . . . . . . . . . . . . . . . . . . . . . . . 22,500 422,900Nintendo Co., Ltd. . . . . . . . . . . . . . . . . . . . . . . . . . . . . . . . . 8,100 2,957,350Nippon Building Fund, Inc. (REIT) . . . . . . . . . . . . . . . . . . . . . . 88 509,023Nippon Electric Glass Co., Ltd. . . . . . . . . . . . . . . . . . . . . . . . . . 6,200 195,018Nippon Express Co., Ltd. . . . . . . . . . . . . . . . . . . . . . . . . . . . . 5,900 386,983Nippon Paint Holdings Co., Ltd. . . . . . . . . . . . . . . . . . . . . . . . 9,500 354,718Nippon Prologis REIT, Inc. . . . . . . . . . . . . . . . . . . . . . . . . . . . 143 283,150Nippon Steel & Sumitomo Metal Corp. . . . . . . . . . . . . . . . . . . . 56,300 1,191,270Nippon Telegraph & Telephone Corp. . . . . . . . . . . . . . . . . . . . . 50,400 2,277,408Nippon Yusen KK . . . . . . . . . . . . . . . . . . . . . . . . . . . . . . . . . 12,600 237,048Nissan Chemical Corp. . . . . . . . . . . . . . . . . . . . . . . . . . . . . . 10,000 528,382Nissan Motor Co., Ltd. . . . . . . . . . . . . . . . . . . . . . . . . . . . . . . 166,900 1,562,870Nisshin Seifun Group, Inc. . . . . . . . . . . . . . . . . . . . . . . . . . . . 15,700 344,230Nissin Foods Holdings Co., Ltd. . . . . . . . . . . . . . . . . . . . . . . . . 4,700 323,157Nitori Holdings Co., Ltd. . . . . . . . . . . . . . . . . . . . . . . . . . . . . 5,800 832,052Nitto Denko Corp. . . . . . . . . . . . . . . . . . . . . . . . . . . . . . . . . 12,600 944,932Nomura Holdings, Inc. . . . . . . . . . . . . . . . . . . . . . . . . . . . . . 241,200 1,145,498Nomura Real Estate Holdings, Inc. . . . . . . . . . . . . . . . . . . . . . . 9,500 191,857Nomura Real Estate Master Fund, Inc. (REIT) . . . . . . . . . . . . . . . 322 440,651Nomura Research Institute, Ltd. . . . . . . . . . . . . . . . . . . . . . . . 6,900 348,352NSK, Ltd. . . . . . . . . . . . . . . . . . . . . . . . . . . . . . . . . . . . . . . 26,600 305,010NTT Data Corp. . . . . . . . . . . . . . . . . . . . . . . . . . . . . . . . . . . 40,780 564,873NTT DoCoMo, Inc. . . . . . . . . . . . . . . . . . . . . . . . . . . . . . . . . 94,600 2,544,644Obayashi Corp. . . . . . . . . . . . . . . . . . . . . . . . . . . . . . . . . . . 45,500 431,106Obic Co., Ltd. . . . . . . . . . . . . . . . . . . . . . . . . . . . . . . . . . . . 5,000 472,849Odakyu Electric Railway Co., Ltd. (e) . . . . . . . . . . . . . . . . . . . . 20,100 475,744OJI Holdings Corp. . . . . . . . . . . . . . . . . . . . . . . . . . . . . . . . . 68,000 493,885Olympus Corp. . . . . . . . . . . . . . . . . . . . . . . . . . . . . . . . . . . 22,800 890,412Omron Corp. . . . . . . . . . . . . . . . . . . . . . . . . . . . . . . . . . . . . 13,400 566,244Ono Pharmaceutical Co., Ltd. . . . . . . . . . . . . . . . . . . . . . . . . . 26,100 738,553Oracle Corp. Japan . . . . . . . . . . . . . . . . . . . . . . . . . . . . . . . 3,000 241,928Oriental Land Co., Ltd. . . . . . . . . . . . . . . . . . . . . . . . . . . . . . 14,000 1,464,497ORIX Corp. . . . . . . . . . . . . . . . . . . . . . . . . . . . . . . . . . . . . . 92,600 1,501,628
BHFTII-202
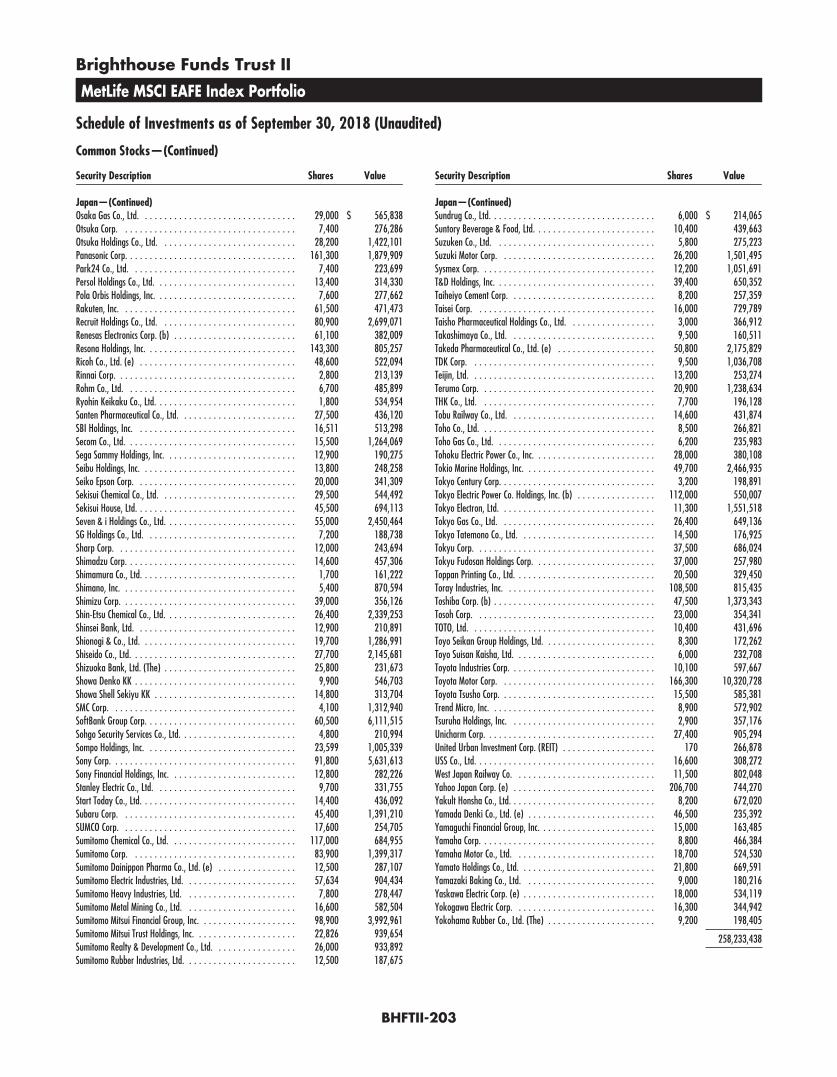
Brighthouse Funds Trust II
MetLife MSCI EAFE Index Portfolio
Schedule of Investments as of September 30, 2018 (Unaudited)
Common Stocks—(Continued)
Security Description Shares Value
Japan—(Continued)Osaka Gas Co., Ltd. . . . . . . . . . . . . . . . . . . . . . . . . . . . . . . . 29,000 $ 565,838Otsuka Corp. . . . . . . . . . . . . . . . . . . . . . . . . . . . . . . . . . . . 7,400 276,286Otsuka Holdings Co., Ltd. . . . . . . . . . . . . . . . . . . . . . . . . . . . 28,200 1,422,101Panasonic Corp. . . . . . . . . . . . . . . . . . . . . . . . . . . . . . . . . . . 161,300 1,879,909Park24 Co., Ltd. . . . . . . . . . . . . . . . . . . . . . . . . . . . . . . . . . 7,400 223,699Persol Holdings Co., Ltd. . . . . . . . . . . . . . . . . . . . . . . . . . . . . 13,400 314,330Pola Orbis Holdings, Inc. . . . . . . . . . . . . . . . . . . . . . . . . . . . . 7,600 277,662Rakuten, Inc. . . . . . . . . . . . . . . . . . . . . . . . . . . . . . . . . . . . 61,500 471,473Recruit Holdings Co., Ltd. . . . . . . . . . . . . . . . . . . . . . . . . . . . 80,900 2,699,071Renesas Electronics Corp. (b) . . . . . . . . . . . . . . . . . . . . . . . . . 61,100 382,009Resona Holdings, Inc. . . . . . . . . . . . . . . . . . . . . . . . . . . . . . . 143,300 805,257Ricoh Co., Ltd. (e) . . . . . . . . . . . . . . . . . . . . . . . . . . . . . . . . 48,600 522,094Rinnai Corp. . . . . . . . . . . . . . . . . . . . . . . . . . . . . . . . . . . . . 2,800 213,139Rohm Co., Ltd. . . . . . . . . . . . . . . . . . . . . . . . . . . . . . . . . . . 6,700 485,899Ryohin Keikaku Co., Ltd. . . . . . . . . . . . . . . . . . . . . . . . . . . . . 1,800 534,954Santen Pharmaceutical Co., Ltd. . . . . . . . . . . . . . . . . . . . . . . . 27,500 436,120SBI Holdings, Inc. . . . . . . . . . . . . . . . . . . . . . . . . . . . . . . . . 16,511 513,298Secom Co., Ltd. . . . . . . . . . . . . . . . . . . . . . . . . . . . . . . . . . . 15,500 1,264,069Sega Sammy Holdings, Inc. . . . . . . . . . . . . . . . . . . . . . . . . . . 12,900 190,275Seibu Holdings, Inc. . . . . . . . . . . . . . . . . . . . . . . . . . . . . . . . 13,800 248,258Seiko Epson Corp. . . . . . . . . . . . . . . . . . . . . . . . . . . . . . . . . 20,000 341,309Sekisui Chemical Co., Ltd. . . . . . . . . . . . . . . . . . . . . . . . . . . . 29,500 544,492Sekisui House, Ltd. . . . . . . . . . . . . . . . . . . . . . . . . . . . . . . . . 45,500 694,113Seven & i Holdings Co., Ltd. . . . . . . . . . . . . . . . . . . . . . . . . . . 55,000 2,450,464SG Holdings Co., Ltd. . . . . . . . . . . . . . . . . . . . . . . . . . . . . . . 7,200 188,738Sharp Corp. . . . . . . . . . . . . . . . . . . . . . . . . . . . . . . . . . . . . 12,000 243,694Shimadzu Corp. . . . . . . . . . . . . . . . . . . . . . . . . . . . . . . . . . . 14,600 457,306Shimamura Co., Ltd. . . . . . . . . . . . . . . . . . . . . . . . . . . . . . . . 1,700 161,222Shimano, Inc. . . . . . . . . . . . . . . . . . . . . . . . . . . . . . . . . . . . 5,400 870,594Shimizu Corp. . . . . . . . . . . . . . . . . . . . . . . . . . . . . . . . . . . . 39,000 356,126Shin-Etsu Chemical Co., Ltd. . . . . . . . . . . . . . . . . . . . . . . . . . . 26,400 2,339,253Shinsei Bank, Ltd. . . . . . . . . . . . . . . . . . . . . . . . . . . . . . . . . 12,900 210,891Shionogi & Co., Ltd. . . . . . . . . . . . . . . . . . . . . . . . . . . . . . . . 19,700 1,286,991Shiseido Co., Ltd. . . . . . . . . . . . . . . . . . . . . . . . . . . . . . . . . . 27,700 2,145,681Shizuoka Bank, Ltd. (The) . . . . . . . . . . . . . . . . . . . . . . . . . . . 25,800 231,673Showa Denko KK . . . . . . . . . . . . . . . . . . . . . . . . . . . . . . . . . 9,900 546,703Showa Shell Sekiyu KK . . . . . . . . . . . . . . . . . . . . . . . . . . . . . 14,800 313,704SMC Corp. . . . . . . . . . . . . . . . . . . . . . . . . . . . . . . . . . . . . . 4,100 1,312,940SoftBank Group Corp. . . . . . . . . . . . . . . . . . . . . . . . . . . . . . . 60,500 6,111,515Sohgo Security Services Co., Ltd. . . . . . . . . . . . . . . . . . . . . . . . 4,800 210,994Sompo Holdings, Inc. . . . . . . . . . . . . . . . . . . . . . . . . . . . . . . 23,599 1,005,339Sony Corp. . . . . . . . . . . . . . . . . . . . . . . . . . . . . . . . . . . . . . 91,800 5,631,613Sony Financial Holdings, Inc. . . . . . . . . . . . . . . . . . . . . . . . . . 12,800 282,226Stanley Electric Co., Ltd. . . . . . . . . . . . . . . . . . . . . . . . . . . . . 9,700 331,755Start Today Co., Ltd. . . . . . . . . . . . . . . . . . . . . . . . . . . . . . . . 14,400 436,092Subaru Corp. . . . . . . . . . . . . . . . . . . . . . . . . . . . . . . . . . . . 45,400 1,391,210SUMCO Corp. . . . . . . . . . . . . . . . . . . . . . . . . . . . . . . . . . . . 17,600 254,705Sumitomo Chemical Co., Ltd. . . . . . . . . . . . . . . . . . . . . . . . . . 117,000 684,955Sumitomo Corp. . . . . . . . . . . . . . . . . . . . . . . . . . . . . . . . . . 83,900 1,399,317Sumitomo Dainippon Pharma Co., Ltd. (e) . . . . . . . . . . . . . . . . 12,500 287,107Sumitomo Electric Industries, Ltd. . . . . . . . . . . . . . . . . . . . . . . 57,634 904,434Sumitomo Heavy Industries, Ltd. . . . . . . . . . . . . . . . . . . . . . . 7,800 278,447Sumitomo Metal Mining Co., Ltd. . . . . . . . . . . . . . . . . . . . . . . 16,600 582,504Sumitomo Mitsui Financial Group, Inc. . . . . . . . . . . . . . . . . . . . 98,900 3,992,961Sumitomo Mitsui Trust Holdings, Inc. . . . . . . . . . . . . . . . . . . . . 22,826 939,654Sumitomo Realty & Development Co., Ltd. . . . . . . . . . . . . . . . . 26,000 933,892Sumitomo Rubber Industries, Ltd. . . . . . . . . . . . . . . . . . . . . . . 12,500 187,675
Security Description Shares Value
Japan—(Continued)Sundrug Co., Ltd. . . . . . . . . . . . . . . . . . . . . . . . . . . . . . . . . . 6,000 $ 214,065Suntory Beverage & Food, Ltd. . . . . . . . . . . . . . . . . . . . . . . . . 10,400 439,663Suzuken Co., Ltd. . . . . . . . . . . . . . . . . . . . . . . . . . . . . . . . . 5,800 275,223Suzuki Motor Corp. . . . . . . . . . . . . . . . . . . . . . . . . . . . . . . . 26,200 1,501,495Sysmex Corp. . . . . . . . . . . . . . . . . . . . . . . . . . . . . . . . . . . . 12,200 1,051,691T&D Holdings, Inc. . . . . . . . . . . . . . . . . . . . . . . . . . . . . . . . . 39,400 650,352Taiheiyo Cement Corp. . . . . . . . . . . . . . . . . . . . . . . . . . . . . . 8,200 257,359Taisei Corp. . . . . . . . . . . . . . . . . . . . . . . . . . . . . . . . . . . . . 16,000 729,789Taisho Pharmaceutical Holdings Co., Ltd. . . . . . . . . . . . . . . . . . 3,000 366,912Takashimaya Co., Ltd. . . . . . . . . . . . . . . . . . . . . . . . . . . . . . 9,500 160,511Takeda Pharmaceutical Co., Ltd. (e) . . . . . . . . . . . . . . . . . . . . 50,800 2,175,829TDK Corp. . . . . . . . . . . . . . . . . . . . . . . . . . . . . . . . . . . . . . 9,500 1,036,708Teijin, Ltd. . . . . . . . . . . . . . . . . . . . . . . . . . . . . . . . . . . . . . 13,200 253,274Terumo Corp. . . . . . . . . . . . . . . . . . . . . . . . . . . . . . . . . . . . 20,900 1,238,634THK Co., Ltd. . . . . . . . . . . . . . . . . . . . . . . . . . . . . . . . . . . . 7,700 196,128Tobu Railway Co., Ltd. . . . . . . . . . . . . . . . . . . . . . . . . . . . . . 14,600 431,874Toho Co., Ltd. . . . . . . . . . . . . . . . . . . . . . . . . . . . . . . . . . . . 8,500 266,821Toho Gas Co., Ltd. . . . . . . . . . . . . . . . . . . . . . . . . . . . . . . . . 6,200 235,983Tohoku Electric Power Co., Inc. . . . . . . . . . . . . . . . . . . . . . . . . 28,000 380,108Tokio Marine Holdings, Inc. . . . . . . . . . . . . . . . . . . . . . . . . . . 49,700 2,466,935Tokyo Century Corp. . . . . . . . . . . . . . . . . . . . . . . . . . . . . . . . 3,200 198,891Tokyo Electric Power Co. Holdings, Inc. (b) . . . . . . . . . . . . . . . . 112,000 550,007Tokyo Electron, Ltd. . . . . . . . . . . . . . . . . . . . . . . . . . . . . . . . 11,300 1,551,518Tokyo Gas Co., Ltd. . . . . . . . . . . . . . . . . . . . . . . . . . . . . . . . 26,400 649,136Tokyo Tatemono Co., Ltd. . . . . . . . . . . . . . . . . . . . . . . . . . . . 14,500 176,925Tokyu Corp. . . . . . . . . . . . . . . . . . . . . . . . . . . . . . . . . . . . . 37,500 686,024Tokyu Fudosan Holdings Corp. . . . . . . . . . . . . . . . . . . . . . . . . 37,000 257,980Toppan Printing Co., Ltd. . . . . . . . . . . . . . . . . . . . . . . . . . . . . 20,500 329,450Toray Industries, Inc. . . . . . . . . . . . . . . . . . . . . . . . . . . . . . . 108,500 815,435Toshiba Corp. (b) . . . . . . . . . . . . . . . . . . . . . . . . . . . . . . . . . 47,500 1,373,343Tosoh Corp. . . . . . . . . . . . . . . . . . . . . . . . . . . . . . . . . . . . . 23,000 354,341TOTO, Ltd. . . . . . . . . . . . . . . . . . . . . . . . . . . . . . . . . . . . . . 10,400 431,696Toyo Seikan Group Holdings, Ltd. . . . . . . . . . . . . . . . . . . . . . . 8,300 172,262Toyo Suisan Kaisha, Ltd. . . . . . . . . . . . . . . . . . . . . . . . . . . . . 6,000 232,708Toyota Industries Corp. . . . . . . . . . . . . . . . . . . . . . . . . . . . . . 10,100 597,667Toyota Motor Corp. . . . . . . . . . . . . . . . . . . . . . . . . . . . . . . . 166,300 10,320,728Toyota Tsusho Corp. . . . . . . . . . . . . . . . . . . . . . . . . . . . . . . . 15,500 585,381Trend Micro, Inc. . . . . . . . . . . . . . . . . . . . . . . . . . . . . . . . . . 8,900 572,902Tsuruha Holdings, Inc. . . . . . . . . . . . . . . . . . . . . . . . . . . . . . 2,900 357,176Unicharm Corp. . . . . . . . . . . . . . . . . . . . . . . . . . . . . . . . . . . 27,400 905,294United Urban Investment Corp. (REIT) . . . . . . . . . . . . . . . . . . . 170 266,878USS Co., Ltd. . . . . . . . . . . . . . . . . . . . . . . . . . . . . . . . . . . . . 16,600 308,272West Japan Railway Co. . . . . . . . . . . . . . . . . . . . . . . . . . . . . 11,500 802,048Yahoo Japan Corp. (e) . . . . . . . . . . . . . . . . . . . . . . . . . . . . . 206,700 744,270Yakult Honsha Co., Ltd. . . . . . . . . . . . . . . . . . . . . . . . . . . . . . 8,200 672,020Yamada Denki Co., Ltd. (e) . . . . . . . . . . . . . . . . . . . . . . . . . . 46,500 235,392Yamaguchi Financial Group, Inc. . . . . . . . . . . . . . . . . . . . . . . . 15,000 163,485Yamaha Corp. . . . . . . . . . . . . . . . . . . . . . . . . . . . . . . . . . . . 8,800 466,384Yamaha Motor Co., Ltd. . . . . . . . . . . . . . . . . . . . . . . . . . . . . 18,700 524,530Yamato Holdings Co., Ltd. . . . . . . . . . . . . . . . . . . . . . . . . . . . 21,800 669,591Yamazaki Baking Co., Ltd. . . . . . . . . . . . . . . . . . . . . . . . . . . 9,000 180,216Yaskawa Electric Corp. (e) . . . . . . . . . . . . . . . . . . . . . . . . . . . 18,000 534,119Yokogawa Electric Corp. . . . . . . . . . . . . . . . . . . . . . . . . . . . . 16,300 344,942Yokohama Rubber Co., Ltd. (The) . . . . . . . . . . . . . . . . . . . . . . 9,200 198,405
258,233,438
BHFTII-203
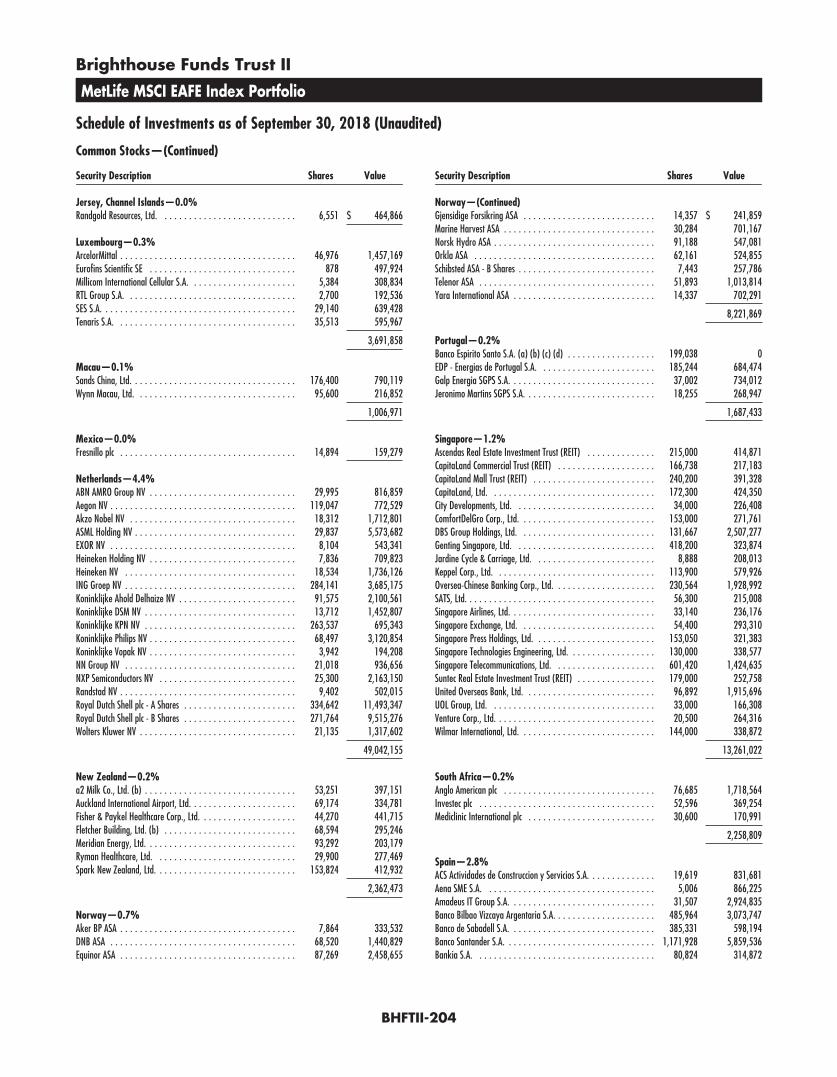
Brighthouse Funds Trust II
MetLife MSCI EAFE Index Portfolio
Schedule of Investments as of September 30, 2018 (Unaudited)
Common Stocks—(Continued)
Security Description Shares Value
Jersey, Channel Islands—0.0%Randgold Resources, Ltd. . . . . . . . . . . . . . . . . . . . . . . . . . . . 6,551 $ 464,866
Luxembourg—0.3%ArcelorMittal . . . . . . . . . . . . . . . . . . . . . . . . . . . . . . . . . . . . 46,976 1,457,169Eurofins Scientific SE . . . . . . . . . . . . . . . . . . . . . . . . . . . . . . 878 497,924Millicom International Cellular S.A. . . . . . . . . . . . . . . . . . . . . . 5,384 308,834RTL Group S.A. . . . . . . . . . . . . . . . . . . . . . . . . . . . . . . . . . . 2,700 192,536SES S.A. . . . . . . . . . . . . . . . . . . . . . . . . . . . . . . . . . . . . . . . 29,140 639,428Tenaris S.A. . . . . . . . . . . . . . . . . . . . . . . . . . . . . . . . . . . . . 35,513 595,967
3,691,858
Macau—0.1%Sands China, Ltd. . . . . . . . . . . . . . . . . . . . . . . . . . . . . . . . . . 176,400 790,119Wynn Macau, Ltd. . . . . . . . . . . . . . . . . . . . . . . . . . . . . . . . . 95,600 216,852
1,006,971
Mexico—0.0%Fresnillo plc . . . . . . . . . . . . . . . . . . . . . . . . . . . . . . . . . . . . 14,894 159,279
Netherlands—4.4%ABN AMRO Group NV . . . . . . . . . . . . . . . . . . . . . . . . . . . . . . 29,995 816,859Aegon NV . . . . . . . . . . . . . . . . . . . . . . . . . . . . . . . . . . . . . . 119,047 772,529Akzo Nobel NV . . . . . . . . . . . . . . . . . . . . . . . . . . . . . . . . . . 18,312 1,712,801ASML Holding NV . . . . . . . . . . . . . . . . . . . . . . . . . . . . . . . . . 29,837 5,573,682EXOR NV . . . . . . . . . . . . . . . . . . . . . . . . . . . . . . . . . . . . . . 8,104 543,341Heineken Holding NV . . . . . . . . . . . . . . . . . . . . . . . . . . . . . . 7,836 709,823Heineken NV . . . . . . . . . . . . . . . . . . . . . . . . . . . . . . . . . . . 18,534 1,736,126ING Groep NV . . . . . . . . . . . . . . . . . . . . . . . . . . . . . . . . . . . 284,141 3,685,175Koninklijke Ahold Delhaize NV . . . . . . . . . . . . . . . . . . . . . . . . 91,575 2,100,561Koninklijke DSM NV . . . . . . . . . . . . . . . . . . . . . . . . . . . . . . . 13,712 1,452,807Koninklijke KPN NV . . . . . . . . . . . . . . . . . . . . . . . . . . . . . . . 263,537 695,343Koninklijke Philips NV . . . . . . . . . . . . . . . . . . . . . . . . . . . . . . 68,497 3,120,854Koninklijke Vopak NV . . . . . . . . . . . . . . . . . . . . . . . . . . . . . . 3,942 194,208NN Group NV . . . . . . . . . . . . . . . . . . . . . . . . . . . . . . . . . . . 21,018 936,656NXP Semiconductors NV . . . . . . . . . . . . . . . . . . . . . . . . . . . . 25,300 2,163,150Randstad NV . . . . . . . . . . . . . . . . . . . . . . . . . . . . . . . . . . . . 9,402 502,015Royal Dutch Shell plc - A Shares . . . . . . . . . . . . . . . . . . . . . . . 334,642 11,493,347Royal Dutch Shell plc - B Shares . . . . . . . . . . . . . . . . . . . . . . . 271,764 9,515,276Wolters Kluwer NV . . . . . . . . . . . . . . . . . . . . . . . . . . . . . . . . 21,135 1,317,602
49,042,155
New Zealand—0.2%a2 Milk Co., Ltd. (b) . . . . . . . . . . . . . . . . . . . . . . . . . . . . . . . 53,251 397,151Auckland International Airport, Ltd. . . . . . . . . . . . . . . . . . . . . . 69,174 334,781Fisher & Paykel Healthcare Corp., Ltd. . . . . . . . . . . . . . . . . . . . 44,270 441,715Fletcher Building, Ltd. (b) . . . . . . . . . . . . . . . . . . . . . . . . . . . 68,594 295,246Meridian Energy, Ltd. . . . . . . . . . . . . . . . . . . . . . . . . . . . . . . 93,292 203,179Ryman Healthcare, Ltd. . . . . . . . . . . . . . . . . . . . . . . . . . . . . 29,900 277,469Spark New Zealand, Ltd. . . . . . . . . . . . . . . . . . . . . . . . . . . . . 153,824 412,932
2,362,473
Norway—0.7%Aker BP ASA . . . . . . . . . . . . . . . . . . . . . . . . . . . . . . . . . . . . 7,864 333,532DNB ASA . . . . . . . . . . . . . . . . . . . . . . . . . . . . . . . . . . . . . . 68,520 1,440,829Equinor ASA . . . . . . . . . . . . . . . . . . . . . . . . . . . . . . . . . . . . 87,269 2,458,655
Security Description Shares Value
Norway—(Continued)Gjensidige Forsikring ASA . . . . . . . . . . . . . . . . . . . . . . . . . . . 14,357 $ 241,859Marine Harvest ASA . . . . . . . . . . . . . . . . . . . . . . . . . . . . . . . 30,284 701,167Norsk Hydro ASA . . . . . . . . . . . . . . . . . . . . . . . . . . . . . . . . . 91,188 547,081Orkla ASA . . . . . . . . . . . . . . . . . . . . . . . . . . . . . . . . . . . . . 62,161 524,855Schibsted ASA - B Shares . . . . . . . . . . . . . . . . . . . . . . . . . . . . 7,443 257,786Telenor ASA . . . . . . . . . . . . . . . . . . . . . . . . . . . . . . . . . . . . 51,893 1,013,814Yara International ASA . . . . . . . . . . . . . . . . . . . . . . . . . . . . . 14,337 702,291
8,221,869
Portugal—0.2%Banco Espirito Santo S.A. (a) (b) (c) (d) . . . . . . . . . . . . . . . . . . 199,038 0EDP - Energias de Portugal S.A. . . . . . . . . . . . . . . . . . . . . . . . 185,244 684,474Galp Energia SGPS S.A. . . . . . . . . . . . . . . . . . . . . . . . . . . . . . 37,002 734,012Jeronimo Martins SGPS S.A. . . . . . . . . . . . . . . . . . . . . . . . . . . 18,255 268,947
1,687,433
Singapore—1.2%Ascendas Real Estate Investment Trust (REIT) . . . . . . . . . . . . . . 215,000 414,871CapitaLand Commercial Trust (REIT) . . . . . . . . . . . . . . . . . . . . 166,738 217,183CapitaLand Mall Trust (REIT) . . . . . . . . . . . . . . . . . . . . . . . . . 240,200 391,328CapitaLand, Ltd. . . . . . . . . . . . . . . . . . . . . . . . . . . . . . . . . . 172,300 424,350City Developments, Ltd. . . . . . . . . . . . . . . . . . . . . . . . . . . . . 34,000 226,408ComfortDelGro Corp., Ltd. . . . . . . . . . . . . . . . . . . . . . . . . . . . 153,000 271,761DBS Group Holdings, Ltd. . . . . . . . . . . . . . . . . . . . . . . . . . . . 131,667 2,507,277Genting Singapore, Ltd. . . . . . . . . . . . . . . . . . . . . . . . . . . . . 418,200 323,874Jardine Cycle & Carriage, Ltd. . . . . . . . . . . . . . . . . . . . . . . . . 8,888 208,013Keppel Corp., Ltd. . . . . . . . . . . . . . . . . . . . . . . . . . . . . . . . . 113,900 579,926Oversea-Chinese Banking Corp., Ltd. . . . . . . . . . . . . . . . . . . . . 230,564 1,928,992SATS, Ltd. . . . . . . . . . . . . . . . . . . . . . . . . . . . . . . . . . . . . . . 56,300 215,008Singapore Airlines, Ltd. . . . . . . . . . . . . . . . . . . . . . . . . . . . . . 33,140 236,176Singapore Exchange, Ltd. . . . . . . . . . . . . . . . . . . . . . . . . . . . 54,400 293,310Singapore Press Holdings, Ltd. . . . . . . . . . . . . . . . . . . . . . . . . 153,050 321,383Singapore Technologies Engineering, Ltd. . . . . . . . . . . . . . . . . . 130,000 338,577Singapore Telecommunications, Ltd. . . . . . . . . . . . . . . . . . . . . 601,420 1,424,635Suntec Real Estate Investment Trust (REIT) . . . . . . . . . . . . . . . . 179,000 252,758United Overseas Bank, Ltd. . . . . . . . . . . . . . . . . . . . . . . . . . . 96,892 1,915,696UOL Group, Ltd. . . . . . . . . . . . . . . . . . . . . . . . . . . . . . . . . . 33,000 166,308Venture Corp., Ltd. . . . . . . . . . . . . . . . . . . . . . . . . . . . . . . . . 20,500 264,316Wilmar International, Ltd. . . . . . . . . . . . . . . . . . . . . . . . . . . . 144,000 338,872
13,261,022
South Africa—0.2%Anglo American plc . . . . . . . . . . . . . . . . . . . . . . . . . . . . . . . 76,685 1,718,564Investec plc . . . . . . . . . . . . . . . . . . . . . . . . . . . . . . . . . . . . 52,596 369,254Mediclinic International plc . . . . . . . . . . . . . . . . . . . . . . . . . . 30,600 170,991
2,258,809
Spain—2.8%ACS Actividades de Construccion y Servicios S.A. . . . . . . . . . . . . . 19,619 831,681Aena SME S.A. . . . . . . . . . . . . . . . . . . . . . . . . . . . . . . . . . . 5,006 866,225Amadeus IT Group S.A. . . . . . . . . . . . . . . . . . . . . . . . . . . . . . 31,507 2,924,835Banco Bilbao Vizcaya Argentaria S.A. . . . . . . . . . . . . . . . . . . . . 485,964 3,073,747Banco de Sabadell S.A. . . . . . . . . . . . . . . . . . . . . . . . . . . . . . 385,331 598,194Banco Santander S.A. . . . . . . . . . . . . . . . . . . . . . . . . . . . . . . 1,171,928 5,859,536Bankia S.A. . . . . . . . . . . . . . . . . . . . . . . . . . . . . . . . . . . . . 80,824 314,872
BHFTII-204
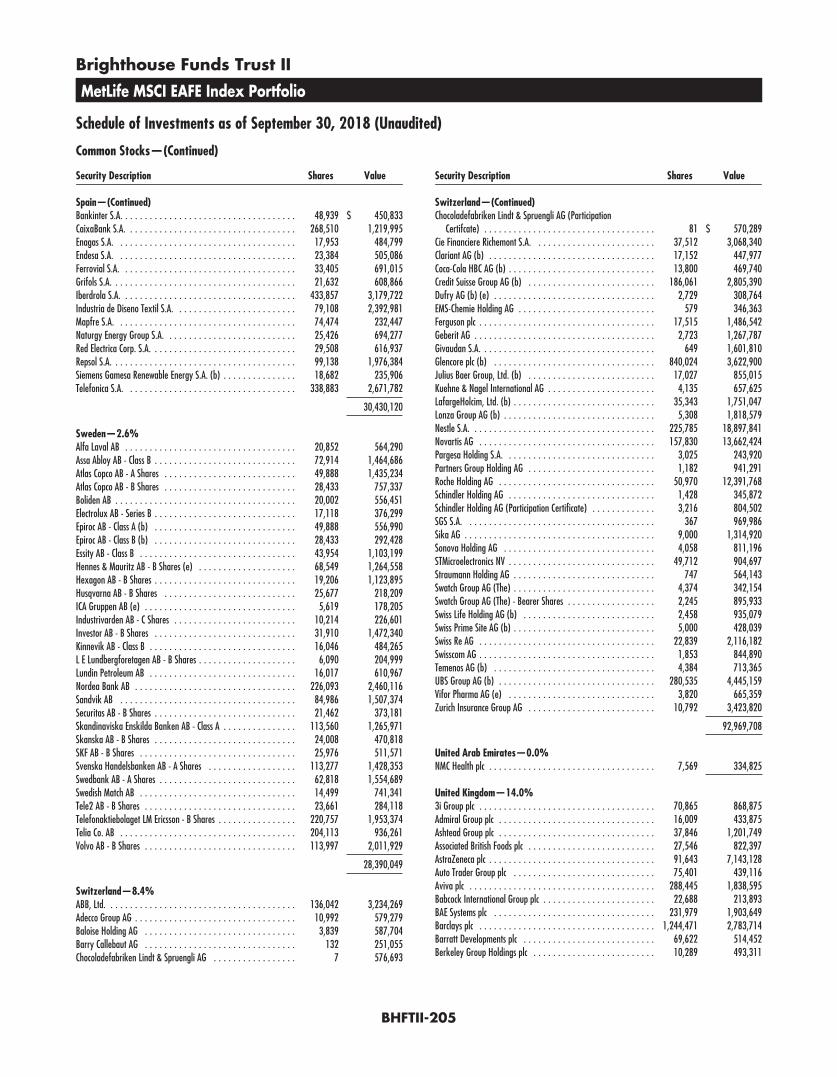
Brighthouse Funds Trust II
MetLife MSCI EAFE Index Portfolio
Schedule of Investments as of September 30, 2018 (Unaudited)
Common Stocks—(Continued)
Security Description Shares Value
Spain—(Continued)Bankinter S.A. . . . . . . . . . . . . . . . . . . . . . . . . . . . . . . . . . . . 48,939 $ 450,833CaixaBank S.A. . . . . . . . . . . . . . . . . . . . . . . . . . . . . . . . . . . 268,510 1,219,995Enagas S.A. . . . . . . . . . . . . . . . . . . . . . . . . . . . . . . . . . . . . 17,953 484,799Endesa S.A. . . . . . . . . . . . . . . . . . . . . . . . . . . . . . . . . . . . . 23,384 505,086Ferrovial S.A. . . . . . . . . . . . . . . . . . . . . . . . . . . . . . . . . . . . 33,405 691,015Grifols S.A. . . . . . . . . . . . . . . . . . . . . . . . . . . . . . . . . . . . . . 21,632 608,866Iberdrola S.A. . . . . . . . . . . . . . . . . . . . . . . . . . . . . . . . . . . . 433,857 3,179,722Industria de Diseno Textil S.A. . . . . . . . . . . . . . . . . . . . . . . . . 79,108 2,392,981Mapfre S.A. . . . . . . . . . . . . . . . . . . . . . . . . . . . . . . . . . . . . 74,474 232,447Naturgy Energy Group S.A. . . . . . . . . . . . . . . . . . . . . . . . . . . 25,426 694,277Red Electrica Corp. S.A. . . . . . . . . . . . . . . . . . . . . . . . . . . . . . 29,508 616,937Repsol S.A. . . . . . . . . . . . . . . . . . . . . . . . . . . . . . . . . . . . . . 99,138 1,976,384Siemens Gamesa Renewable Energy S.A. (b) . . . . . . . . . . . . . . . 18,682 235,906Telefonica S.A. . . . . . . . . . . . . . . . . . . . . . . . . . . . . . . . . . . 338,883 2,671,782
30,430,120
Sweden—2.6%Alfa Laval AB . . . . . . . . . . . . . . . . . . . . . . . . . . . . . . . . . . . 20,852 564,290Assa Abloy AB - Class B . . . . . . . . . . . . . . . . . . . . . . . . . . . . . 72,914 1,464,686Atlas Copco AB - A Shares . . . . . . . . . . . . . . . . . . . . . . . . . . . 49,888 1,435,234Atlas Copco AB - B Shares . . . . . . . . . . . . . . . . . . . . . . . . . . . 28,433 757,337Boliden AB . . . . . . . . . . . . . . . . . . . . . . . . . . . . . . . . . . . . . 20,002 556,451Electrolux AB - Series B . . . . . . . . . . . . . . . . . . . . . . . . . . . . . 17,118 376,299Epiroc AB - Class A (b) . . . . . . . . . . . . . . . . . . . . . . . . . . . . . 49,888 556,990Epiroc AB - Class B (b) . . . . . . . . . . . . . . . . . . . . . . . . . . . . . 28,433 292,428Essity AB - Class B . . . . . . . . . . . . . . . . . . . . . . . . . . . . . . . . 43,954 1,103,199Hennes & Mauritz AB - B Shares (e) . . . . . . . . . . . . . . . . . . . . 68,549 1,264,558Hexagon AB - B Shares . . . . . . . . . . . . . . . . . . . . . . . . . . . . . 19,206 1,123,895Husqvarna AB - B Shares . . . . . . . . . . . . . . . . . . . . . . . . . . . 25,677 218,209ICA Gruppen AB (e) . . . . . . . . . . . . . . . . . . . . . . . . . . . . . . . 5,619 178,205Industrivarden AB - C Shares . . . . . . . . . . . . . . . . . . . . . . . . . 10,214 226,601Investor AB - B Shares . . . . . . . . . . . . . . . . . . . . . . . . . . . . . 31,910 1,472,340Kinnevik AB - Class B . . . . . . . . . . . . . . . . . . . . . . . . . . . . . . 16,046 484,265L E Lundbergforetagen AB - B Shares . . . . . . . . . . . . . . . . . . . . 6,090 204,999Lundin Petroleum AB . . . . . . . . . . . . . . . . . . . . . . . . . . . . . . 16,017 610,967Nordea Bank AB . . . . . . . . . . . . . . . . . . . . . . . . . . . . . . . . . 226,093 2,460,116Sandvik AB . . . . . . . . . . . . . . . . . . . . . . . . . . . . . . . . . . . . 84,986 1,507,374Securitas AB - B Shares . . . . . . . . . . . . . . . . . . . . . . . . . . . . . 21,462 373,181Skandinaviska Enskilda Banken AB - Class A . . . . . . . . . . . . . . . 113,560 1,265,971Skanska AB - B Shares . . . . . . . . . . . . . . . . . . . . . . . . . . . . . 24,008 470,818SKF AB - B Shares . . . . . . . . . . . . . . . . . . . . . . . . . . . . . . . . 25,976 511,571Svenska Handelsbanken AB - A Shares . . . . . . . . . . . . . . . . . . 113,277 1,428,353Swedbank AB - A Shares . . . . . . . . . . . . . . . . . . . . . . . . . . . . 62,818 1,554,689Swedish Match AB . . . . . . . . . . . . . . . . . . . . . . . . . . . . . . . . 14,499 741,341Tele2 AB - B Shares . . . . . . . . . . . . . . . . . . . . . . . . . . . . . . . 23,661 284,118Telefonaktiebolaget LM Ericsson - B Shares . . . . . . . . . . . . . . . . 220,757 1,953,374Telia Co. AB . . . . . . . . . . . . . . . . . . . . . . . . . . . . . . . . . . . . 204,113 936,261Volvo AB - B Shares . . . . . . . . . . . . . . . . . . . . . . . . . . . . . . . 113,997 2,011,929
28,390,049
Switzerland—8.4%ABB, Ltd. . . . . . . . . . . . . . . . . . . . . . . . . . . . . . . . . . . . . . . 136,042 3,234,269Adecco Group AG . . . . . . . . . . . . . . . . . . . . . . . . . . . . . . . . . 10,992 579,279Baloise Holding AG . . . . . . . . . . . . . . . . . . . . . . . . . . . . . . . 3,839 587,704Barry Callebaut AG . . . . . . . . . . . . . . . . . . . . . . . . . . . . . . . 132 251,055Chocoladefabriken Lindt & Spruengli AG . . . . . . . . . . . . . . . . . 7 576,693
Security Description Shares Value
Switzerland—(Continued)Chocoladefabriken Lindt & Spruengli AG (Participation
Certifcate) . . . . . . . . . . . . . . . . . . . . . . . . . . . . . . . . . . . 81 $ 570,289Cie Financiere Richemont S.A. . . . . . . . . . . . . . . . . . . . . . . . . 37,512 3,068,340Clariant AG (b) . . . . . . . . . . . . . . . . . . . . . . . . . . . . . . . . . . 17,152 447,977Coca-Cola HBC AG (b) . . . . . . . . . . . . . . . . . . . . . . . . . . . . . . 13,800 469,740Credit Suisse Group AG (b) . . . . . . . . . . . . . . . . . . . . . . . . . . 186,061 2,805,390Dufry AG (b) (e) . . . . . . . . . . . . . . . . . . . . . . . . . . . . . . . . . 2,729 308,764EMS-Chemie Holding AG . . . . . . . . . . . . . . . . . . . . . . . . . . . . 579 346,363Ferguson plc . . . . . . . . . . . . . . . . . . . . . . . . . . . . . . . . . . . . 17,515 1,486,542Geberit AG . . . . . . . . . . . . . . . . . . . . . . . . . . . . . . . . . . . . . 2,723 1,267,787Givaudan S.A. . . . . . . . . . . . . . . . . . . . . . . . . . . . . . . . . . . . 649 1,601,810Glencore plc (b) . . . . . . . . . . . . . . . . . . . . . . . . . . . . . . . . . 840,024 3,622,900Julius Baer Group, Ltd. (b) . . . . . . . . . . . . . . . . . . . . . . . . . . 17,027 855,015Kuehne & Nagel International AG . . . . . . . . . . . . . . . . . . . . . . 4,135 657,625LafargeHolcim, Ltd. (b) . . . . . . . . . . . . . . . . . . . . . . . . . . . . . 35,343 1,751,047Lonza Group AG (b) . . . . . . . . . . . . . . . . . . . . . . . . . . . . . . . 5,308 1,818,579Nestle S.A. . . . . . . . . . . . . . . . . . . . . . . . . . . . . . . . . . . . . . 225,785 18,897,841Novartis AG . . . . . . . . . . . . . . . . . . . . . . . . . . . . . . . . . . . . 157,830 13,662,424Pargesa Holding S.A. . . . . . . . . . . . . . . . . . . . . . . . . . . . . . . 3,025 243,920Partners Group Holding AG . . . . . . . . . . . . . . . . . . . . . . . . . . 1,182 941,291Roche Holding AG . . . . . . . . . . . . . . . . . . . . . . . . . . . . . . . . 50,970 12,391,768Schindler Holding AG . . . . . . . . . . . . . . . . . . . . . . . . . . . . . . 1,428 345,872Schindler Holding AG (Participation Certificate) . . . . . . . . . . . . . 3,216 804,502SGS S.A. . . . . . . . . . . . . . . . . . . . . . . . . . . . . . . . . . . . . . . 367 969,986Sika AG . . . . . . . . . . . . . . . . . . . . . . . . . . . . . . . . . . . . . . . 9,000 1,314,920Sonova Holding AG . . . . . . . . . . . . . . . . . . . . . . . . . . . . . . . 4,058 811,196STMicroelectronics NV . . . . . . . . . . . . . . . . . . . . . . . . . . . . . . 49,712 904,697Straumann Holding AG . . . . . . . . . . . . . . . . . . . . . . . . . . . . . 747 564,143Swatch Group AG (The) . . . . . . . . . . . . . . . . . . . . . . . . . . . . . 4,374 342,154Swatch Group AG (The) - Bearer Shares . . . . . . . . . . . . . . . . . . 2,245 895,933Swiss Life Holding AG (b) . . . . . . . . . . . . . . . . . . . . . . . . . . . 2,458 935,079Swiss Prime Site AG (b) . . . . . . . . . . . . . . . . . . . . . . . . . . . . . 5,000 428,039Swiss Re AG . . . . . . . . . . . . . . . . . . . . . . . . . . . . . . . . . . . . 22,839 2,116,182Swisscom AG . . . . . . . . . . . . . . . . . . . . . . . . . . . . . . . . . . . . 1,853 844,890Temenos AG (b) . . . . . . . . . . . . . . . . . . . . . . . . . . . . . . . . . 4,384 713,365UBS Group AG (b) . . . . . . . . . . . . . . . . . . . . . . . . . . . . . . . . 280,535 4,445,159Vifor Pharma AG (e) . . . . . . . . . . . . . . . . . . . . . . . . . . . . . . 3,820 665,359Zurich Insurance Group AG . . . . . . . . . . . . . . . . . . . . . . . . . . 10,792 3,423,820
92,969,708
United Arab Emirates—0.0%NMC Health plc . . . . . . . . . . . . . . . . . . . . . . . . . . . . . . . . . . 7,569 334,825
United Kingdom—14.0%3i Group plc . . . . . . . . . . . . . . . . . . . . . . . . . . . . . . . . . . . . 70,865 868,875Admiral Group plc . . . . . . . . . . . . . . . . . . . . . . . . . . . . . . . . 16,009 433,875Ashtead Group plc . . . . . . . . . . . . . . . . . . . . . . . . . . . . . . . . 37,846 1,201,749Associated British Foods plc . . . . . . . . . . . . . . . . . . . . . . . . . . 27,546 822,397AstraZeneca plc . . . . . . . . . . . . . . . . . . . . . . . . . . . . . . . . . . 91,643 7,143,128Auto Trader Group plc . . . . . . . . . . . . . . . . . . . . . . . . . . . . . 75,401 439,116Aviva plc . . . . . . . . . . . . . . . . . . . . . . . . . . . . . . . . . . . . . . 288,445 1,838,595Babcock International Group plc . . . . . . . . . . . . . . . . . . . . . . . 22,688 213,893BAE Systems plc . . . . . . . . . . . . . . . . . . . . . . . . . . . . . . . . . 231,979 1,903,649Barclays plc . . . . . . . . . . . . . . . . . . . . . . . . . . . . . . . . . . . . 1,244,471 2,783,714Barratt Developments plc . . . . . . . . . . . . . . . . . . . . . . . . . . . 69,622 514,452Berkeley Group Holdings plc . . . . . . . . . . . . . . . . . . . . . . . . . 10,289 493,311
BHFTII-205
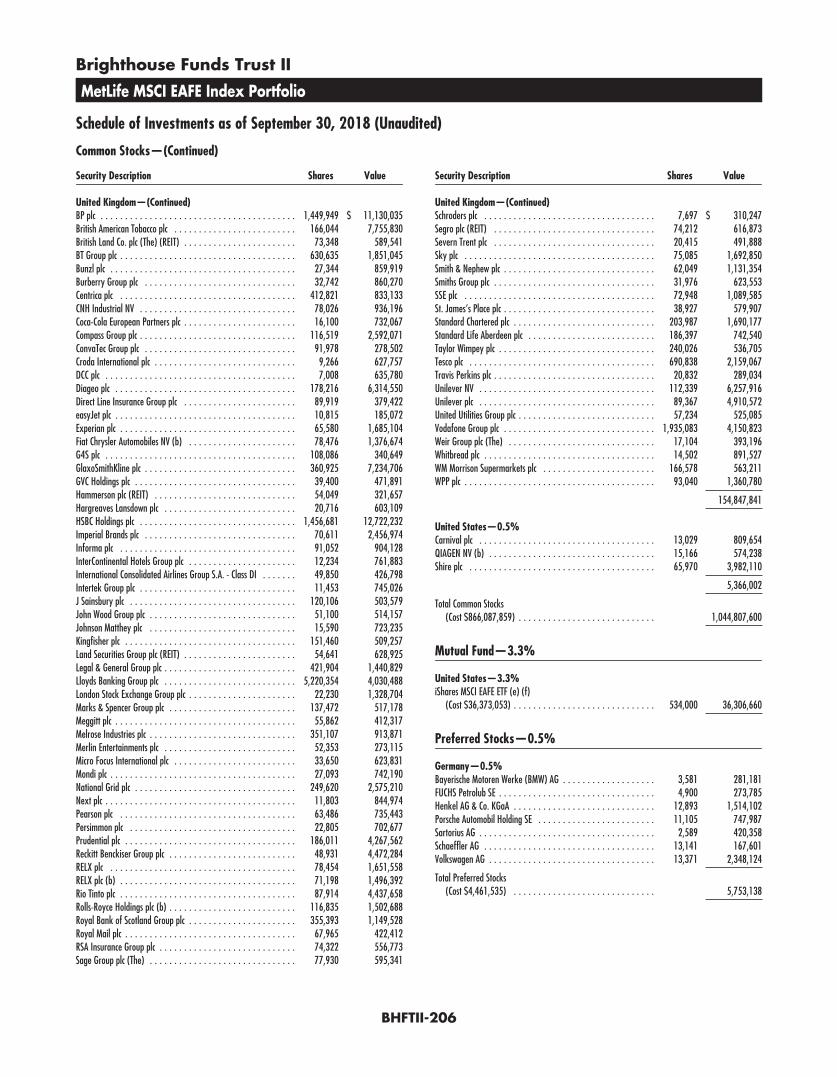
Brighthouse Funds Trust II
MetLife MSCI EAFE Index Portfolio
Schedule of Investments as of September 30, 2018 (Unaudited)
Common Stocks—(Continued)
Security Description Shares Value
United Kingdom—(Continued)BP plc . . . . . . . . . . . . . . . . . . . . . . . . . . . . . . . . . . . . . . . . 1,449,949 $ 11,130,035British American Tobacco plc . . . . . . . . . . . . . . . . . . . . . . . . . 166,044 7,755,830British Land Co. plc (The) (REIT) . . . . . . . . . . . . . . . . . . . . . . . 73,348 589,541BT Group plc . . . . . . . . . . . . . . . . . . . . . . . . . . . . . . . . . . . . 630,635 1,851,045Bunzl plc . . . . . . . . . . . . . . . . . . . . . . . . . . . . . . . . . . . . . . 27,344 859,919Burberry Group plc . . . . . . . . . . . . . . . . . . . . . . . . . . . . . . . 32,742 860,270Centrica plc . . . . . . . . . . . . . . . . . . . . . . . . . . . . . . . . . . . . 412,821 833,133CNH Industrial NV . . . . . . . . . . . . . . . . . . . . . . . . . . . . . . . . 78,026 936,196Coca-Cola European Partners plc . . . . . . . . . . . . . . . . . . . . . . . 16,100 732,067Compass Group plc . . . . . . . . . . . . . . . . . . . . . . . . . . . . . . . . 116,519 2,592,071ConvaTec Group plc . . . . . . . . . . . . . . . . . . . . . . . . . . . . . . . 91,978 278,502Croda International plc . . . . . . . . . . . . . . . . . . . . . . . . . . . . . 9,266 627,757DCC plc . . . . . . . . . . . . . . . . . . . . . . . . . . . . . . . . . . . . . . . 7,008 635,780Diageo plc . . . . . . . . . . . . . . . . . . . . . . . . . . . . . . . . . . . . . 178,216 6,314,550Direct Line Insurance Group plc . . . . . . . . . . . . . . . . . . . . . . . 89,919 379,422easyJet plc . . . . . . . . . . . . . . . . . . . . . . . . . . . . . . . . . . . . . 10,815 185,072Experian plc . . . . . . . . . . . . . . . . . . . . . . . . . . . . . . . . . . . . 65,580 1,685,104Fiat Chrysler Automobiles NV (b) . . . . . . . . . . . . . . . . . . . . . . 78,476 1,376,674G4S plc . . . . . . . . . . . . . . . . . . . . . . . . . . . . . . . . . . . . . . . 108,086 340,649GlaxoSmithKline plc . . . . . . . . . . . . . . . . . . . . . . . . . . . . . . . 360,925 7,234,706GVC Holdings plc . . . . . . . . . . . . . . . . . . . . . . . . . . . . . . . . . 39,400 471,891Hammerson plc (REIT) . . . . . . . . . . . . . . . . . . . . . . . . . . . . . 54,049 321,657Hargreaves Lansdown plc . . . . . . . . . . . . . . . . . . . . . . . . . . . 20,716 603,109HSBC Holdings plc . . . . . . . . . . . . . . . . . . . . . . . . . . . . . . . . 1,456,681 12,722,232Imperial Brands plc . . . . . . . . . . . . . . . . . . . . . . . . . . . . . . . 70,611 2,456,974Informa plc . . . . . . . . . . . . . . . . . . . . . . . . . . . . . . . . . . . . 91,052 904,128InterContinental Hotels Group plc . . . . . . . . . . . . . . . . . . . . . . 12,234 761,883International Consolidated Airlines Group S.A. - Class DI . . . . . . . 49,850 426,798Intertek Group plc . . . . . . . . . . . . . . . . . . . . . . . . . . . . . . . . 11,453 745,026J Sainsbury plc . . . . . . . . . . . . . . . . . . . . . . . . . . . . . . . . . . 120,106 503,579John Wood Group plc . . . . . . . . . . . . . . . . . . . . . . . . . . . . . . 51,100 514,157Johnson Matthey plc . . . . . . . . . . . . . . . . . . . . . . . . . . . . . . 15,590 723,235Kingfisher plc . . . . . . . . . . . . . . . . . . . . . . . . . . . . . . . . . . . 151,460 509,257Land Securities Group plc (REIT) . . . . . . . . . . . . . . . . . . . . . . . 54,641 628,925Legal & General Group plc . . . . . . . . . . . . . . . . . . . . . . . . . . . 421,904 1,440,829Lloyds Banking Group plc . . . . . . . . . . . . . . . . . . . . . . . . . . . 5,220,354 4,030,488London Stock Exchange Group plc . . . . . . . . . . . . . . . . . . . . . . 22,230 1,328,704Marks & Spencer Group plc . . . . . . . . . . . . . . . . . . . . . . . . . . 137,472 517,178Meggitt plc . . . . . . . . . . . . . . . . . . . . . . . . . . . . . . . . . . . . . 55,862 412,317Melrose Industries plc . . . . . . . . . . . . . . . . . . . . . . . . . . . . . . 351,107 913,871Merlin Entertainments plc . . . . . . . . . . . . . . . . . . . . . . . . . . . 52,353 273,115Micro Focus International plc . . . . . . . . . . . . . . . . . . . . . . . . . 33,650 623,831Mondi plc . . . . . . . . . . . . . . . . . . . . . . . . . . . . . . . . . . . . . . 27,093 742,190National Grid plc . . . . . . . . . . . . . . . . . . . . . . . . . . . . . . . . . 249,620 2,575,210Next plc . . . . . . . . . . . . . . . . . . . . . . . . . . . . . . . . . . . . . . . 11,803 844,974Pearson plc . . . . . . . . . . . . . . . . . . . . . . . . . . . . . . . . . . . . 63,486 735,443Persimmon plc . . . . . . . . . . . . . . . . . . . . . . . . . . . . . . . . . . 22,805 702,677Prudential plc . . . . . . . . . . . . . . . . . . . . . . . . . . . . . . . . . . . 186,011 4,267,562Reckitt Benckiser Group plc . . . . . . . . . . . . . . . . . . . . . . . . . . 48,931 4,472,284RELX plc . . . . . . . . . . . . . . . . . . . . . . . . . . . . . . . . . . . . . . 78,454 1,651,558RELX plc (b) . . . . . . . . . . . . . . . . . . . . . . . . . . . . . . . . . . . . 71,198 1,496,392Rio Tinto plc . . . . . . . . . . . . . . . . . . . . . . . . . . . . . . . . . . . . 87,914 4,437,658Rolls-Royce Holdings plc (b) . . . . . . . . . . . . . . . . . . . . . . . . . . 116,835 1,502,688Royal Bank of Scotland Group plc . . . . . . . . . . . . . . . . . . . . . . 355,393 1,149,528Royal Mail plc . . . . . . . . . . . . . . . . . . . . . . . . . . . . . . . . . . . 67,965 422,412RSA Insurance Group plc . . . . . . . . . . . . . . . . . . . . . . . . . . . . 74,322 556,773Sage Group plc (The) . . . . . . . . . . . . . . . . . . . . . . . . . . . . . . 77,930 595,341
Security Description Shares Value
United Kingdom—(Continued)Schroders plc . . . . . . . . . . . . . . . . . . . . . . . . . . . . . . . . . . . 7,697 $ 310,247Segro plc (REIT) . . . . . . . . . . . . . . . . . . . . . . . . . . . . . . . . . 74,212 616,873Severn Trent plc . . . . . . . . . . . . . . . . . . . . . . . . . . . . . . . . . 20,415 491,888Sky plc . . . . . . . . . . . . . . . . . . . . . . . . . . . . . . . . . . . . . . . 75,085 1,692,850Smith & Nephew plc . . . . . . . . . . . . . . . . . . . . . . . . . . . . . . . 62,049 1,131,354Smiths Group plc . . . . . . . . . . . . . . . . . . . . . . . . . . . . . . . . . 31,976 623,553SSE plc . . . . . . . . . . . . . . . . . . . . . . . . . . . . . . . . . . . . . . . 72,948 1,089,585St. James’s Place plc . . . . . . . . . . . . . . . . . . . . . . . . . . . . . . . 38,927 579,907Standard Chartered plc . . . . . . . . . . . . . . . . . . . . . . . . . . . . . 203,987 1,690,177Standard Life Aberdeen plc . . . . . . . . . . . . . . . . . . . . . . . . . . 186,397 742,540Taylor Wimpey plc . . . . . . . . . . . . . . . . . . . . . . . . . . . . . . . . 240,026 536,705Tesco plc . . . . . . . . . . . . . . . . . . . . . . . . . . . . . . . . . . . . . . 690,838 2,159,067Travis Perkins plc . . . . . . . . . . . . . . . . . . . . . . . . . . . . . . . . . 20,832 289,034Unilever NV . . . . . . . . . . . . . . . . . . . . . . . . . . . . . . . . . . . . 112,339 6,257,916Unilever plc . . . . . . . . . . . . . . . . . . . . . . . . . . . . . . . . . . . . 89,367 4,910,572United Utilities Group plc . . . . . . . . . . . . . . . . . . . . . . . . . . . . 57,234 525,085Vodafone Group plc . . . . . . . . . . . . . . . . . . . . . . . . . . . . . . . 1,935,083 4,150,823Weir Group plc (The) . . . . . . . . . . . . . . . . . . . . . . . . . . . . . . 17,104 393,196Whitbread plc . . . . . . . . . . . . . . . . . . . . . . . . . . . . . . . . . . . 14,502 891,527WM Morrison Supermarkets plc . . . . . . . . . . . . . . . . . . . . . . . 166,578 563,211WPP plc . . . . . . . . . . . . . . . . . . . . . . . . . . . . . . . . . . . . . . . 93,040 1,360,780
154,847,841
United States—0.5%Carnival plc . . . . . . . . . . . . . . . . . . . . . . . . . . . . . . . . . . . . 13,029 809,654QIAGEN NV (b) . . . . . . . . . . . . . . . . . . . . . . . . . . . . . . . . . . 15,166 574,238Shire plc . . . . . . . . . . . . . . . . . . . . . . . . . . . . . . . . . . . . . . 65,970 3,982,110
5,366,002
Total Common Stocks(Cost $866,087,859) . . . . . . . . . . . . . . . . . . . . . . . . . . . . 1,044,807,600
Mutual Fund—3.3%
United States—3.3%iShares MSCI EAFE ETF (e) (f)
(Cost $36,373,053) . . . . . . . . . . . . . . . . . . . . . . . . . . . . . 534,000 36,306,660
Preferred Stocks—0.5%
Germany—0.5%Bayerische Motoren Werke (BMW) AG . . . . . . . . . . . . . . . . . . . 3,581 281,181FUCHS Petrolub SE . . . . . . . . . . . . . . . . . . . . . . . . . . . . . . . . 4,900 273,785Henkel AG & Co. KGaA . . . . . . . . . . . . . . . . . . . . . . . . . . . . . 12,893 1,514,102Porsche Automobil Holding SE . . . . . . . . . . . . . . . . . . . . . . . . 11,105 747,987Sartorius AG . . . . . . . . . . . . . . . . . . . . . . . . . . . . . . . . . . . . 2,589 420,358Schaeffler AG . . . . . . . . . . . . . . . . . . . . . . . . . . . . . . . . . . . 13,141 167,601Volkswagen AG . . . . . . . . . . . . . . . . . . . . . . . . . . . . . . . . . . 13,371 2,348,124
Total Preferred Stocks(Cost $4,461,535) . . . . . . . . . . . . . . . . . . . . . . . . . . . . . 5,753,138
BHFTII-206

Brighthouse Funds Trust II
MetLife MSCI EAFE Index Portfolio
Schedule of Investments as of September 30, 2018 (Unaudited)
Short-Term Investments—1.3%
Security DescriptionPrincipalAmount* Value
Discount Notes—0.6%Federal Home Loan Bank
1.804%, 10/12/18 (g) . . . . . . . . . . . . . . . . . . . . . . . . . . 125,000 $ 124,9191.936%, 10/24/18 (g) . . . . . . . . . . . . . . . . . . . . . . . . . . 500,000 499,3262.021%, 11/09/18 (g) . . . . . . . . . . . . . . . . . . . . . . . . . . 2,350,000 2,344,5272.042%, 11/14/18 (g) . . . . . . . . . . . . . . . . . . . . . . . . . . 925,000 922,5692.053%, 11/07/18 (g) . . . . . . . . . . . . . . . . . . . . . . . . . . 2,600,000 2,594,2542.159%, 12/12/18 (g) . . . . . . . . . . . . . . . . . . . . . . . . . . 400,000 398,256
6,883,851
U.S. Treasury—0.7%U.S. Treasury Bills
2.060%, 11/15/18 (g) . . . . . . . . . . . . . . . . . . . . . . . . . . 1,675,000 1,670,6372.102%, 12/06/18 (g) . . . . . . . . . . . . . . . . . . . . . . . . . . 1,925,000 1,917,4922.106%, 12/13/18 (g) . . . . . . . . . . . . . . . . . . . . . . . . . . 2,600,000 2,588,8102.133%, 12/20/18 (g) . . . . . . . . . . . . . . . . . . . . . . . . . . 1,400,000 1,393,381
7,570,320
Total Short-Term Investments(Cost $14,455,123) . . . . . . . . . . . . . . . . . . . . . . . . . . . . . 14,454,171
Securities Lending Reinvestments (h)—1.2%
Bank Note—0.2%Bank of America N.A.
2.398%, 1M LIBOR + 0.250%, 11/13/18 (i) . . . . . . . . . . . . 2,000,000 2,000,000
Certificate of Deposit—0.1%Landesbank Baden-Wuettertemberg
2.180%, 10/02/18 . . . . . . . . . . . . . . . . . . . . . . . . . . . . . 500,000 500,001
Commercial Paper—0.2%Bank of China, Ltd.
2.550%, 12/20/18 . . . . . . . . . . . . . . . . . . . . . . . . . . . . . 993,625 994,247ING Funding LLC
2.453%, 1M LIBOR + 0.320%, 02/08/19 (i) . . . . . . . . . . . . 1,500,000 1,500,766
2,495,013
Repurchase Agreements—0.6%Citigroup Global Markets, Ltd.
Repurchase Agreement dated 09/28/18 at 2.240%, due on10/01/18 with a maturity value of $300,056; collateralizedby U.S. Treasury and Foreign Obligations with rates rangingfrom 0.625% - 2.875%, maturity dates ranging from01/15/19 - 02/15/43, and an aggregate market value of$306,000. . . . . . . . . . . . . . . . . . . . . . . . . . . . . . . . . . . . 300,000 300,000Repurchase Agreement dated 09/28/18 at 2.240%, due on10/01/18 with a maturity value of $200,037; collateralizedby U.S. Treasury and Foreign Obligations with rates rangingfrom 1.750% - 2.875%, maturity dates ranging from10/15/20 - 05/15/27, and an aggregate market value of$204,000. . . . . . . . . . . . . . . . . . . . . . . . . . . . . . . . . . . . 200,000 200,000
Security DescriptionPrincipalAmount* Value
Repurchase Agreements—(Continued)Citigroup Global Markets, Ltd.
Repurchase Agreement dated 09/28/18 at 2.240%, due on10/01/18 with a maturity value of $300,056; collateralizedby U.S. Treasury and Foreign Obligations with rates rangingfrom 0.375% - 3.125%, maturity dates ranging from12/17/18 - 02/15/43, and an aggregate market value of$306,000. . . . . . . . . . . . . . . . . . . . . . . . . . . . . . . . . . . . 300,000 $ 300,000
Deutsche Bank AG, LondonRepurchase Agreement dated 01/09/18 at 2.560%, due on10/01/18 with a maturity value of $203,769; collateralizedby various Common Stock with an aggregate market value of$222,665. . . . . . . . . . . . . . . . . . . . . . . . . . . . . . . . . . . . 200,000 200,000
ING Bank NV, LondonRepurchase Agreement dated 08/03/18 at 2.420%, due on10/01/18 with a maturity value of $200,793; collateralizedby various Common Stock with an aggregate market value of$222,249. . . . . . . . . . . . . . . . . . . . . . . . . . . . . . . . . . . . 200,000 200,000
Macquarie Bank, Ltd., LondonRepurchase Agreement dated 09/28/18 at 2.200%, due on10/01/18 with a maturity value of $1,843,563; collateralizedby U.S. Treasury Obligations with rates ranging from 0.125% -5.500%, maturity dates ranging from 08/31/19 - 05/15/48,and an aggregate market value of $1,878,656. . . . . . . . . . . 1,843,225 1,843,225
Morgan Stanley & Co. LLCRepurchase Agreement dated 09/25/18 at 2.470%, due on10/02/18 with a maturity value of $2,000,961; collateralizedby various Common Stock with an aggregate market value of$2,200,429. . . . . . . . . . . . . . . . . . . . . . . . . . . . . . . . . . 2,000,000 2,000,000
NBC Global Finance, Ltd.Repurchase Agreement dated 11/30/17 at 2.340%, due on10/01/18 with a maturity value of $407,930; collateralizedby various Common Stock with an aggregate market value of$445,062. . . . . . . . . . . . . . . . . . . . . . . . . . . . . . . . . . . . 400,000 400,000Repurchase Agreement dated 03/16/18 at 2.340%, due on10/01/18 with a maturity value of $303,881; collateralizedby various Common Stock with an aggregate market value of$333,797. . . . . . . . . . . . . . . . . . . . . . . . . . . . . . . . . . . . 300,000 300,000
Societe GeneraleRepurchase Agreement dated 03/08/18 at 2.310%, due on10/01/18 with a maturity value of $303,985; collateralizedby U.S. Treasury Obligations with rates ranging from 0.000% -4.250%, maturity dates ranging from 02/07/19 - 02/15/47,and various Common Stock with an aggregate market value of$333,195. . . . . . . . . . . . . . . . . . . . . . . . . . . . . . . . . . . . 300,000 300,000Repurchase Agreement dated 03/16/18 at 2.310%, due on10/01/18 with a maturity value of $303,831; collateralizedby U.S. Treasury Obligations with rates ranging from 0.000% -4.250%, maturity dates ranging from 02/07/19 - 02/15/47,and various Common Stock with an aggregate market value of$333,195. . . . . . . . . . . . . . . . . . . . . . . . . . . . . . . . . . . . 300,000 300,000Repurchase Agreement dated 03/21/18 at 2.310%, due on10/01/18 with a maturity value of $303,735; collateralizedby U.S. Treasury Obligations with rates ranging from 0.000% -4.250%, maturity dates ranging from 02/07/19 - 02/15/47,and various Common Stock with an aggregate market value of$333,195. . . . . . . . . . . . . . . . . . . . . . . . . . . . . . . . . . . . 300,000 300,000
BHFTII-207
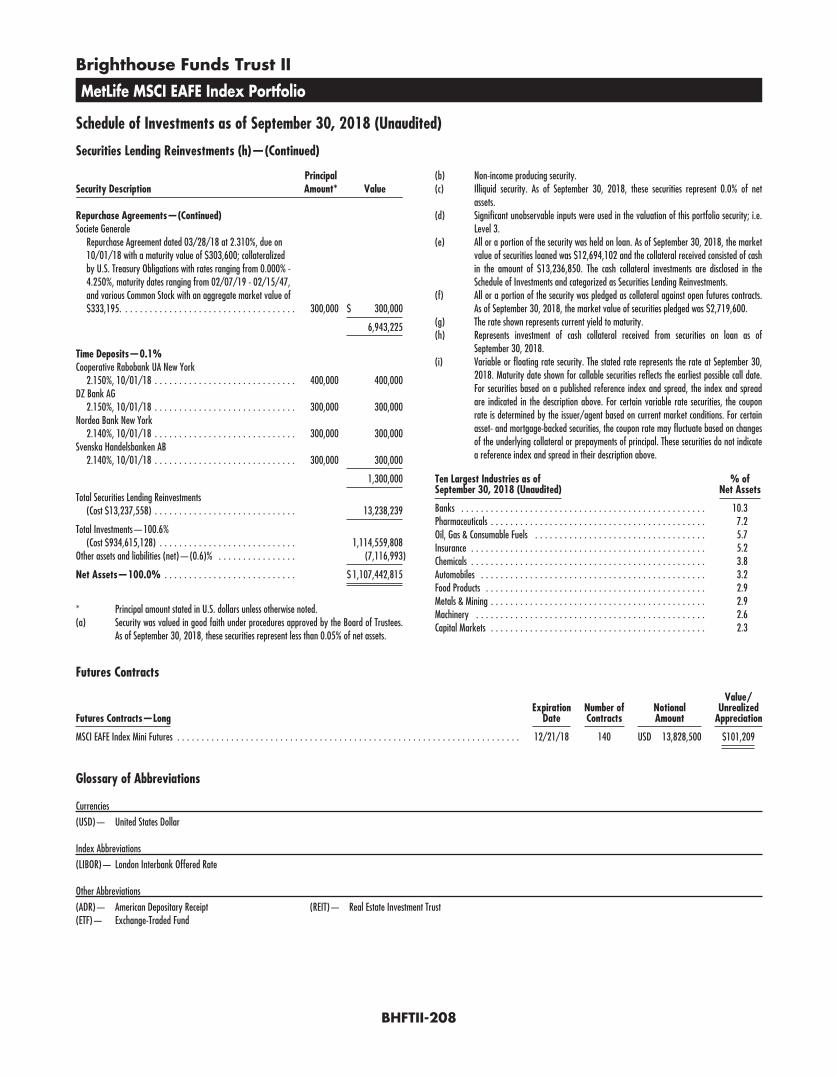
Brighthouse Funds Trust II
MetLife MSCI EAFE Index Portfolio
Schedule of Investments as of September 30, 2018 (Unaudited)
Securities Lending Reinvestments (h)—(Continued)
Security DescriptionPrincipalAmount* Value
Repurchase Agreements—(Continued)Societe Generale
Repurchase Agreement dated 03/28/18 at 2.310%, due on10/01/18 with a maturity value of $303,600; collateralizedby U.S. Treasury Obligations with rates ranging from 0.000% -4.250%, maturity dates ranging from 02/07/19 - 02/15/47,and various Common Stock with an aggregate market value of$333,195. . . . . . . . . . . . . . . . . . . . . . . . . . . . . . . . . . . . 300,000 $ 300,000
6,943,225
Time Deposits—0.1%Cooperative Rabobank UA New York
2.150%, 10/01/18 . . . . . . . . . . . . . . . . . . . . . . . . . . . . . 400,000 400,000DZ Bank AG
2.150%, 10/01/18 . . . . . . . . . . . . . . . . . . . . . . . . . . . . . 300,000 300,000Nordea Bank New York
2.140%, 10/01/18 . . . . . . . . . . . . . . . . . . . . . . . . . . . . . 300,000 300,000Svenska Handelsbanken AB
2.140%, 10/01/18 . . . . . . . . . . . . . . . . . . . . . . . . . . . . . 300,000 300,000
1,300,000
Total Securities Lending Reinvestments(Cost $13,237,558) . . . . . . . . . . . . . . . . . . . . . . . . . . . . . 13,238,239
Total Investments—100.6%(Cost $934,615,128) . . . . . . . . . . . . . . . . . . . . . . . . . . . . 1,114,559,808
Other assets and liabilities (net)—(0.6)% . . . . . . . . . . . . . . . . (7,116,993)
Net Assets—100.0% . . . . . . . . . . . . . . . . . . . . . . . . . . . $ 1,107,442,815
* Principal amount stated in U.S. dollars unless otherwise noted.(a) Security was valued in good faith under procedures approved by the Board of Trustees.
As of September 30, 2018, these securities represent less than 0.05% of net assets.
(b) Non-income producing security.(c) Illiquid security. As of September 30, 2018, these securities represent 0.0% of net
assets.(d) Significant unobservable inputs were used in the valuation of this portfolio security; i.e.
Level 3.(e) All or a portion of the security was held on loan. As of September 30, 2018, the market
value of securities loaned was $12,694,102 and the collateral received consisted of cashin the amount of $13,236,850. The cash collateral investments are disclosed in theSchedule of Investments and categorized as Securities Lending Reinvestments.
(f) All or a portion of the security was pledged as collateral against open futures contracts.As of September 30, 2018, the market value of securities pledged was $2,719,600.
(g) The rate shown represents current yield to maturity.(h) Represents investment of cash collateral received from securities on loan as of
September 30, 2018.(i) Variable or floating rate security. The stated rate represents the rate at September 30,
2018. Maturity date shown for callable securities reflects the earliest possible call date.For securities based on a published reference index and spread, the index and spreadare indicated in the description above. For certain variable rate securities, the couponrate is determined by the issuer/agent based on current market conditions. For certainasset- and mortgage-backed securities, the coupon rate may fluctuate based on changesof the underlying collateral or prepayments of principal. These securities do not indicatea reference index and spread in their description above.
Ten Largest Industries as ofSeptember 30, 2018 (Unaudited)
% ofNet Assets
Banks . . . . . . . . . . . . . . . . . . . . . . . . . . . . . . . . . . . . . . . . . . . . . . . . . . 10.3Pharmaceuticals . . . . . . . . . . . . . . . . . . . . . . . . . . . . . . . . . . . . . . . . . . . . 7.2Oil, Gas & Consumable Fuels . . . . . . . . . . . . . . . . . . . . . . . . . . . . . . . . . . . 5.7Insurance . . . . . . . . . . . . . . . . . . . . . . . . . . . . . . . . . . . . . . . . . . . . . . . . 5.2Chemicals . . . . . . . . . . . . . . . . . . . . . . . . . . . . . . . . . . . . . . . . . . . . . . . . 3.8Automobiles . . . . . . . . . . . . . . . . . . . . . . . . . . . . . . . . . . . . . . . . . . . . . . 3.2Food Products . . . . . . . . . . . . . . . . . . . . . . . . . . . . . . . . . . . . . . . . . . . . . 2.9Metals & Mining . . . . . . . . . . . . . . . . . . . . . . . . . . . . . . . . . . . . . . . . . . . . 2.9Machinery . . . . . . . . . . . . . . . . . . . . . . . . . . . . . . . . . . . . . . . . . . . . . . . 2.6Capital Markets . . . . . . . . . . . . . . . . . . . . . . . . . . . . . . . . . . . . . . . . . . . . 2.3
Futures Contracts
Futures Contracts—LongExpiration
DateNumber ofContracts
NotionalAmount
Value/Unrealized
Appreciation
MSCI EAFE Index Mini Futures . . . . . . . . . . . . . . . . . . . . . . . . . . . . . . . . . . . . . . . . . . . . . . . . . . . . . . . . . . . . . . . . . . . . . . 12/21/18 140 USD 13,828,500 $101,209
Glossary of Abbreviations
Currencies
(USD)— United States Dollar
Index Abbreviations
(LIBOR)— London Interbank Offered Rate
Other Abbreviations
(ADR)— American Depositary Receipt(ETF)— Exchange-Traded Fund
(REIT)— Real Estate Investment Trust
BHFTII-208
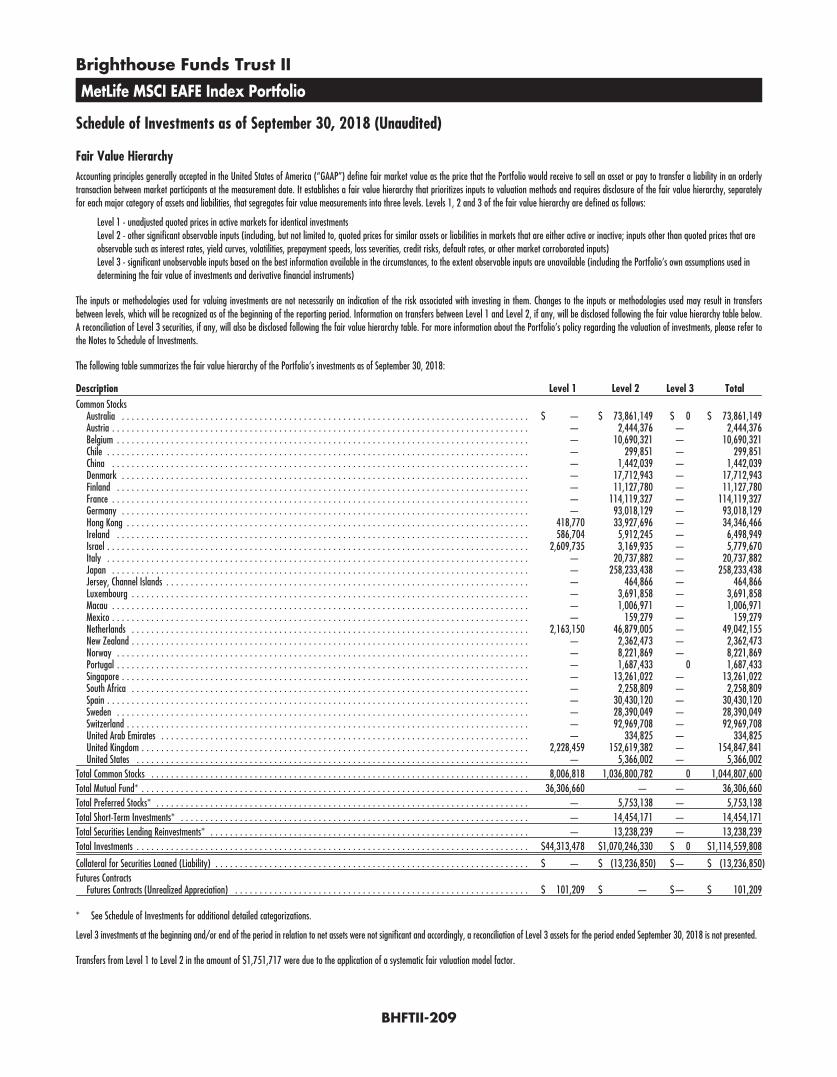
Brighthouse Funds Trust II
MetLife MSCI EAFE Index Portfolio
Schedule of Investments as of September 30, 2018 (Unaudited)
Fair Value HierarchyAccounting principles generally accepted in the United States of America (“GAAP”) define fair market value as the price that the Portfolio would receive to sell an asset or pay to transfer a liability in an orderlytransaction between market participants at the measurement date. It establishes a fair value hierarchy that prioritizes inputs to valuation methods and requires disclosure of the fair value hierarchy, separatelyfor each major category of assets and liabilities, that segregates fair value measurements into three levels. Levels 1, 2 and 3 of the fair value hierarchy are defined as follows:
Level 1 - unadjusted quoted prices in active markets for identical investmentsLevel 2 - other significant observable inputs (including, but not limited to, quoted prices for similar assets or liabilities in markets that are either active or inactive; inputs other than quoted prices that areobservable such as interest rates, yield curves, volatilities, prepayment speeds, loss severities, credit risks, default rates, or other market corroborated inputs)Level 3 - significant unobservable inputs based on the best information available in the circumstances, to the extent observable inputs are unavailable (including the Portfolio’s own assumptions used indetermining the fair value of investments and derivative financial instruments)
The inputs or methodologies used for valuing investments are not necessarily an indication of the risk associated with investing in them. Changes to the inputs or methodologies used may result in transfersbetween levels, which will be recognized as of the beginning of the reporting period. Information on transfers between Level 1 and Level 2, if any, will be disclosed following the fair value hierarchy table below.A reconciliation of Level 3 securities, if any, will also be disclosed following the fair value hierarchy table. For more information about the Portfolio’s policy regarding the valuation of investments, please refer tothe Notes to Schedule of Investments.
The following table summarizes the fair value hierarchy of the Portfolio’s investments as of September 30, 2018:
Description Level 1 Level 2 Level 3 TotalCommon Stocks
Australia . . . . . . . . . . . . . . . . . . . . . . . . . . . . . . . . . . . . . . . . . . . . . . . . . . . . . . . . . . . . . . . . . . . . . . . . . . . . . . . . . . . $ — $ 73,861,149 $ 0 $ 73,861,149Austria . . . . . . . . . . . . . . . . . . . . . . . . . . . . . . . . . . . . . . . . . . . . . . . . . . . . . . . . . . . . . . . . . . . . . . . . . . . . . . . . . . . . . — 2,444,376 — 2,444,376Belgium . . . . . . . . . . . . . . . . . . . . . . . . . . . . . . . . . . . . . . . . . . . . . . . . . . . . . . . . . . . . . . . . . . . . . . . . . . . . . . . . . . . . — 10,690,321 — 10,690,321Chile . . . . . . . . . . . . . . . . . . . . . . . . . . . . . . . . . . . . . . . . . . . . . . . . . . . . . . . . . . . . . . . . . . . . . . . . . . . . . . . . . . . . . . — 299,851 — 299,851China . . . . . . . . . . . . . . . . . . . . . . . . . . . . . . . . . . . . . . . . . . . . . . . . . . . . . . . . . . . . . . . . . . . . . . . . . . . . . . . . . . . . . — 1,442,039 — 1,442,039Denmark . . . . . . . . . . . . . . . . . . . . . . . . . . . . . . . . . . . . . . . . . . . . . . . . . . . . . . . . . . . . . . . . . . . . . . . . . . . . . . . . . . . — 17,712,943 — 17,712,943Finland . . . . . . . . . . . . . . . . . . . . . . . . . . . . . . . . . . . . . . . . . . . . . . . . . . . . . . . . . . . . . . . . . . . . . . . . . . . . . . . . . . . . — 11,127,780 — 11,127,780France . . . . . . . . . . . . . . . . . . . . . . . . . . . . . . . . . . . . . . . . . . . . . . . . . . . . . . . . . . . . . . . . . . . . . . . . . . . . . . . . . . . . . — 114,119,327 — 114,119,327Germany . . . . . . . . . . . . . . . . . . . . . . . . . . . . . . . . . . . . . . . . . . . . . . . . . . . . . . . . . . . . . . . . . . . . . . . . . . . . . . . . . . . — 93,018,129 — 93,018,129Hong Kong . . . . . . . . . . . . . . . . . . . . . . . . . . . . . . . . . . . . . . . . . . . . . . . . . . . . . . . . . . . . . . . . . . . . . . . . . . . . . . . . . . 418,770 33,927,696 — 34,346,466Ireland . . . . . . . . . . . . . . . . . . . . . . . . . . . . . . . . . . . . . . . . . . . . . . . . . . . . . . . . . . . . . . . . . . . . . . . . . . . . . . . . . . . . 586,704 5,912,245 — 6,498,949Israel . . . . . . . . . . . . . . . . . . . . . . . . . . . . . . . . . . . . . . . . . . . . . . . . . . . . . . . . . . . . . . . . . . . . . . . . . . . . . . . . . . . . . . 2,609,735 3,169,935 — 5,779,670Italy . . . . . . . . . . . . . . . . . . . . . . . . . . . . . . . . . . . . . . . . . . . . . . . . . . . . . . . . . . . . . . . . . . . . . . . . . . . . . . . . . . . . . . — 20,737,882 — 20,737,882Japan . . . . . . . . . . . . . . . . . . . . . . . . . . . . . . . . . . . . . . . . . . . . . . . . . . . . . . . . . . . . . . . . . . . . . . . . . . . . . . . . . . . . . — 258,233,438 — 258,233,438Jersey, Channel Islands . . . . . . . . . . . . . . . . . . . . . . . . . . . . . . . . . . . . . . . . . . . . . . . . . . . . . . . . . . . . . . . . . . . . . . . . . . — 464,866 — 464,866Luxembourg . . . . . . . . . . . . . . . . . . . . . . . . . . . . . . . . . . . . . . . . . . . . . . . . . . . . . . . . . . . . . . . . . . . . . . . . . . . . . . . . . — 3,691,858 — 3,691,858Macau . . . . . . . . . . . . . . . . . . . . . . . . . . . . . . . . . . . . . . . . . . . . . . . . . . . . . . . . . . . . . . . . . . . . . . . . . . . . . . . . . . . . . — 1,006,971 — 1,006,971Mexico . . . . . . . . . . . . . . . . . . . . . . . . . . . . . . . . . . . . . . . . . . . . . . . . . . . . . . . . . . . . . . . . . . . . . . . . . . . . . . . . . . . . . — 159,279 — 159,279Netherlands . . . . . . . . . . . . . . . . . . . . . . . . . . . . . . . . . . . . . . . . . . . . . . . . . . . . . . . . . . . . . . . . . . . . . . . . . . . . . . . . . 2,163,150 46,879,005 — 49,042,155New Zealand . . . . . . . . . . . . . . . . . . . . . . . . . . . . . . . . . . . . . . . . . . . . . . . . . . . . . . . . . . . . . . . . . . . . . . . . . . . . . . . . . — 2,362,473 — 2,362,473Norway . . . . . . . . . . . . . . . . . . . . . . . . . . . . . . . . . . . . . . . . . . . . . . . . . . . . . . . . . . . . . . . . . . . . . . . . . . . . . . . . . . . . — 8,221,869 — 8,221,869Portugal . . . . . . . . . . . . . . . . . . . . . . . . . . . . . . . . . . . . . . . . . . . . . . . . . . . . . . . . . . . . . . . . . . . . . . . . . . . . . . . . . . . . — 1,687,433 0 1,687,433Singapore . . . . . . . . . . . . . . . . . . . . . . . . . . . . . . . . . . . . . . . . . . . . . . . . . . . . . . . . . . . . . . . . . . . . . . . . . . . . . . . . . . . — 13,261,022 — 13,261,022South Africa . . . . . . . . . . . . . . . . . . . . . . . . . . . . . . . . . . . . . . . . . . . . . . . . . . . . . . . . . . . . . . . . . . . . . . . . . . . . . . . . . — 2,258,809 — 2,258,809Spain . . . . . . . . . . . . . . . . . . . . . . . . . . . . . . . . . . . . . . . . . . . . . . . . . . . . . . . . . . . . . . . . . . . . . . . . . . . . . . . . . . . . . . — 30,430,120 — 30,430,120Sweden . . . . . . . . . . . . . . . . . . . . . . . . . . . . . . . . . . . . . . . . . . . . . . . . . . . . . . . . . . . . . . . . . . . . . . . . . . . . . . . . . . . . — 28,390,049 — 28,390,049Switzerland . . . . . . . . . . . . . . . . . . . . . . . . . . . . . . . . . . . . . . . . . . . . . . . . . . . . . . . . . . . . . . . . . . . . . . . . . . . . . . . . . . — 92,969,708 — 92,969,708United Arab Emirates . . . . . . . . . . . . . . . . . . . . . . . . . . . . . . . . . . . . . . . . . . . . . . . . . . . . . . . . . . . . . . . . . . . . . . . . . . . — 334,825 — 334,825United Kingdom . . . . . . . . . . . . . . . . . . . . . . . . . . . . . . . . . . . . . . . . . . . . . . . . . . . . . . . . . . . . . . . . . . . . . . . . . . . . . . . 2,228,459 152,619,382 — 154,847,841United States . . . . . . . . . . . . . . . . . . . . . . . . . . . . . . . . . . . . . . . . . . . . . . . . . . . . . . . . . . . . . . . . . . . . . . . . . . . . . . . . — 5,366,002 — 5,366,002
Total Common Stocks . . . . . . . . . . . . . . . . . . . . . . . . . . . . . . . . . . . . . . . . . . . . . . . . . . . . . . . . . . . . . . . . . . . . . . . . . . . . . 8,006,818 1,036,800,782 0 1,044,807,600Total Mutual Fund* . . . . . . . . . . . . . . . . . . . . . . . . . . . . . . . . . . . . . . . . . . . . . . . . . . . . . . . . . . . . . . . . . . . . . . . . . . . . . . . 36,306,660 — — 36,306,660Total Preferred Stocks* . . . . . . . . . . . . . . . . . . . . . . . . . . . . . . . . . . . . . . . . . . . . . . . . . . . . . . . . . . . . . . . . . . . . . . . . . . . . — 5,753,138 — 5,753,138Total Short-Term Investments* . . . . . . . . . . . . . . . . . . . . . . . . . . . . . . . . . . . . . . . . . . . . . . . . . . . . . . . . . . . . . . . . . . . . . . . — 14,454,171 — 14,454,171Total Securities Lending Reinvestments* . . . . . . . . . . . . . . . . . . . . . . . . . . . . . . . . . . . . . . . . . . . . . . . . . . . . . . . . . . . . . . . . . — 13,238,239 — 13,238,239Total Investments . . . . . . . . . . . . . . . . . . . . . . . . . . . . . . . . . . . . . . . . . . . . . . . . . . . . . . . . . . . . . . . . . . . . . . . . . . . . . . . . $44,313,478 $1,070,246,330 $ 0 $1,114,559,808
Collateral for Securities Loaned (Liability) . . . . . . . . . . . . . . . . . . . . . . . . . . . . . . . . . . . . . . . . . . . . . . . . . . . . . . . . . . . . . . . . $ — $ (13,236,850) $— $ (13,236,850)Futures Contracts
Futures Contracts (Unrealized Appreciation) . . . . . . . . . . . . . . . . . . . . . . . . . . . . . . . . . . . . . . . . . . . . . . . . . . . . . . . . . . . . $ 101,209 $ — $— $ 101,209
* See Schedule of Investments for additional detailed categorizations.
Level 3 investments at the beginning and/or end of the period in relation to net assets were not significant and accordingly, a reconciliation of Level 3 assets for the period ended September 30, 2018 is not presented.
Transfers from Level 1 to Level 2 in the amount of $1,751,717 were due to the application of a systematic fair valuation model factor.
BHFTII-209
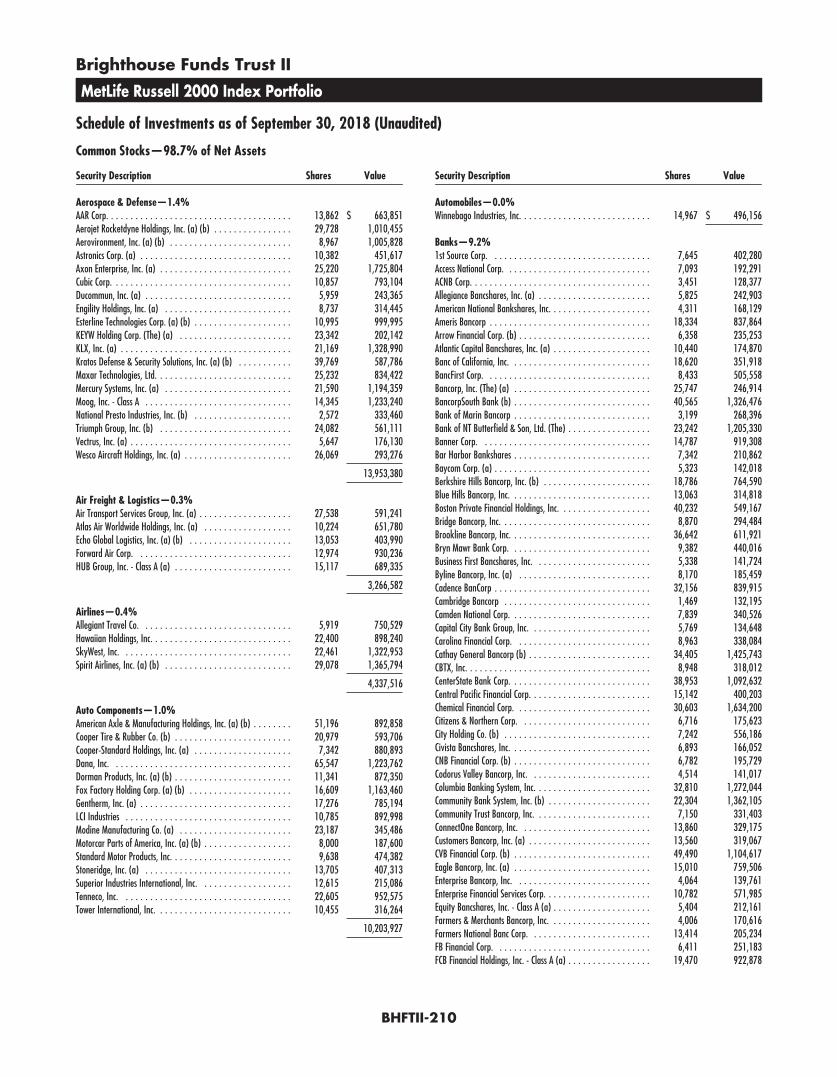
Brighthouse Funds Trust II
MetLife Russell 2000 Index Portfolio
Schedule of Investments as of September 30, 2018 (Unaudited)
Common Stocks—98.7% of Net Assets
Security Description Shares Value
Aerospace & Defense—1.4%AAR Corp. . . . . . . . . . . . . . . . . . . . . . . . . . . . . . . . . . . . . . 13,862 $ 663,851Aerojet Rocketdyne Holdings, Inc. (a) (b) . . . . . . . . . . . . . . . . 29,728 1,010,455Aerovironment, Inc. (a) (b) . . . . . . . . . . . . . . . . . . . . . . . . . 8,967 1,005,828Astronics Corp. (a) . . . . . . . . . . . . . . . . . . . . . . . . . . . . . . . 10,382 451,617Axon Enterprise, Inc. (a) . . . . . . . . . . . . . . . . . . . . . . . . . . . 25,220 1,725,804Cubic Corp. . . . . . . . . . . . . . . . . . . . . . . . . . . . . . . . . . . . . 10,857 793,104Ducommun, Inc. (a) . . . . . . . . . . . . . . . . . . . . . . . . . . . . . . 5,959 243,365Engility Holdings, Inc. (a) . . . . . . . . . . . . . . . . . . . . . . . . . . 8,737 314,445Esterline Technologies Corp. (a) (b) . . . . . . . . . . . . . . . . . . . . 10,995 999,995KEYW Holding Corp. (The) (a) . . . . . . . . . . . . . . . . . . . . . . . 23,342 202,142KLX, Inc. (a) . . . . . . . . . . . . . . . . . . . . . . . . . . . . . . . . . . . 21,169 1,328,990Kratos Defense & Security Solutions, Inc. (a) (b) . . . . . . . . . . . 39,769 587,786Maxar Technologies, Ltd. . . . . . . . . . . . . . . . . . . . . . . . . . . . 25,232 834,422Mercury Systems, Inc. (a) . . . . . . . . . . . . . . . . . . . . . . . . . . 21,590 1,194,359Moog, Inc. - Class A . . . . . . . . . . . . . . . . . . . . . . . . . . . . . . 14,345 1,233,240National Presto Industries, Inc. (b) . . . . . . . . . . . . . . . . . . . . 2,572 333,460Triumph Group, Inc. (b) . . . . . . . . . . . . . . . . . . . . . . . . . . . 24,082 561,111Vectrus, Inc. (a) . . . . . . . . . . . . . . . . . . . . . . . . . . . . . . . . . 5,647 176,130Wesco Aircraft Holdings, Inc. (a) . . . . . . . . . . . . . . . . . . . . . . 26,069 293,276
13,953,380
Air Freight & Logistics—0.3%Air Transport Services Group, Inc. (a) . . . . . . . . . . . . . . . . . . . 27,538 591,241Atlas Air Worldwide Holdings, Inc. (a) . . . . . . . . . . . . . . . . . . 10,224 651,780Echo Global Logistics, Inc. (a) (b) . . . . . . . . . . . . . . . . . . . . . 13,053 403,990Forward Air Corp. . . . . . . . . . . . . . . . . . . . . . . . . . . . . . . . 12,974 930,236HUB Group, Inc. - Class A (a) . . . . . . . . . . . . . . . . . . . . . . . . 15,117 689,335
3,266,582
Airlines—0.4%Allegiant Travel Co. . . . . . . . . . . . . . . . . . . . . . . . . . . . . . . 5,919 750,529Hawaiian Holdings, Inc. . . . . . . . . . . . . . . . . . . . . . . . . . . . . 22,400 898,240SkyWest, Inc. . . . . . . . . . . . . . . . . . . . . . . . . . . . . . . . . . . 22,461 1,322,953Spirit Airlines, Inc. (a) (b) . . . . . . . . . . . . . . . . . . . . . . . . . . 29,078 1,365,794
4,337,516
Auto Components—1.0%American Axle & Manufacturing Holdings, Inc. (a) (b) . . . . . . . . 51,196 892,858Cooper Tire & Rubber Co. (b) . . . . . . . . . . . . . . . . . . . . . . . . 20,979 593,706Cooper-Standard Holdings, Inc. (a) . . . . . . . . . . . . . . . . . . . . 7,342 880,893Dana, Inc. . . . . . . . . . . . . . . . . . . . . . . . . . . . . . . . . . . . . 65,547 1,223,762Dorman Products, Inc. (a) (b) . . . . . . . . . . . . . . . . . . . . . . . . 11,341 872,350Fox Factory Holding Corp. (a) (b) . . . . . . . . . . . . . . . . . . . . . 16,609 1,163,460Gentherm, Inc. (a) . . . . . . . . . . . . . . . . . . . . . . . . . . . . . . . 17,276 785,194LCI Industries . . . . . . . . . . . . . . . . . . . . . . . . . . . . . . . . . . 10,785 892,998Modine Manufacturing Co. (a) . . . . . . . . . . . . . . . . . . . . . . . 23,187 345,486Motorcar Parts of America, Inc. (a) (b) . . . . . . . . . . . . . . . . . . 8,000 187,600Standard Motor Products, Inc. . . . . . . . . . . . . . . . . . . . . . . . . 9,638 474,382Stoneridge, Inc. (a) . . . . . . . . . . . . . . . . . . . . . . . . . . . . . . 13,705 407,313Superior Industries International, Inc. . . . . . . . . . . . . . . . . . . 12,615 215,086Tenneco, Inc. . . . . . . . . . . . . . . . . . . . . . . . . . . . . . . . . . . 22,605 952,575Tower International, Inc. . . . . . . . . . . . . . . . . . . . . . . . . . . . 10,455 316,264
10,203,927
Security Description Shares Value
Automobiles—0.0%Winnebago Industries, Inc. . . . . . . . . . . . . . . . . . . . . . . . . . . 14,967 $ 496,156
Banks—9.2%1st Source Corp. . . . . . . . . . . . . . . . . . . . . . . . . . . . . . . . . 7,645 402,280Access National Corp. . . . . . . . . . . . . . . . . . . . . . . . . . . . . . 7,093 192,291ACNB Corp. . . . . . . . . . . . . . . . . . . . . . . . . . . . . . . . . . . . . 3,451 128,377Allegiance Bancshares, Inc. (a) . . . . . . . . . . . . . . . . . . . . . . . 5,825 242,903American National Bankshares, Inc. . . . . . . . . . . . . . . . . . . . . 4,311 168,129Ameris Bancorp . . . . . . . . . . . . . . . . . . . . . . . . . . . . . . . . . 18,334 837,864Arrow Financial Corp. (b) . . . . . . . . . . . . . . . . . . . . . . . . . . . 6,358 235,253Atlantic Capital Bancshares, Inc. (a) . . . . . . . . . . . . . . . . . . . . 10,440 174,870Banc of California, Inc. . . . . . . . . . . . . . . . . . . . . . . . . . . . . 18,620 351,918BancFirst Corp. . . . . . . . . . . . . . . . . . . . . . . . . . . . . . . . . . 8,433 505,558Bancorp, Inc. (The) (a) . . . . . . . . . . . . . . . . . . . . . . . . . . . . 25,747 246,914BancorpSouth Bank (b) . . . . . . . . . . . . . . . . . . . . . . . . . . . . 40,565 1,326,476Bank of Marin Bancorp . . . . . . . . . . . . . . . . . . . . . . . . . . . . 3,199 268,396Bank of NT Butterfield & Son, Ltd. (The) . . . . . . . . . . . . . . . . . 23,242 1,205,330Banner Corp. . . . . . . . . . . . . . . . . . . . . . . . . . . . . . . . . . . 14,787 919,308Bar Harbor Bankshares . . . . . . . . . . . . . . . . . . . . . . . . . . . . 7,342 210,862Baycom Corp. (a) . . . . . . . . . . . . . . . . . . . . . . . . . . . . . . . . 5,323 142,018Berkshire Hills Bancorp, Inc. (b) . . . . . . . . . . . . . . . . . . . . . . 18,786 764,590Blue Hills Bancorp, Inc. . . . . . . . . . . . . . . . . . . . . . . . . . . . . 13,063 314,818Boston Private Financial Holdings, Inc. . . . . . . . . . . . . . . . . . . 40,232 549,167Bridge Bancorp, Inc. . . . . . . . . . . . . . . . . . . . . . . . . . . . . . . 8,870 294,484Brookline Bancorp, Inc. . . . . . . . . . . . . . . . . . . . . . . . . . . . . 36,642 611,921Bryn Mawr Bank Corp. . . . . . . . . . . . . . . . . . . . . . . . . . . . . 9,382 440,016Business First Bancshares, Inc. . . . . . . . . . . . . . . . . . . . . . . . 5,338 141,724Byline Bancorp, Inc. (a) . . . . . . . . . . . . . . . . . . . . . . . . . . . 8,170 185,459Cadence BanCorp . . . . . . . . . . . . . . . . . . . . . . . . . . . . . . . . 32,156 839,915Cambridge Bancorp . . . . . . . . . . . . . . . . . . . . . . . . . . . . . . 1,469 132,195Camden National Corp. . . . . . . . . . . . . . . . . . . . . . . . . . . . . 7,839 340,526Capital City Bank Group, Inc. . . . . . . . . . . . . . . . . . . . . . . . . 5,769 134,648Carolina Financial Corp. . . . . . . . . . . . . . . . . . . . . . . . . . . . 8,963 338,084Cathay General Bancorp (b) . . . . . . . . . . . . . . . . . . . . . . . . . 34,405 1,425,743CBTX, Inc. . . . . . . . . . . . . . . . . . . . . . . . . . . . . . . . . . . . . . 8,948 318,012CenterState Bank Corp. . . . . . . . . . . . . . . . . . . . . . . . . . . . . 38,953 1,092,632Central Pacific Financial Corp. . . . . . . . . . . . . . . . . . . . . . . . . 15,142 400,203Chemical Financial Corp. . . . . . . . . . . . . . . . . . . . . . . . . . . . 30,603 1,634,200Citizens & Northern Corp. . . . . . . . . . . . . . . . . . . . . . . . . . . 6,716 175,623City Holding Co. (b) . . . . . . . . . . . . . . . . . . . . . . . . . . . . . . 7,242 556,186Civista Bancshares, Inc. . . . . . . . . . . . . . . . . . . . . . . . . . . . . 6,893 166,052CNB Financial Corp. (b) . . . . . . . . . . . . . . . . . . . . . . . . . . . . 6,782 195,729Codorus Valley Bancorp, Inc. . . . . . . . . . . . . . . . . . . . . . . . . 4,514 141,017Columbia Banking System, Inc. . . . . . . . . . . . . . . . . . . . . . . . 32,810 1,272,044Community Bank System, Inc. (b) . . . . . . . . . . . . . . . . . . . . . 22,304 1,362,105Community Trust Bancorp, Inc. . . . . . . . . . . . . . . . . . . . . . . . 7,150 331,403ConnectOne Bancorp, Inc. . . . . . . . . . . . . . . . . . . . . . . . . . . 13,860 329,175Customers Bancorp, Inc. (a) . . . . . . . . . . . . . . . . . . . . . . . . . 13,560 319,067CVB Financial Corp. (b) . . . . . . . . . . . . . . . . . . . . . . . . . . . . 49,490 1,104,617Eagle Bancorp, Inc. (a) . . . . . . . . . . . . . . . . . . . . . . . . . . . . 15,010 759,506Enterprise Bancorp, Inc. . . . . . . . . . . . . . . . . . . . . . . . . . . . 4,064 139,761Enterprise Financial Services Corp. . . . . . . . . . . . . . . . . . . . . . 10,782 571,985Equity Bancshares, Inc. - Class A (a) . . . . . . . . . . . . . . . . . . . . 5,404 212,161Farmers & Merchants Bancorp, Inc. . . . . . . . . . . . . . . . . . . . . 4,006 170,616Farmers National Banc Corp. . . . . . . . . . . . . . . . . . . . . . . . . 13,414 205,234FB Financial Corp. . . . . . . . . . . . . . . . . . . . . . . . . . . . . . . . 6,411 251,183FCB Financial Holdings, Inc. - Class A (a) . . . . . . . . . . . . . . . . . 19,470 922,878
BHFTII-210

Brighthouse Funds Trust II
MetLife Russell 2000 Index Portfolio
Schedule of Investments as of September 30, 2018 (Unaudited)
Common Stocks—(Continued)
Security Description Shares Value
Banks—(Continued)Fidelity Southern Corp. . . . . . . . . . . . . . . . . . . . . . . . . . . . . 10,827 $ 268,293Financial Institutions, Inc. . . . . . . . . . . . . . . . . . . . . . . . . . . 6,461 202,875First BanCorp (a) . . . . . . . . . . . . . . . . . . . . . . . . . . . . . . . . 86,676 788,752First Bancorp . . . . . . . . . . . . . . . . . . . . . . . . . . . . . . . . . . 12,826 519,581First Bancorp, Inc. . . . . . . . . . . . . . . . . . . . . . . . . . . . . . . . 5,308 153,773First Bancshares, Inc. (The) . . . . . . . . . . . . . . . . . . . . . . . . . 6,100 238,205First Busey Corp. . . . . . . . . . . . . . . . . . . . . . . . . . . . . . . . . 20,300 630,315First Commonwealth Financial Corp. . . . . . . . . . . . . . . . . . . . . 45,936 741,407First Community Bancshares, Inc. . . . . . . . . . . . . . . . . . . . . . 8,470 286,964First Connecticut Bancorp, Inc. . . . . . . . . . . . . . . . . . . . . . . . 7,629 225,437First Financial Bancorp . . . . . . . . . . . . . . . . . . . . . . . . . . . . 41,209 1,223,907First Financial Bankshares, Inc. (b) . . . . . . . . . . . . . . . . . . . . 27,909 1,649,422First Financial Corp. . . . . . . . . . . . . . . . . . . . . . . . . . . . . . . 5,203 261,191First Foundation, Inc. (a) . . . . . . . . . . . . . . . . . . . . . . . . . . . 17,720 276,786First Internet Bancorp . . . . . . . . . . . . . . . . . . . . . . . . . . . . . 4,019 122,379First Interstate BancSystem, Inc. - Class A . . . . . . . . . . . . . . . . 15,279 684,499First Merchants Corp. . . . . . . . . . . . . . . . . . . . . . . . . . . . . . 22,695 1,021,048First Mid-Illinois Bancshares, Inc. . . . . . . . . . . . . . . . . . . . . . . 5,809 234,277First Midwest Bancorp, Inc. . . . . . . . . . . . . . . . . . . . . . . . . . 43,816 1,165,067First of Long Island Corp. (The) . . . . . . . . . . . . . . . . . . . . . . . 9,924 215,847Flushing Financial Corp. . . . . . . . . . . . . . . . . . . . . . . . . . . . 13,422 327,497Franklin Financial Network, Inc. (a) (b) . . . . . . . . . . . . . . . . . 4,922 192,450Fulton Financial Corp. . . . . . . . . . . . . . . . . . . . . . . . . . . . . . 76,291 1,270,245German American Bancorp, Inc. . . . . . . . . . . . . . . . . . . . . . . 10,138 357,669Glacier Bancorp, Inc. (b) . . . . . . . . . . . . . . . . . . . . . . . . . . . 36,365 1,566,968Great Southern Bancorp, Inc. . . . . . . . . . . . . . . . . . . . . . . . . 4,991 276,252Great Western Bancorp, Inc. (b) . . . . . . . . . . . . . . . . . . . . . . 26,273 1,108,458Green Bancorp, Inc. . . . . . . . . . . . . . . . . . . . . . . . . . . . . . . 11,285 249,399Guaranty Bancorp . . . . . . . . . . . . . . . . . . . . . . . . . . . . . . . 11,425 339,323Guaranty Bancshares, Inc. . . . . . . . . . . . . . . . . . . . . . . . . . . 3,924 118,623Hancock Holding Co. . . . . . . . . . . . . . . . . . . . . . . . . . . . . . . 36,710 1,745,560Hanmi Financial Corp. . . . . . . . . . . . . . . . . . . . . . . . . . . . . . 15,681 390,457HarborOne Bancorp, Inc. (a) . . . . . . . . . . . . . . . . . . . . . . . . 7,489 143,190Heartland Financial USA, Inc. (b) . . . . . . . . . . . . . . . . . . . . . 13,588 788,783Heritage Commerce Corp. . . . . . . . . . . . . . . . . . . . . . . . . . . 17,854 266,382Heritage Financial Corp. (b) . . . . . . . . . . . . . . . . . . . . . . . . . 15,777 554,562Hilltop Holdings, Inc. . . . . . . . . . . . . . . . . . . . . . . . . . . . . . 34,409 694,030Home BancShares, Inc. (b) . . . . . . . . . . . . . . . . . . . . . . . . . 68,087 1,491,105HomeTrust Bancshares, Inc. (a) . . . . . . . . . . . . . . . . . . . . . . 8,531 248,679Hope Bancorp, Inc. . . . . . . . . . . . . . . . . . . . . . . . . . . . . . . . 53,525 865,499Horizon Bancorp . . . . . . . . . . . . . . . . . . . . . . . . . . . . . . . . 17,556 346,731Iberiabank Corp. . . . . . . . . . . . . . . . . . . . . . . . . . . . . . . . . 24,314 1,977,944Independent Bank Corp. . . . . . . . . . . . . . . . . . . . . . . . . . . . 11,863 280,560Independent Bank Corp./Rockland Trust . . . . . . . . . . . . . . . . 11,523 951,800Independent Bank Group, Inc. . . . . . . . . . . . . . . . . . . . . . . . 9,806 650,138International Bancshares Corp. . . . . . . . . . . . . . . . . . . . . . . . 23,225 1,045,125Investors Bancorp, Inc. . . . . . . . . . . . . . . . . . . . . . . . . . . . . 113,703 1,395,136Lakeland Bancorp, Inc. . . . . . . . . . . . . . . . . . . . . . . . . . . . . 19,901 359,213Lakeland Financial Corp. . . . . . . . . . . . . . . . . . . . . . . . . . . . 11,384 529,128LegacyTexas Financial Group, Inc. . . . . . . . . . . . . . . . . . . . . . 21,060 897,156Live Oak Bancshares, Inc. (b) . . . . . . . . . . . . . . . . . . . . . . . . 10,534 282,311Macatawa Bank Corp. . . . . . . . . . . . . . . . . . . . . . . . . . . . . . 14,416 168,811MB Financial, Inc. . . . . . . . . . . . . . . . . . . . . . . . . . . . . . . . 35,622 1,642,530Mercantile Bank Corp. . . . . . . . . . . . . . . . . . . . . . . . . . . . . 8,647 288,550Metropolitan Bank Holding Corp. (a) . . . . . . . . . . . . . . . . . . . 3,277 134,750Midland States Bancorp, Inc. (b) . . . . . . . . . . . . . . . . . . . . . . 10,034 322,091MidWestOne Financial Group, Inc. . . . . . . . . . . . . . . . . . . . . . 5,585 186,036
Security Description Shares Value
Banks—(Continued)National Bank Holdings Corp. - Class A . . . . . . . . . . . . . . . . . . 12,889 $ 485,271National Bankshares, Inc. . . . . . . . . . . . . . . . . . . . . . . . . . . 3,487 158,484National Commerce Corp. (a) . . . . . . . . . . . . . . . . . . . . . . . . 7,109 293,602NBT Bancorp, Inc. (b) . . . . . . . . . . . . . . . . . . . . . . . . . . . . . 20,117 772,090Nicolet Bankshares, Inc. (a) . . . . . . . . . . . . . . . . . . . . . . . . . 4,410 240,389Northrim BanCorp, Inc. . . . . . . . . . . . . . . . . . . . . . . . . . . . . 3,529 146,630OFG Bancorp . . . . . . . . . . . . . . . . . . . . . . . . . . . . . . . . . . . 19,884 321,127Old Line Bancshares, Inc. . . . . . . . . . . . . . . . . . . . . . . . . . . . 7,597 240,369Old National Bancorp . . . . . . . . . . . . . . . . . . . . . . . . . . . . . 69,241 1,336,351Old Second Bancorp, Inc. . . . . . . . . . . . . . . . . . . . . . . . . . . . 14,296 220,873Opus Bank (b) . . . . . . . . . . . . . . . . . . . . . . . . . . . . . . . . . 8,631 236,489Origin Bancorp, Inc. (b) . . . . . . . . . . . . . . . . . . . . . . . . . . . . 6,937 261,178Pacific Premier Bancorp, Inc. (a) . . . . . . . . . . . . . . . . . . . . . . 21,020 781,944Park National Corp. . . . . . . . . . . . . . . . . . . . . . . . . . . . . . . 5,741 606,020Peapack Gladstone Financial Corp. . . . . . . . . . . . . . . . . . . . . 8,311 256,727People’s Utah Bancorp . . . . . . . . . . . . . . . . . . . . . . . . . . . . 7,011 238,023Peoples Bancorp, Inc. . . . . . . . . . . . . . . . . . . . . . . . . . . . . . 8,443 295,758Peoples Financial Services Corp. . . . . . . . . . . . . . . . . . . . . . . 3,673 155,735Preferred Bank (b) . . . . . . . . . . . . . . . . . . . . . . . . . . . . . . 6,573 384,521QCR Holdings, Inc. . . . . . . . . . . . . . . . . . . . . . . . . . . . . . . . 5,811 237,379RBB Bancorp . . . . . . . . . . . . . . . . . . . . . . . . . . . . . . . . . . . 6,720 164,640Reliant Bancorp, Inc. . . . . . . . . . . . . . . . . . . . . . . . . . . . . . 5,179 132,427Renasant Corp. . . . . . . . . . . . . . . . . . . . . . . . . . . . . . . . . . 22,158 913,131Republic Bancorp, Inc. - Class A . . . . . . . . . . . . . . . . . . . . . . . 5,421 249,908Republic First Bancorp, Inc. (a) . . . . . . . . . . . . . . . . . . . . . . . 22,031 157,522S&T Bancorp, Inc. (b) . . . . . . . . . . . . . . . . . . . . . . . . . . . . . 15,660 679,018Sandy Spring Bancorp, Inc. . . . . . . . . . . . . . . . . . . . . . . . . . 16,080 632,105Seacoast Banking Corp. of Florida (a) (b) . . . . . . . . . . . . . . . . 21,315 622,398ServisFirst Bancshares, Inc. (b) . . . . . . . . . . . . . . . . . . . . . . . 20,928 819,331Sierra Bancorp . . . . . . . . . . . . . . . . . . . . . . . . . . . . . . . . . 5,841 168,805Simmons First National Corp. - Class A . . . . . . . . . . . . . . . . . . 41,478 1,221,527SmartFinancial, Inc. (a) . . . . . . . . . . . . . . . . . . . . . . . . . . . . 5,821 137,085South State Corp. . . . . . . . . . . . . . . . . . . . . . . . . . . . . . . . . 16,714 1,370,548Southern First Bancshares, Inc. (a) . . . . . . . . . . . . . . . . . . . . 3,419 134,367Southern National Bancorp of Virginia, Inc. . . . . . . . . . . . . . . . 10,799 174,944Southside Bancshares, Inc. (b) . . . . . . . . . . . . . . . . . . . . . . . 15,530 540,444State Bank Financial Corp. . . . . . . . . . . . . . . . . . . . . . . . . . . 16,379 494,318Stock Yards Bancorp, Inc. . . . . . . . . . . . . . . . . . . . . . . . . . . 10,633 385,978Summit Financial Group, Inc. . . . . . . . . . . . . . . . . . . . . . . . . 5,705 132,413Tompkins Financial Corp. . . . . . . . . . . . . . . . . . . . . . . . . . . . 6,912 561,185Towne Bank . . . . . . . . . . . . . . . . . . . . . . . . . . . . . . . . . . . 30,317 935,279TriCo Bancshares . . . . . . . . . . . . . . . . . . . . . . . . . . . . . . . . 11,734 453,167TriState Capital Holdings, Inc. (a) . . . . . . . . . . . . . . . . . . . . . 11,422 315,247Triumph Bancorp, Inc. (a) (b) . . . . . . . . . . . . . . . . . . . . . . . . 11,267 430,399Trustmark Corp. (b) . . . . . . . . . . . . . . . . . . . . . . . . . . . . . . 31,188 1,049,476UMB Financial Corp. (b) . . . . . . . . . . . . . . . . . . . . . . . . . . . 20,613 1,461,462Union Bankshares Corp. (b) . . . . . . . . . . . . . . . . . . . . . . . . . 30,030 1,157,056United Bankshares, Inc. (b) . . . . . . . . . . . . . . . . . . . . . . . . . 43,338 1,575,336United Community Banks, Inc. . . . . . . . . . . . . . . . . . . . . . . . 34,521 962,791Univest Corp. of Pennsylvania . . . . . . . . . . . . . . . . . . . . . . . 12,133 320,918Valley National Bancorp (b) . . . . . . . . . . . . . . . . . . . . . . . . . 147,264 1,656,720Veritex Holdings, Inc. (a) . . . . . . . . . . . . . . . . . . . . . . . . . . . 11,061 312,584Washington Trust Bancorp, Inc. . . . . . . . . . . . . . . . . . . . . . . . 7,713 426,529WesBanco, Inc. . . . . . . . . . . . . . . . . . . . . . . . . . . . . . . . . . 23,770 1,059,667West Bancorp, Inc. . . . . . . . . . . . . . . . . . . . . . . . . . . . . . . . 8,036 188,846Westamerica Bancorp (b) . . . . . . . . . . . . . . . . . . . . . . . . . . 11,738 706,158
92,439,281
BHFTII-211
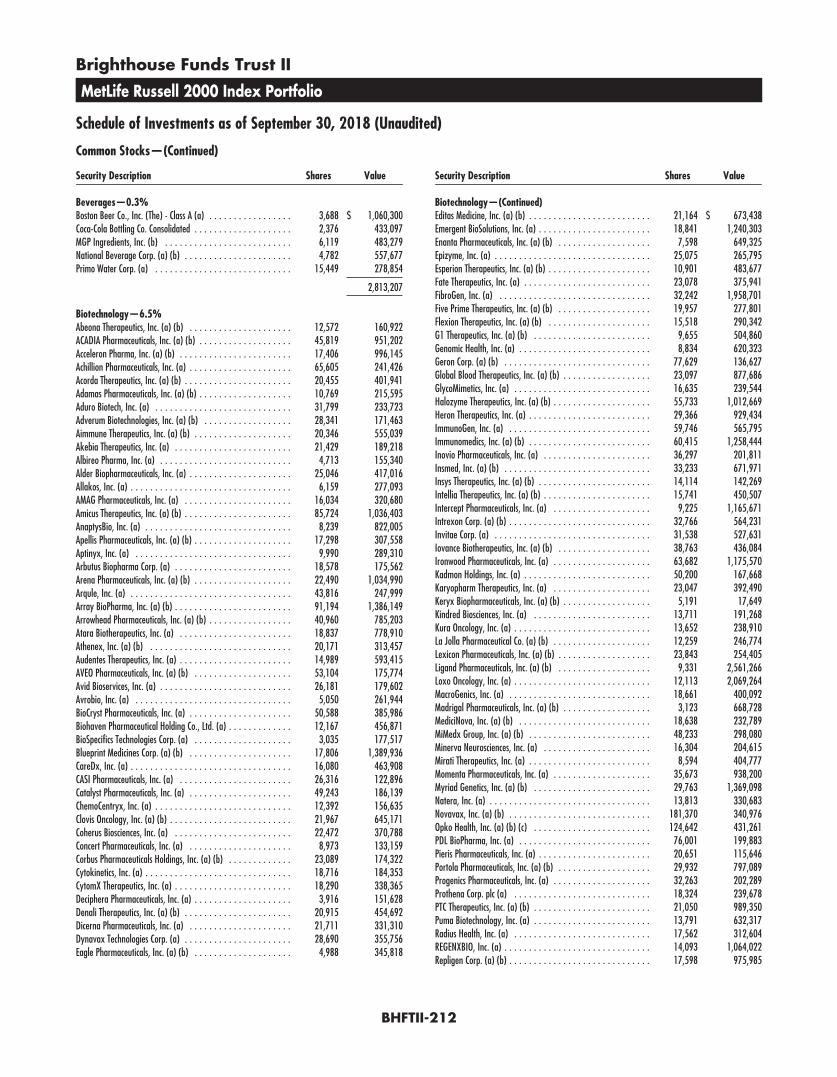
Brighthouse Funds Trust II
MetLife Russell 2000 Index Portfolio
Schedule of Investments as of September 30, 2018 (Unaudited)
Common Stocks—(Continued)
Security Description Shares Value
Beverages—0.3%Boston Beer Co., Inc. (The) - Class A (a) . . . . . . . . . . . . . . . . . 3,688 $ 1,060,300Coca-Cola Bottling Co. Consolidated . . . . . . . . . . . . . . . . . . . . 2,376 433,097MGP Ingredients, Inc. (b) . . . . . . . . . . . . . . . . . . . . . . . . . . 6,119 483,279National Beverage Corp. (a) (b) . . . . . . . . . . . . . . . . . . . . . . 4,782 557,677Primo Water Corp. (a) . . . . . . . . . . . . . . . . . . . . . . . . . . . . 15,449 278,854
2,813,207
Biotechnology—6.5%Abeona Therapeutics, Inc. (a) (b) . . . . . . . . . . . . . . . . . . . . . 12,572 160,922ACADIA Pharmaceuticals, Inc. (a) (b) . . . . . . . . . . . . . . . . . . . 45,819 951,202Acceleron Pharma, Inc. (a) (b) . . . . . . . . . . . . . . . . . . . . . . . 17,406 996,145Achillion Pharmaceuticals, Inc. (a) . . . . . . . . . . . . . . . . . . . . . 65,605 241,426Acorda Therapeutics, Inc. (a) (b) . . . . . . . . . . . . . . . . . . . . . . 20,455 401,941Adamas Pharmaceuticals, Inc. (a) (b) . . . . . . . . . . . . . . . . . . . 10,769 215,595Aduro Biotech, Inc. (a) . . . . . . . . . . . . . . . . . . . . . . . . . . . . 31,799 233,723Adverum Biotechnologies, Inc. (a) (b) . . . . . . . . . . . . . . . . . . 28,341 171,463Aimmune Therapeutics, Inc. (a) (b) . . . . . . . . . . . . . . . . . . . . 20,346 555,039Akebia Therapeutics, Inc. (a) . . . . . . . . . . . . . . . . . . . . . . . . 21,429 189,218Albireo Pharma, Inc. (a) . . . . . . . . . . . . . . . . . . . . . . . . . . . 4,713 155,340Alder Biopharmaceuticals, Inc. (a) . . . . . . . . . . . . . . . . . . . . . 25,046 417,016Allakos, Inc. (a) . . . . . . . . . . . . . . . . . . . . . . . . . . . . . . . . . 6,159 277,093AMAG Pharmaceuticals, Inc. (a) . . . . . . . . . . . . . . . . . . . . . . 16,034 320,680Amicus Therapeutics, Inc. (a) (b) . . . . . . . . . . . . . . . . . . . . . . 85,724 1,036,403AnaptysBio, Inc. (a) . . . . . . . . . . . . . . . . . . . . . . . . . . . . . . 8,239 822,005Apellis Pharmaceuticals, Inc. (a) (b) . . . . . . . . . . . . . . . . . . . . 17,298 307,558Aptinyx, Inc. (a) . . . . . . . . . . . . . . . . . . . . . . . . . . . . . . . . 9,990 289,310Arbutus Biopharma Corp. (a) . . . . . . . . . . . . . . . . . . . . . . . . 18,578 175,562Arena Pharmaceuticals, Inc. (a) (b) . . . . . . . . . . . . . . . . . . . . 22,490 1,034,990Arqule, Inc. (a) . . . . . . . . . . . . . . . . . . . . . . . . . . . . . . . . . 43,816 247,999Array BioPharma, Inc. (a) (b) . . . . . . . . . . . . . . . . . . . . . . . . 91,194 1,386,149Arrowhead Pharmaceuticals, Inc. (a) (b) . . . . . . . . . . . . . . . . . 40,960 785,203Atara Biotherapeutics, Inc. (a) . . . . . . . . . . . . . . . . . . . . . . . 18,837 778,910Athenex, Inc. (a) (b) . . . . . . . . . . . . . . . . . . . . . . . . . . . . . 20,171 313,457Audentes Therapeutics, Inc. (a) . . . . . . . . . . . . . . . . . . . . . . . 14,989 593,415AVEO Pharmaceuticals, Inc. (a) (b) . . . . . . . . . . . . . . . . . . . . 53,104 175,774Avid Bioservices, Inc. (a) . . . . . . . . . . . . . . . . . . . . . . . . . . . 26,181 179,602Avrobio, Inc. (a) . . . . . . . . . . . . . . . . . . . . . . . . . . . . . . . . 5,050 261,944BioCryst Pharmaceuticals, Inc. (a) . . . . . . . . . . . . . . . . . . . . . 50,588 385,986Biohaven Pharmaceutical Holding Co., Ltd. (a) . . . . . . . . . . . . . 12,167 456,871BioSpecifics Technologies Corp. (a) . . . . . . . . . . . . . . . . . . . . 3,035 177,517Blueprint Medicines Corp. (a) (b) . . . . . . . . . . . . . . . . . . . . . 17,806 1,389,936CareDx, Inc. (a) . . . . . . . . . . . . . . . . . . . . . . . . . . . . . . . . . 16,080 463,908CASI Pharmaceuticals, Inc. (a) . . . . . . . . . . . . . . . . . . . . . . . 26,316 122,896Catalyst Pharmaceuticals, Inc. (a) . . . . . . . . . . . . . . . . . . . . . 49,243 186,139ChemoCentryx, Inc. (a) . . . . . . . . . . . . . . . . . . . . . . . . . . . . 12,392 156,635Clovis Oncology, Inc. (a) (b) . . . . . . . . . . . . . . . . . . . . . . . . . 21,967 645,171Coherus Biosciences, Inc. (a) . . . . . . . . . . . . . . . . . . . . . . . . 22,472 370,788Concert Pharmaceuticals, Inc. (a) . . . . . . . . . . . . . . . . . . . . . 8,973 133,159Corbus Pharmaceuticals Holdings, Inc. (a) (b) . . . . . . . . . . . . . 23,089 174,322Cytokinetics, Inc. (a) . . . . . . . . . . . . . . . . . . . . . . . . . . . . . . 18,716 184,353CytomX Therapeutics, Inc. (a) . . . . . . . . . . . . . . . . . . . . . . . . 18,290 338,365Deciphera Pharmaceuticals, Inc. (a) . . . . . . . . . . . . . . . . . . . . 3,916 151,628Denali Therapeutics, Inc. (a) (b) . . . . . . . . . . . . . . . . . . . . . . 20,915 454,692Dicerna Pharmaceuticals, Inc. (a) . . . . . . . . . . . . . . . . . . . . . 21,711 331,310Dynavax Technologies Corp. (a) . . . . . . . . . . . . . . . . . . . . . . 28,690 355,756Eagle Pharmaceuticals, Inc. (a) (b) . . . . . . . . . . . . . . . . . . . . 4,988 345,818
Security Description Shares Value
Biotechnology—(Continued)Editas Medicine, Inc. (a) (b) . . . . . . . . . . . . . . . . . . . . . . . . . 21,164 $ 673,438Emergent BioSolutions, Inc. (a) . . . . . . . . . . . . . . . . . . . . . . . 18,841 1,240,303Enanta Pharmaceuticals, Inc. (a) (b) . . . . . . . . . . . . . . . . . . . 7,598 649,325Epizyme, Inc. (a) . . . . . . . . . . . . . . . . . . . . . . . . . . . . . . . . 25,075 265,795Esperion Therapeutics, Inc. (a) (b) . . . . . . . . . . . . . . . . . . . . . 10,901 483,677Fate Therapeutics, Inc. (a) . . . . . . . . . . . . . . . . . . . . . . . . . . 23,078 375,941FibroGen, Inc. (a) . . . . . . . . . . . . . . . . . . . . . . . . . . . . . . . 32,242 1,958,701Five Prime Therapeutics, Inc. (a) (b) . . . . . . . . . . . . . . . . . . . 19,957 277,801Flexion Therapeutics, Inc. (a) (b) . . . . . . . . . . . . . . . . . . . . . 15,518 290,342G1 Therapeutics, Inc. (a) (b) . . . . . . . . . . . . . . . . . . . . . . . . 9,655 504,860Genomic Health, Inc. (a) . . . . . . . . . . . . . . . . . . . . . . . . . . . 8,834 620,323Geron Corp. (a) (b) . . . . . . . . . . . . . . . . . . . . . . . . . . . . . . 77,629 136,627Global Blood Therapeutics, Inc. (a) (b) . . . . . . . . . . . . . . . . . . 23,097 877,686GlycoMimetics, Inc. (a) . . . . . . . . . . . . . . . . . . . . . . . . . . . . 16,635 239,544Halozyme Therapeutics, Inc. (a) (b) . . . . . . . . . . . . . . . . . . . . 55,733 1,012,669Heron Therapeutics, Inc. (a) . . . . . . . . . . . . . . . . . . . . . . . . . 29,366 929,434ImmunoGen, Inc. (a) . . . . . . . . . . . . . . . . . . . . . . . . . . . . . 59,746 565,795Immunomedics, Inc. (a) (b) . . . . . . . . . . . . . . . . . . . . . . . . . 60,415 1,258,444Inovio Pharmaceuticals, Inc. (a) . . . . . . . . . . . . . . . . . . . . . . 36,297 201,811Insmed, Inc. (a) (b) . . . . . . . . . . . . . . . . . . . . . . . . . . . . . . 33,233 671,971Insys Therapeutics, Inc. (a) (b) . . . . . . . . . . . . . . . . . . . . . . . 14,114 142,269Intellia Therapeutics, Inc. (a) (b) . . . . . . . . . . . . . . . . . . . . . . 15,741 450,507Intercept Pharmaceuticals, Inc. (a) . . . . . . . . . . . . . . . . . . . . 9,225 1,165,671Intrexon Corp. (a) (b) . . . . . . . . . . . . . . . . . . . . . . . . . . . . . 32,766 564,231Invitae Corp. (a) . . . . . . . . . . . . . . . . . . . . . . . . . . . . . . . . 31,538 527,631Iovance Biotherapeutics, Inc. (a) (b) . . . . . . . . . . . . . . . . . . . 38,763 436,084Ironwood Pharmaceuticals, Inc. (a) . . . . . . . . . . . . . . . . . . . . 63,682 1,175,570Kadmon Holdings, Inc. (a) . . . . . . . . . . . . . . . . . . . . . . . . . . 50,200 167,668Karyopharm Therapeutics, Inc. (a) . . . . . . . . . . . . . . . . . . . . 23,047 392,490Keryx Biopharmaceuticals, Inc. (a) (b) . . . . . . . . . . . . . . . . . . 5,191 17,649Kindred Biosciences, Inc. (a) . . . . . . . . . . . . . . . . . . . . . . . . 13,711 191,268Kura Oncology, Inc. (a) . . . . . . . . . . . . . . . . . . . . . . . . . . . . 13,652 238,910La Jolla Pharmaceutical Co. (a) (b) . . . . . . . . . . . . . . . . . . . . 12,259 246,774Lexicon Pharmaceuticals, Inc. (a) (b) . . . . . . . . . . . . . . . . . . . 23,843 254,405Ligand Pharmaceuticals, Inc. (a) (b) . . . . . . . . . . . . . . . . . . . 9,331 2,561,266Loxo Oncology, Inc. (a) . . . . . . . . . . . . . . . . . . . . . . . . . . . . 12,113 2,069,264MacroGenics, Inc. (a) . . . . . . . . . . . . . . . . . . . . . . . . . . . . . 18,661 400,092Madrigal Pharmaceuticals, Inc. (a) (b) . . . . . . . . . . . . . . . . . . 3,123 668,728MediciNova, Inc. (a) (b) . . . . . . . . . . . . . . . . . . . . . . . . . . . 18,638 232,789MiMedx Group, Inc. (a) (b) . . . . . . . . . . . . . . . . . . . . . . . . . 48,233 298,080Minerva Neurosciences, Inc. (a) . . . . . . . . . . . . . . . . . . . . . . 16,304 204,615Mirati Therapeutics, Inc. (a) . . . . . . . . . . . . . . . . . . . . . . . . . 8,594 404,777Momenta Pharmaceuticals, Inc. (a) . . . . . . . . . . . . . . . . . . . . 35,673 938,200Myriad Genetics, Inc. (a) (b) . . . . . . . . . . . . . . . . . . . . . . . . 29,763 1,369,098Natera, Inc. (a) . . . . . . . . . . . . . . . . . . . . . . . . . . . . . . . . . 13,813 330,683Novavax, Inc. (a) (b) . . . . . . . . . . . . . . . . . . . . . . . . . . . . . 181,370 340,976Opko Health, Inc. (a) (b) (c) . . . . . . . . . . . . . . . . . . . . . . . . 124,642 431,261PDL BioPharma, Inc. (a) . . . . . . . . . . . . . . . . . . . . . . . . . . . 76,001 199,883Pieris Pharmaceuticals, Inc. (a) . . . . . . . . . . . . . . . . . . . . . . . 20,651 115,646Portola Pharmaceuticals, Inc. (a) (b) . . . . . . . . . . . . . . . . . . . 29,932 797,089Progenics Pharmaceuticals, Inc. (a) . . . . . . . . . . . . . . . . . . . . 32,263 202,289Prothena Corp. plc (a) . . . . . . . . . . . . . . . . . . . . . . . . . . . . 18,324 239,678PTC Therapeutics, Inc. (a) (b) . . . . . . . . . . . . . . . . . . . . . . . . 21,050 989,350Puma Biotechnology, Inc. (a) . . . . . . . . . . . . . . . . . . . . . . . . 13,791 632,317Radius Health, Inc. (a) . . . . . . . . . . . . . . . . . . . . . . . . . . . . 17,562 312,604REGENXBIO, Inc. (a) . . . . . . . . . . . . . . . . . . . . . . . . . . . . . . 14,093 1,064,022Repligen Corp. (a) (b) . . . . . . . . . . . . . . . . . . . . . . . . . . . . . 17,598 975,985
BHFTII-212
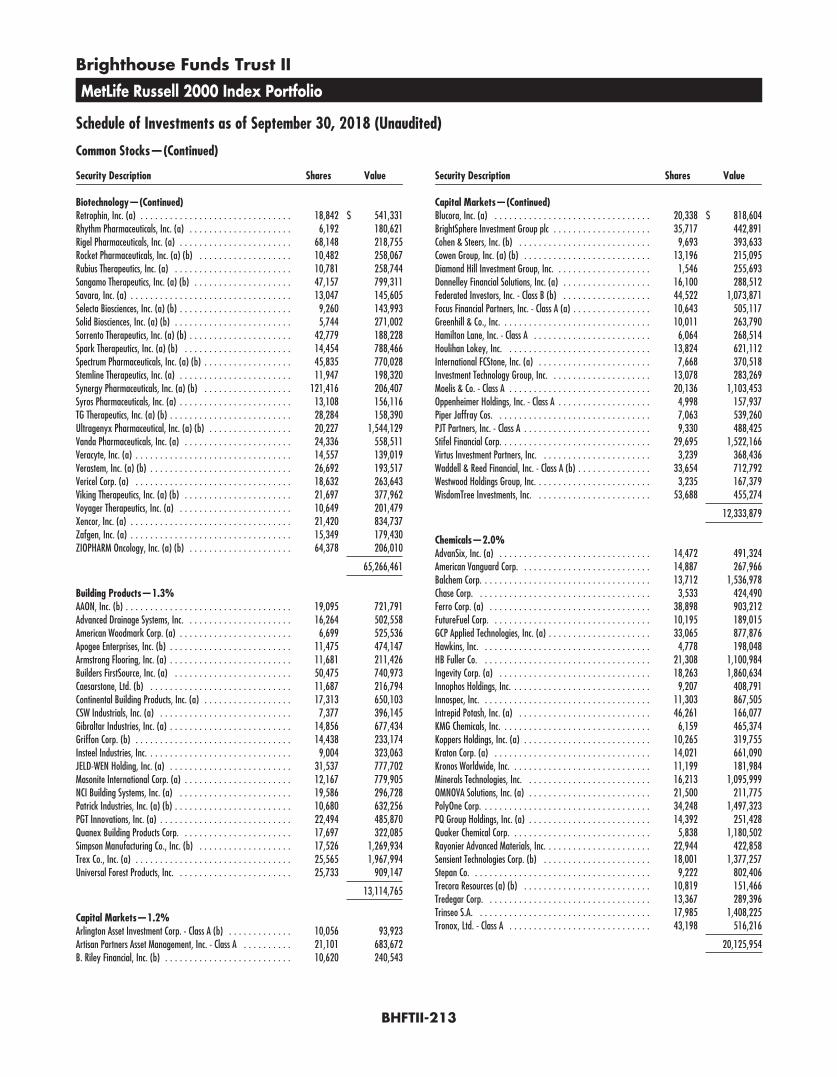
Brighthouse Funds Trust II
MetLife Russell 2000 Index Portfolio
Schedule of Investments as of September 30, 2018 (Unaudited)
Common Stocks—(Continued)
Security Description Shares Value
Biotechnology—(Continued)Retrophin, Inc. (a) . . . . . . . . . . . . . . . . . . . . . . . . . . . . . . . 18,842 $ 541,331Rhythm Pharmaceuticals, Inc. (a) . . . . . . . . . . . . . . . . . . . . . 6,192 180,621Rigel Pharmaceuticals, Inc. (a) . . . . . . . . . . . . . . . . . . . . . . . 68,148 218,755Rocket Pharmaceuticals, Inc. (a) (b) . . . . . . . . . . . . . . . . . . . 10,482 258,067Rubius Therapeutics, Inc. (a) . . . . . . . . . . . . . . . . . . . . . . . . 10,781 258,744Sangamo Therapeutics, Inc. (a) (b) . . . . . . . . . . . . . . . . . . . . 47,157 799,311Savara, Inc. (a) . . . . . . . . . . . . . . . . . . . . . . . . . . . . . . . . . 13,047 145,605Selecta Biosciences, Inc. (a) (b) . . . . . . . . . . . . . . . . . . . . . . . 9,260 143,993Solid Biosciences, Inc. (a) (b) . . . . . . . . . . . . . . . . . . . . . . . . 5,744 271,002Sorrento Therapeutics, Inc. (a) (b) . . . . . . . . . . . . . . . . . . . . . 42,779 188,228Spark Therapeutics, Inc. (a) (b) . . . . . . . . . . . . . . . . . . . . . . 14,454 788,466Spectrum Pharmaceuticals, Inc. (a) (b) . . . . . . . . . . . . . . . . . . 45,835 770,028Stemline Therapeutics, Inc. (a) . . . . . . . . . . . . . . . . . . . . . . . 11,947 198,320Synergy Pharmaceuticals, Inc. (a) (b) . . . . . . . . . . . . . . . . . . 121,416 206,407Syros Pharmaceuticals, Inc. (a) . . . . . . . . . . . . . . . . . . . . . . . 13,108 156,116TG Therapeutics, Inc. (a) (b) . . . . . . . . . . . . . . . . . . . . . . . . . 28,284 158,390Ultragenyx Pharmaceutical, Inc. (a) (b) . . . . . . . . . . . . . . . . . 20,227 1,544,129Vanda Pharmaceuticals, Inc. (a) . . . . . . . . . . . . . . . . . . . . . . 24,336 558,511Veracyte, Inc. (a) . . . . . . . . . . . . . . . . . . . . . . . . . . . . . . . . 14,557 139,019Verastem, Inc. (a) (b) . . . . . . . . . . . . . . . . . . . . . . . . . . . . . 26,692 193,517Vericel Corp. (a) . . . . . . . . . . . . . . . . . . . . . . . . . . . . . . . . 18,632 263,643Viking Therapeutics, Inc. (a) (b) . . . . . . . . . . . . . . . . . . . . . . 21,697 377,962Voyager Therapeutics, Inc. (a) . . . . . . . . . . . . . . . . . . . . . . . 10,649 201,479Xencor, Inc. (a) . . . . . . . . . . . . . . . . . . . . . . . . . . . . . . . . . 21,420 834,737Zafgen, Inc. (a) . . . . . . . . . . . . . . . . . . . . . . . . . . . . . . . . . 15,349 179,430ZIOPHARM Oncology, Inc. (a) (b) . . . . . . . . . . . . . . . . . . . . . 64,378 206,010
65,266,461
Building Products—1.3%AAON, Inc. (b) . . . . . . . . . . . . . . . . . . . . . . . . . . . . . . . . . . 19,095 721,791Advanced Drainage Systems, Inc. . . . . . . . . . . . . . . . . . . . . . 16,264 502,558American Woodmark Corp. (a) . . . . . . . . . . . . . . . . . . . . . . . 6,699 525,536Apogee Enterprises, Inc. (b) . . . . . . . . . . . . . . . . . . . . . . . . . 11,475 474,147Armstrong Flooring, Inc. (a) . . . . . . . . . . . . . . . . . . . . . . . . . 11,681 211,426Builders FirstSource, Inc. (a) . . . . . . . . . . . . . . . . . . . . . . . . 50,475 740,973Caesarstone, Ltd. (b) . . . . . . . . . . . . . . . . . . . . . . . . . . . . . 11,687 216,794Continental Building Products, Inc. (a) . . . . . . . . . . . . . . . . . . 17,313 650,103CSW Industrials, Inc. (a) . . . . . . . . . . . . . . . . . . . . . . . . . . . 7,377 396,145Gibraltar Industries, Inc. (a) . . . . . . . . . . . . . . . . . . . . . . . . . 14,856 677,434Griffon Corp. (b) . . . . . . . . . . . . . . . . . . . . . . . . . . . . . . . . 14,438 233,174Insteel Industries, Inc. . . . . . . . . . . . . . . . . . . . . . . . . . . . . . 9,004 323,063JELD-WEN Holding, Inc. (a) . . . . . . . . . . . . . . . . . . . . . . . . . 31,537 777,702Masonite International Corp. (a) . . . . . . . . . . . . . . . . . . . . . . 12,167 779,905NCI Building Systems, Inc. (a) . . . . . . . . . . . . . . . . . . . . . . . 19,586 296,728Patrick Industries, Inc. (a) (b) . . . . . . . . . . . . . . . . . . . . . . . . 10,680 632,256PGT Innovations, Inc. (a) . . . . . . . . . . . . . . . . . . . . . . . . . . . 22,494 485,870Quanex Building Products Corp. . . . . . . . . . . . . . . . . . . . . . . 17,697 322,085Simpson Manufacturing Co., Inc. (b) . . . . . . . . . . . . . . . . . . . 17,526 1,269,934Trex Co., Inc. (a) . . . . . . . . . . . . . . . . . . . . . . . . . . . . . . . . 25,565 1,967,994Universal Forest Products, Inc. . . . . . . . . . . . . . . . . . . . . . . . 25,733 909,147
13,114,765
Capital Markets—1.2%Arlington Asset Investment Corp. - Class A (b) . . . . . . . . . . . . . 10,056 93,923Artisan Partners Asset Management, Inc. - Class A . . . . . . . . . . 21,101 683,672B. Riley Financial, Inc. (b) . . . . . . . . . . . . . . . . . . . . . . . . . . 10,620 240,543
Security Description Shares Value
Capital Markets—(Continued)Blucora, Inc. (a) . . . . . . . . . . . . . . . . . . . . . . . . . . . . . . . . 20,338 $ 818,604BrightSphere Investment Group plc . . . . . . . . . . . . . . . . . . . . 35,717 442,891Cohen & Steers, Inc. (b) . . . . . . . . . . . . . . . . . . . . . . . . . . . 9,693 393,633Cowen Group, Inc. (a) (b) . . . . . . . . . . . . . . . . . . . . . . . . . . 13,196 215,095Diamond Hill Investment Group, Inc. . . . . . . . . . . . . . . . . . . . 1,546 255,693Donnelley Financial Solutions, Inc. (a) . . . . . . . . . . . . . . . . . . 16,100 288,512Federated Investors, Inc. - Class B (b) . . . . . . . . . . . . . . . . . . 44,522 1,073,871Focus Financial Partners, Inc. - Class A (a) . . . . . . . . . . . . . . . . 10,643 505,117Greenhill & Co., Inc. . . . . . . . . . . . . . . . . . . . . . . . . . . . . . . 10,011 263,790Hamilton Lane, Inc. - Class A . . . . . . . . . . . . . . . . . . . . . . . . 6,064 268,514Houlihan Lokey, Inc. . . . . . . . . . . . . . . . . . . . . . . . . . . . . . 13,824 621,112International FCStone, Inc. (a) . . . . . . . . . . . . . . . . . . . . . . . 7,668 370,518Investment Technology Group, Inc. . . . . . . . . . . . . . . . . . . . . 13,078 283,269Moelis & Co. - Class A . . . . . . . . . . . . . . . . . . . . . . . . . . . . . 20,136 1,103,453Oppenheimer Holdings, Inc. - Class A . . . . . . . . . . . . . . . . . . . 4,998 157,937Piper Jaffray Cos. . . . . . . . . . . . . . . . . . . . . . . . . . . . . . . . 7,063 539,260PJT Partners, Inc. - Class A . . . . . . . . . . . . . . . . . . . . . . . . . . 9,330 488,425Stifel Financial Corp. . . . . . . . . . . . . . . . . . . . . . . . . . . . . . . 29,695 1,522,166Virtus Investment Partners, Inc. . . . . . . . . . . . . . . . . . . . . . . 3,239 368,436Waddell & Reed Financial, Inc. - Class A (b) . . . . . . . . . . . . . . . 33,654 712,792Westwood Holdings Group, Inc. . . . . . . . . . . . . . . . . . . . . . . . 3,235 167,379WisdomTree Investments, Inc. . . . . . . . . . . . . . . . . . . . . . . . 53,688 455,274
12,333,879
Chemicals—2.0%AdvanSix, Inc. (a) . . . . . . . . . . . . . . . . . . . . . . . . . . . . . . . 14,472 491,324American Vanguard Corp. . . . . . . . . . . . . . . . . . . . . . . . . . . 14,887 267,966Balchem Corp. . . . . . . . . . . . . . . . . . . . . . . . . . . . . . . . . . . 13,712 1,536,978Chase Corp. . . . . . . . . . . . . . . . . . . . . . . . . . . . . . . . . . . . 3,533 424,490Ferro Corp. (a) . . . . . . . . . . . . . . . . . . . . . . . . . . . . . . . . . 38,898 903,212FutureFuel Corp. . . . . . . . . . . . . . . . . . . . . . . . . . . . . . . . . 10,195 189,015GCP Applied Technologies, Inc. (a) . . . . . . . . . . . . . . . . . . . . . 33,065 877,876Hawkins, Inc. . . . . . . . . . . . . . . . . . . . . . . . . . . . . . . . . . . 4,778 198,048HB Fuller Co. . . . . . . . . . . . . . . . . . . . . . . . . . . . . . . . . . . 21,308 1,100,984Ingevity Corp. (a) . . . . . . . . . . . . . . . . . . . . . . . . . . . . . . . 18,263 1,860,634Innophos Holdings, Inc. . . . . . . . . . . . . . . . . . . . . . . . . . . . . 9,207 408,791Innospec, Inc. . . . . . . . . . . . . . . . . . . . . . . . . . . . . . . . . . . 11,303 867,505Intrepid Potash, Inc. (a) . . . . . . . . . . . . . . . . . . . . . . . . . . . 46,261 166,077KMG Chemicals, Inc. . . . . . . . . . . . . . . . . . . . . . . . . . . . . . . 6,159 465,374Koppers Holdings, Inc. (a) . . . . . . . . . . . . . . . . . . . . . . . . . . 10,265 319,755Kraton Corp. (a) . . . . . . . . . . . . . . . . . . . . . . . . . . . . . . . . 14,021 661,090Kronos Worldwide, Inc. . . . . . . . . . . . . . . . . . . . . . . . . . . . . 11,199 181,984Minerals Technologies, Inc. . . . . . . . . . . . . . . . . . . . . . . . . . 16,213 1,095,999OMNOVA Solutions, Inc. (a) . . . . . . . . . . . . . . . . . . . . . . . . . 21,500 211,775PolyOne Corp. . . . . . . . . . . . . . . . . . . . . . . . . . . . . . . . . . . 34,248 1,497,323PQ Group Holdings, Inc. (a) . . . . . . . . . . . . . . . . . . . . . . . . . 14,392 251,428Quaker Chemical Corp. . . . . . . . . . . . . . . . . . . . . . . . . . . . . 5,838 1,180,502Rayonier Advanced Materials, Inc. . . . . . . . . . . . . . . . . . . . . . 22,944 422,858Sensient Technologies Corp. (b) . . . . . . . . . . . . . . . . . . . . . . 18,001 1,377,257Stepan Co. . . . . . . . . . . . . . . . . . . . . . . . . . . . . . . . . . . . . 9,222 802,406Trecora Resources (a) (b) . . . . . . . . . . . . . . . . . . . . . . . . . . 10,819 151,466Tredegar Corp. . . . . . . . . . . . . . . . . . . . . . . . . . . . . . . . . . 13,367 289,396Trinseo S.A. . . . . . . . . . . . . . . . . . . . . . . . . . . . . . . . . . . . 17,985 1,408,225Tronox, Ltd. - Class A . . . . . . . . . . . . . . . . . . . . . . . . . . . . . 43,198 516,216
20,125,954
BHFTII-213
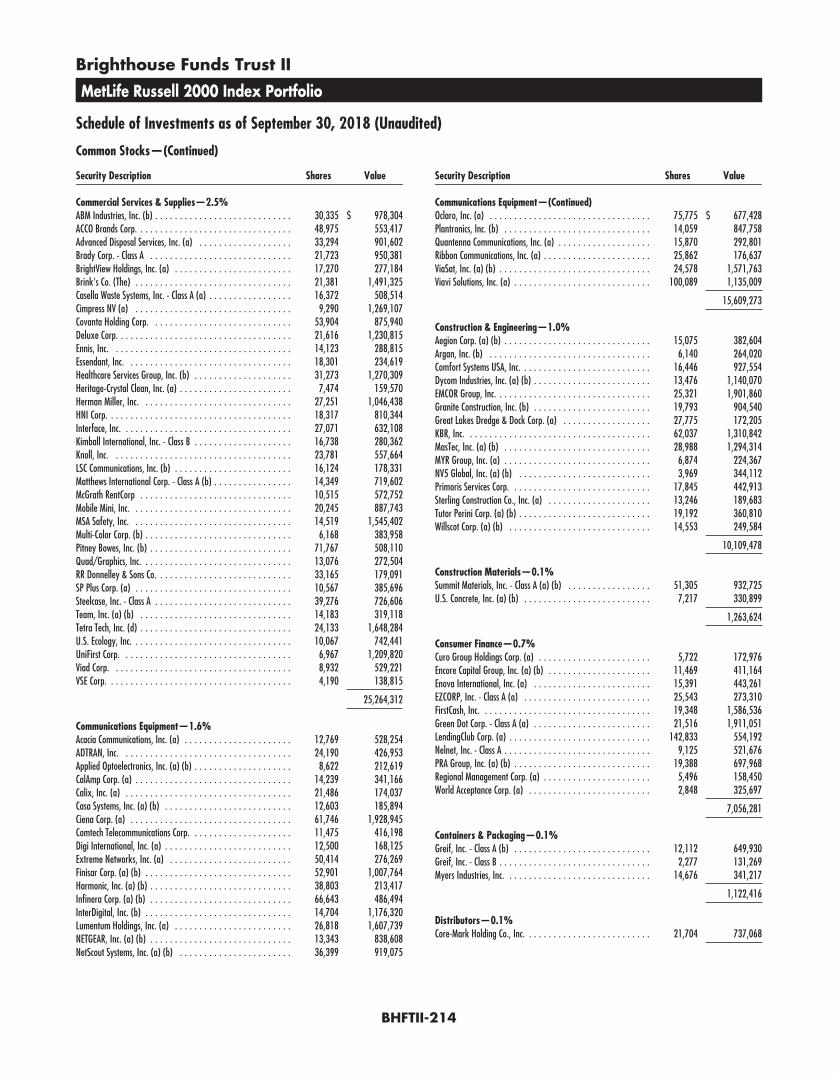
Brighthouse Funds Trust II
MetLife Russell 2000 Index Portfolio
Schedule of Investments as of September 30, 2018 (Unaudited)
Common Stocks—(Continued)
Security Description Shares Value
Commercial Services & Supplies—2.5%ABM Industries, Inc. (b) . . . . . . . . . . . . . . . . . . . . . . . . . . . . 30,335 $ 978,304ACCO Brands Corp. . . . . . . . . . . . . . . . . . . . . . . . . . . . . . . . 48,975 553,417Advanced Disposal Services, Inc. (a) . . . . . . . . . . . . . . . . . . . 33,294 901,602Brady Corp. - Class A . . . . . . . . . . . . . . . . . . . . . . . . . . . . . 21,723 950,381BrightView Holdings, Inc. (a) . . . . . . . . . . . . . . . . . . . . . . . . 17,270 277,184Brink’s Co. (The) . . . . . . . . . . . . . . . . . . . . . . . . . . . . . . . . 21,381 1,491,325Casella Waste Systems, Inc. - Class A (a) . . . . . . . . . . . . . . . . . 16,372 508,514Cimpress NV (a) . . . . . . . . . . . . . . . . . . . . . . . . . . . . . . . . 9,290 1,269,107Covanta Holding Corp. . . . . . . . . . . . . . . . . . . . . . . . . . . . . 53,904 875,940Deluxe Corp. . . . . . . . . . . . . . . . . . . . . . . . . . . . . . . . . . . . 21,616 1,230,815Ennis, Inc. . . . . . . . . . . . . . . . . . . . . . . . . . . . . . . . . . . . . 14,123 288,815Essendant, Inc. . . . . . . . . . . . . . . . . . . . . . . . . . . . . . . . . . 18,301 234,619Healthcare Services Group, Inc. (b) . . . . . . . . . . . . . . . . . . . . 31,273 1,270,309Heritage-Crystal Clean, Inc. (a) . . . . . . . . . . . . . . . . . . . . . . . 7,474 159,570Herman Miller, Inc. . . . . . . . . . . . . . . . . . . . . . . . . . . . . . . 27,251 1,046,438HNI Corp. . . . . . . . . . . . . . . . . . . . . . . . . . . . . . . . . . . . . . 18,317 810,344Interface, Inc. . . . . . . . . . . . . . . . . . . . . . . . . . . . . . . . . . . 27,071 632,108Kimball International, Inc. - Class B . . . . . . . . . . . . . . . . . . . . 16,738 280,362Knoll, Inc. . . . . . . . . . . . . . . . . . . . . . . . . . . . . . . . . . . . . 23,781 557,664LSC Communications, Inc. (b) . . . . . . . . . . . . . . . . . . . . . . . . 16,124 178,331Matthews International Corp. - Class A (b) . . . . . . . . . . . . . . . . 14,349 719,602McGrath RentCorp . . . . . . . . . . . . . . . . . . . . . . . . . . . . . . . 10,515 572,752Mobile Mini, Inc. . . . . . . . . . . . . . . . . . . . . . . . . . . . . . . . . 20,245 887,743MSA Safety, Inc. . . . . . . . . . . . . . . . . . . . . . . . . . . . . . . . . 14,519 1,545,402Multi-Color Corp. (b) . . . . . . . . . . . . . . . . . . . . . . . . . . . . . . 6,168 383,958Pitney Bowes, Inc. (b) . . . . . . . . . . . . . . . . . . . . . . . . . . . . . 71,767 508,110Quad/Graphics, Inc. . . . . . . . . . . . . . . . . . . . . . . . . . . . . . . 13,076 272,504RR Donnelley & Sons Co. . . . . . . . . . . . . . . . . . . . . . . . . . . . 33,165 179,091SP Plus Corp. (a) . . . . . . . . . . . . . . . . . . . . . . . . . . . . . . . . 10,567 385,696Steelcase, Inc. - Class A . . . . . . . . . . . . . . . . . . . . . . . . . . . . 39,276 726,606Team, Inc. (a) (b) . . . . . . . . . . . . . . . . . . . . . . . . . . . . . . . 14,183 319,118Tetra Tech, Inc. (d) . . . . . . . . . . . . . . . . . . . . . . . . . . . . . . . 24,133 1,648,284U.S. Ecology, Inc. . . . . . . . . . . . . . . . . . . . . . . . . . . . . . . . . 10,067 742,441UniFirst Corp. . . . . . . . . . . . . . . . . . . . . . . . . . . . . . . . . . . 6,967 1,209,820Viad Corp. . . . . . . . . . . . . . . . . . . . . . . . . . . . . . . . . . . . . 8,932 529,221VSE Corp. . . . . . . . . . . . . . . . . . . . . . . . . . . . . . . . . . . . . . 4,190 138,815
25,264,312
Communications Equipment—1.6%Acacia Communications, Inc. (a) . . . . . . . . . . . . . . . . . . . . . . 12,769 528,254ADTRAN, Inc. . . . . . . . . . . . . . . . . . . . . . . . . . . . . . . . . . . 24,190 426,953Applied Optoelectronics, Inc. (a) (b) . . . . . . . . . . . . . . . . . . . . 8,622 212,619CalAmp Corp. (a) . . . . . . . . . . . . . . . . . . . . . . . . . . . . . . . . 14,239 341,166Calix, Inc. (a) . . . . . . . . . . . . . . . . . . . . . . . . . . . . . . . . . . 21,486 174,037Casa Systems, Inc. (a) (b) . . . . . . . . . . . . . . . . . . . . . . . . . . 12,603 185,894Ciena Corp. (a) . . . . . . . . . . . . . . . . . . . . . . . . . . . . . . . . . 61,746 1,928,945Comtech Telecommunications Corp. . . . . . . . . . . . . . . . . . . . . 11,475 416,198Digi International, Inc. (a) . . . . . . . . . . . . . . . . . . . . . . . . . . 12,500 168,125Extreme Networks, Inc. (a) . . . . . . . . . . . . . . . . . . . . . . . . . 50,414 276,269Finisar Corp. (a) (b) . . . . . . . . . . . . . . . . . . . . . . . . . . . . . . 52,901 1,007,764Harmonic, Inc. (a) (b) . . . . . . . . . . . . . . . . . . . . . . . . . . . . . 38,803 213,417Infinera Corp. (a) (b) . . . . . . . . . . . . . . . . . . . . . . . . . . . . . 66,643 486,494InterDigital, Inc. (b) . . . . . . . . . . . . . . . . . . . . . . . . . . . . . . 14,704 1,176,320Lumentum Holdings, Inc. (a) . . . . . . . . . . . . . . . . . . . . . . . . 26,818 1,607,739NETGEAR, Inc. (a) (b) . . . . . . . . . . . . . . . . . . . . . . . . . . . . . 13,343 838,608NetScout Systems, Inc. (a) (b) . . . . . . . . . . . . . . . . . . . . . . . 36,399 919,075
Security Description Shares Value
Communications Equipment—(Continued)Oclaro, Inc. (a) . . . . . . . . . . . . . . . . . . . . . . . . . . . . . . . . . 75,775 $ 677,428Plantronics, Inc. (b) . . . . . . . . . . . . . . . . . . . . . . . . . . . . . . 14,059 847,758Quantenna Communications, Inc. (a) . . . . . . . . . . . . . . . . . . . 15,870 292,801Ribbon Communications, Inc. (a) . . . . . . . . . . . . . . . . . . . . . . 25,862 176,637ViaSat, Inc. (a) (b) . . . . . . . . . . . . . . . . . . . . . . . . . . . . . . . 24,578 1,571,763Viavi Solutions, Inc. (a) . . . . . . . . . . . . . . . . . . . . . . . . . . . . 100,089 1,135,009
15,609,273
Construction & Engineering—1.0%Aegion Corp. (a) (b) . . . . . . . . . . . . . . . . . . . . . . . . . . . . . . 15,075 382,604Argan, Inc. (b) . . . . . . . . . . . . . . . . . . . . . . . . . . . . . . . . . 6,140 264,020Comfort Systems USA, Inc. . . . . . . . . . . . . . . . . . . . . . . . . . . 16,446 927,554Dycom Industries, Inc. (a) (b) . . . . . . . . . . . . . . . . . . . . . . . . 13,476 1,140,070EMCOR Group, Inc. . . . . . . . . . . . . . . . . . . . . . . . . . . . . . . . 25,321 1,901,860Granite Construction, Inc. (b) . . . . . . . . . . . . . . . . . . . . . . . . 19,793 904,540Great Lakes Dredge & Dock Corp. (a) . . . . . . . . . . . . . . . . . . 27,775 172,205KBR, Inc. . . . . . . . . . . . . . . . . . . . . . . . . . . . . . . . . . . . . . 62,037 1,310,842MasTec, Inc. (a) (b) . . . . . . . . . . . . . . . . . . . . . . . . . . . . . . 28,988 1,294,314MYR Group, Inc. (a) . . . . . . . . . . . . . . . . . . . . . . . . . . . . . . 6,874 224,367NV5 Global, Inc. (a) (b) . . . . . . . . . . . . . . . . . . . . . . . . . . . 3,969 344,112Primoris Services Corp. . . . . . . . . . . . . . . . . . . . . . . . . . . . . 17,845 442,913Sterling Construction Co., Inc. (a) . . . . . . . . . . . . . . . . . . . . . 13,246 189,683Tutor Perini Corp. (a) (b) . . . . . . . . . . . . . . . . . . . . . . . . . . . 19,192 360,810Willscot Corp. (a) (b) . . . . . . . . . . . . . . . . . . . . . . . . . . . . . 14,553 249,584
10,109,478
Construction Materials—0.1%Summit Materials, Inc. - Class A (a) (b) . . . . . . . . . . . . . . . . . 51,305 932,725U.S. Concrete, Inc. (a) (b) . . . . . . . . . . . . . . . . . . . . . . . . . . 7,217 330,899
1,263,624
Consumer Finance—0.7%Curo Group Holdings Corp. (a) . . . . . . . . . . . . . . . . . . . . . . . 5,722 172,976Encore Capital Group, Inc. (a) (b) . . . . . . . . . . . . . . . . . . . . . 11,469 411,164Enova International, Inc. (a) . . . . . . . . . . . . . . . . . . . . . . . . 15,391 443,261EZCORP, Inc. - Class A (a) . . . . . . . . . . . . . . . . . . . . . . . . . . 25,543 273,310FirstCash, Inc. . . . . . . . . . . . . . . . . . . . . . . . . . . . . . . . . . . 19,348 1,586,536Green Dot Corp. - Class A (a) . . . . . . . . . . . . . . . . . . . . . . . . 21,516 1,911,051LendingClub Corp. (a) . . . . . . . . . . . . . . . . . . . . . . . . . . . . . 142,833 554,192Nelnet, Inc. - Class A . . . . . . . . . . . . . . . . . . . . . . . . . . . . . . 9,125 521,676PRA Group, Inc. (a) (b) . . . . . . . . . . . . . . . . . . . . . . . . . . . . 19,388 697,968Regional Management Corp. (a) . . . . . . . . . . . . . . . . . . . . . . 5,496 158,450World Acceptance Corp. (a) . . . . . . . . . . . . . . . . . . . . . . . . . 2,848 325,697
7,056,281
Containers & Packaging—0.1%Greif, Inc. - Class A (b) . . . . . . . . . . . . . . . . . . . . . . . . . . . . 12,112 649,930Greif, Inc. - Class B . . . . . . . . . . . . . . . . . . . . . . . . . . . . . . . 2,277 131,269Myers Industries, Inc. . . . . . . . . . . . . . . . . . . . . . . . . . . . . . 14,676 341,217
1,122,416
Distributors—0.1%Core-Mark Holding Co., Inc. . . . . . . . . . . . . . . . . . . . . . . . . . 21,704 737,068
BHFTII-214
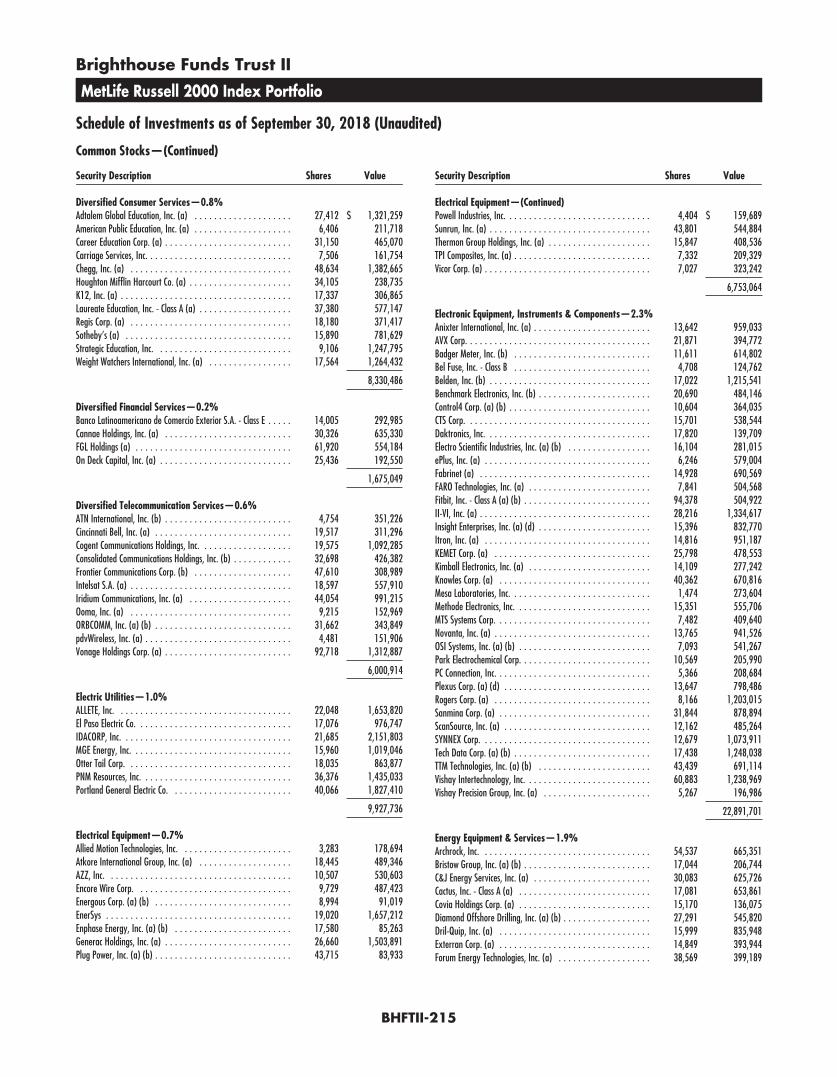
Brighthouse Funds Trust II
MetLife Russell 2000 Index Portfolio
Schedule of Investments as of September 30, 2018 (Unaudited)
Common Stocks—(Continued)
Security Description Shares Value
Diversified Consumer Services—0.8%Adtalem Global Education, Inc. (a) . . . . . . . . . . . . . . . . . . . . 27,412 $ 1,321,259American Public Education, Inc. (a) . . . . . . . . . . . . . . . . . . . . 6,406 211,718Career Education Corp. (a) . . . . . . . . . . . . . . . . . . . . . . . . . . 31,150 465,070Carriage Services, Inc. . . . . . . . . . . . . . . . . . . . . . . . . . . . . . 7,506 161,754Chegg, Inc. (a) . . . . . . . . . . . . . . . . . . . . . . . . . . . . . . . . . 48,634 1,382,665Houghton Mifflin Harcourt Co. (a) . . . . . . . . . . . . . . . . . . . . . 34,105 238,735K12, Inc. (a) . . . . . . . . . . . . . . . . . . . . . . . . . . . . . . . . . . . 17,337 306,865Laureate Education, Inc. - Class A (a) . . . . . . . . . . . . . . . . . . . 37,380 577,147Regis Corp. (a) . . . . . . . . . . . . . . . . . . . . . . . . . . . . . . . . . 18,180 371,417Sotheby’s (a) . . . . . . . . . . . . . . . . . . . . . . . . . . . . . . . . . . 15,890 781,629Strategic Education, Inc. . . . . . . . . . . . . . . . . . . . . . . . . . . . 9,106 1,247,795Weight Watchers International, Inc. (a) . . . . . . . . . . . . . . . . . 17,564 1,264,432
8,330,486
Diversified Financial Services—0.2%Banco Latinoamericano de Comercio Exterior S.A. - Class E . . . . . 14,005 292,985Cannae Holdings, Inc. (a) . . . . . . . . . . . . . . . . . . . . . . . . . . 30,326 635,330FGL Holdings (a) . . . . . . . . . . . . . . . . . . . . . . . . . . . . . . . . 61,920 554,184On Deck Capital, Inc. (a) . . . . . . . . . . . . . . . . . . . . . . . . . . . 25,436 192,550
1,675,049
Diversified Telecommunication Services—0.6%ATN International, Inc. (b) . . . . . . . . . . . . . . . . . . . . . . . . . . 4,754 351,226Cincinnati Bell, Inc. (a) . . . . . . . . . . . . . . . . . . . . . . . . . . . . 19,517 311,296Cogent Communications Holdings, Inc. . . . . . . . . . . . . . . . . . . 19,575 1,092,285Consolidated Communications Holdings, Inc. (b) . . . . . . . . . . . . 32,698 426,382Frontier Communications Corp. (b) . . . . . . . . . . . . . . . . . . . . 47,610 308,989Intelsat S.A. (a) . . . . . . . . . . . . . . . . . . . . . . . . . . . . . . . . . 18,597 557,910Iridium Communications, Inc. (a) . . . . . . . . . . . . . . . . . . . . . 44,054 991,215Ooma, Inc. (a) . . . . . . . . . . . . . . . . . . . . . . . . . . . . . . . . . 9,215 152,969ORBCOMM, Inc. (a) (b) . . . . . . . . . . . . . . . . . . . . . . . . . . . . 31,662 343,849pdvWireless, Inc. (a) . . . . . . . . . . . . . . . . . . . . . . . . . . . . . . 4,481 151,906Vonage Holdings Corp. (a) . . . . . . . . . . . . . . . . . . . . . . . . . . 92,718 1,312,887
6,000,914
Electric Utilities—1.0%ALLETE, Inc. . . . . . . . . . . . . . . . . . . . . . . . . . . . . . . . . . . . 22,048 1,653,820El Paso Electric Co. . . . . . . . . . . . . . . . . . . . . . . . . . . . . . . . 17,076 976,747IDACORP, Inc. . . . . . . . . . . . . . . . . . . . . . . . . . . . . . . . . . . 21,685 2,151,803MGE Energy, Inc. . . . . . . . . . . . . . . . . . . . . . . . . . . . . . . . . 15,960 1,019,046Otter Tail Corp. . . . . . . . . . . . . . . . . . . . . . . . . . . . . . . . . . 18,035 863,877PNM Resources, Inc. . . . . . . . . . . . . . . . . . . . . . . . . . . . . . . 36,376 1,435,033Portland General Electric Co. . . . . . . . . . . . . . . . . . . . . . . . . 40,066 1,827,410
9,927,736
Electrical Equipment—0.7%Allied Motion Technologies, Inc. . . . . . . . . . . . . . . . . . . . . . . 3,283 178,694Atkore International Group, Inc. (a) . . . . . . . . . . . . . . . . . . . 18,445 489,346AZZ, Inc. . . . . . . . . . . . . . . . . . . . . . . . . . . . . . . . . . . . . . 10,507 530,603Encore Wire Corp. . . . . . . . . . . . . . . . . . . . . . . . . . . . . . . . 9,729 487,423Energous Corp. (a) (b) . . . . . . . . . . . . . . . . . . . . . . . . . . . . 8,994 91,019EnerSys . . . . . . . . . . . . . . . . . . . . . . . . . . . . . . . . . . . . . . 19,020 1,657,212Enphase Energy, Inc. (a) (b) . . . . . . . . . . . . . . . . . . . . . . . . 17,580 85,263Generac Holdings, Inc. (a) . . . . . . . . . . . . . . . . . . . . . . . . . . 26,660 1,503,891Plug Power, Inc. (a) (b) . . . . . . . . . . . . . . . . . . . . . . . . . . . . 43,715 83,933
Security Description Shares Value
Electrical Equipment—(Continued)Powell Industries, Inc. . . . . . . . . . . . . . . . . . . . . . . . . . . . . . 4,404 $ 159,689Sunrun, Inc. (a) . . . . . . . . . . . . . . . . . . . . . . . . . . . . . . . . . 43,801 544,884Thermon Group Holdings, Inc. (a) . . . . . . . . . . . . . . . . . . . . . 15,847 408,536TPI Composites, Inc. (a) . . . . . . . . . . . . . . . . . . . . . . . . . . . . 7,332 209,329Vicor Corp. (a) . . . . . . . . . . . . . . . . . . . . . . . . . . . . . . . . . . 7,027 323,242
6,753,064
Electronic Equipment, Instruments & Components—2.3%Anixter International, Inc. (a) . . . . . . . . . . . . . . . . . . . . . . . . 13,642 959,033AVX Corp. . . . . . . . . . . . . . . . . . . . . . . . . . . . . . . . . . . . . . 21,871 394,772Badger Meter, Inc. (b) . . . . . . . . . . . . . . . . . . . . . . . . . . . . 11,611 614,802Bel Fuse, Inc. - Class B . . . . . . . . . . . . . . . . . . . . . . . . . . . . 4,708 124,762Belden, Inc. (b) . . . . . . . . . . . . . . . . . . . . . . . . . . . . . . . . . 17,022 1,215,541Benchmark Electronics, Inc. (b) . . . . . . . . . . . . . . . . . . . . . . . 20,690 484,146Control4 Corp. (a) (b) . . . . . . . . . . . . . . . . . . . . . . . . . . . . . 10,604 364,035CTS Corp. . . . . . . . . . . . . . . . . . . . . . . . . . . . . . . . . . . . . . 15,701 538,544Daktronics, Inc. . . . . . . . . . . . . . . . . . . . . . . . . . . . . . . . . . 17,820 139,709Electro Scientific Industries, Inc. (a) (b) . . . . . . . . . . . . . . . . . 16,104 281,015ePlus, Inc. (a) . . . . . . . . . . . . . . . . . . . . . . . . . . . . . . . . . . 6,246 579,004Fabrinet (a) . . . . . . . . . . . . . . . . . . . . . . . . . . . . . . . . . . . 14,928 690,569FARO Technologies, Inc. (a) . . . . . . . . . . . . . . . . . . . . . . . . . 7,841 504,568Fitbit, Inc. - Class A (a) (b) . . . . . . . . . . . . . . . . . . . . . . . . . . 94,378 504,922II-VI, Inc. (a) . . . . . . . . . . . . . . . . . . . . . . . . . . . . . . . . . . . 28,216 1,334,617Insight Enterprises, Inc. (a) (d) . . . . . . . . . . . . . . . . . . . . . . . 15,396 832,770Itron, Inc. (a) . . . . . . . . . . . . . . . . . . . . . . . . . . . . . . . . . . 14,816 951,187KEMET Corp. (a) . . . . . . . . . . . . . . . . . . . . . . . . . . . . . . . . 25,798 478,553Kimball Electronics, Inc. (a) . . . . . . . . . . . . . . . . . . . . . . . . . 14,109 277,242Knowles Corp. (a) . . . . . . . . . . . . . . . . . . . . . . . . . . . . . . . 40,362 670,816Mesa Laboratories, Inc. . . . . . . . . . . . . . . . . . . . . . . . . . . . . 1,474 273,604Methode Electronics, Inc. . . . . . . . . . . . . . . . . . . . . . . . . . . . 15,351 555,706MTS Systems Corp. . . . . . . . . . . . . . . . . . . . . . . . . . . . . . . . 7,482 409,640Novanta, Inc. (a) . . . . . . . . . . . . . . . . . . . . . . . . . . . . . . . . 13,765 941,526OSI Systems, Inc. (a) (b) . . . . . . . . . . . . . . . . . . . . . . . . . . . 7,093 541,267Park Electrochemical Corp. . . . . . . . . . . . . . . . . . . . . . . . . . . 10,569 205,990PC Connection, Inc. . . . . . . . . . . . . . . . . . . . . . . . . . . . . . . . 5,366 208,684Plexus Corp. (a) (d) . . . . . . . . . . . . . . . . . . . . . . . . . . . . . . 13,647 798,486Rogers Corp. (a) . . . . . . . . . . . . . . . . . . . . . . . . . . . . . . . . 8,166 1,203,015Sanmina Corp. (a) . . . . . . . . . . . . . . . . . . . . . . . . . . . . . . . 31,844 878,894ScanSource, Inc. (a) . . . . . . . . . . . . . . . . . . . . . . . . . . . . . . 12,162 485,264SYNNEX Corp. . . . . . . . . . . . . . . . . . . . . . . . . . . . . . . . . . . 12,679 1,073,911Tech Data Corp. (a) (b) . . . . . . . . . . . . . . . . . . . . . . . . . . . . 17,438 1,248,038TTM Technologies, Inc. (a) (b) . . . . . . . . . . . . . . . . . . . . . . . 43,439 691,114Vishay Intertechnology, Inc. . . . . . . . . . . . . . . . . . . . . . . . . . 60,883 1,238,969Vishay Precision Group, Inc. (a) . . . . . . . . . . . . . . . . . . . . . . 5,267 196,986
22,891,701
Energy Equipment & Services—1.9%Archrock, Inc. . . . . . . . . . . . . . . . . . . . . . . . . . . . . . . . . . . 54,537 665,351Bristow Group, Inc. (a) (b) . . . . . . . . . . . . . . . . . . . . . . . . . . 17,044 206,744C&J Energy Services, Inc. (a) . . . . . . . . . . . . . . . . . . . . . . . . 30,083 625,726Cactus, Inc. - Class A (a) . . . . . . . . . . . . . . . . . . . . . . . . . . . 17,081 653,861Covia Holdings Corp. (a) . . . . . . . . . . . . . . . . . . . . . . . . . . . 15,170 136,075Diamond Offshore Drilling, Inc. (a) (b) . . . . . . . . . . . . . . . . . . 27,291 545,820Dril-Quip, Inc. (a) . . . . . . . . . . . . . . . . . . . . . . . . . . . . . . . 15,999 835,948Exterran Corp. (a) . . . . . . . . . . . . . . . . . . . . . . . . . . . . . . . 14,849 393,944Forum Energy Technologies, Inc. (a) . . . . . . . . . . . . . . . . . . . 38,569 399,189
BHFTII-215

Brighthouse Funds Trust II
MetLife Russell 2000 Index Portfolio
Schedule of Investments as of September 30, 2018 (Unaudited)
Common Stocks—(Continued)
Security Description Shares Value
Energy Equipment & Services—(Continued)Frank’s International NV . . . . . . . . . . . . . . . . . . . . . . . . . . . 36,054 $ 312,949FTS International, Inc. (a) . . . . . . . . . . . . . . . . . . . . . . . . . . 16,194 190,927Helix Energy Solutions Group, Inc. (a) (b) . . . . . . . . . . . . . . . . 67,569 667,582Keane Group, Inc. (a) . . . . . . . . . . . . . . . . . . . . . . . . . . . . . 25,842 319,665KLX Energy Services Holdings, Inc. (a) . . . . . . . . . . . . . . . . . . 9,171 293,564Liberty Oilfield Services, Inc. - Class A (b) . . . . . . . . . . . . . . . . 20,373 439,446Mammoth Energy Services, Inc. . . . . . . . . . . . . . . . . . . . . . . 6,277 182,661Matrix Service Co. (a) . . . . . . . . . . . . . . . . . . . . . . . . . . . . . 14,196 349,931McDermott International, Inc. (a) . . . . . . . . . . . . . . . . . . . . . 78,718 1,450,773Natural Gas Services Group, Inc. (a) . . . . . . . . . . . . . . . . . . . 6,643 140,167Newpark Resources, Inc. (a) . . . . . . . . . . . . . . . . . . . . . . . . . 41,815 432,785Nine Energy Service, Inc. (a) . . . . . . . . . . . . . . . . . . . . . . . . 7,202 220,237Noble Corp. plc (a) (b) . . . . . . . . . . . . . . . . . . . . . . . . . . . . 121,320 852,880Ocean Rig UDW, Inc. - Class A (a) . . . . . . . . . . . . . . . . . . . . . 25,463 881,529Oceaneering International, Inc. (b) . . . . . . . . . . . . . . . . . . . . 45,596 1,258,450Oil States International, Inc. (a) . . . . . . . . . . . . . . . . . . . . . . 27,605 916,486Pioneer Energy Services Corp. (a) . . . . . . . . . . . . . . . . . . . . . 40,379 119,118ProPetro Holding Corp. (a) (b) . . . . . . . . . . . . . . . . . . . . . . . 33,439 551,409RigNet, Inc. (a) . . . . . . . . . . . . . . . . . . . . . . . . . . . . . . . . . 7,390 150,386Rowan Cos. plc - Class A (a) . . . . . . . . . . . . . . . . . . . . . . . . . 56,769 1,068,960SEACOR Holdings, Inc. (a) . . . . . . . . . . . . . . . . . . . . . . . . . . 7,977 394,143SEACOR Marine Holdings, Inc. (a) . . . . . . . . . . . . . . . . . . . . . 8,966 202,901Select Energy Services, Inc. - Class A (a) . . . . . . . . . . . . . . . . . 21,969 260,113Solaris Oilfield Infrastructure, Inc. - Class A (a) (b) . . . . . . . . . . 13,032 246,174Superior Energy Services, Inc. (a) . . . . . . . . . . . . . . . . . . . . . 73,574 716,611TETRA Technologies, Inc. (a) . . . . . . . . . . . . . . . . . . . . . . . . . 58,562 264,115Tidewater, Inc. (a) . . . . . . . . . . . . . . . . . . . . . . . . . . . . . . . 11,300 352,447U.S. Silica Holdings, Inc. (b) . . . . . . . . . . . . . . . . . . . . . . . . . 34,136 642,781Unit Corp. (a) . . . . . . . . . . . . . . . . . . . . . . . . . . . . . . . . . . 24,655 642,509
18,984,357
Entertainment—0.6%AMC Entertainment Holdings, Inc. - Class A (b) . . . . . . . . . . . . . 25,675 526,337Eros International plc (a) . . . . . . . . . . . . . . . . . . . . . . . . . . . 13,360 160,988Glu Mobile, Inc. (a) . . . . . . . . . . . . . . . . . . . . . . . . . . . . . . 50,565 376,709IMAX Corp. (a) . . . . . . . . . . . . . . . . . . . . . . . . . . . . . . . . . 23,016 593,813Liberty Braves Group - Class A (a) . . . . . . . . . . . . . . . . . . . . . 5,080 138,582Liberty Braves Group - Class C (a) (b) . . . . . . . . . . . . . . . . . . 16,010 436,273Marcus Corp. (The) . . . . . . . . . . . . . . . . . . . . . . . . . . . . . . . 9,550 401,578Pandora Media, Inc. (a) (b) . . . . . . . . . . . . . . . . . . . . . . . . . 113,159 1,076,142Reading International, Inc. - Class A (a) . . . . . . . . . . . . . . . . . 8,504 134,363Rosetta Stone, Inc. (a) . . . . . . . . . . . . . . . . . . . . . . . . . . . . 9,843 195,777World Wrestling Entertainment, Inc. - Class A . . . . . . . . . . . . . . 19,301 1,866,986
5,907,548
Equity Real Estate Investment Trusts—6.3%Acadia Realty Trust (b) . . . . . . . . . . . . . . . . . . . . . . . . . . . . 34,500 967,035Agree Realty Corp. . . . . . . . . . . . . . . . . . . . . . . . . . . . . . . . 13,037 692,525Alexander & Baldwin, Inc. . . . . . . . . . . . . . . . . . . . . . . . . . . 29,617 672,010Alexander’s, Inc. . . . . . . . . . . . . . . . . . . . . . . . . . . . . . . . . 1,029 353,256American Assets Trust, Inc. . . . . . . . . . . . . . . . . . . . . . . . . . . 16,370 610,437Americold Realty Trust (b) . . . . . . . . . . . . . . . . . . . . . . . . . . 38,305 958,391Armada Hoffler Properties, Inc. . . . . . . . . . . . . . . . . . . . . . . 19,662 297,093Ashford Hospitality Trust, Inc. . . . . . . . . . . . . . . . . . . . . . . . . 36,619 233,995Braemar Hotels & Resorts, Inc. . . . . . . . . . . . . . . . . . . . . . . . 14,521 170,912CareTrust REIT, Inc. . . . . . . . . . . . . . . . . . . . . . . . . . . . . . . 34,103 603,964
Security Description Shares Value
Equity Real Estate Investment Trusts—(Continued)CatchMark Timber Trust, Inc. - Class A . . . . . . . . . . . . . . . . . . 23,620 $ 269,977CBL & Associates Properties, Inc. (b) . . . . . . . . . . . . . . . . . . . 78,126 311,723Cedar Realty Trust, Inc. . . . . . . . . . . . . . . . . . . . . . . . . . . . . 37,954 176,866Chatham Lodging Trust . . . . . . . . . . . . . . . . . . . . . . . . . . . . 19,109 399,187Chesapeake Lodging Trust . . . . . . . . . . . . . . . . . . . . . . . . . . 24,761 794,085City Office REIT, Inc. . . . . . . . . . . . . . . . . . . . . . . . . . . . . . . 14,820 187,028Community Healthcare Trust, Inc. . . . . . . . . . . . . . . . . . . . . . 6,825 211,438CoreCivic, Inc. . . . . . . . . . . . . . . . . . . . . . . . . . . . . . . . . . . 54,476 1,325,401CorEnergy Infrastructure Trust, Inc. (b) . . . . . . . . . . . . . . . . . 5,980 224,728Corepoint Lodging, Inc. . . . . . . . . . . . . . . . . . . . . . . . . . . . . 18,376 357,413Cousins Properties, Inc. . . . . . . . . . . . . . . . . . . . . . . . . . . . . 183,442 1,630,799DiamondRock Hospitality Co. . . . . . . . . . . . . . . . . . . . . . . . . 92,371 1,077,970Easterly Government Properties, Inc. (b) . . . . . . . . . . . . . . . . 27,307 528,937EastGroup Properties, Inc. . . . . . . . . . . . . . . . . . . . . . . . . . . 15,737 1,504,772First Industrial Realty Trust, Inc. . . . . . . . . . . . . . . . . . . . . . . 53,382 1,676,195Four Corners Property Trust, Inc. . . . . . . . . . . . . . . . . . . . . . . 29,818 766,024Franklin Street Properties Corp. . . . . . . . . . . . . . . . . . . . . . . 48,177 384,934Front Yard Residential Corp. . . . . . . . . . . . . . . . . . . . . . . . . . 23,934 259,684Geo Group, Inc. (The) . . . . . . . . . . . . . . . . . . . . . . . . . . . . . 53,292 1,340,827Getty Realty Corp. . . . . . . . . . . . . . . . . . . . . . . . . . . . . . . . 13,449 384,103Gladstone Commercial Corp. . . . . . . . . . . . . . . . . . . . . . . . . 13,243 253,603Global Net Lease, Inc. . . . . . . . . . . . . . . . . . . . . . . . . . . . . . 31,987 666,929Government Properties Income Trust . . . . . . . . . . . . . . . . . . . 44,872 506,605Gramercy Property Trust . . . . . . . . . . . . . . . . . . . . . . . . . . . 68,529 1,880,436Healthcare Realty Trust, Inc. (b) . . . . . . . . . . . . . . . . . . . . . . 53,035 1,551,804Hersha Hospitality Trust . . . . . . . . . . . . . . . . . . . . . . . . . . . 16,071 364,330Independence Realty Trust, Inc. . . . . . . . . . . . . . . . . . . . . . . 39,339 414,240Industrial Logistics Properties Trust (b) . . . . . . . . . . . . . . . . . . 9,163 210,841InfraREIT, Inc. . . . . . . . . . . . . . . . . . . . . . . . . . . . . . . . . . . 19,986 422,704Innovative Industrial Properties, Inc. (b) . . . . . . . . . . . . . . . . . 3,223 155,477Investors Real Estate Trust . . . . . . . . . . . . . . . . . . . . . . . . . . 55,650 332,787iStar, Inc. . . . . . . . . . . . . . . . . . . . . . . . . . . . . . . . . . . . . . 31,393 350,660Jernigan Capital, Inc. . . . . . . . . . . . . . . . . . . . . . . . . . . . . . 8,813 170,003Kite Realty Group Trust . . . . . . . . . . . . . . . . . . . . . . . . . . . . 38,990 649,183LaSalle Hotel Properties . . . . . . . . . . . . . . . . . . . . . . . . . . . 49,981 1,728,843Lexington Realty Trust . . . . . . . . . . . . . . . . . . . . . . . . . . . . 86,092 714,564LTC Properties, Inc. . . . . . . . . . . . . . . . . . . . . . . . . . . . . . . . 17,896 789,393Mack-Cali Realty Corp. . . . . . . . . . . . . . . . . . . . . . . . . . . . . 38,134 810,729MedEquities Realty Trust, Inc. . . . . . . . . . . . . . . . . . . . . . . . . 10,709 104,091Monmouth Real Estate Investment Corp. . . . . . . . . . . . . . . . . . 32,365 541,143National Health Investors, Inc. . . . . . . . . . . . . . . . . . . . . . . . 18,042 1,363,795National Storage Affiliates Trust . . . . . . . . . . . . . . . . . . . . . . 25,366 645,311New Senior Investment Group, Inc. . . . . . . . . . . . . . . . . . . . . 16,579 97,816NexPoint Residential Trust, Inc. . . . . . . . . . . . . . . . . . . . . . . . 9,154 303,913NorthStar Realty Europe Corp. . . . . . . . . . . . . . . . . . . . . . . . 22,208 314,465One Liberty Properties, Inc. . . . . . . . . . . . . . . . . . . . . . . . . . 6,290 174,736Pebblebrook Hotel Trust (b) . . . . . . . . . . . . . . . . . . . . . . . . . 30,891 1,123,506Pennsylvania Real Estate Investment Trust (b) . . . . . . . . . . . . . 32,570 308,112Physicians Realty Trust . . . . . . . . . . . . . . . . . . . . . . . . . . . . 82,152 1,385,083Piedmont Office Realty Trust, Inc. - Class A . . . . . . . . . . . . . . . 58,830 1,113,652PotlatchDeltic Corp. . . . . . . . . . . . . . . . . . . . . . . . . . . . . . . 27,255 1,116,092Preferred Apartment Communities, Inc. - Class A . . . . . . . . . . . 18,839 331,190PS Business Parks, Inc. . . . . . . . . . . . . . . . . . . . . . . . . . . . . 8,900 1,131,101QTS Realty Trust, Inc. - Class A . . . . . . . . . . . . . . . . . . . . . . . 22,822 973,815Ramco-Gershenson Properties Trust . . . . . . . . . . . . . . . . . . . . 37,976 516,474Retail Opportunity Investments Corp. (b) . . . . . . . . . . . . . . . . 52,344 977,262Rexford Industrial Realty, Inc. . . . . . . . . . . . . . . . . . . . . . . . 40,096 1,281,468
BHFTII-216
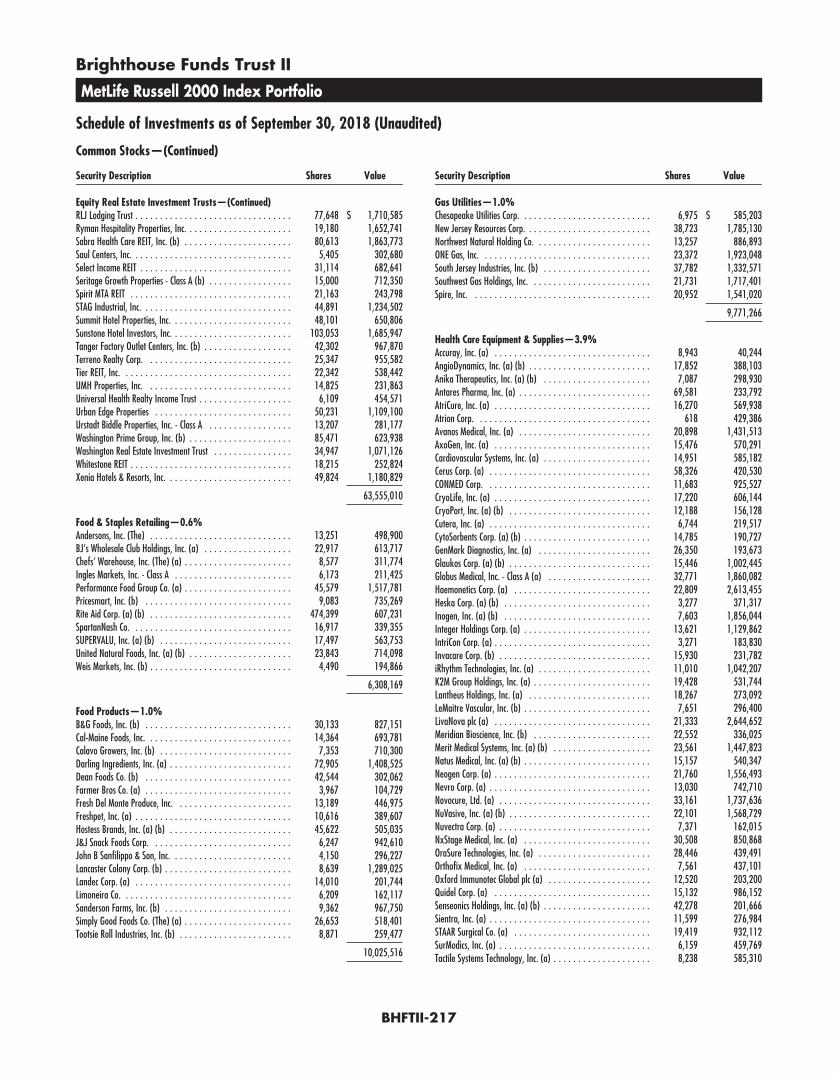
Brighthouse Funds Trust II
MetLife Russell 2000 Index Portfolio
Schedule of Investments as of September 30, 2018 (Unaudited)
Common Stocks—(Continued)
Security Description Shares Value
Equity Real Estate Investment Trusts—(Continued)RLJ Lodging Trust . . . . . . . . . . . . . . . . . . . . . . . . . . . . . . . . 77,648 $ 1,710,585Ryman Hospitality Properties, Inc. . . . . . . . . . . . . . . . . . . . . . 19,180 1,652,741Sabra Health Care REIT, Inc. (b) . . . . . . . . . . . . . . . . . . . . . . 80,613 1,863,773Saul Centers, Inc. . . . . . . . . . . . . . . . . . . . . . . . . . . . . . . . . 5,405 302,680Select Income REIT . . . . . . . . . . . . . . . . . . . . . . . . . . . . . . . 31,114 682,641Seritage Growth Properties - Class A (b) . . . . . . . . . . . . . . . . . 15,000 712,350Spirit MTA REIT . . . . . . . . . . . . . . . . . . . . . . . . . . . . . . . . . 21,163 243,798STAG Industrial, Inc. . . . . . . . . . . . . . . . . . . . . . . . . . . . . . . 44,891 1,234,502Summit Hotel Properties, Inc. . . . . . . . . . . . . . . . . . . . . . . . . 48,101 650,806Sunstone Hotel Investors, Inc. . . . . . . . . . . . . . . . . . . . . . . . . 103,053 1,685,947Tanger Factory Outlet Centers, Inc. (b) . . . . . . . . . . . . . . . . . . 42,302 967,870Terreno Realty Corp. . . . . . . . . . . . . . . . . . . . . . . . . . . . . . 25,347 955,582Tier REIT, Inc. . . . . . . . . . . . . . . . . . . . . . . . . . . . . . . . . . . 22,342 538,442UMH Properties, Inc. . . . . . . . . . . . . . . . . . . . . . . . . . . . . . 14,825 231,863Universal Health Realty Income Trust . . . . . . . . . . . . . . . . . . . 6,109 454,571Urban Edge Properties . . . . . . . . . . . . . . . . . . . . . . . . . . . . 50,231 1,109,100Urstadt Biddle Properties, Inc. - Class A . . . . . . . . . . . . . . . . . 13,207 281,177Washington Prime Group, Inc. (b) . . . . . . . . . . . . . . . . . . . . . 85,471 623,938Washington Real Estate Investment Trust . . . . . . . . . . . . . . . . 34,947 1,071,126Whitestone REIT . . . . . . . . . . . . . . . . . . . . . . . . . . . . . . . . . 18,215 252,824Xenia Hotels & Resorts, Inc. . . . . . . . . . . . . . . . . . . . . . . . . . 49,824 1,180,829
63,555,010
Food & Staples Retailing—0.6%Andersons, Inc. (The) . . . . . . . . . . . . . . . . . . . . . . . . . . . . . 13,251 498,900BJ’s Wholesale Club Holdings, Inc. (a) . . . . . . . . . . . . . . . . . . 22,917 613,717Chefs’ Warehouse, Inc. (The) (a) . . . . . . . . . . . . . . . . . . . . . . 8,577 311,774Ingles Markets, Inc. - Class A . . . . . . . . . . . . . . . . . . . . . . . . 6,173 211,425Performance Food Group Co. (a) . . . . . . . . . . . . . . . . . . . . . . 45,579 1,517,781Pricesmart, Inc. (b) . . . . . . . . . . . . . . . . . . . . . . . . . . . . . . 9,083 735,269Rite Aid Corp. (a) (b) . . . . . . . . . . . . . . . . . . . . . . . . . . . . . 474,399 607,231SpartanNash Co. . . . . . . . . . . . . . . . . . . . . . . . . . . . . . . . . 16,917 339,355SUPERVALU, Inc. (a) (b) . . . . . . . . . . . . . . . . . . . . . . . . . . . 17,497 563,753United Natural Foods, Inc. (a) (b) . . . . . . . . . . . . . . . . . . . . . 23,843 714,098Weis Markets, Inc. (b) . . . . . . . . . . . . . . . . . . . . . . . . . . . . . 4,490 194,866
6,308,169
Food Products—1.0%B&G Foods, Inc. (b) . . . . . . . . . . . . . . . . . . . . . . . . . . . . . . 30,133 827,151Cal-Maine Foods, Inc. . . . . . . . . . . . . . . . . . . . . . . . . . . . . . 14,364 693,781Calavo Growers, Inc. (b) . . . . . . . . . . . . . . . . . . . . . . . . . . . 7,353 710,300Darling Ingredients, Inc. (a) . . . . . . . . . . . . . . . . . . . . . . . . . 72,905 1,408,525Dean Foods Co. (b) . . . . . . . . . . . . . . . . . . . . . . . . . . . . . . 42,544 302,062Farmer Bros Co. (a) . . . . . . . . . . . . . . . . . . . . . . . . . . . . . . 3,967 104,729Fresh Del Monte Produce, Inc. . . . . . . . . . . . . . . . . . . . . . . . 13,189 446,975Freshpet, Inc. (a) . . . . . . . . . . . . . . . . . . . . . . . . . . . . . . . . 10,616 389,607Hostess Brands, Inc. (a) (b) . . . . . . . . . . . . . . . . . . . . . . . . . 45,622 505,035J&J Snack Foods Corp. . . . . . . . . . . . . . . . . . . . . . . . . . . . . 6,247 942,610John B Sanfilippo & Son, Inc. . . . . . . . . . . . . . . . . . . . . . . . . 4,150 296,227Lancaster Colony Corp. (b) . . . . . . . . . . . . . . . . . . . . . . . . . . 8,639 1,289,025Landec Corp. (a) . . . . . . . . . . . . . . . . . . . . . . . . . . . . . . . . 14,010 201,744Limoneira Co. . . . . . . . . . . . . . . . . . . . . . . . . . . . . . . . . . . 6,209 162,117Sanderson Farms, Inc. (b) . . . . . . . . . . . . . . . . . . . . . . . . . . 9,362 967,750Simply Good Foods Co. (The) (a) . . . . . . . . . . . . . . . . . . . . . . 26,653 518,401Tootsie Roll Industries, Inc. (b) . . . . . . . . . . . . . . . . . . . . . . . 8,871 259,477
10,025,516
Security Description Shares Value
Gas Utilities—1.0%Chesapeake Utilities Corp. . . . . . . . . . . . . . . . . . . . . . . . . . . 6,975 $ 585,203New Jersey Resources Corp. . . . . . . . . . . . . . . . . . . . . . . . . . 38,723 1,785,130Northwest Natural Holding Co. . . . . . . . . . . . . . . . . . . . . . . . 13,257 886,893ONE Gas, Inc. . . . . . . . . . . . . . . . . . . . . . . . . . . . . . . . . . . 23,372 1,923,048South Jersey Industries, Inc. (b) . . . . . . . . . . . . . . . . . . . . . . 37,782 1,332,571Southwest Gas Holdings, Inc. . . . . . . . . . . . . . . . . . . . . . . . . 21,731 1,717,401Spire, Inc. . . . . . . . . . . . . . . . . . . . . . . . . . . . . . . . . . . . . 20,952 1,541,020
9,771,266
Health Care Equipment & Supplies—3.9%Accuray, Inc. (a) . . . . . . . . . . . . . . . . . . . . . . . . . . . . . . . . 8,943 40,244AngioDynamics, Inc. (a) (b) . . . . . . . . . . . . . . . . . . . . . . . . . 17,852 388,103Anika Therapeutics, Inc. (a) (b) . . . . . . . . . . . . . . . . . . . . . . 7,087 298,930Antares Pharma, Inc. (a) . . . . . . . . . . . . . . . . . . . . . . . . . . . 69,581 233,792AtriCure, Inc. (a) . . . . . . . . . . . . . . . . . . . . . . . . . . . . . . . . 16,270 569,938Atrion Corp. . . . . . . . . . . . . . . . . . . . . . . . . . . . . . . . . . . . 618 429,386Avanos Medical, Inc. (a) . . . . . . . . . . . . . . . . . . . . . . . . . . . 20,898 1,431,513AxoGen, Inc. (a) . . . . . . . . . . . . . . . . . . . . . . . . . . . . . . . . 15,476 570,291Cardiovascular Systems, Inc. (a) . . . . . . . . . . . . . . . . . . . . . . 14,951 585,182Cerus Corp. (a) . . . . . . . . . . . . . . . . . . . . . . . . . . . . . . . . . 58,326 420,530CONMED Corp. . . . . . . . . . . . . . . . . . . . . . . . . . . . . . . . . . 11,683 925,527CryoLife, Inc. (a) . . . . . . . . . . . . . . . . . . . . . . . . . . . . . . . . 17,220 606,144CryoPort, Inc. (a) (b) . . . . . . . . . . . . . . . . . . . . . . . . . . . . . 12,188 156,128Cutera, Inc. (a) . . . . . . . . . . . . . . . . . . . . . . . . . . . . . . . . . 6,744 219,517CytoSorbents Corp. (a) (b) . . . . . . . . . . . . . . . . . . . . . . . . . . 14,785 190,727GenMark Diagnostics, Inc. (a) . . . . . . . . . . . . . . . . . . . . . . . 26,350 193,673Glaukos Corp. (a) (b) . . . . . . . . . . . . . . . . . . . . . . . . . . . . . 15,446 1,002,445Globus Medical, Inc. - Class A (a) . . . . . . . . . . . . . . . . . . . . . 32,771 1,860,082Haemonetics Corp. (a) . . . . . . . . . . . . . . . . . . . . . . . . . . . . 22,809 2,613,455Heska Corp. (a) (b) . . . . . . . . . . . . . . . . . . . . . . . . . . . . . . 3,277 371,317Inogen, Inc. (a) (b) . . . . . . . . . . . . . . . . . . . . . . . . . . . . . . 7,603 1,856,044Integer Holdings Corp. (a) . . . . . . . . . . . . . . . . . . . . . . . . . . 13,621 1,129,862IntriCon Corp. (a) . . . . . . . . . . . . . . . . . . . . . . . . . . . . . . . . 3,271 183,830Invacare Corp. (b) . . . . . . . . . . . . . . . . . . . . . . . . . . . . . . . 15,930 231,782iRhythm Technologies, Inc. (a) . . . . . . . . . . . . . . . . . . . . . . . 11,010 1,042,207K2M Group Holdings, Inc. (a) . . . . . . . . . . . . . . . . . . . . . . . . 19,428 531,744Lantheus Holdings, Inc. (a) . . . . . . . . . . . . . . . . . . . . . . . . . 18,267 273,092LeMaitre Vascular, Inc. (b) . . . . . . . . . . . . . . . . . . . . . . . . . . 7,651 296,400LivaNova plc (a) . . . . . . . . . . . . . . . . . . . . . . . . . . . . . . . . 21,333 2,644,652Meridian Bioscience, Inc. (b) . . . . . . . . . . . . . . . . . . . . . . . . 22,552 336,025Merit Medical Systems, Inc. (a) (b) . . . . . . . . . . . . . . . . . . . . 23,561 1,447,823Natus Medical, Inc. (a) (b) . . . . . . . . . . . . . . . . . . . . . . . . . . 15,157 540,347Neogen Corp. (a) . . . . . . . . . . . . . . . . . . . . . . . . . . . . . . . . 21,760 1,556,493Nevro Corp. (a) . . . . . . . . . . . . . . . . . . . . . . . . . . . . . . . . . 13,030 742,710Novocure, Ltd. (a) . . . . . . . . . . . . . . . . . . . . . . . . . . . . . . . 33,161 1,737,636NuVasive, Inc. (a) (b) . . . . . . . . . . . . . . . . . . . . . . . . . . . . . 22,101 1,568,729Nuvectra Corp. (a) . . . . . . . . . . . . . . . . . . . . . . . . . . . . . . . 7,371 162,015NxStage Medical, Inc. (a) . . . . . . . . . . . . . . . . . . . . . . . . . . 30,508 850,868OraSure Technologies, Inc. (a) . . . . . . . . . . . . . . . . . . . . . . . 28,446 439,491Orthofix Medical, Inc. (a) . . . . . . . . . . . . . . . . . . . . . . . . . . 7,561 437,101Oxford Immunotec Global plc (a) . . . . . . . . . . . . . . . . . . . . . 12,520 203,200Quidel Corp. (a) . . . . . . . . . . . . . . . . . . . . . . . . . . . . . . . . 15,132 986,152Senseonics Holdings, Inc. (a) (b) . . . . . . . . . . . . . . . . . . . . . . 42,278 201,666Sientra, Inc. (a) . . . . . . . . . . . . . . . . . . . . . . . . . . . . . . . . . 11,599 276,984STAAR Surgical Co. (a) . . . . . . . . . . . . . . . . . . . . . . . . . . . . 19,419 932,112SurModics, Inc. (a) . . . . . . . . . . . . . . . . . . . . . . . . . . . . . . . 6,159 459,769Tactile Systems Technology, Inc. (a) . . . . . . . . . . . . . . . . . . . . 8,238 585,310
BHFTII-217
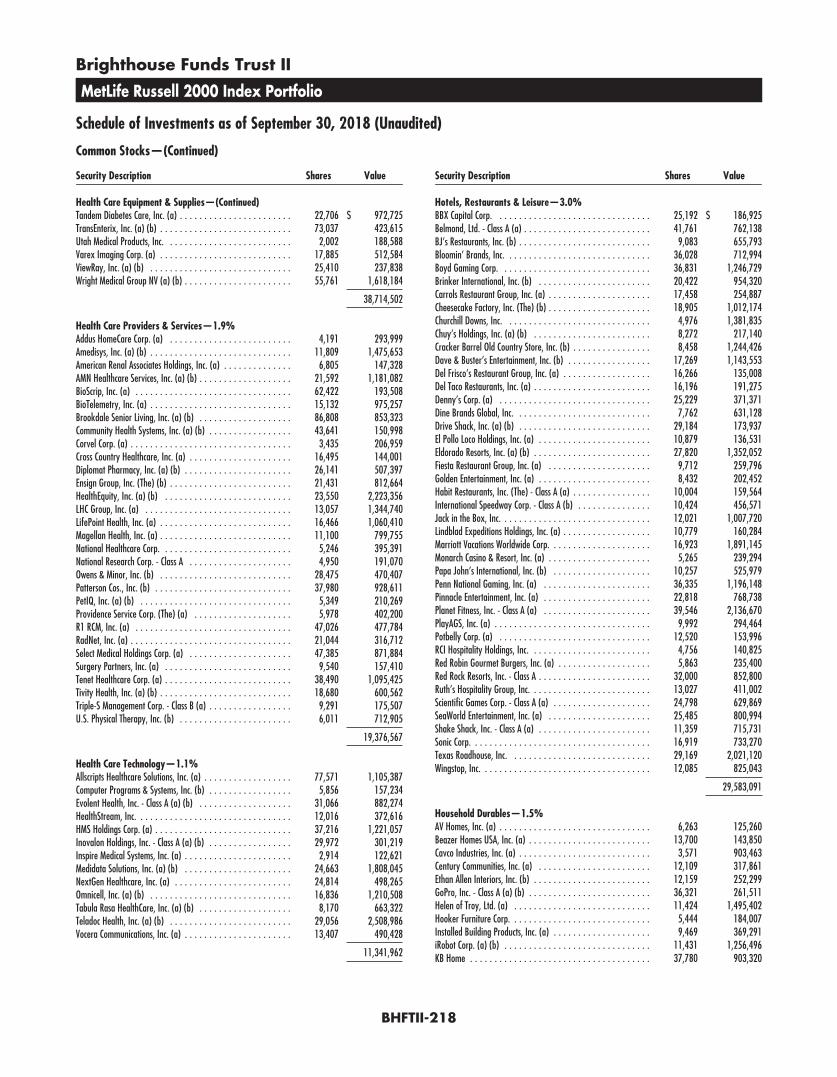
Brighthouse Funds Trust II
MetLife Russell 2000 Index Portfolio
Schedule of Investments as of September 30, 2018 (Unaudited)
Common Stocks—(Continued)
Security Description Shares Value
Health Care Equipment & Supplies—(Continued)Tandem Diabetes Care, Inc. (a) . . . . . . . . . . . . . . . . . . . . . . . 22,706 $ 972,725TransEnterix, Inc. (a) (b) . . . . . . . . . . . . . . . . . . . . . . . . . . . 73,037 423,615Utah Medical Products, Inc. . . . . . . . . . . . . . . . . . . . . . . . . . 2,002 188,588Varex Imaging Corp. (a) . . . . . . . . . . . . . . . . . . . . . . . . . . . 17,885 512,584ViewRay, Inc. (a) (b) . . . . . . . . . . . . . . . . . . . . . . . . . . . . . 25,410 237,838Wright Medical Group NV (a) (b) . . . . . . . . . . . . . . . . . . . . . . 55,761 1,618,184
38,714,502
Health Care Providers & Services—1.9%Addus HomeCare Corp. (a) . . . . . . . . . . . . . . . . . . . . . . . . . 4,191 293,999Amedisys, Inc. (a) (b) . . . . . . . . . . . . . . . . . . . . . . . . . . . . . 11,809 1,475,653American Renal Associates Holdings, Inc. (a) . . . . . . . . . . . . . . 6,805 147,328AMN Healthcare Services, Inc. (a) (b) . . . . . . . . . . . . . . . . . . . 21,592 1,181,082BioScrip, Inc. (a) . . . . . . . . . . . . . . . . . . . . . . . . . . . . . . . . 62,422 193,508BioTelemetry, Inc. (a) . . . . . . . . . . . . . . . . . . . . . . . . . . . . . 15,132 975,257Brookdale Senior Living, Inc. (a) (b) . . . . . . . . . . . . . . . . . . . 86,808 853,323Community Health Systems, Inc. (a) (b) . . . . . . . . . . . . . . . . . 43,641 150,998Corvel Corp. (a) . . . . . . . . . . . . . . . . . . . . . . . . . . . . . . . . . 3,435 206,959Cross Country Healthcare, Inc. (a) . . . . . . . . . . . . . . . . . . . . . 16,495 144,001Diplomat Pharmacy, Inc. (a) (b) . . . . . . . . . . . . . . . . . . . . . . 26,141 507,397Ensign Group, Inc. (The) (b) . . . . . . . . . . . . . . . . . . . . . . . . . 21,431 812,664HealthEquity, Inc. (a) (b) . . . . . . . . . . . . . . . . . . . . . . . . . . 23,550 2,223,356LHC Group, Inc. (a) . . . . . . . . . . . . . . . . . . . . . . . . . . . . . . 13,057 1,344,740LifePoint Health, Inc. (a) . . . . . . . . . . . . . . . . . . . . . . . . . . . 16,466 1,060,410Magellan Health, Inc. (a) . . . . . . . . . . . . . . . . . . . . . . . . . . . 11,100 799,755National Healthcare Corp. . . . . . . . . . . . . . . . . . . . . . . . . . . 5,246 395,391National Research Corp. - Class A . . . . . . . . . . . . . . . . . . . . . 4,950 191,070Owens & Minor, Inc. (b) . . . . . . . . . . . . . . . . . . . . . . . . . . . 28,475 470,407Patterson Cos., Inc. (b) . . . . . . . . . . . . . . . . . . . . . . . . . . . . 37,980 928,611PetIQ, Inc. (a) (b) . . . . . . . . . . . . . . . . . . . . . . . . . . . . . . . 5,349 210,269Providence Service Corp. (The) (a) . . . . . . . . . . . . . . . . . . . . 5,978 402,200R1 RCM, Inc. (a) . . . . . . . . . . . . . . . . . . . . . . . . . . . . . . . . 47,026 477,784RadNet, Inc. (a) . . . . . . . . . . . . . . . . . . . . . . . . . . . . . . . . . 21,044 316,712Select Medical Holdings Corp. (a) . . . . . . . . . . . . . . . . . . . . . 47,385 871,884Surgery Partners, Inc. (a) . . . . . . . . . . . . . . . . . . . . . . . . . . 9,540 157,410Tenet Healthcare Corp. (a) . . . . . . . . . . . . . . . . . . . . . . . . . . 38,490 1,095,425Tivity Health, Inc. (a) (b) . . . . . . . . . . . . . . . . . . . . . . . . . . . 18,680 600,562Triple-S Management Corp. - Class B (a) . . . . . . . . . . . . . . . . . 9,291 175,507U.S. Physical Therapy, Inc. (b) . . . . . . . . . . . . . . . . . . . . . . . 6,011 712,905
19,376,567
Health Care Technology—1.1%Allscripts Healthcare Solutions, Inc. (a) . . . . . . . . . . . . . . . . . . 77,571 1,105,387Computer Programs & Systems, Inc. (b) . . . . . . . . . . . . . . . . . 5,856 157,234Evolent Health, Inc. - Class A (a) (b) . . . . . . . . . . . . . . . . . . . 31,066 882,274HealthStream, Inc. . . . . . . . . . . . . . . . . . . . . . . . . . . . . . . . 12,016 372,616HMS Holdings Corp. (a) . . . . . . . . . . . . . . . . . . . . . . . . . . . . 37,216 1,221,057Inovalon Holdings, Inc. - Class A (a) (b) . . . . . . . . . . . . . . . . . 29,972 301,219Inspire Medical Systems, Inc. (a) . . . . . . . . . . . . . . . . . . . . . . 2,914 122,621Medidata Solutions, Inc. (a) (b) . . . . . . . . . . . . . . . . . . . . . . 24,663 1,808,045NextGen Healthcare, Inc. (a) . . . . . . . . . . . . . . . . . . . . . . . . 24,814 498,265Omnicell, Inc. (a) (b) . . . . . . . . . . . . . . . . . . . . . . . . . . . . . 16,836 1,210,508Tabula Rasa HealthCare, Inc. (a) (b) . . . . . . . . . . . . . . . . . . . 8,170 663,322Teladoc Health, Inc. (a) (b) . . . . . . . . . . . . . . . . . . . . . . . . . 29,056 2,508,986Vocera Communications, Inc. (a) . . . . . . . . . . . . . . . . . . . . . . 13,407 490,428
11,341,962
Security Description Shares Value
Hotels, Restaurants & Leisure—3.0%BBX Capital Corp. . . . . . . . . . . . . . . . . . . . . . . . . . . . . . . . 25,192 $ 186,925Belmond, Ltd. - Class A (a) . . . . . . . . . . . . . . . . . . . . . . . . . . 41,761 762,138BJ’s Restaurants, Inc. (b) . . . . . . . . . . . . . . . . . . . . . . . . . . . 9,083 655,793Bloomin’ Brands, Inc. . . . . . . . . . . . . . . . . . . . . . . . . . . . . . 36,028 712,994Boyd Gaming Corp. . . . . . . . . . . . . . . . . . . . . . . . . . . . . . . 36,831 1,246,729Brinker International, Inc. (b) . . . . . . . . . . . . . . . . . . . . . . . 20,422 954,320Carrols Restaurant Group, Inc. (a) . . . . . . . . . . . . . . . . . . . . . 17,458 254,887Cheesecake Factory, Inc. (The) (b) . . . . . . . . . . . . . . . . . . . . . 18,905 1,012,174Churchill Downs, Inc. . . . . . . . . . . . . . . . . . . . . . . . . . . . . . 4,976 1,381,835Chuy’s Holdings, Inc. (a) (b) . . . . . . . . . . . . . . . . . . . . . . . . 8,272 217,140Cracker Barrel Old Country Store, Inc. (b) . . . . . . . . . . . . . . . . 8,458 1,244,426Dave & Buster’s Entertainment, Inc. (b) . . . . . . . . . . . . . . . . . 17,269 1,143,553Del Frisco’s Restaurant Group, Inc. (a) . . . . . . . . . . . . . . . . . . 16,266 135,008Del Taco Restaurants, Inc. (a) . . . . . . . . . . . . . . . . . . . . . . . . 16,196 191,275Denny’s Corp. (a) . . . . . . . . . . . . . . . . . . . . . . . . . . . . . . . 25,229 371,371Dine Brands Global, Inc. . . . . . . . . . . . . . . . . . . . . . . . . . . . 7,762 631,128Drive Shack, Inc. (a) (b) . . . . . . . . . . . . . . . . . . . . . . . . . . . 29,184 173,937El Pollo Loco Holdings, Inc. (a) . . . . . . . . . . . . . . . . . . . . . . . 10,879 136,531Eldorado Resorts, Inc. (a) (b) . . . . . . . . . . . . . . . . . . . . . . . . 27,820 1,352,052Fiesta Restaurant Group, Inc. (a) . . . . . . . . . . . . . . . . . . . . . 9,712 259,796Golden Entertainment, Inc. (a) . . . . . . . . . . . . . . . . . . . . . . . 8,432 202,452Habit Restaurants, Inc. (The) - Class A (a) . . . . . . . . . . . . . . . . 10,004 159,564International Speedway Corp. - Class A (b) . . . . . . . . . . . . . . . 10,424 456,571Jack in the Box, Inc. . . . . . . . . . . . . . . . . . . . . . . . . . . . . . . 12,021 1,007,720Lindblad Expeditions Holdings, Inc. (a) . . . . . . . . . . . . . . . . . . 10,779 160,284Marriott Vacations Worldwide Corp. . . . . . . . . . . . . . . . . . . . . 16,923 1,891,145Monarch Casino & Resort, Inc. (a) . . . . . . . . . . . . . . . . . . . . . 5,265 239,294Papa John’s International, Inc. (b) . . . . . . . . . . . . . . . . . . . . 10,257 525,979Penn National Gaming, Inc. (a) . . . . . . . . . . . . . . . . . . . . . . 36,335 1,196,148Pinnacle Entertainment, Inc. (a) . . . . . . . . . . . . . . . . . . . . . . 22,818 768,738Planet Fitness, Inc. - Class A (a) . . . . . . . . . . . . . . . . . . . . . . 39,546 2,136,670PlayAGS, Inc. (a) . . . . . . . . . . . . . . . . . . . . . . . . . . . . . . . . 9,992 294,464Potbelly Corp. (a) . . . . . . . . . . . . . . . . . . . . . . . . . . . . . . . 12,520 153,996RCI Hospitality Holdings, Inc. . . . . . . . . . . . . . . . . . . . . . . . . 4,756 140,825Red Robin Gourmet Burgers, Inc. (a) . . . . . . . . . . . . . . . . . . . 5,863 235,400Red Rock Resorts, Inc. - Class A . . . . . . . . . . . . . . . . . . . . . . . 32,000 852,800Ruth’s Hospitality Group, Inc. . . . . . . . . . . . . . . . . . . . . . . . . 13,027 411,002Scientific Games Corp. - Class A (a) . . . . . . . . . . . . . . . . . . . . 24,798 629,869SeaWorld Entertainment, Inc. (a) . . . . . . . . . . . . . . . . . . . . . 25,485 800,994Shake Shack, Inc. - Class A (a) . . . . . . . . . . . . . . . . . . . . . . . 11,359 715,731Sonic Corp. . . . . . . . . . . . . . . . . . . . . . . . . . . . . . . . . . . . . 16,919 733,270Texas Roadhouse, Inc. . . . . . . . . . . . . . . . . . . . . . . . . . . . . 29,169 2,021,120Wingstop, Inc. . . . . . . . . . . . . . . . . . . . . . . . . . . . . . . . . . . 12,085 825,043
29,583,091
Household Durables—1.5%AV Homes, Inc. (a) . . . . . . . . . . . . . . . . . . . . . . . . . . . . . . . 6,263 125,260Beazer Homes USA, Inc. (a) . . . . . . . . . . . . . . . . . . . . . . . . . 13,700 143,850Cavco Industries, Inc. (a) . . . . . . . . . . . . . . . . . . . . . . . . . . . 3,571 903,463Century Communities, Inc. (a) . . . . . . . . . . . . . . . . . . . . . . . 12,109 317,861Ethan Allen Interiors, Inc. (b) . . . . . . . . . . . . . . . . . . . . . . . . 12,159 252,299GoPro, Inc. - Class A (a) (b) . . . . . . . . . . . . . . . . . . . . . . . . . 36,321 261,511Helen of Troy, Ltd. (a) . . . . . . . . . . . . . . . . . . . . . . . . . . . . 11,424 1,495,402Hooker Furniture Corp. . . . . . . . . . . . . . . . . . . . . . . . . . . . . 5,444 184,007Installed Building Products, Inc. (a) . . . . . . . . . . . . . . . . . . . . 9,469 369,291iRobot Corp. (a) (b) . . . . . . . . . . . . . . . . . . . . . . . . . . . . . . 11,431 1,256,496KB Home . . . . . . . . . . . . . . . . . . . . . . . . . . . . . . . . . . . . . 37,780 903,320
BHFTII-218
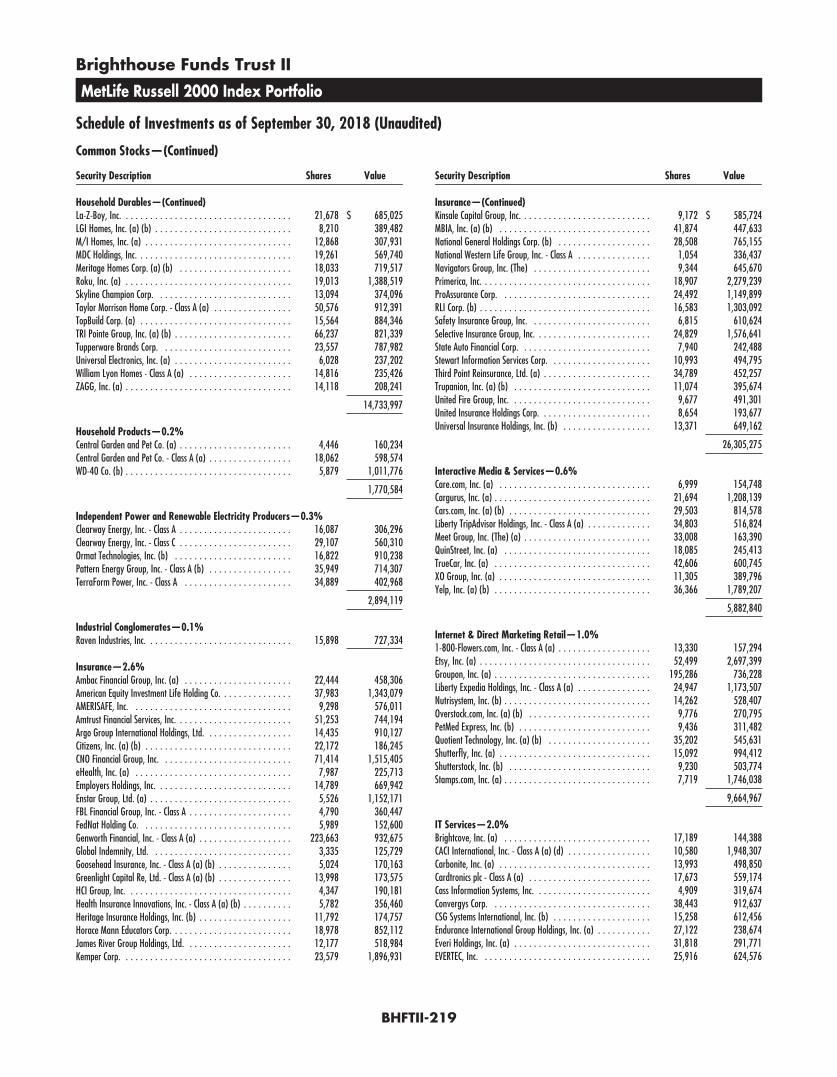
Brighthouse Funds Trust II
MetLife Russell 2000 Index Portfolio
Schedule of Investments as of September 30, 2018 (Unaudited)
Common Stocks—(Continued)
Security Description Shares Value
Household Durables—(Continued)La-Z-Boy, Inc. . . . . . . . . . . . . . . . . . . . . . . . . . . . . . . . . . . 21,678 $ 685,025LGI Homes, Inc. (a) (b) . . . . . . . . . . . . . . . . . . . . . . . . . . . . 8,210 389,482M/I Homes, Inc. (a) . . . . . . . . . . . . . . . . . . . . . . . . . . . . . . 12,868 307,931MDC Holdings, Inc. . . . . . . . . . . . . . . . . . . . . . . . . . . . . . . . 19,261 569,740Meritage Homes Corp. (a) (b) . . . . . . . . . . . . . . . . . . . . . . . 18,033 719,517Roku, Inc. (a) . . . . . . . . . . . . . . . . . . . . . . . . . . . . . . . . . . 19,013 1,388,519Skyline Champion Corp. . . . . . . . . . . . . . . . . . . . . . . . . . . . 13,094 374,096Taylor Morrison Home Corp. - Class A (a) . . . . . . . . . . . . . . . . 50,576 912,391TopBuild Corp. (a) . . . . . . . . . . . . . . . . . . . . . . . . . . . . . . . 15,564 884,346TRI Pointe Group, Inc. (a) (b) . . . . . . . . . . . . . . . . . . . . . . . . 66,237 821,339Tupperware Brands Corp. . . . . . . . . . . . . . . . . . . . . . . . . . . 23,557 787,982Universal Electronics, Inc. (a) . . . . . . . . . . . . . . . . . . . . . . . . 6,028 237,202William Lyon Homes - Class A (a) . . . . . . . . . . . . . . . . . . . . . 14,816 235,426ZAGG, Inc. (a) . . . . . . . . . . . . . . . . . . . . . . . . . . . . . . . . . . 14,118 208,241
14,733,997
Household Products—0.2%Central Garden and Pet Co. (a) . . . . . . . . . . . . . . . . . . . . . . . 4,446 160,234Central Garden and Pet Co. - Class A (a) . . . . . . . . . . . . . . . . . 18,062 598,574WD-40 Co. (b) . . . . . . . . . . . . . . . . . . . . . . . . . . . . . . . . . . 5,879 1,011,776
1,770,584
Independent Power and Renewable Electricity Producers—0.3%Clearway Energy, Inc. - Class A . . . . . . . . . . . . . . . . . . . . . . . 16,087 306,296Clearway Energy, Inc. - Class C . . . . . . . . . . . . . . . . . . . . . . . 29,107 560,310Ormat Technologies, Inc. (b) . . . . . . . . . . . . . . . . . . . . . . . . 16,822 910,238Pattern Energy Group, Inc. - Class A (b) . . . . . . . . . . . . . . . . . 35,949 714,307TerraForm Power, Inc. - Class A . . . . . . . . . . . . . . . . . . . . . . 34,889 402,968
2,894,119
Industrial Conglomerates—0.1%Raven Industries, Inc. . . . . . . . . . . . . . . . . . . . . . . . . . . . . . 15,898 727,334
Insurance—2.6%Ambac Financial Group, Inc. (a) . . . . . . . . . . . . . . . . . . . . . . 22,444 458,306American Equity Investment Life Holding Co. . . . . . . . . . . . . . . 37,983 1,343,079AMERISAFE, Inc. . . . . . . . . . . . . . . . . . . . . . . . . . . . . . . . . 9,298 576,011Amtrust Financial Services, Inc. . . . . . . . . . . . . . . . . . . . . . . . 51,253 744,194Argo Group International Holdings, Ltd. . . . . . . . . . . . . . . . . . 14,435 910,127Citizens, Inc. (a) (b) . . . . . . . . . . . . . . . . . . . . . . . . . . . . . . 22,172 186,245CNO Financial Group, Inc. . . . . . . . . . . . . . . . . . . . . . . . . . . 71,414 1,515,405eHealth, Inc. (a) . . . . . . . . . . . . . . . . . . . . . . . . . . . . . . . . 7,987 225,713Employers Holdings, Inc. . . . . . . . . . . . . . . . . . . . . . . . . . . . 14,789 669,942Enstar Group, Ltd. (a) . . . . . . . . . . . . . . . . . . . . . . . . . . . . . 5,526 1,152,171FBL Financial Group, Inc. - Class A . . . . . . . . . . . . . . . . . . . . . 4,790 360,447FedNat Holding Co. . . . . . . . . . . . . . . . . . . . . . . . . . . . . . . 5,989 152,600Genworth Financial, Inc. - Class A (a) . . . . . . . . . . . . . . . . . . . 223,663 932,675Global Indemnity, Ltd. . . . . . . . . . . . . . . . . . . . . . . . . . . . . 3,335 125,729Goosehead Insurance, Inc. - Class A (a) (b) . . . . . . . . . . . . . . . 5,024 170,163Greenlight Capital Re, Ltd. - Class A (a) (b) . . . . . . . . . . . . . . . 13,998 173,575HCI Group, Inc. . . . . . . . . . . . . . . . . . . . . . . . . . . . . . . . . . 4,347 190,181Health Insurance Innovations, Inc. - Class A (a) (b) . . . . . . . . . . 5,782 356,460Heritage Insurance Holdings, Inc. (b) . . . . . . . . . . . . . . . . . . . 11,792 174,757Horace Mann Educators Corp. . . . . . . . . . . . . . . . . . . . . . . . . 18,978 852,112James River Group Holdings, Ltd. . . . . . . . . . . . . . . . . . . . . . 12,177 518,984Kemper Corp. . . . . . . . . . . . . . . . . . . . . . . . . . . . . . . . . . . 23,579 1,896,931
Security Description Shares Value
Insurance—(Continued)Kinsale Capital Group, Inc. . . . . . . . . . . . . . . . . . . . . . . . . . . 9,172 $ 585,724MBIA, Inc. (a) (b) . . . . . . . . . . . . . . . . . . . . . . . . . . . . . . . 41,874 447,633National General Holdings Corp. (b) . . . . . . . . . . . . . . . . . . . 28,508 765,155National Western Life Group, Inc. - Class A . . . . . . . . . . . . . . . 1,054 336,437Navigators Group, Inc. (The) . . . . . . . . . . . . . . . . . . . . . . . . 9,344 645,670Primerica, Inc. . . . . . . . . . . . . . . . . . . . . . . . . . . . . . . . . . . 18,907 2,279,239ProAssurance Corp. . . . . . . . . . . . . . . . . . . . . . . . . . . . . . . 24,492 1,149,899RLI Corp. (b) . . . . . . . . . . . . . . . . . . . . . . . . . . . . . . . . . . . 16,583 1,303,092Safety Insurance Group, Inc. . . . . . . . . . . . . . . . . . . . . . . . . 6,815 610,624Selective Insurance Group, Inc. . . . . . . . . . . . . . . . . . . . . . . . 24,829 1,576,641State Auto Financial Corp. . . . . . . . . . . . . . . . . . . . . . . . . . . 7,940 242,488Stewart Information Services Corp. . . . . . . . . . . . . . . . . . . . . 10,993 494,795Third Point Reinsurance, Ltd. (a) . . . . . . . . . . . . . . . . . . . . . . 34,789 452,257Trupanion, Inc. (a) (b) . . . . . . . . . . . . . . . . . . . . . . . . . . . . 11,074 395,674United Fire Group, Inc. . . . . . . . . . . . . . . . . . . . . . . . . . . . . 9,677 491,301United Insurance Holdings Corp. . . . . . . . . . . . . . . . . . . . . . . 8,654 193,677Universal Insurance Holdings, Inc. (b) . . . . . . . . . . . . . . . . . . 13,371 649,162
26,305,275
Interactive Media & Services—0.6%Care.com, Inc. (a) . . . . . . . . . . . . . . . . . . . . . . . . . . . . . . . 6,999 154,748Cargurus, Inc. (a) . . . . . . . . . . . . . . . . . . . . . . . . . . . . . . . . 21,694 1,208,139Cars.com, Inc. (a) (b) . . . . . . . . . . . . . . . . . . . . . . . . . . . . . 29,503 814,578Liberty TripAdvisor Holdings, Inc. - Class A (a) . . . . . . . . . . . . . 34,803 516,824Meet Group, Inc. (The) (a) . . . . . . . . . . . . . . . . . . . . . . . . . . 33,008 163,390QuinStreet, Inc. (a) . . . . . . . . . . . . . . . . . . . . . . . . . . . . . . 18,085 245,413TrueCar, Inc. (a) . . . . . . . . . . . . . . . . . . . . . . . . . . . . . . . . 42,606 600,745XO Group, Inc. (a) . . . . . . . . . . . . . . . . . . . . . . . . . . . . . . . 11,305 389,796Yelp, Inc. (a) (b) . . . . . . . . . . . . . . . . . . . . . . . . . . . . . . . . 36,366 1,789,207
5,882,840
Internet & Direct Marketing Retail—1.0%1-800-Flowers.com, Inc. - Class A (a) . . . . . . . . . . . . . . . . . . . 13,330 157,294Etsy, Inc. (a) . . . . . . . . . . . . . . . . . . . . . . . . . . . . . . . . . . . 52,499 2,697,399Groupon, Inc. (a) . . . . . . . . . . . . . . . . . . . . . . . . . . . . . . . . 195,286 736,228Liberty Expedia Holdings, Inc. - Class A (a) . . . . . . . . . . . . . . . 24,947 1,173,507Nutrisystem, Inc. (b) . . . . . . . . . . . . . . . . . . . . . . . . . . . . . . 14,262 528,407Overstock.com, Inc. (a) (b) . . . . . . . . . . . . . . . . . . . . . . . . . 9,776 270,795PetMed Express, Inc. (b) . . . . . . . . . . . . . . . . . . . . . . . . . . . 9,436 311,482Quotient Technology, Inc. (a) (b) . . . . . . . . . . . . . . . . . . . . . 35,202 545,631Shutterfly, Inc. (a) . . . . . . . . . . . . . . . . . . . . . . . . . . . . . . . 15,092 994,412Shutterstock, Inc. (b) . . . . . . . . . . . . . . . . . . . . . . . . . . . . . 9,230 503,774Stamps.com, Inc. (a) . . . . . . . . . . . . . . . . . . . . . . . . . . . . . . 7,719 1,746,038
9,664,967
IT Services—2.0%Brightcove, Inc. (a) . . . . . . . . . . . . . . . . . . . . . . . . . . . . . . 17,189 144,388CACI International, Inc. - Class A (a) (d) . . . . . . . . . . . . . . . . . 10,580 1,948,307Carbonite, Inc. (a) . . . . . . . . . . . . . . . . . . . . . . . . . . . . . . . 13,993 498,850Cardtronics plc - Class A (a) . . . . . . . . . . . . . . . . . . . . . . . . . 17,673 559,174Cass Information Systems, Inc. . . . . . . . . . . . . . . . . . . . . . . . 4,909 319,674Convergys Corp. . . . . . . . . . . . . . . . . . . . . . . . . . . . . . . . . 38,443 912,637CSG Systems International, Inc. (b) . . . . . . . . . . . . . . . . . . . . 15,258 612,456Endurance International Group Holdings, Inc. (a) . . . . . . . . . . . 27,122 238,674Everi Holdings, Inc. (a) . . . . . . . . . . . . . . . . . . . . . . . . . . . . 31,818 291,771EVERTEC, Inc. . . . . . . . . . . . . . . . . . . . . . . . . . . . . . . . . . . 25,916 624,576
BHFTII-219
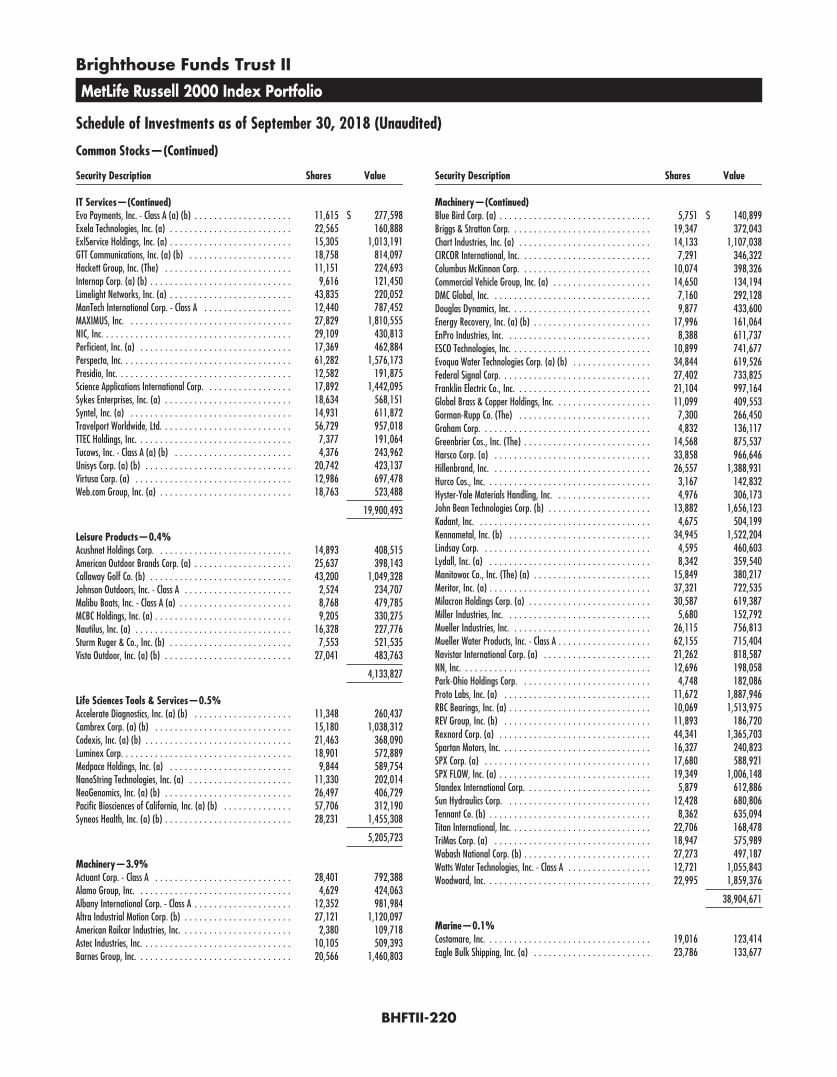
Brighthouse Funds Trust II
MetLife Russell 2000 Index Portfolio
Schedule of Investments as of September 30, 2018 (Unaudited)
Common Stocks—(Continued)
Security Description Shares Value
IT Services—(Continued)Evo Payments, Inc. - Class A (a) (b) . . . . . . . . . . . . . . . . . . . . 11,615 $ 277,598Exela Technologies, Inc. (a) . . . . . . . . . . . . . . . . . . . . . . . . . 22,565 160,888ExlService Holdings, Inc. (a) . . . . . . . . . . . . . . . . . . . . . . . . . 15,305 1,013,191GTT Communications, Inc. (a) (b) . . . . . . . . . . . . . . . . . . . . . 18,758 814,097Hackett Group, Inc. (The) . . . . . . . . . . . . . . . . . . . . . . . . . . 11,151 224,693Internap Corp. (a) (b) . . . . . . . . . . . . . . . . . . . . . . . . . . . . . 9,616 121,450Limelight Networks, Inc. (a) . . . . . . . . . . . . . . . . . . . . . . . . . 43,835 220,052ManTech International Corp. - Class A . . . . . . . . . . . . . . . . . . 12,440 787,452MAXIMUS, Inc. . . . . . . . . . . . . . . . . . . . . . . . . . . . . . . . . . 27,829 1,810,555NIC, Inc. . . . . . . . . . . . . . . . . . . . . . . . . . . . . . . . . . . . . . . 29,109 430,813Perficient, Inc. (a) . . . . . . . . . . . . . . . . . . . . . . . . . . . . . . . 17,369 462,884Perspecta, Inc. . . . . . . . . . . . . . . . . . . . . . . . . . . . . . . . . . . 61,282 1,576,173Presidio, Inc. . . . . . . . . . . . . . . . . . . . . . . . . . . . . . . . . . . . 12,582 191,875Science Applications International Corp. . . . . . . . . . . . . . . . . . 17,892 1,442,095Sykes Enterprises, Inc. (a) . . . . . . . . . . . . . . . . . . . . . . . . . . 18,634 568,151Syntel, Inc. (a) . . . . . . . . . . . . . . . . . . . . . . . . . . . . . . . . . 14,931 611,872Travelport Worldwide, Ltd. . . . . . . . . . . . . . . . . . . . . . . . . . . 56,729 957,018TTEC Holdings, Inc. . . . . . . . . . . . . . . . . . . . . . . . . . . . . . . . 7,377 191,064Tucows, Inc. - Class A (a) (b) . . . . . . . . . . . . . . . . . . . . . . . . 4,376 243,962Unisys Corp. (a) (b) . . . . . . . . . . . . . . . . . . . . . . . . . . . . . . 20,742 423,137Virtusa Corp. (a) . . . . . . . . . . . . . . . . . . . . . . . . . . . . . . . . 12,986 697,478Web.com Group, Inc. (a) . . . . . . . . . . . . . . . . . . . . . . . . . . . 18,763 523,488
19,900,493
Leisure Products—0.4%Acushnet Holdings Corp. . . . . . . . . . . . . . . . . . . . . . . . . . . . 14,893 408,515American Outdoor Brands Corp. (a) . . . . . . . . . . . . . . . . . . . . 25,637 398,143Callaway Golf Co. (b) . . . . . . . . . . . . . . . . . . . . . . . . . . . . . 43,200 1,049,328Johnson Outdoors, Inc. - Class A . . . . . . . . . . . . . . . . . . . . . . 2,524 234,707Malibu Boats, Inc. - Class A (a) . . . . . . . . . . . . . . . . . . . . . . . 8,768 479,785MCBC Holdings, Inc. (a) . . . . . . . . . . . . . . . . . . . . . . . . . . . . 9,205 330,275Nautilus, Inc. (a) . . . . . . . . . . . . . . . . . . . . . . . . . . . . . . . . 16,328 227,776Sturm Ruger & Co., Inc. (b) . . . . . . . . . . . . . . . . . . . . . . . . . 7,553 521,535Vista Outdoor, Inc. (a) (b) . . . . . . . . . . . . . . . . . . . . . . . . . . 27,041 483,763
4,133,827
Life Sciences Tools & Services—0.5%Accelerate Diagnostics, Inc. (a) (b) . . . . . . . . . . . . . . . . . . . . 11,348 260,437Cambrex Corp. (a) (b) . . . . . . . . . . . . . . . . . . . . . . . . . . . . 15,180 1,038,312Codexis, Inc. (a) (b) . . . . . . . . . . . . . . . . . . . . . . . . . . . . . . 21,463 368,090Luminex Corp. . . . . . . . . . . . . . . . . . . . . . . . . . . . . . . . . . . 18,901 572,889Medpace Holdings, Inc. (a) . . . . . . . . . . . . . . . . . . . . . . . . . 9,844 589,754NanoString Technologies, Inc. (a) . . . . . . . . . . . . . . . . . . . . . 11,330 202,014NeoGenomics, Inc. (a) (b) . . . . . . . . . . . . . . . . . . . . . . . . . . 26,497 406,729Pacific Biosciences of California, Inc. (a) (b) . . . . . . . . . . . . . . 57,706 312,190Syneos Health, Inc. (a) (b) . . . . . . . . . . . . . . . . . . . . . . . . . . 28,231 1,455,308
5,205,723
Machinery—3.9%Actuant Corp. - Class A . . . . . . . . . . . . . . . . . . . . . . . . . . . . 28,401 792,388Alamo Group, Inc. . . . . . . . . . . . . . . . . . . . . . . . . . . . . . . . 4,629 424,063Albany International Corp. - Class A . . . . . . . . . . . . . . . . . . . . 12,352 981,984Altra Industrial Motion Corp. (b) . . . . . . . . . . . . . . . . . . . . . . 27,121 1,120,097American Railcar Industries, Inc. . . . . . . . . . . . . . . . . . . . . . . 2,380 109,718Astec Industries, Inc. . . . . . . . . . . . . . . . . . . . . . . . . . . . . . . 10,105 509,393Barnes Group, Inc. . . . . . . . . . . . . . . . . . . . . . . . . . . . . . . . 20,566 1,460,803
Security Description Shares Value
Machinery—(Continued)Blue Bird Corp. (a) . . . . . . . . . . . . . . . . . . . . . . . . . . . . . . . 5,751 $ 140,899Briggs & Stratton Corp. . . . . . . . . . . . . . . . . . . . . . . . . . . . . 19,347 372,043Chart Industries, Inc. (a) . . . . . . . . . . . . . . . . . . . . . . . . . . . 14,133 1,107,038CIRCOR International, Inc. . . . . . . . . . . . . . . . . . . . . . . . . . . 7,291 346,322Columbus McKinnon Corp. . . . . . . . . . . . . . . . . . . . . . . . . . . 10,074 398,326Commercial Vehicle Group, Inc. (a) . . . . . . . . . . . . . . . . . . . . 14,650 134,194DMC Global, Inc. . . . . . . . . . . . . . . . . . . . . . . . . . . . . . . . . 7,160 292,128Douglas Dynamics, Inc. . . . . . . . . . . . . . . . . . . . . . . . . . . . . 9,877 433,600Energy Recovery, Inc. (a) (b) . . . . . . . . . . . . . . . . . . . . . . . . 17,996 161,064EnPro Industries, Inc. . . . . . . . . . . . . . . . . . . . . . . . . . . . . . 8,388 611,737ESCO Technologies, Inc. . . . . . . . . . . . . . . . . . . . . . . . . . . . . 10,899 741,677Evoqua Water Technologies Corp. (a) (b) . . . . . . . . . . . . . . . . 34,844 619,526Federal Signal Corp. . . . . . . . . . . . . . . . . . . . . . . . . . . . . . . 27,402 733,825Franklin Electric Co., Inc. . . . . . . . . . . . . . . . . . . . . . . . . . . . 21,104 997,164Global Brass & Copper Holdings, Inc. . . . . . . . . . . . . . . . . . . . 11,099 409,553Gorman-Rupp Co. (The) . . . . . . . . . . . . . . . . . . . . . . . . . . . 7,300 266,450Graham Corp. . . . . . . . . . . . . . . . . . . . . . . . . . . . . . . . . . . 4,832 136,117Greenbrier Cos., Inc. (The) . . . . . . . . . . . . . . . . . . . . . . . . . . 14,568 875,537Harsco Corp. (a) . . . . . . . . . . . . . . . . . . . . . . . . . . . . . . . . 33,858 966,646Hillenbrand, Inc. . . . . . . . . . . . . . . . . . . . . . . . . . . . . . . . . 26,557 1,388,931Hurco Cos., Inc. . . . . . . . . . . . . . . . . . . . . . . . . . . . . . . . . . 3,167 142,832Hyster-Yale Materials Handling, Inc. . . . . . . . . . . . . . . . . . . . 4,976 306,173John Bean Technologies Corp. (b) . . . . . . . . . . . . . . . . . . . . . 13,882 1,656,123Kadant, Inc. . . . . . . . . . . . . . . . . . . . . . . . . . . . . . . . . . . . 4,675 504,199Kennametal, Inc. (b) . . . . . . . . . . . . . . . . . . . . . . . . . . . . . 34,945 1,522,204Lindsay Corp. . . . . . . . . . . . . . . . . . . . . . . . . . . . . . . . . . . 4,595 460,603Lydall, Inc. (a) . . . . . . . . . . . . . . . . . . . . . . . . . . . . . . . . . 8,342 359,540Manitowoc Co., Inc. (The) (a) . . . . . . . . . . . . . . . . . . . . . . . . 15,849 380,217Meritor, Inc. (a) . . . . . . . . . . . . . . . . . . . . . . . . . . . . . . . . . 37,321 722,535Milacron Holdings Corp. (a) . . . . . . . . . . . . . . . . . . . . . . . . . 30,587 619,387Miller Industries, Inc. . . . . . . . . . . . . . . . . . . . . . . . . . . . . . 5,680 152,792Mueller Industries, Inc. . . . . . . . . . . . . . . . . . . . . . . . . . . . . 26,115 756,813Mueller Water Products, Inc. - Class A . . . . . . . . . . . . . . . . . . . 62,155 715,404Navistar International Corp. (a) . . . . . . . . . . . . . . . . . . . . . . 21,262 818,587NN, Inc. . . . . . . . . . . . . . . . . . . . . . . . . . . . . . . . . . . . . . . 12,696 198,058Park-Ohio Holdings Corp. . . . . . . . . . . . . . . . . . . . . . . . . . . 4,748 182,086Proto Labs, Inc. (a) . . . . . . . . . . . . . . . . . . . . . . . . . . . . . . 11,672 1,887,946RBC Bearings, Inc. (a) . . . . . . . . . . . . . . . . . . . . . . . . . . . . . 10,069 1,513,975REV Group, Inc. (b) . . . . . . . . . . . . . . . . . . . . . . . . . . . . . . 11,893 186,720Rexnord Corp. (a) . . . . . . . . . . . . . . . . . . . . . . . . . . . . . . . 44,341 1,365,703Spartan Motors, Inc. . . . . . . . . . . . . . . . . . . . . . . . . . . . . . . 16,327 240,823SPX Corp. (a) . . . . . . . . . . . . . . . . . . . . . . . . . . . . . . . . . . 17,680 588,921SPX FLOW, Inc. (a) . . . . . . . . . . . . . . . . . . . . . . . . . . . . . . . 19,349 1,006,148Standex International Corp. . . . . . . . . . . . . . . . . . . . . . . . . . 5,879 612,886Sun Hydraulics Corp. . . . . . . . . . . . . . . . . . . . . . . . . . . . . . 12,428 680,806Tennant Co. (b) . . . . . . . . . . . . . . . . . . . . . . . . . . . . . . . . . 8,362 635,094Titan International, Inc. . . . . . . . . . . . . . . . . . . . . . . . . . . . . 22,706 168,478TriMas Corp. (a) . . . . . . . . . . . . . . . . . . . . . . . . . . . . . . . . 18,947 575,989Wabash National Corp. (b) . . . . . . . . . . . . . . . . . . . . . . . . . . 27,273 497,187Watts Water Technologies, Inc. - Class A . . . . . . . . . . . . . . . . . 12,721 1,055,843Woodward, Inc. . . . . . . . . . . . . . . . . . . . . . . . . . . . . . . . . . 22,995 1,859,376
38,904,671
Marine—0.1%Costamare, Inc. . . . . . . . . . . . . . . . . . . . . . . . . . . . . . . . . . 19,016 123,414Eagle Bulk Shipping, Inc. (a) . . . . . . . . . . . . . . . . . . . . . . . . 23,786 133,677
BHFTII-220
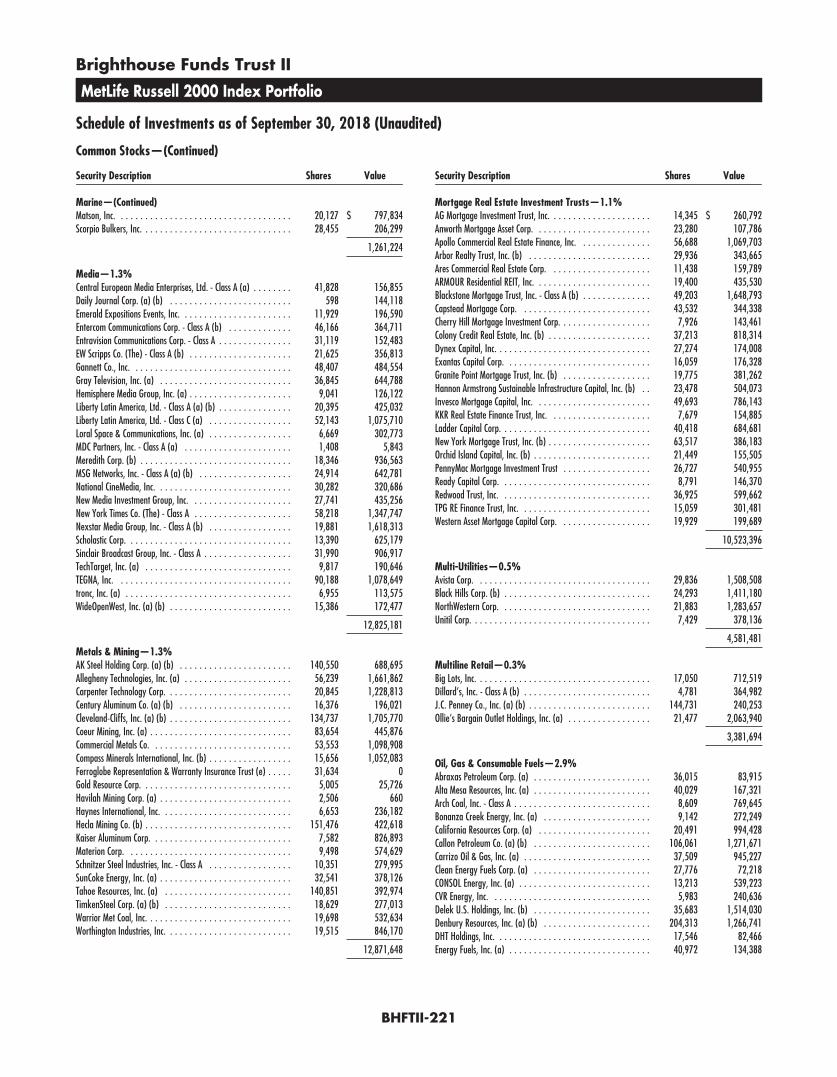
Brighthouse Funds Trust II
MetLife Russell 2000 Index Portfolio
Schedule of Investments as of September 30, 2018 (Unaudited)
Common Stocks—(Continued)
Security Description Shares Value
Marine—(Continued)Matson, Inc. . . . . . . . . . . . . . . . . . . . . . . . . . . . . . . . . . . . 20,127 $ 797,834Scorpio Bulkers, Inc. . . . . . . . . . . . . . . . . . . . . . . . . . . . . . . 28,455 206,299
1,261,224
Media—1.3%Central European Media Enterprises, Ltd. - Class A (a) . . . . . . . . 41,828 156,855Daily Journal Corp. (a) (b) . . . . . . . . . . . . . . . . . . . . . . . . . 598 144,118Emerald Expositions Events, Inc. . . . . . . . . . . . . . . . . . . . . . . 11,929 196,590Entercom Communications Corp. - Class A (b) . . . . . . . . . . . . . 46,166 364,711Entravision Communications Corp. - Class A . . . . . . . . . . . . . . . 31,119 152,483EW Scripps Co. (The) - Class A (b) . . . . . . . . . . . . . . . . . . . . . 21,625 356,813Gannett Co., Inc. . . . . . . . . . . . . . . . . . . . . . . . . . . . . . . . . 48,407 484,554Gray Television, Inc. (a) . . . . . . . . . . . . . . . . . . . . . . . . . . . 36,845 644,788Hemisphere Media Group, Inc. (a) . . . . . . . . . . . . . . . . . . . . . 9,041 126,122Liberty Latin America, Ltd. - Class A (a) (b) . . . . . . . . . . . . . . . 20,395 425,032Liberty Latin America, Ltd. - Class C (a) . . . . . . . . . . . . . . . . . 52,143 1,075,710Loral Space & Communications, Inc. (a) . . . . . . . . . . . . . . . . . 6,669 302,773MDC Partners, Inc. - Class A (a) . . . . . . . . . . . . . . . . . . . . . . 1,408 5,843Meredith Corp. (b) . . . . . . . . . . . . . . . . . . . . . . . . . . . . . . . 18,346 936,563MSG Networks, Inc. - Class A (a) (b) . . . . . . . . . . . . . . . . . . . 24,914 642,781National CineMedia, Inc. . . . . . . . . . . . . . . . . . . . . . . . . . . . 30,282 320,686New Media Investment Group, Inc. . . . . . . . . . . . . . . . . . . . . 27,741 435,256New York Times Co. (The) - Class A . . . . . . . . . . . . . . . . . . . . 58,218 1,347,747Nexstar Media Group, Inc. - Class A (b) . . . . . . . . . . . . . . . . . 19,881 1,618,313Scholastic Corp. . . . . . . . . . . . . . . . . . . . . . . . . . . . . . . . . . 13,390 625,179Sinclair Broadcast Group, Inc. - Class A . . . . . . . . . . . . . . . . . . 31,990 906,917TechTarget, Inc. (a) . . . . . . . . . . . . . . . . . . . . . . . . . . . . . . 9,817 190,646TEGNA, Inc. . . . . . . . . . . . . . . . . . . . . . . . . . . . . . . . . . . . 90,188 1,078,649tronc, Inc. (a) . . . . . . . . . . . . . . . . . . . . . . . . . . . . . . . . . . 6,955 113,575WideOpenWest, Inc. (a) (b) . . . . . . . . . . . . . . . . . . . . . . . . . 15,386 172,477
12,825,181
Metals & Mining—1.3%AK Steel Holding Corp. (a) (b) . . . . . . . . . . . . . . . . . . . . . . . 140,550 688,695Allegheny Technologies, Inc. (a) . . . . . . . . . . . . . . . . . . . . . . 56,239 1,661,862Carpenter Technology Corp. . . . . . . . . . . . . . . . . . . . . . . . . . 20,845 1,228,813Century Aluminum Co. (a) (b) . . . . . . . . . . . . . . . . . . . . . . . 16,376 196,021Cleveland-Cliffs, Inc. (a) (b) . . . . . . . . . . . . . . . . . . . . . . . . . 134,737 1,705,770Coeur Mining, Inc. (a) . . . . . . . . . . . . . . . . . . . . . . . . . . . . . 83,654 445,876Commercial Metals Co. . . . . . . . . . . . . . . . . . . . . . . . . . . . . 53,553 1,098,908Compass Minerals International, Inc. (b) . . . . . . . . . . . . . . . . . 15,656 1,052,083Ferroglobe Representation & Warranty Insurance Trust (e) . . . . . 31,634 0Gold Resource Corp. . . . . . . . . . . . . . . . . . . . . . . . . . . . . . . 5,005 25,726Havilah Mining Corp. (a) . . . . . . . . . . . . . . . . . . . . . . . . . . . 2,506 660Haynes International, Inc. . . . . . . . . . . . . . . . . . . . . . . . . . . 6,653 236,182Hecla Mining Co. (b) . . . . . . . . . . . . . . . . . . . . . . . . . . . . . . 151,476 422,618Kaiser Aluminum Corp. . . . . . . . . . . . . . . . . . . . . . . . . . . . . 7,582 826,893Materion Corp. . . . . . . . . . . . . . . . . . . . . . . . . . . . . . . . . . 9,498 574,629Schnitzer Steel Industries, Inc. - Class A . . . . . . . . . . . . . . . . . 10,351 279,995SunCoke Energy, Inc. (a) . . . . . . . . . . . . . . . . . . . . . . . . . . . 32,541 378,126Tahoe Resources, Inc. (a) . . . . . . . . . . . . . . . . . . . . . . . . . . 140,851 392,974TimkenSteel Corp. (a) (b) . . . . . . . . . . . . . . . . . . . . . . . . . . 18,629 277,013Warrior Met Coal, Inc. . . . . . . . . . . . . . . . . . . . . . . . . . . . . . 19,698 532,634Worthington Industries, Inc. . . . . . . . . . . . . . . . . . . . . . . . . . 19,515 846,170
12,871,648
Security Description Shares Value
Mortgage Real Estate Investment Trusts—1.1%AG Mortgage Investment Trust, Inc. . . . . . . . . . . . . . . . . . . . . 14,345 $ 260,792Anworth Mortgage Asset Corp. . . . . . . . . . . . . . . . . . . . . . . . 23,280 107,786Apollo Commercial Real Estate Finance, Inc. . . . . . . . . . . . . . . 56,688 1,069,703Arbor Realty Trust, Inc. (b) . . . . . . . . . . . . . . . . . . . . . . . . . 29,936 343,665Ares Commercial Real Estate Corp. . . . . . . . . . . . . . . . . . . . . 11,438 159,789ARMOUR Residential REIT, Inc. . . . . . . . . . . . . . . . . . . . . . . . 19,400 435,530Blackstone Mortgage Trust, Inc. - Class A (b) . . . . . . . . . . . . . . 49,203 1,648,793Capstead Mortgage Corp. . . . . . . . . . . . . . . . . . . . . . . . . . . 43,532 344,338Cherry Hill Mortgage Investment Corp. . . . . . . . . . . . . . . . . . . 7,926 143,461Colony Credit Real Estate, Inc. (b) . . . . . . . . . . . . . . . . . . . . . 37,213 818,314Dynex Capital, Inc. . . . . . . . . . . . . . . . . . . . . . . . . . . . . . . . 27,274 174,008Exantas Capital Corp. . . . . . . . . . . . . . . . . . . . . . . . . . . . . . 16,059 176,328Granite Point Mortgage Trust, Inc. (b) . . . . . . . . . . . . . . . . . . 19,775 381,262Hannon Armstrong Sustainable Infrastructure Capital, Inc. (b) . . 23,478 504,073Invesco Mortgage Capital, Inc. . . . . . . . . . . . . . . . . . . . . . . . 49,693 786,143KKR Real Estate Finance Trust, Inc. . . . . . . . . . . . . . . . . . . . . 7,679 154,885Ladder Capital Corp. . . . . . . . . . . . . . . . . . . . . . . . . . . . . . . 40,418 684,681New York Mortgage Trust, Inc. (b) . . . . . . . . . . . . . . . . . . . . . 63,517 386,183Orchid Island Capital, Inc. (b) . . . . . . . . . . . . . . . . . . . . . . . . 21,449 155,505PennyMac Mortgage Investment Trust . . . . . . . . . . . . . . . . . . 26,727 540,955Ready Capital Corp. . . . . . . . . . . . . . . . . . . . . . . . . . . . . . . 8,791 146,370Redwood Trust, Inc. . . . . . . . . . . . . . . . . . . . . . . . . . . . . . . 36,925 599,662TPG RE Finance Trust, Inc. . . . . . . . . . . . . . . . . . . . . . . . . . . 15,059 301,481Western Asset Mortgage Capital Corp. . . . . . . . . . . . . . . . . . . 19,929 199,689
10,523,396
Multi-Utilities—0.5%Avista Corp. . . . . . . . . . . . . . . . . . . . . . . . . . . . . . . . . . . . 29,836 1,508,508Black Hills Corp. (b) . . . . . . . . . . . . . . . . . . . . . . . . . . . . . . 24,293 1,411,180NorthWestern Corp. . . . . . . . . . . . . . . . . . . . . . . . . . . . . . . 21,883 1,283,657Unitil Corp. . . . . . . . . . . . . . . . . . . . . . . . . . . . . . . . . . . . . 7,429 378,136
4,581,481
Multiline Retail—0.3%Big Lots, Inc. . . . . . . . . . . . . . . . . . . . . . . . . . . . . . . . . . . . 17,050 712,519Dillard’s, Inc. - Class A (b) . . . . . . . . . . . . . . . . . . . . . . . . . . 4,781 364,982J.C. Penney Co., Inc. (a) (b) . . . . . . . . . . . . . . . . . . . . . . . . . 144,731 240,253Ollie’s Bargain Outlet Holdings, Inc. (a) . . . . . . . . . . . . . . . . . 21,477 2,063,940
3,381,694
Oil, Gas & Consumable Fuels—2.9%Abraxas Petroleum Corp. (a) . . . . . . . . . . . . . . . . . . . . . . . . 36,015 83,915Alta Mesa Resources, Inc. (a) . . . . . . . . . . . . . . . . . . . . . . . . 40,029 167,321Arch Coal, Inc. - Class A . . . . . . . . . . . . . . . . . . . . . . . . . . . . 8,609 769,645Bonanza Creek Energy, Inc. (a) . . . . . . . . . . . . . . . . . . . . . . 9,142 272,249California Resources Corp. (a) . . . . . . . . . . . . . . . . . . . . . . . 20,491 994,428Callon Petroleum Co. (a) (b) . . . . . . . . . . . . . . . . . . . . . . . . 106,061 1,271,671Carrizo Oil & Gas, Inc. (a) . . . . . . . . . . . . . . . . . . . . . . . . . . 37,509 945,227Clean Energy Fuels Corp. (a) . . . . . . . . . . . . . . . . . . . . . . . . 27,776 72,218CONSOL Energy, Inc. (a) . . . . . . . . . . . . . . . . . . . . . . . . . . . 13,213 539,223CVR Energy, Inc. . . . . . . . . . . . . . . . . . . . . . . . . . . . . . . . . 5,983 240,636Delek U.S. Holdings, Inc. (b) . . . . . . . . . . . . . . . . . . . . . . . . 35,683 1,514,030Denbury Resources, Inc. (a) (b) . . . . . . . . . . . . . . . . . . . . . . 204,313 1,266,741DHT Holdings, Inc. . . . . . . . . . . . . . . . . . . . . . . . . . . . . . . . 17,546 82,466Energy Fuels, Inc. (a) . . . . . . . . . . . . . . . . . . . . . . . . . . . . . 40,972 134,388
BHFTII-221

Brighthouse Funds Trust II
MetLife Russell 2000 Index Portfolio
Schedule of Investments as of September 30, 2018 (Unaudited)
Common Stocks—(Continued)
Security Description Shares Value
Oil, Gas & Consumable Fuels—(Continued)Energy XXI Gulf Coast, Inc. (a) . . . . . . . . . . . . . . . . . . . . . . . 17,463 $ 145,991Evolution Petroleum Corp. . . . . . . . . . . . . . . . . . . . . . . . . . . 13,703 151,418Frontline, Ltd. (a) (b) . . . . . . . . . . . . . . . . . . . . . . . . . . . . . 36,108 209,788GasLog, Ltd. . . . . . . . . . . . . . . . . . . . . . . . . . . . . . . . . . . . 20,748 409,773Golar LNG, Ltd. . . . . . . . . . . . . . . . . . . . . . . . . . . . . . . . . . 40,113 1,115,141Green Plains, Inc. . . . . . . . . . . . . . . . . . . . . . . . . . . . . . . . . 17,956 308,843Gulfport Energy Corp. (a) . . . . . . . . . . . . . . . . . . . . . . . . . . 80,820 841,336Halcon Resources Corp. (a) (b) . . . . . . . . . . . . . . . . . . . . . . . 63,394 283,371HighPoint Resources Corp. (a) . . . . . . . . . . . . . . . . . . . . . . . 30,111 146,942International Seaways, Inc. (a) . . . . . . . . . . . . . . . . . . . . . . . 9,606 192,312Jagged Peak Energy, Inc. (a) (b) . . . . . . . . . . . . . . . . . . . . . 28,571 395,137Laredo Petroleum, Inc. (a) . . . . . . . . . . . . . . . . . . . . . . . . . . 72,739 594,278Matador Resources Co. (a) (b) . . . . . . . . . . . . . . . . . . . . . . . 46,595 1,539,965Nordic American Tankers, Ltd. (b) . . . . . . . . . . . . . . . . . . . . . 67,672 141,434Northern Oil and Gas, Inc. (a) . . . . . . . . . . . . . . . . . . . . . . . 91,303 365,212Oasis Petroleum, Inc. (a) (b) . . . . . . . . . . . . . . . . . . . . . . . . 124,006 1,758,405Panhandle Oil and Gas, Inc. - Class A . . . . . . . . . . . . . . . . . . . 7,855 144,925Par Pacific holdings, Inc. (a) . . . . . . . . . . . . . . . . . . . . . . . . . 16,282 332,153PDC Energy, Inc. (a) . . . . . . . . . . . . . . . . . . . . . . . . . . . . . . 28,041 1,372,887Peabody Energy Corp. . . . . . . . . . . . . . . . . . . . . . . . . . . . . 34,338 1,223,806Penn Virginia Corp. (a) . . . . . . . . . . . . . . . . . . . . . . . . . . . . 5,878 473,414Renewable Energy Group, Inc. (a) (b) . . . . . . . . . . . . . . . . . . 16,294 469,267Resolute Energy Corp. (a) (b) . . . . . . . . . . . . . . . . . . . . . . . . 11,063 418,292REX American Resources Corp. (a) . . . . . . . . . . . . . . . . . . . . . 2,989 225,819Ring Energy, Inc. (a) (b) . . . . . . . . . . . . . . . . . . . . . . . . . . . 28,500 282,435SandRidge Energy, Inc. (a) . . . . . . . . . . . . . . . . . . . . . . . . . 13,335 144,951Scorpio Tankers, Inc. . . . . . . . . . . . . . . . . . . . . . . . . . . . . . 134,645 270,636SemGroup Corp. - Class A (b) . . . . . . . . . . . . . . . . . . . . . . . . 36,615 807,361Ship Finance International, Ltd. (b) . . . . . . . . . . . . . . . . . . . . 38,547 535,803Southwestern Energy Co. (a) (b) . . . . . . . . . . . . . . . . . . . . . . 270,546 1,382,490SRC Energy, Inc. (a) (b) . . . . . . . . . . . . . . . . . . . . . . . . . . . 107,906 959,284Talos Energy, Inc. (a) (b) . . . . . . . . . . . . . . . . . . . . . . . . . . . 10,507 344,840Teekay Corp. . . . . . . . . . . . . . . . . . . . . . . . . . . . . . . . . . . 29,414 198,250Tellurian, Inc. (a) (b) . . . . . . . . . . . . . . . . . . . . . . . . . . . . . 38,940 349,292Uranium Energy Corp. (a) (b) . . . . . . . . . . . . . . . . . . . . . . . 78,766 135,478W&T Offshore, Inc. (a) . . . . . . . . . . . . . . . . . . . . . . . . . . . . 35,854 345,633WildHorse Resource Development Corp. (a) . . . . . . . . . . . . . . . 13,227 312,686World Fuel Services Corp. . . . . . . . . . . . . . . . . . . . . . . . . . . 31,238 864,668
28,547,874
Paper & Forest Products—0.6%Boise Cascade Co. . . . . . . . . . . . . . . . . . . . . . . . . . . . . . . . 18,411 677,525Clearwater Paper Corp. (a) . . . . . . . . . . . . . . . . . . . . . . . . . 7,836 232,729KapStone Paper and Packaging Corp. . . . . . . . . . . . . . . . . . . 39,372 1,335,104Louisiana-Pacific Corp. . . . . . . . . . . . . . . . . . . . . . . . . . . . . 62,872 1,665,479Neenah, Inc. (b) . . . . . . . . . . . . . . . . . . . . . . . . . . . . . . . . 7,745 668,393PH Glatfelter Co. . . . . . . . . . . . . . . . . . . . . . . . . . . . . . . . . 21,278 406,623Schweitzer-Mauduit International, Inc. . . . . . . . . . . . . . . . . . . 12,254 469,451Verso Corp. - Class A (a) . . . . . . . . . . . . . . . . . . . . . . . . . . . 16,813 566,094
6,021,398
Personal Products—0.4%Edgewell Personal Care Co. (a) (b) . . . . . . . . . . . . . . . . . . . . 24,669 1,140,448elf Beauty, Inc. (a) (b) . . . . . . . . . . . . . . . . . . . . . . . . . . . . 10,888 138,604Inter Parfums, Inc. . . . . . . . . . . . . . . . . . . . . . . . . . . . . . . . 8,191 527,910
Security Description Shares Value
Personal Products—(Continued)Medifast, Inc. . . . . . . . . . . . . . . . . . . . . . . . . . . . . . . . . . . 5,370 $ 1,189,724USANA Health Sciences, Inc. (a) (b) . . . . . . . . . . . . . . . . . . . . 5,606 675,803
3,672,489
Pharmaceuticals—2.2%Aclaris Therapeutics, Inc. (a) (b) . . . . . . . . . . . . . . . . . . . . . . 13,157 191,040Aerie Pharmaceuticals, Inc. (a) . . . . . . . . . . . . . . . . . . . . . . . 16,392 1,008,928Akcea Therapeutics, Inc. (a) . . . . . . . . . . . . . . . . . . . . . . . . . 7,356 257,607Akorn, Inc. (a) . . . . . . . . . . . . . . . . . . . . . . . . . . . . . . . . . 43,557 565,370Amneal Pharmaceuticals, Inc. (a) (b) . . . . . . . . . . . . . . . . . . . 40,537 899,516Amphastar Pharmaceuticals, Inc. (a) . . . . . . . . . . . . . . . . . . . 18,205 350,264ANI Pharmaceuticals, Inc. (a) (b) . . . . . . . . . . . . . . . . . . . . . 3,945 223,050Aratana Therapeutics, Inc. (a) . . . . . . . . . . . . . . . . . . . . . . . 23,524 137,380Assembly Biosciences, Inc. (a) (b) . . . . . . . . . . . . . . . . . . . . . 9,765 362,672Assertio Therapeutics, Inc. (a) . . . . . . . . . . . . . . . . . . . . . . . . 13,565 79,762Collegium Pharmaceutical, Inc. (a) (b) . . . . . . . . . . . . . . . . . . 14,032 206,832Corcept Therapeutics, Inc. (a) . . . . . . . . . . . . . . . . . . . . . . . . 43,446 609,113Cymabay Therapeutics, Inc. (a) . . . . . . . . . . . . . . . . . . . . . . . 28,178 312,212Dermira, Inc. (a) . . . . . . . . . . . . . . . . . . . . . . . . . . . . . . . . 18,139 197,715Dova Pharmaceuticals, Inc. (a) (b) . . . . . . . . . . . . . . . . . . . . 6,038 126,617Eloxx Pharmaceuticals, Inc. (a) . . . . . . . . . . . . . . . . . . . . . . . 14,403 245,427Endo International plc (a) . . . . . . . . . . . . . . . . . . . . . . . . . . 96,815 1,629,397Endocyte, Inc. (a) (b) . . . . . . . . . . . . . . . . . . . . . . . . . . . . . 30,890 548,606Horizon Pharma plc (a) . . . . . . . . . . . . . . . . . . . . . . . . . . . . 73,606 1,441,206Innoviva, Inc. (a) . . . . . . . . . . . . . . . . . . . . . . . . . . . . . . . . 33,334 508,010Intersect ENT, Inc. (a) . . . . . . . . . . . . . . . . . . . . . . . . . . . . . 13,971 401,666Intra-Cellular Therapies, Inc. (a) . . . . . . . . . . . . . . . . . . . . . . 19,606 425,450Mallinckrodt plc (a) (b) . . . . . . . . . . . . . . . . . . . . . . . . . . . . 38,301 1,122,602Marinus Pharmaceuticals, Inc. (a) . . . . . . . . . . . . . . . . . . . . . 18,675 186,750Medicines Co. (The) (a) (b) . . . . . . . . . . . . . . . . . . . . . . . . . 32,038 958,257MyoKardia, Inc. (a) . . . . . . . . . . . . . . . . . . . . . . . . . . . . . . 15,152 987,910Omeros Corp. (a) (b) . . . . . . . . . . . . . . . . . . . . . . . . . . . . . 21,460 523,839Optinose, Inc. (a) (b) . . . . . . . . . . . . . . . . . . . . . . . . . . . . . 8,130 101,056Pacira Pharmaceuticals, Inc. (a) . . . . . . . . . . . . . . . . . . . . . . 18,507 909,619Paratek Pharmaceuticals, Inc. (a) (b) . . . . . . . . . . . . . . . . . . . 16,222 157,353Phibro Animal Health Corp. - Class A . . . . . . . . . . . . . . . . . . . 9,993 428,700Prestige Brands Holdings, Inc. (a) (b) . . . . . . . . . . . . . . . . . . 22,778 863,059Reata Pharmaceuticals, Inc. - Class A (a) (b) . . . . . . . . . . . . . . 8,381 685,231Revance Therapeutics, Inc. (a) (b) . . . . . . . . . . . . . . . . . . . . . 15,532 385,970SIGA Technologies, Inc. (a) . . . . . . . . . . . . . . . . . . . . . . . . . 22,951 158,132Supernus Pharmaceuticals, Inc. (a) (b) . . . . . . . . . . . . . . . . . . 22,494 1,132,573TherapeuticsMD, Inc. (a) (b) . . . . . . . . . . . . . . . . . . . . . . . . 78,988 518,161Theravance Biopharma, Inc. (a) (b) . . . . . . . . . . . . . . . . . . . . 19,690 643,272Tricida, Inc. (a) . . . . . . . . . . . . . . . . . . . . . . . . . . . . . . . . . 8,210 250,816WAVE Life Sciences, Ltd. (a) . . . . . . . . . . . . . . . . . . . . . . . . . 8,571 428,550Zogenix, Inc. (a) . . . . . . . . . . . . . . . . . . . . . . . . . . . . . . . . 19,414 962,934
22,132,624
Professional Services—1.4%ASGN, Inc. (a) . . . . . . . . . . . . . . . . . . . . . . . . . . . . . . . . . . 22,539 1,779,003Barrett Business Services, Inc. . . . . . . . . . . . . . . . . . . . . . . . . 3,358 224,247CBIZ, Inc. (a) . . . . . . . . . . . . . . . . . . . . . . . . . . . . . . . . . . 24,387 577,972CRA International, Inc. . . . . . . . . . . . . . . . . . . . . . . . . . . . . 2,862 143,730Exponent, Inc. . . . . . . . . . . . . . . . . . . . . . . . . . . . . . . . . . . 23,584 1,264,103Forrester Research, Inc. . . . . . . . . . . . . . . . . . . . . . . . . . . . . 5,782 265,394FTI Consulting, Inc. (a) . . . . . . . . . . . . . . . . . . . . . . . . . . . . 16,848 1,233,105
BHFTII-222

Brighthouse Funds Trust II
MetLife Russell 2000 Index Portfolio
Schedule of Investments as of September 30, 2018 (Unaudited)
Common Stocks—(Continued)
Security Description Shares Value
Professional Services—(Continued)Heidrick & Struggles International, Inc. . . . . . . . . . . . . . . . . . 9,634 $ 326,111Huron Consulting Group, Inc. (a) . . . . . . . . . . . . . . . . . . . . . . 10,356 511,586ICF International, Inc. . . . . . . . . . . . . . . . . . . . . . . . . . . . . . 7,485 564,743InnerWorkings, Inc. (a) . . . . . . . . . . . . . . . . . . . . . . . . . . . . 18,741 148,429Insperity, Inc. . . . . . . . . . . . . . . . . . . . . . . . . . . . . . . . . . . 16,476 1,943,344Kelly Services, Inc. - Class A . . . . . . . . . . . . . . . . . . . . . . . . . 14,944 359,104Kforce, Inc. . . . . . . . . . . . . . . . . . . . . . . . . . . . . . . . . . . . . 9,613 361,449Korn/Ferry International . . . . . . . . . . . . . . . . . . . . . . . . . . . 25,738 1,267,339Mistras Group, Inc. (a) . . . . . . . . . . . . . . . . . . . . . . . . . . . . 8,222 178,171Navigant Consulting, Inc. . . . . . . . . . . . . . . . . . . . . . . . . . . . 21,686 500,079Resources Connection, Inc. . . . . . . . . . . . . . . . . . . . . . . . . . . 12,083 200,578TriNet Group, Inc. (a) . . . . . . . . . . . . . . . . . . . . . . . . . . . . . 19,326 1,088,440TrueBlue, Inc. (a) . . . . . . . . . . . . . . . . . . . . . . . . . . . . . . . . 19,573 509,877WageWorks, Inc. (a) . . . . . . . . . . . . . . . . . . . . . . . . . . . . . . 18,480 790,020
14,236,824
Real Estate Management & Development—0.5%Altisource Portfolio Solutions S.A. (a) (b) . . . . . . . . . . . . . . . . 3,645 117,478Cushman & Wakefield plc (a) . . . . . . . . . . . . . . . . . . . . . . . . 26,156 444,390Essential Properties Realty Trust, Inc. . . . . . . . . . . . . . . . . . . . 23,430 332,472Forestar Group, Inc. (a) (b) . . . . . . . . . . . . . . . . . . . . . . . . . 5,456 115,667FRP Holdings, Inc. (a) . . . . . . . . . . . . . . . . . . . . . . . . . . . . . 3,389 210,457HFF, Inc. - Class A . . . . . . . . . . . . . . . . . . . . . . . . . . . . . . . 17,641 749,390Kennedy-Wilson Holdings, Inc. . . . . . . . . . . . . . . . . . . . . . . . 56,325 1,210,988Marcus & Millichap, Inc. (a) . . . . . . . . . . . . . . . . . . . . . . . . . 9,235 320,547Newmark Group, Inc. - Class A . . . . . . . . . . . . . . . . . . . . . . . 9,665 108,151RE/MAX Holdings, Inc. - Class A . . . . . . . . . . . . . . . . . . . . . . 8,877 393,695Redfin Corp. (a) (b) . . . . . . . . . . . . . . . . . . . . . . . . . . . . . . 34,295 641,317RMR Group, Inc. (The) - Class A (b) . . . . . . . . . . . . . . . . . . . . 3,481 323,037St. Joe Co. (The) (a) (b) . . . . . . . . . . . . . . . . . . . . . . . . . . . 19,924 334,723Tejon Ranch Co. (a) (b) . . . . . . . . . . . . . . . . . . . . . . . . . . . . 9,079 197,105
5,499,417
Road & Rail—0.5%ArcBest Corp. . . . . . . . . . . . . . . . . . . . . . . . . . . . . . . . . . . 10,451 507,396Avis Budget Group, Inc. (a) . . . . . . . . . . . . . . . . . . . . . . . . . 29,503 948,226Covenant Transportation Group, Inc. - Class A (a) . . . . . . . . . . . 5,776 167,850Daseke, Inc. (a) . . . . . . . . . . . . . . . . . . . . . . . . . . . . . . . . . 19,836 159,085Heartland Express, Inc. . . . . . . . . . . . . . . . . . . . . . . . . . . . . 22,410 442,149Hertz Global Holdings, Inc. (a) (b) . . . . . . . . . . . . . . . . . . . . 26,814 437,873Marten Transport, Ltd. . . . . . . . . . . . . . . . . . . . . . . . . . . . . 19,376 407,865Saia, Inc. (a) . . . . . . . . . . . . . . . . . . . . . . . . . . . . . . . . . . . 11,835 904,786Universal Logistics Holdings, Inc. . . . . . . . . . . . . . . . . . . . . . . 4,017 147,826US Xpress Enterprises, Inc. - Class A (a) . . . . . . . . . . . . . . . . . 17,067 235,525Werner Enterprises, Inc. (b) . . . . . . . . . . . . . . . . . . . . . . . . . 22,043 779,220YRC Worldwide, Inc. (a) . . . . . . . . . . . . . . . . . . . . . . . . . . . 14,785 132,769
5,270,570
Semiconductors & Semiconductor Equipment—2.4%Advanced Energy Industries, Inc. (a) . . . . . . . . . . . . . . . . . . . 17,261 891,531Ambarella, Inc. (a) (b) . . . . . . . . . . . . . . . . . . . . . . . . . . . . 14,056 543,686Amkor Technology, Inc. (a) . . . . . . . . . . . . . . . . . . . . . . . . . 46,149 341,041Aquantia Corp. (a) (b) . . . . . . . . . . . . . . . . . . . . . . . . . . . . 10,607 135,664Axcelis Technologies, Inc. (a) . . . . . . . . . . . . . . . . . . . . . . . . 13,934 273,803AXT, Inc. (a) (b) . . . . . . . . . . . . . . . . . . . . . . . . . . . . . . . . 18,990 135,779
Security Description Shares Value
Semiconductors & Semiconductor Equipment—(Continued)Brooks Automation, Inc. . . . . . . . . . . . . . . . . . . . . . . . . . . . 29,420 $ 1,030,583Cabot Microelectronics Corp. (b) . . . . . . . . . . . . . . . . . . . . . . 11,541 1,190,685Ceva, Inc. (a) . . . . . . . . . . . . . . . . . . . . . . . . . . . . . . . . . . 10,183 292,761Cirrus Logic, Inc. (a) . . . . . . . . . . . . . . . . . . . . . . . . . . . . . . 26,378 1,018,191Cohu, Inc. . . . . . . . . . . . . . . . . . . . . . . . . . . . . . . . . . . . . . 11,848 297,385Cree, Inc. (a) (b) . . . . . . . . . . . . . . . . . . . . . . . . . . . . . . . . 43,635 1,652,457Diodes, Inc. (a) . . . . . . . . . . . . . . . . . . . . . . . . . . . . . . . . . 18,315 609,706Entegris, Inc. . . . . . . . . . . . . . . . . . . . . . . . . . . . . . . . . . . . 61,443 1,778,775FormFactor, Inc. (a) (d) . . . . . . . . . . . . . . . . . . . . . . . . . . . 31,702 435,903Ichor Holdings, Ltd. (a) (b) . . . . . . . . . . . . . . . . . . . . . . . . . 12,029 245,632Impinj, Inc. (a) (b) . . . . . . . . . . . . . . . . . . . . . . . . . . . . . . . 8,561 212,484Inphi Corp. (a) (b) . . . . . . . . . . . . . . . . . . . . . . . . . . . . . . . 19,424 737,724Integrated Device Technology, Inc. (a) . . . . . . . . . . . . . . . . . . 55,643 2,615,777Lattice Semiconductor Corp. (a) . . . . . . . . . . . . . . . . . . . . . . 55,030 440,240MACOM Technology Solutions Holdings, Inc. (a) (b) . . . . . . . . . 18,984 391,070MaxLinear, Inc. (a) (b) . . . . . . . . . . . . . . . . . . . . . . . . . . . . 26,699 530,776Nanometrics, Inc. (a) . . . . . . . . . . . . . . . . . . . . . . . . . . . . . 9,845 369,384NeoPhotonics Corp. (a) (b) . . . . . . . . . . . . . . . . . . . . . . . . . 16,522 137,133NVE Corp. . . . . . . . . . . . . . . . . . . . . . . . . . . . . . . . . . . . . . 2,605 275,817Photronics, Inc. (a) . . . . . . . . . . . . . . . . . . . . . . . . . . . . . . . 30,362 299,066Power Integrations, Inc. . . . . . . . . . . . . . . . . . . . . . . . . . . . 11,988 757,642Rambus, Inc. (a) . . . . . . . . . . . . . . . . . . . . . . . . . . . . . . . . 49,965 545,118Rudolph Technologies, Inc. (a) . . . . . . . . . . . . . . . . . . . . . . . 13,085 319,928Semtech Corp. (a) . . . . . . . . . . . . . . . . . . . . . . . . . . . . . . . 27,797 1,545,513Silicon Laboratories, Inc. (a) . . . . . . . . . . . . . . . . . . . . . . . . . 18,379 1,687,192SMART Global Holdings, Inc. (a) . . . . . . . . . . . . . . . . . . . . . . 4,560 131,054SunPower Corp. (a) (b) . . . . . . . . . . . . . . . . . . . . . . . . . . . . 31,453 229,607Synaptics, Inc. (a) (b) . . . . . . . . . . . . . . . . . . . . . . . . . . . . . 14,825 676,316Ultra Clean Holdings, Inc. (a) . . . . . . . . . . . . . . . . . . . . . . . . 16,793 210,752Veeco Instruments, Inc. (a) (b) . . . . . . . . . . . . . . . . . . . . . . . 22,250 228,063Xcerra Corp. (a) . . . . . . . . . . . . . . . . . . . . . . . . . . . . . . . . 26,473 377,770Xperi Corp. (b) . . . . . . . . . . . . . . . . . . . . . . . . . . . . . . . . . 24,436 362,875
23,954,883
Software—5.2%8x8, Inc. (a) . . . . . . . . . . . . . . . . . . . . . . . . . . . . . . . . . . . 41,065 872,631A10 Networks, Inc. (a) . . . . . . . . . . . . . . . . . . . . . . . . . . . . 21,727 132,100ACI Worldwide, Inc. (a) . . . . . . . . . . . . . . . . . . . . . . . . . . . . 49,533 1,393,859Alarm.com Holdings, Inc. (a) . . . . . . . . . . . . . . . . . . . . . . . . 14,286 820,016Altair Engineering, Inc. - Class A (a) . . . . . . . . . . . . . . . . . . . . 13,495 586,358Alteryx, Inc. - Class A (a) . . . . . . . . . . . . . . . . . . . . . . . . . . . 12,993 743,330American Software, Inc. - Class A . . . . . . . . . . . . . . . . . . . . . 12,761 154,791Appfolio, Inc. - Class A (a) . . . . . . . . . . . . . . . . . . . . . . . . . . 6,877 539,157Apptio, Inc. - Class A (a) . . . . . . . . . . . . . . . . . . . . . . . . . . . 15,604 576,724Avalara, Inc. (a) . . . . . . . . . . . . . . . . . . . . . . . . . . . . . . . . 6,568 229,420Avaya Holdings Corp. (a) . . . . . . . . . . . . . . . . . . . . . . . . . . 46,353 1,026,255Benefitfocus, Inc. (a) (b) . . . . . . . . . . . . . . . . . . . . . . . . . . . 9,362 378,693Blackbaud, Inc. (b) . . . . . . . . . . . . . . . . . . . . . . . . . . . . . . . 20,813 2,112,103Blackline, Inc. (a) . . . . . . . . . . . . . . . . . . . . . . . . . . . . . . . 14,923 842,702Bottomline Technologies de, Inc. (a) . . . . . . . . . . . . . . . . . . . 17,336 1,260,501Box, Inc. - Class A (a) (b) . . . . . . . . . . . . . . . . . . . . . . . . . . 53,384 1,276,411ChannelAdvisor Corp. (a) . . . . . . . . . . . . . . . . . . . . . . . . . . . 10,403 129,517Cision, Ltd. (a) . . . . . . . . . . . . . . . . . . . . . . . . . . . . . . . . . 24,259 407,551Cloudera, Inc. (a) . . . . . . . . . . . . . . . . . . . . . . . . . . . . . . . . 44,625 787,631CommVault Systems, Inc. (a) . . . . . . . . . . . . . . . . . . . . . . . . 17,956 1,256,920Cornerstone OnDemand, Inc. (a) . . . . . . . . . . . . . . . . . . . . . . 24,008 1,362,454
BHFTII-223

Brighthouse Funds Trust II
MetLife Russell 2000 Index Portfolio
Schedule of Investments as of September 30, 2018 (Unaudited)
Common Stocks—(Continued)
Security Description Shares Value
Software—(Continued)Coupa Software, Inc. (a) . . . . . . . . . . . . . . . . . . . . . . . . . . . 22,830 $ 1,805,853Digimarc Corp. (a) . . . . . . . . . . . . . . . . . . . . . . . . . . . . . . . 3,943 124,007Ebix, Inc. (b) . . . . . . . . . . . . . . . . . . . . . . . . . . . . . . . . . . . 10,806 855,295Ellie Mae, Inc. (a) (b) . . . . . . . . . . . . . . . . . . . . . . . . . . . . . 14,424 1,366,962Envestnet, Inc. (a) (b) . . . . . . . . . . . . . . . . . . . . . . . . . . . . . 20,207 1,231,617Everbridge, Inc. (a) . . . . . . . . . . . . . . . . . . . . . . . . . . . . . . 12,141 699,807Five9, Inc. (a) . . . . . . . . . . . . . . . . . . . . . . . . . . . . . . . . . . 24,673 1,077,963ForeScout Technologies, Inc. (a) . . . . . . . . . . . . . . . . . . . . . . 13,416 506,588Hortonworks, Inc. (a) . . . . . . . . . . . . . . . . . . . . . . . . . . . . . 31,713 723,374HubSpot, Inc. (a) . . . . . . . . . . . . . . . . . . . . . . . . . . . . . . . . 15,654 2,362,971Imperva, Inc. (a) . . . . . . . . . . . . . . . . . . . . . . . . . . . . . . . . 15,746 731,402Instructure, Inc. (a) (b) . . . . . . . . . . . . . . . . . . . . . . . . . . . . 14,481 512,627j2 Global, Inc. (b) . . . . . . . . . . . . . . . . . . . . . . . . . . . . . . . 19,963 1,653,935LivePerson, Inc. (a) . . . . . . . . . . . . . . . . . . . . . . . . . . . . . . 24,337 631,545LiveRamp Holdings, Inc. (a) . . . . . . . . . . . . . . . . . . . . . . . . . 34,321 1,695,801MicroStrategy, Inc. - Class A (a) . . . . . . . . . . . . . . . . . . . . . . 4,222 593,698MINDBODY, Inc. - Class A (a) . . . . . . . . . . . . . . . . . . . . . . . . 20,014 813,569MobileIron, Inc. (a) . . . . . . . . . . . . . . . . . . . . . . . . . . . . . . 28,325 150,123Model N, Inc. (a) . . . . . . . . . . . . . . . . . . . . . . . . . . . . . . . . 11,583 183,591Monotype Imaging Holdings, Inc. . . . . . . . . . . . . . . . . . . . . . 18,592 375,558New Relic, Inc. (a) . . . . . . . . . . . . . . . . . . . . . . . . . . . . . . . 19,122 1,801,866OneSpan, Inc. (a) (b) . . . . . . . . . . . . . . . . . . . . . . . . . . . . . 15,031 286,341Paylocity Holding Corp. (a) . . . . . . . . . . . . . . . . . . . . . . . . . 13,301 1,068,336Progress Software Corp. . . . . . . . . . . . . . . . . . . . . . . . . . . . 21,029 742,113PROS Holdings, Inc. (a) . . . . . . . . . . . . . . . . . . . . . . . . . . . . 12,910 452,108Q2 Holdings, Inc. (a) . . . . . . . . . . . . . . . . . . . . . . . . . . . . . 16,765 1,015,121QAD, Inc. - Class A . . . . . . . . . . . . . . . . . . . . . . . . . . . . . . . 4,798 271,807Qualys, Inc. (a) (b) . . . . . . . . . . . . . . . . . . . . . . . . . . . . . . 14,838 1,322,066Rapid7, Inc. (a) . . . . . . . . . . . . . . . . . . . . . . . . . . . . . . . . . 16,703 616,675SailPoint Technologies Holding, Inc. (a) . . . . . . . . . . . . . . . . . 23,515 799,980SendGrid, Inc. (a) . . . . . . . . . . . . . . . . . . . . . . . . . . . . . . . 12,940 476,063ShotSpotter, Inc. (a) . . . . . . . . . . . . . . . . . . . . . . . . . . . . . . 3,603 220,828SPS Commerce, Inc. (a) . . . . . . . . . . . . . . . . . . . . . . . . . . . . 7,550 749,262Tenable Holdings, Inc. (a) . . . . . . . . . . . . . . . . . . . . . . . . . . 8,652 336,390TiVo Corp. (b) . . . . . . . . . . . . . . . . . . . . . . . . . . . . . . . . . . 54,357 676,745Trade Desk, Inc. (The) - Class A (a) (b) . . . . . . . . . . . . . . . . . . 14,265 2,152,731Upland Software, Inc. (a) . . . . . . . . . . . . . . . . . . . . . . . . . . 7,503 242,422Varonis Systems, Inc. (a) . . . . . . . . . . . . . . . . . . . . . . . . . . . 12,721 931,813Verint Systems, Inc. (a) . . . . . . . . . . . . . . . . . . . . . . . . . . . . 28,969 1,451,347Workiva, Inc. (a) . . . . . . . . . . . . . . . . . . . . . . . . . . . . . . . . 11,206 442,637Yext, Inc. (a) . . . . . . . . . . . . . . . . . . . . . . . . . . . . . . . . . . 37,385 886,024Zix Corp. (a) . . . . . . . . . . . . . . . . . . . . . . . . . . . . . . . . . . . 25,140 139,527Zscaler, Inc. (a) (b) . . . . . . . . . . . . . . . . . . . . . . . . . . . . . . 5,862 239,052
52,306,664
Specialty Retail—3.1%Aaron’s, Inc. . . . . . . . . . . . . . . . . . . . . . . . . . . . . . . . . . . . 30,071 1,637,667Abercrombie & Fitch Co. - Class A (b) . . . . . . . . . . . . . . . . . . . 28,497 601,857America’s Car-Mart, Inc. (a) . . . . . . . . . . . . . . . . . . . . . . . . . 2,826 220,993American Eagle Outfitters, Inc. . . . . . . . . . . . . . . . . . . . . . . . 73,095 1,814,949Asbury Automotive Group, Inc. (a) (b) . . . . . . . . . . . . . . . . . . 9,029 620,744Ascena Retail Group, Inc. (a) (b) . . . . . . . . . . . . . . . . . . . . . . 80,127 366,180At Home Group, Inc. (a) (b) . . . . . . . . . . . . . . . . . . . . . . . . . 19,716 621,646Barnes & Noble, Inc. . . . . . . . . . . . . . . . . . . . . . . . . . . . . . . 9,830 57,014Bed Bath & Beyond, Inc. (b) . . . . . . . . . . . . . . . . . . . . . . . . 61,523 922,845Boot Barn Holdings, Inc. (a) (b) . . . . . . . . . . . . . . . . . . . . . . 12,612 358,307
Security Description Shares Value
Specialty Retail—(Continued)Buckle, Inc. (The) (b) . . . . . . . . . . . . . . . . . . . . . . . . . . . . . 14,188 $ 327,033Caleres, Inc. . . . . . . . . . . . . . . . . . . . . . . . . . . . . . . . . . . . 20,189 723,978Camping World Holdings, Inc. - Class A (b) . . . . . . . . . . . . . . . 14,592 311,101Carvana Co. (a) (b) . . . . . . . . . . . . . . . . . . . . . . . . . . . . . . 14,356 848,296Cato Corp. (The) - Class A . . . . . . . . . . . . . . . . . . . . . . . . . . 9,562 200,993Chico’s FAS, Inc. (b) . . . . . . . . . . . . . . . . . . . . . . . . . . . . . . 59,471 515,614Children’s Place, Inc. (The) . . . . . . . . . . . . . . . . . . . . . . . . . . 7,101 907,508Citi Trends, Inc. . . . . . . . . . . . . . . . . . . . . . . . . . . . . . . . . . 4,579 131,738Conn’s, Inc. (a) . . . . . . . . . . . . . . . . . . . . . . . . . . . . . . . . . 10,289 363,716DSW, Inc. - Class A . . . . . . . . . . . . . . . . . . . . . . . . . . . . . . . 31,615 1,071,116Express, Inc. (a) (b) . . . . . . . . . . . . . . . . . . . . . . . . . . . . . . 34,677 383,528Five Below, Inc. (a) . . . . . . . . . . . . . . . . . . . . . . . . . . . . . . 23,446 3,049,387GameStop Corp. - Class A (b) . . . . . . . . . . . . . . . . . . . . . . . . 46,271 706,558Genesco, Inc. (a) (b) . . . . . . . . . . . . . . . . . . . . . . . . . . . . . . 8,683 408,969GNC Holdings, Inc. - Class A (a) . . . . . . . . . . . . . . . . . . . . . . 41,490 171,769Group 1 Automotive, Inc. . . . . . . . . . . . . . . . . . . . . . . . . . . 7,911 513,424Guess?, Inc. . . . . . . . . . . . . . . . . . . . . . . . . . . . . . . . . . . . 25,521 576,775Haverty Furniture Cos., Inc. (b) . . . . . . . . . . . . . . . . . . . . . . . 10,391 229,641Hibbett Sports, Inc. (a) (b) . . . . . . . . . . . . . . . . . . . . . . . . . . 10,209 191,929Hudson, Ltd. - Class A (a) . . . . . . . . . . . . . . . . . . . . . . . . . . 18,056 407,343Lithia Motors, Inc. - Class A (b) . . . . . . . . . . . . . . . . . . . . . . . 10,519 858,982Lumber Liquidators Holdings, Inc. (a) (b) . . . . . . . . . . . . . . . . 13,856 214,629MarineMax, Inc. (a) . . . . . . . . . . . . . . . . . . . . . . . . . . . . . . 12,696 269,790Monro, Inc. . . . . . . . . . . . . . . . . . . . . . . . . . . . . . . . . . . . . 13,506 940,018Murphy USA, Inc. (a) (b) . . . . . . . . . . . . . . . . . . . . . . . . . . . 12,944 1,106,194National Vision Holdings, Inc. (a) . . . . . . . . . . . . . . . . . . . . . 22,276 1,005,539Office Depot, Inc. . . . . . . . . . . . . . . . . . . . . . . . . . . . . . . . . 216,434 694,753Party City Holdco, Inc. (a) . . . . . . . . . . . . . . . . . . . . . . . . . . 25,796 349,536Rent-A-Center, Inc. (a) . . . . . . . . . . . . . . . . . . . . . . . . . . . . 21,277 305,963RH (a) (b) . . . . . . . . . . . . . . . . . . . . . . . . . . . . . . . . . . . . 8,668 1,135,595Sally Beauty Holdings, Inc. (a) (b) . . . . . . . . . . . . . . . . . . . . . 56,288 1,035,136Shoe Carnival, Inc. (b) . . . . . . . . . . . . . . . . . . . . . . . . . . . . 4,114 158,389Signet Jewelers, Ltd. . . . . . . . . . . . . . . . . . . . . . . . . . . . . . . 25,288 1,667,238Sleep Number Corp. (a) (b) . . . . . . . . . . . . . . . . . . . . . . . . . 14,171 521,209Sonic Automotive, Inc. - Class A . . . . . . . . . . . . . . . . . . . . . . . 9,480 183,438Tailored Brands, Inc. (b) . . . . . . . . . . . . . . . . . . . . . . . . . . . 22,434 565,112Tile Shop Holdings, Inc. . . . . . . . . . . . . . . . . . . . . . . . . . . . . 20,043 143,307Tilly’s, Inc. - Class A . . . . . . . . . . . . . . . . . . . . . . . . . . . . . . 7,301 138,354Winmark Corp. . . . . . . . . . . . . . . . . . . . . . . . . . . . . . . . . . 1,140 189,240Zumiez, Inc. (a) . . . . . . . . . . . . . . . . . . . . . . . . . . . . . . . . . 10,452 275,410
31,020,450
Technology Hardware, Storage & Peripherals—0.3%3D Systems Corp. (a) (b) . . . . . . . . . . . . . . . . . . . . . . . . . . . 50,283 950,349Cray, Inc. (a) . . . . . . . . . . . . . . . . . . . . . . . . . . . . . . . . . . 19,290 414,735Diebold Nixdorf, Inc. (b) . . . . . . . . . . . . . . . . . . . . . . . . . . . 35,435 159,457Electronics for Imaging, Inc. (a) (b) . . . . . . . . . . . . . . . . . . . . 18,879 643,396Immersion Corp. (a) . . . . . . . . . . . . . . . . . . . . . . . . . . . . . . 14,029 148,287Stratasys, Ltd. (a) (b) . . . . . . . . . . . . . . . . . . . . . . . . . . . . . 23,667 546,944USA Technologies, Inc. (a) . . . . . . . . . . . . . . . . . . . . . . . . . . 23,924 172,253
3,035,421
Textiles, Apparel & Luxury Goods—0.8%Crocs, Inc. (a) (d) . . . . . . . . . . . . . . . . . . . . . . . . . . . . . . . . 31,969 680,620Culp, Inc. . . . . . . . . . . . . . . . . . . . . . . . . . . . . . . . . . . . . . 4,697 113,667Deckers Outdoor Corp. (a) . . . . . . . . . . . . . . . . . . . . . . . . . . 13,276 1,574,268
BHFTII-224
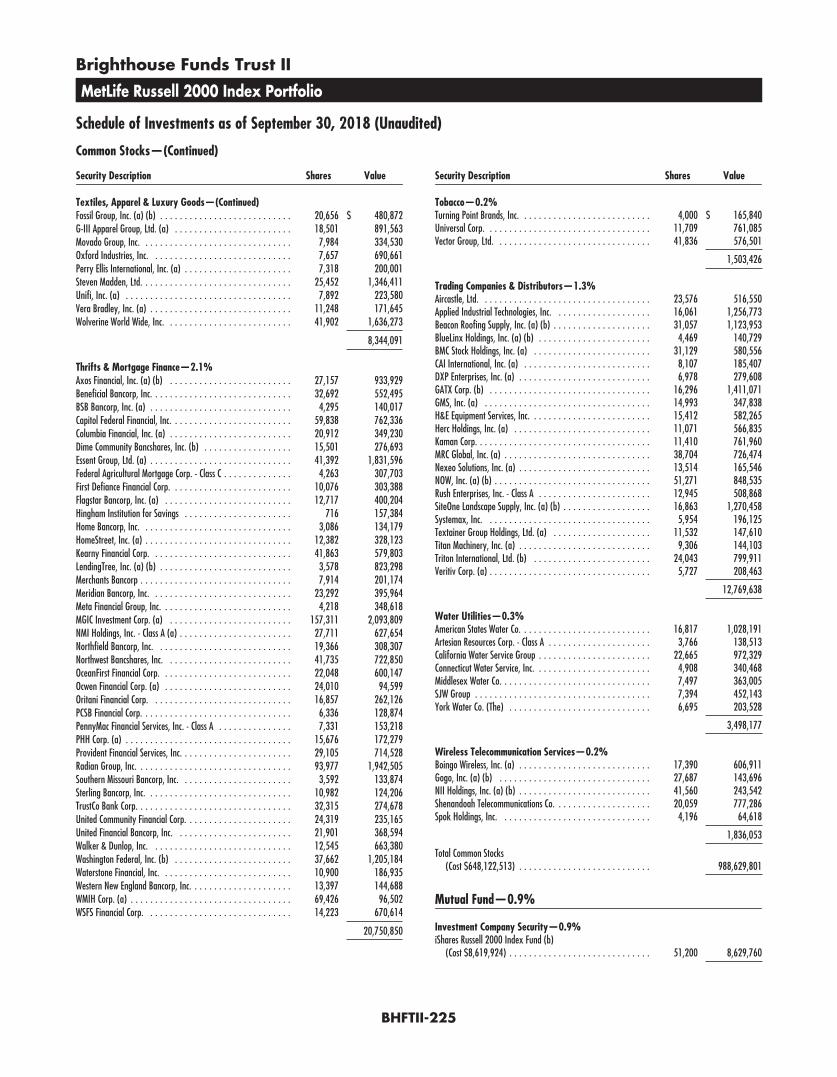
Brighthouse Funds Trust II
MetLife Russell 2000 Index Portfolio
Schedule of Investments as of September 30, 2018 (Unaudited)
Common Stocks—(Continued)
Security Description Shares Value
Textiles, Apparel & Luxury Goods—(Continued)Fossil Group, Inc. (a) (b) . . . . . . . . . . . . . . . . . . . . . . . . . . . 20,656 $ 480,872G-III Apparel Group, Ltd. (a) . . . . . . . . . . . . . . . . . . . . . . . . 18,501 891,563Movado Group, Inc. . . . . . . . . . . . . . . . . . . . . . . . . . . . . . . 7,984 334,530Oxford Industries, Inc. . . . . . . . . . . . . . . . . . . . . . . . . . . . . 7,657 690,661Perry Ellis International, Inc. (a) . . . . . . . . . . . . . . . . . . . . . . 7,318 200,001Steven Madden, Ltd. . . . . . . . . . . . . . . . . . . . . . . . . . . . . . . 25,452 1,346,411Unifi, Inc. (a) . . . . . . . . . . . . . . . . . . . . . . . . . . . . . . . . . . 7,892 223,580Vera Bradley, Inc. (a) . . . . . . . . . . . . . . . . . . . . . . . . . . . . . 11,248 171,645Wolverine World Wide, Inc. . . . . . . . . . . . . . . . . . . . . . . . . . 41,902 1,636,273
8,344,091
Thrifts & Mortgage Finance—2.1%Axos Financial, Inc. (a) (b) . . . . . . . . . . . . . . . . . . . . . . . . . 27,157 933,929Beneficial Bancorp, Inc. . . . . . . . . . . . . . . . . . . . . . . . . . . . . 32,692 552,495BSB Bancorp, Inc. (a) . . . . . . . . . . . . . . . . . . . . . . . . . . . . . 4,295 140,017Capitol Federal Financial, Inc. . . . . . . . . . . . . . . . . . . . . . . . . 59,838 762,336Columbia Financial, Inc. (a) . . . . . . . . . . . . . . . . . . . . . . . . . 20,912 349,230Dime Community Bancshares, Inc. (b) . . . . . . . . . . . . . . . . . . 15,501 276,693Essent Group, Ltd. (a) . . . . . . . . . . . . . . . . . . . . . . . . . . . . . 41,392 1,831,596Federal Agricultural Mortgage Corp. - Class C . . . . . . . . . . . . . . 4,263 307,703First Defiance Financial Corp. . . . . . . . . . . . . . . . . . . . . . . . . 10,076 303,388Flagstar Bancorp, Inc. (a) . . . . . . . . . . . . . . . . . . . . . . . . . . 12,717 400,204Hingham Institution for Savings . . . . . . . . . . . . . . . . . . . . . . 716 157,384Home Bancorp, Inc. . . . . . . . . . . . . . . . . . . . . . . . . . . . . . . 3,086 134,179HomeStreet, Inc. (a) . . . . . . . . . . . . . . . . . . . . . . . . . . . . . . 12,382 328,123Kearny Financial Corp. . . . . . . . . . . . . . . . . . . . . . . . . . . . . 41,863 579,803LendingTree, Inc. (a) (b) . . . . . . . . . . . . . . . . . . . . . . . . . . . 3,578 823,298Merchants Bancorp . . . . . . . . . . . . . . . . . . . . . . . . . . . . . . . 7,914 201,174Meridian Bancorp, Inc. . . . . . . . . . . . . . . . . . . . . . . . . . . . . 23,292 395,964Meta Financial Group, Inc. . . . . . . . . . . . . . . . . . . . . . . . . . . 4,218 348,618MGIC Investment Corp. (a) . . . . . . . . . . . . . . . . . . . . . . . . . 157,311 2,093,809NMI Holdings, Inc. - Class A (a) . . . . . . . . . . . . . . . . . . . . . . . 27,711 627,654Northfield Bancorp, Inc. . . . . . . . . . . . . . . . . . . . . . . . . . . . 19,366 308,307Northwest Bancshares, Inc. . . . . . . . . . . . . . . . . . . . . . . . . . 41,735 722,850OceanFirst Financial Corp. . . . . . . . . . . . . . . . . . . . . . . . . . . 22,048 600,147Ocwen Financial Corp. (a) . . . . . . . . . . . . . . . . . . . . . . . . . . 24,010 94,599Oritani Financial Corp. . . . . . . . . . . . . . . . . . . . . . . . . . . . . 16,857 262,126PCSB Financial Corp. . . . . . . . . . . . . . . . . . . . . . . . . . . . . . . 6,336 128,874PennyMac Financial Services, Inc. - Class A . . . . . . . . . . . . . . . 7,331 153,218PHH Corp. (a) . . . . . . . . . . . . . . . . . . . . . . . . . . . . . . . . . . 15,676 172,279Provident Financial Services, Inc. . . . . . . . . . . . . . . . . . . . . . . 29,105 714,528Radian Group, Inc. . . . . . . . . . . . . . . . . . . . . . . . . . . . . . . . 93,977 1,942,505Southern Missouri Bancorp, Inc. . . . . . . . . . . . . . . . . . . . . . . 3,592 133,874Sterling Bancorp, Inc. . . . . . . . . . . . . . . . . . . . . . . . . . . . . . 10,982 124,206TrustCo Bank Corp. . . . . . . . . . . . . . . . . . . . . . . . . . . . . . . . 32,315 274,678United Community Financial Corp. . . . . . . . . . . . . . . . . . . . . . 24,319 235,165United Financial Bancorp, Inc. . . . . . . . . . . . . . . . . . . . . . . . 21,901 368,594Walker & Dunlop, Inc. . . . . . . . . . . . . . . . . . . . . . . . . . . . . 12,545 663,380Washington Federal, Inc. (b) . . . . . . . . . . . . . . . . . . . . . . . . 37,662 1,205,184Waterstone Financial, Inc. . . . . . . . . . . . . . . . . . . . . . . . . . . 10,900 186,935Western New England Bancorp, Inc. . . . . . . . . . . . . . . . . . . . . 13,397 144,688WMIH Corp. (a) . . . . . . . . . . . . . . . . . . . . . . . . . . . . . . . . . 69,426 96,502WSFS Financial Corp. . . . . . . . . . . . . . . . . . . . . . . . . . . . . . 14,223 670,614
20,750,850
Security Description Shares Value
Tobacco—0.2%Turning Point Brands, Inc. . . . . . . . . . . . . . . . . . . . . . . . . . . 4,000 $ 165,840Universal Corp. . . . . . . . . . . . . . . . . . . . . . . . . . . . . . . . . . 11,709 761,085Vector Group, Ltd. . . . . . . . . . . . . . . . . . . . . . . . . . . . . . . . 41,836 576,501
1,503,426
Trading Companies & Distributors—1.3%Aircastle, Ltd. . . . . . . . . . . . . . . . . . . . . . . . . . . . . . . . . . . 23,576 516,550Applied Industrial Technologies, Inc. . . . . . . . . . . . . . . . . . . . 16,061 1,256,773Beacon Roofing Supply, Inc. (a) (b) . . . . . . . . . . . . . . . . . . . . 31,057 1,123,953BlueLinx Holdings, Inc. (a) (b) . . . . . . . . . . . . . . . . . . . . . . . 4,469 140,729BMC Stock Holdings, Inc. (a) . . . . . . . . . . . . . . . . . . . . . . . . 31,129 580,556CAI International, Inc. (a) . . . . . . . . . . . . . . . . . . . . . . . . . . 8,107 185,407DXP Enterprises, Inc. (a) . . . . . . . . . . . . . . . . . . . . . . . . . . . 6,978 279,608GATX Corp. (b) . . . . . . . . . . . . . . . . . . . . . . . . . . . . . . . . . 16,296 1,411,071GMS, Inc. (a) . . . . . . . . . . . . . . . . . . . . . . . . . . . . . . . . . . 14,993 347,838H&E Equipment Services, Inc. . . . . . . . . . . . . . . . . . . . . . . . . 15,412 582,265Herc Holdings, Inc. (a) . . . . . . . . . . . . . . . . . . . . . . . . . . . . 11,071 566,835Kaman Corp. . . . . . . . . . . . . . . . . . . . . . . . . . . . . . . . . . . . 11,410 761,960MRC Global, Inc. (a) . . . . . . . . . . . . . . . . . . . . . . . . . . . . . . 38,704 726,474Nexeo Solutions, Inc. (a) . . . . . . . . . . . . . . . . . . . . . . . . . . . 13,514 165,546NOW, Inc. (a) (b) . . . . . . . . . . . . . . . . . . . . . . . . . . . . . . . . 51,271 848,535Rush Enterprises, Inc. - Class A . . . . . . . . . . . . . . . . . . . . . . . 12,945 508,868SiteOne Landscape Supply, Inc. (a) (b) . . . . . . . . . . . . . . . . . . 16,863 1,270,458Systemax, Inc. . . . . . . . . . . . . . . . . . . . . . . . . . . . . . . . . . 5,954 196,125Textainer Group Holdings, Ltd. (a) . . . . . . . . . . . . . . . . . . . . 11,532 147,610Titan Machinery, Inc. (a) . . . . . . . . . . . . . . . . . . . . . . . . . . . 9,306 144,103Triton International, Ltd. (b) . . . . . . . . . . . . . . . . . . . . . . . . 24,043 799,911Veritiv Corp. (a) . . . . . . . . . . . . . . . . . . . . . . . . . . . . . . . . . 5,727 208,463
12,769,638
Water Utilities—0.3%American States Water Co. . . . . . . . . . . . . . . . . . . . . . . . . . . 16,817 1,028,191Artesian Resources Corp. - Class A . . . . . . . . . . . . . . . . . . . . . 3,766 138,513California Water Service Group . . . . . . . . . . . . . . . . . . . . . . . 22,665 972,329Connecticut Water Service, Inc. . . . . . . . . . . . . . . . . . . . . . . . 4,908 340,468Middlesex Water Co. . . . . . . . . . . . . . . . . . . . . . . . . . . . . . . 7,497 363,005SJW Group . . . . . . . . . . . . . . . . . . . . . . . . . . . . . . . . . . . . 7,394 452,143York Water Co. (The) . . . . . . . . . . . . . . . . . . . . . . . . . . . . . 6,695 203,528
3,498,177
Wireless Telecommunication Services—0.2%Boingo Wireless, Inc. (a) . . . . . . . . . . . . . . . . . . . . . . . . . . . 17,390 606,911Gogo, Inc. (a) (b) . . . . . . . . . . . . . . . . . . . . . . . . . . . . . . . 27,687 143,696NII Holdings, Inc. (a) (b) . . . . . . . . . . . . . . . . . . . . . . . . . . . 41,560 243,542Shenandoah Telecommunications Co. . . . . . . . . . . . . . . . . . . . 20,059 777,286Spok Holdings, Inc. . . . . . . . . . . . . . . . . . . . . . . . . . . . . . . 4,196 64,618
1,836,053
Total Common Stocks(Cost $648,122,513) . . . . . . . . . . . . . . . . . . . . . . . . . . . 988,629,801
Mutual Fund—0.9%
Investment Company Security—0.9%iShares Russell 2000 Index Fund (b)
(Cost $8,619,924) . . . . . . . . . . . . . . . . . . . . . . . . . . . . . 51,200 8,629,760
BHFTII-225
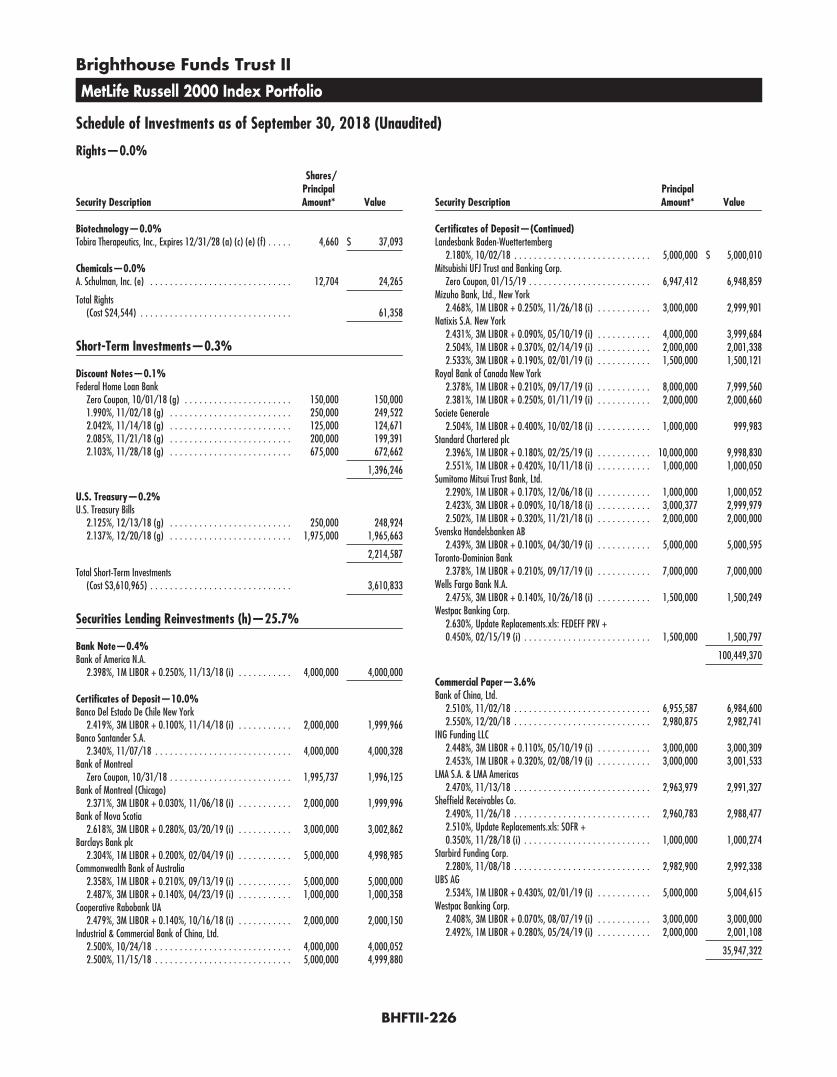
Brighthouse Funds Trust II
MetLife Russell 2000 Index Portfolio
Schedule of Investments as of September 30, 2018 (Unaudited)
Rights—0.0%
Security Description
Shares/PrincipalAmount* Value
Biotechnology—0.0%Tobira Therapeutics, Inc., Expires 12/31/28 (a) (c) (e) (f) . . . . . 4,660 $ 37,093
Chemicals—0.0%A. Schulman, Inc. (e) . . . . . . . . . . . . . . . . . . . . . . . . . . . . . 12,704 24,265
Total Rights(Cost $24,544) . . . . . . . . . . . . . . . . . . . . . . . . . . . . . . . 61,358
Short-Term Investments—0.3%
Discount Notes—0.1%Federal Home Loan Bank
Zero Coupon, 10/01/18 (g) . . . . . . . . . . . . . . . . . . . . . . 150,000 150,0001.990%, 11/02/18 (g) . . . . . . . . . . . . . . . . . . . . . . . . . 250,000 249,5222.042%, 11/14/18 (g) . . . . . . . . . . . . . . . . . . . . . . . . . 125,000 124,6712.085%, 11/21/18 (g) . . . . . . . . . . . . . . . . . . . . . . . . . 200,000 199,3912.103%, 11/28/18 (g) . . . . . . . . . . . . . . . . . . . . . . . . . 675,000 672,662
1,396,246
U.S. Treasury—0.2%U.S. Treasury Bills
2.125%, 12/13/18 (g) . . . . . . . . . . . . . . . . . . . . . . . . . 250,000 248,9242.137%, 12/20/18 (g) . . . . . . . . . . . . . . . . . . . . . . . . . 1,975,000 1,965,663
2,214,587
Total Short-Term Investments(Cost $3,610,965) . . . . . . . . . . . . . . . . . . . . . . . . . . . . . 3,610,833
Securities Lending Reinvestments (h)—25.7%
Bank Note—0.4%Bank of America N.A.
2.398%, 1M LIBOR + 0.250%, 11/13/18 (i) . . . . . . . . . . . 4,000,000 4,000,000
Certificates of Deposit—10.0%Banco Del Estado De Chile New York
2.419%, 3M LIBOR + 0.100%, 11/14/18 (i) . . . . . . . . . . . 2,000,000 1,999,966Banco Santander S.A.
2.340%, 11/07/18 . . . . . . . . . . . . . . . . . . . . . . . . . . . . 4,000,000 4,000,328Bank of Montreal
Zero Coupon, 10/31/18 . . . . . . . . . . . . . . . . . . . . . . . . . 1,995,737 1,996,125Bank of Montreal (Chicago)
2.371%, 3M LIBOR + 0.030%, 11/06/18 (i) . . . . . . . . . . . 2,000,000 1,999,996Bank of Nova Scotia
2.618%, 3M LIBOR + 0.280%, 03/20/19 (i) . . . . . . . . . . . 3,000,000 3,002,862Barclays Bank plc
2.304%, 1M LIBOR + 0.200%, 02/04/19 (i) . . . . . . . . . . . 5,000,000 4,998,985Commonwealth Bank of Australia
2.358%, 1M LIBOR + 0.210%, 09/13/19 (i) . . . . . . . . . . . 5,000,000 5,000,0002.487%, 3M LIBOR + 0.140%, 04/23/19 (i) . . . . . . . . . . . 1,000,000 1,000,358
Cooperative Rabobank UA2.479%, 3M LIBOR + 0.140%, 10/16/18 (i) . . . . . . . . . . . 2,000,000 2,000,150
Industrial & Commercial Bank of China, Ltd.2.500%, 10/24/18 . . . . . . . . . . . . . . . . . . . . . . . . . . . . 4,000,000 4,000,0522.500%, 11/15/18 . . . . . . . . . . . . . . . . . . . . . . . . . . . . 5,000,000 4,999,880
Security DescriptionPrincipalAmount* Value
Certificates of Deposit—(Continued)Landesbank Baden-Wuettertemberg
2.180%, 10/02/18 . . . . . . . . . . . . . . . . . . . . . . . . . . . . 5,000,000 $ 5,000,010Mitsubishi UFJ Trust and Banking Corp.
Zero Coupon, 01/15/19 . . . . . . . . . . . . . . . . . . . . . . . . . 6,947,412 6,948,859Mizuho Bank, Ltd., New York
2.468%, 1M LIBOR + 0.250%, 11/26/18 (i) . . . . . . . . . . . 3,000,000 2,999,901Natixis S.A. New York
2.431%, 3M LIBOR + 0.090%, 05/10/19 (i) . . . . . . . . . . . 4,000,000 3,999,6842.504%, 1M LIBOR + 0.370%, 02/14/19 (i) . . . . . . . . . . . 2,000,000 2,001,3382.533%, 3M LIBOR + 0.190%, 02/01/19 (i) . . . . . . . . . . . 1,500,000 1,500,121
Royal Bank of Canada New York2.378%, 1M LIBOR + 0.210%, 09/17/19 (i) . . . . . . . . . . . 8,000,000 7,999,5602.381%, 1M LIBOR + 0.250%, 01/11/19 (i) . . . . . . . . . . . 2,000,000 2,000,660
Societe Generale2.504%, 1M LIBOR + 0.400%, 10/02/18 (i) . . . . . . . . . . . 1,000,000 999,983
Standard Chartered plc2.396%, 1M LIBOR + 0.180%, 02/25/19 (i) . . . . . . . . . . . 10,000,000 9,998,8302.551%, 1M LIBOR + 0.420%, 10/11/18 (i) . . . . . . . . . . . 1,000,000 1,000,050
Sumitomo Mitsui Trust Bank, Ltd.2.290%, 1M LIBOR + 0.170%, 12/06/18 (i) . . . . . . . . . . . 1,000,000 1,000,0522.423%, 3M LIBOR + 0.090%, 10/18/18 (i) . . . . . . . . . . . 3,000,377 2,999,9792.502%, 1M LIBOR + 0.320%, 11/21/18 (i) . . . . . . . . . . . 2,000,000 2,000,000
Svenska Handelsbanken AB2.439%, 3M LIBOR + 0.100%, 04/30/19 (i) . . . . . . . . . . . 5,000,000 5,000,595
Toronto-Dominion Bank2.378%, 1M LIBOR + 0.210%, 09/17/19 (i) . . . . . . . . . . . 7,000,000 7,000,000
Wells Fargo Bank N.A.2.475%, 3M LIBOR + 0.140%, 10/26/18 (i) . . . . . . . . . . . 1,500,000 1,500,249
Westpac Banking Corp.2.630%, Update Replacements.xls: FEDEFF PRV +0.450%, 02/15/19 (i) . . . . . . . . . . . . . . . . . . . . . . . . . . 1,500,000 1,500,797
100,449,370
Commercial Paper—3.6%Bank of China, Ltd.
2.510%, 11/02/18 . . . . . . . . . . . . . . . . . . . . . . . . . . . . 6,955,587 6,984,6002.550%, 12/20/18 . . . . . . . . . . . . . . . . . . . . . . . . . . . . 2,980,875 2,982,741
ING Funding LLC2.448%, 3M LIBOR + 0.110%, 05/10/19 (i) . . . . . . . . . . . 3,000,000 3,000,3092.453%, 1M LIBOR + 0.320%, 02/08/19 (i) . . . . . . . . . . . 3,000,000 3,001,533
LMA S.A. & LMA Americas2.470%, 11/13/18 . . . . . . . . . . . . . . . . . . . . . . . . . . . . 2,963,979 2,991,327
Sheffield Receivables Co.2.490%, 11/26/18 . . . . . . . . . . . . . . . . . . . . . . . . . . . . 2,960,783 2,988,4772.510%, Update Replacements.xls: SOFR +0.350%, 11/28/18 (i) . . . . . . . . . . . . . . . . . . . . . . . . . . 1,000,000 1,000,274
Starbird Funding Corp.2.280%, 11/08/18 . . . . . . . . . . . . . . . . . . . . . . . . . . . . 2,982,900 2,992,338
UBS AG2.534%, 1M LIBOR + 0.430%, 02/01/19 (i) . . . . . . . . . . . 5,000,000 5,004,615
Westpac Banking Corp.2.408%, 3M LIBOR + 0.070%, 08/07/19 (i) . . . . . . . . . . . 3,000,000 3,000,0002.492%, 1M LIBOR + 0.280%, 05/24/19 (i) . . . . . . . . . . . 2,000,000 2,001,108
35,947,322
BHFTII-226

Brighthouse Funds Trust II
MetLife Russell 2000 Index Portfolio
Schedule of Investments as of September 30, 2018 (Unaudited)
Securities Lending Reinvestments (h)—(Continued)
Security DescriptionPrincipalAmount* Value
Repurchase Agreements—8.8%Citigroup Global Markets, Inc.
Repurchase Agreement dated 05/03/18 at 2.440%, due on10/05/18 with a maturity value of $4,042,022;collateralized by U.S. Treasury Obligations with rates rangingfrom 1.625% - 2.250%, maturity dates ranging from11/30/19 - 11/15/27, and various Common Stock with anaggregate market value of $4,217,144. . . . . . . . . . . . . . . 4,000,000 $ 4,000,000Repurchase Agreement dated 07/25/18 at 2.570%, due on11/02/18 with a maturity value of $1,007,139;collateralized by various Common Stock with an aggregatemarket value of $1,100,000. . . . . . . . . . . . . . . . . . . . . . 1,000,000 1,000,000Repurchase Agreement dated 01/25/17 at 2.720%, due on12/31/18 with a maturity value of $52,663; collateralizedby U.S. Treasury Obligations with rates ranging from0.000% - 2.220%, maturity dates ranging from 11/01/18 -04/30/20, and an aggregate market value of $51,000. . . . 50,000 50,000
Citigroup Global Markets, Ltd.Repurchase Agreement dated 09/28/18 at 2.240%, due on10/01/18 with a maturity value of $2,700,504;collateralized by U.S. Treasury and Foreign Obligations withrates ranging from 1.750% - 2.875%, maturity dates rangingfrom 10/15/20 - 05/15/27, and an aggregate market valueof $2,754,002. . . . . . . . . . . . . . . . . . . . . . . . . . . . . . . . 2,700,000 2,700,000Repurchase Agreement dated 09/28/18 at 2.240%, due on10/01/18 with a maturity value of $3,000,560;collateralized by U.S. Treasury and Foreign Obligations withrates ranging from 0.375% - 3.125%, maturity dates rangingfrom 12/17/18 - 02/15/43, and an aggregate market valueof $3,060,000. . . . . . . . . . . . . . . . . . . . . . . . . . . . . . . . 3,000,000 3,000,000
Deutsche Bank AG, LondonRepurchase Agreement dated 01/09/18 at 2.560%, due on10/01/18 with a maturity value of $2,445,227;collateralized by various Common Stock with an aggregatemarket value of $2,671,974. . . . . . . . . . . . . . . . . . . . . . 2,400,000 2,400,000
ING Bank NV, LondonRepurchase Agreement dated 08/03/18 at 2.420%, due on10/01/18 with a maturity value of $2,610,312;collateralized by various Common Stock with an aggregatemarket value of $2,889,239. . . . . . . . . . . . . . . . . . . . . . 2,600,000 2,600,000
Macquarie Bank, Ltd., LondonRepurchase Agreement dated 09/28/18 at 2.200%, due on10/01/18 with a maturity value of $116,186; collateralizedby U.S. Treasury Obligations with rates ranging from0.125% - 5.500%, maturity dates ranging from 08/31/19 -05/15/48, and an aggregate market value of $118,397. . . 116,164 116,164
Merrill Lynch, Pierce, Fenner & Smith, Inc.Repurchase Agreement dated 10/26/16 at 2.720%, due on12/31/18 with a maturity value of $3,710,498;collateralized by various Common Stock with an aggregatemarket value of $3,850,000. . . . . . . . . . . . . . . . . . . . . . 3,500,000 3,500,000Repurchase Agreement dated 08/01/17 at 2.720%, due on12/31/18 with a maturity value of $2,078,124;collateralized by various Common Stock with an aggregatemarket value of $2,200,000. . . . . . . . . . . . . . . . . . . . . . 2,000,000 2,000,000
Security DescriptionPrincipalAmount* Value
Repurchase Agreements—(Continued)Morgan Stanley & Co. LLC
Repurchase Agreement dated 09/25/18 at 2.470%, due on10/02/18 with a maturity value of $20,009,606;collateralized by various Common Stock with an aggregatemarket value of $22,004,285. . . . . . . . . . . . . . . . . . . . . 20,000,000 $ 20,000,000
NBC Global Finance, Ltd.Repurchase Agreement dated 11/30/17 at 2.340%, due on10/01/18 with a maturity value of $4,691,195;collateralized by various Common Stock with an aggregatemarket value of $5,118,214. . . . . . . . . . . . . . . . . . . . . . 4,600,000 4,600,000Repurchase Agreement dated 03/16/18 at 2.340%, due on10/01/18 with a maturity value of $4,254,327;collateralized by various Common Stock with an aggregatemarket value of $4,673,152. . . . . . . . . . . . . . . . . . . . . . 4,200,000 4,200,000Repurchase Agreement dated 07/18/18 at 2.370%, due on10/05/18 with a maturity value of $2,010,402;collateralized by various Common Stock with an aggregatemarket value of $2,225,488. . . . . . . . . . . . . . . . . . . . . . 2,000,000 2,000,000Repurchase Agreement dated 07/19/18 at 2.370%, due on10/05/18 with a maturity value of $3,015,405;collateralized by various Common Stock with an aggregatemarket value of $3,338,232. . . . . . . . . . . . . . . . . . . . . . 3,000,000 3,000,000
Societe GeneraleRepurchase Agreement dated 03/08/18 at 2.310%, due on10/01/18 with a maturity value of $5,573,054;collateralized by U.S. Treasury Obligations with rates rangingfrom 0.000% - 4.250%, maturity dates ranging from02/07/19 - 02/15/47, and various Common Stock with anaggregate market value of $6,108,566. . . . . . . . . . . . . . . 5,500,000 5,500,000Repurchase Agreement dated 03/16/18 at 2.310%, due on10/01/18 with a maturity value of $6,684,277;collateralized by U.S. Treasury Obligations with rates rangingfrom 0.000% - 4.250%, maturity dates ranging from02/07/19 - 02/15/47, and various Common Stock with anaggregate market value of $7,330,279. . . . . . . . . . . . . . . 6,600,000 6,600,000Repurchase Agreement dated 03/21/18 at 2.310%, due on10/01/18 with a maturity value of $4,049,793;collateralized by U.S. Treasury Obligations with rates rangingfrom 0.000% - 4.250%, maturity dates ranging from02/07/19 - 02/15/47, and various Common Stock with anaggregate market value of $4,442,594. . . . . . . . . . . . . . . 4,000,000 4,000,000Repurchase Agreement dated 03/28/18 at 2.310%, due on10/01/18 with a maturity value of $6,881,594;collateralized by U.S. Treasury Obligations with rates rangingfrom 0.000% - 4.250%, maturity dates ranging from02/07/19 - 02/15/47, and various Common Stock with anaggregate market value of $7,552,409. . . . . . . . . . . . . . . 6,800,000 6,800,000Repurchase Agreement dated 07/10/18 at 2.340%, due on10/05/18 with a maturity value of $3,419,227;collateralized by U.S. Treasury Obligations with rates rangingfrom 0.000% - 4.250%, maturity dates ranging from02/07/19 - 02/15/47, and various Common Stock with anaggregate market value of $3,776,205. . . . . . . . . . . . . . . 3,400,000 3,400,000
BHFTII-227

Brighthouse Funds Trust II
MetLife Russell 2000 Index Portfolio
Schedule of Investments as of September 30, 2018 (Unaudited)
Securities Lending Reinvestments (h)—(Continued)
Security DescriptionPrincipalAmount* Value
Repurchase Agreements—(Continued)Societe Generale
Repurchase Agreement dated 04/18/18 at 2.340%, due on10/05/18 with a maturity value of $2,022,100;collateralized by U.S. Treasury Obligations with rates rangingfrom 0.000% - 4.250%, maturity dates ranging from02/07/19 - 02/15/47, and various Common Stock with anaggregate market value of $2,221,297. . . . . . . . . . . . . . . 2,000,000 $ 2,000,000Repurchase Agreement dated 05/10/18 at 2.340%, due on10/05/18 with a maturity value of $4,543,290;collateralized by U.S. Treasury Obligations with rates rangingfrom 0.000% - 4.250%, maturity dates ranging from02/07/19 - 02/15/47, and various Common Stock with anaggregate market value of $4,997,918. . . . . . . . . . . . . . . 4,500,000 4,500,000
87,966,164
Time Deposits—2.9%Canadian Imperial Bank of Commerce
2.130%, 10/01/18 . . . . . . . . . . . . . . . . . . . . . . . . . . . . 10,000,000 10,000,000Cooperative Rabobank UA New York
2.150%, 10/01/18 . . . . . . . . . . . . . . . . . . . . . . . . . . . . 10,000,000 10,000,000DZ Bank AG
2.150%, 10/01/18 . . . . . . . . . . . . . . . . . . . . . . . . . . . . 2,000,000 2,000,000Erste Group Bank AG
2.170%, 10/01/18 . . . . . . . . . . . . . . . . . . . . . . . . . . . . 2,750,000 2,750,000Nordea Bank New York
2.140%, 10/01/18 . . . . . . . . . . . . . . . . . . . . . . . . . . . . 2,000,000 2,000,000Svenska Handelsbanken AB
2.140%, 10/01/18 . . . . . . . . . . . . . . . . . . . . . . . . . . . . 2,000,000 2,000,000
28,750,000
Total Securities Lending Reinvestments(Cost $257,100,910) . . . . . . . . . . . . . . . . . . . . . . . . . . . 257,112,856
Total Investments—125.6%(Cost $917,478,856) . . . . . . . . . . . . . . . . . . . . . . . . . . . 1,258,044,608
Other assets and liabilities (net)—(25.6)% . . . . . . . . . . . . . . (256,224,905)
Net Assets—100.0% . . . . . . . . . . . . . . . . . . . . . . . . . . $ 1,001,819,703
* Principal amount stated in U.S. dollars unless otherwise noted.(a) Non-income producing security.(b) All or a portion of the security was held on loan. As of September 30, 2018, the market
value of securities loaned was $249,545,496 and the collateral received consisted ofcash in the amount of $257,003,814. The cash collateral investments are disclosed inthe Schedule of Investments and categorized as Securities Lending Reinvestments.
(c) Security was valued in good faith under procedures approved by the Board of Trustees.As of September 30, 2018, these securities represent less than 0.05% of net assets.
(d) All or a portion of the security was pledged as collateral against open futures contracts.As of September 30, 2018, the market value of securities pledged was $3,215,992.
(e) Illiquid security. As of September 30, 2018, these securities represent 0.0% of netassets.
(f) Significant unobservable inputs were used in the valuation of this portfolio security; i.e.Level 3.
(g) The rate shown represents current yield to maturity.(h) Represents investment of cash collateral received from securities on loan as of
September 30, 2018.(i) Variable or floating rate security. The stated rate represents the rate at September 30,
2018. Maturity date shown for callable securities reflects the earliest possible call date.For securities based on a published reference index and spread, the index and spreadare indicated in the description above. For certain variable rate securities, the couponrate is determined by the issuer/agent based on current market conditions. For certainasset- and mortgage-backed securities, the coupon rate may fluctuate based on changesof the underlying collateral or prepayments of principal. These securities do not indicatea reference index and spread in their description above.
Futures Contracts
Futures Contracts—LongExpiration
DateNumber ofContracts
NotionalAmount
Value/Unrealized
Depreciation
Russell 2000 Index Mini Futures . . . . . . . . . . . . . . . . . . . . . . . . . . . . . . . . . . . . . . . . . . . . . . . . . . . . . . . . . . . . . . . . . . . . 12/21/18 42 USD 3,571,680 $(58,756)
Glossary of Abbreviations
Currencies(USD)— United States Dollar
Index Abbreviations(FEDEFF PRV)— Effective Federal Funds Rate (LIBOR)— London Interbank Offered Rate (SOFR)— Secured Overnight Financing Rate
Other Abbreviations
(REIT)— Real Estate Investment Trust
BHFTII-228
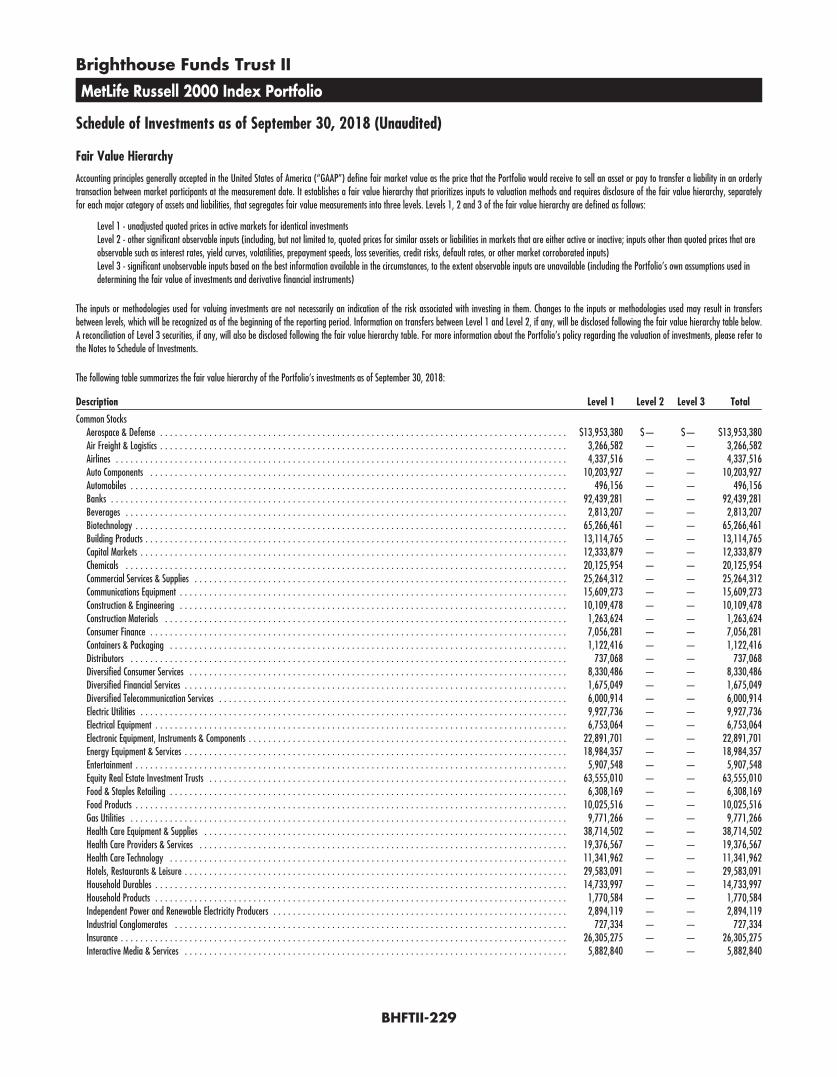
Brighthouse Funds Trust II
MetLife Russell 2000 Index Portfolio
Schedule of Investments as of September 30, 2018 (Unaudited)
Fair Value Hierarchy
Accounting principles generally accepted in the United States of America (“GAAP”) define fair market value as the price that the Portfolio would receive to sell an asset or pay to transfer a liability in an orderlytransaction between market participants at the measurement date. It establishes a fair value hierarchy that prioritizes inputs to valuation methods and requires disclosure of the fair value hierarchy, separatelyfor each major category of assets and liabilities, that segregates fair value measurements into three levels. Levels 1, 2 and 3 of the fair value hierarchy are defined as follows:
Level 1 - unadjusted quoted prices in active markets for identical investmentsLevel 2 - other significant observable inputs (including, but not limited to, quoted prices for similar assets or liabilities in markets that are either active or inactive; inputs other than quoted prices that areobservable such as interest rates, yield curves, volatilities, prepayment speeds, loss severities, credit risks, default rates, or other market corroborated inputs)Level 3 - significant unobservable inputs based on the best information available in the circumstances, to the extent observable inputs are unavailable (including the Portfolio’s own assumptions used indetermining the fair value of investments and derivative financial instruments)
The inputs or methodologies used for valuing investments are not necessarily an indication of the risk associated with investing in them. Changes to the inputs or methodologies used may result in transfersbetween levels, which will be recognized as of the beginning of the reporting period. Information on transfers between Level 1 and Level 2, if any, will be disclosed following the fair value hierarchy table below.A reconciliation of Level 3 securities, if any, will also be disclosed following the fair value hierarchy table. For more information about the Portfolio’s policy regarding the valuation of investments, please refer tothe Notes to Schedule of Investments.
The following table summarizes the fair value hierarchy of the Portfolio’s investments as of September 30, 2018:
Description Level 1 Level 2 Level 3 Total
Common StocksAerospace & Defense . . . . . . . . . . . . . . . . . . . . . . . . . . . . . . . . . . . . . . . . . . . . . . . . . . . . . . . . . . . . . . . . . . . . . . . . . . . . . . . . . . . $13,953,380 $— $— $13,953,380Air Freight & Logistics . . . . . . . . . . . . . . . . . . . . . . . . . . . . . . . . . . . . . . . . . . . . . . . . . . . . . . . . . . . . . . . . . . . . . . . . . . . . . . . . . . . 3,266,582 — — 3,266,582Airlines . . . . . . . . . . . . . . . . . . . . . . . . . . . . . . . . . . . . . . . . . . . . . . . . . . . . . . . . . . . . . . . . . . . . . . . . . . . . . . . . . . . . . . . . . . . . 4,337,516 — — 4,337,516Auto Components . . . . . . . . . . . . . . . . . . . . . . . . . . . . . . . . . . . . . . . . . . . . . . . . . . . . . . . . . . . . . . . . . . . . . . . . . . . . . . . . . . . . . 10,203,927 — — 10,203,927Automobiles . . . . . . . . . . . . . . . . . . . . . . . . . . . . . . . . . . . . . . . . . . . . . . . . . . . . . . . . . . . . . . . . . . . . . . . . . . . . . . . . . . . . . . . . . 496,156 — — 496,156Banks . . . . . . . . . . . . . . . . . . . . . . . . . . . . . . . . . . . . . . . . . . . . . . . . . . . . . . . . . . . . . . . . . . . . . . . . . . . . . . . . . . . . . . . . . . . . . 92,439,281 — — 92,439,281Beverages . . . . . . . . . . . . . . . . . . . . . . . . . . . . . . . . . . . . . . . . . . . . . . . . . . . . . . . . . . . . . . . . . . . . . . . . . . . . . . . . . . . . . . . . . . 2,813,207 — — 2,813,207Biotechnology . . . . . . . . . . . . . . . . . . . . . . . . . . . . . . . . . . . . . . . . . . . . . . . . . . . . . . . . . . . . . . . . . . . . . . . . . . . . . . . . . . . . . . . . 65,266,461 — — 65,266,461Building Products . . . . . . . . . . . . . . . . . . . . . . . . . . . . . . . . . . . . . . . . . . . . . . . . . . . . . . . . . . . . . . . . . . . . . . . . . . . . . . . . . . . . . . 13,114,765 — — 13,114,765Capital Markets . . . . . . . . . . . . . . . . . . . . . . . . . . . . . . . . . . . . . . . . . . . . . . . . . . . . . . . . . . . . . . . . . . . . . . . . . . . . . . . . . . . . . . . 12,333,879 — — 12,333,879Chemicals . . . . . . . . . . . . . . . . . . . . . . . . . . . . . . . . . . . . . . . . . . . . . . . . . . . . . . . . . . . . . . . . . . . . . . . . . . . . . . . . . . . . . . . . . . 20,125,954 — — 20,125,954Commercial Services & Supplies . . . . . . . . . . . . . . . . . . . . . . . . . . . . . . . . . . . . . . . . . . . . . . . . . . . . . . . . . . . . . . . . . . . . . . . . . . . . 25,264,312 — — 25,264,312Communications Equipment . . . . . . . . . . . . . . . . . . . . . . . . . . . . . . . . . . . . . . . . . . . . . . . . . . . . . . . . . . . . . . . . . . . . . . . . . . . . . . . 15,609,273 — — 15,609,273Construction & Engineering . . . . . . . . . . . . . . . . . . . . . . . . . . . . . . . . . . . . . . . . . . . . . . . . . . . . . . . . . . . . . . . . . . . . . . . . . . . . . . . 10,109,478 — — 10,109,478Construction Materials . . . . . . . . . . . . . . . . . . . . . . . . . . . . . . . . . . . . . . . . . . . . . . . . . . . . . . . . . . . . . . . . . . . . . . . . . . . . . . . . . . 1,263,624 — — 1,263,624Consumer Finance . . . . . . . . . . . . . . . . . . . . . . . . . . . . . . . . . . . . . . . . . . . . . . . . . . . . . . . . . . . . . . . . . . . . . . . . . . . . . . . . . . . . . 7,056,281 — — 7,056,281Containers & Packaging . . . . . . . . . . . . . . . . . . . . . . . . . . . . . . . . . . . . . . . . . . . . . . . . . . . . . . . . . . . . . . . . . . . . . . . . . . . . . . . . . 1,122,416 — — 1,122,416Distributors . . . . . . . . . . . . . . . . . . . . . . . . . . . . . . . . . . . . . . . . . . . . . . . . . . . . . . . . . . . . . . . . . . . . . . . . . . . . . . . . . . . . . . . . . 737,068 — — 737,068Diversified Consumer Services . . . . . . . . . . . . . . . . . . . . . . . . . . . . . . . . . . . . . . . . . . . . . . . . . . . . . . . . . . . . . . . . . . . . . . . . . . . . . 8,330,486 — — 8,330,486Diversified Financial Services . . . . . . . . . . . . . . . . . . . . . . . . . . . . . . . . . . . . . . . . . . . . . . . . . . . . . . . . . . . . . . . . . . . . . . . . . . . . . . 1,675,049 — — 1,675,049Diversified Telecommunication Services . . . . . . . . . . . . . . . . . . . . . . . . . . . . . . . . . . . . . . . . . . . . . . . . . . . . . . . . . . . . . . . . . . . . . . . 6,000,914 — — 6,000,914Electric Utilities . . . . . . . . . . . . . . . . . . . . . . . . . . . . . . . . . . . . . . . . . . . . . . . . . . . . . . . . . . . . . . . . . . . . . . . . . . . . . . . . . . . . . . . 9,927,736 — — 9,927,736Electrical Equipment . . . . . . . . . . . . . . . . . . . . . . . . . . . . . . . . . . . . . . . . . . . . . . . . . . . . . . . . . . . . . . . . . . . . . . . . . . . . . . . . . . . . 6,753,064 — — 6,753,064Electronic Equipment, Instruments & Components . . . . . . . . . . . . . . . . . . . . . . . . . . . . . . . . . . . . . . . . . . . . . . . . . . . . . . . . . . . . . . . . . 22,891,701 — — 22,891,701Energy Equipment & Services . . . . . . . . . . . . . . . . . . . . . . . . . . . . . . . . . . . . . . . . . . . . . . . . . . . . . . . . . . . . . . . . . . . . . . . . . . . . . . 18,984,357 — — 18,984,357Entertainment . . . . . . . . . . . . . . . . . . . . . . . . . . . . . . . . . . . . . . . . . . . . . . . . . . . . . . . . . . . . . . . . . . . . . . . . . . . . . . . . . . . . . . . . 5,907,548 — — 5,907,548Equity Real Estate Investment Trusts . . . . . . . . . . . . . . . . . . . . . . . . . . . . . . . . . . . . . . . . . . . . . . . . . . . . . . . . . . . . . . . . . . . . . . . . . 63,555,010 — — 63,555,010Food & Staples Retailing . . . . . . . . . . . . . . . . . . . . . . . . . . . . . . . . . . . . . . . . . . . . . . . . . . . . . . . . . . . . . . . . . . . . . . . . . . . . . . . . . 6,308,169 — — 6,308,169Food Products . . . . . . . . . . . . . . . . . . . . . . . . . . . . . . . . . . . . . . . . . . . . . . . . . . . . . . . . . . . . . . . . . . . . . . . . . . . . . . . . . . . . . . . . 10,025,516 — — 10,025,516Gas Utilities . . . . . . . . . . . . . . . . . . . . . . . . . . . . . . . . . . . . . . . . . . . . . . . . . . . . . . . . . . . . . . . . . . . . . . . . . . . . . . . . . . . . . . . . . 9,771,266 — — 9,771,266Health Care Equipment & Supplies . . . . . . . . . . . . . . . . . . . . . . . . . . . . . . . . . . . . . . . . . . . . . . . . . . . . . . . . . . . . . . . . . . . . . . . . . . 38,714,502 — — 38,714,502Health Care Providers & Services . . . . . . . . . . . . . . . . . . . . . . . . . . . . . . . . . . . . . . . . . . . . . . . . . . . . . . . . . . . . . . . . . . . . . . . . . . . 19,376,567 — — 19,376,567Health Care Technology . . . . . . . . . . . . . . . . . . . . . . . . . . . . . . . . . . . . . . . . . . . . . . . . . . . . . . . . . . . . . . . . . . . . . . . . . . . . . . . . . 11,341,962 — — 11,341,962Hotels, Restaurants & Leisure . . . . . . . . . . . . . . . . . . . . . . . . . . . . . . . . . . . . . . . . . . . . . . . . . . . . . . . . . . . . . . . . . . . . . . . . . . . . . . 29,583,091 — — 29,583,091Household Durables . . . . . . . . . . . . . . . . . . . . . . . . . . . . . . . . . . . . . . . . . . . . . . . . . . . . . . . . . . . . . . . . . . . . . . . . . . . . . . . . . . . . 14,733,997 — — 14,733,997Household Products . . . . . . . . . . . . . . . . . . . . . . . . . . . . . . . . . . . . . . . . . . . . . . . . . . . . . . . . . . . . . . . . . . . . . . . . . . . . . . . . . . . . 1,770,584 — — 1,770,584Independent Power and Renewable Electricity Producers . . . . . . . . . . . . . . . . . . . . . . . . . . . . . . . . . . . . . . . . . . . . . . . . . . . . . . . . . . . . 2,894,119 — — 2,894,119Industrial Conglomerates . . . . . . . . . . . . . . . . . . . . . . . . . . . . . . . . . . . . . . . . . . . . . . . . . . . . . . . . . . . . . . . . . . . . . . . . . . . . . . . . 727,334 — — 727,334Insurance . . . . . . . . . . . . . . . . . . . . . . . . . . . . . . . . . . . . . . . . . . . . . . . . . . . . . . . . . . . . . . . . . . . . . . . . . . . . . . . . . . . . . . . . . . . 26,305,275 — — 26,305,275Interactive Media & Services . . . . . . . . . . . . . . . . . . . . . . . . . . . . . . . . . . . . . . . . . . . . . . . . . . . . . . . . . . . . . . . . . . . . . . . . . . . . . . 5,882,840 — — 5,882,840
BHFTII-229
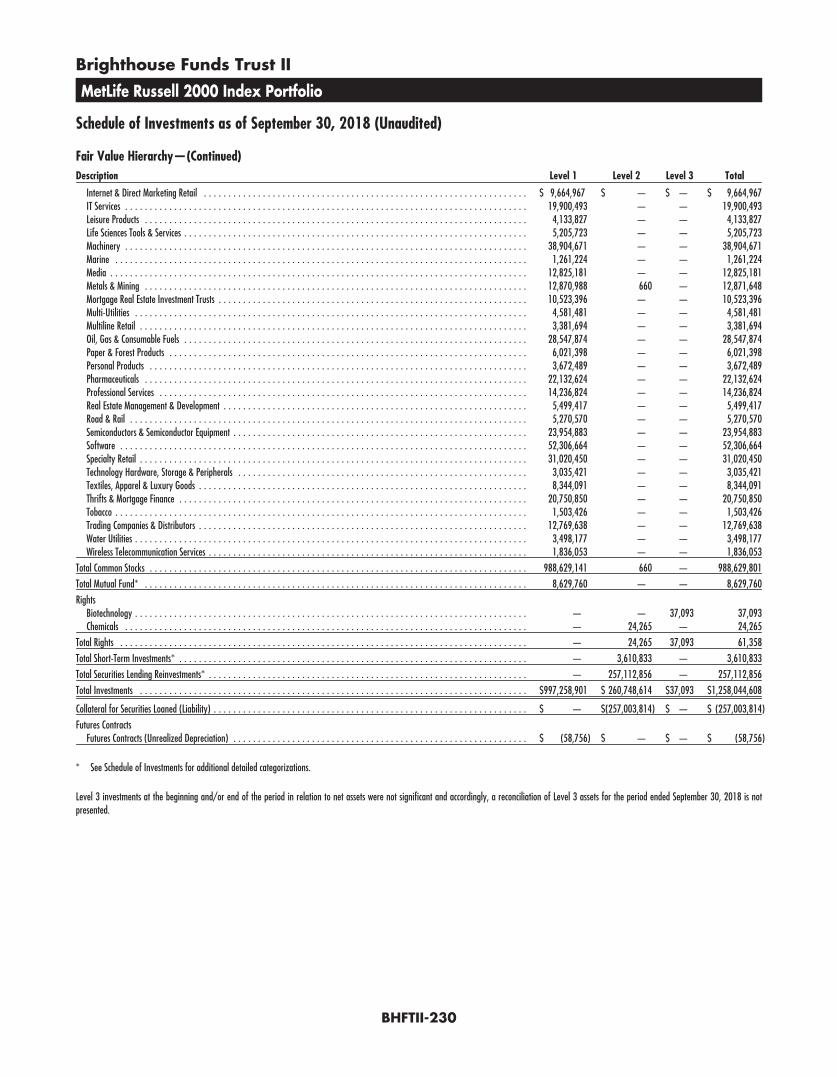
Brighthouse Funds Trust II
MetLife Russell 2000 Index Portfolio
Schedule of Investments as of September 30, 2018 (Unaudited)
Fair Value Hierarchy—(Continued)Description Level 1 Level 2 Level 3 Total
Internet & Direct Marketing Retail . . . . . . . . . . . . . . . . . . . . . . . . . . . . . . . . . . . . . . . . . . . . . . . . . . . . . . . . . . . . . . . . . . $ 9,664,967 $ — $ — $ 9,664,967IT Services . . . . . . . . . . . . . . . . . . . . . . . . . . . . . . . . . . . . . . . . . . . . . . . . . . . . . . . . . . . . . . . . . . . . . . . . . . . . . . . . . . 19,900,493 — — 19,900,493Leisure Products . . . . . . . . . . . . . . . . . . . . . . . . . . . . . . . . . . . . . . . . . . . . . . . . . . . . . . . . . . . . . . . . . . . . . . . . . . . . . . 4,133,827 — — 4,133,827Life Sciences Tools & Services . . . . . . . . . . . . . . . . . . . . . . . . . . . . . . . . . . . . . . . . . . . . . . . . . . . . . . . . . . . . . . . . . . . . . . 5,205,723 — — 5,205,723Machinery . . . . . . . . . . . . . . . . . . . . . . . . . . . . . . . . . . . . . . . . . . . . . . . . . . . . . . . . . . . . . . . . . . . . . . . . . . . . . . . . . . 38,904,671 — — 38,904,671Marine . . . . . . . . . . . . . . . . . . . . . . . . . . . . . . . . . . . . . . . . . . . . . . . . . . . . . . . . . . . . . . . . . . . . . . . . . . . . . . . . . . . . 1,261,224 — — 1,261,224Media . . . . . . . . . . . . . . . . . . . . . . . . . . . . . . . . . . . . . . . . . . . . . . . . . . . . . . . . . . . . . . . . . . . . . . . . . . . . . . . . . . . . . 12,825,181 — — 12,825,181Metals & Mining . . . . . . . . . . . . . . . . . . . . . . . . . . . . . . . . . . . . . . . . . . . . . . . . . . . . . . . . . . . . . . . . . . . . . . . . . . . . . . 12,870,988 660 — 12,871,648Mortgage Real Estate Investment Trusts . . . . . . . . . . . . . . . . . . . . . . . . . . . . . . . . . . . . . . . . . . . . . . . . . . . . . . . . . . . . . . . 10,523,396 — — 10,523,396Multi-Utilities . . . . . . . . . . . . . . . . . . . . . . . . . . . . . . . . . . . . . . . . . . . . . . . . . . . . . . . . . . . . . . . . . . . . . . . . . . . . . . . . 4,581,481 — — 4,581,481Multiline Retail . . . . . . . . . . . . . . . . . . . . . . . . . . . . . . . . . . . . . . . . . . . . . . . . . . . . . . . . . . . . . . . . . . . . . . . . . . . . . . . 3,381,694 — — 3,381,694Oil, Gas & Consumable Fuels . . . . . . . . . . . . . . . . . . . . . . . . . . . . . . . . . . . . . . . . . . . . . . . . . . . . . . . . . . . . . . . . . . . . . . 28,547,874 — — 28,547,874Paper & Forest Products . . . . . . . . . . . . . . . . . . . . . . . . . . . . . . . . . . . . . . . . . . . . . . . . . . . . . . . . . . . . . . . . . . . . . . . . . 6,021,398 — — 6,021,398Personal Products . . . . . . . . . . . . . . . . . . . . . . . . . . . . . . . . . . . . . . . . . . . . . . . . . . . . . . . . . . . . . . . . . . . . . . . . . . . . . 3,672,489 — — 3,672,489Pharmaceuticals . . . . . . . . . . . . . . . . . . . . . . . . . . . . . . . . . . . . . . . . . . . . . . . . . . . . . . . . . . . . . . . . . . . . . . . . . . . . . . 22,132,624 — — 22,132,624Professional Services . . . . . . . . . . . . . . . . . . . . . . . . . . . . . . . . . . . . . . . . . . . . . . . . . . . . . . . . . . . . . . . . . . . . . . . . . . . 14,236,824 — — 14,236,824Real Estate Management & Development . . . . . . . . . . . . . . . . . . . . . . . . . . . . . . . . . . . . . . . . . . . . . . . . . . . . . . . . . . . . . . 5,499,417 — — 5,499,417Road & Rail . . . . . . . . . . . . . . . . . . . . . . . . . . . . . . . . . . . . . . . . . . . . . . . . . . . . . . . . . . . . . . . . . . . . . . . . . . . . . . . . . 5,270,570 — — 5,270,570Semiconductors & Semiconductor Equipment . . . . . . . . . . . . . . . . . . . . . . . . . . . . . . . . . . . . . . . . . . . . . . . . . . . . . . . . . . . . 23,954,883 — — 23,954,883Software . . . . . . . . . . . . . . . . . . . . . . . . . . . . . . . . . . . . . . . . . . . . . . . . . . . . . . . . . . . . . . . . . . . . . . . . . . . . . . . . . . . 52,306,664 — — 52,306,664Specialty Retail . . . . . . . . . . . . . . . . . . . . . . . . . . . . . . . . . . . . . . . . . . . . . . . . . . . . . . . . . . . . . . . . . . . . . . . . . . . . . . . 31,020,450 — — 31,020,450Technology Hardware, Storage & Peripherals . . . . . . . . . . . . . . . . . . . . . . . . . . . . . . . . . . . . . . . . . . . . . . . . . . . . . . . . . . . 3,035,421 — — 3,035,421Textiles, Apparel & Luxury Goods . . . . . . . . . . . . . . . . . . . . . . . . . . . . . . . . . . . . . . . . . . . . . . . . . . . . . . . . . . . . . . . . . . . 8,344,091 — — 8,344,091Thrifts & Mortgage Finance . . . . . . . . . . . . . . . . . . . . . . . . . . . . . . . . . . . . . . . . . . . . . . . . . . . . . . . . . . . . . . . . . . . . . . . 20,750,850 — — 20,750,850Tobacco . . . . . . . . . . . . . . . . . . . . . . . . . . . . . . . . . . . . . . . . . . . . . . . . . . . . . . . . . . . . . . . . . . . . . . . . . . . . . . . . . . . . 1,503,426 — — 1,503,426Trading Companies & Distributors . . . . . . . . . . . . . . . . . . . . . . . . . . . . . . . . . . . . . . . . . . . . . . . . . . . . . . . . . . . . . . . . . . . 12,769,638 — — 12,769,638Water Utilities . . . . . . . . . . . . . . . . . . . . . . . . . . . . . . . . . . . . . . . . . . . . . . . . . . . . . . . . . . . . . . . . . . . . . . . . . . . . . . . . 3,498,177 — — 3,498,177Wireless Telecommunication Services . . . . . . . . . . . . . . . . . . . . . . . . . . . . . . . . . . . . . . . . . . . . . . . . . . . . . . . . . . . . . . . . . 1,836,053 — — 1,836,053
Total Common Stocks . . . . . . . . . . . . . . . . . . . . . . . . . . . . . . . . . . . . . . . . . . . . . . . . . . . . . . . . . . . . . . . . . . . . . . . . . . . . . 988,629,141 660 — 988,629,801
Total Mutual Fund* . . . . . . . . . . . . . . . . . . . . . . . . . . . . . . . . . . . . . . . . . . . . . . . . . . . . . . . . . . . . . . . . . . . . . . . . . . . . . . 8,629,760 — — 8,629,760
RightsBiotechnology . . . . . . . . . . . . . . . . . . . . . . . . . . . . . . . . . . . . . . . . . . . . . . . . . . . . . . . . . . . . . . . . . . . . . . . . . . . . . . . . — — 37,093 37,093Chemicals . . . . . . . . . . . . . . . . . . . . . . . . . . . . . . . . . . . . . . . . . . . . . . . . . . . . . . . . . . . . . . . . . . . . . . . . . . . . . . . . . . — 24,265 — 24,265
Total Rights . . . . . . . . . . . . . . . . . . . . . . . . . . . . . . . . . . . . . . . . . . . . . . . . . . . . . . . . . . . . . . . . . . . . . . . . . . . . . . . . . . . — 24,265 37,093 61,358
Total Short-Term Investments* . . . . . . . . . . . . . . . . . . . . . . . . . . . . . . . . . . . . . . . . . . . . . . . . . . . . . . . . . . . . . . . . . . . . . . . — 3,610,833 — 3,610,833
Total Securities Lending Reinvestments* . . . . . . . . . . . . . . . . . . . . . . . . . . . . . . . . . . . . . . . . . . . . . . . . . . . . . . . . . . . . . . . . . — 257,112,856 — 257,112,856
Total Investments . . . . . . . . . . . . . . . . . . . . . . . . . . . . . . . . . . . . . . . . . . . . . . . . . . . . . . . . . . . . . . . . . . . . . . . . . . . . . . . $997,258,901 $ 260,748,614 $37,093 $1,258,044,608
Collateral for Securities Loaned (Liability) . . . . . . . . . . . . . . . . . . . . . . . . . . . . . . . . . . . . . . . . . . . . . . . . . . . . . . . . . . . . . . . . $ — $(257,003,814) $ — $ (257,003,814)
Futures ContractsFutures Contracts (Unrealized Depreciation) . . . . . . . . . . . . . . . . . . . . . . . . . . . . . . . . . . . . . . . . . . . . . . . . . . . . . . . . . . . . $ (58,756) $ — $ — $ (58,756)
* See Schedule of Investments for additional detailed categorizations.
Level 3 investments at the beginning and/or end of the period in relation to net assets were not significant and accordingly, a reconciliation of Level 3 assets for the period ended September 30, 2018 is notpresented.
BHFTII-230

Brighthouse Funds Trust II
MFS Total Return Portfolio
Schedule of Investments as of September 30, 2018 (Unaudited)
Common Stocks—59.6% of Net Assets
Security Description Shares Value
Aerospace & Defense—2.3%Boeing Co. (The) . . . . . . . . . . . . . . . . . . . . . . . . . . . . . . . . . . 13,281 $ 4,939,204Harris Corp. . . . . . . . . . . . . . . . . . . . . . . . . . . . . . . . . . . . . . 6,198 1,048,763Lockheed Martin Corp. . . . . . . . . . . . . . . . . . . . . . . . . . . . . . . 13,166 4,554,909Northrop Grumman Corp. . . . . . . . . . . . . . . . . . . . . . . . . . . . . 9,189 2,916,313United Technologies Corp. . . . . . . . . . . . . . . . . . . . . . . . . . . . 37,128 5,190,866
18,650,055
Air Freight & Logistics—0.2%United Parcel Service, Inc. - Class B . . . . . . . . . . . . . . . . . . . . . 17,471 2,039,739
Airlines—0.2%Delta Air Lines, Inc. . . . . . . . . . . . . . . . . . . . . . . . . . . . . . . . . 21,176 1,224,608
Auto Components—0.6%Aptiv plc . . . . . . . . . . . . . . . . . . . . . . . . . . . . . . . . . . . . . . . 24,585 2,062,681Garrett Motion, Inc. (a) . . . . . . . . . . . . . . . . . . . . . . . . . . . . . 2,971 54,958Lear Corp. . . . . . . . . . . . . . . . . . . . . . . . . . . . . . . . . . . . . . . 16,368 2,373,360
4,490,999
Automobiles—0.2%Harley-Davidson, Inc. . . . . . . . . . . . . . . . . . . . . . . . . . . . . . . 5,121 231,981Toyota Motor Corp. . . . . . . . . . . . . . . . . . . . . . . . . . . . . . . . . 23,000 1,426,961
1,658,942
Banks—5.9%Bank of America Corp. . . . . . . . . . . . . . . . . . . . . . . . . . . . . . . 207,588 6,115,543BNP Paribas S.A. . . . . . . . . . . . . . . . . . . . . . . . . . . . . . . . . . 8,824 539,285Citigroup, Inc. . . . . . . . . . . . . . . . . . . . . . . . . . . . . . . . . . . . 119,646 8,583,404JPMorgan Chase & Co. . . . . . . . . . . . . . . . . . . . . . . . . . . . . . . 133,962 15,116,272PNC Financial Services Group, Inc. (The) . . . . . . . . . . . . . . . . . . 33,192 4,520,419Royal Bank of Canada . . . . . . . . . . . . . . . . . . . . . . . . . . . . . . 10,726 859,807Sumitomo Mitsui Financial Group, Inc. . . . . . . . . . . . . . . . . . . . . 11,200 452,046SunTrust Banks, Inc. (b) . . . . . . . . . . . . . . . . . . . . . . . . . . . . . 14,355 958,770U.S. Bancorp . . . . . . . . . . . . . . . . . . . . . . . . . . . . . . . . . . . . 105,387 5,565,487Wells Fargo & Co. . . . . . . . . . . . . . . . . . . . . . . . . . . . . . . . . . 93,662 4,922,875Westpac Banking Corp. . . . . . . . . . . . . . . . . . . . . . . . . . . . . . 40,154 808,688
48,442,596
Beverages—0.7%Coca-Cola European Partners plc . . . . . . . . . . . . . . . . . . . . . . . 18,750 852,563Diageo plc . . . . . . . . . . . . . . . . . . . . . . . . . . . . . . . . . . . . . . 85,759 3,037,100Molson Coors Brewing Co. - Class B . . . . . . . . . . . . . . . . . . . . . . 12,120 745,380PepsiCo, Inc. . . . . . . . . . . . . . . . . . . . . . . . . . . . . . . . . . . . . 7,108 794,674
5,429,717
Biotechnology—0.1%Biogen, Inc. (a) . . . . . . . . . . . . . . . . . . . . . . . . . . . . . . . . . . 2,445 863,843
Building Products—0.6%Johnson Controls International plc (b) . . . . . . . . . . . . . . . . . . . . 136,403 4,774,105
Capital Markets—3.5%Apollo Global Management LLC - Class A . . . . . . . . . . . . . . . . . . 59,188 2,044,946Bank of New York Mellon Corp. (The) . . . . . . . . . . . . . . . . . . . . 97,690 4,981,213BlackRock, Inc. . . . . . . . . . . . . . . . . . . . . . . . . . . . . . . . . . . . 6,463 3,046,206
Security Description Shares Value
Capital Markets—(Continued)Blackstone Group L.P. (The) . . . . . . . . . . . . . . . . . . . . . . . . . . 38,538 $ 1,467,527Charles Schwab Corp. (The) . . . . . . . . . . . . . . . . . . . . . . . . . . . 18,441 906,375Goldman Sachs Group, Inc. (The) . . . . . . . . . . . . . . . . . . . . . . . 26,867 6,024,656Invesco, Ltd. (b) . . . . . . . . . . . . . . . . . . . . . . . . . . . . . . . . . . 21,973 502,742Moody’s Corp. . . . . . . . . . . . . . . . . . . . . . . . . . . . . . . . . . . . 7,094 1,186,117Morgan Stanley . . . . . . . . . . . . . . . . . . . . . . . . . . . . . . . . . . 36,495 1,699,572Nasdaq, Inc. (b) . . . . . . . . . . . . . . . . . . . . . . . . . . . . . . . . . . 20,088 1,723,551State Street Corp. . . . . . . . . . . . . . . . . . . . . . . . . . . . . . . . . . 37,240 3,119,967T. Rowe Price Group, Inc. . . . . . . . . . . . . . . . . . . . . . . . . . . . . 17,852 1,949,081
28,651,953
Chemicals—1.6%Axalta Coating Systems, Ltd. (a) . . . . . . . . . . . . . . . . . . . . . . . 44,179 1,288,260Celanese Corp. . . . . . . . . . . . . . . . . . . . . . . . . . . . . . . . . . . . 13,196 1,504,344DowDuPont, Inc. . . . . . . . . . . . . . . . . . . . . . . . . . . . . . . . . . . 27,718 1,782,544PPG Industries, Inc. . . . . . . . . . . . . . . . . . . . . . . . . . . . . . . . . 52,191 5,695,604Sherwin-Williams Co. (The) . . . . . . . . . . . . . . . . . . . . . . . . . . . 6,495 2,956,589
13,227,341
Commercial Services & Supplies—0.1%Transcontinental, Inc. - Class A . . . . . . . . . . . . . . . . . . . . . . . . . 39,704 703,923
Communications Equipment—0.7%Cisco Systems, Inc. . . . . . . . . . . . . . . . . . . . . . . . . . . . . . . . . 116,096 5,648,070
Consumer Finance—0.6%American Express Co. . . . . . . . . . . . . . . . . . . . . . . . . . . . . . . 17,585 1,872,627Discover Financial Services . . . . . . . . . . . . . . . . . . . . . . . . . . . 25,743 1,968,052Synchrony Financial . . . . . . . . . . . . . . . . . . . . . . . . . . . . . . . 20,951 651,157
4,491,836
Containers & Packaging—0.2%Crown Holdings, Inc. (a) (b) . . . . . . . . . . . . . . . . . . . . . . . . . . 27,035 1,297,680
Diversified Financial Services—0.1%ORIX Corp. . . . . . . . . . . . . . . . . . . . . . . . . . . . . . . . . . . . . . 50,200 813,807
Diversified Telecommunication Services—0.5%AT&T, Inc. . . . . . . . . . . . . . . . . . . . . . . . . . . . . . . . . . . . . . . 10,295 345,706Verizon Communications, Inc. . . . . . . . . . . . . . . . . . . . . . . . . . 64,287 3,432,283
3,777,989
Electric Utilities—1.8%American Electric Power Co., Inc. . . . . . . . . . . . . . . . . . . . . . . . 12,703 900,389Duke Energy Corp. . . . . . . . . . . . . . . . . . . . . . . . . . . . . . . . . 47,181 3,775,423Exelon Corp. . . . . . . . . . . . . . . . . . . . . . . . . . . . . . . . . . . . . 91,921 4,013,271PPL Corp. . . . . . . . . . . . . . . . . . . . . . . . . . . . . . . . . . . . . . . 72,061 2,108,505Southern Co. (The) (b) . . . . . . . . . . . . . . . . . . . . . . . . . . . . . . 51,417 2,241,781SSE plc . . . . . . . . . . . . . . . . . . . . . . . . . . . . . . . . . . . . . . . . 84,536 1,262,040Xcel Energy, Inc. . . . . . . . . . . . . . . . . . . . . . . . . . . . . . . . . . . 13,806 651,781
14,953,190
Electrical Equipment—0.9%Eaton Corp. plc . . . . . . . . . . . . . . . . . . . . . . . . . . . . . . . . . . . 77,215 6,696,857Regal-Beloit Corp. (b) . . . . . . . . . . . . . . . . . . . . . . . . . . . . . . 5,248 432,698
BHFTII-231

Brighthouse Funds Trust II
MFS Total Return Portfolio
Schedule of Investments as of September 30, 2018 (Unaudited)
Common Stocks—(Continued)
Security Description Shares Value
Electrical Equipment—(Continued)Schneider Electric SE . . . . . . . . . . . . . . . . . . . . . . . . . . . . . . . 5,319 $ 427,927
7,557,482
Energy Equipment & Services—0.4%Schlumberger, Ltd. . . . . . . . . . . . . . . . . . . . . . . . . . . . . . . . . 53,699 3,271,343
Entertainment—0.1%Electronic Arts, Inc. (a) . . . . . . . . . . . . . . . . . . . . . . . . . . . . . . 4,224 508,950
Equity Real Estate Investment Trusts—1.1%Extra Space Storage, Inc. . . . . . . . . . . . . . . . . . . . . . . . . . . . . 14,462 1,252,988Life Storage, Inc. . . . . . . . . . . . . . . . . . . . . . . . . . . . . . . . . . 8,566 815,140Medical Properties Trust, Inc. (b) . . . . . . . . . . . . . . . . . . . . . . . 197,643 2,946,857Public Storage . . . . . . . . . . . . . . . . . . . . . . . . . . . . . . . . . . . 2,862 577,065Simon Property Group, Inc. (b) . . . . . . . . . . . . . . . . . . . . . . . . 6,957 1,229,650STORE Capital Corp. (b) . . . . . . . . . . . . . . . . . . . . . . . . . . . . . 75,673 2,102,953
8,924,653
Food & Staples Retailing—0.2%Kroger Co. (The) (b) . . . . . . . . . . . . . . . . . . . . . . . . . . . . . . . 20,831 606,391U.S. Foods Holding Corp. (a) . . . . . . . . . . . . . . . . . . . . . . . . . . 23,971 738,786
1,345,177
Food Products—2.0%Archer-Daniels-Midland Co. . . . . . . . . . . . . . . . . . . . . . . . . . . . 40,769 2,049,458Danone S.A. . . . . . . . . . . . . . . . . . . . . . . . . . . . . . . . . . . . . 20,634 1,597,414General Mills, Inc. . . . . . . . . . . . . . . . . . . . . . . . . . . . . . . . . . 71,010 3,047,749J.M. Smucker Co. (The) (b) . . . . . . . . . . . . . . . . . . . . . . . . . . . 5,826 597,806Marine Harvest ASA . . . . . . . . . . . . . . . . . . . . . . . . . . . . . . . 66,850 1,548,647Mondelez International, Inc. - Class A . . . . . . . . . . . . . . . . . . . . 20,312 872,603Nestle S.A. . . . . . . . . . . . . . . . . . . . . . . . . . . . . . . . . . . . . . 45,425 3,784,179Tyson Foods, Inc. - Class A . . . . . . . . . . . . . . . . . . . . . . . . . . . 43,780 2,606,223
16,104,079
Health Care Equipment & Supplies—2.4%Abbott Laboratories . . . . . . . . . . . . . . . . . . . . . . . . . . . . . . . . 72,035 5,284,488Danaher Corp. . . . . . . . . . . . . . . . . . . . . . . . . . . . . . . . . . . . 56,089 6,094,631Medtronic plc . . . . . . . . . . . . . . . . . . . . . . . . . . . . . . . . . . . . 71,035 6,987,713Zimmer Biomet Holdings, Inc. (b) . . . . . . . . . . . . . . . . . . . . . . 10,873 1,429,473
19,796,305
Health Care Providers & Services—2.0%AmerisourceBergen Corp. . . . . . . . . . . . . . . . . . . . . . . . . . . . . 11,183 1,031,296Cigna Corp. . . . . . . . . . . . . . . . . . . . . . . . . . . . . . . . . . . . . . 17,614 3,668,116CVS Health Corp. . . . . . . . . . . . . . . . . . . . . . . . . . . . . . . . . . 26,131 2,057,032Express Scripts Holding Co. (a) . . . . . . . . . . . . . . . . . . . . . . . . 11,756 1,116,938HCA Healthcare, Inc. . . . . . . . . . . . . . . . . . . . . . . . . . . . . . . . 21,529 2,995,114Humana, Inc. . . . . . . . . . . . . . . . . . . . . . . . . . . . . . . . . . . . . 11,280 3,818,506McKesson Corp. . . . . . . . . . . . . . . . . . . . . . . . . . . . . . . . . . . 13,666 1,812,795
16,499,797
Hotels, Restaurants & Leisure—0.3%Aramark . . . . . . . . . . . . . . . . . . . . . . . . . . . . . . . . . . . . . . . 25,202 1,084,190Marriott International, Inc. - Class A . . . . . . . . . . . . . . . . . . . . . 6,080 802,743
Security Description Shares Value
Hotels, Restaurants & Leisure—(Continued)Starbucks Corp. (b) . . . . . . . . . . . . . . . . . . . . . . . . . . . . . . . . 10,710 $ 608,756
2,495,689
Household Durables—0.5%Newell Brands, Inc. (b) . . . . . . . . . . . . . . . . . . . . . . . . . . . . . 86,425 1,754,427PulteGroup, Inc. (b) . . . . . . . . . . . . . . . . . . . . . . . . . . . . . . . 28,062 695,096Whirlpool Corp. . . . . . . . . . . . . . . . . . . . . . . . . . . . . . . . . . . 12,590 1,495,063
3,944,586
Household Products—0.6%Colgate-Palmolive Co. . . . . . . . . . . . . . . . . . . . . . . . . . . . . . . 4,927 329,863Kimberly-Clark Corp. . . . . . . . . . . . . . . . . . . . . . . . . . . . . . . . 25,000 2,841,000Procter & Gamble Co. (The) . . . . . . . . . . . . . . . . . . . . . . . . . . 4,545 378,280Reckitt Benckiser Group plc . . . . . . . . . . . . . . . . . . . . . . . . . . . 18,019 1,646,113
5,195,256
Industrial Conglomerates—1.3%3M Co. . . . . . . . . . . . . . . . . . . . . . . . . . . . . . . . . . . . . . . . . 16,034 3,378,524Honeywell International, Inc. . . . . . . . . . . . . . . . . . . . . . . . . . 44,687 7,373,355
10,751,879
Insurance—3.3%Aon plc . . . . . . . . . . . . . . . . . . . . . . . . . . . . . . . . . . . . . . . . 33,479 5,148,401Chubb, Ltd. (b) . . . . . . . . . . . . . . . . . . . . . . . . . . . . . . . . . . . 46,291 6,186,329Prudential Financial, Inc. . . . . . . . . . . . . . . . . . . . . . . . . . . . . 46,924 4,754,340Tokio Marine Holdings, Inc. . . . . . . . . . . . . . . . . . . . . . . . . . . 8,900 441,629Travelers Cos., Inc. (The) . . . . . . . . . . . . . . . . . . . . . . . . . . . . 59,190 7,677,535Unum Group (b) . . . . . . . . . . . . . . . . . . . . . . . . . . . . . . . . . . 23,820 930,647Zurich Insurance Group AG . . . . . . . . . . . . . . . . . . . . . . . . . . . 6,446 2,035,443
27,174,324
Interactive Media & Services—0.7%Alphabet, Inc. - Class A (a) . . . . . . . . . . . . . . . . . . . . . . . . . . . 2,009 2,425,024Facebook, Inc. - Class A (a) . . . . . . . . . . . . . . . . . . . . . . . . . . . 18,735 3,081,158
5,506,182
Internet & Direct Marketing Retail—0.6%Amazon.com, Inc. (a) . . . . . . . . . . . . . . . . . . . . . . . . . . . . . . 2,596 5,199,788
IT Services—2.6%Accenture plc - Class A . . . . . . . . . . . . . . . . . . . . . . . . . . . . . . 43,978 7,485,056Amdocs, Ltd. . . . . . . . . . . . . . . . . . . . . . . . . . . . . . . . . . . . . 21,111 1,392,904Cognizant Technology Solutions Corp. - Class A . . . . . . . . . . . . . . 8,505 656,161DXC Technology Co. . . . . . . . . . . . . . . . . . . . . . . . . . . . . . . . 61,347 5,737,171Fidelity National Information Services, Inc. . . . . . . . . . . . . . . . . 17,494 1,908,071Fiserv, Inc. (a) . . . . . . . . . . . . . . . . . . . . . . . . . . . . . . . . . . . 20,685 1,704,030Visa, Inc. - Class A (b) . . . . . . . . . . . . . . . . . . . . . . . . . . . . . . 9,169 1,376,175Worldpay, Inc. - Class A (a) . . . . . . . . . . . . . . . . . . . . . . . . . . . 11,681 1,182,935
21,442,503
Life Sciences Tools & Services—0.8%Thermo Fisher Scientific, Inc. . . . . . . . . . . . . . . . . . . . . . . . . . . 28,035 6,842,783
Machinery—1.1%AGCO Corp. (b) . . . . . . . . . . . . . . . . . . . . . . . . . . . . . . . . . . 13,151 799,449
BHFTII-232
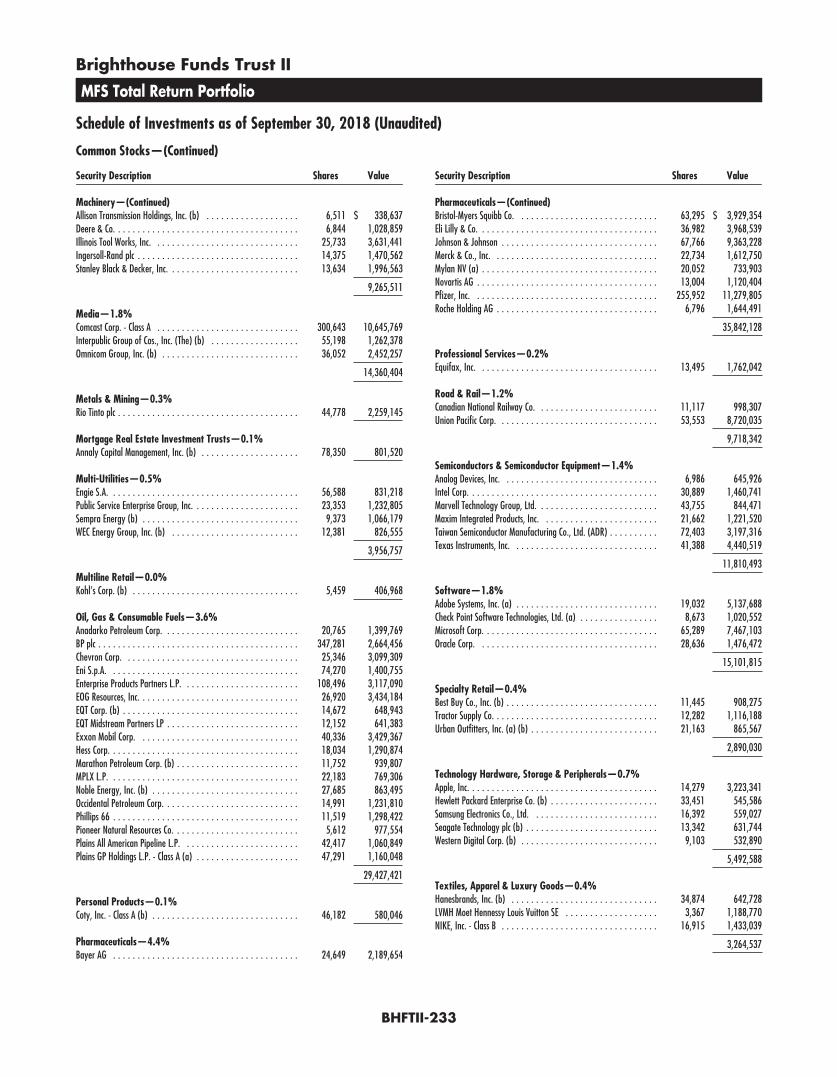
Brighthouse Funds Trust II
MFS Total Return Portfolio
Schedule of Investments as of September 30, 2018 (Unaudited)
Common Stocks—(Continued)
Security Description Shares Value
Machinery—(Continued)Allison Transmission Holdings, Inc. (b) . . . . . . . . . . . . . . . . . . . 6,511 $ 338,637Deere & Co. . . . . . . . . . . . . . . . . . . . . . . . . . . . . . . . . . . . . . 6,844 1,028,859Illinois Tool Works, Inc. . . . . . . . . . . . . . . . . . . . . . . . . . . . . . 25,733 3,631,441Ingersoll-Rand plc . . . . . . . . . . . . . . . . . . . . . . . . . . . . . . . . . 14,375 1,470,562Stanley Black & Decker, Inc. . . . . . . . . . . . . . . . . . . . . . . . . . . 13,634 1,996,563
9,265,511
Media—1.8%Comcast Corp. - Class A . . . . . . . . . . . . . . . . . . . . . . . . . . . . . 300,643 10,645,769Interpublic Group of Cos., Inc. (The) (b) . . . . . . . . . . . . . . . . . . 55,198 1,262,378Omnicom Group, Inc. (b) . . . . . . . . . . . . . . . . . . . . . . . . . . . . 36,052 2,452,257
14,360,404
Metals & Mining—0.3%Rio Tinto plc . . . . . . . . . . . . . . . . . . . . . . . . . . . . . . . . . . . . . 44,778 2,259,145
Mortgage Real Estate Investment Trusts—0.1%Annaly Capital Management, Inc. (b) . . . . . . . . . . . . . . . . . . . . 78,350 801,520
Multi-Utilities—0.5%Engie S.A. . . . . . . . . . . . . . . . . . . . . . . . . . . . . . . . . . . . . . . 56,588 831,218Public Service Enterprise Group, Inc. . . . . . . . . . . . . . . . . . . . . . 23,353 1,232,805Sempra Energy (b) . . . . . . . . . . . . . . . . . . . . . . . . . . . . . . . . 9,373 1,066,179WEC Energy Group, Inc. (b) . . . . . . . . . . . . . . . . . . . . . . . . . . 12,381 826,555
3,956,757
Multiline Retail—0.0%Kohl’s Corp. (b) . . . . . . . . . . . . . . . . . . . . . . . . . . . . . . . . . . 5,459 406,968
Oil, Gas & Consumable Fuels—3.6%Anadarko Petroleum Corp. . . . . . . . . . . . . . . . . . . . . . . . . . . . 20,765 1,399,769BP plc . . . . . . . . . . . . . . . . . . . . . . . . . . . . . . . . . . . . . . . . . 347,281 2,664,456Chevron Corp. . . . . . . . . . . . . . . . . . . . . . . . . . . . . . . . . . . . 25,346 3,099,309Eni S.p.A. . . . . . . . . . . . . . . . . . . . . . . . . . . . . . . . . . . . . . . 74,270 1,400,755Enterprise Products Partners L.P. . . . . . . . . . . . . . . . . . . . . . . . 108,496 3,117,090EOG Resources, Inc. . . . . . . . . . . . . . . . . . . . . . . . . . . . . . . . . 26,920 3,434,184EQT Corp. (b) . . . . . . . . . . . . . . . . . . . . . . . . . . . . . . . . . . . . 14,672 648,943EQT Midstream Partners LP . . . . . . . . . . . . . . . . . . . . . . . . . . . 12,152 641,383Exxon Mobil Corp. . . . . . . . . . . . . . . . . . . . . . . . . . . . . . . . . 40,336 3,429,367Hess Corp. . . . . . . . . . . . . . . . . . . . . . . . . . . . . . . . . . . . . . . 18,034 1,290,874Marathon Petroleum Corp. (b) . . . . . . . . . . . . . . . . . . . . . . . . . 11,752 939,807MPLX L.P. . . . . . . . . . . . . . . . . . . . . . . . . . . . . . . . . . . . . . . 22,183 769,306Noble Energy, Inc. (b) . . . . . . . . . . . . . . . . . . . . . . . . . . . . . . 27,685 863,495Occidental Petroleum Corp. . . . . . . . . . . . . . . . . . . . . . . . . . . . 14,991 1,231,810Phillips 66 . . . . . . . . . . . . . . . . . . . . . . . . . . . . . . . . . . . . . . 11,519 1,298,422Pioneer Natural Resources Co. . . . . . . . . . . . . . . . . . . . . . . . . . 5,612 977,554Plains All American Pipeline L.P. . . . . . . . . . . . . . . . . . . . . . . . 42,417 1,060,849Plains GP Holdings L.P. - Class A (a) . . . . . . . . . . . . . . . . . . . . . 47,291 1,160,048
29,427,421
Personal Products—0.1%Coty, Inc. - Class A (b) . . . . . . . . . . . . . . . . . . . . . . . . . . . . . . 46,182 580,046
Pharmaceuticals—4.4%Bayer AG . . . . . . . . . . . . . . . . . . . . . . . . . . . . . . . . . . . . . . 24,649 2,189,654
Security Description Shares Value
Pharmaceuticals—(Continued)Bristol-Myers Squibb Co. . . . . . . . . . . . . . . . . . . . . . . . . . . . . 63,295 $ 3,929,354Eli Lilly & Co. . . . . . . . . . . . . . . . . . . . . . . . . . . . . . . . . . . . . 36,982 3,968,539Johnson & Johnson . . . . . . . . . . . . . . . . . . . . . . . . . . . . . . . . 67,766 9,363,228Merck & Co., Inc. . . . . . . . . . . . . . . . . . . . . . . . . . . . . . . . . . 22,734 1,612,750Mylan NV (a) . . . . . . . . . . . . . . . . . . . . . . . . . . . . . . . . . . . . 20,052 733,903Novartis AG . . . . . . . . . . . . . . . . . . . . . . . . . . . . . . . . . . . . . 13,004 1,120,404Pfizer, Inc. . . . . . . . . . . . . . . . . . . . . . . . . . . . . . . . . . . . . . 255,952 11,279,805Roche Holding AG . . . . . . . . . . . . . . . . . . . . . . . . . . . . . . . . . 6,796 1,644,491
35,842,128
Professional Services—0.2%Equifax, Inc. . . . . . . . . . . . . . . . . . . . . . . . . . . . . . . . . . . . . 13,495 1,762,042
Road & Rail—1.2%Canadian National Railway Co. . . . . . . . . . . . . . . . . . . . . . . . . 11,117 998,307Union Pacific Corp. . . . . . . . . . . . . . . . . . . . . . . . . . . . . . . . . 53,553 8,720,035
9,718,342
Semiconductors & Semiconductor Equipment—1.4%Analog Devices, Inc. . . . . . . . . . . . . . . . . . . . . . . . . . . . . . . . 6,986 645,926Intel Corp. . . . . . . . . . . . . . . . . . . . . . . . . . . . . . . . . . . . . . . 30,889 1,460,741Marvell Technology Group, Ltd. . . . . . . . . . . . . . . . . . . . . . . . . 43,755 844,471Maxim Integrated Products, Inc. . . . . . . . . . . . . . . . . . . . . . . . 21,662 1,221,520Taiwan Semiconductor Manufacturing Co., Ltd. (ADR) . . . . . . . . . . 72,403 3,197,316Texas Instruments, Inc. . . . . . . . . . . . . . . . . . . . . . . . . . . . . . 41,388 4,440,519
11,810,493
Software—1.8%Adobe Systems, Inc. (a) . . . . . . . . . . . . . . . . . . . . . . . . . . . . . 19,032 5,137,688Check Point Software Technologies, Ltd. (a) . . . . . . . . . . . . . . . . 8,673 1,020,552Microsoft Corp. . . . . . . . . . . . . . . . . . . . . . . . . . . . . . . . . . . . 65,289 7,467,103Oracle Corp. . . . . . . . . . . . . . . . . . . . . . . . . . . . . . . . . . . . . 28,636 1,476,472
15,101,815
Specialty Retail—0.4%Best Buy Co., Inc. (b) . . . . . . . . . . . . . . . . . . . . . . . . . . . . . . . 11,445 908,275Tractor Supply Co. . . . . . . . . . . . . . . . . . . . . . . . . . . . . . . . . . 12,282 1,116,188Urban Outfitters, Inc. (a) (b) . . . . . . . . . . . . . . . . . . . . . . . . . . 21,163 865,567
2,890,030
Technology Hardware, Storage & Peripherals—0.7%Apple, Inc. . . . . . . . . . . . . . . . . . . . . . . . . . . . . . . . . . . . . . . 14,279 3,223,341Hewlett Packard Enterprise Co. (b) . . . . . . . . . . . . . . . . . . . . . . 33,451 545,586Samsung Electronics Co., Ltd. . . . . . . . . . . . . . . . . . . . . . . . . . 16,392 559,027Seagate Technology plc (b) . . . . . . . . . . . . . . . . . . . . . . . . . . . 13,342 631,744Western Digital Corp. (b) . . . . . . . . . . . . . . . . . . . . . . . . . . . . 9,103 532,890
5,492,588
Textiles, Apparel & Luxury Goods—0.4%Hanesbrands, Inc. (b) . . . . . . . . . . . . . . . . . . . . . . . . . . . . . . 34,874 642,728LVMH Moet Hennessy Louis Vuitton SE . . . . . . . . . . . . . . . . . . . 3,367 1,188,770NIKE, Inc. - Class B . . . . . . . . . . . . . . . . . . . . . . . . . . . . . . . . 16,915 1,433,039
3,264,537
BHFTII-233
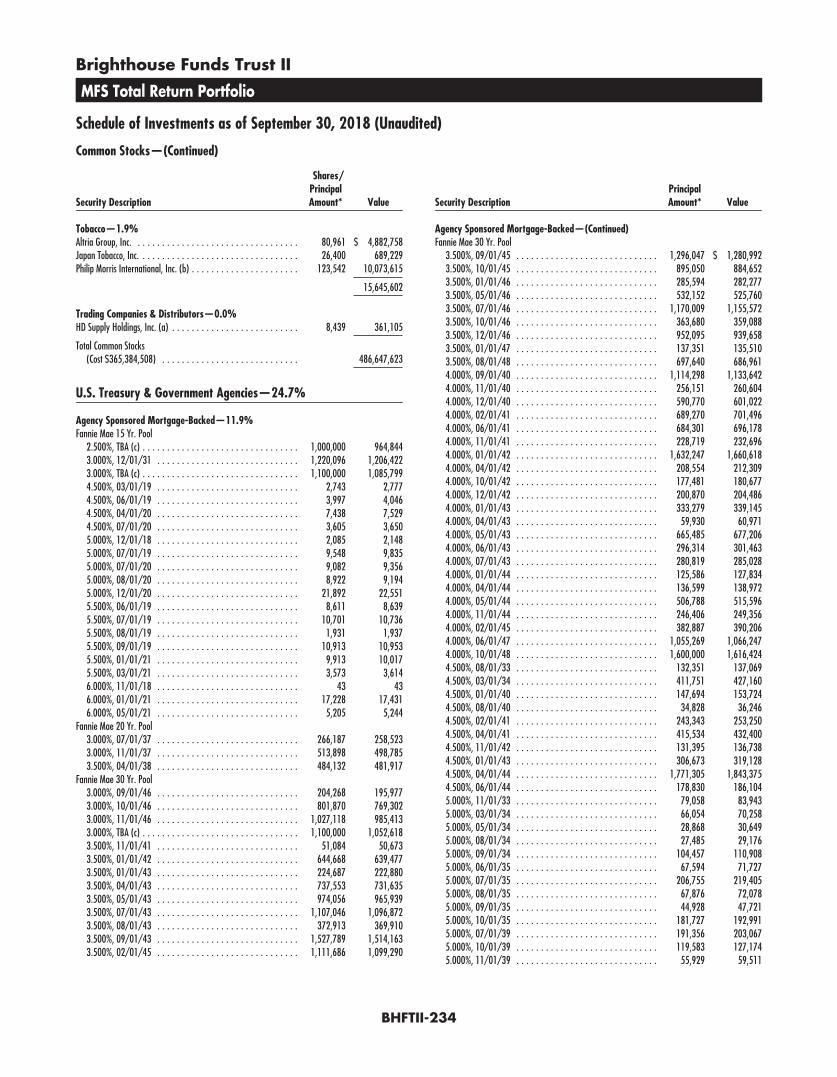
Brighthouse Funds Trust II
MFS Total Return Portfolio
Schedule of Investments as of September 30, 2018 (Unaudited)
Common Stocks—(Continued)
Security Description
Shares/PrincipalAmount* Value
Tobacco—1.9%Altria Group, Inc. . . . . . . . . . . . . . . . . . . . . . . . . . . . . . . . . . 80,961 $ 4,882,758Japan Tobacco, Inc. . . . . . . . . . . . . . . . . . . . . . . . . . . . . . . . . 26,400 689,229Philip Morris International, Inc. (b) . . . . . . . . . . . . . . . . . . . . . . 123,542 10,073,615
15,645,602
Trading Companies & Distributors—0.0%HD Supply Holdings, Inc. (a) . . . . . . . . . . . . . . . . . . . . . . . . . . 8,439 361,105
Total Common Stocks(Cost $365,384,508) . . . . . . . . . . . . . . . . . . . . . . . . . . . . 486,647,623
U.S. Treasury & Government Agencies—24.7%
Agency Sponsored Mortgage-Backed—11.9%Fannie Mae 15 Yr. Pool
2.500%, TBA (c) . . . . . . . . . . . . . . . . . . . . . . . . . . . . . . . . 1,000,000 964,8443.000%, 12/01/31 . . . . . . . . . . . . . . . . . . . . . . . . . . . . . 1,220,096 1,206,4223.000%, TBA (c) . . . . . . . . . . . . . . . . . . . . . . . . . . . . . . . . 1,100,000 1,085,7994.500%, 03/01/19 . . . . . . . . . . . . . . . . . . . . . . . . . . . . . 2,743 2,7774.500%, 06/01/19 . . . . . . . . . . . . . . . . . . . . . . . . . . . . . 3,997 4,0464.500%, 04/01/20 . . . . . . . . . . . . . . . . . . . . . . . . . . . . . 7,438 7,5294.500%, 07/01/20 . . . . . . . . . . . . . . . . . . . . . . . . . . . . . 3,605 3,6505.000%, 12/01/18 . . . . . . . . . . . . . . . . . . . . . . . . . . . . . 2,085 2,1485.000%, 07/01/19 . . . . . . . . . . . . . . . . . . . . . . . . . . . . . 9,548 9,8355.000%, 07/01/20 . . . . . . . . . . . . . . . . . . . . . . . . . . . . . 9,082 9,3565.000%, 08/01/20 . . . . . . . . . . . . . . . . . . . . . . . . . . . . . 8,922 9,1945.000%, 12/01/20 . . . . . . . . . . . . . . . . . . . . . . . . . . . . . 21,892 22,5515.500%, 06/01/19 . . . . . . . . . . . . . . . . . . . . . . . . . . . . . 8,611 8,6395.500%, 07/01/19 . . . . . . . . . . . . . . . . . . . . . . . . . . . . . 10,701 10,7365.500%, 08/01/19 . . . . . . . . . . . . . . . . . . . . . . . . . . . . . 1,931 1,9375.500%, 09/01/19 . . . . . . . . . . . . . . . . . . . . . . . . . . . . . 10,913 10,9535.500%, 01/01/21 . . . . . . . . . . . . . . . . . . . . . . . . . . . . . 9,913 10,0175.500%, 03/01/21 . . . . . . . . . . . . . . . . . . . . . . . . . . . . . 3,573 3,6146.000%, 11/01/18 . . . . . . . . . . . . . . . . . . . . . . . . . . . . . 43 436.000%, 01/01/21 . . . . . . . . . . . . . . . . . . . . . . . . . . . . . 17,228 17,4316.000%, 05/01/21 . . . . . . . . . . . . . . . . . . . . . . . . . . . . . 5,205 5,244
Fannie Mae 20 Yr. Pool3.000%, 07/01/37 . . . . . . . . . . . . . . . . . . . . . . . . . . . . . 266,187 258,5233.000%, 11/01/37 . . . . . . . . . . . . . . . . . . . . . . . . . . . . . 513,898 498,7853.500%, 04/01/38 . . . . . . . . . . . . . . . . . . . . . . . . . . . . . 484,132 481,917
Fannie Mae 30 Yr. Pool3.000%, 09/01/46 . . . . . . . . . . . . . . . . . . . . . . . . . . . . . 204,268 195,9773.000%, 10/01/46 . . . . . . . . . . . . . . . . . . . . . . . . . . . . . 801,870 769,3023.000%, 11/01/46 . . . . . . . . . . . . . . . . . . . . . . . . . . . . . 1,027,118 985,4133.000%, TBA (c) . . . . . . . . . . . . . . . . . . . . . . . . . . . . . . . . 1,100,000 1,052,6183.500%, 11/01/41 . . . . . . . . . . . . . . . . . . . . . . . . . . . . . 51,084 50,6733.500%, 01/01/42 . . . . . . . . . . . . . . . . . . . . . . . . . . . . . 644,668 639,4773.500%, 01/01/43 . . . . . . . . . . . . . . . . . . . . . . . . . . . . . 224,687 222,8803.500%, 04/01/43 . . . . . . . . . . . . . . . . . . . . . . . . . . . . . 737,553 731,6353.500%, 05/01/43 . . . . . . . . . . . . . . . . . . . . . . . . . . . . . 974,056 965,9393.500%, 07/01/43 . . . . . . . . . . . . . . . . . . . . . . . . . . . . . 1,107,046 1,096,8723.500%, 08/01/43 . . . . . . . . . . . . . . . . . . . . . . . . . . . . . 372,913 369,9103.500%, 09/01/43 . . . . . . . . . . . . . . . . . . . . . . . . . . . . . 1,527,789 1,514,1633.500%, 02/01/45 . . . . . . . . . . . . . . . . . . . . . . . . . . . . . 1,111,686 1,099,290
Security DescriptionPrincipalAmount* Value
Agency Sponsored Mortgage-Backed—(Continued)Fannie Mae 30 Yr. Pool
3.500%, 09/01/45 . . . . . . . . . . . . . . . . . . . . . . . . . . . . . 1,296,047 $ 1,280,9923.500%, 10/01/45 . . . . . . . . . . . . . . . . . . . . . . . . . . . . . 895,050 884,6523.500%, 01/01/46 . . . . . . . . . . . . . . . . . . . . . . . . . . . . . 285,594 282,2773.500%, 05/01/46 . . . . . . . . . . . . . . . . . . . . . . . . . . . . . 532,152 525,7603.500%, 07/01/46 . . . . . . . . . . . . . . . . . . . . . . . . . . . . . 1,170,009 1,155,5723.500%, 10/01/46 . . . . . . . . . . . . . . . . . . . . . . . . . . . . . 363,680 359,0883.500%, 12/01/46 . . . . . . . . . . . . . . . . . . . . . . . . . . . . . 952,095 939,6583.500%, 01/01/47 . . . . . . . . . . . . . . . . . . . . . . . . . . . . . 137,351 135,5103.500%, 08/01/48 . . . . . . . . . . . . . . . . . . . . . . . . . . . . . 697,640 686,9614.000%, 09/01/40 . . . . . . . . . . . . . . . . . . . . . . . . . . . . . 1,114,298 1,133,6424.000%, 11/01/40 . . . . . . . . . . . . . . . . . . . . . . . . . . . . . 256,151 260,6044.000%, 12/01/40 . . . . . . . . . . . . . . . . . . . . . . . . . . . . . 590,770 601,0224.000%, 02/01/41 . . . . . . . . . . . . . . . . . . . . . . . . . . . . . 689,270 701,4964.000%, 06/01/41 . . . . . . . . . . . . . . . . . . . . . . . . . . . . . 684,301 696,1784.000%, 11/01/41 . . . . . . . . . . . . . . . . . . . . . . . . . . . . . 228,719 232,6964.000%, 01/01/42 . . . . . . . . . . . . . . . . . . . . . . . . . . . . . 1,632,247 1,660,6184.000%, 04/01/42 . . . . . . . . . . . . . . . . . . . . . . . . . . . . . 208,554 212,3094.000%, 10/01/42 . . . . . . . . . . . . . . . . . . . . . . . . . . . . . 177,481 180,6774.000%, 12/01/42 . . . . . . . . . . . . . . . . . . . . . . . . . . . . . 200,870 204,4864.000%, 01/01/43 . . . . . . . . . . . . . . . . . . . . . . . . . . . . . 333,279 339,1454.000%, 04/01/43 . . . . . . . . . . . . . . . . . . . . . . . . . . . . . 59,930 60,9714.000%, 05/01/43 . . . . . . . . . . . . . . . . . . . . . . . . . . . . . 665,485 677,2064.000%, 06/01/43 . . . . . . . . . . . . . . . . . . . . . . . . . . . . . 296,314 301,4634.000%, 07/01/43 . . . . . . . . . . . . . . . . . . . . . . . . . . . . . 280,819 285,0284.000%, 01/01/44 . . . . . . . . . . . . . . . . . . . . . . . . . . . . . 125,586 127,8344.000%, 04/01/44 . . . . . . . . . . . . . . . . . . . . . . . . . . . . . 136,599 138,9724.000%, 05/01/44 . . . . . . . . . . . . . . . . . . . . . . . . . . . . . 506,788 515,5964.000%, 11/01/44 . . . . . . . . . . . . . . . . . . . . . . . . . . . . . 246,406 249,3564.000%, 02/01/45 . . . . . . . . . . . . . . . . . . . . . . . . . . . . . 382,887 390,2064.000%, 06/01/47 . . . . . . . . . . . . . . . . . . . . . . . . . . . . . 1,055,269 1,066,2474.000%, 10/01/48 . . . . . . . . . . . . . . . . . . . . . . . . . . . . . 1,600,000 1,616,4244.500%, 08/01/33 . . . . . . . . . . . . . . . . . . . . . . . . . . . . . 132,351 137,0694.500%, 03/01/34 . . . . . . . . . . . . . . . . . . . . . . . . . . . . . 411,751 427,1604.500%, 01/01/40 . . . . . . . . . . . . . . . . . . . . . . . . . . . . . 147,694 153,7244.500%, 08/01/40 . . . . . . . . . . . . . . . . . . . . . . . . . . . . . 34,828 36,2464.500%, 02/01/41 . . . . . . . . . . . . . . . . . . . . . . . . . . . . . 243,343 253,2504.500%, 04/01/41 . . . . . . . . . . . . . . . . . . . . . . . . . . . . . 415,534 432,4004.500%, 11/01/42 . . . . . . . . . . . . . . . . . . . . . . . . . . . . . 131,395 136,7384.500%, 01/01/43 . . . . . . . . . . . . . . . . . . . . . . . . . . . . . 306,673 319,1284.500%, 04/01/44 . . . . . . . . . . . . . . . . . . . . . . . . . . . . . 1,771,305 1,843,3754.500%, 06/01/44 . . . . . . . . . . . . . . . . . . . . . . . . . . . . . 178,830 186,1045.000%, 11/01/33 . . . . . . . . . . . . . . . . . . . . . . . . . . . . . 79,058 83,9435.000%, 03/01/34 . . . . . . . . . . . . . . . . . . . . . . . . . . . . . 66,054 70,2585.000%, 05/01/34 . . . . . . . . . . . . . . . . . . . . . . . . . . . . . 28,868 30,6495.000%, 08/01/34 . . . . . . . . . . . . . . . . . . . . . . . . . . . . . 27,485 29,1765.000%, 09/01/34 . . . . . . . . . . . . . . . . . . . . . . . . . . . . . 104,457 110,9085.000%, 06/01/35 . . . . . . . . . . . . . . . . . . . . . . . . . . . . . 67,594 71,7275.000%, 07/01/35 . . . . . . . . . . . . . . . . . . . . . . . . . . . . . 206,755 219,4055.000%, 08/01/35 . . . . . . . . . . . . . . . . . . . . . . . . . . . . . 67,876 72,0785.000%, 09/01/35 . . . . . . . . . . . . . . . . . . . . . . . . . . . . . 44,928 47,7215.000%, 10/01/35 . . . . . . . . . . . . . . . . . . . . . . . . . . . . . 181,727 192,9915.000%, 07/01/39 . . . . . . . . . . . . . . . . . . . . . . . . . . . . . 191,356 203,0675.000%, 10/01/39 . . . . . . . . . . . . . . . . . . . . . . . . . . . . . 119,583 127,1745.000%, 11/01/39 . . . . . . . . . . . . . . . . . . . . . . . . . . . . . 55,929 59,511
BHFTII-234
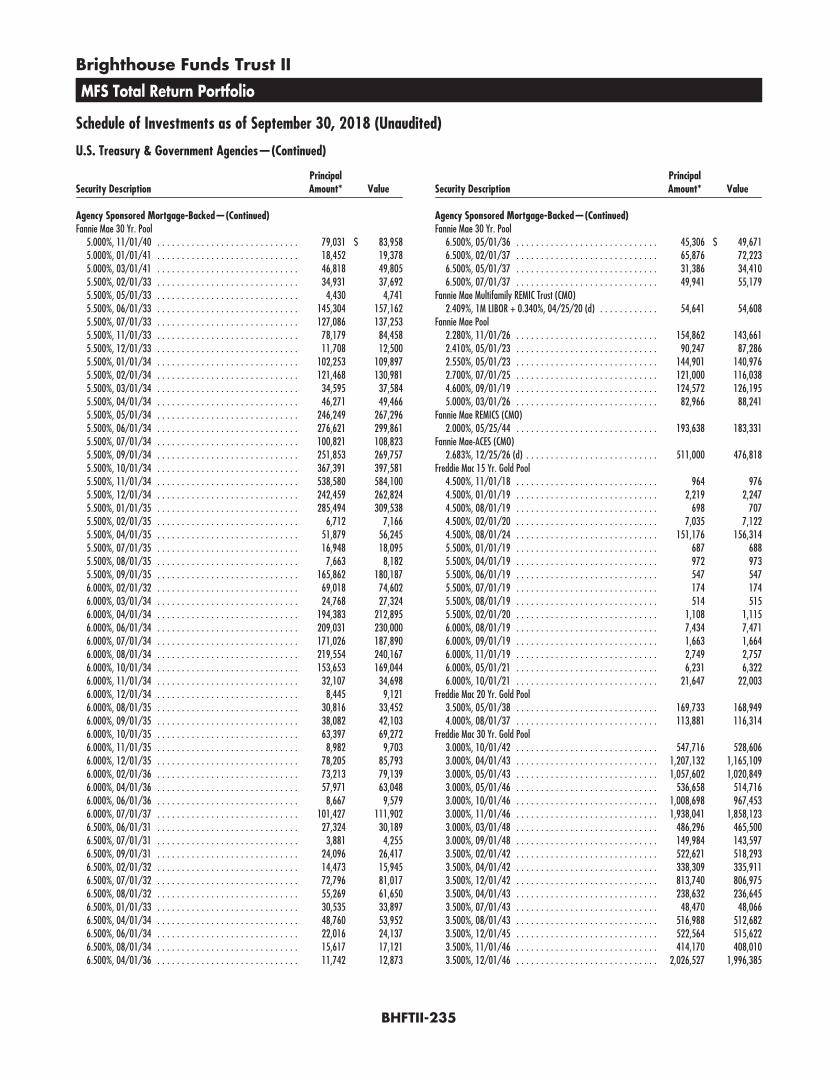
Brighthouse Funds Trust II
MFS Total Return Portfolio
Schedule of Investments as of September 30, 2018 (Unaudited)
U.S. Treasury & Government Agencies—(Continued)
Security DescriptionPrincipalAmount* Value
Agency Sponsored Mortgage-Backed—(Continued)Fannie Mae 30 Yr. Pool
5.000%, 11/01/40 . . . . . . . . . . . . . . . . . . . . . . . . . . . . . 79,031 $ 83,9585.000%, 01/01/41 . . . . . . . . . . . . . . . . . . . . . . . . . . . . . 18,452 19,3785.000%, 03/01/41 . . . . . . . . . . . . . . . . . . . . . . . . . . . . . 46,818 49,8055.500%, 02/01/33 . . . . . . . . . . . . . . . . . . . . . . . . . . . . . 34,931 37,6925.500%, 05/01/33 . . . . . . . . . . . . . . . . . . . . . . . . . . . . . 4,430 4,7415.500%, 06/01/33 . . . . . . . . . . . . . . . . . . . . . . . . . . . . . 145,304 157,1625.500%, 07/01/33 . . . . . . . . . . . . . . . . . . . . . . . . . . . . . 127,086 137,2535.500%, 11/01/33 . . . . . . . . . . . . . . . . . . . . . . . . . . . . . 78,179 84,4585.500%, 12/01/33 . . . . . . . . . . . . . . . . . . . . . . . . . . . . . 11,708 12,5005.500%, 01/01/34 . . . . . . . . . . . . . . . . . . . . . . . . . . . . . 102,253 109,8975.500%, 02/01/34 . . . . . . . . . . . . . . . . . . . . . . . . . . . . . 121,468 130,9815.500%, 03/01/34 . . . . . . . . . . . . . . . . . . . . . . . . . . . . . 34,595 37,5845.500%, 04/01/34 . . . . . . . . . . . . . . . . . . . . . . . . . . . . . 46,271 49,4665.500%, 05/01/34 . . . . . . . . . . . . . . . . . . . . . . . . . . . . . 246,249 267,2965.500%, 06/01/34 . . . . . . . . . . . . . . . . . . . . . . . . . . . . . 276,621 299,8615.500%, 07/01/34 . . . . . . . . . . . . . . . . . . . . . . . . . . . . . 100,821 108,8235.500%, 09/01/34 . . . . . . . . . . . . . . . . . . . . . . . . . . . . . 251,853 269,7575.500%, 10/01/34 . . . . . . . . . . . . . . . . . . . . . . . . . . . . . 367,391 397,5815.500%, 11/01/34 . . . . . . . . . . . . . . . . . . . . . . . . . . . . . 538,580 584,1005.500%, 12/01/34 . . . . . . . . . . . . . . . . . . . . . . . . . . . . . 242,459 262,8245.500%, 01/01/35 . . . . . . . . . . . . . . . . . . . . . . . . . . . . . 285,494 309,5385.500%, 02/01/35 . . . . . . . . . . . . . . . . . . . . . . . . . . . . . 6,712 7,1665.500%, 04/01/35 . . . . . . . . . . . . . . . . . . . . . . . . . . . . . 51,879 56,2455.500%, 07/01/35 . . . . . . . . . . . . . . . . . . . . . . . . . . . . . 16,948 18,0955.500%, 08/01/35 . . . . . . . . . . . . . . . . . . . . . . . . . . . . . 7,663 8,1825.500%, 09/01/35 . . . . . . . . . . . . . . . . . . . . . . . . . . . . . 165,862 180,1876.000%, 02/01/32 . . . . . . . . . . . . . . . . . . . . . . . . . . . . . 69,018 74,6026.000%, 03/01/34 . . . . . . . . . . . . . . . . . . . . . . . . . . . . . 24,768 27,3246.000%, 04/01/34 . . . . . . . . . . . . . . . . . . . . . . . . . . . . . 194,383 212,8956.000%, 06/01/34 . . . . . . . . . . . . . . . . . . . . . . . . . . . . . 209,031 230,0006.000%, 07/01/34 . . . . . . . . . . . . . . . . . . . . . . . . . . . . . 171,026 187,8906.000%, 08/01/34 . . . . . . . . . . . . . . . . . . . . . . . . . . . . . 219,554 240,1676.000%, 10/01/34 . . . . . . . . . . . . . . . . . . . . . . . . . . . . . 153,653 169,0446.000%, 11/01/34 . . . . . . . . . . . . . . . . . . . . . . . . . . . . . 32,107 34,6986.000%, 12/01/34 . . . . . . . . . . . . . . . . . . . . . . . . . . . . . 8,445 9,1216.000%, 08/01/35 . . . . . . . . . . . . . . . . . . . . . . . . . . . . . 30,816 33,4526.000%, 09/01/35 . . . . . . . . . . . . . . . . . . . . . . . . . . . . . 38,082 42,1036.000%, 10/01/35 . . . . . . . . . . . . . . . . . . . . . . . . . . . . . 63,397 69,2726.000%, 11/01/35 . . . . . . . . . . . . . . . . . . . . . . . . . . . . . 8,982 9,7036.000%, 12/01/35 . . . . . . . . . . . . . . . . . . . . . . . . . . . . . 78,205 85,7936.000%, 02/01/36 . . . . . . . . . . . . . . . . . . . . . . . . . . . . . 73,213 79,1396.000%, 04/01/36 . . . . . . . . . . . . . . . . . . . . . . . . . . . . . 57,971 63,0486.000%, 06/01/36 . . . . . . . . . . . . . . . . . . . . . . . . . . . . . 8,667 9,5796.000%, 07/01/37 . . . . . . . . . . . . . . . . . . . . . . . . . . . . . 101,427 111,9026.500%, 06/01/31 . . . . . . . . . . . . . . . . . . . . . . . . . . . . . 27,324 30,1896.500%, 07/01/31 . . . . . . . . . . . . . . . . . . . . . . . . . . . . . 3,881 4,2556.500%, 09/01/31 . . . . . . . . . . . . . . . . . . . . . . . . . . . . . 24,096 26,4176.500%, 02/01/32 . . . . . . . . . . . . . . . . . . . . . . . . . . . . . 14,473 15,9456.500%, 07/01/32 . . . . . . . . . . . . . . . . . . . . . . . . . . . . . 72,796 81,0176.500%, 08/01/32 . . . . . . . . . . . . . . . . . . . . . . . . . . . . . 55,269 61,6506.500%, 01/01/33 . . . . . . . . . . . . . . . . . . . . . . . . . . . . . 30,535 33,8976.500%, 04/01/34 . . . . . . . . . . . . . . . . . . . . . . . . . . . . . 48,760 53,9526.500%, 06/01/34 . . . . . . . . . . . . . . . . . . . . . . . . . . . . . 22,016 24,1376.500%, 08/01/34 . . . . . . . . . . . . . . . . . . . . . . . . . . . . . 15,617 17,1216.500%, 04/01/36 . . . . . . . . . . . . . . . . . . . . . . . . . . . . . 11,742 12,873
Security DescriptionPrincipalAmount* Value
Agency Sponsored Mortgage-Backed—(Continued)Fannie Mae 30 Yr. Pool
6.500%, 05/01/36 . . . . . . . . . . . . . . . . . . . . . . . . . . . . . 45,306 $ 49,6716.500%, 02/01/37 . . . . . . . . . . . . . . . . . . . . . . . . . . . . . 65,876 72,2236.500%, 05/01/37 . . . . . . . . . . . . . . . . . . . . . . . . . . . . . 31,386 34,4106.500%, 07/01/37 . . . . . . . . . . . . . . . . . . . . . . . . . . . . . 49,941 55,179
Fannie Mae Multifamily REMIC Trust (CMO)2.409%, 1M LIBOR + 0.340%, 04/25/20 (d) . . . . . . . . . . . . 54,641 54,608
Fannie Mae Pool2.280%, 11/01/26 . . . . . . . . . . . . . . . . . . . . . . . . . . . . . 154,862 143,6612.410%, 05/01/23 . . . . . . . . . . . . . . . . . . . . . . . . . . . . . 90,247 87,2862.550%, 05/01/23 . . . . . . . . . . . . . . . . . . . . . . . . . . . . . 144,901 140,9762.700%, 07/01/25 . . . . . . . . . . . . . . . . . . . . . . . . . . . . . 121,000 116,0384.600%, 09/01/19 . . . . . . . . . . . . . . . . . . . . . . . . . . . . . 124,572 126,1955.000%, 03/01/26 . . . . . . . . . . . . . . . . . . . . . . . . . . . . . 82,966 88,241
Fannie Mae REMICS (CMO)2.000%, 05/25/44 . . . . . . . . . . . . . . . . . . . . . . . . . . . . . 193,638 183,331
Fannie Mae-ACES (CMO)2.683%, 12/25/26 (d) . . . . . . . . . . . . . . . . . . . . . . . . . . . 511,000 476,818
Freddie Mac 15 Yr. Gold Pool4.500%, 11/01/18 . . . . . . . . . . . . . . . . . . . . . . . . . . . . . 964 9764.500%, 01/01/19 . . . . . . . . . . . . . . . . . . . . . . . . . . . . . 2,219 2,2474.500%, 08/01/19 . . . . . . . . . . . . . . . . . . . . . . . . . . . . . 698 7074.500%, 02/01/20 . . . . . . . . . . . . . . . . . . . . . . . . . . . . . 7,035 7,1224.500%, 08/01/24 . . . . . . . . . . . . . . . . . . . . . . . . . . . . . 151,176 156,3145.500%, 01/01/19 . . . . . . . . . . . . . . . . . . . . . . . . . . . . . 687 6885.500%, 04/01/19 . . . . . . . . . . . . . . . . . . . . . . . . . . . . . 972 9735.500%, 06/01/19 . . . . . . . . . . . . . . . . . . . . . . . . . . . . . 547 5475.500%, 07/01/19 . . . . . . . . . . . . . . . . . . . . . . . . . . . . . 174 1745.500%, 08/01/19 . . . . . . . . . . . . . . . . . . . . . . . . . . . . . 514 5155.500%, 02/01/20 . . . . . . . . . . . . . . . . . . . . . . . . . . . . . 1,108 1,1156.000%, 08/01/19 . . . . . . . . . . . . . . . . . . . . . . . . . . . . . 7,434 7,4716.000%, 09/01/19 . . . . . . . . . . . . . . . . . . . . . . . . . . . . . 1,663 1,6646.000%, 11/01/19 . . . . . . . . . . . . . . . . . . . . . . . . . . . . . 2,749 2,7576.000%, 05/01/21 . . . . . . . . . . . . . . . . . . . . . . . . . . . . . 6,231 6,3226.000%, 10/01/21 . . . . . . . . . . . . . . . . . . . . . . . . . . . . . 21,647 22,003
Freddie Mac 20 Yr. Gold Pool3.500%, 05/01/38 . . . . . . . . . . . . . . . . . . . . . . . . . . . . . 169,733 168,9494.000%, 08/01/37 . . . . . . . . . . . . . . . . . . . . . . . . . . . . . 113,881 116,314
Freddie Mac 30 Yr. Gold Pool3.000%, 10/01/42 . . . . . . . . . . . . . . . . . . . . . . . . . . . . . 547,716 528,6063.000%, 04/01/43 . . . . . . . . . . . . . . . . . . . . . . . . . . . . . 1,207,132 1,165,1093.000%, 05/01/43 . . . . . . . . . . . . . . . . . . . . . . . . . . . . . 1,057,602 1,020,8493.000%, 05/01/46 . . . . . . . . . . . . . . . . . . . . . . . . . . . . . 536,658 514,7163.000%, 10/01/46 . . . . . . . . . . . . . . . . . . . . . . . . . . . . . 1,008,698 967,4533.000%, 11/01/46 . . . . . . . . . . . . . . . . . . . . . . . . . . . . . 1,938,041 1,858,1233.000%, 03/01/48 . . . . . . . . . . . . . . . . . . . . . . . . . . . . . 486,296 465,5003.000%, 09/01/48 . . . . . . . . . . . . . . . . . . . . . . . . . . . . . 149,984 143,5973.500%, 02/01/42 . . . . . . . . . . . . . . . . . . . . . . . . . . . . . 522,621 518,2933.500%, 04/01/42 . . . . . . . . . . . . . . . . . . . . . . . . . . . . . 338,309 335,9113.500%, 12/01/42 . . . . . . . . . . . . . . . . . . . . . . . . . . . . . 813,740 806,9753.500%, 04/01/43 . . . . . . . . . . . . . . . . . . . . . . . . . . . . . 238,632 236,6453.500%, 07/01/43 . . . . . . . . . . . . . . . . . . . . . . . . . . . . . 48,470 48,0663.500%, 08/01/43 . . . . . . . . . . . . . . . . . . . . . . . . . . . . . 516,988 512,6823.500%, 12/01/45 . . . . . . . . . . . . . . . . . . . . . . . . . . . . . 522,564 515,6223.500%, 11/01/46 . . . . . . . . . . . . . . . . . . . . . . . . . . . . . 414,170 408,0103.500%, 12/01/46 . . . . . . . . . . . . . . . . . . . . . . . . . . . . . 2,026,527 1,996,385
BHFTII-235
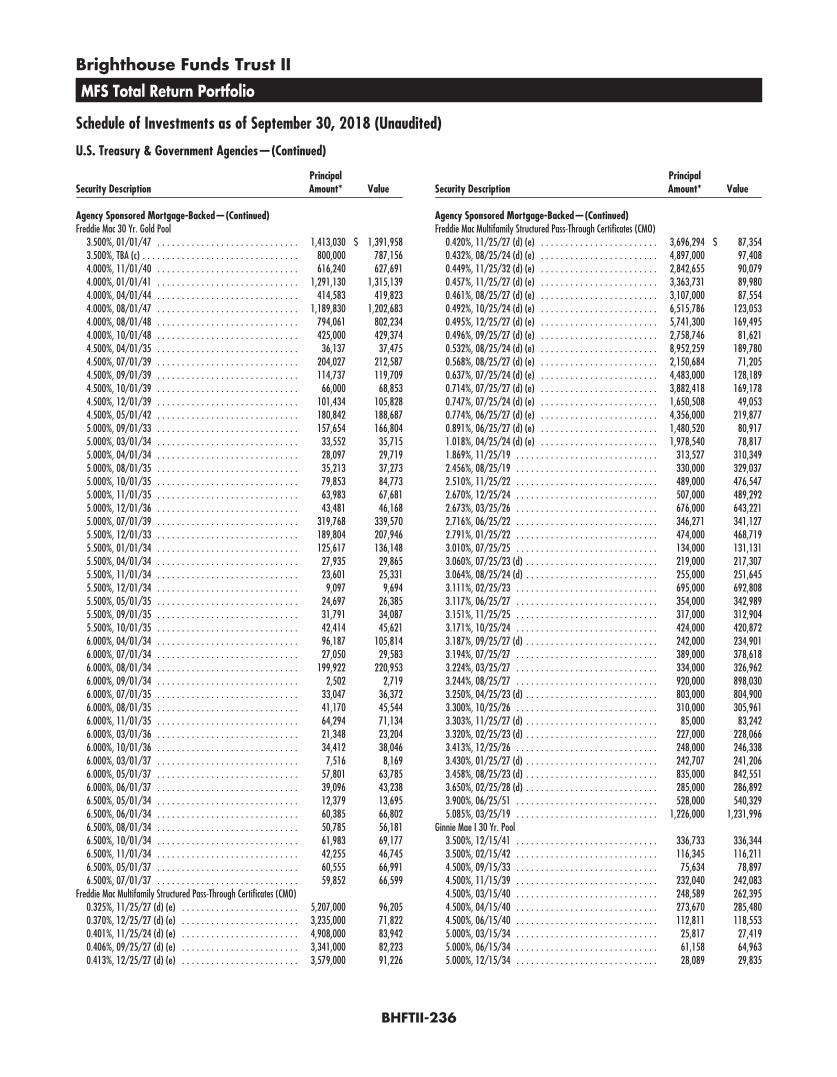
Brighthouse Funds Trust II
MFS Total Return Portfolio
Schedule of Investments as of September 30, 2018 (Unaudited)
U.S. Treasury & Government Agencies—(Continued)
Security DescriptionPrincipalAmount* Value
Agency Sponsored Mortgage-Backed—(Continued)Freddie Mac 30 Yr. Gold Pool
3.500%, 01/01/47 . . . . . . . . . . . . . . . . . . . . . . . . . . . . . 1,413,030 $ 1,391,9583.500%, TBA (c) . . . . . . . . . . . . . . . . . . . . . . . . . . . . . . . . 800,000 787,1564.000%, 11/01/40 . . . . . . . . . . . . . . . . . . . . . . . . . . . . . 616,240 627,6914.000%, 01/01/41 . . . . . . . . . . . . . . . . . . . . . . . . . . . . . 1,291,130 1,315,1394.000%, 04/01/44 . . . . . . . . . . . . . . . . . . . . . . . . . . . . . 414,583 419,8234.000%, 08/01/47 . . . . . . . . . . . . . . . . . . . . . . . . . . . . . 1,189,830 1,202,6834.000%, 08/01/48 . . . . . . . . . . . . . . . . . . . . . . . . . . . . . 794,061 802,2344.000%, 10/01/48 . . . . . . . . . . . . . . . . . . . . . . . . . . . . . 425,000 429,3744.500%, 04/01/35 . . . . . . . . . . . . . . . . . . . . . . . . . . . . . 36,137 37,4754.500%, 07/01/39 . . . . . . . . . . . . . . . . . . . . . . . . . . . . . 204,027 212,5874.500%, 09/01/39 . . . . . . . . . . . . . . . . . . . . . . . . . . . . . 114,737 119,7094.500%, 10/01/39 . . . . . . . . . . . . . . . . . . . . . . . . . . . . . 66,000 68,8534.500%, 12/01/39 . . . . . . . . . . . . . . . . . . . . . . . . . . . . . 101,434 105,8284.500%, 05/01/42 . . . . . . . . . . . . . . . . . . . . . . . . . . . . . 180,842 188,6875.000%, 09/01/33 . . . . . . . . . . . . . . . . . . . . . . . . . . . . . 157,654 166,8045.000%, 03/01/34 . . . . . . . . . . . . . . . . . . . . . . . . . . . . . 33,552 35,7155.000%, 04/01/34 . . . . . . . . . . . . . . . . . . . . . . . . . . . . . 28,097 29,7195.000%, 08/01/35 . . . . . . . . . . . . . . . . . . . . . . . . . . . . . 35,213 37,2735.000%, 10/01/35 . . . . . . . . . . . . . . . . . . . . . . . . . . . . . 79,853 84,7735.000%, 11/01/35 . . . . . . . . . . . . . . . . . . . . . . . . . . . . . 63,983 67,6815.000%, 12/01/36 . . . . . . . . . . . . . . . . . . . . . . . . . . . . . 43,481 46,1685.000%, 07/01/39 . . . . . . . . . . . . . . . . . . . . . . . . . . . . . 319,768 339,5705.500%, 12/01/33 . . . . . . . . . . . . . . . . . . . . . . . . . . . . . 189,804 207,9465.500%, 01/01/34 . . . . . . . . . . . . . . . . . . . . . . . . . . . . . 125,617 136,1485.500%, 04/01/34 . . . . . . . . . . . . . . . . . . . . . . . . . . . . . 27,935 29,8655.500%, 11/01/34 . . . . . . . . . . . . . . . . . . . . . . . . . . . . . 23,601 25,3315.500%, 12/01/34 . . . . . . . . . . . . . . . . . . . . . . . . . . . . . 9,097 9,6945.500%, 05/01/35 . . . . . . . . . . . . . . . . . . . . . . . . . . . . . 24,697 26,3855.500%, 09/01/35 . . . . . . . . . . . . . . . . . . . . . . . . . . . . . 31,791 34,0875.500%, 10/01/35 . . . . . . . . . . . . . . . . . . . . . . . . . . . . . 42,414 45,6216.000%, 04/01/34 . . . . . . . . . . . . . . . . . . . . . . . . . . . . . 96,187 105,8146.000%, 07/01/34 . . . . . . . . . . . . . . . . . . . . . . . . . . . . . 27,050 29,5836.000%, 08/01/34 . . . . . . . . . . . . . . . . . . . . . . . . . . . . . 199,922 220,9536.000%, 09/01/34 . . . . . . . . . . . . . . . . . . . . . . . . . . . . . 2,502 2,7196.000%, 07/01/35 . . . . . . . . . . . . . . . . . . . . . . . . . . . . . 33,047 36,3726.000%, 08/01/35 . . . . . . . . . . . . . . . . . . . . . . . . . . . . . 41,170 45,5446.000%, 11/01/35 . . . . . . . . . . . . . . . . . . . . . . . . . . . . . 64,294 71,1346.000%, 03/01/36 . . . . . . . . . . . . . . . . . . . . . . . . . . . . . 21,348 23,2046.000%, 10/01/36 . . . . . . . . . . . . . . . . . . . . . . . . . . . . . 34,412 38,0466.000%, 03/01/37 . . . . . . . . . . . . . . . . . . . . . . . . . . . . . 7,516 8,1696.000%, 05/01/37 . . . . . . . . . . . . . . . . . . . . . . . . . . . . . 57,801 63,7856.000%, 06/01/37 . . . . . . . . . . . . . . . . . . . . . . . . . . . . . 39,096 43,2386.500%, 05/01/34 . . . . . . . . . . . . . . . . . . . . . . . . . . . . . 12,379 13,6956.500%, 06/01/34 . . . . . . . . . . . . . . . . . . . . . . . . . . . . . 60,385 66,8026.500%, 08/01/34 . . . . . . . . . . . . . . . . . . . . . . . . . . . . . 50,785 56,1816.500%, 10/01/34 . . . . . . . . . . . . . . . . . . . . . . . . . . . . . 61,983 69,1776.500%, 11/01/34 . . . . . . . . . . . . . . . . . . . . . . . . . . . . . 42,255 46,7456.500%, 05/01/37 . . . . . . . . . . . . . . . . . . . . . . . . . . . . . 60,555 66,9916.500%, 07/01/37 . . . . . . . . . . . . . . . . . . . . . . . . . . . . . 59,852 66,599
Freddie Mac Multifamily Structured Pass-Through Certificates (CMO)0.325%, 11/25/27 (d) (e) . . . . . . . . . . . . . . . . . . . . . . . . 5,207,000 96,2050.370%, 12/25/27 (d) (e) . . . . . . . . . . . . . . . . . . . . . . . . 3,235,000 71,8220.401%, 11/25/24 (d) (e) . . . . . . . . . . . . . . . . . . . . . . . . 4,908,000 83,9420.406%, 09/25/27 (d) (e) . . . . . . . . . . . . . . . . . . . . . . . . 3,341,000 82,2230.413%, 12/25/27 (d) (e) . . . . . . . . . . . . . . . . . . . . . . . . 3,579,000 91,226
Security DescriptionPrincipalAmount* Value
Agency Sponsored Mortgage-Backed—(Continued)Freddie Mac Multifamily Structured Pass-Through Certificates (CMO)
0.420%, 11/25/27 (d) (e) . . . . . . . . . . . . . . . . . . . . . . . . 3,696,294 $ 87,3540.432%, 08/25/24 (d) (e) . . . . . . . . . . . . . . . . . . . . . . . . 4,897,000 97,4080.449%, 11/25/32 (d) (e) . . . . . . . . . . . . . . . . . . . . . . . . 2,842,655 90,0790.457%, 11/25/27 (d) (e) . . . . . . . . . . . . . . . . . . . . . . . . 3,363,731 89,9800.461%, 08/25/27 (d) (e) . . . . . . . . . . . . . . . . . . . . . . . . 3,107,000 87,5540.492%, 10/25/24 (d) (e) . . . . . . . . . . . . . . . . . . . . . . . . 6,515,786 123,0530.495%, 12/25/27 (d) (e) . . . . . . . . . . . . . . . . . . . . . . . . 5,741,300 169,4950.496%, 09/25/27 (d) (e) . . . . . . . . . . . . . . . . . . . . . . . . 2,758,746 81,6210.532%, 08/25/24 (d) (e) . . . . . . . . . . . . . . . . . . . . . . . . 8,952,259 189,7800.568%, 08/25/27 (d) (e) . . . . . . . . . . . . . . . . . . . . . . . . 2,150,684 71,2050.637%, 07/25/24 (d) (e) . . . . . . . . . . . . . . . . . . . . . . . . 4,483,000 128,1890.714%, 07/25/27 (d) (e) . . . . . . . . . . . . . . . . . . . . . . . . 3,882,418 169,1780.747%, 07/25/24 (d) (e) . . . . . . . . . . . . . . . . . . . . . . . . 1,650,508 49,0530.774%, 06/25/27 (d) (e) . . . . . . . . . . . . . . . . . . . . . . . . 4,356,000 219,8770.891%, 06/25/27 (d) (e) . . . . . . . . . . . . . . . . . . . . . . . . 1,480,520 80,9171.018%, 04/25/24 (d) (e) . . . . . . . . . . . . . . . . . . . . . . . . 1,978,540 78,8171.869%, 11/25/19 . . . . . . . . . . . . . . . . . . . . . . . . . . . . . 313,527 310,3492.456%, 08/25/19 . . . . . . . . . . . . . . . . . . . . . . . . . . . . . 330,000 329,0372.510%, 11/25/22 . . . . . . . . . . . . . . . . . . . . . . . . . . . . . 489,000 476,5472.670%, 12/25/24 . . . . . . . . . . . . . . . . . . . . . . . . . . . . . 507,000 489,2922.673%, 03/25/26 . . . . . . . . . . . . . . . . . . . . . . . . . . . . . 676,000 643,2212.716%, 06/25/22 . . . . . . . . . . . . . . . . . . . . . . . . . . . . . 346,271 341,1272.791%, 01/25/22 . . . . . . . . . . . . . . . . . . . . . . . . . . . . . 474,000 468,7193.010%, 07/25/25 . . . . . . . . . . . . . . . . . . . . . . . . . . . . . 134,000 131,1313.060%, 07/25/23 (d) . . . . . . . . . . . . . . . . . . . . . . . . . . . 219,000 217,3073.064%, 08/25/24 (d) . . . . . . . . . . . . . . . . . . . . . . . . . . . 255,000 251,6453.111%, 02/25/23 . . . . . . . . . . . . . . . . . . . . . . . . . . . . . 695,000 692,8083.117%, 06/25/27 . . . . . . . . . . . . . . . . . . . . . . . . . . . . . 354,000 342,9893.151%, 11/25/25 . . . . . . . . . . . . . . . . . . . . . . . . . . . . . 317,000 312,9043.171%, 10/25/24 . . . . . . . . . . . . . . . . . . . . . . . . . . . . . 424,000 420,8723.187%, 09/25/27 (d) . . . . . . . . . . . . . . . . . . . . . . . . . . . 242,000 234,9013.194%, 07/25/27 . . . . . . . . . . . . . . . . . . . . . . . . . . . . . 389,000 378,6183.224%, 03/25/27 . . . . . . . . . . . . . . . . . . . . . . . . . . . . . 334,000 326,9623.244%, 08/25/27 . . . . . . . . . . . . . . . . . . . . . . . . . . . . . 920,000 898,0303.250%, 04/25/23 (d) . . . . . . . . . . . . . . . . . . . . . . . . . . . 803,000 804,9003.300%, 10/25/26 . . . . . . . . . . . . . . . . . . . . . . . . . . . . . 310,000 305,9613.303%, 11/25/27 (d) . . . . . . . . . . . . . . . . . . . . . . . . . . . 85,000 83,2423.320%, 02/25/23 (d) . . . . . . . . . . . . . . . . . . . . . . . . . . . 227,000 228,0663.413%, 12/25/26 . . . . . . . . . . . . . . . . . . . . . . . . . . . . . 248,000 246,3383.430%, 01/25/27 (d) . . . . . . . . . . . . . . . . . . . . . . . . . . . 242,707 241,2063.458%, 08/25/23 (d) . . . . . . . . . . . . . . . . . . . . . . . . . . . 835,000 842,5513.650%, 02/25/28 (d) . . . . . . . . . . . . . . . . . . . . . . . . . . . 285,000 286,8923.900%, 06/25/51 . . . . . . . . . . . . . . . . . . . . . . . . . . . . . 528,000 540,3295.085%, 03/25/19 . . . . . . . . . . . . . . . . . . . . . . . . . . . . . 1,226,000 1,231,996
Ginnie Mae I 30 Yr. Pool3.500%, 12/15/41 . . . . . . . . . . . . . . . . . . . . . . . . . . . . . 336,733 336,3443.500%, 02/15/42 . . . . . . . . . . . . . . . . . . . . . . . . . . . . . 116,345 116,2114.500%, 09/15/33 . . . . . . . . . . . . . . . . . . . . . . . . . . . . . 75,634 78,8974.500%, 11/15/39 . . . . . . . . . . . . . . . . . . . . . . . . . . . . . 232,040 242,0834.500%, 03/15/40 . . . . . . . . . . . . . . . . . . . . . . . . . . . . . 248,589 262,3954.500%, 04/15/40 . . . . . . . . . . . . . . . . . . . . . . . . . . . . . 273,670 285,4804.500%, 06/15/40 . . . . . . . . . . . . . . . . . . . . . . . . . . . . . 112,811 118,5535.000%, 03/15/34 . . . . . . . . . . . . . . . . . . . . . . . . . . . . . 25,817 27,4195.000%, 06/15/34 . . . . . . . . . . . . . . . . . . . . . . . . . . . . . 61,158 64,9635.000%, 12/15/34 . . . . . . . . . . . . . . . . . . . . . . . . . . . . . 28,089 29,835
BHFTII-236
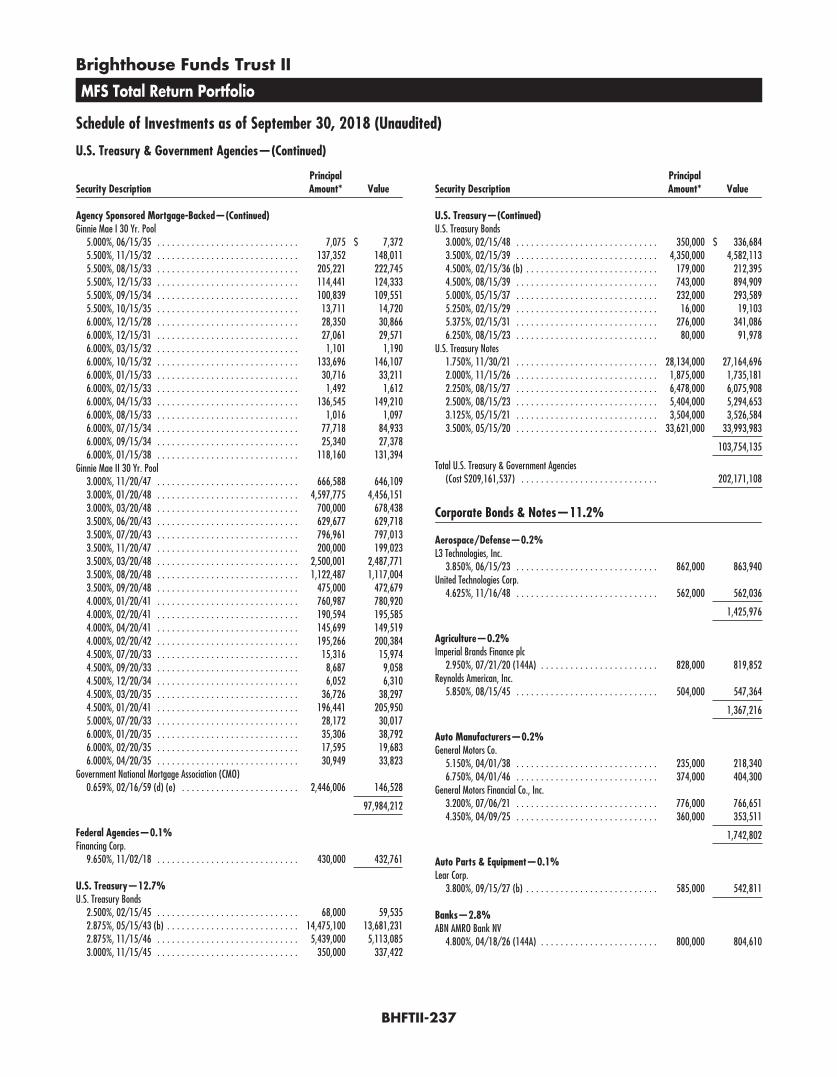
Brighthouse Funds Trust II
MFS Total Return Portfolio
Schedule of Investments as of September 30, 2018 (Unaudited)
U.S. Treasury & Government Agencies—(Continued)
Security DescriptionPrincipalAmount* Value
Agency Sponsored Mortgage-Backed—(Continued)Ginnie Mae I 30 Yr. Pool
5.000%, 06/15/35 . . . . . . . . . . . . . . . . . . . . . . . . . . . . . 7,075 $ 7,3725.500%, 11/15/32 . . . . . . . . . . . . . . . . . . . . . . . . . . . . . 137,352 148,0115.500%, 08/15/33 . . . . . . . . . . . . . . . . . . . . . . . . . . . . . 205,221 222,7455.500%, 12/15/33 . . . . . . . . . . . . . . . . . . . . . . . . . . . . . 114,441 124,3335.500%, 09/15/34 . . . . . . . . . . . . . . . . . . . . . . . . . . . . . 100,839 109,5515.500%, 10/15/35 . . . . . . . . . . . . . . . . . . . . . . . . . . . . . 13,711 14,7206.000%, 12/15/28 . . . . . . . . . . . . . . . . . . . . . . . . . . . . . 28,350 30,8666.000%, 12/15/31 . . . . . . . . . . . . . . . . . . . . . . . . . . . . . 27,061 29,5716.000%, 03/15/32 . . . . . . . . . . . . . . . . . . . . . . . . . . . . . 1,101 1,1906.000%, 10/15/32 . . . . . . . . . . . . . . . . . . . . . . . . . . . . . 133,696 146,1076.000%, 01/15/33 . . . . . . . . . . . . . . . . . . . . . . . . . . . . . 30,716 33,2116.000%, 02/15/33 . . . . . . . . . . . . . . . . . . . . . . . . . . . . . 1,492 1,6126.000%, 04/15/33 . . . . . . . . . . . . . . . . . . . . . . . . . . . . . 136,545 149,2106.000%, 08/15/33 . . . . . . . . . . . . . . . . . . . . . . . . . . . . . 1,016 1,0976.000%, 07/15/34 . . . . . . . . . . . . . . . . . . . . . . . . . . . . . 77,718 84,9336.000%, 09/15/34 . . . . . . . . . . . . . . . . . . . . . . . . . . . . . 25,340 27,3786.000%, 01/15/38 . . . . . . . . . . . . . . . . . . . . . . . . . . . . . 118,160 131,394
Ginnie Mae II 30 Yr. Pool3.000%, 11/20/47 . . . . . . . . . . . . . . . . . . . . . . . . . . . . . 666,588 646,1093.000%, 01/20/48 . . . . . . . . . . . . . . . . . . . . . . . . . . . . . 4,597,775 4,456,1513.000%, 03/20/48 . . . . . . . . . . . . . . . . . . . . . . . . . . . . . 700,000 678,4383.500%, 06/20/43 . . . . . . . . . . . . . . . . . . . . . . . . . . . . . 629,677 629,7183.500%, 07/20/43 . . . . . . . . . . . . . . . . . . . . . . . . . . . . . 796,961 797,0133.500%, 11/20/47 . . . . . . . . . . . . . . . . . . . . . . . . . . . . . 200,000 199,0233.500%, 03/20/48 . . . . . . . . . . . . . . . . . . . . . . . . . . . . . 2,500,001 2,487,7713.500%, 08/20/48 . . . . . . . . . . . . . . . . . . . . . . . . . . . . . 1,122,487 1,117,0043.500%, 09/20/48 . . . . . . . . . . . . . . . . . . . . . . . . . . . . . 475,000 472,6794.000%, 01/20/41 . . . . . . . . . . . . . . . . . . . . . . . . . . . . . 760,987 780,9204.000%, 02/20/41 . . . . . . . . . . . . . . . . . . . . . . . . . . . . . 190,594 195,5854.000%, 04/20/41 . . . . . . . . . . . . . . . . . . . . . . . . . . . . . 145,699 149,5194.000%, 02/20/42 . . . . . . . . . . . . . . . . . . . . . . . . . . . . . 195,266 200,3844.500%, 07/20/33 . . . . . . . . . . . . . . . . . . . . . . . . . . . . . 15,316 15,9744.500%, 09/20/33 . . . . . . . . . . . . . . . . . . . . . . . . . . . . . 8,687 9,0584.500%, 12/20/34 . . . . . . . . . . . . . . . . . . . . . . . . . . . . . 6,052 6,3104.500%, 03/20/35 . . . . . . . . . . . . . . . . . . . . . . . . . . . . . 36,726 38,2974.500%, 01/20/41 . . . . . . . . . . . . . . . . . . . . . . . . . . . . . 196,441 205,9505.000%, 07/20/33 . . . . . . . . . . . . . . . . . . . . . . . . . . . . . 28,172 30,0176.000%, 01/20/35 . . . . . . . . . . . . . . . . . . . . . . . . . . . . . 35,306 38,7926.000%, 02/20/35 . . . . . . . . . . . . . . . . . . . . . . . . . . . . . 17,595 19,6836.000%, 04/20/35 . . . . . . . . . . . . . . . . . . . . . . . . . . . . . 30,949 33,823
Government National Mortgage Association (CMO)0.659%, 02/16/59 (d) (e) . . . . . . . . . . . . . . . . . . . . . . . . 2,446,006 146,528
97,984,212
Federal Agencies—0.1%Financing Corp.
9.650%, 11/02/18 . . . . . . . . . . . . . . . . . . . . . . . . . . . . . 430,000 432,761
U.S. Treasury—12.7%U.S. Treasury Bonds
2.500%, 02/15/45 . . . . . . . . . . . . . . . . . . . . . . . . . . . . . 68,000 59,5352.875%, 05/15/43 (b) . . . . . . . . . . . . . . . . . . . . . . . . . . . 14,475,100 13,681,2312.875%, 11/15/46 . . . . . . . . . . . . . . . . . . . . . . . . . . . . . 5,439,000 5,113,0853.000%, 11/15/45 . . . . . . . . . . . . . . . . . . . . . . . . . . . . . 350,000 337,422
Security DescriptionPrincipalAmount* Value
U.S. Treasury—(Continued)U.S. Treasury Bonds
3.000%, 02/15/48 . . . . . . . . . . . . . . . . . . . . . . . . . . . . . 350,000 $ 336,6843.500%, 02/15/39 . . . . . . . . . . . . . . . . . . . . . . . . . . . . . 4,350,000 4,582,1134.500%, 02/15/36 (b) . . . . . . . . . . . . . . . . . . . . . . . . . . . 179,000 212,3954.500%, 08/15/39 . . . . . . . . . . . . . . . . . . . . . . . . . . . . . 743,000 894,9095.000%, 05/15/37 . . . . . . . . . . . . . . . . . . . . . . . . . . . . . 232,000 293,5895.250%, 02/15/29 . . . . . . . . . . . . . . . . . . . . . . . . . . . . . 16,000 19,1035.375%, 02/15/31 . . . . . . . . . . . . . . . . . . . . . . . . . . . . . 276,000 341,0866.250%, 08/15/23 . . . . . . . . . . . . . . . . . . . . . . . . . . . . . 80,000 91,978
U.S. Treasury Notes1.750%, 11/30/21 . . . . . . . . . . . . . . . . . . . . . . . . . . . . . 28,134,000 27,164,6962.000%, 11/15/26 . . . . . . . . . . . . . . . . . . . . . . . . . . . . . 1,875,000 1,735,1812.250%, 08/15/27 . . . . . . . . . . . . . . . . . . . . . . . . . . . . . 6,478,000 6,075,9082.500%, 08/15/23 . . . . . . . . . . . . . . . . . . . . . . . . . . . . . 5,404,000 5,294,6533.125%, 05/15/21 . . . . . . . . . . . . . . . . . . . . . . . . . . . . . 3,504,000 3,526,5843.500%, 05/15/20 . . . . . . . . . . . . . . . . . . . . . . . . . . . . . 33,621,000 33,993,983
103,754,135
Total U.S. Treasury & Government Agencies(Cost $209,161,537) . . . . . . . . . . . . . . . . . . . . . . . . . . . . 202,171,108
Corporate Bonds & Notes—11.2%
Aerospace/Defense—0.2%L3 Technologies, Inc.
3.850%, 06/15/23 . . . . . . . . . . . . . . . . . . . . . . . . . . . . . 862,000 863,940United Technologies Corp.
4.625%, 11/16/48 . . . . . . . . . . . . . . . . . . . . . . . . . . . . . 562,000 562,036
1,425,976
Agriculture—0.2%Imperial Brands Finance plc
2.950%, 07/21/20 (144A) . . . . . . . . . . . . . . . . . . . . . . . . 828,000 819,852Reynolds American, Inc.
5.850%, 08/15/45 . . . . . . . . . . . . . . . . . . . . . . . . . . . . . 504,000 547,364
1,367,216
Auto Manufacturers—0.2%General Motors Co.
5.150%, 04/01/38 . . . . . . . . . . . . . . . . . . . . . . . . . . . . . 235,000 218,3406.750%, 04/01/46 . . . . . . . . . . . . . . . . . . . . . . . . . . . . . 374,000 404,300
General Motors Financial Co., Inc.3.200%, 07/06/21 . . . . . . . . . . . . . . . . . . . . . . . . . . . . . 776,000 766,6514.350%, 04/09/25 . . . . . . . . . . . . . . . . . . . . . . . . . . . . . 360,000 353,511
1,742,802
Auto Parts & Equipment—0.1%Lear Corp.
3.800%, 09/15/27 (b) . . . . . . . . . . . . . . . . . . . . . . . . . . . 585,000 542,811
Banks—2.8%ABN AMRO Bank NV
4.800%, 04/18/26 (144A) . . . . . . . . . . . . . . . . . . . . . . . . 800,000 804,610
BHFTII-237
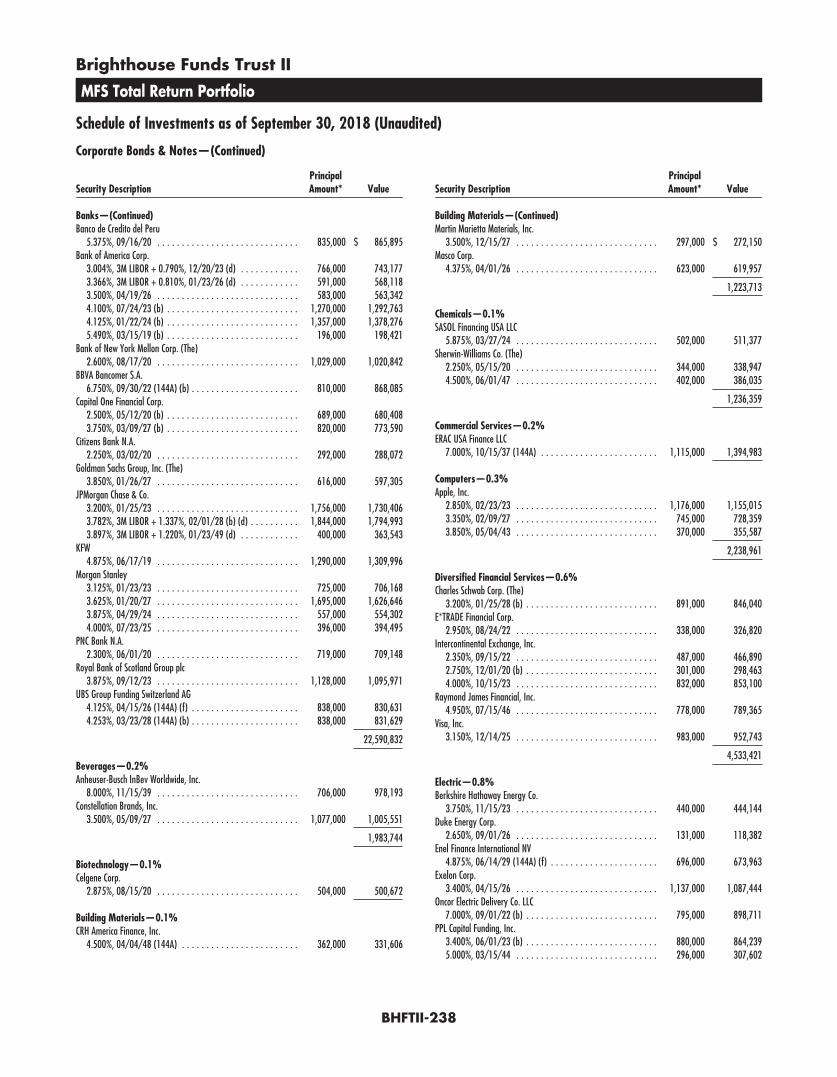
Brighthouse Funds Trust II
MFS Total Return Portfolio
Schedule of Investments as of September 30, 2018 (Unaudited)
Corporate Bonds & Notes—(Continued)
Security DescriptionPrincipalAmount* Value
Banks—(Continued)Banco de Credito del Peru
5.375%, 09/16/20 . . . . . . . . . . . . . . . . . . . . . . . . . . . . . 835,000 $ 865,895Bank of America Corp.
3.004%, 3M LIBOR + 0.790%, 12/20/23 (d) . . . . . . . . . . . . 766,000 743,1773.366%, 3M LIBOR + 0.810%, 01/23/26 (d) . . . . . . . . . . . . 591,000 568,1183.500%, 04/19/26 . . . . . . . . . . . . . . . . . . . . . . . . . . . . . 583,000 563,3424.100%, 07/24/23 (b) . . . . . . . . . . . . . . . . . . . . . . . . . . . 1,270,000 1,292,7634.125%, 01/22/24 (b) . . . . . . . . . . . . . . . . . . . . . . . . . . . 1,357,000 1,378,2765.490%, 03/15/19 (b) . . . . . . . . . . . . . . . . . . . . . . . . . . . 196,000 198,421
Bank of New York Mellon Corp. (The)2.600%, 08/17/20 . . . . . . . . . . . . . . . . . . . . . . . . . . . . . 1,029,000 1,020,842
BBVA Bancomer S.A.6.750%, 09/30/22 (144A) (b) . . . . . . . . . . . . . . . . . . . . . . 810,000 868,085
Capital One Financial Corp.2.500%, 05/12/20 (b) . . . . . . . . . . . . . . . . . . . . . . . . . . . 689,000 680,4083.750%, 03/09/27 (b) . . . . . . . . . . . . . . . . . . . . . . . . . . . 820,000 773,590
Citizens Bank N.A.2.250%, 03/02/20 . . . . . . . . . . . . . . . . . . . . . . . . . . . . . 292,000 288,072
Goldman Sachs Group, Inc. (The)3.850%, 01/26/27 . . . . . . . . . . . . . . . . . . . . . . . . . . . . . 616,000 597,305
JPMorgan Chase & Co.3.200%, 01/25/23 . . . . . . . . . . . . . . . . . . . . . . . . . . . . . 1,756,000 1,730,4063.782%, 3M LIBOR + 1.337%, 02/01/28 (b) (d) . . . . . . . . . . 1,844,000 1,794,9933.897%, 3M LIBOR + 1.220%, 01/23/49 (d) . . . . . . . . . . . . 400,000 363,543
KFW4.875%, 06/17/19 . . . . . . . . . . . . . . . . . . . . . . . . . . . . . 1,290,000 1,309,996
Morgan Stanley3.125%, 01/23/23 . . . . . . . . . . . . . . . . . . . . . . . . . . . . . 725,000 706,1683.625%, 01/20/27 . . . . . . . . . . . . . . . . . . . . . . . . . . . . . 1,695,000 1,626,6463.875%, 04/29/24 . . . . . . . . . . . . . . . . . . . . . . . . . . . . . 557,000 554,3024.000%, 07/23/25 . . . . . . . . . . . . . . . . . . . . . . . . . . . . . 396,000 394,495
PNC Bank N.A.2.300%, 06/01/20 . . . . . . . . . . . . . . . . . . . . . . . . . . . . . 719,000 709,148
Royal Bank of Scotland Group plc3.875%, 09/12/23 . . . . . . . . . . . . . . . . . . . . . . . . . . . . . 1,128,000 1,095,971
UBS Group Funding Switzerland AG4.125%, 04/15/26 (144A) (f) . . . . . . . . . . . . . . . . . . . . . . 838,000 830,6314.253%, 03/23/28 (144A) (b) . . . . . . . . . . . . . . . . . . . . . . 838,000 831,629
22,590,832
Beverages—0.2%Anheuser-Busch InBev Worldwide, Inc.
8.000%, 11/15/39 . . . . . . . . . . . . . . . . . . . . . . . . . . . . . 706,000 978,193Constellation Brands, Inc.
3.500%, 05/09/27 . . . . . . . . . . . . . . . . . . . . . . . . . . . . . 1,077,000 1,005,551
1,983,744
Biotechnology—0.1%Celgene Corp.
2.875%, 08/15/20 . . . . . . . . . . . . . . . . . . . . . . . . . . . . . 504,000 500,672
Building Materials—0.1%CRH America Finance, Inc.
4.500%, 04/04/48 (144A) . . . . . . . . . . . . . . . . . . . . . . . . 362,000 331,606
Security DescriptionPrincipalAmount* Value
Building Materials—(Continued)Martin Marietta Materials, Inc.
3.500%, 12/15/27 . . . . . . . . . . . . . . . . . . . . . . . . . . . . . 297,000 $ 272,150Masco Corp.
4.375%, 04/01/26 . . . . . . . . . . . . . . . . . . . . . . . . . . . . . 623,000 619,957
1,223,713
Chemicals—0.1%SASOL Financing USA LLC
5.875%, 03/27/24 . . . . . . . . . . . . . . . . . . . . . . . . . . . . . 502,000 511,377Sherwin-Williams Co. (The)
2.250%, 05/15/20 . . . . . . . . . . . . . . . . . . . . . . . . . . . . . 344,000 338,9474.500%, 06/01/47 . . . . . . . . . . . . . . . . . . . . . . . . . . . . . 402,000 386,035
1,236,359
Commercial Services—0.2%ERAC USA Finance LLC
7.000%, 10/15/37 (144A) . . . . . . . . . . . . . . . . . . . . . . . . 1,115,000 1,394,983
Computers—0.3%Apple, Inc.
2.850%, 02/23/23 . . . . . . . . . . . . . . . . . . . . . . . . . . . . . 1,176,000 1,155,0153.350%, 02/09/27 . . . . . . . . . . . . . . . . . . . . . . . . . . . . . 745,000 728,3593.850%, 05/04/43 . . . . . . . . . . . . . . . . . . . . . . . . . . . . . 370,000 355,587
2,238,961
Diversified Financial Services—0.6%Charles Schwab Corp. (The)
3.200%, 01/25/28 (b) . . . . . . . . . . . . . . . . . . . . . . . . . . . 891,000 846,040E*TRADE Financial Corp.
2.950%, 08/24/22 . . . . . . . . . . . . . . . . . . . . . . . . . . . . . 338,000 326,820Intercontinental Exchange, Inc.
2.350%, 09/15/22 . . . . . . . . . . . . . . . . . . . . . . . . . . . . . 487,000 466,8902.750%, 12/01/20 (b) . . . . . . . . . . . . . . . . . . . . . . . . . . . 301,000 298,4634.000%, 10/15/23 . . . . . . . . . . . . . . . . . . . . . . . . . . . . . 832,000 853,100
Raymond James Financial, Inc.4.950%, 07/15/46 . . . . . . . . . . . . . . . . . . . . . . . . . . . . . 778,000 789,365
Visa, Inc.3.150%, 12/14/25 . . . . . . . . . . . . . . . . . . . . . . . . . . . . . 983,000 952,743
4,533,421
Electric—0.8%Berkshire Hathaway Energy Co.
3.750%, 11/15/23 . . . . . . . . . . . . . . . . . . . . . . . . . . . . . 440,000 444,144Duke Energy Corp.
2.650%, 09/01/26 . . . . . . . . . . . . . . . . . . . . . . . . . . . . . 131,000 118,382Enel Finance International NV
4.875%, 06/14/29 (144A) (f) . . . . . . . . . . . . . . . . . . . . . . 696,000 673,963Exelon Corp.
3.400%, 04/15/26 . . . . . . . . . . . . . . . . . . . . . . . . . . . . . 1,137,000 1,087,444Oncor Electric Delivery Co. LLC
7.000%, 09/01/22 (b) . . . . . . . . . . . . . . . . . . . . . . . . . . . 795,000 898,711PPL Capital Funding, Inc.
3.400%, 06/01/23 (b) . . . . . . . . . . . . . . . . . . . . . . . . . . . 880,000 864,2395.000%, 03/15/44 . . . . . . . . . . . . . . . . . . . . . . . . . . . . . 296,000 307,602
BHFTII-238
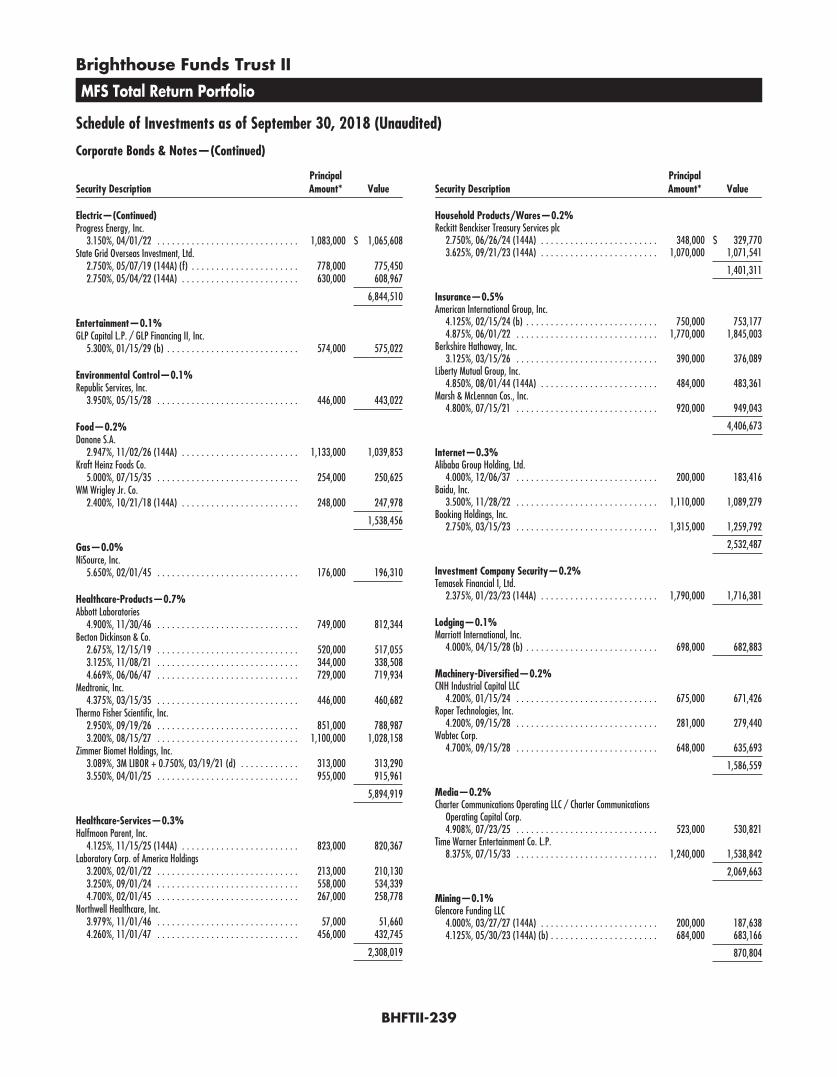
Brighthouse Funds Trust II
MFS Total Return Portfolio
Schedule of Investments as of September 30, 2018 (Unaudited)
Corporate Bonds & Notes—(Continued)
Security DescriptionPrincipalAmount* Value
Electric—(Continued)Progress Energy, Inc.
3.150%, 04/01/22 . . . . . . . . . . . . . . . . . . . . . . . . . . . . . 1,083,000 $ 1,065,608State Grid Overseas Investment, Ltd.
2.750%, 05/07/19 (144A) (f) . . . . . . . . . . . . . . . . . . . . . . 778,000 775,4502.750%, 05/04/22 (144A) . . . . . . . . . . . . . . . . . . . . . . . . 630,000 608,967
6,844,510
Entertainment—0.1%GLP Capital L.P. / GLP Financing II, Inc.
5.300%, 01/15/29 (b) . . . . . . . . . . . . . . . . . . . . . . . . . . . 574,000 575,022
Environmental Control—0.1%Republic Services, Inc.
3.950%, 05/15/28 . . . . . . . . . . . . . . . . . . . . . . . . . . . . . 446,000 443,022
Food—0.2%Danone S.A.
2.947%, 11/02/26 (144A) . . . . . . . . . . . . . . . . . . . . . . . . 1,133,000 1,039,853Kraft Heinz Foods Co.
5.000%, 07/15/35 . . . . . . . . . . . . . . . . . . . . . . . . . . . . . 254,000 250,625WM Wrigley Jr. Co.
2.400%, 10/21/18 (144A) . . . . . . . . . . . . . . . . . . . . . . . . 248,000 247,978
1,538,456
Gas—0.0%NiSource, Inc.
5.650%, 02/01/45 . . . . . . . . . . . . . . . . . . . . . . . . . . . . . 176,000 196,310
Healthcare-Products—0.7%Abbott Laboratories
4.900%, 11/30/46 . . . . . . . . . . . . . . . . . . . . . . . . . . . . . 749,000 812,344Becton Dickinson & Co.
2.675%, 12/15/19 . . . . . . . . . . . . . . . . . . . . . . . . . . . . . 520,000 517,0553.125%, 11/08/21 . . . . . . . . . . . . . . . . . . . . . . . . . . . . . 344,000 338,5084.669%, 06/06/47 . . . . . . . . . . . . . . . . . . . . . . . . . . . . . 729,000 719,934
Medtronic, Inc.4.375%, 03/15/35 . . . . . . . . . . . . . . . . . . . . . . . . . . . . . 446,000 460,682
Thermo Fisher Scientific, Inc.2.950%, 09/19/26 . . . . . . . . . . . . . . . . . . . . . . . . . . . . . 851,000 788,9873.200%, 08/15/27 . . . . . . . . . . . . . . . . . . . . . . . . . . . . . 1,100,000 1,028,158
Zimmer Biomet Holdings, Inc.3.089%, 3M LIBOR + 0.750%, 03/19/21 (d) . . . . . . . . . . . . 313,000 313,2903.550%, 04/01/25 . . . . . . . . . . . . . . . . . . . . . . . . . . . . . 955,000 915,961
5,894,919
Healthcare-Services—0.3%Halfmoon Parent, Inc.
4.125%, 11/15/25 (144A) . . . . . . . . . . . . . . . . . . . . . . . . 823,000 820,367Laboratory Corp. of America Holdings
3.200%, 02/01/22 . . . . . . . . . . . . . . . . . . . . . . . . . . . . . 213,000 210,1303.250%, 09/01/24 . . . . . . . . . . . . . . . . . . . . . . . . . . . . . 558,000 534,3394.700%, 02/01/45 . . . . . . . . . . . . . . . . . . . . . . . . . . . . . 267,000 258,778
Northwell Healthcare, Inc.3.979%, 11/01/46 . . . . . . . . . . . . . . . . . . . . . . . . . . . . . 57,000 51,6604.260%, 11/01/47 . . . . . . . . . . . . . . . . . . . . . . . . . . . . . 456,000 432,745
2,308,019
Security DescriptionPrincipalAmount* Value
Household Products/Wares—0.2%Reckitt Benckiser Treasury Services plc
2.750%, 06/26/24 (144A) . . . . . . . . . . . . . . . . . . . . . . . . 348,000 $ 329,7703.625%, 09/21/23 (144A) . . . . . . . . . . . . . . . . . . . . . . . . 1,070,000 1,071,541
1,401,311
Insurance—0.5%American International Group, Inc.
4.125%, 02/15/24 (b) . . . . . . . . . . . . . . . . . . . . . . . . . . . 750,000 753,1774.875%, 06/01/22 . . . . . . . . . . . . . . . . . . . . . . . . . . . . . 1,770,000 1,845,003
Berkshire Hathaway, Inc.3.125%, 03/15/26 . . . . . . . . . . . . . . . . . . . . . . . . . . . . . 390,000 376,089
Liberty Mutual Group, Inc.4.850%, 08/01/44 (144A) . . . . . . . . . . . . . . . . . . . . . . . . 484,000 483,361
Marsh & McLennan Cos., Inc.4.800%, 07/15/21 . . . . . . . . . . . . . . . . . . . . . . . . . . . . . 920,000 949,043
4,406,673
Internet—0.3%Alibaba Group Holding, Ltd.
4.000%, 12/06/37 . . . . . . . . . . . . . . . . . . . . . . . . . . . . . 200,000 183,416Baidu, Inc.
3.500%, 11/28/22 . . . . . . . . . . . . . . . . . . . . . . . . . . . . . 1,110,000 1,089,279Booking Holdings, Inc.
2.750%, 03/15/23 . . . . . . . . . . . . . . . . . . . . . . . . . . . . . 1,315,000 1,259,792
2,532,487
Investment Company Security—0.2%Temasek Financial I, Ltd.
2.375%, 01/23/23 (144A) . . . . . . . . . . . . . . . . . . . . . . . . 1,790,000 1,716,381
Lodging—0.1%Marriott International, Inc.
4.000%, 04/15/28 (b) . . . . . . . . . . . . . . . . . . . . . . . . . . . 698,000 682,883
Machinery-Diversified—0.2%CNH Industrial Capital LLC
4.200%, 01/15/24 . . . . . . . . . . . . . . . . . . . . . . . . . . . . . 675,000 671,426Roper Technologies, Inc.
4.200%, 09/15/28 . . . . . . . . . . . . . . . . . . . . . . . . . . . . . 281,000 279,440Wabtec Corp.
4.700%, 09/15/28 . . . . . . . . . . . . . . . . . . . . . . . . . . . . . 648,000 635,693
1,586,559
Media—0.2%Charter Communications Operating LLC / Charter Communications
Operating Capital Corp.4.908%, 07/23/25 . . . . . . . . . . . . . . . . . . . . . . . . . . . . . 523,000 530,821
Time Warner Entertainment Co. L.P.8.375%, 07/15/33 . . . . . . . . . . . . . . . . . . . . . . . . . . . . . 1,240,000 1,538,842
2,069,663
Mining—0.1%Glencore Funding LLC
4.000%, 03/27/27 (144A) . . . . . . . . . . . . . . . . . . . . . . . . 200,000 187,6384.125%, 05/30/23 (144A) (b) . . . . . . . . . . . . . . . . . . . . . . 684,000 683,166
870,804
BHFTII-239
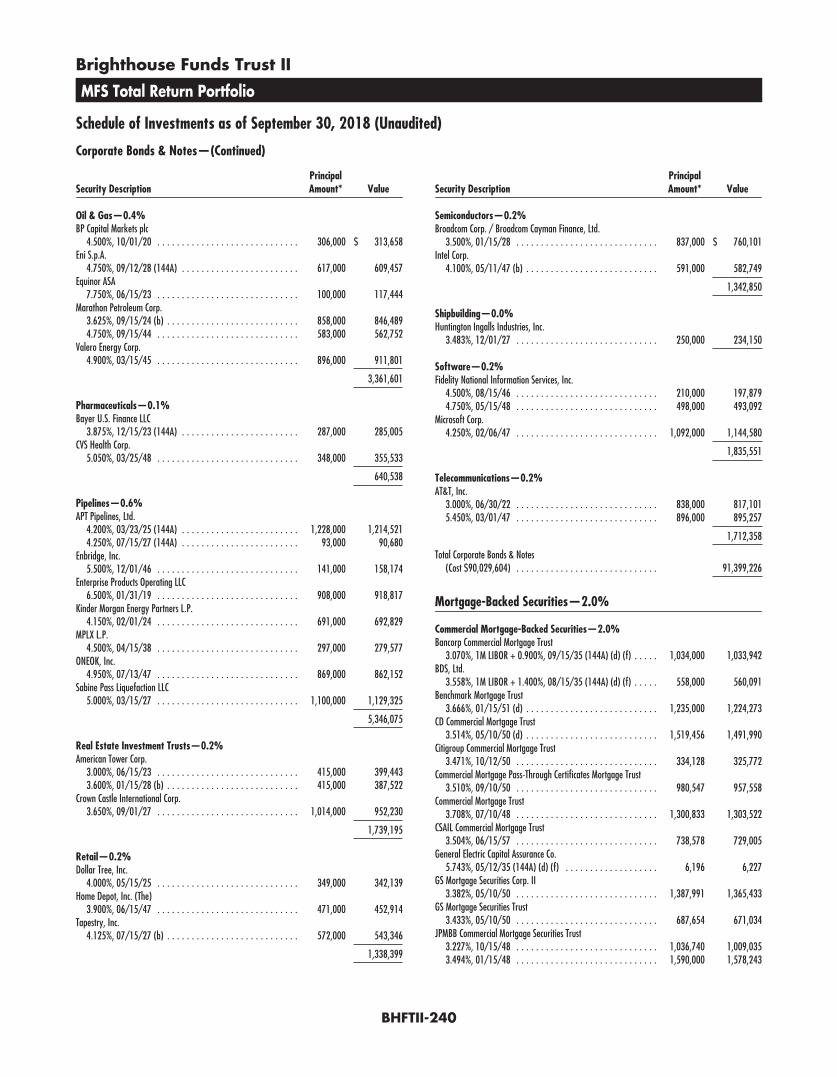
Brighthouse Funds Trust II
MFS Total Return Portfolio
Schedule of Investments as of September 30, 2018 (Unaudited)
Corporate Bonds & Notes—(Continued)
Security DescriptionPrincipalAmount* Value
Oil & Gas—0.4%BP Capital Markets plc
4.500%, 10/01/20 . . . . . . . . . . . . . . . . . . . . . . . . . . . . . 306,000 $ 313,658Eni S.p.A.
4.750%, 09/12/28 (144A) . . . . . . . . . . . . . . . . . . . . . . . . 617,000 609,457Equinor ASA
7.750%, 06/15/23 . . . . . . . . . . . . . . . . . . . . . . . . . . . . . 100,000 117,444Marathon Petroleum Corp.
3.625%, 09/15/24 (b) . . . . . . . . . . . . . . . . . . . . . . . . . . . 858,000 846,4894.750%, 09/15/44 . . . . . . . . . . . . . . . . . . . . . . . . . . . . . 583,000 562,752
Valero Energy Corp.4.900%, 03/15/45 . . . . . . . . . . . . . . . . . . . . . . . . . . . . . 896,000 911,801
3,361,601
Pharmaceuticals—0.1%Bayer U.S. Finance LLC
3.875%, 12/15/23 (144A) . . . . . . . . . . . . . . . . . . . . . . . . 287,000 285,005CVS Health Corp.
5.050%, 03/25/48 . . . . . . . . . . . . . . . . . . . . . . . . . . . . . 348,000 355,533
640,538
Pipelines—0.6%APT Pipelines, Ltd.
4.200%, 03/23/25 (144A) . . . . . . . . . . . . . . . . . . . . . . . . 1,228,000 1,214,5214.250%, 07/15/27 (144A) . . . . . . . . . . . . . . . . . . . . . . . . 93,000 90,680
Enbridge, Inc.5.500%, 12/01/46 . . . . . . . . . . . . . . . . . . . . . . . . . . . . . 141,000 158,174
Enterprise Products Operating LLC6.500%, 01/31/19 . . . . . . . . . . . . . . . . . . . . . . . . . . . . . 908,000 918,817
Kinder Morgan Energy Partners L.P.4.150%, 02/01/24 . . . . . . . . . . . . . . . . . . . . . . . . . . . . . 691,000 692,829
MPLX L.P.4.500%, 04/15/38 . . . . . . . . . . . . . . . . . . . . . . . . . . . . . 297,000 279,577
ONEOK, Inc.4.950%, 07/13/47 . . . . . . . . . . . . . . . . . . . . . . . . . . . . . 869,000 862,152
Sabine Pass Liquefaction LLC5.000%, 03/15/27 . . . . . . . . . . . . . . . . . . . . . . . . . . . . . 1,100,000 1,129,325
5,346,075
Real Estate Investment Trusts—0.2%American Tower Corp.
3.000%, 06/15/23 . . . . . . . . . . . . . . . . . . . . . . . . . . . . . 415,000 399,4433.600%, 01/15/28 (b) . . . . . . . . . . . . . . . . . . . . . . . . . . . 415,000 387,522
Crown Castle International Corp.3.650%, 09/01/27 . . . . . . . . . . . . . . . . . . . . . . . . . . . . . 1,014,000 952,230
1,739,195
Retail—0.2%Dollar Tree, Inc.
4.000%, 05/15/25 . . . . . . . . . . . . . . . . . . . . . . . . . . . . . 349,000 342,139Home Depot, Inc. (The)
3.900%, 06/15/47 . . . . . . . . . . . . . . . . . . . . . . . . . . . . . 471,000 452,914Tapestry, Inc.
4.125%, 07/15/27 (b) . . . . . . . . . . . . . . . . . . . . . . . . . . . 572,000 543,346
1,338,399
Security DescriptionPrincipalAmount* Value
Semiconductors—0.2%Broadcom Corp. / Broadcom Cayman Finance, Ltd.
3.500%, 01/15/28 . . . . . . . . . . . . . . . . . . . . . . . . . . . . . 837,000 $ 760,101Intel Corp.
4.100%, 05/11/47 (b) . . . . . . . . . . . . . . . . . . . . . . . . . . . 591,000 582,749
1,342,850
Shipbuilding—0.0%Huntington Ingalls Industries, Inc.
3.483%, 12/01/27 . . . . . . . . . . . . . . . . . . . . . . . . . . . . . 250,000 234,150
Software—0.2%Fidelity National Information Services, Inc.
4.500%, 08/15/46 . . . . . . . . . . . . . . . . . . . . . . . . . . . . . 210,000 197,8794.750%, 05/15/48 . . . . . . . . . . . . . . . . . . . . . . . . . . . . . 498,000 493,092
Microsoft Corp.4.250%, 02/06/47 . . . . . . . . . . . . . . . . . . . . . . . . . . . . . 1,092,000 1,144,580
1,835,551
Telecommunications—0.2%AT&T, Inc.
3.000%, 06/30/22 . . . . . . . . . . . . . . . . . . . . . . . . . . . . . 838,000 817,1015.450%, 03/01/47 . . . . . . . . . . . . . . . . . . . . . . . . . . . . . 896,000 895,257
1,712,358
Total Corporate Bonds & Notes(Cost $90,029,604) . . . . . . . . . . . . . . . . . . . . . . . . . . . . . 91,399,226
Mortgage-Backed Securities—2.0%
Commercial Mortgage-Backed Securities—2.0%Bancorp Commercial Mortgage Trust
3.070%, 1M LIBOR + 0.900%, 09/15/35 (144A) (d) (f) . . . . . 1,034,000 1,033,942BDS, Ltd.
3.558%, 1M LIBOR + 1.400%, 08/15/35 (144A) (d) (f) . . . . . 558,000 560,091Benchmark Mortgage Trust
3.666%, 01/15/51 (d) . . . . . . . . . . . . . . . . . . . . . . . . . . . 1,235,000 1,224,273CD Commercial Mortgage Trust
3.514%, 05/10/50 (d) . . . . . . . . . . . . . . . . . . . . . . . . . . . 1,519,456 1,491,990Citigroup Commercial Mortgage Trust
3.471%, 10/12/50 . . . . . . . . . . . . . . . . . . . . . . . . . . . . . 334,128 325,772Commercial Mortgage Pass-Through Certificates Mortgage Trust
3.510%, 09/10/50 . . . . . . . . . . . . . . . . . . . . . . . . . . . . . 980,547 957,558Commercial Mortgage Trust
3.708%, 07/10/48 . . . . . . . . . . . . . . . . . . . . . . . . . . . . . 1,300,833 1,303,522CSAIL Commercial Mortgage Trust
3.504%, 06/15/57 . . . . . . . . . . . . . . . . . . . . . . . . . . . . . 738,578 729,005General Electric Capital Assurance Co.
5.743%, 05/12/35 (144A) (d) (f) . . . . . . . . . . . . . . . . . . . 6,196 6,227GS Mortgage Securities Corp. II
3.382%, 05/10/50 . . . . . . . . . . . . . . . . . . . . . . . . . . . . . 1,387,991 1,365,433GS Mortgage Securities Trust
3.433%, 05/10/50 . . . . . . . . . . . . . . . . . . . . . . . . . . . . . 687,654 671,034JPMBB Commercial Mortgage Securities Trust
3.227%, 10/15/48 . . . . . . . . . . . . . . . . . . . . . . . . . . . . . 1,036,740 1,009,0353.494%, 01/15/48 . . . . . . . . . . . . . . . . . . . . . . . . . . . . . 1,590,000 1,578,243
BHFTII-240

Brighthouse Funds Trust II
MFS Total Return Portfolio
Schedule of Investments as of September 30, 2018 (Unaudited)
Mortgage-Backed Securities—(Continued)
Security DescriptionPrincipalAmount* Value
Commercial Mortgage-Backed Securities—(Continued)JPMCC Commercial Mortgage Securities Trust
3.454%, 09/15/50 . . . . . . . . . . . . . . . . . . . . . . . . . . . . . 266,697 $ 259,382Morgan Stanley Bank of America Merrill Lynch Trust
3.536%, 11/15/52 . . . . . . . . . . . . . . . . . . . . . . . . . . . . . 519,442 506,539Morgan Stanley Capital I, Inc.
3.530%, 06/15/50 . . . . . . . . . . . . . . . . . . . . . . . . . . . . . 470,148 458,765UBS Commercial Mortgage Trust
3.679%, 12/15/50 . . . . . . . . . . . . . . . . . . . . . . . . . . . . . 1,210,000 1,191,445Wells Fargo Commercial Mortgage Trust
3.540%, 05/15/48 . . . . . . . . . . . . . . . . . . . . . . . . . . . . . 1,410,327 1,403,675
Total Mortgage-Backed Securities(Cost $16,722,796) . . . . . . . . . . . . . . . . . . . . . . . . . . . . . 16,075,931
Asset-Backed Securities—1.4%
Asset-Backed - Automobile—0.2%Chesapeake Funding II LLC
3.040%, 04/15/30 (144A) (f) . . . . . . . . . . . . . . . . . . . . . . 534,000 532,6553.158%, 1M LIBOR + 1.000%, 06/15/28 (144A) (d) (f) . . . . . 530,004 532,044
Ford Credit Auto Owner Trust2.260%, 11/15/25 (144A) . . . . . . . . . . . . . . . . . . . . . . . . 550,000 548,2082.310%, 04/15/26 (144A) . . . . . . . . . . . . . . . . . . . . . . . . 425,000 422,272
2,035,179
Asset-Backed - Home Equity—0.1%Bayview Financial Revolving Asset Trust
3.842%, 1M LIBOR + 1.600%, 12/28/40 (144A) (d) (f) . . . . . 493,422 459,704GMAC Home Equity Loan Trust
5.805%, 10/25/36 (d) . . . . . . . . . . . . . . . . . . . . . . . . . . . 133,821 135,403Home Equity Loan Trust
5.320%, 12/25/35 (d) . . . . . . . . . . . . . . . . . . . . . . . . . . . 261,110 252,706
847,813
Asset-Backed - Other—1.1%ALM, Ltd.
Zero Coupon, -1 x 3M LIBOR + 1.400%, 10/15/27(144A) (d) (f) . . . . . . . . . . . . . . . . . . . . . . . . . . . . . . . . . 1,395,000 1,395,0002.604%, 3M LIBOR + 1.250%, 10/18/27 (144A) (d) (f) . . . . . 849,000 841,861
American Tower Trust I3.070%, 03/15/48 (144A) . . . . . . . . . . . . . . . . . . . . . . . . 1,000,000 976,446
Dryden 55 CLO, Ltd.3.061%, 3M LIBOR + 1.020%, 04/15/31 (144A) (d) . . . . . . . 1,430,000 1,422,654
Dryden Senior Loan Fund3.248%, 3M LIBOR + 0.900%, 04/15/29 (144A) (d) (f) . . . . . 663,000 658,123
Figueroa CLO, Ltd.3.839%, 3M LIBOR + 1.500%, 01/15/27 (144A) (d) . . . . . . . 420,000 419,575
Mountain Hawk CLO, Ltd.4.133%, 3M LIBOR + 1.800%, 04/18/25 (144A) (d) . . . . . . . 1,463,576 1,463,728
Navistar Financial Dealer Note Master Trust2.798%, 1M LIBOR + 0.630%, 09/25/23 (144A) (d) (f) . . . . . 808,000 807,999
Neuberger Berman CLO, Ltd.3.139%, 3M LIBOR + 0.800%, 01/15/28 (144A) (d) (f) . . . . . 600,000 598,685
Security Description
Shares/PrincipalAmount* Value
Asset-Backed - Other—(Continued)Small Business Administration Participation Certificates
4.350%, 07/01/23 . . . . . . . . . . . . . . . . . . . . . . . . . . . . . 99,556 $ 101,2904.770%, 04/01/24 . . . . . . . . . . . . . . . . . . . . . . . . . . . . . 7,881 8,0334.950%, 03/01/25 . . . . . . . . . . . . . . . . . . . . . . . . . . . . . 40,462 41,3614.990%, 09/01/24 . . . . . . . . . . . . . . . . . . . . . . . . . . . . . 22,850 23,4355.110%, 08/01/25 . . . . . . . . . . . . . . . . . . . . . . . . . . . . . 57,852 59,1555.180%, 05/01/24 . . . . . . . . . . . . . . . . . . . . . . . . . . . . . 11,148 11,3675.520%, 06/01/24 . . . . . . . . . . . . . . . . . . . . . . . . . . . . . 27,379 28,187
8,856,899
Total Asset-Backed Securities(Cost $11,816,297) . . . . . . . . . . . . . . . . . . . . . . . . . . . . . 11,739,891
Municipals—0.2%New Jersey State Turnpike Authority, Build America Bond
7.414%, 01/01/40(Cost $1,092,733) . . . . . . . . . . . . . . . . . . . . . . . . . . . . . . 1,050,000 1,502,329
Convertible Preferred Stocks—0.1%
Electric—0.1%CenterPoint Energy, Inc.
7.000%, 09/01/21 (a) . . . . . . . . . . . . . . . . . . . . . . . . . . . 10,262 518,129
Electric Utilities—0.0%NextEra Energy, Inc.
6.123%, 09/01/19 . . . . . . . . . . . . . . . . . . . . . . . . . . . . . 6,834 389,196
Total Convertible Preferred Stocks(Cost $892,157) . . . . . . . . . . . . . . . . . . . . . . . . . . . . . . . 907,325
Short-Term Investment—1.4%
Discount Note—1.4%Federal Home Loan Bank
Zero Coupon, 10/01/18 (g) . . . . . . . . . . . . . . . . . . . . . . . . 11,246,000 11,246,000
Total Short-Term Investments(Cost $11,246,000) . . . . . . . . . . . . . . . . . . . . . . . . . . . . . 11,246,000
Securities Lending Reinvestments (h)—8.4%
Certificates of Deposit—3.7%Banco Del Estado De Chile New York
2.419%, 3M LIBOR + 0.100%, 11/14/18 (d) . . . . . . . . . . . . 2,000,000 1,999,966Banco Santander S.A.
2.340%, 11/07/18 . . . . . . . . . . . . . . . . . . . . . . . . . . . . . 1,499,962 1,500,123Bank of Montreal (Chicago)
2.371%, 3M LIBOR + 0.030%, 11/06/18 (d) . . . . . . . . . . . . 1,000,000 999,998Bank of Nova Scotia
2.618%, 3M LIBOR + 0.280%, 03/20/19 (d) . . . . . . . . . . . . 2,000,000 2,001,908Barclays Bank plc
2.304%, 1M LIBOR + 0.200%, 02/04/19 (d) . . . . . . . . . . . . 1,000,000 999,797Cooperative Rabobank UA
2.479%, 3M LIBOR + 0.140%, 10/16/18 (d) . . . . . . . . . . . . 1,000,000 1,000,075
BHFTII-241
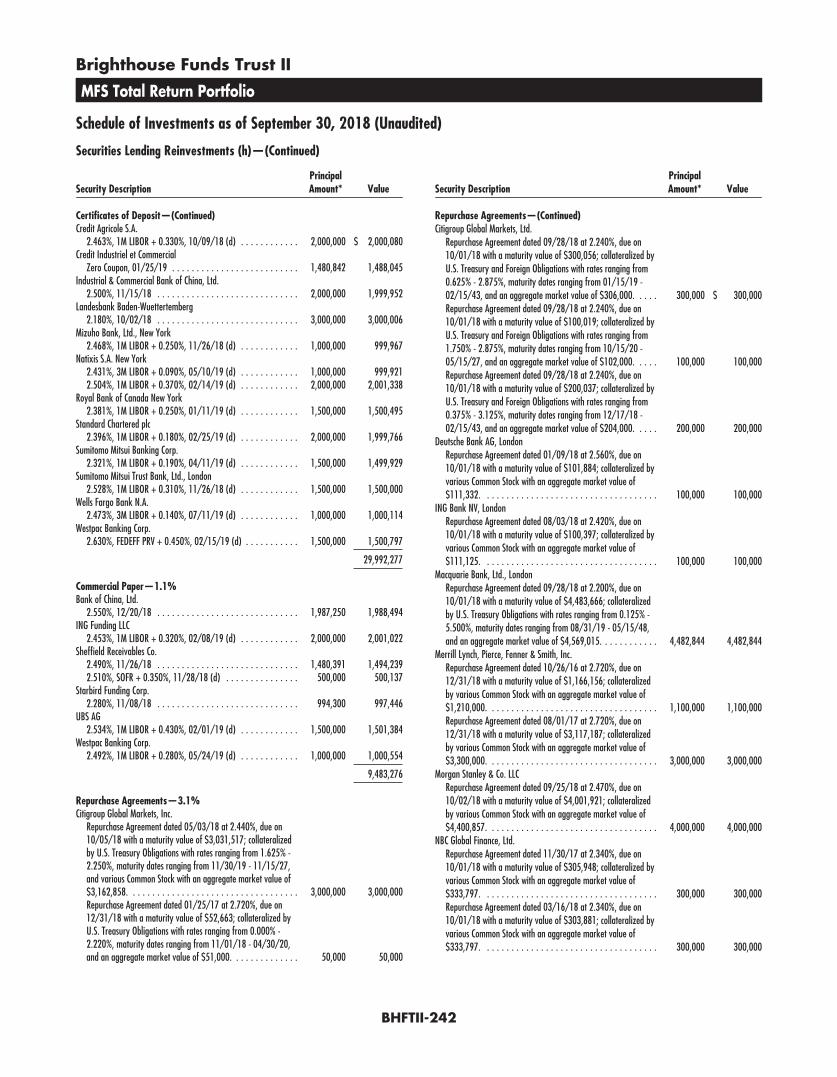
Brighthouse Funds Trust II
MFS Total Return Portfolio
Schedule of Investments as of September 30, 2018 (Unaudited)
Securities Lending Reinvestments (h)—(Continued)
Security DescriptionPrincipalAmount* Value
Certificates of Deposit—(Continued)Credit Agricole S.A.
2.463%, 1M LIBOR + 0.330%, 10/09/18 (d) . . . . . . . . . . . . 2,000,000 $ 2,000,080Credit Industriel et Commercial
Zero Coupon, 01/25/19 . . . . . . . . . . . . . . . . . . . . . . . . . . 1,480,842 1,488,045Industrial & Commercial Bank of China, Ltd.
2.500%, 11/15/18 . . . . . . . . . . . . . . . . . . . . . . . . . . . . . 2,000,000 1,999,952Landesbank Baden-Wuettertemberg
2.180%, 10/02/18 . . . . . . . . . . . . . . . . . . . . . . . . . . . . . 3,000,000 3,000,006Mizuho Bank, Ltd., New York
2.468%, 1M LIBOR + 0.250%, 11/26/18 (d) . . . . . . . . . . . . 1,000,000 999,967Natixis S.A. New York
2.431%, 3M LIBOR + 0.090%, 05/10/19 (d) . . . . . . . . . . . . 1,000,000 999,9212.504%, 1M LIBOR + 0.370%, 02/14/19 (d) . . . . . . . . . . . . 2,000,000 2,001,338
Royal Bank of Canada New York2.381%, 1M LIBOR + 0.250%, 01/11/19 (d) . . . . . . . . . . . . 1,500,000 1,500,495
Standard Chartered plc2.396%, 1M LIBOR + 0.180%, 02/25/19 (d) . . . . . . . . . . . . 2,000,000 1,999,766
Sumitomo Mitsui Banking Corp.2.321%, 1M LIBOR + 0.190%, 04/11/19 (d) . . . . . . . . . . . . 1,500,000 1,499,929
Sumitomo Mitsui Trust Bank, Ltd., London2.528%, 1M LIBOR + 0.310%, 11/26/18 (d) . . . . . . . . . . . . 1,500,000 1,500,000
Wells Fargo Bank N.A.2.473%, 3M LIBOR + 0.140%, 07/11/19 (d) . . . . . . . . . . . . 1,000,000 1,000,114
Westpac Banking Corp.2.630%, FEDEFF PRV + 0.450%, 02/15/19 (d) . . . . . . . . . . . 1,500,000 1,500,797
29,992,277
Commercial Paper—1.1%Bank of China, Ltd.
2.550%, 12/20/18 . . . . . . . . . . . . . . . . . . . . . . . . . . . . . 1,987,250 1,988,494ING Funding LLC
2.453%, 1M LIBOR + 0.320%, 02/08/19 (d) . . . . . . . . . . . . 2,000,000 2,001,022Sheffield Receivables Co.
2.490%, 11/26/18 . . . . . . . . . . . . . . . . . . . . . . . . . . . . . 1,480,391 1,494,2392.510%, SOFR + 0.350%, 11/28/18 (d) . . . . . . . . . . . . . . . 500,000 500,137
Starbird Funding Corp.2.280%, 11/08/18 . . . . . . . . . . . . . . . . . . . . . . . . . . . . . 994,300 997,446
UBS AG2.534%, 1M LIBOR + 0.430%, 02/01/19 (d) . . . . . . . . . . . . 1,500,000 1,501,384
Westpac Banking Corp.2.492%, 1M LIBOR + 0.280%, 05/24/19 (d) . . . . . . . . . . . . 1,000,000 1,000,554
9,483,276
Repurchase Agreements—3.1%Citigroup Global Markets, Inc.
Repurchase Agreement dated 05/03/18 at 2.440%, due on10/05/18 with a maturity value of $3,031,517; collateralizedby U.S. Treasury Obligations with rates ranging from 1.625% -2.250%, maturity dates ranging from 11/30/19 - 11/15/27,and various Common Stock with an aggregate market value of$3,162,858. . . . . . . . . . . . . . . . . . . . . . . . . . . . . . . . . . . 3,000,000 3,000,000Repurchase Agreement dated 01/25/17 at 2.720%, due on12/31/18 with a maturity value of $52,663; collateralized byU.S. Treasury Obligations with rates ranging from 0.000% -2.220%, maturity dates ranging from 11/01/18 - 04/30/20,and an aggregate market value of $51,000. . . . . . . . . . . . . . 50,000 50,000
Security DescriptionPrincipalAmount* Value
Repurchase Agreements—(Continued)Citigroup Global Markets, Ltd.
Repurchase Agreement dated 09/28/18 at 2.240%, due on10/01/18 with a maturity value of $300,056; collateralized byU.S. Treasury and Foreign Obligations with rates ranging from0.625% - 2.875%, maturity dates ranging from 01/15/19 -02/15/43, and an aggregate market value of $306,000. . . . . 300,000 $ 300,000Repurchase Agreement dated 09/28/18 at 2.240%, due on10/01/18 with a maturity value of $100,019; collateralized byU.S. Treasury and Foreign Obligations with rates ranging from1.750% - 2.875%, maturity dates ranging from 10/15/20 -05/15/27, and an aggregate market value of $102,000. . . . . 100,000 100,000Repurchase Agreement dated 09/28/18 at 2.240%, due on10/01/18 with a maturity value of $200,037; collateralized byU.S. Treasury and Foreign Obligations with rates ranging from0.375% - 3.125%, maturity dates ranging from 12/17/18 -02/15/43, and an aggregate market value of $204,000. . . . . 200,000 200,000
Deutsche Bank AG, LondonRepurchase Agreement dated 01/09/18 at 2.560%, due on10/01/18 with a maturity value of $101,884; collateralized byvarious Common Stock with an aggregate market value of$111,332. . . . . . . . . . . . . . . . . . . . . . . . . . . . . . . . . . . . 100,000 100,000
ING Bank NV, LondonRepurchase Agreement dated 08/03/18 at 2.420%, due on10/01/18 with a maturity value of $100,397; collateralized byvarious Common Stock with an aggregate market value of$111,125. . . . . . . . . . . . . . . . . . . . . . . . . . . . . . . . . . . . 100,000 100,000
Macquarie Bank, Ltd., LondonRepurchase Agreement dated 09/28/18 at 2.200%, due on10/01/18 with a maturity value of $4,483,666; collateralizedby U.S. Treasury Obligations with rates ranging from 0.125% -5.500%, maturity dates ranging from 08/31/19 - 05/15/48,and an aggregate market value of $4,569,015. . . . . . . . . . . . 4,482,844 4,482,844
Merrill Lynch, Pierce, Fenner & Smith, Inc.Repurchase Agreement dated 10/26/16 at 2.720%, due on12/31/18 with a maturity value of $1,166,156; collateralizedby various Common Stock with an aggregate market value of$1,210,000. . . . . . . . . . . . . . . . . . . . . . . . . . . . . . . . . . . 1,100,000 1,100,000Repurchase Agreement dated 08/01/17 at 2.720%, due on12/31/18 with a maturity value of $3,117,187; collateralizedby various Common Stock with an aggregate market value of$3,300,000. . . . . . . . . . . . . . . . . . . . . . . . . . . . . . . . . . . 3,000,000 3,000,000
Morgan Stanley & Co. LLCRepurchase Agreement dated 09/25/18 at 2.470%, due on10/02/18 with a maturity value of $4,001,921; collateralizedby various Common Stock with an aggregate market value of$4,400,857. . . . . . . . . . . . . . . . . . . . . . . . . . . . . . . . . . . 4,000,000 4,000,000
NBC Global Finance, Ltd.Repurchase Agreement dated 11/30/17 at 2.340%, due on10/01/18 with a maturity value of $305,948; collateralized byvarious Common Stock with an aggregate market value of$333,797. . . . . . . . . . . . . . . . . . . . . . . . . . . . . . . . . . . . 300,000 300,000Repurchase Agreement dated 03/16/18 at 2.340%, due on10/01/18 with a maturity value of $303,881; collateralized byvarious Common Stock with an aggregate market value of$333,797. . . . . . . . . . . . . . . . . . . . . . . . . . . . . . . . . . . . 300,000 300,000
BHFTII-242
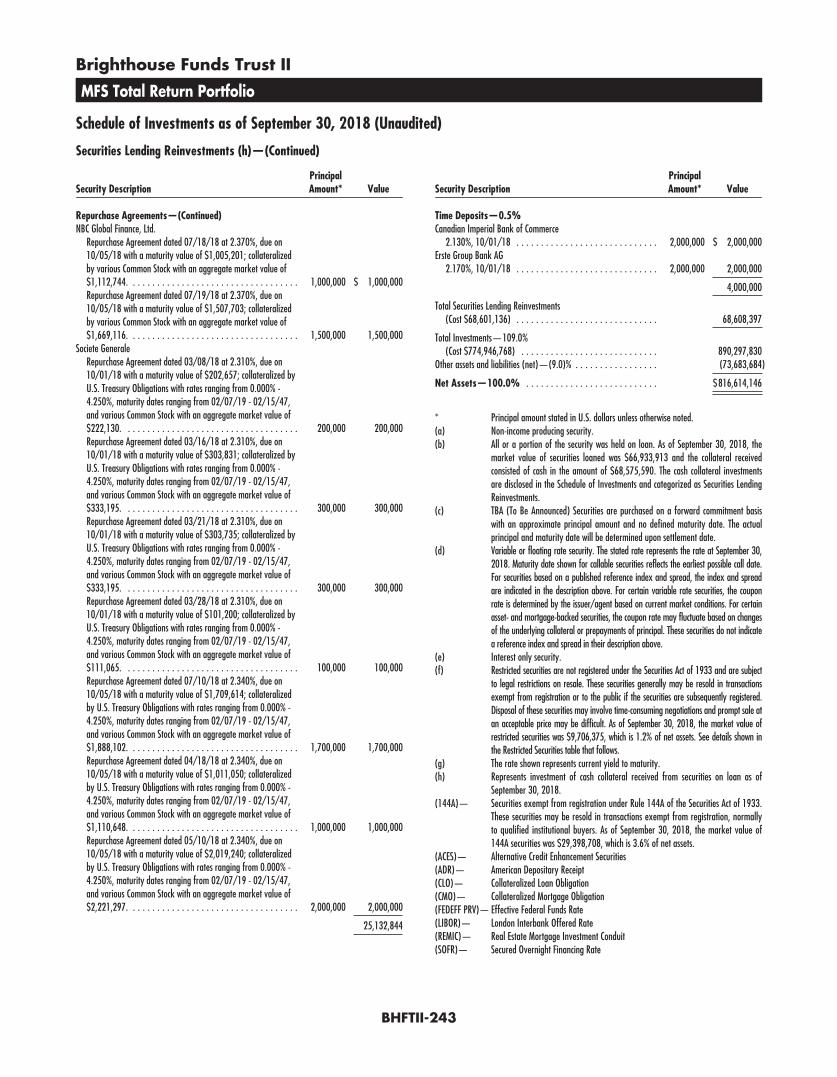
Brighthouse Funds Trust II
MFS Total Return Portfolio
Schedule of Investments as of September 30, 2018 (Unaudited)
Securities Lending Reinvestments (h)—(Continued)
Security DescriptionPrincipalAmount* Value
Repurchase Agreements—(Continued)NBC Global Finance, Ltd.
Repurchase Agreement dated 07/18/18 at 2.370%, due on10/05/18 with a maturity value of $1,005,201; collateralizedby various Common Stock with an aggregate market value of$1,112,744. . . . . . . . . . . . . . . . . . . . . . . . . . . . . . . . . . . 1,000,000 $ 1,000,000Repurchase Agreement dated 07/19/18 at 2.370%, due on10/05/18 with a maturity value of $1,507,703; collateralizedby various Common Stock with an aggregate market value of$1,669,116. . . . . . . . . . . . . . . . . . . . . . . . . . . . . . . . . . . 1,500,000 1,500,000
Societe GeneraleRepurchase Agreement dated 03/08/18 at 2.310%, due on10/01/18 with a maturity value of $202,657; collateralized byU.S. Treasury Obligations with rates ranging from 0.000% -4.250%, maturity dates ranging from 02/07/19 - 02/15/47,and various Common Stock with an aggregate market value of$222,130. . . . . . . . . . . . . . . . . . . . . . . . . . . . . . . . . . . . 200,000 200,000Repurchase Agreement dated 03/16/18 at 2.310%, due on10/01/18 with a maturity value of $303,831; collateralized byU.S. Treasury Obligations with rates ranging from 0.000% -4.250%, maturity dates ranging from 02/07/19 - 02/15/47,and various Common Stock with an aggregate market value of$333,195. . . . . . . . . . . . . . . . . . . . . . . . . . . . . . . . . . . . 300,000 300,000Repurchase Agreement dated 03/21/18 at 2.310%, due on10/01/18 with a maturity value of $303,735; collateralized byU.S. Treasury Obligations with rates ranging from 0.000% -4.250%, maturity dates ranging from 02/07/19 - 02/15/47,and various Common Stock with an aggregate market value of$333,195. . . . . . . . . . . . . . . . . . . . . . . . . . . . . . . . . . . . 300,000 300,000Repurchase Agreement dated 03/28/18 at 2.310%, due on10/01/18 with a maturity value of $101,200; collateralized byU.S. Treasury Obligations with rates ranging from 0.000% -4.250%, maturity dates ranging from 02/07/19 - 02/15/47,and various Common Stock with an aggregate market value of$111,065. . . . . . . . . . . . . . . . . . . . . . . . . . . . . . . . . . . . 100,000 100,000Repurchase Agreement dated 07/10/18 at 2.340%, due on10/05/18 with a maturity value of $1,709,614; collateralizedby U.S. Treasury Obligations with rates ranging from 0.000% -4.250%, maturity dates ranging from 02/07/19 - 02/15/47,and various Common Stock with an aggregate market value of$1,888,102. . . . . . . . . . . . . . . . . . . . . . . . . . . . . . . . . . . 1,700,000 1,700,000Repurchase Agreement dated 04/18/18 at 2.340%, due on10/05/18 with a maturity value of $1,011,050; collateralizedby U.S. Treasury Obligations with rates ranging from 0.000% -4.250%, maturity dates ranging from 02/07/19 - 02/15/47,and various Common Stock with an aggregate market value of$1,110,648. . . . . . . . . . . . . . . . . . . . . . . . . . . . . . . . . . . 1,000,000 1,000,000Repurchase Agreement dated 05/10/18 at 2.340%, due on10/05/18 with a maturity value of $2,019,240; collateralizedby U.S. Treasury Obligations with rates ranging from 0.000% -4.250%, maturity dates ranging from 02/07/19 - 02/15/47,and various Common Stock with an aggregate market value of$2,221,297. . . . . . . . . . . . . . . . . . . . . . . . . . . . . . . . . . . 2,000,000 2,000,000
25,132,844
Security DescriptionPrincipalAmount* Value
Time Deposits—0.5%Canadian Imperial Bank of Commerce
2.130%, 10/01/18 . . . . . . . . . . . . . . . . . . . . . . . . . . . . . 2,000,000 $ 2,000,000Erste Group Bank AG
2.170%, 10/01/18 . . . . . . . . . . . . . . . . . . . . . . . . . . . . . 2,000,000 2,000,000
4,000,000
Total Securities Lending Reinvestments(Cost $68,601,136) . . . . . . . . . . . . . . . . . . . . . . . . . . . . . 68,608,397
Total Investments—109.0%(Cost $774,946,768) . . . . . . . . . . . . . . . . . . . . . . . . . . . . 890,297,830
Other assets and liabilities (net)—(9.0)% . . . . . . . . . . . . . . . . . (73,683,684)
Net Assets—100.0% . . . . . . . . . . . . . . . . . . . . . . . . . . . $816,614,146
* Principal amount stated in U.S. dollars unless otherwise noted.(a) Non-income producing security.(b) All or a portion of the security was held on loan. As of September 30, 2018, the
market value of securities loaned was $66,933,913 and the collateral receivedconsisted of cash in the amount of $68,575,590. The cash collateral investmentsare disclosed in the Schedule of Investments and categorized as Securities LendingReinvestments.
(c) TBA (To Be Announced) Securities are purchased on a forward commitment basiswith an approximate principal amount and no defined maturity date. The actualprincipal and maturity date will be determined upon settlement date.
(d) Variable or floating rate security. The stated rate represents the rate at September 30,2018. Maturity date shown for callable securities reflects the earliest possible call date.For securities based on a published reference index and spread, the index and spreadare indicated in the description above. For certain variable rate securities, the couponrate is determined by the issuer/agent based on current market conditions. For certainasset- and mortgage-backed securities, the coupon rate may fluctuate based on changesof the underlying collateral or prepayments of principal. These securities do not indicatea reference index and spread in their description above.
(e) Interest only security.(f) Restricted securities are not registered under the Securities Act of 1933 and are subject
to legal restrictions on resale. These securities generally may be resold in transactionsexempt from registration or to the public if the securities are subsequently registered.Disposal of these securities may involve time-consuming negotiations and prompt sale atan acceptable price may be difficult. As of September 30, 2018, the market value ofrestricted securities was $9,706,375, which is 1.2% of net assets. See details shown inthe Restricted Securities table that follows.
(g) The rate shown represents current yield to maturity.(h) Represents investment of cash collateral received from securities on loan as of
September 30, 2018.(144A)— Securities exempt from registration under Rule 144A of the Securities Act of 1933.
These securities may be resold in transactions exempt from registration, normallyto qualified institutional buyers. As of September 30, 2018, the market value of144A securities was $29,398,708, which is 3.6% of net assets.
(ACES)— Alternative Credit Enhancement Securities(ADR)— American Depositary Receipt(CLO)— Collateralized Loan Obligation(CMO)— Collateralized Mortgage Obligation(FEDEFF PRV)— Effective Federal Funds Rate(LIBOR)— London Interbank Offered Rate(REMIC)— Real Estate Mortgage Investment Conduit(SOFR)— Secured Overnight Financing Rate
BHFTII-243
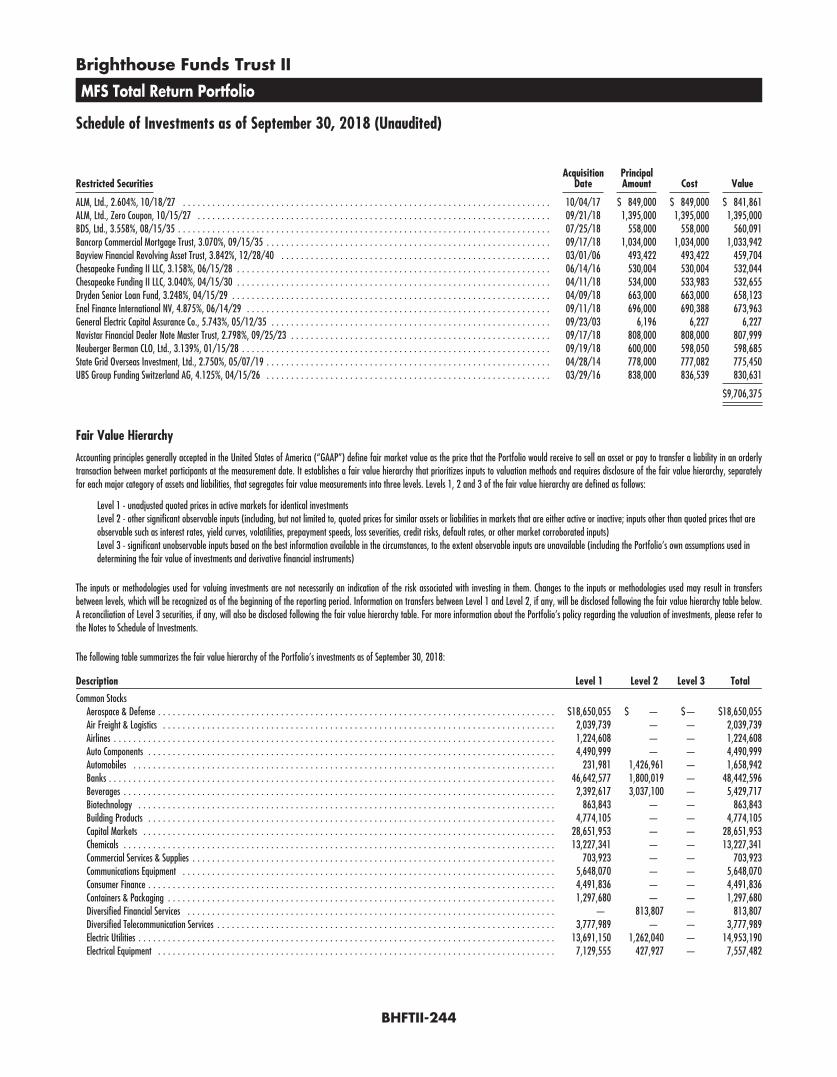
Brighthouse Funds Trust II
MFS Total Return Portfolio
Schedule of Investments as of September 30, 2018 (Unaudited)
Restricted SecuritiesAcquisition
DatePrincipalAmount Cost Value
ALM, Ltd., 2.604%, 10/18/27 . . . . . . . . . . . . . . . . . . . . . . . . . . . . . . . . . . . . . . . . . . . . . . . . . . . . . . . . . . . . . . . . . . . . . . . . . . . 10/04/17 $ 849,000 $ 849,000 $ 841,861ALM, Ltd., Zero Coupon, 10/15/27 . . . . . . . . . . . . . . . . . . . . . . . . . . . . . . . . . . . . . . . . . . . . . . . . . . . . . . . . . . . . . . . . . . . . . . . . 09/21/18 1,395,000 1,395,000 1,395,000BDS, Ltd., 3.558%, 08/15/35 . . . . . . . . . . . . . . . . . . . . . . . . . . . . . . . . . . . . . . . . . . . . . . . . . . . . . . . . . . . . . . . . . . . . . . . . . . . . 07/25/18 558,000 558,000 560,091Bancorp Commercial Mortgage Trust, 3.070%, 09/15/35 . . . . . . . . . . . . . . . . . . . . . . . . . . . . . . . . . . . . . . . . . . . . . . . . . . . . . . . . . . 09/17/18 1,034,000 1,034,000 1,033,942Bayview Financial Revolving Asset Trust, 3.842%, 12/28/40 . . . . . . . . . . . . . . . . . . . . . . . . . . . . . . . . . . . . . . . . . . . . . . . . . . . . . . . 03/01/06 493,422 493,422 459,704Chesapeake Funding II LLC, 3.158%, 06/15/28 . . . . . . . . . . . . . . . . . . . . . . . . . . . . . . . . . . . . . . . . . . . . . . . . . . . . . . . . . . . . . . . . 06/14/16 530,004 530,004 532,044Chesapeake Funding II LLC, 3.040%, 04/15/30 . . . . . . . . . . . . . . . . . . . . . . . . . . . . . . . . . . . . . . . . . . . . . . . . . . . . . . . . . . . . . . . . 04/11/18 534,000 533,983 532,655Dryden Senior Loan Fund, 3.248%, 04/15/29 . . . . . . . . . . . . . . . . . . . . . . . . . . . . . . . . . . . . . . . . . . . . . . . . . . . . . . . . . . . . . . . . . 04/09/18 663,000 663,000 658,123Enel Finance International NV, 4.875%, 06/14/29 . . . . . . . . . . . . . . . . . . . . . . . . . . . . . . . . . . . . . . . . . . . . . . . . . . . . . . . . . . . . . . 09/11/18 696,000 690,388 673,963General Electric Capital Assurance Co., 5.743%, 05/12/35 . . . . . . . . . . . . . . . . . . . . . . . . . . . . . . . . . . . . . . . . . . . . . . . . . . . . . . . . . 09/23/03 6,196 6,227 6,227Navistar Financial Dealer Note Master Trust, 2.798%, 09/25/23 . . . . . . . . . . . . . . . . . . . . . . . . . . . . . . . . . . . . . . . . . . . . . . . . . . . . . 09/17/18 808,000 808,000 807,999Neuberger Berman CLO, Ltd., 3.139%, 01/15/28 . . . . . . . . . . . . . . . . . . . . . . . . . . . . . . . . . . . . . . . . . . . . . . . . . . . . . . . . . . . . . . . 09/19/18 600,000 598,050 598,685State Grid Overseas Investment, Ltd., 2.750%, 05/07/19 . . . . . . . . . . . . . . . . . . . . . . . . . . . . . . . . . . . . . . . . . . . . . . . . . . . . . . . . . . 04/28/14 778,000 777,082 775,450UBS Group Funding Switzerland AG, 4.125%, 04/15/26 . . . . . . . . . . . . . . . . . . . . . . . . . . . . . . . . . . . . . . . . . . . . . . . . . . . . . . . . . . 03/29/16 838,000 836,539 830,631
$9,706,375
Fair Value Hierarchy
Accounting principles generally accepted in the United States of America (“GAAP”) define fair market value as the price that the Portfolio would receive to sell an asset or pay to transfer a liability in an orderlytransaction between market participants at the measurement date. It establishes a fair value hierarchy that prioritizes inputs to valuation methods and requires disclosure of the fair value hierarchy, separatelyfor each major category of assets and liabilities, that segregates fair value measurements into three levels. Levels 1, 2 and 3 of the fair value hierarchy are defined as follows:
Level 1 - unadjusted quoted prices in active markets for identical investmentsLevel 2 - other significant observable inputs (including, but not limited to, quoted prices for similar assets or liabilities in markets that are either active or inactive; inputs other than quoted prices that areobservable such as interest rates, yield curves, volatilities, prepayment speeds, loss severities, credit risks, default rates, or other market corroborated inputs)Level 3 - significant unobservable inputs based on the best information available in the circumstances, to the extent observable inputs are unavailable (including the Portfolio’s own assumptions used indetermining the fair value of investments and derivative financial instruments)
The inputs or methodologies used for valuing investments are not necessarily an indication of the risk associated with investing in them. Changes to the inputs or methodologies used may result in transfersbetween levels, which will be recognized as of the beginning of the reporting period. Information on transfers between Level 1 and Level 2, if any, will be disclosed following the fair value hierarchy table below.A reconciliation of Level 3 securities, if any, will also be disclosed following the fair value hierarchy table. For more information about the Portfolio’s policy regarding the valuation of investments, please refer tothe Notes to Schedule of Investments.
The following table summarizes the fair value hierarchy of the Portfolio’s investments as of September 30, 2018:
Description Level 1 Level 2 Level 3 Total
Common StocksAerospace & Defense . . . . . . . . . . . . . . . . . . . . . . . . . . . . . . . . . . . . . . . . . . . . . . . . . . . . . . . . . . . . . . . . . . . . . . . . . . . . . . . . . $18,650,055 $ — $— $18,650,055Air Freight & Logistics . . . . . . . . . . . . . . . . . . . . . . . . . . . . . . . . . . . . . . . . . . . . . . . . . . . . . . . . . . . . . . . . . . . . . . . . . . . . . . . . 2,039,739 — — 2,039,739Airlines . . . . . . . . . . . . . . . . . . . . . . . . . . . . . . . . . . . . . . . . . . . . . . . . . . . . . . . . . . . . . . . . . . . . . . . . . . . . . . . . . . . . . . . . . . 1,224,608 — — 1,224,608Auto Components . . . . . . . . . . . . . . . . . . . . . . . . . . . . . . . . . . . . . . . . . . . . . . . . . . . . . . . . . . . . . . . . . . . . . . . . . . . . . . . . . . . 4,490,999 — — 4,490,999Automobiles . . . . . . . . . . . . . . . . . . . . . . . . . . . . . . . . . . . . . . . . . . . . . . . . . . . . . . . . . . . . . . . . . . . . . . . . . . . . . . . . . . . . . . 231,981 1,426,961 — 1,658,942Banks . . . . . . . . . . . . . . . . . . . . . . . . . . . . . . . . . . . . . . . . . . . . . . . . . . . . . . . . . . . . . . . . . . . . . . . . . . . . . . . . . . . . . . . . . . . 46,642,577 1,800,019 — 48,442,596Beverages . . . . . . . . . . . . . . . . . . . . . . . . . . . . . . . . . . . . . . . . . . . . . . . . . . . . . . . . . . . . . . . . . . . . . . . . . . . . . . . . . . . . . . . . 2,392,617 3,037,100 — 5,429,717Biotechnology . . . . . . . . . . . . . . . . . . . . . . . . . . . . . . . . . . . . . . . . . . . . . . . . . . . . . . . . . . . . . . . . . . . . . . . . . . . . . . . . . . . . . 863,843 — — 863,843Building Products . . . . . . . . . . . . . . . . . . . . . . . . . . . . . . . . . . . . . . . . . . . . . . . . . . . . . . . . . . . . . . . . . . . . . . . . . . . . . . . . . . . 4,774,105 — — 4,774,105Capital Markets . . . . . . . . . . . . . . . . . . . . . . . . . . . . . . . . . . . . . . . . . . . . . . . . . . . . . . . . . . . . . . . . . . . . . . . . . . . . . . . . . . . . 28,651,953 — — 28,651,953Chemicals . . . . . . . . . . . . . . . . . . . . . . . . . . . . . . . . . . . . . . . . . . . . . . . . . . . . . . . . . . . . . . . . . . . . . . . . . . . . . . . . . . . . . . . . 13,227,341 — — 13,227,341Commercial Services & Supplies . . . . . . . . . . . . . . . . . . . . . . . . . . . . . . . . . . . . . . . . . . . . . . . . . . . . . . . . . . . . . . . . . . . . . . . . . . 703,923 — — 703,923Communications Equipment . . . . . . . . . . . . . . . . . . . . . . . . . . . . . . . . . . . . . . . . . . . . . . . . . . . . . . . . . . . . . . . . . . . . . . . . . . . . 5,648,070 — — 5,648,070Consumer Finance . . . . . . . . . . . . . . . . . . . . . . . . . . . . . . . . . . . . . . . . . . . . . . . . . . . . . . . . . . . . . . . . . . . . . . . . . . . . . . . . . . . 4,491,836 — — 4,491,836Containers & Packaging . . . . . . . . . . . . . . . . . . . . . . . . . . . . . . . . . . . . . . . . . . . . . . . . . . . . . . . . . . . . . . . . . . . . . . . . . . . . . . . 1,297,680 — — 1,297,680Diversified Financial Services . . . . . . . . . . . . . . . . . . . . . . . . . . . . . . . . . . . . . . . . . . . . . . . . . . . . . . . . . . . . . . . . . . . . . . . . . . . — 813,807 — 813,807Diversified Telecommunication Services . . . . . . . . . . . . . . . . . . . . . . . . . . . . . . . . . . . . . . . . . . . . . . . . . . . . . . . . . . . . . . . . . . . . . 3,777,989 — — 3,777,989Electric Utilities . . . . . . . . . . . . . . . . . . . . . . . . . . . . . . . . . . . . . . . . . . . . . . . . . . . . . . . . . . . . . . . . . . . . . . . . . . . . . . . . . . . . . 13,691,150 1,262,040 — 14,953,190Electrical Equipment . . . . . . . . . . . . . . . . . . . . . . . . . . . . . . . . . . . . . . . . . . . . . . . . . . . . . . . . . . . . . . . . . . . . . . . . . . . . . . . . . 7,129,555 427,927 — 7,557,482
BHFTII-244

Brighthouse Funds Trust II
MFS Total Return Portfolio
Schedule of Investments as of September 30, 2018 (Unaudited)
Fair Value Hierarchy—(Continued)Description Level 1 Level 2 Level 3 Total
Energy Equipment & Services . . . . . . . . . . . . . . . . . . . . . . . . . . . . . . . . . . . . . . . . . . . . . . . . . . . . . . . . . . . . . . . . . . . . . . . . $ 3,271,343 $ — $— $ 3,271,343Entertainment . . . . . . . . . . . . . . . . . . . . . . . . . . . . . . . . . . . . . . . . . . . . . . . . . . . . . . . . . . . . . . . . . . . . . . . . . . . . . . . . . . 508,950 — — 508,950Equity Real Estate Investment Trusts . . . . . . . . . . . . . . . . . . . . . . . . . . . . . . . . . . . . . . . . . . . . . . . . . . . . . . . . . . . . . . . . . . . 8,924,653 — — 8,924,653Food & Staples Retailing . . . . . . . . . . . . . . . . . . . . . . . . . . . . . . . . . . . . . . . . . . . . . . . . . . . . . . . . . . . . . . . . . . . . . . . . . . . 1,345,177 — — 1,345,177Food Products . . . . . . . . . . . . . . . . . . . . . . . . . . . . . . . . . . . . . . . . . . . . . . . . . . . . . . . . . . . . . . . . . . . . . . . . . . . . . . . . . . 9,173,839 6,930,240 — 16,104,079Health Care Equipment & Supplies . . . . . . . . . . . . . . . . . . . . . . . . . . . . . . . . . . . . . . . . . . . . . . . . . . . . . . . . . . . . . . . . . . . . 19,796,305 — — 19,796,305Health Care Providers & Services . . . . . . . . . . . . . . . . . . . . . . . . . . . . . . . . . . . . . . . . . . . . . . . . . . . . . . . . . . . . . . . . . . . . . 16,499,797 — — 16,499,797Hotels, Restaurants & Leisure . . . . . . . . . . . . . . . . . . . . . . . . . . . . . . . . . . . . . . . . . . . . . . . . . . . . . . . . . . . . . . . . . . . . . . . . 2,495,689 — — 2,495,689Household Durables . . . . . . . . . . . . . . . . . . . . . . . . . . . . . . . . . . . . . . . . . . . . . . . . . . . . . . . . . . . . . . . . . . . . . . . . . . . . . . 3,944,586 — — 3,944,586Household Products . . . . . . . . . . . . . . . . . . . . . . . . . . . . . . . . . . . . . . . . . . . . . . . . . . . . . . . . . . . . . . . . . . . . . . . . . . . . . . 3,549,143 1,646,113 — 5,195,256Industrial Conglomerates . . . . . . . . . . . . . . . . . . . . . . . . . . . . . . . . . . . . . . . . . . . . . . . . . . . . . . . . . . . . . . . . . . . . . . . . . . 10,751,879 — — 10,751,879Insurance . . . . . . . . . . . . . . . . . . . . . . . . . . . . . . . . . . . . . . . . . . . . . . . . . . . . . . . . . . . . . . . . . . . . . . . . . . . . . . . . . . . . . 24,697,252 2,477,072 — 27,174,324Interactive Media & Services . . . . . . . . . . . . . . . . . . . . . . . . . . . . . . . . . . . . . . . . . . . . . . . . . . . . . . . . . . . . . . . . . . . . . . . . 5,506,182 — — 5,506,182Internet & Direct Marketing Retail . . . . . . . . . . . . . . . . . . . . . . . . . . . . . . . . . . . . . . . . . . . . . . . . . . . . . . . . . . . . . . . . . . . . 5,199,788 — — 5,199,788IT Services . . . . . . . . . . . . . . . . . . . . . . . . . . . . . . . . . . . . . . . . . . . . . . . . . . . . . . . . . . . . . . . . . . . . . . . . . . . . . . . . . . . . 21,442,503 — — 21,442,503Life Sciences Tools & Services . . . . . . . . . . . . . . . . . . . . . . . . . . . . . . . . . . . . . . . . . . . . . . . . . . . . . . . . . . . . . . . . . . . . . . . . 6,842,783 — — 6,842,783Machinery . . . . . . . . . . . . . . . . . . . . . . . . . . . . . . . . . . . . . . . . . . . . . . . . . . . . . . . . . . . . . . . . . . . . . . . . . . . . . . . . . . . . 9,265,511 — — 9,265,511Media . . . . . . . . . . . . . . . . . . . . . . . . . . . . . . . . . . . . . . . . . . . . . . . . . . . . . . . . . . . . . . . . . . . . . . . . . . . . . . . . . . . . . . . 14,360,404 — — 14,360,404Metals & Mining . . . . . . . . . . . . . . . . . . . . . . . . . . . . . . . . . . . . . . . . . . . . . . . . . . . . . . . . . . . . . . . . . . . . . . . . . . . . . . . . — 2,259,145 — 2,259,145Mortgage Real Estate Investment Trusts . . . . . . . . . . . . . . . . . . . . . . . . . . . . . . . . . . . . . . . . . . . . . . . . . . . . . . . . . . . . . . . . . 801,520 — — 801,520Multi-Utilities . . . . . . . . . . . . . . . . . . . . . . . . . . . . . . . . . . . . . . . . . . . . . . . . . . . . . . . . . . . . . . . . . . . . . . . . . . . . . . . . . . 3,125,539 831,218 — 3,956,757Multiline Retail . . . . . . . . . . . . . . . . . . . . . . . . . . . . . . . . . . . . . . . . . . . . . . . . . . . . . . . . . . . . . . . . . . . . . . . . . . . . . . . . . 406,968 — — 406,968Oil, Gas & Consumable Fuels . . . . . . . . . . . . . . . . . . . . . . . . . . . . . . . . . . . . . . . . . . . . . . . . . . . . . . . . . . . . . . . . . . . . . . . . 25,362,210 4,065,211 — 29,427,421Personal Products . . . . . . . . . . . . . . . . . . . . . . . . . . . . . . . . . . . . . . . . . . . . . . . . . . . . . . . . . . . . . . . . . . . . . . . . . . . . . . . 580,046 — — 580,046Pharmaceuticals . . . . . . . . . . . . . . . . . . . . . . . . . . . . . . . . . . . . . . . . . . . . . . . . . . . . . . . . . . . . . . . . . . . . . . . . . . . . . . . . 30,887,579 4,954,549 — 35,842,128Professional Services . . . . . . . . . . . . . . . . . . . . . . . . . . . . . . . . . . . . . . . . . . . . . . . . . . . . . . . . . . . . . . . . . . . . . . . . . . . . . 1,762,042 — — 1,762,042Road & Rail . . . . . . . . . . . . . . . . . . . . . . . . . . . . . . . . . . . . . . . . . . . . . . . . . . . . . . . . . . . . . . . . . . . . . . . . . . . . . . . . . . . 9,718,342 — — 9,718,342Semiconductors & Semiconductor Equipment . . . . . . . . . . . . . . . . . . . . . . . . . . . . . . . . . . . . . . . . . . . . . . . . . . . . . . . . . . . . . . 11,810,493 — — 11,810,493Software . . . . . . . . . . . . . . . . . . . . . . . . . . . . . . . . . . . . . . . . . . . . . . . . . . . . . . . . . . . . . . . . . . . . . . . . . . . . . . . . . . . . . 15,101,815 — — 15,101,815Specialty Retail . . . . . . . . . . . . . . . . . . . . . . . . . . . . . . . . . . . . . . . . . . . . . . . . . . . . . . . . . . . . . . . . . . . . . . . . . . . . . . . . . 2,890,030 — — 2,890,030Technology Hardware, Storage & Peripherals . . . . . . . . . . . . . . . . . . . . . . . . . . . . . . . . . . . . . . . . . . . . . . . . . . . . . . . . . . . . . 4,933,561 559,027 — 5,492,588Textiles, Apparel & Luxury Goods . . . . . . . . . . . . . . . . . . . . . . . . . . . . . . . . . . . . . . . . . . . . . . . . . . . . . . . . . . . . . . . . . . . . . 2,075,767 1,188,770 — 3,264,537Tobacco . . . . . . . . . . . . . . . . . . . . . . . . . . . . . . . . . . . . . . . . . . . . . . . . . . . . . . . . . . . . . . . . . . . . . . . . . . . . . . . . . . . . . . 14,956,373 689,229 — 15,645,602Trading Companies & Distributors . . . . . . . . . . . . . . . . . . . . . . . . . . . . . . . . . . . . . . . . . . . . . . . . . . . . . . . . . . . . . . . . . . . . . 361,105 — — 361,105
Total Common Stocks . . . . . . . . . . . . . . . . . . . . . . . . . . . . . . . . . . . . . . . . . . . . . . . . . . . . . . . . . . . . . . . . . . . . . . . . . . . . . . . 452,279,195 34,368,428 — 486,647,623
Total U.S. Treasury & Government Agencies* . . . . . . . . . . . . . . . . . . . . . . . . . . . . . . . . . . . . . . . . . . . . . . . . . . . . . . . . . . . . . . . . — 202,171,108 — 202,171,108
Total Corporate Bonds & Notes* . . . . . . . . . . . . . . . . . . . . . . . . . . . . . . . . . . . . . . . . . . . . . . . . . . . . . . . . . . . . . . . . . . . . . . . . — 91,399,226 — 91,399,226
Total Mortgage-Backed Securities* . . . . . . . . . . . . . . . . . . . . . . . . . . . . . . . . . . . . . . . . . . . . . . . . . . . . . . . . . . . . . . . . . . . . . . — 16,075,931 — 16,075,931
Total Asset-Backed Securities* . . . . . . . . . . . . . . . . . . . . . . . . . . . . . . . . . . . . . . . . . . . . . . . . . . . . . . . . . . . . . . . . . . . . . . . . . — 11,739,891 — 11,739,891
Total Municipals . . . . . . . . . . . . . . . . . . . . . . . . . . . . . . . . . . . . . . . . . . . . . . . . . . . . . . . . . . . . . . . . . . . . . . . . . . . . . . . . . . . — 1,502,329 — 1,502,329
Total Convertible Preferred Stocks* . . . . . . . . . . . . . . . . . . . . . . . . . . . . . . . . . . . . . . . . . . . . . . . . . . . . . . . . . . . . . . . . . . . . . . 907,325 — — 907,325
Total Short-Term Investment* . . . . . . . . . . . . . . . . . . . . . . . . . . . . . . . . . . . . . . . . . . . . . . . . . . . . . . . . . . . . . . . . . . . . . . . . . . — 11,246,000 — 11,246,000
Total Securities Lending Reinvestments* . . . . . . . . . . . . . . . . . . . . . . . . . . . . . . . . . . . . . . . . . . . . . . . . . . . . . . . . . . . . . . . . . . . — 68,608,397 — 68,608,397
Total Investments . . . . . . . . . . . . . . . . . . . . . . . . . . . . . . . . . . . . . . . . . . . . . . . . . . . . . . . . . . . . . . . . . . . . . . . . . . . . . . . . . . $453,186,520 $437,111,310 $— $890,297,830
Collateral for Securities Loaned (Liability) . . . . . . . . . . . . . . . . . . . . . . . . . . . . . . . . . . . . . . . . . . . . . . . . . . . . . . . . . . . . . . . . . . $ — $ (68,575,590) $— $ (68,575,590)
* See Schedule of Investments for additional detailed categorizations.
BHFTII-245

Brighthouse Funds Trust II
MFS Value Portfolio
Schedule of Investments as of September 30, 2018 (Unaudited)
Common Stocks—99.0% of Net Assets
Security Description Shares Value
Aerospace & Defense—3.8%Lockheed Martin Corp. . . . . . . . . . . . . . . . . . . . . . . . . . . . . 73,070 $ 25,279,297Northrop Grumman Corp. . . . . . . . . . . . . . . . . . . . . . . . . . . 206,057 65,396,310United Technologies Corp. . . . . . . . . . . . . . . . . . . . . . . . . . . 333,319 46,601,330
137,276,937
Air Freight & Logistics—0.6%United Parcel Service, Inc. - Class B . . . . . . . . . . . . . . . . . . . . 183,111 21,378,209
Auto Components—0.7%Aptiv plc . . . . . . . . . . . . . . . . . . . . . . . . . . . . . . . . . . . . . 323,246 27,120,339Garrett Motion, Inc. (a) . . . . . . . . . . . . . . . . . . . . . . . . . . . . 12,340 228,285
27,348,624
Automobiles—0.1%Harley-Davidson, Inc. . . . . . . . . . . . . . . . . . . . . . . . . . . . . . 114,383 5,181,550
Banks—13.6%Citigroup, Inc. . . . . . . . . . . . . . . . . . . . . . . . . . . . . . . . . . . 1,151,177 82,585,438JPMorgan Chase & Co. . . . . . . . . . . . . . . . . . . . . . . . . . . . . 1,500,815 169,351,965PNC Financial Services Group, Inc. (The) . . . . . . . . . . . . . . . . . 411,922 56,099,657U.S. Bancorp . . . . . . . . . . . . . . . . . . . . . . . . . . . . . . . . . . . 1,501,139 79,275,150Wells Fargo & Co. . . . . . . . . . . . . . . . . . . . . . . . . . . . . . . . 2,083,811 109,525,106
496,837,316
Beverages—1.6%Diageo plc . . . . . . . . . . . . . . . . . . . . . . . . . . . . . . . . . . . . 1,189,803 42,136,115PepsiCo, Inc. . . . . . . . . . . . . . . . . . . . . . . . . . . . . . . . . . . . 158,025 17,667,195
59,803,310
Building Products—1.7%Johnson Controls International plc (b) . . . . . . . . . . . . . . . . . . 1,720,968 60,233,880
Capital Markets—7.5%Bank of New York Mellon Corp. (The) . . . . . . . . . . . . . . . . . . 802,469 40,917,894BlackRock, Inc. . . . . . . . . . . . . . . . . . . . . . . . . . . . . . . . . . 78,543 37,019,672Goldman Sachs Group, Inc. (The) (b) . . . . . . . . . . . . . . . . . . . 361,094 80,971,719Moody’s Corp. (b) . . . . . . . . . . . . . . . . . . . . . . . . . . . . . . . 157,578 26,347,042Nasdaq, Inc. (b) . . . . . . . . . . . . . . . . . . . . . . . . . . . . . . . . 446,818 38,336,984State Street Corp. . . . . . . . . . . . . . . . . . . . . . . . . . . . . . . . . 371,258 31,103,995T. Rowe Price Group, Inc. (b) . . . . . . . . . . . . . . . . . . . . . . . . 164,762 17,988,715
272,686,021
Chemicals—3.1%DowDuPont, Inc. . . . . . . . . . . . . . . . . . . . . . . . . . . . . . . . . 211,222 13,583,687PPG Industries, Inc. (b) . . . . . . . . . . . . . . . . . . . . . . . . . . . . 595,638 65,001,975Sherwin-Williams Co. (The) . . . . . . . . . . . . . . . . . . . . . . . . . 77,083 35,088,952
113,674,614
Consumer Finance—1.1%American Express Co. . . . . . . . . . . . . . . . . . . . . . . . . . . . . . 392,986 41,849,079
Containers & Packaging—0.4%Crown Holdings, Inc. (a) (b) . . . . . . . . . . . . . . . . . . . . . . . . . 278,848 13,384,704
Security Description Shares Value
Diversified Telecommunication Services—0.8%Verizon Communications, Inc. . . . . . . . . . . . . . . . . . . . . . . . . 560,905 $ 29,946,718
Electric Utilities—2.9%Duke Energy Corp. (b) . . . . . . . . . . . . . . . . . . . . . . . . . . . . 725,024 58,016,420Southern Co. (The) (b) . . . . . . . . . . . . . . . . . . . . . . . . . . . . 727,707 31,728,025Xcel Energy, Inc. (b) . . . . . . . . . . . . . . . . . . . . . . . . . . . . . . 308,351 14,557,251
104,301,696
Electrical Equipment—1.1%Eaton Corp. plc . . . . . . . . . . . . . . . . . . . . . . . . . . . . . . . . . 445,505 38,638,649
Energy Equipment & Services—1.5%Schlumberger, Ltd. . . . . . . . . . . . . . . . . . . . . . . . . . . . . . . . 905,863 55,185,174
Equity Real Estate Investment Trusts—0.4%Public Storage (b) . . . . . . . . . . . . . . . . . . . . . . . . . . . . . . . 63,589 12,821,450
Food Products—4.0%Archer-Daniels-Midland Co. . . . . . . . . . . . . . . . . . . . . . . . . . 467,843 23,518,467Danone S.A. . . . . . . . . . . . . . . . . . . . . . . . . . . . . . . . . . . . 215,822 16,708,203General Mills, Inc. (b) . . . . . . . . . . . . . . . . . . . . . . . . . . . . . 853,909 36,649,774J.M. Smucker Co. (The) (b) . . . . . . . . . . . . . . . . . . . . . . . . . 129,970 13,336,222Nestle S.A. . . . . . . . . . . . . . . . . . . . . . . . . . . . . . . . . . . . . 687,939 57,309,503
147,522,169
Health Care Equipment & Supplies—5.7%Abbott Laboratories (b) . . . . . . . . . . . . . . . . . . . . . . . . . . . . 785,685 57,637,851Danaher Corp. . . . . . . . . . . . . . . . . . . . . . . . . . . . . . . . . . 481,612 52,331,960Medtronic plc . . . . . . . . . . . . . . . . . . . . . . . . . . . . . . . . . . 1,006,021 98,962,286
208,932,097
Health Care Providers & Services—2.4%Cigna Corp. . . . . . . . . . . . . . . . . . . . . . . . . . . . . . . . . . . . . 187,074 38,958,161Express Scripts Holding Co. (a) . . . . . . . . . . . . . . . . . . . . . . . 264,599 25,139,551McKesson Corp. . . . . . . . . . . . . . . . . . . . . . . . . . . . . . . . . . 170,774 22,653,171
86,750,883
Household Durables—0.2%Newell Brands, Inc. (b) . . . . . . . . . . . . . . . . . . . . . . . . . . . . 350,473 7,114,602
Household Products—1.3%Colgate-Palmolive Co. . . . . . . . . . . . . . . . . . . . . . . . . . . . . . 109,146 7,307,325Kimberly-Clark Corp. . . . . . . . . . . . . . . . . . . . . . . . . . . . . . 99,379 11,293,429Procter & Gamble Co. (The) . . . . . . . . . . . . . . . . . . . . . . . . . 100,668 8,378,598Reckitt Benckiser Group plc . . . . . . . . . . . . . . . . . . . . . . . . . 212,242 19,389,218
46,368,570
Industrial Conglomerates—3.3%3M Co. (b) . . . . . . . . . . . . . . . . . . . . . . . . . . . . . . . . . . . . 205,442 43,288,684Honeywell International, Inc. . . . . . . . . . . . . . . . . . . . . . . . . 458,987 75,732,855
119,021,539
Insurance—7.0%Aon plc (b) . . . . . . . . . . . . . . . . . . . . . . . . . . . . . . . . . . . . 460,155 70,762,636Chubb, Ltd. . . . . . . . . . . . . . . . . . . . . . . . . . . . . . . . . . . . . 559,369 74,754,073
BHFTII-246