Brief Introduction on Company/Unit
30
Brief Introduction on Company/Unit 1 1690MW TPP JSW Energy Ltd Tornagallu (Vijayanagar Capacity) Ballari Dist. Karnataka 860MW - SBU2– 2 X 300MW SBU1- 2 X 130MW Unit Fuel SBU1 2 X 130MW Imported Coal, Corex Gas SBU2 2 X 300MW Imported Coal & BFG Gas CPP1 100MW BFG & Corex Gas CPP2 125MW BFG & Corex Gas CPP3&4 2 X 300MW Imported Coal & BFG gas SBU – Strategic Business Unit CPP – Captive power plant
Transcript of Brief Introduction on Company/Unit
Brief Introduction on Company/Unit
1
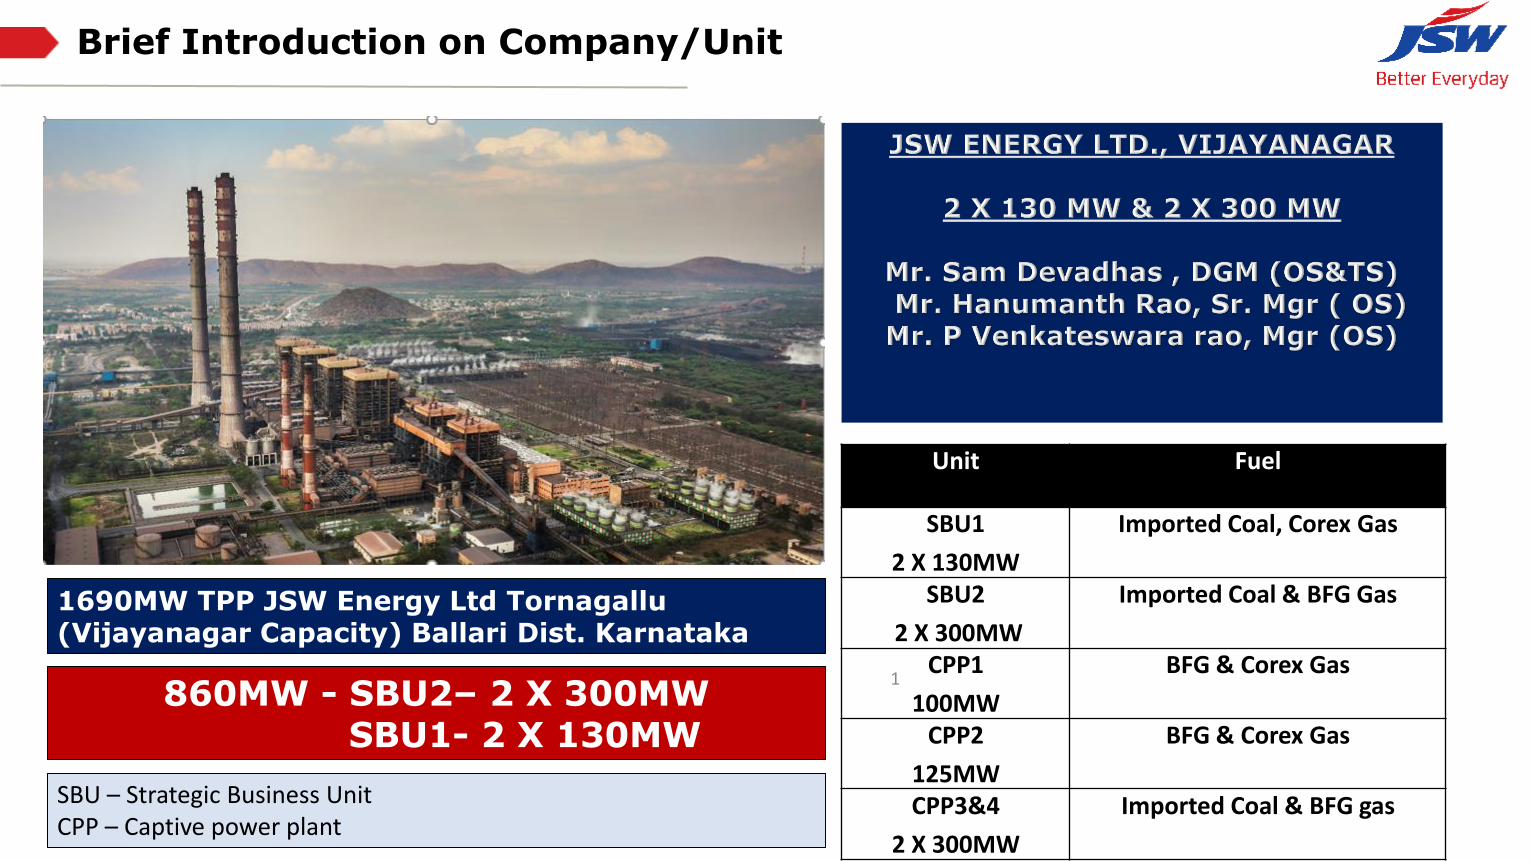
1690MW TPP JSW Energy Ltd Tornagallu (Vijayanagar Capacity) Ballari Dist. Karnataka
860MW - SBU2– 2 X 300MWSBU1- 2 X 130MW
Unit Fuel
SBU1
2 X 130MW
Imported Coal, Corex Gas
SBU2
2 X 300MW
Imported Coal & BFG Gas
CPP1
100MW
BFG & Corex Gas
CPP2
125MW
BFG & Corex Gas
CPP3&4
2 X 300MW
Imported Coal & BFG gasSBU – Strategic Business UnitCPP – Captive power plant

Brief introduction on Company/Unit
2
IntroductionJSW Energy is one of the most efficient power generation companies in India. With a capacity of
5.39 GW spread across several locations, it is a major player in the Indian power industry. It also
owns strategic stakes in natural resource companies in South Africa. The company operates as
India’s leading power trading company. JSW Energy has a joint venture with Toshiba Corporation for
manufacturing of supercritical Steam Turbines and Generators.
JSW Energy began its commercial operations in the year 2000 with a capacity of 0.26 GW and has
gradually increased to 5.39 GW by 2018 with 4 generation facilities viz. Vijayanagar, Ratnagiri,
Barmer and Sholtu
Vijayanagar Plant:
Located in Vijayanagar, Karnataka, this plant consists of two separate business units, along with
steel captive power with a combined capacity of 1690 MW. The plant stands out as extremely
efficient and has received several accolades from the Govt. of India. The Vijayanagar plant
comprises of two separate business units: SBU I: This unit was commissioned in the year 2000. It is
the first of its kind in India, which is operating on multi-fuel technology of any combinations. 2x130
MW project is one of the first kind registered under Clean Development Mechanism (CDM)
mechanism for reduction of GHG emissions and received CERs of 4.95 Million.
SBU II: This unit became operational in the year 2009.
Running on imported coal and a blend of coal from other different sources that help boost cost
effectiveness. This unit is retrofitted with in-house burners to operate with steel plant by-product
gases.

3
Energy Consumption Overview FY 20-21
31.8
PLANT LOAD FACTOR
(%)
98.5
AVAILABILITY FACTOR
(%)
2410
GROSS HEATRATE(KCAL/KWH)
8.16
AUXILIARY POWERCONSUMPTION
(%)
0.15
SP. DM WATER CONSUMPTION
(%)
2186
SP. RAW WATER CONSUMPTION
(M3/MU)
0.23
SP. OIL CONSUMPTION
(%)
2397
GENERATIONMU

4
Sp. Energy Consumption in last 3 years (FY 2018-21)
2344
2378
2410
50.49
39.64
31.82
0.00
10.00
20.00
30.00
40.00
50.00
60.00
2300
2320
2340
2360
2380
2400
2420
FY 18-19YTD
FY 19-20YTD
FY 20-21YTD
%
KC
AL/
KW
HR
TIME PERIOD
860MW GHR & PLF
GHR PLF
GHR has increase due to reduction in PLF. Less demand due to increase of Renewable Energy capacity
7.70%
7.89%
8.16%
50.49
39.64
31.82
0.00
10.00
20.00
30.00
40.00
50.00
60.00
7.40%
7.50%
7.60%
7.70%
7.80%
7.90%
8.00%
8.10%
8.20%
FY 18-19YTD
FY 19-20YTD
FY 20-21YTD
PLF
%
AP
C %
TIME PERIOD
860MW APC & PLF
APC PLF
APC has increase due to reduction in PLF. Less demand due to increase of Renewable Energy capacity

5
Availability Trend for last 3 years (FY 2018-21)
1.8
4.3
0
0 1 2 3 4 5
18-19
19-20
20-21
%
FY
Planned outage
1.3
0.6
2.07
0 0.5 1 1.5 2 2.5
18-19
19-20
20-21
%FY
Forced outage
96.90%
95.08%
98.51%
20.00% 30.00% 40.00% 50.00% 60.00% 70.00% 80.00% 90.00% 100.00% 110.00%
FY 18-19 YTD
FY 19-20 YTD
FY 20-21YTD
Availablity

Internal benchmarking/external benchmarking
31.8
77.16
86.93
80.46
2410
2323
2363
2332
0 500 1000 1500 2000 2500 3000
JSWEL-Vijaynagar
GMR-Kamalanga
Lanco-Amarkantak
RPG-DHARIWAL
Kcal/KWHr & %
GH
R &
AP
C
GHR & PLF comparision
Gross heatrate Kcal/KWH Plant Load Factor %
GHR of Vijayanagar is high due to Less PLF
31.8
77.16
86.93
80.46
8.1
6.81
8.16
7.67
0 20 40 60 80 100
JSWEL-Vijaynagar
GMR-Kamalanga
Lanco-Amarkantak
RPG-DHARIWAL
APC % & PLF %
AP
C &
PLF
PLF & APC Comparision
Auxiliary Power consumption % Plant Load Factor %
APC is high due to less PLF. Vijayanagar APC is less than Lanco -Amarkantak, because of stopping of CWP & BFP at 150MW & below
CERC Norms • Availability Factor 85%• APC 8.25%• SOC 0.25ml/kwh

7
Encon PROJECTS PLANNED IN FY 21-22
Project PlannedSavings in Lakhs Rs.
Expected savings per annum in Lakh
Rs
ROI in months
SBU1 U1 Fills Replacement 50 53.43 11.23
SBU2 U1 Fills Replacement 70 98.81 8.50
SBU1 U1 COH 250 149.62 20.05
SBU2 U1 COH 250 254.08 11.81

ENERGY SAVING PROJECTS IMPLEMENTED
Financial YearNo. of Energy
savings projectInvestmentRs. Million
Electrical savings (Million
KWHr)
Thermal savings(Million
Kcal/MTOE)
Savings (INR Million)
2020-2021 5 14.265 3.0495 0.000536 15.88
2019-2020 9 47.29 4.93294 0.001445 40.92
2018-2019 4 0 25.0705 --- 102.03
Total 18 61.55 33.05 0.001991 158.83

SUMMARY OF ENERGY SAVING PROJECTS IMPLEMENTED FOR LAST 3 FINANCIAL YEARS
Financial Year
PROJECT Investme
ntRs. Million
Electrical savings (Million KWHr)
Thermal savings(Million
Kcal/MTOE)
Savings(INR
Million)
2020-2021
SBU2 U1 Clear water pump sump Level Auto control by varying VFD speed
0 0.1253 0 0.40974
2020-2021
CEP VFD Deaerator level logic implementation to reduce throttling losses of Deaerator control valve
0 0.5326 0 1.7416
2020-2021
SBU2 U1 4 CT cell fills replaced with trickle grid 14 0.69826 0.0001721 4.182
2020-2021
SBU2 U1 Reduction in Net Unit Heatrate by improving the vacuum at 140MW by Keeping 2 CWP in service
0 1.35001 0.000286 7.565
2020-2021
SBU2 U1 Condenser cleaning 8-March-2021 0.265 0.34336 0.00007823 1.986
2019-2020
Energy conservation by seal air header pressure optimization w.r.to coal flow
0 0.12813 0 0.45
2019-2020
Energy conservation by stopping of Standby Mill Lube Oil Pumps in SBU2 units
0 0.021447 0 0.07
2019-2020
SBU-2 Unit-1 improvement in cooling tower effectiveness by 7% by replacing the existing cross flute PVC CT fills with anti-clogging trickle grid fills in 06 Nos of CT cells
19.79 0 0.0013388 18.08

SUMMARY OF ENERGY SAVING PROJECTS IMPLEMENTED FOR LAST 3 FINANCIAL YEARS
Financial Year
PROJECT Investme
ntRs. Million
Electrical savings (Million KWHr)
Thermal savings(Million
Kcal/MTOE)
Savings(INR
Million)
2019-2020
Replacement of APH baskets and reducing the DP across APH there by reducing power consumption of ID and PA fans
27.5 0.876 0 3.06 *
2019-2020
SBU-1- Reduction of power consumption of 135kWh by switching OFF ESP hopper heater, shaft insulator heaters and rapping motors during reserve shutdown of unit
0 1.137645 0 3.98
2019-2020
SBU-1- Reduction of power consumption of 30Kwh in Instrument air compressor by running in suction throttle mode over Base mode.
0 0.26352 0 0.92
2019-2020
Reduction of Auxiliary power nearly 172 KWh by optimisation of equipment running during the minimum export schedule, optimisation of total air flow with respect to % of Oxygen at APH inlet thereby reduction of power consumption in ID,FD and PA fans
0 1.066195 0 3.73
2019-2020
Reduction of Start-up Auxiliary power from 85MWh to 45MWh for every cold start-up by optimising the equipment’s in service
0 1.44 0 5.04
2019-2020
SBU-2 reserve unit Cold startup oil consumption optimization 0 0 0.0001058 5.59

SUMMARY OF ENERGY SAVING PROJECTS IMPLEMENTED FOR LAST 3 FINANCIAL YEARS
Financial Year
PROJECT Investme
ntRs. Million
Electrical savings (Million KWHr)
Thermal savings(Million
Kcal/MTOE)
Savings(INR
Million)
2018-2019
Optimisation of Auxiliary power consumption in Balance of plant equipments( CHP & APH)
0 7.458935 0 30.35
2018-2019
Energy Saving through overhauling of 300MW Circulating Water Pump-A
0 0.153225 0 0.62
2018-2019 CEP header Pressure Optimization @ Part load(150 MW) 0 1.320967 0 5.38
2018-2019
Part load power consumption optimisation by best operation practices.After detailed study of the operating regime in part load at 150MW, One Boiler Feed water Pump, 1 Circulating Water Pump and 1 Closed cycle Circulating water pump were stopped and kept standby.
0 16.137414 0 65.68
* Payback time is high due to unit not running because of non availability of schedule

INNOVATIVE PROJECT

Utilisation of Renewable Energy sources (Investment made, capacity addition)
• 930 Acres of land procured on lease in the near by villages of Sandur, Ballari district. For 225MW Solar park. Panel Installation work started.
• Land acquisition under progress for 600MW - IPP & 800MW –SECI Wind mill projects in Karnataka.
• JSW Energy has installed 50KW Solar project for support of Mid Day Meal Scheme program at Akshya patra foundation , this is being used for cooking meals under mid day meals program to surrounding villages.
• Bio gas unit –Bio gas unit was commissioned using the canteen waste and the gas generated being used as a supplement to LPG at plant canteen. Reduced LPG consumption by 4hrs daily.
Solar Panels Errection in Progress
Land for Solar ParkLand for Solar Park

14
Environment Management- Ash Utilization
113
103
100
2018-19 2019-20 2020-21
Ash
Uti
lisie
d %
Financial Year
Ash utilisation %
% utilisation greater than 100% because ash taken from pond
69
12
19
FY 20-21 Ash Utilisation in %
Cement Bricks Mine
6912
19
13
FY 18-19 Ash Utilisation in %
Cement Bricks
Mine Road pavements
72
16
113
FY 19-20 Ash Utilisation in %
Cement Bricks
Mine Road pavements

15
Environment Management- Ash Utilization
Particulars UOM 2018-19 2019-20 2020-21
Ash Stock in Plant (yard + pond) Tons 123914 119660 119660Ash Generated Tons 237822 145776 113599
Ash Utilization % 113 103 100
Ash Utilized in manufacturing of cement/concrete – othersimilar products
% 78 72 69
Ash Utilized in Fly Ash Bricks % 11 16 12
Ash Utilized in Mine filling % 11 11 19
Ash Utilized for Roads pavements % 13 3
Ash Utilization in Other Areas – Please mention below %
1. %
2. %
3. %
4. %
5. %
Expenditure on Ash Utilization (annual) INR(Lakhs) 10.97 18.50 86
Ash Handling done through various methods
Ash Handled
(WetMethod)
% 81
Ash Handled (DryMethod)
% 19
Ash Handled (semiwet)
%
Till FY 19-20, ACC was handling the entire ash handling system, and only SBU 1 bottom ash was handled by the Company, whereas FY 20-21 onwards entire ash system is being handled by the Company, hence expenditure not comparable.

16
ENVIRONMENT MANAGEMENT - EMISSIONS
0.96 0.97
0.91
0.85
0.9
0.95
1
2018-19 2019-20 2020-21
Emis
sio
n In
ten
sity
FY
860MW Total CO2 Emissions Per MW of Generation Ton/MW
390 372458
0
100
200
300
400
500
Current SOx Emissions at Full Load*
SOx
mg/
NM
3
FY
130 MW Unit SOx Emission mg/NM3
2018-19 2019-20 2020-21
360 372
501
0
100
200
300
400
500
600
Current NOx Emissions at Full Load*
NO
x m
g/N
M3
FY
130 MW Unit NOx Emission mg/NM3
2018-19 2019-20 2020-21
51
48
44
40
42
44
46
48
50
52
Particulate Matter *
PM
mg/
NM
3
FY
130MW PM mg/NM3
2018-19 2019-20 2020-21
750
648663
550
600
650
700
750
800
Current SOx Emissions at Full Load*
SOx
mg/
NM
3
FY
300MW SOx mg/NM3
2018-19 2019-20 2020-21
446
360
502
0
100
200
300
400
500
600
Current NOx Emissions at Full Load*
NO
x m
g/N
M3
FY
300MW NOx mg/NM3
2018-19 2019-20 2020-21
65
50
60
0
10
20
30
40
50
60
70
Particulate Matter *
mg/
NM
3
FY
300MW PM mg/NM3
2018-19 2019-20 2020-21

17
ENVIRONMENT MANAGEMENT - WATER
0.210.18
0.15
0
0.05
0.1
0.15
0.2
0.25
1
%
FY
Sp. DM water consumption
18-19 19-20 20-21
2.12
2.35
2.186
2
2.1
2.2
2.3
2.4
1
M3
/MW
FY
Sp. Raw water consumption
18-19 19-20 20-21
Weather Plant is Zero Liquid Discharge - YES
Best Practices in Water Management

18
BEST PRACTICES Flexibilization
SBU2 U2 was operated at 70MW

19
BEST PRACTICES
Maintenance and reliability

20
BEST PRACTICES
Maintenance and reliability

21
BEST PRACTICES
Maintenance and reliability

22
BEST PRACTICES
Projects implemented through Kaizens ( Workers and Supervisor level)

23
BEST PRACTICES
Projects implemented through Kaizens ( Workers and Supervisor level)

24
BEST PRACTICES DIGITISATION
This dash board gives the information JSW Energy Ltd Generation along with MTD & YTD
Critical Parameters trend

25
Teamwork, Employee Involvement & Monitoring
1. Daily monitoring system
Is done through DM (Daily Management) board in all department with SIC & dept. Employees. Daily O&M Meeting. HOD Meeting, Quality Assurance Review Meeting (QAR)
2. Review meeting chaired by
Head of the Plant
3. Separate budget for Energy Conservation
In CAPEX Energy conservation budget is included
4. Energy efficiency / awareness training program
Energy Efficiency Training programs conducted by CII, BEE, QSHEEN (ISO)
5. Projects implemented through Kaizens ( Workers and Supervisor level)
Projects list attached in previous slide. (IQM Portal is developed around 250 ideas recorded)
6. % Major Areas of concern in terms of energy efficiency and reliability* Cooling tower Performance Sustenance

ISO CERTIFICATION
FY 20-210.133% investment of energy saving projects on total turnover of the company

LONG TERM VISION ON ENERGY EFFICIENCY
➢ 300KNM3/Hr additional Gas Firing additional boiler Errection. To consume the gas from
18MTPA JSW Steel Plant. & to reduce Pollution & other Environment hazards if the gas
would have been let to atmosphere. To reduce the coal consumption & Pollution issues due
to Flue gas.
➢ 70MW Operation of 300MW plants, when the Solar & Wind Power starts Generating Power.
Wrt bundling Thermal, Solar & Wind Power.
➢ Solar Plant 225MW – Commissioning by March 2022.
➢ 1400MW Wind Mill Project – By FY 2023
➢ Exploring the possibility of PSP – Pumped storage plant

28
learning from CII Energy Award 2020 or any other award program
1. There scope for Energy savings in Electrical Systems Case studies such as :-Isolation of one TFR ‘s, Paralleling of TFR’s to reduce the transformer losses, Using Solar Energy for APC reduction,
2. Awareness related to Energy conservation, Water conservation, digitization measures taken by other Similar Power plants.
Golden Peacock Quality award FY 20-21SEEM Award for Energy
Management FY-20-21

29
learning from CII Energy Award 2020 or any other award program
Certificate of appreciation from Ministry of Finance
Green Maple Diamond Award under Energy Conservation FY 20-21.