Breeding season food limitation drives population decline of
12
Breeding season food limitation drives population decline of the Little Owl Athene noctua in Denmark KASPER THORUP, 1 * PETER SUNDE, 2 LARS B. JACOBSEN 1,3 & CARSTEN RAHBEK 4 1 Center for Macroecology, Evolution and Climate, Zoological Museum, University of Copenhagen, Universitetsparken 15, DK-2100 Copenhagen, Denmark 2 National Environmental Research Institute, Department of Wildlife Ecology and Biodiversity, Aarhus University, Grenaavej 14, DK-8410 Rønde, Denmark 3 Animal Behaviour Group, Department of Biology, University of Copenhagen, Universitetsparken 15, DK-2100 Copenhagen, Denmark 4 Center for Macroecology, Evolution and Climate, Department of Biology, University of Copenhagen, Universitetsparken 15, DK-2100 Copenhagen, Denmark Many farmland bird species have declined markedly in Europe in recent decades because of changes in agricultural practice. The specific causes vary and are poorly known for many species. The Little Owl, which feeds extensively on large invertebrates and is strongly associated with the agricultural landscape, has declined over most of north- western Europe, including Denmark. We investigated the likely reasons for the popula- tion decline in Denmark by identifying patterns of local extinction (scale, 5 · 5 km 2 ) and estimating demographic parameters affecting local survival, focusing on changes over time and their relationship to habitat characteristics. The distribution of the Little Owl in Denmark contracted considerably between 1972–74 and 1993–96. The extent of con- traction varied across the country, and the only habitat correlate was that local disappear- ance was associated with smaller amounts of agricultural land. Analyses of ring recovery data suggested a constant annual adult survival rate of 61% from 1920 to 2002, which is similar to estimates from countries with stable populations. First-year annual survival rates were much lower than values previously reported. From the 1970s into the 21st century, the mean number of fledglings declined from around 3 to < 2 young per terri- tory, but the decline in clutch size was considerably less. Reproductive parameters were higher closer to habitat types known to be important foraging habitats for Little Owls, and were also positively correlated with the amount of seasonally changing land cover (mostly farmland) within a 1-km radius around nests as well as temperatures before and during the breeding season. Experimental food supplementation to breeding pairs increased the proportion of eggs that resulted in fledged young from 27 to 79%, support- ing the hypothesis that the main proximate reason underlying the ongoing population decline is reduced productivity induced by energetic constraints after egg-laying. Conser- vation efforts should target enhancement of food availability during the breeding season. Other farmland species dependent on large invertebrates are likely to share the problems that Little Owls face in modern agricultural landscapes. Keywords: agriculture, conservation, experiment, food supplementation, habitat association, invertebrates, reproductive output, survival. Many bird species associated with farmland have suffered severe declines in Europe, often attributed to landscape changes following the development of modern agricultural techniques (Donald et al. 2001, Tucker & Heath 2004). These declines are not associated with any single factor, and a variety of causes have been described for different species, *Corresponding author. Email: [email protected] ª 2010 The Authors Journal compilation ª 2010 British Ornithologists’ Union Ibis (2010), doi: 10.1111/j.1474-919X.2010.01046.x
Transcript of Breeding season food limitation drives population decline of

Breeding season food limitation drives populationdecline of the Little Owl Athene noctua in Denmark
KASPER THORUP,1* PETER SUNDE,2 LARS B. JACOBSEN1,3 & CARSTEN RAHBEK4
1Center for Macroecology, Evolution and Climate, Zoological Museum, University of Copenhagen,
Universitetsparken 15, DK-2100 Copenhagen, Denmark2National Environmental Research Institute, Department of Wildlife Ecology and Biodiversity, Aarhus University,
Grenaavej 14, DK-8410 Rønde, Denmark3Animal Behaviour Group, Department of Biology, University of Copenhagen, Universitetsparken 15,
DK-2100 Copenhagen, Denmark4Center for Macroecology, Evolution and Climate, Department of Biology, University of Copenhagen,
Universitetsparken 15, DK-2100 Copenhagen, Denmark
Many farmland bird species have declined markedly in Europe in recent decades becauseof changes in agricultural practice. The specific causes vary and are poorly known formany species. The Little Owl, which feeds extensively on large invertebrates andis strongly associated with the agricultural landscape, has declined over most of north-western Europe, including Denmark. We investigated the likely reasons for the popula-tion decline in Denmark by identifying patterns of local extinction (scale, 5 · 5 km2) andestimating demographic parameters affecting local survival, focusing on changes overtime and their relationship to habitat characteristics. The distribution of the Little Owlin Denmark contracted considerably between 1972–74 and 1993–96. The extent of con-traction varied across the country, and the only habitat correlate was that local disappear-ance was associated with smaller amounts of agricultural land. Analyses of ring recoverydata suggested a constant annual adult survival rate of 61% from 1920 to 2002, which issimilar to estimates from countries with stable populations. First-year annual survivalrates were much lower than values previously reported. From the 1970s into the 21stcentury, the mean number of fledglings declined from around 3 to < 2 young per terri-tory, but the decline in clutch size was considerably less. Reproductive parameters werehigher closer to habitat types known to be important foraging habitats for Little Owls,and were also positively correlated with the amount of seasonally changing land cover(mostly farmland) within a 1-km radius around nests as well as temperatures before andduring the breeding season. Experimental food supplementation to breeding pairsincreased the proportion of eggs that resulted in fledged young from 27 to 79%, support-ing the hypothesis that the main proximate reason underlying the ongoing populationdecline is reduced productivity induced by energetic constraints after egg-laying. Conser-vation efforts should target enhancement of food availability during the breeding season.Other farmland species dependent on large invertebrates are likely to share the problemsthat Little Owls face in modern agricultural landscapes.
Keywords: agriculture, conservation, experiment, food supplementation, habitat association,invertebrates, reproductive output, survival.
Many bird species associated with farmland havesuffered severe declines in Europe, often attributed
to landscape changes following the development ofmodern agricultural techniques (Donald et al.2001, Tucker & Heath 2004). These declines arenot associated with any single factor, and a varietyof causes have been described for different species,
*Corresponding author.Email: [email protected]
ª 2010 The Authors
Journal compilation ª 2010 British Ornithologists’ Union
Ibis (2010), doi: 10.1111/j.1474-919X.2010.01046.x

largely depending on differences in biology(Newton 2004). However, where documentationof direct effects of agricultural intensification incausing declines is lacking, this prevents effectivemanagement.
The Little Owl Athene noctua declined consider-ably in northwestern Europe in the latter halfof the 20th century (Tucker & Heath 2004,Nieuwenhuyse et al. 2008). In this region,the species is closely tied to human-modified agri-cultural landscapes, both for breeding and forforaging. In Denmark, on the northwestern limitof the species’ distribution, Little Owls have beendeclining at least since the 1970s, when the popu-lation probably numbered 1000 pairs at a mini-mum. Currently, one isolated population ofaround 100 pairs persists in Himmerland, in north-west Denmark, with only a few scattered pairsoutside this area. This decline involves both con-traction of the range and reduced density, even inthe remaining core area (Jacobsen 2006).
The diet of the Little Owl is varied and consistsmainly of small rodents, earthworms and insects(Nieuwenhuyse et al. 2008). The species is seden-tary, with short dispersal distances and very littleexchange between populations at a regional scale,although metapopulation dynamics are likely to beimportant at the local (< 25 km) population level(Schaub et al. 2006). Thus, recent changes in theDanish Little Owl population are likely to havebeen driven by changes in the production of youngor in survival.
Here, our aim was to identify the causes of thedecline of the Little Owl population in Denmark.We combined environmental and demographicinformation to: (1) investigate the overall habitatcharacteristics associated with changes in localpopulations; (2) examine the potential demo-graphic drivers of population trends; and (3) evalu-ate the dependence of such demographic traits onenvironmental variation. First, we used two sepa-rate censuses of Danish birds (1972–74 and 1993–96) for analysis of disappearance of Little Owls atthe scale of 5 · 5 km2 between the two censusperiods and related these findings to habitat fac-tors, whilst taking into account spatial autocorrela-tion. Secondly, we estimated survival from ringingdata and breeding output from surveyed nests,including temporal trends, and also tested theeffects of a series of habitat and climate variableson breeding output. Finally, we tested the hypoth-esis of food limitation on production of young by
means of a supplementary feeding experiment onbreeding pairs.
METHODS
Spatial extinction pattern in Denmark,1970s to 1990s
We used data from the two Danish breeding birdcensuses in 1972–74 (Dybbro 1976) and 1993–96(Grell 1998) to model changes in the breeding dis-tribution of Little Owls in Denmark between thesetwo periods. In both censuses, the occurrence ofbreeding (or presumed breeding) Little Owls wasrecorded in 5 · 5-km2 squares. To assess whichfactors influenced the disappearance of the species,we categorized squares according to whether thespecies occurred in both censuses (61 squares) oronly in the first (394). We did not investigate thesmaller number of appearances of the species (96squares in which the species was recorded only inthe second census) because ‘appearance’ events aremuch more likely to arise simply from being over-looked in the first census rather than being real‘colonizations’. This is due in part to the slightlypoorer coverage in the first census (Grell 1998)but more importantly to the fact that the specieshas become much rarer. Furthermore, we lackedthe temporal resolution of the habitat datarequired to simultaneously link habitat and occu-pancy over time.
The spatial structure of the disappearance ofLittle Owls was investigated using a spatial auto-correlogram (based on Moran’s I), which measuresautocorrelation between squares as a function ofthe distance between them. We modelled theeffects of habitat categories as the proportions ofhabitat types covering each square, using the habi-tat data from the Danish Area Information Sys-tem (AIS) (Nielsen et al. 2000), in which Danishland cover is categorized into 12 standardizedhabitat categories based on satellite images of25-m resolution, obtained during 1996–2000 (amuch shorter period than that covered in ouranalysis). Annual habitat coverage maps were notavailable.
We modelled the effects on disappearance ofthe four habitat variables (seasonally changing landcover, grass, marsh and woodland) for which aseparate univariate logistic regression model of dis-appearance from a square indicated a possibleeffect (P < 0.10). Spatial autocorrelation among
ª 2010 The Authors
Journal compilation ª 2010 British Ornithologists’ Union
2 K. Thorup et al.

squares was taken into account by estimating howmuch the disappearance in one square wasreflected in the disappearance in surroundingsquares. We used the commonly employedautocovariate model (Dormann et al. 2007; alsocalled the lagged-response autoregressive model,Rangel et al. 2006) in which the autoregressiveresponse occurs only in the response variable.Several other spatial models are available, but it isnot clear in which cases one model should bepreferred over another (e.g. Dormann et al. 2007,Bini et al. 2009). However, for our dataset thelagged-response autoregressive model had consid-erably lower Akaike’s information criterion (AIC)values than other, more complex spatial models(lagged predictor, simultaneous and conditionalautoregression models). All spatial analyses wereperformed using SAM (spatial analysis in macroe-cology) vers. 2.0 (Rangel et al. 2006).
Survival, 1920–2002
We used ringing data for 491 pulli and 87 adultsringed throughout the breeding area in Denmarkduring 1920–2002; of these, 34 pulli and 16 adultswere found dead and reported before 2003.Reports of birds that were recaptured alive werenot included in the analyses.
Annual survival rates were estimated in a cap-ture–mark–recapture framework using the recov-ery data type in program MARK 4.1 (White &Burnham 1999). The capture–mark–recaptureframework allows for separate estimation of sur-vival rate S and recovery probability r and is wellsuited for evaluating different models based on, forexample, age (Lebreton et al. 1992). Each individ-ual was considered ringed on 15 June of the yearof capture and the encounter history for this analy-sis included 83 yearly ‘capture’ occasions. We alsoincluded linear trends of survival rates and recov-ery probabilities. Furthermore, average tempera-ture in the coldest period January–February from aDanish weather station in North Jutland (Cappe-len et al. 2007) was included as an additionalcovariate to model a possible effect of winterseverity on survival. Because the model with age-dependent survival and recovery probabilities{S(age) r(age)} fitted the data well (P = 0.62,Goodness-of-fit bootstrap test; Cooch & White2007) we did not adjust our AIC values for over-dispersion but only for small sample sizes, i.e. weused Akaike’s information criterion corrected for
small sample size (AICc), not the small sampleversion of the quasi-AIC (QAICc).
Reproductive success, 1975–2006
Survey of the area
Nests of 256 Little Owl territories throughoutJutland, but primarily from Himmerland, weresurveyed during 1975–2006 by a small group ofvolunteer observers (Jacobsen 2006), for a total of943 breeding attempts. In a 100-km2 census areain Himmerland in northern Jutland that includesone of the few remaining strongholds for the LittleOwl in Denmark, all suitable breeding localitieswere visited and playback was conducted inMarch–April. Other areas were not surveyed sys-tematically for territories; instead, information wascollected based on known pairs combined withplayback in some suitable areas and advertising inlocal media. In many cases, clutch size or numberof nestlings could not be confirmed. The numberof nestlings was recorded as the number of youngat age of ringing (12–25 days after hatching).Numbers of fledglings were recorded as the num-ber of young seen or heard around the nest soonafter fledging.
Clutch sizes were recorded for 71 breedingattempts, the number of nestlings for 126 and thenumber of fledglings for 350. Trends over timewere investigated using linear regression analysis.The resulting error distributions were assessedvisually and no obvious deviations from normalwere found. Breeding attempts not resulting infledged young occurred only in later years, necessi-tating control for a possible bias in later yearstowards increasing observer awareness of theimportance of also recording zero fledglings. Toaddress this potential bias, we tested for changesover time in the production of fledglings both withand without including counts of zero fledglings inthe data.
Habitat and breeding performance analysis
To analyse the effects of habitat on breeding perfor-mance, we again used the AIS data (Nielsen et al.2000). For each Little Owl nesting site, we mea-sured the distance to each land-use class using theANIMAL MOVEMENT extension (vers. 2.04, Hooge &Eichenlaub 1997) of ARCVIEW (vers. 3.2). We alsocalculated the areas of each land-use class within a1-km radius from the nest, using in-built functionsin ARCVIEW (vers. 3.2). Because Little Owls prefer
ª 2010 The Authors
Journal compilation ª 2010 British Ornithologists’ Union
Food limitation in Little Owls 3

to forage in open landscapes with short vegetation(Nieuwenhuyse et al. 2008; our unpubl. data) wemerged in a single category called ‘Little Owl habi-tat’ the polygons classified in the AIS as grazed area,grassland and meadow. Seasonally changing landcover was not included in this category because inthe AIS it is characterized by intensive arable agri-culture with tall crops that are not suitable foraginghabitat for nesting Little Owls. There was a strongcorrelation between some of the variables, espe-cially between the distance to and the area of a par-ticular habitat. None of the measures of Little Owlwhether habitat had correlation coefficients largerthan 0.5 with other habitat variables. Several stud-ies have investigated occupancy as a function ofhabitat parameters in Little Owls (e.g. Nie-uwenhuyse et al. 2001, Martínez & Zuberogoitia2004, Cornulier & Bretagnolle 2006, Zabala et al.2006). Overall, these reports show that habitatassociations are scale-dependent. However, here weinvestigate whether habitat effects of production ofyoung and effects at different scales may act in com-bination. We use a somewhat larger home-rangescale compared with Martínez and Zuberogoitia(2004) (1 km vs. 309 m radius around nests), bothto allow for different scales and because the LittleOwls in Denmark have larger home-ranges (Sundeet al. 2009). Furthermore, the studies exhibit con-siderable regional variation. Thus, we included boththe distance to each land use available in the AIS aswell as the area of the habitat, as did Martínez andZuberogoitia (2004). We could not include small-scale variables such as linear structures (Martínez &Zuberogoitia 2004), tree lines, edges (Nie-uwenhuyse & Bekaert 2001, Nieuwenhuyse et al.2001) or poles (Nieuwenhuyse et al. 2008) becausethe AIS data were too coarse.
Analysis of climate
To investigate the influence of climate on LittleOwl breeding success, we used monthly weatherdata from the Vestervig meteorological station innorthwest Denmark (Cappelen et al. 2007). Thedataset included average monthly temperaturesand precipitation as well as the number of dayswith local snow cover estimated to be above 50%.Most of the weather variables were significantlyintercorrelated.
Statistical analysis
Production of young was modelled in SAS 9.1 (SASInstitute Inc., Cary, NC, USA), with Poisson-
distributed errors. The numbers of eggs (71 LittleOwl breeding attempts), nestlings (126 breedingattempts) and fledglings (350 breeding attempts)per pair were modelled as functions of the habitat(distance to and area around nest) and yearly cli-mate data, considering habitat zones of a 1-kmradius as well as distance to specific habitat types.Year (1975–2006) was included as a covariate inthe models to investigate long-term trends in pro-duction. Models were identified using backwardelimination of parameters from full models withthe GENMOD (Poisson-distributed errors and loglink) procedure. To control for possible pseudo-replication arising from use of data from more than1 year from each nest-site being used, we testedthe effect of adding the nest-site ID as a randomfactor (using the GLIMMIX procedure) to the modelsidentified using backward elimination. The addi-tional variance component for the mixed modelwith nest-site ID as a random variable was not sig-nificant in any of the models and was omitted fromanalyses. For the models identified, we calculatedparameter estimates from normal linear regressionto allow easy interpretation of the estimatedeffects.
In total, the following fixed, explanatory vari-ables were entered into the models: Year, Distanceto urban areas, Distance to road, Distance to LittleOwl habitat, Seasonally changing land cover,Forest area, City area, Little Owl habitat area,December–February temperature, March–Apriltemperature, May temperature, June temperature,March–April precipitation, May precipitation, Juneprecipitation, and Days with snow cover thepreceding winter.
Analysis of food as a limiting factor
To assess whether food was a limiting factor foroffspring survival, we supplied two pairs duringthe breeding season 2005 and three different pairsduring 2006 with supplemental food (one to threedead domestic mice or newly hatched chickens perday). Food was supplied daily from hatching untilthe young fledged. For the five food-supplementednests and 23 control nests from the same 2 years,we assessed the success rate of raising young as theproportion of eggs that survived until fledging. Sur-vival rates of eggs until fledging were estimated asbinomial outcomes (nfledglings ⁄ neggs per nest) usinga generalized linear model with a logit link andbinomial error term (the GENMOD procedure in SAS
9.1). Estimates were adjusted for strong over-
ª 2010 The Authors
Journal compilation ª 2010 British Ornithologists’ Union
4 K. Thorup et al.

dispersion (Deviance ⁄ df ratio = 2.87 and 2.28,respectively with and without year effect included)arising from within-clutch variation using theDSCALE option in SAS. The effect of experimentaltreatment and year (2005 or 2006) was tested witha likelihood ratio test.
Parameterization of the populationmodel
We parameterized a simple population model(Williams et al. 2002) with two age classes (first-year individuals and older, adult birds) correspond-ing to the estimated annual survival rates as thefollowing Leslie matrix:
N0 t þ 1ð ÞN1 t þ 1ð Þ
� �¼
S0bX S1bX
S0 S1
� �N0ðtÞN1ðtÞ
� �
where Ni is the total number of Owls in ageclass i, Si is the annual survival of Owls in ageclass i, b is the number of fledglings producedper female, X is the proportion of females in thepopulation times the proportion of adults breed-ing, and t is time.
Production of young was estimated as the aver-age brood size at ringing (typically chicks about20 days old; range 12–25) for 67 clutches ringed in1982–2006 (L.B. Jacobsen unpubl. data). The fewcases of pairs laying eggs but failing to raise young
to this age were counted as non-breeders. The pro-portion of individuals breeding was estimated usingdata collected during 1994–2006 from an inten-sively surveyed area in Himmerland (Jacobsen2006) by summing over all years the number ofbirds recorded breeding and dividing this value bythe total number of birds recorded over the years(i.e. including unmated individuals or pairs thatdid not lay eggs). Little Owls are generally monog-amous, breed once per season, start breeding intheir first year, and rarely lay replacement clutches(Nieuwenhuyse et al. 2008). We set the proportionof females in the population at 0.5 and number ofnesting attempts to one per year.
RESULTS
Spatial extinction pattern
The number of 25-km2 squares with Little Owlsrecorded during the two Danish breeding bird cen-suses declined from 457 in 1972–74 (Dybbro1976) to 157 in 1993–96 (Grell 1998). In 396squares (87%), Little Owls disappeared betweenthe first and the second censuses.
There was a strong spatial component in thepattern of disappearance, as relatively more squareslost Little Owls in the southeastern part of therange (Figs 1 and 2). After the spatial componentin autoregressive models was accounted for,the seasonally changing land cover was the only
(a) (b) (c)
Figure 1. (a) Spatial structure of disappearance from 1972–1974 to 1993–1996 of Little Owls from 5 · 5-km2 squares in Denmark.
Squares in which Owls were observed in both periods are filled, whereas open symbols indicate squares in which Owls were recorded
in the first period and not in the second. (b) Amount of seasonally changing land cover within each square indicated as shades of grey
ranging from large (59–78%; black) to small (< 20%; lightest grey). (c) Amount of deciduous forest indicated as shades of grey
ranging from large (10–19%; black) to small (0–2%; lightest grey).
ª 2010 The Authors
Journal compilation ª 2010 British Ornithologists’ Union
Food limitation in Little Owls 5

landscape parameter that correlated with disap-pearance. Squares with high seasonally changingland cover were less likely to lose Little Owlsbetween the censuses (Table 1). However, season-ally changing land cover explained only a smallamount of variation (1%) compared with the 15%explained by spatial pattern alone (Table 1).
Survival
Annual survival rates and recovery probabilitiesdiffered between juveniles and adults in the bestsupported model (Table 2). The estimated annualsurvival rates of juveniles and adults were 0.15(95% confidence interval 0.07–0.28) and 0.61 (CI
0.600
0.400
0.200
0.000
–0.200
–0.400
–0.600
Mo
ran
’s I
0 50 100 150 200 250 300 350
Distance class (km)
Figure 2. Spatial structure of disappearance of Little Owls from 5 · 5-km2 squares in Denmark as indicated by the amount of autocor-
relation (Moran’s I) between squares that are close to each other compared with squares that are far apart. Squares = Moran’s I,
Filled = P < 0.05, Open = P > 0.05. Maximum Moran’s I is indicated for each distance class. Squares that are closer to each other
are positively correlated and distant squares are negatively correlated, as is typical of spatial autocorrelation.
Table 1. Effect of the proportion of arable land, grass, marsh and woodland on the disappearance of Little Owls from 5 · 5-km2
squares (n = 455) modelled as ordinary logistic regression and autoregressive models taking spatial autocorrelation among squares
into account. All-subsets model selection. AICc for each model type for models with DAICc < 2 are shown. For best models,
parameter estimates are given for the probability of disappearance (logit-transformed). Thus, a positive parameter estimate indicates
that the parameter in question is associated with an increased likelihood of loss of occupancy. All models included an intercept.
Model Variable
Parameter
estimate se Wald v2 P AICc DAICc
Logistic regression model
{Grass, marsh, woodland} 331.7 0
Seasonally changing
land cover
)0.027 0.008 8.55 0.0035
Marsh 0.24 0.16 2.23 0.14
Woodland 0.37 0.10 13.17 0.0003
{Seasonally changing land cover, grass,
marsh, woodland}
331.9 0.2
{Marsh, woodland} 332.4 1.3
Model Variable Coeff. se R2 t P AICc DAICc
Pure autoregressive model
0.386 0.721 0.151 )1048.0 0
Autoregressive lagged response model
{Seasonally changing land cover} )1049.3 0
Seasonally changing
land cover
)0.005 0.002 0.009 )2.093 0.037
{Seasonally changing land cover, woodland} )1048.1 1.2
{Marsh, woodland} )1047.5 1.8
{Grass, woodland} )1047.3 2.0
ª 2010 The Authors
Journal compilation ª 2010 British Ornithologists’ Union
6 K. Thorup et al.

0.49–0.72), respectively. The associated recoveryprobabilities were 0.05 (CI 0.03–0.08) and 0.19(CI 0.12–0.28), respectively. Models with a slightnegative trend in juvenile survival estimate (from0.18 to 0.13 over 83 years) or slight temporaltrend in recovery probability were only weaklysupported (DAICc = 1.87 and 1.92, respectively;Table 2). The best model did not include anyeffect of winter temperatures on survival(Table 2).
Reproductive success
All reproductive parameters declined from the1970s to 2006 (Fig. 3). This was the case regard-less of whether zero-counts nesting attempts wereincluded in the analyses. Only the trend for fledgedyoung was significant, either with (slope = )0.05,P < 0.001) or without (slope = )0.03, P < 0.001)inclusion of counts of zero fledglings. Each pairraised on average more than three young to
Table 2. Models of annual survival of ringed Little Owls. The survival rates S and recovery probabilities r estimated in each model are
indicated in brackets. (age): separate estimates for first-year birds and older; (temp): winter temperature included as a covariate;
(trend): linear trend included as covariate; and (.): constant over time. For the best model {S(age) r(age)}, this indicates separate first-
year and adult annual survival rates and recovery probabilities. Model selection is based on AIC. #Par, number of parameters.
Model AICc DAICc AICc weight Model likelihood #Par Deviance
{S (age) r (age)} 478.8 0.00 0.508 1.00 4 198.87
{S (age temp) r (age)} 480.6 1.87 0.152 0.39 5 198.71
{S (age) r (age trend)} 480.7 1.92 0.195 0.38 5 198.75
{S (age trend) r (age)} 480.8 2.01 0.186 0.37 5 198.85
{S (age trend temp) r (age)} 482.7 3.88 0.056 0.14 6 198.68
{S (age trend) r (age trend)} 482.7 3.95 0.071 0.14 6 198.74
{S (age trend trend*age) r (age trend)} 484.6 5.87 0.027 0.05 7 198.61
{S (age) r (.)} 486.9 8.12 0.009 0.02 3 209.02
{S (.) r (.)} 489.2 10.42 0.003 0.01 2 213.34
{S (.) r (age)} 491.1 12.37 0.001 0.00 3 213.27
4
5
Eggs
0
1
2
3
6
7
8
9
1975 1980 1985 1990 1995 2000 2005 2010
3
0
1
2
4
5
6
7
1975 1980 1985 1990 1995 2000 2005 2010
Nestlings
0
1
2
3
4
5
6
7
8
1975 1980 1985 1990 1995 2000 2005 2010
Fledglings
(a) (b)
(c)
Figure 3. Production of eggs, nestlings and fledged young produced per breeding pair of Little Owls each year in the period 1975–
2006. Thin lines indicate a non-significant trend over time. The thick lines for fledged young indicate a significant trend, either with
(solid line) or without (dashed line) inclusion of counts of zero fledglings. Trend lines are not corrected for the influence of habitat and
climate variables.
ª 2010 The Authors
Journal compilation ª 2010 British Ornithologists’ Union
Food limitation in Little Owls 7
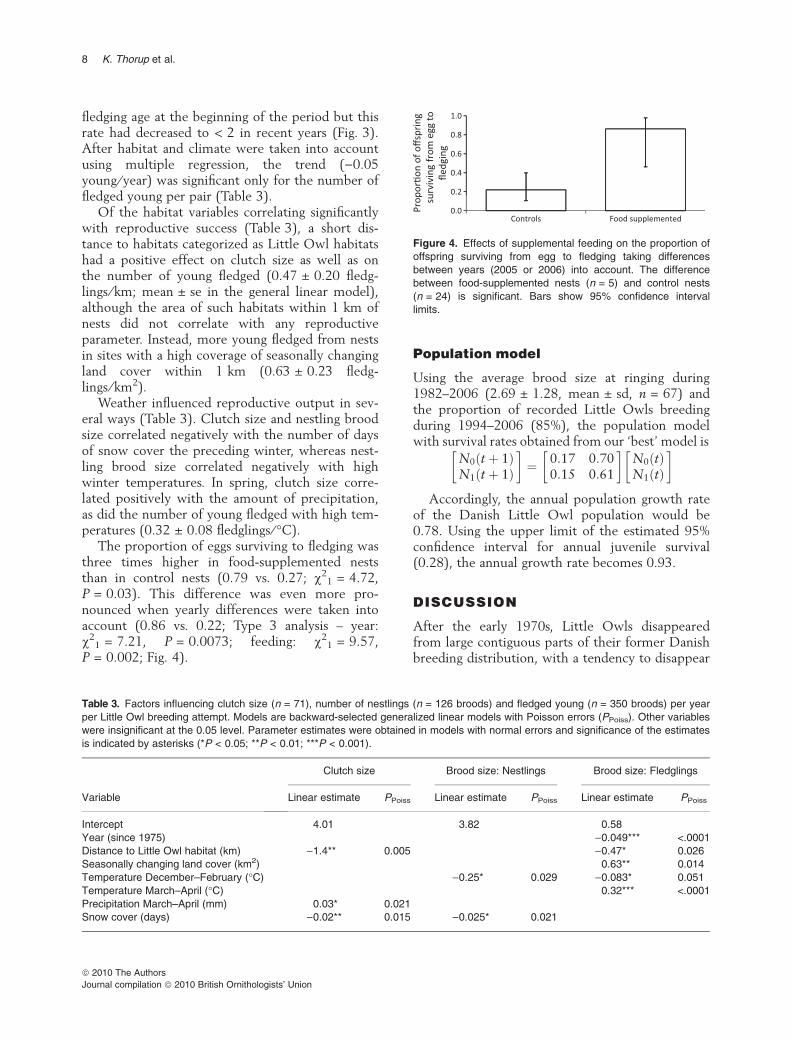
fledging age at the beginning of the period but thisrate had decreased to < 2 in recent years (Fig. 3).After habitat and climate were taken into accountusing multiple regression, the trend ()0.05young ⁄ year) was significant only for the number offledged young per pair (Table 3).
Of the habitat variables correlating significantlywith reproductive success (Table 3), a short dis-tance to habitats categorized as Little Owl habitatshad a positive effect on clutch size as well as onthe number of young fledged (0.47 ± 0.20 fledg-lings ⁄ km; mean ± se in the general linear model),although the area of such habitats within 1 km ofnests did not correlate with any reproductiveparameter. Instead, more young fledged from nestsin sites with a high coverage of seasonally changingland cover within 1 km (0.63 ± 0.23 fledg-lings ⁄ km2).
Weather influenced reproductive output in sev-eral ways (Table 3). Clutch size and nestling broodsize correlated negatively with the number of daysof snow cover the preceding winter, whereas nest-ling brood size correlated negatively with highwinter temperatures. In spring, clutch size corre-lated positively with the amount of precipitation,as did the number of young fledged with high tem-peratures (0.32 ± 0.08 fledglings ⁄ �C).
The proportion of eggs surviving to fledging wasthree times higher in food-supplemented neststhan in control nests (0.79 vs. 0.27; v2
1 = 4.72,P = 0.03). This difference was even more pro-nounced when yearly differences were taken intoaccount (0.86 vs. 0.22; Type 3 analysis – year:v2
1 = 7.21, P = 0.0073; feeding: v21 = 9.57,
P = 0.002; Fig. 4).
Population model
Using the average brood size at ringing during1982–2006 (2.69 ± 1.28, mean ± sd, n = 67) andthe proportion of recorded Little Owls breedingduring 1994–2006 (85%), the population modelwith survival rates obtained from our ‘best’ model is
N0 t þ 1ð ÞN1 t þ 1ð Þ
� �¼ 0:17 0:70
0:15 0:61
� �N0ðtÞN1ðtÞ
� �
Accordingly, the annual population growth rateof the Danish Little Owl population would be0.78. Using the upper limit of the estimated 95%confidence interval for annual juvenile survival(0.28), the annual growth rate becomes 0.93.
DISCUSSION
After the early 1970s, Little Owls disappearedfrom large contiguous parts of their former Danishbreeding distribution, with a tendency to disappear
Table 3. Factors influencing clutch size (n = 71), number of nestlings (n = 126 broods) and fledged young (n = 350 broods) per year
per Little Owl breeding attempt. Models are backward-selected generalized linear models with Poisson errors (PPoiss). Other variables
were insignificant at the 0.05 level. Parameter estimates were obtained in models with normal errors and significance of the estimates
is indicated by asterisks (*P < 0.05; **P < 0.01; ***P < 0.001).
Variable
Clutch size Brood size: Nestlings Brood size: Fledglings
Linear estimate PPoiss Linear estimate PPoiss Linear estimate PPoiss
Intercept 4.01 3.82 0.58
Year (since 1975) )0.049*** <.0001
Distance to Little Owl habitat (km) )1.4** 0.005 )0.47* 0.026
Seasonally changing land cover (km2) 0.63** 0.014
Temperature December–February (�C) )0.25* 0.029 )0.083* 0.051
Temperature March–April (�C) 0.32*** <.0001
Precipitation March–April (mm) 0.03* 0.021
Snow cover (days) )0.02** 0.015 )0.025* 0.021
Figure 4. Effects of supplemental feeding on the proportion of
offspring surviving from egg to fledging taking differences
between years (2005 or 2006) into account. The difference
between food-supplemented nests (n = 5) and control nests
(n = 24) is significant. Bars show 95% confidence interval
limits.
ª 2010 The Authors
Journal compilation ª 2010 British Ornithologists’ Union
8 K. Thorup et al.

from areas with less agriculture (seasonally chang-ing land cover). Our estimates of survival did notindicate decreases over time, but the breedingoutput seemed to have decreased by more thanone-third. Production of young was affected bydistance to grassy habitats, proportion of seasonallychanging land cover, and weather before and dur-ing the breeding season, and providing supplemen-tal food during feeding had a positive effect. Thesensitivity of reproductive parameters to landscapefeatures and the positive response to experimentalfood supplementation after laying indicate thatfood access during the breeding season plays animportant role for reproductive output and thuspopulation dynamics.
Spatial components and habitat effectsat different scales
There was a clear tendency for synchrony in localextinction patterns over a range of up to 50 km.Little Owls seem to depend on short-scaledispersal (Schaub et al. 2006), and dispersal dis-tances are generally small (Bønløkke et al. 2006,Fuchs & Laar 2008). The strong spatial componentwith little dependence on environmental factors inthe disappearance of Little Owls may result from adecrease in the pool of potential immigrants.Another factor resulting in spatial dependence ofdisappearance may be a second-order process, suchas attraction or the social system. We cannot ruleout that the spatial pattern observed here is theresult of a lack of suitable habitat descriptors rele-vant for Little Owls in our study. On a smallerscale than the one considered here, Cornulier andBretagnolle (2006) found no clustering of territo-ries when they considered a habitat availabilitysimilar to the one used here. The difference maybe attributable to the smaller scale in their studyor to the evaluation of a population in steepdecline in our case. Overall, the factors affectingreproductive output in the current work are quitesimilar to the variables generally found to affectLittle Owl occurrence at the scale of the homerange (e.g. Nieuwenhuyse et al. 2001, Martínez &Zuberogoitia 2004, Zabala et al. 2006).
Demographic rates and predictedpopulation dynamics
We estimated annual survival rates of Danish LittleOwls during 1920–2002 as 0.15 for juveniles and
0.61 for adults with no pronounced changes overtime. Estimated recovery probabilities were lowerfor juvenile than for adult birds. This partly unex-pected result is most likely caused by the fact thatDanish ringing schemes generally discouragedrecording of birds that had not moved away fromthe ringing site or that were recovered less than30 days after ringing (Bønløkke et al. 2006).
Our estimated adult annual survival rate com-pares well with estimates reported in the literature(Exo & Hennes 1980, Schaub et al. 2006). Ourjuvenile annual survival rate of 0.15, however, ismuch lower than the 0.30 reported by Exo andHennes (1980), although these authors did not takeinto account potential differences between adultand juvenile recovery ⁄ recapture probability. Otherstudies have reported estimates similar to ours butthose studies did not include emigration (e.g. Lettyet al. 2001, Schaub et al. 2006) and thus probablyunderestimated survival. Hence, it is likely thatjuvenile annual survival rate in Denmark is lowerthan that found in most of Central Europe.
The production of young declined considerablyover time. The number of eggs and nestlingsshowed less decrease over time than the numberof fledglings, indicating that the factors causing thedecline act after the early nesting stages. Addition-ally, winter weather had a stronger effect on thenumber of eggs and nestlings than on fledglingnumbers; temperature and precipitation had agreater effect in the nesting period on egg andnestling number, again emphasizing the sensitivityof post-laying losses.
To balance the estimated mortality alone in our‘best’ model, each pair would have to produce 5.2nestlings that reach the age of ringing, and all sur-viving birds would have to enter the breeding pop-ulation (i.e. no floaters). Even though there wereapparently very few floaters in the population after2004, given that many widowed territories did notbecome re-occupied (Sunde et al. 2009), it doesnot seem realistic for production to balance mor-tality. However, the annual growth rate of 0.78 isprobably unrealistically low. This low rate primar-ily results from our surprisingly low estimate ofjuvenile survival, which is, however, also quiteuncertain. An annual growth rate of 0.93 (basedon the upper 95% confidence interval limit of juve-nile survival) is probably closer to a realistic popu-lation model for the Danish Little Owls. Assuminga growth rate of 0.93 results in an 89% decreaseover 30 years, which roughly corresponds to the
ª 2010 The Authors
Journal compilation ª 2010 British Ornithologists’ Union
Food limitation in Little Owls 9
presumed decline from in the order of 1000 pairsin the 1970s to the current estimated 100 pairs,although early population size estimates are veryuncertain.
Food limitation as the direct cause ofthe decline
Our results suggest that food limitation during thebreeding period may be the main reason for thedeclining numbers of Little Owls in Denmark.Little Owl parents are very active and probablyenergetically stressed during the post-hatchingperiod (Exo 1988, Holsegård-Rasmussen et al.2009). The decrease in production of young withincreasing distance to preferred habitat is probablya direct result of adults only being able to bring asmaller amount of food to the nest if they have tofly further to forage.
The results from the food supplementationexperiment are based on a very small sample sizeand should be treated with caution, and other fac-tors such as predation could also influence breed-ing output. Nevertheless, the direct, positive effectof supplemental feeding on the number of fledgingyoung supports the limiting role of food supply.Positive effects of experimental food supplementa-tion on reproductive success through improvednestling survival have been shown in a several rap-tor species (Amar & Redpath 2002, Brommer et al.2004, Gonzalez et al. 2006, Byholm & Kekkonen2008), although the mechanism appears to differamong species, including an indirect, delayedresponse in a large raptor, the Ural Owl Strixuralensis (Brommer et al. 2004).
Ultimate reasons for the populationdecline: habitat quality?
A decline in productivity may well have startedlong before our recording of productivity began.The correlation between production of young andgrassy habitats indicates that the decline may berelated to the large-scale landscape changes associ-ated with changes in agricultural practices. Such adependence on agricultural practices has also beenfound in another small raptor, the insectivorousScops Owls Otus scops, in the Alps (Marchesi &Sergio 2005, Sergio & Marchesi 2009) and Spain(Martínez et al. 2007) and suggests that agricul-tural changes are a general cause for recent declinesin small, European owls. The amount of grassy
habitats on which the owls seem to depend forsuccessful reproduction has decreased in the pastand is likely to be further reduced in the nearfuture (Ellemann et al. 2001), as for example whengrazed areas are converted to cropland. Our studydocuments a link between breeding performanceand habitat, and indicates that this link is mostlikely caused by food limitation when suitable hab-itat is not readily available. A similar situation wasfound in Hen Harriers Circus cyaneus (Amar et al.2003, 2008) that fed primarily on small verte-brates. This pattern of the interaction betweenfood limitation and suitable habitat causingreduced breeding performance in an intensifiedagricultural landscape is probably common amonganimals dependent on small vertebrates or largerinvertebrates.
In correlation with agricultural intensification,including habitat loss and change, and the increaseduse of pesticides and fertilizers, there has been adramatic decline in the abundance and biomass oflarger insects (Benton et al. 2002). The DanishLittle Owl population apparently feeds relativelymore on earthworms than do other European pop-ulations (Ottesen & Svenné 2008). This could bedue to reduced insect abundance, although thereduction in insect abundance is not as extreme inDenmark as in, for example, the UK (Fox 2004).
Conservation implications
With an estimated population size of about 100pairs, and an estimated annual growth rate of 0.93,the Danish population is likely to fall to a criticalsize of fewer than 25 pairs within 20 years unlessactions target improved reproductive success.Because the main reason for reproductive failureappears to be related to food limitation after egg-laying (which is the period in which offspring aremost affected), the energetic situation of breedingbirds should be the main target for conservationinitiatives. Our results indicate that the availabilityof grazed or other areas with short vegetation isimportant for adults when providing food to theyoung. In the short term, provision of additionalfood to breeding pairs might be an efficient strat-egy for boosting the number of potential recruitersto the population by improving survival of initi-ated broods. The consequences of such manage-ment action should be monitored to confirm oursmall-scale results of food provision at the popula-tion level.
ª 2010 The Authors
Journal compilation ª 2010 British Ornithologists’ Union
10 K. Thorup et al.

We thank two anonymous reviewers for their thorough com-ments on an earlier version of this article. The study was fundedby the Villum Kann Rasmussen Foundation.
REFERENCES
Amar, A. & Redpath, S.M. 2002. Determining the cause of the
Hen Harrier decline on the Orkney Islands: an experimental
test of two hypotheses. Anim. Conserv. 5: 21–28.
Amar, A., Redpath, S. & Thirgood, S. 2003. Evidence for
food limitation in the declining Hen Harrier population on
the Orkney Islands, Scotland. Biol. Conserv. 111: 377–
384.
Amar, A., Arroyo, B., Meek, E., Redpath, S. & Riley, H.
2008. Influence of habitat on breeding performance of Hen
Harriers Circus cyaneus in Orkney. Ibis 150: 400–404.
Benton, T.G., Bryant, D.M., Cole, L. & Crick, H.Q.P. 2002.
Linking agricultural practice to insect and bird populations: a
historical study over three decades. J. Appl. Ecol. 39: 673–
687.
Bini, L.M., Diniz-Filho, J.A.F., Rangel, T.F.L.V.B., Akre,
T.S.B., Albaladejo, R.G., Albuquerque, F.S., Aparicio,
A., Araujo, M.B., Baselga, A., Beck, J., Bellocq, M.I.,
Bohning-Gaese, K., Borges, P.A.V., Castro-Parga, I.,
Chey, V.K., Chown, S.L., Marco, P.d. Jr, Dobkin, D.S.,
Ferrer-Castan, D., Field, R., Filloy, J., Fleishman, E.,
Gomez, J.F., Hortal, J., Iverson, J.B., Kerr, J.T.,
Kissling, W.D., Kitching, I.J., Leon-Cortes, J.L., Lobo,
J.M., Montoya, D., Morales-Castilla, I., Moreno, J.C.,
Oberdorff, T., Olalla-Tarraga, M.A., Pausas, J.G., Qian,
H., Rahbek, C., Rodrıguez, M.A., Rueda, M., Ruggiero,
A., Sackmann, P., Sanders, N.J., Terribile, L.C., Vetaas,
O.R. & Hawkins, B.A. 2009. Coefficient shifts in geographi-
cal ecology: an empirical evaluation of spatial and non-spa-
tial regression. Ecography 32: 193–204.
Bønløkke, J., Madsen, J.J., Thorup, K., Pedersen, K.T.,
Bjerrum, M. & Rahbek, C. 2006. The Danish Bird Migra-
tion Atlas. Humlebaek: Rhodos Press & Zoological
Museum, University of Copenhagen.
Brommer, J.E., Karell, P. & Pietiainen, H. 2004. Supplemen-
tary fed Ural owls increase their reproductive output with a
one year time lag. Oecologia 139: 354–358.
Byholm, P. & Kekkonen, M. 2008. Food regulates reproduc-
tion differently in different habitats: experimental evidence
in the Goshawk. Ecology 89: 1696–1702.
Cappelen, J., Laursen, E.V., Jørgensen, P.V. & Kern-
Hansen, C. 2007. DMI Monthly Climate Data Collection
1768–2006, Denmark, The Faroe Islands and Greenland.
Danish Meteorological Institute. [Data available at http://
www.dmi.dk/dmi/tr07-06.zip].
Cooch, E. & White, G. 2007. Using MARK – A Gentle Intro-
duction. http://www.phidot.org/software/mark/docs/book/
markbook.exe (retrieved 23 November 2008).
Cornulier, T. & Bretagnolle, V. 2006. Assessing the influence
of environmental heterogeneity on bird spacing patterns: a
case study with two raptors. Ecography 29: 240–250.
Donald, P.F., Green, R.E. & Heath, M.F. 2001. Agricultural
intensification and the collapse of Europe’s farmland bird
populations. Proc. R. Soc. Lond. B, 268: 25–29.
Dormann, C.F., McPherson, J.M., Araujo, M.B., Bivand, R.,
Bolliger, J., Carl, G., Davies, R.G., Hirzel, A., Jetz, W.,
Kissling, W.D., Kuhn, I., Ohlemuller, R., Peres-Neto,
P.R., Reineking, B., Schroder, B., Schurr, F.M. &
Wilson, R. 2007. Methods to account for spatial autocorre-
lation in the analysis of species distributional data: a review.
Ecography 30: 609–628.
Dybbro, T. 1976. De danske ynglefugles udbredelse. Copen-
hagen: Dansk Ornithologisk Forening. [In Danish]
Ellemann, L., Ejrnæs, R., Reddersen, J. & Fredshavn, J.
2001. Det lysabne landkab. Faglig rapport fra DMU nr. 372.
Kalø: Danmarks Miljøundersøgelser. [In Danish]
Exo, K.-M. 1988. Jahreszeitliche okologische Anpassungen
des Steinkauzes (Athene noctua). J. Ornithol. 129: 393–
415.
Exo, K.M. & Hennes, R. 1980. Beitrag zur Populationsokolige
des Steinkauzes (Athene noctua) – eine Analyse deutscher
und niederlandischer Ringfunde. Vogelwarte 30: 162–179.
Fox, A.D. 2004. Has Danish agriculture maintained farmland
bird populations? J. Appl. Ecol. 41: 427–439.
Fuchs, P. & Laar, J.v.d. 2008. Dispersie en vestiging van
jonge Steenuilen. Limosa 81: 129–138.
Gonzalez, L., Margalida, A., Sanchez, R. & Oria, J. 2006.
Supplementary feeding as an effective tool for improving
breeding success in the Spanish Imperial Eagle (Aquila
adalberti). Biol. Conserv. 129: 477–486.
Grell, M.B. 1998. Fuglenes Danmark. Copenhagen: GAD. [In
Danish].
Holsegard-Rasmussen, M.H., Sunde, P., Thorup, K.,
Jacobsen, L.B., Ottesen, N., Svenne, S. & Rahbek, C.
2009. Variation in working effort in Danish Little Owls
(Athene noctua). Ardea 97: 547–554.
Hooge, P.N. & Eichenlaub, B. 1997. Animal movement exten-
sion to ARCVIEW. Ver 1.1. Anchorage: Alaska Biological Sci-
ence Center, US Geological Survey.
Jacobsen, L.B. 2006. Ynglebestanden af Kirkeugle Athene
noctua i Vendsyssel og Himmerland 1981–2000. Dansk
Orn. Foren. Tidsskr. 100: 35–43. [In Danish with English
summary].
Lebreton, J.D., Burnham, K.P., Clobert, J. & Anderson,
D.R. 1992. Modeling survival and testing biological hypothe-
sis using marked animals: a unified approach with case
studies. Ecol. Monogr. 62: 67–118.
Letty, J., Genot, J.C. & Sarrazin, F. 2001. Viabilite de la pop-
ulation de cheveche d’Athena Athene noctua dans le parc
naturel regional des Vosges du nord. Alauda 69: 359–372.
[In French]
Marchesi, L. & Sergio, F. 2005. Distribution, density, diet and
productivity of the Scops Owl Otus scops in the Italian Alps.
Ibis 147: 176–187.
Martınez, J.A. & Zuberogoitia, I. 2004. Habitat preferences
for Long-eared Owls Asio otus and Little Owls Athene noc-
tua in semi-arid environments at three spatial scales. Bird
Study 51: 163–169.
Martınez, J.A., Zuberogoitia, I., Martınez, J.E., Zabala, J. &
Calvo, J.F. 2007. Patterns of territory settlement by
Eurasian Scops-Owls (Otus scops) in altered semi-arid
landscapes. J. Arid Environ. 69: 400–409.
Newton, I. 2004. The recent declines of farmland bird popula-
tions in Britain: an appraisal of causal factors and conserva-
tion actions. Ibis 146: 579–600.
Nielsen, K., Stjernholm, M., Olsen, B.Ø., Muller-Wohlfeil,
D.I., Madsen, I.L., Kjeldgaard, A., Groom, G., Hansen,
H.S., Rolev, A.M., Hermansen, B., Skov-Petersen, H.,
ª 2010 The Authors
Journal compilation ª 2010 British Ornithologists’ Union
Food limitation in Little Owls 11

Johannsen, V.K., Hvidberg, M., Jensen, J.E., Bacher, V.
& Larsen, H. 2000. Areal Informations Systemet – AIS.
Miljø- og Energiministeriet and Danmarks Miljøundersøgel-
ser. [Data available at http://www.dmu.dk/Udgivelser/
Kort_og_Geodata/AIS/].
Nieuwenhuyse, D.V. & Bekaert, M. 2001. Study of Little Owl
Athene noctua habitat preference in Herzele (East-Flan-
ders, Northern Belgium) using the median test. Oriolus 67:
62–71.
Nieuwenhuyse, D.V., Leysen, M. & Leysen, K. (eds.) 2001.
Little Owl in Flanders in its international context. Proc. 2nd
Int. Little Owl Symp., Geraardsbergen, Belgium. Oriolus 67:
1–149.
Nieuwenhuyse, D.V., Genot, J.-C. & Johnson, D.H. 2008.
The Little Owl. Cambridge: Cambridge University Press.
Ottesen, N. & Svenne, S. 2008. Diætsammensætning og
habitatbrug hos den danske kirkeugle (Athene noctua).
MSc thesis. University of Copenhagen. [In Danish]
Rangel, T.F.L.V.B., Diniz-Filho, J.A.F. & Bini, M. 2006.
Towards an integrated computational tool for spatial
analysis in macroecology and biogeography. Global Ecol.
Biogeogr. 15: 321–327.
Schaub, M., Ullrich, B., Knotzsch, G., Albrecht, P. &
Meisser, C. 2006. Local population dynamics and the
impact of scale and isolation: a study on different Little Owl
populations. Oikos 115: 389–400.
Sergio, F. & Marchesi, L. 2009. Conservation of Scops Owl
Otus scops in the Alps: relationships with grassland man-
agement, predation risk and wider biodiversity. Ibis 151:
40–50.
Sunde, P., Thorup, K., Jacobsen, L.B., Holsegard-Rasmus-
sen, M.H., Ottesen, N., Svenne, S. & Rahbek, C. 2009.
Spatial behaviour of Little Owls (Athene noctua) in a declin-
ing low-density population in Denmark. J. Ornithol. 150:
537–548.
Tucker, G.M. & Heath, M.F. 2004. Birds in Europe: their Con-
servation Status. Cambridge: Birdlife International.
White, G.C. & Burnham, K.P. 1999. Program MARK: survival
estimation from populations of marked animals. Bird Study
46: 120–139.
Williams, B., Nichols, J. & Conroy, M. 2002. Analysis and
Management of Animal Populations. London: Academic
Press.
Zabala, J., Zuberogoitia, I., Martınez-Climent, J.A., Martı-
nez, J.E., Azkona, A., Hidalgo, S. & Iraeta, A. 2006.
Occupancy and abundance of Little Owl Athene noctua in
an intensively managed forest area in Biscay. Ornis Fenn.
83: 97–107.
Received 3 August 2009;revision accepted 28 June 2010.
ª 2010 The Authors
Journal compilation ª 2010 British Ornithologists’ Union
12 K. Thorup et al.