Breeding bird community composition in different ... · PDF fileBreeding bird community...
11
Breeding bird community composition in different successional vegetation in the montane coniferous forests zone of Taiwan Tzung-Su Ding, Huan-Chang Liao, Hsiao-Wei Yuan * School Q1 of Forestry and Resource Conservation, National Taiwan University, No. 1, Sec. 4, Roosevelt Road, Taipei 106, Taiwan Received 5 August 2007; received in revised form 20 January 2008; accepted 21 January 2008 Abstract To examine the relationship between forest succession following fire and the composition of bird communities, we investigated the vegetation structure, bird population density, foraging behavior and guild structure in bamboo grasslands (11 years since the last fire), pine savanna (41 years), pine woodland (58 years), old-growth hemlock forest (never burned), and old-growth spruce forest (never burned) in the Tatachia area of central Taiwan. Canopy height, total foliage cover, tree density, total basal area of tree, total basal area of snags, foliage height diversity, and tree species richness all increased with successional age. However, shrub cover peaked in intermediate successional stages. The vertical profile of foliage cover was more diverse in later successional forests, which had more breeding bird species and ecological guilds. All the breeding bird species recorded in early and intermediate stages were also found distributed in the late successional forests. Because Taiwan has high precipitation and humidity, and most forest fires in Taiwan are caused by human activities, forest fires and large areas of early successional vegetation were probably rare in the mountain areas of Taiwan prior to the arrival of humans. Therefore, bird species have not had enough time to adapt to areas with early or intermediate successional vegetation. Moreover, late successional forests host all the major plant species found in the early and intermediate stages and have higher foliage height diversity index, which was positively correlated with the bird species richness and bird species diversity index in this study. As a result, all breeding bird species and guilds in the area can be found in late successional forests. Efforts for conserving avian diversity in Taiwan should focus on protecting the remaining native old-growth forests. # 2008 Published by Elsevier B.V. Keywords: Vegetation succession; Seral stages; Avian assemblages; Ecological guild; Habitat selection; Taiwan 1. Introduction Forest fires abruptly change the structure and composition of biological communities and affect management of forests and biodiversity (Attiwill, 1994). In forest ecosystems, vegetation in later successional stages is usually taller, has more total biomass, and greater tree species richness (e.g., Linder et al., 1997; Cochrane and Schulze, 1999; Wang et al., 2006). Late successional vegetation also tends to have more vertical layers of foliage and higher variance in tree size (e.g., Linder et al., 1997; Skowno and Bond, 2003 Q3 ; Venier and Pearce, 2005). These more complex habitats provide greater foraging and nesting opportunities for wildlife (Keller et al., 2003; Dı ´az et al., 2005; Schwab et al., 2006). The species composition of animal communities changes during succession (Oppel, 2006; Schieck and Song, 2006). The conventional view is that, immediately after disturbance, wildlife density and species richness are low (e.g., Venier and Pearce, 2005; Green and Sanecki, 2006; Sara ` et al., 2006; Schieck and Song, 2006). However, many studies (e.g., Imbeau et al., 1999; Keller et al., 2003; Pons and Wendenburg, 2005) have found that animal species diversity or total density peaked 0–12 years after fire or logging. The inclusion of early successional species and cavity-nesting species contributed to these early peaks in density and diversity (Hutto, 1995; Imbeau et al., 1999; Pons and Wendenburg, 2005; Schieck and Song, 2006). Some wildlife species are restricted to early or intermediate successional stages and do not occur in late successional stages (e.g., Hutto, 1995; Imbeau et al., 1999; Hunter et al., 2001; Herrando et al., 2003; Venier and Pearce, 2005; Paquet et al., 2006). Many animal species associated with early and intermediate successional stages have declined in North www.elsevier.com/locate/foreco Available online at www.sciencedirect.com Forest Ecology and Management xxx (2008) xxx–xxx 1 2 3 4 5 6 7 8 9 10 11 12 13 14 15 16 17 18 19 20 21 22 23 24 25 26 27 28 29 30 31 32 33 34 35 36 37 38 39 40 41 42 41 42 43 44 45 46 47 48 49 50 51 52 53 54 55 56 57 58 59 60 * Corresponding Q2 author. Tel.: +886 2 3366 4634; fax: +886 2 2565 4520. E-mail address: [email protected] (H.-W. Yuan). 0378-1127/$ – see front matter # 2008 Published by Elsevier B.V. doi:10.1016/j.foreco.2008.01.056
Transcript of Breeding bird community composition in different ... · PDF fileBreeding bird community...

Q1
Q3
1
2
3
4
56
789
10
11
12
13
14
15
16
17
18
19
20
21
22
23
2425
26
27
28
29
30
31
32
33
34
35
36
37
38
39
40
41
42
Q2
Breeding bird community composition in different successional
vegetation in the montane coniferous forests zone of Taiwan
Tzung-Su Ding, Huan-Chang Liao, Hsiao-Wei Yuan *
School of Forestry and Resource Conservation, National Taiwan University, No. 1, Sec. 4, Roosevelt Road, Taipei 106, Taiwan
Received 5 August 2007; received in revised form 20 January 2008; accepted 21 January 2008
Abstract
To examine the relationship between forest succession following fire and the composition of bird communities, we investigated the vegetation
structure, bird population density, foraging behavior and guild structure in bamboo grasslands (11 years since the last fire), pine savanna (41 years),
pine woodland (58 years), old-growth hemlock forest (never burned), and old-growth spruce forest (never burned) in the Tatachia area of central
Taiwan. Canopy height, total foliage cover, tree density, total basal area of tree, total basal area of snags, foliage height diversity, and tree species
richness all increased with successional age. However, shrub cover peaked in intermediate successional stages. The vertical profile of foliage cover
was more diverse in later successional forests, which had more breeding bird species and ecological guilds. All the breeding bird species recorded
in early and intermediate stages were also found distributed in the late successional forests. Because Taiwan has high precipitation and humidity,
and most forest fires in Taiwan are caused by human activities, forest fires and large areas of early successional vegetation were probably rare in the
mountain areas of Taiwan prior to the arrival of humans. Therefore, bird species have not had enough time to adapt to areas with early or
intermediate successional vegetation. Moreover, late successional forests host all the major plant species found in the early and intermediate stages
and have higher foliage height diversity index, which was positively correlated with the bird species richness and bird species diversity index in this
study. As a result, all breeding bird species and guilds in the area can be found in late successional forests. Efforts for conserving avian diversity in
Taiwan should focus on protecting the remaining native old-growth forests.
# 2008 Published by Elsevier B.V.
Keywords: Vegetation succession; Seral stages; Avian assemblages; Ecological guild; Habitat selection; Taiwan
www.elsevier.com/locate/foreco
Available online at www.sciencedirect.com
Forest Ecology and Management xxx (2008) xxx–xxx
41
42
43
44
45
46
47
48
49
50
51
52
53
54
55
1. Introduction
Forest fires abruptly change the structure and composition of
biological communities and affect management of forests and
biodiversity (Attiwill, 1994). In forest ecosystems, vegetation
in later successional stages is usually taller, has more total
biomass, and greater tree species richness (e.g., Linder et al.,
1997; Cochrane and Schulze, 1999; Wang et al., 2006). Late
successional vegetation also tends to have more vertical layers
of foliage and higher variance in tree size (e.g., Linder et al.,
1997; Skowno and Bond, 2003; Venier and Pearce, 2005).
These more complex habitats provide greater foraging and
nesting opportunities for wildlife (Keller et al., 2003; Dıaz
et al., 2005; Schwab et al., 2006).
56
57
58
59
60
* Corresponding author. Tel.: +886 2 3366 4634; fax: +886 2 2565 4520.
E-mail address: [email protected] (H.-W. Yuan).
0378-1127/$ – see front matter # 2008 Published by Elsevier B.V.
doi:10.1016/j.foreco.2008.01.056
The species composition of animal communities changes
during succession (Oppel, 2006; Schieck and Song, 2006).
The conventional view is that, immediately after disturbance,
wildlife density and species richness are low (e.g., Venier and
Pearce, 2005; Green and Sanecki, 2006; Sara et al., 2006;
Schieck and Song, 2006). However, many studies (e.g.,
Imbeau et al., 1999; Keller et al., 2003; Pons and
Wendenburg, 2005) have found that animal species diversity
or total density peaked 0–12 years after fire or logging. The
inclusion of early successional species and cavity-nesting
species contributed to these early peaks in density and
diversity (Hutto, 1995; Imbeau et al., 1999; Pons and
Wendenburg, 2005; Schieck and Song, 2006).
Some wildlife species are restricted to early or intermediate
successional stages and do not occur in late successional stages
(e.g., Hutto, 1995; Imbeau et al., 1999; Hunter et al., 2001;
Herrando et al., 2003; Venier and Pearce, 2005; Paquet et al.,
2006). Many animal species associated with early and
intermediate successional stages have declined in North
Ding
註解
“Marked”的設定者是“Ding”
Ding
註解
“Accepted”的設定者是“Ding”
Ding
打字機文字

60
61
62
63
64
65
66
67
68
69
70
71
72
73
74
75
76
77
78
79
80
81
82
83
84
85
86
87
88
89
90
91
92
93
94
95
96
97
98
99
100
101
102
103
104
105
106
107
108
109
110
111
112
113
114
114
115
116
117
118
119
120
121
122
123
124
125
126
127
128
129
130
131
132
133
134
135
136
137
138
139
140
141
142
143
144
145
146
147
148
149
150
151
152
153
154
155
156
157
158
159
160
161
162
163
164
165
166
167
168
169
T.-S. Ding et al. / Forest Ecology and Management xxx (2008) xxx–xxx2
America and Europe in the past few decades (Brawn et al.,
2001; DeGraaf and Yamasaki, 2003). This trend has been
attributed to the suppression of natural disturbance and the
expansion of agriculture and development (Brawn et al., 2001).
To conserve species associated with early and intermediate
successional vegetation, biodiversity conservation programs
should not suppress natural disturbances (e.g., fire, flood) and, if
needed, introduce active anthropogenic disturbances (e.g.,
prescribed fires, logging) that mimic natural disturbances
(Hutto, 1995; Linder et al., 1997; Herrando et al., 2003; Venier
and Pearce, 2005; Pons and Wendenburg, 2005; Oppel, 2006;
Schwab et al., 2006; Barbaro et al., 2007).
Fires, typhoons, and landslides are the major natural
disturbances that occur in Taiwan forests. Due to high annual
precipitation (greater than 2500 mm in 80% of the area) and
steep mountain topography, burned areas in Taiwan are
vulnerable to erosion and landslides. Therefore, the policy of
forest managers in Taiwan is to suppress all fires (Hwang and
Lin, 2005). In addition, prescribed fires are not used in
mountain areas of Taiwan. Nevertheless, due to increased
human activities in the last few decades, forest fires are more
frequent (Hwang and Lin, 2005), creating more areas of early
and intermediate successional stages in the mountains of
Taiwan. There have been very few studies of the animal
communities associated with the successional vegetation
following forest fires in Taiwan.
In this study, we investigated the vegetation structure and the
composition of the breeding bird communities in 11-, 41-, and
58-year-old plant communities following forest fires, and in
two, primary, old-growth forests in the Tatachia area of central
Taiwan. The main objectives of this study were to: (1)
determine the species composition of bird communities in
vegetation at different successional vegetation; (2) define the
ecological guilds for birds and determine their abundance in
different successional stages; and (3) examine the relationships
between bird community structure and vegetation structure.
2. Methods
2.1. Study site
We conducted this study in the Tatachia area (238300N,
1208550E), in central Taiwan. The study site is about 2550–
2850 m a.s.l. and is on a small mountain range that lies between
the Yushan and Alishan mountain ranges (Fig. 1).
Based on weather data from the on-site Luling long-term
weather station (2700 m a.s.l.), the annual average temperature
in 2003 and 2004 was 11.2 8C. The highest monthly average
temperature was 14.0 8C (in June), and the lowest monthly
average was 4.7 8C (in January). Annual precipitation at the
study site was 4009 mm. About 80% of the annual precipitation
fell in May–September due to the southwest, summer monsoon
rains.
In Taiwan, primary forests at this elevation (2550–2850 m)
are mainly hemlock (Tsuga chinensis) in xeric habitats, and
spruce (Picea morrisonicola) in mesic habitats (Su, 1984). In
the study area, grasslands of short bamboo (Yushania
niitakayamensis) and silvergrass (Miscanthus transmorriso-
nensis) usually dominate after forest fires. If no additional fires
occur, the bamboo grassland is replaced by pine forests (mainly
Pinus taiwanensis and P. armandii) and eventually hemlock or
spruce forests. Due to frequent forest fires, there is a mosaic of
different vegetation types in the study area.
We established 22 sampling stations in the 5 major
vegetation types within the study site: bamboo grassland,
pine savanna, pine woodland, hemlock forest, and spruce
forest (Fig. 1). All the sampling stations were located in large
patches of vegetation (at least 100 ha) and had similar aspect
and elevation (2550–2850 m) (Fig. 1). There were four
stations in the bamboo grassland, which represented the first
stage of succession after burning. Several fires have burned
this site in the past few decades and the last one occurred in
January 1993. Intermediate successional vegetation was
represented by the pine savanna, burned in 1963, and pine
woodland, burned in 1946. There were five stations in each
of the forest types. At the time of field sampling, there were
virtually no old trees (>70 years) and very few snags and
logs. The hemlock forest and spruce forest have not
experienced forest fire or logging during the last few
centuries. Both forests had four stations and represented
the late stages of succession. The criteria for selecting
sampling stations were: (1) the vegetation structure of the
sampling stations was relatively homogeneous; (2) the
topography and vegetation of the stations allowed observers
to detect birds in all directions; (3) that the stations should be
at least 200 m away from creeks and the edge of different
vegetation types; and (4) at least 200 m away from other
sampling stations.
2.2. Measurement of habitat structure
We measured 18 habitat attributes (Table 1) at each sampling
station from July to October 2004 and grouped them into 3
categories: abiotic, floristic, and physiognomic. For the slope
aspect of each station, a relative value from 1 to 16 was given,
based on the moisture gradient from the direction of SSW
(driest) to NNE (wettest) (Su, 1987). We established a
20 m � 20 m quadrat at the center of each station and
measured the species, height, and diameter at breast height
(DBH) of all trees and snags within each quadrat. Foliage cover
was measured along two 20 m, randomly oriented transect lines
that were orthogonal to each other and passed through the
center of each 20 m � 20 m quadrat. We erected a carbon fiber
pole at 0.5 m intervals along each transect and counted each
time the pole made contact with a leaf or branch. The height of
each contact was assigned to one of nine vertical layers (0–
0.5 m, 0.5–1 m, 1–2 m, 2–4 m, 4–6 m, 6–10 m, 20–25 m, 15–
20 m, and >20 m) and the plant was categorized by one of four
growth forms (herb, shrub, sub-canopy tree, and canopy tree).
There were 80 sample points for foliage cover at each station.
We averaged the foliage cover of each growth form from the
number of times the pole touched a branch or leaf of each
growth form. A 100% foliage cover means that the pole touched
a branch or leaf once on average. Total foliage cover was

Q4
169
170
171
172
173
174
174
175
176
177
178
Fig. 1. The study site was located in the montane zone (2550–2850 m a.s.l.) in the Tatachia area of central Taiwan.
T.-S. Ding et al. / Forest Ecology and Management xxx (2008) xxx–xxx 3
summed from the foliage cover of individual growth forms. We
used the Shannon–Wiener diversity index (Krebs, 1989) to
describe foliage height diversity, using the foliage cover of the
nine vertical layers, and tree species diversity, based on the total
basal area of each tree species in the 20 m � 20 m quadrat.
Table 1
The 18 habitat attributes (mean � S.D.) of each of the five vegetation types1
Habitat attribute Bamboo grassland Pine sav
Abiotic attributes
Elevation (m) 2841 � 30a 2682 �Aspect 9.2 � 4.2a 12.6 �
Physiognomic attributes
Vegetation height (m) 0.3 � 0.5a 4.8 �Herb cover (%) 89.4 � 4.6abc 99.0 �Shrub cover (%) 15.6 � 12.5a 109.8 �Sub-canopy cover (%) 0.0 � 0.0a 50.7 �Canopy cover (%) 0.0 � 0.0a 15.0 �Total foliage cover (%) 105.0 � 11.6a 274.5 �Proportion of ground foliage (%) 100.0 � 0.0a 76.1 �Tree density (No./ha) 169 � 290a 1380 �Mean DBH (cm) 3.1 � 4.4a 6.8 �CV of DBH (cm) 0.34 � 0.55a 0.93 �Total BA of trees (m3/ha) 0.4 � 0.5a 12.0 �Total BA of snags (m3/ha) 0.15 � 0.21a 0.04 �Foliage height diversity 0.42 � 0.23a 1.52 �
Floristic attributes
Tree species richness 0.75 � 0.96a 4.80 �Tree species diversity 0.06 � 0.12a 0.49 �Proportion of broadleaf foliage (%) 0.0 � 0.0a 1.1 �
1 For each habitat attribute, there were significant differences among vegetation ty
shared superscript letters.
2.3. Estimating bird density
Two of the authors (TSD and HCL) estimated the density of
each bird species at each station from March to June, 2004 by
using the variable-distance circular-plot method (Reynolds
anna Pine woodland Hemlock forest Spruce forest
5b 2726 � 13c 2662 � 17b 2627 � 22d
3.8ab 14.2 � 1.5b 10.5 � 3.5ab 12.5 � 3.4ab
1.0b 11.8 � 2.8c 15.8 � 1.5d 32.0 � 2.9e
2.2ab 69.3 � 26.0ac 46.6 � 19.5d 89.1 � 8.6abc
33.2b 200.8 � 51.0c 133.1 � 43.3b 105.9 � 25.5b
24.3b 90.0 � 21.0b 184.4 � 41.6c 141.3 � 47.9c
18.8a 135.3 � 60.6b 123.7 � 24.4b 235.3 � 26.4c
59.4b 495.4 � 48.6c 487.8 � 12.8c 571.6 � 59.3d
8.3b 54.5 � 7.3c 36.8 � 11.9d 34.1 � 2.6d
720ab 1475 � 931ac 1881 � 455bc 4612 � 2032d
1.1a 17.2 � 7.1b 13.9 � 3.8b 6.5 � 0.9a
0.50ab 0.75 � 0.17a 1.21 � 0.54b 2.20 � 0.37c
14.5a 41.8 � 14.6b 64.0 � 9.7c 72.9 � 17.4c
0.08a 0.83 � 0.17b 29.24 � 27.71c 16.64 � 12.09c
0.24b 1.93 � 0.09c 1.98 � 0.05c 2.12 � 0.06c
1.92b 6.60 � 2.51b 7.50 � 0.58b 17.50 � 4.43c
0.29b 0.61 � 0.27b 0.76 � 0.29bc 1.10 � 0.23c
1.4a 3.5 � 5.9a 15.6 � 8.5b 27.6 � 10.2c
pes. The values that are not significantly different ( p > 0.05) are indicated by

Q5
178
179
180
181
182183
184
185
186
187
188
189
190
191
192
193
194
195
196
197
198
199
200
201
202
203
204
205
206
207
208
209
210
211
212
213
214
215
216
217
218
219
220
221
222
223
224
225
226
227
228
229
230
230
231
232
233
234
235
236
237
238
239
240
241
242
243
244
245
246
247
248
249
250
251
252
253
254
255
256
257
258
259
260
261
262
263
264
265
266
267
268
269
270
271
272
273
274
275
276
277
278
279
280
T.-S. Ding et al. / Forest Ecology and Management xxx (2008) xxx–xxx4
et al., 1980), which calculates the average number of
individuals recorded within the circular area of a radius that
most birds could be effectively detected. The equation for
calculating bird density is:
D ¼ n� 104
pr2C;
where D is the estimated density (No./ha) of each species at
each station, n is the total number of birds of the species
detected within its effective detection radius at the station, r
is the effective detection radius (m), and C is the total number of
bird counts.
Based on the results of a previous study at this site (Shiu and
Lee, 2003), we counted birds at each station for 6 min, which
registered more than 80% of the individuals and species
recorded in 30 min (Shiu and Lee, 2003). The bird counts were
only conducted between local sunrise and 3 h thereafter. We
repeated bird counts on all the sampling stations of same
vegetation type hourly. At each station, we recorded the
number, distance, and sex (by appearance or song if possible) of
all birds seen or heard in 6 min. For some secretive species that
are difficult to detect visually or by their calls, each record of
their territorial songs was treated as two individuals. We
excluded individuals that simply flew past the station. In total,
we counted birds 30 times at each sampling station and no count
was carried out during rain. Both investigators exerted the same
sampling effort (15 counts) for each station and had a similar
sampling schedule for all the sampling stations. The effective
detection radius for each species was determined by inspecting
a histogram of bird density in 10 m concentric bands, following
the criteria detailed in Reynolds et al. (1980). Because the
detection ability of observers could vary with vegetation
structure, the effective detection radius for each species was
determined separately for each vegetation type.
Bird nomenclature and taxonomy follows Dickinson (2003),
except for that of the Taiwan Bush Warbler (Bradypterus
alishanensis), which follows Rasmussen et al. (2000). We
calculated bird species diversity by applying the Shannon–
Wiener diversity index (Krebs, 1989) to the density of each bird
species. Total bird biomass was summed from the product of
the density and biomass (reported in Shiu et al., 2005) of each
bird species.
2.4. Resource utilization of birds
We directly observed bird foraging behavior from May to
July 2004, to determine the food resource utilization of the bird
species recorded. One author (HCL) closely followed the first
bird encountered in the sampling stations and recorded its
successful foraging behaviors until the bird flew out of sight.
Recorded variables included food item (nectar, fruit, seed, bud,
invertebrate, vertebrate, and carrion), foraging substrate
(ground, shrub, tree leaves, bole, and air), and foraging tactic
(glean, fly-catch, hawk, and peck). When the focal bird was no
longer in sight, the next bird encountered would be followed. A
total of 90 h of observation time was spent in the study site
(18 h in each of the five major vegetation types). For those bird
species with less than 20 records of successful foraging
behavior (14 species in total), we included our previous
observations during breeding seasons in the study site to
prepare the foraging behavior data for guild classification.
2.5. Statistical analyses
We used cluster analysis to classify the ecological guilds of
birds by foraging behavior and to group sampling stations by
bird species composition. We used Euclidean distance for
similarity calculations and UPGMA (unweighted pair-group
method using arithmetic averages) for the linkage method in
cluster analysis. We employed PC-ORD 4.25 (McCune and
Mefford, 1999) to conduct cluster analysis and DCA
(Detrended Correspondence Analysis) and SPSS 12.0 for
ANOVA and regression analyses.
3. Results
3.1. Habitat structure
There were significant differences in all 18 habitat attributes
among at least some of the 5 major successional stages (Dunn
test, p < 0.05; Table 1). Most physiognomic and floristic
attributes increased with successional stage (canopy height,
sub-canopy cover, canopy cover, total foliage cover, tree
density, CV of DBH, total basal area of tree, total basal area of
snag, foliage height diversity, tree species richness, and tree
species diversity). In contrast, shrub cover peaked in
intermediate successional stages, and the relative proportion
of ground foliage (herb and shrub) peaked in bamboo grassland
and then decreased with successional age. The vertical profile
of foliage cover was most even in pine woodland, hemlock
forest, and spruce forest (Fig. 2). Most foliage in bamboo
grassland was below 1 m. In pine savanna, foliage in the layers
of 4–15 m was sparse but foliage cover below 1 m was high.
Pine woodland had well-developed vegetation layers that were
evenly distributed from the ground to the 10–15 m layer. The
vertical profile of foliage cover for hemlock forest was similar
to that of pine woodland, but hemlock forest had more foliage in
the layers above 15 m. Spruce forest had a bimodal distribution
of foliage cover; the layers above 15 m and below 0.5 m had
dense foliage cover.
3.2. Bird community composition
We registered 17,883 records from 46 species during the
field counts. Of these, 37 species were resident, breeding
species with at least 3 records (Table 2). In addition, there were
two migrant species (Turdus chrysolaus, Zoothera aurea), one
nocturnal species (Strix aluco), one altitudinal migrant
(Troglodytes troglodytes), and five transient species (Dendro-
copos canicapillus, Cuculus poliocephalus, Hypsipetes leuco-
cephalus, Spizixos semitorques, Cettia fortipes).
Bird community composition differed in the five vegetation
types (Table 2). The species with highest density in both

280
281
282
283
284
285
286
287
288
289
290
291
292
293
294
295
296
297
298
299
300
301
302
303
304
305
306
307
308
309
310
311
312
313
314
315
316
317
318
318
319
320
321
322
323
324
325
326
327
328
329
330
331
332
333
334
335
336
337
338
339
340
341
342
343
344
345
346
347
348
349
350
351
352
353
354
Fig. 2. The vertical profile of foliage cover in bamboo grassland, pine savanna, pine woodland, hemlock forest, and spruce forest.
T.-S. Ding et al. / Forest Ecology and Management xxx (2008) xxx–xxx 5
bamboo grassland and pine savanna were Cettia acanthizoides,
Alcippe cinereiceps and B. alishanensis. In pine woodland,
Regulus goodfellowi, A. cinereiceps, and C. acanthizoides
dominated. In hemlock forest and spruce forest, R. goodfellowi,
A. cinereiceps, Yuhina brunneiceps, and Muscicapa ferruginea
were abundant.
All bird species occurring in early and intermediate
successional stages were also present in late successional
forests (Table 2). The spruce forest had all but one of the 37
breeding species and had 6 species that were not recorded in
other vegetation types.
3.3. Bird guild structure
The foraging substrates, foraging tactics, and food items of
the 37 local breeding species varied considerably (Table 3).
Most species were insectivores that glean prey from a variety of
substrates. A total of 10 foraging guilds were identified using
cluster analysis (Fig. 3). The guilds were: carnivore (1 species),
ground omnivore (3), ground insectivore (2), ground herbivore
(2), shrub insectivore (9), tree insectivore (12), tree frugivore
(2), bole gleaner (1), bole pecker (2), and aerial insectivore (3).
Hemlock forest and spruce forests had 10 and 9 guilds,
respectively, and were dominated by tree insectivores (58.1%,
58.2%) and shrub insectivores (27.6%, 18.9%) (Table 4). Pine
woodland and pine savanna both had six guilds, dominated by
shrub insectivores (52.0%, 72.9%) and tree insectivores
(39.1%, 16.1%). Four guilds (carnivore, bole gleaner, bole
pecker, and aerial insectivore) were absent from pine woodland
and pine savanna. Bamboo grassland only had four guilds and,
as the pine savanna and pine woodland, the shrub insectivores
(78.6%) dominated.
The abundance of insectivorous guilds positively correlated
with the foliage cover of the vertical layers that they forage. The
proportion of shrub insectivores at each station positively
correlated with ground foliage cover in simple linear regression
analyses (r2 = 0.88, p < 0.001). The proportion of tree
insectivores at each station was positively correlated with
the total foliage cover of the canopy and sub-canopy layers
(r2 = 0.90, p < 0.001). The total density of bole peckers and
bole gleaners also were significantly and positively correlated
with snag basal area (r2 = 0.29, p = 0.01) at each station,
however the amount of variation attributed to snag basal area
was relatively small.
3.4. Analysis of bird community characteristics
Bird species diversity, bird species richness, total bird
density, and total bird biomass all increased with successional
stage and peaked in spruce forest (Table 2). Stepwise forward
multiple regression (criterion for inclusion and exclusion,
p < 0.05) was applied to evaluate the statistical explanatory
power of all the 18 habitat attributes on bird species diversity,
total bird density, and total bird biomass. Foliage height
diversity was significantly and positively correlated with bird
species diversity and explained 69.2% of the variance in bird
species diversity ( p < 0.001). All the other 17 habitat attributes
were not significantly correlated with the residuals of bird
species diversity ( p > 0.05) once the effects of foliage height
diversity had been removed. Total foliage cover was
significantly and positively correlated with total bird density
(r2 = 0.85, p < 0.001) and total bird biomass (r2 = 0.83,
p < 0.001). The other 17 habitat attributes were not sig-
nificantly correlated with the residuals of total bird density and
total bird biomass ( p > 0.05) once the effects of total foliage
cover had been justified.
3.5. Ordination of bird communities and habitat selection
The species composition data of bird communities at the 22
sampling stations were analyzed using DCA. The 22 stations
fell into 5 groups, based on vegetation type (Fig. 4). Cluster
analysis of the bird species density data also placed the
sampling stations into the same five groups (data not shown).
The first DCA axis was significantly correlated with most
habitat variables (Table 5). Vegetation height (r = 0.94), total
basal area of trees (r = 0.92), and canopy cover (r = 0.89) were
most highly correlated with the first axis. In general, the first
axis represented the increase in tree size with successional
stage. The second DCA axis was significantly correlated with

354
355
356
357
358
359
360
361
362
363
364
365
366
367
368
368
369
370
371
372
373
374
375
376
377
378
379
380
Table 2
The average density (mean � S.D.) (No./ha) of 37 species of breeding birds and bird community characteristics in the five vegetation types
English name Scientific name Bamboo grassland Pine savanna Pine woodland Hemlock forest Spruce forest
Mikado Pheasant 1,2 Syrmaticus Mikado – – – – 0.02 � 0.02
Ashy Woodpigeon3 Columba pulchricollis – 0.02 � 0.02 0.04 � 0.03 0.03 � 0.01 0.19 � 0.03
Himalayan Cuckoo Cuculus saturatus – 0.02 � 0.04 0.03 � 0.01 0.21 � 0.11 0.18 � 0.09
Collared Owlet3 Glaucidium brodiei – – – 0.03 � 0.03 –
White-backed Woodpecker3 Dendrocopos leucotos – – – 0.06 � 0.05 0.06 � 0.05
Grey-headed Woodpecker1 Picus canus – – – – 0.01 � 0.01
Eurasian Nutcracker3 Nucifraga caryocatactes – – – 0.73 � 0.28 0.14 � 0.03
Large-billed Crow Corvus macrorhynchos – 0.04 � 0.03 0.01 � 0.01 0.11 � 0.10 0.02 � 0.02
Eurasian Jay Garrulus glandarius – – – – 0.03 � 0.03
Green-backed Tit Parus monticolus – – – 0.21 � 0.23 0.34 � 0.17
Coal Tit Parus ater 0.08 � 0.04 0.10 � 0.09 0.30 � 0.11 1.58 � 0.40 2.00 � 0.25
Black-throated Tit Aegithalos concinnus – 0.87 � 0.78 1.84 � 0.69 0.30 � 0.35 1.06 � 1.23
Yellowish-bellied Bush Warbler Cettia acanthizoides 3.10 � 0.35 4.52 � 0.43 5.21 � 0.67 2.24 � 0.81 0.95 � 0.47
Taiwan Bush Warbler2 Bradypterus alishanensis 2.46 � 0.45 1.88 � 0.34 1.24 � 0.48 0.53 � 0.24 0.59 � 0.18
Rufous-faced Warbler Abroscopus albogularis – – – 0.02 � 0.03 0.21 � 0.18
Scaly-breasted Wren-Babbler Pnoepyga albiventer – – 0.19 � 0.11 0.25 � 0.19 0.65 � 0.20
Rufous-capped Babbler Stachyris ruficeps 0.09 � 0.05 0.14 � 0.11 0.74 � 0.16 0.62 � 0.07 0.76 � 0.09
White-whiskered Laughing-thrush2 Garrulax morrisonianus 0.90 � 0.26 0.92 � 0.15 1.14 � 0.10 1.03 � 0.27 0.96 � 0.12
Steere’s Liocichla2 Liocichla steerii – – – 0.27 � 0.23 1.09 � 0.30
Taiwan Barwing 2,3 Actinodura morrisoniana – – 0.13 � 0.11 0.72 � 0.41 1.18 � 0.70
Streak-throated Fulvetta Alcippe cinereiceps 2.79 � 0.62 4.92 � 0.66 8.16 � 1.75 6.43 � 0.37 3.57 � 1.15
Grey-cheeked Fulvetta Alcippe morrisonia – – 0.51 � 0.56 1.18 � 0.41 3.68 � 0.88
White-eared Sibia2 Heterophasia auricularis 0.05 � 0.04 0.02 � 0.03 0.02 � 0.03 0.01 � 0.02 0.24 � 0.11
Taiwan Yuhina2 Yuhina brunneiceps 0.37 � 0.14 0.52 � 0.48 3.23 � 0.44 5.36 � 0.89 5.60 � 0.43
Golden Parrotbill3 Paradoxornis verreauxi – 0.45 � 0.32 3.21 � 1.51 – 0.93 � 1.52
Flamecrest2 Regulus goodfellowi 0.27 � 0.31 1.27 � 0.64 11.31 � 4.76 16.19 � 2.59 20.37 � 3.76
Eurasian Nuthatch Sitta europaea – – – 0.73 � 0.90 0.14 � 0.16
Taiwan Whistling Thrush2 Myophonus insularis – – – – 0.08 � 0.09
White-browed Shortwing Brachypteryx montana 0.05 � 0.04 0.12 � 0.20 1.74 � 0.50 0.88 � 0.51 1.88 � 0.37
White-browed Bush Robin1 Luscinia indica 0.06 � 0.07 0.69 � 0.52 1.79 � 0.78 2.47 � 0.23 2.19 � 0.20
Collared Bush Robin2 Luscinia johnstoniae 1.51 � 0.58 0.80 � 0.38 1.68 � 0.49 1.11 � 0.77 1.94 � 0.65
Ferruginous Flycatcher Muscicapa ferruginea – – – 0.27 � 0.31 7.43 � 3.80
Snowy-browed Flycatcher3 Ficedula hyperythra – – – – 0.22 � 0.18
Vivid Niltava Niltava vivida – – – – 0.28 � 0.19
Vinaceous Rosefinch Carpodacus vinaceus 0.13 � 0.19 0.07 � 0.07 1.65 � 0.38 0.86 � 0.33 0.86 � 0.38
Brown Bullfinch3 Pyrrhula nipalensis – – – 0.06 � 0.07 0.12 � 0.10
Grey-headed Bullfinch3 Pyrrhula erythaca 0.09 � 0.07 0.33 � 0.11 0.43 � 0.18 0.64 � 0.16 0.22 � 0.10
Total bird density (No./ha) 11.95a 17.76b 44.71c 44.40c 60.11d
Bird species richness 14a 20b 23c 30d 36e
Bird species diversity 1.89a 2.15b 2.38c 2.30c 2.50d
Total biomass (g/ha) 188.2a 267.9b 536.9c 612.8d 819.3e
The values that are not significantly different ( p > 0.05) are indicated by shared superscript letters.1 Rare in Taiwan.2 Endemic to Taiwan.3 Uncommon in Taiwan.
T.-S. Ding et al. / Forest Ecology and Management xxx (2008) xxx–xxx6
proportion of ground foliage cover (r = �0.69) and foliage
height diversity (r = 0.66) (Table 5). The third axis was
significantly correlated with only a few habitat variables, all of
which were more highly correlated with the first axis or second
axis.
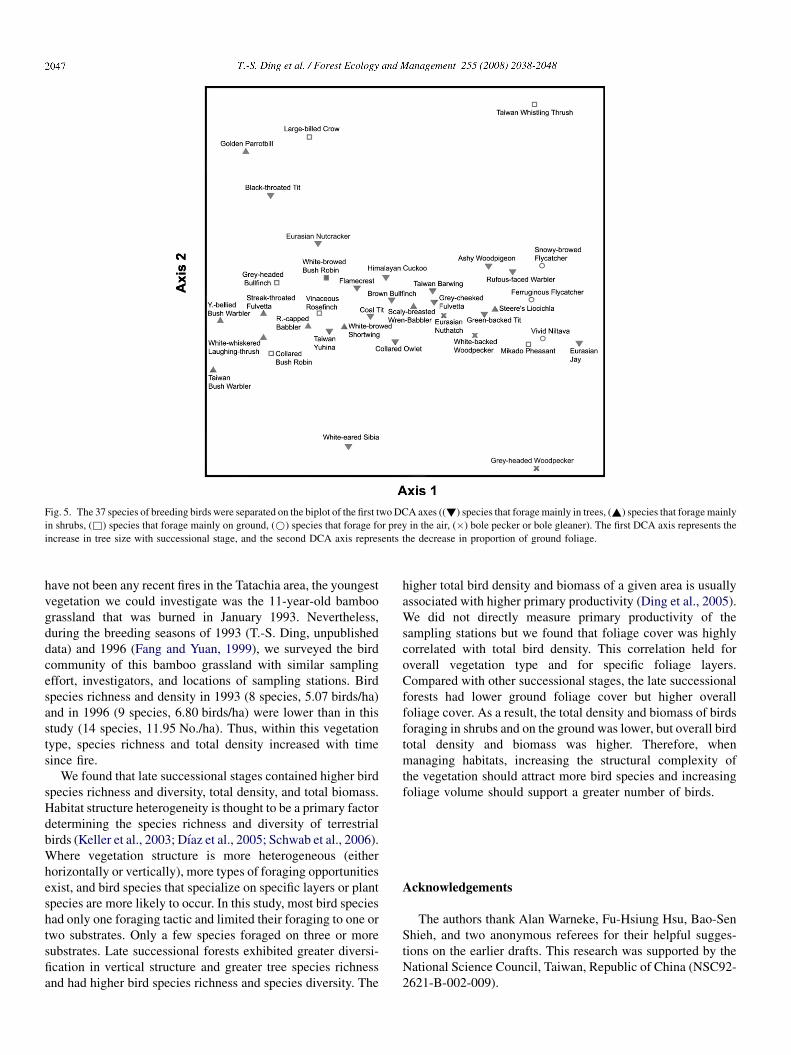
The 37 breeding bird species were well separated on the
biplot of the first two DCA axes (Fig. 5). Most species that
forage in shrubs appear on the left side of first axis. This
corresponds to their preferred habitats, those with fewer trees.
Most species that forage in the upper layers of the forest appear
right of the first axis. Species that only occurred in late
successional stages (aerial insectivores, bole peckers, and bole
gleaner) also appear right of the first axis. Species that forage on
the ground were spread widely on the biplot.
4. Discussion
4.1. Bird species composition in vegetation at different
successional stages
We found that late successional forests contained all the
observed breeding bird species in the Tatachia area. No bird
species were restricted to the early or intermediate successional
stages. This finding differs from the results of many previous
studies in temperate areas (e.g., Hutto, 1995; Imbeau et al.,
1999; Hunter et al., 2001; Litvaitis, 2001; Herrando et al., 2003;
Venier and Pearce, 2005; Paquet et al., 2006). In addition, all
the dominant plant species in early and intermediate succes-
sional stages also occurred in late successional forests. Because

380
381
382
383
384
385
386
387
388
389
390
391
392
393
394
394
395
396
397
398
399
400
401
402
403
404
405
406
407
408
Table 3
The observed distributions in foraging substrates, foraging tactics, and food items and the guild classification of 37 species of breeding birds in the Tatachia area of
Taiwan
Species Guild1 n2 Foraging substrates (%) Foraging tactics (%) Food items (%)
Ground Shrub Leaves Bole Air Flycatch Hawk Glean Peck Plant Invertebrates Vertebrates
Mikado Pheasant GO 2 100 0 0 0 0 0 0 100 0 70 30 0
Ashy Woodpigeon TF 3 0 0 100 0 0 0 0 100 0 100 0 0
Himalayan Cuckoo TI 2 0 0 90 10 0 0 20 80 0 0 100 0
Collared Owlet CA 0 20 0 0 80 0 0 100 0 0 0 0 100
White-backed Woodpecker BP 26 0 0 0 100 0 0 0 0 100 0 100 0
Grey-headed Woodpecker BP 2 0 0 0 100 0 0 0 0 100 0 100 0
Eurasian Nutcracker TI 5 0 0 80 20 0 0 0 100 0 30 70 0
Large-billed Crow GO 30 100 0 0 0 0 0 0 100 0 30 30 40
Eurasian Jay TI 20 0 0 70 30 0 0 20 80 0 30 50 20
Green-backed Tit TI 21 0 0 90 10 0 0 0 100 0 0 100 0
Coal Tit TI 47 4 0 96 0 0 0 0 100 0 0 100 0
Black-throated Tit TI 33 0 5 85 10 0 0 0 100 0 0 100 0
Yellowish-bellied Bush
Warbler
SI 116 0 46 34 20 0 0 0 100 0 0 100 0
Taiwan Bush Warbler SI 6 50 50 0 0 0 0 0 100 0 0 100 0
Rufous-faced Warbler TI 3 0 20 80 0 0 0 0 100 0 0 100 0
Scaly-breasted Wren-Babbler SI 5 40 60 0 0 0 0 0 100 0 0 100 0
Rufous-capped Babbler SI 2 0 90 10 0 0 0 0 100 0 20 80 0
White-whiskered
Laughing-thrush
SI 62 15 41 18 26 0 0 0 100 0 22 78 0
Steere’s Liocichla SI 13 0 70 30 0 0 0 0 100 0 25 75 0
Taiwan Barwing TI 64 0 0 50 50 0 0 0 100 0 27 73 0
Streak-throated Fulvetta SI 131 2 73 17 8 0 0 0 100 0 0 100 0
Grey-cheeked Fulvetta TI 21 0 24 66 10 0 0 0 100 0 15 85 0
White-eared Sibia TI 5 0 0 80 20 0 0 0 100 0 40 60 0
Taiwan Yuhina TI 91 0 2 94 4 0 0 0 100 0 12 88 0
Golden Parrotbill SI 77 0 100 0 0 0 0 0 100 0 0 100 0
Flamecrest TI 85 0 0 90 10 0 0 0 100 0 0 100 0
Eurasian Nuthatch BG 43 0 0 17 83 0 0 0 100 0 0 100 0
Taiwan Whistling Thrush GI 1 100 0 0 0 0 0 10 90 0 0 80 20
White-browed Shortwing SI 5 40 60 0 0 0 0 0 100 0 0 100 0
White-browed Bush Robin GI 30 83 0 0 17 0 0 0 100 0 0 100 0
Collared Bush Robin GI 55 73 0 0 27 0 0 11 89 0 0 100 0
Ferruginous Flycatcher FI 27 0 0 4 0 96 96 0 4 0 0 100 0
Snowy-browed Flycatcher FI 7 0 20 20 0 60 80 0 20 0 0 100 0
Vivid Niltava FI 22 0 0 0 0 100 100 0 0 0 0 100 0
Vinaceous Rosefinch GH 25 48 32 20 0 0 0 0 100 0 100 0 0
Brown Bullfinch TF 26 0 0 100 0 0 0 0 100 0 100 0 0
Grey-headed Bullfinch GH 28 54 32 14 0 0 0 0 100 0 100 0 0
1 Classified guild: CA (carnivore), GO (ground omnivore), GI (ground insectivore), GH (ground herbivore), SI (shrub insectivore), TF (tree insectivore), TF (tree
frugivore), BG (bole gleaner), BP (bole pecker), and FI (aerial insectivore).2 The total number of observed successful foraging behavior. The data for those species with less than 20 records were modified by our previous observations during
breeding seasons in the study site.
T.-S. Ding et al. / Forest Ecology and Management xxx (2008) xxx–xxx 7
all sampling stations in the late successional stages were
located in large, round patches (at least 3 km2) and at least
200 m away from vegetation edge, we think the primary reason
that late successional stages included all the species from
earlier stages is because forest fires and large-area early
successional stages are relatively new and rare to the Tatachia
area and, possibly, the mountain areas of Taiwan.
Taiwan is an island with high annual precipitation, high
humidity, and rugged terrain. For example, the Alishan weather
station (2413 m a.s.l.), about 7 km from the study site, had an
average annual precipitation of 3802 mm and average relative
humidity of 86.5% from 1971 to 2000. Even during the driest
month at the Alishan weather station (January), the average
precipitation was 88 mm and the average relative humidity was
80%. Given the high precipitation and humidity, natural fire
should be relatively rare and limited in the study site and in the
mountain areas of Taiwan. Among the 1454 forest fires
recorded in the National Forests of Taiwan from 1963 to 2004,
fewer than 1% of the fires started naturally and the rest were
started by human activities (e.g., farming, hunting, recreation
and arson) (Lin, 1992; Hwang and Lin, 2005).
Based on several studies of stable isotope ratios in soil
organic matter from the Tatachia area, most, if not all, of the
study site was forested between 500 and 2500 years ago
(Chiang et al., 2004; Hsueh, 2005). Tsukada (1966, 1967)
analyzed the pollen records in Sun-Moon-Lake, about 42 km
from our study site. He found that, during the past 40,000 years,
Gramineae were abundant only in the last 4000 years. Studies in

408
409
410
411
412
413
414
415
416
417
418
419
420
421
421
422
423
424
425
426
427
428
429
430
431
432
433
434
Fig. 3. The 37 species of breeding birds were grouped into 10 ecological guilds based on foraging behavior.
T.-S. Ding et al. / Forest Ecology and Management xxx (2008) xxx–xxx8
Tatachia and Sun-Moon-Lake suggest that forest fires were rare
in the study area before A.D. 1000, when indigenous people first
settled this area. Thus, birds may have had insufficient time and
opportunity to become specialists in early or intermediate
successional stages generated by wildfire.
Typhoons and landslides are other major natural distur-
bances occurring in the forests in Taiwan. Although typhoons
damage forests, they seldom initiate primary succession of
vegetation. Unless typhoons cause large areas of landslides,
most trees are still alive after typhoons and the plant species
composition is not changed dramatically. Landslides sweep
away most trees and start primary succession of vegetation.
However, the early successional stages caused by landslides
Table 4
The relative abundance (%) of bird guilds in the five vegetation types
Guild Bamboo grassland Pine savanna
Carnivore 0 0
Ground omnivore 0 0.2
Ground insectivore 13.1 8.4
Ground herbivore 1.9 2.2
Shrub insectivore 78.6 72.9
Tree insectivore 6.4 16.1
Tree frugivore 0 0.1
Bole gleaner 0 0
Bole pecker 0 0
Aerial insectivore 0 0
usually consist of a narrow band that spans the elevational
gradient. Most plant and animal species in the mountain areas
of Taiwan are distributed within a narrow elevation range. The
early successional stages regenerated in landslide areas often
differed greatly with elevation. This further limits the area of
early and intermediate successional stages and the chance that
birds will become specialists of them.
Maintaining land mosaics of various vegetation types at
different successional stages, which usually results in higher
species richness, has been a guiding principle of habitat
management for conserving biodiversity (reviewed in Tews
et al., 2004; Bennett et al., 2006; Parr and Andersen, 2006). We
found that some shrub foragers were more abundant in the early
Pine woodland Hemlock forest Spruce forest
0 0.1 0
0.1 0.2 0.1
7.8 8.1 7.0
0.9 3.4 1.8
52.0 27.6 18.9
39.1 58.1 58.2
0.1 0.2 0.5
0 1.6 0.2
0 0.1 0.1
0 0.6 13.2

434
435
436
437
438
439
440
441
442
443
444
445
446
447
448
449
450
451
452
453
454
455
456
457
458
459
460
461
462
463
464
465
466
466
467
468
469
470
471
472
473
474
475
476
477
478
479
480
481
482
483
484
485
486
487
488
489
490
491
492
493
494
Fig. 4. The distribution of the 22 sampling stations on the DCA biplot
correlated closely with the successional stage of the vegetation in which each
station was located. The first DCA axis represents the increase in tree size with
successional stage, and the second DCA axis represents the decrease in
proportion of ground foliage.
Table 5
Correlations between the habitat variables and the first three axes of the DCA
Axis 1 Axis 2 Axis 3
Length (standard deviation) 1.607 0.679 0.669
Eigenvalue 0.220 0.022 0.013
Abiotic attributes
Altitude (m) �0.75* �0.60* 0.37
Aspect 0.02 0.56* �0.37
Physiognomic attributes
Vegetation height (m) 0.94* 0.38 �0.16
Herb cover (%) �0.36 0.03 0.18
Shrub cover (%) 0.30 0.59* �0.52
Sub-canopy cover (%) 0.82* 0.35 �0.20
Canopy cover (%) 0.89* 0.32 �0.30
Total foliage cover (%) 0.86* 0.54* �0.49
Proportion of ground foliage (%) �0.71* �0.69* 0.62*
Tree density (No./ha) 0.73* 0.37 �0.18
Mean DBH (cm) 0.29 0.44 �0.47
CV of DBH (cm) 0.75* 0.39 �0.05
Total BA of trees (m3/ha) 0.92* 0.42 �0.19
Total BA of snags (m3/ha) 0.73* 0.21 �0.12
Foliage height diversity 0.78* 0.66* �0.59*
Floristic attributes
Tree species richness 0.84* 0.36 �0.22
Tree species diversity 0.44 0.61* �0.48
Proportion of broadleaf foliage (%) 0.83* 0.33 0.17
* p < 0.01.
T.-S. Ding et al. / Forest Ecology and Management xxx (2008) xxx–xxx 9
successional stages, indicating this habitat has special value for
shrub foragers. However, if species that occurred in early or
intermediate successional stages are common in late succes-
sional habitats, there may be no need to actively manage
for early or intermediate successional habitats in areas
where disturbance was historically rare. Instead, we should
maintain large area of late successional stages, which are
often threatened with destruction in developing countries
(Soule, 1991).
4.2. Abundance of bird ecological guilds in different
successional stages
More than 90% of the birds in this study were insectivores.
Omnivores and herbivores were rare. In general, most of the
terrestrial bird species in the world are insectivores. Insecti-
vores are usually dominant in coniferous forests (Fernandez-
Juricic, 2000), which often have fewer plant species and
subsequently provide fewer types of food for omnivores and
herbivores than other vegetation types.
The abundance of foliage insectivores (species that prey on
insects on foliage) is correlated with the distribution of foliage
(Yuan et al., 2005). We found that shrub insectivores were
dominant in bamboo grassland and pine savanna, where most
foliage occurs as herbs and shrubs, and were less common in
pine woodland, hemlock forest, and spruce forest. Likewise,
tree insectivores dominated in late successional stages, in which
most forest foliage was on sub-canopy and canopy trees.
Aerial insectivores (three species of flycatchers) were
present only in late successional forests. Flycatchers usually
perch on solitary twigs and catch flying insects in the air. This
foraging behavior and their abundance are highly correlated
with increasingly diverse foliage structure (Holmes and Recher,
1986). The hemlock forests and spruce forests in this study area
had taller vegetation, more total foliage volume, and a more
even vertical distribution of foliage. Thus, these forests provide
more perching twigs and, possibly, more insects for the
flycatchers that other vegetation types.
Many studies (e.g., Hutto, 1995; Schieck and Song, 2006)
have reported that bole peckers and bole gleaners are more
common in burned areas. Forest fires often create plenty of
snags and logs, which provide more foraging substrates
and nesting sites for bole specialists (Hutto, 1995; Imbeau
et al., 1999). We found the bole peckers and bole gleaners
were only present in late successional stages and were not
found in the early and intermediate successional stages. This
is likely because the bamboo grassland in the study site
burned at least four times in the past 70 years. The frequent
fires in the bamboo grassland prevent the existence of snags,
as found in our results. Additionally, the high temperature
and humidity of the study site resulted in relatively rapid
decomposition of snags. As a result, few bole peckers or bole
gleaners recruit to burned areas. Snags only become common
in mature forests after some trees die of competition or
disease.
4.3. Relationships between bird community characteristics
and vegetation structure
We found that species diversity and the total density of
breeding birds increased with time of succession. However,
some studies (e.g., Imbeau et al., 1999; Keller et al., 2003; Pons
and Wendenburg, 2005) reported that bird species diversity and
total density peaked 0–12 years following fires. Because there
6
494
495
496
497
498
499
500
501
502
503
504
505
506
507
508
509
510
511
512
513
514
515
516
517
518
519
520
520
521
522
523
524
525
526
527
528
529
530
531
532
533
534
535
536
537
538
539
540
541
542
Fig. 5. The 37 species of breeding birds were separated on the biplot of the first two DCA axes ((!) species that forage mainly in trees, (~) species that forage mainly
in shrubs, (&) species that forage mainly on ground, (*) species that forage for prey in the air, (�) bole pecker or bole gleaner). The first DCA axis represents the
increase in tree size with successional stage, and the second DCA axis represents the decrease in proportion of ground foliage.
T.-S. Ding et al. / Forest Ecology and Management xxx (2008) xxx–xxx10
have not been any recent fires in the Tatachia area, the youngest
vegetation we could investigate was the 11-year-old bamboo
grassland that was burned in January 1993. Nevertheless,
during the breeding seasons of 1993 (T.-S. Ding, unpublished
data) and 1996 (Fang and Yuan, 1999), we surveyed the bird
community of this bamboo grassland with similar sampling
effort, investigators, and locations of sampling stations. Bird
species richness and density in 1993 (8 species, 5.07 birds/ha)
and in 1996 (9 species, 6.80 birds/ha) were lower than in this
study (14 species, 11.95 No./ha). Thus, within this vegetation
type, species richness and total density increased with time
since fire.
We found that late successional stages contained higher bird
species richness and diversity, total density, and total biomass.
Habitat structure heterogeneity is thought to be a primary factor
determining the species richness and diversity of terrestrial
birds (Keller et al., 2003; Dıaz et al., 2005; Schwab et al., 2006).
Where vegetation structure is more heterogeneous (either
horizontally or vertically), more types of foraging opportunities
exist, and bird species that specialize on specific layers or plant
species are more likely to occur. In this study, most bird species
had only one foraging tactic and limited their foraging to one or
two substrates. Only a few species foraged on three or more
substrates. Late successional forests exhibited greater diversi-
fication in vertical structure and greater tree species richness
and had higher bird species richness and species diversity. The
higher total bird density and biomass of a given area is usually
associated with higher primary productivity (Ding et al., 2005).
We did not directly measure primary productivity of the
sampling stations but we found that foliage cover was highly
correlated with total bird density. This correlation held for
overall vegetation type and for specific foliage layers.
Compared with other successional stages, the late successional
forests had lower ground foliage cover but higher overall
foliage cover. As a result, the total density and biomass of birds
foraging in shrubs and on the ground was lower, but overall bird
total density and biomass was higher. Therefore, when
managing habitats, increasing the structural complexity of
the vegetation should attract more bird species and increasing
foliage volume should support a greater number of birds.
Uncited Qreferences
Fuller and DeStefano (2003) and Lee et al. (2004).
Acknowledgements
The authors thank Alan Warneke, Fu-Hsiung Hsu, Bao-Sen
Shieh, and two anonymous referees for their helpful sugges-
tions on the earlier drafts. This research was supported by the
National Science Council, Taiwan, Republic of China (NSC92-
2621-B-002-009).

542
543
544
545
546
547
548
549
550
551
552
553
554
555
556
557
558
559
560
561
562
563
564
565
566
567
568
569
570
571
572
573
574
575
576
577
578
579
580
581
582
583
584
585
586
587
588
589
590
591
592
593
594
595
596
597
598
599
600
601
602
603
604
605
605
606
607
608
609
610
611
612
613
614
615
616
617
618
619
620
621
622
623
624
625
626
627
628
629
630
631
632
633
634
635
636
637
638
639
640
641
642
643
644
645
646
647
648
649
650
651
652
653
654
655
656
657
658
659
660
661
662
663
664
665
666
667
668
669669
T.-S. Ding et al. / Forest Ecology and Management xxx (2008) xxx–xxx 11
References
Attiwill, P.M., 1994. The disturbance of forest ecosystems—the ecological basis
for conservative management. For. Ecol. Manage. 63, 247–300.
Barbaro, L., Rossi, J.P., Vetillard, F., Nezan, J., Jactel, H., 2007. The spatial
distribution of birds and carabid beetles in pine plantation forests: the role of
landscape composition and structure. J. Biogeogr. 34, 652–664.
Bennett, A.F., Radford, J.Q., Haslem, A., 2006. Properties of land mosaics:
implications for nature conservation in agricultural environments. Biol.
Conserv. 133, 250–264.
Brawn, J.D., Robinson, S.K., Thompson III, F.R., 2001. The role of distur-
bance in the ecology and conservation of birds. Annu. Rev. Ecol. Syst. 32,
251–276.
Chiang, P.N., Wang, M.K., Chiu, C.Y., King, H.B., Hwong, J.L., 2004. Changes
in the grassland-forest boundary at Ta-Ta-Chia long term ecological
research (LTER) site detected by stable isotope ratios of soil organic matter.
Chemosphere 54, 217–224.
Cochrane, M.A., Schulze, M.D., 1999. Fire as a recurrent event in tropical
forests of the eastern Amazon: effects on forest structure, biomass, and
species composition. Biotropica 31, 2–16.
DeGraaf, R.M., Yamasaki, M., 2003. Options for managing early-successional
forest and shrubland bird habitats in the Northeastern United States. For.
Ecol. Manage. 185, 179–191.
Dıaz, I.A., Armesto, J.J., Reid, S., Sieving, K.E., Willson, M.F., 2005. Linking
forest structure and composition: avian diversity in successional forests of
Chiloe Island. Chile. Biol. Conserv. 123, 91–101.
Dickinson, E.C. (Ed.), 2003. The Howard and Moore Complete Checklist of
the Birds of the World. third ed. Princeton University Press, Princeton, USA.
Ding, T.-S., Yuan, H.-W., Geng, S., Lin, Y.-S., Lee, P.-F., 2005. Energy flux,
body size, and density in relation to bird species richness along an eleva-
tional gradient in Taiwan. Global Ecol. Biogeogr. 14, 299–306.
Fang, C.-Y., Yuan, H.-W., 1999. Effects of pine forest fire to the bird commu-
nity in the Tatachia Area, Nantou County, Taiwan. Q. J. Chin. For. 32,
1–12.
Fernandez-Juricic, E., 2000. Forest fragmentation affects winter flock formation
of an insectivorous guild. Ardea 88, 235–241.
Fuller, T.K., DeStefano, S., 2003. Relative importance of early-successional
forests and shrubland habitats to mammals in the northern United States.
For. Ecol. Manage. 185, 75–79.
Green, K., Sanecki, G., 2006. Immediate and short-term responses of bird and
mammal assemblages to a subalpine wildfire in the Snowy Mountains,
Australia. Austral. Ecol. 31, 673–681.
Herrando, S., Brotons, L., Llacuna, S., 2003. Does fire increase the spatial
heterogeneity of bird communities in Mediterranean landscapes? Ibis 145,
307–317.
Holmes, R.T., Recher, H.F., 1986. Search tactics of insectivorous birds foraging
in an Australia eucalypt (Eucalyptus) forest. Auk 103, 515–530.
Hsueh, Y.-H., 2005. Using stable carbon isotope and black carbon to infer the
possible major vegetation types dynamics in Tatachia area, central Taiwan.
Master Thesis. National Taiwan University, Taipei, Taiwan.
Hunter, W.C., Buehler, D.A., Canterbury, R.A., Confer, J.L., Hamel, P.B., 2001.
Conservation of disturbance-dependent birds in eastern North America.
Wildl. Soc. Bull. 29, 440–455.
Hutto, R.L., 1995. Composition of bird communities following stand-replace-
ment fires in Northern Rocky Mountain (U.S.A.) conifer forests. Conserv.
Biol. 9, 1041–1058.
Hwang, C.Y., Lin, C.-C., 2005. Analysis of forest fires in Taiwan national
forests. Q. J. Chin. For. 38, 449–464.
Imbeau, L., Savard, J.P.L., Gagnon, R., 1999. Comparing bird assemblages in
successional black spruce stands originating from fire and logging. Can. J.
Zool. 77, 1850–1860.
Keller, J.K., Richmond, M.E., Smith, C.R., 2003. An explanation of patterns of
breeding bird species richness and density following clearcutting in north-
eastern USA forests. For. Ecol. Manage. 174, 541–564.
Lee, P.-F., Ding, T.-S., Hsu, F.-S., Geng, S., 2004. Bird species richness in
Taiwan: distribution on gradients of elevation, primary productivity, and
urbanization. J. Biogeogr. 31, 307–314.
Lin, C.-C., 1992. Analysis of fires in national forests in Taiwan (1963–1991).
Bull. Taiwan For. Res. Inst. 7, 169–178.
Linder, P., Elfving, B., Zackrisson, O., 1997. Stand structure and successional
trends in virgin boreal forest reserves in Sweden. For. Ecol. Manage. 98,
17–33.
Litvaitis, J.A., 2001. Importance of early successional habitats to mammals in
eastern forests. Wildl. Soc. Bull. 29, 466–473.
McCune, B., Mefford, M.J., 1999. Multivariate Analysis of Ecological Data,
version 4.25. MjM Software, Gleneden Beach, USA.
Oppel, S., 2006. Long-term changes of a coastal bird breeding community on a
small island—does natural succession compromise conservation values?
Biodivers. Conserv. 14, 3407–3422.
Paquet, J.-Y., Vandevyvre, X., Delahaye, L., Rondeux, J., 2006. Bird assem-
blages in a mixed woodland-farmland landscape: the conservation value of
silviculture-dependant open areas in plantation forest. For. Ecol. Manage.
227, 59–70.
Parr, C.L., Andersen, A.N., 2006. Patch mosaic burning for biodiversity
conservation: a critique of the pyrodiversity paradigm. Conserv. Biol. 20,
1610–1619.
Pons, R., Wendenburg, C., 2005. The impact of fire and forest conversion into
savanna on the bird communities of West Madagascan dry forests. Anim.
Conserv. 8, 183–193.
Rasmussen, P.C., Round, P.D., Dickinson, E.C., Rozendaal, F.G., 2000. A new
bush-warbler (Sylviidae, Bradypterus) from Taiwan. Auk 117, 279–289.
Reynolds, R.T., Scott, J.M., Nussbaum, R.A., 1980. A variable circular-plot
method for estimating bird numbers. Condor 82, 309–313.
Sara, M., Bellia, E., Milazzo, A., 2006. Fire disturbance disrupts co-occurrence
patterns of terrestrial vertebrates in Mediterranean woodlands. J. Biogeogr.
33, 843–852.
Schieck, J., Song, S.J., 2006. Changes in bird communities throughout succes-
sion following fire and harvest in boreal forests of western North America:
literature review and meta-analyses. Can. J. For. Res. 36, 1299–1318.
Schwab, F.E., Simon, N.P.P., Sinclair, A.R.E., 2006. Bird–vegetation relation-
ships in Southern British Columbia. J. Wildl. Manag. 70, 189–197.
Shiu, H.-J., Ding, T.-S., Sheu, J.-E., Lin, R.-S., Koh, C.-N., Lee, P.-F., 2005.
Morphological characters of bird species in Taiwan. Taiwania 50, 80–92.
Shiu, H.-J., Lee, P.F., 2003. Assessing avian point-count duration and sample
size using species accumulation functions. Zool. Stud. 42, 357–367.
Soule, M.E., 1991. Conservation—tactics for a constant crisis. Science 253,
744–750.
Su, H.-J., 1984. Studies on the climate and vegetation types of the natural forests
in Taiwan (II): altitudinal vegetation zones in relation to temperature
gradient. Q. J. Chin. For. 17, 57–73.
Su, H.-J., 1987. Forest habitat factors and their quantitative assessment. Q. J.
Chin. For. 20, 1–14.
Tews, J., Brose, U., Grimm, V., Tielborger, K., Wichmann, M.C., Schwager, M.,
Jeltsch, F., 2004. Animal species diversity driven by habitat heterogeneity/
diversity: the importance of keystone structures. J. Biogeogr. 31, 79–92.
Tsukada, M., 1966. Late Pleistocene vegetation and climate in Taiwan (For-
mosa). Proc. Natl. Acad. Sci. U.S.A. 55, 543–548.
Tsukada, M., 1967. Vegetation in subtropical Formosa during the Pleistocene
and the Holocene. Paleogeogr. Paleoclimatol. Paleoecol. 3, 49–64.
Venier, L.A., Pearce, J.L., 2005. Boreal bird community response to jack pine
forest succession. For. Ecol. Manage. 217, 19–36.
Wang, D.P., Ji, S.Y., Chen, F.P., Xing, F.W., Peng, S.L., 2006. Diversity and
relationship with succession of naturally regenerated southern subtropical
forests in Shenzhen, China and its comparison with the zonal climax of
Hong Kong. For. Ecol. Manage. 222, 384–390.
Yuan, H.-W., Ding, T.-S., Hsieh, H.-I., 2005. Short-term responses of animal
communities to thinning in a Cryptomeria japonica (Taxodiaceae) planta-
tion in Taiwan. Zool. Stud. 44, 393–402.
Ding
打字機文字


![FOREST STRUCTURE ON BIRD SPECIES COMPOSITION IN … · on forest resources for livelihood [1]. Given the rapid population growth and ensuing increased ... unsustainable, with burning,](https://static.fdocuments.net/doc/165x107/5f27ad84f98f92669c4ed617/forest-structure-on-bird-species-composition-in-on-forest-resources-for-livelihood.jpg)