Breakeven and Leverage
29
Breakeven and Leverage Part of Chapter 13
-
Upload
dinhkhuong -
Category
Documents
-
view
226 -
download
0
Transcript of Breakeven and Leverage
Breakeven and Leverage
Part of Chapter 13
2
Read parts of chapter related to breakeven and leverage (DOL, DFL, DTL)
Breakeven Operating, financial and total leverage
Risk Capital structure is a risk decision and that is
why this is in chapter 13, but the parts we are pulling out of chapter 13 now rely on the income statement and fit well with what we have covered in chapter 3 and AFN.
3
Breakeven Analysis
Used to determine the level of sales a firm must achieve to stay in business in the long run
Shows the mix of fixed and variable cost and the volume required for zero profit/loss Profit/loss generally measured by EBIT
(operating profit/loss)
4
Breakeven Analysis
Breakeven Diagrams Sales level is considered the big uncertainty
Operating Breakeven occurs at the intersection of revenue and total operating cost
Represents the level of sales at which revenue equals cost
Usually operating breakeven (interest ignored) And financial breakeven Need variable cost–fixed cost breakdown Variable cost per unit assumed constant
5
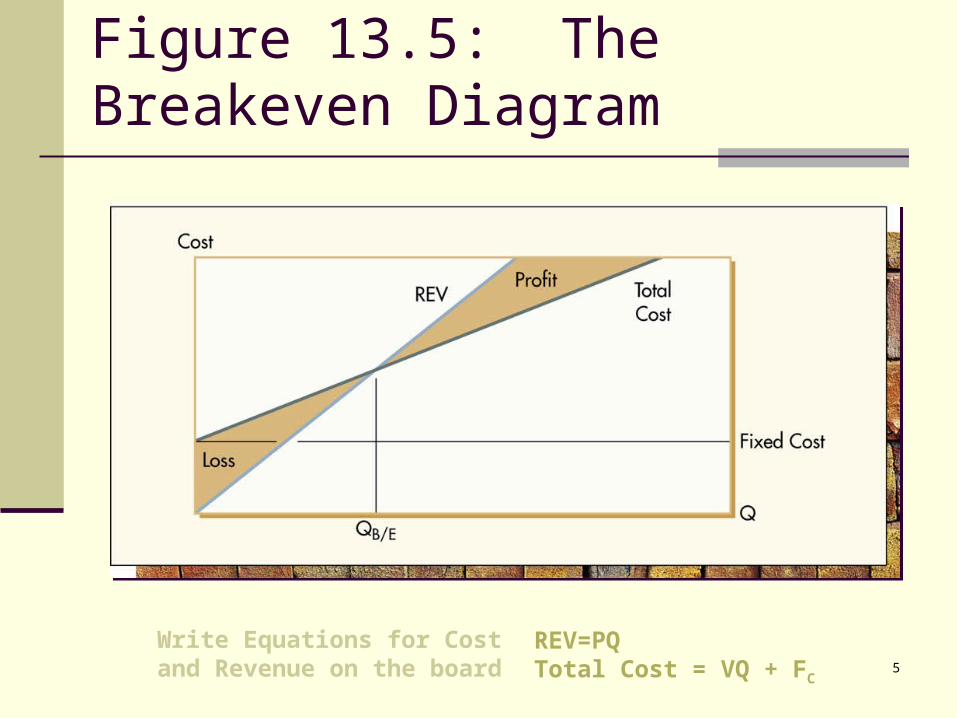
Figure 13.5: The Breakeven Diagram
Write Equations for Cost and Revenue on the board
REV=PQTotal Cost = VQ + FC
6
Breakeven Analysis The Contribution Margin
Every sale makes a ‘contribution’ per unit of the difference between price (P) and variable cost (V)
Ct = P – V Can be expressed as a percentage of the
price Known as the contribution margin (CM) CM = (P – V) / P
7
Breakeven Analysis—Example
Q: Suppose a company can make a unit of product for $7 in variable labor and materials, and sell it for $10. What are the contribution and contribution margin?
A: The contribution per unit is $3, or $10 - $7, while the contribution margin is $3 / $10, or 30%.
Exa
mpl
e
8
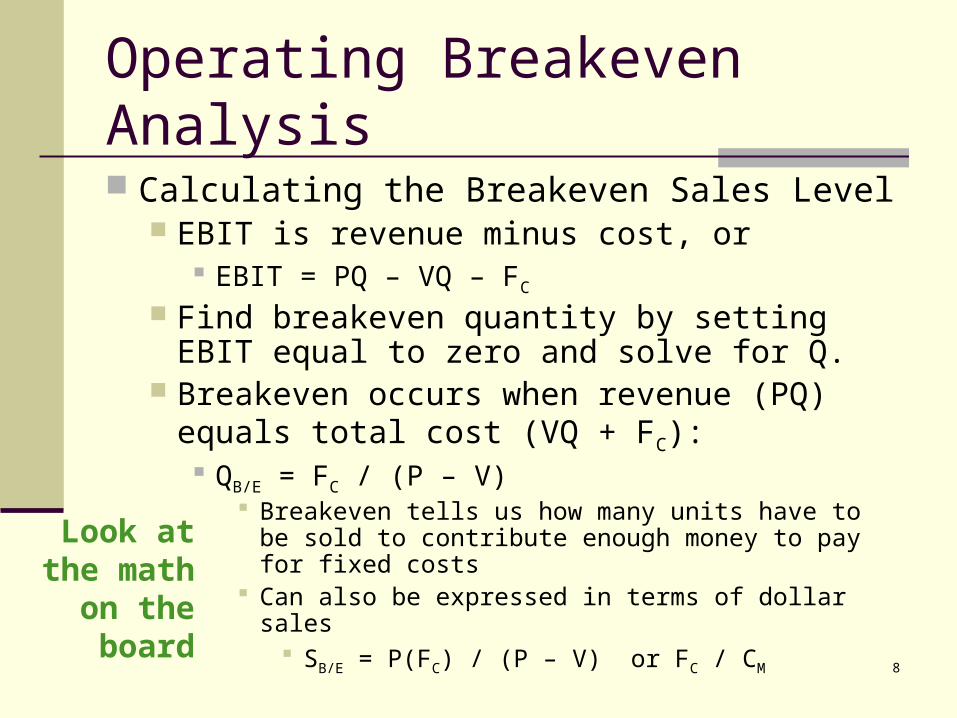
Operating Breakeven Analysis Calculating the Breakeven Sales Level
EBIT is revenue minus cost, or EBIT = PQ – VQ – FC
Find breakeven quantity by setting EBIT equal to zero and solve for Q.
Breakeven occurs when revenue (PQ) equals total cost (VQ + FC):
QB/E = FC / (P – V) Breakeven tells us how many units have to be sold
to contribute enough money to pay for fixed costs Can also be expressed in terms of dollar sales
SB/E = P(FC) / (P – V) or FC / CM
Look at the math
on the board
9
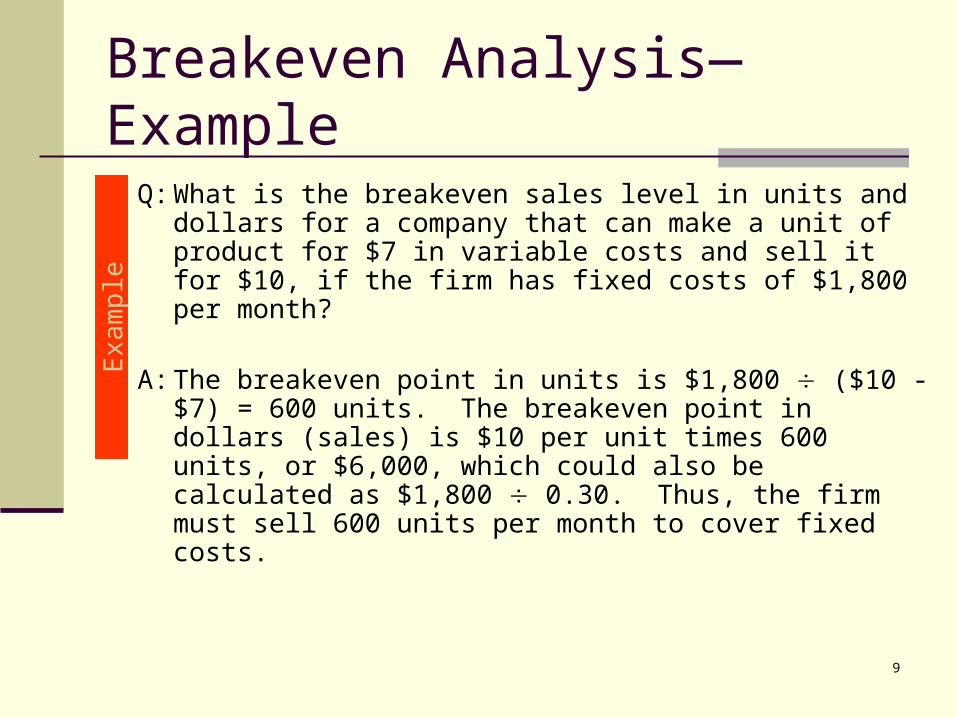
Breakeven Analysis—Example
Q: What is the breakeven sales level in units and dollars for a company that can make a unit of product for $7 in variable costs and sell it for $10, if the firm has fixed costs of $1,800 per month?
A: The breakeven point in units is $1,800 ($10 - $7) = 600 units. The breakeven point in dollars (sales) is $10 per unit times 600 units, or $6,000, which could also be calculated as $1,800 0.30. Thus, the firm must sell 600 units per month to cover fixed costs.
Exa
mpl
e
10
Risk in the Context of Leverage Leverage potentially affects the stock price
Alters the risk/return relationship in an equity investment
Measures of performance Operating income (AKA: EBIT)
Unaffected by leverage because it is calculated prior to the deduction for interest
Return on Equity (ROE) is Net Income Stockholders’ Equity
Earnings per Share (EPS) is Net Income number of shares
Investors regard EPS as an important indicator of future profitability
skim
11
Risk in the Context of Leverage
Redefining Risk for Leverage-Related Issues Leverage-related risk is variation in ROE
and EPS Business risk—variation in EBIT Financial risk—additional variation in
ROE and EPS brought about by financial leverage
12
Leverage and Risk—Two Kinds 1. Operating leverage (operating risk) and
2.Financial leverage (financial risk) Operating leverage affects a firm’s business risk Relates to a company’s cost structure
Involves relative use of fixed versus variable costs (more fixed cost is more operating leverage)
If doing a task with a fixed cost is cheaper than doing it with a variable cost then operating leverage will improve a firm’s ROE and EPS
14
The Effect of Operating Leverage
As volume moves away from breakeven, profit or loss increases faster with more operating leverage
The Risk Effect More operating leverage leads to larger variations in EBIT,
or business risk The Effect on Expected EBIT
Thus, when a firm is operating above breakeven, more operating leverage implies higher operating profit
If a firm is relatively sure of its sales level, it is in the firm’s best interests to trade variable costs for fixed cost (assuming the firm is operating above breakeven)
15
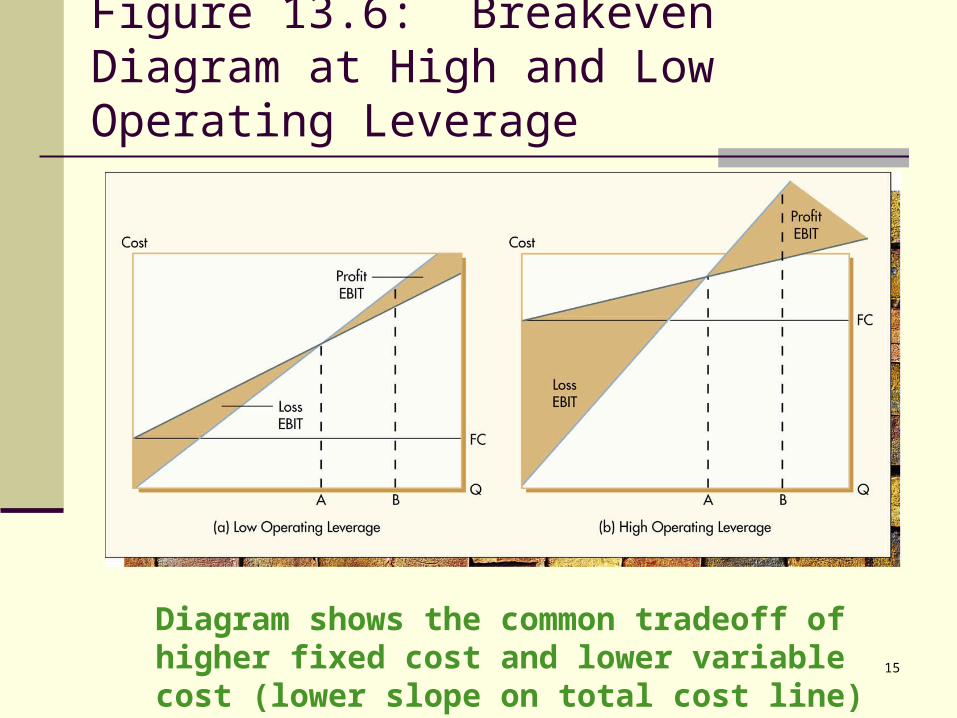
Figure 13.6: Breakeven Diagram at High and Low Operating Leverage
Diagram shows the common tradeoff of higher fixed cost and lower variable cost (lower slope on total cost line)
16
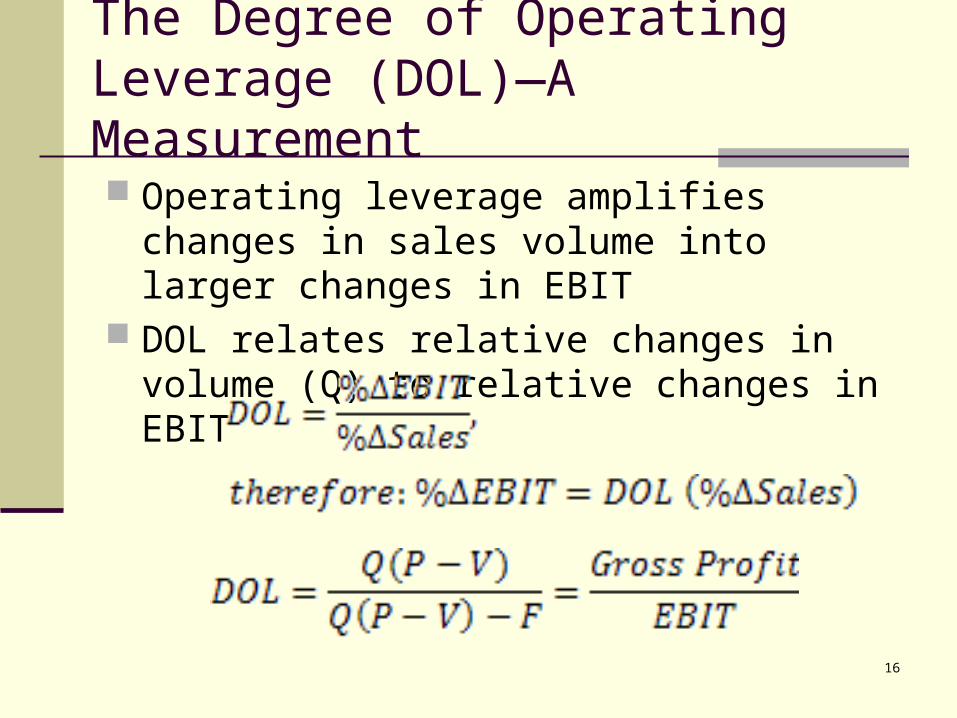
The Degree of Operating Leverage (DOL)—A Measurement Operating leverage amplifies changes in
sales volume into larger changes in EBIT DOL relates relative changes in volume (Q) to
relative changes in EBIT
18
The Degree of Operating Leverage (DOL)—A Measurement
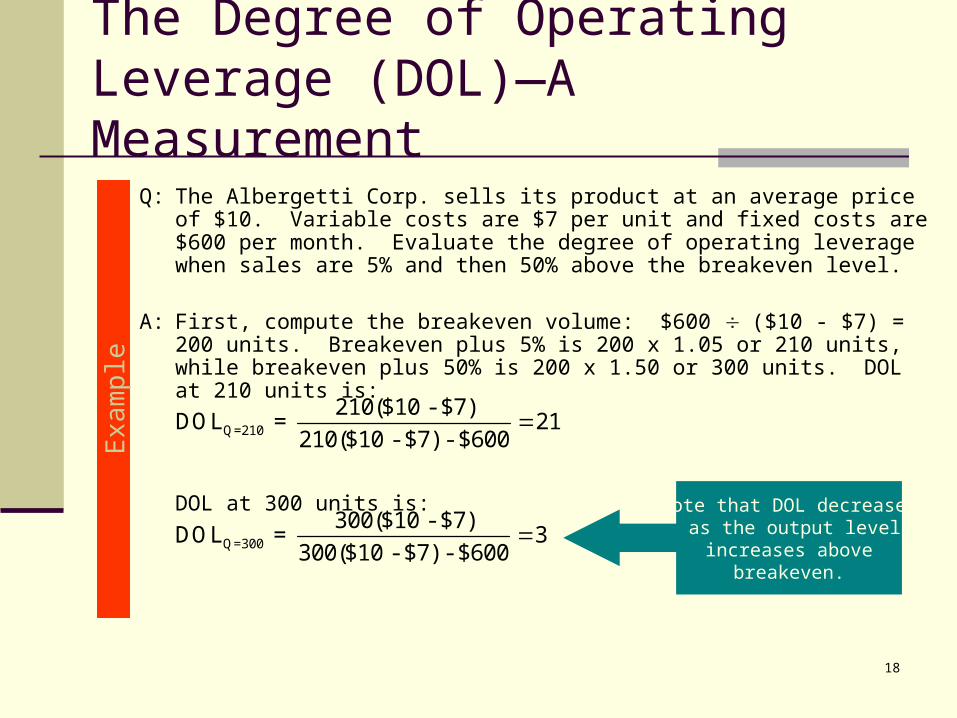
Q: The Albergetti Corp. sells its product at an average price of $10. Variable costs are $7 per unit and fixed costs are $600 per month. Evaluate the degree of operating leverage when sales are 5% and then 50% above the breakeven level.
A: First, compute the breakeven volume: $600 ($10 - $7) = 200 units. Breakeven plus 5% is 200 x 1.05 or 210 units, while breakeven plus 50% is 200 x 1.50 or 300 units. DOL at 210 units is:
DOL at 300 units is:
Exa
mpl
e
Note that DOL decreases as the output level
increases abovebreakeven.
Q=210210($10 - $7)DOL = 21
210($10 - $7) - $600
Q=300300($10 - $7)DOL = 3
300($10 - $7) - $600
19
Financial Leverage
The use of borrowed money incurs interest, which is like a fixed cost
If returns are greater than the interest rate then financial leverage will improve a firm’s ROE and EPS
However, if returns are lower than the interest rate then borrowing money will worsen EPS and ROE
20
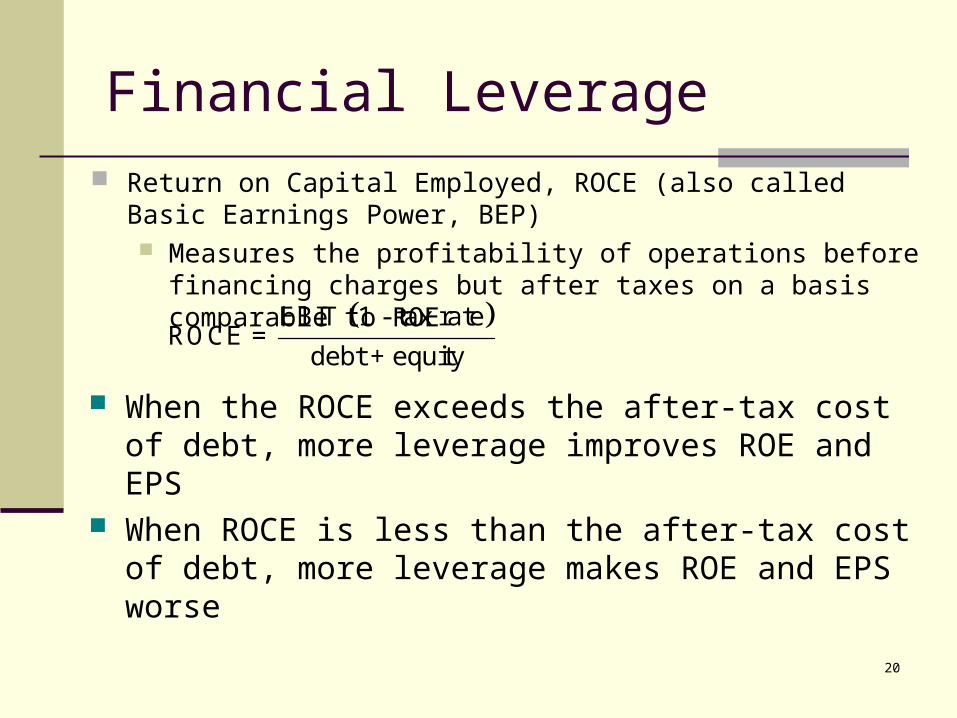
Financial Leverage Return on Capital Employed, ROCE (also called Basic Earnings
Power, BEP) Measures the profitability of operations before financing charges
but after taxes on a basis comparable to ROE EBIT 1 - tax rate
ROCE = debt + equity
When the ROCE exceeds the after-tax cost of debt, more leverage improves ROE and EPS
When ROCE is less than the after-tax cost of debt, more leverage makes ROE and EPS worse
21
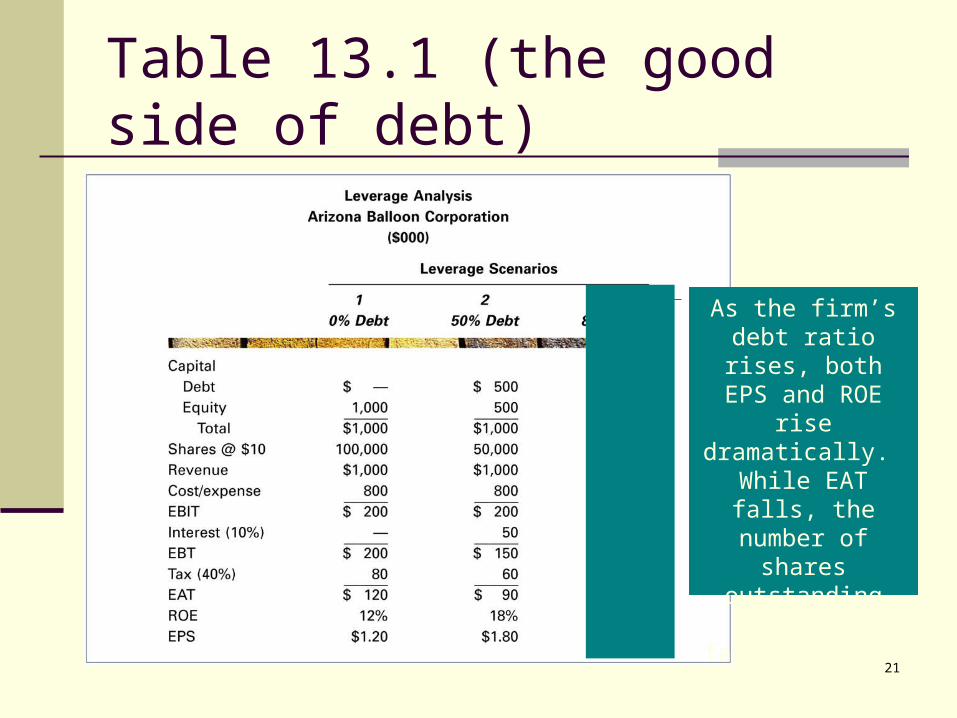
Table 13.1 (the good side of debt)
As the firm’s debt ratio rises, both
EPS and ROE rise dramatically. While
EAT falls, the number of shares
outstanding falls at a faster rate as debt replaces
equity.
22
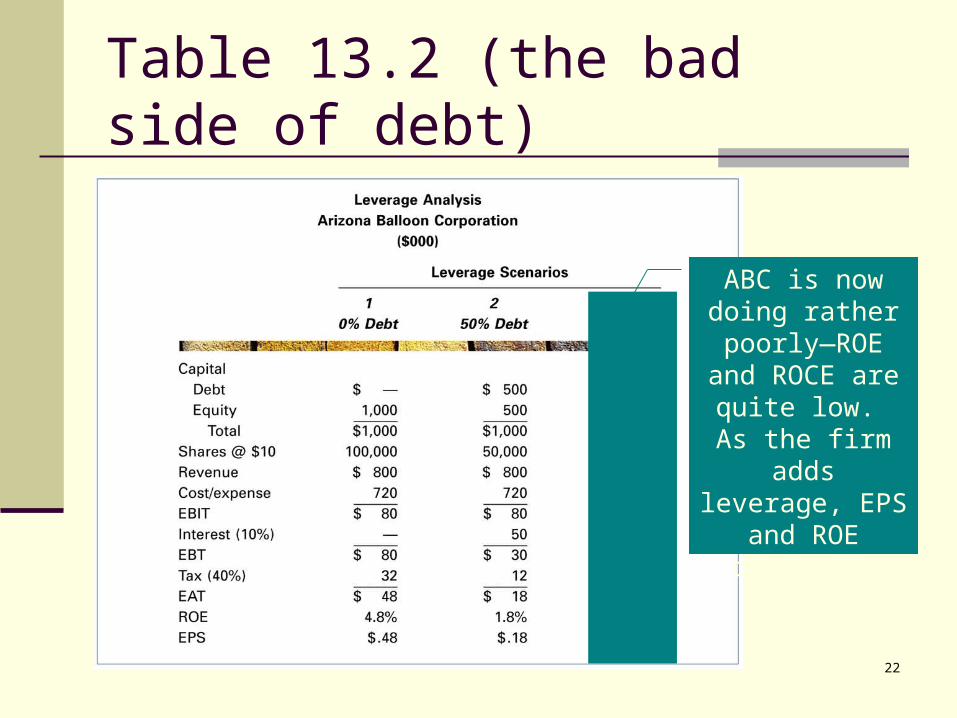
Table 13.2 (the bad side of debt)
ABC is now doing rather
poorly—ROE and ROCE are quite low. As the firm adds leverage, EPS and ROE
decrease.
23
Financial Leverage and Financial Risk Financial leverage is a two-edged sword
Multiplies good results into great results Multiplies bad results into terrible results
ROE and EPS for leveraged firms experience more variation
Financial risk is the increased variability in financial results that comes from additional leverage
skim
24
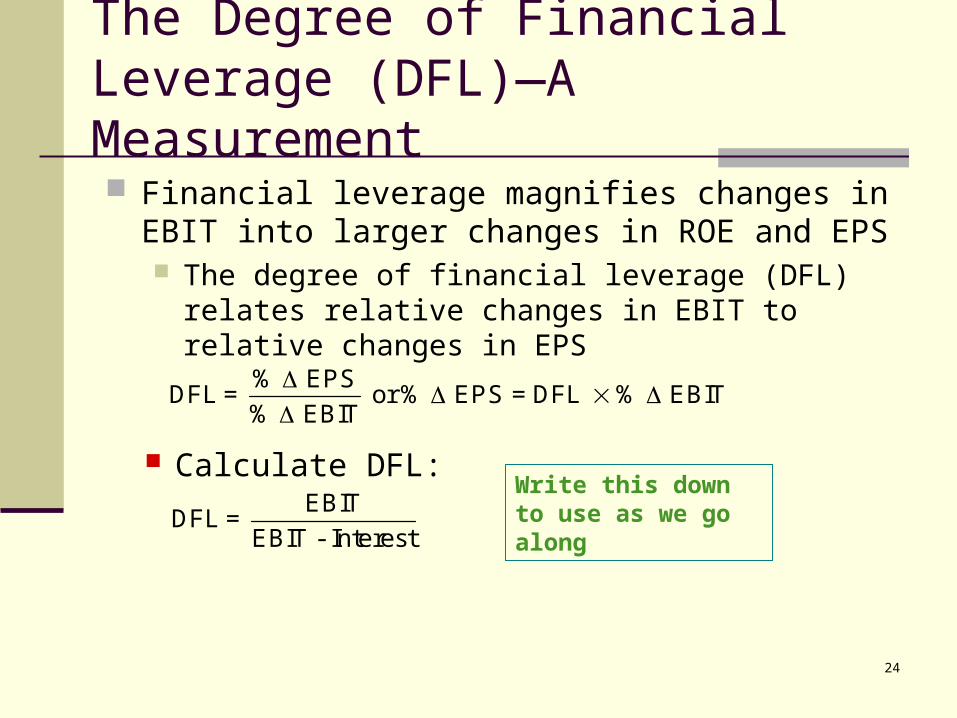
The Degree of Financial Leverage (DFL)—A Measurement Financial leverage magnifies changes in EBIT into
larger changes in ROE and EPS The degree of financial leverage (DFL) relates relative
changes in EBIT to relative changes in EPS
% EPSDFL = or % EPS = DFL % EBIT% EBIT
Calculate DFL:EBITDFL =
EBIT - InterestWrite this down to use as we go along
25
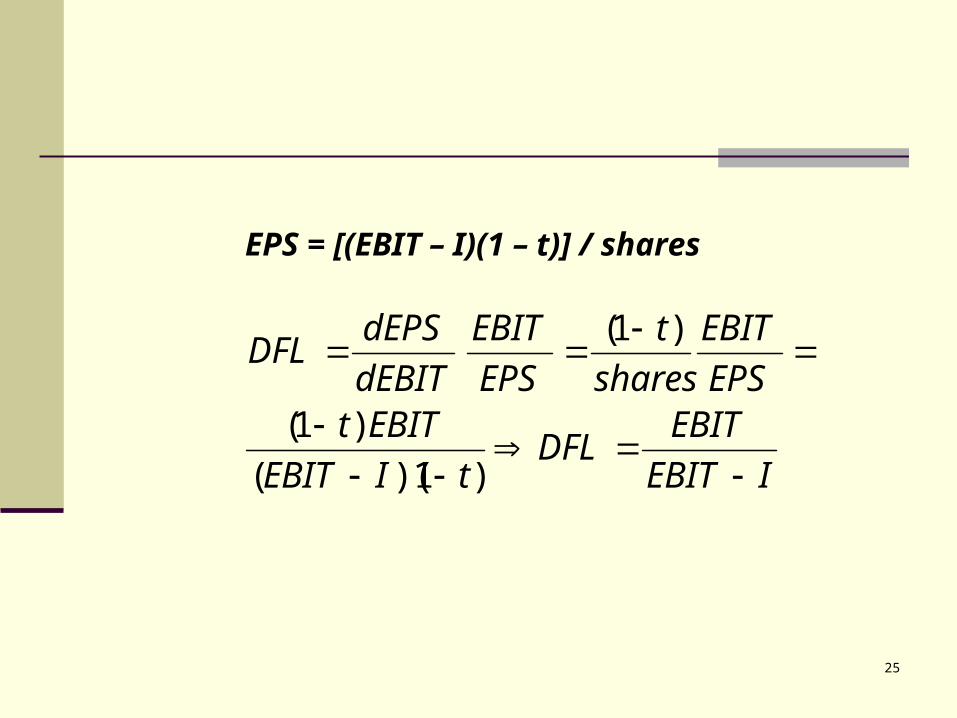
EPS = [(EBIT – I)(1 – t)] / shares
IEBITEBITDFL
tIEBITEBITt
EPSEBIT
sharest
EPSEBIT
dEBITdEPSDFL
)1)(()1(
)1(
26
The Degree of Financial Leverage (DFL)—A Measurement—Example
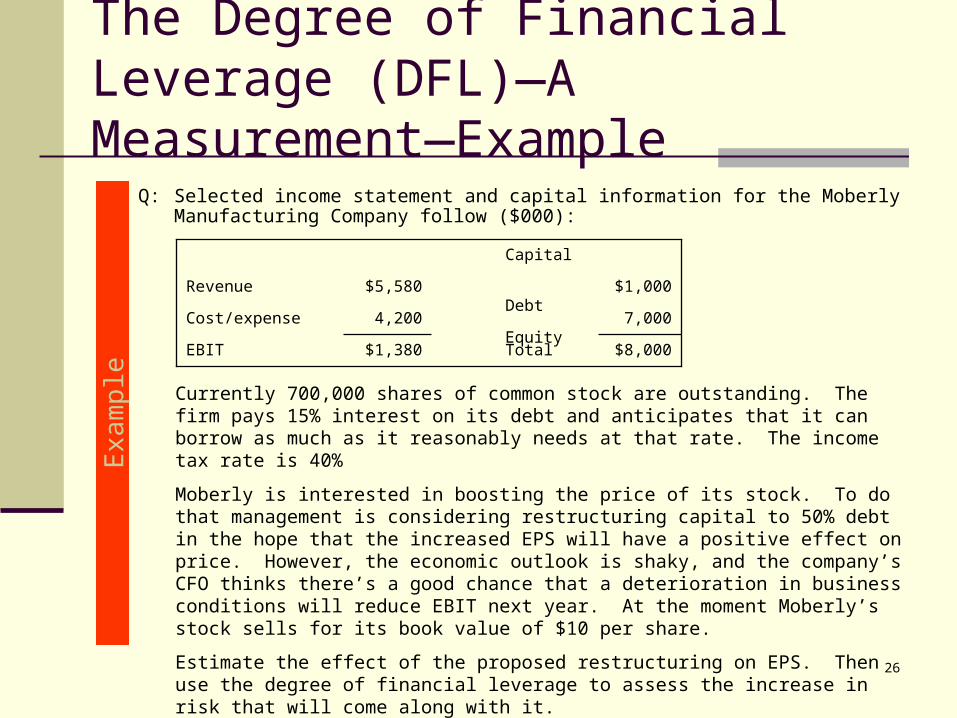
Q: Selected income statement and capital information for the Moberly Manufacturing Company follow ($000):
Exa
mpl
e
Currently 700,000 shares of common stock are outstanding. The firm pays 15% interest on its debt and anticipates that it can borrow as much as it reasonably needs at that rate. The income tax rate is 40%
Moberly is interested in boosting the price of its stock. To do that management is considering restructuring capital to 50% debt in the hope that the increased EPS will have a positive effect on price. However, the economic outlook is shaky, and the company’s CFO thinks there’s a good chance that a deterioration in business conditions will reduce EBIT next year. At the moment Moberly’s stock sells for its book value of $10 per share.
Estimate the effect of the proposed restructuring on EPS. Then use the degree of financial leverage to assess the increase in risk that will come along with it.
$8,000Total$1,380EBIT
7,000 Equity4,200Cost/expense
$1,000 Debt$5,580Revenue
Capital
27
The Degree of Financial Leverage (DFL)—A Measurement (Example)
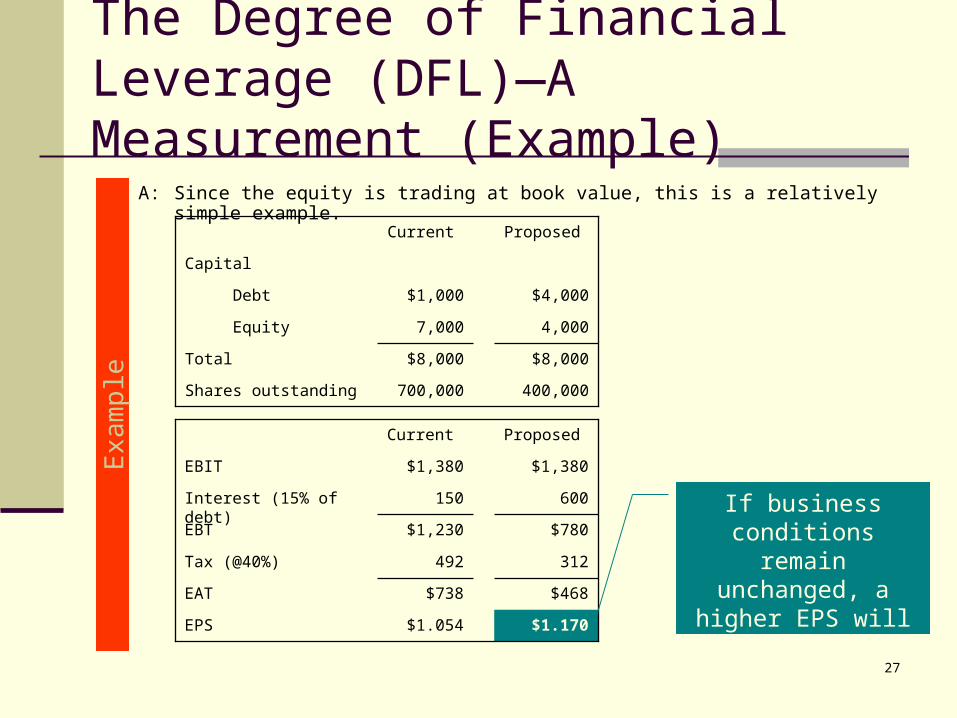
A: Since the equity is trading at book value, this is a relatively simple example.
Exa
mpl
e
400,000700,000Shares outstanding
ProposedCurrent
$8,000$8,000Total
4,0007,000 Equity
$4,000$1,000 Debt
Capital
$1.170$1.054EPS
$468$738EAT
ProposedCurrent
312492Tax (@40%)
$780$1,230EBT
600150Interest (15% of debt)
$1,380$1,380EBIT
If business conditions remain unchanged, a higher EPS will result
with the addition of debt.
28
The Degree of Financial Leverage (DFL)—A Measurement—Example
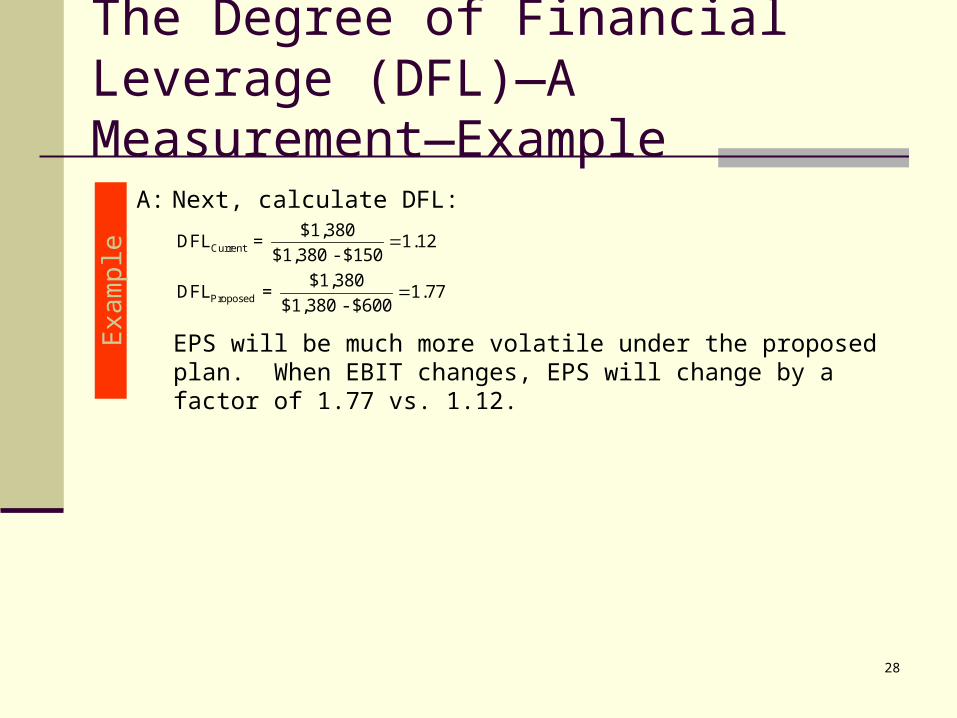
A: Next, calculate DFL:
Exa
mpl
e Current
Proposed
$1,380DFL = 1.12$1,380 - $150
$1,380DFL = 1.77$1,380 - $600
EPS will be much more volatile under the proposed plan. When EBIT changes, EPS will change by a factor of 1.77 vs. 1.12.
29
Comparing Operating and Financial Leverage
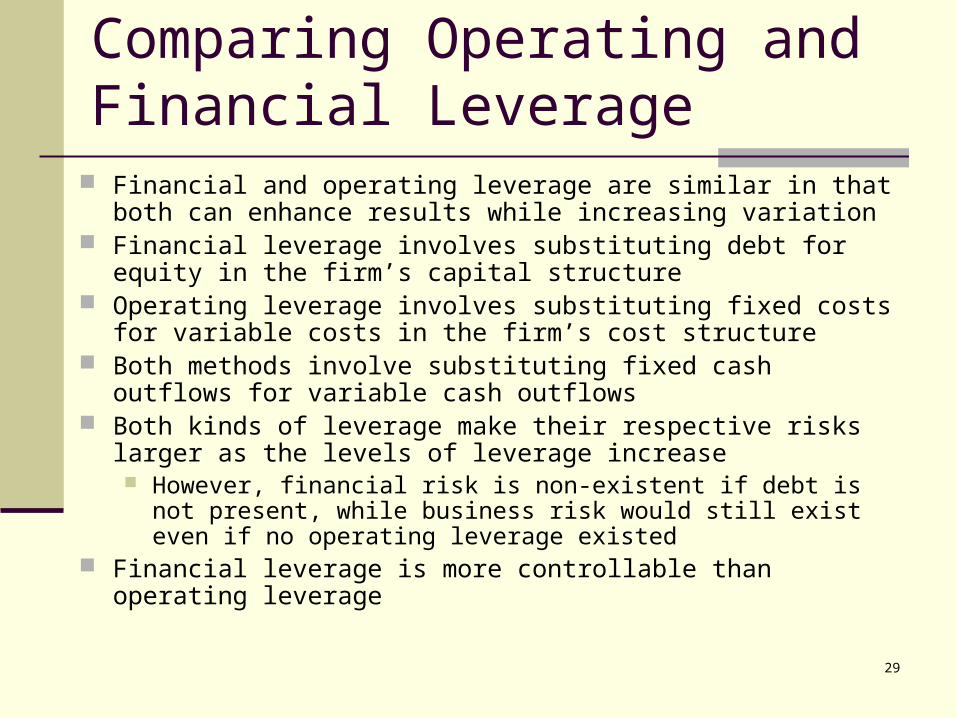
Financial and operating leverage are similar in that both can enhance results while increasing variation
Financial leverage involves substituting debt for equity in the firm’s capital structure
Operating leverage involves substituting fixed costs for variable costs in the firm’s cost structure
Both methods involve substituting fixed cash outflows for variable cash outflows
Both kinds of leverage make their respective risks larger as the levels of leverage increase However, financial risk is non-existent if debt is not present, while
business risk would still exist even if no operating leverage existed Financial leverage is more controllable than operating leverage
30
The Compounding Effect of Operating and Financial Leverage The effects of financial and operating leverage compound one
another Changes in sales are amplified by operating leverage into larger
relative changes in EBIT Which in turn are amplified into still larger relative changes
in ROE and EPS by financial leverage The effect is multiplicative, not additive
Thus, fairly modest changes in sales can lead to dramatic changes in ROE and EPS
The combined effect can be measured using degree of total leverage (DTL) DTL = DOL × DFL
31
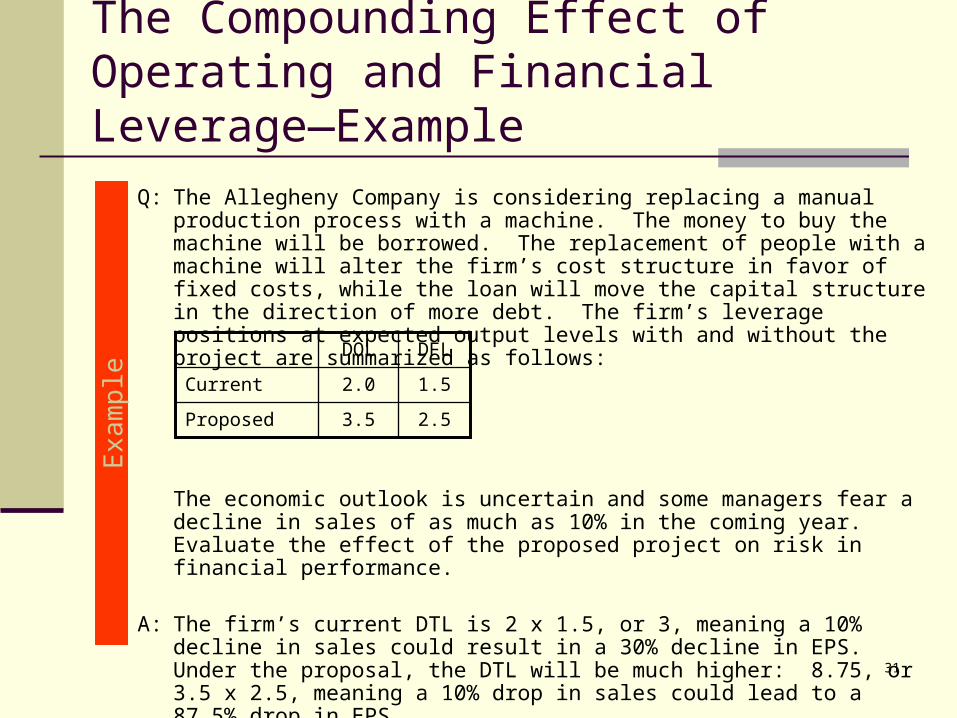
The Compounding Effect of Operating and Financial Leverage—Example
Q: The Allegheny Company is considering replacing a manual production process with a machine. The money to buy the machine will be borrowed. The replacement of people with a machine will alter the firm’s cost structure in favor of fixed costs, while the loan will move the capital structure in the direction of more debt. The firm’s leverage positions at expected output levels with and without the project are summarized as follows:
The economic outlook is uncertain and some managers fear a decline in sales of as much as 10% in the coming year. Evaluate the effect of the proposed project on risk in financial performance.
A: The firm’s current DTL is 2 x 1.5, or 3, meaning a 10% decline in sales could result in a 30% decline in EPS. Under the proposal, the DTL will be much higher: 8.75, or 3.5 x 2.5, meaning a 10% drop in sales could lead to a 87.5% drop in EPS.
Exa
mpl
e
2.53.5Proposed
1.52.0Current
DFLDOL