Cracklin' Cornbread, Beer-Batter Cheese Bread, Cinnamon Swirl Bread & Zuchini Bread
date post
21-Dec-2015Category
view
214download
0
BREAD 2008 - 1
IW Outes-Leon
Nutrition and Growth in Rural Ethiopia
BREAD Summer School 2008
Ingo W. Outes-Leon, Oxford University

BREAD 2008 - 2
IW Outes-Leon
Overview
A. Introduction
B. Data and Empirical Model
C. Results
D. Conclusions

BREAD 2008 - 3
IW Outes-Leon
A.1 Introduction – Aim and Motivation
Test whether poor nutrition and health has a negative effect on a HHs ability to generate future consumption
We estimate effect of adult low BMI on HH consumption growth, after controlling for other HH assets.
Necessary, but not sufficient, condition for nutritional poverty traps to exist.
Combine Nutritional Poverty Trap (Dasgupta and Ray) - Productivity Effect Morbidity theories (Deaton (2005) and Fogel (1992)) - Health Effect
With Micro-Growth models (Jalan and Ravallion (2003), Antman and McKenzie (2005) and Dercon and Shapiro (2007))
And literature on Non-linearity in BMI (Dasgupta (1993) and Strauss and Thomas (1998))

BREAD 2008 - 4
IW Outes-Leon
A.2 Introduction – Aim and Motivation
Take inspiration from Mankiw, Romer and Weil (1992), estimate: HH consumption growth (1995 to 2004) on Lagged dependent variable And HH Assets and Other characteristics on baseline (1995)
Adult Low BMI enters equation as further component of HH human capital
That is, Conditional convergence type of model. So no actual test of poverty traps But able to indicate if low BMI has a drag-down effect on HH
growth

BREAD 2008 - 5
IW Outes-Leon
A.3 Introduction – Contribution and Challenges
Findings and Contribution:
IV methods provide evidence of negative Growth Effect of low BMI Evidence of Persistence of the 1984 Drought on 1995 adult BMI Application of ‘weak’ IV estimation and inference methods.
Estimation: IV Fuller Estimator Inferences: Conditional Likelihood Ratio (CLR) Moreira p-values
Challenges:
Validity of Instrumentation Methodology Doubtful, but IV estimates still interesting
Disentangle village-specific nutritional effects from individual HH effects Unobserved Village Effects vs local nutritional poverty traps (e.g. shocks
and HH infrastructure) Quartile regressions might provide further insight.
Treatment of Other Assets, especially Livestock
BREAD 2008 - 6
IW Outes-Leon
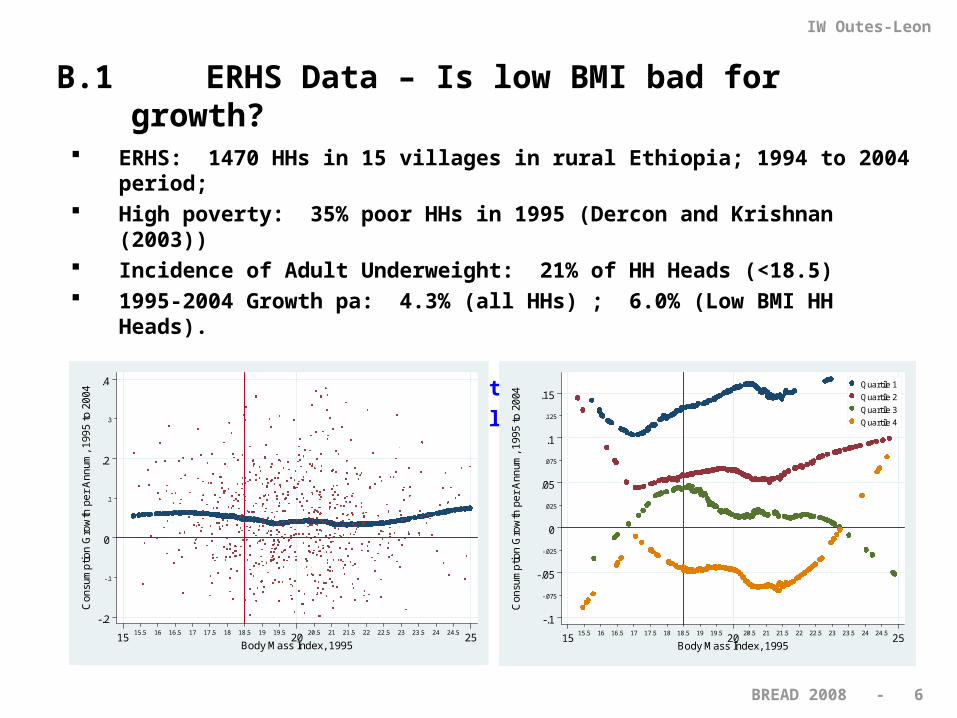
B.1 ERHS Data – Is low BMI bad for growth?
ERHS: 1470 HHs in 15 villages in rural Ethiopia; 1994 to 2004 period; High poverty: 35% poor HHs in 1995 (Dercon and Krishnan (2003)) Incidence of Adult Underweight: 21% of HH Heads (<18.5) 1995-2004 Growth pa: 4.3% (all HHs) ; 6.0% (Low BMI HH Heads).
Kernel smoothing: No apparent Poverty Trap Quartile Kernel smoothing: ‘low BMI’ effect for poor HHS ?
-.1
.1
.3
-.2
0
.2
.4
Con
sum
ptio
n G
row
th p
er
Ann
um, 1
995
to 2
004
15.5 16 16.5 17 17.5 18 18.5 19 19.5 20.5 21 21.5 22 22.5 23 23.5 24 24.515 20 25Body Mass Index, 1995
-.075
-.025
.025
.075
.125
-.1
-.05
0
.05
.1
.15
Con
sum
ptio
n G
row
th p
er
Ann
um, 1
995
to 2
004
15.5 16 16.5 17 17.5 18 18.5 19 19.5 20.5 21 21.5 22 22.5 23 23.5 24 24.515 20 25Body Mass Index, 1995
Quartile 1
Quartile 2
Quartile 3
Quartile 4
BREAD 2008 - 7
IW Outes-Leon
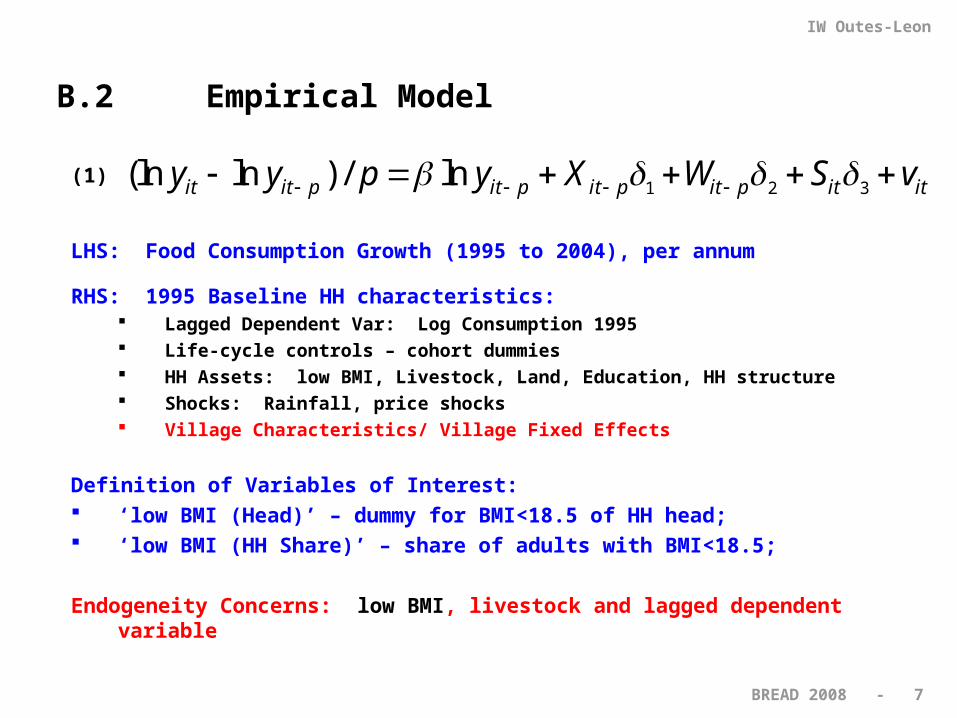
B.2 Empirical Model
(1)
LHS: Food Consumption Growth (1995 to 2004), per annum
RHS: 1995 Baseline HH characteristics: Lagged Dependent Var: Log Consumption 1995 Life-cycle controls – cohort dummies HH Assets: low BMI, Livestock, Land, Education, HH structure Shocks: Rainfall, price shocks Village Characteristics/ Village Fixed Effects
Definition of Variables of Interest: ‘low BMI (Head)’ – dummy for BMI<18.5 of HH head; ‘low BMI (HH Share)’ – share of adults with BMI<18.5;
Endogeneity Concerns: low BMI, livestock and lagged dependent variable
1 2 3(ln ln ) / lnit it p it p it p it p it ity y p y X W S v
BREAD 2008 - 8
IW Outes-Leon
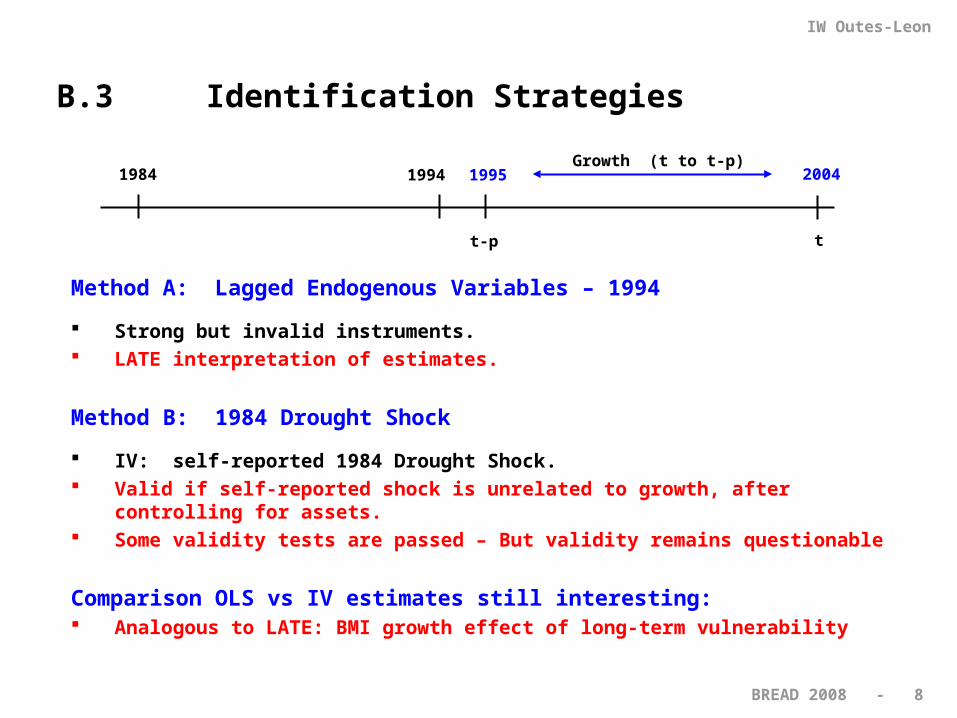
B.3 Identification Strategies
Method A: Lagged Endogenous Variables – 1994
Strong but invalid instruments. LATE interpretation of estimates.
Method B: 1984 Drought Shock
IV: self-reported 1984 Drought Shock. Valid if self-reported shock is unrelated to growth, after controlling for assets. Some validity tests are passed – But validity remains questionable
Comparison OLS vs IV estimates still interesting: Analogous to LATE: BMI growth effect of long-term vulnerability
2004199519941984
tt-p
Growth (t to t-p)
BREAD 2008 - 9
IW Outes-Leon
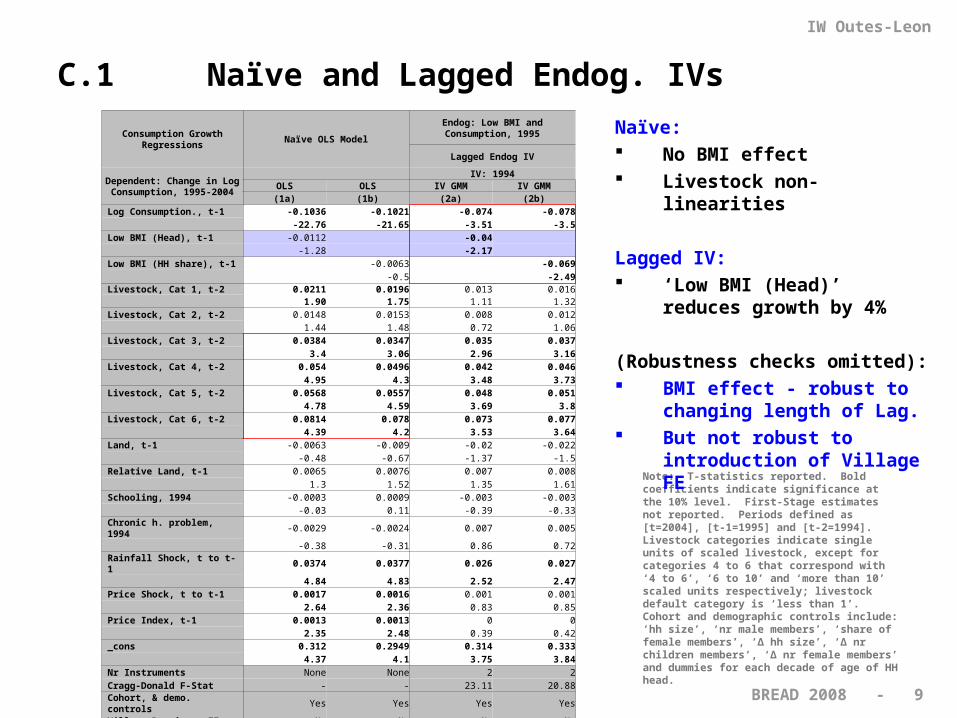
Consumption Growth Regressions
Naïve OLS Model
Endog: Low BMI and Consumption, 1995
Lagged Endog IV
Dependent: Change in Log Consumption, 1995-2004
IV: 1994OLS OLS IV GMM IV GMM(1a) (1b) (2a) (2b)
Log Consumption., t-1 -0.1036 -0.1021 -0.074 -0.078 -22.76 -21.65 -3.51 -3.5Low BMI (Head), t-1 -0.0112 -0.04 -1.28 -2.17 Low BMI (HH share), t-1 -0.0063 -0.069 -0.5 -2.49Livestock, Cat 1, t-2 0.0211 0.0196 0.013 0.016 1.90 1.75 1.11 1.32Livestock, Cat 2, t-2 0.0148 0.0153 0.008 0.012 1.44 1.48 0.72 1.06Livestock, Cat 3, t-2 0.0384 0.0347 0.035 0.037 3.4 3.06 2.96 3.16Livestock, Cat 4, t-2 0.054 0.0496 0.042 0.046 4.95 4.3 3.48 3.73Livestock, Cat 5, t-2 0.0568 0.0557 0.048 0.051 4.78 4.59 3.69 3.8Livestock, Cat 6, t-2 0.0814 0.078 0.073 0.077 4.39 4.2 3.53 3.64Land, t-1 -0.0063 -0.009 -0.02 -0.022 -0.48 -0.67 -1.37 -1.5Relative Land, t-1 0.0065 0.0076 0.007 0.008 1.3 1.52 1.35 1.61Schooling, 1994 -0.0003 0.0009 -0.003 -0.003 -0.03 0.11 -0.39 -0.33Chronic h. problem, 1994 -0.0029 -0.0024 0.007 0.005 -0.38 -0.31 0.86 0.72Rainfall Shock, t to t-1 0.0374 0.0377 0.026 0.027 4.84 4.83 2.52 2.47Price Shock, t to t-1 0.0017 0.0016 0.001 0.001 2.64 2.36 0.83 0.85Price Index, t-1 0.0013 0.0013 0 0 2.35 2.48 0.39 0.42_cons 0.312 0.2949 0.314 0.333 4.37 4.1 3.75 3.84Nr Instruments None None 2 2Cragg-Donald F-Stat - - 23.11 20.88Cohort, & demo. controls Yes Yes Yes YesVillage Dummies - FE No No No NoNr. Observations 764 764 764 764
C.1 Naïve and Lagged Endog. IVs
Note: T-statistics reported. Bold coefficients indicate significance at the 10% level. First-Stage estimates not reported. Periods defined as [t=2004], [t-1=1995] and [t-2=1994]. Livestock categories indicate single units of scaled livestock, except for categories 4 to 6 that correspond with ‘4 to 6’, ‘6 to 10’ and ‘more than 10’ scaled units respectively; livestock default category is ‘less than 1’. Cohort and demographic controls include: ‘hh size’, ‘nr male members’, ‘share of female members’, ‘Δ hh size’, ‘Δ nr children members’, ‘Δ nr female members’ and dummies for each decade of age of HH head.
Naïve: No BMI effect Livestock non-linearities
Lagged IV: ‘Low BMI (Head)’ reduces
growth by 4%
(Robustness checks omitted): BMI effect - robust to
changing length of Lag. But not robust to introduction
of Village FE
BREAD 2008 - 10
IW Outes-Leon
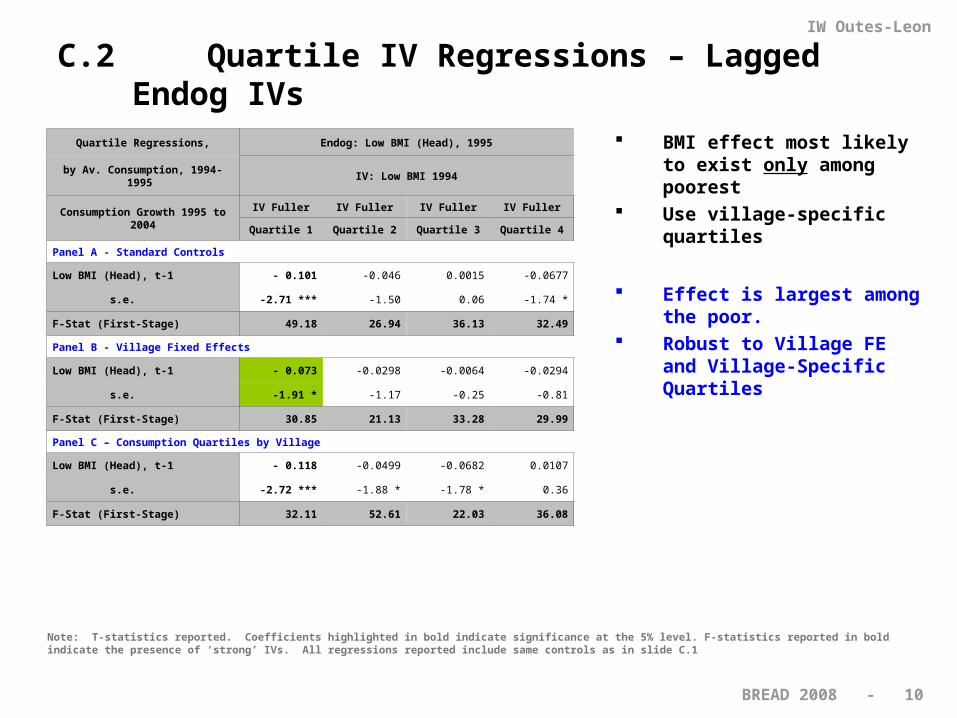
C.2 Quartile IV Regressions – Lagged Endog IVs
Quartile Regressions, Endog: Low BMI (Head), 1995
by Av. Consumption, 1994-1995 IV: Low BMI 1994
Consumption Growth 1995 to 2004IV Fuller IV Fuller IV Fuller IV Fuller
Quartile 1 Quartile 2 Quartile 3 Quartile 4
Panel A - Standard Controls
Low BMI (Head), t-1 - 0.101 -0.046 0.0015 -0.0677
s.e. -2.71 *** -1.50 0.06 -1.74 *
F-Stat (First-Stage) 49.18 26.94 36.13 32.49
Panel B - Village Fixed Effects
Low BMI (Head), t-1 - 0.073 -0.0298 -0.0064 -0.0294
s.e. -1.91 * -1.17 -0.25 -0.81
F-Stat (First-Stage) 30.85 21.13 33.28 29.99
Panel C – Consumption Quartiles by Village
Low BMI (Head), t-1 - 0.118 -0.0499 -0.0682 0.0107
s.e. -2.72 *** -1.88 * -1.78 * 0.36
F-Stat (First-Stage) 32.11 52.61 22.03 36.08
Note: T-statistics reported. Coefficients highlighted in bold indicate significance at the 5% level. F-statistics reported in bold indicate the presence of ‘strong’ IVs. All regressions reported include same controls as in slide C.1
BMI effect most likely to exist only among poorest
Use village-specific quartiles
Effect is largest among the poor.
Robust to Village FE and Village-Specific Quartiles
BREAD 2008 - 11
IW Outes-Leon
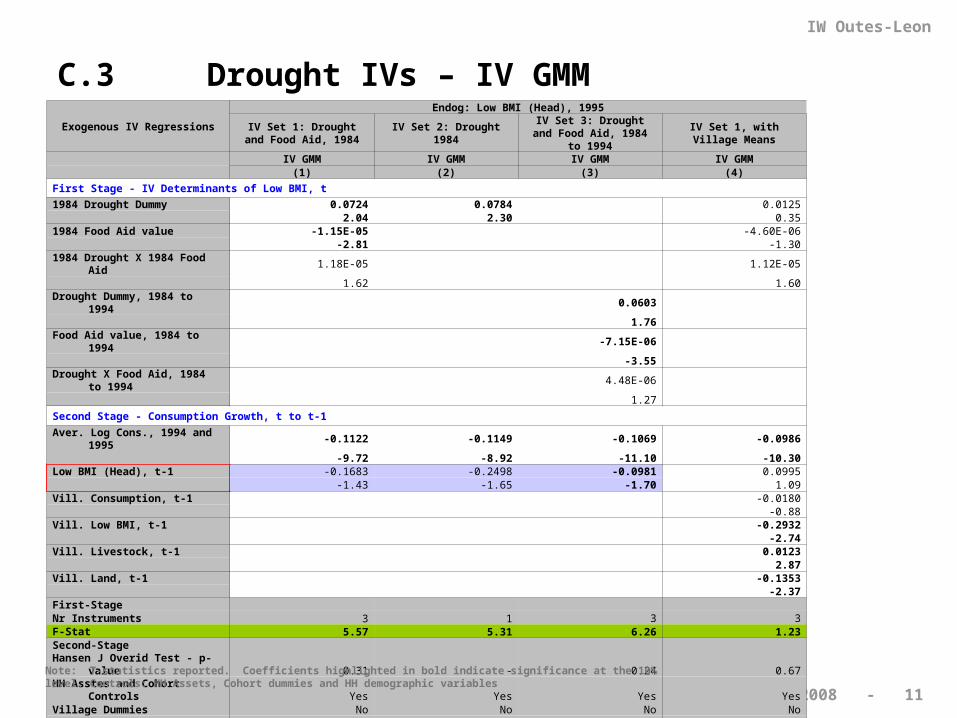
C.3 Drought IVs – IV GMMExogenous IV Regressions
Endog: Low BMI (Head), 1995IV Set 1: Drought and
Food Aid, 1984IV Set 2: Drought 1984
IV Set 3: Drought and Food Aid, 1984 to 1994
IV Set 1, with Village Means
IV GMM IV GMM IV GMM IV GMM (1) (2) (3) (4)
First Stage - IV Determinants of Low BMI, t
1984 Drought Dummy 0.0724 0.0784 0.0125 2.04 2.30 0.351984 Food Aid value -1.15E-05 -4.60E-06 -2.81 -1.301984 Drought X 1984 Food Aid 1.18E-05 1.12E-05 1.62 1.60Drought Dummy, 1984 to 1994 0.0603 1.76 Food Aid value, 1984 to 1994 -7.15E-06 -3.55 Drought X Food Aid, 1984 to 1994 4.48E-06 1.27
Second Stage - Consumption Growth, t to t-1
Aver. Log Cons., 1994 and 1995 -0.1122 -0.1149 -0.1069 -0.0986 -9.72 -8.92 -11.10 -10.30Low BMI (Head), t-1 -0.1683 -0.2498 -0.0981 0.0995 -1.43 -1.65 -1.70 1.09Vill. Consumption, t-1 -0.0180 -0.88Vill. Low BMI, t-1 -0.2932 -2.74Vill. Livestock, t-1 0.0123 2.87Vill. Land, t-1 -0.1353 -2.37First-Stage Nr Instruments 3 1 3 3F-Stat 5.57 5.31 6.26 1.23Second-Stage Hansen J Overid Test - p-value 0.31 - 0.24 0.67HH Asstes and Cohort Controls Yes Yes Yes YesVillage Dummies No No No NoR-Square 0.051 -0.285 0.233 0.256Nr. Observations 707 713 707 707
Note: T-statistics reported. Coefficients highlighted in bold indicate significance at the 10% level. Controls: HH Assets, Cohort dummies and HH demographic variables

BREAD 2008 - 12
IW Outes-Leon
C.4 Drought IVs – Weak IVs
IV GMM (First-Stage) F-Stats: Stock and Yogo (2005) critical values F-Stats from [5.31] to [6.26] suggest: IV estimates include 30% to 20% of the
OLS Bias
Weak IV GMM estimates are unreliable – under finite-samples, (Murray (2006)): IV GMM point estimates can be substantially bias; Standard Errors tend to be invalid and smaller (!!)
Estimation: IV Fuller and IV LIML Methods are more robust to ‘weak’ IVs In the literature: IV Fuller method is preferred estimator. See Stock, Wright and Yogo (2002) and Murray (2006).
Inferences: CLR Moreira and Anderson-Rubin tests more robust CLR Moreira methods shown to dominate alternative methods See Andrews, Moreira and Stock (2005) and Murray (2006).
BREAD 2008 - 13
IW Outes-Leon
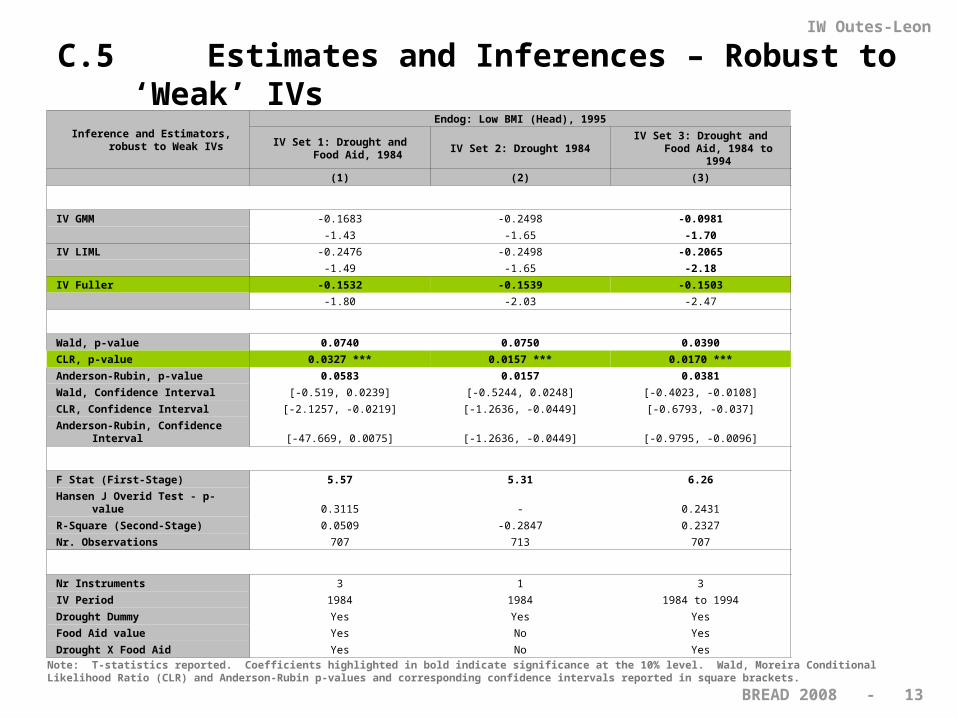
C.5 Estimates and Inferences – Robust to ‘Weak’ IVs
Inference and Estimators, robust to Weak IVs
Endog: Low BMI (Head), 1995
IV Set 1: Drought and Food Aid, 1984
IV Set 2: Drought 1984IV Set 3: Drought and Food Aid,
1984 to 1994
(1) (2) (3)
IV GMM -0.1683 -0.2498 -0.0981
-1.43 -1.65 -1.70
IV LIML -0.2476 -0.2498 -0.2065
-1.49 -1.65 -2.18
IV Fuller -0.1532 -0.1539 -0.1503
-1.80 -2.03 -2.47
Wald, p-value 0.0740 0.0750 0.0390
CLR, p-value 0.0327 *** 0.0157 *** 0.0170 ***
Anderson-Rubin, p-value 0.0583 0.0157 0.0381
Wald, Confidence Interval [-0.519, 0.0239] [-0.5244, 0.0248] [-0.4023, -0.0108]
CLR, Confidence Interval [-2.1257, -0.0219] [-1.2636, -0.0449] [-0.6793, -0.037]
Anderson-Rubin, Confidence Interval [-47.669, 0.0075] [-1.2636, -0.0449] [-0.9795, -0.0096]
F Stat (First-Stage) 5.57 5.31 6.26
Hansen J Overid Test - p-value 0.3115 - 0.2431
R-Square (Second-Stage) 0.0509 -0.2847 0.2327
Nr. Observations 707 713 707
Nr Instruments 3 1 3
IV Period 1984 1984 1984 to 1994
Drought Dummy Yes Yes Yes
Food Aid value Yes No Yes
Drought X Food Aid Yes No Yes
Note: T-statistics reported. Coefficients highlighted in bold indicate significance at the 10% level. Wald, Moreira Conditional Likelihood Ratio (CLR) and Anderson-Rubin p-values and corresponding confidence intervals reported in square brackets.
BREAD 2008 - 14
IW Outes-Leon
Food Aid - Validity Better connected HHs – obtain more Food Aid and grow faster. No bias appreciable when comparing with ‘IV Set 2: 1984 Drought Only’
Self-Reported Drought likely endogenous E.g. Better insured HHs in 1984 drought villages – not affected by Drought. No available HH information prior to 1984 drought. Use answer ‘Did “food sharing” increase during famine?’ as extra control.
Livestock Endogeneity and Low BMI Bias Current Implicit Ass: 1984 Drought affects exclusively HH health. Persistence in Livestock Assets might be behind ‘low BMI’ effects Over-id Drought IV estimates with Endog: Low BMI and Low Livestock
Model is unreliable due to ‘very weak’ IVs. But ‘Low BMI’ effect remains large [-0.10]. While ‘Low Livestock’ effect is increased substantially;
C.6 Further on Drought IVs
BREAD 2008 - 15
IW Outes-Leon
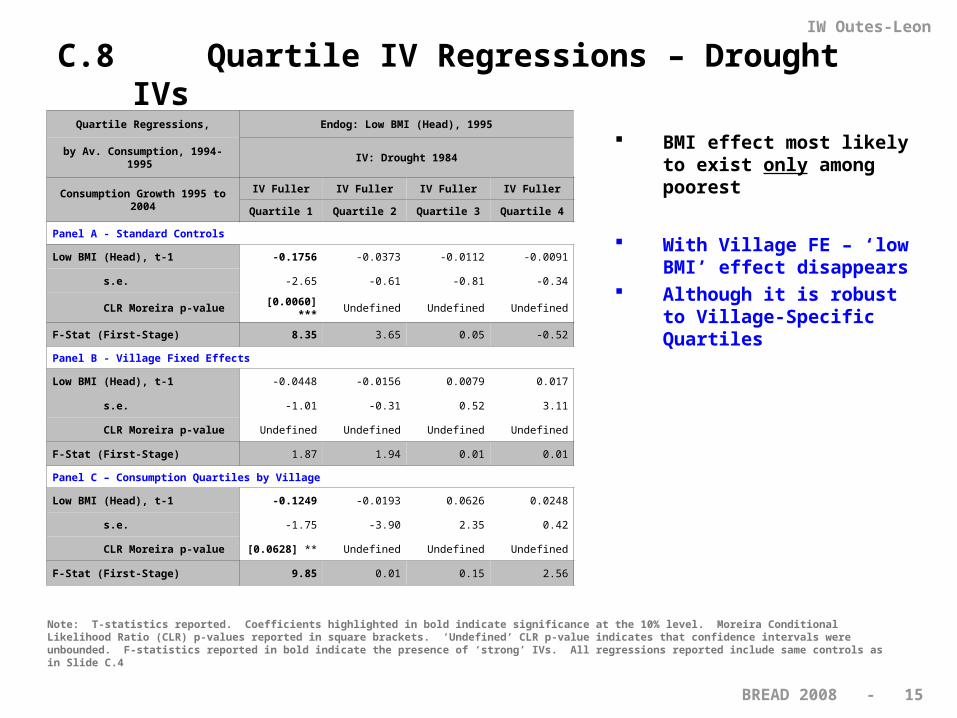
C.8 Quartile IV Regressions – Drought IVs
Note: T-statistics reported. Coefficients highlighted in bold indicate significance at the 10% level. Moreira Conditional Likelihood Ratio (CLR) p-values reported in square brackets. ‘Undefined’ CLR p-value indicates that confidence intervals were unbounded. F-statistics reported in bold indicate the presence of ‘strong’ IVs. All regressions reported include same controls as in Slide C.4
Quartile Regressions, Endog: Low BMI (Head), 1995
by Av. Consumption, 1994-1995 IV: Drought 1984
Consumption Growth 1995 to 2004IV Fuller IV Fuller IV Fuller IV Fuller
Quartile 1 Quartile 2 Quartile 3 Quartile 4
Panel A - Standard Controls
Low BMI (Head), t-1 -0.1756 -0.0373 -0.0112 -0.0091
s.e. -2.65 -0.61 -0.81 -0.34
CLR Moreira p-value [0.0060] *** Undefined Undefined Undefined
F-Stat (First-Stage) 8.35 3.65 0.05 -0.52
Panel B - Village Fixed Effects
Low BMI (Head), t-1 -0.0448 -0.0156 0.0079 0.017
s.e. -1.01 -0.31 0.52 3.11
CLR Moreira p-value Undefined Undefined Undefined Undefined
F-Stat (First-Stage) 1.87 1.94 0.01 0.01
Panel C – Consumption Quartiles by Village
Low BMI (Head), t-1 -0.1249 -0.0193 0.0626 0.0248
s.e. -1.75 -3.90 2.35 0.42
CLR Moreira p-value [0.0628] ** Undefined Undefined Undefined
F-Stat (First-Stage) 9.85 0.01 0.15 2.56
BMI effect most likely to exist only among poorest
With Village FE – ‘low BMI’ effect disappears
Although it is robust to Village-Specific Quartiles
BREAD 2008 - 16
IW Outes-Leon
D.1 Conclusions
Uncover substantial persistence of 1984 drought on 1995 livestock and BMI
Low BMI has significant negative effect on subsequent HH growth. Lagged Endog IVs and Drought IVs provide results consistent with each other.
Growth effect of Low BMI might not be causal but can be interpreted as growth effect of low BMI persistence (Lagged IV) or
HH vulnerability (Drought IV).
This Low BMI burden is overwhelmingly borne by the poor.
Growth effect is large in magnitude For lowest quartile (with village FE), persistence of low BMI reduces
growth by 7% percentage points per annum, for a period of nine years.
Drought IV estimates suggest a very large effect – up to 15% percentage points per annum, for nine-year period.
But partly include village and ‘livestock’ effects.
BREAD 2008 - 17
IW Outes-Leon
D.2 Going Forward
Alternative IVs; Alternative tests of validity;
Arellano-Bond Panel Estimation Can tackle Unobserved HH Heterogeneity Unpack HH FE – seek for 1984 Drought effect
Testing for Mechanism of low BMI: Income and productivity Higher morbidity

BREAD 2008 - 18
IW Outes-Leon
Many Thanks

BREAD 2008 - 19
IW Outes-Leon
Consumption Growth Regressions
Endog: Low BMI and Consumption, 1995
Lagged Endog IVLagged Endog IV, Lagged Endog IV,
Village Means Village FE
Dependent: Change in Log Consumption,
1995-2004
Growth: 1995-2004 IV: 1994
Growth: 1997-2004 IV: 1994
Growth: 1995-2004 IV: 1994
Growth: 1997-2004 IV: 1994
Growth: 1995-2004 IV: 1994
IV GMM IV GMM IV GMM IV GMM IV GMM IV GMM IV GMM IV GMM IV GMM IV GMM
(1a) (1b) (2a) (2b) (3a) (3b) (4a) (4b) (5a) (5b)
Log Consumption., t-1 -0.074 -0.078 -0.054 -0.054 -0.081 -0.084 -0.034 -0.037 -0.063 -0.065
-3.51 -3.5 -1.36 -1.45 -2.36 -2.32 -0.63 -0.74 -1.97 -1.96
Low BMI (Head), t-1 -0.04 -0.042 -0.033 -0.06 -0.019
-2.17 -1.34 -1.77 -1.78 -1.09
Low BMI (HH share), t-1 -0.069 -0.063 -0.058 -0.113 -0.037
-2.49 -1.36 -1.86 -2.13 -1.18
Vill. Consumption, t-1 -0.002 0.002 -0.04 -0.033
-0.05 0.05 -0.67 -0.57
Vill. Low BMI, t-1 -0.06 -0.04 0.091 0.119
-1.14 -0.71 1.31 1.59
Vill. Livestock, t-1 0.007 0.007 0.006 0.006
2.26 2.22 0.98 0.99
Vill. Land, t-1 -0.022 -0.024 0.045 0.043
-0.54 -0.56 0.69 0.67
First-Stage
Nr Instruments 2 2 2 2 2 2 2 2 2 2
Cragg-Donald F-Stat 23.11 20.88 12.83 13.47 10.74 10.7 8.58 8.97 11.21 11.1
Second-Stage
Asset, Cohort Controls Yes Yes Yes Yes Yes Yes Yes Yes Yes Yes
Village Dummies - FE No No No No No No No No Yes Yes
R-Square 0.459 0.452 0.296 0.285 0.4822 0.4734 0.234 0.217 0.5 0.498
Nr. Observations 764 764 735 735 764 764 735 735 764 764
Note: T-statistics reported. Bold coefficients indicate significance at the 10% level. First-Stage estimates not reported. Periods defined as [t=2004], [t-1=1995] and [t-2=1994]. Controls: HH Assets, Cohort dummies and HH demographic variables
C.3 Lagged Endogenous IVs – Robustness
BREAD 2008 - 20
IW Outes-Leon
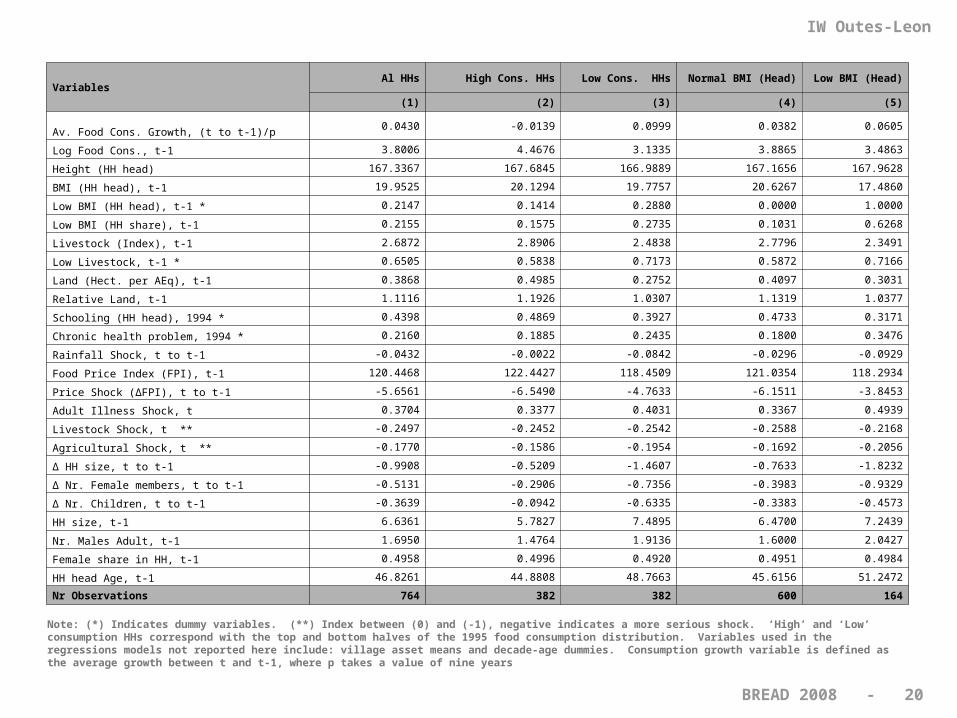
VariablesAl HHs High Cons. HHs Low Cons. HHs Normal BMI (Head) Low BMI (Head)
(1) (2) (3) (4) (5)
Av. Food Cons. Growth, (t to t-1)/p0.0430 -0.0139 0.0999 0.0382 0.0605
Log Food Cons., t-1 3.8006 4.4676 3.1335 3.8865 3.4863
Height (HH head) 167.3367 167.6845 166.9889 167.1656 167.9628
BMI (HH head), t-1 19.9525 20.1294 19.7757 20.6267 17.4860
Low BMI (HH head), t-1 * 0.2147 0.1414 0.2880 0.0000 1.0000
Low BMI (HH share), t-1 0.2155 0.1575 0.2735 0.1031 0.6268
Livestock (Index), t-1 2.6872 2.8906 2.4838 2.7796 2.3491
Low Livestock, t-1 * 0.6505 0.5838 0.7173 0.5872 0.7166
Land (Hect. per AEq), t-1 0.3868 0.4985 0.2752 0.4097 0.3031
Relative Land, t-1 1.1116 1.1926 1.0307 1.1319 1.0377
Schooling (HH head), 1994 * 0.4398 0.4869 0.3927 0.4733 0.3171
Chronic health problem, 1994 * 0.2160 0.1885 0.2435 0.1800 0.3476
Rainfall Shock, t to t-1 -0.0432 -0.0022 -0.0842 -0.0296 -0.0929
Food Price Index (FPI), t-1 120.4468 122.4427 118.4509 121.0354 118.2934
Price Shock (ΔFPI), t to t-1 -5.6561 -6.5490 -4.7633 -6.1511 -3.8453
Adult Illness Shock, t 0.3704 0.3377 0.4031 0.3367 0.4939
Livestock Shock, t ** -0.2497 -0.2452 -0.2542 -0.2588 -0.2168
Agricultural Shock, t ** -0.1770 -0.1586 -0.1954 -0.1692 -0.2056
Δ HH size, t to t-1 -0.9908 -0.5209 -1.4607 -0.7633 -1.8232
Δ Nr. Female members, t to t-1 -0.5131 -0.2906 -0.7356 -0.3983 -0.9329
Δ Nr. Children, t to t-1 -0.3639 -0.0942 -0.6335 -0.3383 -0.4573
HH size, t-1 6.6361 5.7827 7.4895 6.4700 7.2439
Nr. Males Adult, t-1 1.6950 1.4764 1.9136 1.6000 2.0427
Female share in HH, t-1 0.4958 0.4996 0.4920 0.4951 0.4984
HH head Age, t-1 46.8261 44.8808 48.7663 45.6156 51.2472
Nr Observations 764 382 382 600 164
Note: (*) Indicates dummy variables. (**) Index between (0) and (-1), negative indicates a more serious shock. ‘High’ and ‘Low’ consumption HHs correspond with the top and bottom halves of the 1995 food consumption distribution. Variables used in the regressions models not reported here include: village asset means and decade-age dummies. Consumption growth variable is defined as the average growth between t and t-1, where p takes a value of nine years

BREAD 2008 - 21
IW Outes-Leon
Note: Change in number of households from 713 to 707 is due to missing food aid information for 6 households. Pairs of columns (3)-(4) and (5)-(6) add to unity by village
Low BMI (Head)
1984 Drought Shock 1984-1994 Drought ShockNr Observ.
Av. Food Aid Value (1984)
Av. Food Aid Value (1984-1994)
1995 No Yes No Yes
Normal BMI - 1995 No 286 273 244 315 559 677 Birr 2001 Birr
Low BMI - 1995 Yes 52 102 44 110 154 446 Birr 771 Birr
Nr Observations 713 338 375 288 425 713 707 707
By Villages
Haresaw 12.50% 37.5% 62.5% 31.3% 68.8% 32 938 Birr 4532 Birr
Geblen 8.33% 83.3% 16.7% 83.3% 16.7% 24 49 Birr 17,055 Birr
Dinki 26.79% 8.9% 91.1% 5.4% 94.6% 56 406 Birr 406 Birr
Yetemen 10.26% 66.7% 33.3% 33.3% 66.7% 39 - -
Shumsha 8.62% 34.5% 65.5% 22.4% 77.6% 58 6,430 Birr 9,960 Birr
Sirbana Godeti 15.91% 95.5% 4.6% 88.6% 11.4% 44 - -
Adele Keke 14.29% 42.9% 57.1% 37.5% 62.5% 56 71 Birr 118 Birr
Korodegaga 34.55% 25.5% 74.6% 18.2% 81.8% 55 6 Birr 236 Birr
Trirufe Ketchema 22.73% 47.7% 52.3% 45.5% 54.6% 44 3 Birr 3 Birr
Imdibir 81.82% 15.2% 84.9% 15.2% 84.9% 33 122 Birr 206 Birr
Aze Deboa 25.00% 0.0% 100.0% 0.0% 100.0% 40 26 Birr 30 Birr
Adado 10.00% 100.0% 0.0% 100.0% 0.0% 40 - -
Gara Godo 35.59% 32.2% 67.8% 27.1% 72.9% 59 70 Birr 515 Birr
Doma 22.22% 42.2% 57.8% 20.0% 80.0% 45 63 Birr 314 Birr
Milki 0.00% 73.0% 27.0% 70.3% 29.7% 37 - -
Kormargefia 16.00% 84.0% 16.0% 80.0% 20.0% 25 - -
Karafino 14.29% 85.7% 14.3% 85.7% 14.3% 14 - -
Bokafia 16.67% 91.7% 8.3% 91.7% 8.3% 12 - -
All villages 21.60% 47.4% 52.6% 40.4% 59.6% 713 627 Birr 1734 Birr
BREAD 2008 - 22
IW Outes-Leon
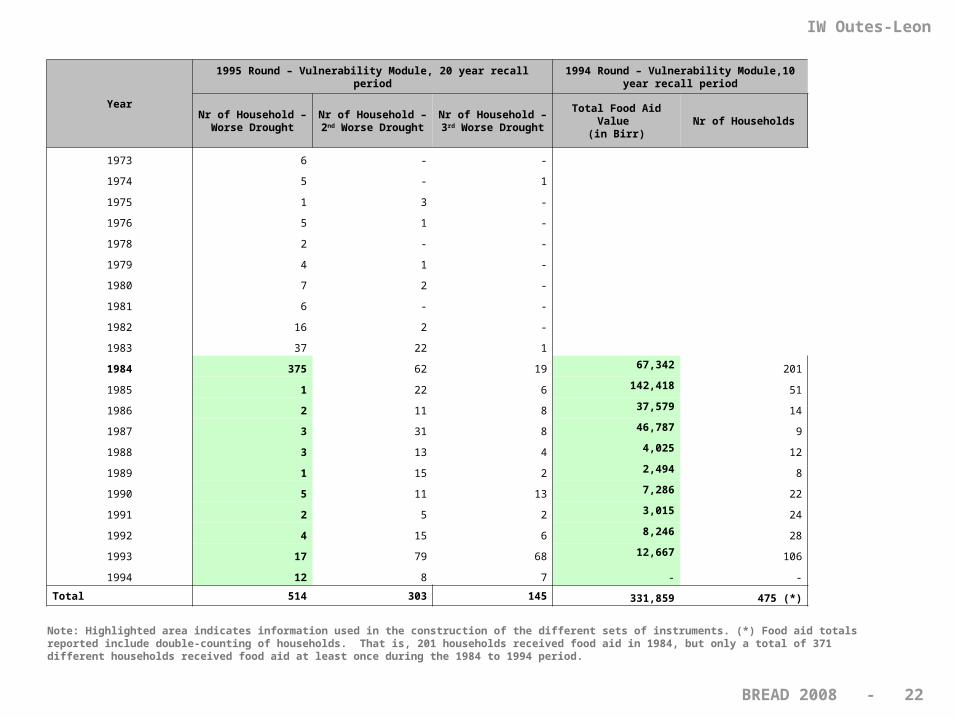
Note: Highlighted area indicates information used in the construction of the different sets of instruments. (*) Food aid totals reported include double-counting of households. That is, 201 households received food aid in 1984, but only a total of 371 different households received food aid at least once during the 1984 to 1994 period.
Year
1995 Round – Vulnerability Module, 20 year recall period1994 Round – Vulnerability Module,10 year
recall period
Nr of Household – Worse Drought
Nr of Household – 2nd Worse Drought
Nr of Household – 3rd Worse Drought
Total Food Aid Value (in Birr)
Nr of Households
1973 6 - -
1974 5 - 1
1975 1 3 -
1976 5 1 -
1978 2 - -
1979 4 1 -
1980 7 2 -
1981 6 - -
1982 16 2 -
1983 37 22 1
1984 375 62 19 67,342 201
1985 1 22 6 142,418 51
1986 2 11 8 37,579 14
1987 3 31 8 46,787 9
1988 3 13 4 4,025 12
1989 1 15 2 2,494 8
1990 5 11 13 7,286 22
1991 2 5 2 3,015 24
1992 4 15 6 8,246 28
1993 17 79 68 12,667 106
1994 12 8 7 - -
Total 514 303 145 331,859 475 (*)

BREAD 2008 - 23
IW Outes-Leon
Note: T-statistics reported. Coefficients highlighted in bold indicate significance at the 10% level. Moreira Conditional Likelihood Ratio (CLR) p-values reported in square brackets. ‘Undefined’ CLR p-value indicates that confidence intervals were unbounded. F-statistics reported in bold indicate the presence of ‘strong’ IVs. All regressions reported include same controls as in Slide D.2
Quartile Regressions, Endog: Low BMI (Head), 1995 Endog: Low BMI (Head), 1995
by Av. Consumption, 1994-1995 IV: Low BMI 1994 IV: Drought 1984
Consumption Growth 1995 to 2004IV Fuller IV Fuller IV Fuller IV Fuller IV Fuller IV Fuller IV Fuller IV Fuller
Quartile 1 Quartile 2 Quartile 3 Quartile 4 Quartile 1 Quartile 2 Quartile 3 Quartile 4
Panel A - Standard Controls
Low BMI (Head), t-1 -0.101 -0.046 0.0015 -0.0677 -0.1756 -0.0373 -0.0112 -0.0091
-2.71 -1.50 0.06 -1.74 -2.65 -0.61 -0.81 -0.34
[0.0023] [0.1797] [0.9993] [0.0848] [0.0060] Undefined Undefined Undefined
F-Stat (First-Stage) 49.18 26.94 36.13 32.49 8.35 3.65 0.05 -0.52
Panel B - Village Fixed Effects
Low BMI (Head), t-1 -0.073 -0.0298 -0.0064 -0.0294 -0.0448 -0.0156 0.0079 0.017
-1.91 -1.17 -0.25 -0.81 -1.01 -0.31 0.52 3.11
[0.0556] [0.4368] [0.8180] [0.4603] Undefined Undefined Undefined Undefined
F-Stat (First-Stage) 30.85 21.13 33.28 29.99 1.87 1.94 0.01 0.01
Panel C – Consumption Quartiles by Village
Low BMI (Head), t-1 -0.118 -0.0499 -0.0682 0.0107 -0.1249 -0.0193 0.0626 0.0248
-2.72 -1.88 -1.78 0.36 -1.75 -3.90 2.35 0.42
[0.0013] [0.0733] [0.0972] [0.7445] [0.0628] Undefined Undefined Undefined
F-Stat (First-Stage) 32.11 52.61 22.03 36.08 9.85 0.01 0.15 2.56