
Brazilian Crisis – 1998/1999. Brazil vs. Asia Current Account of ~4%GDP vs. 8% for Thailand Fixed...
24
Brazilian Crisis – 1998/1999
-
Upload
aleesha-clark -
Category
Documents
-
view
221 -
download
0
Transcript of Brazilian Crisis – 1998/1999. Brazil vs. Asia Current Account of ~4%GDP vs. 8% for Thailand Fixed...
Brazilian Crisis – 1998/1999
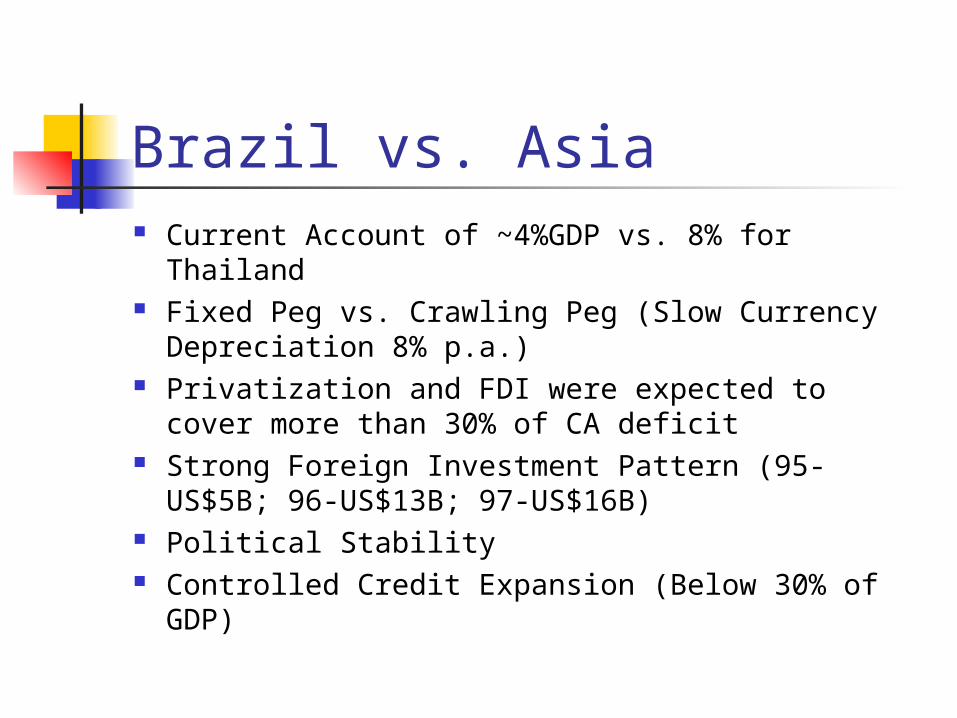
Brazil vs. Asia Current Account of ~4%GDP vs. 8% for Thailand Fixed Peg vs. Crawling Peg (Slow Currency
Depreciation 8% p.a.) Privatization and FDI were expected to cover
more than 30% of CA deficit Strong Foreign Investment Pattern (95-US$5B;
96-US$13B; 97-US$16B) Political Stability Controlled Credit Expansion (Below 30% of GDP)

What went wrong? Two Main Factors
Adverse Price Shock between Jan-97 and Jan-99 Exported Products Prices fell 16%
International Credit Restrictions Russian Crisis – August/98
The Brazilian Strategy assumed that the Country would have time to do the necessary adjustments, while the rest of the world financed the current account deficit.

Crisis Cronology Deterioration of Primary Results (Interest not
Included) Increase in Public DebtSource 1994 1995 1996 1997 1998 1999
Federal 9.2 10.1 13.6 15.2 21.1 24.4
States and Municipalities
9.8 10.6 11.5 13.0 14.4 15.6
State Enterprises
7.0 6.6 5.8 2.8 2.6 2.6
Total 26.0 27.3 30.9 31.0 38.1 42.6

Budget Deficit
1995 1996 1997 1998 1999
Budget Deficit (R$ MM)
47,027
45,741
53,232
72,490
96,158
GDP (R$ B) 974
1,000
1,033
1,035
1,043
Deficit (%GDP) 4.83% 4.57% 5.15% 7.00% 9.22%

Debt Evolution (% of GDP)
Source 1994 1995 1996 1997 1998 1999
Federal 9.2 10.1 13.6 15.2 21.1 24.4
States and Municipalities
9.8 10.6 11.5 13.0 14.4 15.6
State Enterprises
7.0 6.6 5.8 2.8 2.6 2.6
Total 26.0 27.3 30.9 31.0 38.1 42.6

Crisis Cronology Increase in CA Deficit as a % of GDP
Increase in financial needs

Current Account DeficitItemization 1995 1996 1997 1998 1999 2000Balance of payments deficit in current account (R$ Billion) 18 25 38 45 43 45% of GDP 2.8 3.1 4.4 4.9 4.5 4.1
Current Account Deficit
0
10
20
30
40
50
1995 1996 1997 1998 1999 2000
Year
R$
Bil
lio
n
0.0
1.0
2.0
3.0
4.0
5.0
6.0
%
Balance of payments deficit in current account (R$ Billion) % of GDP

Trade Balance 1994 1995 1996 1997 1998 1999
1. Trade Balance
10,843
(3,353)
(5,556)
(8,365)
(6,591)
(1,198)
2. Services (14,743)
(18,600)
(21,044)
(27,289)
(28,799)
(25,211)
3. Unilateral Transfers
2,588
3,974
2,899
2,216
1,778
2,035
Current Account (1,312)
(17,979)
(23,701)
(33,438)
(33,612)
(24,374)

Financial System

Crisis Cronology Political Issues
Itamar Franco (former President and current Governor of Minas Gerais) announced a default on the State Debt.
International Agents fly out of the country

Unemployment RateItemization 1995 1996 1997 1998 1999 2000Unemployment Rate (December) 4.44 3.82 4.84 6.32 6.28 4.83
Unemployment Rate
-
1.00
2.00
3.00
4.00
5.00
6.00
7.00
1995 1996 1997 1998 1999 2000
Year
%
Unemployment Rate (December)

Interest Rate

Interest RateItemization 1997 1998 1999 2000 2 001 Interest Rate - Federal Funds (%per year - December) 42.0 31.2 19.0 16.2 19.1
Interest Rate
0.0
10.0
20.0
30.0
40.0
50.0
1997 1998 1999 2000 2 001
Year
%
Interest Rate - Federal Funds (%per year - December)

International Reserves
International Reserves
3000035000400004500050000550006000065000700007500080000
Jan
-97
Ma
r-9
7
Ma
y-9
7
Jul-
97
Se
p-9
7
No
v-9
7
Jan
-98
Ma
r-9
8
Ma
y-9
8
Jul-
98
Se
p-9
8
No
v-9
8
Jan
-99
Ma
r-9
9
Ma
y-9
9
Jul-
99
Se
p-9
9
No
v-9
9

Foreign Exchange Rate
Foreign Exchange Rate (R$/US$)
0.7
0.9
1.1
1.3
1.5
1.7
1.9
2.1
Jan-
96
Mar
-96
May
-96
Jul-9
6
Sep
-96
Nov
-96
Jan-
97
Mar
-97
May
-97
Jul-9
7
Sep
-97
Nov
-97
Jan-
98
Mar
-98
May
-98
Jul-9
8
Sep
-98
Nov
-98
Jan-
99
Mar
-99
May
-99
Jul-9
9
Sep
-99
Nov
-99

Stock Exchange Bovespa
Ibovespa
4,000
6,000
8,000
10,000
12,000
14,000
Jan-
96
Mar
-96
May
-96
Jul-9
6
Sep-9
6
Nov-96
Jan-
97
Mar
-97
May
-97
Jul-9
7
Sep-9
7
Nov-97
Jan-
98
Mar
-98
May
-98
Jul-9
8
Sep-9
8
Nov-98

Stock Exchange Bovespa
Stock Exchange - IBOVESPA
0
5 000
10 000
15 000
20 000
1996 1997 1998 1999 2000 2 001
Year
Po
ints
- 50.0
0.0
50.0
100.0
150.0
200.0
% C
han
ge
Stock Exchange (IBOVESPA - End of Period) % Change

GDP GrowthItemization 1995 1996 1997 1998 1999 2000GDP at market prices (R$ Billion) 646 779 871 914 961 1 090Real GDP change rate (%) 4.2 2.7 3.3 0.2 0.8 4.5
GDP Growth
0
200
400
600
800
1 000
1 200
1995 1996 1997 1998 1999 2000
Year
R$
Bil
lio
n
0.0
1.0
2.0
3.0
4.0
5.0
% C
han
ge
GDP at market prices (R$ Billion) Real GDP change rate (%)

GDP US$Itemization 1995 1996 1997 1998 1999 2000GDP (US$ billion) 705 775 808 787 529 596Change rate (%) 9.9 4.2 - 2.5 - 32.8 12.6
GDP US$
0
200
400
600
800
1 000
1995 1996 1997 1998 1999 2000
Year
US
$ B
illi
on
- 40.0
- 30.0
- 20.0
- 10.0
0.0
10.0
20.0
% C
han
ge
GDP (US$ billion) Change rate (%)

Inflation RateItemization 1995 1996 1997 1998 1999 2000Inflation Rate (IPCA - % Change) 66.01 15.76 6.93 3.20 4.86 7.04
Inflation Rate
-
10.00
20.00
30.00
40.00
50.00
60.00
70.00
1995 1996 1997 1998 1999 2000
Year
%
Inflation Rate (IPCA - % Change)

Monetary BaseItemization 1996 1997 1998 1999 2000 2 001 Monetary Base (R$ Billion) 20 32 39 48 48 45% Change 60.8 23.1 23.6 - 1.5 - 4.6
Monetary Base
0
10
20
30
40
50
60
1996 1997 1998 1999 2000 2 001
Year
R$
Bil
lio
n
- 10.0 0.0 10.0 20.0 30.0 40.0 50.0 60.0 70.0
%
Monetary Base (R$ Billion) % Change
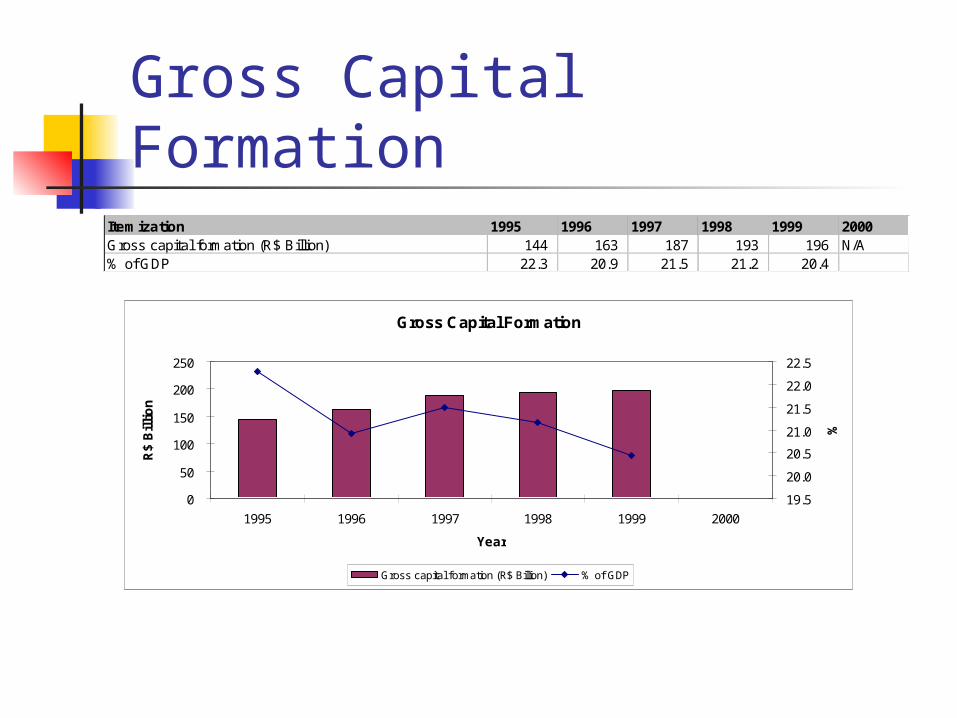
Gross Capital FormationItemization 1995 1996 1997 1998 1999 2000Gross capital formation (R$ Billion) 144 163 187 193 196 N/A% of GDP 22.3 20.9 21.5 21.2 20.4
Gross Capital Formation
0
50
100
150
200
250
1995 1996 1997 1998 1999 2000
Year
R$
Bil
lio
n
19.5
20.0
20.5
21.0
21.5
22.0
22.5
%
Gross capital formation (R$ Billion) % of GDP

National AccountsItemization 1995 1996 1997 1998 1999 2000
GDP at market prices (R$ thousand) 646 191 517 778 886 727 870 743 034 913 735 044 960 857 736 1 089 688 140
Real GDP change rate (%) 4.2 2.7 3.3 0.2 0.8 4.5
Implicit GDP deflator (%) 77.6 17.4 8.3 4.7 4.3 8.6
Nominal GDP change rate (%) 85.0 20.5 11.8 4.9 5.2 13.4
Net income/payments abroad (R$ thousand)1/ 10 153 742 12 227 761 17 110 252 22 362 173 34 823 000 47 009 069 *
GNP at market prices (R$ thousand) 636 037 775 766 658 966 853 632 782 891 372 871 926 034 736 1 042 679 071 3/
Net unrequited transfers (R$ thousand)2/ 3 324 649 2 598 250 2 022 936 1 759 437 2 227 000 3 285 215 *
Gross national disposable income (R$ thousand)2/ 639 362 424 769 257 216 855 655 718 893 132 308 928 261 736 1 045 964 286 3/
Balance of payments deficit in current account 18 226 492 24 509 968 37 883 110 44 573 739 43 266 000 44 999 823 *
(R$ thousand)
Consumption expenditures and gross capital formation 657 588 916 793 767 184 893 538 828 937 706 047 971 527 736 1 090 964 109 3/
(R$ thousand)
Consumption (R$ thousand) 513 561 741 630 813 704 704 200 000 738 747 000 775 098 000 ...
Gross capital formation (R$ thousand) 144 027 175 162 953 480 187 187 000 193 436 000 196 452 000 ...
Gross savings (R$ thousand)2/ 125 800 683 138 443 512 149 303 890 148 862 261 153 186 000 ...
GDP (US$ billion)3/ 705.4 775.5 807.8 787.5 529.4 595.9
Source: Bacen and IBGE