Brazil - USDA · Source: Brazilian Agricultural Research Center (EMBRAPA). While IBGE and EMBRAPA...
13
THIS REPORT CONTAINS ASSESSMENTS OF COMMODITY AND TRADE ISSUES MADE BY USDA STAFF AND NOT NECESSARILY STATEMENTS OF OFFICIAL U.S. GOVERNMENT POLICY - Date: GAIN Report Number: Post: Report Categories: Approved By: Prepared By: Report Highlights: The Brazilian economy is on the rise, driven in large put by high consumer demand. This is reflected in the wine market where imports have increased 94 percent over the last five years. In the past five years, the growth of U.S. wine exports to Brazil was larger than the average growth of all imported wines in containers of less than two liters. Opportunities abound for U.S. wine exports. I) Production: Katty Corrente, Agricultural Assistant Fred Giles, Director Agricultural Trade Office, São Paulo Wine Brazilian Wine Market Sao Paulo ATO Brazil BR10010 11/30/2010 Public Voluntary
Transcript of Brazil - USDA · Source: Brazilian Agricultural Research Center (EMBRAPA). While IBGE and EMBRAPA...

THIS REPORT CONTAINS ASSESSMENTS OF COMMODITY AND TRADE ISSUES MADE BY
USDA STAFF AND NOT NECESSARILY STATEMENTS OF OFFICIAL U.S. GOVERNMENT
POLICY
-
Date:
GAIN Report Number:
Post:
Report Categories:
Approved By:
Prepared By:
Report Highlights:
The Brazilian economy is on the rise, driven in large put by high consumer demand. This is
reflected in the wine market where imports have increased 94 percent over the last five years. In
the past five years, the growth of U.S. wine exports to Brazil was larger than the average growth
of all imported wines in containers of less than two liters. Opportunities abound for U.S. wine
exports.
I) Production:
Katty Corrente, Agricultural Assistant
Fred Giles, Director Agricultural Trade Office, São Paulo
Wine
Brazilian Wine Market
Sao Paulo ATO
Brazil
BR10010
11/30/2010
Public Voluntary

The International Organization of Vine and Wine (OIV) estimates the world total wine production at
266 million hectoliters. Brazilian production accounted for approximately 3 million hectoliters,
representing 1 percent of world total production. World wine production has been relatively stable.
However, Brazil has decreased production volumes from 2007 to 2009 by more than 15 percent.
The decrease production is mostly due to the wide climatic variations encountered in grape
producing areas of Brazil.
Grape-planted area in Brazil reached 82,584 hectares in 2009, which represents a 2 percent
increase compared to the previous year. Total production reached 1.3 million tons in 2009, a
decrease of 6 percent compared to 2008. A slightly decrease in yields was also observed, from
17.7kg/ha in 2008 to 17.0kg/ha in 2009.
According to the Brazilian Institute of Statistics and Geography (IBGE), in 2009, the state of Rio
Grande do Sul made up 54 percent of total grape production. The remainder of grape production
was concentrated in the state of São Paulo, Pernambuco, Paraná, Santa Catarina, Minas Gerais and
the Vale do São Francisco region (Bahia state). Although not reported by IBGE, the states of Mato
Grosso do Sul, Espirito Santo, Parana and Piaui have also been producing grapes in small
quantities.
Each wine grape area has a peculiarity. The 9 degree south latitude in the Vale do São Francisco,
located in the Northeast region, allows producers to harvest two to three times per year. In the
south of Minas Gerais and east of São Paulo winter harvesting - also known as cycle inversion - has
decreased the production of table grapes while raising the production of wine grapes such as Syrah.
WINE GRAPE PRODUCTION AREAS
Source: Brazilian Wine Institute (IBRAVIN)
The South region is the traditional wine production area in Brazil. The Uplands and Southeast
mountain range of Rio Grande do Sul produce European varietals such as Cabernet Sauvignon,

Merlot, Tannat and Sauvignon Blanc. Serra Gaúcha gathers the largest vineyards and is an enology
reference for the wine sector in Brazil. In 2001, new ventures emerged in the Santa Catarina
uplands. Those ventures were motivated by high altitudes, which allow harvesting between May
and June.
As shown in the table below the total volume of grape production in Brazil dropped to 1,345,719
tons. Production was impacted by adverse weather conditions and the reduction of vineyards due
to the world economic crisis.
Brazilian Grape Production (ton)
State 2006 2007 2008 2009
Pernambuco 155,783 170,326 162,977 158,515
Bahia 89,738 120,654 97,481 90,508
Minas Gerais 12,318 11,995 13,711 11,773
São Paulo 195,357 193,023 192,976 177,934
Paraná 95,357 99,180 101,500 102,080
Santa Catarina 47,787 54,554 58,330 67,546
Rio Grande do Sul 623,847 705,228 776,027 737,363
Brazil 1,220,187 1,354,960 1,403,002 1,345,719
Source: Brazilian Institute of Statistics and Geography (IBGE).
According to the Brazilian Agricultural Research Center (EMBRAPA), the production of table grapes and
grapes for industrial purposes has oscillated strongly in the past years. Nonetheless, the
production of grapes for industrial purposes has been increasing in the past four years. While in
2006 the production of wine varietals made up 38.3 percent of total production, the share rose to
50.3 percent in 2009, totaling 678,169 ton.
Brazilian Grape Production by destination (ton)
2006 2007 2008 2009
Industrial purpose 470,705 637,125 708,042 678,169
In Natura 757,685 717,835 691,220 667,550
Source: Brazilian Agricultural Research Center (EMBRAPA).
While IBGE and EMBRAPA data correspond to the total production of fresh grapes in the country,
the Brazilian Union for Wine Production (UVIBRA) produces estimates of wine production based on
the volume of grapes harvested in Rio Grande do Sul and delivered to the processing industry.
According to UVIBRA, the wine varietals account for less than twenty percent of total grape
production for industrial purposes. Wine production during 2002-2009 decreased almost 30
percent in 2006, against a 47 percent increase during the period of 2006 to 2008. In 2009, wine
production declined 18.6 percent.
WINE GRAPE PRODUCTION (t) x WINE PRODUCTION (000 hl)

Source: Brazilian Union for Wine Production (UVIBRA)
Note: data refers to Rio Grande do Sul state
According to the Brazilian Agricultural Research Center (EMBRAPA), Cabernet Sauvignon and
Merlot varietals were the most common varietals for red wine production in 2008, accounting for
33 percent and 24 percent, respectively. Among white and rose grape production, Moscato and
Chardonnay are the most accepted types of grape in Brazil. In 2008, Moscato production reached
approximately 15 million tons compared to 6 million tons of Chardonnay grapes. However, as a
result of the consumers’ openness to new trends, the consumption of other wine types - such as
Merlot, Malbec, Sauvignon Blanc and Riesling - continues to increase.
Processed red wine grapes by type (Ton)

2005 2006 2007 2008
Cabernet Sauvignon 12,821 12,063 14,489 16,646
Merlot 10,632 8,443 11,399 11,866
Tannat 4,561 3,055 3,514 4,711
Cabernet Franc 3,869 3,285 4,081 4,008
Pinot Noir 1,704 1,161 1,270 1,930
Ancelota 861 872 1,532 1,709
Alicante Bouschet 1,076 1,078 1,775 1,588
Pinotage 1,994 996 1,113 1,578
Egiodola 1,070 899 1,265 1,366
Others 2,891 2,390 3,423 3,590
Total 41,479 34,242 43,861 48,992
Source: Brazilian Agricultural Research Center (EMBRAPA). Note: data refers to Rio Grande do Sul state
Processed white and rose wine grapes by type (Ton)
2005 2006 2007 2008
Moscato 10,146 10,749 15,717 14,744
Chardonnay 4,441 1,830 1,752 5,829
Riesling Italico 3,496 1,902 1,961 2,699
Prosecco 789 917 910 1,931
Trebbiano 1,974 1,376 1,712 1,846
Moscato Giallo 703 777 1,173 1,122
Moscato Nazareno 922 544 616 1,035
Colombard 655 519 594 880
Sauvignon Blanc 738 606 618 609
Others 5,234 3,127 3,216 3,889
Total 29,098 22,347 28,269 34,584
Source: Brazilian Agricultural Research Center (EMBRAPA). Note: data refers to Rio Grande do Sul state
II) Consumption:
A study from the Brazilian Wine Institute (IBRAVIN) reports that a large number of Brazilian wine
consumers still consider drinking wine as a symbol of prestige and sophistication. However,
Brazilian per capita consumption is still modest when compared to Italian and French levels. In
Brazil, a consumer drinks 1.8 liters of wine per year while in Italy and France the volume is around
43 liters per year. Even when compared to neighboring countries, the consumption is still small.
In Argentina, for instance, per capita wine consumption is almost 23 liters per year. Wine sales in
Brazil are mainly concentrated in the South and Southeast regions. Nevertheless, wine specialists
believe that sparkling wines have good consumption potential in the Northeast region due to the
high temperatures throughout the year.
Despite the low per capita consumption, wine companies estimate that the wine sector grew 10
percent in 2009 and will increase around 18 percent in 2010, thanks to the significant growth of
the Brazilian economy and favorable exchange rates. In addition, a growing number of new wine
stores facilitated the entry of new brands, increasing competitiveness in the Brazilian market.
Wine consumption in Brazil underwent significant changes between 2002 and 2003 when
Argentinean and Chilean wine companies began to target their export efforts toward Brazil.
Argentinean producers benefit from the Mercosul trade agreement, which exempts wines from the
import tax (II). In addition, the bilateral trade agreement with Brazil has been reducing the import
tax (II) of Chilean wines, which will reach tax exemption in 2011. Although price still affects
Brazilian consumers’ decision, such tax benefits allowed Chilean and Argentinean wines to become
preferred among wines from the New World.
To encourage the consumption of Wines from the New World - which includes Brazilian wines –
associations and producers have been investing in marketing and new technology since 2009.
These marketing efforts are based on a market study from the Brazilian Wine Institute (IBRAVIN).
The study states that the Brazilian consumers are attracted by authenticity and contemporary
features. These consumers have demanding personalities and are up to 40 years of age. The
report also states that the consumption is still low due to consumers’ lack of information about
wines. Marketing actions are taking place through television, radio, magazines and supermarkets,
which are still the top wine sellers; Brazilian producers are investing in new technologies to
improve the wine quality and attract these consumers with diverse packaging and labeling.
Nevertheless, industry sources believe that these efforts are not enough to increase wine
consumption. IBRAVIN estimates that the per capita consumption will be 3.5 liters per year by
2030. However, the potential is much bigger when considering an estimated population of 210
million habitants in 2030, which will represent the highest level of Economically Active Population
(EAP) in Brazilian history. Wine marketing specialists believe that in order to increase the
consumption among the EAP, the wine sector will need more investments in marketing and
technology to overcome climate issues and lack of knowledge about wines.
III) Trade:
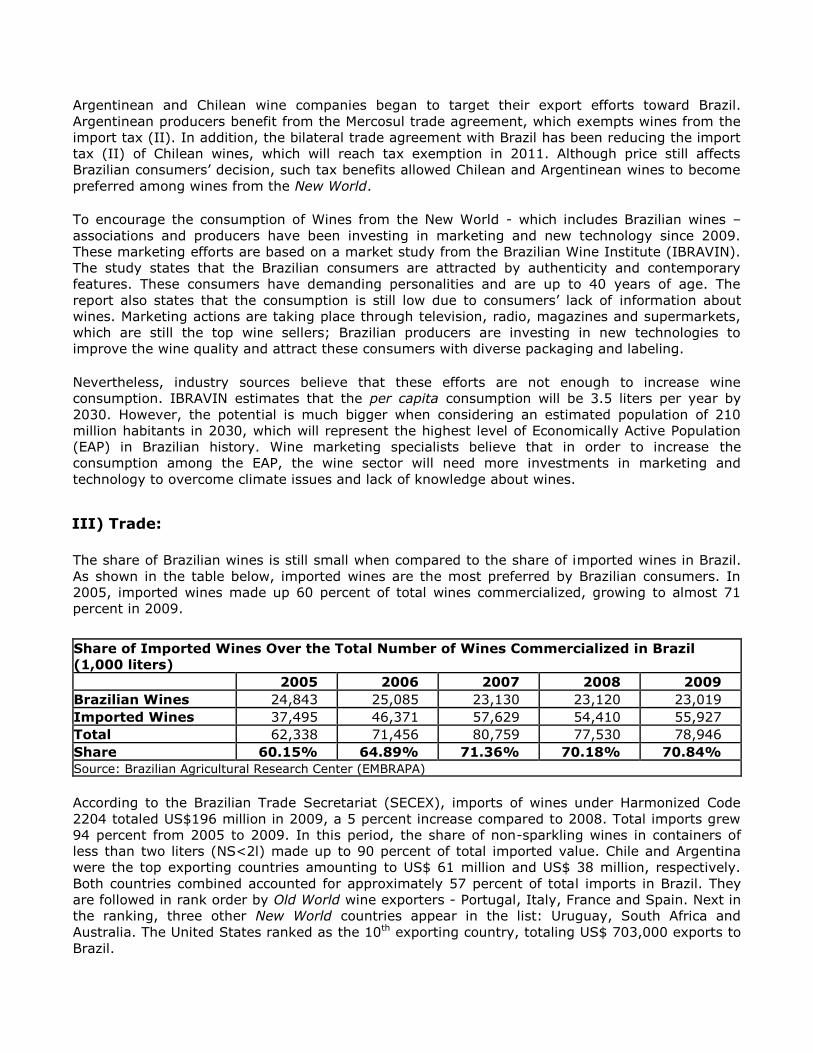
The share of Brazilian wines is still small when compared to the share of imported wines in Brazil.
As shown in the table below, imported wines are the most preferred by Brazilian consumers. In
2005, imported wines made up 60 percent of total wines commercialized, growing to almost 71
percent in 2009.
Share of Imported Wines Over the Total Number of Wines Commercialized in Brazil
(1,000 liters)
2005 2006 2007 2008 2009
Brazilian Wines 24,843 25,085 23,130 23,120 23,019
Imported Wines 37,495 46,371 57,629 54,410 55,927
Total 62,338 71,456 80,759 77,530 78,946
Share 60.15% 64.89% 71.36% 70.18% 70.84%
Source: Brazilian Agricultural Research Center (EMBRAPA)
According to the Brazilian Trade Secretariat (SECEX), imports of wines under Harmonized Code
2204 totaled US$196 million in 2009, a 5 percent increase compared to 2008. Total imports grew
94 percent from 2005 to 2009. In this period, the share of non-sparkling wines in containers of
less than two liters (NS<2l) made up to 90 percent of total imported value. Chile and Argentina
were the top exporting countries amounting to US$ 61 million and US$ 38 million, respectively.
Both countries combined accounted for approximately 57 percent of total imports in Brazil. They
are followed in rank order by Old World wine exporters - Portugal, Italy, France and Spain. Next in
the ranking, three other New World countries appear in the list: Uruguay, South Africa and
Australia. The United States ranked as the 10th exporting country, totaling US$ 703,000 exports to
Brazil.

Brazilian Wine Imports (Thousand Dollars)
2005 2006 2007 2008 2009 % ∆ 2005-2009
1 Chile 25,414 36,643 47,669 50,740 61,378 141.51%
2 Argentina 21,523 25,764 36,115 37,354 38,521 78.98%
3 Portugal 14,509 18,846 23,499 23,654 23,423 61.44%
4 Italy 11,163 16,994 22,022 24,366 23,058 106.56%
5 France 5,731 10,442 14,661 16,221 16,892 194.75%
6 Spain 2,489 4,280 4,496 6,024 6,219 149.86%
7 Uruguay 924 1,439 3,132 2,089 1,943 110.28%
8 South Africa 775 1,164 1,320 1,152 1,931 149.16%
9 Australia 901 1,060 1,583 1,247 998 10.77%
10 United States 245 355 334 542 703 186.94%
11 New Zealand 224 255 417 537 302 34.82%
12 Germany 382 635 648 1,064 292 -23.56%
Others 203 159 414 397 433 113.30% Total NS>2 84,483 118,036 156,310 165,387 176,093 108.44% All wines 100,616 139,906 175,226 185,836 196,050 94.85%
Source: Brazilian Secretariat of Foreign Trade (SECEX)
Note: NS>2 refers to Non Sparkling Wines in Containers of Less than 2 Liters.
The growth of U.S. wine exports to Brazil was larger than the average growth of imported wines in
containers of less than two liters. In the last five years, U.S. wine exports increased 187 percent
against an average growth of 108 percent of all imported wines in the same period. In terms of
market growth, France is the leading exporting country, followed by the United States.
Brazilian wine imports from January to October (Thousand Dollars)
2009 2010 ∆ % 2009-2010
1 Chile 46,874 59,375 26.67%

2 Argentina 31,018 40,192 29.58%
3 Portugal 18,223 22,883 25.57%
4 Italy 17,037 21,753 27.68%
5 France 12,102 14,586 20.53%
6 Spain 4,745 6,873 44.85%
7 South Africa 1,616 2,905 79.76%
8 Uruguay 1,505 2,218 47.38%
9 Austrália 878 1,414 61.05%
10 United States 489 971 98.57%
11 New Zealand 196 840 328.57%
12 Germany 243 620 155.14%
Others 370 474 28.11%
Total NS>2 135,296 175,104 29.42%
All wines 149,458 193,674 29.58%
Source: Brazilian Secretariat of Foreign Trade (SECEX).
Note: NS>2 refers to Non Sparkling Wines in Containers of Less than 2 Liters.
The statistics for 2010 corroborate the favorable economic situation. Supported by exchange rate
stability, U.S. wine exports to Brazil amounted to US$ 971,000 from January to October, an
increase of 98 percent compared to the same period in 2009. This growth also represents an
almost 40 percent increase over the total value exported to Brazil in 2009. Nonetheless, the
growth has not raised the market share of U.S. wines in Brazil. Chile and Argentina account for
almost 57 percent of market share, followed by European countries. Portugal, Italy, France and
Spain have a share of 13.3 percent, 13.09 percent, 9.59 percent and 3.53 percent, respectively.
All the other countries have less than 4 percent of market share. The United States has not
reached the one percent threshold of total market share.
MARKET SHARE BY EXPORTER COUNTRY IN 2009 (%)

Source: Brazilian Secretariat of Foreign Trade (SECEX)
According to wine importers, not only does the exchange rate favor consumption of U.S. wine but
also the increased levels of Brazilian consumers’ income. As a result, consumers have more travel
opportunities during which they become acquainted with New World wines. These consumers are
open and receptive to wines from new origins and varietals. The Index Performance of New World
wines (based on import values for 2003) illustrates how the United States can benefit from this
new consumer behavior. Australia and New Zealand wines - which are direct U.S. competitors - are
decreasing their advance in the Brazilian market. The United States is able to compete with these
countries with the same quality and new wine grape varietals.
INDEX PERFORMANCE OF NEW WORLD WINE EXPORTS TO BRAZIL (excluding South America)
Source: Brazilian Secretariat of Foreign Trade (SECEX)
IV) Import procedures

The Secretariat of Agricultural Protection (SDA) of the Ministry of Agriculture, Livestock and Food
Supply (MAPA) has the regulatory authority to enforce regulations on domestic and imported plant
products and by-products. Under the Secretariat of Agricultural Protection (SDA), the Department
of Plant Origin Products Inspection Service (DIPOV) is responsible for enforcing federal law
regarding registration, compliance, and labeling of beverages (including distilled spirits and wine,
soft drinks, and juices). In order to better assist the large volume of requests for imported wines,
Ministry of Agriculture, Livestock and Food Supply (MAPA) created the General Coordination for
Wines and Beverages (CGVB), which oversees wine and beverage related issues. Inspections at
airports and ports are overseen by another major office called General Coordination for
International Sanitary Inspection of Agriculture and Livestock (CGVIG).
Recently, MAPA changed its wine import regulations through Normative Instruction no. 54 of
November 18th, 2009. The new regulation exempts wineries from registration with MAPA and also
establishes new formats for the certificate of analysis and certificate of origin for aseptic fermented
beverages, which includes vinegar and wines. According to Normative Instruction no. 54/2009, the
certificates must follow the model presented on the ANNEX VIII of Normative Instruction no.
54/2009. Moreover, under this new procedure, MAPA also requires a list of entities eligible to issue
the certificates of origin and analysis. In the past, companies have provided a document issued by
Chambers of Commerce. This is no longer accepted. Currently, each foreign government has to
formally notify MAPA of all entities eligible to issue the certificates. The list of eligible entities is
available at MAPA’s web site (http://www.agricultura.gov.br/).
U.S. labs or companies that are not on the list must contact the U.S. Agricultural Trade Office in
Sao Paulo. In order to expedite the process, the exporter should send a copy of the certificates and
complete contact information for the lab/company.
The complete import process for wines follows:
Pre-embarkation
I) Formula Study
Required documents: Quantitative product formula Alcohol Content
Procedure: The Formula Study consists of analyzing the complete composition of the
product, in order to tell whether it fulfills its Identity and Quality Standards (PIQ), which are
determined by specific legislation. In addition, it must be verified whether all ingredients
and additives are allowed for the product category in Brazil, as well as whether it obeys
maximum established limits.
II) Label development
Required documents: Quantitative product formula Alcohol Content Original product label.
Procedure: The label must include, on each unit statements determined by specific
legislation. In the case of a product whose label is not in the Portuguese language, an

adhesive sticker may be used, on the original label, including all the obligatory information
in Portuguese.
III) Exporter’s Pro Forma
Required documents: Exporter’s Pro Forma
Procedure: Once the sale of the merchandise is established between the exporter and the
importer, the import operation begins. At that point, the writing up of a Pro Forma Invoice
becomes necessary and the exporter must send it to the importer. IV) Issuance of an Import License (L.I.)
Required documents:
Import License
Procedure: Once the importer accepts the Pro forma invoice, the company must consult
with the Integrated Foreign Trade System (SISCOMEX), using the NCM code (equivalent to
the HS code) of the product to be imported, as to whether an Import License (LI) is needed.
In the case of wines, when consulting with SISCOMEX in Administrative Treatments,
through the NCM, the system will indicate that the issuance of an LI with MAPA pre-
approval is necessary prior to the shipment of the merchandise. This procedure may be
done by the importer or by a registered agent previously authorized to use SISCOMEX in
the importer’s name.
Embarkation: V) Embarkation Instructions
Required documents: Embarkation Instruction
Procedure: In order to ship the merchandise, the importer must supply the Embarkation
Instructions to the exporter. These instructions consist of a document containing all the
information related to the sale and the merchandise condition upon embarkation, such as
the quantity of the product, form of payment, transport temperature, packaging, pallet
used, etc.
VI) Load/Shipment Clearance
Required documents: None
Procedure: The exporter sends the Shipping Instructions containing all the information
necessary for issuance of the bill of lading. Customs Clearance

VII) Arrival of the Merchandise at the Port
Required documents: None
Procedure: Upon arrival of the merchandise at the port, the load must be sent to the
Customs Terminal (storage) pre-selected by the importer. Otherwise, it will be sent to the
terminal at which the shipping company maintains space. Once the merchandise is duly
placed, the terminal must confirm and create the presence of the cargo, which is done by
informing SISCOMEX of the conditions under which the cargo was received.
VIII) Registering the Import Declaration (DI) with SISCOMEX
Required documents: None
Procedure: Once the LI is released by MAPA, the importer or the registered customs agent
must register the DI at SISCOMEX. The DI is a document in which all information related to
the import will be contained such as importer information, data on the cargo, data on the
bonded storage, etc.
IX) Physical review by MAPA official
Required documents: Request for Review of Agricultural Products Additional data for the request for review of agricultural products when there is more than
one product per request Inspection Memorandum Deposit Agreement – General Coordination for Sanitary Inspection on Agriculture and
Livestock (VIGIAGRO) Collecting samples agreement Certificate of analysis and Certificate of Origin Aging Certificate (if necessary) Commercial Invoice Copy of the Bill of Lading or AWB LI Packing list Copy of the Operational License of the warehouse where the product will be stored.
Procedure: Once the product arrives in Brazil, the customs official will verify whether it was
duly authorized and if all the documents comply with the requirements.
X) Federal Revenue Parameterized Selection
Required documents:
Request for Review of Agricultural Products Additional data for the request for review of agricultural products when there is more than
one product per request
Inspection Memorandum Deposit Agreement (VIGIAGRO) Collecting samples agreement

Certificate of analysis and Certificate of Origin Aging Certificate (if necessary) Commercial Invoice Copy of the Bill of Lading or AWB LI Packing list Copy of the Operational License of the warehouse where the product will be stored ICMS Guide collected Proof Import (CI)
Procedure: Upon registration of the DI, the process goes into Federal Revenue
parameterization with SISCOMEX. The system will choose automatically on which channel
the merchandise will be cleared by the Federal Revenue.
XI) MAPA Clearance to Commercialize Products
Required documents: None
Procedure: The beverage may only be cleared for commercialization after clearance by
MAPA – control analysis - which must be done by MAPA’s laboratory in Jundiai (zero cost,
and takes approximately 60 days to obtain the written results) or, for those desirous of
accelerating the process, it be done by a Legally-Approved Laboratory.
OBS.: for detailed information on import process, please, access Market Access Report for Wines at
http://www.usdabrazil.org.br/home/pdf/rw_wine.pdf
V) Post contact and further information
Please do not hesitate to contact the offices below for questions or comments regarding this report
or request assistance to export processed food products into Brazil: U.S. Agricultural Trade Office (ATO) Office of Agricultural Affairs (OAA)
U.S. Consulate General U.S. Embassy Rua Henri Dunant, 700 Av. das Nacoes, quadra 801, lote 3
04709-110 Sao Paulo – SP 70403-900 Brasilia - DF
Tel: (55 11) 5186-7400 Tel: (55 61) 3312-7000
Fax: (55 11) 5186-7499 Fax: (55 61) 3312-7659
E-mail: [email protected] E-mail: [email protected] [email protected] Home Page: www.usdabrazil.org.br