BRAZIL - OECD.org · Among Latin American countries, Brazil performs below Chile, Mexico, Uruguay...
12
BRAZIL Key findings • While Brazil performs below the OECD average, its mean performance in mathematics has improved since 2003 from 356 to 391 score points, making Brazil the country with the largest performance gains since 2003. Significant improvements are also found in reading and science. • Improvements have been particularly strong among low performers in mathematics, reading and science. • Between 2003 and 2012, Brazil also expanded enrolment in primary and secondary schools, with enrolment rates for 15-year-olds growing from 65% in 2003 to 78% in 2012. • The disciplinary climate in Brazilian schools was better in 2012 than in 2003, and schools were able to attract and retain qualified teachers more easily. • Grade repetition is still widespread in Brazil, is negatively associated with performance in mathematics, and is more prevalent among disadvantaged students. Brazil needs to look for more effective ways to work with low-performing students in order to establish high expectations for all, motivate students, and reduce high dropout rates. Student performance in mathematics, reading and science Brazil performs below the average in mathematics (ranks between 57 and 60), reading (ranks between 54 and 56) and science (ranks between 57 and 60) among the 65 countries and economies that participated in the 2012 PISA assessment of 15-year-olds. Mean mathematics performance • Students in Brazil score 391 points in mathematics, on average – below the OECD average and comparable with Albania, Argentina, Jordan and Tunisia. Among Latin American countries, Brazil performs below Chile, Mexico, Uruguay and Costa Rica, but above Colombia and Peru. • Brazil’s mean performance has improved since 2003 from 356 to 391 score points, showing an annualised change of 4.1 score points. Figures accounting for social and demographic changes between 2003 and 2012 show that this improvement in mathematics performance results, for about half, from improvements in the economic, social and cultural status of the student population.
Transcript of BRAZIL - OECD.org · Among Latin American countries, Brazil performs below Chile, Mexico, Uruguay...

BRAZIL Key findings
• While Brazil performs below the OECD average, its mean performance in mathematics has improved since 2003 from 356 to 391 score points, making Brazil the country with the largest performance gains since 2003. Significant improvements are also found in reading and science.
• Improvements have been particularly strong among low performers in mathematics, reading and science.
• Between 2003 and 2012, Brazil also expanded enrolment in primary and secondary schools, with enrolment rates for 15-year-olds growing from 65% in 2003 to 78% in 2012.
• The disciplinary climate in Brazilian schools was better in 2012 than in 2003, and schools were able to attract and retain qualified teachers more easily.
• Grade repetition is still widespread in Brazil, is negatively associated with performance in mathematics, and is more prevalent among disadvantaged students. Brazil needs to look for more effective ways to work with low-performing students in order to establish high expectations for all, motivate students, and reduce high dropout rates.
Student performance in mathematics, reading and science Brazil performs below the average in mathematics (ranks between 57 and 60), reading (ranks between 54 and 56) and science (ranks between 57 and 60) among the 65 countries and economies that participated in the 2012 PISA assessment of 15-year-olds.
Mean mathematics performance
• Students in Brazil score 391 points in mathematics, on average – below the OECD average and comparable with Albania, Argentina, Jordan and Tunisia. Among Latin American countries, Brazil performs below Chile, Mexico, Uruguay and Costa Rica, but above Colombia and Peru.
• Brazil’s mean performance has improved since 2003 from 356 to 391 score points, showing an annualised change of 4.1 score points. Figures accounting for social and demographic changes between 2003 and 2012 show that this improvement in mathematics performance results, for about half, from improvements in the economic, social and cultural status of the student population.

BRAZIL – Country Note –Results from PISA 2012
© OECD 2
Share of top- and low-performing students in mathematics
Changes in a country’s average performance can result from changes among low performers (those who perform below the baseline Level 2) and/or among top performers (those who perform at Level 5 or 6). Between 2003 and 2012, performance gains in Brazil can largely be attributed to a reduction in the proportion of low-performing students.
• Some 67.1% of students are low performers in mathematics, meaning that, at best, they can extract relevant information from a single source and can use basic algorithms, formulae, procedures or conventions to solve problems involving whole numbers. This proportion in 2012 is above the OECD average, but decreasing from an even higher share in 2003 (75.2%).
• Some 1.1% of students are top performers in mathematics, meaning that they can develop and work with models for complex situations, and work strategically using broad, well-developed thinking and reasoning skills. This proportion is stable and smaller than on average across the OECD.
Gender differences in mathematics
• In 2012, Brazilian boys scored 18 points higher in mathematics than girls, on average; this gender gap is larger than the OECD average, and remained stable since 2003.
Student performance in different areas of mathematics
• Among the three mathematical processes measured in PISA, Brazil’s 15-year-old students have the highest mean scores in interpreting, applying and evaluating mathematical outcomes. They have the lowest mean scores in formulating situations mathematically, and perform close to their overall performance level in employing mathematical concepts, facts, procedures and reasoning.
• Among the four content areas distinguished in PISA within mathematics, Brazilian students performed strongest in uncertainty and data, and weakest in change and relationships. Their performance in space and shape was also somewhat below their overall performance, while their performance in quantity was close to their overall performance.
The strengths and weaknesses of Brazilian students highlighted by the content subscales may reflect differences in curriculum priorities and in course content available to 15-year-olds. The change and relationships subscale, where Brazilian students struggle the most, is most closely linked to algebra and the study of mathematical functions.
Mean reading performance
• Students in Brazil score 410 points in reading, on average – below the OECD average and comparable with Colombia, Tunisia and Uruguay. Among Latin American countries, Brazil performs below Chile, Costa Rica and Mexico, but above Argentina and Peru.
• Brazil’s mean performance has improved since 2000 from 396 to 410 score points, showing an annualised change of 1.2 score points. Figures accounting for social and demographic changes between 2000 and 2012 show that this improvement in reading performance can be entirely explained by improvements in the economic, social and cultural status of the student population.
BRAZIL – Country Note –Results from PISA 2012
© OECD 3
Share of top- and low-performing students in reading
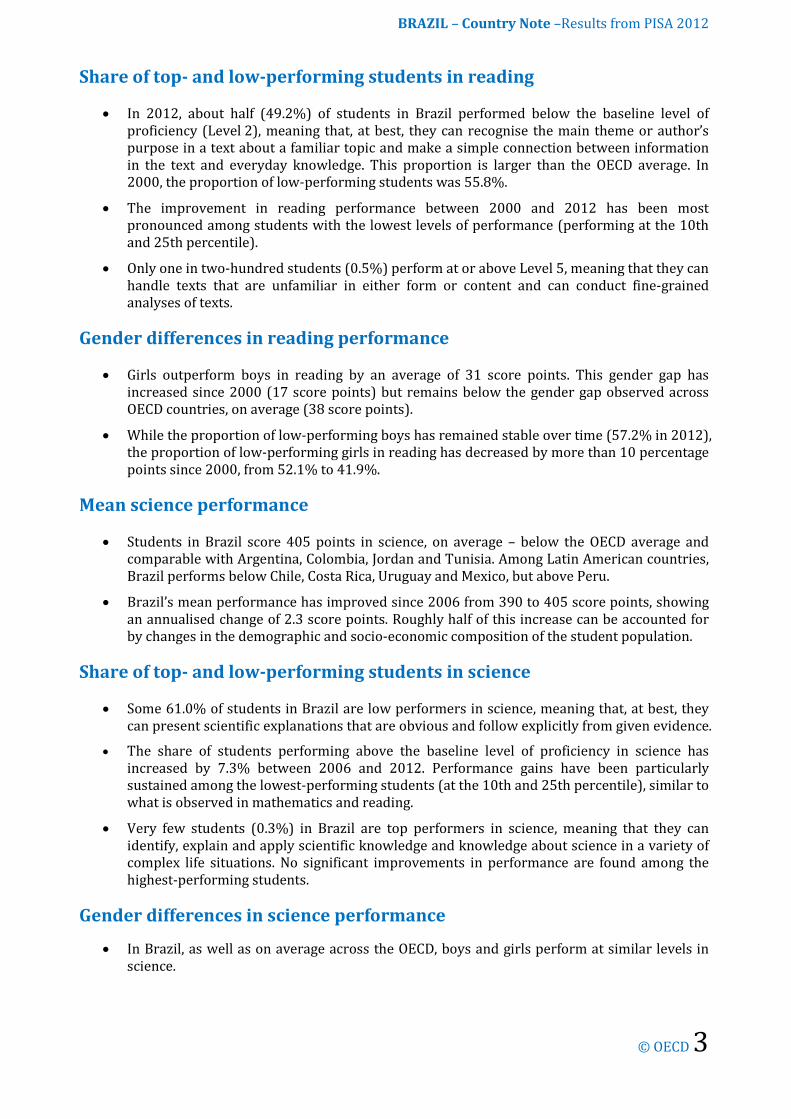
• In 2012, about half (49.2%) of students in Brazil performed below the baseline level of proficiency (Level 2), meaning that, at best, they can recognise the main theme or author’s purpose in a text about a familiar topic and make a simple connection between information in the text and everyday knowledge. This proportion is larger than the OECD average. In 2000, the proportion of low-performing students was 55.8%.
• The improvement in reading performance between 2000 and 2012 has been most pronounced among students with the lowest levels of performance (performing at the 10th and 25th percentile).
• Only one in two-hundred students (0.5%) perform at or above Level 5, meaning that they can handle texts that are unfamiliar in either form or content and can conduct fine-grained analyses of texts.
Gender differences in reading performance
• Girls outperform boys in reading by an average of 31 score points. This gender gap has increased since 2000 (17 score points) but remains below the gender gap observed across OECD countries, on average (38 score points).
• While the proportion of low-performing boys has remained stable over time (57.2% in 2012), the proportion of low-performing girls in reading has decreased by more than 10 percentage points since 2000, from 52.1% to 41.9%.
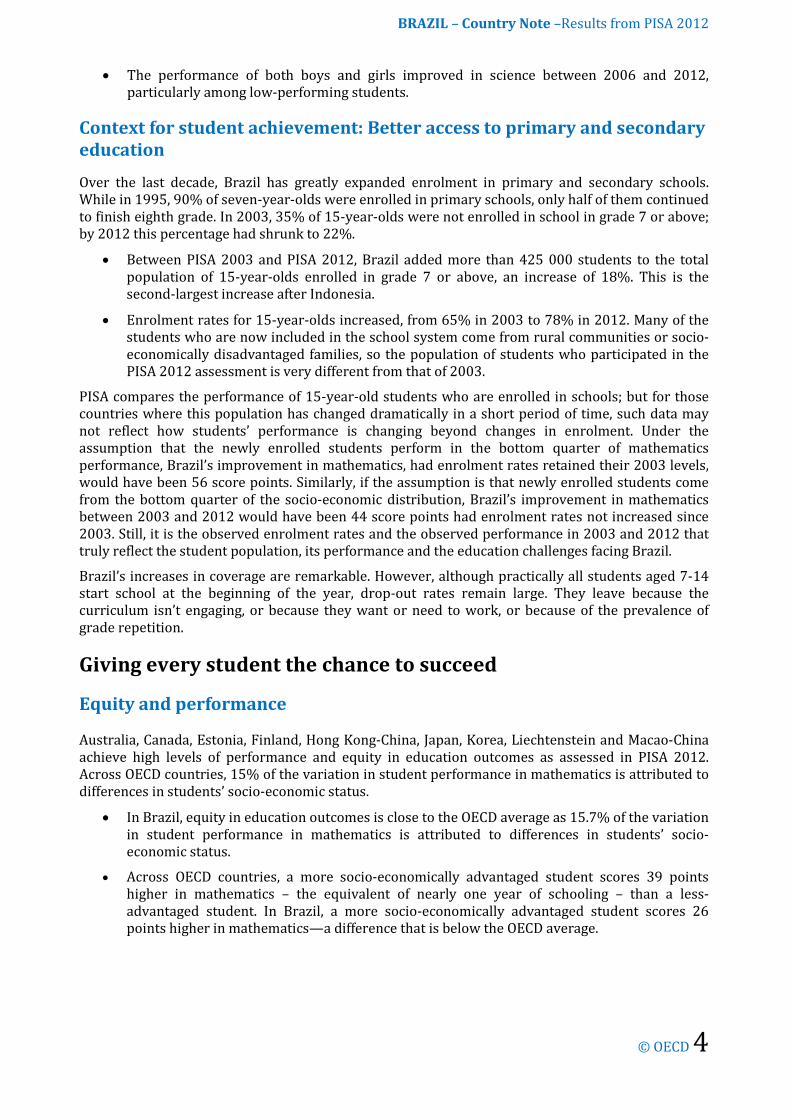
Mean science performance
• Students in Brazil score 405 points in science, on average – below the OECD average and comparable with Argentina, Colombia, Jordan and Tunisia. Among Latin American countries, Brazil performs below Chile, Costa Rica, Uruguay and Mexico, but above Peru.
• Brazil’s mean performance has improved since 2006 from 390 to 405 score points, showing an annualised change of 2.3 score points. Roughly half of this increase can be accounted for by changes in the demographic and socio-economic composition of the student population.
Share of top- and low-performing students in science
• Some 61.0% of students in Brazil are low performers in science, meaning that, at best, they can present scientific explanations that are obvious and follow explicitly from given evidence.
• The share of students performing above the baseline level of proficiency in science has increased by 7.3% between 2006 and 2012. Performance gains have been particularly sustained among the lowest-performing students (at the 10th and 25th percentile), similar to what is observed in mathematics and reading.
• Very few students (0.3%) in Brazil are top performers in science, meaning that they can identify, explain and apply scientific knowledge and knowledge about science in a variety of complex life situations. No significant improvements in performance are found among the highest-performing students.
Gender differences in science performance
• In Brazil, as well as on average across the OECD, boys and girls perform at similar levels in science.
BRAZIL – Country Note –Results from PISA 2012
© OECD 4
• The performance of both boys and girls improved in science between 2006 and 2012, particularly among low-performing students.
Context for student achievement: Better access to primary and secondary education
Over the last decade, Brazil has greatly expanded enrolment in primary and secondary schools. While in 1995, 90% of seven-year-olds were enrolled in primary schools, only half of them continued to finish eighth grade. In 2003, 35% of 15-year-olds were not enrolled in school in grade 7 or above; by 2012 this percentage had shrunk to 22%.
• Between PISA 2003 and PISA 2012, Brazil added more than 425 000 students to the total population of 15-year-olds enrolled in grade 7 or above, an increase of 18%. This is the second-largest increase after Indonesia.
• Enrolment rates for 15-year-olds increased, from 65% in 2003 to 78% in 2012. Many of the students who are now included in the school system come from rural communities or socio-economically disadvantaged families, so the population of students who participated in the PISA 2012 assessment is very different from that of 2003.
PISA compares the performance of 15-year-old students who are enrolled in schools; but for those countries where this population has changed dramatically in a short period of time, such data may not reflect how students’ performance is changing beyond changes in enrolment. Under the assumption that the newly enrolled students perform in the bottom quarter of mathematics performance, Brazil’s improvement in mathematics, had enrolment rates retained their 2003 levels, would have been 56 score points. Similarly, if the assumption is that newly enrolled students come from the bottom quarter of the socio-economic distribution, Brazil’s improvement in mathematics between 2003 and 2012 would have been 44 score points had enrolment rates not increased since 2003. Still, it is the observed enrolment rates and the observed performance in 2003 and 2012 that truly reflect the student population, its performance and the education challenges facing Brazil.
Brazil’s increases in coverage are remarkable. However, although practically all students aged 7-14 start school at the beginning of the year, drop-out rates remain large. They leave because the curriculum isn’t engaging, or because they want or need to work, or because of the prevalence of grade repetition.
Giving every student the chance to succeed
Equity and performance
Australia, Canada, Estonia, Finland, Hong Kong-China, Japan, Korea, Liechtenstein and Macao-China achieve high levels of performance and equity in education outcomes as assessed in PISA 2012. Across OECD countries, 15% of the variation in student performance in mathematics is attributed to differences in students’ socio-economic status.
• In Brazil, equity in education outcomes is close to the OECD average as 15.7% of the variation in student performance in mathematics is attributed to differences in students’ socio-economic status.
• Across OECD countries, a more socio-economically advantaged student scores 39 points higher in mathematics – the equivalent of nearly one year of schooling – than a less-advantaged student. In Brazil, a more socio-economically advantaged student scores 26 points higher in mathematics—a difference that is below the OECD average.

BRAZIL – Country Note –Results from PISA 2012
© OECD 5
Changes between 2003 and 2012 in equity and performance
Of the 39 countries and economies that participated in both PISA 2003 and 2012, Germany, Mexico and Turkey improved both their mathematics performance and their levels of equity in education during the period.
• Brazil has improved its performance, while equity remained stable during this period. • The improvement in performance is not limited to students with the lowest socio-economic
status, but is equally strong among students from lower- and upper-middle class families (second and third quarter of economic, social, and cultural status).
Percentage of resilient students
Across OECD countries, 26% of disadvantaged students – the equivalent of 6.5% of the entire student population – are “resilient”, meaning that they beat the socio-economic odds against them and exceed expectations in performance. In Hong Kong-China, Korea, Macao-China, Singapore and Viet Nam, more than half of all disadvantaged students, or 12.5% of the overall student population, are considered resilient.
• Some 1.9% of student in Brazil are resilient. This is less than the OECD average and the proportion remained stable since 2003.
Access to resources
OECD countries allocate at least an equal, if not a larger, number of mathematics teachers to socio-economically disadvantaged schools as to advantaged schools.
• In Brazil, the student-teacher ratio in advantaged schools is 22.9, while in disadvantaged schools it is 31.3 – meaning that there are fewer teachers in disadvantaged schools than in advantaged schools.
Students’ engagement, drive and self-beliefs Students’ engagement with school, the belief that they can achieve at high levels, and their ability and willingness to do what it takes to reach their goals not only play a central role shaping students’ ability to master academic subjects, they are also valuable attributes that will enable students to lead full lives, meeting challenges and making the most of available opportunities along the way. In other words, much more is required of students – and adults – than just cognitive proficiency.
Engagement with and at school
Students who arrive late or play truant miss learning opportunities. They also disrupt class, creating a disciplinary climate that is not conducive to learning for their fellow students. On average across OECD countries, 35.3% of students reported that they arrived late for school in the two weeks before the PISA test, and 14.5% of students reported that they had skipped an entire day of school or more over the same period.
• In Brazil 33.7% of students reported that they had arrived late for school in the two weeks before the PISA test, and more than one in five students (20.7%) reported that they had skipped a day of school or more over the same period.
Across most countries and economies that participated in PISA 2012, students who attend schools with better teacher-student relations are less likely to have reported that they had arrived late for
BRAZIL – Country Note –Results from PISA 2012
© OECD 6
school in the two weeks before the PISA test. In Brazil too, negative teacher-student relations are strongly associated with students’ lack of punctuality.
• Between PISA 2003 and PISA 2012, the percentage of students reporting that they had arrived late for school decreased by 3 percentage points in Brazil, signalling that students’ engagement with school improved in the period.
For the first time, PISA 2012 asked students to evaluate their happiness at, and satisfaction with, school and to reflect on whether their school environment approaches their idea of an ideal situation. As schools are a, if not the, primary social environment for 15-year-olds, these subjective evaluations provide a good indication of whether education systems are able to foster or hinder overall student well-being.
Across OECD countries, some 80% of students feel happy at school, 78% are satisfied with school, and 61% believe that conditions are ideal in their school.
• Some 85% of students in Brazil reported that they feel happy at school; and some 73% of students are satisfied with schools. However, only 39% believe that conditions are ideal in their school.
In 2012, as in 2003, PISA asked students to report whether they “strongly agree”, “agree”, “disagree” or “strongly disagree” that they feel like an outsider or left out of things, that they make friends easily, that they feel like they belong, that they feel awkward and out of place, that other students seem to like them, or that they feel lonely.
• Worryingly, in Brazil students’ sense of belonging at school deteriorated between 2003 and 2012: for instance, while in 2003 only 8% of students reported that they feel lonely, this proportion more than doubled (to 19%) by 2012.
Drive
Motivation can be regarded as the driving force behind learning. Intrinsic motivation refers to the drive to perform an activity because of the pleasure and interest in the activity itself. Across OECD countries large proportions of students reported low levels of enjoyment of mathematics.
• Brazilian students show higher motivation than students across OECD countries, on average. For example, 53% of students in OECD countries agreed or strongly agreed that they are interested in the things they learn in mathematics. In Brazil, 73% of students agreed or strongly agreed with this statement.
Self-beliefs
Because students who are anxious about mathematics tend to avoid mathematics, mathematics courses and career paths that require mathematical skills, high levels of mathematics anxiety among students can have serious repercussions not only in the short term, on their performance in mathematics, but in the long term, as manifested in skills shortages in key sectors of the labour market.
• The proportion of students who reported high levels of mathematics anxiety in Brazil was above the OECD average. While across OECD countries 31% of students, on average, reported that they get very nervous when doing mathematics problems, 49% of students in Brazil reported so.
• In Brazil, greater mathematics anxiety is associated with a 34-point lower score in mathematics – the same difference found, on average, across OECD countries and the

BRAZIL – Country Note –Results from PISA 2012
© OECD 7
equivalent of almost one year of school. Between 2003 and 2012, the level of anxiety towards mathematics remained stable.
Resources, policies and practices
The learning environment
In Brazil, as in most countries, schools in which fewer students arrive late for class and where the disciplinary climate is more conducive to learning perform better in mathematics, even after accounting for socio-economic status and other school differences.
• Between 2003 and 2012, Brazil was able to reduce the proportion of schools in which more than 25% of students regularly arrive late for class, and to improve the disciplinary climate in its classrooms. In 2003, 63% of students reported that, in most or all lessons, students don’t start working for a long time after the lesson begins; by 2012 that proportion had dropped to 44%.
• Despite an increase in the student population, the proportion of students who are in schools whose principal reported that the school’s capacity to provide instruction is hindered a lot by a lack of qualified teachers shrank notably between 2003 and 2012.
By all measures, Brazil appears to have been successful in ensuring that the learning environment is more conducive to learning, and that schools are able to attract and retain qualified teachers. These improvements in the learning environment may explain why performance improved to a greater extent than what could have been predicted based on improvements in the country’s socio-economic conditions alone.
Resource allocation to advantaged and disadvantaged schools
Brazil must find ways to support socio-economically disadvantaged schools more strongly in order to establish a level playing field for all students.
Brazil spends the equivalent of USD 26 765 on education per student between the ages of 6 and 15 – about one-third of the average OECD expenditure (USD 83 382). Brazil’s per capita GDP, (equivalent to USD 12 237,) is also just over one-third of the average per capita GDP (USD 33 732) across OECD countries.
PISA results show a positive relation between the resources invested in education and performance, but only up to a certain point. PISA also shows that at all levels of expenditure, higher-performing countries tend to distribute educational resources more equitably between socio-economically advantaged and disadvantaged schools.
• In Brazil, the schools serving more advantaged students, which include many private schools, have access to better educational resources, better physical infrastructure, and report fewer problems of attracting and retaining qualified teachers.
• In Brazil, about 13% of 15-year-old students go to a private, independent school. On average, private schools show better performance in PISA. While their students overwhelmingly come from advantaged families, the performance advantage is apparent even after accounting for socio-economic status. For the more affluent families, private schools – which provide access to better educational resources, better physical infrastructure, and have lower student-teacher ratios – are associated with better learning outcomes.
• Between 2003 and 2012 the performance gap between public and private schools narrowed in Brazil.

BRAZIL – Country Note –Results from PISA 2012
© OECD 8
Grade repetition
• In Brazil, more than one in three (36%) 15-year-old students had repeated a grade at least once in primary or secondary school; many had been held back more than once. This is one of the highest rates of grade repetition among countries participating in PISA. Grade repetition in Brazil is negatively associated with performance in mathematics and is more prevalent among disadvantaged students.
• Between 2003 and 2012, the proportion of 15-year-olds who had repeated a grade in primary school declined, but the prevalence of grade repetition increased in upper secondary school. Overall, the proportion of students who had repeated a grade at least once remained stable.
The pervasiveness of grade repetition in Brazil has been linked to high dropout rates, high levels of student disengagement, and the more than 12 years, on average, that it takes students to complete eight grades of primary school. It is important to reduce the use of grade repetition by finding other, more effective ways to work with students from across the performance spectrum, and to establish high expectations for all students, in order to motivate and provide opportunities for all students.

BRAZIL – Country Note –Results from PISA 2012
© OECD 9
Snapshot of performance in mathematics, reading and science
Mean score in PISA 2012
Share of low-achievers
(Below Level 2)
Share of top-performers in mathematics (Level 5 or 6)
Annualised change
Mean score in PISA 2012
Annualised change
Mean score in PISA 2012
Annualised change
OECD average 494 23.1 12.6 -0.3 496 0.3 501 0.5
Shanghai-China 613 3.8 55.4 4.2 570 4.6 580 1.8Singapore 573 8.3 40.0 3.8 542 5.4 551 3.3Hong Kong-China 561 8.5 33.7 1.3 545 2.3 555 2.1Chinese Taipei 560 12.8 37.2 1.7 523 4.5 523 -1.5Korea 554 9.1 30.9 1.1 536 0.9 538 2.6Macao-China 538 10.8 24.3 1.0 509 0.8 521 1.6Japan 536 11.1 23.7 0.4 538 1.5 547 2.6Liechtenstein 535 14.1 24.8 0.3 516 1.3 525 0.4Switzerland 531 12.4 21.4 0.6 509 1.0 515 0.6Netherlands 523 14.8 19.3 -1.6 511 -0.1 522 -0.5Estonia 521 10.5 14.6 0.9 516 2.4 541 1.5Finland 519 12.3 15.3 -2.8 524 -1.7 545 -3.0Canada 518 13.8 16.4 -1.4 523 -0.9 525 -1.5Poland 518 14.4 16.7 2.6 518 2.8 526 4.6Belgium 515 18.9 19.4 -1.6 509 0.1 505 -0.8Germany 514 17.7 17.5 1.4 508 1.8 524 1.4Viet Nam 511 14.2 13.3 m 508 m 528 mAustria 506 18.7 14.3 0.0 490 -0.2 506 -0.8Australia 504 19.7 14.8 -2.2 512 -1.4 521 -0.9Ireland 501 16.9 10.7 -0.6 523 -0.9 522 2.3Slovenia 501 20.1 13.7 -0.6 481 -2.2 514 -0.8Denmark 500 16.8 10.0 -1.8 496 0.1 498 0.4New Zealand 500 22.6 15.0 -2.5 512 -1.1 516 -2.5Czech Republic 499 21.0 12.9 -2.5 493 -0.5 508 -1.0France 495 22.4 12.9 -1.5 505 0.0 499 0.6United Kingdom 494 21.8 11.8 -0.3 499 0.7 514 -0.1Iceland 493 21.5 11.2 -2.2 483 -1.3 478 -2.0Latvia 491 19.9 8.0 0.5 489 1.9 502 2.0Luxembourg 490 24.3 11.2 -0.3 488 0.7 491 0.9Norway 489 22.3 9.4 -0.3 504 0.1 495 1.3Portugal 487 24.9 10.6 2.8 488 1.6 489 2.5Italy 485 24.7 9.9 2.7 490 0.5 494 3.0Spain 484 23.6 8.0 0.1 488 -0.3 496 1.3Russian Federation 482 24.0 7.8 1.1 475 1.1 486 1.0Slovak Republic 482 27.5 11.0 -1.4 463 -0.1 471 -2.7United States 481 25.8 8.8 0.3 498 -0.3 497 1.4Lithuania 479 26.0 8.1 -1.4 477 1.1 496 1.3Sweden 478 27.1 8.0 -3.3 483 -2.8 485 -3.1Hungary 477 28.1 9.3 -1.3 488 1.0 494 -1.6Croatia 471 29.9 7.0 0.6 485 1.2 491 -0.3Israel 466 33.5 9.4 4.2 486 3.7 470 2.8Greece 453 35.7 3.9 1.1 477 0.5 467 -1.1Serbia 449 38.9 4.6 2.2 446 7.6 445 1.5Turkey 448 42.0 5.9 3.2 475 4.1 463 6.4Romania 445 40.8 3.2 4.9 438 1.1 439 3.4Cyprus 440 42.0 3.7 m 449 m 438 mBulgaria 439 43.8 4.1 4.2 436 0.4 446 2.0United Arab Emirates 434 46.3 3.5 m 442 m 448 mKazakhstan 432 45.2 0.9 9.0 393 0.8 425 8.1Thailand 427 49.7 2.6 1.0 441 1.1 444 3.9Chile 423 51.5 1.6 1.9 441 3.1 445 1.1Malaysia 421 51.8 1.3 8.1 398 -7.8 420 -1.4Mexico 413 54.7 0.6 3.1 424 1.1 415 0.9Montenegro 410 56.6 1.0 1.7 422 5.0 410 -0.3Uruguay 409 55.8 1.4 -1.4 411 -1.8 416 -2.1Costa Rica 407 59.9 0.6 -1.2 441 -1.0 429 -0.6Albania 394 60.7 0.8 5.6 394 4.1 397 2.2Brazil 391 67.1 0.8 4.1 410 1.2 405 2.3Argentina 388 66.5 0.3 1.2 396 -1.6 406 2.4Tunisia 388 67.7 0.8 3.1 404 3.8 398 2.2Jordan 386 68.6 0.6 0.2 399 -0.3 409 -2.1Colombia 376 73.8 0.3 1.1 403 3.0 399 1.8Qatar 376 69.6 2.0 9.2 388 12.0 384 5.4Indonesia 375 75.7 0.3 0.7 396 2.3 382 -1.9Peru 368 74.6 0.6 1.0 384 5.2 373 1.3Countries and economies are ranked in descending order of the mathematics mean score in PISA 2012. Source: OECD PISA 2012 database, Tables I.2.1a, I.2.1b, I.2.3a, I.2.3b, I.4.3a, I.4.3b, I.5.3a and I.5.3b.
Countries/economies with a mean performance/share of top-performers above the OECD averageCountries/economies with a share of low-achievers below the OECD average
Countries/economies with a mean performance/share of low-achievers/share of top-performers not statistically significantly different from the OECD average
Countries/economies with a mean performance/share of top-performers below the OECD averageCountries/economies with a share of low-achievers above the OECD average
Countries/economies in which the annualised change in performance is statistically significant are marked in bold.
Mathematics Reading Science

BRAZIL – Country Note –Results from PISA 2012
© OECD 10
What is PISA? The Programme for International Student Assessment (PISA) is an ongoing triennial survey that assesses the extent to which 15-year-olds students near the end of compulsory education have acquired key knowledge and skills that are essential for full participation in modern societies. The assessment does not just ascertain whether students can reproduce knowledge; it also examines how well students can extrapolate from what they have learned and apply that knowledge in unfamiliar settings, both in and outside of school. This approach reflects the fact that modern economies reward individuals not for what they know, but for what they can do with what they know.
PISA offers insights for education policy and practice, and helps monitor trends in students’ acquisition of knowledge and skills across countries and in different demographic subgroups within each country. The findings allow policy makers around the world to gauge the knowledge and skills of students in their own countries in comparison with those in other countries, set policy targets against measurable goals achieved by other education systems, and learn from policies and practices applied elsewhere.
Key features of PISA 2012
The content • The PISA 2012 survey focused on mathematics, with reading, science and problem-solving minor
areas of assessment. For the first time, PISA 2012 also included an assessment of the financial literacy of young people, which was optional for countries.
The students • Around 510 000 students completed the assessment in 2012, representing about 28 million 15-
year-olds in the schools of the 65 participating countries and economies. • In Brazil, 19 877 students in 837 schools completed the assessment in 2012. The participation
rate after replacement is 90%.
The assessment • Paper-based tests were used, with assessments lasting a total of two hours for each student. In a
range of countries and economies, an additional 40 minutes were devoted to the computer-based assessment of mathematics, reading and problem solving.
• Test items were a mixture of multiple-choice items and questions requiring students to construct their own responses. The items were organised in groups based on a passage setting out a real-life situation. A total of about 390 minutes of test items were covered, with different students taking different combinations of test items.
• Students answered a background questionnaire, which took 30 minutes to complete, that sought information about themselves, their homes and their school and learning experiences. School principals were given a questionnaire, to complete in 30 minutes, that covered the school system and the learning environment. In some countries and economies, optional questionnaires were distributed to parents, who were asked to provide information on their perceptions of and involvement in their child’s school, their support for learning in the home, and their child’s career expectations, particularly in mathematics. Countries could choose two other optional questionnaires for students: one asked students about their familiarity with and use of information and communication technologies, and the second sought information about their education to date, including any interruptions in their schooling and whether and how they are preparing for a future career.

BRAZIL – Country Note –Results from PISA 2012
© OECD 11
Map of PISA 2012 countries and economies
OECD countries Partner countries and economies in PISA 2012 Australia Japan Albania Malaysia
Austria Korea Argentina Montenegro
Belgium Luxembourg Brazil Peru
Canada Mexico Bulgaria Qatar
Chile Netherlands Colombia Romania
Czech Republic New Zealand Costa Rica Russian Federation
Denmark Norway Croatia Serbia
Estonia Poland Cyprus1,2 Shanghai-China
Finland Portugal Hong Kong-China Singapore
France Slovak Republic Indonesia Chinese Taipei
Germany Slovenia Jordan Thailand
Greece Spain Kazakhstan Tunisia
Hungary Sweden Latvia United Arab Emirates
Iceland Switzerland Liechtenstein Uruguay
Ireland Turkey Lithuania Vietnam
Israel United Kingdom Macao-China
Italy United States
1. Footnote by Turkey: The information in this document with reference to “Cyprus” relates to the southern part of the Island. There is no single authority representing both Turkish and Greek Cypriot people on the Island. Turkey recognises the Turkish Republic of Northern Cyprus (TRNC). Until a lasting and equitable solution is found within the context of the United Nations, Turkey shall preserve its position concerning the “Cyprus issue”.
2. Footnote by all the European Union Member States of the OECD and the European Union: The Republic of Cyprus is recognised by all members of the United Nations with the exception of Turkey. The information in this document relates to the area under the effective control of the Government of the Republic of Cyprus.

Contacts: Andreas Schleicher Advisor to the Secretary-General on Education Policy, Deputy Director for Education and Skills Email: [email protected] Telephone: +33 6 07 38 54 64 Francesco Avvisati Analyst Directorate for Education and Skills Email: [email protected] Telephone: +33 1 45 24 17 61
For more information on the Programme for International Student Assessment
and to access the full set of PISA 2012 results, visit:
www.oecd.org.edu/pisa