BRASÍLIA NASCEU EXCÊNTRICA - arch.ttu.edu · In a later document (Brasilia revisited), Costa has...
17
ECCENTRIC BRASILIA Ana Maria Passos Mota, Antônio Alexandre Cavalcante Leite, Frederico de Holanda, Laura Regina Simões de Bello Soares, Patrícia Melasso Garcia Institution: Programa de Pós-Graduação em Arquitetura e Urbanismo Faculdade de Arquitetura e Urbanismo Universidade de Brasília Contact: Frederico de Holanda Faculdade de Arquitetura e Urbanismo Universidade de Brasília 70910 – 900 Brasília – DF BRAZIL Phone: + 55 61 307 2454 Fax: + 55 61 274 5444 Mobile: + 55 61 9988 1724 e-mail: [email protected] 0 Abstract Territorial occupation in the Federal District, in Brazil, is characterised by the dichotomy between a) the Pilot Plan, the bit of the Capital originally designed by Lúcio Costa, where only 10% of the population of the whole city lives today, and where the huge majority of all jobs are located, and b) the other cities which constitute the FD, inhabited by the other 90%, with a limited number of jobs. Moreover, a morphological analysis surprisingly reveals that, even from the very beginning, in the 1960’s, the Pilot Plan is not central to the city as a whole, in contradiction to the declared intentions of Costa’s project. This paper explores analytical procedures to characterise such eccentricity, and introduces a measure of compactness, by which the “poli-nucleated” city of Brasilia is compared with other Brazilian cities. 1
Transcript of BRASÍLIA NASCEU EXCÊNTRICA - arch.ttu.edu · In a later document (Brasilia revisited), Costa has...

ECCENTRIC BRASILIA
Ana Maria Passos Mota, Antônio Alexandre Cavalcante Leite, Frederico de Holanda,Laura Regina Simões de Bello Soares, Patrícia Melasso GarciaInstitution:
Programa de Pós-Graduação em Arquitetura e UrbanismoFaculdade de Arquitetura e UrbanismoUniversidade de Brasília
Contact:
Frederico de HolandaFaculdade de Arquitetura e UrbanismoUniversidade de Brasília70910 – 900 Brasília – DFBRAZILPhone: + 55 61 307 2454Fax: + 55 61 274 5444Mobile: + 55 61 9988 1724e-mail: [email protected]
0 Abstract
Territorial occupation in the Federal District, in Brazil, is characterised by the dichotomy
between a) the Pilot Plan, the bit of the Capital originally designed by Lúcio Costa, where
only 10% of the population of the whole city lives today, and where the huge majority of all
jobs are located, and b) the other cities which constitute the FD, inhabited by the other
90%, with a limited number of jobs. Moreover, a morphological analysis surprisingly
reveals that, even from the very beginning, in the 1960’s, the Pilot Plan is not central to the
city as a whole, in contradiction to the declared intentions of Costa’s project. This paper
explores analytical procedures to characterise such eccentricity, and introduces a measure
of compactness, by which the “poli-nucleated” city of Brasilia is compared with other
Brazilian cities.1

2
1 Introduction
The urban system of the Federal District should have been constituted, according to Lúcio
Costa, by the Pilot Plan – the subject matter of the national design competition for the new
Brazilian Capital, in 1957 – and by “satellite cities” that should be created once the Pilot
Plan were completely occupied. For architects and planners, this seemed a great
opportunity to achieve a more democratic urban structure, since the state came to own the
majority or the land where the new city was being built. Leftist ideology in the 1950’s in
Brazil equated state-ownership with public interest. The development of the Capital,
nevertheless, showed how naïve such a stance was. From the very beginning, a process of
strong segregation has developed. In fact, it is curious to note that in other Brazilian cities,
in which market forces predominate over state ownership of the land, we witness a much
more compact configuration, despite the urban voids which are kept by the land speculation
process. In other words, distances between home and work are much smaller in these latter
cases, implying lower social as well as economic costs in the daily life of the inhabitants.
This paper attempts to offer a characterisation of the spatial development of the Brazilian
capital as a whole, not only of the Pilot Plan. Traditional analytical categories of Space
Syntax will be used, such as integration measure and integration core, and a new category
will be experimented with, namely the compactness measure, by which the density of axial
lines per unity of land surface introduces a geometrical dimension to the rather topological
features more akin to syntactic analysis. Without this, some fundamental characteristics of
the city might be lost, particularly considering that the urban system here is largely
discontinuous. Also, some demographic issues will be dealt with, in order to further
characterise the process of strong segregation we find here.
2 Discourse and reality in the beginnings
Costa was worried about segregation, when he wrote the Pilot Plan Report (Costa, 1991).
He believed his design would “naturally” prevent strong social stratification, for the
superblocks, situated along the Road Axis, were organised into sets of four units

3
constituting the neighbourhood unit: “the super-blocks contiguous to the road will be more
valued than the internal ones, and this will allow for gradations proper to the present
regime”, but “avoiding questionable and undesirable stratification.” (Costa 1991: 28-30)
However, only two types of housing were allowed by the plan, in the beginning: a)
buildings six stories high, over pilotis and with lifts, and b) individual “mansions”, by the
lake shore, for the better off. This has prevented low income population to be housed within
the plan, particularly the migrant population who came to work in the building industry.
Costa was positive that favelas should be avoided at all costs. For him, “decent” housing
should be provided for all.
Of course, things do not happen like this in Brazil, nor anywhere else. There were not
enough financial resources to build “decent” housing for all, and, as usual, migrant
population builds their homes through a long and incremental process, starting from
extremely precarious huts, towards more “urbanised” solutions. As this could not happen in
the Pilot Plan, the Cidade Livre (“Free City”) was created, in which the people might build
their houses without strict control. This was situated circa 15 km from the Road Platform,
the core of the plan. However, the site where Cidade Livre was situated was not considered
suitable for a large amount of poor houses, since it constituted a sort of “noble entrance” to
the capital: it located very near to the western end of the airport runway, and such a view
did not please the elite who flew to the seat of federal power.
Another site should be found, in order to house the thousands of migrants who came to the
central plateau looking for jobs. As soon as 1958, therefore two years before inauguration,
a new city – Taguatinga – was designed, one which would little by little be transformed
into the future metropolitan centre, as we shall see. Taguatinga was located even further
away from the Plan: 25 km. In a later document (Brasilia revisited), Costa has
acknowledged the early appearance of the satellite cities, in contradiction to the principles
of his Report, by which they should be built only after completion of the Pilot Plan. He
pointed to the high transportation costs involved in such large distances between home and
jobs, but praised the “positive” maintenance of the “original physiognomy of Brasilia.”
(Costa, 1987:7) Furthermore, the preservation of the Capital’s character demanded the
existence of a large green belt between the Pilot Plan and the satellite cities. The identity of

4
the city should not be stained, for “Brasilia is the expression of a certain urbanistic concept,
has a precise filiation, is not a bastard city.” (Costa 1987: 18) Thus the “democratic”
intentions supposedly related to the structure of the neighbourhood units, were actually
denied by the principles which supported the design.
From the very beginning we have thus witnessed an urban configuration which did not have
the Pilot Plan as its core. The 1960 axial map shows that the integration core, at the time of
the inauguration of the city, was already situated to the west of the originally designed bit
of the Capital (Fig. 1). On the other hand, the large distances created among the urban
nuclei have established a centrifugal configuration which may be characterised by the small
number of axial lines per unit of territory. Such a process was strengthened until the 1970s,
when a tendency of reversal begins to show, as we shall see as follows.
Fig. 1. Main roads axial map of the Federal District, Brazil, 1960.
3 Centrality and compactness
In the first five illustrations (Fig. 1 – Fig. 5), the axial maps of the Federal District in Brazil
(1960, 1970, 1980, 1991 and 1998) include only the major roads (there is not complete
information available of the entire road/street system, for all times) (CODEPLAN 1977,
1984a, 1984b, 1997, 1999a, 1999b, TERRACAP/DITEC 1985). Nevertheless, for the
evolutionary analysis that follows, such limited information offers interesting clues.
5
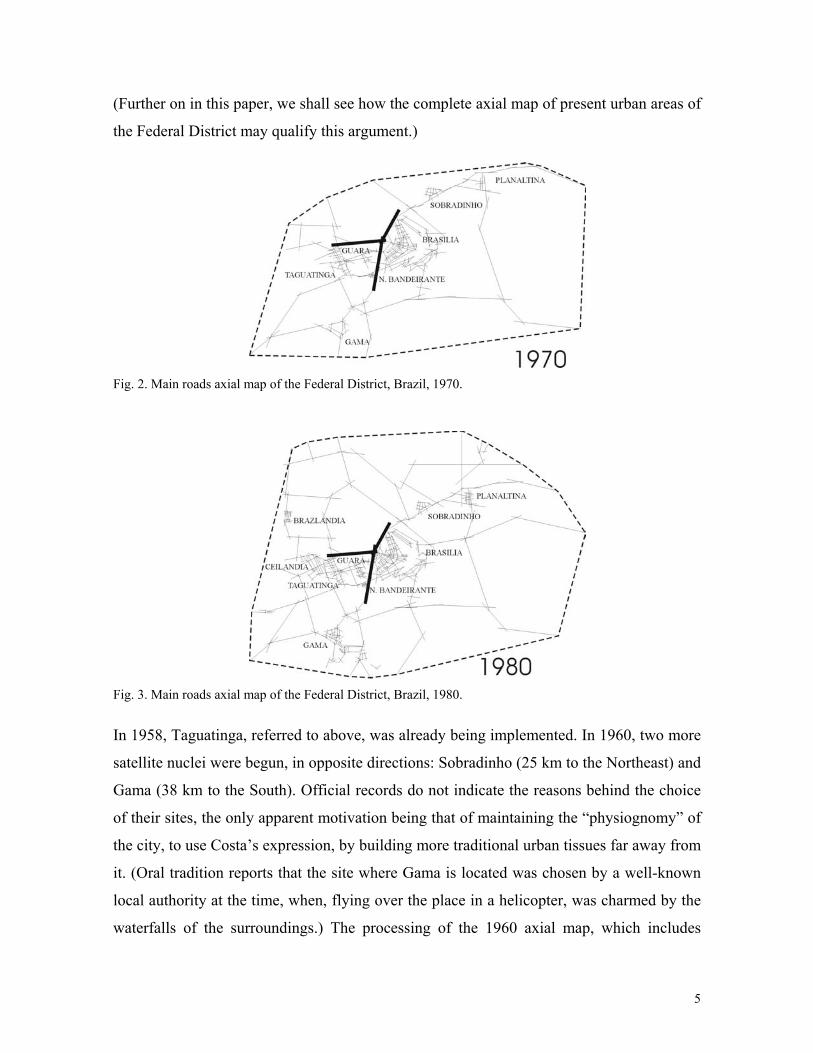
(Further on in this paper, we shall see how the complete axial map of present urban areas of
the Federal District may qualify this argument.)
Fig. 2. Main roads axial map of the Federal District, Brazil, 1970.
Fig. 3. Main roads axial map of the Federal District, Brazil, 1980.
In 1958, Taguatinga, referred to above, was already being implemented. In 1960, two more
satellite nuclei were begun, in opposite directions: Sobradinho (25 km to the Northeast) and
Gama (38 km to the South). Official records do not indicate the reasons behind the choice
of their sites, the only apparent motivation being that of maintaining the “physiognomy” of
the city, to use Costa’s expression, by building more traditional urban tissues far away from
it. (Oral tradition reports that the site where Gama is located was chosen by a well-known
local authority at the time, when, flying over the place in a helicopter, was charmed by the
waterfalls of the surroundings.) The processing of the 1960 axial map, which includes

6
Gama and Sobradinho, already indicates that the more integrated lines were outside the
Pilot Plan.
Fig. 4. Main roads axial map of the Federal District, Brazil, 1991.
Fig. 5. Main roads axial map of the Federal District, Brazil, 1998.

7
Along the following years, such eccentricity has only improved. The integration core has
been steadily moving towards Taguatinga, which, little by little, is becoming the actual
economic centre of the metropolis (see axial maps in figures 2 to 5).
Fig. 6. Evolution of compactness measure in the Federal District, Brazil, 1960 - 1998.
Now the measure of compactness we are suggesting considers the number of axial lines
verified within the smallest convex polygon which circumscribes the whole axial map (such
polygons are drawn in the illustrations). “Compactness” is simply a relation between the
number of lines and the area of the polygon (for elegance, the result is presented in lines /
10 hectares). As far as this relation is concerned in the Federal District in Brazil, we witness
an interesting process. In the first decades, the urge not to “contaminate” the Pilot Plan, led
to the location of the first satellite nuclei, from 25km to 40km away from it. The graphic in
Fig. 6 indicates how compactness has decreased until the 1970’s. From then on, a reversal
is observed. The pressure to occupy the no-man’s land between the Pilot Plan and the
satellite nuclei could not be resisted any longer, and it was Costa himself who would design
an expansion of the satellite city of Guará, located between the Pilot Plan and Taguatinga,
with a new set of social housing superblocks. Nevertheless, “metropolitan” Brasilia (not
simply the originally designed Pilot Plan), presents today a compactness much lower than
other Brazilian cities (Fig. 7 illustrate this).

8
Fig. 7. Compactness of a sample of Brazilian urban areas. Note the high compactness of a traditional colonialarea, as in the Historic Centre of the City of Belém. Brazil. (For the sake of comparison, compactness in theFederal District has been reduced to 1.)
As commented above, we do not have a precise historical information for the whole set of
axial lines of the urban system of the Federal District. For the year 2000, the picture is
shown in Fig. 8. The weight of the “real” bits of areas which have been considered before
only in terms of their main roads, and which are now considered in terms of their total
number of axial lines, makes the argument above even clearer, by pulling the core further
away from the Pilot Plan, towards the Southwest. Mean integration of the whole system,
constituted by 18849 axial lines, amounts to 0.6181, while the integration value of the
Monumental Axis is only 20% above this value (0.7419). Thus the most central bits of the
Pilot Plan do not even belong to the integration core, if we consider the core as constituted
by the 25% most integrated lines: the Monumental Axis is located only in the bottom set of
the 40% most integrated lines.

9
3 Demography
This “physical eccentricity” is furthermore accentuated when we consider demographic
data, as far as the location of housing and jobs are concerned. Table 1 shows how the
demographic importance of the Pilot Plan has dramatically decreased along the years.
Fig. 8. Complete axial map of the urban areas of the Federal District, Brazil, 2000. Red and thicker linesindicate the three most integrated axes.

10
Table 1. Population of Brasilia (i.e. Pilot Plan) as compared to the population of the othercities in the Federal District (in percentages) – 1960 – 1998
% of inhabitants along the yearsCITIES
1960 1970 1980 1991 1998
Brasília (Pilot Plan) 44,38 25,38 21,49 13,30 10,62
Other cities 55,62 74,62 78,51 86,70 89,38
Source: CODEPLAN 1999
Of course, as a metropolis grows, and as the “centre” continues to be considered an
unchanging pre-delimited area, its relative importance as compared to the rest of the city
diminishes. However, Brasilia is not a city which has grown in a balanced way as far as
houses and jobs are concerned. While the relative population of the Pilot Plan decreased
from circa 44% to circa 10% in 40 years, the Plan still houses today circa 76% of all jobs of
the whole metropolis (The source we have used here is from the Ministério do Trabalho e
Emprego (Ministry of Labour and Jobs), 2000). There may be, for technical reasons with
the data base, some overestimation of the location of jobs in the central city. Nevertheless,
this still constitutes a good indication of the present reality). Guará comes far way in second
(with 10%) and Taguatinga in third (4%), as far as jobs are concerned. Fig. 9 illustrates the
number of jobs in each administrative region in the Federal District, compared with the
number of inhabitants. The contrast between jobs and inhabitants is amazing, even more so
when we consider that the city which comes in second is the closest one to the Pilot Plan
(i.e. Guara), thus reinforcing centralisation.
Fig. 9 also plots integration values against jobs and inhabitants. These values refer to the
integration values of the cities, but these have been calculated in a peculiar way, that
deserves a brief comment. The value for each city is the average value of the three most
integrated lines which are completely located within the administrative borders of each
city. This gives us a reasonable picture of the way each city, as a whole, features in the
complete integration map of the Federal District. Also, it will be noticed that the integration

11
values do not refer to the traditional scale of integration measures (around 1 to 2). The point
is that, for illustrative reasons, they have been “normalised” in order to be compared to the
number of jobs and inhabitants, so that we may visually detect the (bad) correlations that
obtain herein.2 Fig. 10 illustrates the integration gradient of the cities by ascribing colours
to each of the administrative regions (following the traditional convention, i.e. the warmer
the more integrated).
Fig. 9. Jobs, inhabitants and integration measures in Administrative Regions in the Federal District, Brazil.
Correlation values between inhabitants, jobs and integration further illustrate the point, as
Table 2 shows. Such values indicate the disparity we may observe in the chart of Fig. 9,
and constitute an interesting index of a) the disparity between job locations and homes, b)
the large number of inhabitants in segregated bits of the system, and c) the concentration of
jobs in the centre.
0
100000
200000
300000
400000
500000
600000
RA I Bra
sília
RA X G
uará
RA III T
agua
tinga
RA IX C
eilân
dia
RA XVI L
ago
Sul
RA V S
obra
dinho
RA XI C
ruze
iro
RA II G
ama
RA VIII
Núc
leo B
ande
irant
e
RA XII
Samam
baia
RA VI P
lanalt
ina
RA XIII
San
ta M
aria
RA XV R
ecan
to d
as E
mas
RA XVIII
Lag
o Nor
te
RA IV B
razlâ
ndia
RA VII
Paran
oá
RA XIV
São
Seb
astiã
o
RA XVII
Riacho
Fun
do
RA XIX
Can
dang
olând
ia
JOBS
INHABITANTS INTEGRATION

12
Table 2: Correlation values between inhabitants, jobs and integration values of CitiesAdministrative Regions in the Federal District, Brazil.
VARIABLES CORRELATION VALUES
Inhabitants / jobs 0.34
Inhabitants / integration -0.01
Jobs / integration 0.27
So far we lack hard comparative evidence from other Brazilian cities, but the result above
seems very typical of the Brazilian Capital. In other cities, we certainly have areas which
are more privileged as far as jobs are concerned, and the majority of the population lives
far away from such jobs. But the fact that most jobs are themselves eccentric is unique.
Fig. 10. Integration measures of the City Administrative Regions in Brazil (the warmer, the more integrated).

13
Now one might ask why Brasilia should be “central” anyway. Of course the reason depends
upon social values which are embraced in order to evaluate this morphology. A strong
contradiction between integration and job location – as it is the case here – implies greater
distances between home and work, with obvious greater social costs. Hard statistics is still
somehow wanting, but studies concerning bus passengers already give us good clues on the
situation. In Brasilia, the ratio passengers/kilometers of bus lines (a classic way of
measuring the efficiency of public transportation systems) is 1.2, circa four times less than
in other Brazilian metropoles of similar size. Consequently, this implies the most expensive
bus fares in the country, and one should have in mind that, despite the strong motorization
ratio in the city (1.8 persons per vehicle, the highest in Brazil), more than 50% of trips to
work and services are still done by public transport. The discontinuous urban fabric – as
already commented – is largely responsible for this poor performance of the city, but so is
the eccentricity of the absolute majority of jobs.
4 A telling controversy
Controversies over the spatial development of the city often reveal different ideological
stances towards its configuration. This is exactly the case with the current debate on the
construction of the third bridge over the lake, which would link the Eastern tip of the
Monumental Axis, across the Lake Paranoa, to the housing areas to the East (Fig. 11). The
construction is already decided, and actually under way, but the argument concerns the way
it should be related with the monumental bit of the city. It might be either a) connected to a
peripheral road and/or to streets which should bypass the Esplanade, or b) directly
connected with the eastern tip of the Esplanade of Ministries. The first alternative is
supported by those who argue in favour of the “original character of the place”, i.e. the
Esplanade should be kept, as much as possible, as an isolated (and deserted, we might add)
bit of the city. The second alternative is supported by the building entrepreneurs, who
would wish a more straightforward link with the city centre.

14
Fig. 11. The thickest line indicates the location of the third bridge over the Lake Paranoá, now underconstruction.
The controversy is far from being solved. But it is as well far from constituting any novelty,
for it is part of the same debate that time and again resurfaces: the need (or otherwise) to
keep the city – or at least its monumental bits – unstained by worldly matters. We may
recall Costa’s plea for maintaining the “physiognomy” of the city and the recurrent efforts
to allow increasing urbanisation only far away from the federal administration core (see
above). Configurational analysis reveal that the “isolationists” intuitively grasp the greater
integration measure that would obtain in the Esplanade with a more intense link with its
surroundings: a simulation, including the third bridge, indicates a growth of (only) 5.2% of
the integration measure of the main axis that crosses the place. On the other hand, it reveals
how much prejudice there is against a “secular improvement” of this central bit, because, in

15
the end, the discussion really boils down to this. For, in fact, as we have seen, the
configurational impact is actually very small for such ado, particularly if we calibrate the
integration measure with the (low) residential density in the other side of the lake,
something we will try to do in the near future.
Anyway, greater integration would certainly mean easier access to the Esplanade, with all
the implications – ethic as well as aesthetic – that would come along with it. Ethically, the
strategy of physically isolating the seat of power – a strategy which historically coincides
with rather authoritarian societies (Holanda 1999) – would be weakened. Aesthetically,
more people would be readily able to enjoy the undeniable beauty of the place in their daily
lives, for the Esplanade would cease to be just the end-of-the-trip for civil servants (or for
rare visitors), and become also a remarkable spatial event along trips the origin and
destination of which are both outside the place. In other words, more people would be able
to enjoy the place also from within and instrumentally, rather than only from without and
symbolically.
4 Conclusion: towards to compact city?
The axial map of Brasilia of the 1960’s already reveals fundamental attributes which are
still found today. Along the four decades that followed, the most integrated lines have
always been situated outside the Pilot Plan, indicating its eccentric character in relation to
the system as a whole. Second, it is curious to consider how the curve of compactness
behaves along time. The initial dispersion is aggravated until the 1970’s, when it begins to
diminish. The pressure for new areas in the Pilot Plan is strongly felt since then, and this
trend does not show signs of reversal. Unfortunately, there has been no compatibility, for
example, between transportation policies and territorial occupation. If the city is tending to
a greater compactness, it is not tending to a better structuration: many dispersed new urban
areas are constituted by gated communities of individual housing, far away from the axes of
more intense flow of vehicular movement.
Brasilia constitutes one of these instances in which suburban spatial types and modes of life
are reproduced in conditions of advanced – albeit peripheral – class societies. But here,
such models are achieved by means of strongly institutionalised state intervention, and not

16
by market forces. Elsewhere, as in São Paulo or other large Brazilian metropoles, elites
develop segregation by means of urban voids, in a strong process of economic speculation
with the land. Here, because of the land was basically state-owned, segregation was
political from the very start.
It is ironic that this has been so. It was once believed that state ownership of land would
guarantee a more democratic urban spatial structure. The analysis of Brasilia demystifies
this, by revealing that state and public interest only coincide in specific political
circumstances. Brazil is one of those countries in which the State has been most strongly
captured by dominant classes, in order to support their own interests. Thus it should not
constitute any surprise the fact that the organisation of the territory in the Federal District –
the seat of the Federal Capital – should constitute such a segregating spatial structure.
5 Bibliography
CODEPLAN, 1977, Plano Estrutural de Organização Territorial do DF (PEOT),
(SEPLAN/GDF, Brasília)
CODEPLAN, 1984, Caracterização do Território e da População do Distrito Federal
(CODEPLAN, Brasília)
CODEPLAN, 1984, Atlas do Distrito Federal 3 (CODEPLAN, Brasília)
CODEPLAN, 1997, Perfil Sócio-Econômico das Famílias do Distrito Federal
(CODEPLAN, Brasília)
CODEPLAN, 1999, Sistema de Informações Estatísticas do Distrito Federal – SIEDF (in
CD-ROM) (CODEPLAN, Brasília)
COSTA, L, 1987, “Brasília Revisitada”, Diário Oficial do Distrito Federal - Decreto Nº
10.829, 14October 1987 (Official Diary of the Federal District, Brasília)
COSTA, L, 1991, Brasília, cidade que inventei (CODEPLAN/DEPHA, Brasília)
GDF/Secretaria de Transportes, 2000, Relatório da gerência operacional do serviço de
transporte público coletivo do DF (GDF, Brasília)

17
Holanda, F, 1999, "Class footprints in the landscape", Space Syntax - II International
Symposium – Proceedings, pp. 6.1 – 6.9 (Programa de Pós-Graduação em Arquitetura e
Urbanismo da Faculdade de Arquitetura e Urbanismo, Universidade de Brasília, Brasília)
Ministério do Trabalho e Emprego, 1999, Cadastro de Estabelecimentos Empregadores -
Base Estatística e Cadastral (in CD-ROM) (MTE, Brasília)
TERRACAP/DITEC, 1985, Brasília 57-85; do plano-piloto ao Plano Piloto
(GDF/SVO/DAU and TERRACAP/DITEC, Brasília) 1 This is an updated version (June 2001) of the paper presented to the Space Syntax – III InternationalSymposium, Atlanta, 7-11 May 2001.
2 In order to become easily visible in the chart, integration values have been subjected to a potency of 10, andthen multiplied by 500,000. However, original values have been kept in the calculation of correlations whichare commented further on in the text.