Brandon Young_AZO_Buy
9
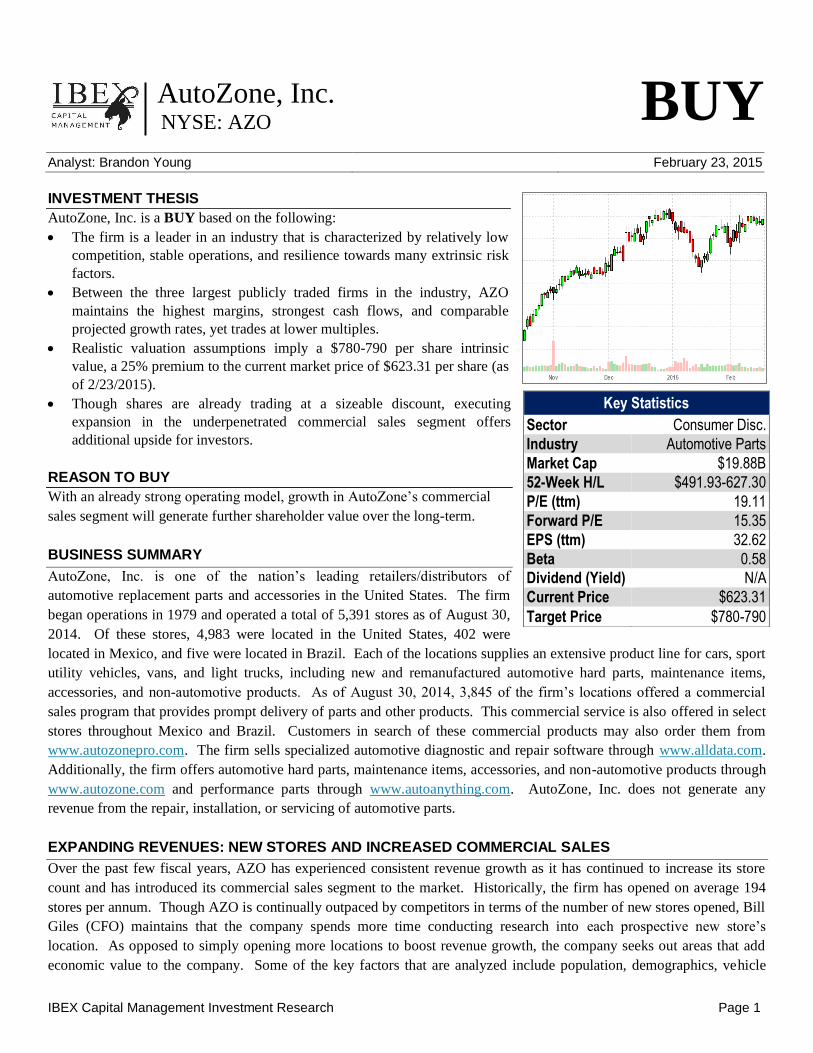
IBEX Capital Management Investment Research Page 1 AutoZone, Inc. NYSE: AZO Analyst: Brandon Young February 23, 2015 INVESTMENT THESIS AutoZone, Inc. is a BUY based on the following: The firm is a leader in an industry that is characterized by relatively low competition, stable operations, and resilience towards many extrinsic risk factors. Between the three largest publicly traded firms in the industry, AZO maintains the highest margins, strongest cash flows, and comparable projected growth rates, yet trades at lower multiples. Realistic valuation assumptions imply a $780-790 per share intrinsic value, a 25% premium to the current market price of $623.31 per share (as of 2/23/2015). Though shares are already trading at a sizeable discount, executing expansion in the underpenetrated commercial sales segment offers additional upside for investors. REASON TO BUY With an already strong operating model, growth in AutoZone’s commercial sales segment will generate further shareholder value over the long-term. BUSINESS SUMMARY AutoZone, Inc. is one of the nation’s leading retailers/distributors of automotive replacement parts and accessories in the United States. The firm began operations in 1979 and operated a total of 5,391 stores as of August 30, 2014. Of these stores, 4,983 were located in the United States, 402 were located in Mexico, and five were located in Brazil. Each of the locations supplies an extensive product line for cars, sport utility vehicles, vans, and light trucks, including new and remanufactured automotive hard parts, maintenance items, accessories, and non-automotive products. As of August 30, 2014, 3,845 of the firm’s locations offered a commercial sales program that provides prompt delivery of parts and other products. This commercial service is also offered in select stores throughout Mexico and Brazil. Customers in search of these commercial products may also order them from www.autozonepro.com. The firm sells specialized automotive diagnostic and repair software through www.alldata.com. Additionally, the firm offers automotive hard parts, maintenance items, accessories, and non-automotive products through www.autozone.com and performance parts through www.autoanything.com. AutoZone, Inc. does not generate any revenue from the repair, installation, or servicing of automotive parts. EXPANDING REVENUES: NEW STORES AND INCREASED COMMERCIAL SALES Over the past few fiscal years, AZO has experienced consistent revenue growth as it has continued to increase its store count and has introduced its commercial sales segment to the market. Historically, the firm has opened on average 194 stores per annum. Though AZO is continually outpaced by competitors in terms of the number of new stores opened, Bill Giles (CFO) maintains that the company spends more time conducting research into each prospective new store’s location. As opposed to simply opening more locations to boost revenue growth, the company seeks out areas that add economic value to the company. Some of the key factors that are analyzed include population, demographics, vehicle Key Statistics Sector Consumer Disc. Industry Automotive Parts Market Cap $19.88B 52-Week H/L $491.93-627.30 P/E (ttm) 19.11 Forward P/E 15.35 EPS (ttm) 32.62 Beta 0.58 Dividend (Yield) N/A Current Price $623.31 Target Price $780-790 BUY
-
Upload
brandon-young -
Category
Documents
-
view
104 -
download
2
Transcript of Brandon Young_AZO_Buy
IBEX Capital Management Investment Research Page 1
AutoZone, Inc. NYSE: AZO
Analyst: Brandon Young February 23, 2015
INVESTMENT THESIS
AutoZone, Inc. is a BUY based on the following:
The firm is a leader in an industry that is characterized by relatively low
competition, stable operations, and resilience towards many extrinsic risk
factors.
Between the three largest publicly traded firms in the industry, AZO
maintains the highest margins, strongest cash flows, and comparable
projected growth rates, yet trades at lower multiples.
Realistic valuation assumptions imply a $780-790 per share intrinsic
value, a 25% premium to the current market price of $623.31 per share (as
of 2/23/2015).
Though shares are already trading at a sizeable discount, executing
expansion in the underpenetrated commercial sales segment offers
additional upside for investors.
REASON TO BUY
With an already strong operating model, growth in AutoZone’s commercial
sales segment will generate further shareholder value over the long-term.
BUSINESS SUMMARY
AutoZone, Inc. is one of the nation’s leading retailers/distributors of
automotive replacement parts and accessories in the United States. The firm
began operations in 1979 and operated a total of 5,391 stores as of August 30,
2014. Of these stores, 4,983 were located in the United States, 402 were
located in Mexico, and five were located in Brazil. Each of the locations supplies an extensive product line for cars, sport
utility vehicles, vans, and light trucks, including new and remanufactured automotive hard parts, maintenance items,
accessories, and non-automotive products. As of August 30, 2014, 3,845 of the firm’s locations offered a commercial
sales program that provides prompt delivery of parts and other products. This commercial service is also offered in select
stores throughout Mexico and Brazil. Customers in search of these commercial products may also order them from
www.autozonepro.com. The firm sells specialized automotive diagnostic and repair software through www.alldata.com.
Additionally, the firm offers automotive hard parts, maintenance items, accessories, and non-automotive products through
www.autozone.com and performance parts through www.autoanything.com. AutoZone, Inc. does not generate any
revenue from the repair, installation, or servicing of automotive parts.
EXPANDING REVENUES: NEW STORES AND INCREASED COMMERCIAL SALES
Over the past few fiscal years, AZO has experienced consistent revenue growth as it has continued to increase its store
count and has introduced its commercial sales segment to the market. Historically, the firm has opened on average 194
stores per annum. Though AZO is continually outpaced by competitors in terms of the number of new stores opened, Bill
Giles (CFO) maintains that the company spends more time conducting research into each prospective new store’s
location. As opposed to simply opening more locations to boost revenue growth, the company seeks out areas that add
economic value to the company. Some of the key factors that are analyzed include population, demographics, vehicle
Key Statistics
Sector Consumer Disc.
Industry Automotive Parts
Market Cap $19.88B
52-Week H/L $491.93-627.30
P/E (ttm) 19.11
Forward P/E 15.35
EPS (ttm) 32.62
Beta 0.58
Dividend (Yield) N/A
Current Price $623.31
Target Price $780-790
BUY

February 23, 2015 AutoZone, Inc.
IBEX Capital Management Investment Research Page 2
profile, demand trends, the number of competitors in the area, and the projected return on the real estate (since AZO also
owns the majority of the properties on which its stores operate). In addition, extensive analysis is conducted to examine
whether each new location will meet a predetermined investment hurdle rate ensuring that the firm is compensated for the
risk of opening an additional store at a particular location. Moving forward, management anticipates that the firm will
continue to expand its store count at the current rate and believes that its careful approach to expansion is one significant
reason for AZO’s operational success thus far.
The subindustry of commercial automotive parts is even more highly fragmented than the one for consumer automotive
parts which AZO management recognizes as an excellent opportunity for future growth. Much like the consumer
segment, the commercial sales segment is very resistant to general economic disruptions and generates comparable
margins. Though commercial sales only represented a mere $1.6B of the firm’s $9.6B revenues in FY2014, the segment
grew by over 10% year-over-year. AZO is currently behind both of the two major players in the industry when it comes
to this segment but is showing much signs of faster growth. It is to be expected that given the untapped market for
commercial automotive parts, AZO should continue to see double digit growth in this segment for years to come which
will likely have a large impact on maximizing on shareholder value.
THE AUTOMOTIVE PARTS INDUSTRY
The strength of the automotive parts industry draws on the increased use of vehicles by both consumer and commercial
users. In general, the industry exhibits a relatively high resilience to economic downturn. In fact, during periods of
financial hardship many automotive users defer the purchase of newer vehicles and continue to add further wear to their
older vehicles which sustains the demand for replacement parts. Thus far, the industry has been one of the few retail
segments to be relatively unaffected by the threat of online competition. Additionally, competitors in this peer group are
not affected greatly by price changes in any specific type of commodity. Overall, the automotive parts industry is highly
fragmented with numerous small “mom-and-pop” shops along with a few large players. Despite this, competition
between each of the major players remains relatively low with each earning relatively high economic profits at present.
Between AutoZone, Advance Auto Parts (NYSE: AAP), and
O’Reilly Automotive (NASDAQ: ORLY), the three largest
players in the automotive parts industry represent nearly $27
billion in sales with a combined capitalization of over $51
billion. Despite trading at lower multiples, AZO boasts the
highest gross margins, operating margins, and second highest
projected year-over-year revenue growth. Additionally for
every dollar of capital invested, AZO generates an over 46%
cash return per annum compared to ORLY and AAP with
returns of only 25% and 24% respectively.
EFFICIENT, CASH-FLOW GENERATIVE BUSINESS MODEL
AZO’s operations are able to generate significant cash flows as a result of management’s approach to efficiently
managing working capital. On average approximately 85-90% of each store’s layout is selling space, of which around
40% is dedicated to hard parts inventory. Each location typically employs between 10 and 16 employees (“AutoZoners”)
each of which receive formal training covering both sales and product topics. The firm has been utilizing longer terms
offered by creditors to increase its payables account resulting in a gradual decrease in the firm’s net working capital over
*(EBIT – Tax Expense + Non-Cash Expenses) / (Long-Term Assets + NOWC)
FY2014 Automotive Parts Industry (Market Cap>$500M)
ORLY AAP AZO
Market Capitalization 20.91B 11.32B 19.88B
Revenue (ttm) 7.22B 9.84B 9.64B
Projected Y/Y Growth 7.16% 1.57% 6.60%
P/E (ttm) 28.1x 23.1x 19.1x
PEG (5 year projected) 1.55x 1.33x 1.31x
TEV/EBITDA (ttm) 14.5x 11.4x 11.1x
EBITDA Margin (ttm) 20.2% 12.4% 22.0%
ROIC* 24.6% 23.7% 46.8%
Figure 1: Comparison of competitors in the Automotive Parts industry with a market capitalization greater than $500 million.

February 23, 2015 AutoZone, Inc.
IBEX Capital Management Investment Research Page 3
Figure 3: AutoZone’s times-interest-earned ratio (EBIT /
Interest Expense) over the last five years.
Figure 2: Composition of AutoZone's capital structure including all debt securities, capital leases, and common equity as of FY2014.
time and allowing it experience the lowest cash conversion cycle in the industry. Though capital expenditure per store has
been on an upward trend for the past few years, the figure amounted to a modest $82,972 for FY2014.
Altogether, the firm is able to consistently earn high returns without substantial reinvestment in working capital or capital
expenditures. Since FY2009, gross and operating margins increased by 167 and 140 bps respectively as a result of more
effective supply chain management and lower shrink expenses. Over the same period, AZO’s revenue grew at 6.16%
CAGR while diluted earnings per share grew at 19.83% CAGR.
OPTIMIZED CAPITAL STRUCTURE & STRONG BALANCE SHEET
At present, AZO maintains an 80/20 equity-to-debt blend in its capital
structure which we would argue maximizes the tax benefits of leverage
while optimizing its cost of capital. The firm’s credit is rated at investment
grade (BBB) by Standard & Poor’s with a weighted average cost of debt
(YTM) and time-to-maturity of 1.92% and 3.8 years respectively. In
regards to the equity portion of its capital structure, the industry’s relative
insensitivity towards economic downturn and appropriate use of financial
leverage leads us to a relatively lower cost of equity assumption in our
valuation of the firm.
Though the firm’s financial leverage has increased over the past five years,
it has remained relatively constant relative to the weight of equity in its
capital structure. With expanding operating margins, AZO’s solvency been
becoming increasingly stronger. From FY2009-2014 the firm’s times-
interest-earned rate increased from 8.30x to 10.93x. During the same
time frame, unlevered free cash flow as a percentage of total debt and
capital leases has remained well above 20%.
In 1998, AZO’s board of directors initiated a share buyback program
which has since amounted to over $15 billion worth of shares which is
especially significant given that the firm’s market capitalization is
around $20 billion at present. Since then, the company’s outstanding
common share amount has been reduced from 160 million to 30 million.
Bill Giles (CFO) asserts, “We continued to view our share repurchase
program as an attractive capital deployment strategy.”
VALUATION: PRO FORMA DCF MODEL
Using a discounted free cash flow model, AutoZone, Inc. is undervalued by over 25% with a $780-790 per share valuation
result using relatively conservative growth rate assumptions. The following assumptions were used in the model (see
Appendix IV and V for cost of capital calculations and sensitivity analysis):
-Beta (β) = 0.58 -Weighted Avg. Cost of Capital (WACC) = 6.13%
-Market Risk Premium (Rm – Rf) = 7.50% -Pre-Tax Cost of Debt (Rd) = 1.92%
-Risk-free Rate (Rf) = 3.00% -Cost of Common Equity (Re) = 7.34%
-Tax Rate (RT) = 35.00% -Terminal Growth = 2.75%

February 23, 2015 AutoZone, Inc.
IBEX Capital Management Investment Research Page 4
INVESTMENT RISKS
AutoZone, Inc. faces risks that potentially could harm the stock’s performance. Some risks include:
The firm depends strongly on using short-term credit to finance its operations. A severe deterioration in the
operations of the company may result in liquidity issues. Additionally, unexpected shocks to the commercial
paper market may result in higher interest rates for the firm’s short-term debt.
A downgrade in the firm’s credit rating may increase the difficulty for the firm to access new debt capital,
refinance its current debt, and issue new securities.
If the firm cannot successfully increase market share in the commercial automotive parts market, the firm’s
growth prospects may be limited.
Demand for the firm’s products is primarily determined by the number and age of vehicles in current service, the
cost of energy sources, the economic environment, the weather, technological advances, the quality of vehicles
manufactured, and restrictions on access to diagnostic tools and repair information. Any dramatic changes to any
of the above factors may potentially adversely affect the fundamental performance of the firm.
New successful entrants to the industry may have a negative effect on the competitive forces of the industry and
have an adverse effect on the firm’s fundamental performance.
Failure to adequately address security concerns with regard to the firm’s information systems may have a negative
impact on the firm’s reputation.
A small portion of the firm’s business is conducted in Mexico and Brazil (407 out of 5,391 stores). Fluctuations
in the foreign exchange market may have an impact on the firm’s operations in those regions.
CONCLUSION
Given the information contained in this research report, it appears that AZO is presently both the highest quality and most
deeply discounted firm within the automotive parts industry. Furthermore, based on the DCF valuation results above,
AZO appears to be undervalued in the market and offers investors very attractive upside potential with limited downside
risk.
DISCLAIMER All data in this report was taken from Capital IQ, SEC Filing: AutoZone, Inc. 10K, or AutoZone, Inc. Investor Relations.
This report is for informational purposes only and is based on publicly available data believed to be reliable, but no representation is
made that such data are accurate or complete. Opinions and projections contained herein reflect the opinion of the analyst as of the
date of this report and are subject to change. The analyses and conclusions detailed in the report were ascertained solely through use
of material public information and/or nonmaterial nonpublic information.
The analyst primarily responsible for this research report and whose name appears on the front cover certifies that: (1) all of the views
expressed in this research report accurately reflect his or her personal views about any and all of the subject securities or issuers
featured in this report; and (2) the analyst receives no direct or indirect form of compensation for any recommendations or views
expressed herein.

February 23, 2015 AutoZone, Inc.
IBEX Capital Management Investment Research Page 5
APPENDIX I: INCOME STATEMENT
Income Statement
For the Fiscal Period Ending 12 months
Aug-25-2012 12 months
Aug-31-2013 12 months
Aug-30-2014
Currency USD USD USD
Revenue 8,604 9,148 9,475
Cost Of Goods Sold 4,172 4,407 4,540
Gross Profit 4,432 4,741 4,935
Selling General & Admin Exp. 2,803 2,969 3,105
R & D Exp. - - -
Depreciation & Amort. - - -
Other Operating Expense/(Income) - - -
Other Operating Exp., Total 2,803 2,969 3,105
Operating Income 1,629 1,772 1,830
Interest Expense (177) (187) (169)
Interest and Invest. Income 1 2 2
Net Interest Exp. (176) (185) (168)
Other Non-Operating Inc. (Exp.) - - -
EBT Excl. Unusual Items 1,453 1,587 1,663
Restructuring Charges - (4) -
Impairment of Goodwill - (18) -
Other Unusual Items - 23 -
EBT Incl. Unusual Items 1,453 1,588 1,663
Income Tax Expense 523 571 593
Earnings from Cont. Ops. 930 1,016 1,070
Earnings of Discontinued Ops. - - -
Extraord. Item & Account. Change - - -
Net Income to Company 930 1,016 1,070
Minority Int. in Earnings - - -
Net Income 930 1,016 1,070

February 23, 2015 AutoZone, Inc.
IBEX Capital Management Investment Research Page 6
APPENDIX II: BALANCE SHEET
Balance Sheet
Balance Sheet as of: Aug-25-2012 Aug-31-2013 Aug-30-2014
Currency USD USD USD ASSETS
Cash And Equivalents 103 142 124
Short Term Investments 23 16 10
Accounts Receivable 161 172 201
Inventory 2,628 2,861 3,140
Deferred Tax Assets, Curr. 1 2 5
Other Current Assets 63 85 100
Total Current Assets 2,979 3,278 3,581
Gross Property, Plant & Equipment 4,660 5,059 5,501
Accumulated Depreciation (1,804) (1,987) (2,190)
Net Property, Plant & Equipment 2,856 3,071 3,310
Long-term Investments 54 66 75
Goodwill 303 368 368
Other Intangibles - 52 75
Deferred Tax Assets, LT 34 4 45
Other Long-Term Assets 41 53 64
Total Assets 6,266 6,892 7,518
LIABILITIES
Accounts Payable 2,927 3,308 3,609
Accrued Exp. 352 335 344
Short-term Borrowings 5 - -
Curr. Port. of LT Debt 45 174 181
Curr. Port. of Cap. Leases 30 32 37
Curr. Income Taxes Payable 17 17 41
Unearned Revenue, Current 29 32 31
Def. Tax Liability, Curr. 184 203 228
Other Current Liabilities 67 69 71
Total Current Liabilities 3,656 4,169 4,541
Long-Term Debt 3,718 4,013 4,163
Capital Leases - - -
Other Non-Current Liabilities 440 397 436
Total Liabilities 7,814 8,579 9,140
Common Stock 0 0 0
Additional Paid In Capital 690 814 844
Retained Earnings (1,033) (1,379) (1,529)
Treasury Stock (1,053) (1,002) (808)
Comprehensive Inc. and Other (152) (121) (129)
Total Common Equity (1,548) (1,687) (1,622)
Total Equity (1,548) (1,687) (1,622)
Total Liabilities And Equity 6,266 6,892 7,518

February 23, 2015 AutoZone, Inc.
IBEX Capital Management Investment Research Page 7
APPENDIX III: STATEMENT OF CASH FLOWS
Cash Flow
For the Fiscal Period Ending 12 months
Aug-25-2012 12 months
Aug-31-2013 12 months
Aug-30-2014
Currency USD USD USD
Net Income 930 1,016 1,070
Depreciation & Amort. 212 227 251
Amort. of Goodwill and Intangibles - 3 7
Depreciation & Amort., Total 212 230 258
Other Amortization 8 8 7
Stock-Based Compensation 33 37 39
Tax Benefit from Stock Options (63) (67) (24)
Other Operating Activities 26 17 (22)
Change in Acc. Receivable (21) (8) (28)
Change In Inventories (168) (233) (277)
Change in Acc. Payable 197 357 285
Change in Inc. Taxes 57 61 47
Change in Other Net Operating Assets 13 (4) (14)
Cash from Ops. 1,224 1,415 1,341
Capital Expenditure (378) (415) (438)
Sale of Property, Plant, and Equipment 7 10 4
Cash Acquisitions - (116) -
Divestitures - - -
Sale (Purchase) of Intangible assets - - (11)
Invest. in Marketable & Equity Securt. (3) (7) (3)
Net (Inc.) Dec. in Loans Originated/Sold - - -
Other Investing Activities - - -
Cash from Investing (375) (527) (448)
Short Term Debt Issued - - -
Long-Term Debt Issued 500 924 657
Total Debt Issued 500 924 657
Short Term Debt Repaid (27) (5) -
Long-Term Debt Repaid (81) (528) (533)
Total Debt Repaid (108) (533) (533)
Issuance of Common Stock 75 97 42
Repurchase of Common Stock (1,363) (1,387) (1,099)
Total Dividends Paid - - -
Special Dividend Paid - - -
Other Financing Activities 52 52 21
Cash from Financing (843) (847) (912)
Foreign Exchange Rate Adj. (0) (2) 1
Net Change in Cash 5 39 (18)

February 23, 2015 AutoZone, Inc.
IBEX Capital Management Investment Research Page 8
APPENDIX IV: COST OF CAPITAL CALCULATION
Cost of Debt Calculation Cost of Equity Calculation
Weighted Avg. YTM* 1.92% Risk-Free Assumption 3.00%
Tax Rate 35.00% Market Risk Premium 7.50%
Post-Tax Cost of Debt 1.25% Estimated Beta** 0.58
Weight of Leverage 19.86% Cost of Equity 7.34%
=Weighted Cost of Debt 0.25% Weight of Equity 80.14%
=Weighted Cost of Equity 5.88%
Weighted Average Cost of Capital Calculation
Weighted Cost of Debt 0.25% Weighted Cost of Equity 5.88%
=WACC 6.13%
*Weighted Average Yield to Maturity
Security Name Weight Yield to Maturity (YTM) Weighted YTM
1.300% Senior Notes (BBB) 10.09% 1.20% 0.12% 2.875% Senior Notes (BBB) 7.57% 3.21% 0.24% 3.125% Senior Notes (BBB) 12.62% 3.23% 0.41% 3.700% Senior Notes (BBB) 12.62% 3.11% 0.39% 4.000% Senior Notes (BBB) 12.62% 2.66% 0.34% 5.500% Senior Notes (BBB) 7.57% 0.75% 0.06% 6.950% Senior Notes (BBB) 5.05% 1.32% 0.07% 7.125% Senior Notes (BBB) 6.31% 2.19% 0.14% Capital Lease Obligations (NR) 3.02% 3.50% 0.11% Commercial Paper (A-2) 22.55% 0.25% 0.06%
=Weighted Avg. YTM 1.92%
**Estimated Betas (against the S&P 500)
Beta Result Adjusted R2 Value
5 Year Monthly Regression 0.332 0.074 5 Year Weekly Regression 0.429 0.153 5 Year Daily Regression 0.503 0.203 Adjusted (Using Vasicek method)*** 0.578 0.090 Beta used in the model 0.578 0.090
***5 year monthly beta adjusted for leverage and industry average
February 23, 2015 AutoZone, Inc.
IBEX Capital Management Investment Research Page 9
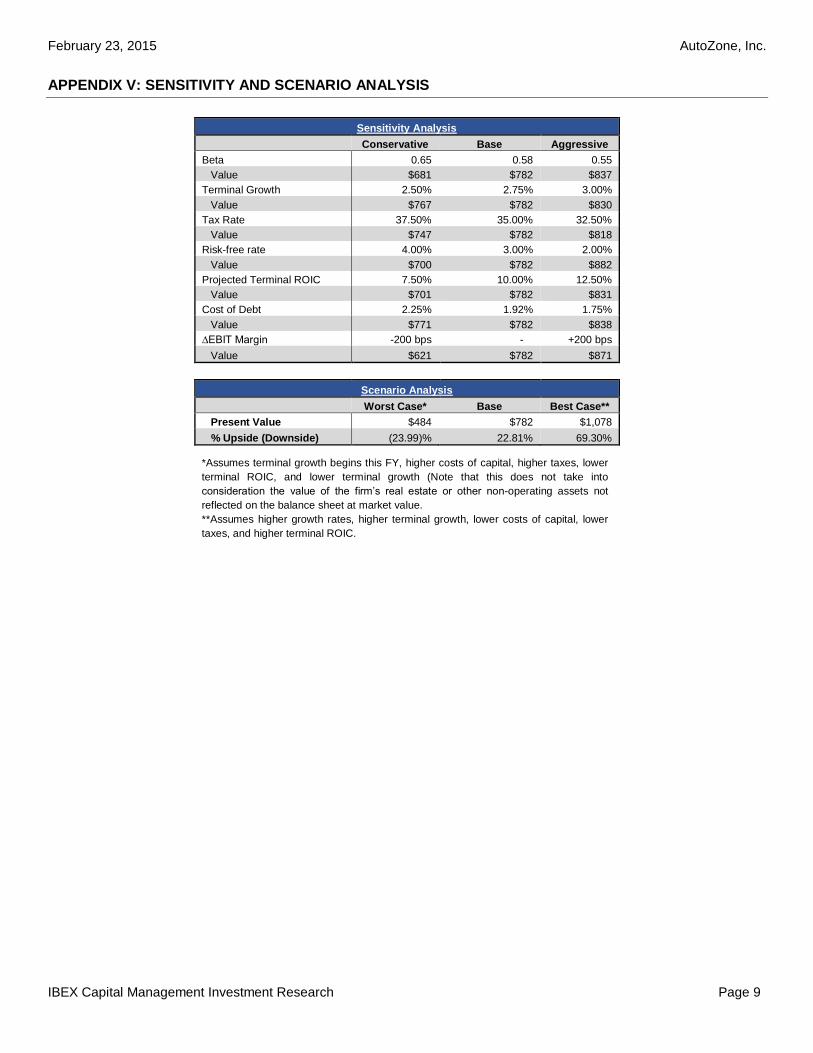
*Assumes terminal growth begins this FY, higher costs of capital, higher taxes, lower
terminal ROIC, and lower terminal growth (Note that this does not take into
consideration the value of the firm’s real estate or other non-operating assets not
reflected on the balance sheet at market value.
**Assumes higher growth rates, higher terminal growth, lower costs of capital, lower
taxes, and higher terminal ROIC.
APPENDIX V: SENSITIVITY AND SCENARIO ANALYSIS
Sensitivity Analysis
Conservative Base Aggressive
Beta 0.65 0.58 0.55
Value $681 $782 $837
Terminal Growth 2.50% 2.75% 3.00%
Value $767 $782 $830
Tax Rate 37.50% 35.00% 32.50%
Value $747 $782 $818
Risk-free rate 4.00% 3.00% 2.00%
Value $700 $782 $882
Projected Terminal ROIC 7.50% 10.00% 12.50%
Value $701 $782 $831
Cost of Debt 2.25% 1.92% 1.75%
Value $771 $782 $838
∆EBIT Margin -200 bps - +200 bps
Value $621 $782 $871
Scenario Analysis
Worst Case* Base Best Case**
Present Value $484 $782 $1,078
% Upside (Downside) (23.99)% 22.81% 69.30%


