Readers and Credentials - hidglobal.com · Understanding HID Global Readers ..... 5
BRAND SOUTH AFRICA
Research & Nation Brand Performance
Presentation
Prepared by Brand South Africa Research
Updated 2 February 2016
1
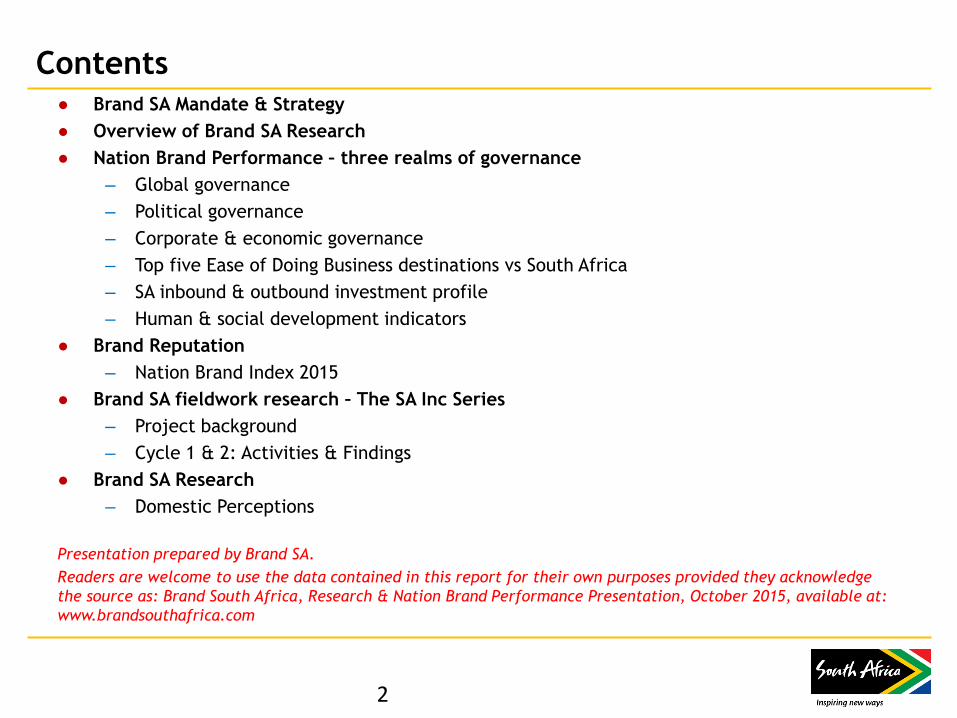
Contents ● Brand SA Mandate & Strategy
● Overview of Brand SA Research
● Nation Brand Performance – three realms of governance
– Global governance
– Political governance
– Corporate & economic governance
– Top five Ease of Doing Business destinations vs South Africa
– SA inbound & outbound investment profile
– Human & social development indicators
● Brand Reputation
– Nation Brand Index 2015
● Brand SA fieldwork research – The SA Inc Series
– Project background
– Cycle 1 & 2: Activities & Findings
● Brand SA Research
– Domestic Perceptions
Presentation prepared by Brand SA.
Readers are welcome to use the data contained in this report for their own purposes provided they acknowledge
the source as: Brand South Africa, Research & Nation Brand Performance Presentation, October 2015, available at:
www.brandsouthafrica.com
2
BRAND SOUTH AFRICA
STRATEGIC PLAN 2015-2020

Brand SA – Core Functions
6 core functions:
1. Information, insights & ideas
2.Marketing, advertising &
branding
3. Issues management
4.Promotions & events
5.Media relationships
6.Stakeholder relationships
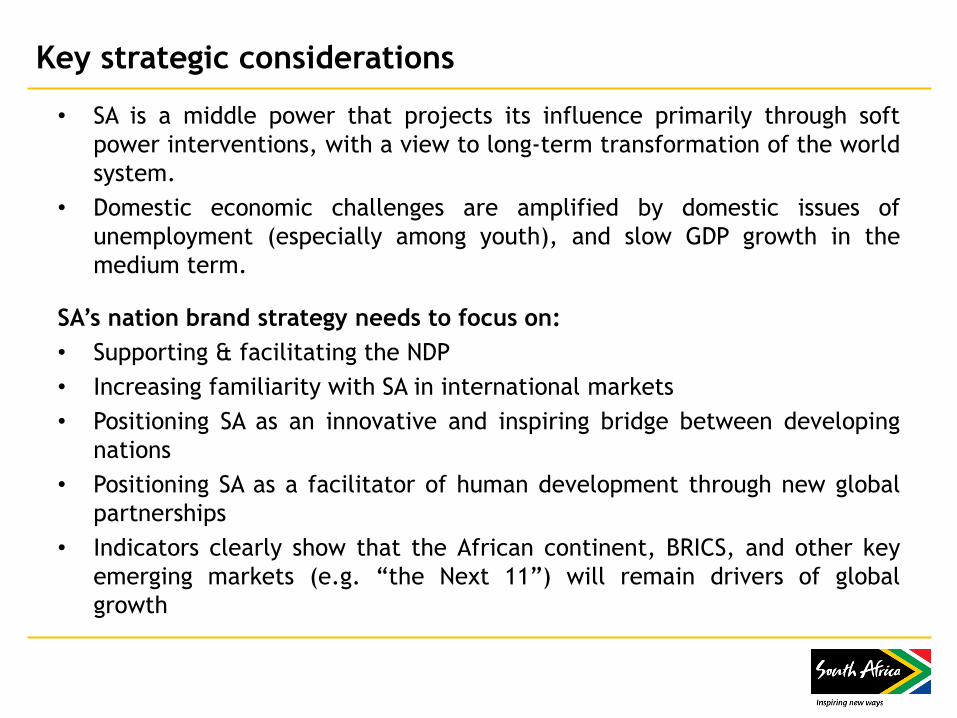
Key strategic considerations
• SA is a middle power that projects its influence primarily through soft
power interventions, with a view to long-term transformation of the world
system.
• Domestic economic challenges are amplified by domestic issues of
unemployment (especially among youth), and slow GDP growth in the
medium term.
SA’s nation brand strategy needs to focus on:
• Supporting & facilitating the NDP
• Increasing familiarity with SA in international markets
• Positioning SA as an innovative and inspiring bridge between developing
nations
• Positioning SA as a facilitator of human development through new global
partnerships
• Indicators clearly show that the African continent, BRICS, and other key
emerging markets (e.g. “the Next 11”) will remain drivers of global
growth
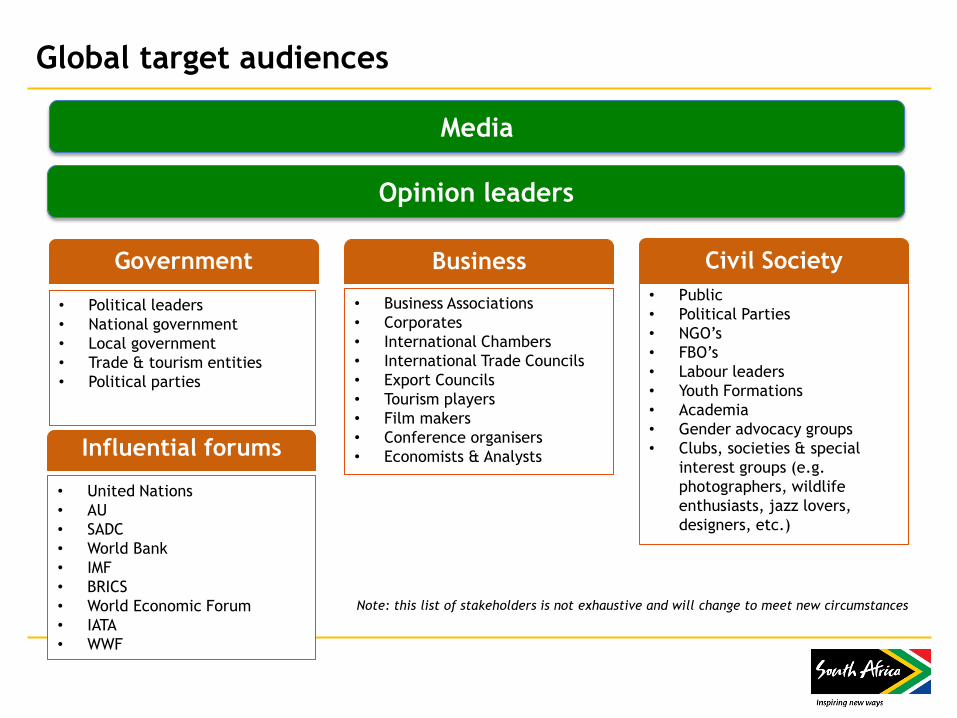
Global target audiences
Note: this list of stakeholders is not exhaustive and will change to meet new circumstances
Government
• Political leaders
• National government
• Local government
• Trade & tourism entities
• Political parties
Business
• Business Associations
• Corporates
• International Chambers
• International Trade Councils
• Export Councils
• Tourism players
• Film makers
• Conference organisers
• Economists & Analysts
• Public
• Political Parties
• NGO’s
• FBO’s
• Labour leaders
• Youth Formations
• Academia
• Gender advocacy groups
• Clubs, societies & special
interest groups (e.g.
photographers, wildlife
enthusiasts, jazz lovers,
designers, etc.)
Civil Society
Media
Influential forums
• United Nations
• AU
• SADC
• World Bank
• IMF
• BRICS
• World Economic Forum
• IATA
• WWF
Opinion leaders
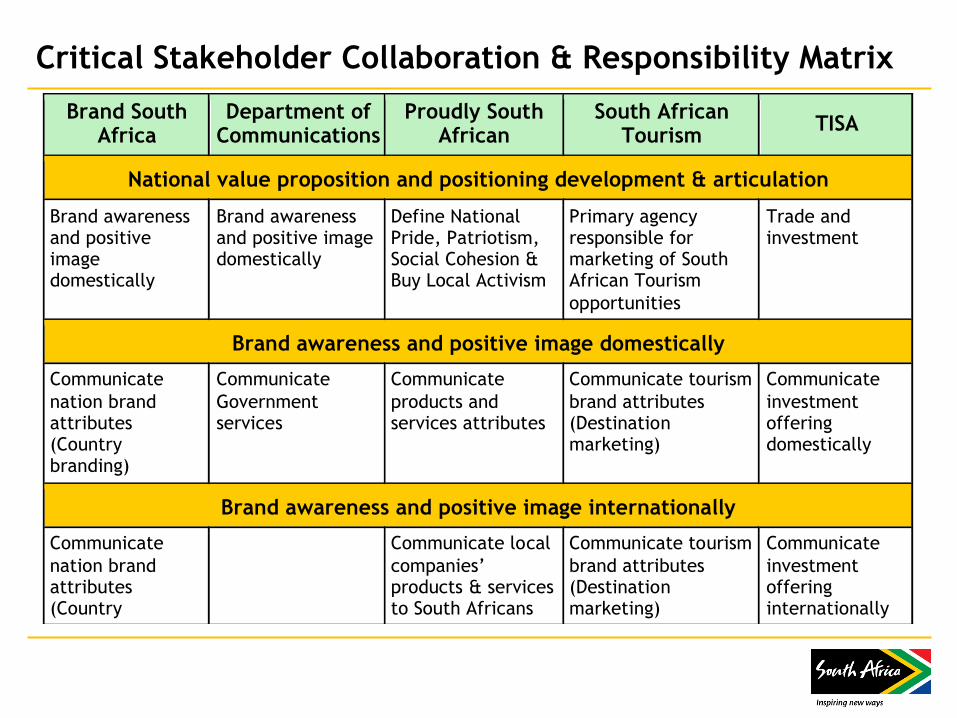
Critical Stakeholder Collaboration & Responsibility Matrix
Brand South Africa
Department of Communications
Proudly South African
South African Tourism
TISA
National value proposition and positioning development & articulation
Brand awareness and positive image domestically
Brand awareness and positive image domestically
Define National Pride, Patriotism, Social Cohesion & Buy Local Activism
Primary agency responsible for marketing of South African Tourism
opportunities
Trade and investment
Brand awareness and positive image domestically
Communicate
nation brand attributes (Country branding)
Communicate
Government services
Communicate
products and services attributes
Communicate tourism
brand attributes (Destination marketing)
Communicate
investment offering domestically
Brand awareness and positive image internationally
Communicate
nation brand attributes (Country
Communicate local
companies’ products & services to South Africans
Communicate tourism
brand attributes (Destination marketing)
Communicate
investment offering internationally
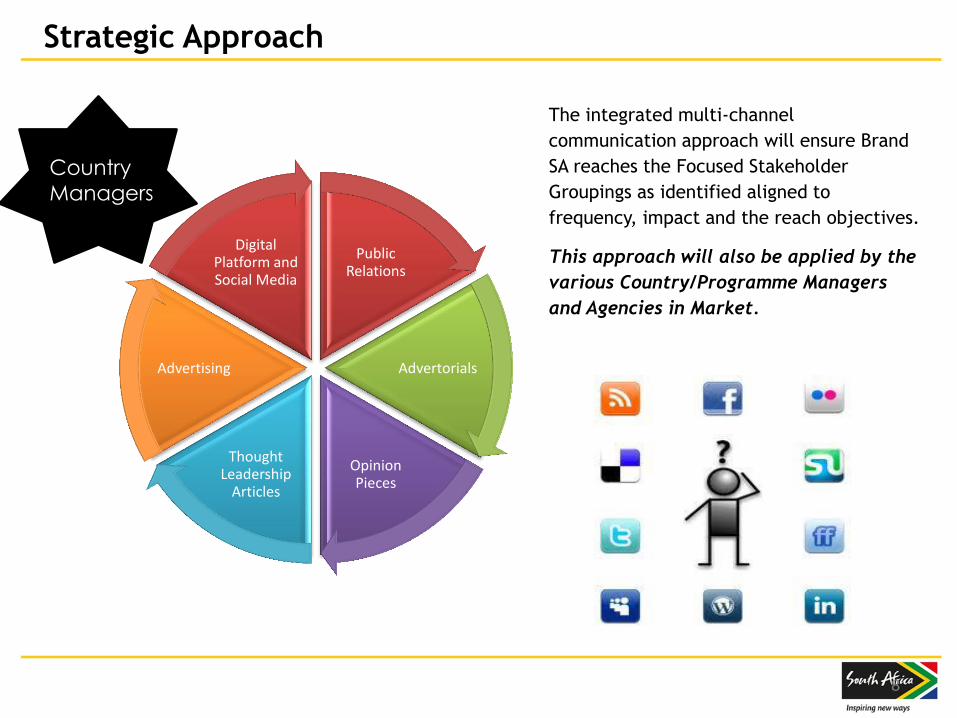
Strategic Approach
Public Relations
Advertorials
Opinion Pieces
Thought Leadership
Articles
Advertising
Digital Platform and Social Media
The integrated multi-channel
communication approach will ensure Brand
SA reaches the Focused Stakeholder
Groupings as identified aligned to
frequency, impact and the reach objectives.
This approach will also be applied by the
various Country/Programme Managers
and Agencies in Market.
Country
Managers
8
OVERVIEW OF BRAND SA
RESEARCH
9
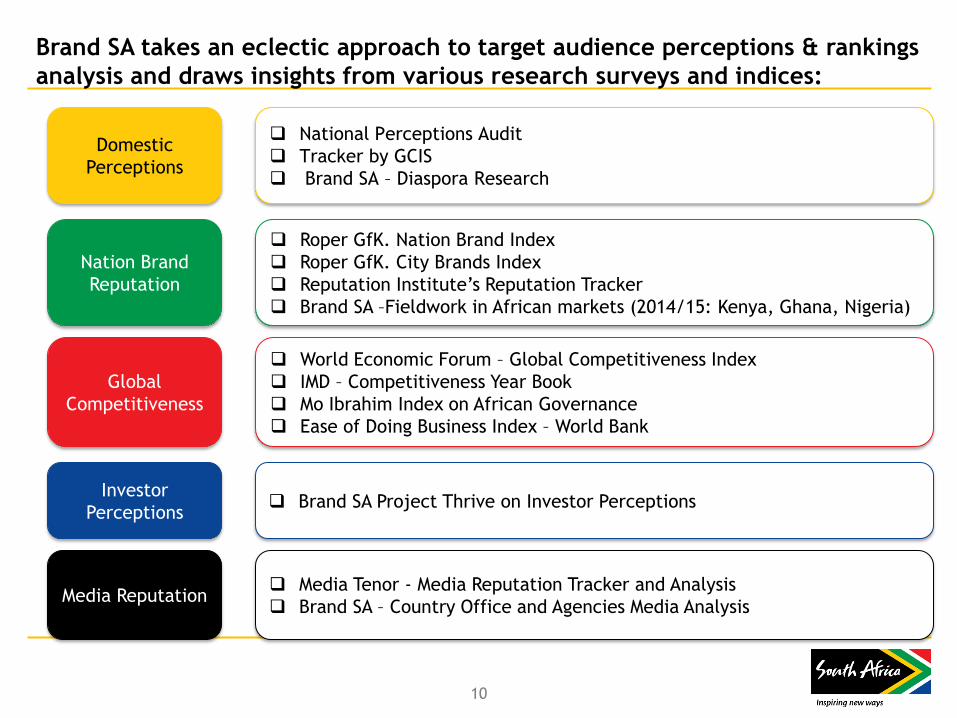
Brand SA takes an eclectic approach to target audience perceptions & rankings
analysis and draws insights from various research surveys and indices:
Domestic
Perceptions
National Perceptions Audit
Tracker by GCIS
Brand SA – Diaspora Research
Nation Brand
Reputation
Roper GfK. Nation Brand Index
Roper GfK. City Brands Index
Reputation Institute’s Reputation Tracker
Brand SA –Fieldwork in African markets (2014/15: Kenya, Ghana, Nigeria)
Global
Competitiveness
World Economic Forum – Global Competitiveness Index
IMD – Competitiveness Year Book
Mo Ibrahim Index on African Governance
Ease of Doing Business Index – World Bank
Investor
Perceptions Brand SA Project Thrive on Investor Perceptions
Media Reputation Media Tenor - Media Reputation Tracker and Analysis
Brand SA – Country Office and Agencies Media Analysis
10
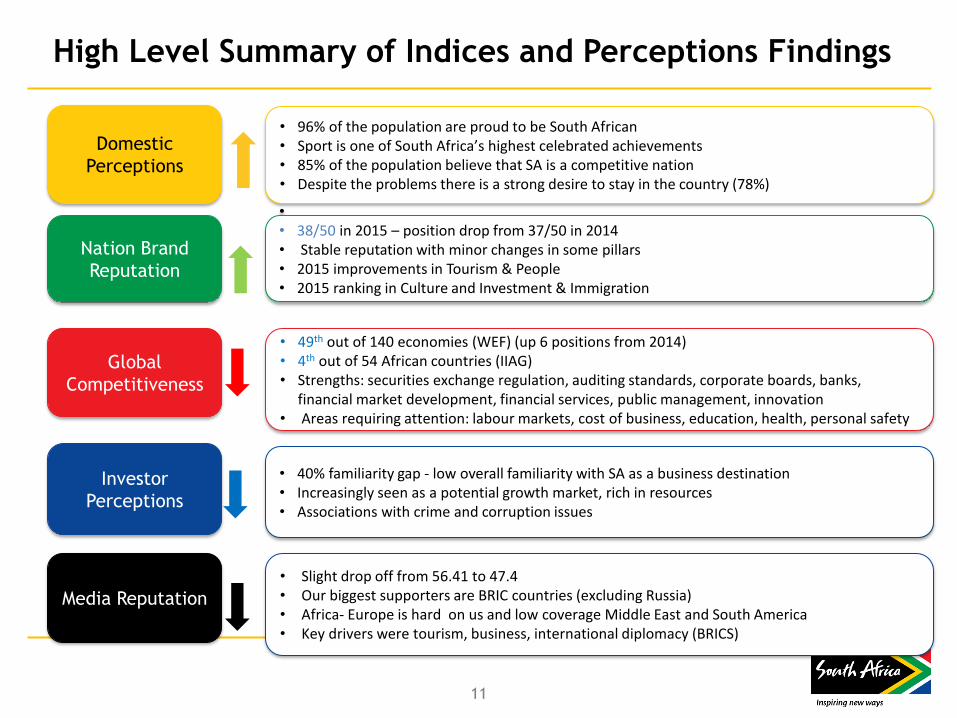
High Level Summary of Indices and Perceptions Findings
Domestic
Perceptions
• 96% of the population are proud to be South African • Sport is one of South Africa’s highest celebrated achievements • 85% of the population believe that SA is a competitive nation • Despite the problems there is a strong desire to stay in the country (78%)
Nation Brand
Reputation
• • 38/50 in 2015 – position drop from 37/50 in 2014 • Stable reputation with minor changes in some pillars • 2015 improvements in Tourism & People • 2015 ranking in Culture and Investment & Immigration
Global
Competitiveness
• 49th out of 140 economies (WEF) (up 6 positions from 2014) • 4th out of 54 African countries (IIAG) • Strengths: securities exchange regulation, auditing standards, corporate boards, banks,
financial market development, financial services, public management, innovation • Areas requiring attention: labour markets, cost of business, education, health, personal safety
Investor
Perceptions
• 40% familiarity gap - low overall familiarity with SA as a business destination • Increasingly seen as a potential growth market, rich in resources • Associations with crime and corruption issues
Media Reputation
• Slight drop off from 56.41 to 47.4 • Our biggest supporters are BRIC countries (excluding Russia) • Africa- Europe is hard on us and low coverage Middle East and South America • Key drivers were tourism, business, international diplomacy (BRICS)
11
NATION BRAND PERFORMANCE
Nation Brand Performance
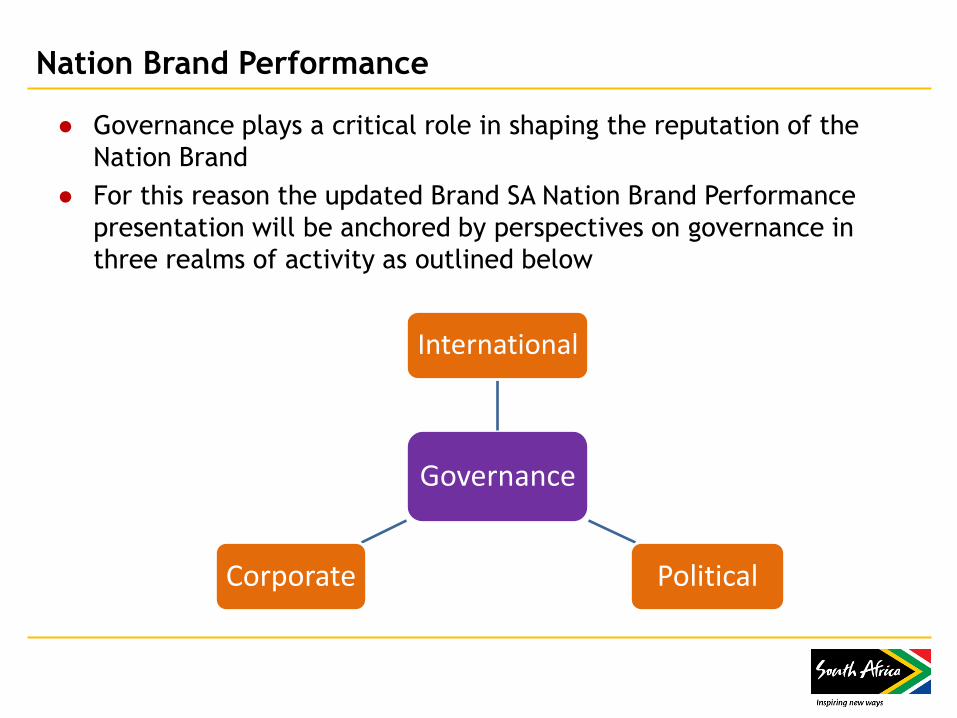
● Governance plays a critical role in shaping the reputation of the
Nation Brand
● For this reason the updated Brand SA Nation Brand Performance
presentation will be anchored by perspectives on governance in
three realms of activity as outlined below
Governance
International
Political Corporate
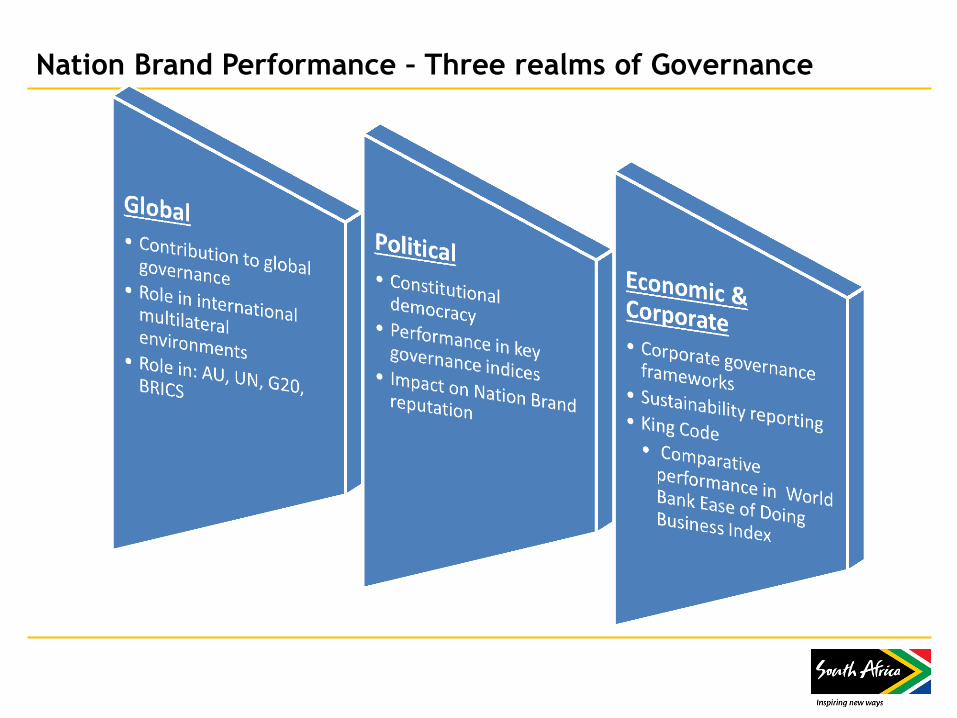
Nation Brand Performance – Three realms of Governance
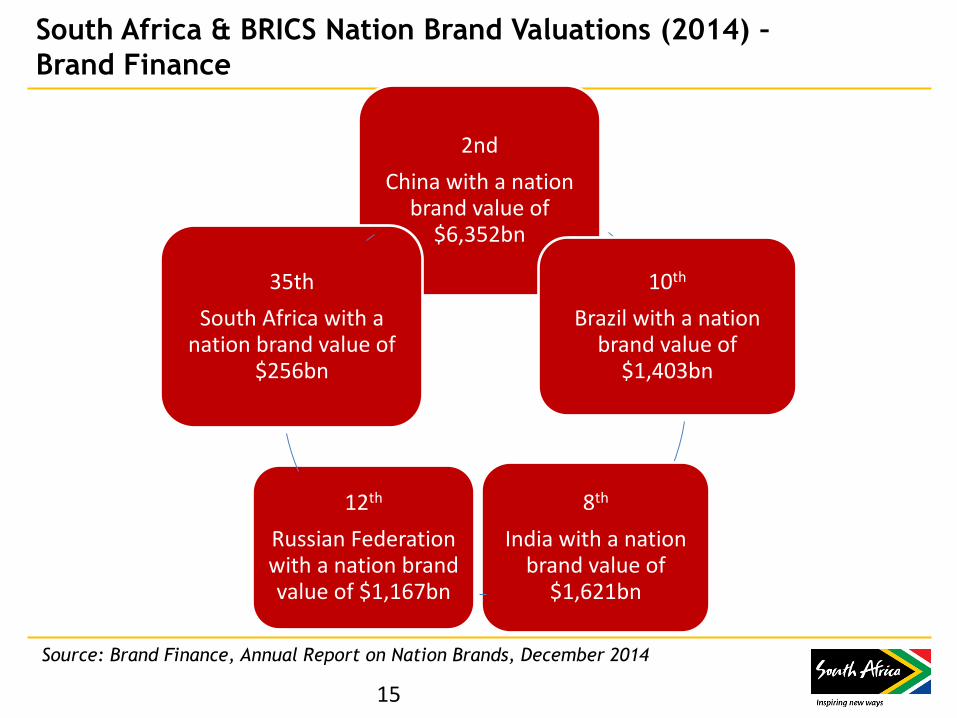
South Africa & BRICS Nation Brand Valuations (2014) –
Brand Finance
2nd
China with a nation brand value of
$6,352bn
10th
Brazil with a nation brand value of
$1,403bn
8th
India with a nation brand value of
$1,621bn
12th
Russian Federation with a nation brand value of $1,167bn
35th
South Africa with a nation brand value of
$256bn
Source: Brand Finance, Annual Report on Nation Brands, December 2014
15
GLOBAL GOVERNANCE
Nation Brand Performance
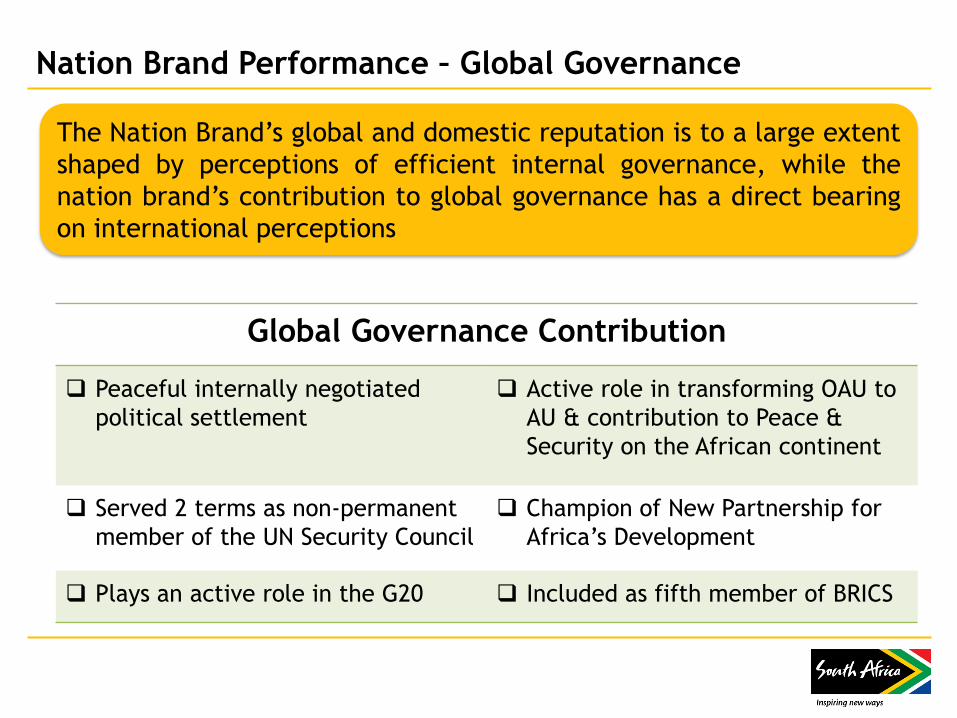
Nation Brand Performance – Global Governance
The Nation Brand’s global and domestic reputation is to a large extent
shaped by perceptions of efficient internal governance, while the
nation brand’s contribution to global governance has a direct bearing
on international perceptions
Global Governance Contribution
Peaceful internally negotiated
political settlement
Active role in transforming OAU to
AU & contribution to Peace &
Security on the African continent
Served 2 terms as non-permanent
member of the UN Security Council
Champion of New Partnership for
Africa’s Development
Plays an active role in the G20 Included as fifth member of BRICS
POLITICAL GOVERNANCE
Nation Brand Performance
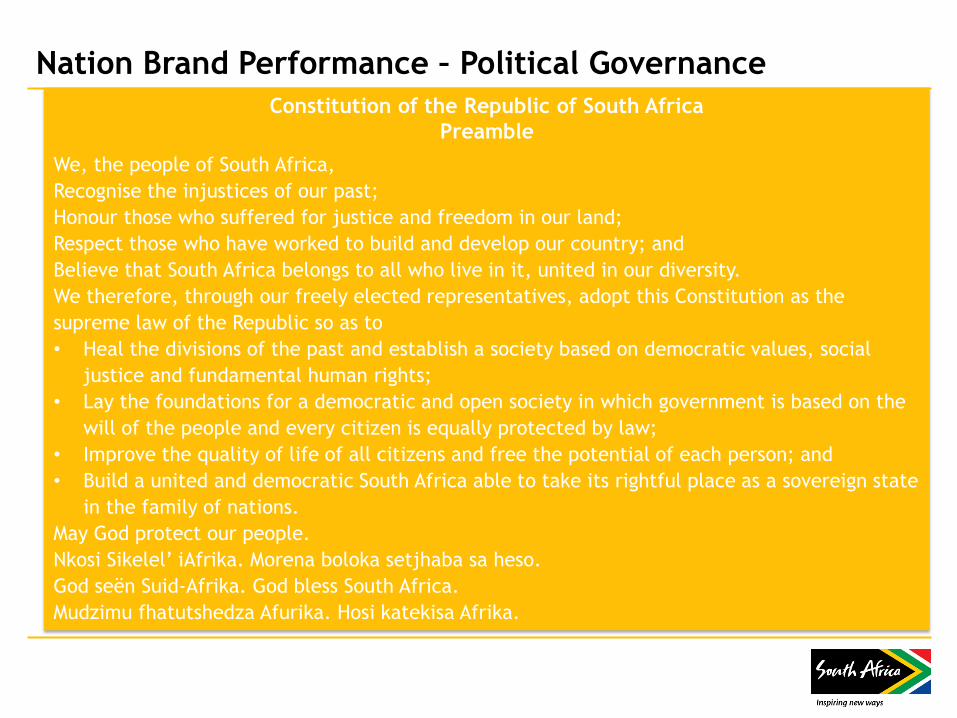
Nation Brand Performance – Political Governance
Constitution of the Republic of South Africa
Preamble
We, the people of South Africa,
Recognise the injustices of our past;
Honour those who suffered for justice and freedom in our land;
Respect those who have worked to build and develop our country; and
Believe that South Africa belongs to all who live in it, united in our diversity.
We therefore, through our freely elected representatives, adopt this Constitution as the
supreme law of the Republic so as to
• Heal the divisions of the past and establish a society based on democratic values, social
justice and fundamental human rights;
• Lay the foundations for a democratic and open society in which government is based on the
will of the people and every citizen is equally protected by law;
• Improve the quality of life of all citizens and free the potential of each person; and
• Build a united and democratic South Africa able to take its rightful place as a sovereign state
in the family of nations.
May God protect our people.
Nkosi Sikelel’ iAfrika. Morena boloka setjhaba sa heso.
God seën Suid-Afrika. God bless South Africa.
Mudzimu fhatutshedza Afurika. Hosi katekisa Afrika.
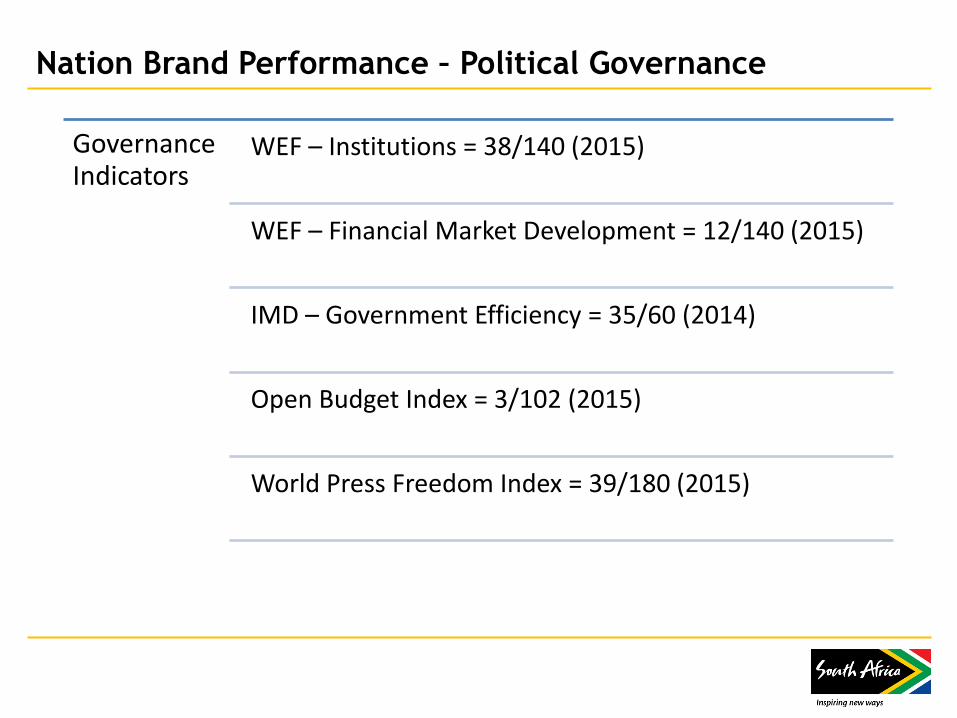
Nation Brand Performance – Political Governance
Governance Indicators
WEF – Institutions = 38/140 (2015)
WEF – Financial Market Development = 12/140 (2015)
IMD – Government Efficiency = 35/60 (2014)
Open Budget Index = 3/102 (2015)
World Press Freedom Index = 39/180 (2015)
African Peer Review Mechanism Country Report 2014 Highlights
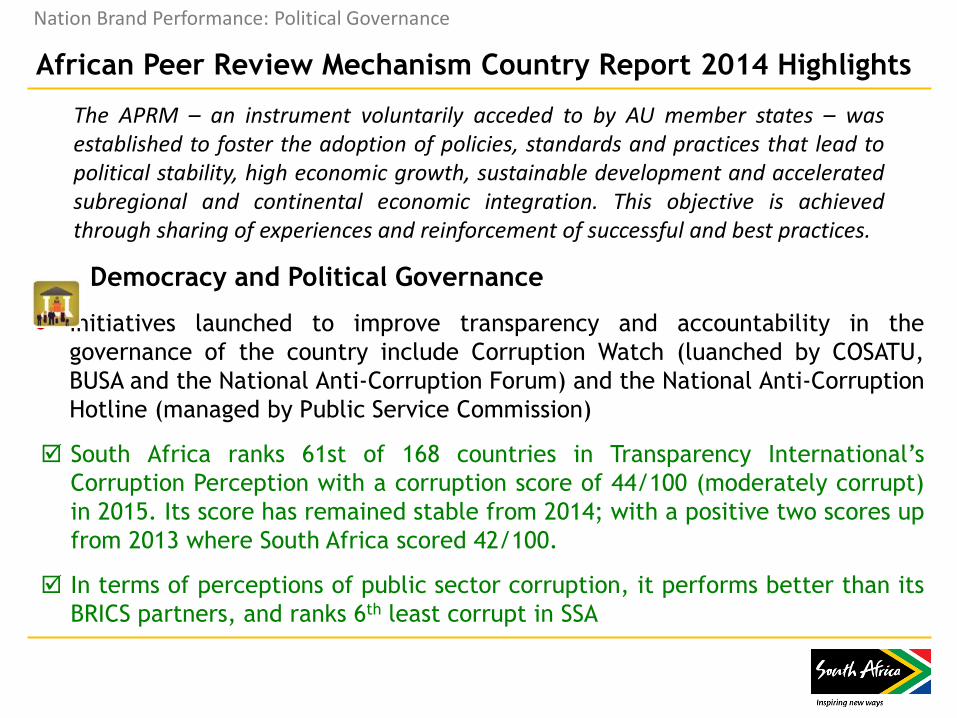
Democracy and Political Governance
● Initiatives launched to improve transparency and accountability in the
governance of the country include Corruption Watch (luanched by COSATU,
BUSA and the National Anti-Corruption Forum) and the National Anti-Corruption
Hotline (managed by Public Service Commission)
South Africa ranks 61st of 168 countries in Transparency International’s
Corruption Perception with a corruption score of 44/100 (moderately corrupt)
in 2015. Its score has remained stable from 2014; with a positive two scores up
from 2013 where South Africa scored 42/100.
In terms of perceptions of public sector corruption, it performs better than its
BRICS partners, and ranks 6th least corrupt in SSA
Nation Brand Performance: Political Governance
The APRM – an instrument voluntarily acceded to by AU member states – was established to foster the adoption of policies, standards and practices that lead to political stability, high economic growth, sustainable development and accelerated subregional and continental economic integration. This objective is achieved through sharing of experiences and reinforcement of successful and best practices.
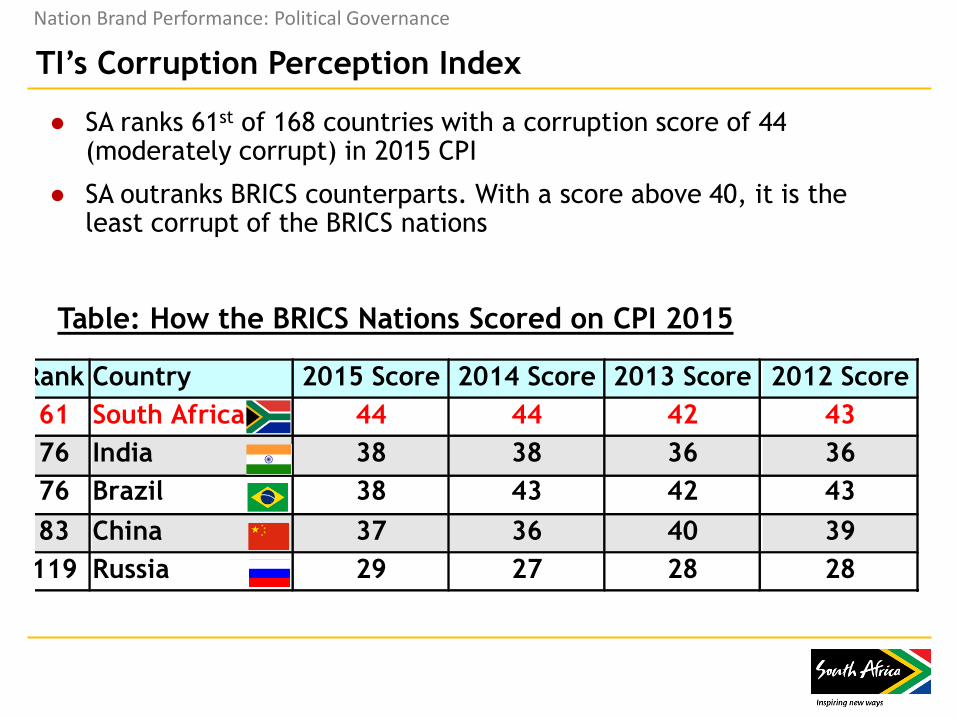
TI’s Corruption Perception Index
● SA ranks 61st of 168 countries with a corruption score of 44 (moderately corrupt) in 2015 CPI
● SA outranks BRICS counterparts. With a score above 40, it is the least corrupt of the BRICS nations
Nation Brand Performance: Political Governance
Rank Country 2015 Score 2014 Score 2013 Score 2012 Score
61 South Africa 44 44 42 43
76 India 38 38 36 36
76 Brazil 38 43 42 43
83 China 37 36 40 39
119 Russia 29 27 28 28
Table: How the BRICS Nations Scored on CPI 2015
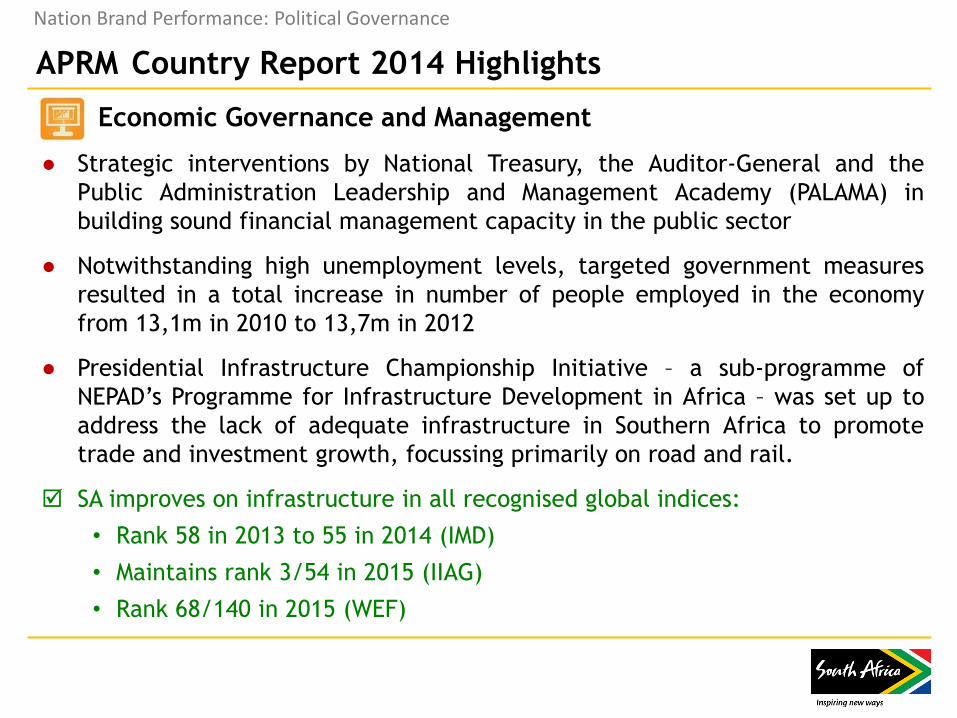
Economic Governance and Management
● Strategic interventions by National Treasury, the Auditor-General and the
Public Administration Leadership and Management Academy (PALAMA) in
building sound financial management capacity in the public sector
● Notwithstanding high unemployment levels, targeted government measures
resulted in a total increase in number of people employed in the economy
from 13,1m in 2010 to 13,7m in 2012
● Presidential Infrastructure Championship Initiative – a sub-programme of
NEPAD’s Programme for Infrastructure Development in Africa – was set up to
address the lack of adequate infrastructure in Southern Africa to promote
trade and investment growth, focussing primarily on road and rail.
SA improves on infrastructure in all recognised global indices:
• Rank 58 in 2013 to 55 in 2014 (IMD)
• Maintains rank 3/54 in 2015 (IIAG)
• Rank 68/140 in 2015 (WEF)
Nation Brand Performance: Political Governance
APRM Country Report 2014 Highlights
APRM Country Report 2014 Highlights
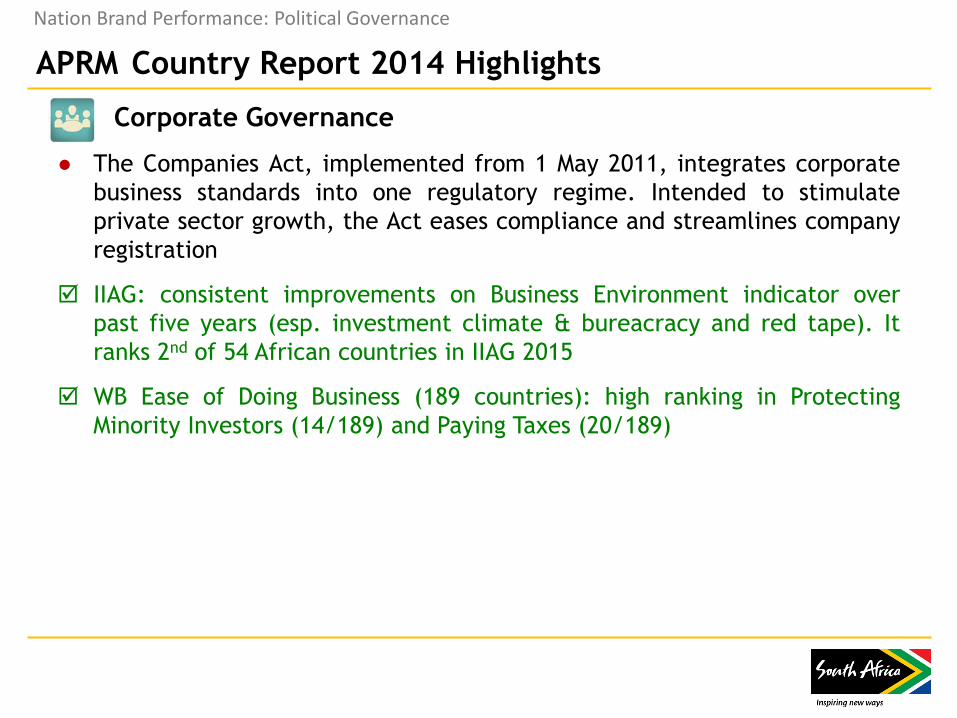
Corporate Governance
● The Companies Act, implemented from 1 May 2011, integrates corporate
business standards into one regulatory regime. Intended to stimulate
private sector growth, the Act eases compliance and streamlines company
registration
IIAG: consistent improvements on Business Environment indicator over
past five years (esp. investment climate & bureacracy and red tape). It
ranks 2nd of 54 African countries in IIAG 2015
WB Ease of Doing Business (189 countries): high ranking in Protecting
Minority Investors (14/189) and Paying Taxes (20/189)
Nation Brand Performance: Political Governance
APRM Country Report 2014 Highlights
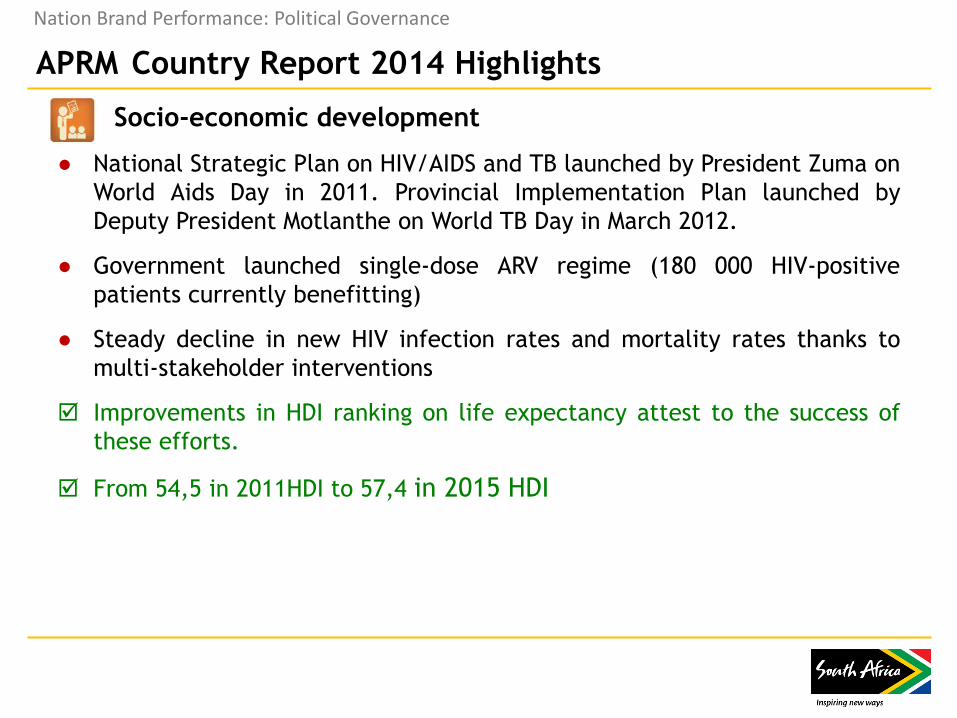
Socio-economic development
● National Strategic Plan on HIV/AIDS and TB launched by President Zuma on
World Aids Day in 2011. Provincial Implementation Plan launched by
Deputy President Motlanthe on World TB Day in March 2012.
● Government launched single-dose ARV regime (180 000 HIV-positive
patients currently benefitting)
● Steady decline in new HIV infection rates and mortality rates thanks to
multi-stakeholder interventions
Improvements in HDI ranking on life expectancy attest to the success of
these efforts.
From 54,5 in 2011HDI to 57,4 in 2015 HDI
Nation Brand Performance: Political Governance
APRM Country Report 2014 Highlights
The APRM also acknowledges critical challenges
● Service delivery and other instances of violence
“These are challenges which have persisted over the three reporting periods
and our government has developed robust mechanisms to root them out”
Foreword by President Jacob Zuma
● Education
● Triple and cyclic challenge of poverty, unemployment and
inequality
Nation Brand Performance: Political Governance
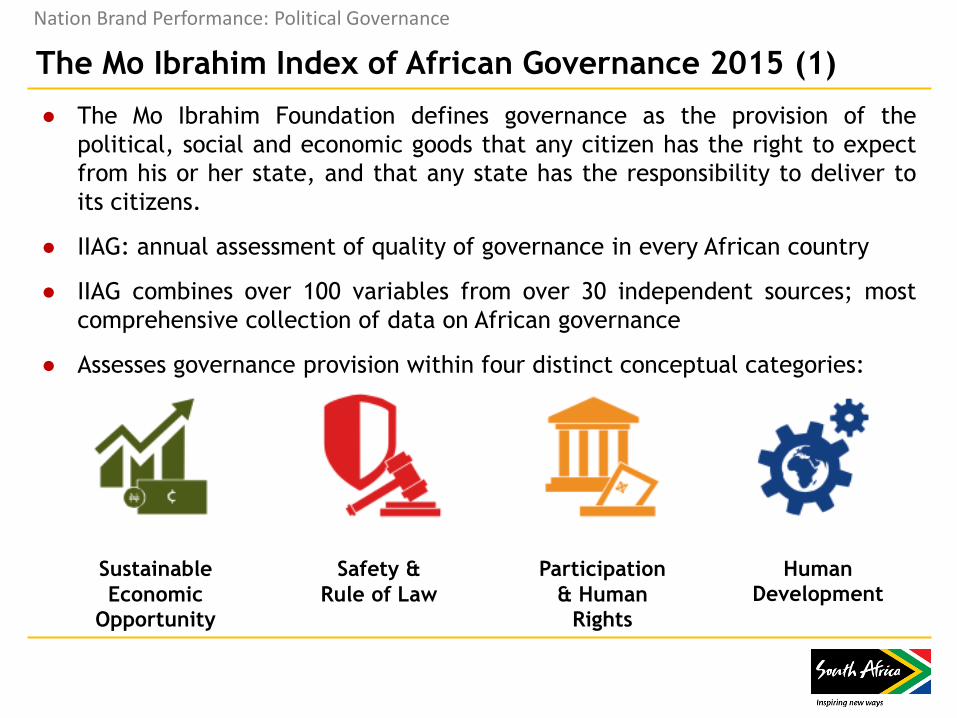
The Mo Ibrahim Index of African Governance 2015 (1)
● The Mo Ibrahim Foundation defines governance as the provision of the
political, social and economic goods that any citizen has the right to expect
from his or her state, and that any state has the responsibility to deliver to
its citizens.
● IIAG: annual assessment of quality of governance in every African country
● IIAG combines over 100 variables from over 30 independent sources; most
comprehensive collection of data on African governance
● Assesses governance provision within four distinct conceptual categories:
Nation Brand Performance: Political Governance
Safety &
Rule of Law
Sustainable
Economic
Opportunity
Participation
& Human
Rights
Human
Development
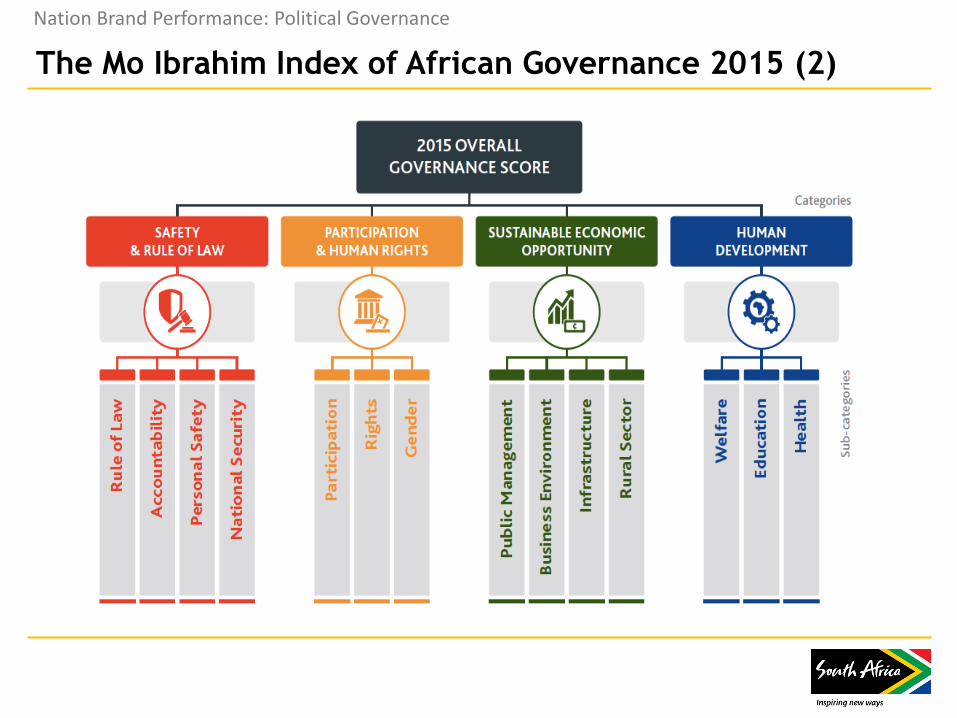
The Mo Ibrahim Index of African Governance 2015 (2)
Nation Brand Performance: Political Governance
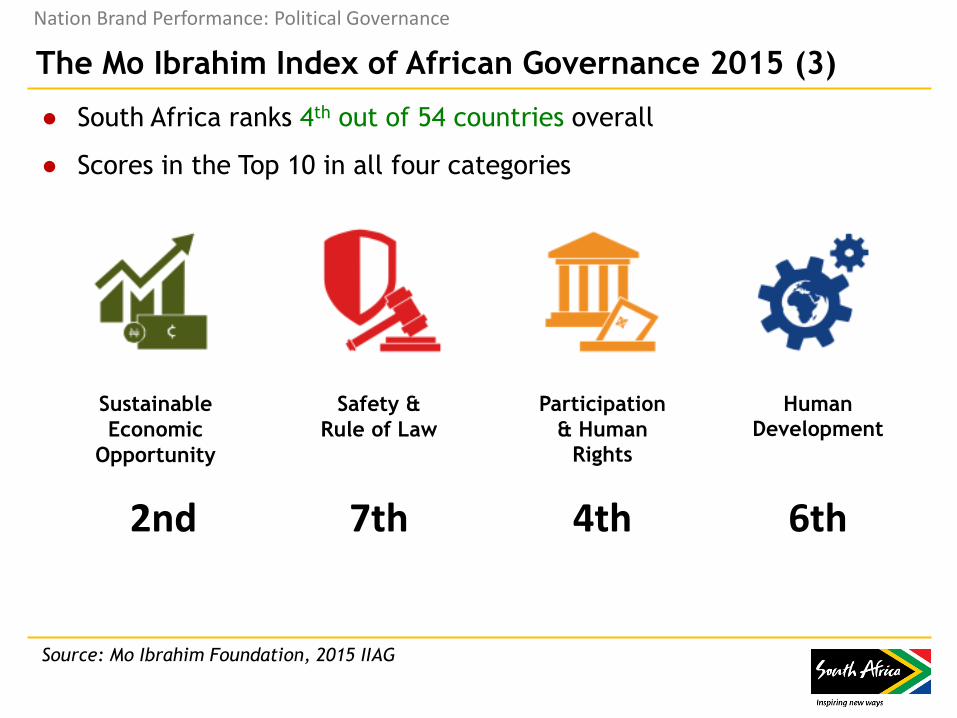
The Mo Ibrahim Index of African Governance 2015 (3)
● South Africa ranks 4th out of 54 countries overall
● Scores in the Top 10 in all four categories
Nation Brand Performance: Political Governance
Safety &
Rule of Law
Sustainable
Economic
Opportunity
Participation
& Human
Rights
Human
Development
2nd 6th 4th 7th
Source: Mo Ibrahim Foundation, 2015 IIAG
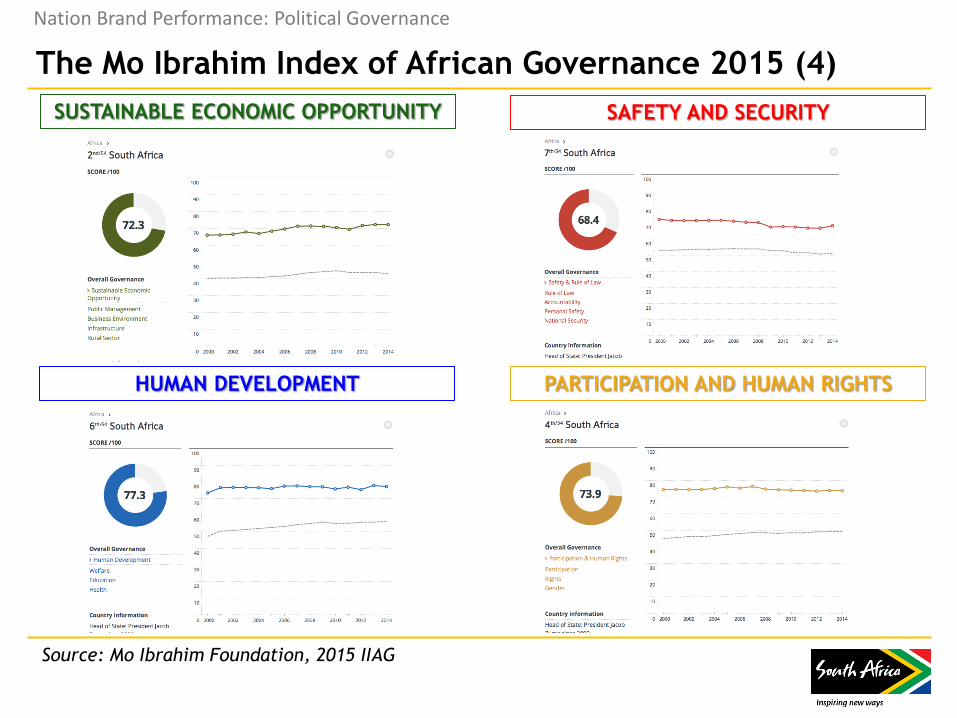
The Mo Ibrahim Index of African Governance 2015 (4)
Nation Brand Performance: Political Governance
SUSTAINABLE ECONOMIC OPPORTUNITY
PARTICIPATION AND HUMAN RIGHTS
SAFETY AND SECURITY
HUMAN DEVELOPMENT
Source: Mo Ibrahim Foundation, 2015 IIAG
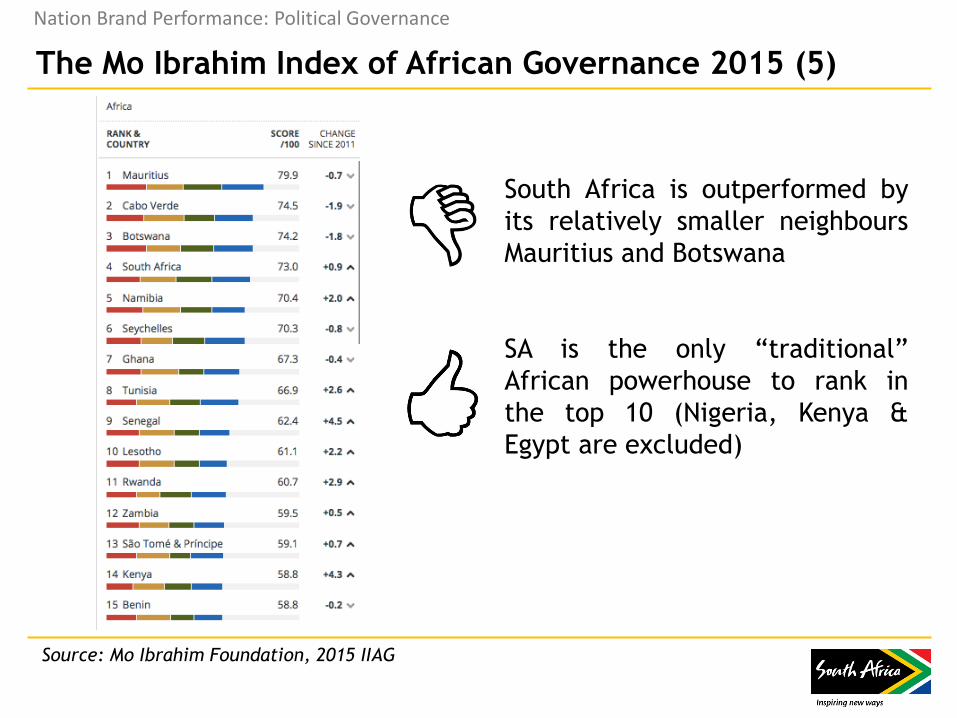
The Mo Ibrahim Index of African Governance 2015 (5)
Nation Brand Performance: Political Governance
South Africa is outperformed by
its relatively smaller neighbours
Mauritius and Botswana
SA is the only “traditional”
African powerhouse to rank in
the top 10 (Nigeria, Kenya &
Egypt are excluded)
Source: Mo Ibrahim Foundation, 2015 IIAG
Source: Mo Ibrahim Foundation, 2015 IIAG
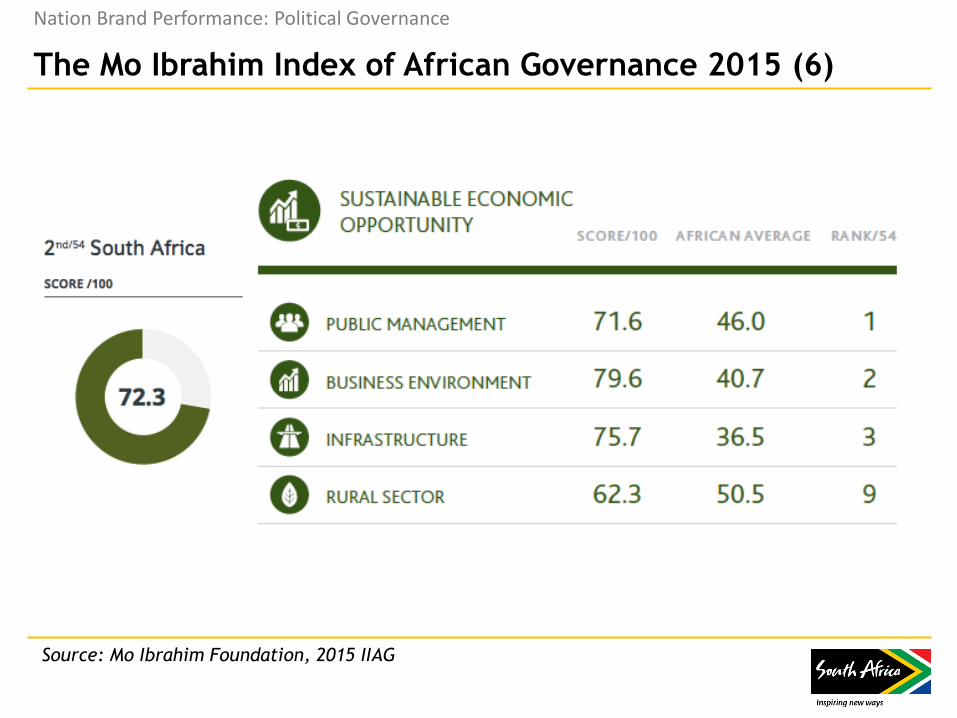
The Mo Ibrahim Index of African Governance 2015 (6)
Nation Brand Performance: Political Governance
Source: Mo Ibrahim Foundation, 2015 IIAG
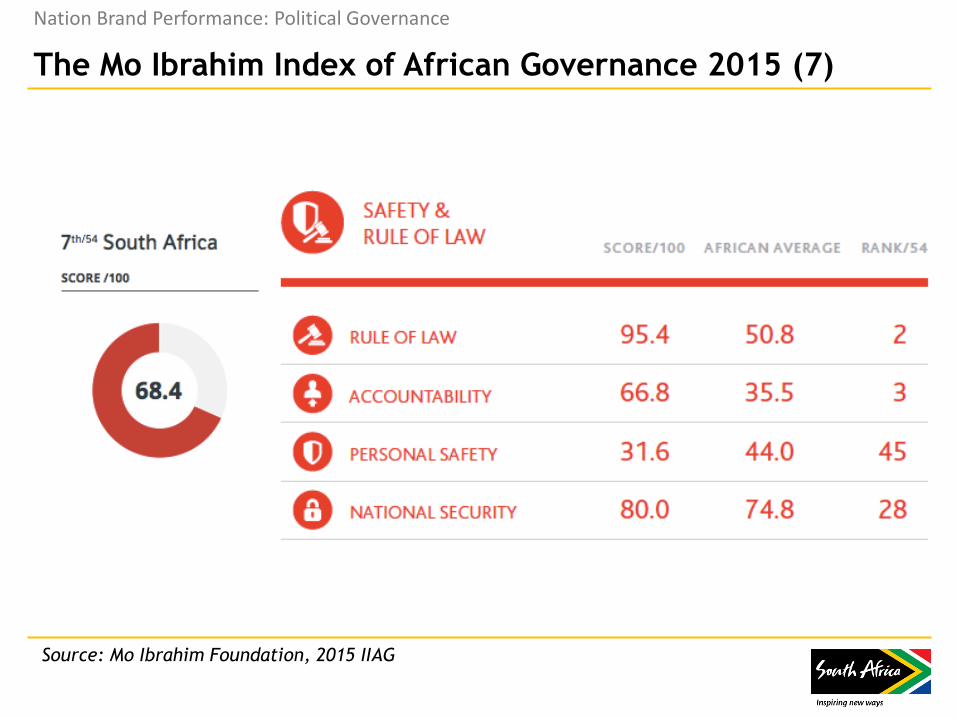
The Mo Ibrahim Index of African Governance 2015 (7)
Nation Brand Performance: Political Governance
Source: Mo Ibrahim Foundation, 2015 IIAG
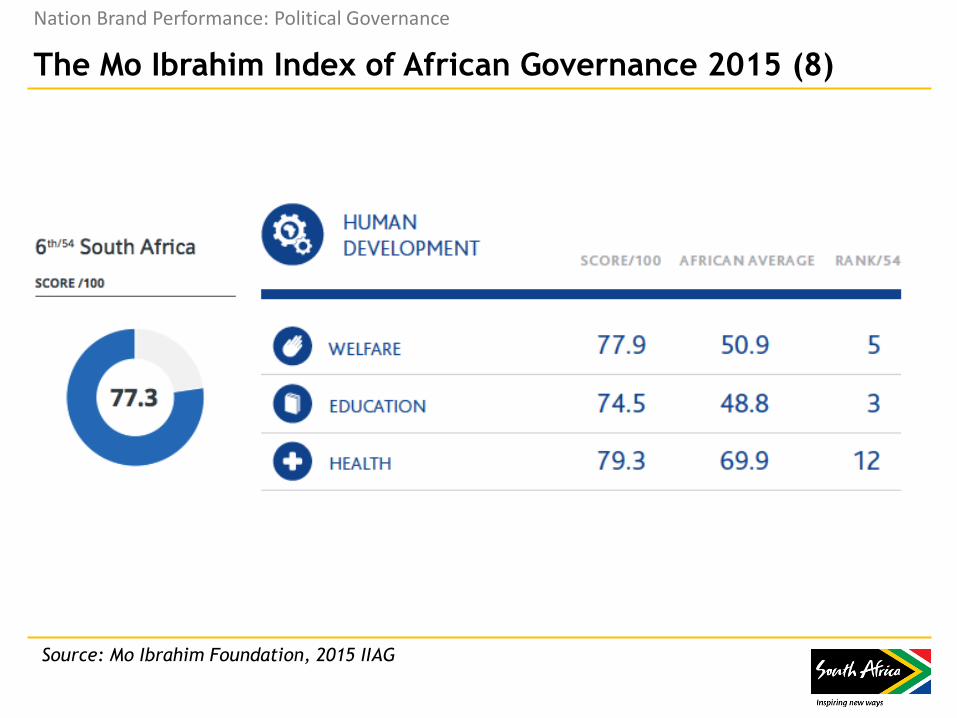
The Mo Ibrahim Index of African Governance 2015 (8)
Nation Brand Performance: Political Governance
Source: Mo Ibrahim Foundation, 2015 IIAG
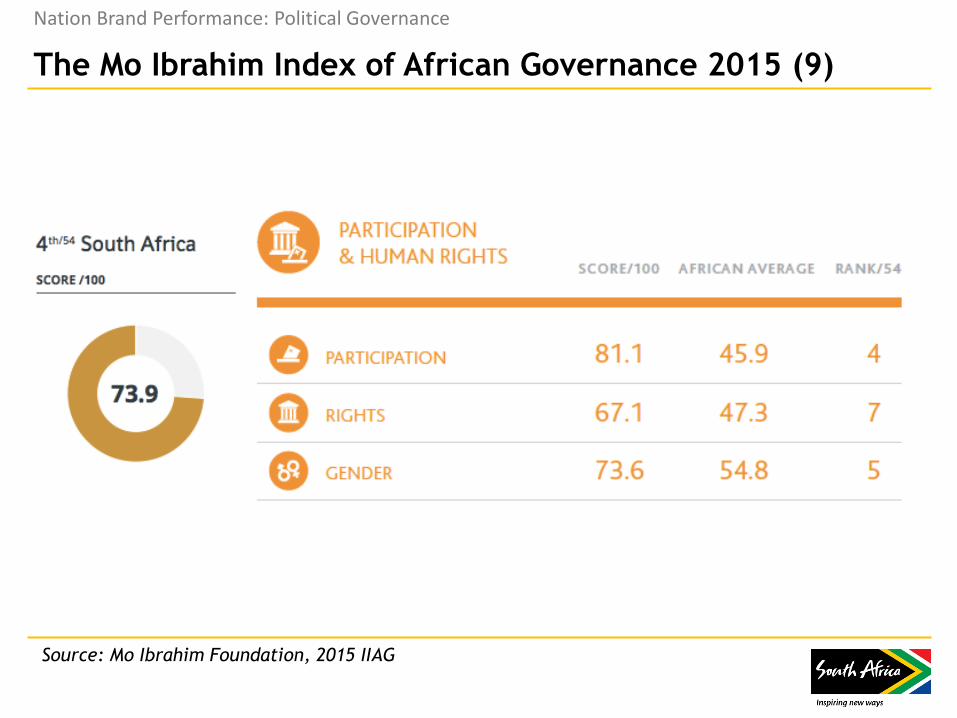
The Mo Ibrahim Index of African Governance 2015 (9)
Nation Brand Performance: Political Governance
CORPORATE & ECONOMIC
GOVERNANCE
Nation Brand Performance
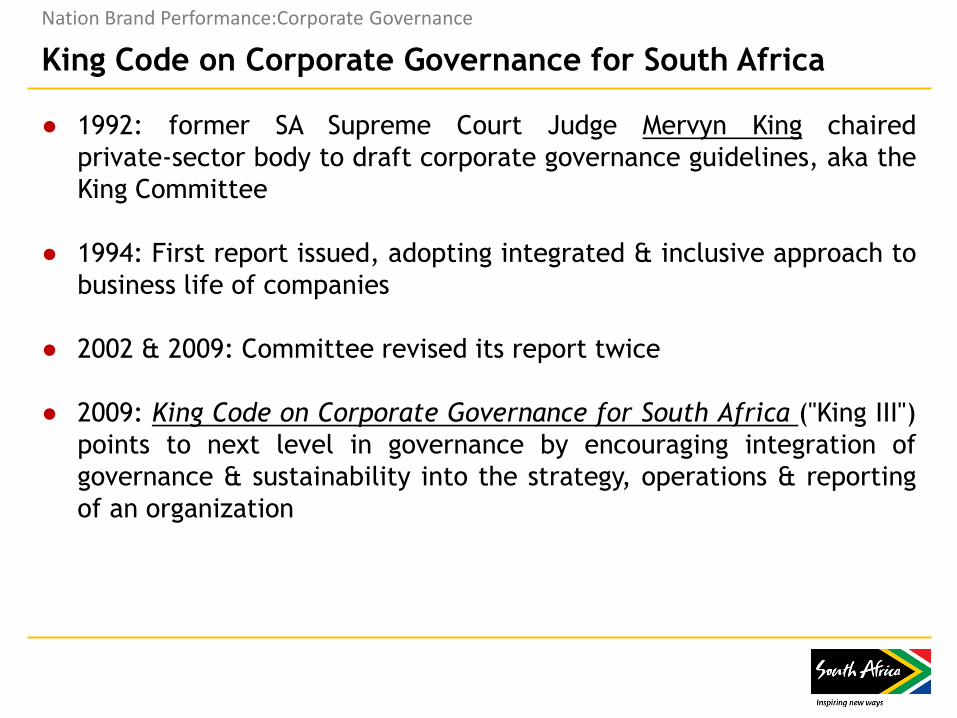
King Code on Corporate Governance for South Africa
● 1992: former SA Supreme Court Judge Mervyn King chaired
private‐sector body to draft corporate governance guidelines, aka the
King Committee
● 1994: First report issued, adopting integrated & inclusive approach to
business life of companies
● 2002 & 2009: Committee revised its report twice
● 2009: King Code on Corporate Governance for South Africa ("King III")
points to next level in governance by encouraging integration of
governance & sustainability into the strategy, operations & reporting
of an organization
Nation Brand Performance:Corporate Governance
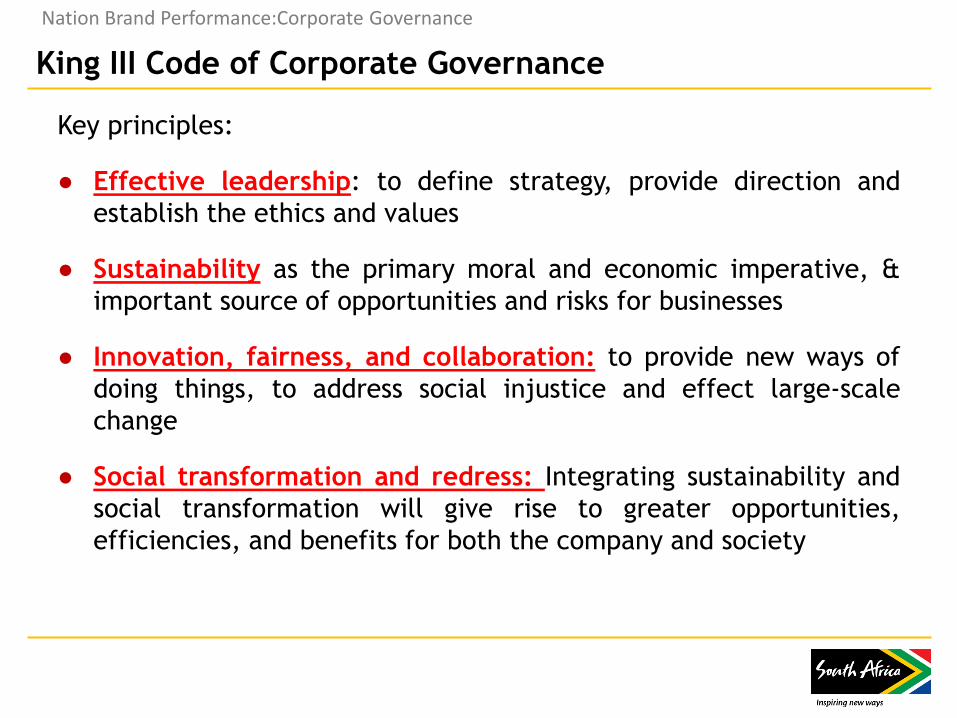
King III Code of Corporate Governance
Key principles:
● Effective leadership: to define strategy, provide direction and
establish the ethics and values
● Sustainability as the primary moral and economic imperative, &
important source of opportunities and risks for businesses
● Innovation, fairness, and collaboration: to provide new ways of
doing things, to address social injustice and effect large-scale
change
● Social transformation and redress: Integrating sustainability and
social transformation will give rise to greater opportunities,
efficiencies, and benefits for both the company and society
Nation Brand Performance:Corporate Governance
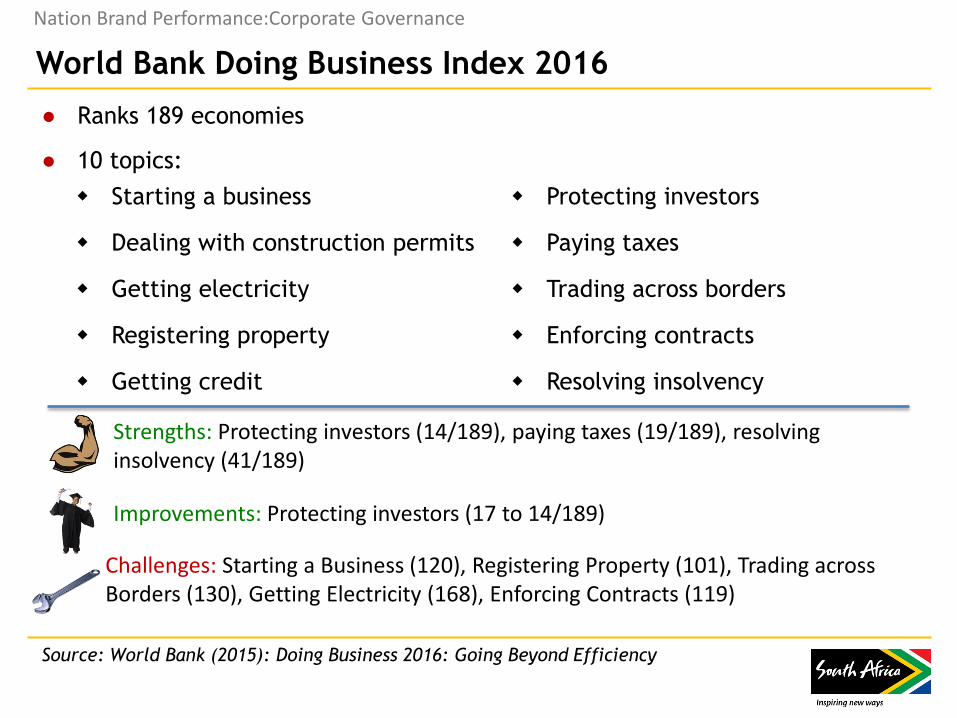
Starting a business Protecting investors
Dealing with construction permits Paying taxes
Getting electricity Trading across borders
Registering property Enforcing contracts
Getting credit Resolving insolvency
World Bank Doing Business Index 2016
● Ranks 189 economies
● 10 topics:
Nation Brand Performance:Corporate Governance
Strengths: Protecting investors (14/189), paying taxes (19/189), resolving insolvency (41/189)
Improvements: Protecting investors (17 to 14/189)
Challenges: Starting a Business (120), Registering Property (101), Trading across Borders (130), Getting Electricity (168), Enforcing Contracts (119)
Source: World Bank (2015): Doing Business 2016: Going Beyond Efficiency
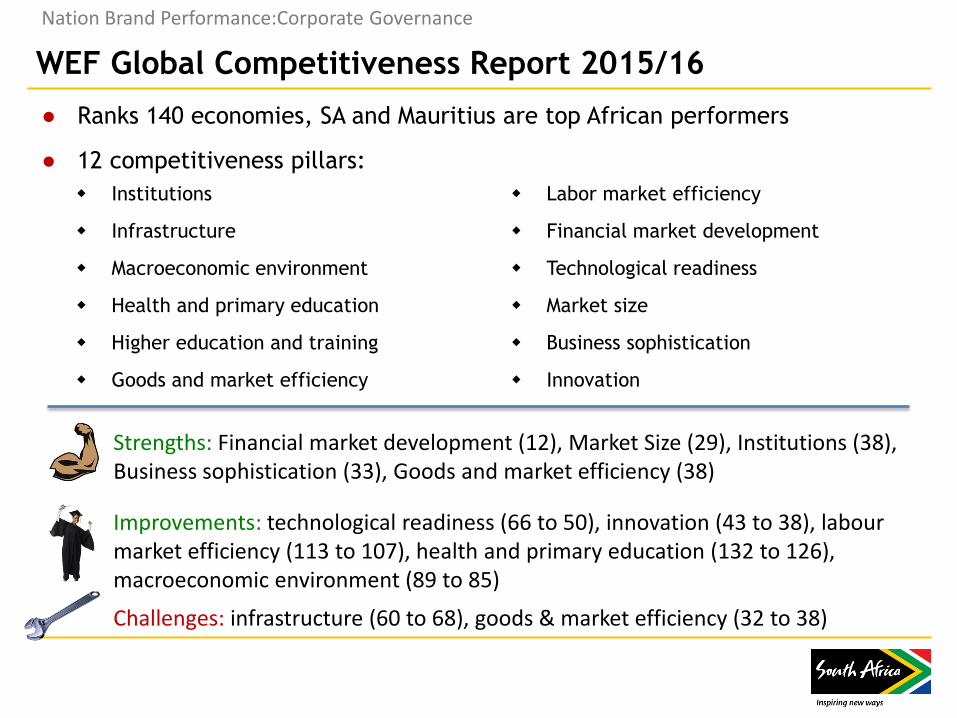
WEF Global Competitiveness Report 2015/16
Nation Brand Performance:Corporate Governance
● Ranks 140 economies, SA and Mauritius are top African performers
● 12 competitiveness pillars:
Institutions Labor market efficiency
Infrastructure Financial market development
Macroeconomic environment Technological readiness
Health and primary education Market size
Higher education and training Business sophistication
Goods and market efficiency Innovation
Strengths: Financial market development (12), Market Size (29), Institutions (38), Business sophistication (33), Goods and market efficiency (38)
Improvements: technological readiness (66 to 50), innovation (43 to 38), labour market efficiency (113 to 107), health and primary education (132 to 126), macroeconomic environment (89 to 85)
Challenges: infrastructure (60 to 68), goods & market efficiency (32 to 38)
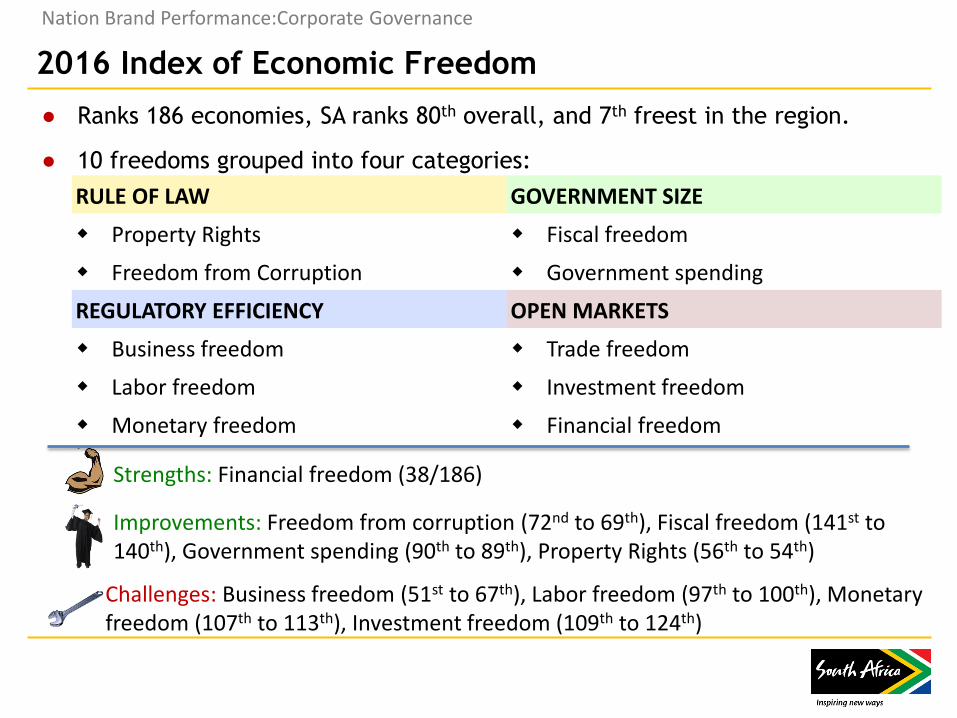
2016 Index of Economic Freedom
Nation Brand Performance:Corporate Governance
● Ranks 186 economies, SA ranks 80th overall, and 7th freest in the region.
● 10 freedoms grouped into four categories:
RULE OF LAW GOVERNMENT SIZE
Property Rights Fiscal freedom
Freedom from Corruption Government spending
REGULATORY EFFICIENCY OPEN MARKETS
Business freedom Trade freedom
Labor freedom Investment freedom
Monetary freedom Financial freedom
Strengths: Financial freedom (38/186)
Improvements: Freedom from corruption (72nd to 69th), Fiscal freedom (141st to 140th), Government spending (90th to 89th), Property Rights (56th to 54th)
Challenges: Business freedom (51st to 67th), Labor freedom (97th to 100th), Monetary freedom (107th to 113th), Investment freedom (109th to 124th)
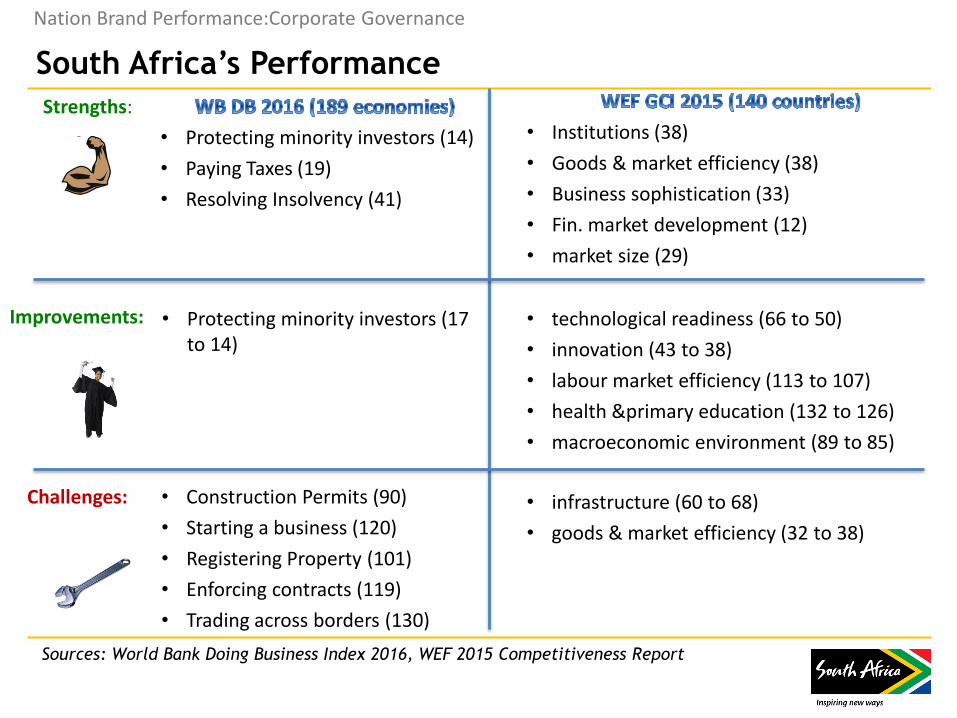
South Africa’s Performance
Nation Brand Performance:Corporate Governance
Strengths:
Improvements:
Challenges:
Sources: World Bank Doing Business Index 2016, WEF 2015 Competitiveness Report
• Protecting minority investors (14)
• Paying Taxes (19)
• Resolving Insolvency (41)
• Institutions (38)
• Goods & market efficiency (38)
• Business sophistication (33)
• Fin. market development (12)
• market size (29)
• Protecting minority investors (17 to 14)
• technological readiness (66 to 50)
• innovation (43 to 38)
• labour market efficiency (113 to 107)
• health &primary education (132 to 126)
• macroeconomic environment (89 to 85)
• Construction Permits (90)
• Starting a business (120)
• Registering Property (101)
• Enforcing contracts (119)
• Trading across borders (130)
• infrastructure (60 to 68)
• goods & market efficiency (32 to 38)
TOP 10 COUNTRIES VS SOUTH
AFRICA
World Bank Doing Business Index 2016
0
20
40
60
80
100
120
140
160
180
Ease of DoingBusiness Rank
Starting a Business
Dealing withConstruction Permits
Getting Electricity
Registering aProperty
Getting CreditProtecting Minority
Investors
Paying Taxes
Trading AcrossBorders
Enforcing Contracts
Resolving Insolvency
Singapore
South Africa
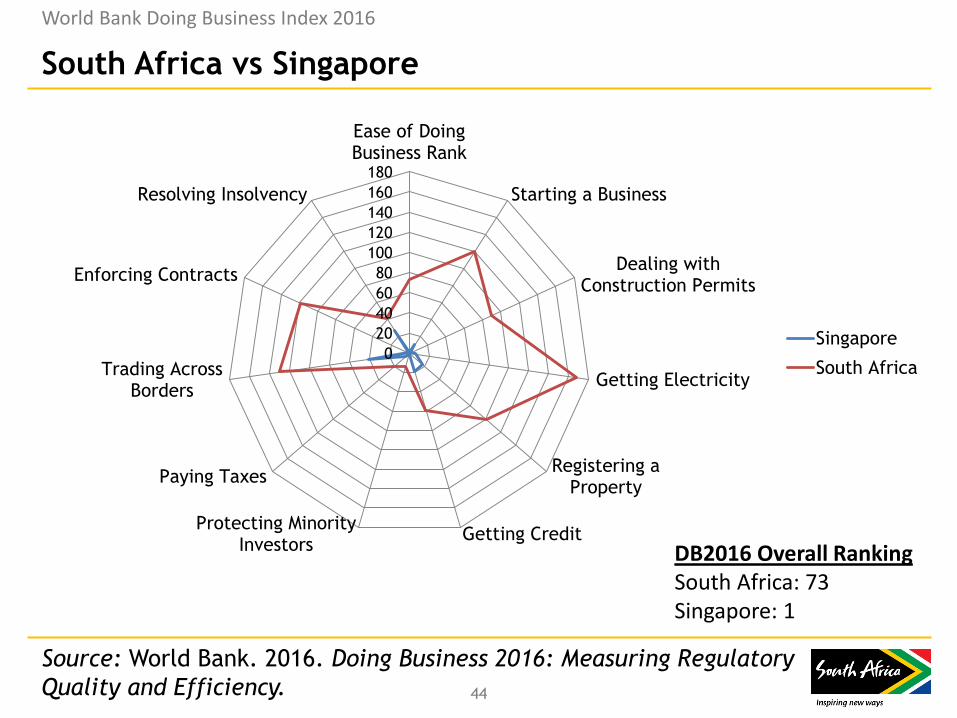
South Africa vs Singapore
44
DB2016 Overall Ranking South Africa: 73 Singapore: 1
World Bank Doing Business Index 2016
Source: World Bank. 2016. Doing Business 2016: Measuring Regulatory
Quality and Efficiency.
0
20
40
60
80
100
120
140
160
180
Ease of DoingBusiness Rank
Starting a Business
Dealing withConstruction Permits
Getting Electricity
Registering aProperty
Getting CreditProtecting Minority
Investors
Paying Taxes
Trading AcrossBorders
Enforcing Contracts
Resolving Insolvency
New Zealand
South Africa
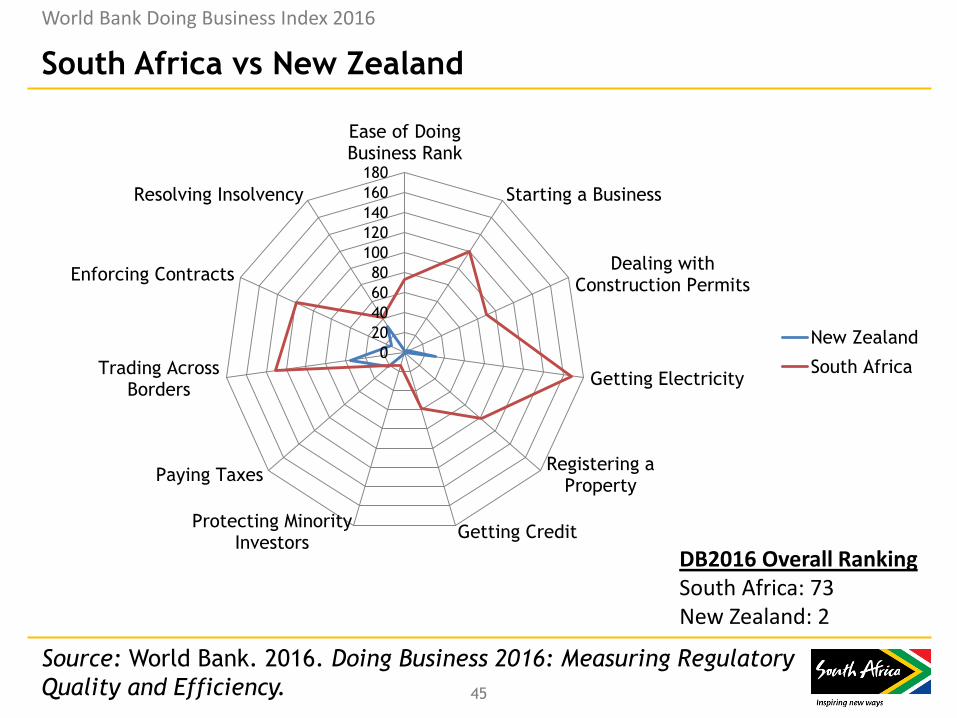
South Africa vs New Zealand
45
DB2016 Overall Ranking South Africa: 73 New Zealand: 2
World Bank Doing Business Index 2016
Source: World Bank. 2016. Doing Business 2016: Measuring Regulatory
Quality and Efficiency.
0
20
40
60
80
100
120
140
160
180
Ease of DoingBusiness Rank
Starting a Business
Dealing withConstruction Permits
Getting Electricity
Registering aProperty
Getting CreditProtecting Minority
Investors
Paying Taxes
Trading AcrossBorders
Enforcing Contracts
Resolving Insolvency
Denmark
South Africa
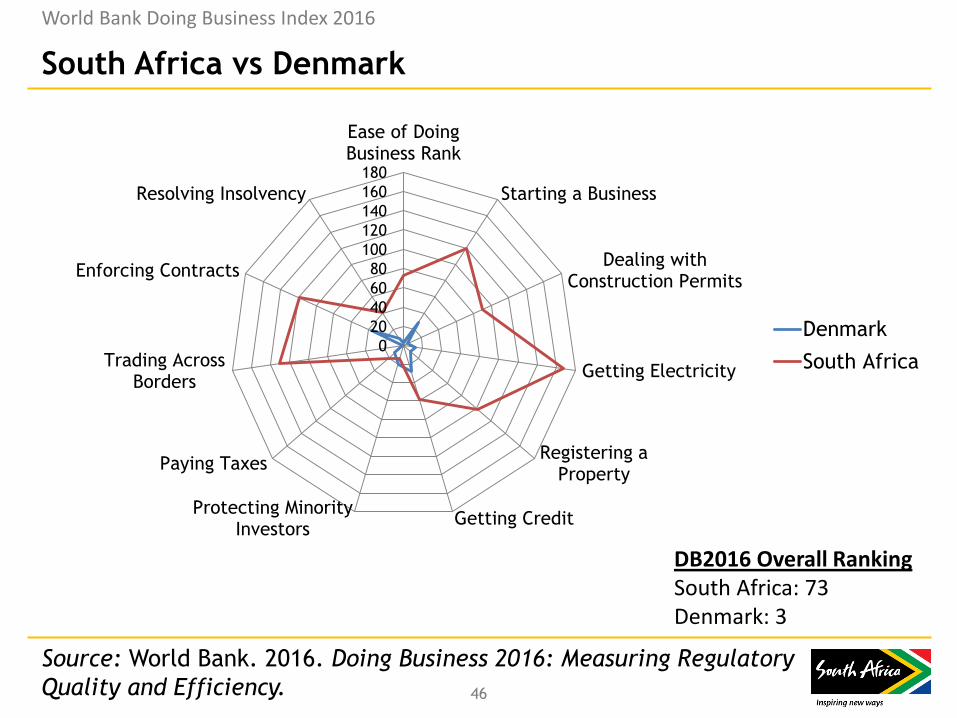
South Africa vs Denmark
46
DB2016 Overall Ranking South Africa: 73 Denmark: 3
World Bank Doing Business Index 2016
Source: World Bank. 2016. Doing Business 2016: Measuring Regulatory
Quality and Efficiency.
0
20
40
60
80
100
120
140
160
180
Ease of DoingBusiness Rank
Starting a Business
Dealing withConstruction Permits
Getting Electricity
Registering aProperty
Getting CreditProtecting Minority
Investors
Paying Taxes
Trading AcrossBorders
Enforcing Contracts
Resolving Insolvency
Korea, Rep.
South Africa
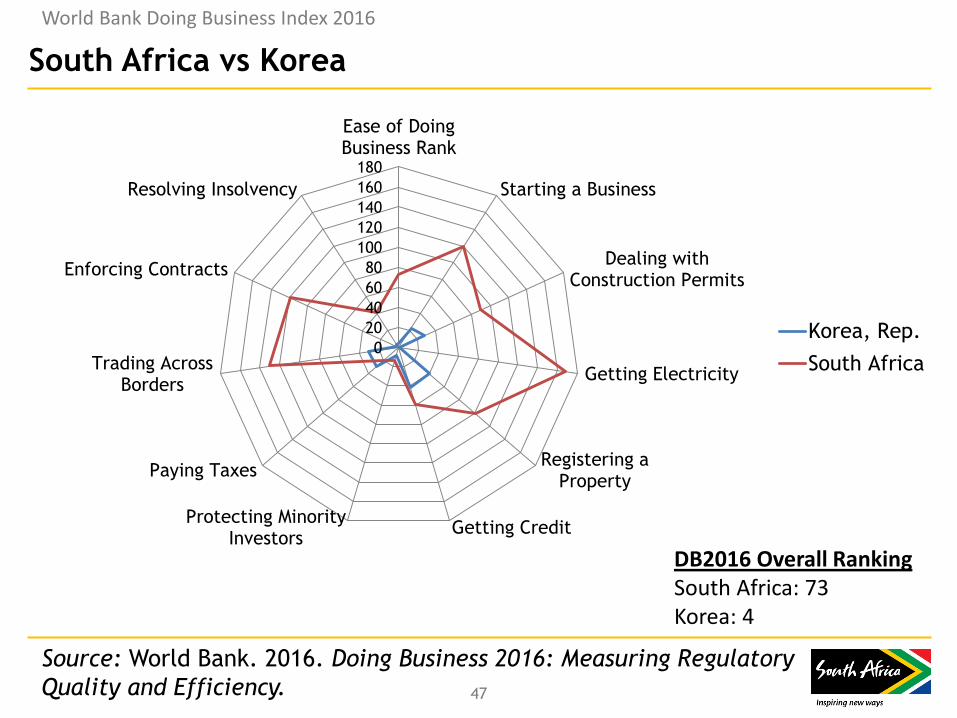
South Africa vs Korea
47
DB2016 Overall Ranking South Africa: 73 Korea: 4
World Bank Doing Business Index 2016
Source: World Bank. 2016. Doing Business 2016: Measuring Regulatory
Quality and Efficiency.
020406080
100120140160180
Ease of DoingBusiness Rank
Starting a Business
Dealing withConstruction
Permits
Getting Electricity
Registering aProperty
Getting CreditProtecting
Minority Investors
Paying Taxes
Trading AcrossBorders
EnforcingContracts
ResolvingInsolvency
Hong Kong SAR, China
South Africa
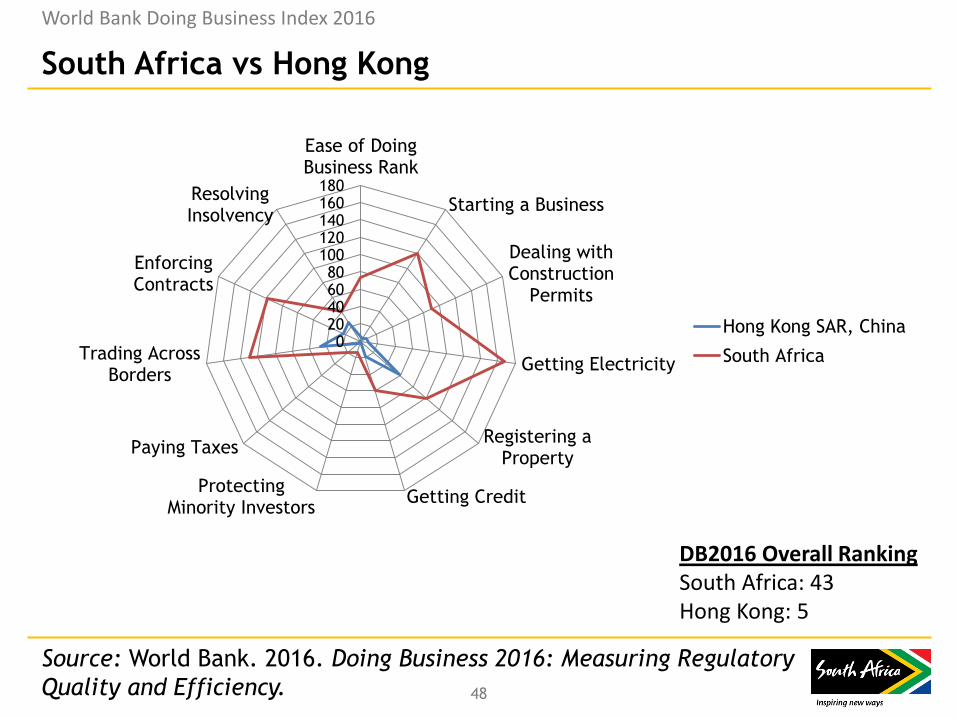
South Africa vs Hong Kong
48
DB2016 Overall Ranking South Africa: 43 Hong Kong: 5
World Bank Doing Business Index 2016
Source: World Bank. 2016. Doing Business 2016: Measuring Regulatory
Quality and Efficiency.
SA INBOUND & OUTBOUND
INVESTMENT PROFILE
Nation Brand Performance
Inbound Investment
Director-General of the Department of Trade & Industry – Mr Lionel
October
● Investment is the most reliable predictor of future economic
growth.
● The fastest growing developing countries have Gross Domestic
Fixed Investment (GDFI) to Gross Domestic Product (GDP) ratios of
above 30% while SA’s is around 20% against the NDP target of 30%.
● At the aggregate level, the challenge South Africa faces is that
private-sector investment is not growing fast enough to grow the
economy by 5%.
SA Investment Profile
Global FDI flow indicators on SA: Inbound
EY Africa Attractiveness Survey 2015
● SA is the top destination for FDI projects – the country attracted 121 projects
in 2014
– SA was the favourite destination for Chinese projects, securing 34.4% of total
Chinese investment on the African continent
● North Africa rebounds as inflows to Southern Africa falter: Egypt comes
second with 71 projects; Morocco comes third with 67 projects
● The above are actual greenfields investments, and does not account for flows
in the financial markets – which – if included will show that SA is the top
destination for FDI and financial market activity in Africa
● Context: Africa’s share of global FDI grew from 3.6% in 2003 to 7,7 in 2012,
and the continent more than doubled its share of global FDI flows from 7.8%
in 2013 to 17.1% in 2014
SA Investment Profile
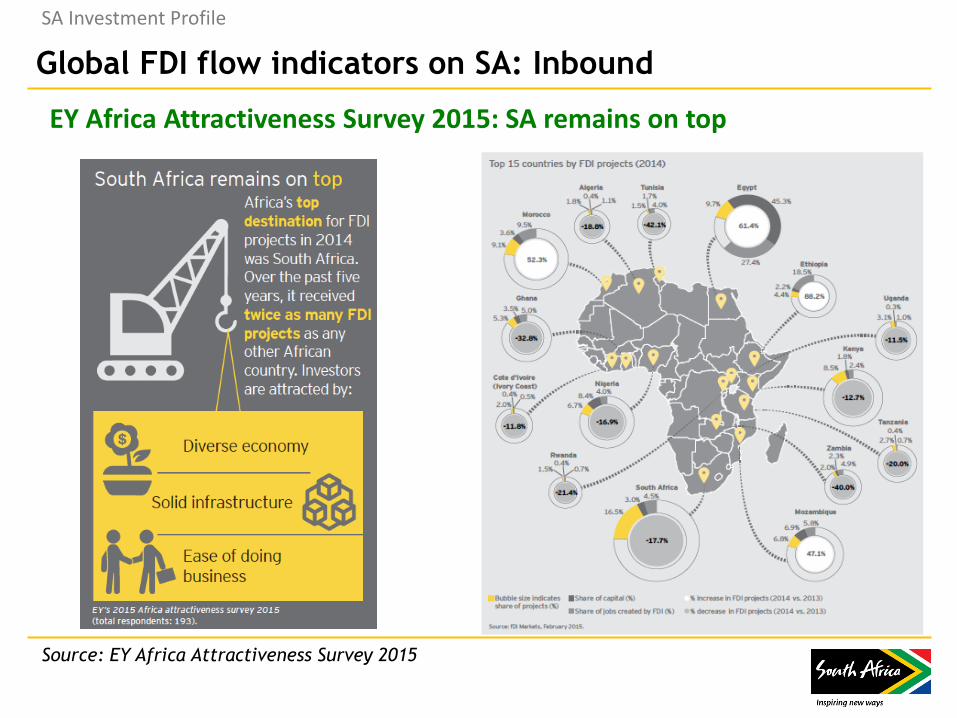
Global FDI flow indicators on SA: Inbound
SA Investment Profile
EY Africa Attractiveness Survey 2015: SA remains on top
Source: EY Africa Attractiveness Survey 2015
Outbound Investment
● 2013 budget speech of then minister of Finance, Pravin Gordhan, indicated that
during the 2008-2013 period the South African Reserve Bank approved nearly
1000 large investments by South African corporations into 36 African countries
● NDP underlines critical importance of boosting intra-African trade and
integration of regional markets
● Johannesburg Stock Exchange currently ranked the 19th largest stock exchange
in the world by market capitalisation and the largest exchange in Africa
● Industrial Development Corporation (IDC) has investments in 60 projects across
20 countries that creates a cumulative African investment portfolio of R7.5
billion by March 2014
● With so many SA and multinational corporates that operate from Joburg into
other African markets, the city’s logistical, air, inland port, and related soft
infrastructure provides a solid base for corporates to establish regional
headquarters
SA Investment Profile
Global FDI flow indicators on SA: Outbound
EY – Africa Attractiveness Survey (2015)
● South Africa is the second largest source of FDI into the African
continent (53 projects launched in 2014).
● SA is the leading intra-regional investor in the financial services
sector (16 projects launched in 2014)
SA Investment Profile
Global FDI flow indicators: Outbound
SA Investment Profile
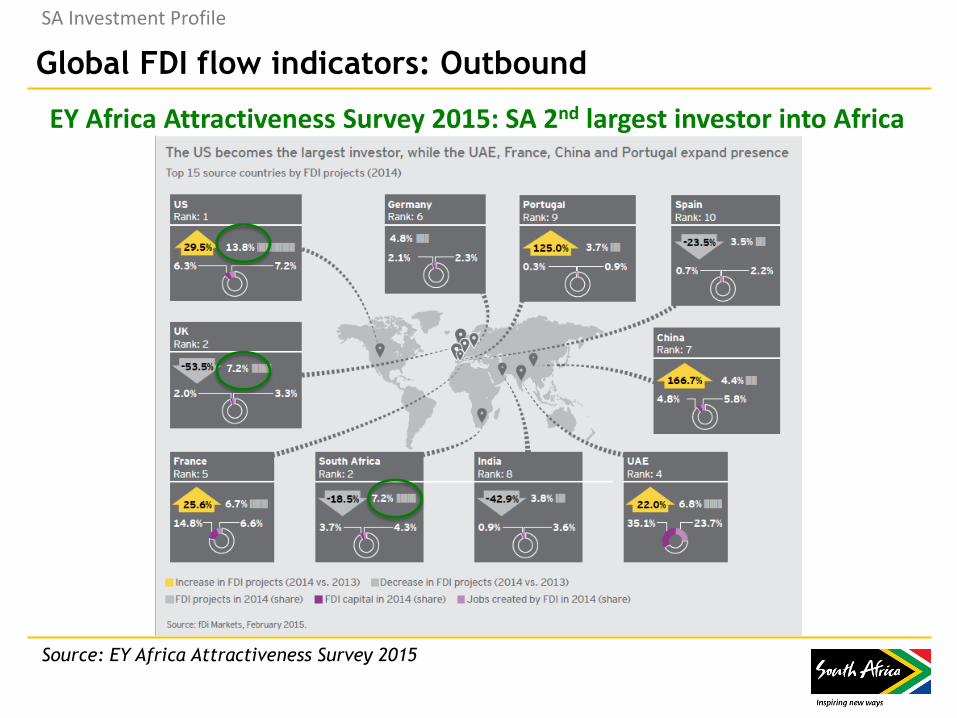
EY Africa Attractiveness Survey 2015: SA 2nd largest investor into Africa
Source: EY Africa Attractiveness Survey 2015
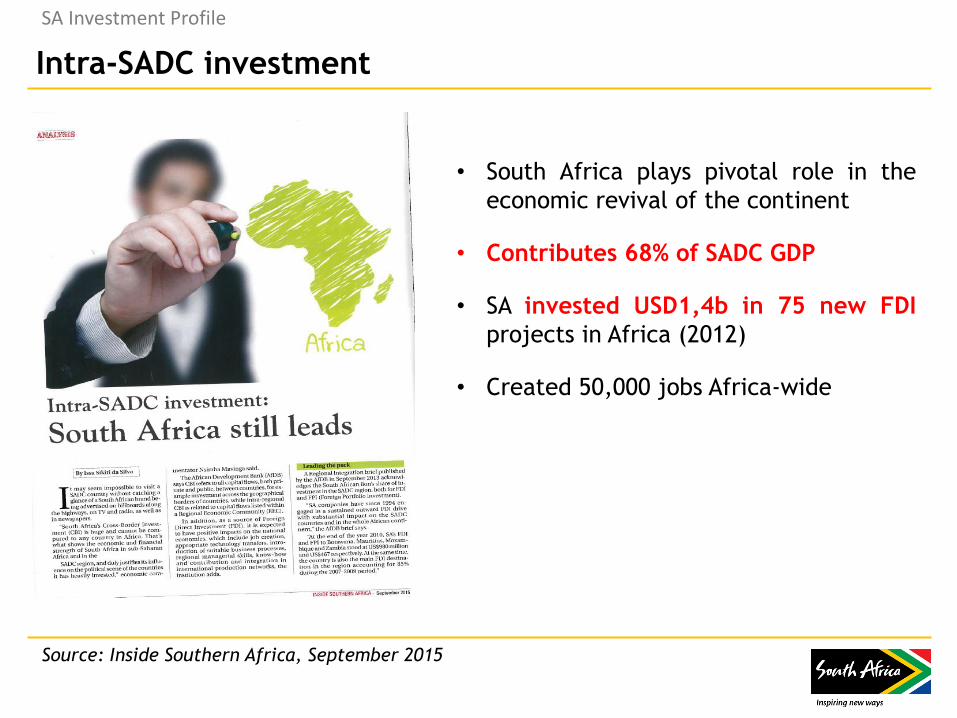
Intra-SADC investment
SA Investment Profile
• South Africa plays pivotal role in the
economic revival of the continent
• Contributes 68% of SADC GDP
• SA invested USD1,4b in 75 new FDI
projects in Africa (2012)
• Created 50,000 jobs Africa-wide
Source: Inside Southern Africa, September 2015
Department of Trade and Industry
● Department of Trade & Industry FDI trend data:
– Gross Domestic Fixed Investment has been growing steadily since the
Global Financial Crisis.
– FDI in 2013 was boosted by the R20bn Barclays investment.
– Latest FDI data show that SA attracted over R140bn in 2013-14.
– Global FDI fell by 16% in 2014.
– SA FDI inflows also slowed in 2014 but remain at a level almost double
the level of FDI in 2012.
● SA FDI performance is not unusual as:
– many multinationals already operate in SA,
– we have sophisticated financial markets to raise domestic capital, and
– our FDI stock is already high by international standards (42%).
SA Investment Profile
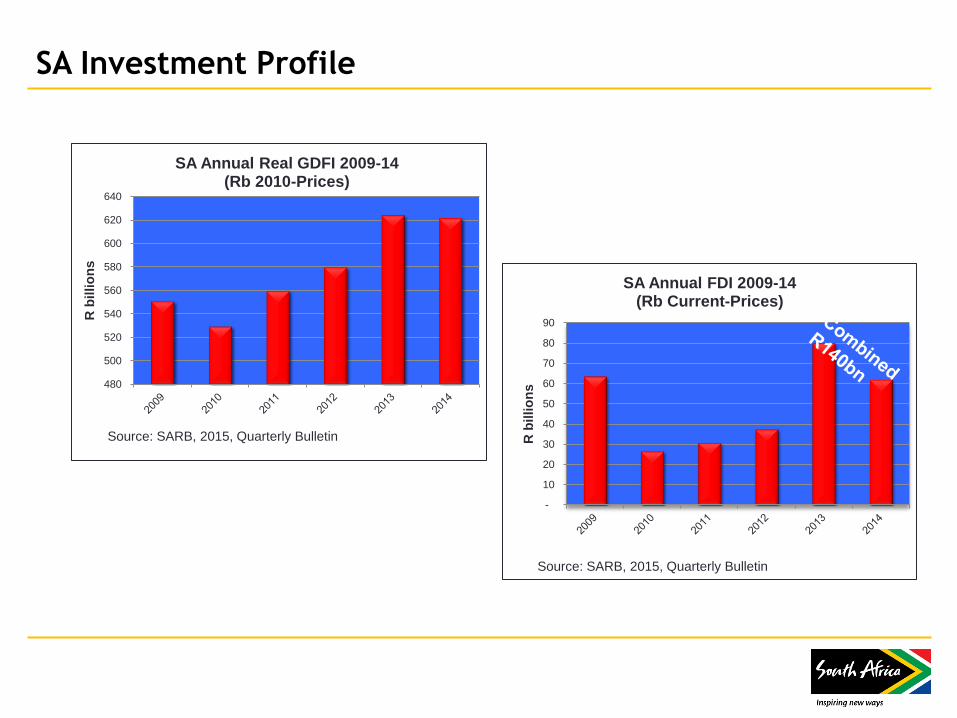
SA Investment Profile
480
500
520
540
560
580
600
620
640
R b
illio
ns
SA Annual Real GDFI 2009-14 (Rb 2010-Prices)
Source: SARB, 2015, Quarterly Bulletin
-
10
20
30
40
50
60
70
80
90
R b
illio
ns
SA Annual FDI 2009-14 (Rb Current-Prices)
Source: SARB, 2015, Quarterly Bulletin
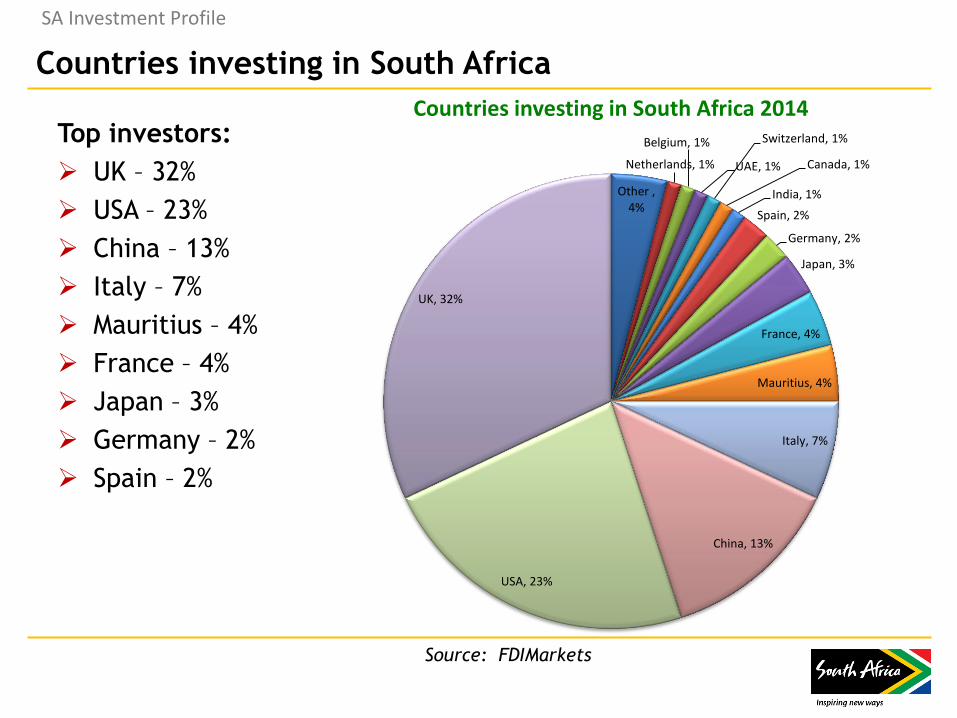
Countries investing in South Africa
Top investors:
UK – 32%
USA – 23%
China – 13%
Italy – 7%
Mauritius – 4%
France – 4%
Japan – 3%
Germany – 2%
Spain – 2%
Other , 4%
Netherlands, 1%
Belgium, 1%
UAE, 1%
Switzerland, 1%
Canada, 1%
India, 1%
Spain, 2%
Germany, 2%
Japan, 3%
France, 4%
Mauritius, 4%
Italy, 7%
China, 13%
USA, 23%
UK, 32%
Countries investing in South Africa 2014
SA Investment Profile
Source: FDIMarkets
DTI’s National Initiative: One Stop Investment Centre (1)
● DTI working on implementing this national initiative
● Gauteng Growth and Development Agency’s successful One Stop Shop at
GIC, Sandton (government services represented e.g. SARS, Home Affairs)
● National centre: central operational structure to act as implementing body
and serve as convener for one stop investment centre
● Will improve investment climate and ease of doing business by identifying
bottlenecks, administrative barriers & have plan of action to improve
service delivery
● Focus: reducing regulatory inefficiencies, setting up norms and standards,
turnaround times, coordinate, fast track, unblock and reduce red tape for
all investors
SA Investment Profile
DTI’s National Initiative: One Stop Investment Centre (2)
● Will coordinate One Stop Investment Centres in SEZ’s; the work of the
Provincial Investment Agencies; local authorities; & relevant government
departments involved in regulatory, registration, permits & licensing
● Council to identify and resolve policy blockages regarding investment &
business and escalate to technical and executive implementation forums if
need be
● Will provide for Investors:
– Facilitation of entire investment value chain;
– Specialist advisory services to investors;
– Co-ordination between various line ministries;
– Communication of these services to potential investors; and
– Be the single-window clearance for registration, licensing and permits
SA Investment Profile
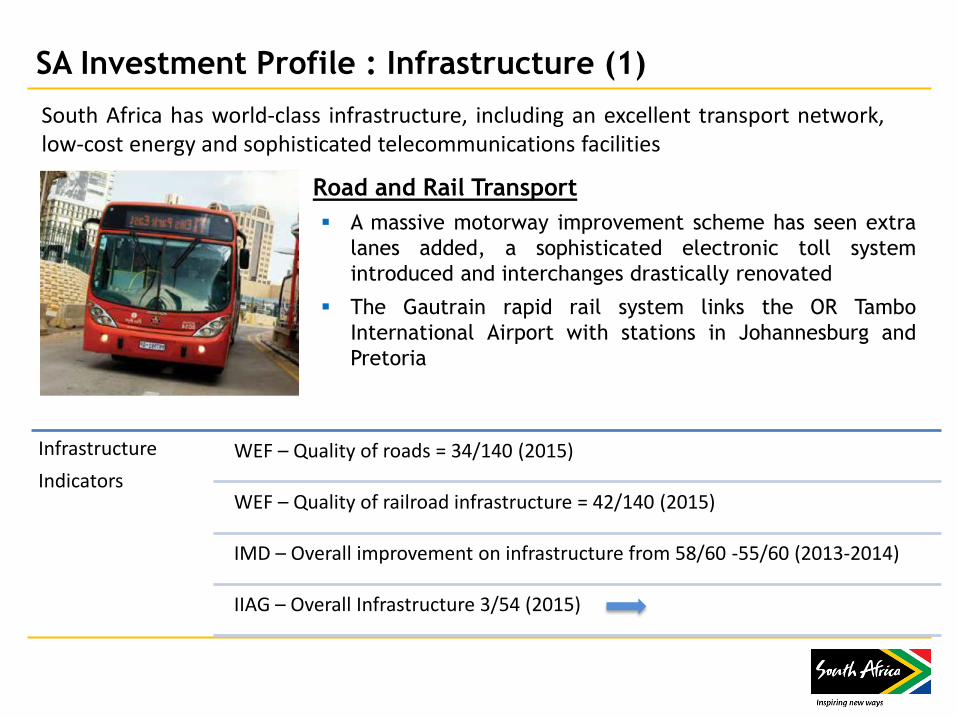
SA Investment Profile : Infrastructure (1)
Road and Rail Transport
A massive motorway improvement scheme has seen extra
lanes added, a sophisticated electronic toll system
introduced and interchanges drastically renovated
The Gautrain rapid rail system links the OR Tambo
International Airport with stations in Johannesburg and
Pretoria
South Africa has world-class infrastructure, including an excellent transport network, low-cost energy and sophisticated telecommunications facilities
Infrastructure
Indicators
WEF – Quality of roads = 34/140 (2015)
WEF – Quality of railroad infrastructure = 42/140 (2015)
IMD – Overall improvement on infrastructure from 58/60 -55/60 (2013-2014)
IIAG – Overall Infrastructure 3/54 (2015)
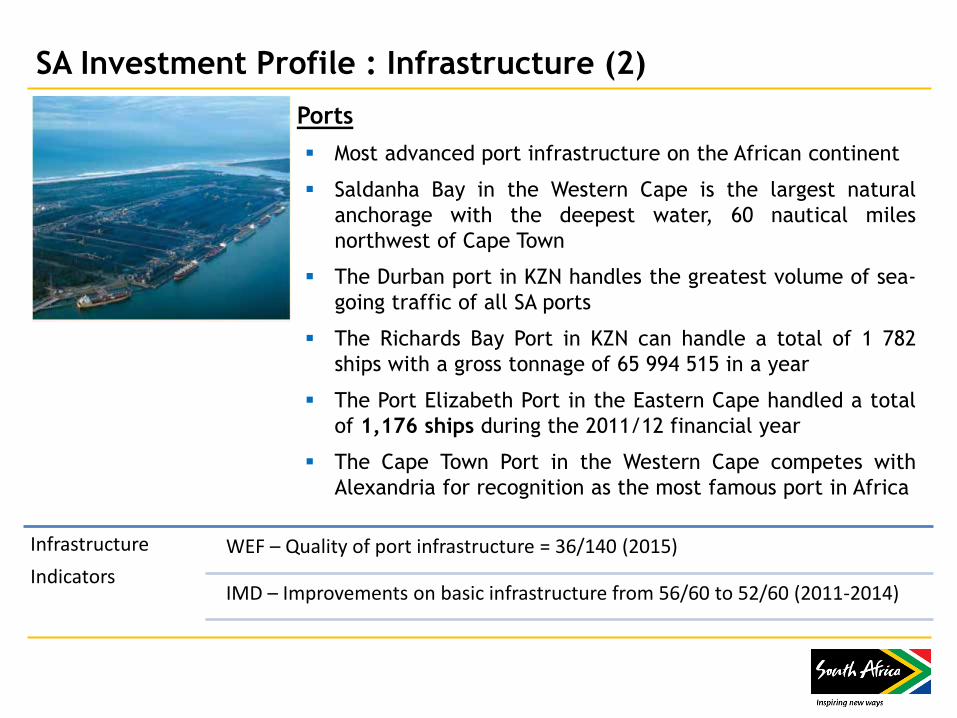
SA Investment Profile : Infrastructure (2)
Ports
Most advanced port infrastructure on the African continent
Saldanha Bay in the Western Cape is the largest natural
anchorage with the deepest water, 60 nautical miles
northwest of Cape Town
The Durban port in KZN handles the greatest volume of sea-
going traffic of all SA ports
The Richards Bay Port in KZN can handle a total of 1 782
ships with a gross tonnage of 65 994 515 in a year
The Port Elizabeth Port in the Eastern Cape handled a total
of 1,176 ships during the 2011/12 financial year
The Cape Town Port in the Western Cape competes with
Alexandria for recognition as the most famous port in Africa
Infrastructure
Indicators
WEF – Quality of port infrastructure = 36/140 (2015)
IMD – Improvements on basic infrastructure from 56/60 to 52/60 (2011-2014)
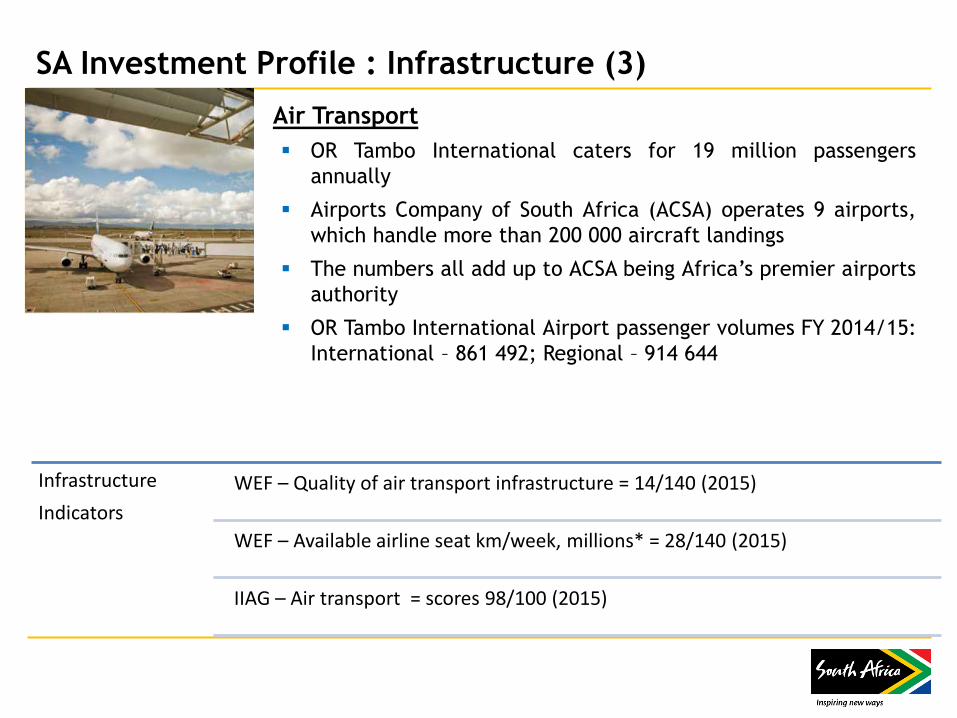
SA Investment Profile : Infrastructure (3)
Air Transport
OR Tambo International caters for 19 million passengers
annually
Airports Company of South Africa (ACSA) operates 9 airports,
which handle more than 200 000 aircraft landings
The numbers all add up to ACSA being Africa’s premier airports
authority
OR Tambo International Airport passenger volumes FY 2014/15:
International – 861 492; Regional – 914 644
Infrastructure
Indicators
WEF – Quality of air transport infrastructure = 14/140 (2015)
WEF – Available airline seat km/week, millions* = 28/140 (2015)
IIAG – Air transport = scores 98/100 (2015)
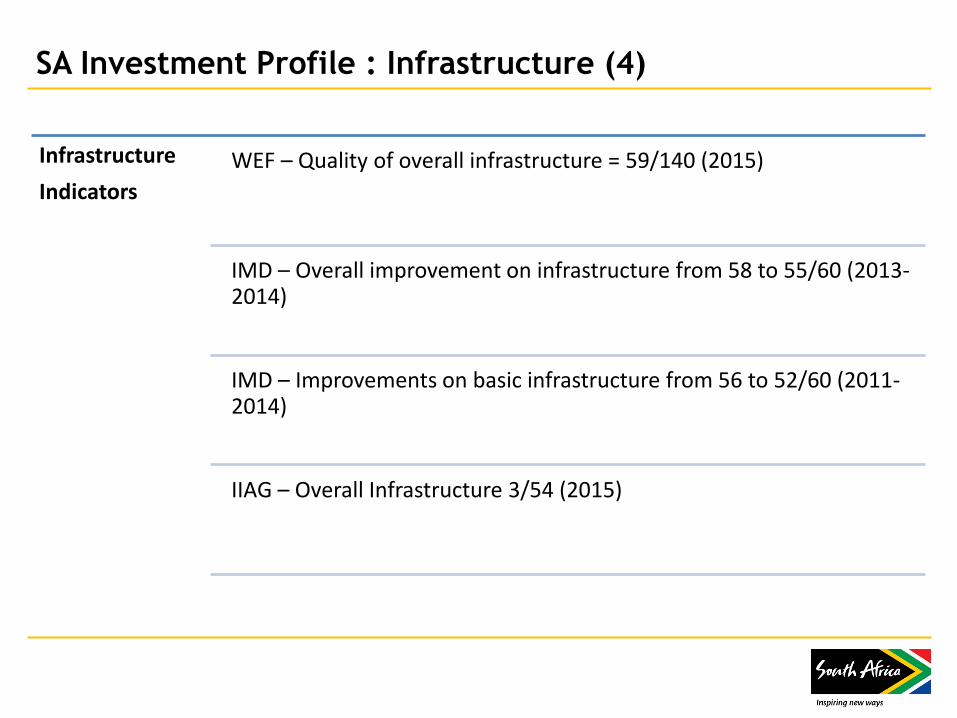
SA Investment Profile : Infrastructure (4)
Infrastructure
Indicators
WEF – Quality of overall infrastructure = 59/140 (2015)
IMD – Overall improvement on infrastructure from 58 to 55/60 (2013-2014)
IMD – Improvements on basic infrastructure from 56 to 52/60 (2011-2014)
IIAG – Overall Infrastructure 3/54 (2015)
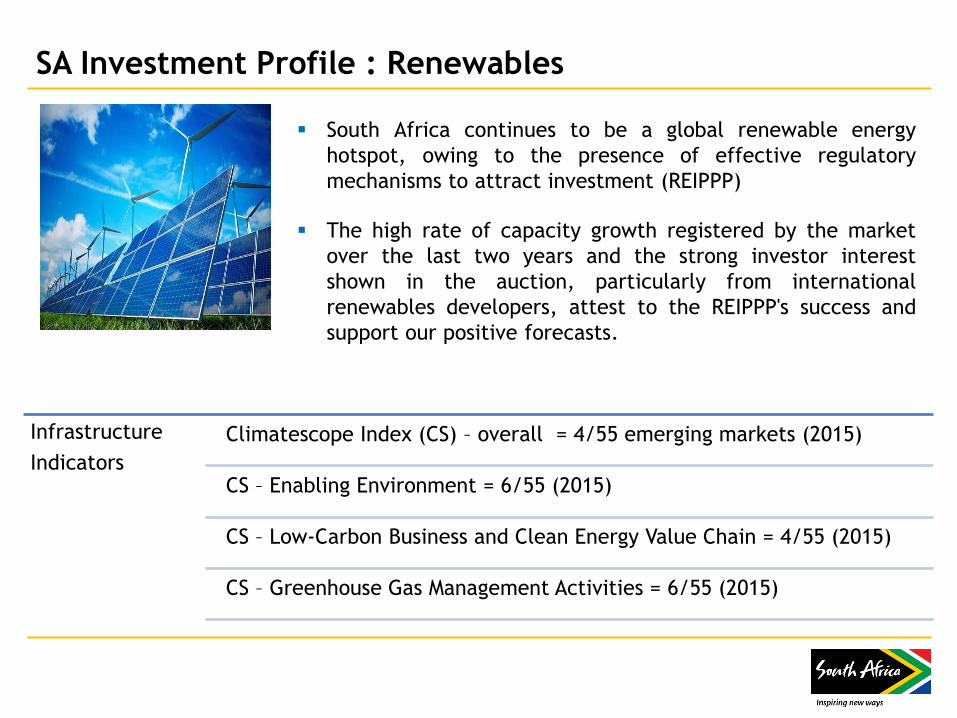
South Africa continues to be a global renewable energy
hotspot, owing to the presence of effective regulatory
mechanisms to attract investment (REIPPP)
The high rate of capacity growth registered by the market
over the last two years and the strong investor interest
shown in the auction, particularly from international
renewables developers, attest to the REIPPP's success and
support our positive forecasts.
SA Investment Profile : Renewables
Infrastructure
Indicators
Climatescope Index (CS) – overall = 4/55 emerging markets (2015)
CS – Enabling Environment = 6/55 (2015)
CS – Low-Carbon Business and Clean Energy Value Chain = 4/55 (2015)
CS – Greenhouse Gas Management Activities = 6/55 (2015)
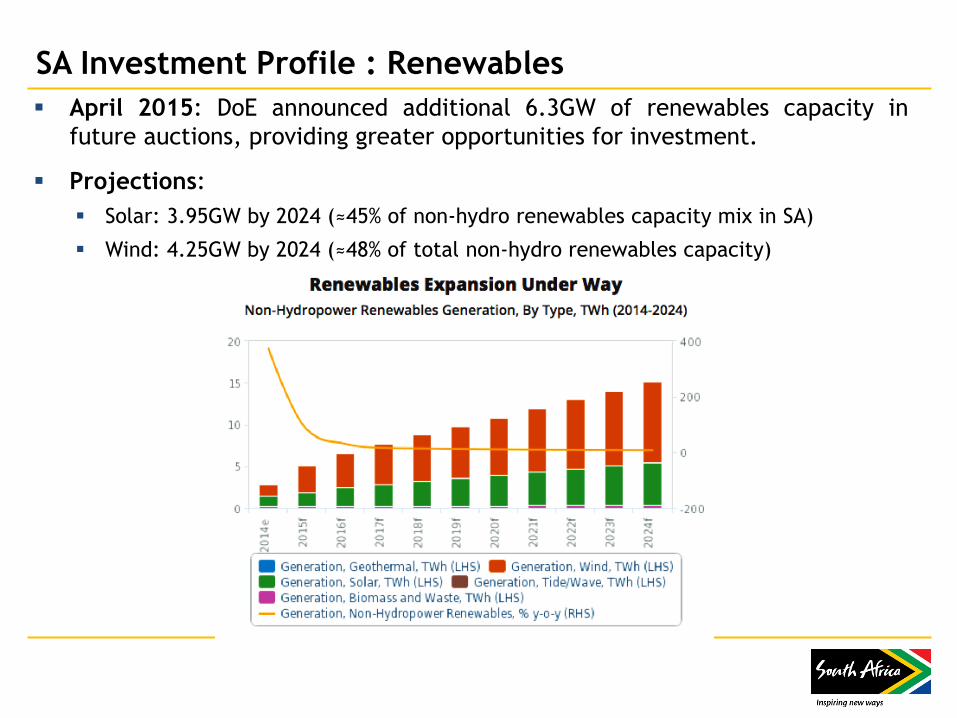
SA Investment Profile : Renewables
April 2015: DoE announced additional 6.3GW of renewables capacity in
future auctions, providing greater opportunities for investment.
Projections:
Solar: 3.95GW by 2024 (≈45% of non-hydro renewables capacity mix in SA)
Wind: 4.25GW by 2024 (≈48% of total non-hydro renewables capacity)
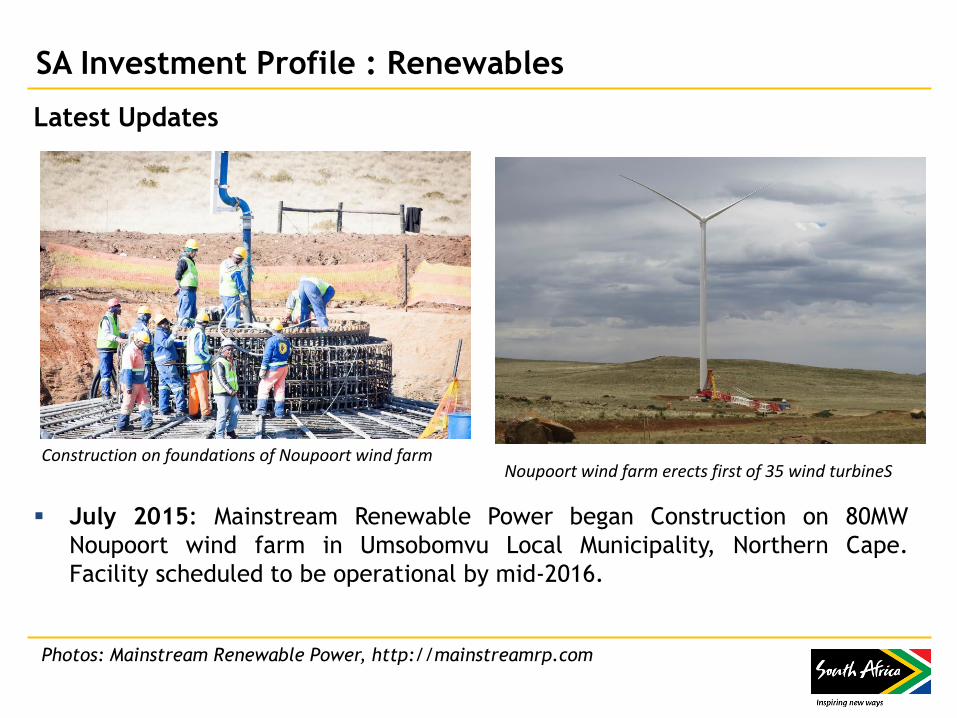
SA Investment Profile : Renewables
Latest Updates
July 2015: Mainstream Renewable Power began Construction on 80MW
Noupoort wind farm in Umsobomvu Local Municipality, Northern Cape.
Facility scheduled to be operational by mid-2016.
Construction on foundations of Noupoort wind farm Noupoort wind farm erects first of 35 wind turbineS
Photos: Mainstream Renewable Power, http://mainstreamrp.com
SA Investment Profile : Renewables
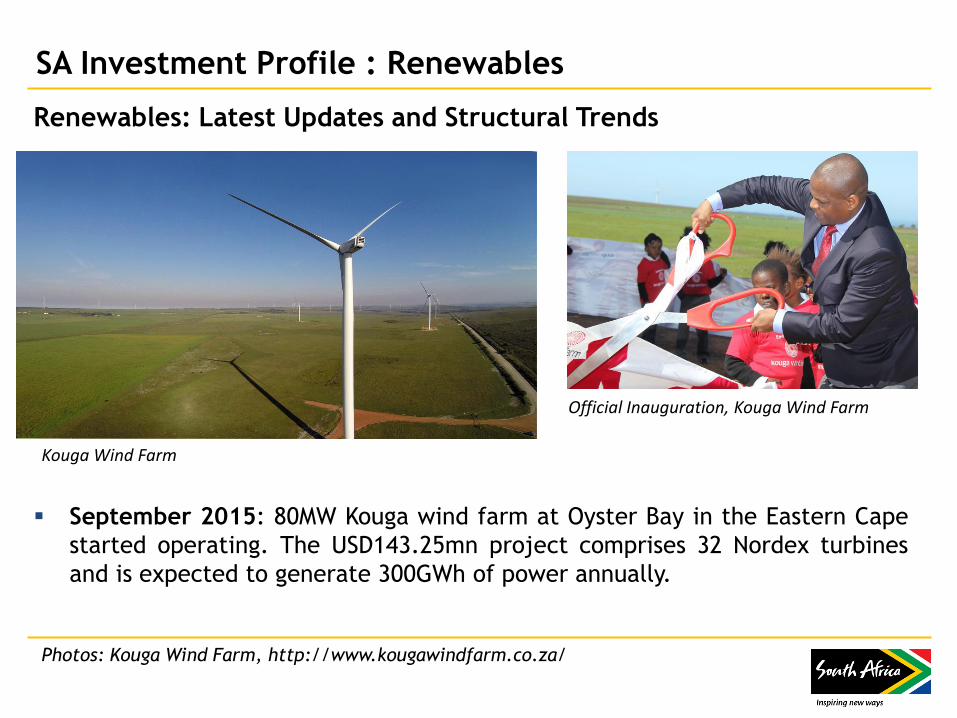
Renewables: Latest Updates and Structural Trends
September 2015: 80MW Kouga wind farm at Oyster Bay in the Eastern Cape
started operating. The USD143.25mn project comprises 32 Nordex turbines
and is expected to generate 300GWh of power annually.
Kouga Wind Farm
Official Inauguration, Kouga Wind Farm
Photos: Kouga Wind Farm, http://www.kougawindfarm.co.za/
Strengths
The REIPPP has been instrumental in mobilising investment into the
sector.
SA’s renewables industry receiving considerable support from development
banks and IFIs.
Renewable companies setting up production facilities to meet growing
demand within country and wider region.
SA Investment Profile : Renewables
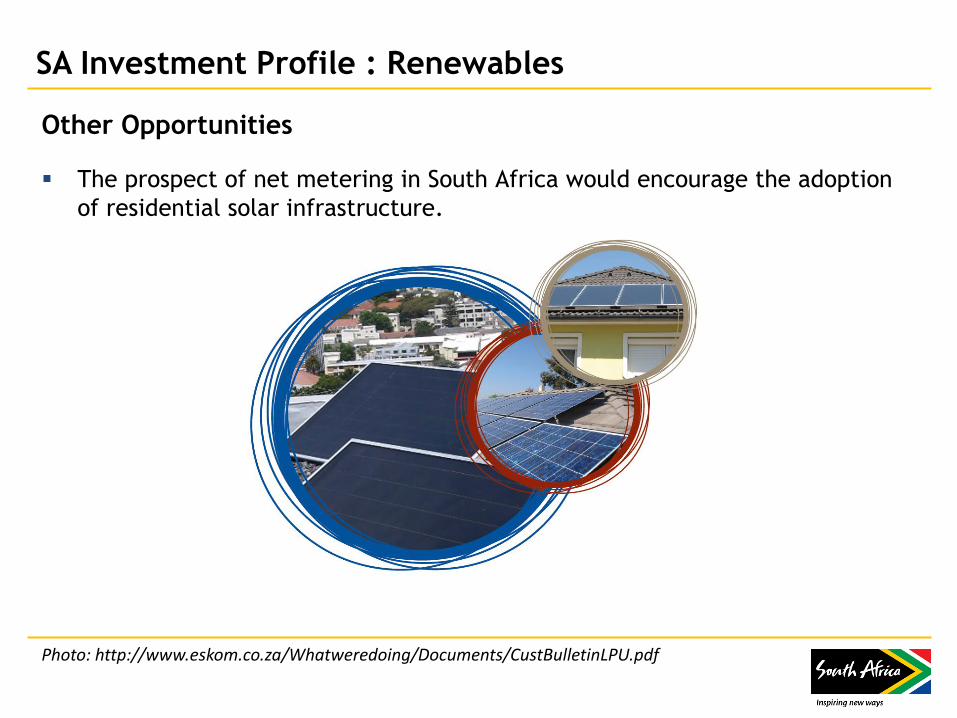
Other Opportunities
The prospect of net metering in South Africa would encourage the adoption
of residential solar infrastructure.
SA Investment Profile : Renewables
Photo: http://www.eskom.co.za/Whatweredoing/Documents/CustBulletinLPU.pdf
Other Opportunities
Interest from high-profile domestic international players remains robust
and further auctions expected to be very competitive
SA Investment Profile : Renewables
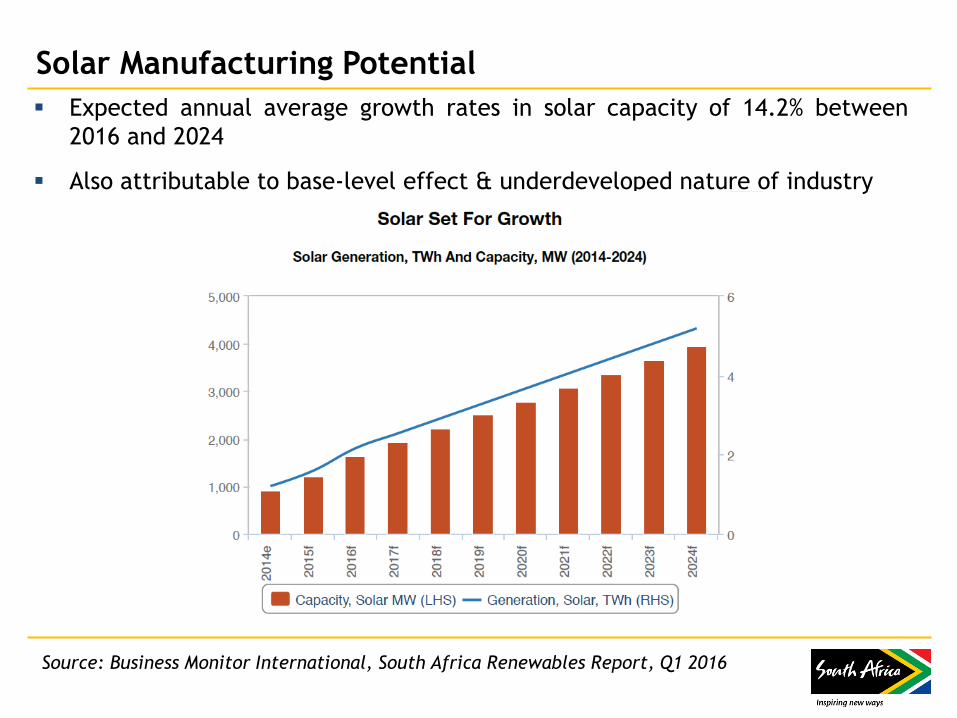
Solar Manufacturing Potential
Expected annual average growth rates in solar capacity of 14.2% between
2016 and 2024
Also attributable to base-level effect & underdeveloped nature of industry
Source: Business Monitor International, South Africa Renewables Report, Q1 2016

Solar Manufacturing Potential
SA solar industry also attracts intl manufacturers
August 2014, Chinese solar manufacturer JinkoSolar opened solar module
production factory in Cape Town (annual manufacturing capacity 120MW)
US company SunPower recently announced plans to open 160MW solar PV
factory in 2015 in Cape Town
Photo: Construction Review Online
Photo: Googlemaps
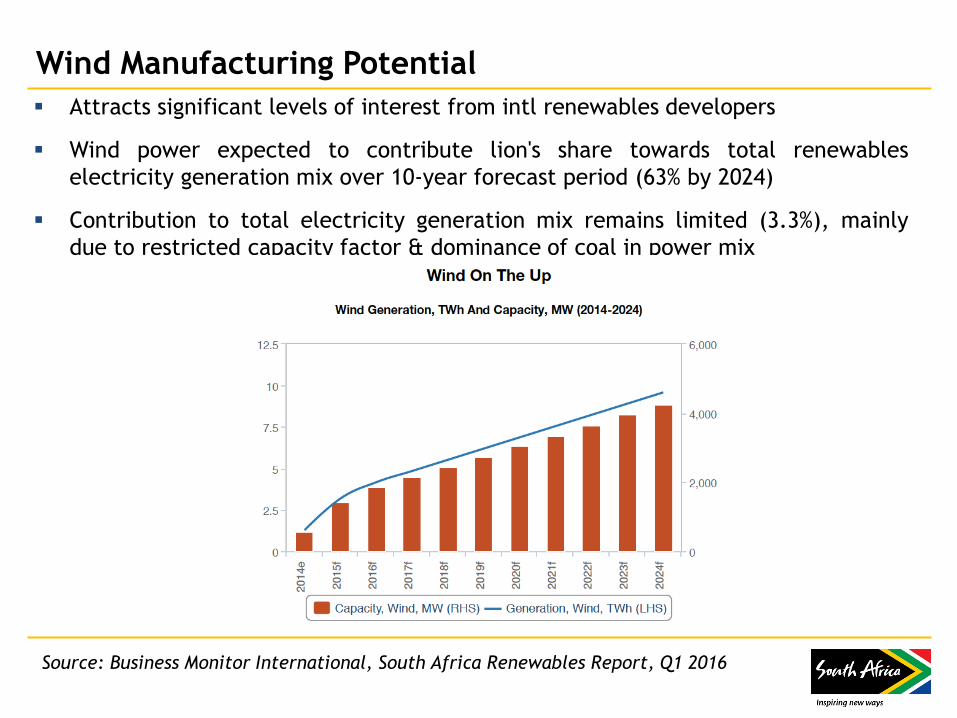
Wind Manufacturing Potential
Attracts significant levels of interest from intl renewables developers
Wind power expected to contribute lion's share towards total renewables
electricity generation mix over 10-year forecast period (63% by 2024)
Contribution to total electricity generation mix remains limited (3.3%), mainly
due to restricted capacity factor & dominance of coal in power mix
Source: Business Monitor International, South Africa Renewables Report, Q1 2016
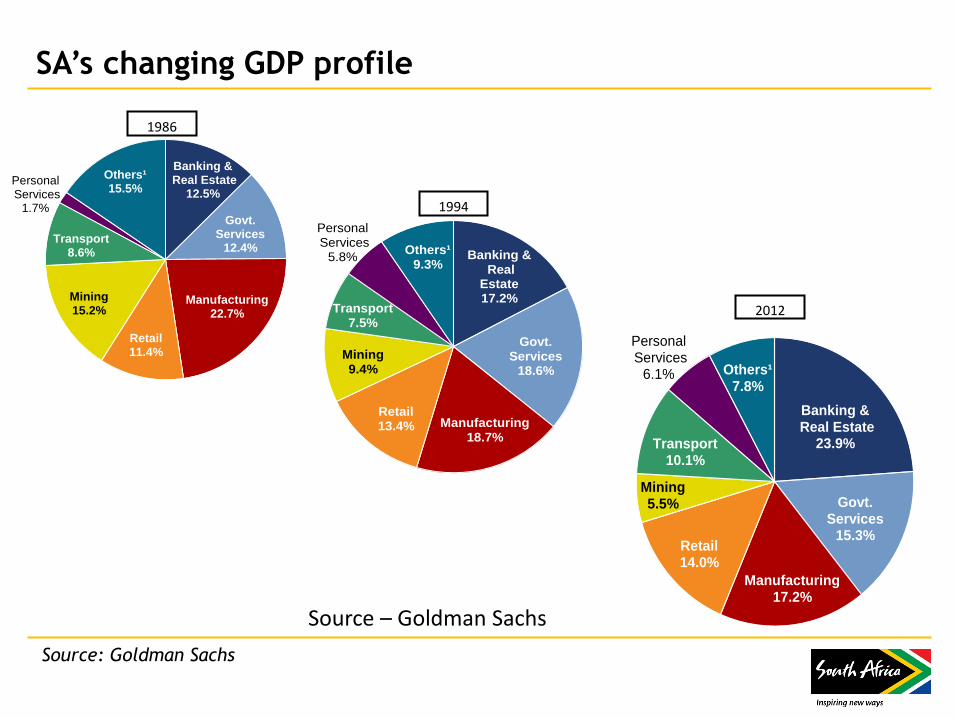
SA’s changing GDP profile
Banking &Real Estate
12.5%
Govt. Services
12.4%
Manufacturing22.7%
Retail11.4%
Mining15.2%
Transport8.6%
PersonalServices
1.7%
Others¹15.5%
Banking &Real
Estate17.2%
Govt. Services
18.6%
Manufacturing18.7%
Retail13.4%
Mining9.4%
Transport7.5%
PersonalServices
5.8%Others¹
9.3%
Banking &Real Estate
23.9%
Govt. Services
15.3%
Manufacturing17.2%
Retail14.0%
Mining5.5%
Transport10.1%
PersonalServices
6.1% Others¹7.8%
1986
1994
2012
Source – Goldman Sachs
Source: Goldman Sachs
HUMAN & SOCIAL
DEVELOPMENT INDICATORS
Nation Brand Performance
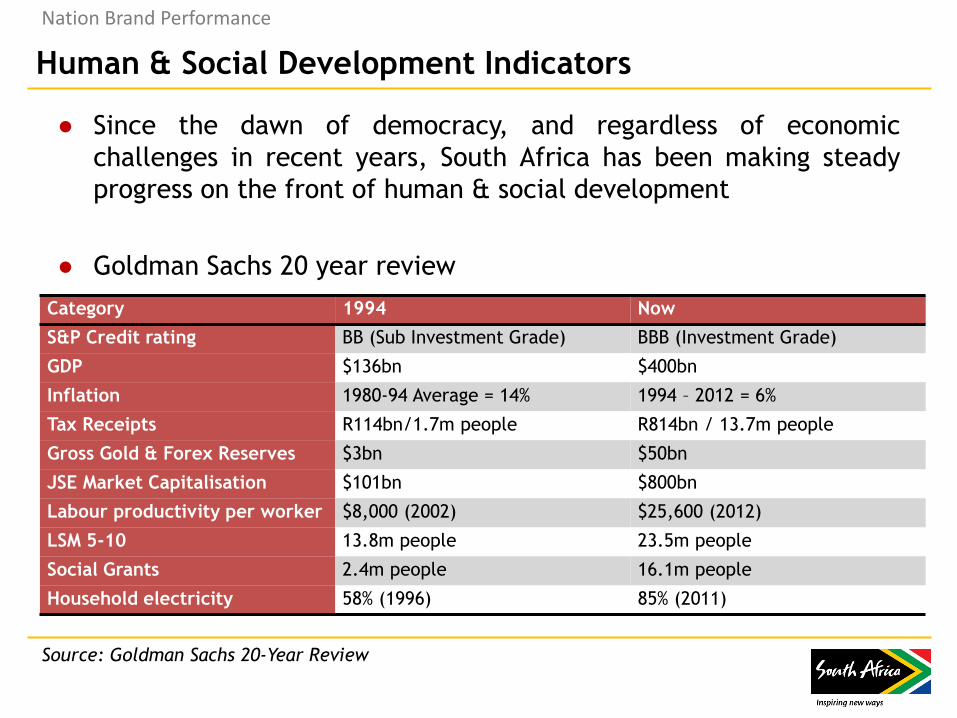
Human & Social Development Indicators
● Since the dawn of democracy, and regardless of economic
challenges in recent years, South Africa has been making steady
progress on the front of human & social development
● Goldman Sachs 20 year review
Category 1994 Now
S&P Credit rating BB (Sub Investment Grade) BBB (Investment Grade)
GDP $136bn $400bn
Inflation 1980-94 Average = 14% 1994 – 2012 = 6%
Tax Receipts R114bn/1.7m people R814bn / 13.7m people
Gross Gold & Forex Reserves $3bn $50bn
JSE Market Capitalisation $101bn $800bn
Labour productivity per worker $8,000 (2002) $25,600 (2012)
LSM 5-10 13.8m people 23.5m people
Social Grants 2.4m people 16.1m people
Household electricity 58% (1996) 85% (2011)
Nation Brand Performance
Source: Goldman Sachs 20-Year Review
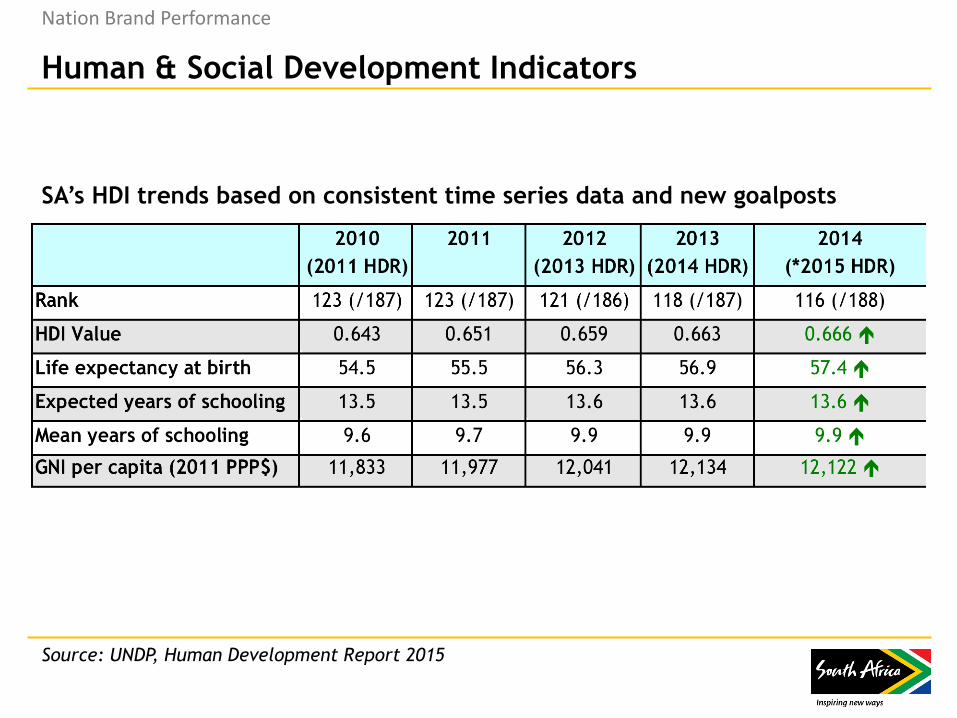
Human & Social Development Indicators
Nation Brand Performance
Source: UNDP, Human Development Report 2015
SA’s HDI trends based on consistent time series data and new goalposts
NATION BRAND INDEX
Brand Reputation
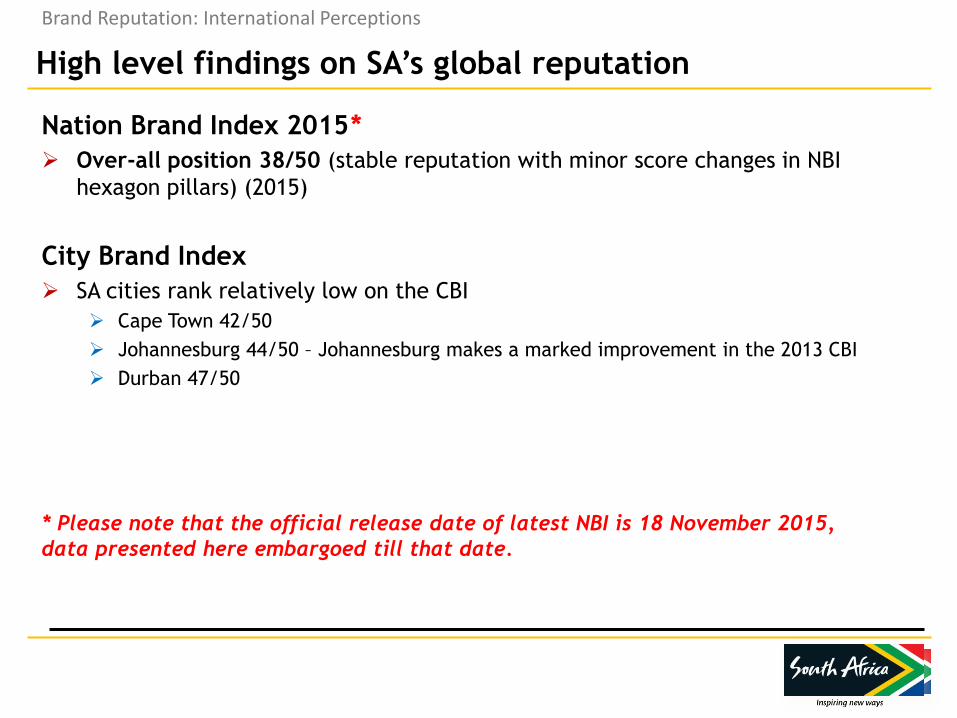
High level findings on SA’s global reputation
Nation Brand Index 2015*
Over-all position 38/50 (stable reputation with minor score changes in NBI
hexagon pillars) (2015)
City Brand Index
SA cities rank relatively low on the CBI
Cape Town 42/50
Johannesburg 44/50 – Johannesburg makes a marked improvement in the 2013 CBI
Durban 47/50
* Please note that the official release date of latest NBI is 18 November 2015,
data presented here embargoed till that date.
Brand Reputation: International Perceptions
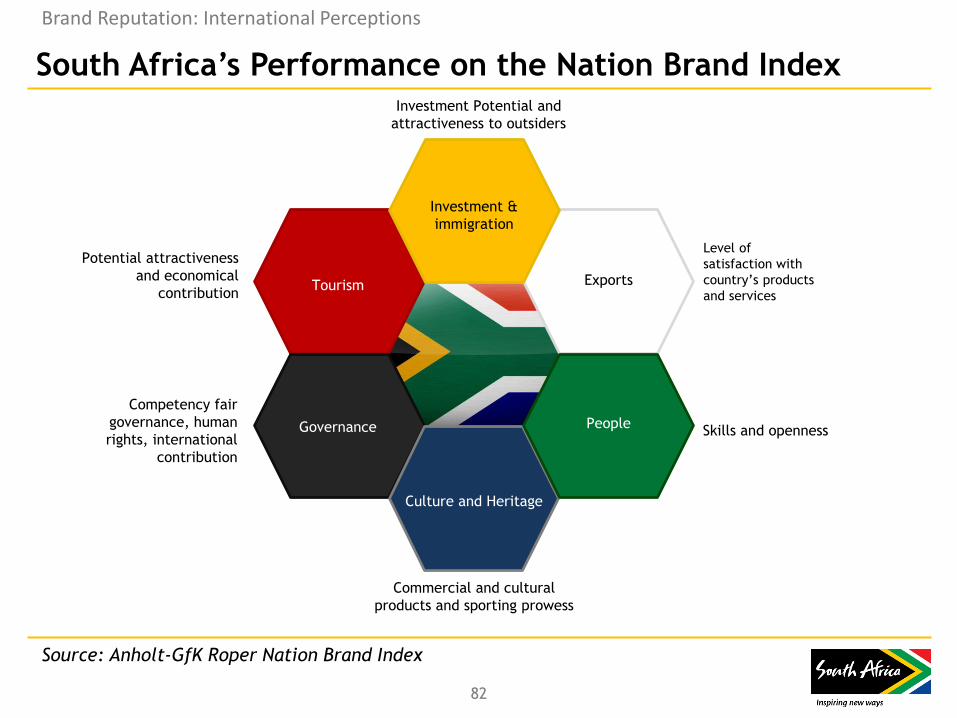
Exports Tourism
Governance
Culture and Heritage
People Skills and openness
Investment Potential and
attractiveness to outsiders
Commercial and cultural
products and sporting prowess
Competency fair
governance, human
rights, international
contribution
Potential attractiveness
and economical
contribution
Level of
satisfaction with
country’s products
and services
Investment &
immigration
South Africa’s Performance on the Nation Brand Index
82
Brand Reputation: International Perceptions
Source: Anholt-GfK Roper Nation Brand Index
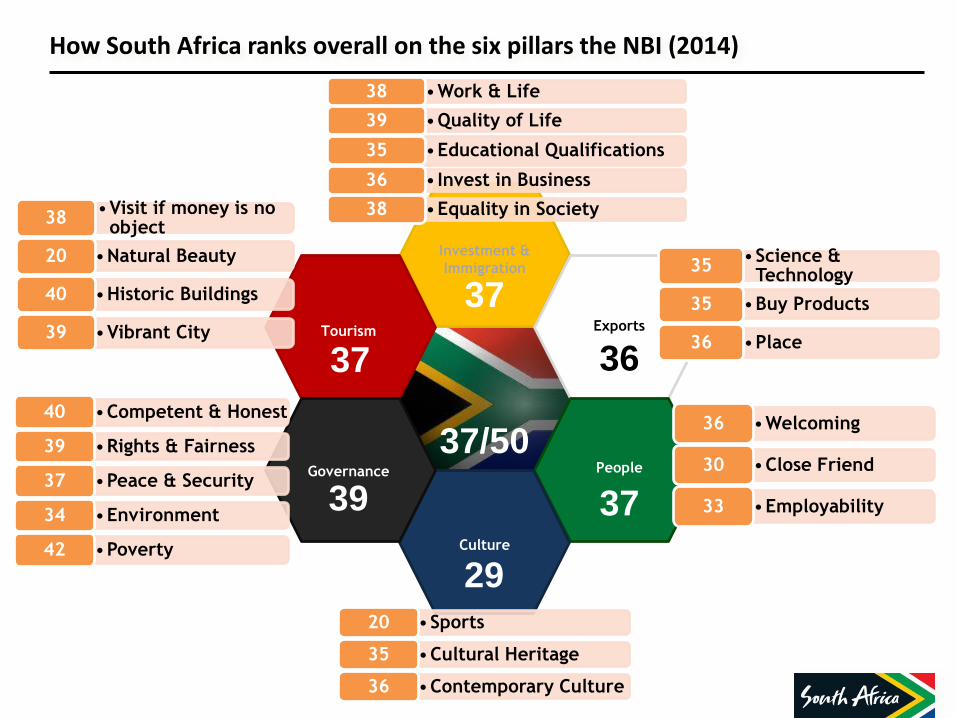
How South Africa ranks overall on the six pillars the NBI (2014)
37/50
Investment &
Immigration
37 Tourism
37 Exports
36
People
37 Culture
29
Governance
39
•Science & Technology
35
•Buy Products 35
•Place 36
•Competent & Honest 40
•Rights & Fairness 39
•Peace & Security 37
•Environment 34
•Poverty 42
•Sports 20
•Cultural Heritage 35
•Contemporary Culture 36
•Welcoming 36
•Close Friend 30
•Employability 33
•Visit if money is no object
38
•Natural Beauty 20
•Historic Buildings 40
•Vibrant City 39
•Work & Life 38
•Quality of Life 39
•Educational Qualifications 35
• Invest in Business 36
•Equality in Society 38
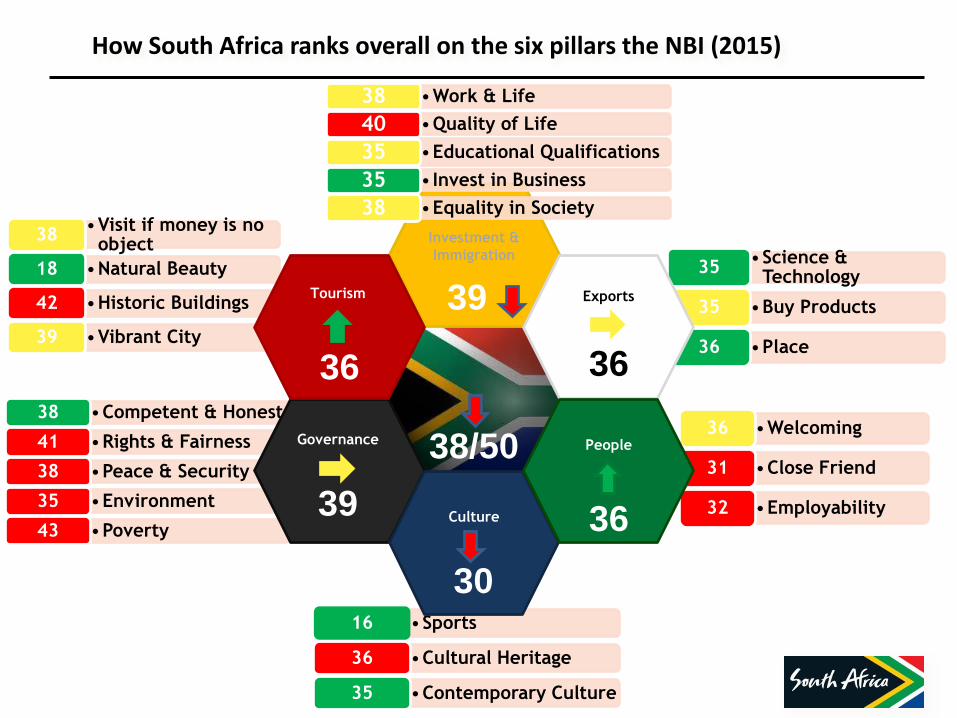
38/50
Investment &
Immigration
39
How South Africa ranks overall on the six pillars the NBI (2015)
•Science & Technology
35
•Buy Products 35
•Place 36
•Competent & Honest 38
•Rights & Fairness 41
•Peace & Security 38
•Environment 35
•Poverty 43
•Sports 16
•Cultural Heritage 36
•Contemporary Culture 35
•Welcoming 36
•Close Friend 31
•Employability 32
•Visit if money is no object
38
•Natural Beauty 18
•Historic Buildings 42
•Vibrant City 39
•Work & Life 38
•Quality of Life 40
•Educational Qualifications 35
• Invest in Business 35
•Equality in Society 38
Exports
36
Governance
39 Culture
30
People
36
Tourism
36
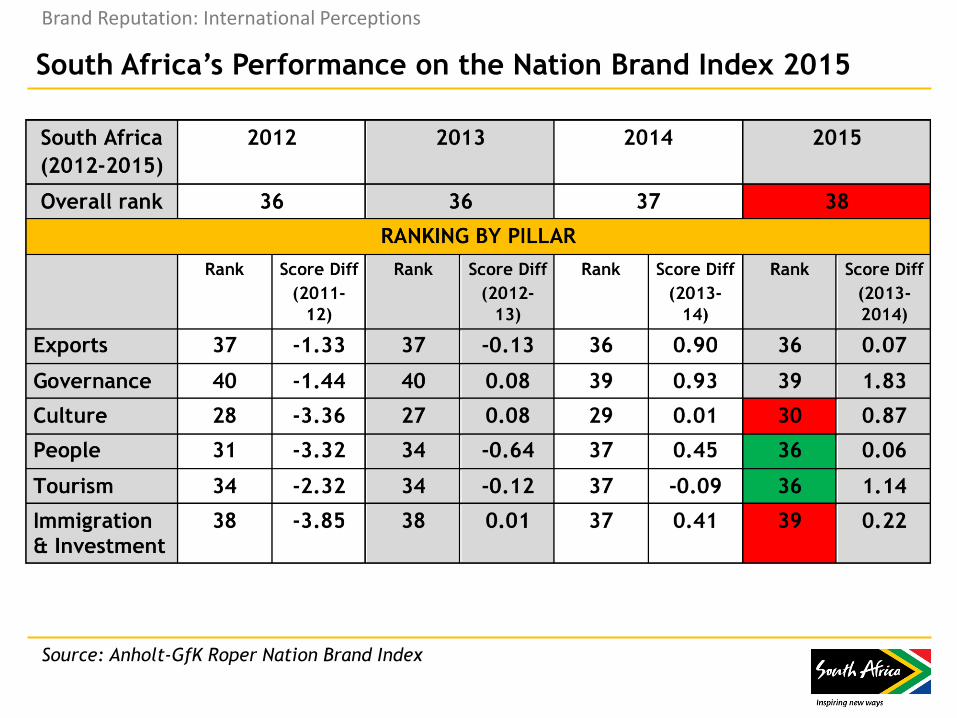
South Africa’s Performance on the Nation Brand Index 2015
Brand Reputation: International Perceptions
Source: Anholt-GfK Roper Nation Brand Index
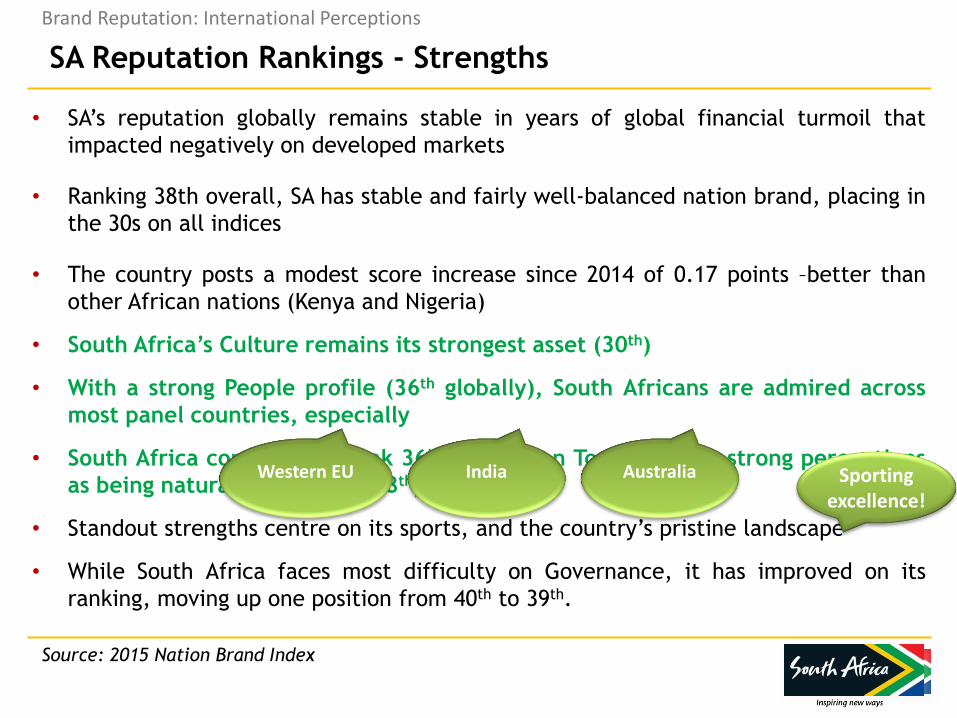
SA Reputation Rankings - Strengths
• SA’s reputation globally remains stable in years of global financial turmoil that
impacted negatively on developed markets
• Ranking 38th overall, SA has stable and fairly well-balanced nation brand, placing in
the 30s on all indices
• The country posts a modest score increase since 2014 of 0.17 points –better than
other African nations (Kenya and Nigeria)
• South Africa’s Culture remains its strongest asset (30th)
• With a strong People profile (36th globally), South Africans are admired across
most panel countries, especially
• South Africa continues to rank 36th globally on Tourism, with strong perceptions
as being naturally beautiful (18th).
• Standout strengths centre on its sports, and the country’s pristine landscape
• While South Africa faces most difficulty on Governance, it has improved on its
ranking, moving up one position from 40th to 39th.
Sporting excellence!
Western EU
India
Australia
Brand Reputation: International Perceptions
Source: 2015 Nation Brand Index
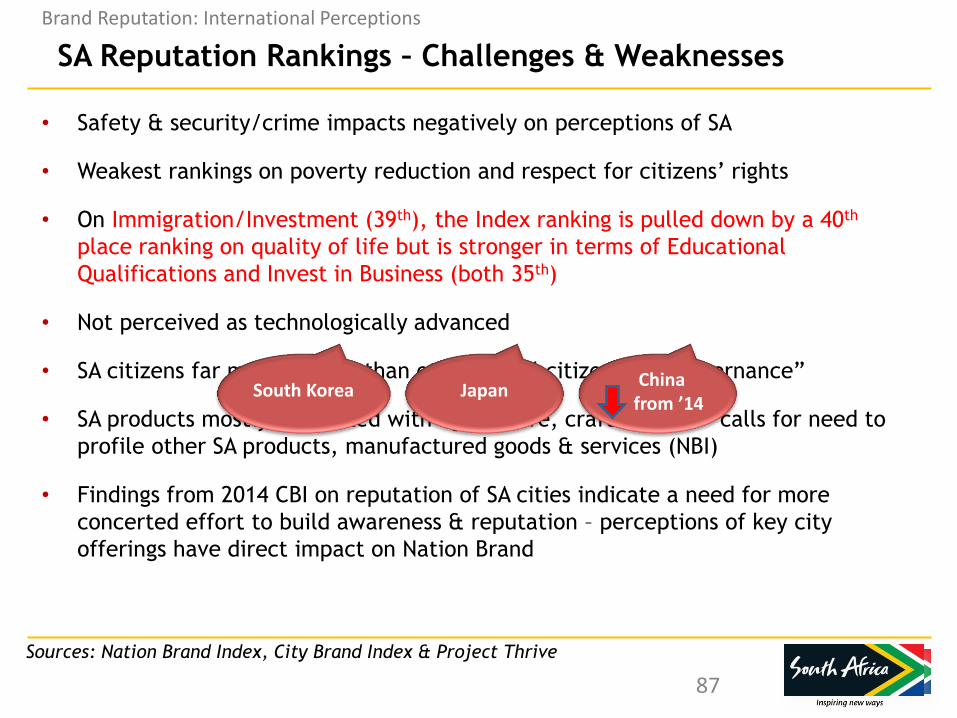
SA Reputation Rankings – Challenges & Weaknesses
• Safety & security/crime impacts negatively on perceptions of SA
• Weakest rankings on poverty reduction and respect for citizens’ rights
• On Immigration/Investment (39th), the Index ranking is pulled down by a 40th
place ranking on quality of life but is stronger in terms of Educational
Qualifications and Invest in Business (both 35th)
• Not perceived as technologically advanced
• SA citizens far more critical than other global citizens on “Governance”
• SA products mostly associated with agriculture, crafts & food – calls for need to
profile other SA products, manufactured goods & services (NBI)
• Findings from 2014 CBI on reputation of SA cities indicate a need for more
concerted effort to build awareness & reputation – perceptions of key city
offerings have direct impact on Nation Brand
87
Brand Reputation: International Perceptions
Sources: Nation Brand Index, City Brand Index & Project Thrive
South Korea
Japan
China from ’14
THE SA INC SERIES
Brand SA Fieldwork Research
Overview: The SA Inc. Research Project
Rationale:
SA’s reputation is shaped by foreign policy; trade interactions as well as
a divergent sets of relationships & interests (governmental, non-
governmental, and business)
Objectives:
Development of framework of analysis that considers all elements of
SA’s strategic economic, diplomatic, multilateral, and peace & security
engagements on the continent
Integrated view of SA’s footprint on the continent for strategic
marketing, communications, and reputation management projects
Brand SA Fieldwork Research
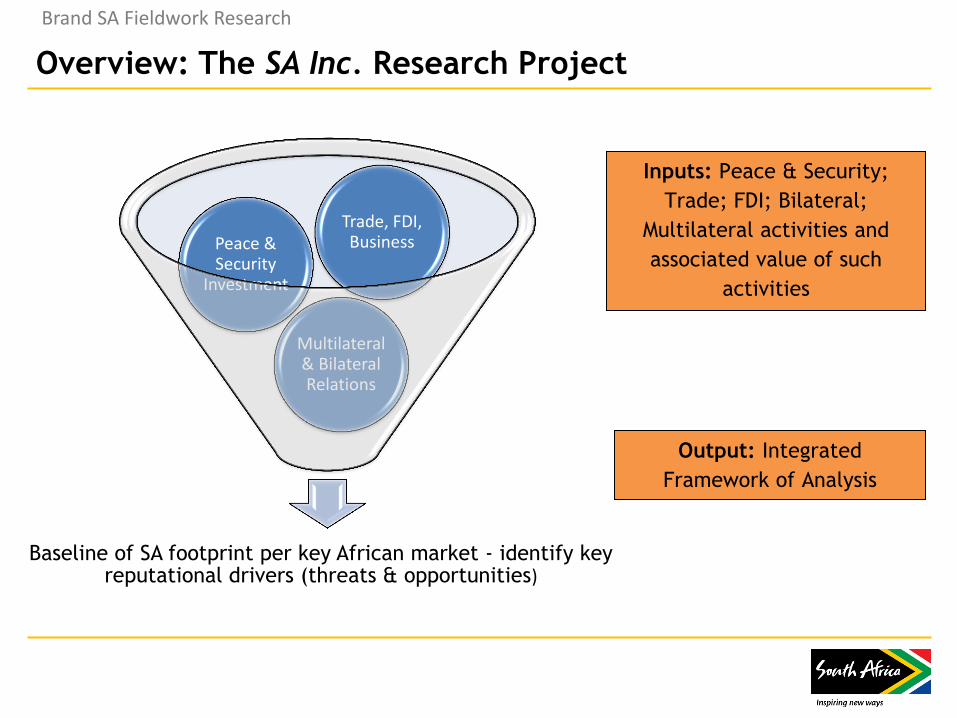
Overview: The SA Inc. Research Project
Baseline of SA footprint per key African market - identify key reputational drivers (threats & opportunities)
Multilateral & Bilateral Relations
Peace & Security
Investment
Trade, FDI, Business
Inputs: Peace & Security;
Trade; FDI; Bilateral;
Multilateral activities and
associated value of such
activities
Output: Integrated
Framework of Analysis
Brand SA Fieldwork Research
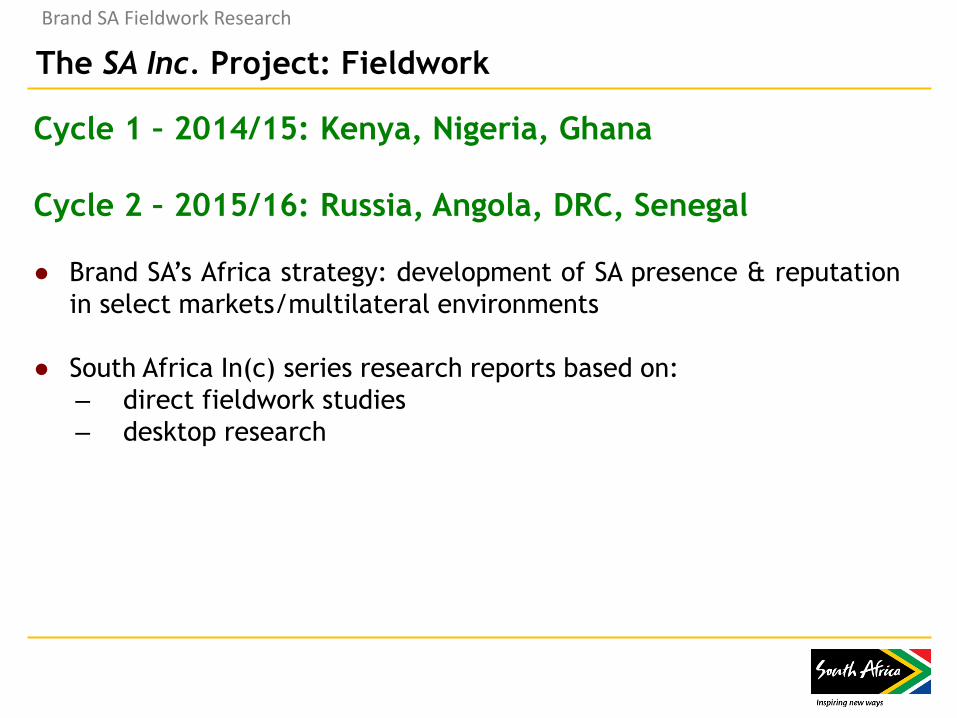
Cycle 1 – 2014/15: Kenya, Nigeria, Ghana
Cycle 2 – 2015/16: Russia, Angola, DRC, Senegal
● Brand SA’s Africa strategy: development of SA presence & reputation
in select markets/multilateral environments
● South Africa In(c) series research reports based on:
– direct fieldwork studies
– desktop research
Brand SA Fieldwork Research
The SA Inc. Project: Fieldwork
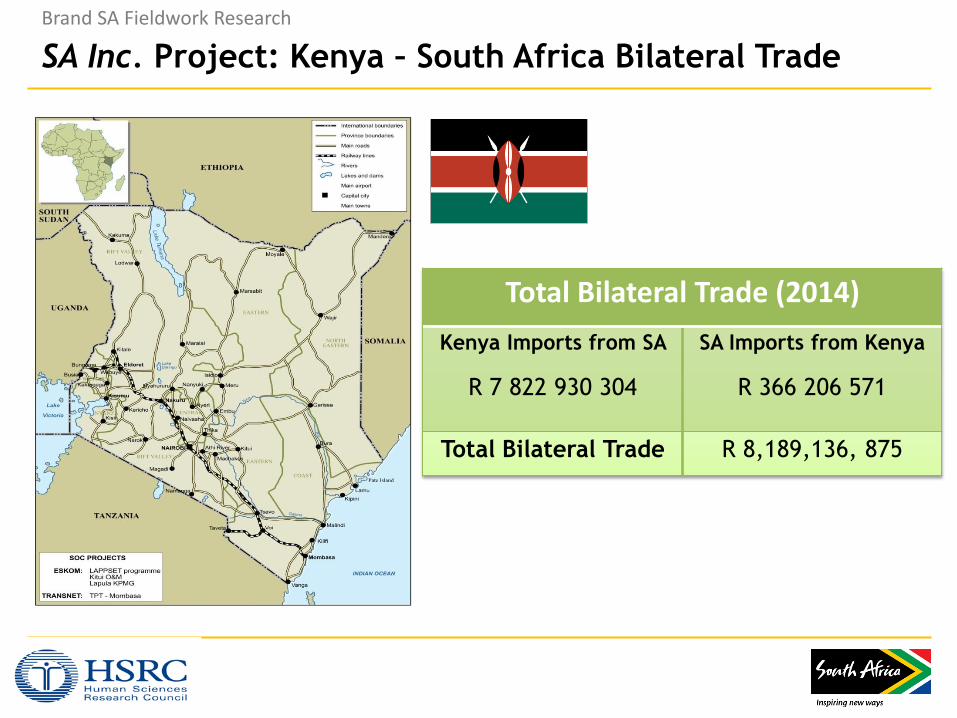
SA Inc. Project: Kenya – South Africa Bilateral Trade
Total Bilateral Trade (2014)
Kenya Imports from SA
R 7 822 930 304
SA Imports from Kenya
R 366 206 571
Total Bilateral Trade R 8,189,136, 875
Brand SA Fieldwork Research
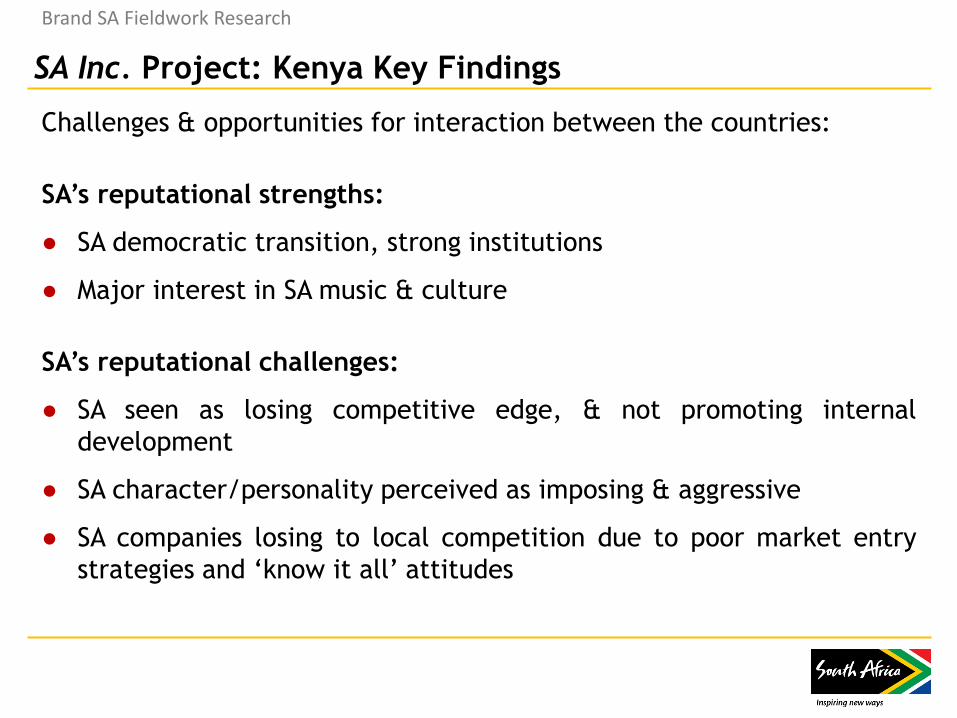
SA Inc. Project: Kenya Key Findings
Challenges & opportunities for interaction between the countries:
SA’s reputational strengths:
● SA democratic transition, strong institutions
● Major interest in SA music & culture
SA’s reputational challenges:
● SA seen as losing competitive edge, & not promoting internal
development
● SA character/personality perceived as imposing & aggressive
● SA companies losing to local competition due to poor market entry
strategies and ‘know it all’ attitudes
Brand SA Fieldwork Research
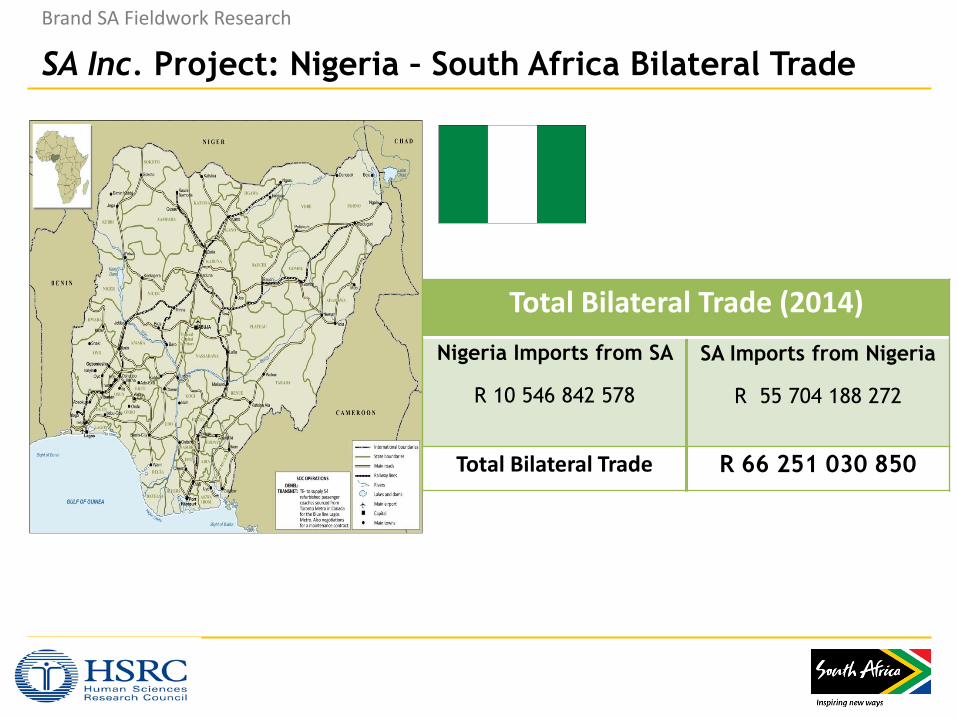
SA Inc. Project: Nigeria – South Africa Bilateral Trade
Total Bilateral Trade (2014)
Nigeria Imports from SA
R 10 546 842 578
SA Imports from Nigeria
R 55 704 188 272
Total Bilateral Trade R 66 251 030 850
Brand SA Fieldwork Research
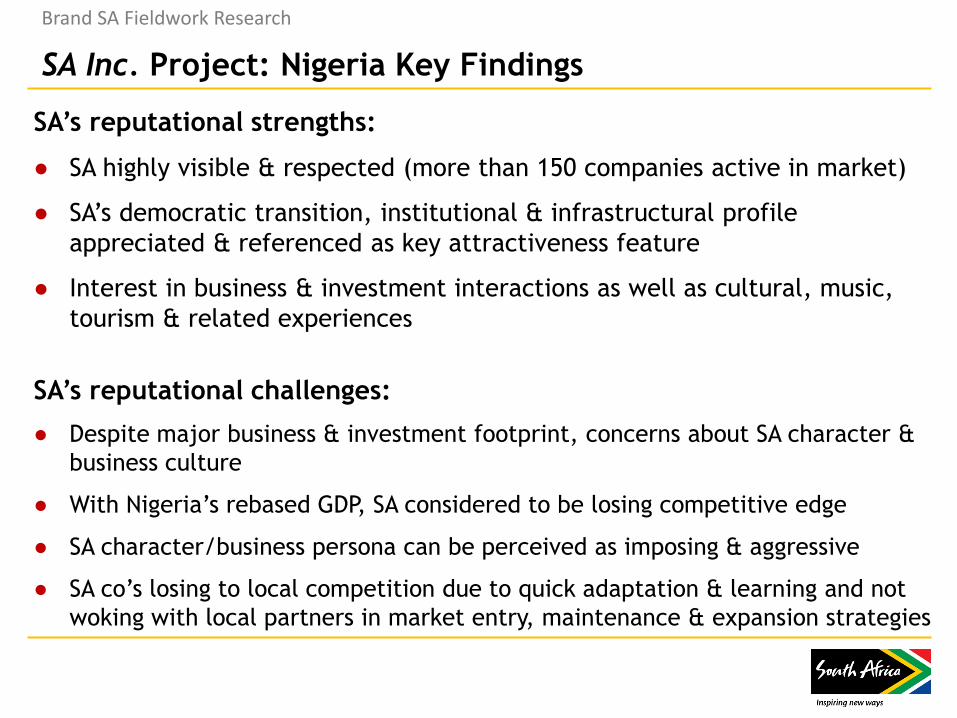
SA Inc. Project: Nigeria Key Findings
SA’s reputational strengths:
● SA highly visible & respected (more than 150 companies active in market)
● SA’s democratic transition, institutional & infrastructural profile
appreciated & referenced as key attractiveness feature
● Interest in business & investment interactions as well as cultural, music,
tourism & related experiences
SA’s reputational challenges:
● Despite major business & investment footprint, concerns about SA character &
business culture
● With Nigeria’s rebased GDP, SA considered to be losing competitive edge
● SA character/business persona can be perceived as imposing & aggressive
● SA co’s losing to local competition due to quick adaptation & learning and not
woking with local partners in market entry, maintenance & expansion strategies
Brand SA Fieldwork Research
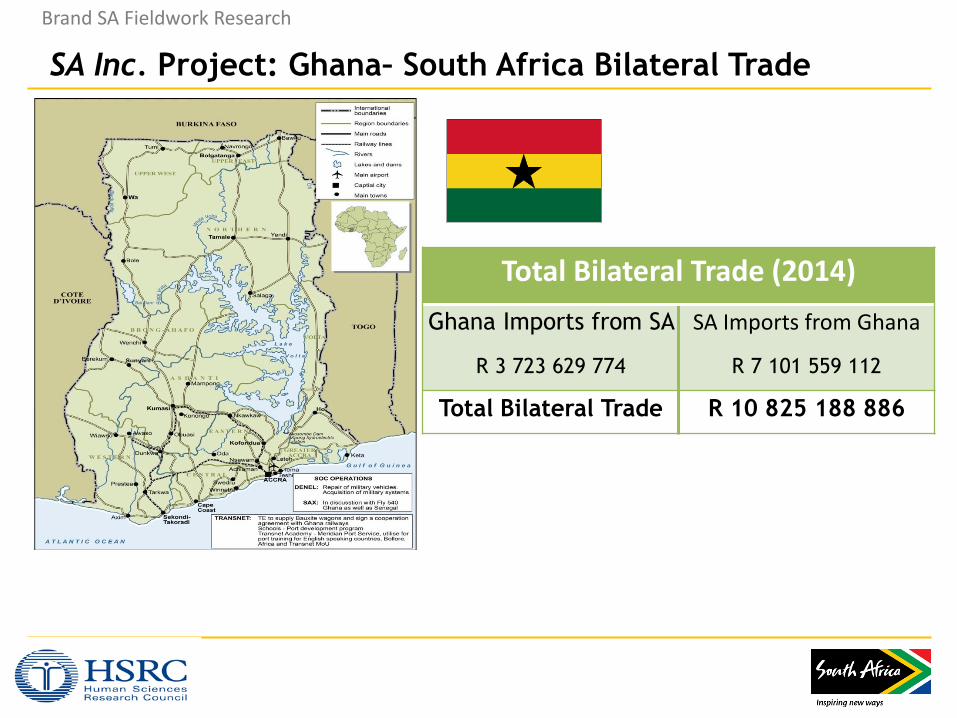
SA Inc. Project: Ghana– South Africa Bilateral Trade
Total Bilateral Trade (2014)
Ghana Imports from SA
R 3 723 629 774
SA Imports from Ghana
R 7 101 559 112
Total Bilateral Trade R 10 825 188 886
Brand SA Fieldwork Research
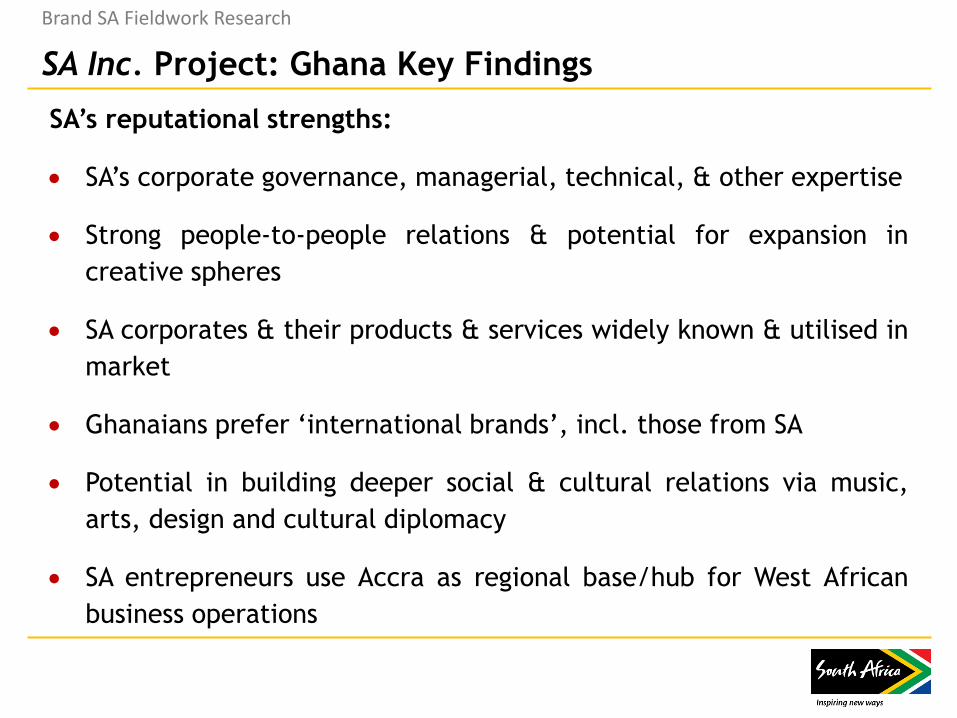
SA Inc. Project: Ghana Key Findings
SA’s reputational strengths:
SA’s corporate governance, managerial, technical, & other expertise
Strong people-to-people relations & potential for expansion in
creative spheres
SA corporates & their products & services widely known & utilised in
market
Ghanaians prefer ‘international brands’, incl. those from SA
Potential in building deeper social & cultural relations via music,
arts, design and cultural diplomacy
SA entrepreneurs use Accra as regional base/hub for West African
business operations
Brand SA Fieldwork Research
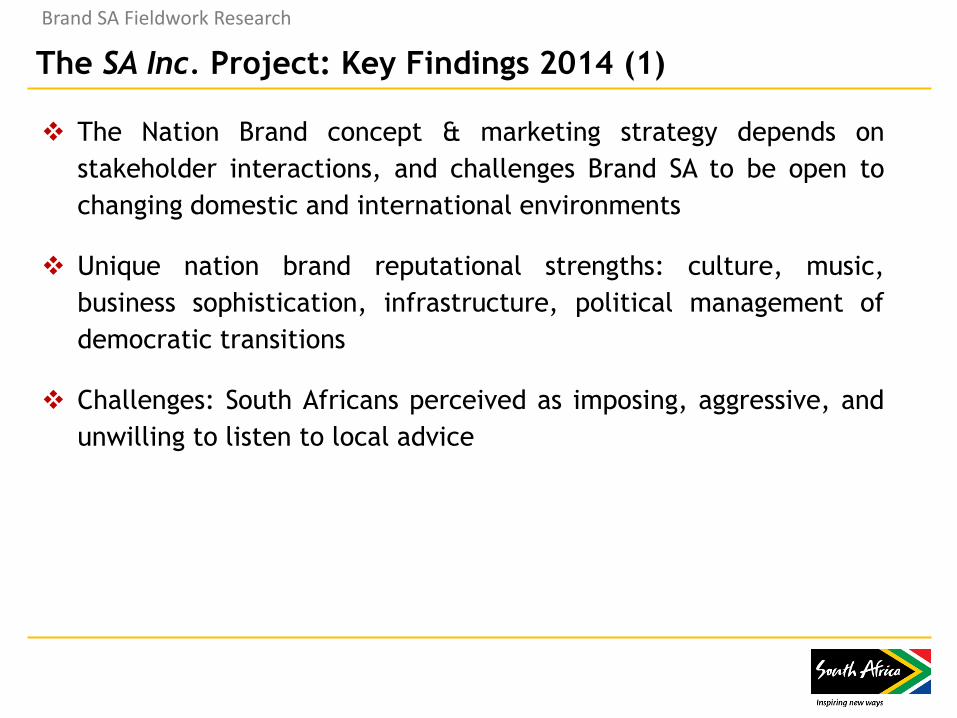
The Nation Brand concept & marketing strategy depends on
stakeholder interactions, and challenges Brand SA to be open to
changing domestic and international environments
Unique nation brand reputational strengths: culture, music,
business sophistication, infrastructure, political management of
democratic transitions
Challenges: South Africans perceived as imposing, aggressive, and
unwilling to listen to local advice
The SA Inc. Project: Key Findings 2014 (1)
Brand SA Fieldwork Research
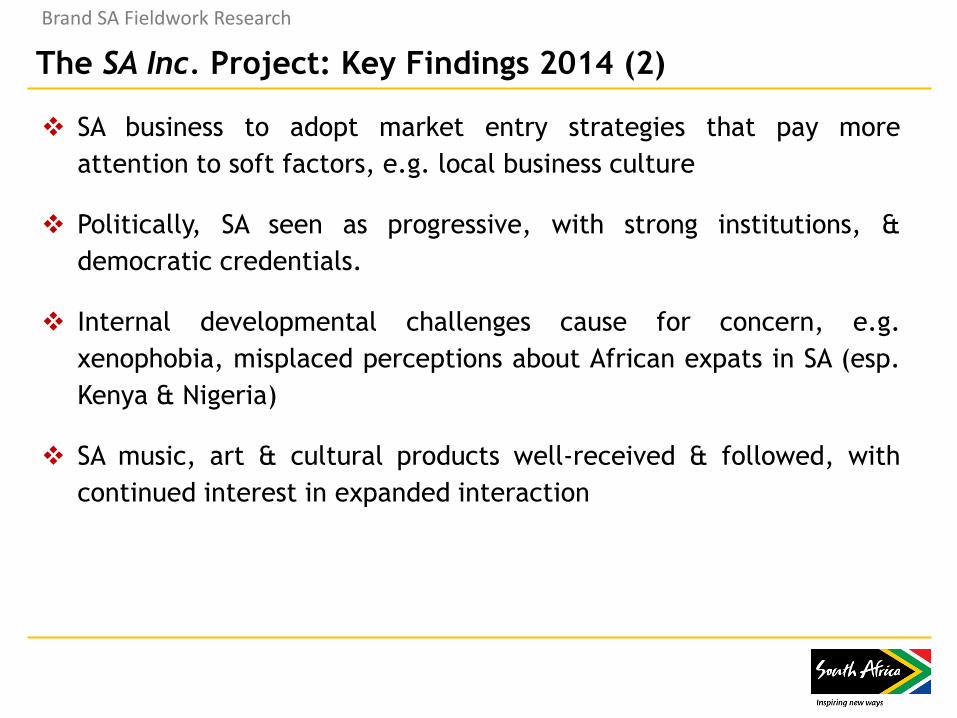
The SA Inc. Project: Key Findings 2014 (2)
SA business to adopt market entry strategies that pay more
attention to soft factors, e.g. local business culture
Politically, SA seen as progressive, with strong institutions, &
democratic credentials.
Internal developmental challenges cause for concern, e.g.
xenophobia, misplaced perceptions about African expats in SA (esp.
Kenya & Nigeria)
SA music, art & cultural products well-received & followed, with
continued interest in expanded interaction
Brand SA Fieldwork Research
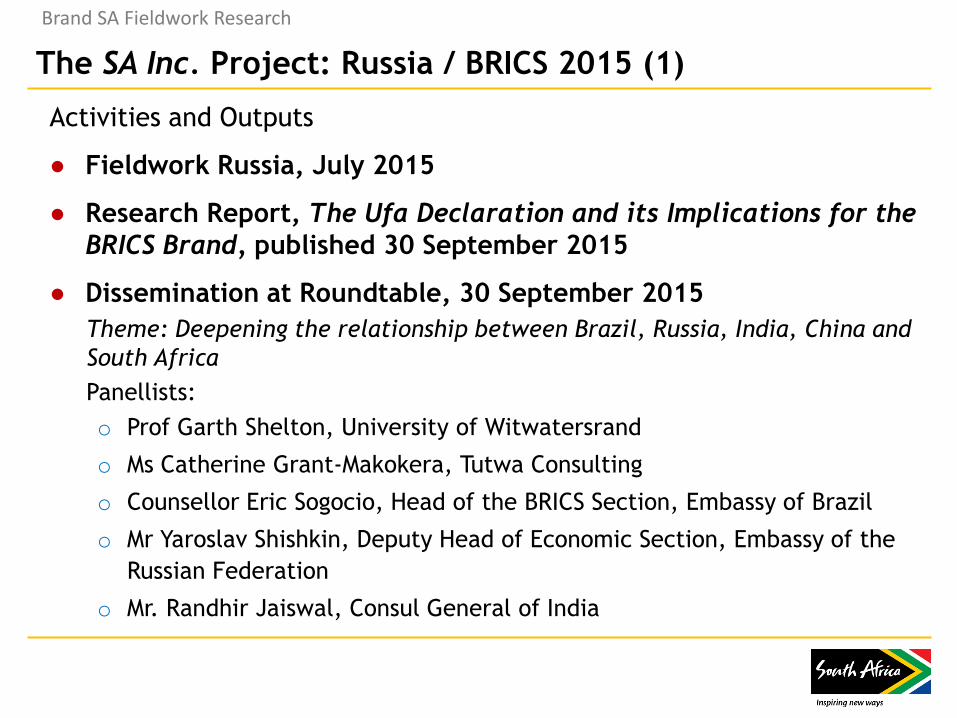
Activities and Outputs
● Fieldwork Russia, July 2015
● Research Report, The Ufa Declaration and its Implications for the
BRICS Brand, published 30 September 2015
● Dissemination at Roundtable, 30 September 2015
Theme: Deepening the relationship between Brazil, Russia, India, China and
South Africa
Panellists:
o Prof Garth Shelton, University of Witwatersrand
o Ms Catherine Grant-Makokera, Tutwa Consulting
o Counsellor Eric Sogocio, Head of the BRICS Section, Embassy of Brazil
o Mr Yaroslav Shishkin, Deputy Head of Economic Section, Embassy of the
Russian Federation
o Mr. Randhir Jaiswal, Consul General of India
The SA Inc. Project: Russia / BRICS 2015 (1)
Brand SA Fieldwork Research
101
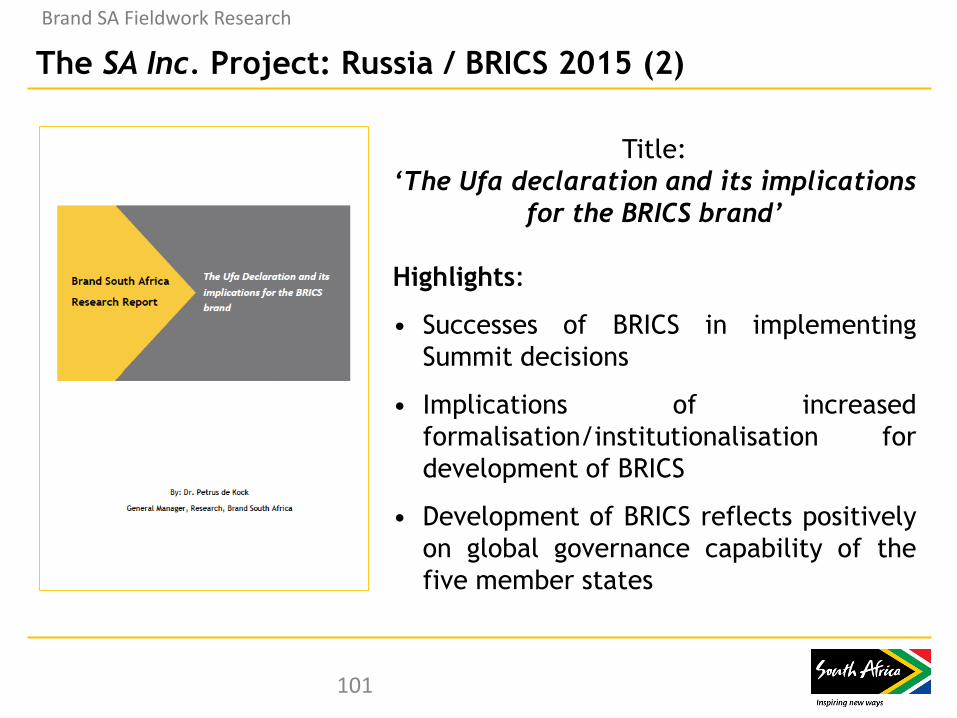
Title:
‘The Ufa declaration and its implications
for the BRICS brand’
Highlights:
• Successes of BRICS in implementing
Summit decisions
• Implications of increased
formalisation/institutionalisation for
development of BRICS
• Development of BRICS reflects positively
on global governance capability of the
five member states
The SA Inc. Project: Russia / BRICS 2015 (2)
Brand SA Fieldwork Research
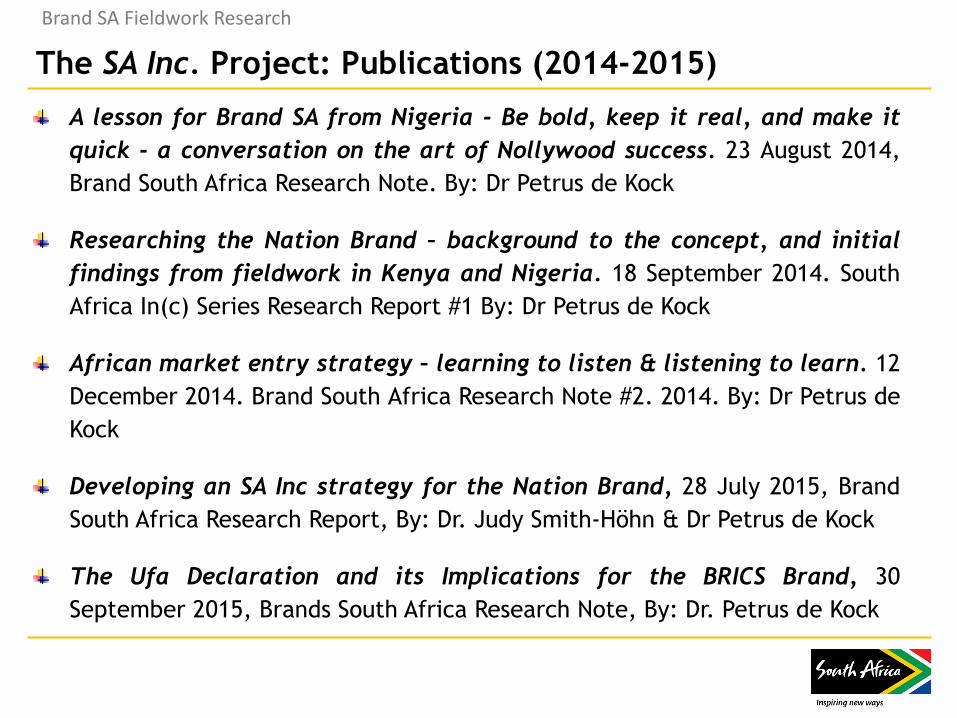
The SA Inc. Project: Publications (2014-2015)
A lesson for Brand SA from Nigeria - Be bold, keep it real, and make it
quick - a conversation on the art of Nollywood success. 23 August 2014,
Brand South Africa Research Note. By: Dr Petrus de Kock
Researching the Nation Brand – background to the concept, and initial
findings from fieldwork in Kenya and Nigeria. 18 September 2014. South
Africa In(c) Series Research Report #1 By: Dr Petrus de Kock
African market entry strategy – learning to listen & listening to learn. 12
December 2014. Brand South Africa Research Note #2. 2014. By: Dr Petrus de
Kock
Developing an SA Inc strategy for the Nation Brand, 28 July 2015, Brand
South Africa Research Report, By: Dr. Judy Smith-Höhn & Dr Petrus de Kock
The Ufa Declaration and its Implications for the BRICS Brand, 30
September 2015, Brands South Africa Research Note, By: Dr. Petrus de Kock
Brand SA Fieldwork Research
DOMESTIC PERCEPTIONS
Brand SA Research
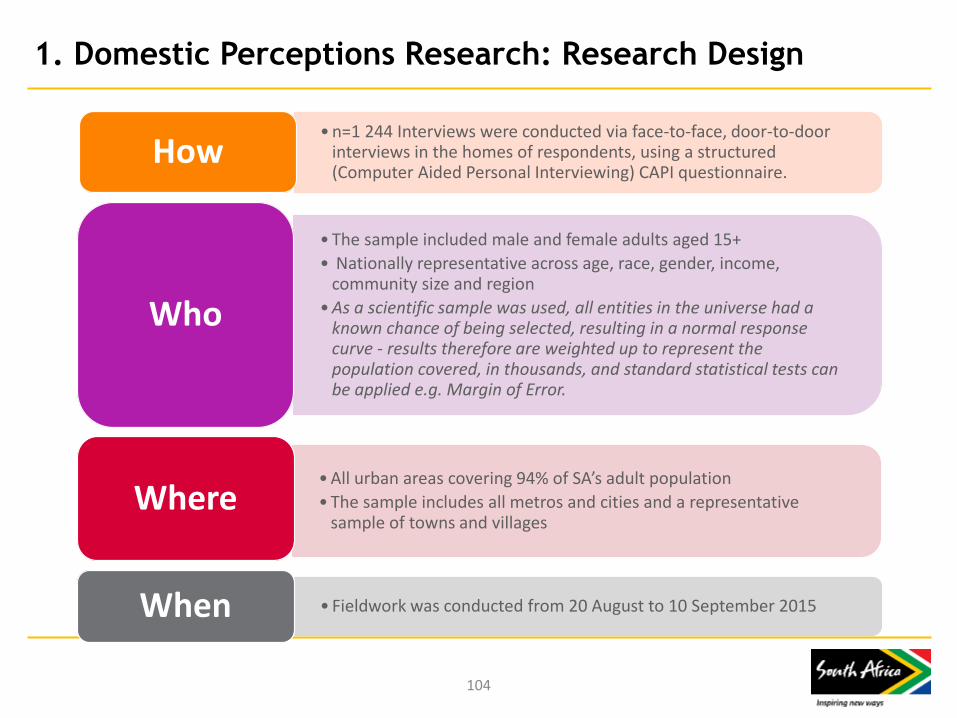
1. Domestic Perceptions Research: Research Design
104
• n=1 244 Interviews were conducted via face-to-face, door-to-door interviews in the homes of respondents, using a structured (Computer Aided Personal Interviewing) CAPI questionnaire.
How
• The sample included male and female adults aged 15+
• Nationally representative across age, race, gender, income, community size and region
• As a scientific sample was used, all entities in the universe had a known chance of being selected, resulting in a normal response curve - results therefore are weighted up to represent the population covered, in thousands, and standard statistical tests can be applied e.g. Margin of Error.
Who
• All urban areas covering 94% of SA’s adult population
• The sample includes all metros and cities and a representative sample of towns and villages
Where
• Fieldwork was conducted from 20 August to 10 September 2015 When
105
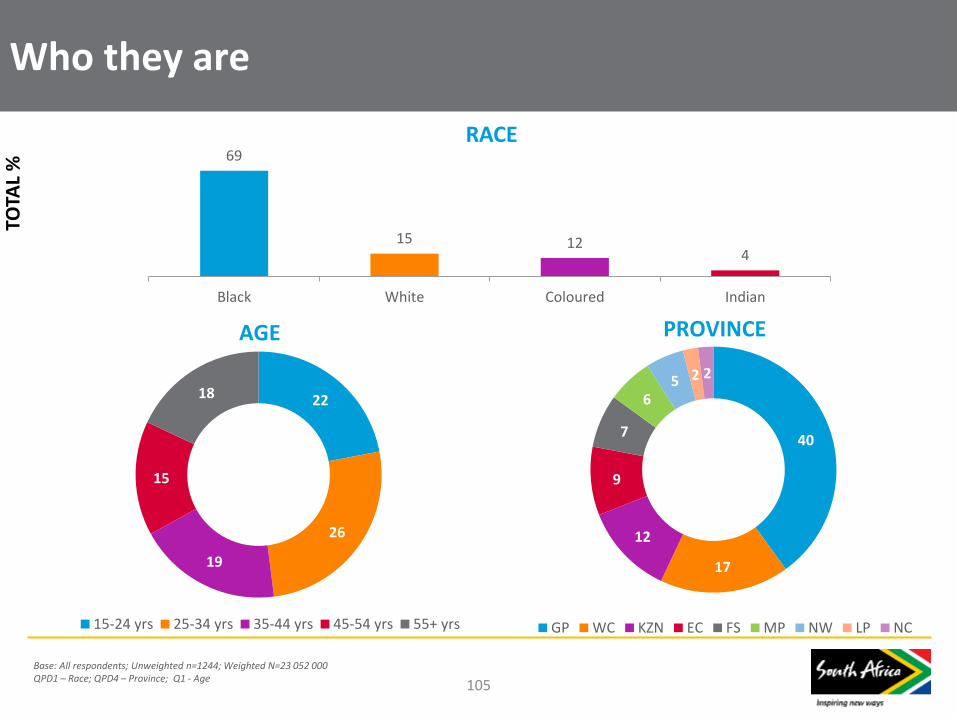
69
15 12 4
Black White Coloured Indian
Who they are
Base: All respondents; Unweighted n=1244; Weighted N=23 052 000 QPD1 – Race; QPD4 – Province; Q1 - Age
RACE
40
17
12
9
7
6 5 2 2
GP WC KZN EC FS MP NW LP NC
PROVINCE AGE
22
26
19
15
18
15-24 yrs 25-34 yrs 35-44 yrs 45-54 yrs 55+ yrs
TOTA
L %
Summary Findings
106
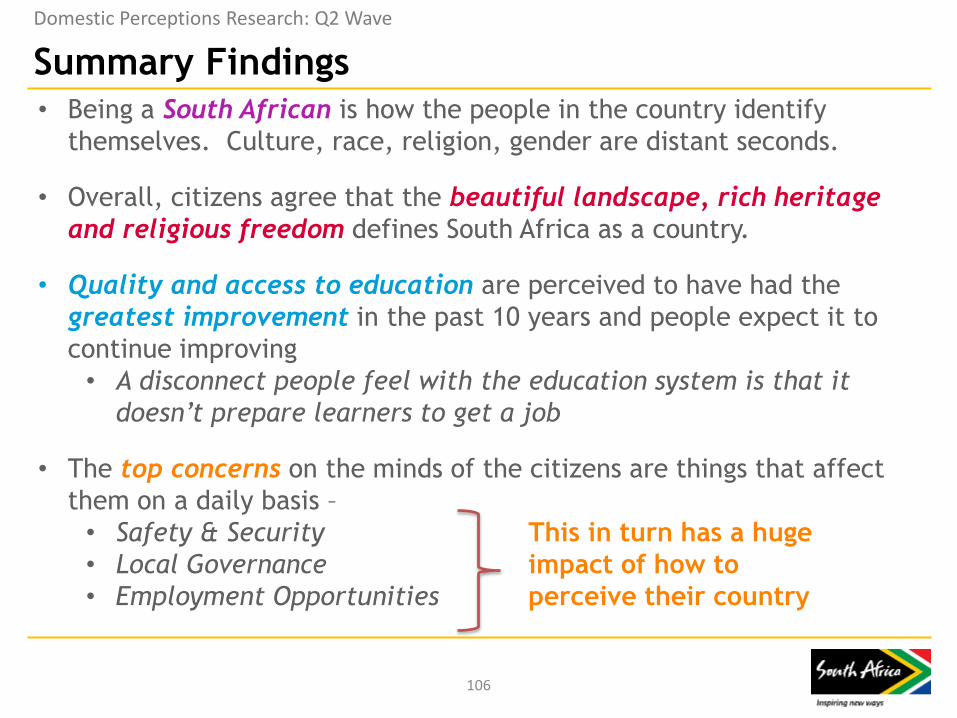
• Being a South African is how the people in the country identify
themselves. Culture, race, religion, gender are distant seconds.
• Overall, citizens agree that the beautiful landscape, rich heritage
and religious freedom defines South Africa as a country.
• Quality and access to education are perceived to have had the
greatest improvement in the past 10 years and people expect it to
continue improving
• A disconnect people feel with the education system is that it
doesn’t prepare learners to get a job
• The top concerns on the minds of the citizens are things that affect
them on a daily basis –
• Safety & Security
• Local Governance
• Employment Opportunities
This in turn has a huge
impact of how to
perceive their country
Domestic Perceptions Research: Q2 Wave
Summary Findings
107
Domestic Perceptions Research: Q2 Wave
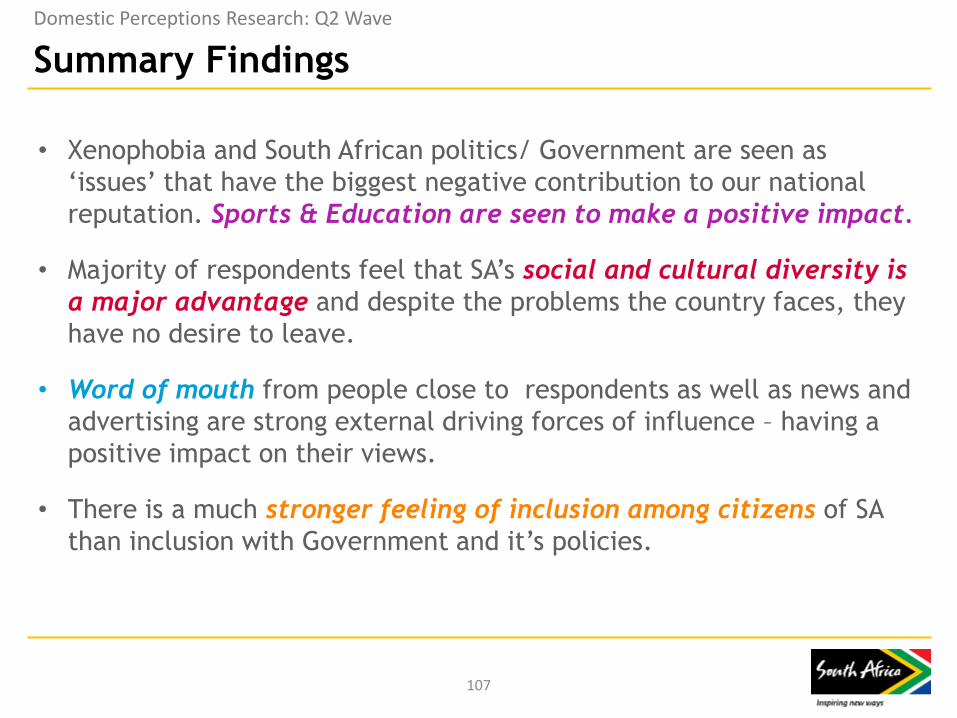
• Xenophobia and South African politics/ Government are seen as
‘issues’ that have the biggest negative contribution to our national
reputation. Sports & Education are seen to make a positive impact.
• Majority of respondents feel that SA’s social and cultural diversity is
a major advantage and despite the problems the country faces, they
have no desire to leave.
• Word of mouth from people close to respondents as well as news and
advertising are strong external driving forces of influence – having a
positive impact on their views.
• There is a much stronger feeling of inclusion among citizens of SA
than inclusion with Government and it’s policies.
Summary Findings
108
Domestic Perceptions Research: Q2 Wave
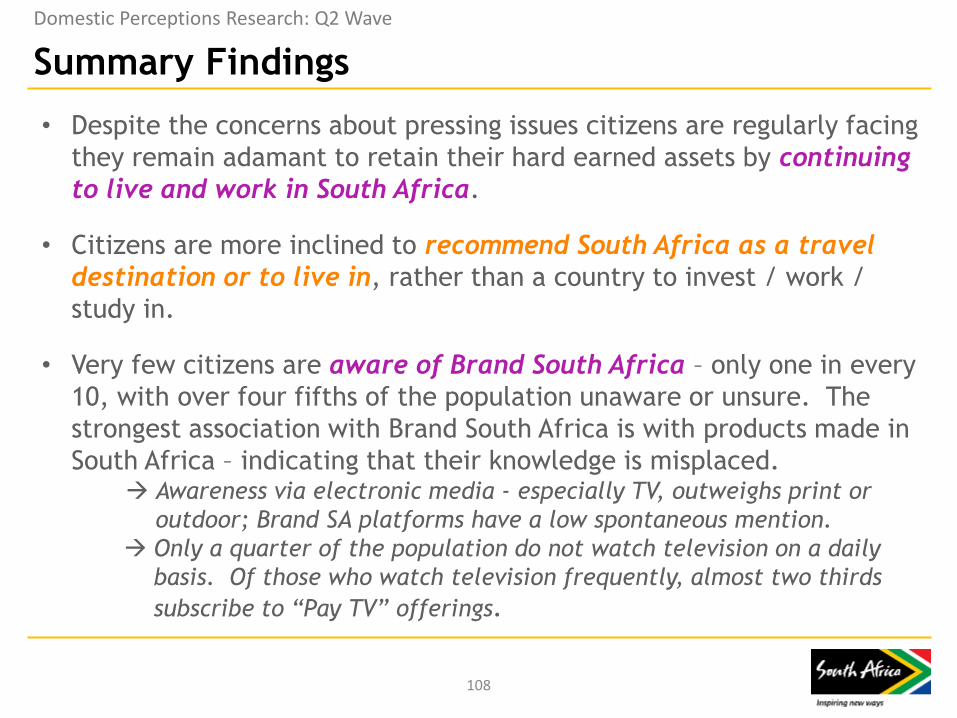
• Despite the concerns about pressing issues citizens are regularly facing
they remain adamant to retain their hard earned assets by continuing
to live and work in South Africa.
• Citizens are more inclined to recommend South Africa as a travel
destination or to live in, rather than a country to invest / work /
study in.
• Very few citizens are aware of Brand South Africa – only one in every
10, with over four fifths of the population unaware or unsure. The
strongest association with Brand South Africa is with products made in
South Africa – indicating that their knowledge is misplaced. Awareness via electronic media - especially TV, outweighs print or
outdoor; Brand SA platforms have a low spontaneous mention.
Only a quarter of the population do not watch television on a daily
basis. Of those who watch television frequently, almost two thirds
subscribe to “Pay TV” offerings.
109
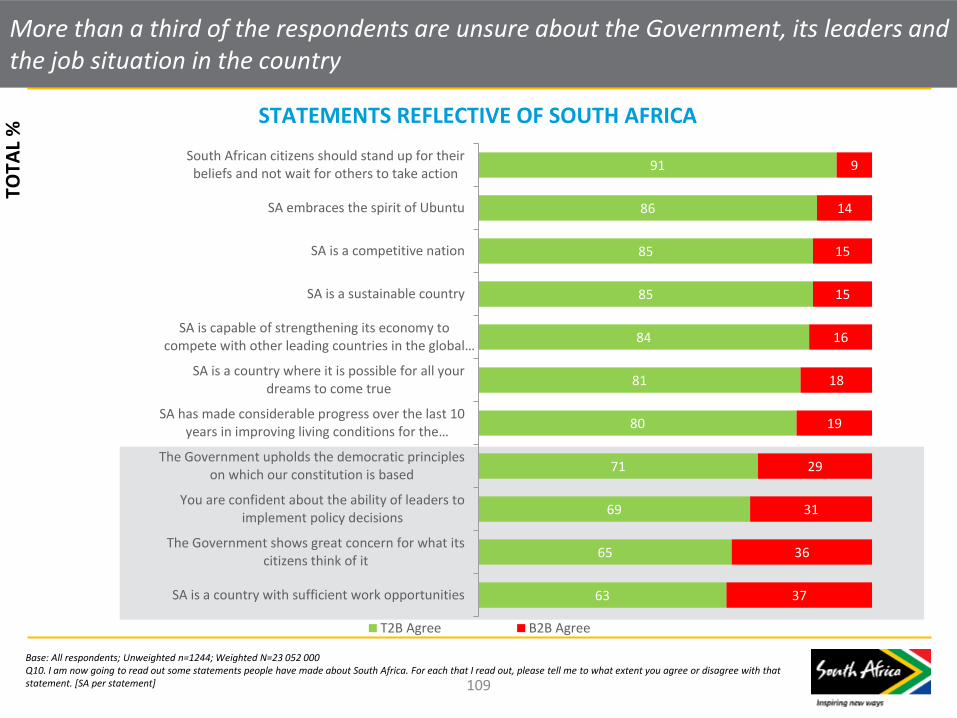
More than a third of the respondents are unsure about the Government, its leaders and the job situation in the country
Base: All respondents; Unweighted n=1244; Weighted N=23 052 000 Q10. I am now going to read out some statements people have made about South Africa. For each that I read out, please tell me to what extent you agree or disagree with that statement. [SA per statement]
91
86
85
85
84
81
80
71
69
65
63
9
14
15
15
16
18
19
29
31
36
37
South African citizens should stand up for theirbeliefs and not wait for others to take action
SA embraces the spirit of Ubuntu
SA is a competitive nation
SA is a sustainable country
SA is capable of strengthening its economy tocompete with other leading countries in the global…
SA is a country where it is possible for all yourdreams to come true
SA has made considerable progress over the last 10years in improving living conditions for the…
The Government upholds the democratic principleson which our constitution is based
You are confident about the ability of leaders toimplement policy decisions
The Government shows great concern for what itscitizens think of it
SA is a country with sufficient work opportunities
T2B Agree B2B Agree
STATEMENTS REFLECTIVE OF SOUTH AFRICA
TOTA
L %
110
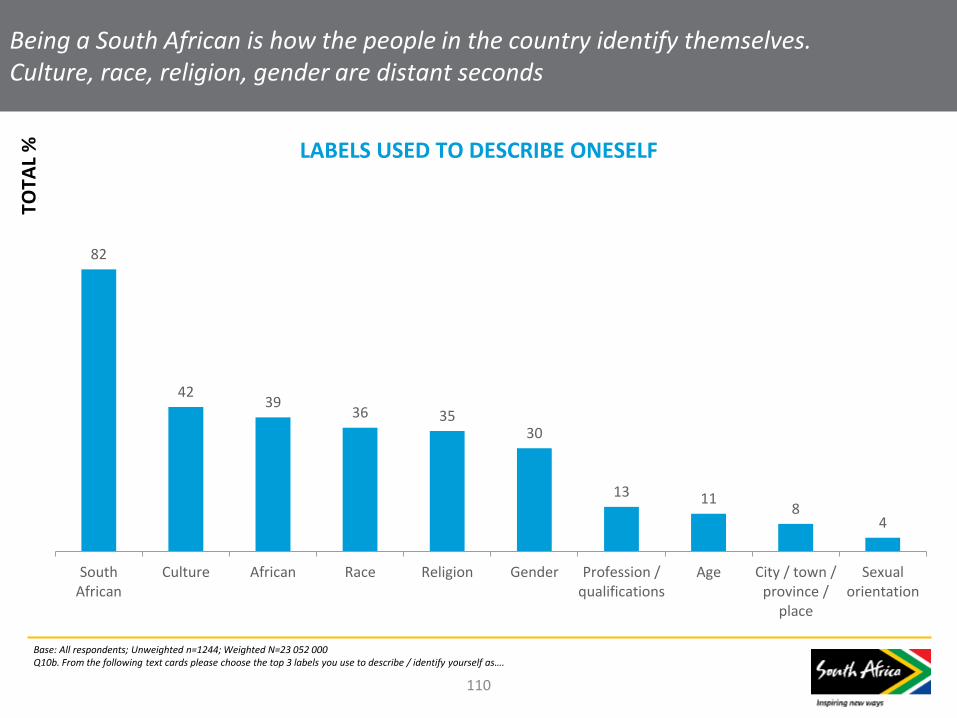
Being a South African is how the people in the country identify themselves. Culture, race, religion, gender are distant seconds
Base: All respondents; Unweighted n=1244; Weighted N=23 052 000 Q10b. From the following text cards please choose the top 3 labels you use to describe / identify yourself as….
82
42 39
36 35 30
13 11 8
4
SouthAfrican
Culture African Race Religion Gender Profession /qualifications
Age City / town /province /
place
Sexualorientation
LABELS USED TO DESCRIBE ONESELF
TOTA
L %
TO
TAL
%
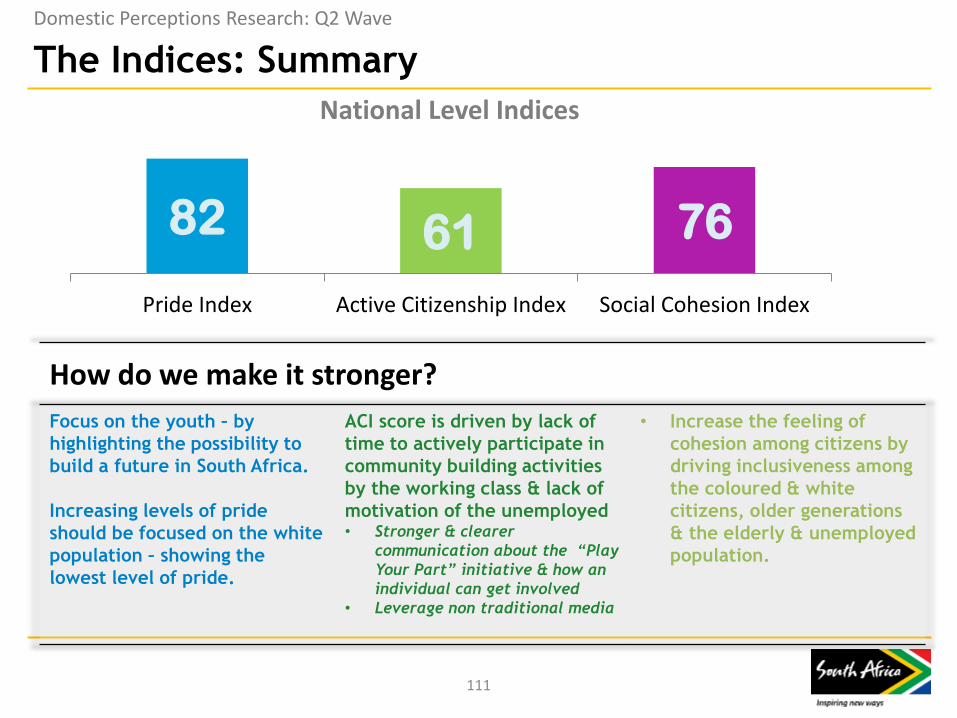
The Indices: Summary
111
Domestic Perceptions Research: Q2 Wave
82 61 76
Pride Index Active Citizenship Index Social Cohesion Index
National Level Indices
How do we make it stronger?
Focus on the youth – by
highlighting the possibility to
build a future in South Africa.
Increasing levels of pride
should be focused on the white
population – showing the
lowest level of pride.
ACI score is driven by lack of
time to actively participate in
community building activities
by the working class & lack of
motivation of the unemployed • Stronger & clearer
communication about the “Play
Your Part” initiative & how an
individual can get involved
• Leverage non traditional media
• Increase the feeling of
cohesion among citizens by
driving inclusiveness among
the coloured & white
citizens, older generations
& the elderly & unemployed
population.
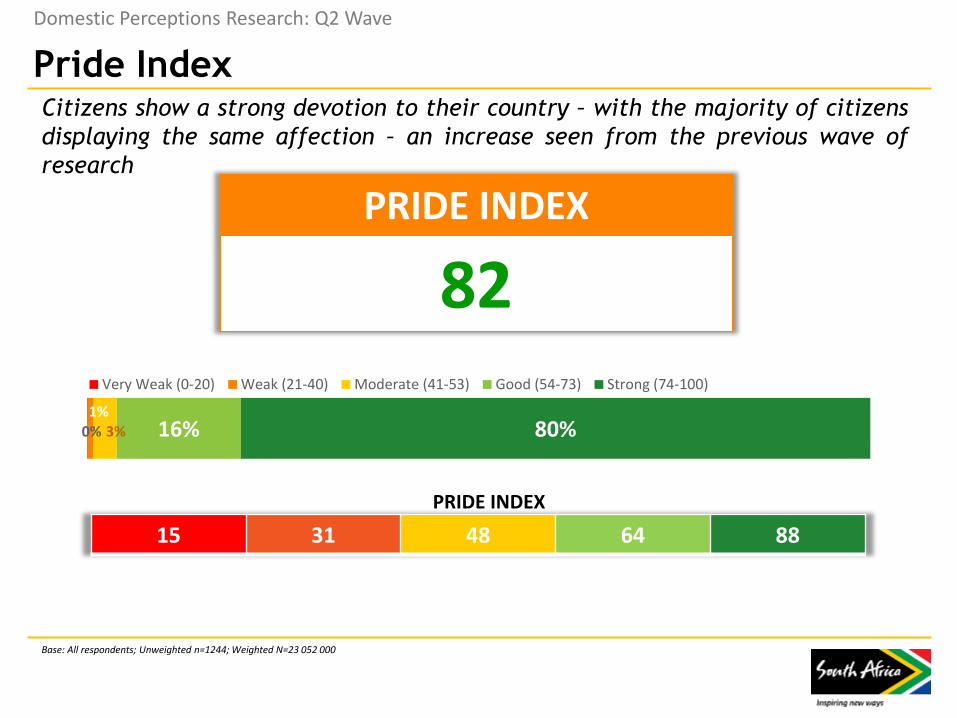
Pride Index
Domestic Perceptions Research: Q2 Wave
Base: All respondents; Unweighted n=1244; Weighted N=23 052 000
PRIDE INDEX
82
0% 1%
3% 16% 80%
Very Weak (0-20) Weak (21-40) Moderate (41-53) Good (54-73) Strong (74-100)
15 31 48 64 88
PRIDE INDEX
PR
IDE
IND
EX –
TO
TAL
% Citizens show a strong devotion to their country – with the majority of citizens
displaying the same affection – an increase seen from the previous wave of
research
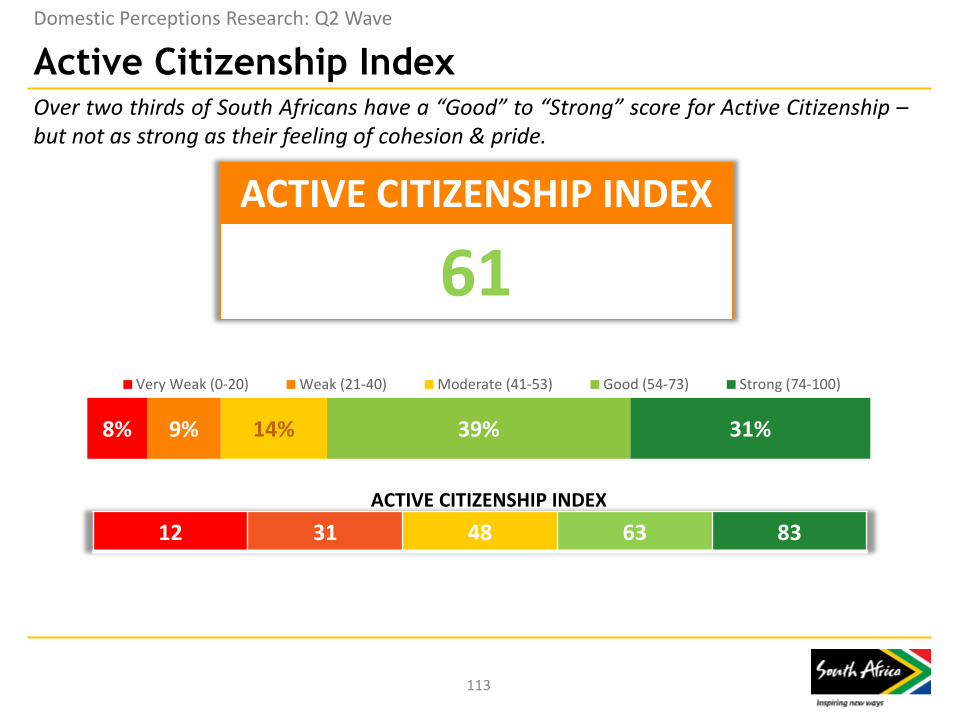
Active Citizenship Index
113
Domestic Perceptions Research: Q2 Wave
Over two thirds of South Africans have a “Good” to “Strong” score for Active Citizenship – but not as strong as their feeling of cohesion & pride.
ACTIVE CITIZENSHIP INDEX
61
8% 9% 14% 39% 31%
Very Weak (0-20) Weak (21-40) Moderate (41-53) Good (54-73) Strong (74-100)
12 31 48 63 83
ACTIVE CITIZENSHIP INDEX
Social Cohesion Index
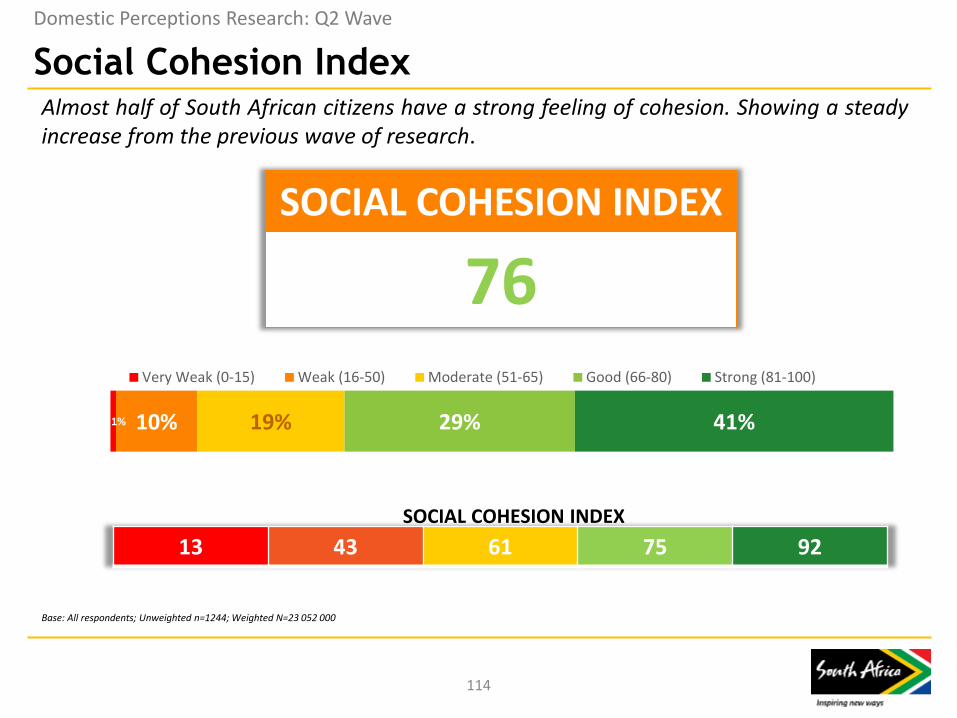
114
Domestic Perceptions Research: Q2 Wave
Base: All respondents; Unweighted n=1244; Weighted N=23 052 000
SOCIAL COHESION INDEX
76
1% 10% 19% 29% 41%
Very Weak (0-15) Weak (16-50) Moderate (51-65) Good (66-80) Strong (81-100)
13 43 61 75 92
SOCIAL COHESION INDEX
Almost half of South African citizens have a strong feeling of cohesion. Showing a steady increase from the previous wave of research.
INTERNATIONAL INVESTOR
PERCEPTIONS
Brand SA Research
To be added when new data received – 2016
Prepared by Brand SA Research
Contact:
Dr Petrus de Kock, GM – Research
Dr Judy Smith-Höhn, Research
Manager
Leigh-Gail Petersen, Researcher
Readers are welcome to use the data
contained in this report for their own
purposes provided they acknowledge
the source as: Brand South Africa,
Research & Nation Brand Performance
Presentation, October 2015, available
at: www.brandsouthafrica.com
116