BRAND SOUTH AFRICA · Contents Brand SA Mandate & Strategy Overview of Brand SA Research Nation...
91
BRAND SOUTH AFRICA Research & Nation Brand Performance Presentation Prepared by Brand South Africa Research Updated 29 September 2015 1
Transcript of BRAND SOUTH AFRICA · Contents Brand SA Mandate & Strategy Overview of Brand SA Research Nation...

BRAND SOUTH AFRICA
Research & Nation Brand Performance
Presentation
Prepared by Brand South Africa Research
Updated 29 September 2015
1

Contents ● Brand SA Mandate & Strategy
● Overview of Brand SA Research
● Nation Brand Performance – three realms of governance
– Global governance
– Political governance
– Corporate & economic governance
– Top five Ease of Doing Business destinations vs South Africa
– SA inbound & outbound investment profile
– Human & social development indicators
● Brand Reputation
– International Perceptions
● Brand SA fieldwork research – The SA Inc Series
– Project background & findings per market
– Overall findings
● Brand SA Research
– Domestic Perceptions
Presentation prepared by Brand SA.
Readers are welcome to use the data contained in this report for their own purposes provided they acknowledge
the source as: Brand South Africa, Research & Nation Brand Performance Presentation, September 2015, available
at: www.brandsouthafrica.com
2

3
BRAND SA MANDATE & STRATEGY

4
Brand SA – Core Functions
Six core functions:
1. Information, insights & ideas
2.Marketing, advertising &
branding
3. Issues management
4.Promotions & events
5.Media relationships
6.Stakeholder relationships

5
Key strategic considerations
• SA is a middle power that projects its influence primarily through soft
power interventions, with a view to long-term transformation of the world
system.
• Domestic economic challenges are amplified by domestic issues of
unemployment (especially among youth), and slow GDP growth in the
medium term.
SA’s nation brand strategy needs to focus on:
• Supporting & facilitating the NDP
• Increasing familiarity with SA in international markets
• Positioning SA as an innovative and inspiring bridge between developing
nations
• Positioning SA as a facilitator of human development through new global
partnerships
• Indicators clearly show that the African continent, BRICS, and other key
emerging markets (e.g. “the Next 11”) will remain drivers of global
growth

6
Global target audiences
Note: this list of stakeholders is not exhaustive and will change to meet new circumstances
Government
• Political leaders
• National government
• Local government
• Trade & tourism entities
• Political parties
Business
• Business Associations
• Corporates
• International Chambers
• International Trade Councils
• Export Councils
• Tourism players
• Film makers
• Conference organisers
• Economists & Analysts
• Public
• Political Parties
• NGO’s
• FBO’s
• Labour leaders
• Youth Formations
• Academia
• Gender advocacy groups
• Clubs, societies & special
interest groups (e.g.
photographers, wildlife
enthusiasts, jazz lovers,
designers, etc.)
Civil Society
Media
Influential forums
• United Nations
• AU
• SADC
• World Bank
• IMF
• BRICS
• World Economic Forum
• IATA
• WWF
Opinion leaders

7
Critical Stakeholder Collaboration & Responsibility Matrix
Brand South Africa
Department of Communications
Proudly South African
South African Tourism
TISA
National value proposition and positioning development & articulation
Brand awareness and positive image domestically
Brand awareness and positive image domestically
Define National Pride, Patriotism, Social Cohesion & Buy Local Activism
Primary agency responsible for marketing of South African Tourism
opportunities
Trade and investment
Brand awareness and positive image domestically
Communicate
nation brand attributes (Country branding)
Communicate
Government services
Communicate
products and services attributes
Communicate tourism
brand attributes (Destination marketing)
Communicate
investment offering domestically
Brand awareness and positive image internationally
Communicate
nation brand attributes (Country
Communicate local
companies’ products & services to South Africans
Communicate tourism
brand attributes (Destination marketing)
Communicate
investment offering internationally

Strategic Approach
Public Relations
Advertorials
Opinion Pieces
Thought Leadership
Articles
Advertising
Digital Platform and Social Media
The integrated multi-channel
communication approach will ensure Brand
SA reaches the Focused Stakeholder
Groupings as identified aligned to
frequency, impact and the reach objectives.
This approach will also be applied by the
various Country/Programme Managers
and Agencies in Market.
Country
Managers
8

OVERVIEW OF BRAND SA
RESEARCH
9

Brand SA takes an eclectic approach to target audience perceptions & rankings
analysis and draws insights from various research surveys and indices:
Domestic
Perceptions
Domestic Perceptions Research
Research Reference Groups
Brand SA stakeholder survey
Nation Brand
Reputation
Roper GfK. Nation Brand Index
Roper GfK. City Brands Index
Brand SA –Fieldwork in African markets (2014/15: Kenya, Ghana, Nigeria;
2015/16: DRC, Angola, Senegal, Russian Federation & BRICS)
Global
Competitiveness
World Economic Forum – Global Competitiveness Index
IMD – Competitiveness Year Book
Mo Ibrahim Index on African Governance
World Bank Ease of Doing Business etc.
Investor
Perceptions Brand SA Project Thrive on International Investor Perceptions
Media Reputation Media Tenor - Media Reputation Tracker and Analysis
Brand SA – Country Office and Agencies Media Analysis
10 10

High Level Summary of Indices and Perceptions Findings
Domestic
Perceptions
• 92% of the population are proud to be South African • Sport is one of South Africa’s highest celebrated achievements • Over 85% of the population believe that SA is a competitive and innovative nation • 95% of South Africans have a sense of belonging in the country • Despite the problems there is a strong desire to stay in the country.
Nation Brand
Reputation
• • 37/50 in 2014 – for three previous years ranked at 36/50 • Stable reputation with minor changes in some pillars • 2014 improvements in Exports, Governance, and Immigration & Investment • 2014 ranking in Tourism, People, and Culture drops
Global
Competitiveness
• 56th out of 144 economies (WEF) • 4th out of 52 African countries (IIAG) • Strengths: securities exchange regulation, auditing standards, corporate boards, banks,
financial market development, financial services, public management • Areas requiring attention: labour markets, cost of business, education, health, personal safety
Investor
Perceptions
• 40% familiarity gap - low overall familiarity with SA as a business destination • Increasingly seen as a potential growth market, rich in resources • Associations with crime and corruption issues
Media Reputation
• Slight drop off from 56.41 to 47.4 • Our biggest supporters are BRIC countries (excluding Russia) • Africa- Europe is hard on us and low coverage Middle East and South America • Key drivers were tourism, business, international diplomacy (BRICS)
11 11

NATION BRAND PERFORMANCE

Nation Brand Performance
● Governance plays a critical role in shaping the reputation of the
Nation Brand
● For this reason the updated Brand SA Nation Brand Performance
presentation will be anchored by perspectives on governance in
three realms of activity as outlined below
Governance
International
Political Corporate
13

Nation Brand Performance – Three realms of Governance
14
South Africa & BRICS Nation Brand Valuations (2014) –
Brand Finance
2nd
China with a nation brand value of
$6,352bn
10th
Brazil with a nation brand value of
$1,403bn
8th
India with a nation brand value of
$1,621bn
12th
Russian Federation with a nation brand value of $1,167bn
35th
South Africa with a nation brand value of
$256bn
Source: Brand Finance, Annual Report on Nation Brands, December 2014
15
GLOBAL GOVERNANCE
Nation Brand Performance

Nation Brand Performance – Global Governance
The Nation Brand’s global and domestic reputation is to a large extent
shaped by perceptions of efficient internal governance, while the
nation brand’s contribution to global governance has a direct bearing
on international perceptions
Global Governance Contribution
Peaceful internally negotiated
political settlement
Active role in transforming OAU to
AU & contribution to Peace &
Security on the African continent
Served 2 terms as non-permanent
member of the UN Security Council
Champion of New Partnership for
Africa’s Development
Plays an active role in the G20 Included as fifth member of BRICS
17

POLITICAL GOVERNANCE
Nation Brand Performance

Nation Brand Performance – Political Governance
Constitution of the Republic of South Africa
Preamble
We, the people of South Africa,
Recognise the injustices of our past;
Honour those who suffered for justice and freedom in our land;
Respect those who have worked to build and develop our country; and
Believe that South Africa belongs to all who live in it, united in our diversity.
We therefore, through our freely elected representatives, adopt this Constitution as the
supreme law of the Republic so as to
• Heal the divisions of the past and establish a society based on democratic values, social
justice and fundamental human rights;
• Lay the foundations for a democratic and open society in which government is based on the
will of the people and every citizen is equally protected by law;
• Improve the quality of life of all citizens and free the potential of each person; and
• Build a united and democratic South Africa able to take its rightful place as a sovereign state
in the family of nations.
May God protect our people.
Nkosi Sikelel’ iAfrika. Morena boloka setjhaba sa heso.
God seën Suid-Afrika. God bless South Africa.
Mudzimu fhatutshedza Afurika. Hosi katekisa Afrika.
19
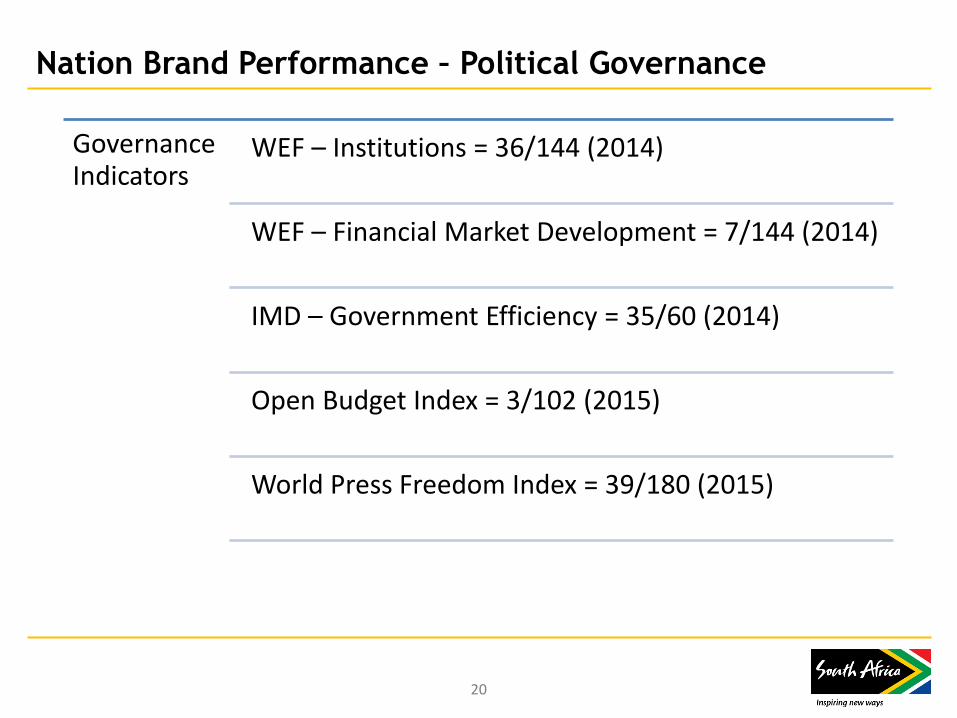
Nation Brand Performance – Political Governance
Governance Indicators
WEF – Institutions = 36/144 (2014)
WEF – Financial Market Development = 7/144 (2014)
IMD – Government Efficiency = 35/60 (2014)
Open Budget Index = 3/102 (2015)
World Press Freedom Index = 39/180 (2015)
20

African Peer Review Mechanism Country Report 2014 Highlights
Democracy and Political Governance
● Initiatives launched to improve transparency and accountability in the
governance of the country include Corruption Watch (luanched by COSATU,
BUSA and the National Anti-Corruption Forum) and the National Anti-Corruption
Hotline (managed by Public Service Commission)
South Africa improved its score from 2013 to 2014 in Transparency
International’s Corruption Perception Index – from 42 to 44 on a scale of 0-100.
In terms of perceptions of public sector corruption, it performs better than its
BRICS partners, ranking 67th out of 175 countries and lies above the regional
average (33/100).
Nation Brand Performance: Political Governance
The APRM – an instrument voluntarily acceded to by AU member states – was established to foster the adoption of policies, standards and practices that lead to political stability, high economic growth, sustainable development and accelerated subregional and continental economic integration. This objective is achieved through sharing of experiences and reinforcement of successful and best practices.
21

The Mo Ibrahim Index of African Governance 2014 (1)
● The Mo Ibrahim Foundation defines governance as the provision of the
political, social and economic goods that any citizen has the right to expect
from his or her state, and that any state has the responsibility to deliver to
its citizens.
● IIAG: annual assessment of quality of governance in every African country
● IIAG combines over 100 variables from over 30 independent sources; most
comprehensive collection of data on African governance
● Assesses governance provision within four distinct conceptual categories:
Nation Brand Performance: Political Governance
Safety &
Rule of Law
Sustainable
Economic
Opportunity
Participation
& Human
Rights
Human
Development
22

The Mo Ibrahim Index of African Governance 2014 (2)
● South Africa ranks 4th out of 52 countries overall
● Scores in the Top 10 in all four categories
Nation Brand Performance: Political Governance
Safety &
Rule of Law
Sustainable
Economic
Opportunity
Participation
& Human
Rights
Human
Development
2nd 6th 4th 8th
23

The Mo Ibrahim Index of African Governance 2014 (3)
Nation Brand Performance: Political Governance
SUSTAINABLE ECONOMIC OPPORTUNITY
PARTICIPATION AND HUMAN RIGHTS
SAFETY AND SECURITY
HUMAN DEVELOPMENT
Source: Mo Ibrahim Foundation, 2014 IIAG
24

CORPORATE & ECONOMIC
GOVERNANCE
Nation Brand Performance

King Code on Corporate Governance for South Africa
● In 1992, at a time when South Africans were adjusting to the fact that
they would be moving towards a new democratic society, former
South African Supreme Court Judge Mervyn King was asked to chair a
private‐sector body to draft corporate governance guidelines.
● The body became known as the King Committee, and its first report,
issued in 1994, was regarded by many as ahead of its time in adopting
an integrated and inclusive approach to the business life of
companies, embracing stakeholders other than shareholders.
● The Committee subsequently revised its report in 2002, and more
recently in 2009. The current King Code on Corporate Governance for
South Africa (also called "King III") is again pointing to the next level
in governance by encouraging the integration of governance and
sustainability into the strategy, operations, and reporting of an
organization.
Nation Brand Performance:Corporate Governance
26
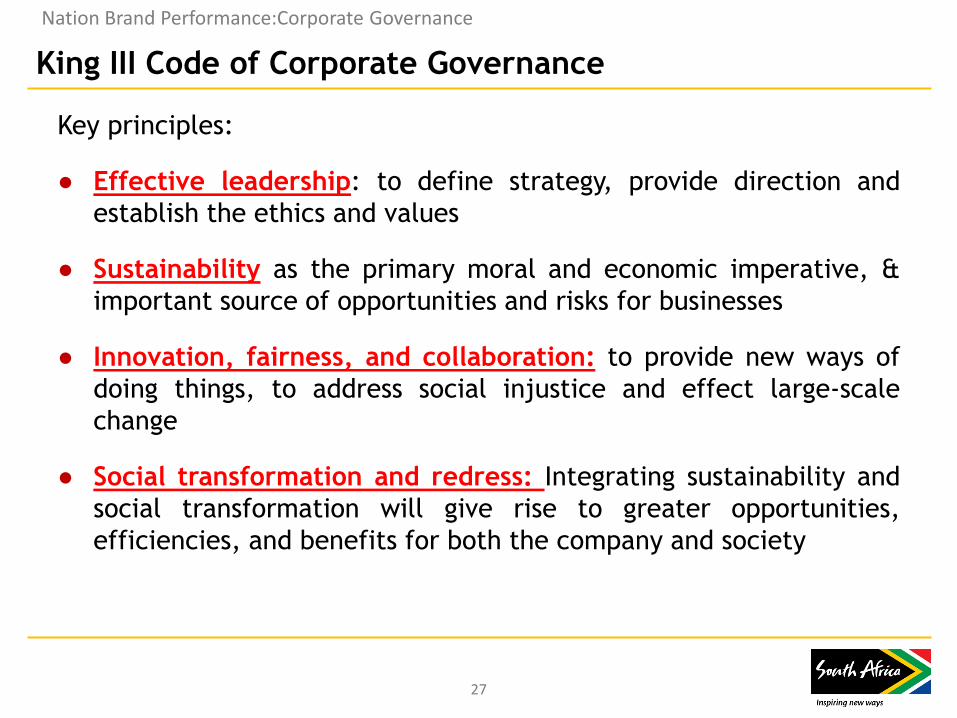
King III Code of Corporate Governance
Key principles:
● Effective leadership: to define strategy, provide direction and
establish the ethics and values
● Sustainability as the primary moral and economic imperative, &
important source of opportunities and risks for businesses
● Innovation, fairness, and collaboration: to provide new ways of
doing things, to address social injustice and effect large-scale
change
● Social transformation and redress: Integrating sustainability and
social transformation will give rise to greater opportunities,
efficiencies, and benefits for both the company and society
Nation Brand Performance:Corporate Governance
27
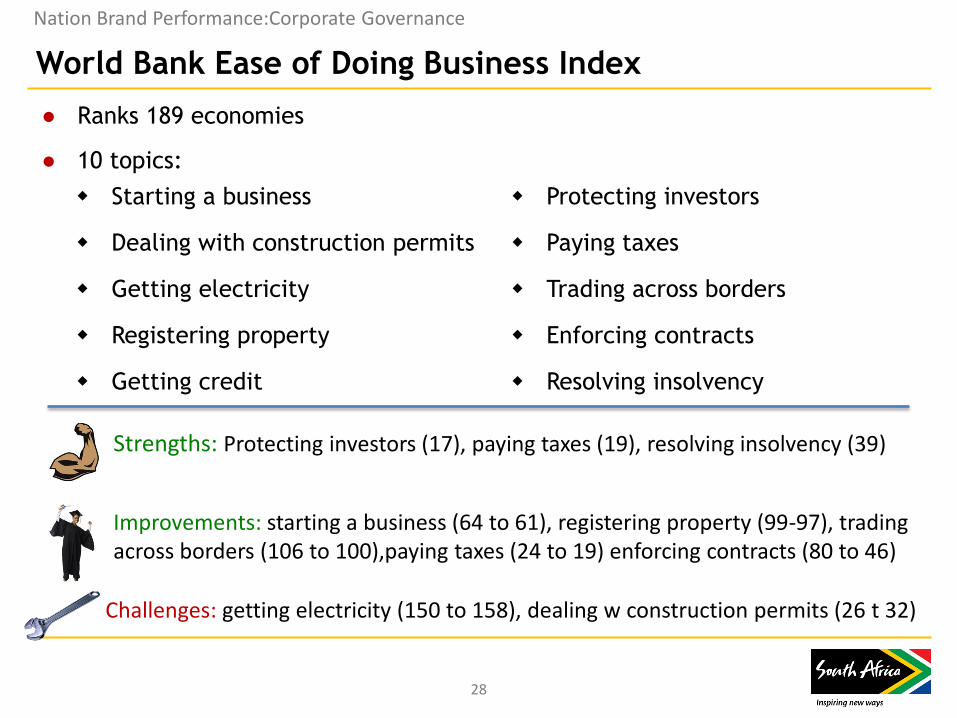
Starting a business Protecting investors
Dealing with construction permits Paying taxes
Getting electricity Trading across borders
Registering property Enforcing contracts
Getting credit Resolving insolvency
World Bank Ease of Doing Business Index
● Ranks 189 economies
● 10 topics:
Nation Brand Performance:Corporate Governance
Strengths: Protecting investors (17), paying taxes (19), resolving insolvency (39)
Improvements: starting a business (64 to 61), registering property (99-97), trading across borders (106 to 100),paying taxes (24 to 19) enforcing contracts (80 to 46)
Challenges: getting electricity (150 to 158), dealing w construction permits (26 t 32)
28

WEF Competitiveness Report
Nation Brand Performance:Corporate Governance
● Ranks 144 economies, SA and Mauritius are top African performers
● 12 competitiveness pillars:
Institutions Labor market efficiency
Infrastructure Financial market development
Macroeconomic environment Technological readiness
Health and primary education Market size
Higher education and training Business sophistication
Goods and market efficiency Innovation
Strengths: Institutions (36), Goods and market efficiency (32), Business sophistication (31), financial market development (7), market size (25)
Improvements: infrastructure (66 to 60), health and primary education (135 to 132)
Challenges: labour market efficiency (113), innovation (39 to 43)
29

TOP 5 COUNTRIES VS SOUTH
AFRICA
World Bank Ease of Doing Business Index 2015

South Africa vs Korea
EDB Overall Ranking-2015 South Africa: 43 Korea: 5
World Bank Ease of Doing Business Index 2015
Source: World Bank (2014): Doing Business 2015: Going Beyond Efficiency
31

South Africa vs Denmark
32
EDB Overall Ranking-2015 South Africa: 43 Denmark: 4
World Bank Ease of Doing Business Index 2015
Source: World Bank (2014): Doing Business 2015: Going Beyond Efficiency

South Africa vs Hong Kong
EDB Overall Ranking-2015 South Africa: 43 Hong Kong: 3
World Bank Ease of Doing Business Index 2015
Source: World Bank (2014): Doing Business 2015: Going Beyond Efficiency
33

South Africa vs New Zealand
EDB Overall Ranking-2015 South Africa: 43 New Zealand: 2
World Bank Ease of Doing Business Index 2015
Source: World Bank (2014): Doing Business 2015: Going Beyond Efficiency
34

South Africa vs Singapore
EDB Overall Ranking-2015 South Africa: 43 Singapore: 1
World Bank Ease of Doing Business Index 2015
Source: World Bank (2014): Doing Business 2015: Going Beyond Efficiency
35

WB Ease of Doing Business Index 2015: The Next 11
36
World Bank Ease of Doing Business Index 2015
Source: World Bank (2014): Doing Business 2015: Going Beyond Efficiency

SA INBOUND & OUTBOUND
INVESTMENT PROFILE
Nation Brand Performance

Inbound Investment
Director-General of the Department of Trade & Industry – Mr Lionel
October
● Investment is the most reliable predictor of future economic
growth.
● The fastest growing developing countries have Gross Domestic
Fixed Investment (GDFI) to Gross Domestic Product (GDP) ratios of
above 30% while SA’s is around 20% against the NDP target of 30%.
● At the aggregate level, the challenge South Africa faces is that
private-sector investment is not growing fast enough to grow the
economy by 5%.
SA Investment Profile
38
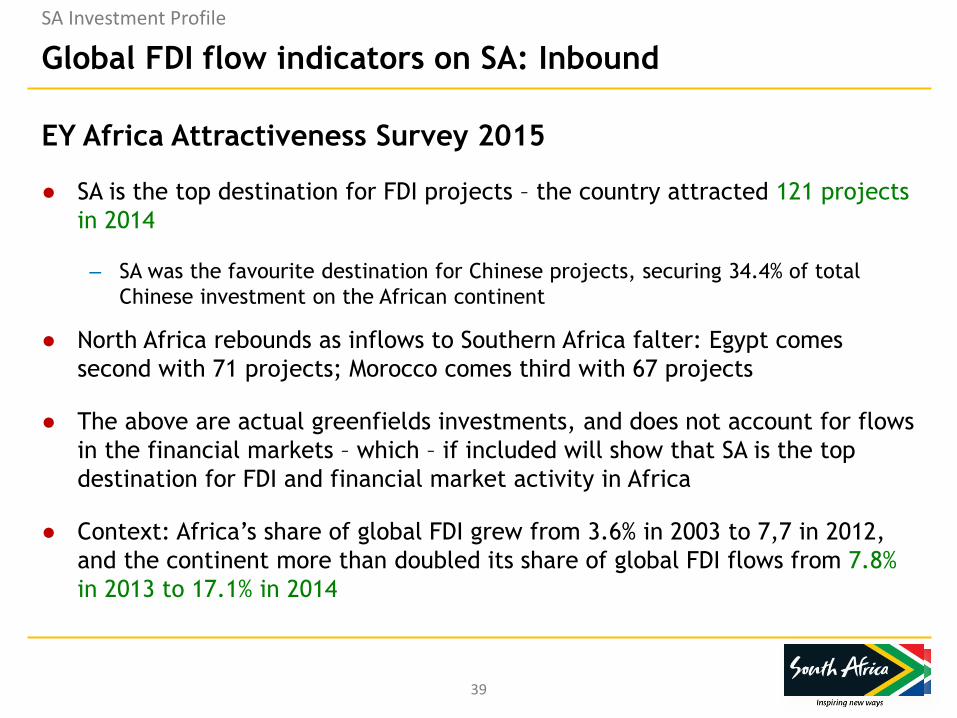
Global FDI flow indicators on SA: Inbound
EY Africa Attractiveness Survey 2015
● SA is the top destination for FDI projects – the country attracted 121 projects
in 2014
– SA was the favourite destination for Chinese projects, securing 34.4% of total
Chinese investment on the African continent
● North Africa rebounds as inflows to Southern Africa falter: Egypt comes
second with 71 projects; Morocco comes third with 67 projects
● The above are actual greenfields investments, and does not account for flows
in the financial markets – which – if included will show that SA is the top
destination for FDI and financial market activity in Africa
● Context: Africa’s share of global FDI grew from 3.6% in 2003 to 7,7 in 2012,
and the continent more than doubled its share of global FDI flows from 7.8%
in 2013 to 17.1% in 2014
SA Investment Profile
39

Global FDI flow indicators on SA: Inbound
SA Investment Profile
EY Africa Attractiveness Survey 2015: SA remains on top
Source: EY Africa Attractiveness Survey 2015
40

Outbound Investment
● 2013 budget speech of then minister of Finance, Pravin Gordhan, indicated that
during the 2008-2013 period the South African Reserve Bank approved nearly 1
000 large investments by South African corporations into 36 African countries
● NDP underlines critical importance of boosting intra-African trade and
integration of regional markets
● Johannesburg Stock Exchange currently ranked the 19th largest stock exchange
in the world by market capitalisation and the largest exchange in Africa
● Industrial Development Corporation (IDC) has investments in 60 projects across
20 countries that creates a cumulative African investment portfolio of R7.5
billion by March 2014
● With so many SA and multinational corporates that operate from Joburg into
other African markets, the city’s logistical, air, inland port, and related soft
infrastructure provides a solid base for corporates to establish regional
headquarters
SA Investment Profile
41

Global FDI flow indicators on SA: Outbound
EY – Africa Attractiveness Survey (2015)
● South Africa is the second largest source of FDI into the African
continent (53 projects launched in 2014).
● SA is the leading intra-regional investor in the financial services
sector (16 projects launched in 2014)
SA Investment Profile
42

Intra-SADC investment
SA Investment Profile
• South Africa plays pivotal role
in the economic revival of the
continent
• Contributes 68% of SADC GDP
• SA invested USD1,4b in 75
new FDI projects in Africa
(2012)
• Created 50,000 jobs Africa-
wide
Source: Inside Southern Africa, September 2015
43

Department of Trade and Industry
● Department of Trade & Industry FDI trend data:
– Gross Domestic Fixed Investment has been growing steadily since the
Global Financial Crisis.
– FDI in 2013 was boosted by the R20bn Barclays investment.
– Latest FDI data show that SA attracted over R140bn in 2013-14.
– Global FDI fell by 16% in 2014.
– SA FDI inflows also slowed in 2014 but remain at a level almost double
the level of FDI in 2012.
● SA FDI performance is not unusual as:
– many multinationals already operate in SA,
– we have sophisticated financial markets to raise domestic capital, and
– our FDI stock is already high by international standards (42%).
SA Investment Profile
44

SA Investment Profile
480
500
520
540
560
580
600
620
640
R b
illio
ns
SA Annual Real GDFI 2009-14 (Rb 2010-Prices)
Source: SARB, 2015, Quarterly Bulletin
-
10
20
30
40
50
60
70
80
90
R b
illio
ns
SA Annual FDI 2009-14 (Rb Current-Prices)
Source: SARB, 2015, Quarterly Bulletin
45

Countries investing in South Africa
Top investors:
UK – 32%
USA – 23%
China – 13%
Italy – 7%
Mauritius – 4%
France – 4%
Japan – 3%
Germany – 2%
Spain – 2%
Other , 4%
Netherlands, 1%
Belgium, 1%
UAE, 1%
Switzerland, 1%
Canada, 1%
India, 1%
Spain, 2%
Germany, 2%
Japan, 3%
France, 4%
Mauritius, 4%
Italy, 7%
China, 13%
USA, 23%
UK, 32%
Countries investing in South Africa 2014
SA Investment Profile
Source: FDIMarkets
46

DTI’s National Initiative: One Stop Investment Centre (1)
● DTI working on implementing this national initiative
● Gauteng Growth and Development Agency’s successful One Stop Shop at
GIC, Sandton (government services represented e.g. SARS, Home Affairs)
● National centre: central operational structure to act as implementing body
and serve as convener for one stop investment centre
● Will improve investment climate and ease of doing business by identifying
bottlenecks, administrative barriers & have plan of action to improve
service delivery
● Focus: reducing regulatory inefficiencies, setting up norms and standards,
turnaround times, coordinate, fast track, unblock and reduce red tape for
all investors
SA Investment Profile
47

Infrastructure
Indicators
WEF – Quality of road = 37/144 (2014)
WEF – Quality of railroad infrastructure = 44/144 (2014)
IMD – Overall improvement on infrastructure from 58/60 -55/60 (2013-2014)
IIAG – Overall Infrastructure 3/52 (2014); road network
SA Investment Profile : Infrastructure (1)
Road and Rail Transport
A massive motorway improvement scheme has seen extra
lanes added, a sophisticated electronic toll system
introduced and interchanges drastically renovated
The Gautrain rapid rail system links the OR Tambo
International Airport with stations in Johannesburg and
Pretoria
South Africa has world-class infrastructure, including an excellent transport network, low-cost energy and sophisticated telecommunications facilities
48

SA Investment Profile : Infrastructure (2)
Ports
Most advanced port infrastructure on the African continent
Saldanha Bay in the Western Cape is the largest natural anchorage with the deepest water, 60 nautical miles northwest of Cape Town
The Durban port in KZN handles the greatest volume of sea-going traffic of all SA ports
The Richards Bay Port in KZN can handle a total of 1 782 ships with a gross tonnage of 65 994 515 in a year
The Port Elizabeth Port in the Eastern Cape handled a total of 1,176 ships during the 2011/12 financial year
The Cape Town Port in the Western Cape competes with Alexandria for recognition as the most famous port in Africa
Infrastructure
Indicators
WEF – Quality of transport infrastructure 32/144 (good by regional standards)
WEF – Quality of port infrastructure = 46/144 (2014)
IMD – Improvements on basic infrastructure from 56/60 to 52/60 (2011-2014)
49
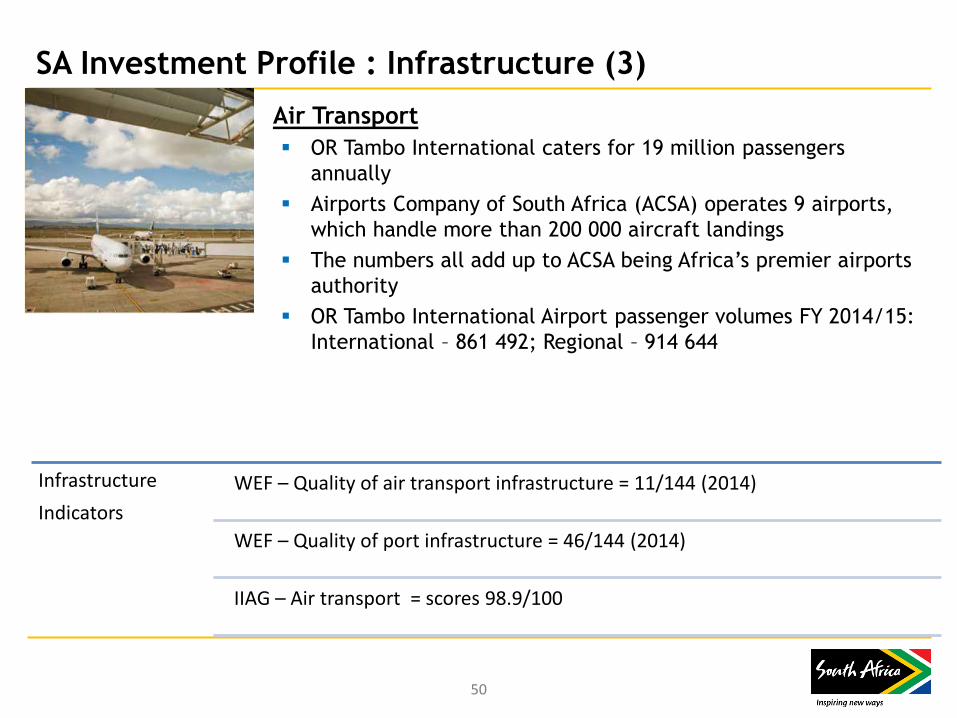
SA Investment Profile : Infrastructure (3)
Air Transport
OR Tambo International caters for 19 million passengers
annually
Airports Company of South Africa (ACSA) operates 9 airports,
which handle more than 200 000 aircraft landings
The numbers all add up to ACSA being Africa’s premier airports
authority
OR Tambo International Airport passenger volumes FY 2014/15:
International – 861 492; Regional – 914 644
Infrastructure
Indicators
WEF – Quality of air transport infrastructure = 11/144 (2014)
WEF – Quality of port infrastructure = 46/144 (2014)
IIAG – Air transport = scores 98.9/100
50

SA Investment Profile : Infrastructure (4)
Infrastructure
Indicators
WEF – Quality of overall infrastructure = 52/144 (2014)
IMD – Overall improvement on infrastructure from 58 to 55/60 (2013-2014)
IMD – Improvements on basic infrastructure from 56 to 52/60 (2011-2014)
IIAG – Overall Infrastructure 3/52 (2014)
51
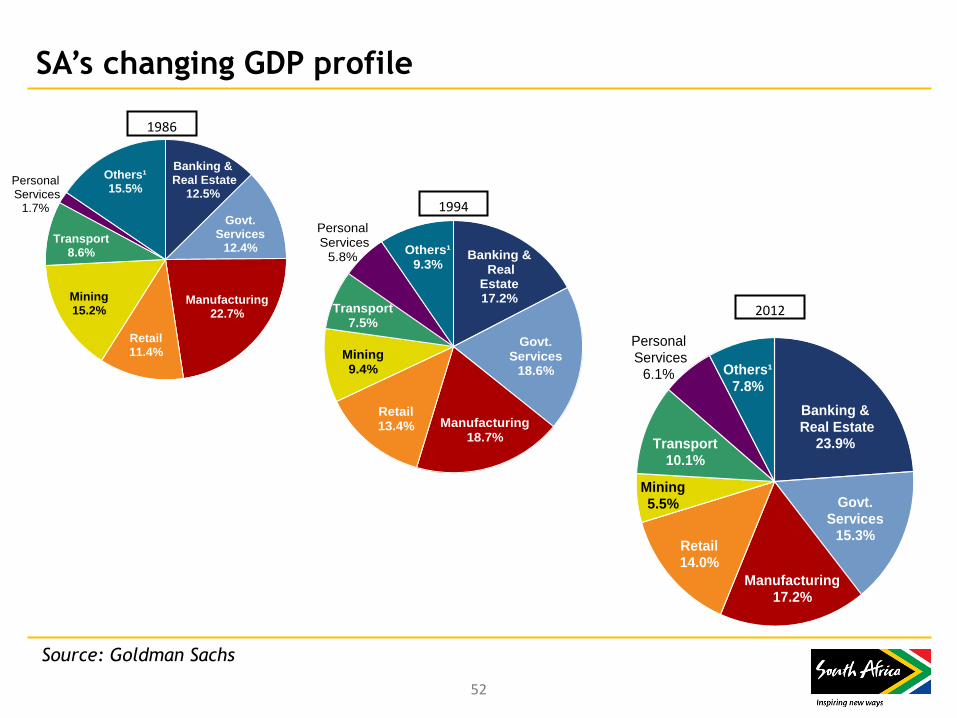
SA’s changing GDP profile
Banking &Real Estate
12.5%
Govt. Services
12.4%
Manufacturing22.7%
Retail11.4%
Mining15.2%
Transport8.6%
PersonalServices
1.7%
Others¹15.5%
Banking &Real
Estate17.2%
Govt. Services
18.6%
Manufacturing18.7%
Retail13.4%
Mining9.4%
Transport7.5%
PersonalServices
5.8%Others¹
9.3%
Banking &Real Estate
23.9%
Govt. Services
15.3%
Manufacturing17.2%
Retail14.0%
Mining5.5%
Transport10.1%
PersonalServices
6.1% Others¹7.8%
1986
1994
2012
Source: Goldman Sachs
52

HUMAN & SOCIAL
DEVELOPMENT INDICATORS
Nation Brand Performance
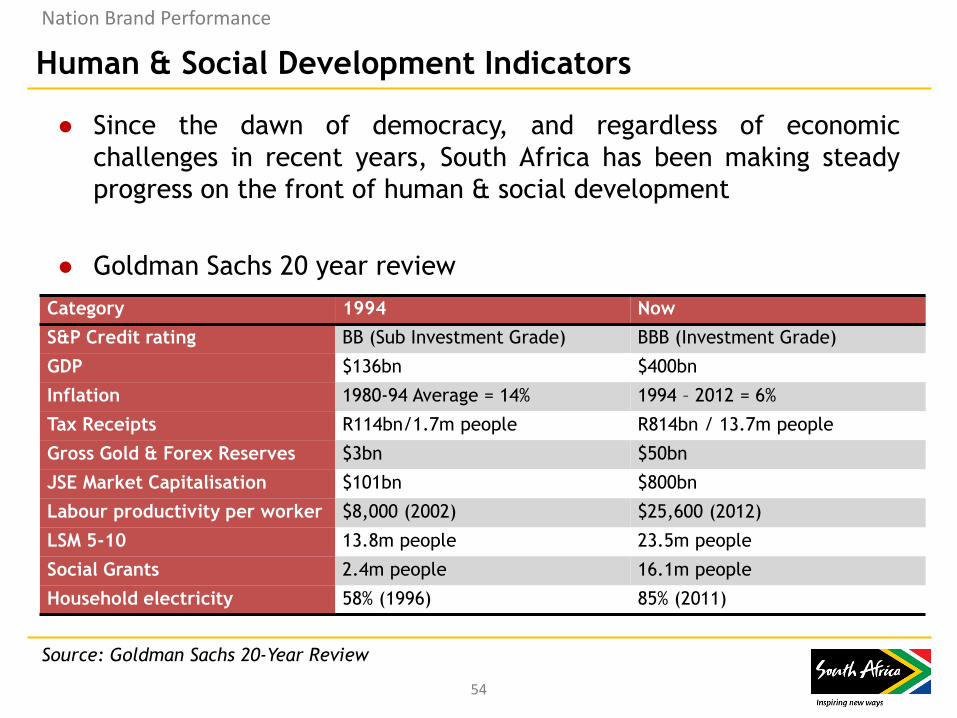
Human & Social Development Indicators
● Since the dawn of democracy, and regardless of economic
challenges in recent years, South Africa has been making steady
progress on the front of human & social development
● Goldman Sachs 20 year review
Category 1994 Now
S&P Credit rating BB (Sub Investment Grade) BBB (Investment Grade)
GDP $136bn $400bn
Inflation 1980-94 Average = 14% 1994 – 2012 = 6%
Tax Receipts R114bn/1.7m people R814bn / 13.7m people
Gross Gold & Forex Reserves $3bn $50bn
JSE Market Capitalisation $101bn $800bn
Labour productivity per worker $8,000 (2002) $25,600 (2012)
LSM 5-10 13.8m people 23.5m people
Social Grants 2.4m people 16.1m people
Household electricity 58% (1996) 85% (2011)
Nation Brand Performance
Source: Goldman Sachs 20-Year Review
54

Human & Social Development Indicators
South Africa HDR indicators
Year Rank HDR value Life
expectancy
Mean yrs of
schooling
Expected
yrs of
schooling
Gross national
income
2013/14 118 0.658 56.9 9.9 13.1 $ 11,788
(PPP)
2012/13 121 0.629 53.4 8.5 13.1 $ 9594
(PPP)
2011 123 0.619 52.8 8.5 13.1 $ 9469
(PPP)
Nation Brand Performance
Source: UNDP, Human Development Report 2014
55

INTERNATIONAL PERCEPTIONS
Brand Reputation

High level findings on SA’s global reputation
Nation Brand Index
Over-all position 37/50 (stable reputation with minor score changes in NBI
hexagon pillars)
City Brand Index
SA cities rank relatively low on the CBI
Cape Town 42/50
Johannesburg 44/50 – Johannesburg makes a marked improvement in the 2013 CBI
Durban 47/50
Brand Reputation: International Perceptions
57

Exports Tourism
Governance
Culture and Heritage
People Skills and openness
Investment Potential and
attractiveness to outsiders
Commercial and cultural
products and sporting prowess
Competency fair
governance, human
rights, international
contribution
Potential attractiveness
and economical
contribution
Level of
satisfaction with
country’s products
and services
Investment &
immigration
South Africa’s Performance on the Nation Brand Index 2014
58
Brand Reputation: International Perceptions
Source: Anholt-GfK Roper Nation Brands Index
58

SA Reputation Rankings - Strengths
• SA’s reputation globally remains stable in years of global financial turmoil that impacted negatively on developed markets
• South Africa’s Culture remains its strongest asset (27th), esp. admired for sporting excellence
• With a strong People profile (34th globally), South Africans are admired across most panel countries, esp. strong in Commonwealth and Western Europe, India and China
• South Africa continues to rank 34th globally on Tourism, with strong perceptions as being naturally beautiful (15th).
• SA seen as making a significant contribution to global culture
• Potential for Higher Education opportunities
• SA is seen as a growing economy with potential for development
• SA’s infrastructure is a key attractiveness feature for international business
• SA’s transition to democracy and diversity seen as important reputation enhancers
Brand Reputation: International Perceptions
Sources: Nation Brand Index, City Brand Index & Project Thrive
59

SA Reputation Rankings – Challenges & Weaknesses
• South Africa faces most difficulty on Governance
• On Immigration/Investment (38th), the Index ranking is pulled down by a 41st-place ranking on quality of life but has strong anchor as place to work and live (34th)
• Safety & security/crime impacts negatively on perceptions of SA
• Corruption
• Poverty alleviation
• Not perceived as technologically advanced, esp. Central and Eastern Europe, South Korea, Mexico and Japan
• SA products mostly associated with agriculture, crafts & food – calls for need to profile other SA products, manufactured goods & services (NBI)
• Findings on reputation of SA cities indicate a need for more concerted effort to build awareness & reputation – perceptions of key city offerings have direct impact on Nation Brand (Johannesburg’s performance improved)
60
Brand Reputation: International Perceptions
Sources: Nation Brand Index, City Brand Index & Project Thrive

61
THE SA INC SERIES
PROJECT BACKGROUND & FINDINGS
PER MARKET
Brand SA Fieldwork Research

62
The SA Inc. Research Project (1)
The SA Inc project aims to:
Contribute to the development of a framework of analysis that considers all
the elements of South Africa’s strategic economic, diplomatic, multilateral,
as well as peace & security engagements on the continent – all of these
elements shape the brand reputation;
The project Rationale:
South Africa’s reputation is shaped by more than foreign policy, or trade
interactions. It is shaped by a divergent sets of relationships and
interests. Therefore depends on, and is influenced by a range of
governmental, non-governmental, and business relationships;
Towards an integrated nation brand analysis:
In addition such a framework of analysis will provide Brand South Africa with
an integrated view of South Africa’s footprint on the continent for strategic
marketing, communications, and reputation management projects.
Brand SA Fieldwork Research

63
The SA Inc. Research Project (2)
Baseline of SA footprint per key African market - identify key reputational drivers (threats & opportunities)
Multilateral & Bilateral Relations
Peace & Security
Investment
Trade, FDI, Business
Inputs: Peace & Security;
Trade; FDI; Bilateral;
Multilateral activities and
associated value of such
activities
Output: Integrated
Framework of Analysis
Brand SA Fieldwork Research

64
Cycle 1 – 2014/15: Kenya, Nigeria, Ghana
● Brand SA’s Africa strategy: development of SA presence & reputation
in select markets/multilateral environments (e.g. BRICS, and
selected key strategic markets);
● South Africa In(c) series research reports based on:
– direct fieldwork studies
– desktop research
• The SA In(c) series aims to develop holistic/integrated understanding
of SA footprint in international markets
Brand SA Fieldwork Research
The SA Inc. Project: Fieldwork

65
The SA Inc. Project: Objectives
● Development of framework of analysis that considers all elements
of SA’s strategic economic, diplomatic, multilateral, and peace &
security engagements on the continent
● Rationale: SA’s reputation is shaped by foreign policy, trade
interactions, AND relationships and interests. Therefore depends
on, and is influenced by a range of governmental, non-
governmental, and business relationships
● Framework will provide Brand SA with integrated view of SA
footprint on continent for strategic marketing, communications,
and reputation management projects
Brand SA Fieldwork Research

66
SA Inc. Project: Kenya – South Africa Bilateral Trade
Total Bilateral Trade (2014)
Kenya Imports from SA
R 7 822 930 304
SA Imports from Kenya
R 366 206 571
Total Bilateral Trade R 8,189,136, 875
Brand SA Fieldwork Research

67
SA Inc. Project: Kenya Key Findings
The fieldwork yielded several insights regarding both challenges and
opportunities for interaction between the countries.
From a reputational point of view SA has major influence on two fronts:
1. As a result of SA democratic transition, strong institutions;
2. As a result of major interest in SA music & culture.
However, through the fieldwork it has become apparent that:
1. SA is seen as losing its competitive edge, & that it is not doing enough
to promote internal development;
2. The SA character or personality perceived as imposing and aggressive;
3. SA companies losing to local competition due to poor market entry
strategies and ‘know it all’ attitudes.
Brand SA Fieldwork Research

68
SA Inc. Project: Nigeria – South Africa Bilateral Trade
Total Bilateral Trade (2014)
Nigeria Imports from SA
R 10 546 842 578
SA Imports from Nigeria
R 55 704 188 272
Total Bilateral Trade R 66 251 030 850
Brand SA Fieldwork Research

69
SA Inc. Project: Nigeria Key Findings From a reputational point of view SA has major influence on several fronts:
1. With more than 150 companies active in the market, SA is highly visible, and
respected in many areas of national competency
2. SA’s democratic transition, institutional & infrastructural profile appreciated
& often referenced as key attractiveness feature
3. Nigerian respondents keen to interact with & explore opportunities with SA
for business & investment interactions and for cultural, music, tourism &
related experiences
However, through the fieldwork it has become apparent that:
1. While SA has a major business and investment footprint in market, concerns
exist about the South African character and business culture
2. With Nigeria’s rebased GDP some consider SA to be losing competitive edge
3. SA character/business persona at times perceived as imposing & aggressive
4. SA companies losing to local competition due to quick adaptation & learning
by local competition and lack of identifying & involving local partners in
market entry, maintenance, and expansion strategies
Brand SA Fieldwork Research

70
SA Inc. Project: Ghana– South Africa Bilateral Trade
Total Bilateral Trade (2014)
Ghana Imports from SA
R 3 723 629 774
SA Imports from Ghana
R 7 101 559 112
Total Bilateral Trade R 10 825 188 886
Brand SA Fieldwork Research

71
SA Inc. Project: Ghana Key Findings
South Africans & their corporate governance, managerial, technical, & other
expertise respected; reflects positively on reputation of the nation brand
Strong people-to-people relations & potential for expansion in creative
spheres
Nation’s reputation in international markets rely on more than government-
to-government relations, & mostly shaped by experience & perceptions of
South African individuals and corporate brands
SA corporates & their products & services widely known & utilised in market
Ghanaians appear to prefer ‘international brands’, incl. those from SA
Tremendous potential in building deeper social & cultural relations via music,
arts, design and cultural diplomacy
SA entrepreneurs use Accra as regional base/hub for West African business
operations
Brand SA Fieldwork Research

72
SA INC PROJECT – OVERALL
FINDINGS
Brand SA Fieldwork Research

73
1. The Nation Brand concept and the execution of nation brand
marketing strategy depends on stakeholder interactions, and
challenges Brand SA to be open to changing domestic and
international environments
2. The initial fieldwork findings indicate unique nation brand
reputational strengths in areas such as: culture, music, business
sophistication, infrastructure, political management of democratic
transitions
3. On the negative side South Africans are perceived as imposing,
aggressive, and unwilling to listen to local advice
The SA Inc. Project: Key Findings (1)
Brand SA Fieldwork Research

74
The SA Inc. Project: Key Findings (2)
4. From a business perspective it implies that more attention needs to
be paid to the manner in which South Africans interact with African
peers, and how market entry strategies are designed by
incorporating soft factors such as business culture;
5. From a political point of view South Africa is seen as progressive,
that it has strong institutions, and democratic credentials to
underpin its constitution. However, internal developmental
challenges, xenophobia, and misplaced perceptions about African
expats in South Africa is a cause for concern in Kenya and Nigeria;
6. While the above is a sensitive issue, it should be noted that South
African music, art, and cultural products are well received,
followed, and fieldwork finds a keen interest in expanded
interaction in these realms.
Brand SA Fieldwork Research

75
The SA Inc. Project: Publications
A lesson for Brand SA from Nigeria - Be bold, keep it real, and
make it quick - a conversation on the art of Nollywood success.
23 August 2014, Brand South Africa Research Note. By: Dr Petrus de
Kock
Researching the Nation Brand – background to the concept, and
initial findings from fieldwork in Kenya and Nigeria. 18
September 2014. South Africa In(c) Series Research Report #1 By: Dr
Petrus de Kock
African market entry strategy – learning to listen & listening to
learn. 12 December 2014. Brand South Africa Research Note #2.
2014. By: Dr Petrus de Kock
Brand SA Fieldwork Research

DOMESTIC PERCEPTIONS
Brand SA Research

Research Design
• n=2 524 Interviews were conducted via face-to-face, door-to-door interviews in the homes of respondents, using a structured (Computer Aided Personal Interviewing) CAPI questionnaire.
How
• The sample included male and female adults aged 15+
• Nationally representative across age, race, gender, income, community size and region
Who
• All urban areas covering 94% of SA’s adult population
• The sample includes all metros and cities and a representative sample of towns and villages
Where
• Fieldwork conducted by service provider AC Nielsen contracted for 2014-2017 When

78
80 68 73
Pride Index Active Citizenship Index Social Cohesion Index
National Level Indices
Summary
How do we make it stronger?
Focus on the youth – need to highlight the enablers for their growth in South Africa
Low score driven by lack of time to actively participate in community building activities by the working class & lack of motivation of the unemployed
• Stronger & clearer communication about Play Your Part initiative
• Leverage non traditional media
• Drive inclusiveness among the coloured, the elderly & the lower LSMs

79
69
14 13 4
Black White Coloured Indian
Who they are
Base: All respondents; Unweighted n=2524; Weighted N=23 801 000 QPD1 – Race; QPD17 – LSM; Q1 - Age
RACE
38%
17%
15%
9%
6%
6% 5% 2% 2%
GP WC KZN EC FS MP NW LP NC
PROVINCE AGE
23%
27% 19%
13%
18%
15-24 yrs 25-34 yrs 35-44 yrs 45-54 yrs 55+ yrs

80
Who they are Over the past 10 years people have become more affluent
Base: All respondents; Unweighted n=2524; Weighted N=23 801 000 - QPD17 – LSM & Source: AMPS (Weighted by Population)
29 22 18
27 35 40
11 17 21 11 15
16
2004 2009 2014
LSM 9/10
LSM 7/8
LSM 5/6
LSM 3/4
22 32 37
10% 5%
7% 5%
7% 4%
45%
31%
24%
LSM 4-6 LSM 7-8 LSM 9-10
LSM

81
Beliefs With the rise of the middle class and people focusing more on career aspirations, they choose to spend limited spare time at their disposal with family rather than joining
local / community initiatives
Base: All respondents; Unweighted n=2524; Weighted N=23 801 000 Q9. I am going to read out some statements that may or may not apply to you. For each I read out, please tell me to what extent you agree or disagree with that statement. Now, to what extent do you agree or disagree that …? [SA per statement] / Q14. I am now going to read out a list of actions, and for each one I would like you to tell me how important it is for members of society to participate in each? [SA per statement]
48
48
43
38
38
35
12
Revert to close family when needadvice
Family orientated and spend most ofspare time with them
Can handle anything that gets thrownyour way
Work plays an important part in yourlife
In your spare time, you prefer to stayat home rather than be out and about
An Optimistic Individual
Friends replace family
61
58
56
51
49
40
40
36
Voting in elections
Keeping informed about country…
Keeping informed about community…
Helping the needy
Supporting local businesses
Making time to focus on interests
Watching sporting events
Joining local / community initiatives
82
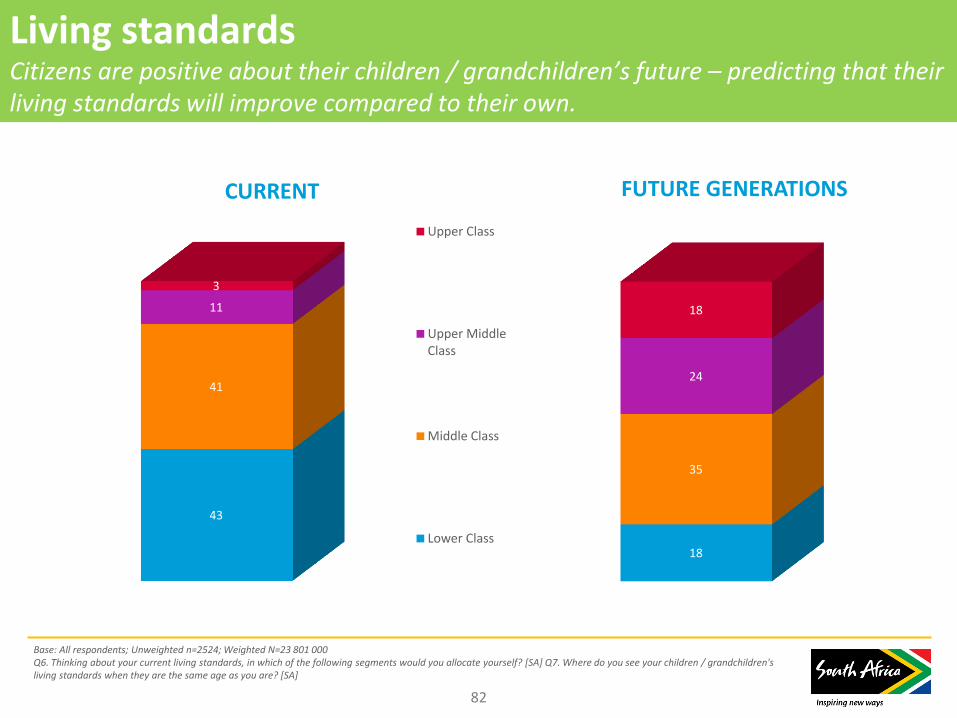
Living standards Citizens are positive about their children / grandchildren’s future – predicting that their living standards will improve compared to their own.
Base: All respondents; Unweighted n=2524; Weighted N=23 801 000 Q6. Thinking about your current living standards, in which of the following segments would you allocate yourself? [SA] Q7. Where do you see your children / grandchildren's living standards when they are the same age as you are? [SA]
43
41
11
3
CURRENT
Upper Class
Upper MiddleClass
Middle Class
Lower Class18
35
24
18
FUTURE GENERATIONS

83
Citizens display high levels of patriotism towards South Africa
Base: All respondents; Unweighted n=2524; Weighted N=23 801 000 Q46. Different people say different things about South Africa. I am again going to read out some statements that have been made about our country. Please tell me to what extent you agree or disagree with each statement. [SA per statement]
85 85 73 78
69 57
9 11
15 12 15
17
6 4 12 10 15
25
Despite the problems,you have no desire to
leave SA
SA's social and culturaldiversity is a major
advantage
Compared to a year agoyou're more likely toopenly criticize the
government
While the governmenthas made a lot of
mistakes, they havedone many good things
Don't think that thingsare better elsewhere;you believe you swap
one set of problems foranother.
The media in SouthAfrica are much too
negative about SA - theydon't show the good
things
T2B (Agree) Neither agree nor disagree B2B (Disagree)
WAY OF PERSONALLY DEALING WITH SITUATIONS IN SA
84
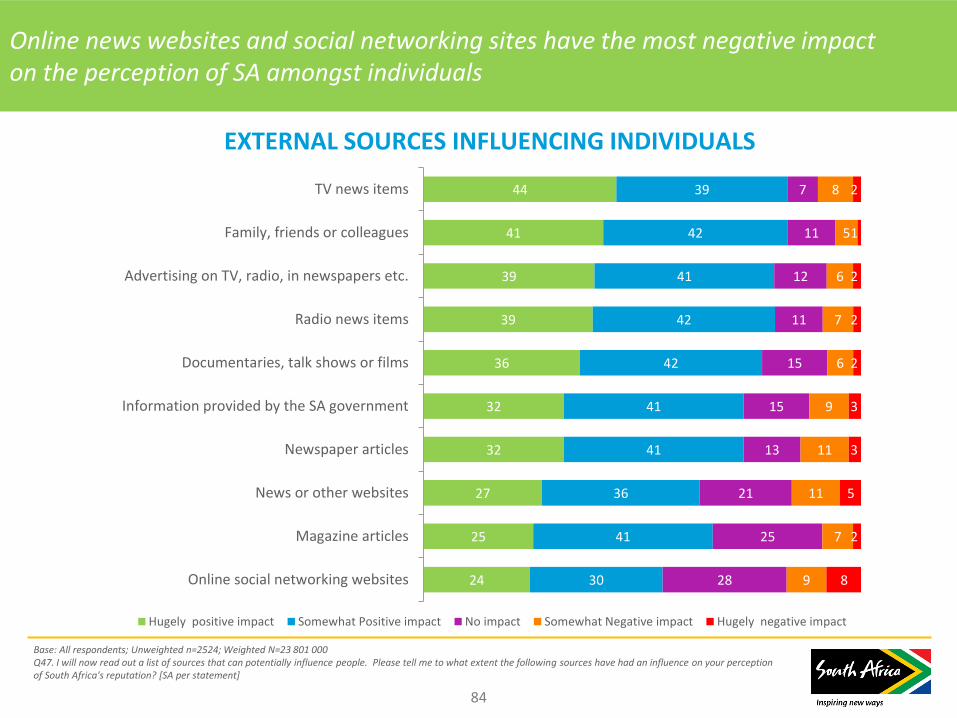
Online news websites and social networking sites have the most negative impact on the perception of SA amongst individuals
Base: All respondents; Unweighted n=2524; Weighted N=23 801 000 Q47. I will now read out a list of sources that can potentially influence people. Please tell me to what extent the following sources have had an influence on your perception of South Africa's reputation? [SA per statement]
44
41
39
39
36
32
32
27
25
24
39
42
41
42
42
41
41
36
41
30
7
11
12
11
15
15
13
21
25
28
8
5
6
7
6
9
11
11
7
9
2
1
2
2
2
3
3
5
2
8
TV news items
Family, friends or colleagues
Advertising on TV, radio, in newspapers etc.
Radio news items
Documentaries, talk shows or films
Information provided by the SA government
Newspaper articles
News or other websites
Magazine articles
Online social networking websites
Hugely positive impact Somewhat Positive impact No impact Somewhat Negative impact Hugely negative impact
EXTERNAL SOURCES INFLUENCING INDIVIDUALS
85
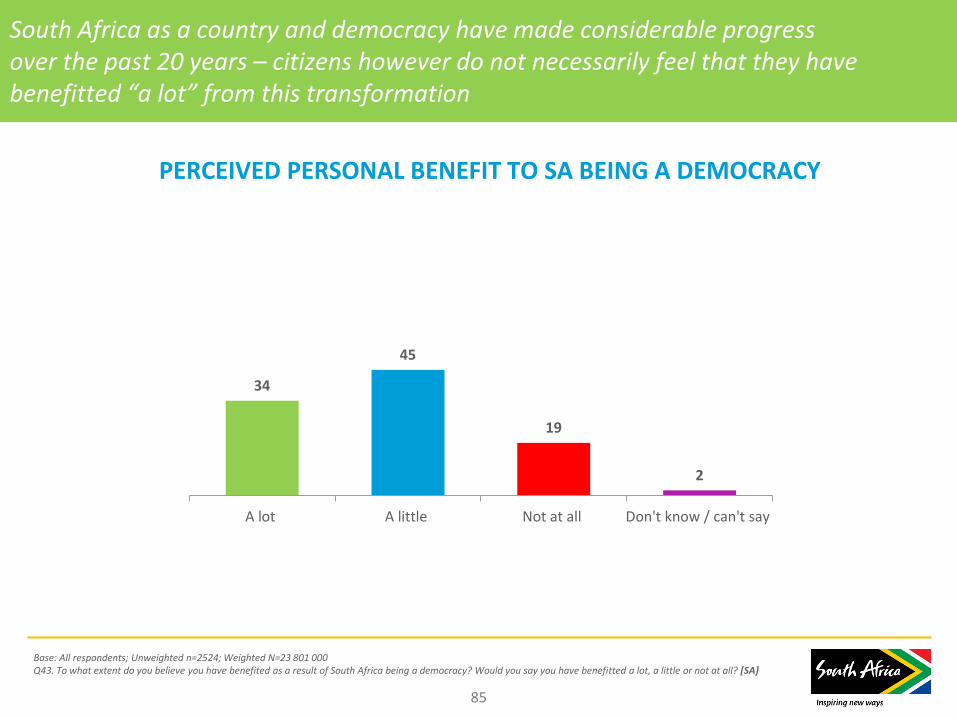
South Africa as a country and democracy have made considerable progress over the past 20 years – citizens however do not necessarily feel that they have benefitted “a lot” from this transformation
Base: All respondents; Unweighted n=2524; Weighted N=23 801 000 Q43. To what extent do you believe you have benefited as a result of South Africa being a democracy? Would you say you have benefitted a lot, a little or not at all? [SA]
34
45
19
2
A lot A little Not at all Don't know / can't say
PERCEIVED PERSONAL BENEFIT TO SA BEING A DEMOCRACY

86
Most are registered voters and prepared to take accountability for reporting community crime; a fair amount – 1 in every 2, are also willing to provide additional personal time or finances – i.e. to take active part in committees or forums, or to pay more taxes for infrastructure upkeep
Base: All respondents; Unweighted n=2524; Weighted N=23 801 000 Q31. Please indicate whether you agree or disagree with each of the following statements? [SA per statement]
50
85 88
49
50
15 12
51
You are part of a communityforum/church committee/local
sports committee
You are a registered voter You believe that it is yourresponsibility to work with theauthorities in making efforts tocombat crime by ensuring you
report the crimes in yourcommunity
You are willing to pay more taxesto contribute to the
infrastructure upkeep in SouthAfrica
Agree Disagree
TAKING PART IN ACTIVITIES / ACTIONS

87
Pride Index (PI) Citizens show a strong devotion to their country – with the majority of citizens displaying the same affection
Base: All respondents; Unweighted n=2524; Weighted N=23 801 000 *Low base
PRIDE INDEX
80
1% 7% 34% 58%
Very weak (0-20) Weak (27-40) Moderate (47-53) Good (60-73) Strong (80-100)
0 32 53 72 89
PRIDE INDEX
88
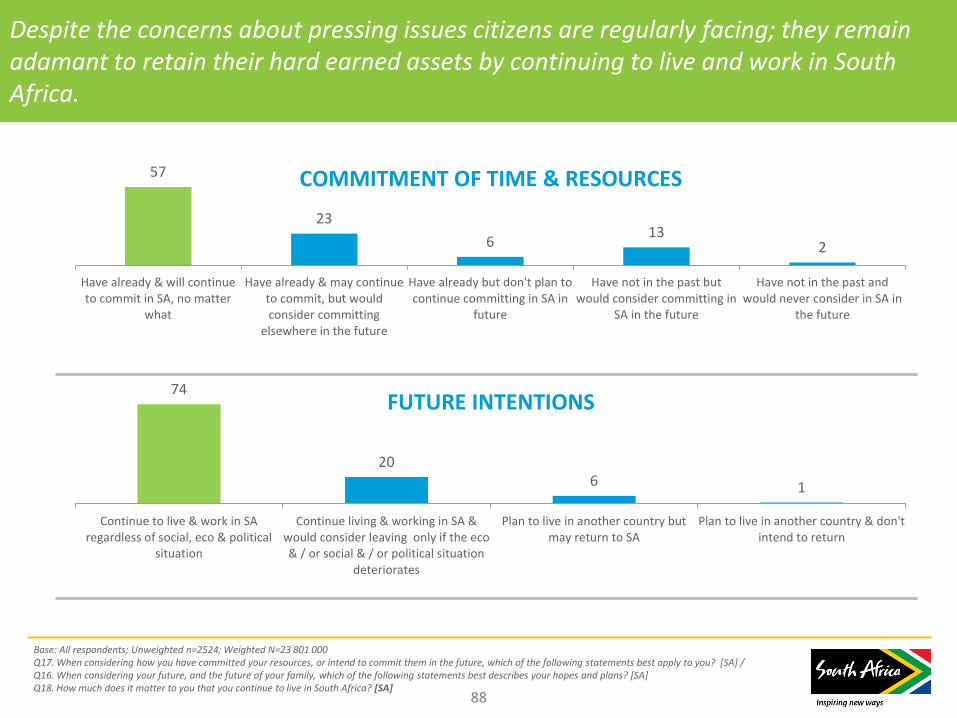
Despite the concerns about pressing issues citizens are regularly facing; they remain adamant to retain their hard earned assets by continuing to live and work in South Africa.
Base: All respondents; Unweighted n=2524; Weighted N=23 801 000 Q17. When considering how you have committed your resources, or intend to commit them in the future, which of the following statements best apply to you? [SA] / Q16. When considering your future, and the future of your family, which of the following statements best describes your hopes and plans? [SA] Q18. How much does it matter to you that you continue to live in South Africa? [SA]
57
23
6 13
2
Have already & will continueto commit in SA, no matter
what
Have already & may continueto commit, but wouldconsider committing
elsewhere in the future
Have already but don't plan tocontinue committing in SA in
future
Have not in the past butwould consider committing in
SA in the future
Have not in the past andwould never consider in SA in
the future
COMMITMENT OF TIME & RESOURCES
74
20 6 1
Continue to live & work in SAregardless of social, eco & political
situation
Continue living & working in SA &would consider leaving only if the eco& / or social & / or political situation
deteriorates
Plan to live in another country butmay return to SA
Plan to live in another country & don'tintend to return
FUTURE INTENTIONS
89
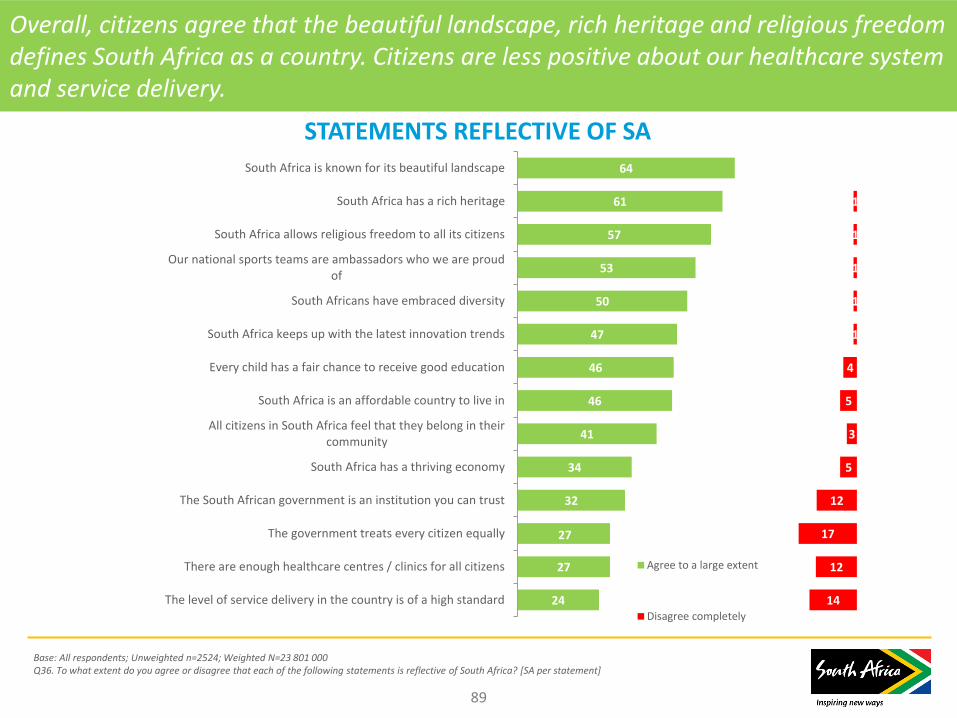
Overall, citizens agree that the beautiful landscape, rich heritage and religious freedom defines South Africa as a country. Citizens are less positive about our healthcare system and service delivery.
Base: All respondents; Unweighted n=2524; Weighted N=23 801 000 Q36. To what extent do you agree or disagree that each of the following statements is reflective of South Africa? [SA per statement]
STATEMENTS REFLECTIVE OF SA 64
61
57
53
50
47
46
46
41
34
32
27
27
24
28
31
33
35
38
38
35
34
38
40
31
28
33
31
6
6
7
9
8
10
9
9
11
14
13
12
11
13
2
2
2
3
3
4
6
7
7
8
13
15
16
18
1
1
1
1
1
4
5
3
5
12
17
12
14
South Africa is known for its beautiful landscape
South Africa has a rich heritage
South Africa allows religious freedom to all its citizens
Our national sports teams are ambassadors who we are proudof
South Africans have embraced diversity
South Africa keeps up with the latest innovation trends
Every child has a fair chance to receive good education
South Africa is an affordable country to live in
All citizens in South Africa feel that they belong in theircommunity
South Africa has a thriving economy
The South African government is an institution you can trust
The government treats every citizen equally
There are enough healthcare centres / clinics for all citizens
The level of service delivery in the country is of a high standard
Agree to a large extentAgree to some extentNeither agree nor disagreeDisagree to some extentDisagree completely

90
Almost two thirds of South African citizens claim that they are extremely proud to be South African
Base: All respondents; Unweighted n=2524; Weighted N=23 801 000 Q37. Using this scale from 1 to 5, where 1 is “Very proud to be South African” and 5 is “Not at all proud to be South African” , are you: [SA] / Q38. ASKED IF PROUD IN Q37: What makes you most proud to be South African, or about South Africa? / Q39. ASKED IF NEUTRAL OR NOT PROUD IN Q37: What is it about South Africa that makes you feel that way?
61%
35%
2% 1%
1%
Extremely proud to be South African
Somewhat proud to be South African
No feelings either way
Not very proud to be South African
Not at all proud to be South African
LEVEL OF PRIDE TO BE A SA CITIZEN
TOP 4 - FACTORS DRIVING PRIDE
%
1 The beautiful landscape 56
2 The cultural diversity 49
3 The people in general 49
4 Achievements of our democracy 41
TOP 3 - FACTORS DETRACTING FROM PRIDE
%
1 The Government is corrupt 27
2 Too much crime and thugs 26
3 Lack of job opportunities 17

Prepared by Brand SA Research
Contact:
Dr Petrus de Kock, GM – Research
Dr Judy Smith-Höhn, Research
Manager
Readers are welcome to use the data
contained in this report for their own
purposes provided they acknowledge
the source as: Brand South Africa,
Research & Nation Brand Performance
Presentation, September 2015,
available at:
www.brandsouthafrica.com
91