Brand Recognition and Quality Inferences
38
Birmingham Business School Discussion Paper Series Title: Brand Recognition and Quality Inferences Author: Yvetta Simonyan and Daniel Goldstein Discussion Paper: 2013-12
Transcript of Brand Recognition and Quality Inferences

Birmingham Business School
Discussion Paper Series
Title: Brand Recognition and QualityInferences
Author: Yvetta Simonyan and Daniel Goldstein
Discussion Paper: 2013-12

Yvetta Simonyan and Daniel G. Goldstein – September 2013
Version: September 4, 2013
Brand Recognition and Quality Inferences
Yvetta Simonyana*
and Daniel G. Goldsteinb
a Birmingham Business School, University of Birmingham b Microsoft Research, London Business School
Discussion paper
Abstract
Could brands associated with mostly negative information–those with poor reputations–be perceived as superior to unrecognized brands? A reasonable consumer should value reputation; however, it is also sensible to put a heavy weight on brand recognition. To investigate this question, the authors study consumers’ inferences about brand quality for products in three domains. Results suggest that brands associated with predominantly negative information are indeed perceived as of higher quality than unrecognized brands. In addition, when consumer inferences are predicted based on different memory cues, the frequency of encountering a brand dominates what people profess to know about it. The authors explore the ecological rationality of this strategy by studying the environmental relationship between expert-judged quality and consumer knowledge. Keywords: inferences from memory, perceived brand quality, recognition, knowledge valence
Acknowledgements
The authors would like to thank the London Business School for funding this research and the London Business School Behavioural Lab for its assistance in data collection. * Corresponding author. Email: [email protected]

Yvetta Simonyan and Daniel G. Doldstein – September 2013 Page 1
This discussion paper is copyright of the University, the author and/or third parties. The intellectual property rights in respect of this work are as defined by The Copyright Designs and Patents Act 1988 or as modified by any successor legislation. Any use made of information contained in this paper must be in accordance with that legislation and must be properly acknowledged. Copies of the paper may be distributed and quotations used for research and study purposes, with due attribution. However, commercial distribution or reproduction in any format is prohibited without the permission of the copyright holder.
Yvetta Simonyan and Daniel G. Doldstein – September 2013 Page 2
Is the devil you know better than the devil you don’t? The marketing literature has
demonstrated an adverse effect of negative publicity on product and brand evaluation,
arguing against the lay belief that “all publicity is good publicity.” For example, Tybout,
Calder, and Sternthal (1981) showed that evaluations of McDonald's restaurants were less
positive when study participants were exposed to negative rumours about the brand. As
one might expect, econometric analyses show that critical reviews have negative effects
on box office revenue or book sales (Basuroy, Chatterjee, and Ravid 2003; Chevalier and
Mayzlin 2006). However, recent findings introduce the possibility that negative publicity
may have different effects on known and unknown brands. Berger and colleagues showed
that negative publicity about a product may increase purchase likelihood and sales of
unknown products by increasing their awareness, perhaps because consumers remember
they heard something about these products, but forget the valence of the information
(Berger, Sorensen, and Rasmussen 2010; Skurnik et al. 2005).
But what if people remember that the publicity was bad–could negative brand
knowledge still be beneficial?
We address this question by looking at consumer inferences about the quality of
actual products, randomly sampled from three categories. A few aspects of our research
distinguish it from previous studies on the effect of information valence.
Building on research studying the effect of information valence on product sales
(Basuroy et al. 2003; Berger et al. 2010; Chevalier and Mayzlin 2006; Duan, Gu, and
Whinston 2008; Liu 2006) or stock prices (Luo 2007), we explore the effect of
information valence on people’s inferences about brand quality and brand awareness,
which are important consumer-based measures of brand equity (Agarwal and Rao 1996;
Keller, 1993; Keller and Lehmann 2006).

Yvetta Simonyan and Daniel G. Doldstein – September 2013 Page 3
We stress the importance of knowledge in memory to consumer decision making.
Some 20 years after a gulf in the decision making literature was first recognized (Alba,
Hutchinson, and Lynch, 1991), there is still little overlap of the consumer behaviour
literature with mainstream memory research in judgment and decision making. Much of
existing work on consumer decision making is focused on “information grid” studies, in
which all relevant brand and attribute information is present before the participant when
decision is made. In many real world decisions, however, some or all of the relevant
information may not be present (Lynch and Srull 1982). Even when information on all the
alternatives is available, people may not use it due to the lack of time and motivation or
due to differing accessibility in memory (Bettman and Park 1980; Dickson and Sawyer
1990; Fazio, Powell, and Williams 1989; Hoyer 1984; Johnson and Russo 1984; Simon
1955). In such settings, information in memory influences the way the product
information is processed or, if no product information is obtainable, serves as a sole input
for consumers’ decisions.
Another distinction that sets the present work apart is its focus on inferences as
opposed to preferences, which have been thoroughly studied (e.g., Bettman and Park
1980; Hoyer and Brown 1990). Even though inferences are one of the potential predictors
of preferences, these two constructs have distinct influences: consumers can infer that
Brand A is of higher quality than Brand B, but show preference for the lower-quality
brand because of other criteria, for example, higher affordability of Brand B.
Alternatively, consumers’ choice may be affected by their overall attitude towards
a brand rather than its perceived quality. Research on attitudes, an important aspect of
brand knowledge, represents “summary judgments and overall evaluations to any brand-
related information” (Keller 2003), including non-product-related attributes and symbolic
benefits. Our investigation, however, focuses on specific aspects of product quality,

Yvetta Simonyan and Daniel G. Doldstein – September 2013 Page 4
whereby eliminating the effect of non-product related associations, along with connected
constructs such as liking (Ahluwalia, Burnkrant, and Unnava 2000; Zajonc 1968; Zajonc
and Rajecki 1969). So, the third specific aspect of this research is its focus on perceived
quality rather than overall attitude towards brands.
Thus, we investigate what people think about brand quality based on what they
know about the brands, as opposed to what brands consumers prefer or how they like
them. Our larger question is which brands do consumers infer to be of higher quality: the
brands associated with mostly negative quality information, or the ones they have never
seen or heard of before? As it will be explained, our prediction is that brands associated
with mostly negative information will tend to be perceived as superior to unrecognized
brands. We test this hypothesis for inferences about individual brands as well as for
inferences about brands in paired comparisons.
H1a: Ranking: When making quality inferences about individual brands,
consumers infer that recognized brands associated with mostly negative
information are of higher quality than unrecognized brands.
H1b: Paired comparison: When making quality inferences about pairs of brands,
in which one brand is recognized and the other is not, consumers infer that
the recognized brands associated with mostly negative information are of
higher quality than the unrecognized brands.
We base these hypotheses on the idea that simple cues can substitute for more
complex pieces of information without a considerable decrease in inferential accuracy,
because brand information in the environment and inferential cues are often strongly
correlated in natural settings (Goldstein and Gigerenzer 2002; Steenkamp 1990). For
example, if higher-quality vacuum cleaner brands are associated with a fair number of

Yvetta Simonyan and Daniel G. Doldstein – September 2013 Page 5
both positive and negative facts about brand quality, then consumers may learn that the
valence of their knowledge is often not informative for inferring quality. At the same
time, if they observe that more commonly mentioned brands tend to be of higher quality,
they may learn that perceived environmental frequency, which is a pre-requisite for the
more complex memory information represented by knowledge valence, may be a robust
single predictor of brand quality.
H2: When memory cues are used to make predictions about people’s quality
inferences in paired comparisons, models including knowledge valence in
addition to other cues are not more accurate than models including only
simpler cues, such as recognition and perceived environmental frequency.
In pursuit of externally valid and robust findings, we investigate these links in
three domains: refrigerators, vacuum cleaners, and business schools. In our studies, three
randomly ordered tasks were performed by each participant. In one of the tasks,
participants were asked about the information in their memory for each brand. In the
second task, perceived brand quality was elicited: participants guessed the most probable
rank a brand could have according to a published quality ranking, such as Consumer
Reports or U.S. News and World Report. Finally, they made inferences about quality for
pairs of brands in a two-alternative forced choice task. To explore the relationship
between volume of the information in the environment and the quality of the object, we
used the frequency of citations on various Internet sources for the brands and quality
ratings from Consumer Reports or U.S. News and World Report.
We conducted two lab studies, collected field data, and used formal mathematical
models to test the hypotheses. First, we will describe the methodology for the lab studies
and discuss results relevant to hypotheses 1a and 1b. This will be followed by the section

Yvetta Simonyan and Daniel G. Doldstein – September 2013 Page 6
describing the models and discussing findings related to hypothesis 2. Finally, we will
present the results of field data analysis before discussing them in the concluding section.
Study 1
Method
Respondents. One hundred and sixteen participants from the London Business
School Behavioural Lab panel took part in the study. To ensure that there were no major
differences in the exposure to the stimuli (US universities) through media and other
sources, we only drew upon participants who could not have spent more than 6 months in
the United States. UK residents served as participants to increase the likelihood that the
typical participant would recognize only some of the (US-based) stimuli. All participants
were paid 12 British pounds ($19USD) for participating.
Material. The domain under investigation is a set of global business schools,
taken from the US News and World Report rankings. To be included in the study,
business school names could not include: a US state name (i.e. University of
Pennsylvania); a large US city name (i.e. New York University); or contain the word
“state” (St. Cloud State University). Universities that had a state or large city name
included in their names were omitted because the respondents might recognize the state
or the city, but not the university, and mistakenly respond that they recognized the
business school (Aribarg, Pieters, and Wedel, 2010). Alternatively, the name of the state
or the city might influence the perception about the schools’ quality. Universities that had
the word “state” included in their names were eliminated because people might perceive
the quality of state (University of X) and non-state universities (X State University)
Yvetta Simonyan and Daniel G. Doldstein – September 2013 Page 7
differently. These assumptions are based on the findings that people evaluate
unrecognized brand names differently depending on the words in the name (Wänke,
Herrmann, and Schaffner 2007). Applied to the domain under investigation, the results of
that study suggest that the name "Baylor University", for example, may not really tell
anything other than it is unrecognized. However, the "Baylor Community College of
Jackson, Mississippi", even if unrecognized, may convey some information about its
quality: people may think that community colleges are of different quality than
universities, or that Mississippi schools are of different quality than schools outside the
state.
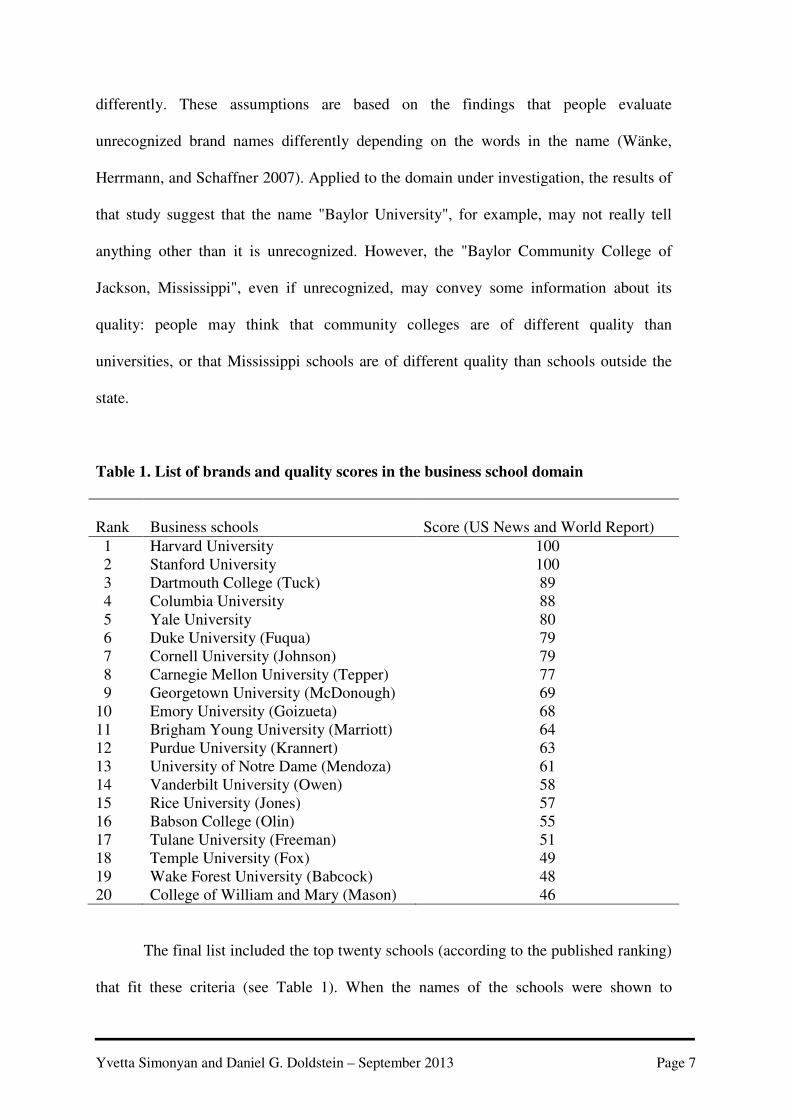
Table 1. List of brands and quality scores in the business school domain
Rank Business schools Score (US News and World Report)
1 Harvard University 100 2 Stanford University 100 3 Dartmouth College (Tuck) 89 4 Columbia University 88 5 Yale University 80 6 Duke University (Fuqua) 79 7 Cornell University (Johnson) 79 8 Carnegie Mellon University (Tepper) 77 9 Georgetown University (McDonough) 69 10 Emory University (Goizueta) 68 11 Brigham Young University (Marriott) 64 12 Purdue University (Krannert) 63 13 University of Notre Dame (Mendoza) 61 14 Vanderbilt University (Owen) 58 15 Rice University (Jones) 57 16 Babson College (Olin) 55 17 Tulane University (Freeman) 51 18 Temple University (Fox) 49 19 Wake Forest University (Babcock) 48 20 College of William and Mary (Mason) 46
The final list included the top twenty schools (according to the published ranking)
that fit these criteria (see Table 1). When the names of the schools were shown to

Yvetta Simonyan and Daniel G. Doldstein – September 2013 Page 8
participants, they were presented in the following way: the full name of the university and
the name of the business school in parenthesis, for example, Dartmouth College (Tuck). If
the university name is the only name the business school has, only the university name
was presented. Participants were advised that the questions in the study concerned US
schools only.
Procedure. Each participant answered three randomly ordered sets of questions
(henceforth, Question Sets 1, 2 and 3). Before starting each task, the participants were
instructed on how to respond to each question and answered several questions that served
as a comprehension check. If participants answered any of the questions incorrectly, they
were redirected to the instructions and answered the test questions again. After three
unsuccessful attempts to answer the questions, the study was paused and the participants
had to call a research assistant to continue. In that case, the research assistant clarified the
task and ensured the participant understood it.
The goal of the Question Set 1 was to gauge respondents’ memory for the stimuli.
Participants were asked several questions about each brand: whether or not they had seen
or heard of the brand before the study (recognition), how frequently they had seen or
heard about it (perceived environmental frequency), how much they knew about its
quality (perceived knowledge volume), and what proportion of that knowledge suggested
that the quality was good (perceived knowledge valence).
During the recognition task, participants indicated whether or not they recognized
each of the 20 US business schools. Each school was presented on a new page. The
respondents were asked to answer as quickly and accurately as possible by pressing the
“Y” and “N” keys. They were told to keep their fingers over these keys during the
experiment, instructed on how the questions were asked, and given several training
questions about US cities, before proceeding to the actual recognition task on the US

Yvetta Simonyan and Daniel G. Doldstein – September 2013 Page 9
business schools. The stimuli were presented in the following manner. The question “Do
you recognize the following US business school?” was presented for 3000 ms, followed
by a fixation point (a cross in the center of the screen) that stayed on the screen for 1000
ms. After the cross disappeared, the screen stayed blank for 1000 ms, after which a school
name appeared on the place where the fixation point was. The school name remained on
the screen until a response was given. The time that elapsed between the point the school
appeared on the screen and the point the participant pressed the keys was recorded. To
avoid differential response to the first item presented, participants first answered a
question about a US business school that was not included in the analysis, and then about
the 20 US business schools from the aforementioned list. The order in which the 20
schools were presented was randomized.
Subsequently, participants indicated how familiar they were with each school.
They were asked to think how frequently they had seen or heard of each of the 20 schools
when answering this question. To answer the question, they used a slider with “Not
familiar at all” and “Very familiar” on its ends, which was coded on a scale of 1 to 50,
though these values were not shown to the participants. The slider was programmed to
avoid anchoring the respondents to the starting point of the slider handle. Each time a new
slider appeared on the screen, it lacked a handle. The handle only appeared once the
participant moved the mouse pointer over the slider bar. The order in which the 20
schools were presented was randomized for each participant.
During the last two tasks of Question Set 1, participants used the same type of
sliders to answer questions about their knowledge regarding each of the 20 schools. The
first question was: “How much do you know about the academic quality of the following
US business school?” The responses were measured using 1 to 50 scale, corresponding to
”I know little about it” and “I know a lot about it”, respectively. The second question,

Yvetta Simonyan and Daniel G. Doldstein – September 2013 Page 10
presented on a new page, was “Of what you know about the academic quality of the
following US business school, how much suggests that it is good or bad?” This was
coded on a -25 to 25 scale, corresponding to “0% good, 100% bad” and “100% good, 0%
bad”, respectively. Again, in case of both questions, the corresponding values remained
invisible to the participants. The questions were presented separately, one per screen for
each of the 20 schools, and appeared in a random order for each participant. To prevent
confusion, the slider for the knowledge amount question was vertical, and the one for
proportions of bad and good knowledge was horizontal. The participants could indicate
that they knew nothing about the school by clicking on a separate “I know nothing about
it” button for both questions.
The aim of the Question Set 2 was to measure respondents’ quality rank estimates.
During this task, perceived quality was elicited while participants guessed the most
probable rank a school could have according to a published quality ranking. Participants
were told that the ranking they were trying to infer was taken from publications that
evaluate business schools. Before beginning the estimation task, the participants were
presented with the list of all 20 schools, which were presented in alphabetic order on one
screen, and asked to estimate the rank of each US business school according to its
academic quality. When performing the actual task, they saw one business school at a
time. Each time a new school appeared on the screen, respondents were asked “Where
would you guess this school might rank?” and reminded that they were supposed to
assign 1 for the highest rank, and 20 for the lowest.
Question Set 3 consisted of paired comparisons. During this task, the participants
made inferences about relative academic quality for 100 pairs of business schools
randomly drawn from a list of all possible pairs of 20 business schools. As before,
participants were told that they were trying to infer which school was ranked higher

Yvetta Simonyan and Daniel G. Doldstein – September 2013 Page 11
according to published rankings. For each question, which was worded “Which of the
following two US business schools is ranked higher according to its academic quality?”,
the respondents were asked to indicate their answer by clicking on one of two buttons,
corresponding to each school, on the computer screen. The order in which the 100 pairs
of schools appeared in the inference task was determined at random for each participant.
On average, participants took 37 minutes to complete the experiment.
Results and Discussion
Recall that Hypothesis 1a predicted that consumers would rank recognized brands
associated with mostly negative information as being of higher quality than unrecognized
brands. To test this hypothesis we calculated average quality rank estimates for all
unrecognized business schools and all recognized business schools, which individual
participants rated as having mostly negative quality in Question Set 1 (the responses to
the question capturing perceived knowledge valence were grouped into three categories:
predominantly negative (RKn–)–“0% good, 100% bad”–“39% good, 61% bad”,
predominantly positive (RKn+) – “61% good, 39% bad”–“100% good, 0% bad”, and
neutral – “40% good, 60% bad”–“60% good, 40% bad”). Any observation with
inconsistent responses (for example, a respondent indicated that he/she had knowledge
about a particular business school, but his/her other responses indicated that he/she had
never seen or heard of that school before) was eliminated from the data set before
analyses were conducted.
Our findings show that, in line with past research (Allison and Uhl 1964; Hoyer
and Brown 1990; Jacoby, Olson, and Haddock 1971; Goldstein and Gigerenzer 2002), the
perceived quality of recognized (R) brands was higher than that of unrecognized (U)

Yvetta Simonyan and Daniel G. Doldstein – September 2013 Page 12
ones. Means of estimated ranks of business schools grouped based on whether they were
recognized or not were 5.90 (out of 20) and 12.69, respectively (SER = .15, SEU = .12). A
mixed-effect linear model testing the relationship between the estimated ranks, on one
side, and recognition as a fixed effect variable and respondents as a random effect
variable, on the other side, confirms that estimated ranks for the recognized brands are
higher than those for unrecognized ones (β = 7.5, SE = .19, t = 40.29).
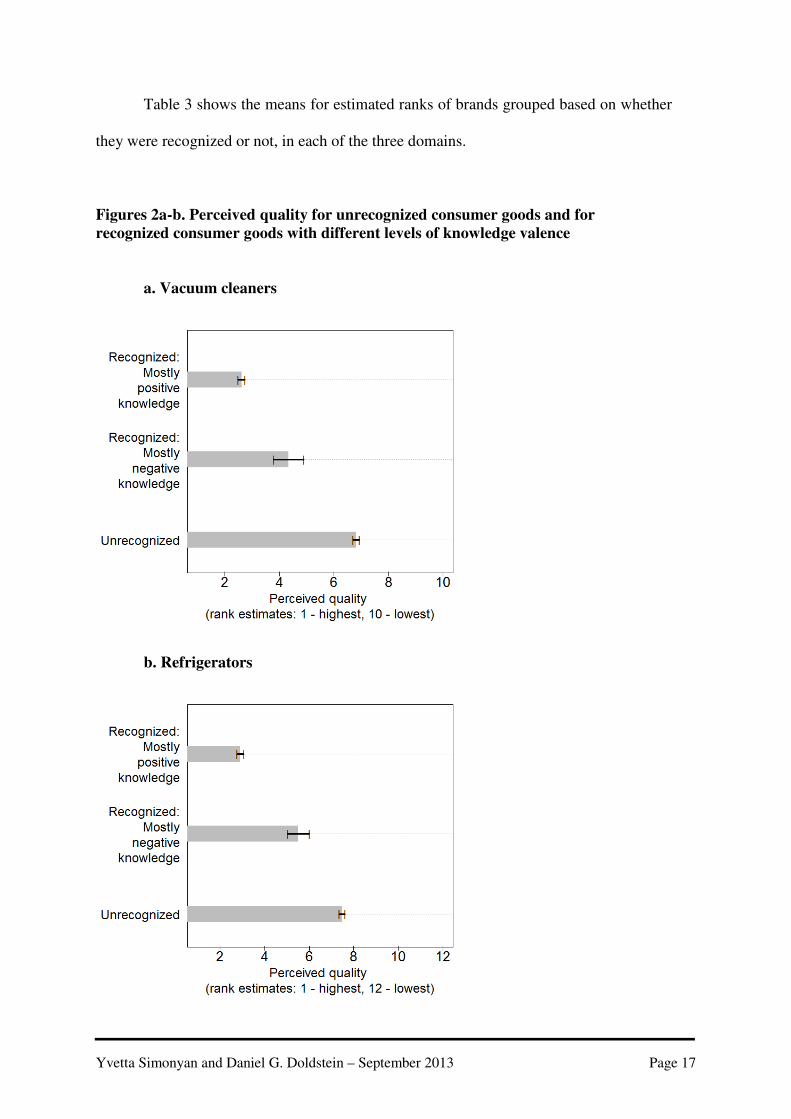
Figure 1. Perceived quality for unrecognized business schools and for recognized
business schools with different levels of knowledge valence
Furthermore, figure1 demonstrates that the effect of recognition was so strong that
even the brands with predominantly poor quality reputation (RKn–) were rated higher
(MRKn–= 6.33, SERKn– = .48) than unrecognized brands. That is, the typical recognized
brand associated with poor quality ranked, on average, about 6th out of 20, while
unrecognized schools were ranked about 13th out of 20. The results of the afore-
mentioned mixed-effect linear model fitted for the subset of the recognized brands

Yvetta Simonyan and Daniel G. Doldstein – September 2013 Page 13
associated with mostly negative knowledge valence and unrecognized brands support
hypothesis 1a (1113 responses from 105 respondents, β = 7.16, SE = .50, t = 14.35).
As would be expected, recognized brands with predominantly positive
information were rated higher than the ones with mostly negative information, which is
confirmed by the results of an ordered logistic regression analysis: the estimated quality
ranks of recognized brands were positively correlated with the proportion of positive
information about quality (Spearman rs(870) = .59, p < .01; Kendall τ(870) = .46, p < .01).
Next, we analysed people’s inferences in paired comparisons to test hypothesis
1b, which predicts that, when given a pair of brands, in which one brand is recognized
and attributed with predominantly poor quality information and the other is not
recognized, consumers infer that the recognized brand is of higher quality. Our results
demonstrate that, in most of these cases, participants inferred that the recognized brand
was of higher quality: 89% of such pairs for business schools, indicating a strong
tendency of people to infer that recognized brands are of higher quality, even when they
were attributed with predominantly poor quality information. This result is significantly
greater than chance (χ2(1, N = 275) = 99.32, p < .01).
But can these results be generalized for other types of brands or they are specific
to business schools? People’s choices and beliefs about business schools may be highly
influenced by school recognition: consumers may choose business schools not only for
their education, but also for the idea that the future employers will recognize their alma
mater. In other domains, where advertising is more prevalent and in which brand
recognition is less clearly related to quality, it may be the case that consumers attend
more to brand reputation. To test for generalization of the results obtained for the
business school domain, in study 2, we attempted at replicating the results for two
traditional consumer products.

Yvetta Simonyan and Daniel G. Doldstein – September 2013 Page 14
Study 2
Method
Participants. Two hundred and three people from the panel of regular study
participants of the London Business School Behavioural Lab participated in the study. All
participants were paid 10 British pounds ($16USD) for participating.
Materials. The brands of consumer goods in the two categories investigated in
study 2 were taken from Consumer Reports magazine. A pilot study was run to refine the
initial list of brands so that both known and unknown brands of different levels of quality
were equally represented. As a measure of quality, we used both overall and attribute
scores published by Consumer Report. If the brand had more than one product model
scored, the overall scores for the models were averaged to compute the brand score within
a particular domain. To calculate the attribute scores, first, all the attribute scores, except
price, were added. Then, for the brands that had more than one model scored, these
cumulative attribute scores were averaged to compute a brand score within a particular
domain. The number of attributes varied across domains. There was a significant positive
correlation between the overall and attribute scores (vacuum cleaners: r(8) = .82, p < .01;
refrigerators: r(10) = .86, p < .01).
The final list of consumer brands included 12 brands of refrigerators and 10
brands of vacuum cleaners. In pursuit of a representative design (Brunswik 1956) and to
avoid a biased selection of items, the brands were chosen from the refined list by a
computerized randomizing procedure. Table 2 lists the brands in each domain along with
the calculated scores.

Yvetta Simonyan and Daniel G. Doldstein – September 2013 Page 15
Table 2. List of brands and quality scores in the consumer good domains
Refrigerator brands Mean overall scores Mean attribute ratings
Bosch 74.33 4.42 Samsung 72.55 4.20 Thermador 70.50 4.00 Sub-Zero 64.50 3.54 Ikea 64.00 3.63 Electrolux 63.80 3.90 Amana 58.38 3.47 Hotpoint 53.50 3.00 Sanyo 47.00 3.50 Fisher & Paykel 43.50 2.75 Marvel 36.00 1.67 Magic Chef 33.00 3.00
Vacuum cleaner brands Mean overall scores Mean attribute ratings
Black & Decker 80.33 3.87 Riccar 67.00 4.08 Panasonic 66.67 3.93 Hoover 66.16 3.95 LG 66.00 4.00 Dyson 63.13 3.78 Aerus 60.00 3.85 Metropolitan 59.00 3.57 Kalorik 49.00 3.00 Koblenz 41.00 3.17
Procedure. Each participant performed three sets of tasks. The first set was used
to familiarize the respondents with the questions they were going to be asked throughout
the study. Just like in Study 1, the participants were instructed on how to answer each
question and tested for comprehension before they could start the actual tasks. A set of
printer brands was used for the training tasks. For the last two sets of tasks, participants
answered questions about two categories of consumer brands.
For each product category, three sets of questions, similar to those in study 1,
were asked. Participants answered all questions about one category before moving to the
next one. Question Set 1 was identical to that from study 1 with one exception: when
participants were asked to indicate how frequently they had seen or heard of each brand,

Yvetta Simonyan and Daniel G. Doldstein – September 2013 Page 16
they used a slider with “Very rarely” and “Very often” on its ends, corresponding to 1 and
50, respectively. If they had not heard of or seen the brand before the study, they could
indicate that by clicking on a special box instead of using the slider. Question sets 2 and 3
were identical to those in study 1. On average, the complete session lasted 48 minutes.
Results and discussion
Hypothesis 1a was supported in the business school domain and predicts that
consumers assign higher quality ranks to recognized brands associated with mostly
negative information than to unrecognized brands.
In an attempt to reconfirm this result, we calculated average quality rank estimates
for all unrecognized brands, all recognized brands attributed with mostly positive
information and all recognized brands attributed with mostly negative quality information
in the consumer good domains. Just as before, any observation with inconsistent
responses (see study 1) was eliminated from the data set before analyses were conducted.
The results for both consumer good domains replicate the results of analysis for
business schools. Specifically, the perceived quality of recognized brands was higher than
that of unrecognized ones.
Table 3. Rank estimates for recognized and unrecognized brands
Recognized brands Unrecognized brands
Domain
N of respondents N Mean SE N Mean SE
Business schools 107 872 5.90 (out of 20) .15 1268
12.69 (out of 20) .12
Vacuum cleaners 202 887 3.15 (out of 10) .06 1133
6.77 (out of 10) .06
Refrigerators 203 1062 3.88 (out of 12) .07 1374
7.44 (out of 12) .07
Yvetta Simonyan and Daniel G. Doldstein – September 2013 Page 17
Table 3 shows the means for estimated ranks of brands grouped based on whether
they were recognized or not, in each of the three domains.
Figures 2a-b. Perceived quality for unrecognized consumer goods and for
recognized consumer goods with different levels of knowledge valence
a. Vacuum cleaners
b. Refrigerators

Yvetta Simonyan and Daniel G. Doldstein – September 2013 Page 18
Furthermore, figures 2A-B show that, again, the effect of recognition was so
strong that even the brands with predominantly poor quality reputation were rated higher
than the unrecognized brands. A mixed-effect linear model testing the relationship
between the estimated ranks, on one side, and recognition as a fixed effect variable and
respondents as a random effect variable, on the other side, confirms that estimated ranks
for the recognized brands with mostly poor quality reputation are higher than those for the
unrecognized ones: vacuum cleaners (1098 responses from 198 respondents), β = 2.78,
SE = .24, t = 11.74; refrigerators (1305 responses from 199 respondents), β = 2.11, SE =
.24, t = 8.78, which supports hypothesis 1a.
For refrigerator brands, which could be ranked between 1 and 12, the
corresponding average ranks of recognized brands with predominantly poor quality
reputation and unrecognized brands were 5.52 versus 7.51 (SERKn– = .25, SEU = .07).
Similarly, for the vacuum cleaner brands, which could be ranked between 1 and 10, the
corresponding means were 4.34 versus 6.83 (SERKn– = .28, SEU = .06).
Just as with business schools, recognized brands of consumer goods with
predominantly positive information were rated higher than the ones with mostly negative
information, which is confirmed by the results of an ordered logistic regression analysis.
As table 4 demonstrates, the quality perception of recognized brands was positively
correlated with the proportion of positive information about quality.
Table 4. Relationship between estimated ranks and knowledge valence
Domain N of observations Spearman rs Kendall τ
Business schools 872 .59* .46* Vacuum cleaners 869 .55* .43* Refrigerators 1026 .56* .43*
* p < .01

Yvetta Simonyan and Daniel G. Doldstein – September 2013 Page 19
Analyses of people’s inferences in paired comparisons aimed at testing hypothesis
1b demonstrate that, across both consumer domains, in most cases, participants inferred
that the recognized brand associated with predominantly poor quality information was of
higher quality than the unrecognized brand, and proportions of such inferences were
significantly greater than chance: 85% of such pairs for vacuum cleaners (χ 2(1, N = 270)
= 55.93, p < .01) and 78% of such pairs for refrigerators (χ 2(1, N = 582) = 42.28, p <
.01)).
Even though these rates were lower than the ones calculated for all pairs in which
one brand was recognized and the other was not (see table 5), they still indicated a strong
tendency of people to infer that recognized brands were of higher quality, even when
these brands were attributed with predominantly poor quality information.
Table 5. Mean individual proportion of inferences when a recognized brand is
inferred to be of higher quality than an unrecognized brand in paired comparisons
Domain N of respondents
Mean individual proportion of relevant pairs
Mean proportion of such inferences
Business schools 107 .43 .89 Vacuum cleaners 202 .52 .91 Refrigerators 203 .49 .88
These results suggest that consumers might not use knowledge valence
information in making inferences about brand quality when comparing a recognized
brand attributed with mostly negative information with an unrecognized brand, and these
inferences can be predicted without knowledge valence information.
To test this idea, that is, hypothesis 2, we tried to predict consumers’ brand quality
estimates based on models that did or did not use knowledge information as predictors of
perceived quality.

Yvetta Simonyan and Daniel G. Doldstein – September 2013 Page 20
Models
To compare accuracy of different memory cues in predicting quality inferences in
paired comparisons, quality rank estimates were modelled as a function of one or more
measures, such as recognition, perceived environmental frequency, knowledge volume
and valence, and response latency.
First, quality rank estimates stated by the participants were modelled as a function
of one or more cues. One set of models used recognition, response latency, and perceived
environmental frequency as predictors, and the other set used knowledge valence and
volume, in addition to these three measures. Then, the outputs of these models, that is,
quality rank estimate predictions for recognized and unrecognized brands, were used to
predict inferences in paired comparisons. Next, these predictions of inference decisions
were compared with inferences stated by the respondents, and the percentage of times a
model made an accurate prediction was calculated for each model. Finally, two sets of
models were compared based on their ability to make accurate predictions of people’s
inferences in paired comparisons.
Due to the way the variables were measured in different domains, some models
could be used for modelling both the recognized and unrecognized brands, but others
required separate models for modelling unrecognized brands and the recognized brands
with different levels of knowledge volume. For example, perceived environmental
frequency was collected using a single scale for both recognized and unrecognized brands
in the business school domain, but not in the other domains. When respondents were
asked about their perceived environmental frequency in the domains of consumer goods,
they had an option of indicating that they had never seen or heard of the brand, in which
case their response was coded as 0. If they did not choose that option, the participants

Yvetta Simonyan and Daniel G. Doldstein – September 2013 Page 21
could use a scale ranging between 1, corresponding to "I have seen or heard of it very
rarely", and 50, corresponding to "I have seen or heard of it very often". As a result, in the
domain of consumer goods, the difference between perceived environmental frequency
coded as 0 and 1 is not the same as the difference between perceived environmental
frequency coded as 1 and 2. Hence, models using the collected perceived environmental
frequency data do not allow for combined modelling of recognized and unrecognized
brands in the domains of consumer goods, but can do so in the domain of business
schools.
Thus, in the business school domain, for models not including knowledge valence
data as a predictor, we modelled quality rank estimates as a function of recognition,
response latency, and perceived environmental frequency for both recognized and
unrecognized brands.
(1) QREij = β0 + β1 * Rij + β2 * RLij + β3 * PEFij + εij,
where QRE represents quality rank estimates of person i for brand j, β0 is the
intercept, β1, β2, β3 are slopes estimated for all individuals and brands, and εij is
the residual, normally distributed with a zero mean and variance σ2, R is
recognition, RL is response latency, and PEF is perceived environmental
frequency.
In the consumer good domains, for models not including knowledge valence data
as a predictor, we used separate models for modelling unrecognized brands and
recognized brands. Rank estimates of recognized brands were modelled as a function of
response latency and perceived environmental frequency, and rank estimates of
unrecognized brands were modelled as a function of response latency.

Yvetta Simonyan and Daniel G. Doldstein – September 2013 Page 22
(2) QRERij = β0 + β1 * RLij + β2 * PEFij + εij,
where QRER represents quality rank estimates of person i for recognized brand j,
β0 is the intercept, β1, β2 are slopes estimated for all individuals and brands, εij is
the residual, normally distributed with a zero mean and variance σ2, RL is
response latency, and PEF is perceived environmental frequency.
(3) QREUij = β0 + β1 * RLij + εij,
where QREU represents quality rank estimates of person i for unrecognized brand
j, β0 is the intercept, β1is a slope estimated for all individuals and brands, εij is the
residual, normally distributed with a zero mean and variance σ2, and RL is
response latency.
For models including knowledge valence data as a predictor of quality rank
estimates, we used the same models for all domains and modelled recognized and
unrecognized brands separately. Rank estimates of recognized brands attributed with
knowledge about quality, were modelled as a function of response latency, perceived
environmental frequency and knowledge volume and valence.
(4) QRERKij = β0 + β1 * RLij + β2 * PEFij + β3 * KVOLij + β4 * KVALij + εij,
where QRERK represents quality rank estimates of person i for recognized brand j
attributed with quality knowledge, β0 is the intercept, β1, β2, β3, β4 are slopes
estimated for all individuals and brands, εij is the residual, normally distributed
with a zero mean and variance σ2, RL is response latency, PEF is perceived
environmental frequency, and KVOL and KVAL are knowledge volume and
valence.

Yvetta Simonyan and Daniel G. Doldstein – September 2013 Page 23
Since ranks are ordinal rather than continuous variables, we used ordered logit
model to predict respondents’ quality rank estimates. Both fitted and cross-validated
values were derived for all models.
Results and discussion
Analysis of the ability of models to make accurate predictions of people’s
inferences in paired comparisons in all three domains revealed that, as predicted by
hypothesis 2, the simpler models, not including knowledge data as one of the predictors
of rank estimates, were as accurate as more complex ones, including knowledge data (see
table 6).
Table 6. Predictive accuracy of models for inferences in paired comparisons
including an unrecognized brand and a recognized brand attributed with quality
information (when predictions are made based rank estimates modelled as a
function of memory cues)
Domain N of observations
Percentage of accurate predictions Fisher’s
exact test p-value
Models not including knowledge valence
Models including
knowledge valence
Business schools 3173 94.30 92.50 .00 Vacuum cleaners 3904 92.98 92.98 1.00 Refrigerators 4756 89.70 89.23 .48
Potential criticism of this method can be the overall complexity of the modelling
approach through several afore-mentioned steps, each based on cross-validated outputs,
which can lower the accuracy of the more complex models. To overcome this drawback,
the accuracy of models was also compared by modelling inferences in paired comparison
based on memory cue data directly.

Yvetta Simonyan and Daniel G. Doldstein – September 2013 Page 24
First, inferences in paired comparison were modelled as a function of response
latency, perceived environmental frequency, and, were applicable, as a function of
knowledge volume and knowledge valence, for the recognized brand. That is, for models
not including knowledge data, the probability that a recognized brand is inferred to be of
higher quality can be expressed as follows.
(6) Pij = β0 + β1 * RLij + β2 * PEFij + εij,
where P represents the probability that person i judges the recognized brand j to be
of higher quality, β0 is the intercept, β1, β2 are the slopes estimated for all
individuals and brands, and εij is the residual, normally distributed with a zero
mean and variance σ2, RL is response latency, and PEF is perceived
environmental frequency.
Alternatively, using knowledge data in addition to simpler cues, that probability
can be modelled the following way.
(7) Pij = β0 + β1 * RLij + β2 * PEFij + β3 * KVOLij + β4 * KVALij + εij,
where P represents the probability that person i judges the recognized brand j to be
of higher quality, β0 is the intercept, β1, β2, β3, β4 are the slopes estimated for all
individuals and brands, εij is the residual, normally distributed with a zero mean
and variance σ2, RL is response latency, PEF is perceived environmental
frequency, and KVOL and KVAL are knowledge volume and valence.
Then, the outcome of the models, that is, the probability of a recognized brand to
be inferred of higher quality, was rounded off to predict the inference in each pair. The
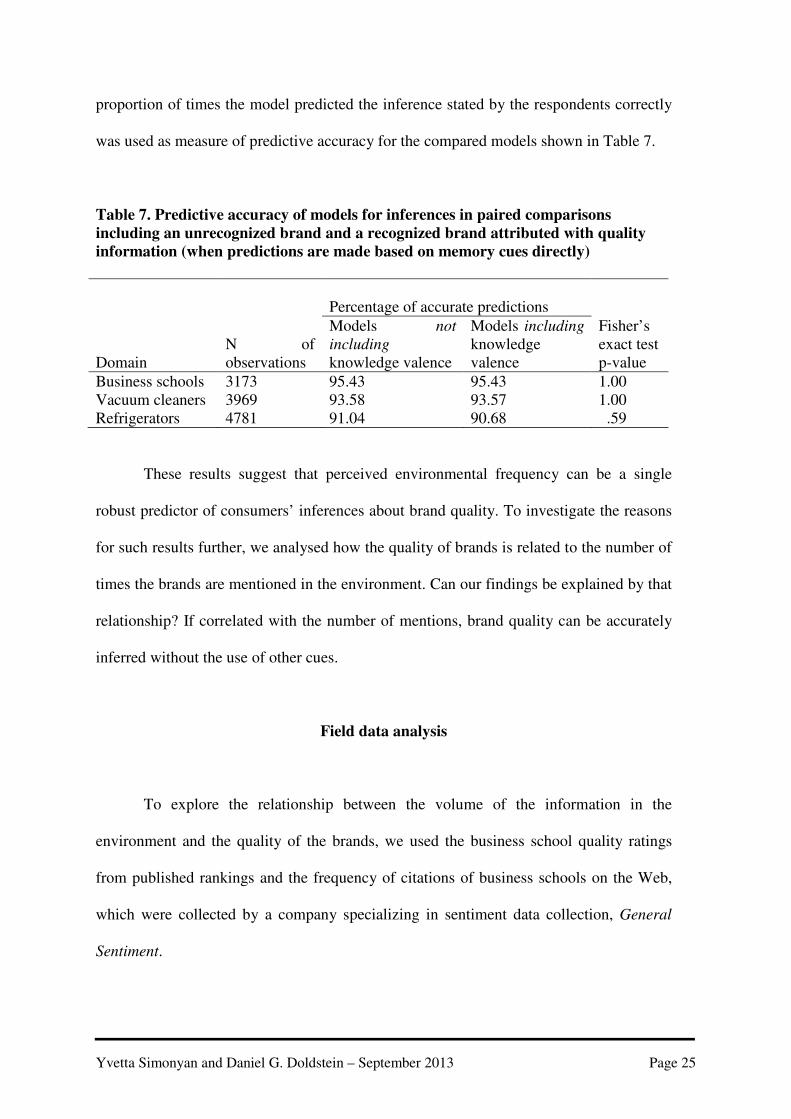
Yvetta Simonyan and Daniel G. Doldstein – September 2013 Page 25
proportion of times the model predicted the inference stated by the respondents correctly
was used as measure of predictive accuracy for the compared models shown in Table 7.
Table 7. Predictive accuracy of models for inferences in paired comparisons
including an unrecognized brand and a recognized brand attributed with quality
information (when predictions are made based on memory cues directly)
Domain N of observations
Percentage of accurate predictions
Fisher’s exact test p-value
Models not
including knowledge valence
Models including
knowledge valence
Business schools 3173 95.43 95.43 1.00 Vacuum cleaners 3969 93.58 93.57 1.00 Refrigerators 4781 91.04 90.68 .59
These results suggest that perceived environmental frequency can be a single
robust predictor of consumers’ inferences about brand quality. To investigate the reasons
for such results further, we analysed how the quality of brands is related to the number of
times the brands are mentioned in the environment. Can our findings be explained by that
relationship? If correlated with the number of mentions, brand quality can be accurately
inferred without the use of other cues.
Field data analysis
To explore the relationship between the volume of the information in the
environment and the quality of the brands, we used the business school quality ratings
from published rankings and the frequency of citations of business schools on the Web,
which were collected by a company specializing in sentiment data collection, General
Sentiment.

Yvetta Simonyan and Daniel G. Doldstein – September 2013 Page 26
In addition, environmental frequency was measured by the number of search
results generated by Google, Bing, and New York Times web search engines for the
combination of the university name and “business school” or “school of business” word
groupings, for example, “harvard” and “business school” or “school of business”. We
used natural logarithmic transformation to transform the numbers of search results
generated by these three sources, that is, search engines, before the results were
standardized within each source. Then, mean values of these standardized scores were
calculated for each school.
Business school quality ranks were determined by averaging the schools’ ranks
published by US News and World Report in 2008 and 2009. When quality scores were
needed, we used the scores published by US News and World Report in 2008.
Results and discussion
The analysis of the relationship between brand quality and information volume in
the environment in the business school domain demonstrate that knowledge valence may
not be necessary to make inferences about the quality of brands. As Figure 3 shows, the
more frequently business schools are cited on the Web, the higher they are ranked
according to the published ratings. Expert-judged brand quality is positively correlated
with the average number of Web search results (r(18) = .83, p < .01) and with the
numbers of mentions in news and social media on the Internet (r(18) = .70, p < .01 for
news media and r(18) = .71, p < .01 for social media).
These findings suggest that, if consumers observe such relationships, they can
make inferences following a simple logic: “I have seen brand A and I have not seen brand
B, brand A must be of higher quality than brand B, even if I know brand A for its mainly
poor quality reputation.” What is interesting to know, whether the brands associated with

Yvetta Simonyan and Daniel G. Doldstein – September 2013 Page 27
mostly negative quality information are of higher quality than unrecognized brands
according to experts’ opinion.
To answer this question, we calculated average expert-judged quality ranks for all
unrecognized business schools and all recognized business schools, which individual
participants rated as having mostly negative quality. Our findings show that the expert-
judged quality of recognized brands is indeed higher than that of unrecognized ones:
means for ranks of business schools grouped based on whether they were recognized or
not were 7.25 (out of 20) and 13.27 (SERKn– = .66 , SEU = .14). A linear regression model
testing the relationship between expert-judged quality ranks and recognition stated by 105
respondents for 1113 brands confirms that the ranks for the recognized brands associated
with mostly negative knowledge valence are significantly higher than those for
Number of results (normalised)
Business schools and their ranks according to published rankings

Yvetta Simonyan and Daniel G. Doldstein – September 2013 Page 28
unrecognized ones (β = 6.02, SE = .60, t = 9.97, p < .001, R2 = .08, p < .001)1. It seems
that, in this domain, it is ecologically rational to use environmental frequency as a cue for
quality inferences.
But what about the other domains, for example, consumer goods, in which the
relationship between quality and environmental frequency can be more distorted by the
ability of companies to increase environmental frequency via advertising regardless of the
brand quality? The afore-mentioned mixed-effect linear model confirmed that expert-
judged ranks of vacuum cleaner and refrigerator brands associated with mostly negative
information are higher than ranks of unrecognized brands in these domains (vacuum
cleaners: 1098 responses from 198 respondents, β = 2.19, SE = .38, t = 5.83, p < .001, R2
= .03, p < .001; refrigerators: 1305 responses from 199 respondents, β = 1.80, SE = .31, t
= 5.74, p < .001, R2 = .02, p < .001). Mean expert-judged ranks of recognized objects
with mostly negative quality associations were 4.48 and 6.67, correspondingly, for the
vacuum cleaner brands (SERKn– = .27, SEU = .09) and 5.75 and 7.55, correspondingly, for
the refrigerator brands (SERKn– = .27, SEU = .1). That is, we see the same pattern as in the
business school domain.
Discussion
In line with past research, our studies showed that the perceived quality of
recognized brands was higher than that of unrecognized ones, and the perception of
quality increased with the perceived environmental frequency. As a compelling extension
1 The following describes the model used to test the relationship between expert-judged quality and
brand recognition.
EJQRj = β0 + β1 * Rij + εij,
where EJQR represents the expert-judged quality rank for brand j, β0 is the intercept, β1 is the slope
estimated for all respondents and brands, εij is the residual, normally distributed with a zero mean and
variance σ2, R is the dummy variable for brand recognition for respondent i and brand j.

Yvetta Simonyan and Daniel G. Doldstein – September 2013 Page 29
of this result, we find that in all three domains we studied, while proportion of negative
information about quality was inversely correlated with quality perception of known
brands, the effect of recognition was so strong that even the brands with predominantly
poor quality reputation were rated as better than unrecognized. When a familiar brand
was compared with an unfamiliar one, mere awareness and perceived environmental
frequency could predict inferences as accurately as the other self-stated knowledge
participants had. This finding is consistent with firms’ tendency to invest heavily in
advertisements that provide no product information, and even attract negative attention to
a brand, like in case of Benetton’s controversial ad campaigns. In 1990s, it used shocking
images to grab people’s attention: unlike most ads which centred around companies’
products or image, Benetton’s advertising showed a newborn baby still attached to its
umbilical cord, a dying AIDS patient surrounded by his family, or a bloody corpse left by
the Mafia. In spite of the criticism and, perhaps, in part due to it, Benetton became one of
the most recognized in the world, entering top five, bypassing Chanel and approaching
Coca Cola (Toscani 1997).
This pattern mirrors the structure of information in the environment: expert
evaluations of quality published by U.S. News and World Report were positively
correlated with the number of mentions on the Internet, which, naturally, involves both
negative and positive remarks. This suggests that consumers may realize that
environmental frequency can serve as a single robust inferential cue for brand quality, in
line with our results regarding participants’ inferences. This has implications for new
brands: when companies have limited resources for brand promotion, they may consider
investing in a higher number of exposures to the potential consumer rather than in
developing deep knowledge about the brand via informative advertising.

Yvetta Simonyan and Daniel G. Doldstein – September 2013 Page 30
Our findings suggest implications not only for situations when customer use
solely the information in their memory, but also when other product information is
available, as consumers tend to select only limited amounts of available information and
place substantial importance on brand name information (Jacoby, Szybillo, and Busato-
Schach 1977). They may use these strategies as coping mechanisms, when facing
difficulty processing product information available from various sources while choosing
among large number of alternatives in a product category (Bettman, Johnson, and Payne
1991). Ecologically rational to the degree that they are adapted to the structure of an
environment, these heuristic decision strategies “can enable both living organisms and
artificial systems to make smart choices quickly and with a minimum of information”
(Todd and Gigerenzer 2000).
In his recent article, Hauser argues that recognition-based heuristic (Goldstein and
Gigerenzer 2002) and its analogues are “excellent descriptions of the decision rules that
consumers use to consider and to choose brands” (Hauser 2011) and stresses the need for
additional insight into such fast and frugal heuristics (Gigerenzer and Goldstein 1996;
Goldstein and Gigerenzer 2002). Discussing the benefits of such research for the design
and marketing of products and referring to some theories in marketing science, Hauser
suggests why consumers can rely on simple heuristics. According to one of such theories,
signalling theory (Erdem and Swait 1998; Milgrom and Roberts 1986; Nelson 1974), the
firm will choose to advertise, only if it can recover its advertising expenditures through
repeat purchase due to product’s high quality. Consumers, who learn through experience
that heavily advertised brands are of high quality, infer the brand quality from
advertising. And since advertising causes awareness of the brand, they can infer high
quality from recognition as well. The ability of recognition to predict quality can be
reinforced by observational learning. That is, a consumer might infer that the product is of

Yvetta Simonyan and Daniel G. Doldstein – September 2013 Page 31
high quality, if he or she observes other consumers using the product. Such observation
increases awareness, whereby making consumers infer direct correlation between
recognition and quality.
Brand awareness increases the likelihood that the brand will be a member of the
consideration set (Baker et al. 1986; Nedungadi 1990), the handful of brands that receive
serious consideration for purchase. Most people use a consider-then-choose decision rule,
when faced with multiple alternatives from which to choose, and inclusion in
consideration set can explain significant variation in brand choice and sales (Hauser and
Wernerfelt 1990; Srinivasan, Vanhuele, and Pauwels 2010). In the domains of durable
goods, such as automobiles, computers, and appliances, simple memory-based decision
rules may be less common than in non-durable product categories. Nonetheless, even
among durables, consumers may use memory cues for forming a consideration set by
screening available alternatives, before seriously evaluating only those brands that are not
screened out (Hauser 2011). Our findings contribute to the understanding why awareness
plays a critical role in consideration set formation by showing strong effect of recognition
on the perceived quality of brands regardless of the valence of knowledge associated with
them.
In summary, unknown brands may benefit from negative publicity as long as it
raises awareness about them, even if consumers remember this quality information. Of
course, it is better for a brand, if consumers have positive knowledge about it, but the fact
that recognized brands with predominantly poor quality reputation are still inferred to be
of higher quality than unrecognized ones is consistent with the lay theory that “better the
devil you know than the devil you don’t know.”

Yvetta Simonyan and Daniel G. Doldstein – September 2013 Page 32
References
Agarwal, M. K. and Rao, V. R. (1996), “An Empirical Comparison of Consumer-Based Measures of Brand Equity,” Marketing Letters, 7 (3), 237-47. Ahluwalia, R., Burnkrant, R. E. and Unnava, H. R. (2000), “Consumer Response to Negative Publicity: The Moderating Role of Commitment,” Journal of Marketing Research, 37 (May), 203-14 Alba, J. W., Hutchinson, J. W. and Lynch, J. G. Jr. (1991), “Memory and Decision Making,” in Handbook of Consumer Behavior, ed. H. Kassarjian and T. Robertson, Englewood Cliffs, NJ: Prentice Hall, 1–49. Allison, R. I. and Uhl, K. P. (1964), “Influence of Beer Brand Identification on Taste Perception,” Journal of Marketing Research, 1 (August), 36-9. Aribarg, A,, Pieters, R. and Wedel, M. (2010), “Raising the BAR: Bias Adjustment of Recognition Tests In Advertising,” Journal of Marketing Research, 47 (June), 387-400. Baker, W., Hutchinson, J. W., Moore, D., and Nedungadi, P. (1986), "Brand Familiarity and Advertising: Effects on the Evoked Set and Brand Preferences," in Advances in
Consumer Research, Vol. 13, ed. Richard J. Lutz, Provo, UT: Association for Consumer Research, 637-42. Basuroy, S., Chatterjee, S. and Ravid, S. A. (2003), “How Critical Are Critical Reviews? The Box Office Effects of Film Critics, Star Power, and Budgets,” Journal of Marketing, 67 (October), 103–17. Bettman, R. J. and Park, C. W. (1980), "Effects of Prior Knowledge and Experience and Phase of the Choice Process on Consumer Decision Processes," Journal of Consumer
Research, 7 (December), 234-48. Berger, J., Sorensen, A. T. and Rasmussen, S. J. (2010), “Positive Effects Of Negative Publicity: When Negative Reviews Increase Sales,” Marketing Science, 29 (September–October), 815-27. Bettman, J. R., Johnson, E. J. and Payne, J. W. (1991), “Consumer Decision Making,” in Handbook of Consumer Behavior, ed. H. Kassarjian and T. Robertson, Englewood Cliffs, NJ: Prentice Hall, 150–84. Brunswik, E. (1956), Perception and the representative design of experiments, Berkeley, CA: University of California Press. Chevalier, J. A. and Mayzlin, D. (2006), “The Effect of Word of Mouth on Sales: Online Book Reviews,” Journal of Marketing Research, 43 (August), 345-54. Dickson, P. R. and Sawyer, A. G. (1990), “The Price Knowledge and Search of Supermarket Shoppers,” Journal of Marketing, 54 (July), 42-53.

Yvetta Simonyan and Daniel G. Doldstein – September 2013 Page 33
Duan, W., Gu, B. and Whinston, A. B. (2008). “Do Online Reviews Matter?–An Empirical Investigation of Panel Data,” Decision Support Systems, 45, 1007–16. Erdem, T. and Swait, J. (2004), “Brand Credibility, Brand Consideration, and Choice,” Journal of Consumer Research, 31 (June), 191-8. Fazio, R. H., Powell, M. C. and Williams, C. J. (1989), “The Role of Attitude Accessibility in the Attitude-to-Behavior Process, Journal of Consumer Research, 16 (December), 280-8. Gigerenzer, G. and Goldstein, D. G. (1996), “Reasoning the Fast and Frugal Way: Models of Bounded Rationality,” Psychological Review, 103 (4), 650-69. Goldstein, D. G. and Gigerenzer, G. (2002), “Models of Ecological Rationality: The Recognition Heuristic,” Psychological Review, 109 (January), 75-90. Hauser, J.(2011), “A Marketing Science Perspective on Recognition-Based Heuristics (And the Fast-And-Frugal Paradigm),” Judgment and Decision Making, 6 (July), 396-408. Hauser, J. R. and Wernerfelt, B.(1990), “An Evaluation Cost Model of Consideration Sets,” Journal of Consumer Research, 16 (March), 393-408. Hoyer, W. D. (1984), “An Examination of Consumer Decision Making for a Common Repeat Purchase Product,” Journal of Consumer Research, 11, (December), 822-9. Hoyer, W. D. and Brown, S. P. (1990), “Effects of Brand Awareness on Choice for a Common, Repeat-Purchase Product,” Journal of Consumer Research, 17 (September), 141-8. Jacoby, J., Olson, J. C. and Haddock, R. A. (1971), “Price, Brand Name, And Product Composition Characteristics As Determinants Of Perceived Quality,” Journal of Applied
Psychology, 55 (December), 570-9. Jacoby, J., Szybillo, G. J. and Busato-Schach, J. (1977), “Information Acquisition Behavior in Brand Choice Situations,” Journal of Consumer Research, 3 (March), 209-16. Johnson, E. J. and Russo, J. E. (1984), “Product Familiarity and Learning New Information,” Journal of Consumer Research, 11 (June), 542-50. Keller, K. L. (2003), “Brand Synthesis: The Multidimensionality of Brand Knowledge,” Journal of Consumer Research, 29 (March), 595-600. Keller, K. L. and Lehmann, D. R. (2006), “Brands and Branding: Research Findings and Future Priorities,” Marketing Science, 25 (November–December), 740-59. Liu, Y. (2006), “Word of Mouth for Movies: Its Dynamics and Impact on Box Office Revenue,” Journal of Marketing, 70 (July), 74-89.

Yvetta Simonyan and Daniel G. Doldstein – September 2013 Page 34
Luo, X. (2007), “Consumer Negative Voice and Firm-Idiosyncratic Stock Returns,” Journal of Marketing, 71 (July), 75-88. Lynch, J. G. Jr. and Srull, T. K. (1982), "Memory and Attentional Factors in Consumer Choice and Decision Making: Concepts and Research Methods," Journal of Consumer
Research, 9 (June), 18-37. Milgrom, P. and Roberts, J. (1986), “Price and Advertising Signals of Product,” Quality
Journal of Political Economy, 94 (August), 796-821. Nedungadi, P. (1990), “Recall and Consumer Consideration Sets: Influencing Choice
without Altering Brand,” Journal of Consumer Research, 17 (December), 263-76. Nelson, P. (1974), “Advertising as Information,” Journal of Political Economy, 82 (July-August), 729-54. Simon, H. A. (1955), “A Behavioral Model of Rational Choice,” Quarterly Journal of
Economics, 69 (February), 99-118. Skurnik, I., Yoon, C., Park, D. C. and Schwarz, N. (2005). “How Warnings About False Claims Become Recommendations,” Journal of Consumer Research, 31 (March), 713–24. Srinivasan, S., Vanhuele, M. and Pauwels, K. (2010), “Mind-Set Metrics in Market Response Models: An Integrative Approach,” Journal of Marketing Research, 47 (August), 672–84. Steenkamp, J. B. E.M. (1990), “Conceptual Model Of The Quality Perception Process,” Journal of Business Research, 21, 309-33. Todd, P. M. and Gigerenzer, G. (2000), “Précis of Simple heuristics that make us smart,” Behavioral and Brain Sciences, 23, 727-80. Toscani, O. (1997), Die Werbung ist ein la¨chelndes Aas [Advertisement is a beast that smiles at us], Frankfurt, Germany: Fischer. Tybout, A. M., Calder, B. J. and Sternthal, B. (1981), “Using Information Processing Theory To Design Marketing Strategies,” Journal of Marketing Research, 18 (February), 73-9. Wänke, M., Herrmann, A. and Schaffner, D. (2007), "Brand Name Influence on Brand Perception," Psychology & Marketing, 24 (January), 1-24. Zajonc, R. B. (1968). “Attitudinal Effects of Mere Exposure,” Journal of Personality and
Social Psychology, 9 (June), 1-27. Zajonc, R. B. and Rajecki, D. W. (1969), “Exposure and affect: A field experiment,” Psychonomic Science, 17 (4), 216-7.

Birmingham Business SchoolUniversity HouseEdgbaston Park RoadBirminghamB15 2TY, United Kingdom
www.birmingham.ac.uk/business