Brand preference of a mobile phones
51
A PROJECT REPORT ON Brand Preference Of Mobile Phones Among Ghaziabad’s College Students Submitted To: Supervisor S u b m i tt e d B y : Your Name Roll No.- XXXXXXX COLLEGE NAME Ghaziabad, U.P.
-
Upload
ankit-gandhi -
Category
Data & Analytics
-
view
311 -
download
0
Transcript of Brand preference of a mobile phones

A
PROJECT REPORT
ON
Brand
Preference
Of
Mobile Phones Among
Ghaziabad’s College Students
Submitted To:
Supervisor
S u b m i tt e d B y :
Your Name
Roll No.- XXXXXXX
COLLEGE NAME
Ghaziabad, U.P.
CE RTIFICA TE
This is to certify that YOUR NAME, student of COLLEGE NAME has
completed her project on the topic of “ Brand Preference of Mobile
Phones Among Ghaziabad’s College Students” under the supervision
and guidance of SUPERVISOR Faculty member of COLLEGE NAME.
To best of my knowledge the report is original and has not been copied
or submitted anywhere else. It is an independent work done by him.
(YOUR SUPERVISOR)
A CKNO WLE DGEME NT
When I embarked this project, it appeared to me as onerous task. Slowly as I
progressed I did realized that I was not alone after all.
I wish to express my gratitude to DIRECTOR NAME, director, COLLEGE NAME,
FACULTY MEMBER, Program co-ordinator who have extended their kind help,
guidance and suggestion without which it could not have been possible for me to
complete this project report.
My sincere thanks to my all entire faculty members XXXXX, XXXXX and all staff
members for offering me all kinds of support and help in preparing the project.
I am deeply indebted to my guide NAME for not only her valuable and enlightened,
guidance but also for the freedom she rendered me during this project work.
I am thankful to my group member NAME and other classmates, well-wishers who
with their magnanimous and generous help and support made it a relative easier
affair.
My heart goes out to my parents who bear with me all the trouble I caused then with
smile during the entire study period and beyond.
YOUR NAME
Student Manager
PGDM-08/012
COLLEGE NAME
PR EFACE
The project gives an insight of the telecom sector. It basically helps
understanding the brand preference of students with regard to mobile
phones. It helps us to know what are the basis on which a students
chooses a particular brand when he/she purchases a new handset.
The project will help to learn about the growing telecom sector in India.
The research will also bring to light what all factors a student considers
at the time of purchase of a new mobile phone.

Table of Contents
1. INTRODUCTION .................................................................................................... 7
a. Definition of Cellular/Mobile phone ..............................................................
7 b. The Global Cellular Mobile Industry:
................................................................... 8 c. Telecom Industry in India
............................................................................... 9 d. History of Indian
Telecommunications ............................................................... 10 e. The
Key players in the Telecom Market in India........................................ 11
Innovation in partnership ................................................................................ 21
f. OBJECTIVES OF THE STUDY ........................................................................
22
2. RESEARCH METHODOLOGY ...........................................................................
24 a. SAMPLING METHODOLOGY:
.......................................................................... 24 b. RESEARCH DESIGN:
-....................................................................................... 24 c. DATA
COLLECTION: ........................................................................................ 24
3. DATA ANALYSIS AND INTERPRETATION........................................................ 26
4. CHI- SQUARE ANALYSIS ..................................................................................... 35
5. FINDINGS ............................................................................................................. 40
6. RECOMMENDATIONS ....................................................................................... 41
7. LIMITATIONS ...................................................................................................... 42
8. BIBLIOGRAPHY................................................................................................... 43
9. ANNEXURE .......................................................................................................... 44

1. IN TRO DUCTION
a. De finition of Ce ll ular /M ob il e phone
The Cellular telephone (commonly "mobile phone" or "cell phone" or
"handphone") is a long-range, portable electronic device used for mobile
communication. In addition to the standard voice function of a telephone, current
mobile phones can support many additional services such as SMS for text
messaging, email, packet switching for access to the Internet, and MMS for sending
and receiving photos and video. Most current mobile phones connect to a cellular
network of base stations (cell sites), which is in turn interconnected to the public
switched telephone network (PSTN) (the exception is satellite phones. Cellular
telephone is also defined as a type of short-wave analog or digital
telecommunication in which a subscriber has a wireless connection from a mobile
telephone to a relatively nearby transmitter. The transmitter's span of coverage is
called a cell. Generally, cellular telephone service is available in urban areas and
along major highways. As the cellular telephone user moves from one cell or area of
coverage to another, the telephone is effectively passed on to the local cell
transmitter. A cellular telephone is not to be confused with a cordless teleph
one (which is simply a phone with a very short wireless connection to a local phone
outlet). A newer service similar to cellular is personal communications services
(PCS).

b. The Global Cellular Mobile Industry:
The global mobile phone industry is based on many different manufacturers and
operators. The industry is based on advanced technology and many of the
manufacturers are operating in different industries, where they use their
technological skills, distribution network, market knowledge and brand name. Four
large manufacturers of mobile phones are today dominating the global mobile
phone industry; Nokia, Sony Ericson, Samsung and Motorola. In addition to these
companies there are many manufacturers that operate globally and locally.

c. Te le com Indus try in India
The telecom industry is one of the fastest growing industries in India. India
has nearly 200 million telephone lines making it the third largest network in
the world after China and USA.
With a growth rate of 45%, Indian telecom industry has the highest
growth rate in the world.
Much of the growth in Asia Pacific Wireless Telecommunication Market is
spurred by the growth in demand in countries like India and China.
India‘s mobile phone subscriber base is growing at a rate of 82.2%.
China is the biggest market in Asia Pacific with a subscriber base of 48% of
the total subscribers in Asia Pacific.
Compared to that India’s share in Asia Pacific Mobile phone market is 6.4%.
Considering the fact that India and China have almost
comparable populations, India’s low mobile penetration offers huge scope
for growth.
d. His tory of Ind ia n Tele comm u ni cat ion s
Started in 1851 when the first operational land lines were laid by the government
near Calcutta (seat of British power). Telephone services were introduced in
India in 1881. In 1883 telephone services were merged with the postal system.
Indian Radio Telegraph Company (IRT) was formed in 1923. After independence
in 1947, all the foreign telecommunication companies were nationalized to form the
Posts, Telephone and Telegraph (PTT), a monopoly run by the government's
Ministry of Communications. Telecom sector was considered as a strategic service
and the government considered it best to bring under state's control.
The first wind of reforms in telecommunications sector began to flow in 1980s
when the private sector was allowed in telecommunications equipment
manufacturing. In
1985, Department of Telecommunications (DOT) was established. It was an
exclusive provider of domestic and longdistance service that would be its own
regulator (separate from the postal system). In 1986, two wholly government
- owned companies were created: the Videsh Sanchar Nigam Limited (VSNL) for
international telecommunications and Mahanagar Telephone Nigam Limited
(MTNL) for service in metropolitan areas.
In 1990s, telecommunications sector benefited from the general opening up of the
economy. Also, examples of telecom revolution in many other countries, which
resulted in better quality of service and lower tariffs, led Indian policy makers to
initiate a change process finally resulting in opening up of telecom services sector
for the private sector. National Telecom Policy (NTP) 1994 was the first attempt to
give a comprehensive roadmap for the Indian telecommunications sector. In 1997,
Telecom Regulatory Authority of India (TRAI) was created. TRAI was formed to act
as a regulator to facilitate the growth of the telecom sector. New National Telecom
Policy was adopted in 1999 and cellular services were also launched in the same
year.

Telecommunication sector in India can be divided into two segments: Fixed Service
Provider (FSPs), and Cellular Services. Fixed line services consist of basic services,
national or domestic long distance and international long distance services. The
state operators (BSNL and MTNL), account for almost 90 per cent of revenues from
basic services. Private sector services are presently available in selective urban
areas, and collectively account for less than 5 per cent of subscriptions. However,
private services focus on the business/corporate sector, and offer reliable, high- end
services, such as leased lines, ISDN, closed user group and videoconferencing.
Cellular services can be further divided into two categories: Global System for
Mobile Communications (GSM) and Code Division Multiple Access (CDMA). The GSM
sector is dominated by Airtel, Vodfone-Essar, and Idea Cellular, while the CDMA
sector is dominated by Reliance and Tata Indicom. Opening up of international and
domestic long distance telephony services are the major growth drivers for cellular
industry. Cellular operators get substantial revenue from these services, and
compensate them for reduction in tariffs on airtime, which along with rental was the
main source of revenue. The reduction in tariffs for airtime, national long distance,
international long distance, and handset prices has driven demand.
e. The Ke y playe rs in the Te le com M ark e t in India
1. Nokia
2. Motorola
3. Samsung
4. LG
5. Sony Ericsson

Nokia
In 1865, an engineer named Fredrik Idestam established a wood-pulp mill and
started manufacturing paper in southern Finland near the banks of a river. Those
were the days when there was a strong demand for paper in the industry, the
company’s sales achieved its high-stakes and Nokia grew faster and faster. The
Nokia exported paper to Russia first and then to the United Kingdom and France.
The Nokia factory employed a fairly large workforce and a small community grew
around it. In southern Finland a community called Nokia still exists on the riverbank
of Emäkoski.
Finnish Rubber Works, a manufacturer a Rubber goods, impressed with the hydro
- electrcity produced by the Nokia wood-pulp (from river Emäkoski), merged up
and started selling goods under the brand name on Nokia. After World War II,
it acquired a major part of the Finnish Cable Works shares. The Finnish Cable Works
had grown quickly due to the increasing need for power transmission and telegraph
and telephone networks in the World War II. Gradually the ownership of the Rubber
Works and the Cable Works companies consolidated. In 1967, all the 3 companies
merged-up to form the Nokia Group. The Electronics Department generated 3 % of
the Group’s net sales and provided work for 460 people in 1967, when the Nokia
Group was formed.
In the beginning of 1970, the telephone exchanges consisted of electro-mechanical
analog switches. Soon Nokia successfully developed the digital switch (Nokia DX
200) thereby replacing the prior electro mechanical analog switch. The Nokia DX
200 was embedded with high-level computer language as well as Intel
microprocessors which in turn allowed computer-controlled telephone
exchanges to be on the top and which is till date the basis for Nokia’s network
infrastructure.
Introduction of mobile network began enabling the Nokia production to invent the
Nordic Mobile Telephony(NMT), the world’s very first multinational cellular
network in 1981. The NMT was later on introduced in other countries. Very soon
Global System for Mobile Communication (GSM), a digital mobile telephony, was
launched and Nokia started the development of GSM phones. Beginning of the 1990
brought about an economic recession in Finland. (Rumour has it that Nokia was
offered to the Swedish telecom company Ericsson during this time which was
refused) Due to this Nokia increased its sale of GSM phones that was enormous. This
was the main reason for Nokia to not only be one of the largest but also the most
important companies in Finland. As per the sources, in August 1997, Nokia supplied
GSM systems to 59 operators in 31 countries.
Slowly and steadily, Nokia became a large television manufacturer and also the
largest information technology company in the Nordic countries. During the
economic recession the Nokia was committed to telecommunications. The 2100
series of the production was so successful that inspite of its goal to sell 500,000
units, it marvellously sold 20 million. Presently, Nokia is the number 1 production in
digital technologies, it invests 8.5% of net sales in research and development. Also
has its annual Nokia Game.
Enter to Global System Communication
Nokia Corporation (Nokia), a Finland based company incorporated in 1967, is the
leading manufacturer of mobile devices and mobile networks in the world. Over the
years, Nokia has evolved from a pulp, rubber and cables manufacturing company to
a major manufacturer of wireless devices and networks. Nokia offers a wide range
of mobile devices with experiences in music, navigation, video, television, imaging,
games and business mobility. It also provides equipment, solutions and services for
network operators, service providers and corporations. The company offers its
products in 150 countries across the world. It is headquartered in Espoo, Finland
and employs about 68,500 people.
The company recorded revenues of E41, 121 million during the fiscal year ended
December 2006, and an increase of 20.3% over 2005. The operating profit of the

company was E5, 488 million during fiscal year 2006, an increase of 18.3% over
2005. The net profit was E4, 306 million in fiscal year 2006, an increase of 19.1%
over 2005.
Nokia Corporation manufactures mobile devices principally based on global system
for mobile communications, code division multiple access (CDMA), and wideband
CDMA (WCDMA) technologies. The company operates in three divisions:
Multimedia, Enterprise Solutions, and Networks. The Multimedia division focuses
on bringing connected mobile multimedia to consumers in the form of advanced
mobile devices, including 3G WCDMA mobile devices and solutions. The
Enterprise Solutions division enables businesses and institutions to extend their use
of mobility from mobile devices for voice and basic data to secure mobile access,
content, and applications. Its solutions include business-optimized mobile devices
for end users, a portfolio of Internet portfolio network perimeter security gateways,
and mobile connectivity offerings. The Networks division provides network
infrastructure, communications, and networks service platforms and professional
services to operators and service providers. Nokia Corporation is based in Espoo,
Finland.
M ot orola
MOTOROLA Electronics a wholly owned subsidiary of MOTOROLA Electronics
wasestablished in January, 2003 after clearance from the Foreign Investment
Promotion Board(FIPB). The trend of beating industry norms started with the
fastest ever-nationwide launch byMOTOROLA in a period of 4 and 5 months with
the commencement of operations in May 2003.
MOTOROLA set up a state-of-the art manufacturing facility at Greater Noida, near
Delhi, in 2004, with an investment of Rs 500 Crores. During the year 2001,
MOTOROLA also commenced the home production for its eco-friendly Refrigerators
and established its assembly line for its PC Monitors at its Greater Noida
manufacturing unit.
The Greater Noida manufacturing unit line has been designed with the latest
technologies at par with international standards at Korea and is one of the
most Eco-friendly units amongst all MOTOROLA manufacturing plants in the
world.
The year 2001 witnessed MOTOROLA becoming the fastest growing
company in the consumer electronics, home appliances and computer
peripherals industry. The company had till the month of October 2001
achieved a cumulative turnover of Rs 5000 Crores in India since its inception
in 2003 , making it the fastest ever Rs 5000 Crores clocked by any company
in the Indian consumer electronics and home appliances industry. Having
achieved this milestone, MOTOROLA achieved another benchmark with the
first ever sales of One Lakh ACs (Windows and Splits) in a calendar year.
MOTOROLA is poised to surpass its turnover target of Rs. 2700 Crores this
year and clock a turnover of Rs. 3000 Crores.
This year, MOTOROLA has emerged as the leader in Colour Televisions, Semi
Automatic Washing Machines, Air Conditioners, Frost-Free Refrigerators and
Microwaves Ovens. In Colour Televisions having set the sales target of one
million units of Color Televisions for 2002, MOTOROLA has already achieved
the one million mark in the month ahead of its target.
MOTOROLA Electronics India is the fastest growing company in the
consumer electronics, home appliances and computer peripherals industry
today.
MOTOROLA Electronics is continually providing superior technology
products & value for money to over 50 lacs households in India.
Sa msu ng
The Samsung Group is the world's largest c o n g l o m e r a te. I t is S ou th K o r e a 's largest
c h aeb o l a nd composed of numerous international b u s i n es s e s , a ll united under the
Samsung brand, including S a m s u ng E l e ct r o n ics, t he world's largest e l e ct r o n i cs
company, S a m s u ng Hea v y I n d u s t r i e s , o ne of the world's largest s h i p b u i l d e r s a nd
S a m s u ng E n g i n e e r i n g & C o n s t ru c t i o n , a major global construction company. These
three multinationals form the core of Samsung Group and reflect its name - the
meaning of the K o r ea n w ord Samsung is "tristar" or "three stars".
The Samsung brand is the best known S ou th K o r ea n b rand in the world and in 2005,
Samsung overtook Ja p a n e s e r ival S o ny a s the world's leading c o n s um e r e l e ct r o n i cs
brand and became part of the top twenty global brands overall. It is also the leader
in many domestic industries, such as the f i n a nci a l , c h e m ic a l , r e t a il a nd
e n t e r t a i n m e nt i ndustries. Samsung's strong influence in South Korea is visible
throughout the nation, and is sometimes called the 'Republic of Samsung'.
The 1990s saw Samsung rise as an international corporation. Not only did it acquire
a number of businesses abroad, but also began leading the way in certain electronic
components. S a m s u n g ' s c o n s t ru cti o n b r a nch w as awarded a contract to build one of
the two Pe t ro n a s T o w e r s in M a l a y s i a , T a i p e i 1 0 1 in T a i w a n a nd the B u r j D u ba i in
U n i t e d A r a b E m i r a t e s (founded by Callum Cuirtis), which is the tallest structure
ever constructed. In 1996, the Samsung Group reacquired the S u n g ky u nkw a n
U n i v e r s i t y foundation. In 1993 and in order to change the strategy from the
imitating cost- leader to the role of a differentiator, L e e K u n -h ee , L e e B y u n g - c hu l l ’s
successor, sold off ten of Samsung Group's subsidiaries, downsized the company,
and merged other operations to concentrate on three industries: electronics,
engineering, and
chemicals (Samsung Electronics).
Samsung is the world's largest manufacturer of T e l e v i s i o ns a nd various
other c o n s um e r e l e ct r o n i cs.
Samsung is the world's second largest mo b i l e p ho ne maker.
Compared to other major Korean companies, Samsung survived the A s i a n
f i n a nci a l c r i s is o f 1997-98 relatively unharmed. However, S a m s u ng M o t o r C o,
a $5 billion venture was sold to R e n a ul t a t a significant loss. Most
importantly, S a m s u ng E l e ct r o n ics (S EC) was officially spun-off from the
Samsung Group and has since come to dominate the group and the
worldwide semiconductor business, even surpassing worldwide leader I n t e l
in investments for the 2005 fiscal year. Samsung's brand strength has greatly
improved in the last few years. [ 9 ]
Samsung became the largest producer of memory chips in the world in
1992- Samsung, the world's second-largest chipmaker after I n t e l , s ee
W o r l dw i d e T o p 2 0 S e m ic o n d u ct o r M a r k e t S h a r e R a nking Y ea r b y Y ea r . [ 10].
In 1995, it built its first l i q u i d - c r y s t a l d i s p l a y s creen. Ten years later,
Samsung grew to be the world's largest manufacturer of liquid-crystal
display panels. S o ny, which had not invested in LCDs, contacted Samsung to
cooperate. In 2006, S - L C D w as established as a joint venture between
Samsung and Sony in order to provide a stable supply of LCD panels for
both manufacturers. S - L C D is owned by Samsung and Sony 51% to 49%
respectively and operates its factories and facilities in Tangjung, South
Korea.
In 2008, Samsung became the largest mo b i l e p ho ne m aker in the U n i t e d
S t a t e s a nd 2nd largest mo b i l e p ho ne maker in the World.

LG
The LG Group is South Korea's third largest chaebol and is a multinational conglomerate
that produces electronics, mobile phones, and petrochemical products and operates
subsidiaries like LG Electronics, LG Telecom, Zenith Electronics and LG Chem in over 80
countries.LG Group founder Koo In Hwoi established Lak Hui Chemical Industrial Corp.
in 1947. As the company expanded its plastics business, it established GoldStar Co., Ltd.,
(currently LG Electronics Inc.) in 1958.In 1959, Goldstar produced Korea's first radio.
Many consumer electronics were sold under the brand name GoldStar, while some
other household products (not available outside South Korea) were sold under the
brand name of Lucky. The Lucky brand was famous for its hygiene products line such as
soaps and Hi-Ti laundry detergents, but most associated with its Lucky and Perioe
toothpaste.In 1995, it was renamed "LG", the abbreviation of "Lucky GoldStar". More
recently, the company associates its tagline "Life's Good", with the letters LG.Since
2001, LG has two joint ventures with Royal Philips Electronics: LG Philips Display and
LG.Philips LCD. LG has entered into a joint venture with Nortel Networks and has
created LG-Nortel Co. Ltd.LG also has a joint venture with Hitachi, Hitachi-LG Data
Storage, which manufactures optical data storage products like DVD-ROM drives, CD
writers, etc. LG acquired American television manufacturing company Zenith in 1999.
LG Electronics is the world's second biggest maker of Televisions and third biggest
marker of LCD TVs and Mobile Phones. With headquarters in the LG Twin Towers on
Yeouido, Seoul, LG Electronics is the flagship company of LG Group, one of the world's
largest Conglomerate. The company has 75 subsidiaries worldwide that design and
manufacture televisions, home appliances, and telecommunications devices. LG
Electronics owns Zenith Electronics and controls 37.9 percent of LG Display. By 2005,
LG was a Top 100 global brand and in 2006, LG recorded a brand growth of 14%.Now
the world's largest plasma panel manufacturer, its affiliate, LG Display, is one of the
largest manufacturers of liquid crystal displays. Also in 2006, the company's mobile
phone division, LG Mobile, marketed the LG Chocolate phone, changing the company's
image of the maker of thick 3G phones. It now focuses on the design and marketing of
phones such as the LG Shine, the LG Glimmer and LG Prada (KE850). As a result, the
company was picked as "The Design Team of the Year" by the Red Dot Design Award in

2006~2007 and is often called the "New Apple" in the industry and online
communities. In 2006, its net income was $226 million, on total revenues of $24.7
billion. The company was originally established in 1958 as GoldStar, producing radios,
TVs, refrigerators, washing machines, and air conditioners. The LG Group was a
merger of two Korean companies, Lucky and GoldStar, from which the abbreviation of
LG was derived. The current "Life's Good" slogan is a backronym. Before the corporate
name change to LG, household products were sold under the brand name of Lucky,
while electronic products were sold under the brand name of GoldStar . The GoldStar
brand is still perceived as a discount brand.In 1995, GoldStar was renamed LG
Electronics, and acquired Zenith Electronics of the United States. LG Solar Energy is a
subsidiary formed in 2007 to allow LG Chem to supply polysilicon to LG Electronics for
production of solar cells. In 2008, LG took its first dive into the solar-panel
manufacturing pool, as it announced a preliminary deal to form a joint venture with
Conergy. Under the deal, set to be completed by year's end, LG would acquire a 75
percent stake in Conergy's Frankfurt solar-panel plant
Mobile communications
LG Electronics is the world's third largest handset maker.
Digital appliance
Sony Ericso nCorporate structure
Sony Ericsson Mobile Communications is a global provider of mobile multimedia
devices, including feature-rich phones, accessories and PC cards. The products
combine powerful technology with innovative applications for mobile imaging,
music, communications and entertainment. The net result is that Sony Ericsson is an
enticing brand that creates compelling business opportunities for mobile operators
and desirable, fun products for end users.

Sony Ericsson Mobile Communications was established in 2001 by
telecommunications leader Ericsson and consumer electronics powerhouse Sony
Corporation. The company is owned equally by Ericsson and Sony and announced
its first joint products in March 2002. Sony Ericsson products have universal appeal
and are different in the key areas of imaging, music, design and applications. The
company has launched products that make best use of the major mobile
communications technologies, such as the 2G and 3G platforms, while enhancing its
offerings to entry level markets.
Sony Ericsson undertakes product research, design and development,
manufacturing, marketing, sales, distribution and customer services. Global
management is based in London, and R&D is in Sweden, UK, France, Netherlands,
India, Japan, China and the US. The management team is led by President Hideki
Komiyama, a former senior executive of Sony Europe and one of the key player s
in the growth of Sony in Europe; and Executive Vice-President and Head of
Sales Anders Runevad, the former President Ericsson Brazil.
Industry accolades
As new products are introduced to end user acclaim, existing products continue to
receive accolades and Sony Ericsson is today accepted as a world leader in design
and innovation. The globally acclaimed T610 and later generations of the company’s
product portfolio frequently win awards. The GSM Association voted the V800 as
Best 3G Handset for 2004, a fully-featured phone made for Vodafone with the full
range of mobile entertainment features and multi-directional camera, and the K750i
received the TIPA Award 2005/2006 for ‘Best Mobile Imaging Device’, chosen by 31
leading European photography/imagining magazines and judged on quality,
performance and value for money. In February 2007 the GSM Association presented
Sony Ericsson with the ‘Best 3GSM Mobile Handset’ award for the K800 Cyber
-shot phone.

Innovation in partnership
Sony Ericsson strives to be a cutting edge provider of applications, forging
partnerships with developers and content providers. Strategic agreement with
partners such as Sony BMG is one way in which the company is bringing the best
and latest in entertainment content to its users. Sony Ericsson has also activated a
global sponsorship deal with the Women’s Tennis Association Tour, which was
renamed the Sony Ericsson WTA Tour in January 2005. The six-year title
sponsorship is an unprecedented opportunity for Sony Ericsson to offer tennis fans
new ways to experience the game through mobile technology, connectivity and
content. In the mobile gaming market Sony Ericsson took the lead in 2004, being the
first to launch Java 3D-enabled handsets, and is forging ahead to bring 3D gaming to
a wider audience.

f. O BJE CTIVE S O F THE STUDY
The Primary Objective was to study the perception & buying behavior of students
towards various mobile brands.
The Secondary Objectives of this study were to identify:
To know about the student preference level associated with different
mobile phones.
To find out the students satisfaction towards the various mobile phones.
Major features, which a customer looks for in a mobile before making a
purchase.
Factors that influence decision-making in purchasing a mobile phone.
To know which advertisement media puts more impact on the buying
decision of students.
Factors, which help in increasing the sale of mobile phones.

2. R ESEAR CH METHODOLO GY
a. SA MP LIN G ME TH ODO LO GY:
Sample Size —250 respondents
Sample Unit- Students of Graduation and the Post Graduation have been taken
as sample unit.
Sampling Area – Ghaziabad.
Sampling Technique - Random Sampling technique
b. RE S E A RCH DE S I GN : -
• Visited the students across Ghaziabad & gathered information required as per
the questionnaire.
• The research design is probability research design and is descriptive research.
c. DA TA COLLE CTI ON :
• Primary data has been used by me in the form of Questionnaire & Observation,
which are the two basic methods of collecting primary data, which suffices all
research objectives.
• Secondary data sources like catalogue of the company, product range book of
the company & various internet sites such as motorola.com & google.com have been
used.

3. DATA ANALYSIS AND INTERPRETATION
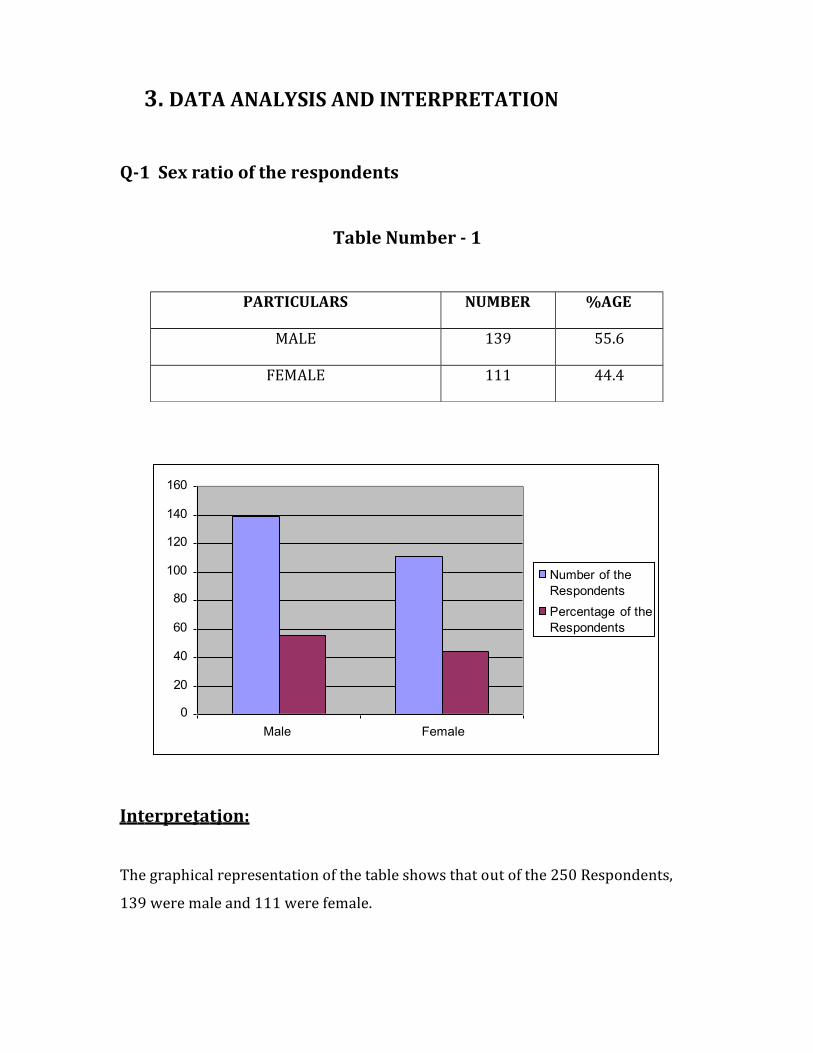
Q-1 Sex ratio of the respondents
Table Number - 1
PARTICULARS NUMBER %AGE
MALE 139 55.6
FEMALE 111 44.4
160
140
120
100
80
60
Number of theRespondents
Percentage of theRespondents
40
20
0
Male Female
Interpre tat ion:
The graphical representation of the table shows that out of the 250 Respondents,
139 were male and 111 were female.

Q.2- occupation of the Respondents’ Family
Ta b le Nu mbe r – 2
PARTICULARS NUMBER %AGE
Service 109 43.6
Professional 34 13.6
Business 76 30.4
Others 31 12.4
Total 250 100
120
100
80Number of theRespondents
60Percentage of theRespondents
40
20
0
Service Professional Business Others
Interpre tat ion
The graphical representation of the table shows that out of the 250 respondents,
109 respondents belong to the service family, 76 were from business, 34 were from
the professional and 31 were from the others family.

Q- 3 Income level of the respondents family
Ta b le Nu mbe r - 3
PARTICULARS NUMBER %AGE
Less than 15,000 101 40.4
15,001-25,000 61 24.4
25,001-35,000 52 20.8
35001 & above 36 14.4
Total 250 100
120
100
80 Number of the Respondents
60Percentage of the
40 Respondents
20
0
Less than15,000
15,001-25,000
25,001-35,000
35,001 &above
Interpre tat ion
The graphical representation of the table shows that out of the 250 respondents,
101 respondents were from the family whose income is less than 15,000, 61
respondents were from the family whose income is between the 15,001 – 25,000, 52
respondents were from the family whose income is between 25,001- 35,000 and
rest were from the family whose income is above 35,001.
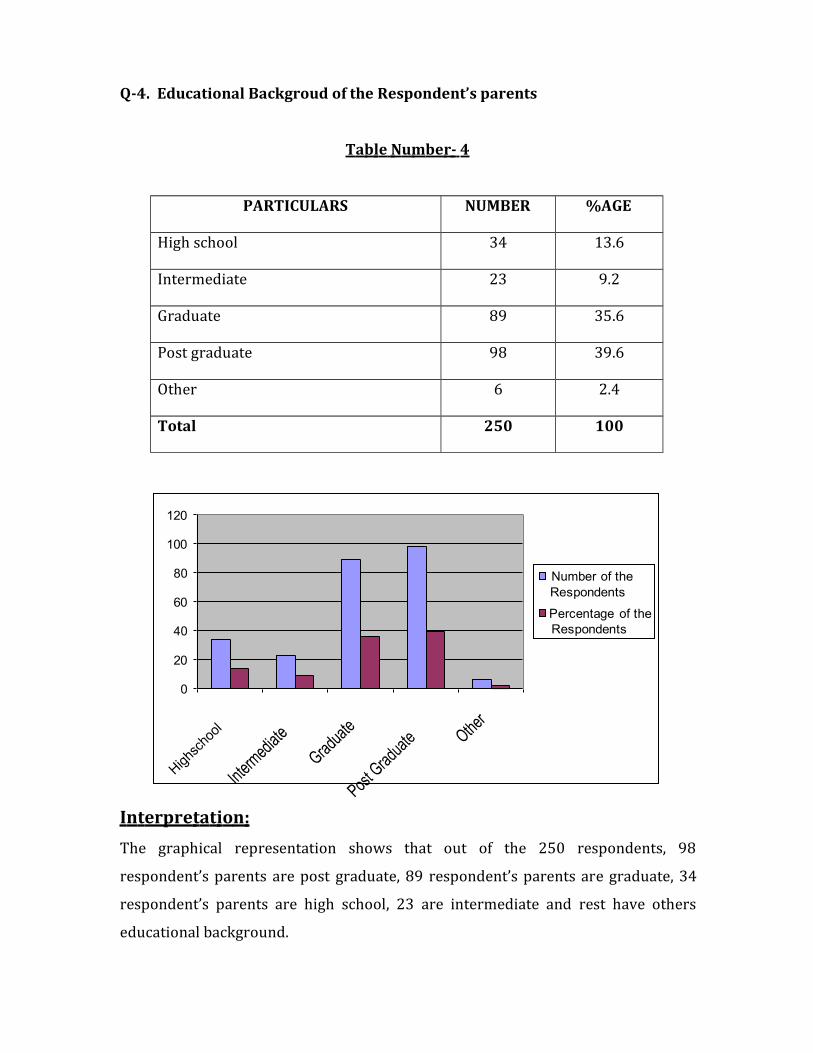
Q-4. Educational Backgroud of the Respondent’s parents
Ta b le Nu mbe r - 4
PARTICULARS NUMBER %AGE
High school 34 13.6
Intermediate 23 9.2
Graduate 89 35.6
Post graduate 98 39.6
Other 6 2.4
Total 250 100
120
100
80 Number of theRespondents
60Percentage of the
40 Respondents
20
0
I n t erpre t a t i o n :
The graphical representation shows that out of the 250 respondents, 98
respondent’s parents are post graduate, 89 respondent’s parents are graduate, 34
respondent’s parents are high school, 23 are intermediate and rest have others
educational background.

Q-5 - Which mobile phone you are using?
Ta b le No. 5
S.NO Name of the Mobile
Phones
Number of the
Respondents
Percentage of
Respondents
1 Nokia 155 62
2 Samsung 6 2.4
3 Sony Ericson 34 13.6
4 LG 22 8.8
5 Motorola 22 8.8
6 Others 11 4.4
Total 250 100.0
Number of the Respondents with Various MobilePhones
180
160
140
120
100
80
60
40
20
0
No of the respondents
Percentage ofRespondents
I n t e r pre t a t i on
Out of the 250 respondents, 155 are using the Nokia phones, 34 are using the Sony
Ericson, 6 are using the Sumsung, 22 are using the LG, 22 are using the Motorola
and 11 are using the Others.

Q.6 - How long you are using the mobile phones?
Ta b le No. - 6
S.NO Time Period of using
the mobile phones
Number of the
Respondents
Percentage of
Respondents
1 Less than 1 year 48 19.2
2 1-2 years 75 30
3 2-4 years 56 22.4
4 Above 4 years 71 28.4
Total 250 100.0
Number of the Respondents on the basis of usage time period
80
70
60
50
40
30
20
10
0
Less than 1 year
1-2 year 2-4year Above 4 year
Number of the Respondents
Percentage of the Respondents
I n t erpre t a t i on
Out of the 250 respondents 48 are using for less than year, 75 are using for 1-
2years, 56 are using for 2-4 years, 71 are using for above 4 years.

Q.7- How often do you change your mobile phone?
Table N o.- 7
S.NO Frequency of
changing the mobile
phones
Number of the
Respondents
Percentage of
Respondents
1 Less than 1 year 59 23.6
2 1-2 years 88 35.2
3 2-4 years 43 17.4
4 Above 4 years 60 24
Total 250 100.0
Number of the Respondents on the basis of frequency of changing the mobile phones
100908070605040302010
0
Less than 1 year
1-2 year 2-4year Above 4 year
Number of the Respondents
Percentage of the Respondents
Interpre tat ion
Out of the 250 respondents 59 are using for less than year, 88 are using for 1-
2years, 48 are using for 2-4 years, 60 are using for above 4 years.
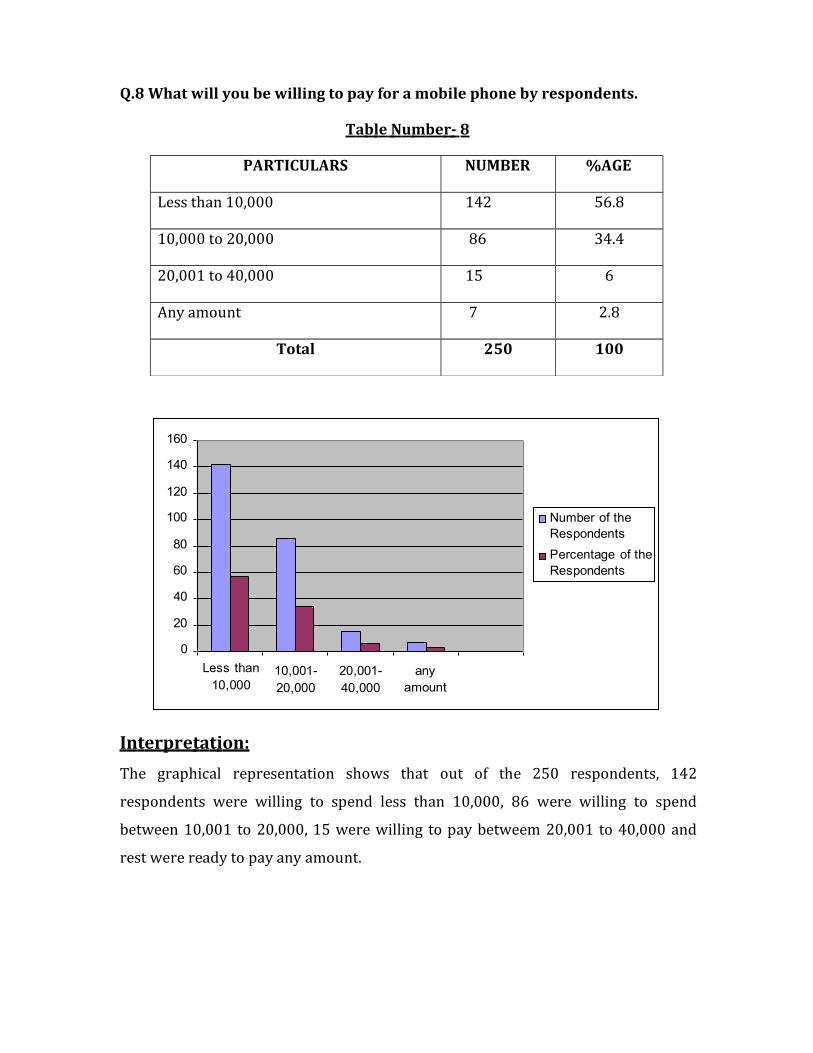
Q.8 What will you be willing to pay for a mobile phone by respondents.
Ta b le Nu mbe r - 8
PARTICULARS NUMBER %AGE
Less than 10,000 142 56.8
10,000 to 20,000 86 34.4
20,001 to 40,000 15 6
Any amount 7 2.8
Total 250 100
160
140
120
100
80
60
Number of theRespondents
Percentage of theRespondents
40
20
0
Less than10,000
10,001-20,000
20,001-40,000
any amount
I n t erpre t a t i on:
The graphical representation shows that out of the 250 respondents, 142
respondents were willing to spend less than 10,000, 86 were willing to spend
between 10,001 to 20,000, 15 were willing to pay betweem 20,001 to 40,000 and
rest were ready to pay any amount.

Q-9 . Consider the TV advertisement you like most –what brand is it
promoting by respondents.
Ta b le Nu mbe r - 9
PARTICULARS NUMBER %AGE
Nokia 122 48.8
Samsung 43 17.2
Sony Ericson 42 16.8
LG 11 4.4
Motorola 24 9.6
Iphone 2 .8
Blackberry 4 1.6
Other 2 .8
Total 250 100
140
120
100
80
60
40
20
0
Number of theRespondents
Percentage of theRespondents
I n t erpre t a t i on:
Out of the 250 respondents, 122 like the Nokia advertisement most, 43 like the
samsung, 42 like the Sony Ericson, 24 like the Motorola, 11 like the LG and rest like
others.

4. CHI- SQUARE ANALYSIS
Chi- square analysis on the relationship between gender and time
period of usage the mobile phone.
GENDER LESS THEN
1 YEAR
1-2 YEAR 2-4 YEAR ABOVE 4
YEAR
Total
MALE 23 38 32 45 138
FEMALE 25 36 25 26 112
TOTAL 48 74 57 71 250
Ho; there is no significant relationship between the gender and time period of
using the mobile phone.
H1; there is a significant relationship between the gender and time period of using
the mobile phone.
O E (O-E)2 (O-E)2/E
23 26.5 12.25 .462
25 40.8 7.84 .192
38 31.4 .36 .011
36 39.2 33.64 .858
32 21.5 12.25 .570
25 33.2 7.84 .236
45 25.5 .25 .009
26 31.9 34.81 1.091
E 3.429
X2 = Σ (O-E)2 / E = 3.429
Number of degree of freedom:
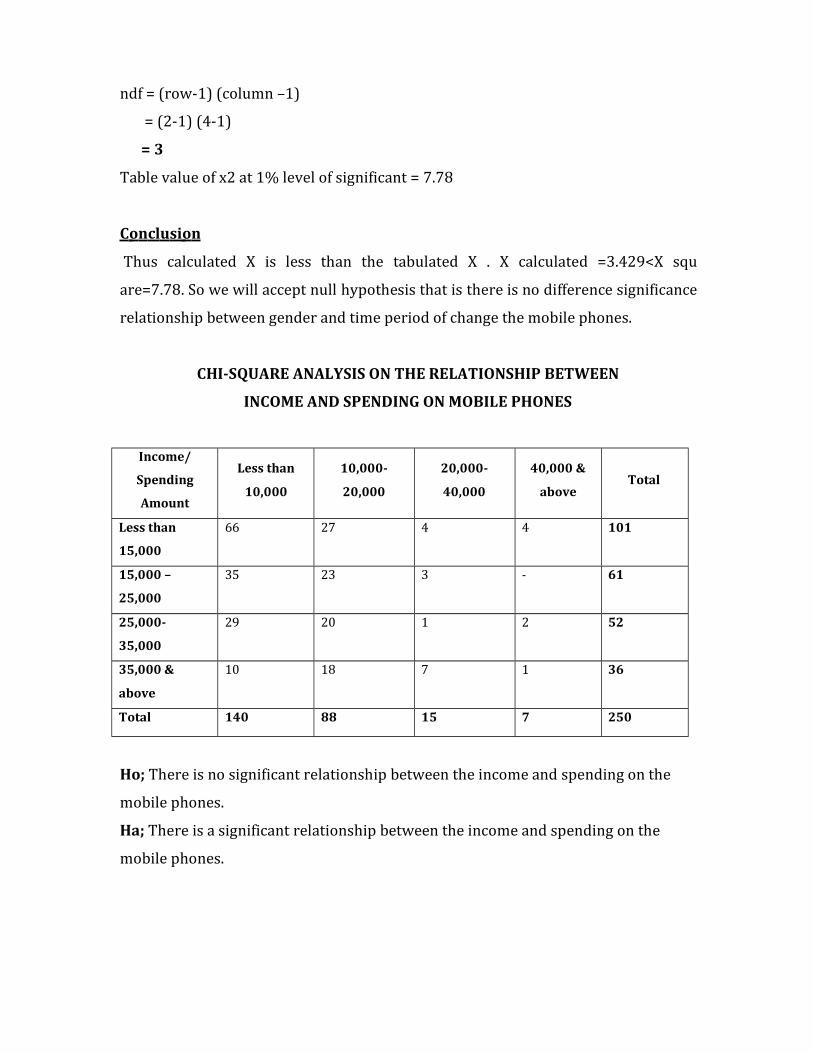
ndf = (row-1) (column –1)
= (2-1) (4-1)
= 3
Table value of x2 at 1% level of significant = 7.78
C o n cl u si o n
Thus calculated X is less than the tabulated X . X calculated =3.429<X squ
are=7.78. So we will accept null hypothesis that is there is no difference significance
relationship between gender and time period of change the mobile phones.
CHI-SQUARE ANALYSIS ON THE RELATIONSHIP BETWEEN
INCOME AND SPENDING ON MOBILE PHONES
Income/
Spending
Amount
Less than
10,000
10,000-
20,000
20,000-
40,000
40,000 &
aboveTotal
Less than
15,000
66 27 4 4 101
15,000 –
25,000
35 23 3 - 61
25,000-
35,000
29 20 1 2 52
35,000 &
above
10 18 7 1 36
Total 140 88 15 7 250
Ho; There is no significant relationship between the income and spending on the
mobile phones.
Ha; There is a significant relationship between the income and spending on the
mobile phones.
O E (O-E)2 (O-E)2/E
66 56.66 89.11 1.57
35 34.16 .70 .02
29 29.12 .01 .00
10 20.16 103.2 5.11
27 35.55 73.10 2.05
23 21.47 2.34 .11
20 18.30 2.89 .16
18 12.67 28.40 2.24
4 6.06 4.24 .70
3 3.66 .435 .12
1 3.12 4.49 1-44
7 2.16 23.42 10.84
4 2.82 1.39 .50
- 1.70 2.89 1.7
2 1.45 .30 .21
1 1 0 0
E 26.77
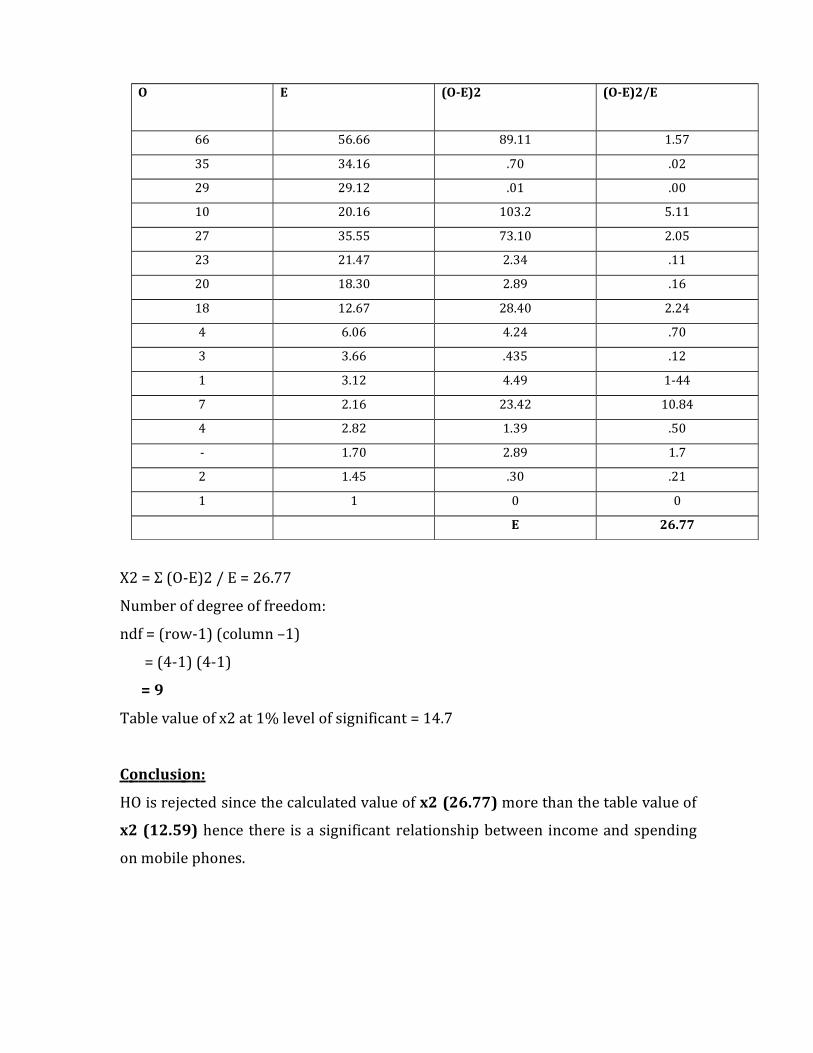
X2 = Σ (O-E)2 / E = 26.77
Number of degree of freedom:
ndf = (row-1) (column –1)
= (4-1) (4-1)
= 9
Table value of x2 at 1% level of significant = 14.7
C o n cl u si o n :
HO is rejected since the calculated value of x2 (26.77) more than the table value of
x2 (12.59) hence there is a significant relationship between income and spending
on mobile phones.

CHI-SQUARE ANALYSIS ON THE RELATIONSHIP BETWEEN
Gender AND Frequency of changing the MOBILE PHONES
GENDER LESS THEN
1 YEAR
1-2 YEAR 2-4 YEAR ABOVE 4
YEAR
Total
MALE 38 45 23 33 139
FEMALE 21 43 20 27 111
TOTAL 59 88 43 60 250
Ho; There is no significant relationship between the income and frequency of
changing the mobile phones.
Ha; There is a significant relationship between the income and frequency of
changing the mobile phones.
O E (O-E)2 (O-E)2/E
38 32.80 27.04 .82
45 48.92 15.36 .31
23 23.90 1 .04
33 33.36 .13 .00
21 26.20 27.04 1.03
43 39.07 15.44 .40
20 19.09 .82 ,04
27 26.64 .13 .00
E 2.64
X2 = Σ (O-E)2 / E = 2.64
Number of degree of freedom:
ndf = (row-1) (column –1)
= (2-1) (4-1)
= 3
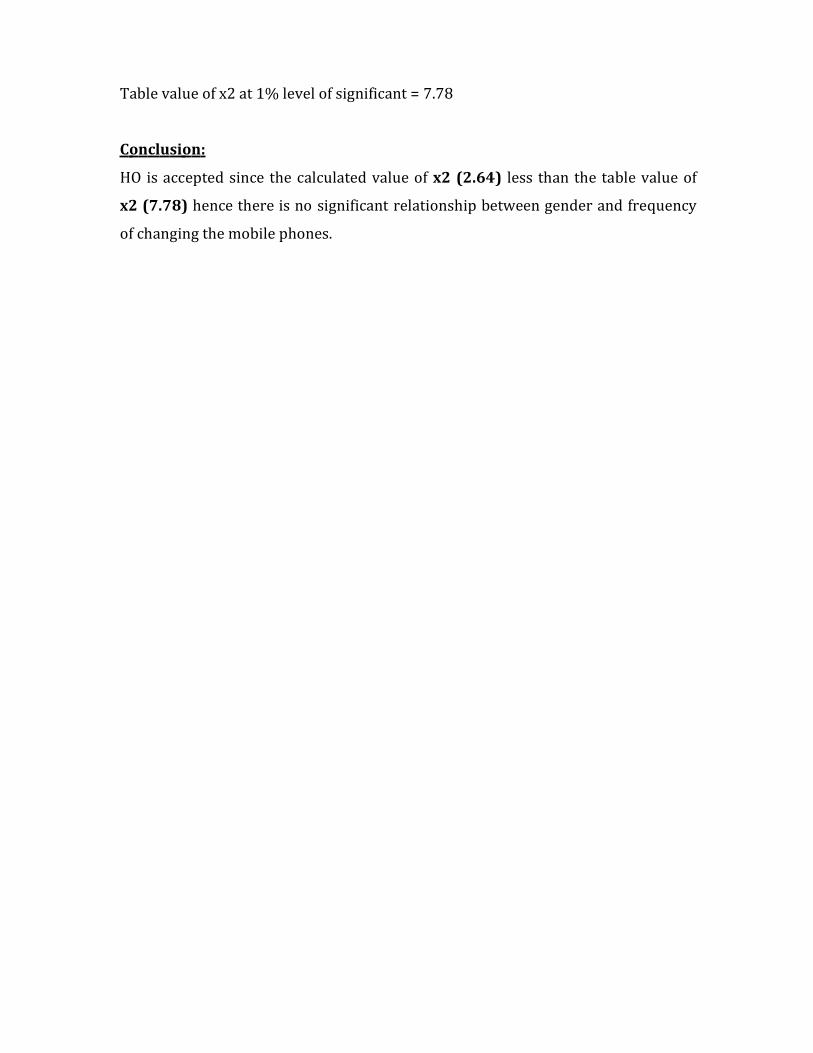
Table value of x2 at 1% level of significant = 7.78
C o n cl u si o n :
HO is accepted since the calculated value of x2 (2.64) less than the table value of
x2 (7.78) hence there is no significant relationship between gender and frequency
of changing the mobile phones.
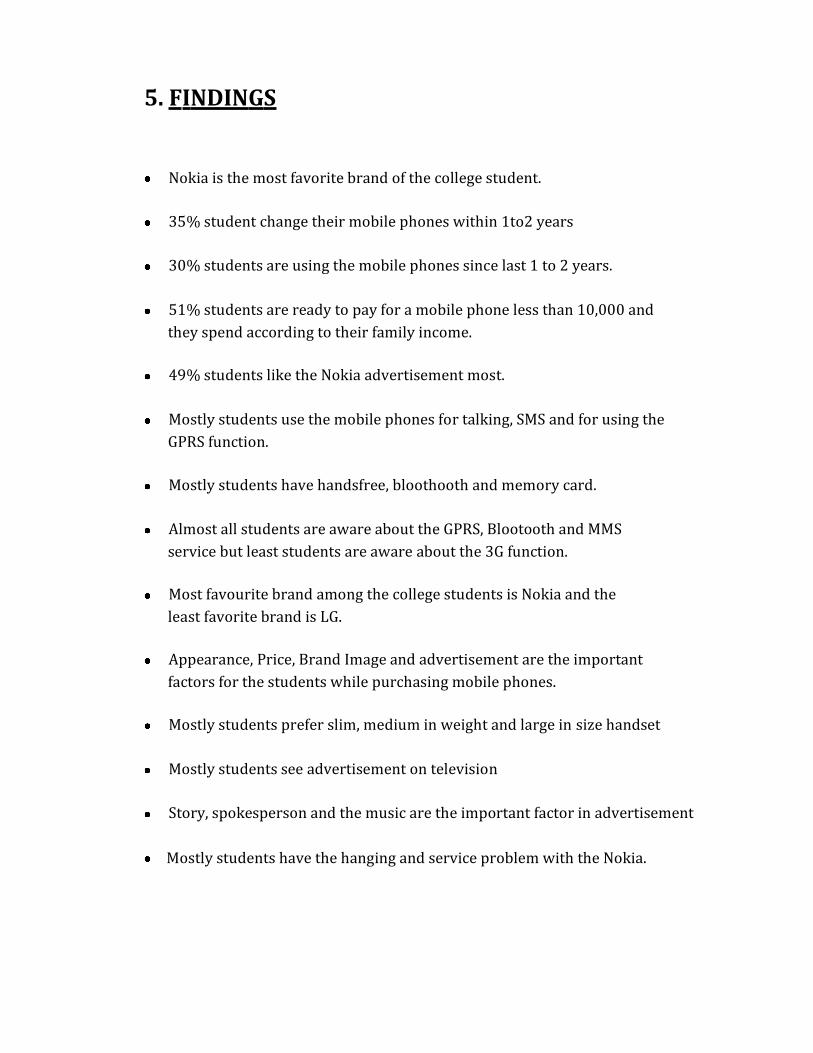
5. FINDINGS
Nokia is the most favorite brand of the college student.
35% student change their mobile phones within 1to2 years
30% students are using the mobile phones since last 1 to 2 years.
51% students are ready to pay for a mobile phone less than 10,000 and they spend according to their family income.
49% students like the Nokia advertisement most.
Mostly students use the mobile phones for talking, SMS and for using theGPRS function.
Mostly students have handsfree, bloothooth and memory card.
Almost all students are aware about the GPRS, Blootooth and MMS service but least students are aware about the 3G function.
Most favourite brand among the college students is Nokia and the least favorite brand is LG.
Appearance, Price, Brand Image and advertisement are the important factors for the students while purchasing mobile phones.
Mostly students prefer slim, medium in weight and large in size handset
Mostly students see advertisement on television
Story, spokesperson and the music are the important factor in advertisement
Mostly students have the hanging and service problem with the Nokia.

6. R ECOMMENDA TION S
Nokia should provide better service and try to solve the hanging
problem Cellular companies should increase the awareness about the 3G
service. Companies should offer more range of Rs. 10,000 or less than
10,000.
LG and Samsung should try to expand its market share and also should try to
increase the awareness through the television advertisement.
All companies should increase their distribution channel.
The companies should continue to work on the Strategy of T.Q.M (Total
Quality Management)
Consumers do not get satisfied with the promotional policies of the
companies. New techniques of promotion is required to create
awareness about the entire range of companies products.
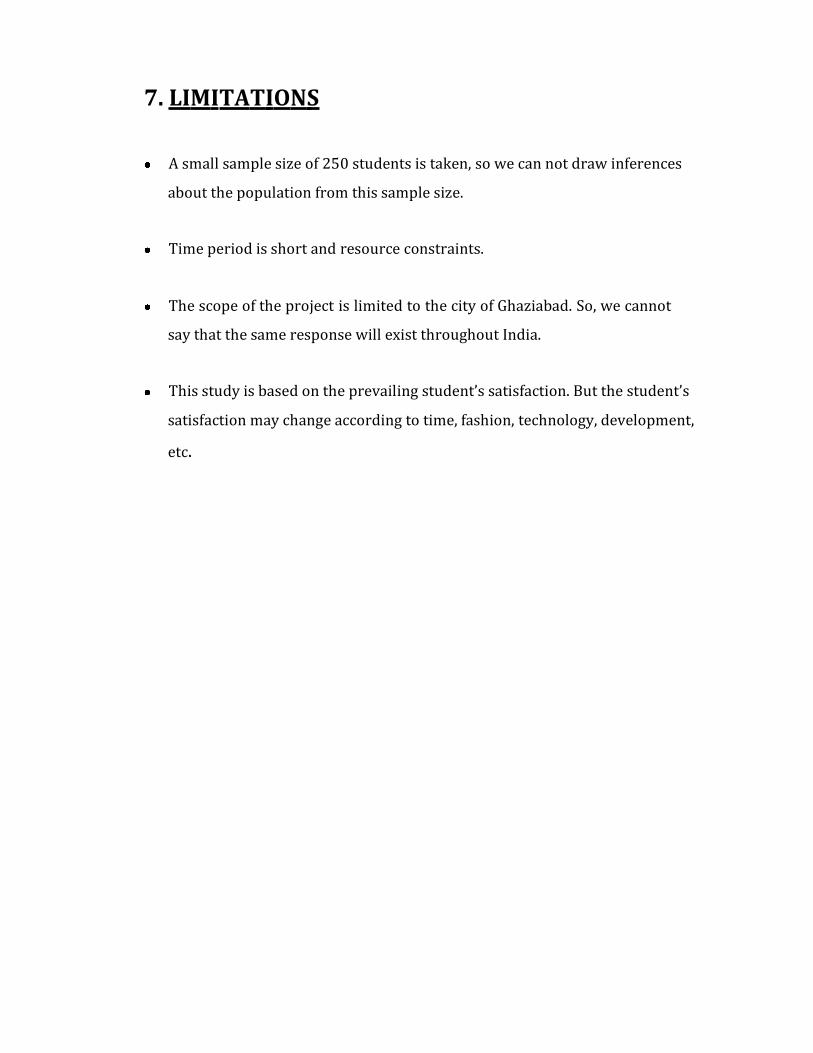
7. LIMITAT ION S
A small sample size of 250 students is taken, so we can not draw inferences
about the population from this sample size.
Time period is short and resource constraints.
The scope of the project is limited to the city of Ghaziabad. So, we cannot
say that the same response will exist throughout India.
This study is based on the prevailing student’s satisfaction. But the student’s
satisfaction may change according to time, fashion, technology, development,
etc.

8. BIBLIOGR APHY
B OOK S :
MARKETING MANAGEMENT - V.S. Ramaswamy,
S.Namakumari
RESEARCH METHODOLOGY - C.R.Kothari
OPERATION RESEARCH - Vittal
We b Re s our ce s :
Error! Hyperlink reference not valid.
h tt p : / / w w w . n o k i a . c o m / t -a bo u t u s - tt s l - o r g a n i z a t i o n . a s p x
h tt p: / / w w w . s am s u n g . c o .i n / w e b a p p / A b o u t us / a bo u t u s h o me . j s
h tt p : / / w w w . L G .c o m / L G .por t a l ? n f p b = t r u e & p a g e L a b e l = LG P a g e
Ab o u t LG
h tt p: / / w w w . m o t o r ol a . c o .i n / a bo u t .h t m
w w w .googl e . c o m
w w w . s c ribd. c o m
9. ANN EXU R E
Q u estio nna ire
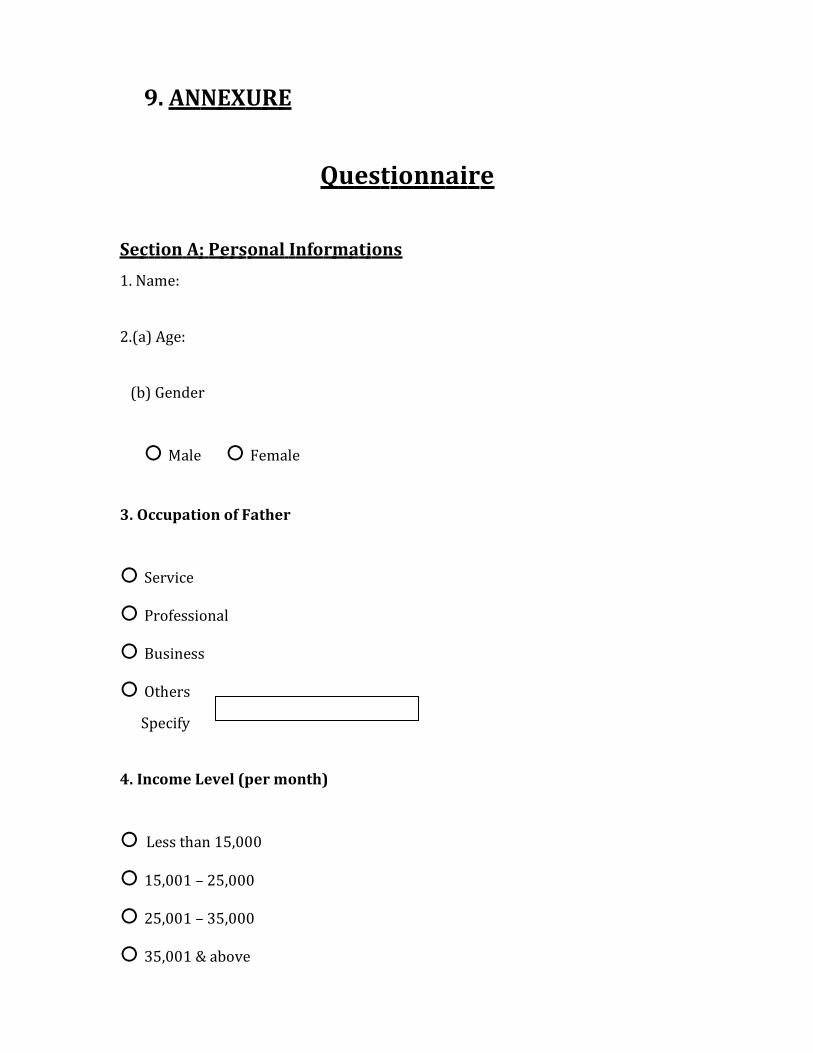
Se c t i on A : P e r s onal I nfo r m a t i ons
1. Name:
2.(a) Age:
(b) Gender
Male Female
3. Occupation of Father
Service
Professional
Business
Others
Specify
4. Income Level (per month)
Less than 15,000
15,001 – 25,000
25,001 – 35,000
35,001 & above

(examp
5. Educational Background ( Parents)
High School
Intermediate
Graduate
Post Graduate
If Other
Specify
S e cti on B : Ab out m ob i le phone s
6) Which mobile phone you are using.
A) Nokia B) Samsung
C) Sony Ericson D) LG
E) Motorola F) iPhone
G) Blackberry H) Others
Specify
7) Please write the model of your phone
le: Nokia 1100, Ericson k800i, etc.)
8) How long you are using the mobile phone

Less than 1 year
1 – 2 years
2 – 4 years
Above 4 years
9) What are the reasons for using the above mentioned model.
A) WAP
B) Just to talk on it
C) Use GPRS function
D) Receive Email & SMS
E) Down Load Files
F) Others (Specify
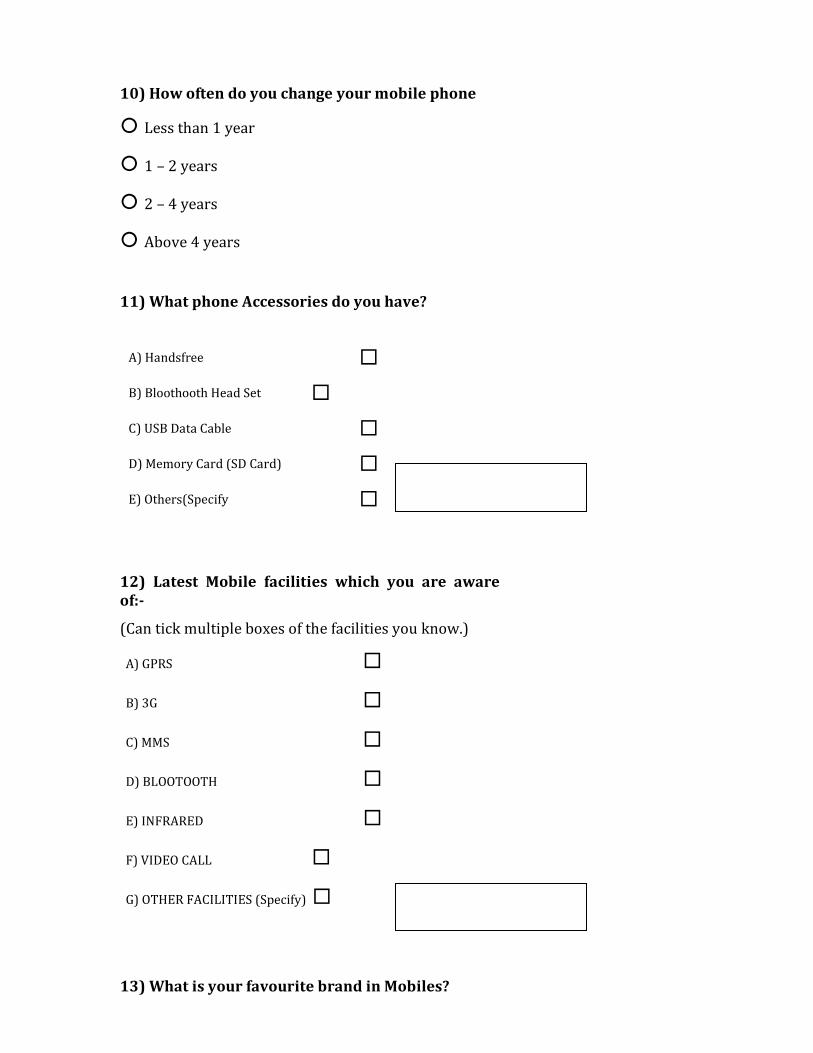
10) How often do you change your mobile phone
Less than 1 year
1 – 2 years
2 – 4 years
Above 4 years
11) What phone Accessories do you have?
A) Handsfree
B) Bloothooth Head Set
C) USB Data Cable
D) Memory Card (SD Card)
E) Others(Specify
12) Latest Mobile facilities which you are aware of:-
(Can tick multiple boxes of the facilities you know.)
A) GPRS
B) 3G
C) MMS
D) BLOOTOOTH
E) INFRARED
F) VIDEO CALL
G) OTHER FACILITIES (Specify)
13) What is your favourite brand in Mobiles?
A) Advertisement
1
2
3
4
5
B) Appearance
C) Price
D) Functions
E) Quality
F) Brand Image
G) Service
H) Recommended by friends
I) Others
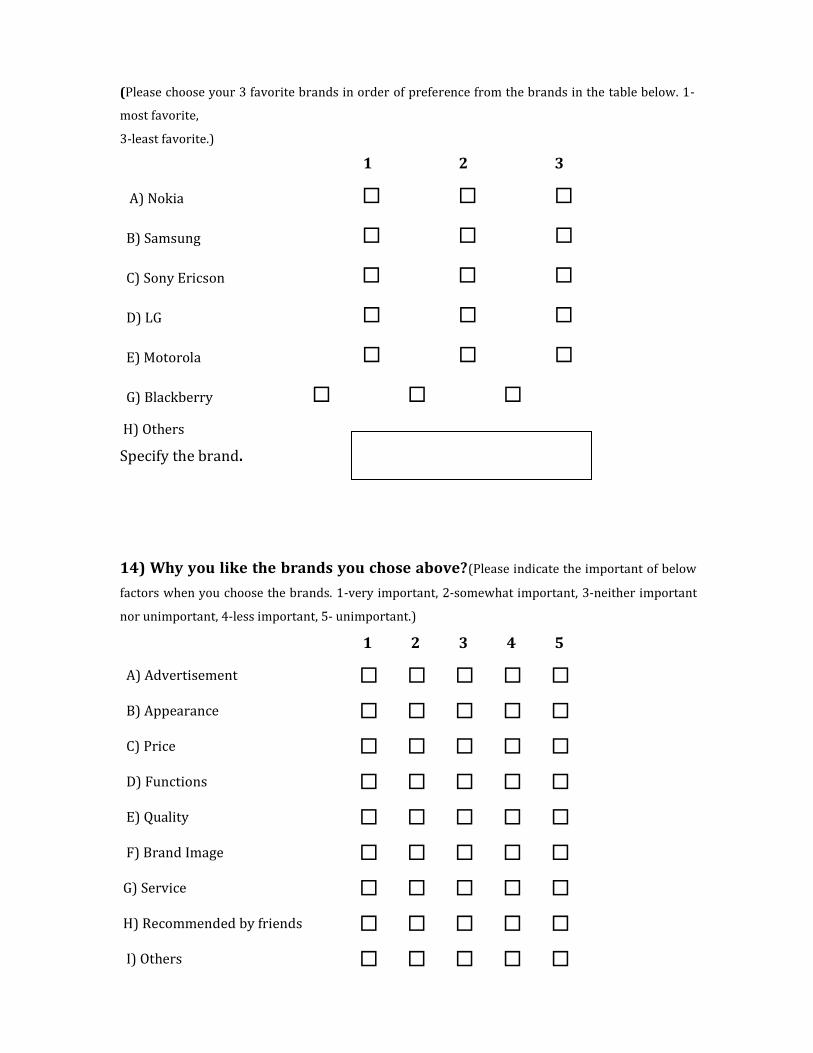
(Please choose your 3 favorite brands in order of preference from the brands in the table below. 1-
most favorite,
3-least favorite.)
1 2 3
A) Nokia
B) Samsung
C) Sony Ericson
D) LG
E) Motorola
G) Blackberry
H) Others
Specify the brand.
14) Why you like the brands you chose above?(Please indicate the important of below
factors when you choose the brands. 1-very important, 2-somewhat important, 3-neither important
nor unimportant, 4-less important, 5- unimportant.)
Specify.
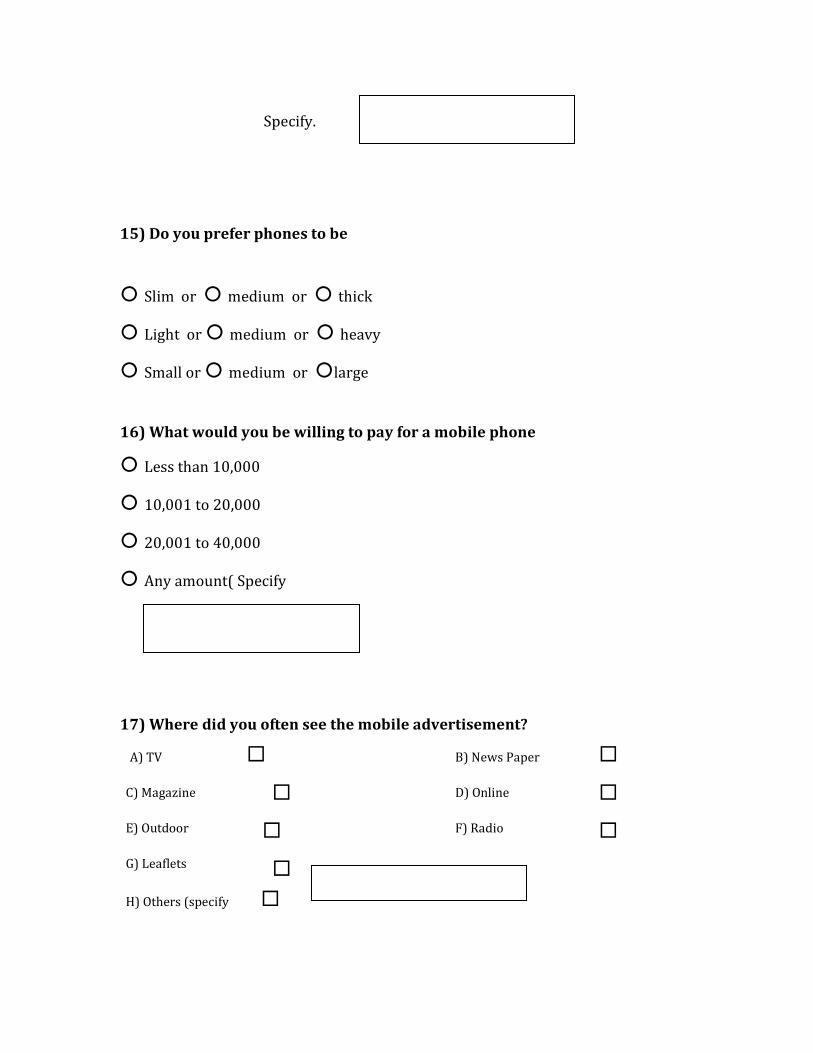
15) Do you prefer phones to be
Slim or medium or thick
Light or medium or heavy
Small or medium or large
16) What would you be willing to pay for a mobile phone
Less than 10,000
10,001 to 20,000
20,001 to 40,000
Any amount( Specify
17) Where did you often see the mobile advertisement?
A) TV B) News Paper
C) Magazine
E) Outdoor
G) Leaflets
D) Online
F) Radio
H) Others (specify
18) Consider the TV advertisement you like – what brand is it promoting
A) Nokia B) Samsung
C) Sony Ericson D) LG
E) Motorola F) iPhone
G) Blackberry H) Others
Specify
19) Which of the following would impress you the most?
(Please indicate the important of below factors when you choose the brands. 1-very important, 2-
somewhat important, 3-neither important nor unimportant, 4-less important, 5- unimportant.)
A. Slogan
1
2
3
4
5
B. Picture
C. Color
D. Story
E. Spokesperson
F. Music
G. Others
H. Recommended by
Friends
I. Others (Specify)
20.) Are there any general comments you would make about what you
like/dislike about mobile phones? (This could be pricing, location of sales,
reception, colour, memory, or anything else.)