BRAND PERSONALITY PERCEPTIONS OF LUXURY SEDAN MOTOR ... · ABSTRACT . Key words: Brand personality,...
127
BRAND PERSONALITY PERCEPTIONS OF LUXURY SEDAN MOTOR VEHICLES AMONGST THE SOUTH AFRICAN GENERATION Y COHORT Philasande Sokhela Student number: 22381937 Dissertation submitted in fulfilment of the requirements for the degree MASTER OF COMMERCE in the discipline of Marketing Management in the FACULTY OF ECONOMIC SCIENCES AND INFORMATION TECHNOLOGY at the NORTH-WEST UNIVERSITY VAAL TRIANGLE CAMPUS Supervisor: Mr R. Müller Co-supervisor: Prof. A.L Bevan-Dye 2015
Transcript of BRAND PERSONALITY PERCEPTIONS OF LUXURY SEDAN MOTOR ... · ABSTRACT . Key words: Brand personality,...

BRAND PERSONALITY PERCEPTIONS OF LUXURY SEDAN MOTOR VEHICLES AMONGST THE SOUTH AFRICAN GENERATION Y COHORT
Philasande Sokhela
Student number: 22381937
Dissertation submitted in fulfilment of the requirements for the degree
MASTER OF COMMERCE
in the discipline of
Marketing Management
in the
FACULTY OF ECONOMIC SCIENCES AND INFORMATION TECHNOLOGY
at the
NORTH-WEST UNIVERSITY
VAAL TRIANGLE CAMPUS
Supervisor: Mr R. Müller Co-supervisor: Prof. A.L Bevan-Dye 2015

DECLARATION
I, Philasande Sokhela declare that BRAND PERSONALITY PERCEPTIONS OF
LUXURY SEDAN MOTOR VEHICLES AMONGST THE SOUTH AFRICAN
GENERATION Y COHORT is my own work and that all the sources I have used or quoted
have been indicated and acknowledged by means of complete references.
Signature: _____________________________
Date: _____________________________
ii
05/03/2015

DECLARATION OF LANGUAGE EDITING
26 November 2014
To whom it may concern
This is to confirm that I, the undersigned, have language edited the completed research
of Philasande Sokhela for the Master of Commerce thesis entitled: Brand personality
perceptions of luxury sedan motor vehicles amongst the South African Generation Y
cohort.
The responsibility of implementing the recommended language changes rests with the
author of the thesis.
Yours truly,
Jomoné Müller
iii

ACKNOWLEDGEMENTS
I would like to pay a special thanks to the following persons for assistance in completing
the study:
• To God, I let go and you took over, without your blessings it seemed impossible. Thank
you for giving me courage, determination and purpose
• To my mother Nontobeko Sokhela, your support gave me confidence. You are my
pillar of strength may god bless you. I love you.
• To my siblings Cebelihle Sokhela, Mpakamiso Sokhela and Lindelo Sokhela, your
support was countless. Thank you
• To my supervisor Re-an Müller and Co-supervisor Prof. Ayesha Bevan-Dye, for
guidance, support, encouragement and believing in my dream.
• To my friends, thank you for pushing me to limitless boundaries.
• To Aldine Oosthuizen for her expertise in assisting with statistics and processes
involved in the study.
• To Jomone Müller, for language editing.
• To all the Generation Y students for participating in the study.
iv

ABSTRACT
Key words: Brand personality, Personality scale, Luxury sedan, Motor vehicles,
Generation Y, South Africa
Brand personality is a set of human personality traits that are relevant to a brand. A
distinctive brand personality serves a symbolic or self-expressive function and helps to
create a set of unique and favourable associations in the consumer’s mind. Generation Y
consumers are considerably more brand and image conscious than any other
generational cohort. Given that motor vehicles, especially luxury motor vehicles, are a
conspicuous consumption item that are often used to signal status to others, luxury motor
vehicle marketers need to understand Generation Y members’ perceptions of brand
personality. Aaker (1997) developed a brand personality trait scale to measure brand
personality perceptions. This study established a factor structure for Aaker’s (1997) brand
personality trait scale applicable for luxury sedan brands. This adapted brand personality
trait scale was used to investigate the brand personality perceptions of luxury sedan
motor vehicles amongst Generation Y.
The target population for this study was defined as students registered at South Africa’s
public HEIs in 2014. This study made use of a non-probability convenience sample to
select one traditional university campus and one university of technology campus located
in the Gauteng province of South Africa. Self-administered questionnaires were
distributed in two separate steps. Step 1 of the study distributed the questionnaire to 65
participants to identify Generation Y students’ top-of-the-mind awareness concerning
luxury sedan motor vehicle brands. Step 2 of the study distributed 500 questionnaires to
investigate the brand personality perceptions of luxury sedan brands amongst Generation
Y students by means of Aaker’s (1997) brand personality trait scale. Step 2 also
investigated Generation Y students’ purchasing intentions of luxury sedan motor vehicles
by making use of an adapted a scale by Zeithaml et al. (1996:31-46). The statistical
analysis included exploratory factor analysis, descriptive statistical analysis and
significance tests.
The findings of the study suggest that Generation Y students’ top three luxury sedan
brands are BMW, Mercedes-Benz and Audi. The brand personality perception results
revealed that all three brands are associated with the ‘Competence’ and ‘Sophisticated’
brand personality dimensions. In addition, BMW is also associated with the ‘Excitement’
v

brand personality dimension. The findings of the study also suggest that Generation Y
students do have purchasing intentions of luxury sedan motor vehicles. Some gender
differences regarding Generation Y students’ brand personality perceptions and
purchasing intentions of luxury sedan motor vehicles do exist. However, the differences
are limited with a small effect of practical significance.
The study offers insight into the brand personality perceptions in the South African
market. Generation Y consumers have unique perceptions regarding different brands and
it is therefore important to gain insight regarding their perceptions. The results presented
in this study can aid the marketers of the selected luxury sedan motor vehicle brands in
identifying the personality traits associated with their brand. This information can be
compared with their current marketing strategy to determine if any differences exist
between the desired and perceived brand personality. This can also help the marketers
to tailor the marketing strategy accordingly to achieve the desired brand personality.
vi

TABLE OF CONTENTS
DECLARATION .................................................................................. ii
DECLARATION OF LANGUAGE EDITING ...................................... iii
ACKNOWLEDGEMENTS .................................................................. iv
ABSTRACT ........................................................................................ v
TABLE OF CONTENTS.................................................................... vii
LIST OF TABLES ............................................................................ xiii
LIST OF FIGURES .......................................................................... xiv
CHAPTER 1: INTRODUCTION .......................................................... 1
1.1 INTRODUCTION ....................................................................... 1
1.2 PROBLEM STATEMENT .......................................................... 2
1.3 OBJECTIVES OF THE STUDY ................................................. 3
1.3.1 Primary objective............................................................................. 3
1.3.2 Theoretical objectives ..................................................................... 3
1.3.3 Empirical objectives ........................................................................ 4
1.4 HYPOTHESES TESTING .......................................................... 4
1.5 RESEARCH DESIGN METHODOLOGY .................................. 5
1.5.1 Literature review .............................................................................. 5
1.5.2 Empirical study ................................................................................ 5
1.5.2.1 Target population............................................................................... 5
1.5.2.2 Sampling frame ................................................................................. 6
1.5.2.3 Sampling method............................................................................... 6
1.5.2.4 Sample size ....................................................................................... 6
vii

1.5.2.5 Measuring instrument and data collection method ............................ 6
1.5.2.6 Statistical analysis ............................................................................. 7
1.6 CHAPTER CLASSIFICATION .................................................. 7
1.7 ETHICS STATEMENT ............................................................... 8
1.8 CONCLUSION ........................................................................... 8
CHAPTER 2: DEFINING THE BRANDING CONCEPT ...................... 9
2.1 INTRODUCTION ....................................................................... 9
2.2 DEFINING BRANDING ............................................................. 9
2.2.1 Brand name .................................................................................... 10
2.2.2 Brand mark/logo ............................................................................ 11
2.2.3 Brand image ................................................................................... 11
2.2.4 Brand awareness ........................................................................... 11
2.2.5 Brand loyalty .................................................................................. 12
2.2.6 Brand equity .................................................................................. 12
2.2.7 Brand strategy ............................................................................... 13
2.2.8 Brand positioning .......................................................................... 13
2.2.9 Brand personality .......................................................................... 14
2.3 AAKER’S BRAND PERSONALITY TRAIT SCALE ............... 14
2.4 MARKETING STRATEGY ELEMENTS INFLUENCED BY BRAND PERSONALITY ......................................................... 18
2.4.1 Product ........................................................................................... 18
2.4.2 Place ............................................................................................... 19
2.4.3 Price ................................................................................................ 20
2.4.4 Promotion ...................................................................................... 20
2.5 BRAND PERSONALITY’S INFLUENCE ON CONSUMER BEHAVIOUR ........................................................................... 21
viii

2.6 LUXURY SEDAN MOTOR VEHICLES IN THE SOUTH AFRICAN MARKET ................................................................ 22
2.7 FACTORS INFLUENCING THE PURCHASE DECISIONS OF LUXURY SEDANS .................................................................. 23
2.8 PURCHASING INTENTIONS .................................................. 24
2.9 GENERATION Y ...................................................................... 24
2.10 CONCLUSION ......................................................................... 25
CHAPTER 3: RESEARCH METHODOLOGY................................... 26
3.1 INTRODUCTION ..................................................................... 26
3.2 RESEARCH DESIGN .............................................................. 26
3.3 RESEARCH APPROACH ....................................................... 27
3.4 SAMPLING STRATEGY ......................................................... 28
3.4.1 Target Population .......................................................................... 28
3.4.2 Sampling frame.............................................................................. 28
3.4.3 Method of sampling ....................................................................... 28
3.4.4 Sample size .................................................................................... 29
3.5 DATA COLLECTION METHOD .............................................. 29
3.5.1 Measuring instrument and data Collection ................................. 29
3.5.2 Questionnaire design .................................................................... 30
3.5.3 Questioning format ....................................................................... 30
3.5.3.1 Step 1: Brand identification .............................................................. 30
3.5.3.2 Step 2: Brand personality perceptions ............................................. 31
3.5.4 Questionnaire layout ..................................................................... 31
3.6 ADMINISTRATION OF THE QUESTIONNAIRES .................. 32
3.7 PILOT TESTING OF THE QUESTIONNAIRES ...................... 33
ix

3.8 DATA PREPARATION ............................................................ 33
3.9 STATISTICAL ANALYSIS ...................................................... 34
3.9.1 Descriptive statistics ..................................................................... 34
3.9.1.1 Frequency distribution ..................................................................... 35
3.9.1.2 Mean ............................................................................................... 35
3.9.1.3 Median ............................................................................................. 35
3.9.1.4 Mode ............................................................................................... 35
3.9.1.5 Range .............................................................................................. 35
3.9.1.6 Variance .......................................................................................... 35
3.9.1.7 Standard deviation........................................................................... 36
3.10 EXPLORATORY FACTOR ANALYSIS .................................. 36
3.10.1 Principle component analysis ...................................................... 36
3.10.2 Kaiser-Meyer-Olkin (KMO) ............................................................ 37
3.11 RELIABILITY ........................................................................... 37
3.12 VALIDITY ................................................................................. 37
3.13 TEST OF SIGNIFICANCE ....................................................... 38
3.13.1 T-test ............................................................................................... 38
3.13.2 ANOVA ........................................................................................... 39
3.13.3 Practical significance .................................................................... 39
3.14 CONCLUSION ......................................................................... 39
CHAPTER 4: DATA ANALYSIS AND INTERPRETATION .............. 41
4.1 INTRODUCTION ..................................................................... 41
4.2 DATA GATHERING PROCESS .............................................. 41
4.3 PRELIMINARY DATA ANALYSIS .......................................... 42
4.3.1 Coding ............................................................................................ 42
x

4.3.2 Tabulation ...................................................................................... 45
4.4 DEMOGRAPHIC ANALYSIS .................................................. 45
4.4.1 Step 1 – Brand identification ........................................................ 46
4.4.2 Step 1 – Brand personality perceptions ...................................... 47
4.5 EXPLORATORY FACTOR ANALYSIS .................................. 51
4.6 RELIABILITY AND VALIDITY ................................................. 55
4.7 TOP-OF-THE-MIND AWARENESS CONCERNING LUXURY SEDAN MOTOR VEHICLE BRANDS ..................................... 55
4.8 ASSESSMENT OF BRAND PERSONALITY PERCEPTIONS OF LUXURY SEDAN MOTOR VEHICLES ............................. 57
4.8.1 Brand personality traits association with luxury sedans .......... 57
4.8.2 Brand personality traits association with each brand ............... 58
4.8.3 Significance testing: Brand personality dimensions ................. 61
4.8.4 Hypothesis testing: Comparing the male and female respondents’ with regard to brand personality trait perceptions .................................................................................... 64
4.9 ASSESSMENT OF PURCHASING INTENTIONS OF LUXURY SEDAN MOTOR VEHICLES ................................................... 66
4.9.1 Purchasing intentions of luxury sedans ..................................... 66
4.9.2 Purchasing intentions of each of the brands .............................. 67
4.9.3 Significance testing: Purchasing intentions ............................... 69
4.9.4 Hypothesis testing: Comparing the male and female respondents’ with regard to purchasing intentions. .................. 73
4.10 CONCLUSION ......................................................................... 75
CHAPTER 5: RECOMMENDATIONS AND CONCLUSION ............. 76
5.1 INTRODUCTION ..................................................................... 76
xi

5.2 OVERVIEW OF THE STUDY .................................................. 76
5.3 MAIN FINDINGS ...................................................................... 77
5.4 CONTRIBUTIONS OF THE STUDY ........................................ 80
5.5 RECOMMENDATIONS ........................................................... 80
5.6 FUTURE RESEARCH OPPORTUNITIES ............................... 81
5.7 CONCLUDING REMARKS ..................................................... 82
BIBLIOGRAPHY .............................................................................. 83
APPENDIX A: QUESTIONNAIRES .................................................. 98
APPENDIX B FREQUENCIES ON EACH ITEM ............................. 105
xii

LIST OF TABLES
Table 2.1: The ‘Big Five’ model of personality traits .............................................. 15
Table 2.2: Aaker’s brand personality dimensions with related items ..................... 17
Table 3.1: Empirical objectives and the items contained in the questionnaire and
study ..................................................................................................... 32
Table 3.2: The coding information used for Step 2 ................................................ 34
Table 4.1: Coding information (Step 2) ................................................................. 43
Table 4.2: Rotated factors ..................................................................................... 52
Table 4.3: Reliability and average inter-item correlation values ............................ 55
Table 4.4: Top 10 Luxury sedan brand personality traits ...................................... 57
Table 4.5: Top 10 brand personality traits association with Mercedes-Benz, BMW,
and Audi ............................................................................................... 59
Table 4.6: Brand personality dimensions according to different brands ................ 60
Table 4.7: Analysis of variance (Brand personality dimensions) ........................... 62
Table 4.8: Tukey’s HSD results (Brand personality dimensions)........................... 63
Table 4.9: Statistical and practically significant differences, comparing the male and
female respondents’ concerning brand personality perceptions ........... 65
Table 4.10: Luxury sedan brand purchasing intentions ........................................... 66
Table 4.11: Purchasing intentions of Mercedes-Benz, BMW and Audi ................... 68
Table 4.12: Analysis of variance (ANOVA) ............................................................. 70
Table 4.13: Post hoc Tukey’s HSD test results ....................................................... 72
Table 4.14: Statistical and practical significant difference between males and females
purchasing intentions ........................................................................... 74
xiii

LIST OF FIGURES
Figure 2.1: Aaker’s Brand personality Framework .................................................. 16
Figure 4.1: Gender distribution (Step 1) ................................................................. 46
Figure 4.2: Race distribution (Step 1) ..................................................................... 46
Figure 4.3: Province of origin distribution (Step 2).................................................. 47
Figure 4.4: Year of Study distribution (Step 2) ....................................................... 48
Figure 4.5: Gender distribution (Step 2) ................................................................. 49
Figure 4.6: Ethnic group distribution (Step 2) ......................................................... 49
Figure 4.7: Mother tongue ...................................................................................... 50
Figure 4.8: Age population distribution (Step 2) ..................................................... 51
Figure 4.9: Luxury sedan brand personality trait dimensions (adapted from Aaker,
1997) .................................................................................................... 54
Figure 4.10: Graphical illustration of brands selected by respondents. .................... 56
Figure 4.11: Brand personality dimension distribution of the luxury sedan brands ... 61
Figure 4.12: Intentions according to different brands ............................................... 69
Figure 5.1: Brand personality perceptions .............................................................. 79
xiv

CHAPTER 1: INTRODUCTION
1
1.1 INTRODUCTION
Brand personality is a set of human personality traits that are relevant to a brand (Aaker,
1997:347). Auzolay and Kapferer (2003:5) explain that since there are various definitions
of brand personality, it is important to define the concept of personality clearly, as this will
influence the context through which it is being used. (Ranjbar, 2010 & Keller, 1993).
People typically use different brands, including prestige brands as a way of expressing
themselves to others and signalling their uniqueness (Rook, 1985:252).
According to Plummer (1984:25), as quoted in Geuens, Weijters and De Wulf (2009:97),
brand personality is a significant factor in understanding how consumers choose between
different brands. Brand personality forms a major component of brand identity. Kapferer
(2008:12) emphasises that a brand’s identity is its meaning, which is created by the
business.
Keller (2006:74) highlights that brand personality serves to create a strong brand identity.
Therefore, businesses will be better able to position their brands successfully if they have
clearly defined a brand’s attributes and traits (Wood, 2000:666). Uggla (2006:787) cites
that brand architecture refers to the link between brands and certain human-like
characteristics, which creates certain associations. Khare and Handa (2009:65) points
out that brand personality underpins the postmodern branding and fulfils a multifaceted
function in businesses targeting consumers, especially in terms of their marketing
communications.
Brand personality has a direct influence on consumer behaviour. A distinctive brand
personality helps to create a set of unique and favourable associations in the consumer’s
mind and, therefore, evokes an enhanced sense of brand equity (Ranjbar, 2010:11). A
well-defined and established brand personality serves to encourage brand preference
amongst consumers and helps develop stronger emotional ties with, and trust and loyalty
in the brand (Malhotra & Naresh, 1988:211). Aaker (1996:349-350) indicates that brand
personality is one of the most significant dimensions of the brand identity and plays an
important role in the consumer decision-making process.
Chapter 1: Introduction 1

Noting the salience of brand personality in creating a brand identity, Aaker (1997)
developed a brand personality trait scale based on the Big Five personality traits model
of human personality. The scale consists of five generic dimensions, namely ‘excitement,
sincerity, competence, sophistication and ruggedness’. This scale has served as a brand
personality measure in several studies (Geuens et al., 2009:97, Aaker et al., 2001; Kim,
Han & Park, 2001).
1.2 PROBLEM STATEMENT
Clark (2013:1) indicates that the luxury motor vehicle market in South Africa is dominated
by three main German brands, BMW, Mercedes-Benz and Audi, and that together these
brands have a market share of around 80 per cent. Luxury motor vehicle sales accounted
for about 18 per cent of total passenger motor vehicle sales in 2012 (Clark, 2013:1). There
are various definitions of the Generation Y cohort but this study opted for Market’s
(2004:21) definition. Generation Y, is defined as individuals born between 1986 and 2005
(Market, 2004:21). Generation Y represents an important current and future target market
to marketers (LaSalle, 2003:3), including those in the luxury motor vehicle market. Given
that motor vehicles, especially luxury motor vehicles, are a conspicuous consumption
item that are often used to signal status to others (Han et al., 2010:27), luxury motor
vehicle marketers need to understand Generation Y members’ perceptions of brand
identity and their attachment to brands.
Marketers want to attract individuals in the Generation Y cohort and earn their loyalty
(Williams & Page, 2011:2). Generation Y consumers are considerably more brand and
image conscious than their predecessors in the Generation X and Baby Boomer cohorts
(Deloitte, 2014:4). According to a survey conducted by Deloitte 2014, brand image
determines which vehicles are permitted into the Generation Y cohort’s consideration set.
The survey revealed that more than 67 per cent of Generation Y participants indicated
‘brand image’ as a critical aspect when purchasing a luxury motor vehicle. Nearly half
(47%) of these participants indicated that their impressions from other consumers who
drive a luxury motor vehicle would affect their purchase. This is in contrast to a previous
survey by Deloitte (2010) that suggested that only 33 per cent of Generation X and 24
per cent of Baby Boomer consumers’ purchases are influenced by the impressions of
other consumers.
Chapter 1: Introduction 2

Generation Y consumers tend to establish a holistic relationship with a particular brand,
meaning that the brand should play an important role in their lives (McAlexander et al.,
2002:377).
The brand personality trait scale developed by Aaker (1997) suggests that the dimensions
used in the brand personality scale operate in different ways or influence consumer
preference for different reasons (Aaker, 1997:353). For example, ‘sincerity’, ‘excitement’
and ‘competence’, tap an innate part of human personality, while ‘sophistication’ and
‘ruggedness’ tap a dimension that individuals desire but do not necessarily have. Aaker
(1997:354) suggests that ‘other practical applications of the research also exist’ other
than the theoretical. A Brand personality perception study on motor vehicles was
conducted by Ranjbar (2010:2) in Iran. However, brand personality research or related
research in South Africa is limited. As such, the research undertaken in this study will
significantly contribute to understanding the consumer behaviour of the Generation Y
cohort, particularly that relating to the luxury motor vehicle industry of South Africa. This
research study sought to measure the perceptions of Generation Y individuals on a brand
personality scale of the luxury sedan motor vehicle market in South Africa.
1.3 OBJECTIVES OF THE STUDY
The study addresses the following objectives:
1.3.1 Primary objective
The primary objective of this study was to determine the brand personality perceptions of
luxury sedan motor vehicles amongst the South African Generation Y cohort.
1.3.2 Theoretical objectives
In order to achieve the primary objectives, the following theoretical objectives are
formulated for this study:
• Define branding.
• Define brand personality.
• Describe Aaker’s (1997) brand personality trait scale.
• Identify the role of brand personality within the marketing strategy.
Chapter 1: Introduction 3

• Determine the influence of brand personality on consumer behaviour and purchasing
intensions.
• Define luxury sedan motor vehicles and outline this sector’s current state within the
South African market.
1.3.3 Empirical objectives
• Identify Generation Y students’ top-of-the-mind awareness concerning luxury sedan
motor vehicle brands.
• Establish a factor structure for Aaker’s (1997) 42 brand personality traits applicable
for luxury sedan brands.
• Investigate the brand personality perceptions of luxury sedan motor vehicles amongst
Generation Y students by means of Aaker’s (1997) brand personality trait scale.
• Determine whether gender differences exist regarding Generation Y students’ brand
personality perceptions of luxury sedan motor vehicles.
• Investigate Generation Y students’ purchasing intentions of luxury sedan motor
vehicles by making use of an adapted a scale by Zeithaml et al. (1996).
• Determine whether gender differences exist regarding Generation Y students’
purchasing intentions of luxury sedan motor vehicles.
1.4 HYPOTHESES TESTING
A hypothesis is a statement about the relationship between variables (Hair et al.,
2008:56). Hypotheses testing involves making assumptions about a phenomenon of
interest and then testing that assumption (Berndt & Petzer, 2011:253). The significance
level for testing the hypotheses formulated in this study was set at α=0.05 (Smith, 2004:
3). The decision rule for the hypotheses was applied as follows:
• If P-value is ≥ α, conclude H0
• If P-value is < α, conclude Ha
A null hypothesis (H0) indicates no difference or association between the variables,
whereas an alternate hypothesis (Ha) states that there is a difference or association
between the variables. The following hypotheses will be tested and reported on in Chapter
4.
Chapter 1: Introduction 4

• H01: Brand personality perceptions of luxury sedans do not differ between males
and females
• Ha1: Brand personality perceptions of luxury sedans differ between males and
females
• H02: Purchasing intentions of luxury sedans do not differ between males and
females
• Ha2: Purchasing intentions of luxury sedans differ between males and females
The next section discusses the research design and methodology used in the study.
1.5 RESEARCH DESIGN METHODOLOGY
The study comprises a literature review and empirical study. The empirical study was
conducted by means of quantitative research, using the survey method.
1.5.1 Literature review
In order to underpin the empirical study, a review of South African and international
literature was conducted using secondary data sources that included the Internet,
textbooks, business journals, academic journals, and online academic databases.
1.5.2 Empirical study
The empirical portion of this study comprised of target population, sampling frame,
sampling method, sample size, measuring instrument and data collection method, and
statistical analysis, discussed as follows:
1.5.2.1 Target population
The target population intended for this study was registered students in the higher
education institutions (HEIs) of South Africa. This target population was defined as
follows:
• Element: Students registered at the HEIs of South Africa
• Sampling units: South African public registered HEIs
• Extent: South Africa
• Time: 2014
Chapter 1: Introduction 5

1.5.2.2 Sampling frame
This study focused on the students registered at two South African HEIs located in the
Gauteng province.
1.5.2.3 Sampling method
In this study, a non-probability, convenience sample was taken from the sample frame.
The study included respondents in such a manner that the sample was representative of
the population of South Africa by means of gender and race.
1.5.2.4 Sample size
In Step 1 of the study, a sample of 65 participants was selected in order to determine
Generation Y students’ top-of-the-mind awareness concerning luxury sedan motor
vehicle brands in South Africa. Following this, the historical approach was used to
determine the sample size of 500 respondents for Step 2 of the study. This is in line with
similar studies regarding the measurement of brand personality (Bouhlel et al., 2011;
Ranjbar, 2010; Long-Yi, 2010 & Matzler et al., 2006).
1.5.2.5 Measuring instrument and data collection method
In Step 1 of the study, a sample of 65 participants were requested to complete a
questionnaire indicating which luxury sedan motor vehicles first came to their mind; that
is, applying the top-of-the-mind-awareness method. The top three brands (BMW, Audi
Mercedes-Benz), identified from this step were then included in the questionnaire used
for Step 2 of the study. In Step 2, a sample of 500 participants was requested to indicate
their brand personality perceptions of luxury sedans on a self-administered questionnaire.
Section A of the questionnaire requested data related to the demographics of the
participants. Section B used the brand-personality-trait scale developed by Aaker (1997).
This scale measured the participants' perception of brand personality of the top three
brands of luxury sedans using a five-point Likert scale (1 = strongly disagree and 5 =
strongly agree). Section C measured the purchasing intentions of the participants using
an adapted version of Zeithaml et al. (1996) scale on purchasing intensions. Again, a five-
point Likert scale was used to record responses.
Chapter 1: Introduction 6

The questionnaire used in Step 2 of the study was pre-tested and pilot tested on a sample
of participants that did not form part of the sampling frame. In addition, the 65 participants
used in Step 1 of the study were excluded from the sample used for Step 2 of the study.
1.5.2.6 Statistical analysis
The captured data was analysed using the Statistical Package for the Social Sciences
(SPSS), Version 22.0 for Windows. The following statistical methods were used on the
empirical data sets:
• Reliability and validity analysis
• Descriptive analysis
• Significance tests
• Factor analysis
1.6 CHAPTER CLASSIFICATION
Against the background information provided in this chapter, the remainder of this
dissertation comprises the following chapters:
Chapter 2: Branding and brand personality
In this chapter, the literature concerning brand personality is reviewed. This is followed
by a discussion of the role of brand personality in the marketing strategy. This chapter
also considers the role that brand personality plays in consumer behaviour, affective
loyalty and purchasing intentions. The current state of luxury sedan motor vehicles within
the South African market is discussed. Thereafter, a review of the literature concerning
current perceptions of brand personality of luxury sedan motor vehicles is discussed.
Chapter 3: Research design and methodology
The population, sampling frame, sampling method and data collection method are
discussed in this chapter. In addition, the statistical techniques used to analyse the
captured data are outlined.
Chapter 4: Data analysis and interpretation
Within this chapter, the research findings are analysed, interpreted and evaluated.
Chapter 1: Introduction 7

Chapter 5: Conclusions and recommendations
This chapter comprises a review of the entire study and provides the conclusions drawn
from the study. The limitations of the study are outlined and recommendations emanating
from the study are made for further research.
1.7 ETHICS STATEMENT
This research project adheres to the principles of academic research by protecting the
identities and interests of respondents, while conforming to the ethical writing standards
of academic research. All information provided by the participants is treated confidentially
and the responses provided are reported in aggregate. The participation in this study was
voluntary.
1.8 CONCLUSION
This chapter focused on the relevant aspects of the overall study. Brand personality is a
significant concept to consider in the preparation of a marketing strategy. Personality
traits are intangible features of a brand that play a major role in developing a relationship
between the brand and the consumer. People tend to match themselves with specific
brands that match their personality type. Marketers need to understand these personality
types and tailor their marketing activities according to these differences.
Generation Y is the future target market. They represent the majority of the new age
generation of robust personalities and impulsive buying decisions. Much of their
purchasing decisions are influenced by peers, social media and the web. Understanding
their perceptions about brands is vital. This is why this study takes a look at these specific
brand personality perceptions of the cohort.
The chapter speculated on the overall framework of the study. Theoretical and empirical
objectives are outlined. The classification of the chapters was also discussed with
reference on how each section dealt with different aspects of literature. The following
chapter, Chapter 2, provides a detailed discussion on the underlying literature of the topic
under review.
Chapter 1: Introduction 8

CHAPTER 2: DEFINING THE BRANDING CONCEPT
2
2.1 INTRODUCTION
As stated in the previous chapter, the primary objective of this study is to determine the
brand personality perception of luxury sedan motor vehicles amongst the South African
Generation Y cohort. The main aim of this chapter is to provide the overall theoretical
framework of the study by giving insight into brand personality as a concept. Furthermore,
it aims to provide context while illustrating the importance and relevance of investigating
the brand personality of luxury sedans.
The different sections of this chapter contribute to the overall overview of the study.
Section 2.2 provides a detailed definition of the term branding and brand personality
(Section 2.2.9). The focus of Section 2.3 is on Aaker’s brand personality trait scale, while
Section 2.4 investigates the role of brand personality in the marketing strategy. Section
2.5 elaborates on the influence of brand personality on consumer behaviour and
purchasing intentions. Section 2.6, provides a definition of a luxury sedan while Section
2.7 discuss the current state of the luxury sedan motor vehicle market in South Africa.
Section 2.8 outlines some of the factors influencing the purchase decisions of luxury
sedans. The final section of this chapter, describe some aspects of the Generation Y
cohort, which is the target population used in this study.
2.2 DEFINING BRANDING
The term branding originates from an Old Norse term 'brandr' that means to burn
(Blackett, 2004:1). Farmers would burn their livestock to create a distinguishable mark
that trade buyers would be able to distinguish between the owners. A distinguishable
mark also allows manufacturers to brand their products to differentiate their uniqueness
(Adjei, Mensah, and Adu-boahen, 2014:156). The manufacturer can establish a
proprietary name for a product through the creation of a distinguishable mark (Kotler and
Keller, 2006:304). Branding is, however, more than merely creating a mark or establishing
a name, and is regarded as a complex phenomenon (Maurya & Mishra, 2012:122). There
are several definitions of the term brand but for the purpose of this study, the definition
offered by the American Marketing Association (AMA, 2007:404) is used:
Chapter 2: Defining the branding concept 9

‘A Brand is a name, term, sign, symbol, or perhaps a design that defines the
marketer or seller of a product or service.’
A brand is a convenient distinguishable mark that allows for the classification of products
and segmentation of markets (Kotler & Armstrong, 2010:242). A brand helps the
customers to recall different brands and identify the preferred manufacturer. Maurya and
Mishra (2012:122) argue that brands are ever-present and influence people’s social,
economic, cultural, and religious lives directly. Branding affects the way that consumers
perceive and express themselves in society.
Branding is part of people’s everyday lives (Bernstein, 2003:1134). The idea of branding
has become so popular that there are few products that go unbranded. According to Kotler
and Armstrong (2010:242), branding allows businesses to sell their products distinctively
among competitors. Branding also provides the business with distinctive legal protection,
such as patents or trademarks. Therefore, businesses need to conceptualise their brand
meaning for consumers to form a relationship with the overall brand.
According to Adjei et al. (2014:156), there are several aspects of branding that should be
considered in order to understand the theory behind the concept. These aspects include
brand name, brand mark, brand image, brand awareness, brand loyalty and brand equity.
2.2.1 Brand name
A brand name is an element of a brand that is constructed using a combination of letters
and/or numbers that make up a word (Kotler, 2006:450). An example of a manufacturer
brand name is BMW, which in English stands for Bavarian Motor Works (BMW, 2013).
Consumers can generally differentiate between manufacturers using the brand name.
According to Belén del Río et al. (2001:452), a product’s value, trade and the business
itself are enhanced when a product is identified over time by a brand name. Kotler and
Armstrong (2010:242) add that the concept of a brand name helps the consumer to
identify a product that can satisfy his or her needs. Consumers have a wide choice of
products when making a purchase and it is therefore crucial for marketers to create an
easily recognisable brand name. The brand name can also be supported by a brand mark
to assist in making the brand recognisable.
Chapter 2: Defining the branding concept 10

2.2.2 Brand mark/logo
In contrast to a brand name, a brand mark cannot be expressed verbally. Maurya and
Mishra (2012:123) define a logo as a symbolic sign, mark or icon of the actual brand. It is
unique from that of the competitors (Adjei et al., 2014:156). The brand mark serves as a
distinguishable mark for consumers to identify a particular brand. It can therefore also be
considered as a brand because it incorporates some of the aspects of the definition of a
brand by the American Marketing Association (AMA, 2007:404). Consumers use this sign,
symbol or brand mark to identify the uniqueness of the brand. Klink (2003:154) propose
that a brand name and brand mark can assist in the communication of the brand’s image.
2.2.3 Brand image
Brand image may be defined as the concept the consumers have in their minds regarding
a particular brand (Aaker, 1996:69). Bian and Moutinho (2011:194) point out that the
brand image is the ‘set of brand associations in consumer memory’. These associations
are a result of the interactions the consumer had with the brand. Bian and Moutinho
(2011:193) assert that one crucial aspect of marketing activity is to communicate the
brand image to selected target markets.
Globalisation has provided consumers with a vast amount of brand choices leading to
their perception of the various brands and guiding their purchase decisions. Pappu,
Quester and Cooksey (2006:697) emphasise the importance of a brand image for brands
that compete in international context. International brands have the challenge of
maintaining the core essence of the brand globally. Brand image can be the influencing
factor in the overall brand impression. The impression that a brand creates influences the
familiarity of a brand among consumers.
2.2.4 Brand awareness
Aaker (1997:5) defines brand awareness as consumers’ ability to recall and recognise
brands in different settings. McDonald and Sharp (2000:5) state that brand awareness is
a set of brands that consumers give a considerable amount of attention when making a
serious purchase decision. O’Guinn et al. (2009:33) indicate that brand awareness is a
significant factor indicating consumers’ knowledge about the brand. Indeed, brand
awareness entices consumers, leaving them more knowledgeable about the brand.
Chapter 2: Defining the branding concept 11

When engaging in a purchasing situation regarding a motor vehicle, consumers would
seek information about the brands’ features. It is therefore vital for marketers to
understand the cue that consumers grasp about the brand.
Berger et al. (2007:461) clarify that in most cases, brands offer different levels of product
variety that consumers can easily identify. This variety can act as a cue that can directly
affect consumers’ inference about the brand and the type of brand the consumer chooses.
2.2.5 Brand loyalty
Loyalty can be defined as the customer’s willingness to buy repeatedly from the seller
over the long-term (Boshoff & Du Plessis, 2009:319). The overall impressions formed by
the consumer can result in a long-term relationship with the brand (Lombard 2007:25).
Furthermore, the relationship can be formed through a series of interactions. Consumers
who are loyal to specific brands dominate the luxury sedan market (Strach & Everett,
2006:107-110). The more loyal consumers become to a brand, the higher the value of
that brand. Brand loyalty is therefore closely related to brand equity (Adjei et al.,
2014:157).
Keller (1993:17) support this statement by arguing that one aspect of brands is that when
there is strong brand equity there will be stronger brand loyalty. It is therefore crucial for
marketers to understand this relationship and the role that sales can play in enhancing
brand loyalty and brand equity.
2.2.6 Brand equity
Aaker (1991:15) defines brand equity as a combination of assets interlinked with a brand’s
name and symbol, adding significant contribution to the value provided by the product to
a business or a business’s customers. Kotler and Armstrong, (2010:243) add that brand
equity is the unique effect that influences the customer’s behaviour when exposed to the
product and the marketing activities. Brand equity measures the brand’s strength in terms
of the consumer preference and loyalty. Elliott and Wattanasuwan (1998:131) articulate
that the meaning of a brand and a brand’s equity must cohere to the lived experience of
purchase and usage. The concept of brand equity helps marketers to define their
distinctiveness among competition (Sze & Hamid, 2012:102).
In addition, Wood (2000:662) highlights that brand equity can be the force that drives
competitive advantage. It is derived from knowledge experience of the consumer on the
Chapter 2: Defining the branding concept 12

product as the business is offering it. According to Sze and Hamid (2012:102), a business
needs to build solid brand equity for their products to prolong its competitiveness in the
market. Brand equity can be enhanced by means of a brand strategy that will
consequently improve brand loyalty as well.
2.2.7 Brand strategy
Brand strategy refers to the way businesses blend and match their brand’s name on the
product and the representation of the brand globally (Aaker, 2004:10; Lauforet & Sunders,
1999:52-53; Olins, 1990:3). The strategy is established in line with the broader portfolio
of the business that has ownership of the brand. According to Knox and Freeman
(2006:696), much attention has been directed to the acquisitioning and retaining of
customers as a strategy of brand development. Marketing managers need to formulate a
proper branding strategy in order to achieve marketing objectives.
Brand strategy is also a vital part of the overall marketing strategy. Holt and Cameron
(2010:12) indicate that brand strategies ensure that business goals are achieved and
brand culture is enhanced. Businesses, however, vary in context and there is therefore
no universal rule for the establishment of brand strategies. Shahri (2011:52) asserts that
a branding strategy aims to establish a unique identity and position of the brand in the
market.
2.2.8 Brand positioning
Brand positioning is referred to as an instilled conception about the brand in the
consumer’s mind (Ghodeswar, 2008:6). Venter and Van Rensburg (2009:218) define
positioning as the placement of the brand within the consumer’s mind relative to
competitors. Sujan and Bettman (1989:454-456) indicate that a significant concept to
consider in brand positioning is the similarity and the difference of the brand as perceived
by the consumer relative to other brands.
Positioning is a defining factor of the product’s position in the market. A marketer may
have several choices when positioning a new brand in the market. According to Fuchs
(2010:1766), businesses can position their brands with an infinite number of linkages and
associations. For example, a vehicle manufacturer may associate itself with quality, class,
style or speed.
Chapter 2: Defining the branding concept 13

A business tries to establish a sustainable competitive advantage through positioning in
terms of tangible features and intangible attributes in the consumers mind (Gwin & Gwin,
2003:30). Kotler and Keller (2006:310) opine that positioning results in a successful
creation of a customer value proposition that outlines the reasons why the customer
should buy the product. Therefore, a well-positioned brand tends to appeal to a certain
segment as a result of the differential advantage created through positioning. Ghodeswar
(2008:5) suggest positioning as an extension of brand personality that influences the
brand directly. A business can position their brand based on their brand personality to
successfully create a strong relationship with their customers (Keller & Richey, 2006:75).
2.2.9 Brand personality
Brands tend to possess certain attributes that relate to human characteristics (Aaker,
1997:347). These brand attributes can be defined as the brand’s personality. Consumers
can relate to these attributes of the brand and build a relationship with the brand (Freling
& Forbes, 2005:150). Kim et al. (2002:197) stress that the degree through which people
select particular brands to express themselves enhances their self-identity. Müller
(2014:532) indicates that the challenge businesses face is to create brands with specific
personalities to appeal to their target market. Marketing managers therefore need to make
their marketing activities much more compatible with their consumers.
The brand personality concept is the one that gradually reflects the facet of branding
dynamics based on usable brand attributes (Keller, 2003:596, Kapferer, 1998:44, Carr,
1996:4, Upshaw, 1995; Batra et al., 1993:84-85). Brand personality is an effective
marketing communication tool that a business can utilise to influence its consumers’
perceptions (Zalthman, 1997:425). In addition, brand personality can serve as a guide for
business marketing strategies. A brand personality trait scale can be utilised to measure
consumer’s perceptions of a brand’s personality. Aaker’s (1997) scale is the most widely
used and referenced brand personality trait scale in the literature.
2.3 AAKER’S BRAND PERSONALITY TRAIT SCALE
Aaker (1997:351) developed a framework consisting of 42 personality traits, divided into
the five dimensions of sincerity, excitement, competence, sophistication and ruggedness.
The scale items were selected from an initial list of 309 traits, which was first reduced to
114 traits, and later to 42 traits (Aaker, 1997:349). The initial list of traits was obtained by
means of qualitative research as well as established personality scales from marketing
Chapter 2: Defining the branding concept 14

and psychology (Aaker, 1997:349). Aaker’s scale dimensions therefore have definite
similarities to the renowned ‘Big Five’ personality dimensions from psychology.
Seemingly, the psychological research had converge to a more robust and reliable
factorial composition of human traits. Table 2.1 below indicates the facet dimension of
the ‘Big Five’ personality dimensions.
Table 2.1: The ‘Big Five’ model of personality traits
Trait Description
Openness Curious, original, intellectual, creative and open to new ideas.
Conscientiousness Organised, systematic, punctual, achievement oriented and
dependable.
Extraversion Outgoing, sociable, talkative and enjoy being in social situations.
Agreeableness Affable, tolerant, sensitive, trusting, kind and warm.
Neuroticism Anxious, irritable, temperamental and moody.
Source: Goldberg (1990:1216)
Figure 2.1 indicates the ‘Big Five’ personality dimensions from the psychological
perspective. Every person has each of these personality traits embedded in them. How
people rate themselves on some traits, whether high or low, constitutes the uniqueness
that can be referred to as personality. Aaker’s personality trait scale is similar to the three
dimensions of the ‘Big Five’ model. Sincerity can be associated with the agreeableness
dimension, excitement can be related to extraversion and competence can be associated
with conscientiousness.
In order to develop a concrete understanding of the concept of a brand personality scale,
the term personality needs to be defined. Almund (2012:12) posits that personality reflects
patterns of behaviour that people take in response to their thoughts and feelings. These
patterns may include physical aspects of behaviour such as feelings like being calm rather
than cognitive. Auzolay (2003:147) asserts that personality is clearly defined by traits and
Chapter 2: Defining the branding concept 15

is distinct from the cognitive aspects of a person. Personality can indeed be identified by
certain behaviour, the exact same way that consumers can attribute personality to a brand
according to its perceived behaviour (Reed et al., 2012:311-313).
Figure 2.1, sheds light on the Aaker’s personality scale formed using some inputs from
the ‘Big Five’ personality model.
Figure 2.1: Aaker’s Brand personality Framework
Source: Aaker (1997: 354)
This model of brand personality is relevant for the study based on the idea that it will allow
businesses to find a unique position in the market. Businesses can use measurement
models like a brand personality trait scale to determine their current position within the
market in terms of brand image. Rajagopal (2006:55-57) emphasises that these traits
should be unique and distinguishable from the brands in the same product category. The
following table highlights the five brand personality dimensions according to Aaker (1997)
with the related 42 traits.
Brand personality
Sincerity
*Down-to-earth *Honest
*Wholesome *Cheerful
Excitement
*Daring *Spirited
*Imaginative *Up-to-date
Competence
*Reliable *Intelligent *Successful
Sophistication
*Upper class *Charming
Ruggedness
*Outdoorsy *Tough
Chapter 2: Defining the branding concept 16

Table 2.2: Aaker’s brand personality dimensions with related items
Factor name Traits Factor name Traits
Sincerity 1. Down-to-earth
2. Family-oriented
3. Small-town
4. Honest
5. Sincere
6. Real
7. Wholesome
8. Cheerful
9. Sentimental
10. Friendly
11. Original
Competence 12. Reliable
13. Hard-working
14. Secure
15. Intelligent
16. Technical
17. Corporate
18. Successful
19. Leader
20. Confident
Excitement 21. Daring
22. Trendy
23. Exciting
24. Spirited
25. Cool
26. Young
27. Imaginative
28. Unique
29. Up-to-date
30. Independent
31. Contemporary
Sophistication 32. Upper class
33. Glamorous
34. Good-looking
35. Charming
36. Feminine
37. Smooth
Ruggedness 38. Outdoorsy
39. Masculine
40. Western
41. Tough
42. Rugged
Source: Aaker 1997
Chapter 2: Defining the branding concept 17
A good understanding of these traits is important for future studies on brand personality
and the further implications that brand personality have on consumer behaviour. The
conclusion can be drawn from the theory above that marketing managers need to have a
solid understanding of consumer behaviour to be able to develop marketing strategies
that incorporate brand personality and human personality traits. Aaker’s scale measures
current brand personality so that the business can determine how to adapt their marketing
strategy to change the brand personality.
2.4 MARKETING STRATEGY ELEMENTS INFLUENCED BY BRAND PERSONALITY
Aaker (2009:12) defines marketing strategy as a tool that allows businesses to
concentrate their resources on opportunities that will increase competitive advantage.
Venter and Van Rensburg (2009:7) concur and suggest that a marketing strategy
identifies the most effective use of resources to achieve marketing objectives. The
significance of a strategy is to anticipate competitor’s strategic moves, such as a simple
move like increasing prices or more complex moves, such as new product innovations
(Hoppner, 2010:1). A marketing strategy is about creating a unique and valuable position
in the market (Juin, 2000:25). Walker (2011:65) suggests that such valuable position can
be achieved through a competitive advantage by incorporating a well-integrated
programme of marketing mix elements. McCarthy (1964:5) outlines the 4p’s as crucial
elements in marketing, which are; product, place, price and promotion. The following
section defines these elements and explores how they are influenced by brand
personality.
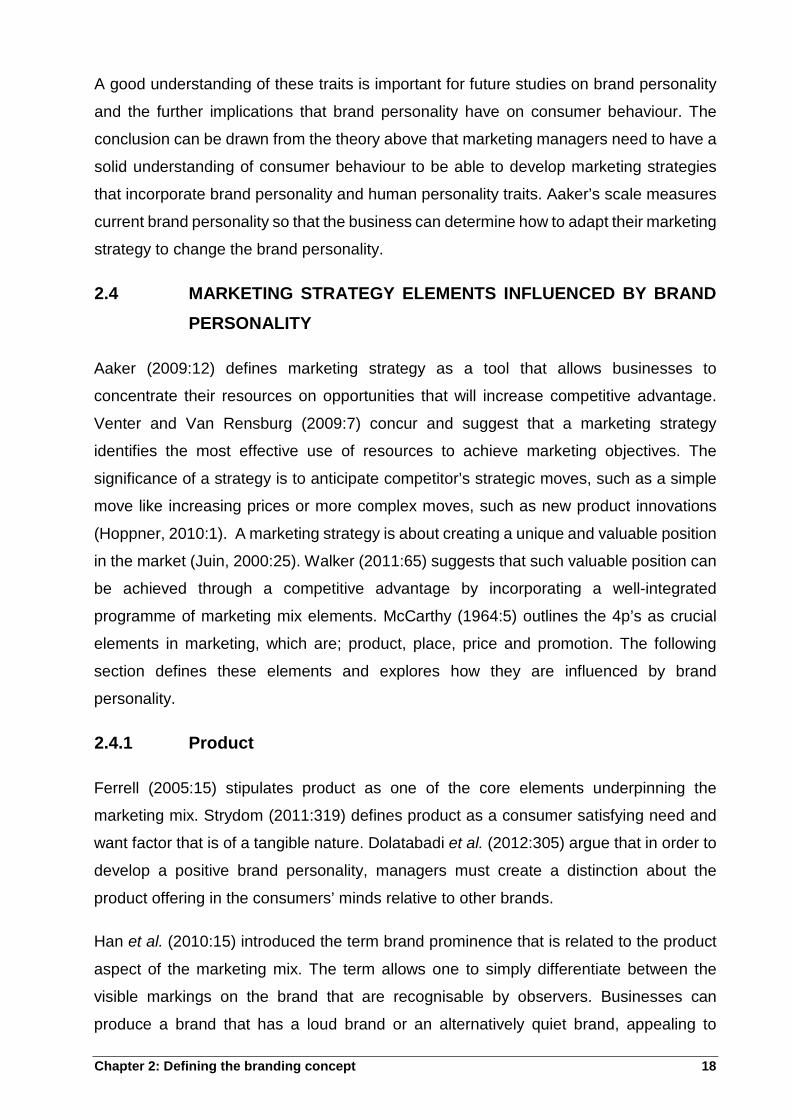
2.4.1 Product
Ferrell (2005:15) stipulates product as one of the core elements underpinning the
marketing mix. Strydom (2011:319) defines product as a consumer satisfying need and
want factor that is of a tangible nature. Dolatabadi et al. (2012:305) argue that in order to
develop a positive brand personality, managers must create a distinction about the
product offering in the consumers’ minds relative to other brands.
Han et al. (2010:15) introduced the term brand prominence that is related to the product
aspect of the marketing mix. The term allows one to simply differentiate between the
visible markings on the brand that are recognisable by observers. Businesses can
produce a brand that has a loud brand or an alternatively quiet brand, appealing to
Chapter 2: Defining the branding concept 18
different types of consumers. Veller (2008:17) provides an example of brand prominence
using the Volvo XC60 crossover. The vehicle was designed with a larger insignia so that
it could be visible from a distance. The visible aspect of the product is crucial because
consumers can easily identify the difference that exists between brands. Visual aspects
of the product would therefore result in a long lasting impression in the consumer’s mind
that enhances the overall perception that consumers have about the brand.
Automobile manufacturers can offer symbolic attributes to differentiate their products.
These symbolic attributes include, but are not limited to, the brand name, quality, and
complexity (Owomoyela, 2013:487). Brand personality perceptions also differentiate by
product type (Ang & Ching Lim, 2006:42). The types of product can be divided into two
groups: symbolic and utilitarian. Furthermore brand personality indicates that symbolic
products are self-expressive in nature and effective and are perceived as more
sophisticated. In contrast, utilitarian products possess a rational appeal, providing
cognitively oriented benefits (Ang & Ching Lim, 2006:42).
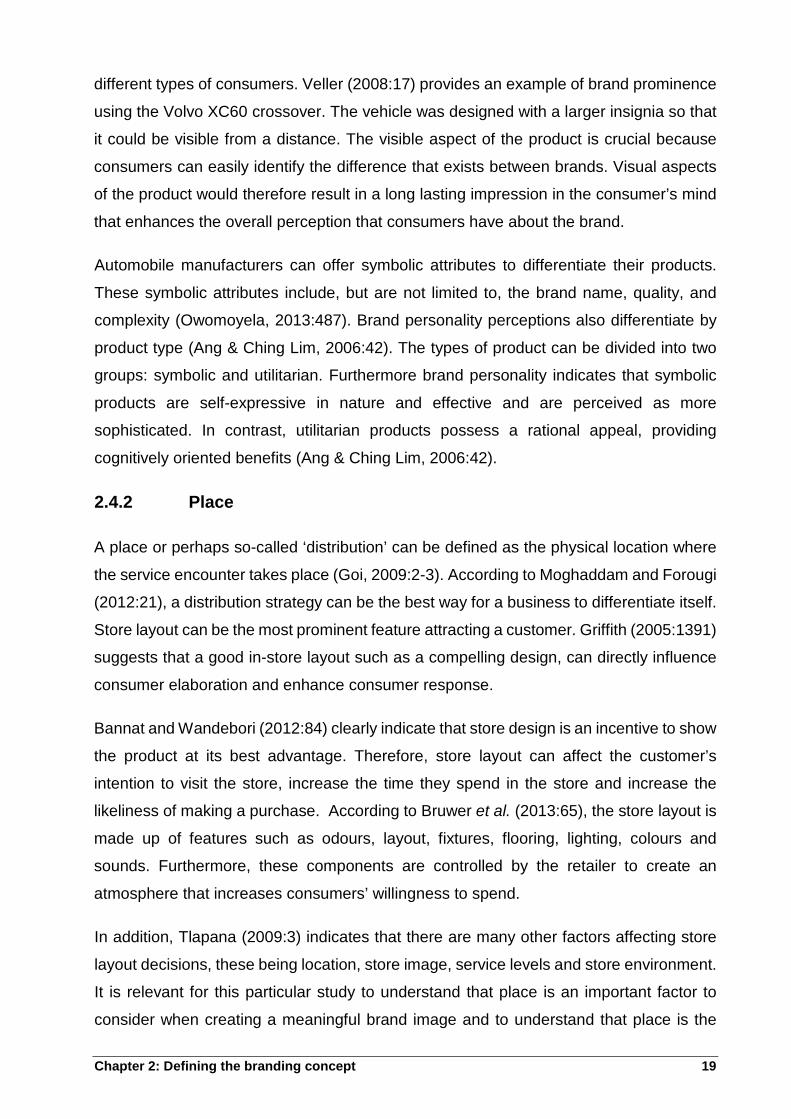
2.4.2 Place
A place or perhaps so-called ‘distribution’ can be defined as the physical location where
the service encounter takes place (Goi, 2009:2-3). According to Moghaddam and Forougi
(2012:21), a distribution strategy can be the best way for a business to differentiate itself.
Store layout can be the most prominent feature attracting a customer. Griffith (2005:1391)
suggests that a good in-store layout such as a compelling design, can directly influence
consumer elaboration and enhance consumer response.
Bannat and Wandebori (2012:84) clearly indicate that store design is an incentive to show
the product at its best advantage. Therefore, store layout can affect the customer’s
intention to visit the store, increase the time they spend in the store and increase the
likeliness of making a purchase. According to Bruwer et al. (2013:65), the store layout is
made up of features such as odours, layout, fixtures, flooring, lighting, colours and
sounds. Furthermore, these components are controlled by the retailer to create an
atmosphere that increases consumers’ willingness to spend.
In addition, Tlapana (2009:3) indicates that there are many other factors affecting store
layout decisions, these being location, store image, service levels and store environment.
It is relevant for this particular study to understand that place is an important factor to
consider when creating a meaningful brand image and to understand that place is the
Chapter 2: Defining the branding concept 19

actual place where consumers make their purchase decisions. The distribution point can
be used to alter consumers’ perception of a brand.
2.4.3 Price
Price is an important factor in the overall performance of the brand globally as well as in
the domestic market. According to Strydom (2011:333-334), price is referred to as a
payment made in exchange for something valuable or beneficial to the consumer.
Marketers need to understand the aspects of pricing as well as setting the perfect price
of a product. Moghaddam and Foroughi (2012:21) posit that pricing strategies have a
direct impact on promotional strategies. Premium prices can therefore be associated with
high quality but subsequently the advertising media should endorse high brand image,
because inappropriate media will result in a lower brand image of the product. In an
economic sense, consumers with higher income tend to consume high quality products
and low income consumers consume low quality products (Damoense & Jordaan,
2007:137).
Jansen and Roy (2009:192) agree that when consumers are not fully informed about the
product quality before making a purchase, the quality is judged based on the price.
Furthermore, a higher price is associated with higher quality. Consumers perceive
products of high quality as being prestigious. Therefore, businesses often charge higher
prices to signal quality and more prestigious products.
2.4.4 Promotion
Kotler and Keller (2006:310) state that promotion is a vital component in the marketing
campaign, consisting of multiple tools designed to support the selling of products or
services to consumers. Tjiptono (2002:219) indicates that promotion can be identified as
any form of marketing communication. For instance, promotion of ideas can be regarded
as advertising (Kotler & Armstrong, 2011:436-440). These ideas are sold to consumers,
whom in reflection of their self-concept make decisions to accept these advertising
appeals or not. Kotler (2006:311) indicates that sales promotion provides an additional
incentive to convince the target market to purchase more products of the brand.
Pierre et al. (2011:24-25) suggest that consumer promotions have a direct impact on
brand equity, mainly because promotions create awareness for the brand category. Pierre
et al. (2011:24-25) stipulate that there is a correlation between brand personality and
Chapter 2: Defining the branding concept 20

sales promotion and the adverse effect both of these have on brand equity. Joshy and
Siyakumaran (2009:263-264) emphasise that consumer promotion has a positive effect
on brand equity in segments where consumers are loyal to the brand. It is evident that
promotions have a direct impact on brand equity by successive reinforcement of changing
behaviour. Clow and Baack (2013:61) conclude that advertising and promotions can
change or enhance a business’s image in the consumer’s mind.
The marketing mix elements are crucial in the positioning of a brand. Consumers’
perceptions are subject to change based on their interactions with a brand through the
marketing mix. The characteristics of the product, the price it is being sold at, the place
of business and all the promotional activities may influence the consumer’s perception of
the brand. These marketing mix elements allow the marketers to be able to target specific
consumers and position their products accordingly.
2.5 BRAND PERSONALITY’S INFLUENCE ON CONSUMER BEHAVIOUR
Consumers are the most important part of a business (Ferrell, 2004:126). One of the
major challenges that marketers deal with is trying to understand why consumers behave
in a certain way. Sarker et al. (2013:44) highlight that information about consumers’
behaviour is crucial for marketers to guide future marketing strategies.
Consumers purchase products to reflect their own personality (Freling & Forbes,
2005:150). A paper by Govers and Mugge (2004) with the title: ‘I love my Jeep because
it is tough like me’, emphasises this argument. Consumers tend to seek out brands that
match their personality. Therefore, businesses need to create brands with specific
personalities to cater for these consumers (Müller, 2014:532). Personality is the result of
social and environmental influences on the consumer (Sarker et al., 2013:1).
Marketers need to develop advertising and products with the personality traits of their
target market in mind (Lombard, 2007:42). Nowadays, people are concerned about their
image and lifestyle within the society that is the direct outcome of their material prosperity.
People tend to project their status through various possessions such as clothes and
accessories.
Agrawal (2014:1062) emphasise that consumers do not only purchase products that
satisfy their needs such as social and safety needs, but self-esteem and self-actualization
Chapter 2: Defining the branding concept 21

also play a role in the overall satisfaction. Marketers need to focus on communicating the
brand personality traits when advertising their brands in order to reach consumers
effectively and influence their purchase decisions (Agrawal, 2014:1062). It is crucial to
understand how different luxury sedan brands play a role in enhancing consumers’ desire
to purchase. Majority of the consumers with a desire to purchase vehicles do not have
informed decisions, therefore their decisions can be enhanced by the brand image.
2.6 LUXURY SEDAN MOTOR VEHICLES IN THE SOUTH AFRICAN MARKET
A sedan is a vehicle that has four doors and is mainly for transporting four or more people
(Dictionary of Contemporary English, 2009:1574). The typical sedan motor vehicle is
mostly for personal use and has minimal features like basic driving controls, inexpensive
interior finishes and low capacity engines. However, the luxury sedan has extensive
features that enhance the brand perception (Raggio, 2009:84). Luxury sedans are
associated with prestige and class. Shenar (2014:47) states that the best luxury sedan
delivers a balance between comfort, sportiness, luxury and refinement. German vehicles
active in the premium segment are BMW, Mercedes-Benz and Audi. These brands
dominate this segment with a market share of about 80 per cent (Clark, 2013:23). Other
luxury sedan vehicles include Jaguar, Infiniti, Lexus, Porsche, Volvo and Land Rover
(Venter, 2013:3-5).
Various studies indicate that the local automotive sector has been a market leader in the
manufacturing sector of South Africa (Naude, 2013:407; Streicher, 2008:2 & Flatters,
2005). The South African automotive sector has a positive influence on the South African
economy (Naude, 2013:407-408). According to Trade and Investment South Africa
(TISA, 2003:3), the positive contribution of the automotive industry may be regarded as
a major role player in the success of the South African economy. The 2013 economic
review by the Industrial Development Corporation (IDC, 2013) indicates that the
automotive industry had a solid performance, as production expanded by 50 per cent
during the year 2013.
The top three luxury brands in South Africa, according to sales figures, are Audi, BMW
and Mercedes-Benz. BMW has been identified as the top luxury vehicle brand in South
Africa for 2013, with 27 671 units sold, followed by Mercedes-Benz’s 22 636 units and
Audi’s 19 335 units (I Africa, 2014; Mercedes-Benz SA, 2014). These figures indicate how
Chapter 2: Defining the branding concept 22

lucrative the South African luxury vehicle market is and, therefore, highlight the
importance of understanding the factors influencing these consumer purchase decisions.
2.7 FACTORS INFLUENCING THE PURCHASE DECISIONS OF LUXURY SEDANS
Shende (2014:2) highlights the factors that influence the purchase of a luxury sedan.
These factors include, but are not limited to, the reliability of the product, the price of the
product, trendy appeal, how much non-price promotion is offered, the trustworthiness and
the feeling that a customer has towards the brand.
Consumers appear to have a desire to purchase particular premium brands, even when
alternative brands offer similar benefits (Bronnenberg et al., 2012:2472). Consumers
engage online search and word of mouth before making a decision to purchase a specific
brand. Strong brands have long-term relationship with their customers, since consumers
tend to be brand loyal (Ghodeswar, 2008:4). Marketers need to understand the various
aspects that create these long-term relationships.
Choo and Mokhtarian (2004:202) reason that a proper understanding of the relationships
between personality and lifestyle factors as well as vehicle type choices have positive
implications on purchases. Therefore, marketers need to understand these factors to be
able to develop future marketing strategies and understand consumer decision-making.
For the purpose of this study, the primary focus is on brand personality and the factors
influencing vehicle choice models.
Kreindler (2014) asserts that the current automobile market is dominated by the
Generation Y cohort, who surpasses the previous Generation X domination. He
concludes that Generation Y purchases approximately 26 per cent of the cars, compared
to the estimated 25 per cent purchased by Generation X within the same period.
Therefore, it is crucial to understand the Generation Y cohort, their behaviour and their
purchase intentions.
In order to understand Generation Y and their purchasing intentions, the study made use
of an adapted purchasing intention scale by Zeithaml et al. (1996) scale. This allowed the
understanding of Generation Y’s purchasing intentions with relevance to the luxury
sedans.
Chapter 2: Defining the branding concept 23

2.8 PURCHASING INTENTIONS
Consumers have different preferences as well as decision making styles. Purchasing
intentions can be referred to as the future intent of buying behaviour as well as the
economic decision involved in the process (Doyle, 2011). The study made use of a
purchasing intention scale adapted from Zeithaml et al. (1996). Originally the scale had
consisted of several items which focused on obtaining information regarding the
behavioural intentions of consumers towards a business. The item wording as reflected
in Zeithaml et al. (1996) read as follows:
• Say positive things about XYZ to other people
• Recommend XYZ to someone who seeks advice
• Encourage friends and relatives to do business with XYZ
• Consider XYZ your first brand of choice
• Do more business with XYZ in the next few years
However the original item wording was significantly changed in order to achieve the sixth
empirical objective (See, Appendix A). The measurement of purchasing intention will
emphasise the importance of Generation Y consumers with regard to luxury sedan motor
vehicles.
2.9 GENERATION Y
Members of the Generation Y cohort are perceptive to the marketing hype created by
advertisements (Williams & Page, 2011:44-45). Furthermore, Spero and Stone
(2004:153-154) indicate that the web space is where this cohort congregates, interacts
with friends and family, work and shop. In addition, the web is the place where Generation
Y individuals turn to for information (Nicholas et al., 2011:28). Therefore, the internet plays
a significant role in Generation Y members’ social lives.
They like to stay informed about what is currently trending and popular. Williams and
Page (2011:44) speculate that the Generation Y cohort is an enigma to marketers and is
likely to have more disposable income than preceding generations.
Deloitte (2014) identified specific factors that would influence the Generation Y individual
in making a significant purchase decision. Deloitte’s (2014) study indicates the most
Chapter 2: Defining the branding concept 24

prominent factors that influence Generation Y consumers to purchase a luxury sedan.
Brand image was among the prompting factors in the decision to purchase a vehicle. The
survey also indicates the reasons why they would not make a purchase. Affordability,
operational costs and lifestyle needs were some of the reasons concluded in the survey.
It is imperative to acknowledge the Generation Y cohort’s addiction to virtual social media.
Marketers need to understand that this generation of brand conscious consumers are
susceptible to social media. Williams and Page (2011:36) conclude that marketing on a
web-based platform would be beneficial for marketers targeting the Generation Y cohort.
This would allow marketers to engage with their target market, since it is their playground
and where they live.
2.10 CONCLUSION
The chapter outlined the various aspects of the literature of the topic under review. The
focus of the chapter was directed towards understanding the influence that brand
personality has on the purchasing intentions of the consumers. It was therefore clear that
research will largely contribute towards future research on the similar topics on brand
personality. The following chapter addresses the research methodology and statistical
methods used in the empirical portion of the study. The methodology discussed outlined
how the data were prepared and the tools that were used to analyse the data.
Chapter 2: Defining the branding concept 25

CHAPTER 3: RESEARCH METHODOLOGY
3
3.1 INTRODUCTION
Research solves a problem in a systematic way. Rajasekar et al. (2006:5) assert that
research methodology defines the study methods through which one can gain knowledge.
In essence, research methodology entails the overall work plan of the research. Proctor
and Jamieson (2012:4) state that marketing research forms a link between the researcher
and the consumer through information gathered. The concept of marketing research is
about the collection, analysis and interpretation of information (Smith, 2012:5). Such
information is relevant and useful in making effective marketing decisions.
Scientific methods are applied when conducting marketing research to uncover the truth
about the marketing phenomena (Zikmund & Babin, 2012:6). Marketing research allows
the marketer to understand the consumer in depth. The study aimed to examine the brand
personality trait perceptions and the purchasing intentions of the Generation Y cohort with
regard to luxury sedan motor vehicles.
This chapter elucidates on the different types of methods that were used in this study.
Much of this chapter discusses the sampling plan and data collection methods. The
chapter outlines the design of the questionnaire and its administration and how data are
prepared. The next section discusses the research design.
3.2 RESEARCH DESIGN
Malhotra (2010:102) defines the research design as an essential foundation, framework
and significant blueprint for conducting a research project. A good research design will
result in an effective research project. Kumar (2005:94) defines research design as
planned, structured and strategic in nature, conceived as to obtain research answers. In
addition, a well thought out research design answers research questions in a valid,
objective and economical way.
Kadzin (2003:3) highlights that when a researcher is planning to undertake a study, it is
important to select the appropriate research design before involving participants of the
study. The appropriate research design used will determine how the participants are
included in the study. Parasuraman, Grewal and Krishnan (2006:56) differentiate
between two types of research, namely exploratory and conclusive research:
Chapter 3: Research Methodology 26

• Exploratory research gathers information to shed light on a particular situation,
providing an ultimatum for further research.
• Conclusive research confirms that the insights are true, allowing the researcher to
make a decision about the course of action.
This study made use of a conclusive research approach. Malhotra and Briks (2000:76)
subdivide conclusive research into descriptive research (describing some functions or
characteristics) and casual research (researching cause and effect relationships). Boieje
(2009:25) asserts that the descriptive nature of research deals with the ‘what’ of the social
phenomena. The main aim of the study was to collect data regarding the brand personality
perceptions of luxury sedan motor vehicles amongst a certain cohort. Therefore, a
descriptive research design was utilised.
The following section discusses the approach to the research of the topic under review in
detail.
3.3 RESEARCH APPROACH
Creswell (2007:3) differentiates between three approaches to research that are
qualitative, quantitative and mixed methods. This section briefly discusses the two most
common methods, qualitative and quantitative, as outlined by Brendt and Petzer
(2011:31).
Williams (2011:65) stresses that a researcher selects the quantitative approach in
response to a study requiring numerical information. In contrast, the qualitative approach
being for research including, observations, textual or visual analysis, and interviews (Gill
et al. 2008:291). Creswell (2007:3-5) indicates that there is more quantitative research
than qualitative research.
This study followed a descriptive research design and, as such, the quantitative approach
to data collection was followed, whereby a survey questionnaire was used to gather the
required data. In order to select the sample, a strategy should be formulated to outline
specific objectives that the sample should address (Boieje, 2009:20-21).
A sampling strategy is discussed in the next section to show how the sample was
selected.
Chapter 3: Research Methodology 27

3.4 SAMPLING STRATEGY
The sampling strategy is the plan that the researcher outlines to be confident that the
sample used in the research study will represent the population from which the sample
was drawn (Landreneau & Creek, 2008:2). The sampling strategy of the study addressed
target population, sampling frame, method of sampling and sample size as discussed
below:
3.4.1 Target Population
Population is the total number of people in a specific geographical area of the study
(Barnejee, 2010:62). Malhotra (2010:372) defines a target population as the total number
of elements from which data may be collected. An incorrectly defined target population
may result in an ineffective research study or misleading findings. A target population is
defined in terms of the elements, sampling units, extent and term.
The target population for this study was defined as students registered at South Africa’s
public HEIs in 2014.
3.4.2 Sampling frame
Turner (2003:3) defines a sampling frame as the source from which a sample may be
drawn. The sampling frame for this study consisted of the 25 HEIs registered in South
Africa (DHET, 2014). The sampling frame also represents the elements of a target
population (Malhotra, 2010:373).
This study made use of a non-probability sample to select one traditional university
campus and one university of technology campus located in the Gauteng province of
South Africa.
3.4.3 Method of sampling
Nel et al. (1998:97) highlight that there are two broad methods of sampling, namely
probability and non-probability sampling. Samkange (2009:35) defines probability
sampling as the randomised selection of participants that ensures that each element has
an equal probability of being chosen for inclusion in the sample. Polit and Hungler
(1995:279) indicate that in contrast, a non-probability relies on the personal judgement of
the researcher, rather than on random selection.
Chapter 3: Research Methodology 28

Malhotra (2010:376) mentions four different types of non-probability sampling techniques,
namely convenience, judgement, quota and snowball sampling. Latham (2007:8)
stipulates that a convenience sample includes individuals who are ready and available.
Cant (2011:78) suggests that convenience sampling is a non-probability method that is
unrestricted and very cheap to conduct. A non-probability method allows the researcher
to get a large number of respondents in a short space of time and minimal cost. Therefore
study made use of a non-probability convenience sampling method to select the sample
participants.
3.4.4 Sample size
The sample size refers to the number of elements that a study considers (Henry,
2013:117). Lenth (2001:187) emphasise that the sample size decision is important
because if the sample size is too small, it will not produce useful results and if it is too big,
collecting data will be excessively.
The study was divided into two steps. Step 1 identified the top three luxury sedan brands,
as identified by 65 selected participants, while Step 2 involved collecting data regarding
the brand personality perceptions and purchasing intentions of luxury sedan motor
vehicles from the selected sample of 500 participants.
The study encompassed a predetermined number of participants that formed part of the
main study (Step 2). This study utilised the historic approach to determine the sample
size. Ranjbar (2010:34) conducted a similar study that measured brand personality of a
Khodro car manufacturer in Iran, with a sample size of 500 participants. Therefore, this
study also had a sample size of 500 participants from the two HEI’s with about 250
questionnaires from each institution.
3.5 DATA COLLECTION METHOD
The following section discusses the aspects relating to the data collection methods.
3.5.1 Measuring instrument and data Collection
Hox and Boenjie (2005:593-594) distinguish between the two methods of data collection
which are primary data and secondary data collection. Discroll (2011:154) refers to
primary data as data collected primarily as first-hand, without the use of secondary
Chapter 3: Research Methodology 29

sources. Oschman (2004:308) defines secondary data as already collected data that has
undergone statistical procedures. The study focused on primary data.
Hair et al. (2008:105) highlight the quantitative research method that makes use of a
survey research method, consisting of a casual and a descriptive research design. The
study made use of a survey research method, utilising a self-administered questionnaire.
The self-administered questionnaire is designed to be completed solely without the
interventions of researchers gathering the data (Wolf, 2008:805). The next section
discusses the design of the self-administered questionnaire.
3.5.2 Questionnaire design
Malhotra (2010:334) states that a questionnaire can be an instrument that is used to
gather information, using a set of questions. The information in the questionnaire will
translate to questions that participants will and are able to answer. Collecting data from a
larger sample by means of a questionnaire is convenient when a time period is specified
(Jenn, 2006:32). Rattray and Jones (2007:235) conclude that questionnaires are mainly
used to ease the collection of information in an orderly manner with a defined sample.
The first chapter clearly indicated the empirical objectives that served as a guide in
designing the questionnaires (See, 1.5.2.4). Each questionnaire was accompanied by a
cover letter (See, Appendix A), specifically addressing the details of the research and the
outcomes thereof as a means to ensure professionalism. Plain language was also used
for the ease of understanding the questions.
3.5.3 Questioning format
Malhotra (2010:335) defines a questionnaire as a series of questions designed to probe
information from participants. Designing a questionnaire is not a science but an art
(Luccobuchi & Churchill, 2010:201). The researcher needs to identify a particular scale
to be used for the questionnaire to ensure that all the empirical objectives are met.
3.5.3.1 Step 1: Brand identification
The first step of the study identified the luxury sedan brands to be used in the main study.
The participants were asked to record the first brand that comes to mind when they think
of a luxury sedan. This technique determines the top-of-the-mind-awareness concerning
luxury sedan motor vehicle brands.
Chapter 3: Research Methodology 30

Netemeyer et al. (2004:210) explain top-of-the-mind-awareness as the degree to which
participants spontaneously think of a brand when a product category is mentioned.
3.5.3.2 Step 2: Brand personality perceptions
The second step of the study gathered data regarding Generation Y students brand
personality perceptions and purchasing intentions of luxury sedan motor vehicles by
means of a Likert scale. Brendt and Petzer (2011:189) identify a Likert scale as a scale
consisting of verbal descriptors that can range from a 3-point to 7-point Likert scale.
The scale is indicative of varying degrees of agreeing or perhaps the extent of
disagreement with a particular statement (DeVellis, 2003:78).
The study made use of a five-point Likert scale through which participants indicated their
level of descriptiveness of the provided 42 personality traits as identified by Aaker (1997)
to measure brand personality perceptions of respondents. The study also measured
respondent’s purchasing intentions on a five-point Likert scale adapted from Zeithaml et
al. (1996).
3.5.4 Questionnaire layout
Step 1 of the study collected information regarding brand identification. Section A of the
questionnaire probed participants to identify the first brand that comes to their minds when
thinking of luxury sedans. Section B of the questionnaire collected information regarding
the demographics of the participants.
The second questionnaire, Step 2, consisted of three sections. The first section of the
questionnaire, Section A, collected information regarding the respondent’s
demographical information. Successively, Section B of the questionnaire, consisted of a
5-point Likert scale, aimed at determining brand personality perceptions of participants
on three luxury sedan brands, as identified in Step 1. The section was aimed at gathering
information regarding the descriptiveness of Aaker’s (1997) brand personality trait scale
as per the selected luxury sedan brands. The last section of the questionnaire, Section
C, was aimed at gathering information regarding respondent’s purchasing intentions of
luxury sedan motor vehicles, utilising an adapted version of a scale by Zeithaml et al.
(1996).
Chapter 3: Research Methodology 31

The sections in the questionnaire addressed different research objectives. Table 3.1
indicated which sections of the questionnaires were used to address each of the empirical
objectives as outlined in Section 1.3.3
Table 3.1: Empirical objectives and the items contained in the questionnaire and study
Empirical research objectives Section
Identify Generation Y students’ top-of-the-mind awareness
concerning luxury sedan motor vehicle brands
Questionnaire 1 Section 4.7
Establish a factor structure for Aaker’s (1997) 42 brand
personality traits applicable for luxury sedan brands. Figure 4.9
Investigate the brand personality perception of luxury sedan
motor vehicles among Generation Y by means of Aaker’s
(1997) brand personality trait scale.
Questionnaire 2 Section B
Determine whether gender differences exist regarding
Generation Y students’ brand personality perceptions of
luxury sedan motor vehicles.
Section 4.8.4
Investigate Generation Y students’ purchasing intentions of
luxury sedan motor vehicles by making use of an adapted
scale by Zeithaml et al. (1996).
Questionnaire 2 Section C
Determine whether gender differences exist regarding
Generation Y students’ purchasing intentions of luxury sedan
motor vehicles
Section 4.9.4
3.6 ADMINISTRATION OF THE QUESTIONNAIRES
The questionnaire was distributed in August 2014. Step 1 of the study distributed the first
questionnaire to 65 participants who did not form part of the main study. Step 2 of the
study distributed 500 questionnaires of which only 420 questionnaires were usable for the
study. Some of the questionnaires were completed by international students and those
questionnaires were discarded as the study focussed on South Africans.
Chapter 3: Research Methodology 32

The questionnaires were distributed at two public HEIs as it will be significant to reach the
target population. The study only focused on registered undergraduate students to form
part of the study. Students who were targeted and formed the Generation Y cohort were
given a self-administered questionnaire. The questionnaires were completed during
specific class times and were collected once a student was finished. The questionnaire
was handed to participants after a lecture. This ensured that there was sufficient time for
the questionnaire to be completed by participants at their own convenience.
3.7 PILOT TESTING OF THE QUESTIONNAIRES
Polit et al. (2001:467) refer to a pilot study as the small scale study that represents the
feasibility of the major study. Van Teijlingen and Hundley (2002:33) suggest that by using
a pilot test, the researcher can reduce the possibility of failure.
The first questionnaire (Step 1) was distributed to five participants while the second
questionnaire (Step 2) was distributed to 60 participants to test the readability of the
questions and the ease of understanding. None of these participants were included in the
main study (Steps 1 and 2).
The Cronbach’s alpha for the pilot study of the second questionnaire was computed to
determine internal reliability. The results were acceptable; the Cronbach’s alpha value of
Section B of the pilot study was 0.915, while Section C had a Cronbach’s alpha value of
0.937. According to Malhotra (2010:319), values between 0 and 1 indicated a good
internal reliability, however those values below a 0, 6 mark would entail a lack of internal
reliability. The resulting values for this study indicated good internal reliability and
therefore the main study was then proceeded.
3.8 DATA PREPARATION
Praya (1999:89) argues that data are not just a simple process and cannot be executed
roughly without proper administration. In essence, the argument is based on the fact that
if the data contains errors, and omissions, these need to be corrected. Malhotra
(2010:452-455) emphasises that the data needs to be cleaned as soon as the first pile of
questionnaires arrive, even though fieldwork is still in progress.
During the data preparation process, the questionnaires were inspected for errors. A
skilled statistician fixed the errors by replacing the missing data with the mean of the
overall data. The study encountered 5 per cent or more missing responses that were
Chapter 3: Research Methodology 33

discarded. Those with less than 5 per cent were completed by a trained statistician by
means of entering a mean value of the respective questions.
McDaniel and Gates (2010:486) refer to coding as assigning different codes to questions
and responses. Proper coding enlightens the data capturing process.
The questionnaire was post-coded by a highly regarded statistician and with the
supervision of the supervisor.
Table 3.2: The coding information used for Step 2
TYPE OF DATA VARIABLE QUESTION NUMBER
Demographic data A1 to H2 Section A
Mercedes-Benz B1_1 to B1_42 Section B
BMW B2_1 to B2_42 Section B
Audi B3_1 to B3_42 Section B
Purchasing intentions Mercedes-Benz MB_1 to MB7 Section C
Purchasing intentions BMW BMW_1 to BMW7 Section C
Purchasing intentions Audi Audi_1 to Audi_7 Section C
3.9 STATISTICAL ANALYSIS
The study made use of the Statistical Package for Social Sciences (SPSS) version 22.0,
a package for Windows, to capture and analyse the data. The statistical methods that
were applied on the empirical data sets are described in the next section.
3.9.1 Descriptive statistics
Lombard et al. (2011:3) define descriptive statistics as a summary of the data obtained
from the participants presented in a structured and easy understandable manner.
Swanepoel et al. (2010:54) outline the following types of descriptive statistics, namely the
Chapter 3: Research Methodology 34

frequency distribution, mean, median, mode, range, variance, standard deviation and
Kaiser-Meyer-Olkin (KMO).
3.9.1.1 Frequency distribution
Malhotra (2011:484) describes a frequency distribution as the calculated distribution of
responses in relation to the variables and express these in percentages. In essence, one
variable is single counted at a time. Malhotra (2011:484) adds that it is the first step when
analysing the frequency distributions of the data. The study made use of statistical pie
charts and tables to report the frequency distributions of the data.
3.9.1.2 Mean
The mean is a basic concept of statistics (Waiter et al., 2011:3). It is one of the well-known
statistics used practically. The mean is used to measure central tendency (Swanepoel et
al., 2010:55). A mean is the summation of all the elements in the data set of variables
and divided by the total number of elements.
3.9.1.3 Median
Hair et al. (2008:154) defines the median as a method that ranks values from high to low,
and when the data is combined and divided by two, the result is the median.
3.9.1.4 Mode
The mode appears most frequently in a data set. It measures the central tendency. In
addition, it is also the value where elements are heavily concentrated (Weiers, 2010:63).
3.9.1.5 Range
The difference between the largest and the smallest observation is regarded as a range
(Swanepoel, et al., 2010:78). It is a simple statistical concept that is easy to measure.
3.9.1.6 Variance
The variance measures how far apart the observations are from their mean (Lombard, et
al., 2011:71). Wichern and Johnson (2007:123) noted that the sample variance is used
as a description of the variation amounts in the measurement of a particular sample. The
Chapter 3: Research Methodology 35

concept is commonly referred to as sample variance that is the mean of squared
differences.
3.9.1.7 Standard deviation
The term standard deviation is a measure of spread used to portray the distance of the
observations from the mean of these observations (Swanepoel, et al., 2010:82).
Standard deviation is calculated using the square root of variance.
3.10 EXPLORATORY FACTOR ANALYSIS
Data need to be reduced into meaningful and manageable bits. Exploratory factor
analysis is highly regarded as a statistical tool that can be utilised to reduce data for
confirmatory or exploratory purpose (Pallant, 2010:181). Malhotra (2010:739) states that
exploratory factor analysis (EFA) is a method of categorising the fundamental factors or
dimensions that describes the correlations between variables.
Comrey and Lee (2013:35) agree that the correlation matrix is the starting point of the
factor analysis in which the inter-correlations are presented. Field (2000:424) indicates
that these matrixes can be reduced through ‘identifying variables that would correlate
highly with other variables, but correlate badly with variables not within the group’. The
Kaiser-Meyer-Olkin (KMO) can be used to measure the appropriateness of the factor
analysis (Malhotra, 2010:638). Furthermore, Pallant (2010:183) indicates that when the
KMO produces a value greater than 0.6, the sample can be regarded as significant. In
factor analysis, there are two basic approaches, namely common factor analysis and
principle component analysis (Malhotra, 2010:643). This study used principle component
factor analysis.
3.10.1 Principle component analysis
Principle component analysis provides insights regarding several dependent variables
which are inter-correlated (Abdi and Williams, 2010:433). The concept extracts
information from table data and represents the information in the form of principal
components. Malhotra (2010:643) outlines several methods to determine the ideal factor
solution. These include only retaining those factors with eigenvalues greater than 1.0,
using the scree plot to determine the number of factors to extract or specifying number of
factors in accordance with prior knowledge from the literature. This study will extract 5
Chapter 3: Research Methodology 36

factors based on Aaker’s (1997) brand personality framework and check if all of these
factors have an eigenvalue greater than 1.0.
Interpreting the factors based on their factor loadings may be a difficult exercise. A factor
rotation may solve this problem. The two categories of factor rotation are orthogonal and
oblique rotation (Brown, 2009:21). Orthogonal rotation includes Varimax, Quartimax and
Equamax rotation techniques. Malhotra (2010:645) indicates that the most useful
technique is the Varimax rotation. This study therefore made use of a Varimax rotation to
extract the factors.
3.10.2 Kaiser-Meyer-Olkin (KMO)
Malhotra (2010:638) defines Kaiser-Meyer-Olkin (KMO) as the test which measures the
adequacy of samples. KMO is used as an index to determine the correctness of a factor
analysis. A KMO value between 0.5 and 1.0 signal a useful factor analysis while a value
below 0.5 indicates an inappropriate factor analysis.
3.11 RELIABILITY
Joppe (2000:1) explained reliability as the consistency of results over time, with an
absolute representation of the overall population. A research instrument can be
considered as reliable if the results can be reproduced over and over again. There are
several ways of calculating reliability of a research instrument. These are test-retest
reliability, alternative forms of reliability and internal consistency (Malhotra, 2011:318).
This study made use of a Cronbach’s alpha reliability test to determine if the internal
consistency of the scale was up to standard. The coefficient can range from 0 to 1 and
anything below the range such as 0.6 is regarded as unreliable due to a lack of internal
consistency (Malhotra, 2010:319).
3.12 VALIDITY
Golafshani (2003:599) defines validity as a determinant of research that shows the
accuracy of the results. An instrument used in a research study, should be accurate and
measure what it is supposed to measure. Wiid and Diggens (2013:221) indicate that
validity is important because it ensures that the data gathered are valid and accurate.
Kimberlin and Winterstein (2008:2279) point out that there are various types of validity,
including content validity, criterion validity and construct validity.
Chapter 3: Research Methodology 37

According to Malhotra (2010:320-321), content validity is subjective and systematic to
assess whether the scale items adequately cover the entire task being measured. It
ensures that the instrument that was used in the study has the desired results that can
be used for further studies. In general terms, content validity is referred to as the extent
to which an adequate defined construct of interest is represented by a sample of items
(Polit & Beck, 2006:489). The content validity of the study was assessed by the study’s
supervisor and co-supervisor to ensure that the content of the questionnaire was up to
standard.
Oluwatayo (2012: 394) addresses criterion validity as a comparison of criterion measures
with regards to correlations that are confirmed as valid. There is a high correlation
coefficient present in the scores reflected on the two or more measuring instruments when
compare together and accepted as valid (Kaplan & Saccuzzo, 2005: 132-135).
Assessing the construct validity involves convergent, discriminant and nomological
validity. Cook and Campbell (1979: 37-39) suggested that construct validity can be tested
in two validation processes, testing for convergence between two things of similar nature
and secondly testing for divergence between two things which are distinctive in nature.
Moreover, Spiliotopoulou (2009: 20) highlights that, when assessing the construct validity,
the values ranging from 0.15 to 0.50 indicate convergent and discriminant validity.
Salzberger (2013:2) asserted that nomological validity relates different measures whose
validity is in question.
3.13 TEST OF SIGNIFICANCE
Test of significance represents the likelihood that the random sample chosen will not form
part of the representative population (Walonick, 1996:13). The study reviewed the basics
of significance testing using the null hypothesis and p – values and conducted a t – test
in order to conclude the null hypothesis
Statistical significance can be determined using two broad techniques; the T-test and
ANOVA as discussed below.
3.13.1 T-test
The T-test can be used to determine whether there are any existing differences between
the samples. It is a measure of the difference between the means divided by the variability
of the means (Hair et al. 2013:288). This is calculated by adding the mean value to the
Chapter 3: Research Methodology 38

standard deviation. The result thereof is the t-value, which determines the probability of
the statistical significance. The T-test provides a mathematical measure to determine two
sample means that had occurred with a formula by chance.
3.13.2 ANOVA
William and Wagner (2010:95) refer to ANOVA (analysis of variance) as a statistical
technique that determines the difference between the mean of multiple variables. The
technique uses a categorical form of independent variables in correspondence with
ongoing dependent variables. Malhotra (2010:531) notes that in the null hypothesis (Ho)
all the means share the same value while the alternative hypothesis (Ha) suggests that
the means do not share the same value. If there do exist a difference between variables,
one must determine whether the difference has any practical significance.
3.13.3 Practical significance
Matheson (2008:1) defines practical significance as a tool that assesses the extent
through which the difference in the variable is large enough to be used practically.
According to Pallant (2007:207), the Cohen’s D-statistic is used to calculate the level of
practical significance. The following indicate how it is calculated:
• 0.20 ≤ D < 0.50: indicates a small practical significance
• 0.50 ≤ D < 0.80: indicates a medium practical significance
• 0.80 ≤ D: indicates a large practical significance
These values indicate the level of significance and the effect it has on the differences.
3.14 CONCLUSION
This chapter discussed the different types of methods that were used in this study. Much
of the chapter outlined the framework used in the sampling and data collection methods.
Furthermore, the chapter outlined the design of the questionnaire and its administration,
and how the data were prepared.
In the next chapter, the data collected during the study are analysed and interpreted. The
data form part of the researcher’s report on findings of useful data. The researcher was
Chapter 3: Research Methodology 39

able to interpret the findings with assistance of statistical software and meaningful
methods. Descriptive statistics allowed the data to be presented in meaningful bits and
reliability test results are presented. The chapter also present an EFA to refine the
research instrument. Hypotheses are also formulated and tested to determine whether
there are any significant differences between male and female participants.
Chapter 3: Research Methodology 40

CHAPTER 4: DATA ANALYSIS AND INTERPRETATION
4
4.1 INTRODUCTION
This chapter reports on the empirical findings of the study. The chapter provides a
discussion on the data gathering process (Section 4.2). Section 4.3 provides a framework
of the data analysis and the together with the coding (Section 4.3.1) and the tabulation
(Section 4.3.2). The chapter consists of several sections, providing the reader with the
detailed findings of the study. Section 4.4 analyses the demographics of the participants
while Section 4.5 reviews the exploratory factor analysis of the study. Section 4.6
discusses the reliability of the results. Section 4.7 provides the findings relating to the first
empirical objective, while Section 4.8 address the third and fourth empirical objective
while 4.8 address the fifth and sixth empirical objective. Section 4.9 offers a conclusion
to the discussion of the empirical findings.
4.2 DATA GATHERING PROCESS
The data gathering process was a crucial step in the overall study formation. In Step 1 of
the study, 65 questionnaires were distributed to a sample of participants who were
selected according to the definition of the target population. This Step 1 questionnaire
consisted of two sections. Section A made use of a free association task where the
respondents were asked to write down the first brand that comes to mind when they think
of a luxury sedan motor vehicle, while Section B gathered data regarding their
demographics. All of the 65 questionnaires were usable and included in the study.
In Step 2 of the study, 500 questionnaires were distributed at the two HEI campuses
selected for the study, in order to cover the target population as stipulated in Chapter 1.
The questionnaire consisted of 56 items divided into three sections. Section A consisted
of seven items designed to gather data regarding the demographics of the participants,
while Section B comprised Aaker’s (1997) 42 traits designed to measure the brand
personality perceptions of the participants. Section C consisted of seven items designed
to gather information on the purchasing intentions of the participants and made use of an
adapted scale developed and validated by Zeithaml et al. (1996). The purchasing
intentions scale indicated the relevance of purchasing intentions with relevance to the
different luxury sedan brand. The scale items probed respondent to rate the
Chapter 4: Data analysis and interpretation 41

descriptiveness of the items in relation to their purchasing intention (1 not at all descriptive
and 5 extremely descriptive). (See Also, Appendix)
Only 420 of the 500 questionnaires were useable. The other 80 questionnaires were
unusable, as 45 were international students. These were discarded because the extent
of the study was limited to the South African Generation Y cohort. The other 35 were not
fully completed and, therefore, were also discarded. Despite the 80 questionnaires
discarded, the remaining 420 questionnaires were deemed sufficient to conduct the factor
analysis.
4.3 PRELIMINARY DATA ANALYSIS
Analysing the data set requires one to make use of coding and tabulation. The following
sections discuss the tabulation and the coding of the data.
4.3.1 Coding
Malhotra (2010:454) defines coding as simply associating a code or usually a number to
a relative response or question. Coding allows the data to be easily captured. The data
set makes more sense when it has been coded with meaning attached to the data
(Welman et al., 2005:342). Step 1 of the study did not make use of coding since a topof-
the-mind-awareness task was utilised. Step 2 of the study consisted of three sections;
Section A, collecting data regarding participants’ demographics, Section B gather data
regarding brand personality perception of luxury sedan motor vehicles and Section C,
which gather data regarding participants purchasing intentions. Various codes were
assigned to different variables and participants. The coding of the questionnaire is
reflected in Table 4.1.
Chapter 4: Data analysis and interpretation 42

Table 4.1: Coding information (Step 2)
Section A: Demographical information
Question Code Construct measured Value assigned to response
Question 1 A1 Country of origin (1) South Africa, (2) Other
Question 2 A2 Province of origin (1) Eastern Cape, (2) Free State,
(3) KwaZulu-Natal, (4) Limpopo,
(5) Mpumalanga, (6) Northern
Cape, (7) North West, (8)
Western Cape
Question 3 A3 Current year of study (1) 1st year, (2) 2nd year, (3) 3rd
year, (4) 4th year, (5) postgrad
Question 4 A4 Gender (1) Male, (2) Female
Question 5 A5 Ethnic group (1) African/Black, (2)
Asian/Indian, (3) Coloured, (4)
White
Question 6 A6 Mother tongue (1) Afrikaans, (2) English, (3)
isiNdebele, (4) IsiXhosa, (5)
isiZulu, (6) Sesotho, (7) Sepedi,
(8) Setswana, (9) SiSwati, (10)
Tshivenda, (11) Xitsonga
Question 7 A7 Age (1)<18, (2) 18, (3) 19, (4) 20, (5)
21, (6) 22, (7) 23, (8) 24, (9) 25,
(10) 25>
Chapter 4: Data analysis and interpretation 43

Table 4.1: Coding information (continued…)
Section B: Brand personality trait rating
Mercedes-
Benz
B1_1 to
B1_42
Mercedes-Benz
Personality trait rating
(1) Not descriptive, (2) Slightly
descriptive, (3) Neutral, (4)
Descriptive, (5) Extremely
descriptive
BMW B2_1 to
B2_42
BMW personality trait
rating
(1) Not descriptive, (2) Slightly
descriptive, (3) Neutral, (4)
Descriptive, (5) Extremely
descriptive
Audi B3_1 to
B3_42
Audi personality trait
rating
(1) Not Descriptive, (2) Slightly
Descriptive, (3) Neutral, (4)
Descriptive, (5) Extremely
descriptive
Section C: Purchasing intentions
Question Code Construct measured Value assigned to response
Int1 MB_1,
BMW_1,
Audi_1
Purchasing intention (1) Not descriptive, (2) Slightly
descriptive, (3) Neutral, (4)
Descriptive, (5) Extremely
descriptive
Int2 MB_2,
BMW_2,
Audi_2
Purchasing intention (1) Not Descriptive, (2) Slightly
descriptive, (3) Neutral, (4)
Descriptive, (5) Extremely
descriptive
Int3 MB_3,
BMW_3,
Audi_3
Purchasing intention (1) Not Descriptive, (2) Slightly
descriptive, (3) Neutral, (4)
Descriptive, (5) Extremely
descriptive
Chapter 4: Data analysis and interpretation 44

Table 4.1: Coding information (continued…)
Question Code Construct measured Value assigned to response
Int4 MB_4,
BMW_4,
Audi_4
Purchasing intention (1) Not descriptive, (2) Slightly
descriptive, (3) Neutral, (4)
Descriptive, (5) Extremely
descriptive
Int5 MB_5,
BMW_5,
Audi_5
Purchasing intention (1) Not descriptive, (2) Slightly
descriptive, (3) Neutral, (4)
Descriptive, (5) Extremely
descriptive
Int6 MB_6,
BMW_6,
Audi_6
Purchasing intention (1) Not Descriptive, (2) Slightly
descriptive, (3) Neutral, (4)
Descriptive, (5) Extremely
descriptive
Int7 MB_7,
BMW_7,
Audi_7
Purchasing intention (1) Not Descriptive, (2) Slightly
descriptive, (3) Neutral, (4)
Descriptive, (5) Extremely
descriptive
4.3.2 Tabulation
The tabulation of the data allows it to be viewed according to different categories and data
sets. Varalakshmi et al. (2005:28) emphasise that the data collected are always initially
disorganised which means that it has to be organised to allow for statistical analysis.
Appendix B reflects the tabulation of the gathered data.
The following section describes the demographics of the participants.
4.4 DEMOGRAPHIC ANALYSIS
The following section provides a detailed description of the demographic profile of the
respondents of Step 1 and Step 2 of the study.
Chapter 4: Data analysis and interpretation 45

4.4.1 Step 1 – Brand identification
This step collected data from 65 respondents. This section outlines the statistical data
retrieved regarding the gender and race distribution of the respondents.
Figure 4.1: Gender distribution (Step 1)
As evident from figure 4.1, the sample group consisted of more females than males.
According to the data there were 29 males and 36 females.
Figure 4.2: Race distribution (Step 1)
Male45%
Female55%
Gender
African/Black81%
White17%Coloured
2%
Chapter 4: Data analysis and interpretation 46

Figure 4.2 indicates that 81 per cent of the participants indicated their ethnic group to be
African/Black, while 17 per cent of the participants were White and only 2 per cent were
Coloured. This distribution is representative of the South African population (StatsSA,
2011).
4.4.2 Step 1 – Brand personality perceptions
Step 2 of the study included a section consisting of seven questions regarding the
demographics of the participants. The focus of these questions was based on the
respondent’s country of origin, province, and year of study, gender, ethnic group, mother
tongue, and age. The section aimed to profile the group of participants.
The first question of the questionnaire was about the country of origin. The study was
only based on the South African population. However, participants from outside the
African borders administered some of the questionnaires. These questionnaires were
discarded and all 420 participants included indicated South Africa as their country of
origin. The second question probed participants about their province of origin.
Figure 4.3: Province of origin distribution (Step 2)
Evident from Figure 4.3 above, the sample group was dominated by the population from
Gauteng (56.9%). The reason for this may be because both of the HEIs accessed are
located in Gauteng. Gauteng was successively followed by the Free State with 15.6 per
Eastern Cape, 1.9
Free State, 15.5
Gauteng, 56.4
KwaZulu-Natal, 3.1
Limpopo, 12.1Mpumalanga, 4.8
Northern Cape, 0.2
North West, 0.8Western Cape, 0.2
Province
Chapter 4: Data analysis and interpretation 47

cent, Limpopo (12.2%), Mpumalanga (4.8%), North West (5%), KwaZulu-Natal (3.1%)
and Eastern Cape (1.9%). In addition, Western Cape as well as Northern Cape only had
one respondent each.
The third question of Section A, probed participants to indicate their year of study. This
was included to indicate that the research is representative of students of various year
levels. The next figure illustrates that the study is representative of undergraduate
students and not postgraduates.
Figure 4.4: Year of Study distribution (Step 2)
Figure 4.4 above reflects the total percentage of students according to different university
levels. Almost half of the sample (44%) was first year students registered at two HEIs
located in the Gauteng province of South Africa. Participants in their second year level of
study accounted for 25 per cent of the sample while the other 31 per cent of the sample
consisted out of students at their 3rd year level of study and upwards.
The next figure illustrates the gender distribution of participants.
1st Year44%
2nd Year26%
3rd Year27%
4th Year3%
Chapter 4: Data analysis and interpretation 48

Figure 4.5: Gender distribution (Step 2)
The female students accounted for more than half of the sample, 56 per cent. The male
counterpart accounted for 44 per cent of the sample participants. This gender distribution
is sufficiently representative to draw comparisons between male and female participants.
The ethnic group of the population is outlined in the next figure.
Figure 4.6: Ethnic group distribution (Step 2)
As evident from Figure 4.6, the African/Black ethnic group accounted for more than 70
per cent of the total target population. The following ethnic group was White participants
that accounted for 24 per cent. The other 3 per cent constituted of Coloured and
Asian/Indian participants. Figure 4.7 indicates the mother tongue of the participants.
Male44%
Female56%
African/Black73%
Asian/Indian1%
Coloured2%
White24%
Chapter 4: Data analysis and interpretation 49

Figure 4.7: Mother tongue
The mother tongue of the participants was also taken into account. The largest group of
the population sample was Sotho speaking (26%). Afrikaans was another popular
language among the participants and accounted for 24 per cent. IsiZulu also prevailed as
a one of the dominant languages among the participants, accounting for 10 per cent of
the population sample. The other 40 per cent was consisting of Sepedi, Setswana,
Tshivenda, IsiXhosa, English, isiNdebele, SiSwati and Xitsonga. This language
distribution reflects an input from all the 11 official languages of South Africa.
There were age gaps and differences between participants that are illustrated in Figure
4.8.
Afikaans24%
English5%
Isindebele1%
IsiXhosa6% Isizulu
10%Sesotho
26%
Sepedi8%
Setswana9%
Siswati2%Tshivenda
5%Xitsonga4%
Mother Tongue
Chapter 4: Data analysis and interpretation 50

Figure 4.8: Age population distribution (Step 2)
Age distribution of participants as depicted in Figure 4.8 reflects that 22 per cent of the
sample was students aged 18 years. Of the total sample, 22 per cent of the participants
were aged 19 years. Participants aged 20 years accounted for 20 per cent, while 14 per
cent were aged 21 years. The participants ranging between 22 and 25 years of age
accounted for 13 per cent of the sample. This distribution indicated a good representation
of the Generation Y cohort.
The next section discusses the exploratory factor analysis.
4.5 EXPLORATORY FACTOR ANALYSIS
The exploratory factor analysis was conducted using the 42 traits from Aaker (1997) to
establish a factor structure within the South African luxury sedan context.
The first step in the analysis was the Kaiser-Meyer-Olkin (KMO) measure of sampling
adequacy and the Bartlett’s Test of Sphericity to ensure the factorability of the data.
Values above 0.5 for the KMO test and a significant Bartlett’s Test of Sphericity value are
advised (Malhotra, 2010:641). The results of the tests were as follows:
• KMO=0.955
• Chi-square Bartlett’s Test=16465.194 (df=561) p=0.000<0.05
<183%
1822%
1922% 20
26%
2114%
22 - 2513%
Chapter 4: Data analysis and interpretation 51

These values were satisfactory. A principal component analysis using a varimax rotation
was performed on the 42 brand personality traits. Based on Aaker’s (1997) scale, 5
factors were extracted. All of the 5 factors had an eigenvalue above 1 and explained
51.51 per cent of the variance.
Some of the items were not construct-related and were therefore excluded from the factor
structure. Costello and Osborne (2005:4) suggest if an item has a communality of less
than 0.40 it may not relate to the other items and the researcher should consider excluding
it from the study. Therefore, the items with a communality below 0.4 (‘Smalltown’,
‘Sentimental’, ‘Contemporary’, ‘Feminine’ and ‘Western’) were excluded. Moreover, items
that cross-loaded on more than one factor were excluded from the study. These items
were: ‘Cheerful’, ‘Unique’ and ‘Independent’. Table 4.2 indicates the rotated factors.
Table 4.2: Rotated factors
Factor
1 2 3 4 5
Down-to-earth .587
Family-oriented .609
Honest .658
Sincere .632
Real .537
Wholesome .532
Friendly .536
Original .491
Reliable .512
Hard-working .571
Secure .549
Intelligent .532
Technical .650
Corporate .688
Chapter 4: Data analysis and interpretation 52

Successful .712
Leader .648
Confident .652
Daring .562
Trendy .564
Exciting .629
Spirited .547
Cool .571
Young .732
Imaginative .540
Up-to-date .475
Upper-class .668
Glamorous .656
Good-looking .728
Charming .652
Smooth .471
Outdoorsy .677
Masculine .570
Tough .682
Rugged .749
*Coefficients below 0.45 were supressed.
As evident from Table 4.2, the factors, as presented by Aaker (1997), were considered
relevant and analysed using the principal component analysis. The results indicate that
the items group into the various factors very similar compared to Aaker’s (1997) model.
The results were used to establish a factor structure for Aaker’s (1997) brand personality
scale applicable to luxury sedan motor vehicles.
Chapter 4: Data analysis and interpretation 53

The second empirical objective of the study was:
Establish a factor structure for Aaker’s (1997) 42 brand personality traits applicable
for luxury sedan brands.
Aaker’s (1997) brand personality trait scale was adapted using the results from the rotated
matrix. Figure 4.9 illustrates the brand personality trait factor structure applicable for
luxury sedans.
Figure 4.9: Luxury sedan brand personality trait dimensions (adapted from Aaker, 1997)
The luxury sedan brand personality trait dimensions (Figure 4.9) are very similar to
Aaker’s (1997) brand personality trait scale. Both have 5 dimensions namely: ‘Sincerity’,
‘Excitement’, ‘Competence’, ‘Sophistication’ and ‘Ruggedness’. Aaker’s dimensions
consist of 42 traits (See, Figure 2.2), from the factor analysis results, there were only 36
traits for the luxury sedan brand personality trait dimensions that were devised (See,
Table 4.2). All of the traits, except ‘Original’, were grouped in the same dimensions as
Aaker’s (1997) model. ‘Original’ had moved from the ‘Sincerity’ to the ‘Competence’
dimension in the luxury sedan brand personality trait dimensions as evident from figure
4.9.
Sincerity
Down-to-earthFamily-oriented
HonestSincere
RealWholesome
Friendly
Excitement
Daring TrendyExcitingSpirited
CoolYoung
Imaginative
Competence
OriginalReliable
Hard-workingSecure
IntelligentTechnicalCorporateSuccessful
LeaderConfident
Sophistication
Up-to-date Upper-classGlamorous
Good-lookingCharmingSmooth
Ruggedness
OutdoorsyMasculine
ToughRugged
Chapter 4: Data analysis and interpretation 54

The following section reports on the reliability of the results.
4.6 RELIABILITY AND VALIDITY
As stipulated in Chapter 3, the reliability was measured using the Cronbach’s alpha value.
Malhotra (2010:319) indicates that a Cronbach’s alpha value of above 0.6 indicates
sufficient internal consistency reliability.
The table below indicates Cronbach’s alpha values larger than 0.6 for each of the 5 brand
personality dimensions as well as the purchasing intension scale. This indicates a good
internal reliability.
The average inter-item correlations were calculated to measure the validity. Clark and
Watson (1995:16) recommend an inter-item correlation value between 0.15 and 0.50. All
the brand personality dimensions depict an inter-item correlation value below 0.50. Whilst
the purchasing intention scale’s value exceeds the 0.50 level. This simply indicates a
strong relationship between the items (Pallant, 2010:100).
Table 4.3: Reliability and average inter-item correlation values
Number of
items
Cronbach alpha
Average inter-item
correlation
Sincerity 7 .784 .342
Competence 9 .881 .427
Excitement 8 .831 .395
Sophistication 5 .813 .469
Ruggedness 4 .707 .375
Purchasing intentions 7 .907 .581
The results of the study are presented in the following sections according to the empirical
objectives stipulated in Chapter 1.
4.7 TOP-OF-THE-MIND AWARENESS CONCERNING LUXURY SEDAN MOTOR VEHICLE BRANDS
The first empirical objective of the study was:
Chapter 4: Data analysis and interpretation 55

Identify Generation Y students’ top-of-the-mind awareness concerning luxury sedan
motor vehicle brands.
The first questionnaire made use of a top-of-the-mind-awareness task to identify the top
luxury sedan brands. Respondents were asked to indicate the first brand that comes to
mind when thinking of a luxury sedan. The responses were then recorded and the results
are represented in Figure 4.10.
Figure 4.10: Graphical illustration of brands selected by respondents.
As evident from Figure 4.10, the top three luxury brands preferred by Generation Y were
BMW, Mercedes-Benz, and Audi. This result is in line with the luxury sedan motor vehicle
sales as presented in Section 2.7. Other brands also mentioned by participants include:
Volkswagen, Lexus, Volvo, Jaguar, Toyota, Maybach and Hyundai. This study, however,
only focused on the top 3 brands being BMW, Mercedes-Benz and Audi. These three
brands were used in the Step 2 of the study to determine the brand personality traits
associated with luxury sedans.
0 5 10 15 20 25
BMW
Mercedes-Benz
Audi
Volkswagen
Lexus
Volvo
Jaguar
Toyota
Maybach
Hyundai
Chapter 4: Data analysis and interpretation 56

4.8 ASSESSMENT OF BRAND PERSONALITY PERCEPTIONS OF LUXURY SEDAN MOTOR VEHICLES
The third empirical objective of the study was:
Investigate the brand personality perception of luxury sedan motor vehicles amongst
Generation Y by means of Aaker’s (1997) brand personality trait scale.
The second questionnaire (Section B) made use of the luxury sedan brand personality
trait dimensions adapted from Aaker (1997) to determine the brand personality
perceptions of the selected luxury sedan brands among the respondents.
4.8.1 Brand personality traits association with luxury sedans
The mean value for each of the traits was computed to determine the brand personality
traits most associated with all three of the brands. Table 4.4 list the top 10 brand
personality traits associated with luxury sedan brands.
Table 4.4: Top 10 Luxury sedan brand personality traits
Personality traits n 𝒙𝒙� Standard deviation
Successful 420 4.373 1.3491
Good-looking 420 4.343 1.3058
Confident 420 4.318 1.2824
Intelligent 420 4.304 1.2338
Up-to-date 420 4.299 1.2217
Original 420 4.27 1.1874
Upper-class 420 4.254 1.1768
Charming 420 4.232 1.1435
Reliable 420 4.228 1.0933
As evident from Table 4.6, Generation Y student participants of the study indicated the
brand personality traits that they associated most with the luxury sedan brands as:
‘Successful’, ‘Good-looking’ and ‘Confident’. Other popular traits include: ‘Intelligent’,
Chapter 4: Data analysis and interpretation 57

‘Up-to-date’, ‘Original’, ‘Upper-class’, ‘Charming’, ‘Independent’ and ‘Reliable. The
following section assessed how the personality trait rated for each of the luxury sedan
brands.
4.8.2 Brand personality traits association with each brand
The mean value for each of the traits was computed to determine the brand personality
traits most associated with each of the luxury sedan brands. Table 4.5 lists the top 10
brand personality traits associated with Mercedes-Benz, BMW and Audi.
Chapter 4: Data analysis and interpretation 58

Table 4.5: Top 10 brand personality traits association with Mercedes-Benz, BMW, and Audi
Mercedes-Benz BMW Audi
Personality trait 𝒙𝒙� S Personality trait 𝒙𝒙� s Personality trait 𝒙𝒙� S
Successful 4.564 0.7987 Exciting 4.376 0.9078 Good-looking 4.28 0.88
Upper-class 4.56 0.8138 Successful 4.362 0.8839 Successful 4.188 0.9492
Confident 4.51 0.8447 Good-looking 4.362 0.9321 Up-to-date 4.185 0.9433
Intelligent 4.445 0.8817 Confident 4.337 0.9515 Charming 4.178 0.979
Up-to-date 4.39 0.8461 Up-to-date 4.318 0.9167 Cool 4.173 1.038
Original 4.386 1.0006 Cool 4.299 1.0064 Intelligent 4.156 0.9434
Good-looking 4.386 0.8814 Charming 4.286 0.9818 Reliable 4.115 0.9506
Reliable 4.383 0.8865 Original 4.252 1.0106 Confident 4.102 1.013
Secure 4.383 0.8508 Trendy 4.243 0.9038 Exciting 4.102 0.9935
Successful 4.564 0.7987 Exciting 4.376 0.9078 Good-looking 4.28 0.88
Chapter 4: Data analysis and interpretation 59

Generation Y students perceive the Mercedes-Benz brand as ‘Successful’, ‘Upper-class’
and ‘Confident’ while BMW is regarded as: ‘Exciting’, ‘Successful’ and ‘Good-looking’.
Audi is also perceived as ‘Good-looking’ and ‘Successful’ as well as ‘Up-to-date’.
The mean value for each of the brand personality dimensions was also computed to
determine the perceptions of the respondents’ relating to the brand personality
dimensions for each of the luxury sedan brands. Table 4.6 below illustrates these results
while Figure 4.11 presents the results more visually.
Table 4.6: Brand personality dimensions according to different brands
Brands
Constructs Mercedes-Benz BMW Audi
𝒙𝒙� s 𝒙𝒙� s 𝒙𝒙� s
Sincerity 3.79091 .678475 3.73985 .663862 3.77339 .593881
Excitement 3.95584 .691273 4.12754 .664680 3.99712 .642802
Competence 4.38333 .620375 4.20901 .663124 4.03279 .655602
Sophistication 4.15159 .652726 4.09506 .707821 4.05163 .689979
Ruggedness 3.712 .8285 3.762 .7758 3.599 .7645
Chapter 4: Data analysis and interpretation 60

*.Please note the range of the graph mean value: 3.5 – 4.5
Figure 4.11: Brand personality dimension distribution of the luxury sedan brands
Figure 4.11 illustrates the mean differences between the three brands (BMW, Mercedes-
Benz and Audi) in relation to the five brand personality dimensions. All three brands
appear to be perceived more ‘Competent’, ‘Exciting’ and ‘Sophisticated’ compared to
‘Sincerity’ and ‘Ruggedness’. There seem to be differences between the brands in relation
with these dimensions. The next section investigates whether any significant differences
do exist among the three luxury sedan brands.
4.8.3 Significance testing: Brand personality dimensions
An ANOVA regarding the brand personality dimensions was undertaken. This was done
to assess the differences that existed between the brands in regard with the brand
personality trait dimensions and to determine if any of these differences were statistically
significant. Table 4.7 indicates the analysis of variance between the mean ratings of brand
personality trait dimensions.
Competence Excitement Sincerity Sophistication RuggednessMercedes 4.38 3.96 3.79 4.15 3.72BMW 4.21 4.13 3.74 4.1 3.76Audi 4.03 3.99 3.77 4.05 3.6
3.5
3.6
3.7
3.8
3.9
4
4.1
4.2
4.3
4.4
4.5
Mea
n Va
lue
Chapter 4: Data analysis and interpretation 61

Table 4.7: Analysis of variance (Brand personality dimensions)
Construct Sum of squares
df Mean
square F Sig
Sincerity Between groups
Within groups
Total
.559
518.263
518.822
2
1239
1241
.279
.418
.668 .513
Competence Between groups
Within groups
Total
25.494
517.783
543.277
2
1239
1241
12.747
.418
30.502 .000
Excitement Between groups
Within groups
Total
6.657
550.799
557.455
2
1239
1241
3.328
.445
7.487 .001
Sophistication Between groups
Within groups
Total
2.087
579.144
581.231
2
1239
1241
1.044
.467
2.233
.108
Ruggedness Between groups
Within groups
Total
5.717
773.969
779.686
2
1239
1241
2.858
.625
4.576 .010
As indicated in the table above there was no significant difference (p > 0.05) for the
‘Sincerity’ and ‘Sophistication’ dimensions of brand personality. This indicates that all
three brands were perceived very similar with regard to these two dimensions. However,
the dimensions: ‘Competence’ (F=30.502, p=0.000<0.05), ‘Excitement’ (F=7487,
p=0.001<0.05) and ‘Ruggedness’ (F=4.567, p=0.010<0.05) suggested statistical
significant differences (p<0.05).
A Tukey’s HSD (Honest Significant Difference) test was undertaken to determine where
the differences for these three dimensions were located between the brands. The
Cohen’s D coefficient was also computed to determine if these differences had any
practical significance. The table below illustrates the results of the post hoc Tukey’s HSD
test.
Chapter 4: Data analysis and interpretation 62
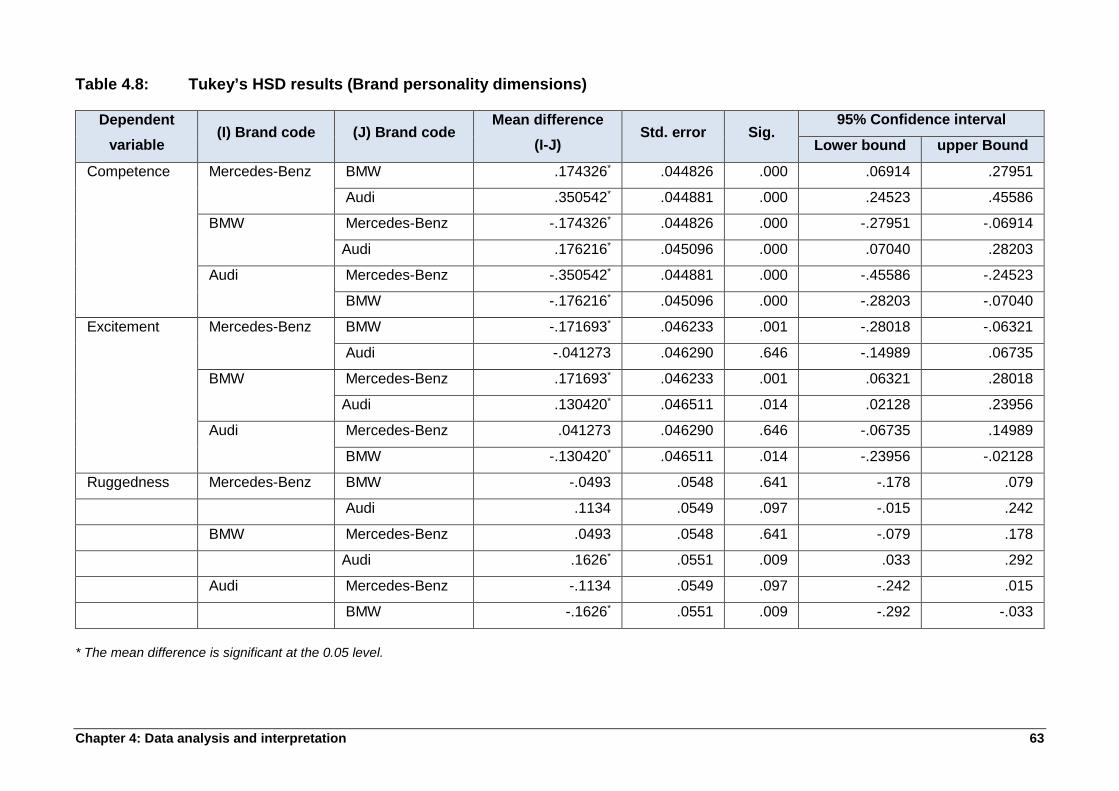
Table 4.8: Tukey’s HSD results (Brand personality dimensions)
Dependent variable
(I) Brand code (J) Brand code Mean difference
(I-J) Std. error Sig.
95% Confidence interval
Lower bound upper Bound
Competence Mercedes-Benz BMW .174326* .044826 .000 .06914 .27951
Audi .350542* .044881 .000 .24523 .45586
BMW Mercedes-Benz -.174326* .044826 .000 -.27951 -.06914
Audi .176216* .045096 .000 .07040 .28203
Audi Mercedes-Benz -.350542* .044881 .000 -.45586 -.24523
BMW -.176216* .045096 .000 -.28203 -.07040
Excitement Mercedes-Benz BMW -.171693* .046233 .001 -.28018 -.06321
Audi -.041273 .046290 .646 -.14989 .06735
BMW Mercedes-Benz .171693* .046233 .001 .06321 .28018
Audi .130420* .046511 .014 .02128 .23956
Audi Mercedes-Benz .041273 .046290 .646 -.06735 .14989
BMW -.130420* .046511 .014 -.23956 -.02128
Ruggedness Mercedes-Benz BMW -.0493 .0548 .641 -.178 .079
Audi .1134 .0549 .097 -.015 .242
BMW Mercedes-Benz .0493 .0548 .641 -.079 .178
Audi .1626* .0551 .009 .033 .292
Audi Mercedes-Benz -.1134 .0549 .097 -.242 .015
BMW -.1626* .0551 .009 -.292 -.033
* The mean difference is significant at the 0.05 level.
Chapter 4: Data analysis and interpretation 63
As evident from Table 4.10, Mercedes-Benz is perceived more ‘Competent’ than BMW.
This difference is a small practical significance (D=0.271). Mercedes-Benz was also
perceived to be more competent than Audi. This difference between Mercedes-Benz and
Audi is of medium effect moving towards practical significance (D=0.549). BMW is
considered more ‘Competent’ than Audi. This difference in relation to ‘Competence’ has
a small effect moving towards practical significance (D=0.267). This consequently
indicates that Audi is perceived less ‘Competent’ than Mercedes-Benz and BMW.
Participants deemed BMW more ‘Exciting’ than Mercedes-Benz with a small effect,
moving towards practically significant difference (D=0.253). BMW is also perceived more
‘Exciting’ than Audi but this difference is practically non-significant (D=0.199). BMW is
also regarded to be more ‘Rugged’ than Audi, indicated by a difference with small effect
moving towards practical significance (D=0.212).
The following section discusses the differences between male and female participants
with regard to the perceptions of the individual brand personality traits.
4.8.4 Hypothesis testing: Comparing the male and female respondents’ with regard to brand personality trait perceptions
The fourth empirical objective of the study was:
Determine whether gender differences exist regarding Generation Y students’ brand
personality perceptions of luxury sedan motor vehicles.
In order to determine the statistical differences between males and females in accordance
with brand personality traits, a T-test was undertaken. The Cohen’s D statistic was
computed for traits that suggested statistical significance (p < 0.05), to determine if the
difference was practically significant. The hypotheses are formulated as follows:
• H01 : Brand personality perceptions of luxury sedans do not differ between males and
females
• Ha1 : Brand personality perceptions of luxury sedans differ between males and
females
Six significant statistical differences were identified among the female and male
respondents concerning the brand personality traits perception. These differences were
statistically significant at p < 0.05 and they are presented in Table 4.9.
Chapter 4: Data analysis and interpretation 64

Table 4.9: Statistical and practically significant differences, comparing the male and female respondents’ concerning brand personality perceptions
Male Female
N �̅�𝑥 s n �̅�𝑥 s t p D
Personality traits
Honest 182 4.066 1.0700 234 3.846 .9815 2.178 0.030 0.214
Wholesome 182 3.923 1.0536 234 3.697 1.0180 2.217 0.027 0.218
Secure 182 4.489 0.9027 234 4.291 .8030 2.367 0.018 0.232
Intelligent 182 4.56 0.8171 234 4.359 .9215 2.323 0.021 0.231
Corporate 182 4.368 0.8288 234 4.171 .8621 2.354 0.019 0.233
Tough 182 4.033 1.2254 234 3.662 1.2157 3.074 0.002 0.304
As evident from the data above the null hypothesis, Ho1 can be rejected for: ‘Honest’,
’Wholesome’, ‘Secure’, ‘Intelligent’, ‘Corporate’ and ‘Tough’ and alternatively the Ha1 is
accepted. Personality perceptions of males and females do differ for these six traits. Male
participants do have different perceptions about the brand personalities compared to
females. It can be concluded from the mean values that males regard all of the above-
mentioned traits as more descriptive of luxury sedan brands than female participants. The
null hypothesis for all the other traits was accepted because the p-value was greater than
the standard value (p>0.05). With the exception to: ‘Honest’, ‘Wholesome’, ‘Secure’,
‘Intelligent’, ‘Corporate’ and ‘Tough’, there were no significant statistical differences
between the male and female participants. As such, the null hypothesis H01 cannot be
rejected for the remaining brand personality traits.
Cohen’s D statistic was computed to determine if the differences were practically
significant. There was a small effect, moving towards practical significance on the
differences of the brand personality traits: ‘Honesty’ (D=0.214), ‘Wholesome’ (D=0.218),
‘Secure’ (D=0.232), ‘Intelligent’ (D=0.231), ‘Corporate’ (D=0.233), and ‘Tough’ (D=0.304).
The following section presents the findings in relation to the luxury sedan brand
purchasing intentions of the participants.
Chapter 4: Data analysis and interpretation 65

4.9 ASSESSMENT OF PURCHASING INTENTIONS OF LUXURY SEDAN MOTOR VEHICLES
The fifth empirical objective of the study was:
Investigate Generation Y students’ purchasing intentions of luxury sedan motor
vehicles by making use of an adapted a scale by Zeithaml et al. (1996).
The second questionnaire (Section C) measured the purchasing intentions of participants
regarding luxury sedan brands. The data were collected using an adapted purchasing
intention scale by Zeithaml et al. (1996). (See, Section 2.8).
4.9.1 Purchasing intentions of luxury sedans
The mean value for each of the purchasing intention items was computed to determine
the participants’ purchasing intentions for all three of the luxury sedan brands. The table
below illustrates these results.
Table 4.10: Luxury sedan brand purchasing intentions
Purchasing intentions Mean Standard deviation
�̅�𝑥 s
Int1: ‘I would like to buy this brand of luxury sedan’ 3.807 1.2738
Int2: ‘I plan on buying this brand of luxury sedan in the next few years’
3.495 1.4547
Int3: ‘I consider this brand as my first choice of luxury sedan’
3.382 1.4644
Int4: ‘I say positive things about this brand of luxury sedan to other people’
3.779 1.2661
Int5: ‘I recommend this brand of luxury sedan to someone who seeks my advice’
3.732 1.2750
Int6: ‘I encourage friends and relatives to do business with this brand of luxury sedan’
3.714 1.2523
Int7: ‘I would not consider any other luxury sedan than this brand’
3.310 1.4747
As evident from Table 4.10, all of the purchasing intention items have a mean value above
3.3 (on a 5-point Likert scale), this indicates that purchasing intentions of luxury sedan
Chapter 4: Data analysis and interpretation 66

vehicles do exist among Generation Y students. Int1 showed the highest mean value
(3.807) of the items indicating that the participants would like to purchase a luxury sedan.
Other items with a high mean value includes: Int4 (3.779), Int5 (3.732) and Int6 (3.714)
which all relate to positive word-of-mouth. This indicates that the Generation Y cohort
tends to spread positive word-of-mouth communication regarding the luxury sedan
brands.
4.9.2 Purchasing intentions of each of the brands
The mean value for each of the purchasing intention items was computed to determine
the participants purchasing intentions for each of the brands. Table 4.11 illustrates these
results while Figure 4.12 presents the results more visually.
Chapter 4: Data analysis and interpretation 67
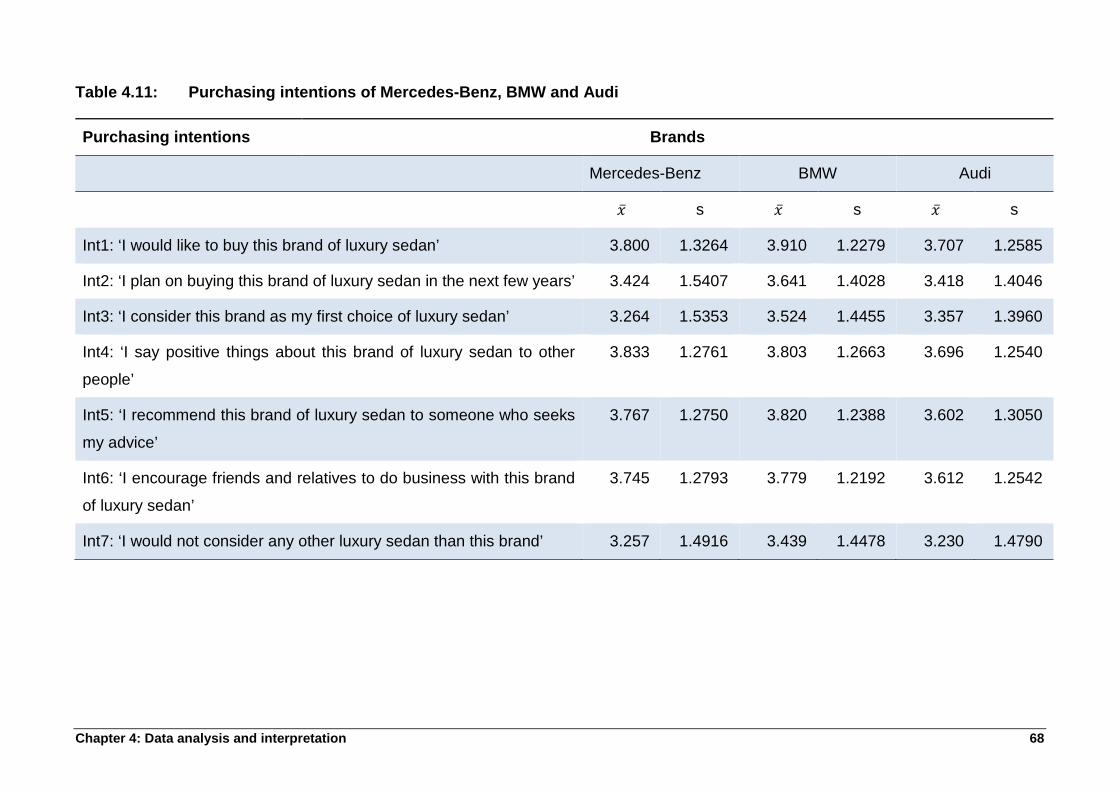
Table 4.11: Purchasing intentions of Mercedes-Benz, BMW and Audi
Purchasing intentions Brands
Mercedes-Benz BMW Audi
�̅�𝑥 s �̅�𝑥 s �̅�𝑥 s
Int1: ‘I would like to buy this brand of luxury sedan’ 3.800 1.3264 3.910 1.2279 3.707 1.2585
Int2: ‘I plan on buying this brand of luxury sedan in the next few years’ 3.424 1.5407 3.641 1.4028 3.418 1.4046
Int3: ‘I consider this brand as my first choice of luxury sedan’ 3.264 1.5353 3.524 1.4455 3.357 1.3960
Int4: ‘I say positive things about this brand of luxury sedan to other
people’
3.833 1.2761 3.803 1.2663 3.696 1.2540
Int5: ‘I recommend this brand of luxury sedan to someone who seeks
my advice’
3.767 1.2750 3.820 1.2388 3.602 1.3050
Int6: ‘I encourage friends and relatives to do business with this brand
of luxury sedan’
3.745 1.2793 3.779 1.2192 3.612 1.2542
Int7: ‘I would not consider any other luxury sedan than this brand’ 3.257 1.4916 3.439 1.4478 3.230 1.4790
Chapter 4: Data analysis and interpretation 68

*. Please note the graph range mean value: 3.0 – 4.0.
Figure 4.12: Intentions according to different brands
Figure 4.12 indicates the mean values of the purchasing intentions according to each
luxury sedan brand. As evident from Figure 4.11, BMW indicates the highest mean value
for all the purchasing intention statements except for Int4 (‘I say positive things about this
brand of luxury sedan’) where Mercedes-Benz has the highest mean value. Audi seemed
to have a lower purchasing intention mean for all the purchasing intentions except for Int3
(‘I consider this brand as my first choice of luxury sedan’) where Mercedes-Benz had the
lower mean. The graph suggested differences among the brands in relation to purchasing
intentions. The following section investigates if any of the differences are practically
significant.
4.9.3 Significance testing: Purchasing intentions
An ANOVA regarding the purchasing intentions of respondents was undertaken. This was
done to assess the differences that existed between the brands with regard to the
purchasing intentions and to determine if any of the differences were statistically
significant. Table 4.12 indicates the analysis of variance between the mean ratings of
purchasing intentions for each brand.
I would liketo buy thisbrand of
luxurysedan
I plan onbuying this
brand ofluxury
sedan in thenext few
years
I considerthis brandas my firstchoice of
luxurysedan
I saypositivethings
about thisbrand of
luxurysedan to
otherpeople
Irecommendthis brandof luxurysedan tosomeone
who seeksmy advice
I encouragefriends andrelatives todo business
with thisbrand of
luxurysedan
I would notconsiderany other
luxurysedan thanthis brand
Mercedes-Benz 3.8 3.424 3.264 3.833 3.767 3.745 3.257BMW 3.91 3.641 3.524 3.803 3.82 3.779 3.439Audi 3.707 3.418 3.357 3.696 3.602 3.612 3.23
33.13.23.33.43.53.63.73.83.9
4
Mea
n Va
lue
Chapter 4: Data analysis and interpretation 69

Table 4.12: Analysis of variance (ANOVA)
Sum of squares df Mean square F Sig. Int1: ‘I would like to buy this brand of luxury sedan’
Between groups 8.357 2 4.178 2.582 .076 Within groups 1976.140 1221 1.618 Total 1984.497 1223
Int2 ‘I plan on buying this brand of luxury sedan in the next few years’
Between groups 13.186 2 6.593 3.126 .044 Within groups 2574.785 1221 2.109 Total 2587.971 1223
Int3: ‘I consider this brand as my first choice of luxury sedan’
Between groups 14.401 2 7.201 3.371 .035 Within groups 2608.422 1221 2.136 Total 2622.823 1223
Int4: ‘I say positive things about this brand of luxury sedan to other people’
Between groups 4.158 2 2.079 1.297 .274 Within groups 1956.284 1221 1.602 Total 1960.441 1223
Int5: ‘I recommend this brand of luxury sedan to someone who seeks my advice’
Between groups 10.344 2 5.172 3.193 .041 Within groups 1977.760 1221 1.620 Total 1988.105 1223
Int6: ‘I encourage friends and relative to do business with this brand of luxury sedan’
Between groups 6.216 2 3.108 1.985 .138 Within groups 1911.702 1221 1.566 Total 1917.918 1223
Int7: ‘I would not consider any other luxury sedan than this brand’
Between groups 10.598 2 5.299 2.442 .087 Within groups 2649.048 1221 2.170 Total 2659.646 1223
Chapter 4: Data analysis and interpretation 70

As visible in Table 4.12, there is no significant difference between the brands in relation
to purchasing intention items: Int1, Int4, Int6 and Int7 as p > 0.05 for all the items. This
indicates that all three brands were perceived very similar with regard to these four
purchasing intention items. However, the purchasing intention items: Int2 (F = 3.126,
p=0.044<0.05), Int3 (F=3.371, p=0.035<0.05) and Int5 (F=3.193, p=0.041<0.05)
suggested statistical significant differences.
A Tukey’s HDS test was undertaken to determine where the differences for these three
purchasing intention items are located between the brands. The Cohen’s D coefficient
was also computed to determine if these differences had any practical significance.
Table 4.13 illustrates the results on the post hoc Tukey’s HSD test.
Chapter 4: Data analysis and interpretation 71

Table 4.13: Post hoc Tukey’s HSD test results
Dependent variable (I) Brand code (J) Brand code Mean difference (I-J) Std. error Sig.
95% Confidence interval
Lower bound Upper bound
Int3: ‘I consider this
brand as my first choice
of luxury sedan ‘
Mercedes-Benz BMW -.2600* .1013 .028 -.498 -.022
Audi -.0929 .1026 .637 -.334 .148
BMW Mercedes-Benz .2600* .1013 .028 .022 .498
Audi .1671 .1031 .237 -.075 .409
Audi Mercedes-Benz .0929 .1026 .637 -.148 .334
BMW -.1671 .1031 .237 -.409 .075
Int5: ‘I recommend this
brand of luxury sedan to
someone who seeks my
advice’
Mercedes-Benz BMW -.0537 .0883 .815 -.261 .153
Audi .1646 .0894 .156 -.045 .374
BMW Mercedes-Benz .0537 .0883 .815 -.153 .261
Audi .2183* .0898 .040 .008 .429
Audi Mercedes-Benz -.1646 .0894 .156 -.374 .045
BMW -.2183* .0898 .040 -.429 -.008
*. The mean difference is significant at the 0.05 level.
Chapter 4: Data analysis and interpretation 72

After further inspection of the post hoc Tukey’s HSD results no practical significant
difference was found for Int2 (‘I plan on buying this brand of luxury sedans in the next few
years’). Evident from Table 4.15, participants consider BMW as their first choice of luxury
sedans more than they consider Mercedes-Benz as their first choice (Int3). This
difference between BMW and Mercedes-Benz is, however, practically non-significant
(D=0.174). Participants are also more likely to recommend BMW to someone who seeks
their advice than they would recommend Audi (Int5). This difference is also practically
non-significant (D=0.171).
The next section compared the male and female participants regarding the differences in
their purchasing intentions of luxury sedan brands.
4.9.4 Hypothesis testing: Comparing the male and female respondents’ with regard to purchasing intentions.
The sixth empirical objective of the study was:
Determine whether gender differences exist regarding Generation Y students’
purchasing intentions of luxury sedan motor vehicles.
A T-test was undertaken to determine if a statistical difference of p<0,05 was present.
Cohen’s D statistic was then calculated to determine if the differences are practically
significant. The hypotheses thereof were formulated as follows:
H02 : Purchasing intentions of luxury sedans do not differ between males and females
Ha2 : Purchasing intentions of luxury sedans differ between males and females
Four significant statistical differences were computed among the female and male
respondents concerning their purchasing intentions. These differences were statistically
significant at p < 0.05 and they are presented in Table 4.14.
Chapter 4: Data analysis and interpretation 73

Table 4.14: Statistical and practical significant difference between males and females purchasing intentions
Male Female
n 𝒙𝒙� s n 𝒙𝒙� S t p D
Purchasing intentions
Int1: ‘I would like to buy this brand of luxury sedan
motor vehicle’
182 4.071 1.3004 234 3.590 1.3113 3.730 0.000 0.368
Int3: ‘I consider this brand as my first choice of
luxury sedan’
182 3.462 1.5719 234 3.111 1.4869 2.326 0.021 0.229
Int4: ‘I say positive things about this brand of luxury
sedan’
182 4.044 1.2867 234 3.675 1.2384 2.962 0.003 0.292
Int7: ‘I would not consider any other luxury sedan
than this brand’
182 3.467 1.5257 234 3.090 1.4429 2.580 0.010 0.254
Chapter 4: Data analysis and interpretation 74

As evident from the data above the null hypothesis, H02 can be rejected for: Int1, Int3,
Int4 and Int7 and alternatively the Ha2 is accepted. Purchasing intentions of males and
females do differ. From the mean values, one can conclude that males rated all of the
four purchasing intention items higher than females. One can thus assume that the male
participants are more likely to purchase a luxury sedan motor vehicle than their female
counterparts. The null hypothesis for Int2, Int5 and Int6 was accepted because the p-
value was greater than standard value (p>0.05). With the exception to: Int1, Int3, Int4 and
Int7, there were no significant statistical differences between the male and female
participants. As such, the null hypothesis H02 cannot be rejected for the remaining
purchasing intentions.
The Cohen D’s statistic was computed to determine if the differences were practically
significant. The difference between males and females for Int1 (D=0.386) has a medium
effect moving towards practical significance while the differences for Int3 (D=0.229), Int4
(D=0.292) and Int7 (D=0.254) have a small effect moving towards practical significance.
4.10 CONCLUSION
The chapter reported and interpreted the empirical findings of the study. All of the six
empirical objectives were addressed. Section 4.2 provided an analysis of the
demographic profile of the participants. It was then followed by Section 4.3, which
discussed the exploratory factor analysis of Aaker’s (1997) brand personality trait scale
in the luxury sedan motor vehicle industry. Section 4.5 addressed the reliability of the data
using the Cronbach’s alpha value. Section 4.6 addressed empirical objective 1: ‘Brand
identification’, while Section 4.7 outlined the results regarding empirical objective 3:
‘Investigating the brand personality perception of luxury sedan motor vehicles amongst
Generation Y by means of Aaker’s (1997) brand personality trait scale’. Section 4.8
discussed empirical objective 5: ‘Investigate Generation Y’s purchasing intentions of
different motor vehicles by making use of an adapted scale by Zeithaml et al. (1996)’.
Section 4.7 and 4.8 made use of significance tests to determine whether there were any
statistical differences that existed between the brands and among male and female
participants. Cohen’s D statistic was computed to determine if significant practical
differences existed between brands as well as males and females.
The following chapter provides further interpretations of the findings and discusses
recommendations and conclusions for the study.
Chapter 4: Data analysis and interpretation 75

CHAPTER 5: RECOMMENDATIONS AND CONCLUSION
5
5.1 INTRODUCTION
As highlighted in Chapter 1, the Generation Y cohort is a very lucrative market for
businesses. This cohort is more brand image conscious than any preceding generation.
It is therefore important to understand how Generation Y perceives brand personality as
it is a contributing factor to brand image perception. The study examined how Generation
Y perceived selected luxury sedan brands according to different brand personality traits
and measured their purchasing intentions.
The previous chapter presented the results of the study. This chapter starts with an
overview of the study (Section 5.2) and thereafter the main findings (Section 5.3) are
presented to determine if all the objectives were met. Section 5.4 outlines the
contributions of the study, while Section 5.5 presents some recommendations. The
chapter concludes with future opportunities for research (Section 5.6) and some
concluding remarks (Section 5.7).
5.2 OVERVIEW OF THE STUDY
The study consisted of different chapters that played an important role in the execution of
the overall objectives of the study. Chapter 1 introduced the topic by providing a
background to the topic. The problem statement (Section 1.2) highlighted the importance
of the Generation Y cohort in the marketplace and indicated the lack of brand personality
related research in South Africa. The primary, theoretical and empirical objectives of the
study were outlined in Section 1.3. The chapter also mentioned the hypotheses (Section
1.4) and methodological approach used in the study and how data were collected (Section
1.5). Moreover, also discussed the methods through which data would be collected and
further gave detailed description of the classification of chapters (Section 1.6).
Chapter 2 of the study was a literature review guided by the theoretical objectives. Section
2.2 of the chapter defined branding, the origin of the term brand and explored the various
aspects that form part of branding. Section 2.2.9 defined the concept brand personality.
Successively, Section 2.3 gave a detailed description of Aaker’s Brand Personality trait
scale. Section 2.4 discussed the various marketing strategy elements influenced by brand
personality, while the influence of brand personality on consumer behaviour was
Chapter 5: Recommendations and conclusion 76

discussed in Section 2.5. Section 2.6 discussed luxury sedan motor vehicles.
Furthermore, Section 2.7 elaborated more on the luxury sedan motor vehicles by focusing
on the position in the South African market. Factors influencing the buying decision of
luxury sedans were described in Section 2.8. The chapter concluded with a section giving
a detailed discussion about the Generation Y cohort, allowing the reader to understand
why the study focuses on this generation.
After the theoretical research, the empirical research followed. Chapter 3 analysed the
research methodology that was undertaken in the research study. This was followed by
a discussion of the research design to be used as a guideline for the research (Section
3.2). Section 3.3 outlined the research approach used in the study, while Section 3.4
discussed the sampling strategy. Section 3.5 reviewed the data collection method used
for the study. How the questionnaire was administered was discussed in Section 3.6, and
Section 3.7 explained the pilot testing of the questionnaire. Section 3.8 further outlined
the data preparation method used for the study. Section 3.9 discussed the statistical
analysis techniques used in the study, describing relevant statistical methods used in the
study. Exploratory factor analysis (Section 3.10) Reliability (Section 3.11), validity
(Section 3.12), and tests of significance (Section 3.13) were also discussed.
Chapter 4 reported on the results and findings guided by the empirical objectives
formulated for the study.
5.3 MAIN FINDINGS
This section discusses the main findings of this study, in accordance with the empirical
objectives formulated in Chapter 1.
• Identify Generation Y students’ top-of-the-mind awareness concerning luxury sedan
motor vehicle brands.
• Establish a factor structure for Aaker’s (1997) 42 brand personality traits applicable
for luxury sedan brands.
• Investigate the brand personality perceptions of luxury sedan motor vehicles amongst
Generation Y students by means of Aaker’s (1997) brand personality trait scale.
• Determine whether gender differences exist regarding Generation Y students’ brand
personality perceptions of luxury sedan motor vehicles.
Chapter 5: Recommendations and conclusion 77

• Investigate Generation Y students’ purchasing intentions of luxury sedan motor
vehicles by making use of an adapted a scale by Zeithaml et al. (1996).
• Determine whether gender differences exist regarding Generation Y students’
purchasing intentions of luxury sedan motor vehicles.
The first empirical objective was to identify Generation Y students’ top-of-the-mind
awareness concerning luxury sedan motor vehicle brands. Generation Y students
identified their top three luxury sedan brands as BMW, Mercedes-Benz and Audi. In the
second objective the brand personality factor structure adapted from Aaker (1997)
revealed five dimensions with 36 brand personality traits. This factor structure is very
similar to Aaker’s as both consist of five similar dimensions.
The third objective was to investigate the brand personality perceptions of luxury sedan
motor vehicles amongst Generation Y students. Figure 5.1 represents the brand
personality dimensions and brand personality traits associated with each of the three
luxury sedan brands.
Chapter 5: Recommendations and conclusion 78

1. Successful 2.Upper-class 3.Confident 4.Intelligent 5. Up-to-date
*Competence
*Sophistication
Mercedes Benz
1.Exciting 2.Successful 3.Good-looking 4.Confident 5.Up-to-date
*Competence
*Sophisticated *Exciting
BMW
1.Good-looking 2.Successful 3.Up-to-date 4.Charming 5.Cool
*Competence
*Sophisticated
Audi
Brand personality
dimensions and traits associated
with luxury sedans:
Figure 5.1: Brand personality perceptions
The findings revealed that all three brands are associated with the ‘Competence’ and
‘Sophisticated’ brand personality dimensions, with BMW also being associated with the
‘Exciting’ brand personality dimension.
The fifth empirical objective aimed to determine the luxury sedan purchasing intentions.
When calculating the average of all the mean values for each of the purchasing intention
items combined one can suggest that Generation Y students do have a positive
purchasing intention towards luxury sedan motor vehicles (mean=3.6).
Generation Y students’ brand personality perceptions and purchasing intentions of luxury
sedan motor vehicles do exist. However, the differences are limited with a small effect of
practical significance.
Chapter 5: Recommendations and conclusion 79

Some gender differences regarding Generation Y students’ brand personality perceptions
and purchasing intentions of luxury sedan motor vehicles do exist. However, the
differences are limited with a small effect of practical significance.
5.4 CONTRIBUTIONS OF THE STUDY
The focus of the study was on the brand personality perceptions of luxury sedan motor
vehicles and purchasing intentions among South African Generation Y cohort. Generation
Y have unique perceptions regarding different brands and it is therefore important to gain
insight regarding their perceptions. The results presented in this study can aid the
marketers of the selected luxury sedan motor vehicle brands in identifying the personality
traits associated with their brand.
This information can be compared with their current marketing strategy to determine if
any differences exist between the desired and perceived brand personality. This
information can help the marketers to tailor the marketing strategy accordingly to achieve
the desired brand personality. The study also offers insight into the brand personality
perceptions in the South African market. There is a paucity of published research on this
topic, specifically on the Generation Y cohort.
5.5 RECOMMENDATIONS
In accordance with the findings of this study, this section outlines some recommendations
regarding the use of brand personality in the luxury sedan motor vehicle industry.
Marketers of the luxury sedan brands that did not form part of the top three brands
(Mercedes-Benz, BMW and Audi) should consider increasing their marketing efforts
aimed at the Generation Y cohort to improve the brand awareness of their brand. These
marketers could alter their marketing efforts according to the top brand personality traits
identified by this study. The top ten traits for luxury sedans as indicated by Generation Y
student were: ‘Successful’, ‘Good looking’, ‘Confident’, ‘Intelligent’, ‘Up-to-date’, ‘Original’,
‘Upper-class’, ‘Charming’, ‘Independent’ and ‘Reliable’. It is recommended that when
branding luxury sedans, these traits should be prioritised as part of the branding strategy.
All of the luxury sedan brands were perceived as part of the ‘Competent’ and
‘Sophisticated’ brand personality dimensions. In order to avoid brand parity the marketers
of luxury sedan brands could also consider focussing their marketing towards the other
Chapter 5: Recommendations and conclusion 80

brand personality dimensions such as ‘Excitement’, ‘Sincerity’ and even some aspects of
‘Ruggedness’ as well. This will lead to a more unique brand image that might increase
brand awareness and influence sales.
Long term purchasing intentions of luxury sedans do exist among the Generation Y cohort
(Int1: ‘I would like to buy this brand of luxury sedan’, mean=3.8). The Generation Y
participants however depicted a lower intention over the short term (Int2: ‘I plan on buying
this brand of luxury sedan in the next few years’, mean=3.42). Marketers should therefore
consider direct marketing to convince the Generation Y cohort to purchase the luxury
sedan rather sooner than later.
5.6 FUTURE RESEARCH OPPORTUNITIES
Future research opportunities for this particular study are broad. The study focused on
brand personality perceptions of Generation Y students. Future studies on Generation Y
could focus on other portions of the Generation Y cohort. Future studies could also
consider targeting other generational cohorts like: Generation X and the Baby Boomers.
The personality traits used in this study were then devised from Aaker’s personality trait
scale. Future research studies should consider using other personality traits as from
psychology.
Only three brands formed part of the study. Future research should include other motor
vehicle brands from the luxury sedan motor vehicle segment. The participants identified
other brands such as Volkswagen, Lexus, Jaguar, Toyota and Hyundai that could also be
included. Future research could also consider focussing on specific model vehicles (BMW
3-series, BMW 5-series etc.) instead of focussing on a brand as a whole (BMW). Future
research should also consider other motor vehicle categories like ‘Hatchbacks’, ‘SUV’s’,
‘Convertibles’ etc.
The purchasing intention scale was limited to a few probing questions that did not provide
a clear insight into Generation Y’s intentions. Future research should focus on including
additional purchasing intention items.
The following section provides conclusion to summarise the study and conclude the
findings.
Chapter 5: Recommendations and conclusion 81

5.7 CONCLUDING REMARKS
Personality traits are intangible human features that prevail in each individual. These traits
define a person’s character. People tend to associate themselves with others who have
similar characteristics. This is also applicable to how they form relationships with brands.
Consumers tend to assess themselves before they can pursue what they really want. A
listed number of factors influence their buying decision.
Brand personality was one of the factors that prevailed. Marketers can play a role in how
consumers perceive their brand by tailoring marketing activities according to the identified
target market. This can be done by positioning the brand according to a specific brand
personality that will allow consumers to form a relationship with the brand. A well-
positioned brand appeals to a certain segment, creating a community of people with
similar interests. This can be done ensuring the brand image portrays personality
characteristics that consumers relate to.
Marketers should be aware that information related to brand personality perceptions is
vital. If a business can identify how consumers view their brand, the information can be
used to their advantage. This study shed some light on the brand personality perceptions
of luxury sedan motor vehicles and purchasing intentions of the Generation Y cohort.
Chapter 5: Recommendations and conclusion 82

BIBLIOGRAPHY
Aaker, J. L. 1997. Dimensions of Brand Personality. Journal of Marketing Research.
American Marketing Association, 34(3):342-356.
Aaker, D. 2004. Leveraging the corporate brand. Californian Management Review, 46
(3); 6-18.
Aaker, D. 2009. Strategic Marketing Management. John Wiley & Sons. 9th ed. p 12.
Aaker, J. L., Benet-Martinez, V., & Garolera, J. 2001. Consumption of Symbols as
carriers of culture: A study of Japanese and Spanish brand personality constructs. Journal
of Personality and Social Psychology, 81, 492−508.
Abdi, H., & Williams, L. J. 2010. Principal component analysis. Wiley Interdisciplinary
Reviews: Computational Statistics, 2(4): 433-459.
Adjei, N. Mensah, P. & Adu-boahen, E. 2014. The Role of Branding and Packaging in
Creating Customer Loyalty in the Toothpaste Market: The Case of Ghana. European
Journal of Business and Management, 6(15), 155-165.
Agrawal, R. 2014. Impact of Brand Personality on the consumer behaviour and its
implications for the Marketer. International Journal of scientific research and management
(IJSRM), 2 (6): 1060-1064.
Ahmand, A. and Thyagaraj, k. 2015. Understanding the Influence of Brand Personality
On Consumer Behaviour. Journal of Advanced Management Science, 3(1): p38-39.
Almlund, M., Duckworth, A., Heckman, J., & Kautz, D. 2011. Personality Psychology
and Economics. NBER Working Paper No. 16822. pp. 12. American Marketing
Association, 2007. Definition of a brand. Retrieved from: https://www.ama.org/
resources/Pages/Dictionary.aspx?dLetter=B&dLetter=B. Date of Access 23/10/2014.
AMA 2014. Definition of a Brand. Retrieved from https://www.ama.org/resources/
pages/dictionary.aspx?dLetter=B. Date of access 26/10/2014.
Auzolay, A., & Kapferer, J. 2003. Do brand personality scales really measure brand
personality? Brand Management, 11, 143−155.
Bibliography 83

Bain A., & Muotinho, L. 2011. "The role of brand image, product involvement, and
knowledge in explaining consumer purchase behaviour of counterfeits", European
Journal of Marketing, 45 (½): 191 – 195.
Banerjee, A., & Chaudhury, S. 2010. Statistics without tears: Populations and samples.
Industrial psychiatry journal, 19(1): 62.
Batra, R., Lehmann, D. R. & Singh, D. 1993. In D. A. Aaker & A. L. Biel (Eds.), Brand
Equity and Advertising, Hillsdale, NJ: Lawrence Erlbaum Associates. 83-97
Banat, A., & Wandebori, H. 2012. Store Design and Store Atmosphere Effect on
Customer Sales per Visit. 2nd International Conference on Business, Economics,
Management and Behavioral Sciences. Retrieved from: http://psrcentre.org/images/
extraimages/1012545.pdf. Date of Access 20/10/14.
Bernstein, D. 2003. "Corporate branding – back to basics", European Journal of
Marketing, 37 (7/8):1133 – 1141.
Berndt, A. & Petzer, D. 2011. Marketing Research. Cape Town: Heinemann. p 356.
Belén del Río, A., Vázquez, R. & Iglesias, V. 2001. "The effects of brand associations
on consumer response", Journal of Consumer Marketing, 18 (5): 452.
Berger, J., Draganska, M., & Simonson, I. 2007. The influence of product variety on
brand perception and choice. Marketing Science, 26(4): 460-472.
Blackett, T. 2004. What is a Brand? A Chapter from Brands and Branding An Economist
Book. Retrieved from; http://www.brandchannel.com/images/papers/
what_is_a_brand.pdf. Date of access 20 May 2014.
BMW 2013. Retrieved from: http://www.bmw.co.za/. Date of Access 23/10/2014.
Boshoff, C. & Du Plessis, F. 2009. Services Marketing: A Contemporary Approach.
Cape Town: Juta. p 319.
Bouhlel, O., Mzoughi, N., Hadiji, D., & Slimane, I. 2011. Brand personality’s influence on
the purchase intention: A mobile marketing case. International Journal of Business and
Management, 6(9): 210.
Bibliography 84

Brown, J. 2009. Choosing the Right Type of Rotation in PCA and EFA. Shiken: JALT
Testing & Evaluation SIG Newsletter. 13 (3): 20 – 25.
Bronnenberg, J., Pierre, J., Dubé, H. & Gentzkow, M. 2012. "The Evolution of Brand
Preferences: Evidence from Consumer Migration." American Economic Review, 102(6):
2472-2508.
Bruwer, B. Fraze, C. AND Venter, P. 2013. Retail Management; A South African
Perspective. First Ed. Oxford University Press. pp. 65-66
Carr, S. 1996. The cult of brand personality, Marketing News, 30, 4-9.
Choo, S. & Mokhtarian, P. 2004. What type of vehicle do people drive? The role of
attitude and lifestyle in influencing vehicle type choice. Transportation Research Part A,
p 202. Retrieved from http://www.uctc.net/papers/721.pdf. Date of access 10/11/2014.
Clark, J. 2013. The luxury car race: South Africans love their BMWs. Online article,
Retrieved from: http://www.moneyweb.co.za/moneyweb-economic-trends/the-luxurycar-
race-south-africans-love-their-bmws. Date of Access 09 October 2013.
Clark, L. & Watson, D. 1995. Construct validity: basic issues in objective scale
development. Psychological assessment, 7(3):309-319.
Clow, K. & Baack, D. 2013. Integrated Advertising, Promotion, and Marketing
Communications. 6th ed. Prentice Hall Publishers. p 61.
Cook, T. D. and Campbell, D. T. 1979. Quasi-Experimentation: Design & Analysis Issues
for Field Settings. Boston: Houghton Muffin Company, 37- 94.
Comrey, A., & Lee, H. 2013. A first course in factor analysis. Psychology Press. 35-37.
Costello, A., & Osborne, J. W. 2005. Best practices in exploratory factor analysis: four
recommendations for getting the most from your analysis. Practical Assessment,
Research & Evaluation, 10(7): 4.
Creswell, J., & Clark, V. 2007. Designing and conducting mixed methods research.
Australian and New Zealand Journal of Public Health. 31(4): 3. Retrieved from:
http://onlinelibrary.wiley.com/doi/10.1111/j.1753-6405.2007.00097.x/pdf. Date of Access
03/11/2014
Bibliography 85

Damoense, M., & Jordaan, A. 2007. Intra-industry trade: a methodology to test the
automobile industry in South Africa: economics. South African Journal of Economic and
Management Sciences, 10(1): 130-144.
Deloitte survey 2010. Connecting with Gen Y. Making the Short list. Available here
http://www.deloitte.com/assets/Dcom-UnitedStates/Local%20Assets/Documents/
us_auto_ ConnectingWithGenY_2010.pdf. Date of Access 07 October 2013.
Deloitte, 2014. 2014 Gen Y automotive consumer study. The changing nature of mobility.
Retrieved from : http://www2.deloitte.com/us/en/pages/manufacturing/ articles/2014-gen-
y-automotive-consumer-study.html. Date of access. 15/08/2014.
DeVellis, R. F. 2003. Scale development: Theory and applications, 2nd ed., Sage
Publications, Thousand Oaks. p 78.
DHET, 2014. Universities in South Africa. Retrieved from: http://www.dhet.gov.za/
SitePages/Inst_Universities_.aspx. Date of access 26/08/2014.
Dictionary of contemporary English. 2009. England: Pearson Education Limited. p 1574
Discroll, D. 2011. Introduction to Primary Research: Observations, Surveys, and
Interviews. p154.
Doyle, C. 2011. Dictionary of marketing. 3rd ed. Oxford University Press.
Elliott, R., & Wattanasuwan, K. 1998. Brands as symbolic resources for the construction
of identity. International journal of Advertising, 17: 131-144.
Ferrell, C. 2004. Business ethics and customer stakeholders. Academy of Management
Executive. 2004.18(2): 129-129. Retrieved from:
http://danielsethics.mgt.unm.edu/pdf/Customer%20Stakeholders.pdf. Date of access
23/10/14.
Ferrell, O. 2005. A framework for understanding organizational ethics. Business ethics:
New challenges for business schools and corporate leaders, pp. 3-17.
Field, A. 2000. Discovering Statistics using SPSS for Windows. London – Thousand
Oaks –New Delhi: Sage publications. p 424.
Bibliography 86
Flatters, F. 2005. The economics of MIDP and the South African motor industry. Trade
and Industrial Policies Strategies. pp. 1-7.
Fuchs, C., & Diamantopoulos, A. 2010. Evaluating the effectiveness of brandpositioning
strategies from a consumer perspective. European Journal of Marketing, 44(11/12): 1766-
1786.
Freling, T. & Forbes, L. 2005. An examination of brand personality through
methodological triangulation. Journal of Brand Management, 13(2): 148-162.
Geuens, M., Weijters, B., & De Wulf, K. 2009. A New Measure of Brand Personality.
International Journal of Research in Marketing, 26, (2): 97-107.
Ghodeswar, B. 2008. Building brand identity in competitive markets: a conceptual model,
Journal of Product & Brand Management, 17(1): 4-12.
Gill, P., Stewart, K., Treasure, E. & Chadwick, B. 2008. Methods of data collection in
qualitative research: interviews and focus groups. British dental journal 204(6): 291.
Retreived from: http://www.nature.com/bdj/journal/v204/n6/pdf/bdj.2008.192.pdf. Date of
Access 03/11/2014
Goldberg, L. 1990. An alternative ‘description of personality’: The big five factor structure.
Journal of Personality & Social Psychology, 59: 1216–1229.
Golafshani, N. 2003. Understanding reliability and validity in qualitative research. The
qualitative report, 8(4): 599.
Govers, M. & Mugge, R. 2004. ‘I Love My Jeep, Because Its Tough Like Me': The Effect
of Product-Personality Congruence on Product Attachment," in Proceedings of the Fourth
International Conference on Design and Emotion, ed. ArenKurtgözü, Ankara, Turkey.
Goi, C. L. 2009. A review of marketing mix: 4Ps or more?. International Journal of
Marketing Studies, 1(1): p2.
Griffith, D. A. 2005. An examination of the influences of store layout in online retailing.
Journal of Business Research, 58 (10): 1391-1396.
Gwin, C., & Gwin, C. 2003. Product attributes model: a tool for evaluating brand
positioning. Journal of Marketing Theory and Practice , 11 (2): 30-42.
Bibliography 87

Hair, J., Wolfinbarger, M., Ortinau, D., & Bush, R. 2008. Essentials of Marketing
Research. McGraw-Hill. pp. 105.
Han, J., Nunes, C. & Dreze, X. 2010. Signalling Status with Luxury Goods: The Role of
Brand Prominence. International Retail and Marketing Review. Retrieved from:
classic.marshall.usc.edu/assets/125/21653.pdf. Date of Access 20/10/2014
Hair, J.F., Anderson, R.E., Tatham, R.L., & Black, W.C. 2008. Multivariate Data Analysis,
7th Ed. Prentice Hall Publisher, Upper Saddle River, New Jersey.
Henry, G. 2013. Practical Sampling: Sample size. Sage Publication Inc., Thousand
Oaks, Retrieved from: http://www.uk.sagepub.com/gray3e/study/chapter9/
Encyclopaedia%20entries/Sample_Size.pdf. Date of access 21/10/2014.
Holt, D., & Cameron, D. 2010. Cultural strategy: Using innovative ideologies to build
breakthrough brands. Oxford University Press.
Hoppner, J. J. 2010. Marketing strategy decision making: The unintended consequences
of incorporating competitive information (Doctoral dissertation, Michigan state university).
pp. 1
I Africa. 2014. SA's top luxury car brand revealed, http://motoring.iafrica.
com/features/893203.html Date of access: 20 October 2014.11.25
IDC, 2013. The Economic Review. Recent developments in the global and South African
economies Retrieved from: http://www.idc.co.za/reports/economic_overview_ feb13.pdf.
Date of access 29/08/2014
Jansen, M. and Roy, S. 2008. Signalling quality through prices in an oligopoly. Games
and Economic Behaviour. 68: 192–207. Retrieved from: https://ideas.repec.org/a/eee/
gamebe/v68y2010i1p192-207.html. Date of access; 20/10/2014
Jenn, C. 2006. Designing a questionnaire. Malaysian Family Physician, 1(1): p32.
Joppe, M. 2000. The Research Process. Retrieved from: http://www.ryerson.
ca/~mjoppe/rp.html. Date of access 10/10/2014.
Joshy J, Sivakumaran B. 2009 The moderating effect of loyalty on the relationship of
sales promotions and brand equity. Advances Cons Res; 8:263–4.Juin, S. 2000.
Bibliography 88

Marketing planning & strategy. 6th ed. [Online]. Available at:
http://faculty.fuqua.duke.edu/~moorman/GeneralMills/Section2/Section2Documents/Mar
ketingPlanningAndStrategy-p23-27.pdf. Date of access 25/10/2014.
Kapferer, N. 1998. Strategic Brand Management, 2nd ed., London and New York: Kogan
Page.
Kapferer, J. 1998. Why are we Seduced by Luxury Brands? The Journal of Brand
Management, 6(1): 44–49.
Kapferer, J. N. 2008. The new strategic brand management, 4th ed. London: Kogan. pp.
10-12.
Kaplan, R. M. & Saccuzzo, D. P. 2005. Psychological testing: Principles, applications
and issues.6th ed. Thomson Wadsworth. 132 - 154.
Kazdin, A. 2003. Research design in clinical psychology. 4th ed. Boston: Allyn &Bacon.
p 3.
Keller, L. 1993. Conceptualizing, Measuring, and Managing, customer-based brand
equity, Journal of Marketing, 57: 1-22. Retrieved from,
facultygsb.stanford.edu/aaker/pdf/dimensions_of_brand_personality.pdf . Date of access
07/10/ 2013
Keller, K. 1993. Strategic Brand Management: Building, Measuring and Managing Brand
Equity. Journal of Marketing, 57 (1); 1-22. Retrieved from
http://www.jstor.org/stable/pdfplus/1252054.pdf?acceptTC=true&jpdConfirm=true. Date
of access 20/10/2014.
Keller, K. 2003. Brand Synthesis: The Multidimensionality of Brand Knowledge, Journal
of Consumer Research, 29: 595-600.
Keller, K. AND Richey, K 2006. The importance of corporate brand personality traits to a
successful 21st century business. Journal of Brand Management, 14: 74 – 81. Retrieved;
http://www.palgrave-journals.com/bm/journal/v14/n1/pdf/2550055a.pdf. Date of access
20/10/14.
Khare, A., & Handa, M. 2009. Role of individual self-concept and brand personality
congruence in determining brand choice. Innovative Marketing, 5(4): 63-71.
Bibliography 89

Kim, C., Han, D., Park, B. 2001. The effect of brand personality and brand identification
on brand loyalty: Applying the theory of social identification. Japanese Psychological
Research Invited Paper. Special Issue: Consumer behaviour. 43(4): 195– 206.
Kimberlin, C. L., & Winterstein, A. G. 2008. Validity and reliability of measurement
instruments used in research. Am J Health Syst Pharm, 65(23): 2276-84.
Klink, R. 2003. Creating meaningful brands: the relationship between brand name and
brand mark. Marketing Letters, 14(3): 143-157.
Knox, S AND Freeman, C. 2006. Measuring and Managing Employer Brand Image in
the Service Industry. Journal of Marketing Management, 22, 695-716. Retrieved from;
http://www.huttonhouserecruitment.com/downloadlibrary/Knox%26Freeman%20Measur
ing%20%26%20Managing%20Employer%20Brand.pdf. Date of access 20/10/14.
Kotler, P. & Keller, K. 2006. Marketing Management. 12th ed. Upper Saddle River, New
Jersey. Pearson Education Inc.
Kotler, P. & Armstrong, G. 2010. Principles of Marketing: Global and Southern African
Perspectives. 1st ed. Pearson Education South Africa. pp. 242.
Kreindler, D. 2014. Generation Why: JD Power Says Gen Y Now Buying More Cars
Than Gen X. Retrieved from: http://www.thetruthaboutcars.com/2014/08/generation-
jdpower-says-gen-y-now-buying-cars-gen-x/. Date of access: 29/07/2014.
Kumar, R. 2005, Research Methodology-A Step-by-Step Guide for Beginners,2nd Ed.,
Singapore, Pearson Education.
Lacobucci, D., & Churchill, G. 2010. Marketing Research Methodological Foundations,
10th ed. South-Western, Cengage Learning. p 201.
LaSalle, L. 2003. Gen Y and the Future of Mall Retailing. Available here,
http://www.us.am.joneslanglasalle.com/Lists/ExpertiseInAction/Attachments/255/JLLGe
n-Y-Mall-Retailing.pdf. Date of Access 07 October 2013.
Landreneau, K. & Creek, W. 2008. Sampling strategies. Retrieved from:
www.natco1.org/research/files/SamplingStrategies.pdf. Date of access 18/10/2014.
Bibliography 90

Latham, B. 2007. Sampling: What is it?. Quantitative Research Methods. Retrieved from:
webpages.acs.ttu.edu/rlatham/.../Sampling_Methodology_Paper.pdf. Date of access
23/08/2014. p 8.
Lauforet, S. & Saunders, J. 1999. ‘Managing Brand Portfolios: Why Leaders Do What
They Do,’ Journal of Advertising Research, 39(1): 51-66.
Lenth, R. V. 2001. Some practical guidelines for effective sample size determination.
The American Statistician, 55(3): 187-193.
Lombard, A. 2007. The impact of brand identity strategy of a consumer product on
consumer perception. Retrieved from: http://upetd.up.ac.za/thesis/submitted/
etd10082008-103031/unrestricted/dissertation.pdf. Date of access, 21/10/2014.
Lombard, M., Weinstein, L., & Ditton, T. B. 2011. Measuring telepresence: The validity
of the Temple Presence Inventory (TPI) in a gaming context. Presented at the Thirteenth
International Workshop on Presence, Edinborough, Scotland, UK.
Long-Yi, L., 2010. "The relationship of consumer personality trait, brand personality and
brand loyalty: an empirical study of toys and video games buyers", Journal of Product &
Brand Management, 19(1): 4 – 17.
MacDonald, E.K. & Sharp, B.M., 2000. ‘Brand awareness effects on consumer decision
making for a common, repeat purchase product: making for a common, repeat purchase
product: A replication’, Journal of Business Research, 48: 5–15.
Malhotra, N. & Birks, F. 2000. Marketing Research. An Applied Approach, European
Edition, Prentice Hall. pp. 79.
Malhotra, N. K. 2010. Marketing research: An applied orientation. Upper Saddle River,
NJ: Pearson. pp. 374-780
Malhotra N., & Naresh K. 1988. Self-Concept and Product Choice: An Integrated
Perspective. Journal of Economic Psychology, 9: 1-28.
http://dx.doi.org/10.1016/01674870(88)90029-3. Date of access 26/10/2014
Markert, J. 2004. Demographics of age: generational and cohort confusion. Journal of
Current Issues and Research in Advertising, 26(2):11-25.
Bibliography 91

Matheson, K. 2008. Statistical versus Practical Significance. Retrieved from:
https://atrium.lib.uoguelph.ca/xmlui/bitstream/handle/10214/1869/A_Statistical_versus_
Practical_Significance.pdf?sequence=7. Date of access 28/10/2014.
Matzler, K., Pichler, E., Füller, J., & Mooradian, A. T. 2011. Personality, person–brand
fit, and brand community: An investigation of individuals, brands, and brand communities.
Journal of Marketing Management, 27 (9-10): 875-880.
Maurya, K., & Mishra, P. 2012. What is a brand? A Perspective on Brand Meaning.
European Journal of Business and Management, 4(3): 122-133.
McAlexander, H., Schouten, W., & Koenig, F. 2002. Building brand community. Journal
of marketing, 66(1): 38-54.
McCarthy, E. J. 1964. Basic Marketing, IL: Richard D. Irwin. p 5
McDaniel, C. & Gates, R. 2010. Marketing Research With SPSS. 8th ed. Danvers MA:
John Wiley and Sons Inc., pp.486.
Mercedes-Benz SA. 2014. Growth and success on the road to 2015 Mercedes-Benz
South Africa posts healthy financial results for 2013,
http://www.mercedesbenzsa.co.za/media-room/news/15032387793/growth-and-
success-on-the-road-to2015-mercedes-benz-south-africa-posts-healthy-financial-
results-for-2013/ Date of access: 20 October 2014.
Moghaddam, F. M., & Foroughi, A. 2012. The influence of marketing strategy elements
on market share of firms. International Journal of Fundamental Psychology and Social
Science, 2 (1): 21-22.
Müller, R. 2014. Perceived Brand Personality of Symbolic Brands. Journal of Economics
& Behavioral Studies, 6(7): 525.
Naude, M. J. 2013. Supply chain challenges in the South African automotive sector: Do
location, size and age matter?. South African Journal of Economic and Management
Sciences, 16(4): 407-408.
Nel, A., Radel, E. & Loubser, M. 1988. Researching the South African Market, 2 ed.
Pretoria: University of South Africa.
Bibliography 92

Netemeyer, R.G., Krishnan, B., Pullig, C., Wang, G., Yagci, M., Dean, D., Ricks, J. &
Wirth, F. 2004. Developing and validating measures of facets of customer-based brand
equity. Journal of Business Research, 57(2): 209-224.
Nicholas, D., Rowlands, I., Clark, D., & Williams, P. 2011. Google Generation II: Web
Behaviour Experiments with the BBC. Aslib Proceedings: New Information Perspectives
63(1): 28-45.
O’Guinn, T., Allen, C. & Semenik, R., 2009, Advertising and integrated brand promotion,
5th ed., South-western, Mason, OH.
Olins, W. 1990. The Wolff Olins Guide to Corporate Identity. London, the Design Council.
Oluwatayo, J. 2012. Validity and Reliability Issues in Educational Research, Journal of
Educational and Social Research, 2(2): 394.
Oschman, J. 2004. A framework for the implementation of total quality management in
the South African Air Force. Doctoral thesis. Pretoria: University of South Africa. p 304.
Pallant, J. 2010. SPSS survival manual: A step by step guide to data analysis using
SPSS. McGraw-Hill International. p 100-183
Pappu, R. Quester, G. Cooksey, W. 2006. "Consumer‐based brand equity and country‐
of‐origin relationships: Some empirical evidence", European Journal of Marketing, 40
(5/6): 696 – 717.
Parasuraman, A., Grewal, G. & Krishnan, R. 2006. Marketing Research.. 2nd ed.
Houghton Mifflin Company; Boston New York. pp 56
Plummer, J. 1984. How personality makes a difference. Journal of Advertising Research,
24: 27−31.
Polit, D.F., and Beck, C.T. 2006. The content validity index: are you sure you know
what’sbeing reported? Critique and recommendations. Research in Nursing & Health, 29:
p467.
Polit, D. & Hungler, P. 1995. Nursing research: Principles and methods. 5th Ed.
Philadelphia: Lippincott.
Proctor, T. & Jamieson, B. 2012. Marketing Research. p 4
Bibliography 93

Raggio, R. D., & Leone, R. P. 2009. Postscript: Preserving and growing brand value in
a downturn. Journal of brand Management, 17(1): 84-89.
Rajagopal, S. 2006. Brand Excellence: Measuring Impact of Advertising and Brand
Personality on Buying Decisions, Measuring Business Excellence, 10 (3): 55-65.
Rajasekar, S., Philominathan, P., & Chinnathambi, V. 2006. Research Methodology.
arXiv preprint physics/0601009. p. 4-5
Ranjbar, A. 2010. Application of brand personality scale in the automobile industry.
Master’s thesis. 1 (006): 13-25.
Rattray, J., & Jones, M. 2007. Essential elements of questionnaire design and
development. Journal of clinical nursing, 16(2): 234-243.
Reed, A., Forehand, R., Puntoni, S., & Warlop, L. 2012. Identity-based consumer
behavior. International Journal of Research in Marketing, 29(4): 311-313.
Rook, W. 1985. The ritual dimension of consumer behaviour. Journal of Consumer
Research, p251-264.
Salzberger, T. 2013. Attempting measurement of psychological attributes. Frontiers in
psychology, 4 (75): 2.
Sarker, P. Bose, T. Palit, M. Haque, E. 2013. Influence of personality in buying
consumer goods-a comparative study between Neo-Freudian theories and trait theory
based on Khulna region. International Journal of Business and Economics Research.
2(3): 41-58.
Shahri, M. 2011. The effectiveness of corporate branding strategy in multi-business
companies. Australian Journal of Business and Management Research. 1 (6): 51-59.
Shenar, G. 2014. Luxury sedans. Consumer reports, 79(4): 44-49.
Shende, V. 2014. Analysis of research in Consumer behaviour of automobile passenger
car customer. International Journal of Scientific and Research Publications, 4 (2): 2-8.
Siguaw, J., Mattila, A., & Austin, J. 1999. The brand-personality scale. The Cornell Hotel
and Restaurant Administration Quarterly, 40(3): 48-5.
Bibliography 94

Smith, S. & Albaum, G. 2012. Basic Marketing Research: Handbook for Research
Professionals, (1): 5. Retrieved from: https://www.du.edu/ir/pdf/basic_
marketing_research _vol_1. Date of access 14/08/2014.
Spero, I. & Stone, M. 2004. Agents of change: how young consumers are changing the
world of marketing. Qualitative Market Research: An International Journal, 7(2): 153-159.
Spiliotopoulou, G. 2009. Reliability reconsidered: Cronbach’s alpha paediatric
assessment in occupational therapy. Australian Occupational Therapy Journal, 56(3):
117.
Strach, P., & Everett, M. 2006. Brand corrosion: mass-marketing’s threat to luxury
automobile brands after merger and acquisition. Journal of Product & brand Management,
15 (2): 107-110.
Streicher, H. 2008. Analysis of the South African Automotive Retailers in an economic
downturn using the Resource Based View. Retrieved from: http://upetd.up.ac.za/
thesis/available/etd-03172010-121218/unrestricted/dissertation.pdf. Date of access
20/08/2014.
STATSSA. 2011. Census 2011. Retrieved from
http://beta2.statssa.gov.za/?page_id=3962. Date of access 20/10/2014
Sujan, M., & Bettman, J. 1989. The effects of bran/d positioning strategies on consumers'
brand and category perceptions: Some insights from schema research. Journal of
Marketing research, p. 454-467.
Swanepoel, J., Swanepoel, C. Van-Graan, F. Alison, J. & Santana L. 2011. Elementary
statistical methods. 3rd ed. AndCork Publishers. p. 55-78.
Sze, H., & Hamid, N. 2012. Brand Equity in Automotive Sector. In Proceedings of the 2nd
International Conference on Management, Malaysia. p 102.
Tlapana, T. 2009. Store layout and its impact on consumer purchasing behaviour At
convenience stores in KwaMashu. Retrieved from: http://ir.dut.ac.za/bitstream/handle/
10321/467/tlapana_2009.pdf?sequence=1. Date of access 20/10/2014.
Tjiptono, F. 2002. Strategi Pemasaran. Edisi Kedua, Penerbit Andi Offset, Yogyakarta
Bibliography 95

Trade and Investment South Africa. 2003. Current developments in the automotive
industry. 7th report. Pretoria: Department of Trade and Industry.
Turner, A. 2003. Sampling frames and master samples. United Nations Secretariat
Statistics Division. Retrieved from; http://unstats.un.org/unsd/
demographic/meetings/egm/sampling_1203/docs/no_3.pdf. Date of Access 14 August
2014.
Upshaw, B. 1995. Building Brand Identity: A Strategy for Success in a Hostile
Marketplace, New York. NY: John Wiley & Sons.
Uggla, H. 2006. The corporate brand association base: A conceptual model for the
creation of inclusive brand architecture. European Journal of Marketing, 40(7/8): 787-789.
Van Teijlingen, R., & Hundley, V. 2010. "The importance of pilot studies." 16(40): p49-
59.
Varalakshmi, V., Suseela, n., Sundaram, G., & Indrani, B. 2004. Statistics Higher
secondary – first year. 1st ed. Tamilnadu Textbook Corporation. College road, Chennai-
600 006. p 28. Retrieved from: http://www.textbooksonline.tn.nic.in/books/11/std11stat-
em.pdf. Date of Access: 29/10/14
Venter, P. and Van Rensburg, J. 2009. Strategic Marketing: Theory and applications for
Competitive Advantage.
Walonick, D. 1996. Statistics Calculator. Retrieved from https://www.statpac.com/
statistics-calculator/Statistics-Calculator-Guide.pdf. Date of access. 29/10/2014.
Walker, O. 2011. Outlines & Highlights for Marketing Strategy: A Decision Focused
Approach by: Cram101. p. 65
Watier, N., Lamontagne, C., & Chartier, S. 2011. What does the mean mean?, Journal
of Statistics Education, 19 (2): 3.
Weiers, R. 2010. Introduction to business statistics. Cengage Learning. Chicago. 7th ed.
p. 63
Welman, C., Kruger, F. & Mitchell, B. 2005. Research Methodology. 3rd ed. Cape Town:
Oxford University Press. p. 342.
Bibliography 96

Wichern, D. & Johnson, R.,. 2007. Applied Multivariate Statistical Analysis. 6th ed.
Prentice Hall, New York. p. 123.
Wiid, J., & Diggines, C. 2013. Marketing Research, 2nd ed. Cape Town, Juta. p. 221.
Williams, K., & Page, R. 2011. Marketing to the generations. Journal of Behavioural
Studies in Business, 3(1): 37-53.
Williams, C. 2011. Research methods. Journal of Business & Economics Research
(JBER), 5(3): 65.
Wolf, J. 2008. Self-administered questionnaire, in PJ Lavrakas (ed.), Encyclopedia of
survey research methods, SAGE Publications, Inc., Thousand Oaks, CA, p. 804-5,
Retrieved from: http://dx.doi.org/10.4135/9781412963947.n522. Date of access
4/11/2014.
Wood, L. 2000. Brands and brand equity: definition and management. Management
decision, 38(9): 662.
Zaltman, G. 1997. Rethinking market research: Putting people back in. Journal of
Marketing Research, 34(4): 425.
Zeithaml, V. A., Berry, L.L. & Parasuraman, A. 1996. The behavioral consequences of
service quality. Journal of Marketing Management, 60: 31-46.
Zikmund, W., & Babin, B. 2012. Essentials of marketing research. Cengage Learning.
Retrieved from, http://books.google.co.za/books?hl=en&lr=&id=xagktDjXcZ0C&oi
=fnd&pg=PP9&dq=WHat+is+Marketing+research&ots=6Mk4aRQNX7&sig=HUpY43m6
PD7rWcM1dRngym-rUGM. Date of access 06 May 2014.
Bibliography 97

APPENDIX A: QUESTIONNAIRES
QUESTIONNAIRE 1
RESEARCH QUESTIONNAIRE
(Step 1)
‘Brand personality perceptions of luxury sedan motor vehicles
amongst the South African Generation Y cohort’
The research study aims to:
Determine the brand personality perceptions of luxury sedan
motor vehicles amongst the South African Generation Y
cohort.
Researcher:
Mr P. Sokhela
North West University (Vaal)
Hendrick van Eck Blvd. Vanderbijlpark
Building 4, Office 110
Cell: 0783863169
Appendices 98

SECTION A: BRAND IDENTIFICATION
A sedan motor vehicle is a car for four or more people.
Write down the first brand that comes to mind when you think of a luxury sedan motor
vehicle?
Brand:
SECTION B: DEMOGRAPHICAL INFORMATION
Pleas circle your relevant response
Thank you for your time!
1. Gender Male Female 2. Designated group
African White Coloured Indian Asian Other (Please specify):
Appendices 99

QUESTIONNAIRE 2
RESEARCH QUESTIONNAIRE
(Step 2)
‘Brand personality perception of luxury sedan motor vehicles amongst South African Generation Y cohort’
This research study aims to:
Determine perceptions of luxury sedan motor vehicles amongst the South
African generation Y cohort.
Researcher: Mr. P. Sokhela North West University (Vaal) Hendrik van Eck Blvd. , Vanderbijlpark Building 4, Office G14. Tel: 0783863169 [email protected]
Appendices 100

SECTION A: DEMOGRAPHICAL INFORMATION
Please mark the appropriate box with a cross (X) or write down your answer.
1. Country of origin:
South Africa Other (please specify):
2. Province of origin:
Eastern Cape Free State Gauteng KwaZulu-
Natal
Limpopo Mpumalanga Northern Cape North West
Western
Cape
Other (Please specify):
3. Current year of study: 1st year 2nd year 3rd year 4th year Post
graduate
4. Gender: Male Female
5.
Ethnic group:
African Black Asian/Indian Coloured White
Other (Please specify):
6. Please indicate your mother tongue language: Afrikaans
English IsiNdebele IsiXhosa IsiZulu Sesotho
Sepedi Setswana SiSwati Tshivenda Xitsonga
Other (Please specify):
7. Age: ˂18 18 19 20 21 22 23 24 25 25˃
Appendices 101

SECTION B: BRAND PERSONALITY TRAIT RATING Brand personality is a set of human characteristics assigned to a brand. Rate how descriptive each of the following personality traits are of: Mercedes-Benz, BMW & Audi luxury sedans.
Please circle your relevant response. (1 = not at all descriptive, 5 = extremely descriptive)
FOR EXAMPLE: Mercedes-Benz BMW Audi
caring 1 2 3 4 5 1 2 3 4 5 1 2 3 4 5
Mercedes-Benz BMW Audi
Down-to-earth 1 2 3 4 5 1 2 3 4 5 1 2 3 4 5
Family-oriented 1 2 3 4 5 1 2 3 4 5 1 2 3 4 5
Small-town 1 2 3 4 5 1 2 3 4 5 1 2 3 4 5
Honest 1 2 3 4 5 1 2 3 4 5 1 2 3 4 5
Sincere 1 2 3 4 5 1 2 3 4 5 1 2 3 4 5
Real 1 2 3 4 5 1 2 3 4 5 1 2 3 4 5
Wholesome 1 2 3 4 5 1 2 3 4 5 1 2 3 4 5
Cheerful 1 2 3 4 5 1 2 3 4 5 1 2 3 4 5
Sentimental 1 2 3 4 5 1 2 3 4 5 1 2 3 4 5
Friendly 1 2 3 4 5 1 2 3 4 5 1 2 3 4 5
Original 1 2 3 4 5 1 2 3 4 5 1 2 3 4 5
Reliable 1 2 3 4 5 1 2 3 4 5 1 2 3 4 5
Hard-working 1 2 3 4 5 1 2 3 4 5 1 2 3 4 5
Secure 1 2 3 4 5 1 2 3 4 5 1 2 3 4 5
Intelligent 1 2 3 4 5 1 2 3 4 5 1 2 3 4 5
Technical 1 2 3 4 5 1 2 3 4 5 1 2 3 4 5
Corporate 1 2 3 4 5 1 2 3 4 5 1 2 3 4 5
Successful 1 2 3 4 5 1 2 3 4 5 1 2 3 4 5
Leader 1 2 3 4 5 1 2 3 4 5 1 2 3 4 5
Confident 1 2 3 4 5 1 2 3 4 5 1 2 3 4 5
Appendices 102

Please circle your relevant response. (1 = not at all descriptive, 5 = extremely descriptive)
Mercedes-Benz BMW Audi
Daring 1 2 3 4 5 1 2 3 4 5 1 2 3 4 5
Trendy 1 2 3 4 5 1 2 3 4 5 1 2 3 4 5
Exciting 1 2 3 4 5 1 2 3 4 5 1 2 3 4 5
Spirited 1 2 3 4 5 1 2 3 4 5 1 2 3 4 5
Cool 1 2 3 4 5 1 2 3 4 5 1 2 3 4 5
Young 1 2 3 4 5 1 2 3 4 5 1 2 3 4 5
Imaginative 1 2 3 4 5 1 2 3 4 5 1 2 3 4 5
Unique 1 2 3 4 5 1 2 3 4 5 1 2 3 4 5
Up-to-date 1 2 3 4 5 1 2 3 4 5 1 2 3 4 5
Independent 1 2 3 4 5 1 2 3 4 5 1 2 3 4 5
Contemporary 1 2 3 4 5 1 2 3 4 5 1 2 3 4 5
Upper class 1 2 3 4 5 1 2 3 4 5 1 2 3 4 5
Glamorous 1 2 3 4 5 1 2 3 4 5 1 2 3 4 5
Good looking 1 2 3 4 5 1 2 3 4 5 1 2 3 4 5
Charming 1 2 3 4 5 1 2 3 4 5 1 2 3 4 5
Feminine 1 2 3 4 5 1 2 3 4 5 1 2 3 4 5
Smooth 1 2 3 4 5 1 2 3 4 5 1 2 3 4 5
Outdoorsy 1 2 3 4 5 1 2 3 4 5 1 2 3 4 5
Masculine 1 2 3 4 5 1 2 3 4 5 1 2 3 4 5
Western 1 2 3 4 5 1 2 3 4 5 1 2 3 4 5
Tough 1 2 3 4 5 1 2 3 4 5 1 2 3 4 5
Rugged 1 2 3 4 5 1 2 3 4 5 1 2 3 4 5
Appendices 103

SECTION C: BEHAVIORAL INTENTIONS Please circle your relevant response.
(1 = not at all descriptive, 5 = extremely descriptive)
FOR EXAMPLE: Mercedes-Benz BMW Audi
Statement 1 2 3 4 5 1 2 3 4 5 1 2 3 4 5
Mercedes-Benz BMW Audi
I would like to buy this brand of luxury sedan. 1 2 3 4 5 1 2 3 4 5 1 2 3 4 5
I plan on buying this brand of luxury sedan in the next few years.
1 2 3 4 5 1 2 3 4 5 1 2 3 4 5
I consider this brand as my first choice of luxury sedan.
1 2 3 4 5 1 2 3 4 5 1 2 3 4 5
I say positive things about this brand of luxury sedan to other people.
1 2 3 4 5 1 2 3 4 5 1 2 3 4 5
I recommend this brand of luxury sedan to someone who seeks my advice.
1 2 3 4 5 1 2 3 4 5 1 2 3 4 5
I encourage friends and relatives to do business with this brand of luxury sedan.
1 2 3 4 5 1 2 3 4 5 1 2 3 4 5
I would not consider any other luxury sedan than this brand.
1 2 3 4 5 1 2 3 4 5 1 2 3 4 5
Thank you for your time!
Appendices 104

APPENDIX B FREQUENCIES ON EACH ITEM
Mercedes Benz
Attribute Not
descriptive Slightly
descriptive Neutral Descriptive Extremely descriptive
Down-to-earth 51 46 108 103 112
Family-oriented 10 30 72 129 179
Small-town 127 101 105 51 36
Honest 9 29 90 139 153
Sincere 16 32 92 129 151
Real 8 21 61 101 229
Wholesome 13 30 108 147 122
Cheerful 15 43 91 132 139
Sentimental 10 28 96 136 150
Friendly 19 33 106 112 150
Original 11 16 46 74 273
Reliable 5 11 52 102 250
Hard-working 7 16 57 120 220
Secure 4 9 51 114 242
Intelligent 5 10 51 81 273
Technical 7 15 50 123 225
Corporate 3 8 70 136 203
Successful 4 10 28 81 297
Leader 6 15 48 108 243
Confident 6 6 43 78 287
daring 18 29 96 141 136
trendy 9 20 73 137 181
Appendices 105

Attribute Not
descriptive Slightly
descriptive Neutral Descriptive Extremely descriptive
Exciting 16 22 72 115 192
Spirited 10 16 100 146 148
Cool 21 30 76 103 190
Young 102 61 114 75 68
Imaginative 11 36 87 142 144
Unique 9 23 73 106 209
Up-to-date 3 11 49 113 244
Independent 6 14 43 104 253
Contemporary 13 19 103 149 136
Upper class 3 12 33 71 301
Glamorous 3 14 68 98 237
Good looking 5 13 44 111 247
Charming 11 16 63 105 225
Feminine 58 43 113 106 100
Smooth 13 20 69 141 177
Outdoorsy 40 54 107 116 103
Masculine 18 25 103 117 157
Western 28 26 77 105 187
Tough 30 29 91 102 168
Rugged 31 49 116 139 85
Purchasing intentions
Like to buy 1 34 40 85 73
Plan on buying 1 78 49 63 72
First choice brand 3 83 51 81 67
Appendices 106

Attribute Not
descriptive Slightly
descriptive Neutral Descriptive Extremely descriptive
Positive things 1 29 39 81 90
Recommend 1 31 41 82 102
Encourage friends 0 36 36 86 103
Only this brand 5 74 52 88 79
BMW
Attribute Not
descriptive Slightly
descriptive Neutral Descriptive Extremely descriptive
Down-to-earth 48 58 101 113 92
Family-oriented 18 41 108 132 113
Small-town 86 79 114 77 56
Honest 21 34 96 132 129
Sincere 23 28 125 119 117
Real 10 20 64 125 193
Wholesome 9 35 112 147 109
Cheerful 14 24 81 118 175
Sentimental 12 33 115 138 114
Friendly 17 26 95 114 160
Original 9 18 63 92 230
Reliable 7 18 66 123 198
Hard-working 10 17 67 131 187
Secure 7 16 60 140 189
Intelligent 5 12 56 118 221
Technical 4 12 74 120 202
Corporate 4 11 93 152 152
Appendices 107

Attribute Not
descriptive Slightly
descriptive Neutral Descriptive Extremely descriptive
Successful 4 11 56 102 239
Leader 10 25 64 132 181
Confident 8 15 47 102 240
daring 8 21 89 125 169
trendy 5 10 70 122 205
Exciting 5 12 55 91 249
Spirited 9 21 71 152 159
Cool 11 15 54 92 240
Young 25 29 71 105 182
Imaginative 6 21 74 146 165
Unique 9 24 86 117 176
Up-to-date 8 10 50 119 225
Independent 11 12 58 123 208
Contemporary 14 21 113 148 116
Upper class 9 16 55 126 206
Glamorous 4 17 76 111 204
Good looking 7 14 47 99 245
Charming 11 13 51 109 228
Feminine 37 37 117 120 101
Smooth 8 21 93 136 154
Outdoorsy 29 51 101 122 109
Masculine 12 17 94 133 156
Western 28 23 92 116 153
Tough 21 27 86 121 157
Appendices 108

Attribute Not
descriptive Slightly
descriptive Neutral Descriptive Extremely descriptive
Rugged 25 47 104 150 86
Purchasing intentions
Like to buy 26 34 72 99 181
Plan on buying 52 38 79 80 163
First choice brand 58 47 75 80 151
Positive things 33 30 90 91 168
Recommend 33 25 86 107 161
Encourage friends 25 38 97 95 157
Only this brand 60 48 77 90 134
Audi
Attribute Not
descriptive Slightly
descriptive Neutral Descriptive Extremely descriptive
Down-to-earth 31 45 95 116 123
Family-oriented 12 47 115 123 113
Small-town 55 86 118 87 64
Honest 10 33 96 157 114
Sincere 11 35 107 136 121
Real 5 28 86 125 166
Wholesome 10 28 121 153 98
Cheerful 13 24 110 122 141
Sentimental 9 29 113 146 113
Friendly 10 24 96 111 169
Original 7 13 80 114 196
Appendices 109

Attribute Not
descriptive Slightly
descriptive Neutral Descriptive Extremely descriptive
Reliable 5 17 83 126 179
Hard-working 4 16 110 139 141
Secure 3 24 84 146 153
Intelligent 6 13 80 123 188
Technical 10 19 75 138 168
Corporate 6 19 107 159 119
Successful 6 15 72 120 197
Leader 14 29 107 142 118
Confident 9 21 74 121 185
daring 10 31 94 154 121
trendy 2 24 97 135 152
Exciting 7 22 75 124 182
Spirited 8 33 84 153 132
Cool 9 23 68 98 212
Young 16 35 71 113 175
Imaginative 7 25 96 134 148
Unique 8 24 95 113 170
Up-to-date 7 14 67 130 192
Independent 7 19 87 123 174
Contemporary 9 33 107 155 106
Upper class 7 27 88 137 151
Glamorous 5 16 76 157 156
Good looking 2 15 60 122 211
Charming 7 20 64 121 198
Appendices 110

Attribute Not
descriptive Slightly
descriptive Neutral Descriptive Extremely descriptive
Feminine 20 33 112 114 131
Smooth 6 15 89 138 162
Outdoorsy 33 44 113 116 104
Masculine 15 32 118 128 117
Western 25 25 92 119 149
Tough 22 48 123 121 96
Rugged 32 58 115 137 68
Purchasing intentions
Like to buy 31 39 81 104 137
Plan on buying 53 48 94 71 125
First choice brand 51 58 88 80 113
Positive things 29 41 78 111 132
Recommend 32 40 80 115 120
Encourage
friends 30 38 89 117 115
Only this brand 74 48 87 70 111
Total group
Attribute Not
descriptive Slightly
descriptive Neutral Descriptive Extremely descriptive
Down-to-earth 130 149 304 332 327
Family-oriented 40 118 295 384 405
Small-town 268 266 337 215 156
Honest 40 96 282 428 396
Sincere 50 95 324 384 389
Appendices 111

Attribute Not
descriptive Slightly
descriptive Neutral Descriptive Extremely descriptive
Real 23 69 211 351 588
Wholesome 32 93 341 447 329
Cheerful 42 91 282 372 455
Sentimental 31 90 324 420 377
Friendly 46 83 297 337 479
Original 27 47 189 280 699
Reliable 17 46 201 351 627
Hard-working 21 49 234 390 548
Secure 14 49 195 400 584
Intelligent 16 35 187 322 682
Technical 21 46 199 381 595
Corporate 13 38 270 447 474
Successful 14 36 156 303 733
Leader 30 69 219 382 542
Confident 23 42 164 301 712
daring 36 81 279 420 426
trendy 16 54 240 394 538
Exciting 28 56 205 330 623
Spirited 27 70 255 451 439
Cool 41 68 198 293 642
Young 143 125 256 296 425
Imaginative 24 82 257 422 457
Unique 26 71 254 336 555
Up-to-date 18 35 166 362 661
Appendices 112

Attribute Not
descriptive Slightly
descriptive Neutral Descriptive Extremely descriptive
Independent 24 45 188 350 635
Contemporary 36 73 323 452 358
Upper class 19 55 176 334 658
Glamorous 12 47 220 366 597
Good looking 14 42 151 332 703
Charming 29 49 178 335 651
Feminine 115 113 342 340 332
Smooth 27 56 251 415 493
Outdoorsy 102 149 321 354 316
Masculine 45 74 315 378 430
Western 81 74 261 340 486
Tough 73 104 300 344 421
Rugged 88 154 335 426 239
Purchasing intentions
Like to buy 1 91 113 238 276
Plan on buying 2 183 135 236 223
First choice brand 6 192 156 244 227
Positive things 2 91 110 249 292
Recommend 6 96 106 248 324
Encourage
friends 3 91 112 272 315
Only this brand 10 208 148 252 239
Appendices 113