
Brand Investment & Valuation A New Empirical Approach · •A practical model for brand valuation...
18
Brand Investment & Valuation A New Empirical Approach Shyam Venugopal Vice President Global Insights PepsiCo Frank Findley Vice President R&D MSW•ARS Research @MSW_ARS
Transcript of Brand Investment & Valuation A New Empirical Approach · •A practical model for brand valuation...

Brand Investment & ValuationA New Empirical Approach
Shyam Venugopal
Vice President Global InsightsPepsiCo
Frank Findley
Vice President R&DMSW•ARS Research
@MSW_ARS
The Issue
• The “brand” is one of the largest assets a company owns
• Unlike tangible assets like factories which are quantified on the balance sheet, a brand’s financial value often goes unrecognized
• This puts marketing and finance teams at a disadvantage for assessing investments in the brand such as media

Essentially…
Brand Investment and Valuation Project
• To bridge this gap MASB, The Marketing Accountability Standards Board, sponsored an ambitious project
• Establish missing linkages between marketing & financial metrics and build a BIV model that any brand could use
• Brought together:
• Leading Academics (LMU, Duke, Michigan, Cologne, Witwatersrand)
• Specialists from research companies (nielsen, MSW•ARS)
• Finance and marketing practitioners from six blue chip corporate participants

BIV Corporate participants
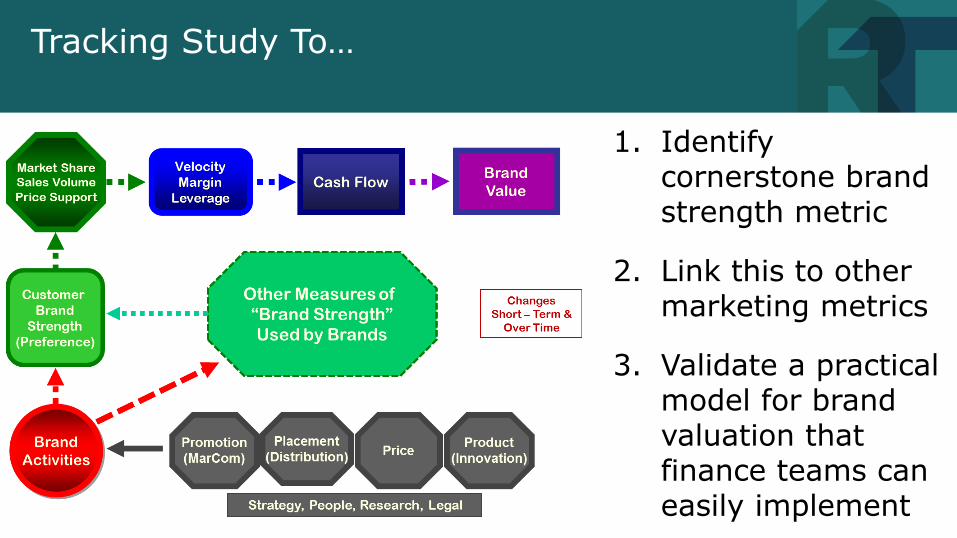
Tracking Study To…
1. Identify cornerstone brand strength metric
2. Link this to other marketing metrics
3. Validate a practical model for brand valuation that finance teams can easily implement
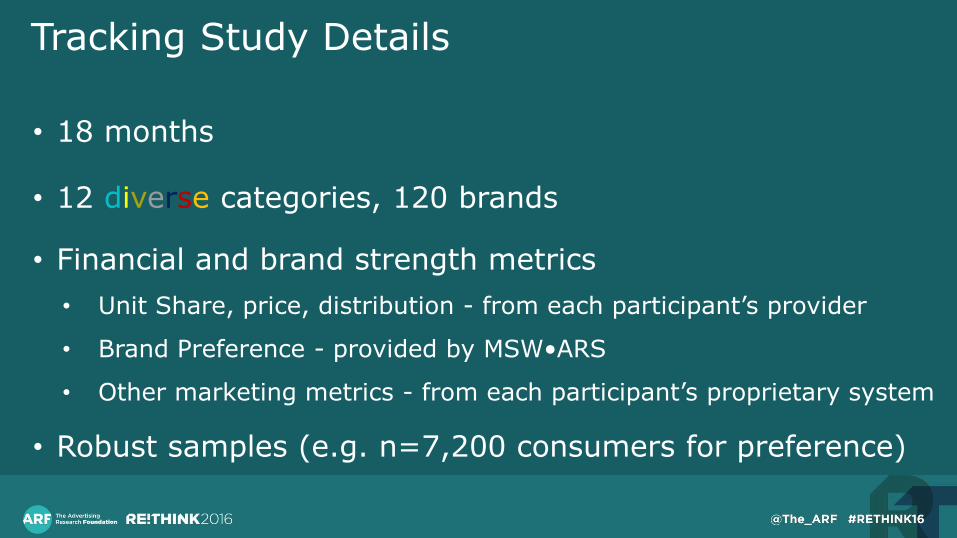
Tracking Study Details
• 18 months
• 12 diverse categories, 120 brands
• Financial and brand strength metrics
• Unit Share, price, distribution - from each participant’s provider
• Brand Preference - provided by MSW•ARS
• Other marketing metrics - from each participant’s proprietary system
• Robust samples (e.g. n=7,200 consumers for preference)
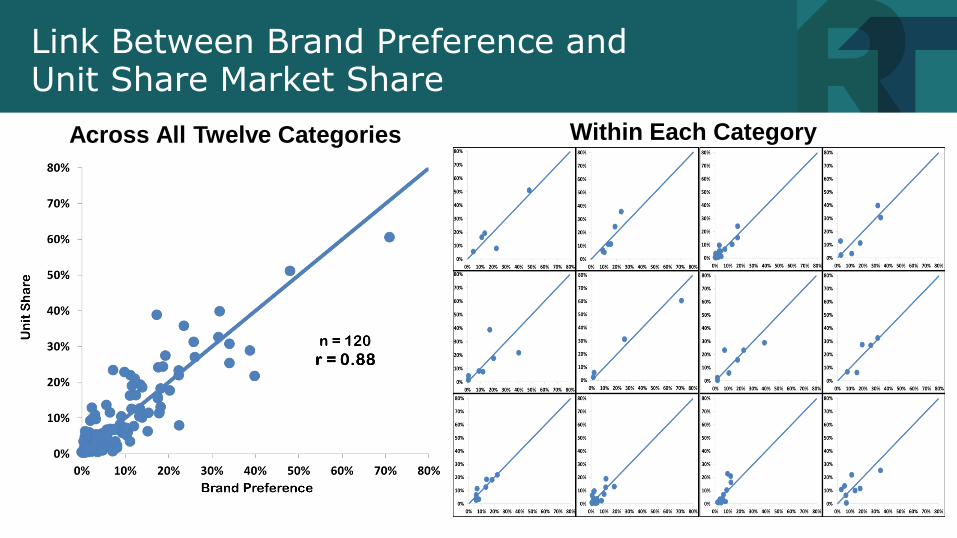
Link Between Brand Preference andUnit Share Market Share
Across All Twelve Categories Within Each Category
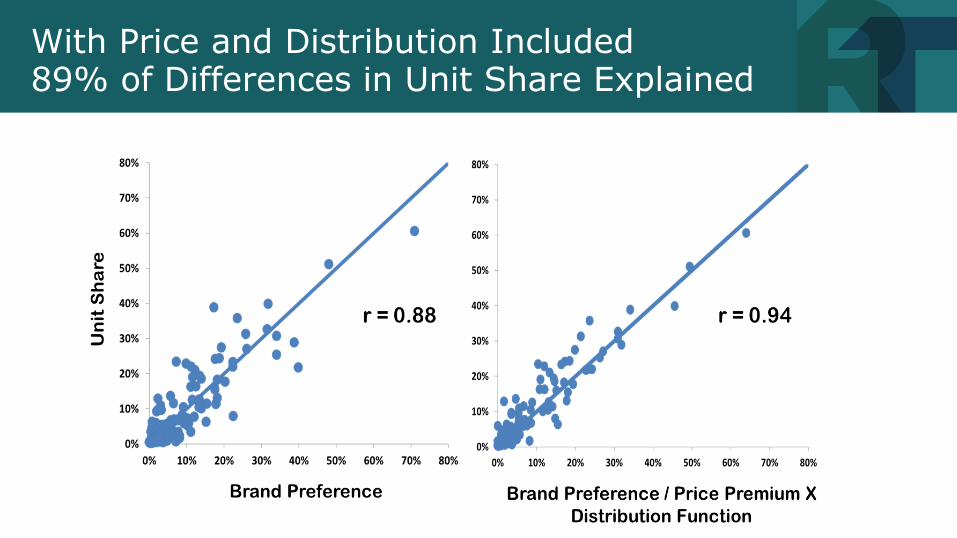
With Price and Distribution Included89% of Differences in Unit Share Explained
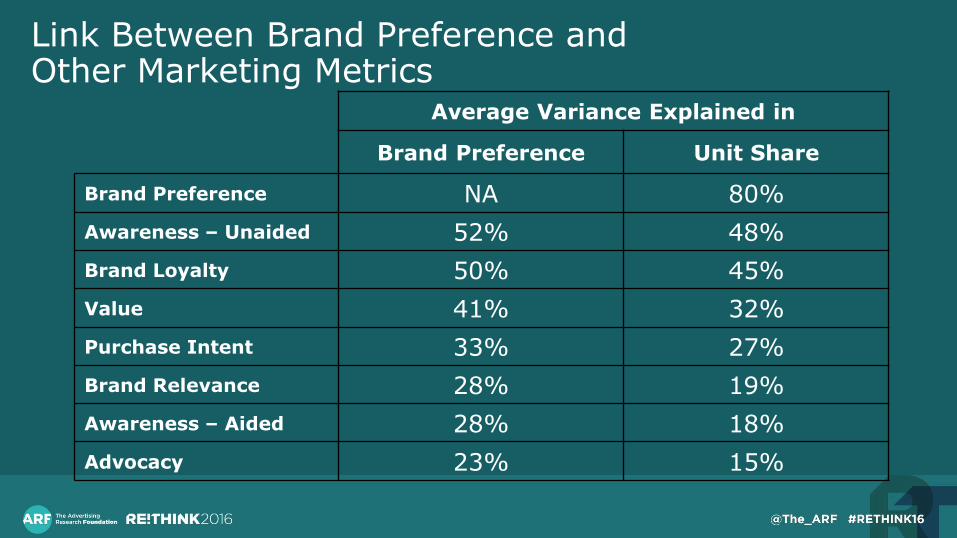
Link Between Brand Preference andOther Marketing Metrics
Average Variance Explained in
Brand Preference Unit Share
Brand Preference NA 80%
Awareness – Unaided 52% 48%
Brand Loyalty 50% 45%
Value 41% 32%
Purchase Intent 33% 27%
Brand Relevance 28% 19%
Awareness – Aided 28% 18%
Advocacy 23% 15%
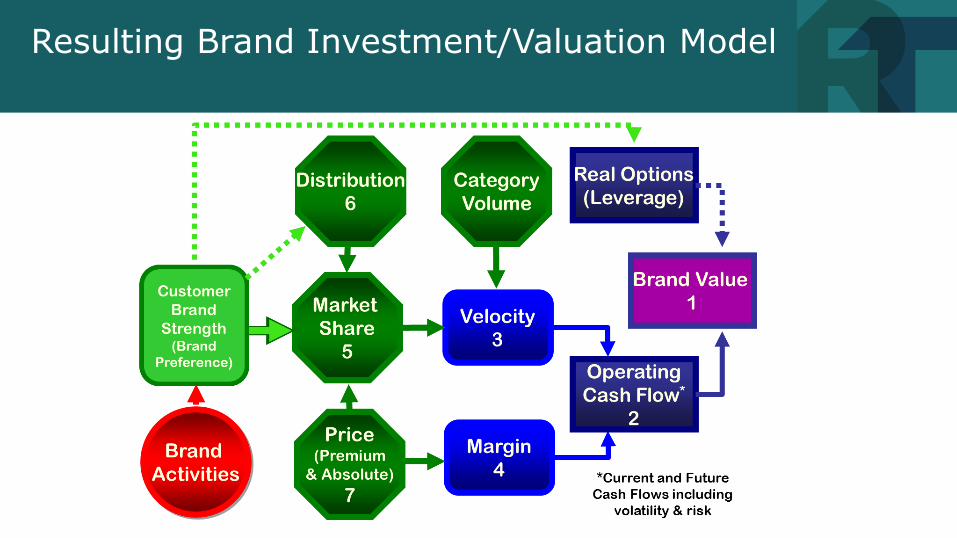
Resulting Brand Investment/Valuation Model
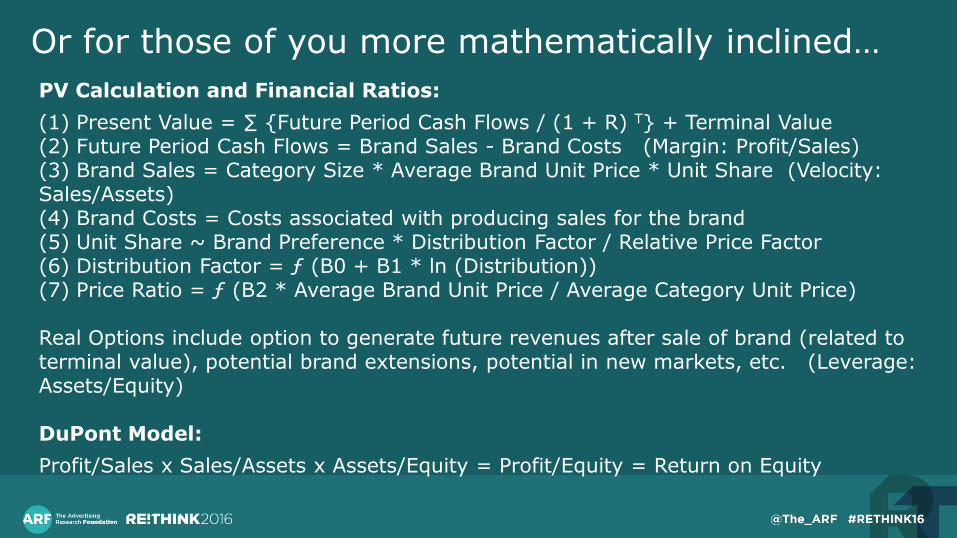
Or for those of you more mathematically inclined…
PV Calculation and Financial Ratios:
(1) Present Value = ∑ {Future Period Cash Flows / (1 + R) T} + Terminal Value(2) Future Period Cash Flows = Brand Sales - Brand Costs (Margin: Profit/Sales)(3) Brand Sales = Category Size * Average Brand Unit Price * Unit Share (Velocity: Sales/Assets)(4) Brand Costs = Costs associated with producing sales for the brand (5) Unit Share ~ Brand Preference * Distribution Factor / Relative Price Factor(6) Distribution Factor = ƒ (B0 + B1 * ln (Distribution))(7) Price Ratio = ƒ (B2 * Average Brand Unit Price / Average Category Unit Price)
Real Options include option to generate future revenues after sale of brand (related to terminal value), potential brand extensions, potential in new markets, etc. (Leverage: Assets/Equity)
DuPont Model:
Profit/Sales x Sales/Assets x Assets/Equity = Profit/Equity = Return on Equity
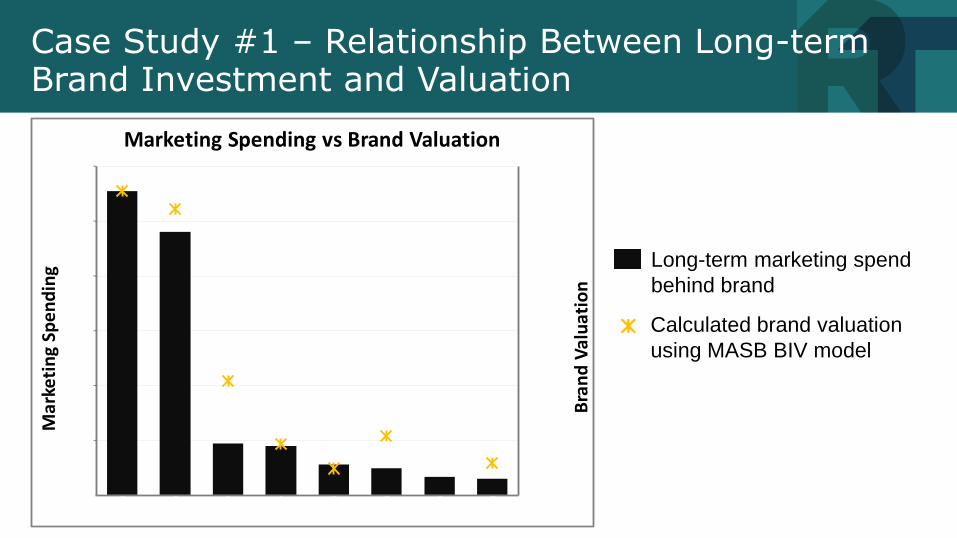
Case Study #1 – Relationship Between Long-term Brand Investment and Valuation
-
500. 0
1,000. 0
1,500. 0
2,000. 0
2,500. 0
3,000. 0
3,500. 0
-
50.0
100. 0
150. 0
200. 0
250. 0
300. 0
Coor s Light Mil ler Lit e Blue Moon Redd's Coor s Banquet Lei nenkugel Smit h & For ge Mil ler Hi gh Lif e
Bra
nd
Val
uat
ion
Ma
rke
tin
g Sp
en
din
g
Marketing Spending vs Brand Valuation
Long-term marketing spend
behind brand
Calculated brand valuation
using MASB BIV model
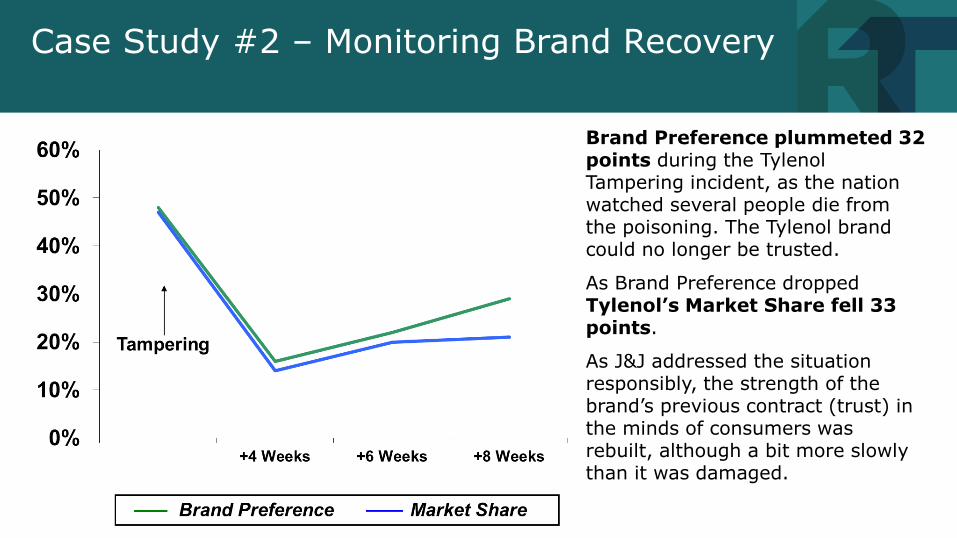
Case Study #2 – Monitoring Brand Recovery
Brand Preference plummeted 32 points during the Tylenol Tampering incident, as the nation watched several people die from the poisoning. The Tylenol brand could no longer be trusted.
As Brand Preference dropped Tylenol’s Market Share fell 33 points.
As J&J addressed the situation responsibly, the strength of the brand’s previous contract (trust) in the minds of consumers was rebuilt, although a bit more slowly than it was damaged.
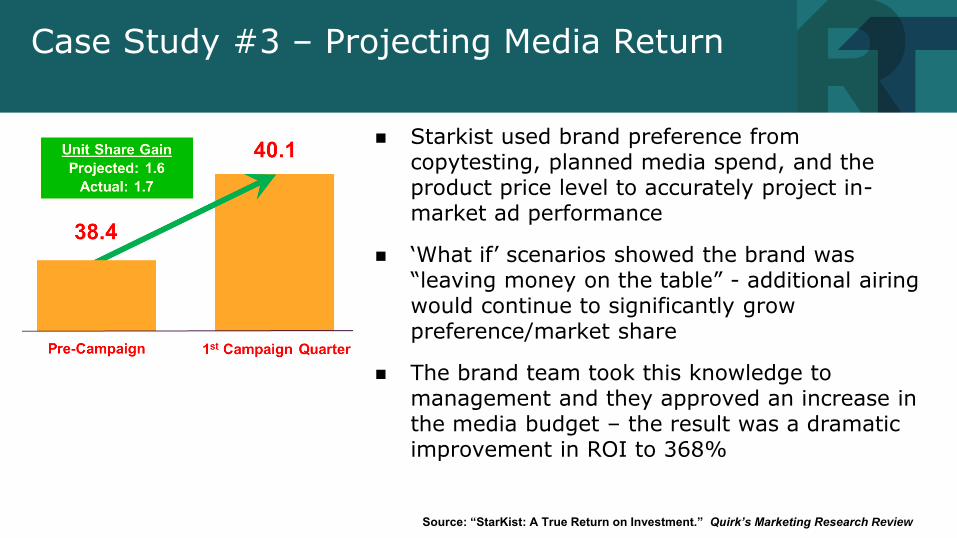
Case Study #3 – Projecting Media Return
Source: “StarKist: A True Return on Investment.” Quirk’s Marketing Research Review
Starkist used brand preference from copytesting, planned media spend, and the product price level to accurately project in-market ad performance
‘What if’ scenarios showed the brand was “leaving money on the table” - additional airing would continue to significantly grow preference/market share
The brand team took this knowledge to management and they approved an increase in the media budget – the result was a dramatic improvement in ROI to 368%

Participant quote
Brands could “earn” a higher valuation based on improved brand preference which would remove
uncertainty relating to future financial assumptions and the longevity of the brand…
Operations can purchase and maintain an asset. Marketing can create and grow one
- Jim Meier, Miller-Coors
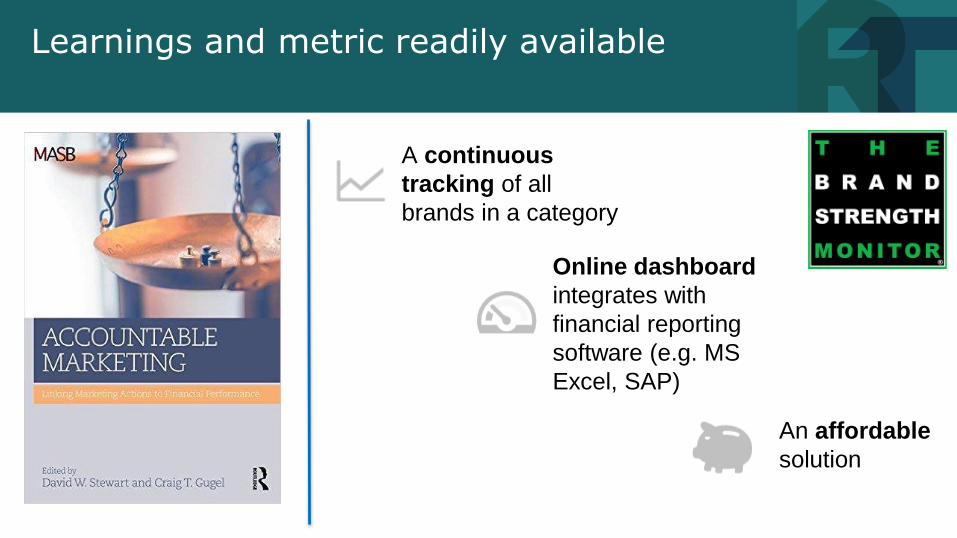
Learnings and metric readily available
A continuous
tracking of all
brands in a category
Online dashboard
integrates with
financial reporting
software (e.g. MS
Excel, SAP)
An affordable
solution
Conclusions
• Brand preference is a strong indicator of “brand strength”
• Explaining 89% variance in unit share with price & distribution
• Captures impact of other marketing metrics – cornerstone
• A practical model for brand valuation is now available
• Uses ‘present value’ of cash flows in alignment with other assets
• Provides a consistent means for tracking brand values over time
• Case studies reveal the power of this new empirical approach for managing brand investments