
Brand Equity Mgt
18
Performance consequences of brand equity management: evidence from organizations in the value chain Artur Baldauf Department of Strategic Management, University of Bern, Bern, Switzerland Karen S. Cravens The University of Tulsa, Tulsa, Oklahoma, USA Gudrun Binder Department of Marketing, University of Vienna, Vienna, Austria Keywords Brand equity, Intangible assets, Value chain, Financial performance, Customers Abstract Evaluating the consequences of brand equity management is one of the most important measurement issues for intangible assets in the new economy. Studies have validated the effect of brand equity on the value of the firm and addressed the capital mark et effects of intangible associations suc h as brand value. Yet, there is not sufficient evidence on which dimensions of brand equity should be measured and monitored to support financial performance. Using regression analysis on a sample of managers in Austrian organizations, this study investigates the effe ct of perc eive d brand equity on brand profitability, brand sales volume, and perceived customer value. Results indicate strong support for measures of perceived quality, brand loyalty, and brand awareness as antecedents of firm performance, customer value and willingness to buy. In recent years, management accounting has been criticized for not providing information to management that is useful in decision making (Kaplan and John son, 198 7). Most performance indicators focused on aggregate, financial accounting-based measures that were at best, very much lagging indicators of performance. At worst these indicators often had little information content for managers in terms of the effect of their actions on firm performance. Brands are not capitalized on the balance sheet in most countries, which counteracts a long-term management focus on the value of any internally- develo ped brands. Therefore, cash flow and short-term profits are more often used as important performance parameters. Strategically, strong brands represent a key component of competitive advantage and function as the main source of a company’s future earnings. For firms with strong brands, performance indicators should incorporate brand-based performance measures instead of concentrating on cash flow and short-term profits. Brand equity research has a more established conceptual logic than other areas of intangibles, making it a viable segment for considering performance measurement implications. Brand equity is defined as ``a set of brand assets and liabilities linked to a brand, its name, and symbol, that add to or subtract from the value provided by a product or service to a firm and/or to that firm’s customers’’ (Aaker, 1991, p. 15). Information about measurement issues relating to brand equity can yield ancillary benefits by contributing to the research foundation on measurement issues for other types of intangibles. If The Emerald Research Register for this journal is available at http://www.emeraldinsight.com/researchregister The current issue and full text archive of this journal is available at http://www.emeraldinsight.com/1061-0421.htm B a la n c e s h e e t 2 2 0 J O U R N A L O F P R O D U C T & B R A N D M A N A G E M E N T , V O L . 1 2 N O . 4 2 0 0 3 , p p . 2 2 0 - 2 3 6 , # M C B U P L I M I T E D , 1 0 6 1 - 0 4 2 1 , D O I 1 0 . 1 1 0 8 / 1 0 6 1 0 4 2 0 3 1 0 4 8 5 0 3 2 A n e x e c u t iv e s u m m a ry f o r m a n a g e rs a n d e x e c u ti v e re a d e r s c a n b e fo u n d a t t h e e n d o f th is a rt ic le
-
Upload
fahad-bin-sohail -
Category
Documents
-
view
221 -
download
0
Transcript of Brand Equity Mgt
832019 Brand Equity Mgt
httpslidepdfcomreaderfullbrand-equity-mgt 117
Performance consequences of brand equity managementevidence from organizations inthe value chain Artur Baldauf Department of Strategic Management University of Bern Bern
Switzerland
Karen S CravensThe University of Tulsa Tulsa Oklahoma USA
Gudrun Binder Department of Marketing University of Vienna Vienna Austria
Keywords Brand equity Intangible assets Value chain Financial performance
Customers
Abstract Evaluating the consequences of brand equity management is one of the most
important measurement issues for intangible assets in the new economy Studies havevalidated the effect of brand equity on the value of the firm and addressed the capital
market effects of intangible associations such as brand value Yet there is not sufficient evidence on which dimensions of brand equity should be measured and monitored to
support financial performance Using regression analysis on a sample of managers in Austrian organizations this study investigates the effect of perceived brand equity on
brand profitability brand sales volume and perceived customer value Results indicatestrong support for measures of perceived quality brand loyalty and brand awareness as
antecedents of firm performance customer value and willingness to buy
In recent years management accounting has been criticized for not providing
information to management that is useful in decision making (Kaplan and
Johnson 1987) Most performance indicators focused on aggregate financial
accounting-based measures that were at best very much lagging indicators
of performance At worst these indicators often had little information content
for managers in terms of the effect of their actions on firm performance
Brands are not capitalized on the balance sheet in most countries which
counteracts a long-term management focus on the value of any internally-
developed brands Therefore cash flow and short-term profits are more often
used as important performance parameters Strategically strong brands
represent a key component of competitive advantage and function as the
main source of a companyrsquos future earnings For firms with strong brands
performance indicators should incorporate brand-based performance
measures instead of concentrating on cash flow and short-term profits Brand
equity research has a more established conceptual logic than other areas of
intangibles making it a viable segment for considering performance
measurement implications Brand equity is defined as ``a set of brand assets
and liabilities linked to a brand its name and symbol that add to or subtract
from the value provided by a product or service to a firm andor to that firmrsquos
customersrsquorsquo (Aaker 1991 p 15) Information about measurement issues
relating to brand equity can yield ancillary benefits by contributing to the
research foundation on measurement issues for other types of intangibles If
The Emerald Research Register for this journal is available at
httpwwwemeraldinsightcomresearchregister
The current issue and full text archive of this journal is available athttpwwwemeraldinsightcom1061-0421htm
B a la n c e s h e e t
2 2 0 J O U R N A L O F P R O D U C T amp B R A N D M A N A G E M E N T V O L 1 2 N O 4 2 0 0 3 p p 2 2 0 - 2 3 6 M C B U P L I M I T E D 1 0 6 1 - 0 4 2 1 D O I 1 0 1 1 0 8 1 0 6 1 0 4 2 0 3 1 0 4 8 5 0 3 2
A n e x e c u t iv e s u m m a ry f o r
m a n a g e rs a n d e x e c u ti v e
re a d e r s c a n b e fo u n d a t t h e
e n d o f th is a rt ic le
832019 Brand Equity Mgt
httpslidepdfcomreaderfullbrand-equity-mgt 217
management is knowledgeable about brand equity strength it can use this
information together with financial databases to develop appropriate
incentive plans and brand management programs (Aaker 1996b)
We examine one particular intangible asset plusmn the equity of the organizationrsquos
brands plusmn since for a significant number of firms the brand is the central asset of
the company (Aaker 1996a Barwise 1993 Shocker et al 1994) Our research
is intended to provide evidence as to the efficacy of using specific brand equitymeasures to evaluate financial performance Specifically the research objective
is to consider whether dimensions of brand equity are important antecedents of
firm performance such as sales and profitability Moreover as customers
ultimately decide about a firmrsquos success or failure we also examine the linkage
between brand equity dimensions and value to customers
We begin our investigation by examining the conceptual foundations for
brand equity and performance and develop the specific directional
hypotheses tested The methodology section contains the sampling plan the
construct measures used in our study of Austrian managers and analytical
issues We present the results of the empirical study and conclude with
implications and suggestions for future research
Conceptual foundations and research hypotheses
Our research considers a segment of Aakerrsquos (1991) original framework of
brand equity which proposes that various organizational efforts contribute to
developing the dimensions of brand equity These dimensions of brand
equity then have a positive impact on providing value to the firm as well as
to the customer For example a brand with strong equity can be leveraged to
launch new products and serves as a cue in repeat purchases In this research
we test the portion of the model that focuses on the effect of the dimensions
of brand equity in providing value The underlying conceptual logic of a
strong brand equity is that it is an asset which is expected to enhance
customer value increase customersrsquo purchase intentions and increase the
organizationrsquos market performance Brand equity reflects the price premium
of a strong brand in combination with the sales it attracts compared to an
average brand (Aaker 1996a Barwise et al 1989)
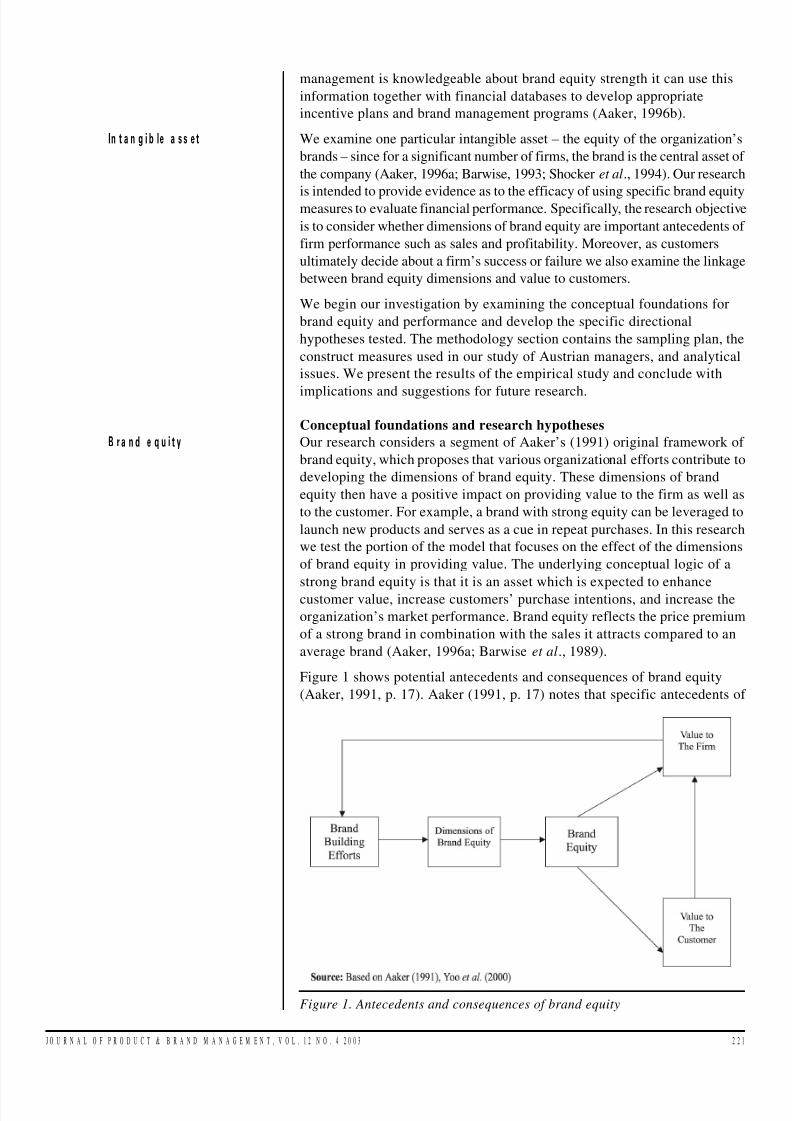
Figure 1 shows potential antecedents and consequences of brand equity
(Aaker 1991 p 17) Aaker (1991 p 17) notes that specific antecedents of
Figure 1 Antecedents and consequences of brand equity
In t a n g i b le a s s e t
B r a n d e q u i t y
J O U R N A L O F P R O D U C T amp B R A N D M A N A G E M E N T V O L 1 2 N O 4 2 0 0 3 2 2 1
832019 Brand Equity Mgt
httpslidepdfcomreaderfullbrand-equity-mgt 317
brand equity comprise brand loyalty brand awareness perceived quality
brand associations and other proprietary assets Together these dimensions
most succinctly represent the assets or liabilities that are linked to a brand its
name or symbol The resulting brand equity thus provides a basis for
strategic initiatives which create value directly for customers and the firm In
addition by providing value to customers brand equity indirectly enhances
value to the firm Aaker (1991 p 17) describes how brand equity enhances
value to customers in terms of their processing and interpretation of
information confidence in the purchasing decision and use satisfaction
Brand equity and customer value in turn provide value to the firm by
enhancing ``efficiency and effectiveness of marketing programs brand
loyalty pricesmargins brand extensions trade leverage and competitive
advantagersquorsquo (Aaker 1991 p 17)
Yoo et al (2000) build on Aakerrsquos (1991 p 17) basic model to incorporate
the brand-building efforts that influence the various dimensions of brand
equity and are also influenced by the provision of value to the firm Yooet al
add a separate construct of brand equity that was not present in Aakerrsquos
original model The major focus of Yoo et alrsquos (2000) research was to
explore the brand-building efforts and the resulting effect on the dimensions
of brand equity They investigated the effects of price store image
distribution intensity advertising spending and price deals on three
particular dimensions of brand equity perceived quality brand loyalty and
brand awareness We continue the focus on these three dimensions of brand
equity
We examine whether the brand awareness brand loyalty and perceived
quality dimensions of brand equity do affect performance as conceptualized
by brand profitability performance brand market performance and customer
perceived value These are core equity dimensions and are expected to be
relevant predictors of value We also include in the model the ultimate test of perceived value in terms of the customersrsquo purchase intention Intention to
purchase is an indication of how likely the customer will purchase the brand
(ranging from definitely will buy to definitely will not buy) If the perception
of the brandrsquos value is favorable and the customers indicate purchase
intention a purchase of the product or service will generate brand
profitability and market performance The conceptual model which guides
our study is shown in Figure 2
The brand equity dimensions of perceived quality brand loyalty and brand
awareness are proposed as antecedents to brand profitability and brand sales
Figure 2 The effect of brand equity dimensions on performance
B r a n d -b u il d i n g
P e rf o r m a n c e
2 2 2 J O U R N A L O F P R O D U C T amp B R A N D M A N A G E M E N T V O L 1 2 N O 4 2 0 0 3
832019 Brand Equity Mgt
httpslidepdfcomreaderfullbrand-equity-mgt 417
volume Two customer oriented value components are incorporated
perceived customer value and purchase intention The research model
focuses on a special stage in the value chain plusmn resellers This is an important
perspective on brand equity which has not received research attention
Hence these resellers will assess the dimensions of brand equity from their
perspective They will also indicate their perceptions concerning customer
value provided and willingness to buy as well as their firmsrsquo market and
profitability performance (the value to the trade)
Brand equity dimensions
The three dimensions of brand equity that we examine are also predicted to
affect performance through the overall positive effect of brand equity As
brand equity increases the firm is expected to enjoy a positive financial
return and the customer receives higher value (Aaker 1991 Aaker and
Jacobson 1994 Keller 1998 Lane and Jacobson 1995) Instead of
considering a single construct of brand equity we propose to focus on the
separate dimensions of brand equity as contributing to performance
Previous research has validated the dimensions of brand awareness
perceived quality and brand loyalty as relating to a higher order construct of brand equity (Yoo et al 2000 Yoo and Donthu 2001)
Brand awareness A major goal of brand management is developing and
maintaining brand awareness because of the impact of awareness on
consumer decision making and overall effect on firm values Brand
awareness is defined as ``the ability for a buyer to recognize or recall that a
brand is a member of a certain product categoryrsquorsquo (Aaker 1991 p 61)
Generating and maintaining brand awareness is important as only those
brands of which customers are aware enter into the consideration set of
brands for possible purchase and brand awareness influences the selection of
products from the consideration set (Hoyer and Brown 1990) Hence only
brands which customers recognize can be identified categorized andultimately purchased
Perceived quality Perceived quality is another dimension of brand value that
ultimately compels the consumer to select a good or service to purchase
(Aaker 1991 Zeithaml 1988) Notably product quality is a firmrsquos essential
resource for achieving competitive advantage (Aaker 1989) Perceived
quality is defined as the consumerrsquos judgment (perception) about a productrsquos
overall excellence or superiority with reference to substitutes (Aaker 1991
Zeithaml 1988) Hence perceived quality is the ``perceived ability of a
product to provide satisfaction `relativersquo to the available alternativesrsquorsquo
(Monroe and Krishnan 1985 p 212) Since the selection of important
attributes and comparison standards for a product are chosen by anindividual quality is not an objective measure Consequently quality
assessment is subjective (Zeithaml 1988)
Brand loyalty Brand loyalty is defined as ``a deeply held commitment to
rebuy or repatronize a preferred product or service consistently in the future
despite situational influences and marketing efforts having the potential to
cause switching behaviorrsquorsquo (Oliver 1997 p 392) An important
characteristic of loyal customers is that they consistently favor a brand and
refrain from switching to other brands (Grover and Srinivasan 1992)
Both Aaker (1991) and Keller (1993) discuss brand loyalty in their
conceptualizations though from somewhat different perspectives Aaker (1991)
notes the differences of brand loyalty from the other brand equity dimensions
because of its connection to the usage experience Loyalty develops via brand
T h r e e d im e n s io n s
B r a n d v a lu e
J O U R N A L O F P R O D U C T amp B R A N D M A N A G E M E N T V O L 1 2 N O 4 2 0 0 3 2 2 3
832019 Brand Equity Mgt
httpslidepdfcomreaderfullbrand-equity-mgt 517
usage In contrast to brand awareness or perceived quality brand loyalty only
exists if people have already bought and consumed a product Purchase and
consumption however are not necessary for obtaining brand awareness and
perceived quality Nonetheless the dimensions of brand equity are causally
interrelated but as loyalty is tied to a brand brand loyalty is a dimension of
brand equity (Aaker 1991) We follow this approach in our research
Brand equity consequencesHaving conceptualized the dimensions of brand equity we now consider the
consequences of these constructs Specifically we discuss the effects on
market and profitability performance as well as on customer value and
provide a supporting logic for the proposed hypotheses
At this point it is important to note that goal divergences between
manufacturers and resellers in the value chain exist Indeed manufacturers
and resellers who compete for added value follow different goals in
allocating resources The main goal of resellers is to achieve profitability
and therefore this channel member is not interested in interbrand price wars
In contrast a manufacturer is primarily interested in generating cash flows
although profitability achievement is essential as well Hence the sales
volume in comparison to competing brands is important (Lassar 1998)
Recognizing these different objectives of channel members we focus on two
distinct types of performance measures
Brand profitability performance Profitability performance is used as an
indicator of the financial contribution of a brand to the profit of the reseller
Brand awareness is expected to be positively related to profitability
performance The underlying logic is that higher levels of awareness will
lead to higher levels of purchase Customers who are unaware of a brand are
unlikely to consider it in their purchasing decision
Several studies have examined the effect of perceived quality on profitability(eg Jacobson and Aaker 1987) Most prominent among the studies examining
the quality and performance relationship are the findings from PIMS-projects
such as Phillips et al (1983) who found a strong positive effect of quality on
return on investment Their findings were used as support in studies conducted
by Jacobson and Aaker (1987) A positive effect of perceived quality on stock
returns was also reported by Aaker and Jacobson (1994)
High levels of brand loyalty should substantially enhance sales of a brand
Loyal buyers are less affected by price competition Higher sales are
expected to increase brand profitability assuming no disproportionate
increase in expenses For example after break-even occupancy levels are
reached by hotels additional occupancy provides major contributions to
profit
We propose the following hypotheses in examining the relationship of brand
equity dimensions to profitability
H1a Brand awareness is positively related to brand profitability
performance
H1b Perceived quality is positively related to brand profitability
performance
H1c Brand loyalty is positively related to brand profitability performance
Brand market performance Brand market performance considers the
demand side of the market and refers to indicators such as sales volume and
G o a l d iv e rg e n c e s
B r a n d lo y a l t y
2 2 4 J O U R N A L O F P R O D U C T amp B R A N D M A N A G E M E N T V O L 1 2 N O 4 2 0 0 3
832019 Brand Equity Mgt
httpslidepdfcomreaderfullbrand-equity-mgt 617
market share (Lassar 1998) The relationship of brand equity dimensions
and brand market performance has received very limited research attention
Yet conceptual support is provided by Webster (2000) who argues that a
major benefit of brand equity is its positive impact on demand Brand
awareness quality and loyalty are expected to enhance brand market
performance These dimensions of brand equity help the organization to
attract and retain customers Due to the support of the manufacturer brand
associations in terms of brand awareness (eg co-op advertising displays)
can be established and therefore brand equity dimensions should be
positively associated with brand market performance The following
hypotheses consider these relationships
H2a Brand awareness is positively related to brand market performance
H2b Perceived quality is positively related to brand market performance
H2c Brand loyalty is positively related to brand market performance
Customer value There is some debate in the literature concerning the
difference between quality and value (Zeithaml 1988) Customer value is
defined as ``the consumerrsquos overall assessment of the utility of a productbased on perceptions of what is rec eived and what is givenrsquorsquo (Zeithaml 1988
p 14) According to Monroe and Krishnan (1985) and Dodds et al (1991)
perceived quality is positively related to perceived value Recognizing a
brand name or logo can lead to positive customer assessments in terms of
considering a product as good value for money or a good bargain A higher
level of brand awareness reduces the consideration set Also it is more likely
that customers will buy familiar products and are more willing to pay a price
premium Hence brand awareness should positively affect perceived value
A higher perceived quality for many people is the reason to buy a product
and some would also be willing to pay a price premium Brand loyalty
should positively impact customer value Loyal customers recognize thefavorable benefitcost opportunity Given these relationships we propose the
following hypotheses
H3a Brand awareness is positively related to customer value
H3b Perceived quality is positively related to customer value
H3c Brand loyalty is positively related to customer value
Purchase intention Executives recognize the importance of purchase
intentions as it is less expensive to retain existing customers instead of
prospecting for new ones (Spreng et al 1995) Customers who perceive
superior value are more likely to buy the same brand in the future (Aaker
1991) Hence there is an expected direct relationship between perceived
customer value and purchase intention Moreover high levels of purchase
intentions should enhance a brandrsquos market and profitability performance
The following hypotheses are offered
H4 Customer value is positively related to purchase intention
H5 Purchase intention is positively related to market performance
H6 Purchase intention is positively related to profitability performance
Methodology
Sampling design and data collection
Our research conducted in Europe examines a stage in the value chain that
is relatively unexplored in terms of brand equity and performance
Q u a li ty a n d v a lu e
E x e c u ti v e s
J O U R N A L O F P R O D U C T amp B R A N D M A N A G E M E N T V O L 1 2 N O 4 2 0 0 3 2 2 5
832019 Brand Equity Mgt
httpslidepdfcomreaderfullbrand-equity-mgt 717
relationships in general plusmn resellers of tiles[1] Specifically tiles are used in a
variety of construction applications though their main uses are for floor and
wall decorations Tiles are used for brand equity assessment since the
product is relatively homogenous and does not lend itself to multiple product
subcategories In Europe there is a high level of brand identity associated
with tiles Tiles are used for the same basic function and typically vary in
perceived quality and brand image Thus it is possible to assess the
dimensions of brand equity without having to control for a wide range of product variations
We selected tile resellers to solicit the most comprehensive assessment of
customer perceptions along with collecting measures of market performance
The perspectives of resellers provide unique insights since they act at the
customer and manufacturer interface Resellers possess knowledge regarding
the perceptions and preferences of their customers and also are aware of the
market performance and relative profitability of the suppliersrsquo brands that
they distribute Hence using responses from intermediaries provides an
opportunity for consideration of customer perceptions along with firm
performance
Based on existing literature and insight from experts we developed and
pretested a standardized questionnaire The questionnaires were mail
distributed to executives from 794 tile resellers in Austria carrying products
from manufacturers located in various countries We studied the perceptions
of Austrian tile resellers distributing tiles manufactured in Italy the Czech
Republic and Slovakia Because of Austriarsquos central location linking
Western Europe and the former Eastern European countries it was
considered as an appropriate research site to examine brand equity and its
consequences Also we were able to collect information from quasi-neutral
people about different brands produced by tile manufacturers from Italy the
Czech Republic and Slovakia Thus major manufacturers are represented
without adding substantial home country source bias The sample group wasderived from an industry list of companies and the ``golden pagesrsquorsquo of the
Austrian Chamber of Commerce
To enhance the response rate of our mail survey we provided pre-addressed
and pre-stamped envelopes assured anonymity and offered a summary of
the research findings as an incentive to the participants After several follow-
up procedures (eg telephone calls new mailings) responses from 189
executives were obtained Due to missing information the final sample
consisted of information from 154 managers In addition 30 questionnaires
were returned as undeliverable Considering this information we achieved a
20 per cent response rate Of these 154 managers 52 (338 per cent) assessed
the Italian 51 (331 per cent) the Czech and 51 (331 per cent) the Slovakian
brand Of the respondents 115 (747 per cent) were male and 39 (253 per
cent) female The median number of years the managers had been doing
business in the industry was 22
Non-response bias was examined using the method proposed by Armstrong
and Overton (1977) A viable check for non-response bias is to split the
sample into early and late respondents No significant differences at the 005
level between the two groups were found which leads us to conclude that
non-response bias is not a major issue
Scale construction
The scales used for both the elements and consequences of brand equity are
described in Table I
A s s e s s m e n t o f c u s t o m e r
p e r c e p t io n s
R e s p o n s e r a t e
2 2 6 J O U R N A L O F P R O D U C T amp B R A N D M A N A G E M E N T V O L 1 2 N O 4 2 0 0 3
832019 Brand Equity Mgt
httpslidepdfcomreaderfullbrand-equity-mgt 817
Construct
Scale items
Scale measure 1 strongly disagree
to 5 strongly agree unless noted Source
Standardized
loading t value
Brand awaren ess I know what X looks like Yoo et al 081 plusmn
Agrave2df = 48 I can recognize X among other brands (2000) 075 976
AGFI = 082 I am aware of X 071 913
CFI = 091
RMSEA = 010
Some characteristics of X come to my
mind quickly 071 994
I can quickly recall the symbol or logoof X 064 798
I have difficulty in imagining X in my
mind 061 756
Perceived quality X is of high quality Yoo et al 083 plusmn
Agrave2df = 26
AGFI = 085
The likelihood that X would be
functional is very high
(2000) and
Dodds et al 069 942
CFI = 095 X appears to be of very poor quality (1991) 059 765
RMSEA = 008
The likelihood that X is reliable is very
high 068 922
The workmanship of X would be high 069 941
X must be of very good quality 078 1104
The likelihood that X is dependable is
very high 080 1151
X seems to be durable 070 953Brand loyal ty I consider myself to be l oyal to X Yoo et al 082 plusmn
Agrave2df = 78 X would be my first choice (2000) and 062 684
AGFI = 084
CFI = 091
I will not buy other brands if X is
available at the wholesaler
Beatty and
Kahle
(1988) 043 473
RMSEA = 011
If X were not available at the wholesaler
it would make little difference to me if I
had to choose another brand 066 736
When another brand is on sale I will
generally purchase it rather than X 070 769
Brand profitability
performance
Agrave2df = 12
Compared to all other brands available
in our trade area the profitability for
carrying X is (1 = lowest-highest = 5)
Lassar
(1998)
086 plusmn
AGFI = 096
CFI = 099
RMSEA = 004
Relative to all other brands we carry the
realized margin for X is
(1 = lowest-
highest = 5) 079 936
Overall X is financially very attractive
for us 065 787
What percentage of your total profit
derived from the sale of tiles is
attributable to X (percentage value) 054 646
Brand market
performance
What percentage of your tile sales
volume is attributable to X ()
Lassar
(1998) 076 plusmn
Agrave2df = 014
AGFI = 099
Compared to all other tile brands we
carry X generates the larges sales volume 082 1004
CFI = 100
RMSEA lt 001
Relative to all other tile brands we carry
the sales potential for X is
(1 = lowest-highest = 5) 077 plusmn
Customerperceived value
Agrave2df = 511
My customers consider X to be
(1 = very poor value for money- very
good value for money = 7)
Dodds et al(1991)
065 plusmn
AGFI = 088
CFI = 094
RMSEA = 007
At the usual price my customers consider
X to be (1 = very uneconomical-very
economical = 7) 075 786
The product is considered to be a good
buy (1 = strongly disagree-strongly
agree = 7) 078 780
My customers consider the usual price for
X to be (1 = very unacceptable-very
acceptable = 7) 076 764
(continued)
Table I Scale development for constructs
J O U R N A L O F P R O D U C T amp B R A N D M A N A G E M E N T V O L 1 2 N O 4 2 0 0 3 2 2 7
832019 Brand Equity Mgt
httpslidepdfcomreaderfullbrand-equity-mgt 917
Perceived quality The scale for perceived quality is based on Dodds et al
(1991) Yoo et al (2000) employed perceived quality to address the overall
evaluation of quality and to avoid considering specific elements of quality
There are eight items in the scale for perceived quality The scale allows a
response from ``1rsquorsquo (strongly disagree) to ``5rsquorsquo (strongly agree) to statements
such as ``X is of high qualityrsquorsquo ``The likelihood that X is reliable is very
highrsquorsquo and ``The likelihood that X is dependable is very highrsquorsquo
Brand loyalty The scale for brand loyalty was developed by Beatty and
Kahle (1988) and has been adapted by Yoo et al (2000) The scale includes
five items With a five-point response scale ranging from ``1rsquorsquo (strongly
disagree) to ``5rsquorsquo (strongly agree) statements for the scale items include ``X
would be my first choicersquorsquo and ``I will not buy other brands if X is available
at the wholesalerrsquorsquo
Brand awareness The scale for brand awareness consists of six itemsdeveloped by Yoo et al (2000) Respondents used a five-point scale
anchored by ``1rsquorsquo (strongly disagree) to ``5rsquorsquo (strongly agree) to statements
ranging from ``I can recognize X among other brandsrsquorsquo to ``Some
characteristics of X come to my mind quicklyrsquorsquo
Brand profitability performance The scale for brand profitability
performance has four items as developed by Lassar (1998) Three of the
items allow a scale response such as ``Compared to all other brands
available in our trade area the profitability for carrying X is rsquorsquo with ``1rsquorsquo =
lowest plusmn highest = ``5rsquorsquo Another item asks ``What percentage of your total
profit derived from the sale of tiles is attributable to Xrsquorsquo Resellers are able to
make this assessment since the product offerings to the reseller are indeed
based upon the incentives offered to choose particular brands
Construct
Scale items
Scale measure 1 strongly disagree
to 5 strongly agree unless noted Source
Standardized
loading t value
X appears to my customers to be a
bargain (1 = strongly disagree-strongly
agree = 7) Del plusmn
My customers are satisfied when they buy
X (1 = strongly disagree-strongly
agree = 7) Del plusmnThe decision of customers to buy X is
confirmed (1 = strongly disagree-strongly
agree = 7) 069 609
Purchase intention
Agrave2df = 007
The likelihood that my customers
purchase X is (1 = very low-very
high = 7)
Dodds et al
(1991) 088 plusmn
AGFI = 099
CFI = 100
RMSEA lt 001
If a customer is going to buy X heshe
would consider buying X at the usual
price (1 = strongly disagree-strongly
agree = 7) Del plusmn
At the usual price my customers would
consider buying X (1 = strongly disagree-
strongly agree = 7) Del plusmn
The probability that my customersconsider buying X is (1 = very low-
very high = 7) 093 1922
The willingness of my customers to buy
X is (1 = very low-very high = 7) 089 plusmn
NotesaWhere X is the brand of interest AGFI = adjusted goodness of fit index
CFI = comparative fit index RMSEA = root mean square error of approximation
Table I
2 2 8 J O U R N A L O F P R O D U C T amp B R A N D M A N A G E M E N T V O L 1 2 N O 4 2 0 0 3
832019 Brand Equity Mgt
httpslidepdfcomreaderfullbrand-equity-mgt 1017
Brand market performance We employ brand sales volume as a measure of
market performance and use the three-item scale developed by Lassar
(1998) One item asks for the percentage of sales volume attributable to X
The other two items are scale responses ``Compared to all other tile brands
we carry X generates the largest sales volumersquorsquo (1 = strongly disagree plusmn
strongly agree = 5) and ``Relative to all other tile brands we carry the sales
potential for X is rsquorsquo (1 = lowest plusmn highest = 5)
Customer perceived value Based on the conceptualization of perceived
value as a trade-off between benefits and sacrifices (costs) the scale for
customer perceived value is obtained from Dodds et al (1991) This scale
uses seven-point responses and the seven statements included relate to items
such as value for money and satisfaction ``The product is considered to be a
good buyrsquorsquo (1 = strongly disagree plusmn strongly agree = 7) and ``My customers
are satisfied when they buyrsquorsquo (1 = strongly disagree plusmn strongly agree = 7)
Purchase intention Purchase intention includes five items such as ``The
likelihood that my customers purchase X is (1 = very low plusmn very high = 7)
and ``At the usual price my customers would consider buying Xrsquorsquo (1 =
strongly disagree plusmn strongly agree = 7) This scale is based on Dodds et al(1991)
Reliability and validity assessments
Given the multiple-item nature of the scales used in this research we
assessed their psychometric properties following the recommendations of
Churchill (1979) and Gerbing and Anderson (1988) First each scale was
subjected to exploratory factor analysis loading on the dominant factor (at
least at 05) with a sum of the items in the factor explaining more that 50 per
cent of the factorrsquos variance Second reliability analyses were conducted
(Cronbach 1951) The alpha coefficients range from 080 to 093 and are
well above the 070 level suggested by Nunnally (1978) Third based onGerbing and Anderson (1988) we also performed confirmatory factor
analysis (CFA) using maximum likelihood estimation procedures for
measure validation The results indicate both acceptable model fits and item
properties and are shown in Table I The overall model fit indices chi-
squaredegrees of freedom adjusted goodness of fit index (AGFI)
comparative fit index (CFI) and root mean square error of approximation
(RMSEA) indicate acceptable model fits All items significantly load on
their corresponding construct (lowest t -value is 473) demonstrating
adequate convergent validity
Following the recommendations of Bagozzi et al (1991) pairwise
comparisons of the constructs within our models were conducted to examineconvergent and discriminate validity We arranged the measures into
subgroups with the first measurement model comprising the brand equity
constructs and the second measurement model consisting of the
consequences constructs All latent-trait correlations are significantly
different at one because each phi-value plus or minus twice the standard
error does not include one thus indicating discriminant validity Tables I
and II provide the summary statistics for the constructs used in testing the
hypotheses Table III shows the correlations within the constructs
To summarize the psychometric properties of the measures are acceptable
For further analyses the individual items of each measure were combined by
calculating the arithmetic means The items relating to reseller performance
were first standardized
B e n e fit s a n d s a c r if ic e s
P a ir w i s e c o m p a ri s o n s
J O U R N A L O F P R O D U C T amp B R A N D M A N A G E M E N T V O L 1 2 N O 4 2 0 0 3 2 2 9
832019 Brand Equity Mgt
httpslidepdfcomreaderfullbrand-equity-mgt 1117
Analysis and results
The primary tests of the hypotheses employed (linear) single and multiple
regression analysis (Cohen and Cohen 1983) The findings obtained from
these analyses are reported in Table IV Both single and multiple regression
analyses results show significant ( p lt 001) F -values (lowest F -value 1142)
indicating good overall model fit Examining the magnitude of the adjusted
R-squared value also leads us to conclude that acceptable amounts of the
variance of the dependent variables can be explained (lowest R-squared
017) Multicollinearity was not a problem as the variance inflation factors
are well below the critical level of 10 All of the coefficients are significant
at p lt 001 with the exception of one coefficient (brand awareness) in one
model which is significant at p lt 005 Moreover the coefficients are all
positive as hypothesized
In the first model the three brand equity dimensions brand awareness (016)
perceived quality (028) and brand loyalty (033) are significant predictors
of brand profitability performance Together the three predictors explain 34
percent of the variation in profitability performance Therefore strong
support for the first three hypotheses ( H1a-H1c) is found
Using brand market performance as the dependent variable the standardized
coefficients (brand awareness 018 perceived quality 022 brand loyalty
034) of the independent variables are significant which supports H2a H2b
and H2c
Of the variance of customer value 31 per cent is explained by the three
brand equity dimensions The estimated standardized coefficients of the
three independent variables (brand awareness 018 perceived quality 021
brand loyalty 019) are all significant Hence support is found for H3a H3b
and H3c
Performing single regression analyses the findings indicate a significant
relationship between customer value and purchase intention (coefficient
054) which supports H4 Also when purchase intention is regressed on
brand market performance (coefficient 062) and brand profitability
performance (coefficient 055) significant results are obtained Therefore
the analyses provide strong support for H5 and H6
Conclusion and implications
The objective of this study was to investigate the effects of using measures of
brand equity as indicators of performance Perceived quality brand loyalty
and brand association were selected as measures of brand equity Results
indicate that all three measures are significant predictors of performance
Constructs (number of items)
Coefficient
alphas
Mean
(standard deviation) Range
Brand awareness (6) 086 394 (081) 100-500
Perceived quality (8) 090 351 (067) 163-500
Brand loyalty (4) 080 241 (086) 100-440
Brand profitability (4)a
080 na na
Brand market performance (3)a
083 na na
Customer perceived value (8) 087 430 (102) 117-683Purchase intention (3) 093 320 (128) 100-667
Notes na = not applicable adue to different scales used as measures for the items thescale was standardized
Table II Summary statistics for constructs
E q u it y d im e n s i o n s
R e g re s s io n a n a ly s e s
2 3 0 J O U R N A L O F P R O D U C T amp B R A N D M A N A G E M E N T V O L 1 2 N O 4 2 0 0 3
832019 Brand Equity Mgt
httpslidepdfcomreaderfullbrand-equity-mgt 1217
B r a n d a w a r e n e s s
P e r c e i v e d q u a l i t y
B r a n d l o y a l t y
B r a n d
p r o f i t a b i l i t y
B r a n d s a l e s
v o l u m e
C u s t o m e r
p e r c e i v e d v a l u
e
P u r c h a s e i n t e n t i o n
B r a n d
a w a r e n e s s
P e r c e i v e d q u a l i t y
0 2
2
B r a n d
l o y a l t y
0 3
4
0 4
6
B r a n d
p r o f i t a b i l i t y p e r f o r m a n c e
0 3
4
0 4
7
0 5
2
B r a n d
m a r k e t p e r f o r m a n c e
0 3
9
0 4
1
0 5
0
0 7
0
C u s t o
m e r p e r c e i v e d v a l u e
0 2
9
0 3
3
0 3
5
0 3
8
0 3
1
P u r c h
a s e i n t e n t i o n
0 3
4
0 4
7
0 5
2
0 5
5
0 6
2
0 5
4
N o t e s
A l l c o r r e l a t i o n s s i g n i f i c a n t a t p lt 0 0
1
T a b l e
I I I C o r r e l a t i o n c o e f f i c i e n t s b y c o n s t r u c t
J O U R N A L O F P R O D U C T amp B R A N D M A N A G E M E N T V O L 1 2 N O 4 2 0 0 3 2 3 1
832019 Brand Equity Mgt
httpslidepdfcomreaderfullbrand-equity-mgt 1317
measures This was true for all three indicators of performance brand
profitability brand sales volume and customer perceived value
The standardized coefficients from the regression analysis in Table IV
provide some indication of the relative importance of the three brand equity
measures as predictors of performance Intercorrelations exist among the
measures as brand awareness and perceived quality will ultimately affect
brand loyalty The standardized coefficients reflect this relationship since the
coefficient for brand loyalty is almost double that of brand awareness
Loyalty is an important predictor of performance Given the difficulty in
selecting a parsimonious yet comprehensive set of performance measures
managers might consider the greater potential information content of ameasure such as brand loyalty
Building brand loyalty is an actionable initiative for manufacturers Possible
actions include creating a reason-to-buy differentiationpositioning creating
value chain member interest and making brand extensions (eg new tile
designs) (Aaker 1991) Brand loyalty increase can be measured on a
longitudinal basis Our research supports the relevance of tracking resellersrsquo
perceptions of brand loyalty
The brand equity constructs have been validated in previous research and
our study lends support to these scales from a unique perspective in the value
chain plusmn resellers The significance of the brand equity measures has
important implications for developing measures of other intangible assetsOur results supported a relationship between non-financial measures and
indicators of performance Without a link to performance the measures are
unlikely to generate results that support the strategic objectives of a firm
A major implication of our research results refers to strategic channel
partnerships (Narus and Anderson 1986) Given the positive relationships
among channel partners the sacrifices and benefits of manufacturers and
resellers have to be assessed and continually developed Although not
examined in this research problems of channel conflict like power or
opportunism are also of central issue (Webster 2000) More importantly as
the new economy compels less traditional and more cooperative ways of
conducting business it is essential to consider the impact of these
cooperative ventures on performance measurement
Dependent variables
Independent
variables
Standardized
- -coefficient
(t-value) F -value
Adjusted
R2
Brand profitability performance Brand awareness 016 (233) 2776 034
Perceived quality 028 (376)
Brand loyalty 033 (435)
Brand market perf or mance Brand awar eness 018 (250) 2334 031
Perceived quality 022 (284)Brand loyalty 034 (427)
Customer perceived value Brand awareness 018 (227) 1142 017
Perceived quality 021 (246)
Brand loyalty 019 (222)
Purchase intention Customer
p ercei ved v alu e 05 4 (79 3) 6 29 3 0 2 9
Brand market performance Purchase intention 062 (963) 9266 038
Brand profitability performance Purchase intention 055 (802) 6436 029
Notes Significant at p lt 001 unless noted Significant at p = 005
Table IV Results of single and multiple regression analysis
In it ia ti v e fo r m a n u fa c t u r e rs
R e s e a r c h r e s u lt s
2 3 2 J O U R N A L O F P R O D U C T amp B R A N D M A N A G E M E N T V O L 1 2 N O 4 2 0 0 3
832019 Brand Equity Mgt
httpslidepdfcomreaderfullbrand-equity-mgt 1417
It is apparent from the study results that factors other than brand equity also
impact performance since the variations in performance explained by brand
equity ranges from 17 to 34 percent (Table IV R-squared values) Brand
equity is an important predictor of performance but other factors such as
competition prices and expenses also impact performance A shortcoming
of our research is the focus on cross-sectional data Hence we are not able to
explore the long-term effects of brand equity on performance Clearly future
studies could refer to longitudinal data Tracking at the reseller level of the
value chain should be more feasible than end-user tracking of brand equity
The reliance on subjective information in our study might be a matter of
concern as well While brand equity from a customer-based perspective and
perceived customer value require quasi subjective information by definition
an alternative view might suggest that objective assessments are necessary
with respect to performance measures However Dess and Robinson (1984)
found no significant differences comparing the validity of subjective and
objective performance measures Nonetheless in future research the model
could be replicated using more objective performance data
Note
1 We term these intermediaries resellers as they distribute the products (tiles) to both
businesses and customers
References
Aaker DA (1989) ``Managing assets and skills the key to a sustainable competitive
advantagersquorsquo California Management Review Vol 32 Winter pp 91-106
Aaker DA (1991) Managing Brand Equity The Free Press New York NY
Aaker DA (1996a) Building Strong Brands The Free Press New York NY
Aaker DA (1996b) ``Measuring brand equity across products and marketsrsquorsquo California
Management Review Vol 38 No 3 pp 102-20Aaker DA and Jacobson R (1994) ``The financial information content of perceived
qualityrsquorsquo Journal of Marketing Research Vol 31 pp 191-201
Armstrong JS and Overton TS (1977) ` Estimating non-response bias in mail surveysrsquorsquo
Journal of Marketing Research Vol 14 August pp 396-402
Bagozzi RP Yi Y and Phillips LW (1991) ``Assessing construct validity in organizational
researchrsquorsquo Administrative Science Quarterly Vol 36 September pp 421-58
Barth ME Clement MB Foster G and Kasznik R (1998) ` Brand values and capital
market valuationrsquorsquo Review of Accounting Studies Vol 3 pp 41-68
Barwise P (1993) ``Brand equity snark or boojumrsquorsquo International Journal of Research in
Marketing Vol 10 March pp 93-104
Barwise P Higson C Likierman A and Marsh P (1989) Accounting for Brands London
Business School and the Institute of Chartered Accountants in England and Wales
London
Beatty SE and Kahle LR (1988) ``Alternative hierarchies of the attitude-behavior
relationship the impact of brand commitment and habitrsquorsquo Journal of the Academy of
Marketing Science Vol 16 Summer pp 1-10
Churchill GA Jr (1979) ` A paradigm for developing better m easures of marketing
constructsrsquorsquo Journal of Marketing Research Vol 16 February pp 64-73
Cohen J and Cohen P (1983) Applied Multiple RegressionCorrelation Analysis for the
Behavioral Sciences (2nd ed) Lawrence Erlbaum Associates Hillsdale NJ
Cronbach LJ (1951) ``Coefficient alpha and the internal structure of testsrsquorsquo Psychometrika
Vol 16 September pp 297-334
Dess GG and Robinson RB (1984) ``Measuring organizational performance in the absence
of objective measures the case of privately-held firm and conglomerate business unitrsquorsquo
Strategic Management Journal Vol 5 pp 265-73
S u b je c t iv e in fo r m a t io n
J O U R N A L O F P R O D U C T amp B R A N D M A N A G E M E N T V O L 1 2 N O 4 2 0 0 3 2 3 3
832019 Brand Equity Mgt
httpslidepdfcomreaderfullbrand-equity-mgt 1517
Dodds WB Monroe KB and Grewal D (1991) ` Effects of price brand and store
information on buyersrsquo product evaluationrsquorsquo Journal of Marketing Research Vol 28
August pp 307-19
Gerbing DW and Anderson JC (1988) ` An updated paradigm for s cale development
incorporating unidimensionality and its assess mentrsquorsquo Journal of Marketing Research
Vol 25 May pp 186-92
Grover R and Srinivasan V (1992) ``Evaluating the multiple effects of retail promotions on
brand-loyal and brand-switching segmentsrsquorsquo Journal of Marketing Research Vol 18
February pp 76-89
Hoyer W D and Brown SP (1990) ``Effects of brand awareness on choice for a common
repeat purchase productrsquorsquo Journal of Consumer Research Vol 17 pp 141-8
Jacobson R and Aaker DA (1987) ``The strategic role of product qualityrsquorsquo Journal of
Marketing Vol 51 October pp 31-44
Kaplan RS and Johnson T (1987) Relevance Lost The Rise and Fall of Management
Accounting Harvard Business School Press Boston MA
Keller KL (1993) ``Conceptualizing measuring and managing customer-based brand
equityrsquorsquo Journal of Marketing Vol 57 January pp 1-22
Keller KL (1998) Building Measuring and Managing Brand Equity Prentice Hall
Englewood Cliffs NJ
Lane V and Jacobson R (1995) ``Stock market reactions to brand extension announcements
the effects of brand attitude and familiarityrsquorsquo Journal of Marketing Vol 59 January
pp 63-77
Lassar WM (1998) ``Control systems in supplier-retailer relationships and their impact on
brand performancersquorsquo Journal of Retailing and Consumer Services Vol 5 No 2 pp 65-75
Monroe KB and Krishnan R (1985) ` The effect of price on s ubjective product
evaluationsrsquorsquo in Jacoby J and Olson J (Eds) Perceived Quality Lexington Books
Lexington MA pp 209-32
Narus JA and Anderson JC (1986) ` Turn your industrial distributors into partnersrsquorsquo
Harvard Business Review Vol 64 MarchApril pp 66-71
Nunnally JC (1978) Psychometric Theory 2nd ed McGraw-Hill New York NY
Oliver RL (1997) Satisfaction A Behavioral Perspective on the Consumer McGraw-Hill
New York NY
Phillips LW Chang DR and Buzzell RD (1983) ``Product quality cost position and
business performance a test of some key hypothesesrsquorsquo Journal of Marketing Vol 47
Spring pp 26-43
Shocker AD Srivastava RK and Ruekert RW (1994) ``Challenges and opportunities
facing brand management an introduction to the special issuersquorsquo Journal of Marketing
Research Vol 31 pp 149-58
Spreng RA Harrell GD and Mackoy RD (1995) ` Service recovery impact on
satisfaction and intentionsrsquorsquo Journal of Service Marketing Vol 9 No 1 pp 15-23
Webster FE (2000) ` Understanding the relationships among brands consumers and
resellersrsquorsquo Journal of the Academy of Marketing Science Vol 28 No 1 pp 17-23
Yoo B and Donthu N (2001) ` Developing and validating a multidimensional consumer-
based brand equity scalersquorsquo Journal of Business Research Vol 52 pp 1-14
Yoo B Donthu N and Lee S (2000) ``An examination of selected marketing mix elements
and brand equityrsquorsquo Journal of the Academy of Marketing Science Vol 28 No 2
pp 195-211
Zeithaml VA (1988) ``Consumer perceptions of price quality and value a means-end
model and synthesis of evidencersquorsquo Journal of Marketing Vol 52 July pp 2-22
amp
2 3 4 J O U R N A L O F P R O D U C T amp B R A N D M A N A G E M E N T V O L 1 2 N O 4 2 0 0 3
832019 Brand Equity Mgt
httpslidepdfcomreaderfullbrand-equity-mgt 1617
Executive summary and implications for managers andexecutives
Brand investment benefits sales and the firmrsquos value
The debate around brand equity and brand valuation has in many ways
settled into two camps plusmn the consumer-based approach (mostly marketers)
and the aggregate sales approach (mostly accountants) I appreciate that
this is a gross over-simplification of the distinction between different approaches and that many models (and much of current theory) endeavour
to join together the two approaches However it is important for marketers
to appreciate that they have yet to fully convince others of the validity of
consumer-based approaches to the measurement of brand equity
Baldauf e t a l set out to produce further validation of the consumer-based
model by examining how the dimensions of brand equity are antecedents of
firm performance and especially sales and profitability This consideration is
important since much of the brand valuation debate concerns the treatment
of the brand on the balance sheet rather than its impact on the profit and loss
account And while marketers will always argue that brands are important
intangible assets (thereby meriting inclusion within the balance sheet) muchof our work as marketers is intended to influence sales and profitability
The antecedents of brand equity
Baldauf Cravens and Binder draw on Aakerrsquos model of brand equity in their
study focusing on the three most important antecedents of brand equity plusmn
brand loyalty brand awareness and perceived quality Aakerrsquos argument is
that where a brand has loyal customers high levels of market awareness and
is perceived to be of high quality it will have a high level of equity plusmn it is
more valuable to the firm
This means that the firmrsquos strategy needs to address each antecedent plusmn
focusing on one or other element will not necessarily deliver brand value However given that we are concerned here with the effect on sales volumes
and profits we need to ask whether achieving positive effect in this area
requires a different balance within the strategy Indeed there could
conceivably be a conflict between strategies aimed at increasing the firmrsquos
value (a balance sheet strategy) and strategies aimed at increasing sales (a
profit and loss strategy)
There is a concern that the latter approach to strategy can result in a sales
promotion led approach to marketing as a complement to the corporate
focus on cash flow and short-term profits Therefore being able to
demonstrate that strategies aimed at increasing brand value also produce
short-term benefits in terms of sales and profitability means being able to justify important brand strategies in a climate of short-term focus
Brand equity is not the only thing influencing performance
While brand strategies are important we have to recognise (and Baldauf
et al remind us) that performance is not solely influenced by brand equity
Marketers have to pay attention to other factors and especially to issues
often dismissed as tactical or mere implementation The marketing director
who fails to appreciate that tactical errors and sloppy implementation can
wreck a strategy should not keep his job
Baldauf et al identify three influences other than brand equity plusmn competition
pricing and expenses Since these clearly have an impact on performance
any marketing strategy needs to be flexible enough and the firm needs also to
J O U R N A L O F P R O D U C T amp B R A N D M A N A G E M E N T V O L 1 2 N O 4 2 0 0 3 2 3 5
T h is s u m m a ry h a s b e e n
p r o v id e d t o a ll o w m a n a g e r s
a n d e x e c u t i v e s a r a p id
a p p r e c i a ti o n o f t h e c o n t e n t
o f t h is a r ti c le T h o s e w it h a
p a r t ic u la r in t e r e s t i n t h e
t o p ic c o v e r e d m a y t h e n r e a d
t h e a r t ic l e i n t o t o t o t a k e a d v a n t a g e o f t h e m o r e
c o m p r e h e n s i v e d e s c r i p ti o n
o f t h e r e s e a r c h u n d e rt a k e n
a n d it s r e s u lt s t o g e t t h e fu ll
b e n e fit o f t h e m a t e r ia l
p r e s e n t
832019 Brand Equity Mgt
httpslidepdfcomreaderfullbrand-equity-mgt 1717
pay attention to its performance in terms of cost containment In addition the
impact of pricing and competition requires a regular reality check against
what is actually happening in the market
However too many firms concentrate on these other issues and respond to
market changes by fine tuning tactics undertaking reactive sales promotions
and trimming costs Often the equally important task of developing brand
equity gets lost in the tactical war with competitors plusmn firms must remember that investing in brand equity has a direct impact on sales (elsewhere in this
issue of JPBM Ataman and U Egrave lengin provide a substantive assessment of this
impact) as well as contributing plusmn accounting approaches allowed plusmn to the
firmrsquos overall value
Brand equity strategies plusmn options
We have noted that the dominant elements of Aakerrsquos brand equity model are
brand loyalty brand awareness and perceived quality but this does not
provide us with a direct guide to the setting of strategies Aaker also included
in his model brand associations and other proprietary assets such as
intellectual property and for some brands these considerations are of
considerable importance
The brand strategy first strikes a balance between investing in awareness plusmn
telling people about the brand plusmn and investing in brand loyalty and repeat
purchase While it remains the case that securing repeat purchase is (all
things being equal) more easy than recruiting a new customer we cannot
overlook the need to maintain and extend our brandrsquos position within the
portfolio of brands from which the consumer chooses
Brand investment therefore should consist of general advertising primarily
aimed at building brand awareness and merchandising sales promotions
direct marketing and packaging that reinforces the choice made by
consumers The price details of the mix depend on the stability of marketsrates of market growth or decline competitor activity and the tactical
demands of distribution channels (and especially retailers)
Baldauf et al provide further evidence that brand investment contributes to
overall firm performance and while such investment should not be to the
exclusion of other factors (price c ompetition etc) that affect performance it
is a central element of successful consumer goods marketing What is very
clear is that investing in the brand is about sales and profits as well as the
overall value of the brand itself
(A preAcirccis of the article ``Performance c onsequences of brand equity
management evidence from organizations in the value chainrsquorsquo Supplied byMarketing Consultants for Emerald)
832019 Brand Equity Mgt
httpslidepdfcomreaderfullbrand-equity-mgt 217
management is knowledgeable about brand equity strength it can use this
information together with financial databases to develop appropriate
incentive plans and brand management programs (Aaker 1996b)
We examine one particular intangible asset plusmn the equity of the organizationrsquos
brands plusmn since for a significant number of firms the brand is the central asset of
the company (Aaker 1996a Barwise 1993 Shocker et al 1994) Our research
is intended to provide evidence as to the efficacy of using specific brand equitymeasures to evaluate financial performance Specifically the research objective
is to consider whether dimensions of brand equity are important antecedents of
firm performance such as sales and profitability Moreover as customers
ultimately decide about a firmrsquos success or failure we also examine the linkage
between brand equity dimensions and value to customers
We begin our investigation by examining the conceptual foundations for
brand equity and performance and develop the specific directional
hypotheses tested The methodology section contains the sampling plan the
construct measures used in our study of Austrian managers and analytical
issues We present the results of the empirical study and conclude with
implications and suggestions for future research
Conceptual foundations and research hypotheses
Our research considers a segment of Aakerrsquos (1991) original framework of
brand equity which proposes that various organizational efforts contribute to
developing the dimensions of brand equity These dimensions of brand
equity then have a positive impact on providing value to the firm as well as
to the customer For example a brand with strong equity can be leveraged to
launch new products and serves as a cue in repeat purchases In this research
we test the portion of the model that focuses on the effect of the dimensions
of brand equity in providing value The underlying conceptual logic of a
strong brand equity is that it is an asset which is expected to enhance
customer value increase customersrsquo purchase intentions and increase the
organizationrsquos market performance Brand equity reflects the price premium
of a strong brand in combination with the sales it attracts compared to an
average brand (Aaker 1996a Barwise et al 1989)
Figure 1 shows potential antecedents and consequences of brand equity
(Aaker 1991 p 17) Aaker (1991 p 17) notes that specific antecedents of
Figure 1 Antecedents and consequences of brand equity
In t a n g i b le a s s e t
B r a n d e q u i t y
J O U R N A L O F P R O D U C T amp B R A N D M A N A G E M E N T V O L 1 2 N O 4 2 0 0 3 2 2 1
832019 Brand Equity Mgt
httpslidepdfcomreaderfullbrand-equity-mgt 317
brand equity comprise brand loyalty brand awareness perceived quality
brand associations and other proprietary assets Together these dimensions
most succinctly represent the assets or liabilities that are linked to a brand its
name or symbol The resulting brand equity thus provides a basis for
strategic initiatives which create value directly for customers and the firm In
addition by providing value to customers brand equity indirectly enhances
value to the firm Aaker (1991 p 17) describes how brand equity enhances
value to customers in terms of their processing and interpretation of
information confidence in the purchasing decision and use satisfaction
Brand equity and customer value in turn provide value to the firm by
enhancing ``efficiency and effectiveness of marketing programs brand
loyalty pricesmargins brand extensions trade leverage and competitive
advantagersquorsquo (Aaker 1991 p 17)
Yoo et al (2000) build on Aakerrsquos (1991 p 17) basic model to incorporate
the brand-building efforts that influence the various dimensions of brand
equity and are also influenced by the provision of value to the firm Yooet al
add a separate construct of brand equity that was not present in Aakerrsquos
original model The major focus of Yoo et alrsquos (2000) research was to
explore the brand-building efforts and the resulting effect on the dimensions
of brand equity They investigated the effects of price store image
distribution intensity advertising spending and price deals on three
particular dimensions of brand equity perceived quality brand loyalty and
brand awareness We continue the focus on these three dimensions of brand
equity
We examine whether the brand awareness brand loyalty and perceived
quality dimensions of brand equity do affect performance as conceptualized
by brand profitability performance brand market performance and customer
perceived value These are core equity dimensions and are expected to be
relevant predictors of value We also include in the model the ultimate test of perceived value in terms of the customersrsquo purchase intention Intention to
purchase is an indication of how likely the customer will purchase the brand
(ranging from definitely will buy to definitely will not buy) If the perception
of the brandrsquos value is favorable and the customers indicate purchase
intention a purchase of the product or service will generate brand
profitability and market performance The conceptual model which guides
our study is shown in Figure 2
The brand equity dimensions of perceived quality brand loyalty and brand
awareness are proposed as antecedents to brand profitability and brand sales
Figure 2 The effect of brand equity dimensions on performance
B r a n d -b u il d i n g
P e rf o r m a n c e
2 2 2 J O U R N A L O F P R O D U C T amp B R A N D M A N A G E M E N T V O L 1 2 N O 4 2 0 0 3
832019 Brand Equity Mgt
httpslidepdfcomreaderfullbrand-equity-mgt 417
volume Two customer oriented value components are incorporated
perceived customer value and purchase intention The research model
focuses on a special stage in the value chain plusmn resellers This is an important
perspective on brand equity which has not received research attention
Hence these resellers will assess the dimensions of brand equity from their
perspective They will also indicate their perceptions concerning customer
value provided and willingness to buy as well as their firmsrsquo market and
profitability performance (the value to the trade)
Brand equity dimensions
The three dimensions of brand equity that we examine are also predicted to
affect performance through the overall positive effect of brand equity As
brand equity increases the firm is expected to enjoy a positive financial
return and the customer receives higher value (Aaker 1991 Aaker and
Jacobson 1994 Keller 1998 Lane and Jacobson 1995) Instead of
considering a single construct of brand equity we propose to focus on the
separate dimensions of brand equity as contributing to performance
Previous research has validated the dimensions of brand awareness
perceived quality and brand loyalty as relating to a higher order construct of brand equity (Yoo et al 2000 Yoo and Donthu 2001)
Brand awareness A major goal of brand management is developing and
maintaining brand awareness because of the impact of awareness on
consumer decision making and overall effect on firm values Brand
awareness is defined as ``the ability for a buyer to recognize or recall that a
brand is a member of a certain product categoryrsquorsquo (Aaker 1991 p 61)
Generating and maintaining brand awareness is important as only those
brands of which customers are aware enter into the consideration set of
brands for possible purchase and brand awareness influences the selection of
products from the consideration set (Hoyer and Brown 1990) Hence only
brands which customers recognize can be identified categorized andultimately purchased
Perceived quality Perceived quality is another dimension of brand value that
ultimately compels the consumer to select a good or service to purchase
(Aaker 1991 Zeithaml 1988) Notably product quality is a firmrsquos essential
resource for achieving competitive advantage (Aaker 1989) Perceived
quality is defined as the consumerrsquos judgment (perception) about a productrsquos
overall excellence or superiority with reference to substitutes (Aaker 1991
Zeithaml 1988) Hence perceived quality is the ``perceived ability of a
product to provide satisfaction `relativersquo to the available alternativesrsquorsquo
(Monroe and Krishnan 1985 p 212) Since the selection of important
attributes and comparison standards for a product are chosen by anindividual quality is not an objective measure Consequently quality
assessment is subjective (Zeithaml 1988)
Brand loyalty Brand loyalty is defined as ``a deeply held commitment to
rebuy or repatronize a preferred product or service consistently in the future
despite situational influences and marketing efforts having the potential to
cause switching behaviorrsquorsquo (Oliver 1997 p 392) An important
characteristic of loyal customers is that they consistently favor a brand and
refrain from switching to other brands (Grover and Srinivasan 1992)
Both Aaker (1991) and Keller (1993) discuss brand loyalty in their
conceptualizations though from somewhat different perspectives Aaker (1991)
notes the differences of brand loyalty from the other brand equity dimensions
because of its connection to the usage experience Loyalty develops via brand
T h r e e d im e n s io n s
B r a n d v a lu e
J O U R N A L O F P R O D U C T amp B R A N D M A N A G E M E N T V O L 1 2 N O 4 2 0 0 3 2 2 3
832019 Brand Equity Mgt
httpslidepdfcomreaderfullbrand-equity-mgt 517
usage In contrast to brand awareness or perceived quality brand loyalty only
exists if people have already bought and consumed a product Purchase and
consumption however are not necessary for obtaining brand awareness and
perceived quality Nonetheless the dimensions of brand equity are causally
interrelated but as loyalty is tied to a brand brand loyalty is a dimension of
brand equity (Aaker 1991) We follow this approach in our research
Brand equity consequencesHaving conceptualized the dimensions of brand equity we now consider the
consequences of these constructs Specifically we discuss the effects on
market and profitability performance as well as on customer value and
provide a supporting logic for the proposed hypotheses
At this point it is important to note that goal divergences between
manufacturers and resellers in the value chain exist Indeed manufacturers
and resellers who compete for added value follow different goals in
allocating resources The main goal of resellers is to achieve profitability
and therefore this channel member is not interested in interbrand price wars
In contrast a manufacturer is primarily interested in generating cash flows
although profitability achievement is essential as well Hence the sales
volume in comparison to competing brands is important (Lassar 1998)
Recognizing these different objectives of channel members we focus on two
distinct types of performance measures
Brand profitability performance Profitability performance is used as an
indicator of the financial contribution of a brand to the profit of the reseller
Brand awareness is expected to be positively related to profitability
performance The underlying logic is that higher levels of awareness will
lead to higher levels of purchase Customers who are unaware of a brand are
unlikely to consider it in their purchasing decision
Several studies have examined the effect of perceived quality on profitability(eg Jacobson and Aaker 1987) Most prominent among the studies examining
the quality and performance relationship are the findings from PIMS-projects
such as Phillips et al (1983) who found a strong positive effect of quality on
return on investment Their findings were used as support in studies conducted
by Jacobson and Aaker (1987) A positive effect of perceived quality on stock
returns was also reported by Aaker and Jacobson (1994)
High levels of brand loyalty should substantially enhance sales of a brand
Loyal buyers are less affected by price competition Higher sales are
expected to increase brand profitability assuming no disproportionate
increase in expenses For example after break-even occupancy levels are
reached by hotels additional occupancy provides major contributions to
profit
We propose the following hypotheses in examining the relationship of brand
equity dimensions to profitability
H1a Brand awareness is positively related to brand profitability
performance
H1b Perceived quality is positively related to brand profitability
performance
H1c Brand loyalty is positively related to brand profitability performance
Brand market performance Brand market performance considers the
demand side of the market and refers to indicators such as sales volume and
G o a l d iv e rg e n c e s
B r a n d lo y a l t y
2 2 4 J O U R N A L O F P R O D U C T amp B R A N D M A N A G E M E N T V O L 1 2 N O 4 2 0 0 3
832019 Brand Equity Mgt
httpslidepdfcomreaderfullbrand-equity-mgt 617
market share (Lassar 1998) The relationship of brand equity dimensions
and brand market performance has received very limited research attention
Yet conceptual support is provided by Webster (2000) who argues that a
major benefit of brand equity is its positive impact on demand Brand
awareness quality and loyalty are expected to enhance brand market
performance These dimensions of brand equity help the organization to
attract and retain customers Due to the support of the manufacturer brand
associations in terms of brand awareness (eg co-op advertising displays)
can be established and therefore brand equity dimensions should be
positively associated with brand market performance The following
hypotheses consider these relationships
H2a Brand awareness is positively related to brand market performance
H2b Perceived quality is positively related to brand market performance
H2c Brand loyalty is positively related to brand market performance
Customer value There is some debate in the literature concerning the
difference between quality and value (Zeithaml 1988) Customer value is
defined as ``the consumerrsquos overall assessment of the utility of a productbased on perceptions of what is rec eived and what is givenrsquorsquo (Zeithaml 1988
p 14) According to Monroe and Krishnan (1985) and Dodds et al (1991)
perceived quality is positively related to perceived value Recognizing a
brand name or logo can lead to positive customer assessments in terms of
considering a product as good value for money or a good bargain A higher
level of brand awareness reduces the consideration set Also it is more likely
that customers will buy familiar products and are more willing to pay a price
premium Hence brand awareness should positively affect perceived value
A higher perceived quality for many people is the reason to buy a product
and some would also be willing to pay a price premium Brand loyalty
should positively impact customer value Loyal customers recognize thefavorable benefitcost opportunity Given these relationships we propose the
following hypotheses
H3a Brand awareness is positively related to customer value
H3b Perceived quality is positively related to customer value
H3c Brand loyalty is positively related to customer value
Purchase intention Executives recognize the importance of purchase
intentions as it is less expensive to retain existing customers instead of
prospecting for new ones (Spreng et al 1995) Customers who perceive
superior value are more likely to buy the same brand in the future (Aaker
1991) Hence there is an expected direct relationship between perceived
customer value and purchase intention Moreover high levels of purchase
intentions should enhance a brandrsquos market and profitability performance
The following hypotheses are offered
H4 Customer value is positively related to purchase intention
H5 Purchase intention is positively related to market performance
H6 Purchase intention is positively related to profitability performance
Methodology
Sampling design and data collection
Our research conducted in Europe examines a stage in the value chain that
is relatively unexplored in terms of brand equity and performance
Q u a li ty a n d v a lu e
E x e c u ti v e s
J O U R N A L O F P R O D U C T amp B R A N D M A N A G E M E N T V O L 1 2 N O 4 2 0 0 3 2 2 5
832019 Brand Equity Mgt
httpslidepdfcomreaderfullbrand-equity-mgt 717
relationships in general plusmn resellers of tiles[1] Specifically tiles are used in a
variety of construction applications though their main uses are for floor and
wall decorations Tiles are used for brand equity assessment since the
product is relatively homogenous and does not lend itself to multiple product
subcategories In Europe there is a high level of brand identity associated
with tiles Tiles are used for the same basic function and typically vary in
perceived quality and brand image Thus it is possible to assess the
dimensions of brand equity without having to control for a wide range of product variations
We selected tile resellers to solicit the most comprehensive assessment of
customer perceptions along with collecting measures of market performance
The perspectives of resellers provide unique insights since they act at the
customer and manufacturer interface Resellers possess knowledge regarding
the perceptions and preferences of their customers and also are aware of the
market performance and relative profitability of the suppliersrsquo brands that
they distribute Hence using responses from intermediaries provides an
opportunity for consideration of customer perceptions along with firm
performance
Based on existing literature and insight from experts we developed and
pretested a standardized questionnaire The questionnaires were mail
distributed to executives from 794 tile resellers in Austria carrying products
from manufacturers located in various countries We studied the perceptions
of Austrian tile resellers distributing tiles manufactured in Italy the Czech
Republic and Slovakia Because of Austriarsquos central location linking
Western Europe and the former Eastern European countries it was
considered as an appropriate research site to examine brand equity and its
consequences Also we were able to collect information from quasi-neutral
people about different brands produced by tile manufacturers from Italy the
Czech Republic and Slovakia Thus major manufacturers are represented
without adding substantial home country source bias The sample group wasderived from an industry list of companies and the ``golden pagesrsquorsquo of the
Austrian Chamber of Commerce
To enhance the response rate of our mail survey we provided pre-addressed
and pre-stamped envelopes assured anonymity and offered a summary of
the research findings as an incentive to the participants After several follow-
up procedures (eg telephone calls new mailings) responses from 189
executives were obtained Due to missing information the final sample
consisted of information from 154 managers In addition 30 questionnaires
were returned as undeliverable Considering this information we achieved a
20 per cent response rate Of these 154 managers 52 (338 per cent) assessed
the Italian 51 (331 per cent) the Czech and 51 (331 per cent) the Slovakian
brand Of the respondents 115 (747 per cent) were male and 39 (253 per
cent) female The median number of years the managers had been doing
business in the industry was 22
Non-response bias was examined using the method proposed by Armstrong
and Overton (1977) A viable check for non-response bias is to split the
sample into early and late respondents No significant differences at the 005
level between the two groups were found which leads us to conclude that
non-response bias is not a major issue
Scale construction
The scales used for both the elements and consequences of brand equity are
described in Table I
A s s e s s m e n t o f c u s t o m e r
p e r c e p t io n s
R e s p o n s e r a t e
2 2 6 J O U R N A L O F P R O D U C T amp B R A N D M A N A G E M E N T V O L 1 2 N O 4 2 0 0 3
832019 Brand Equity Mgt
httpslidepdfcomreaderfullbrand-equity-mgt 817
Construct
Scale items
Scale measure 1 strongly disagree
to 5 strongly agree unless noted Source
Standardized
loading t value
Brand awaren ess I know what X looks like Yoo et al 081 plusmn
Agrave2df = 48 I can recognize X among other brands (2000) 075 976
AGFI = 082 I am aware of X 071 913
CFI = 091
RMSEA = 010
Some characteristics of X come to my
mind quickly 071 994
I can quickly recall the symbol or logoof X 064 798
I have difficulty in imagining X in my
mind 061 756
Perceived quality X is of high quality Yoo et al 083 plusmn
Agrave2df = 26
AGFI = 085
The likelihood that X would be
functional is very high
(2000) and
Dodds et al 069 942
CFI = 095 X appears to be of very poor quality (1991) 059 765
RMSEA = 008
The likelihood that X is reliable is very
high 068 922
The workmanship of X would be high 069 941
X must be of very good quality 078 1104
The likelihood that X is dependable is
very high 080 1151
X seems to be durable 070 953Brand loyal ty I consider myself to be l oyal to X Yoo et al 082 plusmn
Agrave2df = 78 X would be my first choice (2000) and 062 684
AGFI = 084
CFI = 091
I will not buy other brands if X is
available at the wholesaler
Beatty and
Kahle
(1988) 043 473
RMSEA = 011
If X were not available at the wholesaler
it would make little difference to me if I
had to choose another brand 066 736
When another brand is on sale I will
generally purchase it rather than X 070 769
Brand profitability
performance
Agrave2df = 12
Compared to all other brands available
in our trade area the profitability for
carrying X is (1 = lowest-highest = 5)
Lassar
(1998)
086 plusmn
AGFI = 096
CFI = 099
RMSEA = 004
Relative to all other brands we carry the
realized margin for X is
(1 = lowest-
highest = 5) 079 936
Overall X is financially very attractive
for us 065 787
What percentage of your total profit
derived from the sale of tiles is
attributable to X (percentage value) 054 646
Brand market
performance
What percentage of your tile sales
volume is attributable to X ()
Lassar
(1998) 076 plusmn
Agrave2df = 014
AGFI = 099
Compared to all other tile brands we
carry X generates the larges sales volume 082 1004
CFI = 100
RMSEA lt 001
Relative to all other tile brands we carry
the sales potential for X is
(1 = lowest-highest = 5) 077 plusmn
Customerperceived value
Agrave2df = 511
My customers consider X to be
(1 = very poor value for money- very
good value for money = 7)
Dodds et al(1991)
065 plusmn
AGFI = 088
CFI = 094
RMSEA = 007
At the usual price my customers consider
X to be (1 = very uneconomical-very
economical = 7) 075 786
The product is considered to be a good
buy (1 = strongly disagree-strongly
agree = 7) 078 780
My customers consider the usual price for
X to be (1 = very unacceptable-very
acceptable = 7) 076 764
(continued)
Table I Scale development for constructs
J O U R N A L O F P R O D U C T amp B R A N D M A N A G E M E N T V O L 1 2 N O 4 2 0 0 3 2 2 7
832019 Brand Equity Mgt
httpslidepdfcomreaderfullbrand-equity-mgt 917
Perceived quality The scale for perceived quality is based on Dodds et al
(1991) Yoo et al (2000) employed perceived quality to address the overall
evaluation of quality and to avoid considering specific elements of quality
There are eight items in the scale for perceived quality The scale allows a
response from ``1rsquorsquo (strongly disagree) to ``5rsquorsquo (strongly agree) to statements
such as ``X is of high qualityrsquorsquo ``The likelihood that X is reliable is very
highrsquorsquo and ``The likelihood that X is dependable is very highrsquorsquo
Brand loyalty The scale for brand loyalty was developed by Beatty and
Kahle (1988) and has been adapted by Yoo et al (2000) The scale includes
five items With a five-point response scale ranging from ``1rsquorsquo (strongly
disagree) to ``5rsquorsquo (strongly agree) statements for the scale items include ``X
would be my first choicersquorsquo and ``I will not buy other brands if X is available
at the wholesalerrsquorsquo
Brand awareness The scale for brand awareness consists of six itemsdeveloped by Yoo et al (2000) Respondents used a five-point scale
anchored by ``1rsquorsquo (strongly disagree) to ``5rsquorsquo (strongly agree) to statements
ranging from ``I can recognize X among other brandsrsquorsquo to ``Some
characteristics of X come to my mind quicklyrsquorsquo
Brand profitability performance The scale for brand profitability
performance has four items as developed by Lassar (1998) Three of the
items allow a scale response such as ``Compared to all other brands
available in our trade area the profitability for carrying X is rsquorsquo with ``1rsquorsquo =
lowest plusmn highest = ``5rsquorsquo Another item asks ``What percentage of your total
profit derived from the sale of tiles is attributable to Xrsquorsquo Resellers are able to
make this assessment since the product offerings to the reseller are indeed
based upon the incentives offered to choose particular brands
Construct
Scale items
Scale measure 1 strongly disagree
to 5 strongly agree unless noted Source
Standardized
loading t value
X appears to my customers to be a
bargain (1 = strongly disagree-strongly
agree = 7) Del plusmn
My customers are satisfied when they buy
X (1 = strongly disagree-strongly
agree = 7) Del plusmnThe decision of customers to buy X is
confirmed (1 = strongly disagree-strongly
agree = 7) 069 609
Purchase intention
Agrave2df = 007
The likelihood that my customers
purchase X is (1 = very low-very
high = 7)
Dodds et al
(1991) 088 plusmn
AGFI = 099
CFI = 100
RMSEA lt 001
If a customer is going to buy X heshe
would consider buying X at the usual
price (1 = strongly disagree-strongly
agree = 7) Del plusmn
At the usual price my customers would
consider buying X (1 = strongly disagree-
strongly agree = 7) Del plusmn
The probability that my customersconsider buying X is (1 = very low-
very high = 7) 093 1922
The willingness of my customers to buy
X is (1 = very low-very high = 7) 089 plusmn
NotesaWhere X is the brand of interest AGFI = adjusted goodness of fit index
CFI = comparative fit index RMSEA = root mean square error of approximation
Table I
2 2 8 J O U R N A L O F P R O D U C T amp B R A N D M A N A G E M E N T V O L 1 2 N O 4 2 0 0 3
832019 Brand Equity Mgt
httpslidepdfcomreaderfullbrand-equity-mgt 1017
Brand market performance We employ brand sales volume as a measure of
market performance and use the three-item scale developed by Lassar
(1998) One item asks for the percentage of sales volume attributable to X
The other two items are scale responses ``Compared to all other tile brands
we carry X generates the largest sales volumersquorsquo (1 = strongly disagree plusmn
strongly agree = 5) and ``Relative to all other tile brands we carry the sales
potential for X is rsquorsquo (1 = lowest plusmn highest = 5)
Customer perceived value Based on the conceptualization of perceived
value as a trade-off between benefits and sacrifices (costs) the scale for
customer perceived value is obtained from Dodds et al (1991) This scale
uses seven-point responses and the seven statements included relate to items
such as value for money and satisfaction ``The product is considered to be a
good buyrsquorsquo (1 = strongly disagree plusmn strongly agree = 7) and ``My customers
are satisfied when they buyrsquorsquo (1 = strongly disagree plusmn strongly agree = 7)
Purchase intention Purchase intention includes five items such as ``The
likelihood that my customers purchase X is (1 = very low plusmn very high = 7)
and ``At the usual price my customers would consider buying Xrsquorsquo (1 =
strongly disagree plusmn strongly agree = 7) This scale is based on Dodds et al(1991)
Reliability and validity assessments
Given the multiple-item nature of the scales used in this research we
assessed their psychometric properties following the recommendations of
Churchill (1979) and Gerbing and Anderson (1988) First each scale was
subjected to exploratory factor analysis loading on the dominant factor (at
least at 05) with a sum of the items in the factor explaining more that 50 per
cent of the factorrsquos variance Second reliability analyses were conducted
(Cronbach 1951) The alpha coefficients range from 080 to 093 and are
well above the 070 level suggested by Nunnally (1978) Third based onGerbing and Anderson (1988) we also performed confirmatory factor
analysis (CFA) using maximum likelihood estimation procedures for
measure validation The results indicate both acceptable model fits and item
properties and are shown in Table I The overall model fit indices chi-
squaredegrees of freedom adjusted goodness of fit index (AGFI)
comparative fit index (CFI) and root mean square error of approximation
(RMSEA) indicate acceptable model fits All items significantly load on
their corresponding construct (lowest t -value is 473) demonstrating
adequate convergent validity
Following the recommendations of Bagozzi et al (1991) pairwise
comparisons of the constructs within our models were conducted to examineconvergent and discriminate validity We arranged the measures into
subgroups with the first measurement model comprising the brand equity
constructs and the second measurement model consisting of the
consequences constructs All latent-trait correlations are significantly
different at one because each phi-value plus or minus twice the standard
error does not include one thus indicating discriminant validity Tables I
and II provide the summary statistics for the constructs used in testing the
hypotheses Table III shows the correlations within the constructs
To summarize the psychometric properties of the measures are acceptable
For further analyses the individual items of each measure were combined by
calculating the arithmetic means The items relating to reseller performance
were first standardized
B e n e fit s a n d s a c r if ic e s
P a ir w i s e c o m p a ri s o n s
J O U R N A L O F P R O D U C T amp B R A N D M A N A G E M E N T V O L 1 2 N O 4 2 0 0 3 2 2 9
832019 Brand Equity Mgt
httpslidepdfcomreaderfullbrand-equity-mgt 1117
Analysis and results
The primary tests of the hypotheses employed (linear) single and multiple
regression analysis (Cohen and Cohen 1983) The findings obtained from
these analyses are reported in Table IV Both single and multiple regression
analyses results show significant ( p lt 001) F -values (lowest F -value 1142)
indicating good overall model fit Examining the magnitude of the adjusted
R-squared value also leads us to conclude that acceptable amounts of the
variance of the dependent variables can be explained (lowest R-squared
017) Multicollinearity was not a problem as the variance inflation factors
are well below the critical level of 10 All of the coefficients are significant
at p lt 001 with the exception of one coefficient (brand awareness) in one
model which is significant at p lt 005 Moreover the coefficients are all
positive as hypothesized
In the first model the three brand equity dimensions brand awareness (016)
perceived quality (028) and brand loyalty (033) are significant predictors
of brand profitability performance Together the three predictors explain 34
percent of the variation in profitability performance Therefore strong
support for the first three hypotheses ( H1a-H1c) is found
Using brand market performance as the dependent variable the standardized
coefficients (brand awareness 018 perceived quality 022 brand loyalty
034) of the independent variables are significant which supports H2a H2b
and H2c
Of the variance of customer value 31 per cent is explained by the three
brand equity dimensions The estimated standardized coefficients of the
three independent variables (brand awareness 018 perceived quality 021
brand loyalty 019) are all significant Hence support is found for H3a H3b
and H3c
Performing single regression analyses the findings indicate a significant
relationship between customer value and purchase intention (coefficient
054) which supports H4 Also when purchase intention is regressed on
brand market performance (coefficient 062) and brand profitability
performance (coefficient 055) significant results are obtained Therefore
the analyses provide strong support for H5 and H6
Conclusion and implications
The objective of this study was to investigate the effects of using measures of
brand equity as indicators of performance Perceived quality brand loyalty
and brand association were selected as measures of brand equity Results
indicate that all three measures are significant predictors of performance
Constructs (number of items)
Coefficient
alphas
Mean
(standard deviation) Range
Brand awareness (6) 086 394 (081) 100-500
Perceived quality (8) 090 351 (067) 163-500
Brand loyalty (4) 080 241 (086) 100-440
Brand profitability (4)a
080 na na
Brand market performance (3)a
083 na na
Customer perceived value (8) 087 430 (102) 117-683Purchase intention (3) 093 320 (128) 100-667
Notes na = not applicable adue to different scales used as measures for the items thescale was standardized
Table II Summary statistics for constructs
E q u it y d im e n s i o n s
R e g re s s io n a n a ly s e s
2 3 0 J O U R N A L O F P R O D U C T amp B R A N D M A N A G E M E N T V O L 1 2 N O 4 2 0 0 3
832019 Brand Equity Mgt
httpslidepdfcomreaderfullbrand-equity-mgt 1217
B r a n d a w a r e n e s s
P e r c e i v e d q u a l i t y
B r a n d l o y a l t y
B r a n d
p r o f i t a b i l i t y
B r a n d s a l e s
v o l u m e
C u s t o m e r
p e r c e i v e d v a l u
e
P u r c h a s e i n t e n t i o n
B r a n d
a w a r e n e s s
P e r c e i v e d q u a l i t y
0 2
2
B r a n d
l o y a l t y
0 3
4
0 4
6
B r a n d
p r o f i t a b i l i t y p e r f o r m a n c e
0 3
4
0 4
7
0 5
2
B r a n d
m a r k e t p e r f o r m a n c e
0 3
9
0 4
1
0 5
0
0 7
0
C u s t o
m e r p e r c e i v e d v a l u e
0 2
9
0 3
3
0 3
5
0 3
8
0 3
1
P u r c h
a s e i n t e n t i o n
0 3
4
0 4
7
0 5
2
0 5
5
0 6
2
0 5
4
N o t e s
A l l c o r r e l a t i o n s s i g n i f i c a n t a t p lt 0 0
1
T a b l e
I I I C o r r e l a t i o n c o e f f i c i e n t s b y c o n s t r u c t
J O U R N A L O F P R O D U C T amp B R A N D M A N A G E M E N T V O L 1 2 N O 4 2 0 0 3 2 3 1
832019 Brand Equity Mgt
httpslidepdfcomreaderfullbrand-equity-mgt 1317
measures This was true for all three indicators of performance brand
profitability brand sales volume and customer perceived value
The standardized coefficients from the regression analysis in Table IV
provide some indication of the relative importance of the three brand equity
measures as predictors of performance Intercorrelations exist among the
measures as brand awareness and perceived quality will ultimately affect
brand loyalty The standardized coefficients reflect this relationship since the
coefficient for brand loyalty is almost double that of brand awareness
Loyalty is an important predictor of performance Given the difficulty in
selecting a parsimonious yet comprehensive set of performance measures
managers might consider the greater potential information content of ameasure such as brand loyalty
Building brand loyalty is an actionable initiative for manufacturers Possible
actions include creating a reason-to-buy differentiationpositioning creating
value chain member interest and making brand extensions (eg new tile
designs) (Aaker 1991) Brand loyalty increase can be measured on a
longitudinal basis Our research supports the relevance of tracking resellersrsquo
perceptions of brand loyalty
The brand equity constructs have been validated in previous research and
our study lends support to these scales from a unique perspective in the value
chain plusmn resellers The significance of the brand equity measures has
important implications for developing measures of other intangible assetsOur results supported a relationship between non-financial measures and
indicators of performance Without a link to performance the measures are
unlikely to generate results that support the strategic objectives of a firm
A major implication of our research results refers to strategic channel
partnerships (Narus and Anderson 1986) Given the positive relationships
among channel partners the sacrifices and benefits of manufacturers and
resellers have to be assessed and continually developed Although not
examined in this research problems of channel conflict like power or
opportunism are also of central issue (Webster 2000) More importantly as
the new economy compels less traditional and more cooperative ways of
conducting business it is essential to consider the impact of these
cooperative ventures on performance measurement
Dependent variables
Independent
variables
Standardized
- -coefficient
(t-value) F -value
Adjusted
R2
Brand profitability performance Brand awareness 016 (233) 2776 034
Perceived quality 028 (376)
Brand loyalty 033 (435)
Brand market perf or mance Brand awar eness 018 (250) 2334 031
Perceived quality 022 (284)Brand loyalty 034 (427)
Customer perceived value Brand awareness 018 (227) 1142 017
Perceived quality 021 (246)
Brand loyalty 019 (222)
Purchase intention Customer
p ercei ved v alu e 05 4 (79 3) 6 29 3 0 2 9
Brand market performance Purchase intention 062 (963) 9266 038
Brand profitability performance Purchase intention 055 (802) 6436 029
Notes Significant at p lt 001 unless noted Significant at p = 005
Table IV Results of single and multiple regression analysis
In it ia ti v e fo r m a n u fa c t u r e rs
R e s e a r c h r e s u lt s
2 3 2 J O U R N A L O F P R O D U C T amp B R A N D M A N A G E M E N T V O L 1 2 N O 4 2 0 0 3
832019 Brand Equity Mgt
httpslidepdfcomreaderfullbrand-equity-mgt 1417
It is apparent from the study results that factors other than brand equity also
impact performance since the variations in performance explained by brand
equity ranges from 17 to 34 percent (Table IV R-squared values) Brand
equity is an important predictor of performance but other factors such as
competition prices and expenses also impact performance A shortcoming
of our research is the focus on cross-sectional data Hence we are not able to
explore the long-term effects of brand equity on performance Clearly future
studies could refer to longitudinal data Tracking at the reseller level of the
value chain should be more feasible than end-user tracking of brand equity
The reliance on subjective information in our study might be a matter of
concern as well While brand equity from a customer-based perspective and
perceived customer value require quasi subjective information by definition
an alternative view might suggest that objective assessments are necessary
with respect to performance measures However Dess and Robinson (1984)
found no significant differences comparing the validity of subjective and
objective performance measures Nonetheless in future research the model
could be replicated using more objective performance data
Note
1 We term these intermediaries resellers as they distribute the products (tiles) to both
businesses and customers
References
Aaker DA (1989) ``Managing assets and skills the key to a sustainable competitive
advantagersquorsquo California Management Review Vol 32 Winter pp 91-106
Aaker DA (1991) Managing Brand Equity The Free Press New York NY
Aaker DA (1996a) Building Strong Brands The Free Press New York NY
Aaker DA (1996b) ``Measuring brand equity across products and marketsrsquorsquo California
Management Review Vol 38 No 3 pp 102-20Aaker DA and Jacobson R (1994) ``The financial information content of perceived
qualityrsquorsquo Journal of Marketing Research Vol 31 pp 191-201
Armstrong JS and Overton TS (1977) ` Estimating non-response bias in mail surveysrsquorsquo
Journal of Marketing Research Vol 14 August pp 396-402
Bagozzi RP Yi Y and Phillips LW (1991) ``Assessing construct validity in organizational
researchrsquorsquo Administrative Science Quarterly Vol 36 September pp 421-58
Barth ME Clement MB Foster G and Kasznik R (1998) ` Brand values and capital
market valuationrsquorsquo Review of Accounting Studies Vol 3 pp 41-68
Barwise P (1993) ``Brand equity snark or boojumrsquorsquo International Journal of Research in
Marketing Vol 10 March pp 93-104
Barwise P Higson C Likierman A and Marsh P (1989) Accounting for Brands London
Business School and the Institute of Chartered Accountants in England and Wales
London
Beatty SE and Kahle LR (1988) ``Alternative hierarchies of the attitude-behavior
relationship the impact of brand commitment and habitrsquorsquo Journal of the Academy of
Marketing Science Vol 16 Summer pp 1-10
Churchill GA Jr (1979) ` A paradigm for developing better m easures of marketing
constructsrsquorsquo Journal of Marketing Research Vol 16 February pp 64-73
Cohen J and Cohen P (1983) Applied Multiple RegressionCorrelation Analysis for the
Behavioral Sciences (2nd ed) Lawrence Erlbaum Associates Hillsdale NJ
Cronbach LJ (1951) ``Coefficient alpha and the internal structure of testsrsquorsquo Psychometrika
Vol 16 September pp 297-334
Dess GG and Robinson RB (1984) ``Measuring organizational performance in the absence
of objective measures the case of privately-held firm and conglomerate business unitrsquorsquo
Strategic Management Journal Vol 5 pp 265-73
S u b je c t iv e in fo r m a t io n
J O U R N A L O F P R O D U C T amp B R A N D M A N A G E M E N T V O L 1 2 N O 4 2 0 0 3 2 3 3
832019 Brand Equity Mgt
httpslidepdfcomreaderfullbrand-equity-mgt 1517
Dodds WB Monroe KB and Grewal D (1991) ` Effects of price brand and store
information on buyersrsquo product evaluationrsquorsquo Journal of Marketing Research Vol 28
August pp 307-19
Gerbing DW and Anderson JC (1988) ` An updated paradigm for s cale development
incorporating unidimensionality and its assess mentrsquorsquo Journal of Marketing Research
Vol 25 May pp 186-92
Grover R and Srinivasan V (1992) ``Evaluating the multiple effects of retail promotions on
brand-loyal and brand-switching segmentsrsquorsquo Journal of Marketing Research Vol 18
February pp 76-89
Hoyer W D and Brown SP (1990) ``Effects of brand awareness on choice for a common
repeat purchase productrsquorsquo Journal of Consumer Research Vol 17 pp 141-8
Jacobson R and Aaker DA (1987) ``The strategic role of product qualityrsquorsquo Journal of
Marketing Vol 51 October pp 31-44
Kaplan RS and Johnson T (1987) Relevance Lost The Rise and Fall of Management
Accounting Harvard Business School Press Boston MA
Keller KL (1993) ``Conceptualizing measuring and managing customer-based brand
equityrsquorsquo Journal of Marketing Vol 57 January pp 1-22
Keller KL (1998) Building Measuring and Managing Brand Equity Prentice Hall
Englewood Cliffs NJ
Lane V and Jacobson R (1995) ``Stock market reactions to brand extension announcements
the effects of brand attitude and familiarityrsquorsquo Journal of Marketing Vol 59 January
pp 63-77
Lassar WM (1998) ``Control systems in supplier-retailer relationships and their impact on
brand performancersquorsquo Journal of Retailing and Consumer Services Vol 5 No 2 pp 65-75
Monroe KB and Krishnan R (1985) ` The effect of price on s ubjective product
evaluationsrsquorsquo in Jacoby J and Olson J (Eds) Perceived Quality Lexington Books
Lexington MA pp 209-32
Narus JA and Anderson JC (1986) ` Turn your industrial distributors into partnersrsquorsquo
Harvard Business Review Vol 64 MarchApril pp 66-71
Nunnally JC (1978) Psychometric Theory 2nd ed McGraw-Hill New York NY
Oliver RL (1997) Satisfaction A Behavioral Perspective on the Consumer McGraw-Hill
New York NY
Phillips LW Chang DR and Buzzell RD (1983) ``Product quality cost position and
business performance a test of some key hypothesesrsquorsquo Journal of Marketing Vol 47
Spring pp 26-43
Shocker AD Srivastava RK and Ruekert RW (1994) ``Challenges and opportunities
facing brand management an introduction to the special issuersquorsquo Journal of Marketing
Research Vol 31 pp 149-58
Spreng RA Harrell GD and Mackoy RD (1995) ` Service recovery impact on
satisfaction and intentionsrsquorsquo Journal of Service Marketing Vol 9 No 1 pp 15-23
Webster FE (2000) ` Understanding the relationships among brands consumers and
resellersrsquorsquo Journal of the Academy of Marketing Science Vol 28 No 1 pp 17-23
Yoo B and Donthu N (2001) ` Developing and validating a multidimensional consumer-
based brand equity scalersquorsquo Journal of Business Research Vol 52 pp 1-14
Yoo B Donthu N and Lee S (2000) ``An examination of selected marketing mix elements
and brand equityrsquorsquo Journal of the Academy of Marketing Science Vol 28 No 2
pp 195-211
Zeithaml VA (1988) ``Consumer perceptions of price quality and value a means-end
model and synthesis of evidencersquorsquo Journal of Marketing Vol 52 July pp 2-22
amp
2 3 4 J O U R N A L O F P R O D U C T amp B R A N D M A N A G E M E N T V O L 1 2 N O 4 2 0 0 3
832019 Brand Equity Mgt
httpslidepdfcomreaderfullbrand-equity-mgt 1617
Executive summary and implications for managers andexecutives
Brand investment benefits sales and the firmrsquos value
The debate around brand equity and brand valuation has in many ways
settled into two camps plusmn the consumer-based approach (mostly marketers)
and the aggregate sales approach (mostly accountants) I appreciate that
this is a gross over-simplification of the distinction between different approaches and that many models (and much of current theory) endeavour
to join together the two approaches However it is important for marketers
to appreciate that they have yet to fully convince others of the validity of
consumer-based approaches to the measurement of brand equity
Baldauf e t a l set out to produce further validation of the consumer-based
model by examining how the dimensions of brand equity are antecedents of
firm performance and especially sales and profitability This consideration is
important since much of the brand valuation debate concerns the treatment
of the brand on the balance sheet rather than its impact on the profit and loss
account And while marketers will always argue that brands are important
intangible assets (thereby meriting inclusion within the balance sheet) muchof our work as marketers is intended to influence sales and profitability
The antecedents of brand equity
Baldauf Cravens and Binder draw on Aakerrsquos model of brand equity in their
study focusing on the three most important antecedents of brand equity plusmn
brand loyalty brand awareness and perceived quality Aakerrsquos argument is
that where a brand has loyal customers high levels of market awareness and
is perceived to be of high quality it will have a high level of equity plusmn it is
more valuable to the firm
This means that the firmrsquos strategy needs to address each antecedent plusmn
focusing on one or other element will not necessarily deliver brand value However given that we are concerned here with the effect on sales volumes
and profits we need to ask whether achieving positive effect in this area
requires a different balance within the strategy Indeed there could
conceivably be a conflict between strategies aimed at increasing the firmrsquos
value (a balance sheet strategy) and strategies aimed at increasing sales (a
profit and loss strategy)
There is a concern that the latter approach to strategy can result in a sales
promotion led approach to marketing as a complement to the corporate
focus on cash flow and short-term profits Therefore being able to
demonstrate that strategies aimed at increasing brand value also produce
short-term benefits in terms of sales and profitability means being able to justify important brand strategies in a climate of short-term focus
Brand equity is not the only thing influencing performance
While brand strategies are important we have to recognise (and Baldauf
et al remind us) that performance is not solely influenced by brand equity
Marketers have to pay attention to other factors and especially to issues
often dismissed as tactical or mere implementation The marketing director
who fails to appreciate that tactical errors and sloppy implementation can
wreck a strategy should not keep his job
Baldauf et al identify three influences other than brand equity plusmn competition
pricing and expenses Since these clearly have an impact on performance
any marketing strategy needs to be flexible enough and the firm needs also to
J O U R N A L O F P R O D U C T amp B R A N D M A N A G E M E N T V O L 1 2 N O 4 2 0 0 3 2 3 5
T h is s u m m a ry h a s b e e n
p r o v id e d t o a ll o w m a n a g e r s
a n d e x e c u t i v e s a r a p id
a p p r e c i a ti o n o f t h e c o n t e n t
o f t h is a r ti c le T h o s e w it h a
p a r t ic u la r in t e r e s t i n t h e
t o p ic c o v e r e d m a y t h e n r e a d
t h e a r t ic l e i n t o t o t o t a k e a d v a n t a g e o f t h e m o r e
c o m p r e h e n s i v e d e s c r i p ti o n
o f t h e r e s e a r c h u n d e rt a k e n
a n d it s r e s u lt s t o g e t t h e fu ll
b e n e fit o f t h e m a t e r ia l
p r e s e n t
832019 Brand Equity Mgt
httpslidepdfcomreaderfullbrand-equity-mgt 1717
pay attention to its performance in terms of cost containment In addition the
impact of pricing and competition requires a regular reality check against
what is actually happening in the market
However too many firms concentrate on these other issues and respond to
market changes by fine tuning tactics undertaking reactive sales promotions
and trimming costs Often the equally important task of developing brand
equity gets lost in the tactical war with competitors plusmn firms must remember that investing in brand equity has a direct impact on sales (elsewhere in this
issue of JPBM Ataman and U Egrave lengin provide a substantive assessment of this
impact) as well as contributing plusmn accounting approaches allowed plusmn to the
firmrsquos overall value
Brand equity strategies plusmn options
We have noted that the dominant elements of Aakerrsquos brand equity model are
brand loyalty brand awareness and perceived quality but this does not
provide us with a direct guide to the setting of strategies Aaker also included
in his model brand associations and other proprietary assets such as
intellectual property and for some brands these considerations are of
considerable importance
The brand strategy first strikes a balance between investing in awareness plusmn
telling people about the brand plusmn and investing in brand loyalty and repeat
purchase While it remains the case that securing repeat purchase is (all
things being equal) more easy than recruiting a new customer we cannot
overlook the need to maintain and extend our brandrsquos position within the
portfolio of brands from which the consumer chooses
Brand investment therefore should consist of general advertising primarily
aimed at building brand awareness and merchandising sales promotions
direct marketing and packaging that reinforces the choice made by
consumers The price details of the mix depend on the stability of marketsrates of market growth or decline competitor activity and the tactical
demands of distribution channels (and especially retailers)
Baldauf et al provide further evidence that brand investment contributes to
overall firm performance and while such investment should not be to the
exclusion of other factors (price c ompetition etc) that affect performance it
is a central element of successful consumer goods marketing What is very
clear is that investing in the brand is about sales and profits as well as the
overall value of the brand itself
(A preAcirccis of the article ``Performance c onsequences of brand equity
management evidence from organizations in the value chainrsquorsquo Supplied byMarketing Consultants for Emerald)
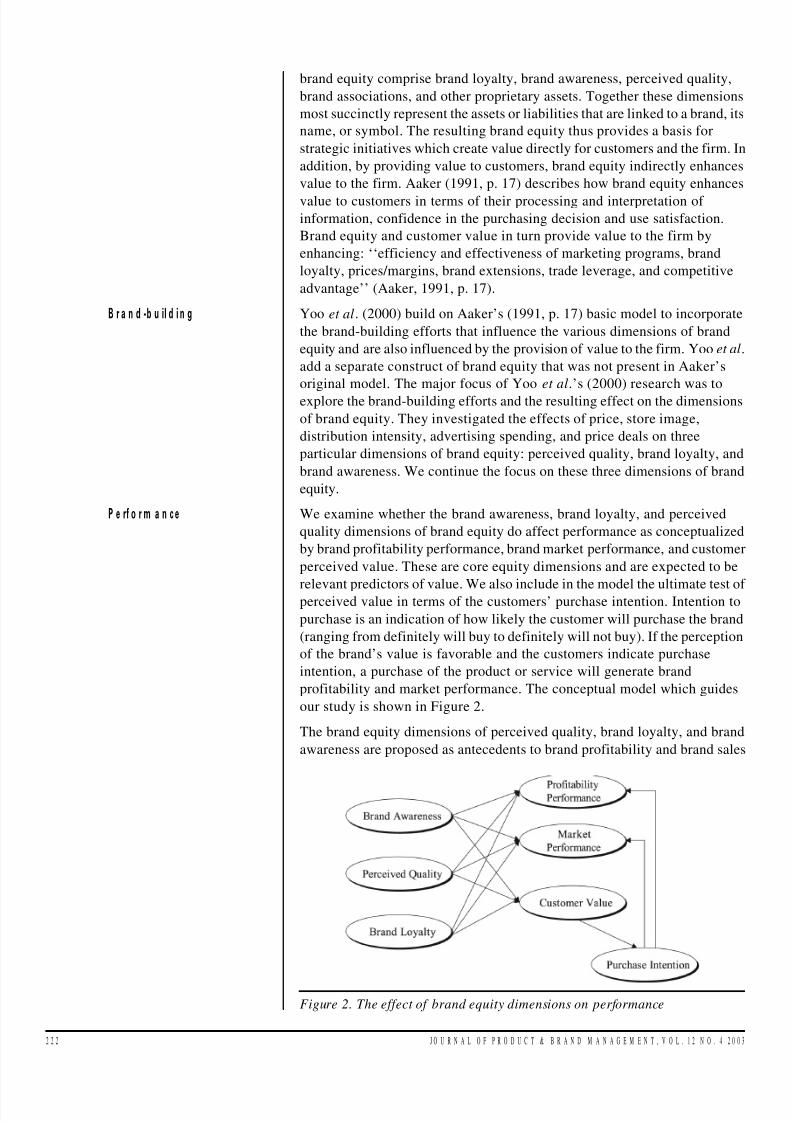
832019 Brand Equity Mgt
httpslidepdfcomreaderfullbrand-equity-mgt 317
brand equity comprise brand loyalty brand awareness perceived quality
brand associations and other proprietary assets Together these dimensions
most succinctly represent the assets or liabilities that are linked to a brand its
name or symbol The resulting brand equity thus provides a basis for
strategic initiatives which create value directly for customers and the firm In
addition by providing value to customers brand equity indirectly enhances
value to the firm Aaker (1991 p 17) describes how brand equity enhances
value to customers in terms of their processing and interpretation of
information confidence in the purchasing decision and use satisfaction
Brand equity and customer value in turn provide value to the firm by
enhancing ``efficiency and effectiveness of marketing programs brand
loyalty pricesmargins brand extensions trade leverage and competitive
advantagersquorsquo (Aaker 1991 p 17)
Yoo et al (2000) build on Aakerrsquos (1991 p 17) basic model to incorporate
the brand-building efforts that influence the various dimensions of brand
equity and are also influenced by the provision of value to the firm Yooet al
add a separate construct of brand equity that was not present in Aakerrsquos
original model The major focus of Yoo et alrsquos (2000) research was to
explore the brand-building efforts and the resulting effect on the dimensions
of brand equity They investigated the effects of price store image
distribution intensity advertising spending and price deals on three
particular dimensions of brand equity perceived quality brand loyalty and
brand awareness We continue the focus on these three dimensions of brand
equity
We examine whether the brand awareness brand loyalty and perceived
quality dimensions of brand equity do affect performance as conceptualized
by brand profitability performance brand market performance and customer
perceived value These are core equity dimensions and are expected to be
relevant predictors of value We also include in the model the ultimate test of perceived value in terms of the customersrsquo purchase intention Intention to
purchase is an indication of how likely the customer will purchase the brand
(ranging from definitely will buy to definitely will not buy) If the perception
of the brandrsquos value is favorable and the customers indicate purchase
intention a purchase of the product or service will generate brand
profitability and market performance The conceptual model which guides
our study is shown in Figure 2
The brand equity dimensions of perceived quality brand loyalty and brand
awareness are proposed as antecedents to brand profitability and brand sales
Figure 2 The effect of brand equity dimensions on performance
B r a n d -b u il d i n g
P e rf o r m a n c e
2 2 2 J O U R N A L O F P R O D U C T amp B R A N D M A N A G E M E N T V O L 1 2 N O 4 2 0 0 3
832019 Brand Equity Mgt
httpslidepdfcomreaderfullbrand-equity-mgt 417
volume Two customer oriented value components are incorporated
perceived customer value and purchase intention The research model
focuses on a special stage in the value chain plusmn resellers This is an important
perspective on brand equity which has not received research attention
Hence these resellers will assess the dimensions of brand equity from their
perspective They will also indicate their perceptions concerning customer
value provided and willingness to buy as well as their firmsrsquo market and
profitability performance (the value to the trade)
Brand equity dimensions
The three dimensions of brand equity that we examine are also predicted to
affect performance through the overall positive effect of brand equity As
brand equity increases the firm is expected to enjoy a positive financial
return and the customer receives higher value (Aaker 1991 Aaker and
Jacobson 1994 Keller 1998 Lane and Jacobson 1995) Instead of
considering a single construct of brand equity we propose to focus on the
separate dimensions of brand equity as contributing to performance
Previous research has validated the dimensions of brand awareness
perceived quality and brand loyalty as relating to a higher order construct of brand equity (Yoo et al 2000 Yoo and Donthu 2001)
Brand awareness A major goal of brand management is developing and
maintaining brand awareness because of the impact of awareness on
consumer decision making and overall effect on firm values Brand
awareness is defined as ``the ability for a buyer to recognize or recall that a
brand is a member of a certain product categoryrsquorsquo (Aaker 1991 p 61)
Generating and maintaining brand awareness is important as only those
brands of which customers are aware enter into the consideration set of
brands for possible purchase and brand awareness influences the selection of
products from the consideration set (Hoyer and Brown 1990) Hence only
brands which customers recognize can be identified categorized andultimately purchased
Perceived quality Perceived quality is another dimension of brand value that
ultimately compels the consumer to select a good or service to purchase
(Aaker 1991 Zeithaml 1988) Notably product quality is a firmrsquos essential
resource for achieving competitive advantage (Aaker 1989) Perceived
quality is defined as the consumerrsquos judgment (perception) about a productrsquos
overall excellence or superiority with reference to substitutes (Aaker 1991
Zeithaml 1988) Hence perceived quality is the ``perceived ability of a
product to provide satisfaction `relativersquo to the available alternativesrsquorsquo
(Monroe and Krishnan 1985 p 212) Since the selection of important
attributes and comparison standards for a product are chosen by anindividual quality is not an objective measure Consequently quality
assessment is subjective (Zeithaml 1988)
Brand loyalty Brand loyalty is defined as ``a deeply held commitment to
rebuy or repatronize a preferred product or service consistently in the future
despite situational influences and marketing efforts having the potential to
cause switching behaviorrsquorsquo (Oliver 1997 p 392) An important
characteristic of loyal customers is that they consistently favor a brand and
refrain from switching to other brands (Grover and Srinivasan 1992)
Both Aaker (1991) and Keller (1993) discuss brand loyalty in their
conceptualizations though from somewhat different perspectives Aaker (1991)
notes the differences of brand loyalty from the other brand equity dimensions
because of its connection to the usage experience Loyalty develops via brand
T h r e e d im e n s io n s
B r a n d v a lu e
J O U R N A L O F P R O D U C T amp B R A N D M A N A G E M E N T V O L 1 2 N O 4 2 0 0 3 2 2 3
832019 Brand Equity Mgt
httpslidepdfcomreaderfullbrand-equity-mgt 517
usage In contrast to brand awareness or perceived quality brand loyalty only
exists if people have already bought and consumed a product Purchase and
consumption however are not necessary for obtaining brand awareness and
perceived quality Nonetheless the dimensions of brand equity are causally
interrelated but as loyalty is tied to a brand brand loyalty is a dimension of
brand equity (Aaker 1991) We follow this approach in our research
Brand equity consequencesHaving conceptualized the dimensions of brand equity we now consider the
consequences of these constructs Specifically we discuss the effects on
market and profitability performance as well as on customer value and
provide a supporting logic for the proposed hypotheses
At this point it is important to note that goal divergences between
manufacturers and resellers in the value chain exist Indeed manufacturers
and resellers who compete for added value follow different goals in
allocating resources The main goal of resellers is to achieve profitability
and therefore this channel member is not interested in interbrand price wars
In contrast a manufacturer is primarily interested in generating cash flows
although profitability achievement is essential as well Hence the sales
volume in comparison to competing brands is important (Lassar 1998)
Recognizing these different objectives of channel members we focus on two
distinct types of performance measures
Brand profitability performance Profitability performance is used as an
indicator of the financial contribution of a brand to the profit of the reseller
Brand awareness is expected to be positively related to profitability
performance The underlying logic is that higher levels of awareness will
lead to higher levels of purchase Customers who are unaware of a brand are
unlikely to consider it in their purchasing decision
Several studies have examined the effect of perceived quality on profitability(eg Jacobson and Aaker 1987) Most prominent among the studies examining
the quality and performance relationship are the findings from PIMS-projects
such as Phillips et al (1983) who found a strong positive effect of quality on
return on investment Their findings were used as support in studies conducted
by Jacobson and Aaker (1987) A positive effect of perceived quality on stock
returns was also reported by Aaker and Jacobson (1994)
High levels of brand loyalty should substantially enhance sales of a brand
Loyal buyers are less affected by price competition Higher sales are
expected to increase brand profitability assuming no disproportionate
increase in expenses For example after break-even occupancy levels are
reached by hotels additional occupancy provides major contributions to
profit
We propose the following hypotheses in examining the relationship of brand
equity dimensions to profitability
H1a Brand awareness is positively related to brand profitability
performance
H1b Perceived quality is positively related to brand profitability
performance
H1c Brand loyalty is positively related to brand profitability performance
Brand market performance Brand market performance considers the
demand side of the market and refers to indicators such as sales volume and
G o a l d iv e rg e n c e s
B r a n d lo y a l t y
2 2 4 J O U R N A L O F P R O D U C T amp B R A N D M A N A G E M E N T V O L 1 2 N O 4 2 0 0 3
832019 Brand Equity Mgt
httpslidepdfcomreaderfullbrand-equity-mgt 617
market share (Lassar 1998) The relationship of brand equity dimensions
and brand market performance has received very limited research attention
Yet conceptual support is provided by Webster (2000) who argues that a
major benefit of brand equity is its positive impact on demand Brand
awareness quality and loyalty are expected to enhance brand market
performance These dimensions of brand equity help the organization to
attract and retain customers Due to the support of the manufacturer brand
associations in terms of brand awareness (eg co-op advertising displays)
can be established and therefore brand equity dimensions should be
positively associated with brand market performance The following
hypotheses consider these relationships
H2a Brand awareness is positively related to brand market performance
H2b Perceived quality is positively related to brand market performance
H2c Brand loyalty is positively related to brand market performance
Customer value There is some debate in the literature concerning the
difference between quality and value (Zeithaml 1988) Customer value is
defined as ``the consumerrsquos overall assessment of the utility of a productbased on perceptions of what is rec eived and what is givenrsquorsquo (Zeithaml 1988
p 14) According to Monroe and Krishnan (1985) and Dodds et al (1991)
perceived quality is positively related to perceived value Recognizing a
brand name or logo can lead to positive customer assessments in terms of
considering a product as good value for money or a good bargain A higher
level of brand awareness reduces the consideration set Also it is more likely
that customers will buy familiar products and are more willing to pay a price
premium Hence brand awareness should positively affect perceived value
A higher perceived quality for many people is the reason to buy a product
and some would also be willing to pay a price premium Brand loyalty
should positively impact customer value Loyal customers recognize thefavorable benefitcost opportunity Given these relationships we propose the
following hypotheses
H3a Brand awareness is positively related to customer value
H3b Perceived quality is positively related to customer value
H3c Brand loyalty is positively related to customer value
Purchase intention Executives recognize the importance of purchase
intentions as it is less expensive to retain existing customers instead of
prospecting for new ones (Spreng et al 1995) Customers who perceive
superior value are more likely to buy the same brand in the future (Aaker
1991) Hence there is an expected direct relationship between perceived
customer value and purchase intention Moreover high levels of purchase
intentions should enhance a brandrsquos market and profitability performance
The following hypotheses are offered
H4 Customer value is positively related to purchase intention
H5 Purchase intention is positively related to market performance
H6 Purchase intention is positively related to profitability performance
Methodology
Sampling design and data collection
Our research conducted in Europe examines a stage in the value chain that
is relatively unexplored in terms of brand equity and performance
Q u a li ty a n d v a lu e
E x e c u ti v e s
J O U R N A L O F P R O D U C T amp B R A N D M A N A G E M E N T V O L 1 2 N O 4 2 0 0 3 2 2 5
832019 Brand Equity Mgt
httpslidepdfcomreaderfullbrand-equity-mgt 717
relationships in general plusmn resellers of tiles[1] Specifically tiles are used in a
variety of construction applications though their main uses are for floor and
wall decorations Tiles are used for brand equity assessment since the
product is relatively homogenous and does not lend itself to multiple product
subcategories In Europe there is a high level of brand identity associated
with tiles Tiles are used for the same basic function and typically vary in
perceived quality and brand image Thus it is possible to assess the
dimensions of brand equity without having to control for a wide range of product variations
We selected tile resellers to solicit the most comprehensive assessment of
customer perceptions along with collecting measures of market performance
The perspectives of resellers provide unique insights since they act at the
customer and manufacturer interface Resellers possess knowledge regarding
the perceptions and preferences of their customers and also are aware of the
market performance and relative profitability of the suppliersrsquo brands that
they distribute Hence using responses from intermediaries provides an
opportunity for consideration of customer perceptions along with firm
performance
Based on existing literature and insight from experts we developed and
pretested a standardized questionnaire The questionnaires were mail
distributed to executives from 794 tile resellers in Austria carrying products
from manufacturers located in various countries We studied the perceptions
of Austrian tile resellers distributing tiles manufactured in Italy the Czech
Republic and Slovakia Because of Austriarsquos central location linking
Western Europe and the former Eastern European countries it was
considered as an appropriate research site to examine brand equity and its
consequences Also we were able to collect information from quasi-neutral
people about different brands produced by tile manufacturers from Italy the
Czech Republic and Slovakia Thus major manufacturers are represented
without adding substantial home country source bias The sample group wasderived from an industry list of companies and the ``golden pagesrsquorsquo of the
Austrian Chamber of Commerce
To enhance the response rate of our mail survey we provided pre-addressed
and pre-stamped envelopes assured anonymity and offered a summary of
the research findings as an incentive to the participants After several follow-
up procedures (eg telephone calls new mailings) responses from 189
executives were obtained Due to missing information the final sample
consisted of information from 154 managers In addition 30 questionnaires
were returned as undeliverable Considering this information we achieved a
20 per cent response rate Of these 154 managers 52 (338 per cent) assessed
the Italian 51 (331 per cent) the Czech and 51 (331 per cent) the Slovakian
brand Of the respondents 115 (747 per cent) were male and 39 (253 per
cent) female The median number of years the managers had been doing
business in the industry was 22
Non-response bias was examined using the method proposed by Armstrong
and Overton (1977) A viable check for non-response bias is to split the
sample into early and late respondents No significant differences at the 005
level between the two groups were found which leads us to conclude that
non-response bias is not a major issue
Scale construction
The scales used for both the elements and consequences of brand equity are
described in Table I
A s s e s s m e n t o f c u s t o m e r
p e r c e p t io n s
R e s p o n s e r a t e
2 2 6 J O U R N A L O F P R O D U C T amp B R A N D M A N A G E M E N T V O L 1 2 N O 4 2 0 0 3
832019 Brand Equity Mgt
httpslidepdfcomreaderfullbrand-equity-mgt 817
Construct
Scale items
Scale measure 1 strongly disagree
to 5 strongly agree unless noted Source
Standardized
loading t value
Brand awaren ess I know what X looks like Yoo et al 081 plusmn
Agrave2df = 48 I can recognize X among other brands (2000) 075 976
AGFI = 082 I am aware of X 071 913
CFI = 091
RMSEA = 010
Some characteristics of X come to my
mind quickly 071 994
I can quickly recall the symbol or logoof X 064 798
I have difficulty in imagining X in my
mind 061 756
Perceived quality X is of high quality Yoo et al 083 plusmn
Agrave2df = 26
AGFI = 085
The likelihood that X would be
functional is very high
(2000) and
Dodds et al 069 942
CFI = 095 X appears to be of very poor quality (1991) 059 765
RMSEA = 008
The likelihood that X is reliable is very
high 068 922
The workmanship of X would be high 069 941
X must be of very good quality 078 1104
The likelihood that X is dependable is
very high 080 1151
X seems to be durable 070 953Brand loyal ty I consider myself to be l oyal to X Yoo et al 082 plusmn
Agrave2df = 78 X would be my first choice (2000) and 062 684
AGFI = 084
CFI = 091
I will not buy other brands if X is
available at the wholesaler
Beatty and
Kahle
(1988) 043 473
RMSEA = 011
If X were not available at the wholesaler
it would make little difference to me if I
had to choose another brand 066 736
When another brand is on sale I will
generally purchase it rather than X 070 769
Brand profitability
performance
Agrave2df = 12
Compared to all other brands available
in our trade area the profitability for
carrying X is (1 = lowest-highest = 5)
Lassar
(1998)
086 plusmn
AGFI = 096
CFI = 099
RMSEA = 004
Relative to all other brands we carry the
realized margin for X is
(1 = lowest-
highest = 5) 079 936
Overall X is financially very attractive
for us 065 787
What percentage of your total profit
derived from the sale of tiles is
attributable to X (percentage value) 054 646
Brand market
performance
What percentage of your tile sales
volume is attributable to X ()
Lassar
(1998) 076 plusmn
Agrave2df = 014
AGFI = 099
Compared to all other tile brands we
carry X generates the larges sales volume 082 1004
CFI = 100
RMSEA lt 001
Relative to all other tile brands we carry
the sales potential for X is
(1 = lowest-highest = 5) 077 plusmn
Customerperceived value
Agrave2df = 511
My customers consider X to be
(1 = very poor value for money- very
good value for money = 7)
Dodds et al(1991)
065 plusmn
AGFI = 088
CFI = 094
RMSEA = 007
At the usual price my customers consider
X to be (1 = very uneconomical-very
economical = 7) 075 786
The product is considered to be a good
buy (1 = strongly disagree-strongly
agree = 7) 078 780
My customers consider the usual price for
X to be (1 = very unacceptable-very
acceptable = 7) 076 764
(continued)
Table I Scale development for constructs
J O U R N A L O F P R O D U C T amp B R A N D M A N A G E M E N T V O L 1 2 N O 4 2 0 0 3 2 2 7
832019 Brand Equity Mgt
httpslidepdfcomreaderfullbrand-equity-mgt 917
Perceived quality The scale for perceived quality is based on Dodds et al
(1991) Yoo et al (2000) employed perceived quality to address the overall
evaluation of quality and to avoid considering specific elements of quality
There are eight items in the scale for perceived quality The scale allows a
response from ``1rsquorsquo (strongly disagree) to ``5rsquorsquo (strongly agree) to statements
such as ``X is of high qualityrsquorsquo ``The likelihood that X is reliable is very
highrsquorsquo and ``The likelihood that X is dependable is very highrsquorsquo
Brand loyalty The scale for brand loyalty was developed by Beatty and
Kahle (1988) and has been adapted by Yoo et al (2000) The scale includes
five items With a five-point response scale ranging from ``1rsquorsquo (strongly
disagree) to ``5rsquorsquo (strongly agree) statements for the scale items include ``X
would be my first choicersquorsquo and ``I will not buy other brands if X is available
at the wholesalerrsquorsquo
Brand awareness The scale for brand awareness consists of six itemsdeveloped by Yoo et al (2000) Respondents used a five-point scale
anchored by ``1rsquorsquo (strongly disagree) to ``5rsquorsquo (strongly agree) to statements
ranging from ``I can recognize X among other brandsrsquorsquo to ``Some
characteristics of X come to my mind quicklyrsquorsquo
Brand profitability performance The scale for brand profitability
performance has four items as developed by Lassar (1998) Three of the
items allow a scale response such as ``Compared to all other brands
available in our trade area the profitability for carrying X is rsquorsquo with ``1rsquorsquo =
lowest plusmn highest = ``5rsquorsquo Another item asks ``What percentage of your total
profit derived from the sale of tiles is attributable to Xrsquorsquo Resellers are able to
make this assessment since the product offerings to the reseller are indeed
based upon the incentives offered to choose particular brands
Construct
Scale items
Scale measure 1 strongly disagree
to 5 strongly agree unless noted Source
Standardized
loading t value
X appears to my customers to be a
bargain (1 = strongly disagree-strongly
agree = 7) Del plusmn
My customers are satisfied when they buy
X (1 = strongly disagree-strongly
agree = 7) Del plusmnThe decision of customers to buy X is
confirmed (1 = strongly disagree-strongly
agree = 7) 069 609
Purchase intention
Agrave2df = 007
The likelihood that my customers
purchase X is (1 = very low-very
high = 7)
Dodds et al
(1991) 088 plusmn
AGFI = 099
CFI = 100
RMSEA lt 001
If a customer is going to buy X heshe
would consider buying X at the usual
price (1 = strongly disagree-strongly
agree = 7) Del plusmn
At the usual price my customers would
consider buying X (1 = strongly disagree-
strongly agree = 7) Del plusmn
The probability that my customersconsider buying X is (1 = very low-
very high = 7) 093 1922
The willingness of my customers to buy
X is (1 = very low-very high = 7) 089 plusmn
NotesaWhere X is the brand of interest AGFI = adjusted goodness of fit index
CFI = comparative fit index RMSEA = root mean square error of approximation
Table I
2 2 8 J O U R N A L O F P R O D U C T amp B R A N D M A N A G E M E N T V O L 1 2 N O 4 2 0 0 3
832019 Brand Equity Mgt
httpslidepdfcomreaderfullbrand-equity-mgt 1017
Brand market performance We employ brand sales volume as a measure of
market performance and use the three-item scale developed by Lassar
(1998) One item asks for the percentage of sales volume attributable to X
The other two items are scale responses ``Compared to all other tile brands
we carry X generates the largest sales volumersquorsquo (1 = strongly disagree plusmn
strongly agree = 5) and ``Relative to all other tile brands we carry the sales
potential for X is rsquorsquo (1 = lowest plusmn highest = 5)
Customer perceived value Based on the conceptualization of perceived
value as a trade-off between benefits and sacrifices (costs) the scale for
customer perceived value is obtained from Dodds et al (1991) This scale
uses seven-point responses and the seven statements included relate to items
such as value for money and satisfaction ``The product is considered to be a
good buyrsquorsquo (1 = strongly disagree plusmn strongly agree = 7) and ``My customers
are satisfied when they buyrsquorsquo (1 = strongly disagree plusmn strongly agree = 7)
Purchase intention Purchase intention includes five items such as ``The
likelihood that my customers purchase X is (1 = very low plusmn very high = 7)
and ``At the usual price my customers would consider buying Xrsquorsquo (1 =
strongly disagree plusmn strongly agree = 7) This scale is based on Dodds et al(1991)
Reliability and validity assessments
Given the multiple-item nature of the scales used in this research we
assessed their psychometric properties following the recommendations of
Churchill (1979) and Gerbing and Anderson (1988) First each scale was
subjected to exploratory factor analysis loading on the dominant factor (at
least at 05) with a sum of the items in the factor explaining more that 50 per
cent of the factorrsquos variance Second reliability analyses were conducted
(Cronbach 1951) The alpha coefficients range from 080 to 093 and are
well above the 070 level suggested by Nunnally (1978) Third based onGerbing and Anderson (1988) we also performed confirmatory factor
analysis (CFA) using maximum likelihood estimation procedures for
measure validation The results indicate both acceptable model fits and item
properties and are shown in Table I The overall model fit indices chi-
squaredegrees of freedom adjusted goodness of fit index (AGFI)
comparative fit index (CFI) and root mean square error of approximation
(RMSEA) indicate acceptable model fits All items significantly load on
their corresponding construct (lowest t -value is 473) demonstrating
adequate convergent validity
Following the recommendations of Bagozzi et al (1991) pairwise
comparisons of the constructs within our models were conducted to examineconvergent and discriminate validity We arranged the measures into
subgroups with the first measurement model comprising the brand equity
constructs and the second measurement model consisting of the
consequences constructs All latent-trait correlations are significantly
different at one because each phi-value plus or minus twice the standard
error does not include one thus indicating discriminant validity Tables I
and II provide the summary statistics for the constructs used in testing the
hypotheses Table III shows the correlations within the constructs
To summarize the psychometric properties of the measures are acceptable
For further analyses the individual items of each measure were combined by
calculating the arithmetic means The items relating to reseller performance
were first standardized
B e n e fit s a n d s a c r if ic e s
P a ir w i s e c o m p a ri s o n s
J O U R N A L O F P R O D U C T amp B R A N D M A N A G E M E N T V O L 1 2 N O 4 2 0 0 3 2 2 9
832019 Brand Equity Mgt
httpslidepdfcomreaderfullbrand-equity-mgt 1117
Analysis and results
The primary tests of the hypotheses employed (linear) single and multiple
regression analysis (Cohen and Cohen 1983) The findings obtained from
these analyses are reported in Table IV Both single and multiple regression
analyses results show significant ( p lt 001) F -values (lowest F -value 1142)
indicating good overall model fit Examining the magnitude of the adjusted
R-squared value also leads us to conclude that acceptable amounts of the
variance of the dependent variables can be explained (lowest R-squared
017) Multicollinearity was not a problem as the variance inflation factors
are well below the critical level of 10 All of the coefficients are significant
at p lt 001 with the exception of one coefficient (brand awareness) in one
model which is significant at p lt 005 Moreover the coefficients are all
positive as hypothesized
In the first model the three brand equity dimensions brand awareness (016)
perceived quality (028) and brand loyalty (033) are significant predictors
of brand profitability performance Together the three predictors explain 34
percent of the variation in profitability performance Therefore strong
support for the first three hypotheses ( H1a-H1c) is found
Using brand market performance as the dependent variable the standardized
coefficients (brand awareness 018 perceived quality 022 brand loyalty
034) of the independent variables are significant which supports H2a H2b
and H2c
Of the variance of customer value 31 per cent is explained by the three
brand equity dimensions The estimated standardized coefficients of the
three independent variables (brand awareness 018 perceived quality 021
brand loyalty 019) are all significant Hence support is found for H3a H3b
and H3c
Performing single regression analyses the findings indicate a significant
relationship between customer value and purchase intention (coefficient
054) which supports H4 Also when purchase intention is regressed on
brand market performance (coefficient 062) and brand profitability
performance (coefficient 055) significant results are obtained Therefore
the analyses provide strong support for H5 and H6
Conclusion and implications
The objective of this study was to investigate the effects of using measures of
brand equity as indicators of performance Perceived quality brand loyalty
and brand association were selected as measures of brand equity Results
indicate that all three measures are significant predictors of performance
Constructs (number of items)
Coefficient
alphas
Mean
(standard deviation) Range
Brand awareness (6) 086 394 (081) 100-500
Perceived quality (8) 090 351 (067) 163-500
Brand loyalty (4) 080 241 (086) 100-440
Brand profitability (4)a
080 na na
Brand market performance (3)a
083 na na
Customer perceived value (8) 087 430 (102) 117-683Purchase intention (3) 093 320 (128) 100-667
Notes na = not applicable adue to different scales used as measures for the items thescale was standardized
Table II Summary statistics for constructs
E q u it y d im e n s i o n s
R e g re s s io n a n a ly s e s
2 3 0 J O U R N A L O F P R O D U C T amp B R A N D M A N A G E M E N T V O L 1 2 N O 4 2 0 0 3
832019 Brand Equity Mgt
httpslidepdfcomreaderfullbrand-equity-mgt 1217
B r a n d a w a r e n e s s
P e r c e i v e d q u a l i t y
B r a n d l o y a l t y
B r a n d
p r o f i t a b i l i t y
B r a n d s a l e s
v o l u m e
C u s t o m e r
p e r c e i v e d v a l u
e
P u r c h a s e i n t e n t i o n
B r a n d
a w a r e n e s s
P e r c e i v e d q u a l i t y
0 2
2
B r a n d
l o y a l t y
0 3
4
0 4
6
B r a n d
p r o f i t a b i l i t y p e r f o r m a n c e
0 3
4
0 4
7
0 5
2
B r a n d
m a r k e t p e r f o r m a n c e
0 3
9
0 4
1
0 5
0
0 7
0
C u s t o
m e r p e r c e i v e d v a l u e
0 2
9
0 3
3
0 3
5
0 3
8
0 3
1
P u r c h
a s e i n t e n t i o n
0 3
4
0 4
7
0 5
2
0 5
5
0 6
2
0 5
4
N o t e s
A l l c o r r e l a t i o n s s i g n i f i c a n t a t p lt 0 0
1
T a b l e
I I I C o r r e l a t i o n c o e f f i c i e n t s b y c o n s t r u c t
J O U R N A L O F P R O D U C T amp B R A N D M A N A G E M E N T V O L 1 2 N O 4 2 0 0 3 2 3 1
832019 Brand Equity Mgt
httpslidepdfcomreaderfullbrand-equity-mgt 1317
measures This was true for all three indicators of performance brand
profitability brand sales volume and customer perceived value
The standardized coefficients from the regression analysis in Table IV
provide some indication of the relative importance of the three brand equity
measures as predictors of performance Intercorrelations exist among the
measures as brand awareness and perceived quality will ultimately affect
brand loyalty The standardized coefficients reflect this relationship since the
coefficient for brand loyalty is almost double that of brand awareness
Loyalty is an important predictor of performance Given the difficulty in
selecting a parsimonious yet comprehensive set of performance measures
managers might consider the greater potential information content of ameasure such as brand loyalty
Building brand loyalty is an actionable initiative for manufacturers Possible
actions include creating a reason-to-buy differentiationpositioning creating
value chain member interest and making brand extensions (eg new tile
designs) (Aaker 1991) Brand loyalty increase can be measured on a
longitudinal basis Our research supports the relevance of tracking resellersrsquo
perceptions of brand loyalty
The brand equity constructs have been validated in previous research and
our study lends support to these scales from a unique perspective in the value
chain plusmn resellers The significance of the brand equity measures has
important implications for developing measures of other intangible assetsOur results supported a relationship between non-financial measures and
indicators of performance Without a link to performance the measures are
unlikely to generate results that support the strategic objectives of a firm
A major implication of our research results refers to strategic channel
partnerships (Narus and Anderson 1986) Given the positive relationships
among channel partners the sacrifices and benefits of manufacturers and
resellers have to be assessed and continually developed Although not
examined in this research problems of channel conflict like power or
opportunism are also of central issue (Webster 2000) More importantly as
the new economy compels less traditional and more cooperative ways of
conducting business it is essential to consider the impact of these
cooperative ventures on performance measurement
Dependent variables
Independent
variables
Standardized
- -coefficient
(t-value) F -value
Adjusted
R2
Brand profitability performance Brand awareness 016 (233) 2776 034
Perceived quality 028 (376)
Brand loyalty 033 (435)
Brand market perf or mance Brand awar eness 018 (250) 2334 031
Perceived quality 022 (284)Brand loyalty 034 (427)
Customer perceived value Brand awareness 018 (227) 1142 017
Perceived quality 021 (246)
Brand loyalty 019 (222)
Purchase intention Customer
p ercei ved v alu e 05 4 (79 3) 6 29 3 0 2 9
Brand market performance Purchase intention 062 (963) 9266 038
Brand profitability performance Purchase intention 055 (802) 6436 029
Notes Significant at p lt 001 unless noted Significant at p = 005
Table IV Results of single and multiple regression analysis
In it ia ti v e fo r m a n u fa c t u r e rs
R e s e a r c h r e s u lt s
2 3 2 J O U R N A L O F P R O D U C T amp B R A N D M A N A G E M E N T V O L 1 2 N O 4 2 0 0 3
832019 Brand Equity Mgt
httpslidepdfcomreaderfullbrand-equity-mgt 1417
It is apparent from the study results that factors other than brand equity also
impact performance since the variations in performance explained by brand
equity ranges from 17 to 34 percent (Table IV R-squared values) Brand
equity is an important predictor of performance but other factors such as
competition prices and expenses also impact performance A shortcoming
of our research is the focus on cross-sectional data Hence we are not able to
explore the long-term effects of brand equity on performance Clearly future
studies could refer to longitudinal data Tracking at the reseller level of the
value chain should be more feasible than end-user tracking of brand equity
The reliance on subjective information in our study might be a matter of
concern as well While brand equity from a customer-based perspective and
perceived customer value require quasi subjective information by definition
an alternative view might suggest that objective assessments are necessary
with respect to performance measures However Dess and Robinson (1984)
found no significant differences comparing the validity of subjective and
objective performance measures Nonetheless in future research the model
could be replicated using more objective performance data
Note
1 We term these intermediaries resellers as they distribute the products (tiles) to both
businesses and customers
References
Aaker DA (1989) ``Managing assets and skills the key to a sustainable competitive
advantagersquorsquo California Management Review Vol 32 Winter pp 91-106
Aaker DA (1991) Managing Brand Equity The Free Press New York NY
Aaker DA (1996a) Building Strong Brands The Free Press New York NY
Aaker DA (1996b) ``Measuring brand equity across products and marketsrsquorsquo California
Management Review Vol 38 No 3 pp 102-20Aaker DA and Jacobson R (1994) ``The financial information content of perceived
qualityrsquorsquo Journal of Marketing Research Vol 31 pp 191-201
Armstrong JS and Overton TS (1977) ` Estimating non-response bias in mail surveysrsquorsquo
Journal of Marketing Research Vol 14 August pp 396-402
Bagozzi RP Yi Y and Phillips LW (1991) ``Assessing construct validity in organizational
researchrsquorsquo Administrative Science Quarterly Vol 36 September pp 421-58
Barth ME Clement MB Foster G and Kasznik R (1998) ` Brand values and capital
market valuationrsquorsquo Review of Accounting Studies Vol 3 pp 41-68
Barwise P (1993) ``Brand equity snark or boojumrsquorsquo International Journal of Research in
Marketing Vol 10 March pp 93-104
Barwise P Higson C Likierman A and Marsh P (1989) Accounting for Brands London
Business School and the Institute of Chartered Accountants in England and Wales
London
Beatty SE and Kahle LR (1988) ``Alternative hierarchies of the attitude-behavior
relationship the impact of brand commitment and habitrsquorsquo Journal of the Academy of
Marketing Science Vol 16 Summer pp 1-10
Churchill GA Jr (1979) ` A paradigm for developing better m easures of marketing
constructsrsquorsquo Journal of Marketing Research Vol 16 February pp 64-73
Cohen J and Cohen P (1983) Applied Multiple RegressionCorrelation Analysis for the
Behavioral Sciences (2nd ed) Lawrence Erlbaum Associates Hillsdale NJ
Cronbach LJ (1951) ``Coefficient alpha and the internal structure of testsrsquorsquo Psychometrika
Vol 16 September pp 297-334
Dess GG and Robinson RB (1984) ``Measuring organizational performance in the absence
of objective measures the case of privately-held firm and conglomerate business unitrsquorsquo
Strategic Management Journal Vol 5 pp 265-73
S u b je c t iv e in fo r m a t io n
J O U R N A L O F P R O D U C T amp B R A N D M A N A G E M E N T V O L 1 2 N O 4 2 0 0 3 2 3 3
832019 Brand Equity Mgt
httpslidepdfcomreaderfullbrand-equity-mgt 1517
Dodds WB Monroe KB and Grewal D (1991) ` Effects of price brand and store
information on buyersrsquo product evaluationrsquorsquo Journal of Marketing Research Vol 28
August pp 307-19
Gerbing DW and Anderson JC (1988) ` An updated paradigm for s cale development
incorporating unidimensionality and its assess mentrsquorsquo Journal of Marketing Research
Vol 25 May pp 186-92
Grover R and Srinivasan V (1992) ``Evaluating the multiple effects of retail promotions on
brand-loyal and brand-switching segmentsrsquorsquo Journal of Marketing Research Vol 18
February pp 76-89
Hoyer W D and Brown SP (1990) ``Effects of brand awareness on choice for a common
repeat purchase productrsquorsquo Journal of Consumer Research Vol 17 pp 141-8
Jacobson R and Aaker DA (1987) ``The strategic role of product qualityrsquorsquo Journal of
Marketing Vol 51 October pp 31-44
Kaplan RS and Johnson T (1987) Relevance Lost The Rise and Fall of Management
Accounting Harvard Business School Press Boston MA
Keller KL (1993) ``Conceptualizing measuring and managing customer-based brand
equityrsquorsquo Journal of Marketing Vol 57 January pp 1-22
Keller KL (1998) Building Measuring and Managing Brand Equity Prentice Hall
Englewood Cliffs NJ
Lane V and Jacobson R (1995) ``Stock market reactions to brand extension announcements
the effects of brand attitude and familiarityrsquorsquo Journal of Marketing Vol 59 January
pp 63-77
Lassar WM (1998) ``Control systems in supplier-retailer relationships and their impact on
brand performancersquorsquo Journal of Retailing and Consumer Services Vol 5 No 2 pp 65-75
Monroe KB and Krishnan R (1985) ` The effect of price on s ubjective product
evaluationsrsquorsquo in Jacoby J and Olson J (Eds) Perceived Quality Lexington Books
Lexington MA pp 209-32
Narus JA and Anderson JC (1986) ` Turn your industrial distributors into partnersrsquorsquo
Harvard Business Review Vol 64 MarchApril pp 66-71
Nunnally JC (1978) Psychometric Theory 2nd ed McGraw-Hill New York NY
Oliver RL (1997) Satisfaction A Behavioral Perspective on the Consumer McGraw-Hill
New York NY
Phillips LW Chang DR and Buzzell RD (1983) ``Product quality cost position and
business performance a test of some key hypothesesrsquorsquo Journal of Marketing Vol 47
Spring pp 26-43
Shocker AD Srivastava RK and Ruekert RW (1994) ``Challenges and opportunities
facing brand management an introduction to the special issuersquorsquo Journal of Marketing
Research Vol 31 pp 149-58
Spreng RA Harrell GD and Mackoy RD (1995) ` Service recovery impact on
satisfaction and intentionsrsquorsquo Journal of Service Marketing Vol 9 No 1 pp 15-23
Webster FE (2000) ` Understanding the relationships among brands consumers and
resellersrsquorsquo Journal of the Academy of Marketing Science Vol 28 No 1 pp 17-23
Yoo B and Donthu N (2001) ` Developing and validating a multidimensional consumer-
based brand equity scalersquorsquo Journal of Business Research Vol 52 pp 1-14
Yoo B Donthu N and Lee S (2000) ``An examination of selected marketing mix elements
and brand equityrsquorsquo Journal of the Academy of Marketing Science Vol 28 No 2
pp 195-211
Zeithaml VA (1988) ``Consumer perceptions of price quality and value a means-end
model and synthesis of evidencersquorsquo Journal of Marketing Vol 52 July pp 2-22
amp
2 3 4 J O U R N A L O F P R O D U C T amp B R A N D M A N A G E M E N T V O L 1 2 N O 4 2 0 0 3
832019 Brand Equity Mgt
httpslidepdfcomreaderfullbrand-equity-mgt 1617
Executive summary and implications for managers andexecutives
Brand investment benefits sales and the firmrsquos value
The debate around brand equity and brand valuation has in many ways
settled into two camps plusmn the consumer-based approach (mostly marketers)
and the aggregate sales approach (mostly accountants) I appreciate that
this is a gross over-simplification of the distinction between different approaches and that many models (and much of current theory) endeavour
to join together the two approaches However it is important for marketers
to appreciate that they have yet to fully convince others of the validity of
consumer-based approaches to the measurement of brand equity
Baldauf e t a l set out to produce further validation of the consumer-based
model by examining how the dimensions of brand equity are antecedents of
firm performance and especially sales and profitability This consideration is
important since much of the brand valuation debate concerns the treatment
of the brand on the balance sheet rather than its impact on the profit and loss
account And while marketers will always argue that brands are important
intangible assets (thereby meriting inclusion within the balance sheet) muchof our work as marketers is intended to influence sales and profitability
The antecedents of brand equity
Baldauf Cravens and Binder draw on Aakerrsquos model of brand equity in their
study focusing on the three most important antecedents of brand equity plusmn
brand loyalty brand awareness and perceived quality Aakerrsquos argument is
that where a brand has loyal customers high levels of market awareness and
is perceived to be of high quality it will have a high level of equity plusmn it is
more valuable to the firm
This means that the firmrsquos strategy needs to address each antecedent plusmn
focusing on one or other element will not necessarily deliver brand value However given that we are concerned here with the effect on sales volumes
and profits we need to ask whether achieving positive effect in this area
requires a different balance within the strategy Indeed there could
conceivably be a conflict between strategies aimed at increasing the firmrsquos
value (a balance sheet strategy) and strategies aimed at increasing sales (a
profit and loss strategy)
There is a concern that the latter approach to strategy can result in a sales
promotion led approach to marketing as a complement to the corporate
focus on cash flow and short-term profits Therefore being able to
demonstrate that strategies aimed at increasing brand value also produce
short-term benefits in terms of sales and profitability means being able to justify important brand strategies in a climate of short-term focus
Brand equity is not the only thing influencing performance
While brand strategies are important we have to recognise (and Baldauf
et al remind us) that performance is not solely influenced by brand equity
Marketers have to pay attention to other factors and especially to issues
often dismissed as tactical or mere implementation The marketing director
who fails to appreciate that tactical errors and sloppy implementation can
wreck a strategy should not keep his job
Baldauf et al identify three influences other than brand equity plusmn competition
pricing and expenses Since these clearly have an impact on performance
any marketing strategy needs to be flexible enough and the firm needs also to
J O U R N A L O F P R O D U C T amp B R A N D M A N A G E M E N T V O L 1 2 N O 4 2 0 0 3 2 3 5
T h is s u m m a ry h a s b e e n
p r o v id e d t o a ll o w m a n a g e r s
a n d e x e c u t i v e s a r a p id
a p p r e c i a ti o n o f t h e c o n t e n t
o f t h is a r ti c le T h o s e w it h a
p a r t ic u la r in t e r e s t i n t h e
t o p ic c o v e r e d m a y t h e n r e a d
t h e a r t ic l e i n t o t o t o t a k e a d v a n t a g e o f t h e m o r e
c o m p r e h e n s i v e d e s c r i p ti o n
o f t h e r e s e a r c h u n d e rt a k e n
a n d it s r e s u lt s t o g e t t h e fu ll
b e n e fit o f t h e m a t e r ia l
p r e s e n t
832019 Brand Equity Mgt
httpslidepdfcomreaderfullbrand-equity-mgt 1717
pay attention to its performance in terms of cost containment In addition the
impact of pricing and competition requires a regular reality check against
what is actually happening in the market
However too many firms concentrate on these other issues and respond to
market changes by fine tuning tactics undertaking reactive sales promotions
and trimming costs Often the equally important task of developing brand
equity gets lost in the tactical war with competitors plusmn firms must remember that investing in brand equity has a direct impact on sales (elsewhere in this
issue of JPBM Ataman and U Egrave lengin provide a substantive assessment of this
impact) as well as contributing plusmn accounting approaches allowed plusmn to the
firmrsquos overall value
Brand equity strategies plusmn options
We have noted that the dominant elements of Aakerrsquos brand equity model are
brand loyalty brand awareness and perceived quality but this does not
provide us with a direct guide to the setting of strategies Aaker also included
in his model brand associations and other proprietary assets such as
intellectual property and for some brands these considerations are of
considerable importance
The brand strategy first strikes a balance between investing in awareness plusmn
telling people about the brand plusmn and investing in brand loyalty and repeat
purchase While it remains the case that securing repeat purchase is (all
things being equal) more easy than recruiting a new customer we cannot
overlook the need to maintain and extend our brandrsquos position within the
portfolio of brands from which the consumer chooses
Brand investment therefore should consist of general advertising primarily
aimed at building brand awareness and merchandising sales promotions
direct marketing and packaging that reinforces the choice made by
consumers The price details of the mix depend on the stability of marketsrates of market growth or decline competitor activity and the tactical
demands of distribution channels (and especially retailers)
Baldauf et al provide further evidence that brand investment contributes to
overall firm performance and while such investment should not be to the
exclusion of other factors (price c ompetition etc) that affect performance it
is a central element of successful consumer goods marketing What is very
clear is that investing in the brand is about sales and profits as well as the
overall value of the brand itself
(A preAcirccis of the article ``Performance c onsequences of brand equity
management evidence from organizations in the value chainrsquorsquo Supplied byMarketing Consultants for Emerald)
832019 Brand Equity Mgt
httpslidepdfcomreaderfullbrand-equity-mgt 717
relationships in general plusmn resellers of tiles[1] Specifically tiles are used in a
variety of construction applications though their main uses are for floor and
wall decorations Tiles are used for brand equity assessment since the
product is relatively homogenous and does not lend itself to multiple product
subcategories In Europe there is a high level of brand identity associated
with tiles Tiles are used for the same basic function and typically vary in
perceived quality and brand image Thus it is possible to assess the
dimensions of brand equity without having to control for a wide range of product variations
We selected tile resellers to solicit the most comprehensive assessment of
customer perceptions along with collecting measures of market performance
The perspectives of resellers provide unique insights since they act at the
customer and manufacturer interface Resellers possess knowledge regarding
the perceptions and preferences of their customers and also are aware of the
market performance and relative profitability of the suppliersrsquo brands that
they distribute Hence using responses from intermediaries provides an
opportunity for consideration of customer perceptions along with firm
performance
Based on existing literature and insight from experts we developed and
pretested a standardized questionnaire The questionnaires were mail
distributed to executives from 794 tile resellers in Austria carrying products
from manufacturers located in various countries We studied the perceptions
of Austrian tile resellers distributing tiles manufactured in Italy the Czech
Republic and Slovakia Because of Austriarsquos central location linking
Western Europe and the former Eastern European countries it was
considered as an appropriate research site to examine brand equity and its
consequences Also we were able to collect information from quasi-neutral
people about different brands produced by tile manufacturers from Italy the
Czech Republic and Slovakia Thus major manufacturers are represented
without adding substantial home country source bias The sample group wasderived from an industry list of companies and the ``golden pagesrsquorsquo of the
Austrian Chamber of Commerce
To enhance the response rate of our mail survey we provided pre-addressed
and pre-stamped envelopes assured anonymity and offered a summary of
the research findings as an incentive to the participants After several follow-
up procedures (eg telephone calls new mailings) responses from 189
executives were obtained Due to missing information the final sample
consisted of information from 154 managers In addition 30 questionnaires
were returned as undeliverable Considering this information we achieved a
20 per cent response rate Of these 154 managers 52 (338 per cent) assessed
the Italian 51 (331 per cent) the Czech and 51 (331 per cent) the Slovakian
brand Of the respondents 115 (747 per cent) were male and 39 (253 per
cent) female The median number of years the managers had been doing
business in the industry was 22
Non-response bias was examined using the method proposed by Armstrong
and Overton (1977) A viable check for non-response bias is to split the
sample into early and late respondents No significant differences at the 005
level between the two groups were found which leads us to conclude that
non-response bias is not a major issue
Scale construction
The scales used for both the elements and consequences of brand equity are
described in Table I
A s s e s s m e n t o f c u s t o m e r
p e r c e p t io n s
R e s p o n s e r a t e
2 2 6 J O U R N A L O F P R O D U C T amp B R A N D M A N A G E M E N T V O L 1 2 N O 4 2 0 0 3
832019 Brand Equity Mgt
httpslidepdfcomreaderfullbrand-equity-mgt 817
Construct
Scale items
Scale measure 1 strongly disagree
to 5 strongly agree unless noted Source
Standardized
loading t value
Brand awaren ess I know what X looks like Yoo et al 081 plusmn
Agrave2df = 48 I can recognize X among other brands (2000) 075 976
AGFI = 082 I am aware of X 071 913
CFI = 091
RMSEA = 010
Some characteristics of X come to my
mind quickly 071 994
I can quickly recall the symbol or logoof X 064 798
I have difficulty in imagining X in my
mind 061 756
Perceived quality X is of high quality Yoo et al 083 plusmn
Agrave2df = 26
AGFI = 085
The likelihood that X would be
functional is very high
(2000) and
Dodds et al 069 942
CFI = 095 X appears to be of very poor quality (1991) 059 765
RMSEA = 008
The likelihood that X is reliable is very
high 068 922
The workmanship of X would be high 069 941
X must be of very good quality 078 1104
The likelihood that X is dependable is
very high 080 1151
X seems to be durable 070 953Brand loyal ty I consider myself to be l oyal to X Yoo et al 082 plusmn
Agrave2df = 78 X would be my first choice (2000) and 062 684
AGFI = 084
CFI = 091
I will not buy other brands if X is
available at the wholesaler
Beatty and
Kahle
(1988) 043 473
RMSEA = 011
If X were not available at the wholesaler
it would make little difference to me if I
had to choose another brand 066 736
When another brand is on sale I will
generally purchase it rather than X 070 769
Brand profitability
performance
Agrave2df = 12
Compared to all other brands available
in our trade area the profitability for
carrying X is (1 = lowest-highest = 5)
Lassar
(1998)
086 plusmn
AGFI = 096
CFI = 099
RMSEA = 004
Relative to all other brands we carry the
realized margin for X is
(1 = lowest-
highest = 5) 079 936
Overall X is financially very attractive
for us 065 787
What percentage of your total profit
derived from the sale of tiles is
attributable to X (percentage value) 054 646
Brand market
performance
What percentage of your tile sales
volume is attributable to X ()
Lassar
(1998) 076 plusmn
Agrave2df = 014
AGFI = 099
Compared to all other tile brands we
carry X generates the larges sales volume 082 1004
CFI = 100
RMSEA lt 001
Relative to all other tile brands we carry
the sales potential for X is
(1 = lowest-highest = 5) 077 plusmn
Customerperceived value
Agrave2df = 511
My customers consider X to be
(1 = very poor value for money- very
good value for money = 7)
Dodds et al(1991)
065 plusmn
AGFI = 088
CFI = 094
RMSEA = 007
At the usual price my customers consider
X to be (1 = very uneconomical-very
economical = 7) 075 786
The product is considered to be a good
buy (1 = strongly disagree-strongly
agree = 7) 078 780
My customers consider the usual price for
X to be (1 = very unacceptable-very
acceptable = 7) 076 764
(continued)
Table I Scale development for constructs
J O U R N A L O F P R O D U C T amp B R A N D M A N A G E M E N T V O L 1 2 N O 4 2 0 0 3 2 2 7
832019 Brand Equity Mgt
httpslidepdfcomreaderfullbrand-equity-mgt 917
Perceived quality The scale for perceived quality is based on Dodds et al
(1991) Yoo et al (2000) employed perceived quality to address the overall
evaluation of quality and to avoid considering specific elements of quality
There are eight items in the scale for perceived quality The scale allows a
response from ``1rsquorsquo (strongly disagree) to ``5rsquorsquo (strongly agree) to statements
such as ``X is of high qualityrsquorsquo ``The likelihood that X is reliable is very
highrsquorsquo and ``The likelihood that X is dependable is very highrsquorsquo
Brand loyalty The scale for brand loyalty was developed by Beatty and
Kahle (1988) and has been adapted by Yoo et al (2000) The scale includes
five items With a five-point response scale ranging from ``1rsquorsquo (strongly
disagree) to ``5rsquorsquo (strongly agree) statements for the scale items include ``X
would be my first choicersquorsquo and ``I will not buy other brands if X is available
at the wholesalerrsquorsquo
Brand awareness The scale for brand awareness consists of six itemsdeveloped by Yoo et al (2000) Respondents used a five-point scale
anchored by ``1rsquorsquo (strongly disagree) to ``5rsquorsquo (strongly agree) to statements
ranging from ``I can recognize X among other brandsrsquorsquo to ``Some
characteristics of X come to my mind quicklyrsquorsquo
Brand profitability performance The scale for brand profitability
performance has four items as developed by Lassar (1998) Three of the
items allow a scale response such as ``Compared to all other brands
available in our trade area the profitability for carrying X is rsquorsquo with ``1rsquorsquo =
lowest plusmn highest = ``5rsquorsquo Another item asks ``What percentage of your total
profit derived from the sale of tiles is attributable to Xrsquorsquo Resellers are able to
make this assessment since the product offerings to the reseller are indeed
based upon the incentives offered to choose particular brands
Construct
Scale items
Scale measure 1 strongly disagree
to 5 strongly agree unless noted Source
Standardized
loading t value
X appears to my customers to be a
bargain (1 = strongly disagree-strongly
agree = 7) Del plusmn
My customers are satisfied when they buy
X (1 = strongly disagree-strongly
agree = 7) Del plusmnThe decision of customers to buy X is
confirmed (1 = strongly disagree-strongly
agree = 7) 069 609
Purchase intention
Agrave2df = 007
The likelihood that my customers
purchase X is (1 = very low-very
high = 7)
Dodds et al
(1991) 088 plusmn
AGFI = 099
CFI = 100
RMSEA lt 001
If a customer is going to buy X heshe
would consider buying X at the usual
price (1 = strongly disagree-strongly
agree = 7) Del plusmn
At the usual price my customers would
consider buying X (1 = strongly disagree-
strongly agree = 7) Del plusmn
The probability that my customersconsider buying X is (1 = very low-
very high = 7) 093 1922
The willingness of my customers to buy
X is (1 = very low-very high = 7) 089 plusmn
NotesaWhere X is the brand of interest AGFI = adjusted goodness of fit index
CFI = comparative fit index RMSEA = root mean square error of approximation
Table I
2 2 8 J O U R N A L O F P R O D U C T amp B R A N D M A N A G E M E N T V O L 1 2 N O 4 2 0 0 3
832019 Brand Equity Mgt
httpslidepdfcomreaderfullbrand-equity-mgt 1017
Brand market performance We employ brand sales volume as a measure of
market performance and use the three-item scale developed by Lassar
(1998) One item asks for the percentage of sales volume attributable to X
The other two items are scale responses ``Compared to all other tile brands
we carry X generates the largest sales volumersquorsquo (1 = strongly disagree plusmn
strongly agree = 5) and ``Relative to all other tile brands we carry the sales
potential for X is rsquorsquo (1 = lowest plusmn highest = 5)
Customer perceived value Based on the conceptualization of perceived
value as a trade-off between benefits and sacrifices (costs) the scale for
customer perceived value is obtained from Dodds et al (1991) This scale
uses seven-point responses and the seven statements included relate to items
such as value for money and satisfaction ``The product is considered to be a
good buyrsquorsquo (1 = strongly disagree plusmn strongly agree = 7) and ``My customers
are satisfied when they buyrsquorsquo (1 = strongly disagree plusmn strongly agree = 7)
Purchase intention Purchase intention includes five items such as ``The
likelihood that my customers purchase X is (1 = very low plusmn very high = 7)
and ``At the usual price my customers would consider buying Xrsquorsquo (1 =
strongly disagree plusmn strongly agree = 7) This scale is based on Dodds et al(1991)
Reliability and validity assessments
Given the multiple-item nature of the scales used in this research we
assessed their psychometric properties following the recommendations of
Churchill (1979) and Gerbing and Anderson (1988) First each scale was
subjected to exploratory factor analysis loading on the dominant factor (at
least at 05) with a sum of the items in the factor explaining more that 50 per
cent of the factorrsquos variance Second reliability analyses were conducted
(Cronbach 1951) The alpha coefficients range from 080 to 093 and are
well above the 070 level suggested by Nunnally (1978) Third based onGerbing and Anderson (1988) we also performed confirmatory factor
analysis (CFA) using maximum likelihood estimation procedures for
measure validation The results indicate both acceptable model fits and item
properties and are shown in Table I The overall model fit indices chi-
squaredegrees of freedom adjusted goodness of fit index (AGFI)
comparative fit index (CFI) and root mean square error of approximation
(RMSEA) indicate acceptable model fits All items significantly load on
their corresponding construct (lowest t -value is 473) demonstrating
adequate convergent validity
Following the recommendations of Bagozzi et al (1991) pairwise
comparisons of the constructs within our models were conducted to examineconvergent and discriminate validity We arranged the measures into
subgroups with the first measurement model comprising the brand equity
constructs and the second measurement model consisting of the
consequences constructs All latent-trait correlations are significantly
different at one because each phi-value plus or minus twice the standard
error does not include one thus indicating discriminant validity Tables I
and II provide the summary statistics for the constructs used in testing the
hypotheses Table III shows the correlations within the constructs
To summarize the psychometric properties of the measures are acceptable
For further analyses the individual items of each measure were combined by
calculating the arithmetic means The items relating to reseller performance
were first standardized
B e n e fit s a n d s a c r if ic e s
P a ir w i s e c o m p a ri s o n s
J O U R N A L O F P R O D U C T amp B R A N D M A N A G E M E N T V O L 1 2 N O 4 2 0 0 3 2 2 9
832019 Brand Equity Mgt
httpslidepdfcomreaderfullbrand-equity-mgt 1117
Analysis and results
The primary tests of the hypotheses employed (linear) single and multiple
regression analysis (Cohen and Cohen 1983) The findings obtained from
these analyses are reported in Table IV Both single and multiple regression
analyses results show significant ( p lt 001) F -values (lowest F -value 1142)
indicating good overall model fit Examining the magnitude of the adjusted
R-squared value also leads us to conclude that acceptable amounts of the
variance of the dependent variables can be explained (lowest R-squared
017) Multicollinearity was not a problem as the variance inflation factors
are well below the critical level of 10 All of the coefficients are significant
at p lt 001 with the exception of one coefficient (brand awareness) in one
model which is significant at p lt 005 Moreover the coefficients are all
positive as hypothesized
In the first model the three brand equity dimensions brand awareness (016)
perceived quality (028) and brand loyalty (033) are significant predictors
of brand profitability performance Together the three predictors explain 34
percent of the variation in profitability performance Therefore strong
support for the first three hypotheses ( H1a-H1c) is found
Using brand market performance as the dependent variable the standardized
coefficients (brand awareness 018 perceived quality 022 brand loyalty
034) of the independent variables are significant which supports H2a H2b
and H2c
Of the variance of customer value 31 per cent is explained by the three
brand equity dimensions The estimated standardized coefficients of the
three independent variables (brand awareness 018 perceived quality 021
brand loyalty 019) are all significant Hence support is found for H3a H3b
and H3c
Performing single regression analyses the findings indicate a significant
relationship between customer value and purchase intention (coefficient
054) which supports H4 Also when purchase intention is regressed on
brand market performance (coefficient 062) and brand profitability
performance (coefficient 055) significant results are obtained Therefore
the analyses provide strong support for H5 and H6
Conclusion and implications
The objective of this study was to investigate the effects of using measures of
brand equity as indicators of performance Perceived quality brand loyalty
and brand association were selected as measures of brand equity Results
indicate that all three measures are significant predictors of performance
Constructs (number of items)
Coefficient
alphas
Mean
(standard deviation) Range
Brand awareness (6) 086 394 (081) 100-500
Perceived quality (8) 090 351 (067) 163-500
Brand loyalty (4) 080 241 (086) 100-440
Brand profitability (4)a
080 na na
Brand market performance (3)a
083 na na
Customer perceived value (8) 087 430 (102) 117-683Purchase intention (3) 093 320 (128) 100-667
Notes na = not applicable adue to different scales used as measures for the items thescale was standardized
Table II Summary statistics for constructs
E q u it y d im e n s i o n s
R e g re s s io n a n a ly s e s
2 3 0 J O U R N A L O F P R O D U C T amp B R A N D M A N A G E M E N T V O L 1 2 N O 4 2 0 0 3
832019 Brand Equity Mgt
httpslidepdfcomreaderfullbrand-equity-mgt 1217
B r a n d a w a r e n e s s
P e r c e i v e d q u a l i t y
B r a n d l o y a l t y
B r a n d
p r o f i t a b i l i t y
B r a n d s a l e s
v o l u m e
C u s t o m e r
p e r c e i v e d v a l u
e
P u r c h a s e i n t e n t i o n
B r a n d
a w a r e n e s s
P e r c e i v e d q u a l i t y
0 2
2
B r a n d
l o y a l t y
0 3
4
0 4
6
B r a n d
p r o f i t a b i l i t y p e r f o r m a n c e
0 3
4
0 4
7
0 5
2
B r a n d
m a r k e t p e r f o r m a n c e
0 3
9
0 4
1
0 5
0
0 7
0
C u s t o
m e r p e r c e i v e d v a l u e
0 2
9
0 3
3
0 3
5
0 3
8
0 3
1
P u r c h
a s e i n t e n t i o n
0 3
4
0 4
7
0 5
2
0 5
5
0 6
2
0 5
4
N o t e s
A l l c o r r e l a t i o n s s i g n i f i c a n t a t p lt 0 0
1
T a b l e
I I I C o r r e l a t i o n c o e f f i c i e n t s b y c o n s t r u c t
J O U R N A L O F P R O D U C T amp B R A N D M A N A G E M E N T V O L 1 2 N O 4 2 0 0 3 2 3 1
832019 Brand Equity Mgt
httpslidepdfcomreaderfullbrand-equity-mgt 1317
measures This was true for all three indicators of performance brand
profitability brand sales volume and customer perceived value
The standardized coefficients from the regression analysis in Table IV
provide some indication of the relative importance of the three brand equity
measures as predictors of performance Intercorrelations exist among the
measures as brand awareness and perceived quality will ultimately affect
brand loyalty The standardized coefficients reflect this relationship since the
coefficient for brand loyalty is almost double that of brand awareness
Loyalty is an important predictor of performance Given the difficulty in
selecting a parsimonious yet comprehensive set of performance measures
managers might consider the greater potential information content of ameasure such as brand loyalty
Building brand loyalty is an actionable initiative for manufacturers Possible
actions include creating a reason-to-buy differentiationpositioning creating
value chain member interest and making brand extensions (eg new tile
designs) (Aaker 1991) Brand loyalty increase can be measured on a
longitudinal basis Our research supports the relevance of tracking resellersrsquo
perceptions of brand loyalty
The brand equity constructs have been validated in previous research and
our study lends support to these scales from a unique perspective in the value
chain plusmn resellers The significance of the brand equity measures has
important implications for developing measures of other intangible assetsOur results supported a relationship between non-financial measures and
indicators of performance Without a link to performance the measures are
unlikely to generate results that support the strategic objectives of a firm
A major implication of our research results refers to strategic channel
partnerships (Narus and Anderson 1986) Given the positive relationships
among channel partners the sacrifices and benefits of manufacturers and
resellers have to be assessed and continually developed Although not
examined in this research problems of channel conflict like power or
opportunism are also of central issue (Webster 2000) More importantly as
the new economy compels less traditional and more cooperative ways of
conducting business it is essential to consider the impact of these
cooperative ventures on performance measurement
Dependent variables
Independent
variables
Standardized
- -coefficient
(t-value) F -value
Adjusted
R2
Brand profitability performance Brand awareness 016 (233) 2776 034
Perceived quality 028 (376)
Brand loyalty 033 (435)
Brand market perf or mance Brand awar eness 018 (250) 2334 031
Perceived quality 022 (284)Brand loyalty 034 (427)
Customer perceived value Brand awareness 018 (227) 1142 017
Perceived quality 021 (246)
Brand loyalty 019 (222)
Purchase intention Customer
p ercei ved v alu e 05 4 (79 3) 6 29 3 0 2 9
Brand market performance Purchase intention 062 (963) 9266 038
Brand profitability performance Purchase intention 055 (802) 6436 029
Notes Significant at p lt 001 unless noted Significant at p = 005
Table IV Results of single and multiple regression analysis
In it ia ti v e fo r m a n u fa c t u r e rs
R e s e a r c h r e s u lt s
2 3 2 J O U R N A L O F P R O D U C T amp B R A N D M A N A G E M E N T V O L 1 2 N O 4 2 0 0 3
832019 Brand Equity Mgt
httpslidepdfcomreaderfullbrand-equity-mgt 1417
It is apparent from the study results that factors other than brand equity also
impact performance since the variations in performance explained by brand
equity ranges from 17 to 34 percent (Table IV R-squared values) Brand
equity is an important predictor of performance but other factors such as
competition prices and expenses also impact performance A shortcoming
of our research is the focus on cross-sectional data Hence we are not able to
explore the long-term effects of brand equity on performance Clearly future
studies could refer to longitudinal data Tracking at the reseller level of the
value chain should be more feasible than end-user tracking of brand equity
The reliance on subjective information in our study might be a matter of
concern as well While brand equity from a customer-based perspective and
perceived customer value require quasi subjective information by definition
an alternative view might suggest that objective assessments are necessary
with respect to performance measures However Dess and Robinson (1984)
found no significant differences comparing the validity of subjective and
objective performance measures Nonetheless in future research the model
could be replicated using more objective performance data
Note
1 We term these intermediaries resellers as they distribute the products (tiles) to both
businesses and customers
References
Aaker DA (1989) ``Managing assets and skills the key to a sustainable competitive
advantagersquorsquo California Management Review Vol 32 Winter pp 91-106
Aaker DA (1991) Managing Brand Equity The Free Press New York NY
Aaker DA (1996a) Building Strong Brands The Free Press New York NY
Aaker DA (1996b) ``Measuring brand equity across products and marketsrsquorsquo California
Management Review Vol 38 No 3 pp 102-20Aaker DA and Jacobson R (1994) ``The financial information content of perceived
qualityrsquorsquo Journal of Marketing Research Vol 31 pp 191-201
Armstrong JS and Overton TS (1977) ` Estimating non-response bias in mail surveysrsquorsquo
Journal of Marketing Research Vol 14 August pp 396-402
Bagozzi RP Yi Y and Phillips LW (1991) ``Assessing construct validity in organizational
researchrsquorsquo Administrative Science Quarterly Vol 36 September pp 421-58
Barth ME Clement MB Foster G and Kasznik R (1998) ` Brand values and capital
market valuationrsquorsquo Review of Accounting Studies Vol 3 pp 41-68
Barwise P (1993) ``Brand equity snark or boojumrsquorsquo International Journal of Research in
Marketing Vol 10 March pp 93-104
Barwise P Higson C Likierman A and Marsh P (1989) Accounting for Brands London
Business School and the Institute of Chartered Accountants in England and Wales
London
Beatty SE and Kahle LR (1988) ``Alternative hierarchies of the attitude-behavior
relationship the impact of brand commitment and habitrsquorsquo Journal of the Academy of
Marketing Science Vol 16 Summer pp 1-10
Churchill GA Jr (1979) ` A paradigm for developing better m easures of marketing
constructsrsquorsquo Journal of Marketing Research Vol 16 February pp 64-73
Cohen J and Cohen P (1983) Applied Multiple RegressionCorrelation Analysis for the
Behavioral Sciences (2nd ed) Lawrence Erlbaum Associates Hillsdale NJ
Cronbach LJ (1951) ``Coefficient alpha and the internal structure of testsrsquorsquo Psychometrika
Vol 16 September pp 297-334
Dess GG and Robinson RB (1984) ``Measuring organizational performance in the absence
of objective measures the case of privately-held firm and conglomerate business unitrsquorsquo
Strategic Management Journal Vol 5 pp 265-73
S u b je c t iv e in fo r m a t io n
J O U R N A L O F P R O D U C T amp B R A N D M A N A G E M E N T V O L 1 2 N O 4 2 0 0 3 2 3 3
832019 Brand Equity Mgt
httpslidepdfcomreaderfullbrand-equity-mgt 1517
Dodds WB Monroe KB and Grewal D (1991) ` Effects of price brand and store
information on buyersrsquo product evaluationrsquorsquo Journal of Marketing Research Vol 28
August pp 307-19
Gerbing DW and Anderson JC (1988) ` An updated paradigm for s cale development
incorporating unidimensionality and its assess mentrsquorsquo Journal of Marketing Research
Vol 25 May pp 186-92
Grover R and Srinivasan V (1992) ``Evaluating the multiple effects of retail promotions on
brand-loyal and brand-switching segmentsrsquorsquo Journal of Marketing Research Vol 18
February pp 76-89
Hoyer W D and Brown SP (1990) ``Effects of brand awareness on choice for a common
repeat purchase productrsquorsquo Journal of Consumer Research Vol 17 pp 141-8
Jacobson R and Aaker DA (1987) ``The strategic role of product qualityrsquorsquo Journal of
Marketing Vol 51 October pp 31-44
Kaplan RS and Johnson T (1987) Relevance Lost The Rise and Fall of Management
Accounting Harvard Business School Press Boston MA
Keller KL (1993) ``Conceptualizing measuring and managing customer-based brand
equityrsquorsquo Journal of Marketing Vol 57 January pp 1-22
Keller KL (1998) Building Measuring and Managing Brand Equity Prentice Hall
Englewood Cliffs NJ
Lane V and Jacobson R (1995) ``Stock market reactions to brand extension announcements
the effects of brand attitude and familiarityrsquorsquo Journal of Marketing Vol 59 January
pp 63-77
Lassar WM (1998) ``Control systems in supplier-retailer relationships and their impact on
brand performancersquorsquo Journal of Retailing and Consumer Services Vol 5 No 2 pp 65-75
Monroe KB and Krishnan R (1985) ` The effect of price on s ubjective product
evaluationsrsquorsquo in Jacoby J and Olson J (Eds) Perceived Quality Lexington Books
Lexington MA pp 209-32
Narus JA and Anderson JC (1986) ` Turn your industrial distributors into partnersrsquorsquo
Harvard Business Review Vol 64 MarchApril pp 66-71
Nunnally JC (1978) Psychometric Theory 2nd ed McGraw-Hill New York NY
Oliver RL (1997) Satisfaction A Behavioral Perspective on the Consumer McGraw-Hill
New York NY
Phillips LW Chang DR and Buzzell RD (1983) ``Product quality cost position and
business performance a test of some key hypothesesrsquorsquo Journal of Marketing Vol 47
Spring pp 26-43
Shocker AD Srivastava RK and Ruekert RW (1994) ``Challenges and opportunities
facing brand management an introduction to the special issuersquorsquo Journal of Marketing
Research Vol 31 pp 149-58
Spreng RA Harrell GD and Mackoy RD (1995) ` Service recovery impact on
satisfaction and intentionsrsquorsquo Journal of Service Marketing Vol 9 No 1 pp 15-23
Webster FE (2000) ` Understanding the relationships among brands consumers and
resellersrsquorsquo Journal of the Academy of Marketing Science Vol 28 No 1 pp 17-23
Yoo B and Donthu N (2001) ` Developing and validating a multidimensional consumer-
based brand equity scalersquorsquo Journal of Business Research Vol 52 pp 1-14
Yoo B Donthu N and Lee S (2000) ``An examination of selected marketing mix elements
and brand equityrsquorsquo Journal of the Academy of Marketing Science Vol 28 No 2
pp 195-211
Zeithaml VA (1988) ``Consumer perceptions of price quality and value a means-end
model and synthesis of evidencersquorsquo Journal of Marketing Vol 52 July pp 2-22
amp
2 3 4 J O U R N A L O F P R O D U C T amp B R A N D M A N A G E M E N T V O L 1 2 N O 4 2 0 0 3
832019 Brand Equity Mgt
httpslidepdfcomreaderfullbrand-equity-mgt 1617
Executive summary and implications for managers andexecutives
Brand investment benefits sales and the firmrsquos value
The debate around brand equity and brand valuation has in many ways
settled into two camps plusmn the consumer-based approach (mostly marketers)
and the aggregate sales approach (mostly accountants) I appreciate that
this is a gross over-simplification of the distinction between different approaches and that many models (and much of current theory) endeavour
to join together the two approaches However it is important for marketers
to appreciate that they have yet to fully convince others of the validity of
consumer-based approaches to the measurement of brand equity
Baldauf e t a l set out to produce further validation of the consumer-based
model by examining how the dimensions of brand equity are antecedents of
firm performance and especially sales and profitability This consideration is
important since much of the brand valuation debate concerns the treatment
of the brand on the balance sheet rather than its impact on the profit and loss
account And while marketers will always argue that brands are important
intangible assets (thereby meriting inclusion within the balance sheet) muchof our work as marketers is intended to influence sales and profitability
The antecedents of brand equity
Baldauf Cravens and Binder draw on Aakerrsquos model of brand equity in their
study focusing on the three most important antecedents of brand equity plusmn
brand loyalty brand awareness and perceived quality Aakerrsquos argument is
that where a brand has loyal customers high levels of market awareness and
is perceived to be of high quality it will have a high level of equity plusmn it is
more valuable to the firm
This means that the firmrsquos strategy needs to address each antecedent plusmn
focusing on one or other element will not necessarily deliver brand value However given that we are concerned here with the effect on sales volumes
and profits we need to ask whether achieving positive effect in this area
requires a different balance within the strategy Indeed there could
conceivably be a conflict between strategies aimed at increasing the firmrsquos
value (a balance sheet strategy) and strategies aimed at increasing sales (a
profit and loss strategy)
There is a concern that the latter approach to strategy can result in a sales
promotion led approach to marketing as a complement to the corporate
focus on cash flow and short-term profits Therefore being able to
demonstrate that strategies aimed at increasing brand value also produce
short-term benefits in terms of sales and profitability means being able to justify important brand strategies in a climate of short-term focus
Brand equity is not the only thing influencing performance
While brand strategies are important we have to recognise (and Baldauf
et al remind us) that performance is not solely influenced by brand equity
Marketers have to pay attention to other factors and especially to issues
often dismissed as tactical or mere implementation The marketing director
who fails to appreciate that tactical errors and sloppy implementation can
wreck a strategy should not keep his job
Baldauf et al identify three influences other than brand equity plusmn competition
pricing and expenses Since these clearly have an impact on performance
any marketing strategy needs to be flexible enough and the firm needs also to
J O U R N A L O F P R O D U C T amp B R A N D M A N A G E M E N T V O L 1 2 N O 4 2 0 0 3 2 3 5
T h is s u m m a ry h a s b e e n
p r o v id e d t o a ll o w m a n a g e r s
a n d e x e c u t i v e s a r a p id
a p p r e c i a ti o n o f t h e c o n t e n t
o f t h is a r ti c le T h o s e w it h a
p a r t ic u la r in t e r e s t i n t h e
t o p ic c o v e r e d m a y t h e n r e a d
t h e a r t ic l e i n t o t o t o t a k e a d v a n t a g e o f t h e m o r e
c o m p r e h e n s i v e d e s c r i p ti o n
o f t h e r e s e a r c h u n d e rt a k e n
a n d it s r e s u lt s t o g e t t h e fu ll
b e n e fit o f t h e m a t e r ia l
p r e s e n t
832019 Brand Equity Mgt
httpslidepdfcomreaderfullbrand-equity-mgt 1717
pay attention to its performance in terms of cost containment In addition the
impact of pricing and competition requires a regular reality check against
what is actually happening in the market
However too many firms concentrate on these other issues and respond to
market changes by fine tuning tactics undertaking reactive sales promotions
and trimming costs Often the equally important task of developing brand
equity gets lost in the tactical war with competitors plusmn firms must remember that investing in brand equity has a direct impact on sales (elsewhere in this
issue of JPBM Ataman and U Egrave lengin provide a substantive assessment of this
impact) as well as contributing plusmn accounting approaches allowed plusmn to the
firmrsquos overall value
Brand equity strategies plusmn options
We have noted that the dominant elements of Aakerrsquos brand equity model are
brand loyalty brand awareness and perceived quality but this does not
provide us with a direct guide to the setting of strategies Aaker also included
in his model brand associations and other proprietary assets such as
intellectual property and for some brands these considerations are of
considerable importance
The brand strategy first strikes a balance between investing in awareness plusmn
telling people about the brand plusmn and investing in brand loyalty and repeat
purchase While it remains the case that securing repeat purchase is (all
things being equal) more easy than recruiting a new customer we cannot
overlook the need to maintain and extend our brandrsquos position within the
portfolio of brands from which the consumer chooses
Brand investment therefore should consist of general advertising primarily
aimed at building brand awareness and merchandising sales promotions
direct marketing and packaging that reinforces the choice made by
consumers The price details of the mix depend on the stability of marketsrates of market growth or decline competitor activity and the tactical
demands of distribution channels (and especially retailers)
Baldauf et al provide further evidence that brand investment contributes to
overall firm performance and while such investment should not be to the
exclusion of other factors (price c ompetition etc) that affect performance it
is a central element of successful consumer goods marketing What is very
clear is that investing in the brand is about sales and profits as well as the
overall value of the brand itself
(A preAcirccis of the article ``Performance c onsequences of brand equity
management evidence from organizations in the value chainrsquorsquo Supplied byMarketing Consultants for Emerald)
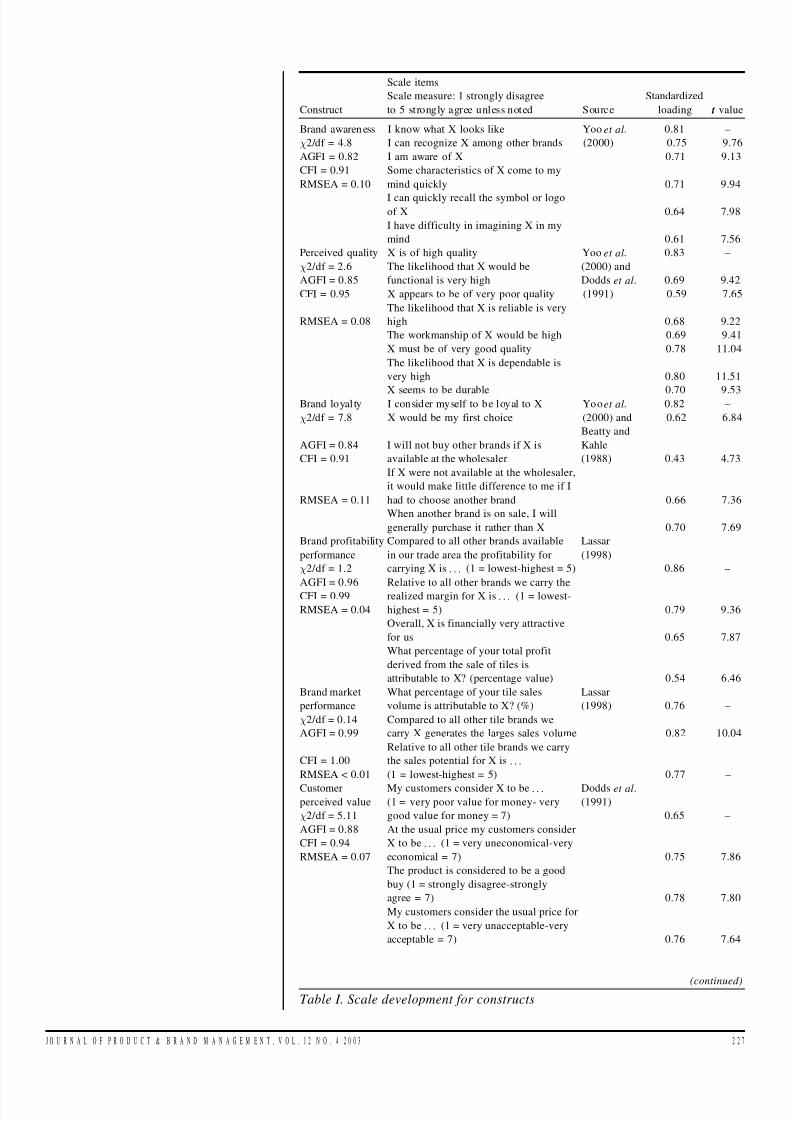
832019 Brand Equity Mgt
httpslidepdfcomreaderfullbrand-equity-mgt 817
Construct
Scale items
Scale measure 1 strongly disagree
to 5 strongly agree unless noted Source
Standardized
loading t value
Brand awaren ess I know what X looks like Yoo et al 081 plusmn
Agrave2df = 48 I can recognize X among other brands (2000) 075 976
AGFI = 082 I am aware of X 071 913
CFI = 091
RMSEA = 010
Some characteristics of X come to my
mind quickly 071 994
I can quickly recall the symbol or logoof X 064 798
I have difficulty in imagining X in my
mind 061 756
Perceived quality X is of high quality Yoo et al 083 plusmn
Agrave2df = 26
AGFI = 085
The likelihood that X would be
functional is very high
(2000) and
Dodds et al 069 942
CFI = 095 X appears to be of very poor quality (1991) 059 765
RMSEA = 008
The likelihood that X is reliable is very
high 068 922
The workmanship of X would be high 069 941
X must be of very good quality 078 1104
The likelihood that X is dependable is
very high 080 1151
X seems to be durable 070 953Brand loyal ty I consider myself to be l oyal to X Yoo et al 082 plusmn
Agrave2df = 78 X would be my first choice (2000) and 062 684
AGFI = 084
CFI = 091
I will not buy other brands if X is
available at the wholesaler
Beatty and
Kahle
(1988) 043 473
RMSEA = 011
If X were not available at the wholesaler
it would make little difference to me if I
had to choose another brand 066 736
When another brand is on sale I will
generally purchase it rather than X 070 769
Brand profitability
performance
Agrave2df = 12
Compared to all other brands available
in our trade area the profitability for
carrying X is (1 = lowest-highest = 5)
Lassar
(1998)
086 plusmn
AGFI = 096
CFI = 099
RMSEA = 004
Relative to all other brands we carry the
realized margin for X is
(1 = lowest-
highest = 5) 079 936
Overall X is financially very attractive
for us 065 787
What percentage of your total profit
derived from the sale of tiles is
attributable to X (percentage value) 054 646
Brand market
performance
What percentage of your tile sales
volume is attributable to X ()
Lassar
(1998) 076 plusmn
Agrave2df = 014
AGFI = 099
Compared to all other tile brands we
carry X generates the larges sales volume 082 1004
CFI = 100
RMSEA lt 001
Relative to all other tile brands we carry
the sales potential for X is
(1 = lowest-highest = 5) 077 plusmn
Customerperceived value
Agrave2df = 511
My customers consider X to be
(1 = very poor value for money- very
good value for money = 7)
Dodds et al(1991)
065 plusmn
AGFI = 088
CFI = 094
RMSEA = 007
At the usual price my customers consider
X to be (1 = very uneconomical-very
economical = 7) 075 786
The product is considered to be a good
buy (1 = strongly disagree-strongly
agree = 7) 078 780
My customers consider the usual price for
X to be (1 = very unacceptable-very
acceptable = 7) 076 764
(continued)
Table I Scale development for constructs
J O U R N A L O F P R O D U C T amp B R A N D M A N A G E M E N T V O L 1 2 N O 4 2 0 0 3 2 2 7
832019 Brand Equity Mgt
httpslidepdfcomreaderfullbrand-equity-mgt 917
Perceived quality The scale for perceived quality is based on Dodds et al
(1991) Yoo et al (2000) employed perceived quality to address the overall
evaluation of quality and to avoid considering specific elements of quality
There are eight items in the scale for perceived quality The scale allows a
response from ``1rsquorsquo (strongly disagree) to ``5rsquorsquo (strongly agree) to statements
such as ``X is of high qualityrsquorsquo ``The likelihood that X is reliable is very
highrsquorsquo and ``The likelihood that X is dependable is very highrsquorsquo
Brand loyalty The scale for brand loyalty was developed by Beatty and
Kahle (1988) and has been adapted by Yoo et al (2000) The scale includes
five items With a five-point response scale ranging from ``1rsquorsquo (strongly
disagree) to ``5rsquorsquo (strongly agree) statements for the scale items include ``X
would be my first choicersquorsquo and ``I will not buy other brands if X is available
at the wholesalerrsquorsquo
Brand awareness The scale for brand awareness consists of six itemsdeveloped by Yoo et al (2000) Respondents used a five-point scale
anchored by ``1rsquorsquo (strongly disagree) to ``5rsquorsquo (strongly agree) to statements
ranging from ``I can recognize X among other brandsrsquorsquo to ``Some
characteristics of X come to my mind quicklyrsquorsquo
Brand profitability performance The scale for brand profitability
performance has four items as developed by Lassar (1998) Three of the
items allow a scale response such as ``Compared to all other brands
available in our trade area the profitability for carrying X is rsquorsquo with ``1rsquorsquo =
lowest plusmn highest = ``5rsquorsquo Another item asks ``What percentage of your total
profit derived from the sale of tiles is attributable to Xrsquorsquo Resellers are able to
make this assessment since the product offerings to the reseller are indeed
based upon the incentives offered to choose particular brands
Construct
Scale items
Scale measure 1 strongly disagree
to 5 strongly agree unless noted Source
Standardized
loading t value
X appears to my customers to be a
bargain (1 = strongly disagree-strongly
agree = 7) Del plusmn
My customers are satisfied when they buy
X (1 = strongly disagree-strongly
agree = 7) Del plusmnThe decision of customers to buy X is
confirmed (1 = strongly disagree-strongly
agree = 7) 069 609
Purchase intention
Agrave2df = 007
The likelihood that my customers
purchase X is (1 = very low-very
high = 7)
Dodds et al
(1991) 088 plusmn
AGFI = 099
CFI = 100
RMSEA lt 001
If a customer is going to buy X heshe
would consider buying X at the usual
price (1 = strongly disagree-strongly
agree = 7) Del plusmn
At the usual price my customers would
consider buying X (1 = strongly disagree-
strongly agree = 7) Del plusmn
The probability that my customersconsider buying X is (1 = very low-
very high = 7) 093 1922
The willingness of my customers to buy
X is (1 = very low-very high = 7) 089 plusmn
NotesaWhere X is the brand of interest AGFI = adjusted goodness of fit index
CFI = comparative fit index RMSEA = root mean square error of approximation
Table I
2 2 8 J O U R N A L O F P R O D U C T amp B R A N D M A N A G E M E N T V O L 1 2 N O 4 2 0 0 3
832019 Brand Equity Mgt
httpslidepdfcomreaderfullbrand-equity-mgt 1017
Brand market performance We employ brand sales volume as a measure of
market performance and use the three-item scale developed by Lassar
(1998) One item asks for the percentage of sales volume attributable to X
The other two items are scale responses ``Compared to all other tile brands
we carry X generates the largest sales volumersquorsquo (1 = strongly disagree plusmn
strongly agree = 5) and ``Relative to all other tile brands we carry the sales
potential for X is rsquorsquo (1 = lowest plusmn highest = 5)
Customer perceived value Based on the conceptualization of perceived
value as a trade-off between benefits and sacrifices (costs) the scale for
customer perceived value is obtained from Dodds et al (1991) This scale
uses seven-point responses and the seven statements included relate to items
such as value for money and satisfaction ``The product is considered to be a
good buyrsquorsquo (1 = strongly disagree plusmn strongly agree = 7) and ``My customers
are satisfied when they buyrsquorsquo (1 = strongly disagree plusmn strongly agree = 7)
Purchase intention Purchase intention includes five items such as ``The
likelihood that my customers purchase X is (1 = very low plusmn very high = 7)
and ``At the usual price my customers would consider buying Xrsquorsquo (1 =
strongly disagree plusmn strongly agree = 7) This scale is based on Dodds et al(1991)
Reliability and validity assessments
Given the multiple-item nature of the scales used in this research we
assessed their psychometric properties following the recommendations of
Churchill (1979) and Gerbing and Anderson (1988) First each scale was
subjected to exploratory factor analysis loading on the dominant factor (at
least at 05) with a sum of the items in the factor explaining more that 50 per
cent of the factorrsquos variance Second reliability analyses were conducted
(Cronbach 1951) The alpha coefficients range from 080 to 093 and are
well above the 070 level suggested by Nunnally (1978) Third based onGerbing and Anderson (1988) we also performed confirmatory factor
analysis (CFA) using maximum likelihood estimation procedures for
measure validation The results indicate both acceptable model fits and item
properties and are shown in Table I The overall model fit indices chi-
squaredegrees of freedom adjusted goodness of fit index (AGFI)
comparative fit index (CFI) and root mean square error of approximation
(RMSEA) indicate acceptable model fits All items significantly load on
their corresponding construct (lowest t -value is 473) demonstrating
adequate convergent validity
Following the recommendations of Bagozzi et al (1991) pairwise
comparisons of the constructs within our models were conducted to examineconvergent and discriminate validity We arranged the measures into
subgroups with the first measurement model comprising the brand equity
constructs and the second measurement model consisting of the
consequences constructs All latent-trait correlations are significantly
different at one because each phi-value plus or minus twice the standard
error does not include one thus indicating discriminant validity Tables I
and II provide the summary statistics for the constructs used in testing the
hypotheses Table III shows the correlations within the constructs
To summarize the psychometric properties of the measures are acceptable
For further analyses the individual items of each measure were combined by
calculating the arithmetic means The items relating to reseller performance
were first standardized
B e n e fit s a n d s a c r if ic e s
P a ir w i s e c o m p a ri s o n s
J O U R N A L O F P R O D U C T amp B R A N D M A N A G E M E N T V O L 1 2 N O 4 2 0 0 3 2 2 9
832019 Brand Equity Mgt
httpslidepdfcomreaderfullbrand-equity-mgt 1117
Analysis and results
The primary tests of the hypotheses employed (linear) single and multiple
regression analysis (Cohen and Cohen 1983) The findings obtained from
these analyses are reported in Table IV Both single and multiple regression
analyses results show significant ( p lt 001) F -values (lowest F -value 1142)
indicating good overall model fit Examining the magnitude of the adjusted
R-squared value also leads us to conclude that acceptable amounts of the
variance of the dependent variables can be explained (lowest R-squared
017) Multicollinearity was not a problem as the variance inflation factors
are well below the critical level of 10 All of the coefficients are significant
at p lt 001 with the exception of one coefficient (brand awareness) in one
model which is significant at p lt 005 Moreover the coefficients are all
positive as hypothesized
In the first model the three brand equity dimensions brand awareness (016)
perceived quality (028) and brand loyalty (033) are significant predictors
of brand profitability performance Together the three predictors explain 34
percent of the variation in profitability performance Therefore strong
support for the first three hypotheses ( H1a-H1c) is found
Using brand market performance as the dependent variable the standardized
coefficients (brand awareness 018 perceived quality 022 brand loyalty
034) of the independent variables are significant which supports H2a H2b
and H2c
Of the variance of customer value 31 per cent is explained by the three
brand equity dimensions The estimated standardized coefficients of the
three independent variables (brand awareness 018 perceived quality 021
brand loyalty 019) are all significant Hence support is found for H3a H3b
and H3c
Performing single regression analyses the findings indicate a significant
relationship between customer value and purchase intention (coefficient
054) which supports H4 Also when purchase intention is regressed on
brand market performance (coefficient 062) and brand profitability
performance (coefficient 055) significant results are obtained Therefore
the analyses provide strong support for H5 and H6
Conclusion and implications
The objective of this study was to investigate the effects of using measures of
brand equity as indicators of performance Perceived quality brand loyalty
and brand association were selected as measures of brand equity Results
indicate that all three measures are significant predictors of performance
Constructs (number of items)
Coefficient
alphas
Mean
(standard deviation) Range
Brand awareness (6) 086 394 (081) 100-500
Perceived quality (8) 090 351 (067) 163-500
Brand loyalty (4) 080 241 (086) 100-440
Brand profitability (4)a
080 na na
Brand market performance (3)a
083 na na
Customer perceived value (8) 087 430 (102) 117-683Purchase intention (3) 093 320 (128) 100-667
Notes na = not applicable adue to different scales used as measures for the items thescale was standardized
Table II Summary statistics for constructs
E q u it y d im e n s i o n s
R e g re s s io n a n a ly s e s
2 3 0 J O U R N A L O F P R O D U C T amp B R A N D M A N A G E M E N T V O L 1 2 N O 4 2 0 0 3
832019 Brand Equity Mgt
httpslidepdfcomreaderfullbrand-equity-mgt 1217
B r a n d a w a r e n e s s
P e r c e i v e d q u a l i t y
B r a n d l o y a l t y
B r a n d
p r o f i t a b i l i t y
B r a n d s a l e s
v o l u m e
C u s t o m e r
p e r c e i v e d v a l u
e
P u r c h a s e i n t e n t i o n
B r a n d
a w a r e n e s s
P e r c e i v e d q u a l i t y
0 2
2
B r a n d
l o y a l t y
0 3
4
0 4
6
B r a n d
p r o f i t a b i l i t y p e r f o r m a n c e
0 3
4
0 4
7
0 5
2
B r a n d
m a r k e t p e r f o r m a n c e
0 3
9
0 4
1
0 5
0
0 7
0
C u s t o
m e r p e r c e i v e d v a l u e
0 2
9
0 3
3
0 3
5
0 3
8
0 3
1
P u r c h
a s e i n t e n t i o n
0 3
4
0 4
7
0 5
2
0 5
5
0 6
2
0 5
4
N o t e s
A l l c o r r e l a t i o n s s i g n i f i c a n t a t p lt 0 0
1
T a b l e
I I I C o r r e l a t i o n c o e f f i c i e n t s b y c o n s t r u c t
J O U R N A L O F P R O D U C T amp B R A N D M A N A G E M E N T V O L 1 2 N O 4 2 0 0 3 2 3 1
832019 Brand Equity Mgt
httpslidepdfcomreaderfullbrand-equity-mgt 1317
measures This was true for all three indicators of performance brand
profitability brand sales volume and customer perceived value
The standardized coefficients from the regression analysis in Table IV
provide some indication of the relative importance of the three brand equity
measures as predictors of performance Intercorrelations exist among the
measures as brand awareness and perceived quality will ultimately affect
brand loyalty The standardized coefficients reflect this relationship since the
coefficient for brand loyalty is almost double that of brand awareness
Loyalty is an important predictor of performance Given the difficulty in
selecting a parsimonious yet comprehensive set of performance measures
managers might consider the greater potential information content of ameasure such as brand loyalty
Building brand loyalty is an actionable initiative for manufacturers Possible
actions include creating a reason-to-buy differentiationpositioning creating
value chain member interest and making brand extensions (eg new tile
designs) (Aaker 1991) Brand loyalty increase can be measured on a
longitudinal basis Our research supports the relevance of tracking resellersrsquo
perceptions of brand loyalty
The brand equity constructs have been validated in previous research and
our study lends support to these scales from a unique perspective in the value
chain plusmn resellers The significance of the brand equity measures has
important implications for developing measures of other intangible assetsOur results supported a relationship between non-financial measures and
indicators of performance Without a link to performance the measures are
unlikely to generate results that support the strategic objectives of a firm
A major implication of our research results refers to strategic channel
partnerships (Narus and Anderson 1986) Given the positive relationships
among channel partners the sacrifices and benefits of manufacturers and
resellers have to be assessed and continually developed Although not
examined in this research problems of channel conflict like power or
opportunism are also of central issue (Webster 2000) More importantly as
the new economy compels less traditional and more cooperative ways of
conducting business it is essential to consider the impact of these
cooperative ventures on performance measurement
Dependent variables
Independent
variables
Standardized
- -coefficient
(t-value) F -value
Adjusted
R2
Brand profitability performance Brand awareness 016 (233) 2776 034
Perceived quality 028 (376)
Brand loyalty 033 (435)
Brand market perf or mance Brand awar eness 018 (250) 2334 031
Perceived quality 022 (284)Brand loyalty 034 (427)
Customer perceived value Brand awareness 018 (227) 1142 017
Perceived quality 021 (246)
Brand loyalty 019 (222)
Purchase intention Customer
p ercei ved v alu e 05 4 (79 3) 6 29 3 0 2 9
Brand market performance Purchase intention 062 (963) 9266 038
Brand profitability performance Purchase intention 055 (802) 6436 029
Notes Significant at p lt 001 unless noted Significant at p = 005
Table IV Results of single and multiple regression analysis
In it ia ti v e fo r m a n u fa c t u r e rs
R e s e a r c h r e s u lt s
2 3 2 J O U R N A L O F P R O D U C T amp B R A N D M A N A G E M E N T V O L 1 2 N O 4 2 0 0 3
832019 Brand Equity Mgt
httpslidepdfcomreaderfullbrand-equity-mgt 1417
It is apparent from the study results that factors other than brand equity also
impact performance since the variations in performance explained by brand
equity ranges from 17 to 34 percent (Table IV R-squared values) Brand
equity is an important predictor of performance but other factors such as
competition prices and expenses also impact performance A shortcoming
of our research is the focus on cross-sectional data Hence we are not able to
explore the long-term effects of brand equity on performance Clearly future
studies could refer to longitudinal data Tracking at the reseller level of the
value chain should be more feasible than end-user tracking of brand equity
The reliance on subjective information in our study might be a matter of
concern as well While brand equity from a customer-based perspective and
perceived customer value require quasi subjective information by definition
an alternative view might suggest that objective assessments are necessary
with respect to performance measures However Dess and Robinson (1984)
found no significant differences comparing the validity of subjective and
objective performance measures Nonetheless in future research the model
could be replicated using more objective performance data
Note
1 We term these intermediaries resellers as they distribute the products (tiles) to both
businesses and customers
References
Aaker DA (1989) ``Managing assets and skills the key to a sustainable competitive
advantagersquorsquo California Management Review Vol 32 Winter pp 91-106
Aaker DA (1991) Managing Brand Equity The Free Press New York NY
Aaker DA (1996a) Building Strong Brands The Free Press New York NY
Aaker DA (1996b) ``Measuring brand equity across products and marketsrsquorsquo California
Management Review Vol 38 No 3 pp 102-20Aaker DA and Jacobson R (1994) ``The financial information content of perceived
qualityrsquorsquo Journal of Marketing Research Vol 31 pp 191-201
Armstrong JS and Overton TS (1977) ` Estimating non-response bias in mail surveysrsquorsquo
Journal of Marketing Research Vol 14 August pp 396-402
Bagozzi RP Yi Y and Phillips LW (1991) ``Assessing construct validity in organizational
researchrsquorsquo Administrative Science Quarterly Vol 36 September pp 421-58
Barth ME Clement MB Foster G and Kasznik R (1998) ` Brand values and capital
market valuationrsquorsquo Review of Accounting Studies Vol 3 pp 41-68
Barwise P (1993) ``Brand equity snark or boojumrsquorsquo International Journal of Research in
Marketing Vol 10 March pp 93-104
Barwise P Higson C Likierman A and Marsh P (1989) Accounting for Brands London
Business School and the Institute of Chartered Accountants in England and Wales
London
Beatty SE and Kahle LR (1988) ``Alternative hierarchies of the attitude-behavior
relationship the impact of brand commitment and habitrsquorsquo Journal of the Academy of
Marketing Science Vol 16 Summer pp 1-10
Churchill GA Jr (1979) ` A paradigm for developing better m easures of marketing
constructsrsquorsquo Journal of Marketing Research Vol 16 February pp 64-73
Cohen J and Cohen P (1983) Applied Multiple RegressionCorrelation Analysis for the
Behavioral Sciences (2nd ed) Lawrence Erlbaum Associates Hillsdale NJ
Cronbach LJ (1951) ``Coefficient alpha and the internal structure of testsrsquorsquo Psychometrika
Vol 16 September pp 297-334
Dess GG and Robinson RB (1984) ``Measuring organizational performance in the absence
of objective measures the case of privately-held firm and conglomerate business unitrsquorsquo
Strategic Management Journal Vol 5 pp 265-73
S u b je c t iv e in fo r m a t io n
J O U R N A L O F P R O D U C T amp B R A N D M A N A G E M E N T V O L 1 2 N O 4 2 0 0 3 2 3 3
832019 Brand Equity Mgt
httpslidepdfcomreaderfullbrand-equity-mgt 1517
Dodds WB Monroe KB and Grewal D (1991) ` Effects of price brand and store
information on buyersrsquo product evaluationrsquorsquo Journal of Marketing Research Vol 28
August pp 307-19
Gerbing DW and Anderson JC (1988) ` An updated paradigm for s cale development
incorporating unidimensionality and its assess mentrsquorsquo Journal of Marketing Research
Vol 25 May pp 186-92
Grover R and Srinivasan V (1992) ``Evaluating the multiple effects of retail promotions on
brand-loyal and brand-switching segmentsrsquorsquo Journal of Marketing Research Vol 18
February pp 76-89
Hoyer W D and Brown SP (1990) ``Effects of brand awareness on choice for a common
repeat purchase productrsquorsquo Journal of Consumer Research Vol 17 pp 141-8
Jacobson R and Aaker DA (1987) ``The strategic role of product qualityrsquorsquo Journal of
Marketing Vol 51 October pp 31-44
Kaplan RS and Johnson T (1987) Relevance Lost The Rise and Fall of Management
Accounting Harvard Business School Press Boston MA
Keller KL (1993) ``Conceptualizing measuring and managing customer-based brand
equityrsquorsquo Journal of Marketing Vol 57 January pp 1-22
Keller KL (1998) Building Measuring and Managing Brand Equity Prentice Hall
Englewood Cliffs NJ
Lane V and Jacobson R (1995) ``Stock market reactions to brand extension announcements
the effects of brand attitude and familiarityrsquorsquo Journal of Marketing Vol 59 January
pp 63-77
Lassar WM (1998) ``Control systems in supplier-retailer relationships and their impact on
brand performancersquorsquo Journal of Retailing and Consumer Services Vol 5 No 2 pp 65-75
Monroe KB and Krishnan R (1985) ` The effect of price on s ubjective product
evaluationsrsquorsquo in Jacoby J and Olson J (Eds) Perceived Quality Lexington Books
Lexington MA pp 209-32
Narus JA and Anderson JC (1986) ` Turn your industrial distributors into partnersrsquorsquo
Harvard Business Review Vol 64 MarchApril pp 66-71
Nunnally JC (1978) Psychometric Theory 2nd ed McGraw-Hill New York NY
Oliver RL (1997) Satisfaction A Behavioral Perspective on the Consumer McGraw-Hill
New York NY
Phillips LW Chang DR and Buzzell RD (1983) ``Product quality cost position and
business performance a test of some key hypothesesrsquorsquo Journal of Marketing Vol 47
Spring pp 26-43
Shocker AD Srivastava RK and Ruekert RW (1994) ``Challenges and opportunities
facing brand management an introduction to the special issuersquorsquo Journal of Marketing
Research Vol 31 pp 149-58
Spreng RA Harrell GD and Mackoy RD (1995) ` Service recovery impact on
satisfaction and intentionsrsquorsquo Journal of Service Marketing Vol 9 No 1 pp 15-23
Webster FE (2000) ` Understanding the relationships among brands consumers and
resellersrsquorsquo Journal of the Academy of Marketing Science Vol 28 No 1 pp 17-23
Yoo B and Donthu N (2001) ` Developing and validating a multidimensional consumer-
based brand equity scalersquorsquo Journal of Business Research Vol 52 pp 1-14
Yoo B Donthu N and Lee S (2000) ``An examination of selected marketing mix elements
and brand equityrsquorsquo Journal of the Academy of Marketing Science Vol 28 No 2
pp 195-211
Zeithaml VA (1988) ``Consumer perceptions of price quality and value a means-end
model and synthesis of evidencersquorsquo Journal of Marketing Vol 52 July pp 2-22
amp
2 3 4 J O U R N A L O F P R O D U C T amp B R A N D M A N A G E M E N T V O L 1 2 N O 4 2 0 0 3
832019 Brand Equity Mgt
httpslidepdfcomreaderfullbrand-equity-mgt 1617
Executive summary and implications for managers andexecutives
Brand investment benefits sales and the firmrsquos value
The debate around brand equity and brand valuation has in many ways
settled into two camps plusmn the consumer-based approach (mostly marketers)
and the aggregate sales approach (mostly accountants) I appreciate that
this is a gross over-simplification of the distinction between different approaches and that many models (and much of current theory) endeavour
to join together the two approaches However it is important for marketers
to appreciate that they have yet to fully convince others of the validity of
consumer-based approaches to the measurement of brand equity
Baldauf e t a l set out to produce further validation of the consumer-based
model by examining how the dimensions of brand equity are antecedents of
firm performance and especially sales and profitability This consideration is
important since much of the brand valuation debate concerns the treatment
of the brand on the balance sheet rather than its impact on the profit and loss
account And while marketers will always argue that brands are important
intangible assets (thereby meriting inclusion within the balance sheet) muchof our work as marketers is intended to influence sales and profitability
The antecedents of brand equity
Baldauf Cravens and Binder draw on Aakerrsquos model of brand equity in their
study focusing on the three most important antecedents of brand equity plusmn
brand loyalty brand awareness and perceived quality Aakerrsquos argument is
that where a brand has loyal customers high levels of market awareness and
is perceived to be of high quality it will have a high level of equity plusmn it is
more valuable to the firm
This means that the firmrsquos strategy needs to address each antecedent plusmn
focusing on one or other element will not necessarily deliver brand value However given that we are concerned here with the effect on sales volumes
and profits we need to ask whether achieving positive effect in this area
requires a different balance within the strategy Indeed there could
conceivably be a conflict between strategies aimed at increasing the firmrsquos
value (a balance sheet strategy) and strategies aimed at increasing sales (a
profit and loss strategy)
There is a concern that the latter approach to strategy can result in a sales
promotion led approach to marketing as a complement to the corporate
focus on cash flow and short-term profits Therefore being able to
demonstrate that strategies aimed at increasing brand value also produce
short-term benefits in terms of sales and profitability means being able to justify important brand strategies in a climate of short-term focus
Brand equity is not the only thing influencing performance
While brand strategies are important we have to recognise (and Baldauf
et al remind us) that performance is not solely influenced by brand equity
Marketers have to pay attention to other factors and especially to issues
often dismissed as tactical or mere implementation The marketing director
who fails to appreciate that tactical errors and sloppy implementation can
wreck a strategy should not keep his job
Baldauf et al identify three influences other than brand equity plusmn competition
pricing and expenses Since these clearly have an impact on performance
any marketing strategy needs to be flexible enough and the firm needs also to
J O U R N A L O F P R O D U C T amp B R A N D M A N A G E M E N T V O L 1 2 N O 4 2 0 0 3 2 3 5
T h is s u m m a ry h a s b e e n
p r o v id e d t o a ll o w m a n a g e r s
a n d e x e c u t i v e s a r a p id
a p p r e c i a ti o n o f t h e c o n t e n t
o f t h is a r ti c le T h o s e w it h a
p a r t ic u la r in t e r e s t i n t h e
t o p ic c o v e r e d m a y t h e n r e a d
t h e a r t ic l e i n t o t o t o t a k e a d v a n t a g e o f t h e m o r e
c o m p r e h e n s i v e d e s c r i p ti o n
o f t h e r e s e a r c h u n d e rt a k e n
a n d it s r e s u lt s t o g e t t h e fu ll
b e n e fit o f t h e m a t e r ia l
p r e s e n t
832019 Brand Equity Mgt
httpslidepdfcomreaderfullbrand-equity-mgt 1717
pay attention to its performance in terms of cost containment In addition the
impact of pricing and competition requires a regular reality check against
what is actually happening in the market
However too many firms concentrate on these other issues and respond to
market changes by fine tuning tactics undertaking reactive sales promotions
and trimming costs Often the equally important task of developing brand
equity gets lost in the tactical war with competitors plusmn firms must remember that investing in brand equity has a direct impact on sales (elsewhere in this
issue of JPBM Ataman and U Egrave lengin provide a substantive assessment of this
impact) as well as contributing plusmn accounting approaches allowed plusmn to the
firmrsquos overall value
Brand equity strategies plusmn options
We have noted that the dominant elements of Aakerrsquos brand equity model are
brand loyalty brand awareness and perceived quality but this does not
provide us with a direct guide to the setting of strategies Aaker also included
in his model brand associations and other proprietary assets such as
intellectual property and for some brands these considerations are of
considerable importance
The brand strategy first strikes a balance between investing in awareness plusmn
telling people about the brand plusmn and investing in brand loyalty and repeat
purchase While it remains the case that securing repeat purchase is (all
things being equal) more easy than recruiting a new customer we cannot
overlook the need to maintain and extend our brandrsquos position within the
portfolio of brands from which the consumer chooses
Brand investment therefore should consist of general advertising primarily
aimed at building brand awareness and merchandising sales promotions
direct marketing and packaging that reinforces the choice made by
consumers The price details of the mix depend on the stability of marketsrates of market growth or decline competitor activity and the tactical
demands of distribution channels (and especially retailers)
Baldauf et al provide further evidence that brand investment contributes to
overall firm performance and while such investment should not be to the
exclusion of other factors (price c ompetition etc) that affect performance it
is a central element of successful consumer goods marketing What is very
clear is that investing in the brand is about sales and profits as well as the
overall value of the brand itself
(A preAcirccis of the article ``Performance c onsequences of brand equity
management evidence from organizations in the value chainrsquorsquo Supplied byMarketing Consultants for Emerald)
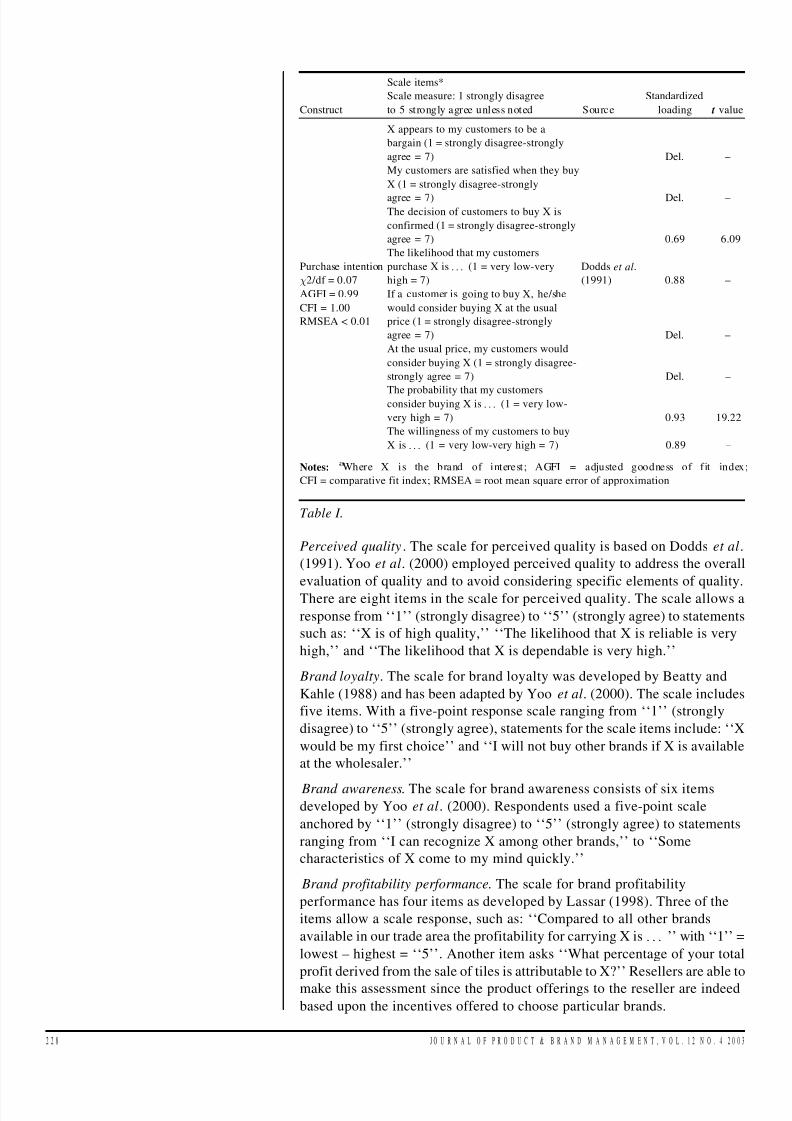
832019 Brand Equity Mgt
httpslidepdfcomreaderfullbrand-equity-mgt 917
Perceived quality The scale for perceived quality is based on Dodds et al
(1991) Yoo et al (2000) employed perceived quality to address the overall
evaluation of quality and to avoid considering specific elements of quality
There are eight items in the scale for perceived quality The scale allows a
response from ``1rsquorsquo (strongly disagree) to ``5rsquorsquo (strongly agree) to statements
such as ``X is of high qualityrsquorsquo ``The likelihood that X is reliable is very
highrsquorsquo and ``The likelihood that X is dependable is very highrsquorsquo
Brand loyalty The scale for brand loyalty was developed by Beatty and
Kahle (1988) and has been adapted by Yoo et al (2000) The scale includes
five items With a five-point response scale ranging from ``1rsquorsquo (strongly
disagree) to ``5rsquorsquo (strongly agree) statements for the scale items include ``X
would be my first choicersquorsquo and ``I will not buy other brands if X is available
at the wholesalerrsquorsquo
Brand awareness The scale for brand awareness consists of six itemsdeveloped by Yoo et al (2000) Respondents used a five-point scale
anchored by ``1rsquorsquo (strongly disagree) to ``5rsquorsquo (strongly agree) to statements
ranging from ``I can recognize X among other brandsrsquorsquo to ``Some
characteristics of X come to my mind quicklyrsquorsquo
Brand profitability performance The scale for brand profitability
performance has four items as developed by Lassar (1998) Three of the
items allow a scale response such as ``Compared to all other brands
available in our trade area the profitability for carrying X is rsquorsquo with ``1rsquorsquo =
lowest plusmn highest = ``5rsquorsquo Another item asks ``What percentage of your total
profit derived from the sale of tiles is attributable to Xrsquorsquo Resellers are able to
make this assessment since the product offerings to the reseller are indeed
based upon the incentives offered to choose particular brands
Construct
Scale items
Scale measure 1 strongly disagree
to 5 strongly agree unless noted Source
Standardized
loading t value
X appears to my customers to be a
bargain (1 = strongly disagree-strongly
agree = 7) Del plusmn
My customers are satisfied when they buy
X (1 = strongly disagree-strongly
agree = 7) Del plusmnThe decision of customers to buy X is
confirmed (1 = strongly disagree-strongly
agree = 7) 069 609
Purchase intention
Agrave2df = 007
The likelihood that my customers
purchase X is (1 = very low-very
high = 7)
Dodds et al
(1991) 088 plusmn
AGFI = 099
CFI = 100
RMSEA lt 001
If a customer is going to buy X heshe
would consider buying X at the usual
price (1 = strongly disagree-strongly
agree = 7) Del plusmn
At the usual price my customers would
consider buying X (1 = strongly disagree-
strongly agree = 7) Del plusmn
The probability that my customersconsider buying X is (1 = very low-
very high = 7) 093 1922
The willingness of my customers to buy
X is (1 = very low-very high = 7) 089 plusmn
NotesaWhere X is the brand of interest AGFI = adjusted goodness of fit index
CFI = comparative fit index RMSEA = root mean square error of approximation
Table I
2 2 8 J O U R N A L O F P R O D U C T amp B R A N D M A N A G E M E N T V O L 1 2 N O 4 2 0 0 3
832019 Brand Equity Mgt
httpslidepdfcomreaderfullbrand-equity-mgt 1017
Brand market performance We employ brand sales volume as a measure of
market performance and use the three-item scale developed by Lassar
(1998) One item asks for the percentage of sales volume attributable to X
The other two items are scale responses ``Compared to all other tile brands
we carry X generates the largest sales volumersquorsquo (1 = strongly disagree plusmn
strongly agree = 5) and ``Relative to all other tile brands we carry the sales
potential for X is rsquorsquo (1 = lowest plusmn highest = 5)
Customer perceived value Based on the conceptualization of perceived
value as a trade-off between benefits and sacrifices (costs) the scale for
customer perceived value is obtained from Dodds et al (1991) This scale
uses seven-point responses and the seven statements included relate to items
such as value for money and satisfaction ``The product is considered to be a
good buyrsquorsquo (1 = strongly disagree plusmn strongly agree = 7) and ``My customers
are satisfied when they buyrsquorsquo (1 = strongly disagree plusmn strongly agree = 7)
Purchase intention Purchase intention includes five items such as ``The
likelihood that my customers purchase X is (1 = very low plusmn very high = 7)
and ``At the usual price my customers would consider buying Xrsquorsquo (1 =
strongly disagree plusmn strongly agree = 7) This scale is based on Dodds et al(1991)
Reliability and validity assessments
Given the multiple-item nature of the scales used in this research we
assessed their psychometric properties following the recommendations of
Churchill (1979) and Gerbing and Anderson (1988) First each scale was
subjected to exploratory factor analysis loading on the dominant factor (at
least at 05) with a sum of the items in the factor explaining more that 50 per
cent of the factorrsquos variance Second reliability analyses were conducted
(Cronbach 1951) The alpha coefficients range from 080 to 093 and are
well above the 070 level suggested by Nunnally (1978) Third based onGerbing and Anderson (1988) we also performed confirmatory factor
analysis (CFA) using maximum likelihood estimation procedures for
measure validation The results indicate both acceptable model fits and item
properties and are shown in Table I The overall model fit indices chi-
squaredegrees of freedom adjusted goodness of fit index (AGFI)
comparative fit index (CFI) and root mean square error of approximation
(RMSEA) indicate acceptable model fits All items significantly load on
their corresponding construct (lowest t -value is 473) demonstrating
adequate convergent validity
Following the recommendations of Bagozzi et al (1991) pairwise
comparisons of the constructs within our models were conducted to examineconvergent and discriminate validity We arranged the measures into
subgroups with the first measurement model comprising the brand equity
constructs and the second measurement model consisting of the
consequences constructs All latent-trait correlations are significantly
different at one because each phi-value plus or minus twice the standard
error does not include one thus indicating discriminant validity Tables I
and II provide the summary statistics for the constructs used in testing the
hypotheses Table III shows the correlations within the constructs
To summarize the psychometric properties of the measures are acceptable
For further analyses the individual items of each measure were combined by
calculating the arithmetic means The items relating to reseller performance
were first standardized
B e n e fit s a n d s a c r if ic e s
P a ir w i s e c o m p a ri s o n s
J O U R N A L O F P R O D U C T amp B R A N D M A N A G E M E N T V O L 1 2 N O 4 2 0 0 3 2 2 9
832019 Brand Equity Mgt
httpslidepdfcomreaderfullbrand-equity-mgt 1117
Analysis and results
The primary tests of the hypotheses employed (linear) single and multiple
regression analysis (Cohen and Cohen 1983) The findings obtained from
these analyses are reported in Table IV Both single and multiple regression
analyses results show significant ( p lt 001) F -values (lowest F -value 1142)
indicating good overall model fit Examining the magnitude of the adjusted
R-squared value also leads us to conclude that acceptable amounts of the
variance of the dependent variables can be explained (lowest R-squared
017) Multicollinearity was not a problem as the variance inflation factors
are well below the critical level of 10 All of the coefficients are significant
at p lt 001 with the exception of one coefficient (brand awareness) in one
model which is significant at p lt 005 Moreover the coefficients are all
positive as hypothesized
In the first model the three brand equity dimensions brand awareness (016)
perceived quality (028) and brand loyalty (033) are significant predictors
of brand profitability performance Together the three predictors explain 34
percent of the variation in profitability performance Therefore strong
support for the first three hypotheses ( H1a-H1c) is found
Using brand market performance as the dependent variable the standardized
coefficients (brand awareness 018 perceived quality 022 brand loyalty
034) of the independent variables are significant which supports H2a H2b
and H2c
Of the variance of customer value 31 per cent is explained by the three
brand equity dimensions The estimated standardized coefficients of the
three independent variables (brand awareness 018 perceived quality 021
brand loyalty 019) are all significant Hence support is found for H3a H3b
and H3c
Performing single regression analyses the findings indicate a significant
relationship between customer value and purchase intention (coefficient
054) which supports H4 Also when purchase intention is regressed on
brand market performance (coefficient 062) and brand profitability
performance (coefficient 055) significant results are obtained Therefore
the analyses provide strong support for H5 and H6
Conclusion and implications
The objective of this study was to investigate the effects of using measures of
brand equity as indicators of performance Perceived quality brand loyalty
and brand association were selected as measures of brand equity Results
indicate that all three measures are significant predictors of performance
Constructs (number of items)
Coefficient
alphas
Mean
(standard deviation) Range
Brand awareness (6) 086 394 (081) 100-500
Perceived quality (8) 090 351 (067) 163-500
Brand loyalty (4) 080 241 (086) 100-440
Brand profitability (4)a
080 na na
Brand market performance (3)a
083 na na
Customer perceived value (8) 087 430 (102) 117-683Purchase intention (3) 093 320 (128) 100-667
Notes na = not applicable adue to different scales used as measures for the items thescale was standardized
Table II Summary statistics for constructs
E q u it y d im e n s i o n s
R e g re s s io n a n a ly s e s
2 3 0 J O U R N A L O F P R O D U C T amp B R A N D M A N A G E M E N T V O L 1 2 N O 4 2 0 0 3
832019 Brand Equity Mgt
httpslidepdfcomreaderfullbrand-equity-mgt 1217
B r a n d a w a r e n e s s
P e r c e i v e d q u a l i t y
B r a n d l o y a l t y
B r a n d
p r o f i t a b i l i t y
B r a n d s a l e s
v o l u m e
C u s t o m e r
p e r c e i v e d v a l u
e
P u r c h a s e i n t e n t i o n
B r a n d
a w a r e n e s s
P e r c e i v e d q u a l i t y
0 2
2
B r a n d
l o y a l t y
0 3
4
0 4
6
B r a n d
p r o f i t a b i l i t y p e r f o r m a n c e
0 3
4
0 4
7
0 5
2
B r a n d
m a r k e t p e r f o r m a n c e
0 3
9
0 4
1
0 5
0
0 7
0
C u s t o
m e r p e r c e i v e d v a l u e
0 2
9
0 3
3
0 3
5
0 3
8
0 3
1
P u r c h
a s e i n t e n t i o n
0 3
4
0 4
7
0 5
2
0 5
5
0 6
2
0 5
4
N o t e s
A l l c o r r e l a t i o n s s i g n i f i c a n t a t p lt 0 0
1
T a b l e
I I I C o r r e l a t i o n c o e f f i c i e n t s b y c o n s t r u c t
J O U R N A L O F P R O D U C T amp B R A N D M A N A G E M E N T V O L 1 2 N O 4 2 0 0 3 2 3 1
832019 Brand Equity Mgt
httpslidepdfcomreaderfullbrand-equity-mgt 1317
measures This was true for all three indicators of performance brand
profitability brand sales volume and customer perceived value
The standardized coefficients from the regression analysis in Table IV
provide some indication of the relative importance of the three brand equity
measures as predictors of performance Intercorrelations exist among the
measures as brand awareness and perceived quality will ultimately affect
brand loyalty The standardized coefficients reflect this relationship since the
coefficient for brand loyalty is almost double that of brand awareness
Loyalty is an important predictor of performance Given the difficulty in
selecting a parsimonious yet comprehensive set of performance measures
managers might consider the greater potential information content of ameasure such as brand loyalty
Building brand loyalty is an actionable initiative for manufacturers Possible
actions include creating a reason-to-buy differentiationpositioning creating
value chain member interest and making brand extensions (eg new tile
designs) (Aaker 1991) Brand loyalty increase can be measured on a
longitudinal basis Our research supports the relevance of tracking resellersrsquo
perceptions of brand loyalty
The brand equity constructs have been validated in previous research and
our study lends support to these scales from a unique perspective in the value
chain plusmn resellers The significance of the brand equity measures has
important implications for developing measures of other intangible assetsOur results supported a relationship between non-financial measures and
indicators of performance Without a link to performance the measures are
unlikely to generate results that support the strategic objectives of a firm
A major implication of our research results refers to strategic channel
partnerships (Narus and Anderson 1986) Given the positive relationships
among channel partners the sacrifices and benefits of manufacturers and
resellers have to be assessed and continually developed Although not
examined in this research problems of channel conflict like power or
opportunism are also of central issue (Webster 2000) More importantly as
the new economy compels less traditional and more cooperative ways of
conducting business it is essential to consider the impact of these
cooperative ventures on performance measurement
Dependent variables
Independent
variables
Standardized
- -coefficient
(t-value) F -value
Adjusted
R2
Brand profitability performance Brand awareness 016 (233) 2776 034
Perceived quality 028 (376)
Brand loyalty 033 (435)
Brand market perf or mance Brand awar eness 018 (250) 2334 031
Perceived quality 022 (284)Brand loyalty 034 (427)
Customer perceived value Brand awareness 018 (227) 1142 017
Perceived quality 021 (246)
Brand loyalty 019 (222)
Purchase intention Customer
p ercei ved v alu e 05 4 (79 3) 6 29 3 0 2 9
Brand market performance Purchase intention 062 (963) 9266 038
Brand profitability performance Purchase intention 055 (802) 6436 029
Notes Significant at p lt 001 unless noted Significant at p = 005
Table IV Results of single and multiple regression analysis
In it ia ti v e fo r m a n u fa c t u r e rs
R e s e a r c h r e s u lt s
2 3 2 J O U R N A L O F P R O D U C T amp B R A N D M A N A G E M E N T V O L 1 2 N O 4 2 0 0 3
832019 Brand Equity Mgt
httpslidepdfcomreaderfullbrand-equity-mgt 1417
It is apparent from the study results that factors other than brand equity also
impact performance since the variations in performance explained by brand
equity ranges from 17 to 34 percent (Table IV R-squared values) Brand
equity is an important predictor of performance but other factors such as
competition prices and expenses also impact performance A shortcoming
of our research is the focus on cross-sectional data Hence we are not able to
explore the long-term effects of brand equity on performance Clearly future
studies could refer to longitudinal data Tracking at the reseller level of the
value chain should be more feasible than end-user tracking of brand equity
The reliance on subjective information in our study might be a matter of
concern as well While brand equity from a customer-based perspective and
perceived customer value require quasi subjective information by definition
an alternative view might suggest that objective assessments are necessary
with respect to performance measures However Dess and Robinson (1984)
found no significant differences comparing the validity of subjective and
objective performance measures Nonetheless in future research the model
could be replicated using more objective performance data
Note
1 We term these intermediaries resellers as they distribute the products (tiles) to both
businesses and customers
References
Aaker DA (1989) ``Managing assets and skills the key to a sustainable competitive
advantagersquorsquo California Management Review Vol 32 Winter pp 91-106
Aaker DA (1991) Managing Brand Equity The Free Press New York NY
Aaker DA (1996a) Building Strong Brands The Free Press New York NY
Aaker DA (1996b) ``Measuring brand equity across products and marketsrsquorsquo California
Management Review Vol 38 No 3 pp 102-20Aaker DA and Jacobson R (1994) ``The financial information content of perceived
qualityrsquorsquo Journal of Marketing Research Vol 31 pp 191-201
Armstrong JS and Overton TS (1977) ` Estimating non-response bias in mail surveysrsquorsquo
Journal of Marketing Research Vol 14 August pp 396-402
Bagozzi RP Yi Y and Phillips LW (1991) ``Assessing construct validity in organizational
researchrsquorsquo Administrative Science Quarterly Vol 36 September pp 421-58
Barth ME Clement MB Foster G and Kasznik R (1998) ` Brand values and capital
market valuationrsquorsquo Review of Accounting Studies Vol 3 pp 41-68
Barwise P (1993) ``Brand equity snark or boojumrsquorsquo International Journal of Research in
Marketing Vol 10 March pp 93-104
Barwise P Higson C Likierman A and Marsh P (1989) Accounting for Brands London
Business School and the Institute of Chartered Accountants in England and Wales
London
Beatty SE and Kahle LR (1988) ``Alternative hierarchies of the attitude-behavior
relationship the impact of brand commitment and habitrsquorsquo Journal of the Academy of
Marketing Science Vol 16 Summer pp 1-10
Churchill GA Jr (1979) ` A paradigm for developing better m easures of marketing
constructsrsquorsquo Journal of Marketing Research Vol 16 February pp 64-73
Cohen J and Cohen P (1983) Applied Multiple RegressionCorrelation Analysis for the
Behavioral Sciences (2nd ed) Lawrence Erlbaum Associates Hillsdale NJ
Cronbach LJ (1951) ``Coefficient alpha and the internal structure of testsrsquorsquo Psychometrika
Vol 16 September pp 297-334
Dess GG and Robinson RB (1984) ``Measuring organizational performance in the absence
of objective measures the case of privately-held firm and conglomerate business unitrsquorsquo
Strategic Management Journal Vol 5 pp 265-73
S u b je c t iv e in fo r m a t io n
J O U R N A L O F P R O D U C T amp B R A N D M A N A G E M E N T V O L 1 2 N O 4 2 0 0 3 2 3 3
832019 Brand Equity Mgt
httpslidepdfcomreaderfullbrand-equity-mgt 1517
Dodds WB Monroe KB and Grewal D (1991) ` Effects of price brand and store
information on buyersrsquo product evaluationrsquorsquo Journal of Marketing Research Vol 28
August pp 307-19
Gerbing DW and Anderson JC (1988) ` An updated paradigm for s cale development
incorporating unidimensionality and its assess mentrsquorsquo Journal of Marketing Research
Vol 25 May pp 186-92
Grover R and Srinivasan V (1992) ``Evaluating the multiple effects of retail promotions on
brand-loyal and brand-switching segmentsrsquorsquo Journal of Marketing Research Vol 18
February pp 76-89
Hoyer W D and Brown SP (1990) ``Effects of brand awareness on choice for a common
repeat purchase productrsquorsquo Journal of Consumer Research Vol 17 pp 141-8
Jacobson R and Aaker DA (1987) ``The strategic role of product qualityrsquorsquo Journal of
Marketing Vol 51 October pp 31-44
Kaplan RS and Johnson T (1987) Relevance Lost The Rise and Fall of Management
Accounting Harvard Business School Press Boston MA
Keller KL (1993) ``Conceptualizing measuring and managing customer-based brand
equityrsquorsquo Journal of Marketing Vol 57 January pp 1-22
Keller KL (1998) Building Measuring and Managing Brand Equity Prentice Hall
Englewood Cliffs NJ
Lane V and Jacobson R (1995) ``Stock market reactions to brand extension announcements
the effects of brand attitude and familiarityrsquorsquo Journal of Marketing Vol 59 January
pp 63-77
Lassar WM (1998) ``Control systems in supplier-retailer relationships and their impact on
brand performancersquorsquo Journal of Retailing and Consumer Services Vol 5 No 2 pp 65-75
Monroe KB and Krishnan R (1985) ` The effect of price on s ubjective product
evaluationsrsquorsquo in Jacoby J and Olson J (Eds) Perceived Quality Lexington Books
Lexington MA pp 209-32
Narus JA and Anderson JC (1986) ` Turn your industrial distributors into partnersrsquorsquo
Harvard Business Review Vol 64 MarchApril pp 66-71
Nunnally JC (1978) Psychometric Theory 2nd ed McGraw-Hill New York NY
Oliver RL (1997) Satisfaction A Behavioral Perspective on the Consumer McGraw-Hill
New York NY
Phillips LW Chang DR and Buzzell RD (1983) ``Product quality cost position and
business performance a test of some key hypothesesrsquorsquo Journal of Marketing Vol 47
Spring pp 26-43
Shocker AD Srivastava RK and Ruekert RW (1994) ``Challenges and opportunities
facing brand management an introduction to the special issuersquorsquo Journal of Marketing
Research Vol 31 pp 149-58
Spreng RA Harrell GD and Mackoy RD (1995) ` Service recovery impact on
satisfaction and intentionsrsquorsquo Journal of Service Marketing Vol 9 No 1 pp 15-23
Webster FE (2000) ` Understanding the relationships among brands consumers and
resellersrsquorsquo Journal of the Academy of Marketing Science Vol 28 No 1 pp 17-23
Yoo B and Donthu N (2001) ` Developing and validating a multidimensional consumer-
based brand equity scalersquorsquo Journal of Business Research Vol 52 pp 1-14
Yoo B Donthu N and Lee S (2000) ``An examination of selected marketing mix elements
and brand equityrsquorsquo Journal of the Academy of Marketing Science Vol 28 No 2
pp 195-211
Zeithaml VA (1988) ``Consumer perceptions of price quality and value a means-end
model and synthesis of evidencersquorsquo Journal of Marketing Vol 52 July pp 2-22
amp
2 3 4 J O U R N A L O F P R O D U C T amp B R A N D M A N A G E M E N T V O L 1 2 N O 4 2 0 0 3
832019 Brand Equity Mgt
httpslidepdfcomreaderfullbrand-equity-mgt 1617
Executive summary and implications for managers andexecutives
Brand investment benefits sales and the firmrsquos value
The debate around brand equity and brand valuation has in many ways
settled into two camps plusmn the consumer-based approach (mostly marketers)
and the aggregate sales approach (mostly accountants) I appreciate that
this is a gross over-simplification of the distinction between different approaches and that many models (and much of current theory) endeavour
to join together the two approaches However it is important for marketers
to appreciate that they have yet to fully convince others of the validity of
consumer-based approaches to the measurement of brand equity
Baldauf e t a l set out to produce further validation of the consumer-based
model by examining how the dimensions of brand equity are antecedents of
firm performance and especially sales and profitability This consideration is
important since much of the brand valuation debate concerns the treatment
of the brand on the balance sheet rather than its impact on the profit and loss
account And while marketers will always argue that brands are important
intangible assets (thereby meriting inclusion within the balance sheet) muchof our work as marketers is intended to influence sales and profitability
The antecedents of brand equity
Baldauf Cravens and Binder draw on Aakerrsquos model of brand equity in their
study focusing on the three most important antecedents of brand equity plusmn
brand loyalty brand awareness and perceived quality Aakerrsquos argument is
that where a brand has loyal customers high levels of market awareness and
is perceived to be of high quality it will have a high level of equity plusmn it is
more valuable to the firm
This means that the firmrsquos strategy needs to address each antecedent plusmn
focusing on one or other element will not necessarily deliver brand value However given that we are concerned here with the effect on sales volumes
and profits we need to ask whether achieving positive effect in this area
requires a different balance within the strategy Indeed there could
conceivably be a conflict between strategies aimed at increasing the firmrsquos
value (a balance sheet strategy) and strategies aimed at increasing sales (a
profit and loss strategy)
There is a concern that the latter approach to strategy can result in a sales
promotion led approach to marketing as a complement to the corporate
focus on cash flow and short-term profits Therefore being able to
demonstrate that strategies aimed at increasing brand value also produce
short-term benefits in terms of sales and profitability means being able to justify important brand strategies in a climate of short-term focus
Brand equity is not the only thing influencing performance
While brand strategies are important we have to recognise (and Baldauf
et al remind us) that performance is not solely influenced by brand equity
Marketers have to pay attention to other factors and especially to issues
often dismissed as tactical or mere implementation The marketing director
who fails to appreciate that tactical errors and sloppy implementation can
wreck a strategy should not keep his job
Baldauf et al identify three influences other than brand equity plusmn competition
pricing and expenses Since these clearly have an impact on performance
any marketing strategy needs to be flexible enough and the firm needs also to
J O U R N A L O F P R O D U C T amp B R A N D M A N A G E M E N T V O L 1 2 N O 4 2 0 0 3 2 3 5
T h is s u m m a ry h a s b e e n
p r o v id e d t o a ll o w m a n a g e r s
a n d e x e c u t i v e s a r a p id
a p p r e c i a ti o n o f t h e c o n t e n t
o f t h is a r ti c le T h o s e w it h a
p a r t ic u la r in t e r e s t i n t h e
t o p ic c o v e r e d m a y t h e n r e a d
t h e a r t ic l e i n t o t o t o t a k e a d v a n t a g e o f t h e m o r e
c o m p r e h e n s i v e d e s c r i p ti o n
o f t h e r e s e a r c h u n d e rt a k e n
a n d it s r e s u lt s t o g e t t h e fu ll
b e n e fit o f t h e m a t e r ia l
p r e s e n t
832019 Brand Equity Mgt
httpslidepdfcomreaderfullbrand-equity-mgt 1717
pay attention to its performance in terms of cost containment In addition the
impact of pricing and competition requires a regular reality check against
what is actually happening in the market
However too many firms concentrate on these other issues and respond to
market changes by fine tuning tactics undertaking reactive sales promotions
and trimming costs Often the equally important task of developing brand
equity gets lost in the tactical war with competitors plusmn firms must remember that investing in brand equity has a direct impact on sales (elsewhere in this
issue of JPBM Ataman and U Egrave lengin provide a substantive assessment of this
impact) as well as contributing plusmn accounting approaches allowed plusmn to the
firmrsquos overall value
Brand equity strategies plusmn options
We have noted that the dominant elements of Aakerrsquos brand equity model are
brand loyalty brand awareness and perceived quality but this does not
provide us with a direct guide to the setting of strategies Aaker also included
in his model brand associations and other proprietary assets such as
intellectual property and for some brands these considerations are of
considerable importance
The brand strategy first strikes a balance between investing in awareness plusmn
telling people about the brand plusmn and investing in brand loyalty and repeat
purchase While it remains the case that securing repeat purchase is (all
things being equal) more easy than recruiting a new customer we cannot
overlook the need to maintain and extend our brandrsquos position within the
portfolio of brands from which the consumer chooses
Brand investment therefore should consist of general advertising primarily
aimed at building brand awareness and merchandising sales promotions
direct marketing and packaging that reinforces the choice made by
consumers The price details of the mix depend on the stability of marketsrates of market growth or decline competitor activity and the tactical
demands of distribution channels (and especially retailers)
Baldauf et al provide further evidence that brand investment contributes to
overall firm performance and while such investment should not be to the
exclusion of other factors (price c ompetition etc) that affect performance it
is a central element of successful consumer goods marketing What is very
clear is that investing in the brand is about sales and profits as well as the
overall value of the brand itself
(A preAcirccis of the article ``Performance c onsequences of brand equity
management evidence from organizations in the value chainrsquorsquo Supplied byMarketing Consultants for Emerald)
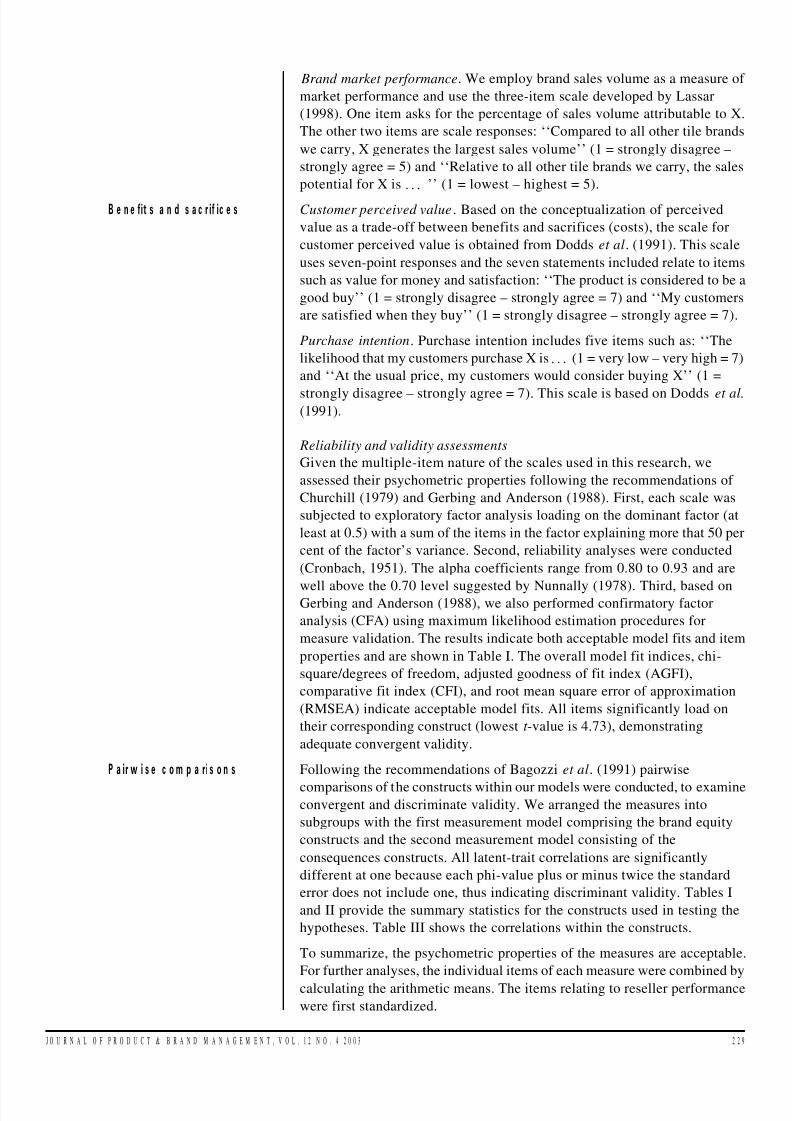
832019 Brand Equity Mgt
httpslidepdfcomreaderfullbrand-equity-mgt 1017
Brand market performance We employ brand sales volume as a measure of
market performance and use the three-item scale developed by Lassar
(1998) One item asks for the percentage of sales volume attributable to X
The other two items are scale responses ``Compared to all other tile brands
we carry X generates the largest sales volumersquorsquo (1 = strongly disagree plusmn
strongly agree = 5) and ``Relative to all other tile brands we carry the sales
potential for X is rsquorsquo (1 = lowest plusmn highest = 5)
Customer perceived value Based on the conceptualization of perceived
value as a trade-off between benefits and sacrifices (costs) the scale for
customer perceived value is obtained from Dodds et al (1991) This scale
uses seven-point responses and the seven statements included relate to items
such as value for money and satisfaction ``The product is considered to be a
good buyrsquorsquo (1 = strongly disagree plusmn strongly agree = 7) and ``My customers
are satisfied when they buyrsquorsquo (1 = strongly disagree plusmn strongly agree = 7)
Purchase intention Purchase intention includes five items such as ``The
likelihood that my customers purchase X is (1 = very low plusmn very high = 7)
and ``At the usual price my customers would consider buying Xrsquorsquo (1 =
strongly disagree plusmn strongly agree = 7) This scale is based on Dodds et al(1991)
Reliability and validity assessments
Given the multiple-item nature of the scales used in this research we
assessed their psychometric properties following the recommendations of
Churchill (1979) and Gerbing and Anderson (1988) First each scale was
subjected to exploratory factor analysis loading on the dominant factor (at
least at 05) with a sum of the items in the factor explaining more that 50 per
cent of the factorrsquos variance Second reliability analyses were conducted
(Cronbach 1951) The alpha coefficients range from 080 to 093 and are
well above the 070 level suggested by Nunnally (1978) Third based onGerbing and Anderson (1988) we also performed confirmatory factor
analysis (CFA) using maximum likelihood estimation procedures for
measure validation The results indicate both acceptable model fits and item
properties and are shown in Table I The overall model fit indices chi-
squaredegrees of freedom adjusted goodness of fit index (AGFI)
comparative fit index (CFI) and root mean square error of approximation
(RMSEA) indicate acceptable model fits All items significantly load on
their corresponding construct (lowest t -value is 473) demonstrating
adequate convergent validity
Following the recommendations of Bagozzi et al (1991) pairwise
comparisons of the constructs within our models were conducted to examineconvergent and discriminate validity We arranged the measures into
subgroups with the first measurement model comprising the brand equity
constructs and the second measurement model consisting of the
consequences constructs All latent-trait correlations are significantly
different at one because each phi-value plus or minus twice the standard
error does not include one thus indicating discriminant validity Tables I
and II provide the summary statistics for the constructs used in testing the
hypotheses Table III shows the correlations within the constructs
To summarize the psychometric properties of the measures are acceptable
For further analyses the individual items of each measure were combined by
calculating the arithmetic means The items relating to reseller performance
were first standardized
B e n e fit s a n d s a c r if ic e s
P a ir w i s e c o m p a ri s o n s
J O U R N A L O F P R O D U C T amp B R A N D M A N A G E M E N T V O L 1 2 N O 4 2 0 0 3 2 2 9
832019 Brand Equity Mgt
httpslidepdfcomreaderfullbrand-equity-mgt 1117
Analysis and results
The primary tests of the hypotheses employed (linear) single and multiple
regression analysis (Cohen and Cohen 1983) The findings obtained from
these analyses are reported in Table IV Both single and multiple regression
analyses results show significant ( p lt 001) F -values (lowest F -value 1142)
indicating good overall model fit Examining the magnitude of the adjusted
R-squared value also leads us to conclude that acceptable amounts of the
variance of the dependent variables can be explained (lowest R-squared
017) Multicollinearity was not a problem as the variance inflation factors
are well below the critical level of 10 All of the coefficients are significant
at p lt 001 with the exception of one coefficient (brand awareness) in one
model which is significant at p lt 005 Moreover the coefficients are all
positive as hypothesized
In the first model the three brand equity dimensions brand awareness (016)
perceived quality (028) and brand loyalty (033) are significant predictors
of brand profitability performance Together the three predictors explain 34
percent of the variation in profitability performance Therefore strong
support for the first three hypotheses ( H1a-H1c) is found
Using brand market performance as the dependent variable the standardized
coefficients (brand awareness 018 perceived quality 022 brand loyalty
034) of the independent variables are significant which supports H2a H2b
and H2c
Of the variance of customer value 31 per cent is explained by the three
brand equity dimensions The estimated standardized coefficients of the
three independent variables (brand awareness 018 perceived quality 021
brand loyalty 019) are all significant Hence support is found for H3a H3b
and H3c
Performing single regression analyses the findings indicate a significant
relationship between customer value and purchase intention (coefficient
054) which supports H4 Also when purchase intention is regressed on
brand market performance (coefficient 062) and brand profitability
performance (coefficient 055) significant results are obtained Therefore
the analyses provide strong support for H5 and H6
Conclusion and implications
The objective of this study was to investigate the effects of using measures of
brand equity as indicators of performance Perceived quality brand loyalty
and brand association were selected as measures of brand equity Results
indicate that all three measures are significant predictors of performance
Constructs (number of items)
Coefficient
alphas
Mean
(standard deviation) Range
Brand awareness (6) 086 394 (081) 100-500
Perceived quality (8) 090 351 (067) 163-500
Brand loyalty (4) 080 241 (086) 100-440
Brand profitability (4)a
080 na na
Brand market performance (3)a
083 na na
Customer perceived value (8) 087 430 (102) 117-683Purchase intention (3) 093 320 (128) 100-667
Notes na = not applicable adue to different scales used as measures for the items thescale was standardized
Table II Summary statistics for constructs
E q u it y d im e n s i o n s
R e g re s s io n a n a ly s e s
2 3 0 J O U R N A L O F P R O D U C T amp B R A N D M A N A G E M E N T V O L 1 2 N O 4 2 0 0 3
832019 Brand Equity Mgt
httpslidepdfcomreaderfullbrand-equity-mgt 1217
B r a n d a w a r e n e s s
P e r c e i v e d q u a l i t y
B r a n d l o y a l t y
B r a n d
p r o f i t a b i l i t y
B r a n d s a l e s
v o l u m e
C u s t o m e r
p e r c e i v e d v a l u
e
P u r c h a s e i n t e n t i o n
B r a n d
a w a r e n e s s
P e r c e i v e d q u a l i t y
0 2
2
B r a n d
l o y a l t y
0 3
4
0 4
6
B r a n d
p r o f i t a b i l i t y p e r f o r m a n c e
0 3
4
0 4
7
0 5
2
B r a n d
m a r k e t p e r f o r m a n c e
0 3
9
0 4
1
0 5
0
0 7
0
C u s t o
m e r p e r c e i v e d v a l u e
0 2
9
0 3
3
0 3
5
0 3
8
0 3
1
P u r c h
a s e i n t e n t i o n
0 3
4
0 4
7
0 5
2
0 5
5
0 6
2
0 5
4
N o t e s
A l l c o r r e l a t i o n s s i g n i f i c a n t a t p lt 0 0
1
T a b l e
I I I C o r r e l a t i o n c o e f f i c i e n t s b y c o n s t r u c t
J O U R N A L O F P R O D U C T amp B R A N D M A N A G E M E N T V O L 1 2 N O 4 2 0 0 3 2 3 1
832019 Brand Equity Mgt
httpslidepdfcomreaderfullbrand-equity-mgt 1317
measures This was true for all three indicators of performance brand
profitability brand sales volume and customer perceived value
The standardized coefficients from the regression analysis in Table IV
provide some indication of the relative importance of the three brand equity
measures as predictors of performance Intercorrelations exist among the
measures as brand awareness and perceived quality will ultimately affect
brand loyalty The standardized coefficients reflect this relationship since the
coefficient for brand loyalty is almost double that of brand awareness
Loyalty is an important predictor of performance Given the difficulty in
selecting a parsimonious yet comprehensive set of performance measures
managers might consider the greater potential information content of ameasure such as brand loyalty
Building brand loyalty is an actionable initiative for manufacturers Possible
actions include creating a reason-to-buy differentiationpositioning creating
value chain member interest and making brand extensions (eg new tile
designs) (Aaker 1991) Brand loyalty increase can be measured on a
longitudinal basis Our research supports the relevance of tracking resellersrsquo
perceptions of brand loyalty
The brand equity constructs have been validated in previous research and
our study lends support to these scales from a unique perspective in the value
chain plusmn resellers The significance of the brand equity measures has
important implications for developing measures of other intangible assetsOur results supported a relationship between non-financial measures and
indicators of performance Without a link to performance the measures are
unlikely to generate results that support the strategic objectives of a firm
A major implication of our research results refers to strategic channel
partnerships (Narus and Anderson 1986) Given the positive relationships
among channel partners the sacrifices and benefits of manufacturers and
resellers have to be assessed and continually developed Although not
examined in this research problems of channel conflict like power or
opportunism are also of central issue (Webster 2000) More importantly as
the new economy compels less traditional and more cooperative ways of
conducting business it is essential to consider the impact of these
cooperative ventures on performance measurement
Dependent variables
Independent
variables
Standardized
- -coefficient
(t-value) F -value
Adjusted
R2
Brand profitability performance Brand awareness 016 (233) 2776 034
Perceived quality 028 (376)
Brand loyalty 033 (435)
Brand market perf or mance Brand awar eness 018 (250) 2334 031
Perceived quality 022 (284)Brand loyalty 034 (427)
Customer perceived value Brand awareness 018 (227) 1142 017
Perceived quality 021 (246)
Brand loyalty 019 (222)
Purchase intention Customer
p ercei ved v alu e 05 4 (79 3) 6 29 3 0 2 9
Brand market performance Purchase intention 062 (963) 9266 038
Brand profitability performance Purchase intention 055 (802) 6436 029
Notes Significant at p lt 001 unless noted Significant at p = 005
Table IV Results of single and multiple regression analysis
In it ia ti v e fo r m a n u fa c t u r e rs
R e s e a r c h r e s u lt s
2 3 2 J O U R N A L O F P R O D U C T amp B R A N D M A N A G E M E N T V O L 1 2 N O 4 2 0 0 3
832019 Brand Equity Mgt
httpslidepdfcomreaderfullbrand-equity-mgt 1417
It is apparent from the study results that factors other than brand equity also
impact performance since the variations in performance explained by brand
equity ranges from 17 to 34 percent (Table IV R-squared values) Brand
equity is an important predictor of performance but other factors such as
competition prices and expenses also impact performance A shortcoming
of our research is the focus on cross-sectional data Hence we are not able to
explore the long-term effects of brand equity on performance Clearly future
studies could refer to longitudinal data Tracking at the reseller level of the
value chain should be more feasible than end-user tracking of brand equity
The reliance on subjective information in our study might be a matter of
concern as well While brand equity from a customer-based perspective and
perceived customer value require quasi subjective information by definition
an alternative view might suggest that objective assessments are necessary
with respect to performance measures However Dess and Robinson (1984)
found no significant differences comparing the validity of subjective and
objective performance measures Nonetheless in future research the model
could be replicated using more objective performance data
Note
1 We term these intermediaries resellers as they distribute the products (tiles) to both
businesses and customers
References
Aaker DA (1989) ``Managing assets and skills the key to a sustainable competitive
advantagersquorsquo California Management Review Vol 32 Winter pp 91-106
Aaker DA (1991) Managing Brand Equity The Free Press New York NY
Aaker DA (1996a) Building Strong Brands The Free Press New York NY
Aaker DA (1996b) ``Measuring brand equity across products and marketsrsquorsquo California
Management Review Vol 38 No 3 pp 102-20Aaker DA and Jacobson R (1994) ``The financial information content of perceived
qualityrsquorsquo Journal of Marketing Research Vol 31 pp 191-201
Armstrong JS and Overton TS (1977) ` Estimating non-response bias in mail surveysrsquorsquo
Journal of Marketing Research Vol 14 August pp 396-402
Bagozzi RP Yi Y and Phillips LW (1991) ``Assessing construct validity in organizational
researchrsquorsquo Administrative Science Quarterly Vol 36 September pp 421-58
Barth ME Clement MB Foster G and Kasznik R (1998) ` Brand values and capital
market valuationrsquorsquo Review of Accounting Studies Vol 3 pp 41-68
Barwise P (1993) ``Brand equity snark or boojumrsquorsquo International Journal of Research in
Marketing Vol 10 March pp 93-104
Barwise P Higson C Likierman A and Marsh P (1989) Accounting for Brands London
Business School and the Institute of Chartered Accountants in England and Wales
London
Beatty SE and Kahle LR (1988) ``Alternative hierarchies of the attitude-behavior
relationship the impact of brand commitment and habitrsquorsquo Journal of the Academy of
Marketing Science Vol 16 Summer pp 1-10
Churchill GA Jr (1979) ` A paradigm for developing better m easures of marketing
constructsrsquorsquo Journal of Marketing Research Vol 16 February pp 64-73
Cohen J and Cohen P (1983) Applied Multiple RegressionCorrelation Analysis for the
Behavioral Sciences (2nd ed) Lawrence Erlbaum Associates Hillsdale NJ
Cronbach LJ (1951) ``Coefficient alpha and the internal structure of testsrsquorsquo Psychometrika
Vol 16 September pp 297-334
Dess GG and Robinson RB (1984) ``Measuring organizational performance in the absence
of objective measures the case of privately-held firm and conglomerate business unitrsquorsquo
Strategic Management Journal Vol 5 pp 265-73
S u b je c t iv e in fo r m a t io n
J O U R N A L O F P R O D U C T amp B R A N D M A N A G E M E N T V O L 1 2 N O 4 2 0 0 3 2 3 3
832019 Brand Equity Mgt
httpslidepdfcomreaderfullbrand-equity-mgt 1517
Dodds WB Monroe KB and Grewal D (1991) ` Effects of price brand and store
information on buyersrsquo product evaluationrsquorsquo Journal of Marketing Research Vol 28
August pp 307-19
Gerbing DW and Anderson JC (1988) ` An updated paradigm for s cale development
incorporating unidimensionality and its assess mentrsquorsquo Journal of Marketing Research
Vol 25 May pp 186-92
Grover R and Srinivasan V (1992) ``Evaluating the multiple effects of retail promotions on
brand-loyal and brand-switching segmentsrsquorsquo Journal of Marketing Research Vol 18
February pp 76-89
Hoyer W D and Brown SP (1990) ``Effects of brand awareness on choice for a common
repeat purchase productrsquorsquo Journal of Consumer Research Vol 17 pp 141-8
Jacobson R and Aaker DA (1987) ``The strategic role of product qualityrsquorsquo Journal of
Marketing Vol 51 October pp 31-44
Kaplan RS and Johnson T (1987) Relevance Lost The Rise and Fall of Management
Accounting Harvard Business School Press Boston MA
Keller KL (1993) ``Conceptualizing measuring and managing customer-based brand
equityrsquorsquo Journal of Marketing Vol 57 January pp 1-22
Keller KL (1998) Building Measuring and Managing Brand Equity Prentice Hall
Englewood Cliffs NJ
Lane V and Jacobson R (1995) ``Stock market reactions to brand extension announcements
the effects of brand attitude and familiarityrsquorsquo Journal of Marketing Vol 59 January
pp 63-77
Lassar WM (1998) ``Control systems in supplier-retailer relationships and their impact on
brand performancersquorsquo Journal of Retailing and Consumer Services Vol 5 No 2 pp 65-75
Monroe KB and Krishnan R (1985) ` The effect of price on s ubjective product
evaluationsrsquorsquo in Jacoby J and Olson J (Eds) Perceived Quality Lexington Books
Lexington MA pp 209-32
Narus JA and Anderson JC (1986) ` Turn your industrial distributors into partnersrsquorsquo
Harvard Business Review Vol 64 MarchApril pp 66-71
Nunnally JC (1978) Psychometric Theory 2nd ed McGraw-Hill New York NY
Oliver RL (1997) Satisfaction A Behavioral Perspective on the Consumer McGraw-Hill
New York NY
Phillips LW Chang DR and Buzzell RD (1983) ``Product quality cost position and
business performance a test of some key hypothesesrsquorsquo Journal of Marketing Vol 47
Spring pp 26-43
Shocker AD Srivastava RK and Ruekert RW (1994) ``Challenges and opportunities
facing brand management an introduction to the special issuersquorsquo Journal of Marketing
Research Vol 31 pp 149-58
Spreng RA Harrell GD and Mackoy RD (1995) ` Service recovery impact on
satisfaction and intentionsrsquorsquo Journal of Service Marketing Vol 9 No 1 pp 15-23
Webster FE (2000) ` Understanding the relationships among brands consumers and
resellersrsquorsquo Journal of the Academy of Marketing Science Vol 28 No 1 pp 17-23
Yoo B and Donthu N (2001) ` Developing and validating a multidimensional consumer-
based brand equity scalersquorsquo Journal of Business Research Vol 52 pp 1-14
Yoo B Donthu N and Lee S (2000) ``An examination of selected marketing mix elements
and brand equityrsquorsquo Journal of the Academy of Marketing Science Vol 28 No 2
pp 195-211
Zeithaml VA (1988) ``Consumer perceptions of price quality and value a means-end
model and synthesis of evidencersquorsquo Journal of Marketing Vol 52 July pp 2-22
amp
2 3 4 J O U R N A L O F P R O D U C T amp B R A N D M A N A G E M E N T V O L 1 2 N O 4 2 0 0 3
832019 Brand Equity Mgt
httpslidepdfcomreaderfullbrand-equity-mgt 1617
Executive summary and implications for managers andexecutives
Brand investment benefits sales and the firmrsquos value
The debate around brand equity and brand valuation has in many ways
settled into two camps plusmn the consumer-based approach (mostly marketers)
and the aggregate sales approach (mostly accountants) I appreciate that
this is a gross over-simplification of the distinction between different approaches and that many models (and much of current theory) endeavour
to join together the two approaches However it is important for marketers
to appreciate that they have yet to fully convince others of the validity of
consumer-based approaches to the measurement of brand equity
Baldauf e t a l set out to produce further validation of the consumer-based
model by examining how the dimensions of brand equity are antecedents of
firm performance and especially sales and profitability This consideration is
important since much of the brand valuation debate concerns the treatment
of the brand on the balance sheet rather than its impact on the profit and loss
account And while marketers will always argue that brands are important
intangible assets (thereby meriting inclusion within the balance sheet) muchof our work as marketers is intended to influence sales and profitability
The antecedents of brand equity
Baldauf Cravens and Binder draw on Aakerrsquos model of brand equity in their
study focusing on the three most important antecedents of brand equity plusmn
brand loyalty brand awareness and perceived quality Aakerrsquos argument is
that where a brand has loyal customers high levels of market awareness and
is perceived to be of high quality it will have a high level of equity plusmn it is
more valuable to the firm
This means that the firmrsquos strategy needs to address each antecedent plusmn
focusing on one or other element will not necessarily deliver brand value However given that we are concerned here with the effect on sales volumes
and profits we need to ask whether achieving positive effect in this area
requires a different balance within the strategy Indeed there could
conceivably be a conflict between strategies aimed at increasing the firmrsquos
value (a balance sheet strategy) and strategies aimed at increasing sales (a
profit and loss strategy)
There is a concern that the latter approach to strategy can result in a sales
promotion led approach to marketing as a complement to the corporate
focus on cash flow and short-term profits Therefore being able to
demonstrate that strategies aimed at increasing brand value also produce
short-term benefits in terms of sales and profitability means being able to justify important brand strategies in a climate of short-term focus
Brand equity is not the only thing influencing performance
While brand strategies are important we have to recognise (and Baldauf
et al remind us) that performance is not solely influenced by brand equity
Marketers have to pay attention to other factors and especially to issues
often dismissed as tactical or mere implementation The marketing director
who fails to appreciate that tactical errors and sloppy implementation can
wreck a strategy should not keep his job
Baldauf et al identify three influences other than brand equity plusmn competition
pricing and expenses Since these clearly have an impact on performance
any marketing strategy needs to be flexible enough and the firm needs also to
J O U R N A L O F P R O D U C T amp B R A N D M A N A G E M E N T V O L 1 2 N O 4 2 0 0 3 2 3 5
T h is s u m m a ry h a s b e e n
p r o v id e d t o a ll o w m a n a g e r s
a n d e x e c u t i v e s a r a p id
a p p r e c i a ti o n o f t h e c o n t e n t
o f t h is a r ti c le T h o s e w it h a
p a r t ic u la r in t e r e s t i n t h e
t o p ic c o v e r e d m a y t h e n r e a d
t h e a r t ic l e i n t o t o t o t a k e a d v a n t a g e o f t h e m o r e
c o m p r e h e n s i v e d e s c r i p ti o n
o f t h e r e s e a r c h u n d e rt a k e n
a n d it s r e s u lt s t o g e t t h e fu ll
b e n e fit o f t h e m a t e r ia l
p r e s e n t
832019 Brand Equity Mgt
httpslidepdfcomreaderfullbrand-equity-mgt 1717
pay attention to its performance in terms of cost containment In addition the
impact of pricing and competition requires a regular reality check against
what is actually happening in the market
However too many firms concentrate on these other issues and respond to
market changes by fine tuning tactics undertaking reactive sales promotions
and trimming costs Often the equally important task of developing brand
equity gets lost in the tactical war with competitors plusmn firms must remember that investing in brand equity has a direct impact on sales (elsewhere in this
issue of JPBM Ataman and U Egrave lengin provide a substantive assessment of this
impact) as well as contributing plusmn accounting approaches allowed plusmn to the
firmrsquos overall value
Brand equity strategies plusmn options
We have noted that the dominant elements of Aakerrsquos brand equity model are
brand loyalty brand awareness and perceived quality but this does not
provide us with a direct guide to the setting of strategies Aaker also included
in his model brand associations and other proprietary assets such as
intellectual property and for some brands these considerations are of
considerable importance
The brand strategy first strikes a balance between investing in awareness plusmn
telling people about the brand plusmn and investing in brand loyalty and repeat
purchase While it remains the case that securing repeat purchase is (all
things being equal) more easy than recruiting a new customer we cannot
overlook the need to maintain and extend our brandrsquos position within the
portfolio of brands from which the consumer chooses
Brand investment therefore should consist of general advertising primarily
aimed at building brand awareness and merchandising sales promotions
direct marketing and packaging that reinforces the choice made by
consumers The price details of the mix depend on the stability of marketsrates of market growth or decline competitor activity and the tactical
demands of distribution channels (and especially retailers)
Baldauf et al provide further evidence that brand investment contributes to
overall firm performance and while such investment should not be to the
exclusion of other factors (price c ompetition etc) that affect performance it
is a central element of successful consumer goods marketing What is very
clear is that investing in the brand is about sales and profits as well as the
overall value of the brand itself
(A preAcirccis of the article ``Performance c onsequences of brand equity
management evidence from organizations in the value chainrsquorsquo Supplied byMarketing Consultants for Emerald)
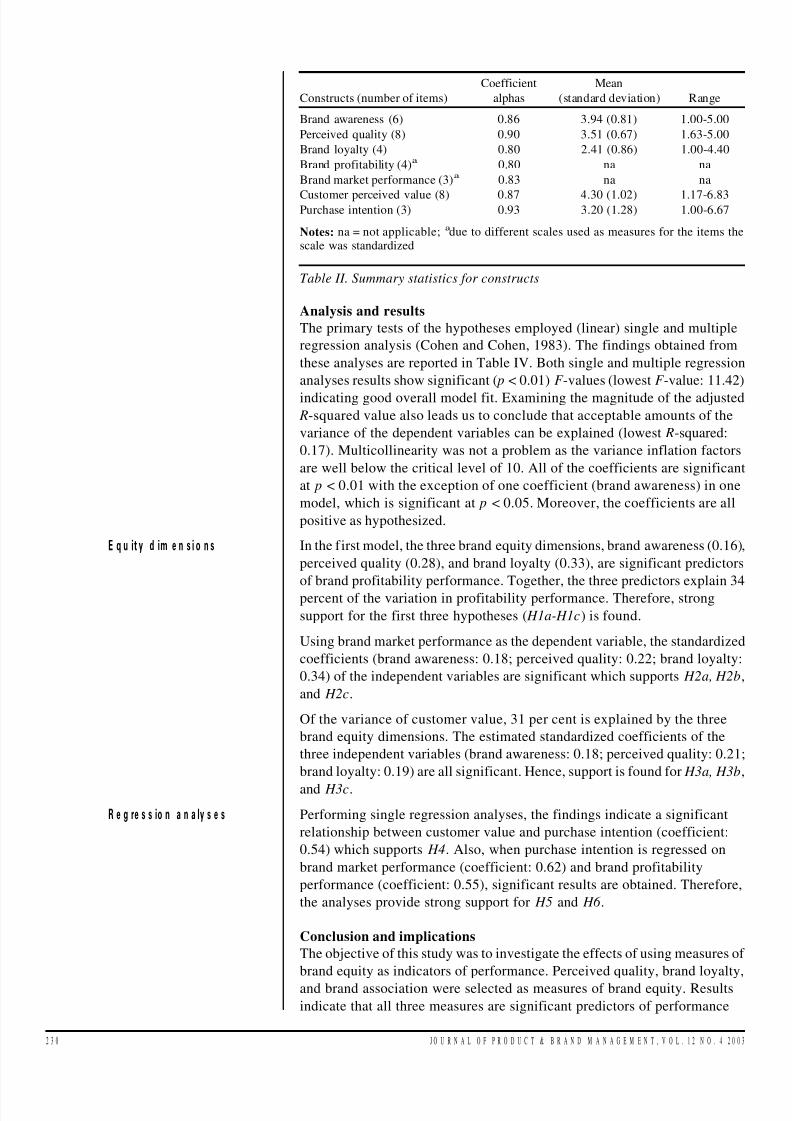
832019 Brand Equity Mgt
httpslidepdfcomreaderfullbrand-equity-mgt 1117
Analysis and results
The primary tests of the hypotheses employed (linear) single and multiple
regression analysis (Cohen and Cohen 1983) The findings obtained from
these analyses are reported in Table IV Both single and multiple regression
analyses results show significant ( p lt 001) F -values (lowest F -value 1142)
indicating good overall model fit Examining the magnitude of the adjusted
R-squared value also leads us to conclude that acceptable amounts of the
variance of the dependent variables can be explained (lowest R-squared
017) Multicollinearity was not a problem as the variance inflation factors
are well below the critical level of 10 All of the coefficients are significant
at p lt 001 with the exception of one coefficient (brand awareness) in one
model which is significant at p lt 005 Moreover the coefficients are all
positive as hypothesized
In the first model the three brand equity dimensions brand awareness (016)
perceived quality (028) and brand loyalty (033) are significant predictors
of brand profitability performance Together the three predictors explain 34
percent of the variation in profitability performance Therefore strong
support for the first three hypotheses ( H1a-H1c) is found
Using brand market performance as the dependent variable the standardized
coefficients (brand awareness 018 perceived quality 022 brand loyalty
034) of the independent variables are significant which supports H2a H2b
and H2c
Of the variance of customer value 31 per cent is explained by the three
brand equity dimensions The estimated standardized coefficients of the
three independent variables (brand awareness 018 perceived quality 021
brand loyalty 019) are all significant Hence support is found for H3a H3b
and H3c
Performing single regression analyses the findings indicate a significant
relationship between customer value and purchase intention (coefficient
054) which supports H4 Also when purchase intention is regressed on
brand market performance (coefficient 062) and brand profitability
performance (coefficient 055) significant results are obtained Therefore
the analyses provide strong support for H5 and H6
Conclusion and implications
The objective of this study was to investigate the effects of using measures of
brand equity as indicators of performance Perceived quality brand loyalty
and brand association were selected as measures of brand equity Results
indicate that all three measures are significant predictors of performance
Constructs (number of items)
Coefficient
alphas
Mean
(standard deviation) Range
Brand awareness (6) 086 394 (081) 100-500
Perceived quality (8) 090 351 (067) 163-500
Brand loyalty (4) 080 241 (086) 100-440
Brand profitability (4)a
080 na na
Brand market performance (3)a
083 na na
Customer perceived value (8) 087 430 (102) 117-683Purchase intention (3) 093 320 (128) 100-667
Notes na = not applicable adue to different scales used as measures for the items thescale was standardized
Table II Summary statistics for constructs
E q u it y d im e n s i o n s
R e g re s s io n a n a ly s e s
2 3 0 J O U R N A L O F P R O D U C T amp B R A N D M A N A G E M E N T V O L 1 2 N O 4 2 0 0 3
832019 Brand Equity Mgt
httpslidepdfcomreaderfullbrand-equity-mgt 1217
B r a n d a w a r e n e s s
P e r c e i v e d q u a l i t y
B r a n d l o y a l t y
B r a n d
p r o f i t a b i l i t y
B r a n d s a l e s
v o l u m e
C u s t o m e r
p e r c e i v e d v a l u
e
P u r c h a s e i n t e n t i o n
B r a n d
a w a r e n e s s
P e r c e i v e d q u a l i t y
0 2
2
B r a n d
l o y a l t y
0 3
4
0 4
6
B r a n d
p r o f i t a b i l i t y p e r f o r m a n c e
0 3
4
0 4
7
0 5
2
B r a n d
m a r k e t p e r f o r m a n c e
0 3
9
0 4
1
0 5
0
0 7
0
C u s t o
m e r p e r c e i v e d v a l u e
0 2
9
0 3
3
0 3
5
0 3
8
0 3
1
P u r c h
a s e i n t e n t i o n
0 3
4
0 4
7
0 5
2
0 5
5
0 6
2
0 5
4
N o t e s
A l l c o r r e l a t i o n s s i g n i f i c a n t a t p lt 0 0
1
T a b l e
I I I C o r r e l a t i o n c o e f f i c i e n t s b y c o n s t r u c t
J O U R N A L O F P R O D U C T amp B R A N D M A N A G E M E N T V O L 1 2 N O 4 2 0 0 3 2 3 1
832019 Brand Equity Mgt
httpslidepdfcomreaderfullbrand-equity-mgt 1317
measures This was true for all three indicators of performance brand
profitability brand sales volume and customer perceived value
The standardized coefficients from the regression analysis in Table IV
provide some indication of the relative importance of the three brand equity
measures as predictors of performance Intercorrelations exist among the
measures as brand awareness and perceived quality will ultimately affect
brand loyalty The standardized coefficients reflect this relationship since the
coefficient for brand loyalty is almost double that of brand awareness
Loyalty is an important predictor of performance Given the difficulty in
selecting a parsimonious yet comprehensive set of performance measures
managers might consider the greater potential information content of ameasure such as brand loyalty
Building brand loyalty is an actionable initiative for manufacturers Possible
actions include creating a reason-to-buy differentiationpositioning creating
value chain member interest and making brand extensions (eg new tile
designs) (Aaker 1991) Brand loyalty increase can be measured on a
longitudinal basis Our research supports the relevance of tracking resellersrsquo
perceptions of brand loyalty
The brand equity constructs have been validated in previous research and
our study lends support to these scales from a unique perspective in the value
chain plusmn resellers The significance of the brand equity measures has
important implications for developing measures of other intangible assetsOur results supported a relationship between non-financial measures and
indicators of performance Without a link to performance the measures are
unlikely to generate results that support the strategic objectives of a firm
A major implication of our research results refers to strategic channel
partnerships (Narus and Anderson 1986) Given the positive relationships
among channel partners the sacrifices and benefits of manufacturers and
resellers have to be assessed and continually developed Although not
examined in this research problems of channel conflict like power or
opportunism are also of central issue (Webster 2000) More importantly as
the new economy compels less traditional and more cooperative ways of
conducting business it is essential to consider the impact of these
cooperative ventures on performance measurement
Dependent variables
Independent
variables
Standardized
- -coefficient
(t-value) F -value
Adjusted
R2
Brand profitability performance Brand awareness 016 (233) 2776 034
Perceived quality 028 (376)
Brand loyalty 033 (435)
Brand market perf or mance Brand awar eness 018 (250) 2334 031
Perceived quality 022 (284)Brand loyalty 034 (427)
Customer perceived value Brand awareness 018 (227) 1142 017
Perceived quality 021 (246)
Brand loyalty 019 (222)
Purchase intention Customer
p ercei ved v alu e 05 4 (79 3) 6 29 3 0 2 9
Brand market performance Purchase intention 062 (963) 9266 038
Brand profitability performance Purchase intention 055 (802) 6436 029
Notes Significant at p lt 001 unless noted Significant at p = 005
Table IV Results of single and multiple regression analysis
In it ia ti v e fo r m a n u fa c t u r e rs
R e s e a r c h r e s u lt s
2 3 2 J O U R N A L O F P R O D U C T amp B R A N D M A N A G E M E N T V O L 1 2 N O 4 2 0 0 3
832019 Brand Equity Mgt
httpslidepdfcomreaderfullbrand-equity-mgt 1417
It is apparent from the study results that factors other than brand equity also
impact performance since the variations in performance explained by brand
equity ranges from 17 to 34 percent (Table IV R-squared values) Brand
equity is an important predictor of performance but other factors such as
competition prices and expenses also impact performance A shortcoming
of our research is the focus on cross-sectional data Hence we are not able to
explore the long-term effects of brand equity on performance Clearly future
studies could refer to longitudinal data Tracking at the reseller level of the
value chain should be more feasible than end-user tracking of brand equity
The reliance on subjective information in our study might be a matter of
concern as well While brand equity from a customer-based perspective and
perceived customer value require quasi subjective information by definition
an alternative view might suggest that objective assessments are necessary
with respect to performance measures However Dess and Robinson (1984)
found no significant differences comparing the validity of subjective and
objective performance measures Nonetheless in future research the model
could be replicated using more objective performance data
Note
1 We term these intermediaries resellers as they distribute the products (tiles) to both
businesses and customers
References
Aaker DA (1989) ``Managing assets and skills the key to a sustainable competitive
advantagersquorsquo California Management Review Vol 32 Winter pp 91-106
Aaker DA (1991) Managing Brand Equity The Free Press New York NY
Aaker DA (1996a) Building Strong Brands The Free Press New York NY
Aaker DA (1996b) ``Measuring brand equity across products and marketsrsquorsquo California
Management Review Vol 38 No 3 pp 102-20Aaker DA and Jacobson R (1994) ``The financial information content of perceived
qualityrsquorsquo Journal of Marketing Research Vol 31 pp 191-201
Armstrong JS and Overton TS (1977) ` Estimating non-response bias in mail surveysrsquorsquo
Journal of Marketing Research Vol 14 August pp 396-402
Bagozzi RP Yi Y and Phillips LW (1991) ``Assessing construct validity in organizational
researchrsquorsquo Administrative Science Quarterly Vol 36 September pp 421-58
Barth ME Clement MB Foster G and Kasznik R (1998) ` Brand values and capital
market valuationrsquorsquo Review of Accounting Studies Vol 3 pp 41-68
Barwise P (1993) ``Brand equity snark or boojumrsquorsquo International Journal of Research in
Marketing Vol 10 March pp 93-104
Barwise P Higson C Likierman A and Marsh P (1989) Accounting for Brands London
Business School and the Institute of Chartered Accountants in England and Wales
London
Beatty SE and Kahle LR (1988) ``Alternative hierarchies of the attitude-behavior
relationship the impact of brand commitment and habitrsquorsquo Journal of the Academy of
Marketing Science Vol 16 Summer pp 1-10
Churchill GA Jr (1979) ` A paradigm for developing better m easures of marketing
constructsrsquorsquo Journal of Marketing Research Vol 16 February pp 64-73
Cohen J and Cohen P (1983) Applied Multiple RegressionCorrelation Analysis for the
Behavioral Sciences (2nd ed) Lawrence Erlbaum Associates Hillsdale NJ
Cronbach LJ (1951) ``Coefficient alpha and the internal structure of testsrsquorsquo Psychometrika
Vol 16 September pp 297-334
Dess GG and Robinson RB (1984) ``Measuring organizational performance in the absence
of objective measures the case of privately-held firm and conglomerate business unitrsquorsquo
Strategic Management Journal Vol 5 pp 265-73
S u b je c t iv e in fo r m a t io n
J O U R N A L O F P R O D U C T amp B R A N D M A N A G E M E N T V O L 1 2 N O 4 2 0 0 3 2 3 3
832019 Brand Equity Mgt
httpslidepdfcomreaderfullbrand-equity-mgt 1517
Dodds WB Monroe KB and Grewal D (1991) ` Effects of price brand and store
information on buyersrsquo product evaluationrsquorsquo Journal of Marketing Research Vol 28
August pp 307-19
Gerbing DW and Anderson JC (1988) ` An updated paradigm for s cale development
incorporating unidimensionality and its assess mentrsquorsquo Journal of Marketing Research
Vol 25 May pp 186-92
Grover R and Srinivasan V (1992) ``Evaluating the multiple effects of retail promotions on
brand-loyal and brand-switching segmentsrsquorsquo Journal of Marketing Research Vol 18
February pp 76-89
Hoyer W D and Brown SP (1990) ``Effects of brand awareness on choice for a common
repeat purchase productrsquorsquo Journal of Consumer Research Vol 17 pp 141-8
Jacobson R and Aaker DA (1987) ``The strategic role of product qualityrsquorsquo Journal of
Marketing Vol 51 October pp 31-44
Kaplan RS and Johnson T (1987) Relevance Lost The Rise and Fall of Management
Accounting Harvard Business School Press Boston MA
Keller KL (1993) ``Conceptualizing measuring and managing customer-based brand
equityrsquorsquo Journal of Marketing Vol 57 January pp 1-22
Keller KL (1998) Building Measuring and Managing Brand Equity Prentice Hall
Englewood Cliffs NJ
Lane V and Jacobson R (1995) ``Stock market reactions to brand extension announcements
the effects of brand attitude and familiarityrsquorsquo Journal of Marketing Vol 59 January
pp 63-77
Lassar WM (1998) ``Control systems in supplier-retailer relationships and their impact on
brand performancersquorsquo Journal of Retailing and Consumer Services Vol 5 No 2 pp 65-75
Monroe KB and Krishnan R (1985) ` The effect of price on s ubjective product
evaluationsrsquorsquo in Jacoby J and Olson J (Eds) Perceived Quality Lexington Books
Lexington MA pp 209-32
Narus JA and Anderson JC (1986) ` Turn your industrial distributors into partnersrsquorsquo
Harvard Business Review Vol 64 MarchApril pp 66-71
Nunnally JC (1978) Psychometric Theory 2nd ed McGraw-Hill New York NY
Oliver RL (1997) Satisfaction A Behavioral Perspective on the Consumer McGraw-Hill
New York NY
Phillips LW Chang DR and Buzzell RD (1983) ``Product quality cost position and
business performance a test of some key hypothesesrsquorsquo Journal of Marketing Vol 47
Spring pp 26-43
Shocker AD Srivastava RK and Ruekert RW (1994) ``Challenges and opportunities
facing brand management an introduction to the special issuersquorsquo Journal of Marketing
Research Vol 31 pp 149-58
Spreng RA Harrell GD and Mackoy RD (1995) ` Service recovery impact on
satisfaction and intentionsrsquorsquo Journal of Service Marketing Vol 9 No 1 pp 15-23
Webster FE (2000) ` Understanding the relationships among brands consumers and
resellersrsquorsquo Journal of the Academy of Marketing Science Vol 28 No 1 pp 17-23
Yoo B and Donthu N (2001) ` Developing and validating a multidimensional consumer-
based brand equity scalersquorsquo Journal of Business Research Vol 52 pp 1-14
Yoo B Donthu N and Lee S (2000) ``An examination of selected marketing mix elements
and brand equityrsquorsquo Journal of the Academy of Marketing Science Vol 28 No 2
pp 195-211
Zeithaml VA (1988) ``Consumer perceptions of price quality and value a means-end
model and synthesis of evidencersquorsquo Journal of Marketing Vol 52 July pp 2-22
amp
2 3 4 J O U R N A L O F P R O D U C T amp B R A N D M A N A G E M E N T V O L 1 2 N O 4 2 0 0 3
832019 Brand Equity Mgt
httpslidepdfcomreaderfullbrand-equity-mgt 1617
Executive summary and implications for managers andexecutives
Brand investment benefits sales and the firmrsquos value
The debate around brand equity and brand valuation has in many ways
settled into two camps plusmn the consumer-based approach (mostly marketers)
and the aggregate sales approach (mostly accountants) I appreciate that
this is a gross over-simplification of the distinction between different approaches and that many models (and much of current theory) endeavour
to join together the two approaches However it is important for marketers
to appreciate that they have yet to fully convince others of the validity of
consumer-based approaches to the measurement of brand equity
Baldauf e t a l set out to produce further validation of the consumer-based
model by examining how the dimensions of brand equity are antecedents of
firm performance and especially sales and profitability This consideration is
important since much of the brand valuation debate concerns the treatment
of the brand on the balance sheet rather than its impact on the profit and loss
account And while marketers will always argue that brands are important
intangible assets (thereby meriting inclusion within the balance sheet) muchof our work as marketers is intended to influence sales and profitability
The antecedents of brand equity
Baldauf Cravens and Binder draw on Aakerrsquos model of brand equity in their
study focusing on the three most important antecedents of brand equity plusmn
brand loyalty brand awareness and perceived quality Aakerrsquos argument is
that where a brand has loyal customers high levels of market awareness and
is perceived to be of high quality it will have a high level of equity plusmn it is
more valuable to the firm
This means that the firmrsquos strategy needs to address each antecedent plusmn
focusing on one or other element will not necessarily deliver brand value However given that we are concerned here with the effect on sales volumes
and profits we need to ask whether achieving positive effect in this area
requires a different balance within the strategy Indeed there could
conceivably be a conflict between strategies aimed at increasing the firmrsquos
value (a balance sheet strategy) and strategies aimed at increasing sales (a
profit and loss strategy)
There is a concern that the latter approach to strategy can result in a sales
promotion led approach to marketing as a complement to the corporate
focus on cash flow and short-term profits Therefore being able to
demonstrate that strategies aimed at increasing brand value also produce
short-term benefits in terms of sales and profitability means being able to justify important brand strategies in a climate of short-term focus
Brand equity is not the only thing influencing performance
While brand strategies are important we have to recognise (and Baldauf
et al remind us) that performance is not solely influenced by brand equity
Marketers have to pay attention to other factors and especially to issues
often dismissed as tactical or mere implementation The marketing director
who fails to appreciate that tactical errors and sloppy implementation can
wreck a strategy should not keep his job
Baldauf et al identify three influences other than brand equity plusmn competition
pricing and expenses Since these clearly have an impact on performance
any marketing strategy needs to be flexible enough and the firm needs also to
J O U R N A L O F P R O D U C T amp B R A N D M A N A G E M E N T V O L 1 2 N O 4 2 0 0 3 2 3 5
T h is s u m m a ry h a s b e e n
p r o v id e d t o a ll o w m a n a g e r s
a n d e x e c u t i v e s a r a p id
a p p r e c i a ti o n o f t h e c o n t e n t
o f t h is a r ti c le T h o s e w it h a
p a r t ic u la r in t e r e s t i n t h e
t o p ic c o v e r e d m a y t h e n r e a d
t h e a r t ic l e i n t o t o t o t a k e a d v a n t a g e o f t h e m o r e
c o m p r e h e n s i v e d e s c r i p ti o n
o f t h e r e s e a r c h u n d e rt a k e n
a n d it s r e s u lt s t o g e t t h e fu ll
b e n e fit o f t h e m a t e r ia l
p r e s e n t
832019 Brand Equity Mgt
httpslidepdfcomreaderfullbrand-equity-mgt 1717
pay attention to its performance in terms of cost containment In addition the
impact of pricing and competition requires a regular reality check against
what is actually happening in the market
However too many firms concentrate on these other issues and respond to
market changes by fine tuning tactics undertaking reactive sales promotions
and trimming costs Often the equally important task of developing brand
equity gets lost in the tactical war with competitors plusmn firms must remember that investing in brand equity has a direct impact on sales (elsewhere in this
issue of JPBM Ataman and U Egrave lengin provide a substantive assessment of this
impact) as well as contributing plusmn accounting approaches allowed plusmn to the
firmrsquos overall value
Brand equity strategies plusmn options
We have noted that the dominant elements of Aakerrsquos brand equity model are
brand loyalty brand awareness and perceived quality but this does not
provide us with a direct guide to the setting of strategies Aaker also included
in his model brand associations and other proprietary assets such as
intellectual property and for some brands these considerations are of
considerable importance
The brand strategy first strikes a balance between investing in awareness plusmn
telling people about the brand plusmn and investing in brand loyalty and repeat
purchase While it remains the case that securing repeat purchase is (all
things being equal) more easy than recruiting a new customer we cannot
overlook the need to maintain and extend our brandrsquos position within the
portfolio of brands from which the consumer chooses
Brand investment therefore should consist of general advertising primarily
aimed at building brand awareness and merchandising sales promotions
direct marketing and packaging that reinforces the choice made by
consumers The price details of the mix depend on the stability of marketsrates of market growth or decline competitor activity and the tactical
demands of distribution channels (and especially retailers)
Baldauf et al provide further evidence that brand investment contributes to
overall firm performance and while such investment should not be to the
exclusion of other factors (price c ompetition etc) that affect performance it
is a central element of successful consumer goods marketing What is very
clear is that investing in the brand is about sales and profits as well as the
overall value of the brand itself
(A preAcirccis of the article ``Performance c onsequences of brand equity
management evidence from organizations in the value chainrsquorsquo Supplied byMarketing Consultants for Emerald)
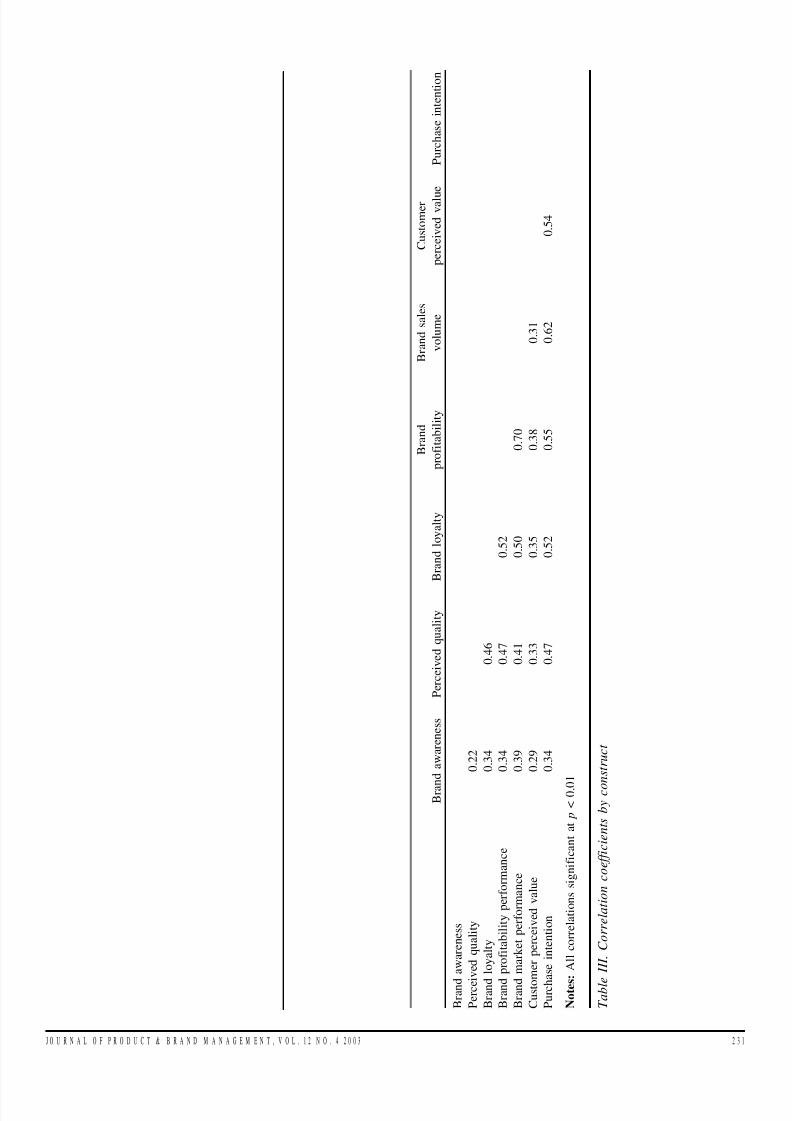
832019 Brand Equity Mgt
httpslidepdfcomreaderfullbrand-equity-mgt 1217
B r a n d a w a r e n e s s
P e r c e i v e d q u a l i t y
B r a n d l o y a l t y
B r a n d
p r o f i t a b i l i t y
B r a n d s a l e s
v o l u m e
C u s t o m e r
p e r c e i v e d v a l u
e
P u r c h a s e i n t e n t i o n
B r a n d
a w a r e n e s s
P e r c e i v e d q u a l i t y
0 2
2
B r a n d
l o y a l t y
0 3
4
0 4
6
B r a n d
p r o f i t a b i l i t y p e r f o r m a n c e
0 3
4
0 4
7
0 5
2
B r a n d
m a r k e t p e r f o r m a n c e
0 3
9
0 4
1
0 5
0
0 7
0
C u s t o
m e r p e r c e i v e d v a l u e
0 2
9
0 3
3
0 3
5
0 3
8
0 3
1
P u r c h
a s e i n t e n t i o n
0 3
4
0 4
7
0 5
2
0 5
5
0 6
2
0 5
4
N o t e s
A l l c o r r e l a t i o n s s i g n i f i c a n t a t p lt 0 0
1
T a b l e
I I I C o r r e l a t i o n c o e f f i c i e n t s b y c o n s t r u c t
J O U R N A L O F P R O D U C T amp B R A N D M A N A G E M E N T V O L 1 2 N O 4 2 0 0 3 2 3 1
832019 Brand Equity Mgt
httpslidepdfcomreaderfullbrand-equity-mgt 1317
measures This was true for all three indicators of performance brand
profitability brand sales volume and customer perceived value
The standardized coefficients from the regression analysis in Table IV
provide some indication of the relative importance of the three brand equity
measures as predictors of performance Intercorrelations exist among the
measures as brand awareness and perceived quality will ultimately affect
brand loyalty The standardized coefficients reflect this relationship since the
coefficient for brand loyalty is almost double that of brand awareness
Loyalty is an important predictor of performance Given the difficulty in
selecting a parsimonious yet comprehensive set of performance measures
managers might consider the greater potential information content of ameasure such as brand loyalty
Building brand loyalty is an actionable initiative for manufacturers Possible
actions include creating a reason-to-buy differentiationpositioning creating
value chain member interest and making brand extensions (eg new tile
designs) (Aaker 1991) Brand loyalty increase can be measured on a
longitudinal basis Our research supports the relevance of tracking resellersrsquo
perceptions of brand loyalty
The brand equity constructs have been validated in previous research and
our study lends support to these scales from a unique perspective in the value
chain plusmn resellers The significance of the brand equity measures has
important implications for developing measures of other intangible assetsOur results supported a relationship between non-financial measures and
indicators of performance Without a link to performance the measures are
unlikely to generate results that support the strategic objectives of a firm
A major implication of our research results refers to strategic channel
partnerships (Narus and Anderson 1986) Given the positive relationships
among channel partners the sacrifices and benefits of manufacturers and
resellers have to be assessed and continually developed Although not
examined in this research problems of channel conflict like power or
opportunism are also of central issue (Webster 2000) More importantly as
the new economy compels less traditional and more cooperative ways of
conducting business it is essential to consider the impact of these
cooperative ventures on performance measurement
Dependent variables
Independent
variables
Standardized
- -coefficient
(t-value) F -value
Adjusted
R2
Brand profitability performance Brand awareness 016 (233) 2776 034
Perceived quality 028 (376)
Brand loyalty 033 (435)
Brand market perf or mance Brand awar eness 018 (250) 2334 031
Perceived quality 022 (284)Brand loyalty 034 (427)
Customer perceived value Brand awareness 018 (227) 1142 017
Perceived quality 021 (246)
Brand loyalty 019 (222)
Purchase intention Customer
p ercei ved v alu e 05 4 (79 3) 6 29 3 0 2 9
Brand market performance Purchase intention 062 (963) 9266 038
Brand profitability performance Purchase intention 055 (802) 6436 029
Notes Significant at p lt 001 unless noted Significant at p = 005
Table IV Results of single and multiple regression analysis
In it ia ti v e fo r m a n u fa c t u r e rs
R e s e a r c h r e s u lt s
2 3 2 J O U R N A L O F P R O D U C T amp B R A N D M A N A G E M E N T V O L 1 2 N O 4 2 0 0 3
832019 Brand Equity Mgt
httpslidepdfcomreaderfullbrand-equity-mgt 1417
It is apparent from the study results that factors other than brand equity also
impact performance since the variations in performance explained by brand
equity ranges from 17 to 34 percent (Table IV R-squared values) Brand
equity is an important predictor of performance but other factors such as
competition prices and expenses also impact performance A shortcoming
of our research is the focus on cross-sectional data Hence we are not able to
explore the long-term effects of brand equity on performance Clearly future
studies could refer to longitudinal data Tracking at the reseller level of the
value chain should be more feasible than end-user tracking of brand equity
The reliance on subjective information in our study might be a matter of
concern as well While brand equity from a customer-based perspective and
perceived customer value require quasi subjective information by definition
an alternative view might suggest that objective assessments are necessary
with respect to performance measures However Dess and Robinson (1984)
found no significant differences comparing the validity of subjective and
objective performance measures Nonetheless in future research the model
could be replicated using more objective performance data
Note
1 We term these intermediaries resellers as they distribute the products (tiles) to both
businesses and customers
References
Aaker DA (1989) ``Managing assets and skills the key to a sustainable competitive
advantagersquorsquo California Management Review Vol 32 Winter pp 91-106
Aaker DA (1991) Managing Brand Equity The Free Press New York NY
Aaker DA (1996a) Building Strong Brands The Free Press New York NY
Aaker DA (1996b) ``Measuring brand equity across products and marketsrsquorsquo California
Management Review Vol 38 No 3 pp 102-20Aaker DA and Jacobson R (1994) ``The financial information content of perceived
qualityrsquorsquo Journal of Marketing Research Vol 31 pp 191-201
Armstrong JS and Overton TS (1977) ` Estimating non-response bias in mail surveysrsquorsquo
Journal of Marketing Research Vol 14 August pp 396-402
Bagozzi RP Yi Y and Phillips LW (1991) ``Assessing construct validity in organizational
researchrsquorsquo Administrative Science Quarterly Vol 36 September pp 421-58
Barth ME Clement MB Foster G and Kasznik R (1998) ` Brand values and capital
market valuationrsquorsquo Review of Accounting Studies Vol 3 pp 41-68
Barwise P (1993) ``Brand equity snark or boojumrsquorsquo International Journal of Research in
Marketing Vol 10 March pp 93-104
Barwise P Higson C Likierman A and Marsh P (1989) Accounting for Brands London
Business School and the Institute of Chartered Accountants in England and Wales
London
Beatty SE and Kahle LR (1988) ``Alternative hierarchies of the attitude-behavior
relationship the impact of brand commitment and habitrsquorsquo Journal of the Academy of
Marketing Science Vol 16 Summer pp 1-10
Churchill GA Jr (1979) ` A paradigm for developing better m easures of marketing
constructsrsquorsquo Journal of Marketing Research Vol 16 February pp 64-73
Cohen J and Cohen P (1983) Applied Multiple RegressionCorrelation Analysis for the
Behavioral Sciences (2nd ed) Lawrence Erlbaum Associates Hillsdale NJ
Cronbach LJ (1951) ``Coefficient alpha and the internal structure of testsrsquorsquo Psychometrika
Vol 16 September pp 297-334
Dess GG and Robinson RB (1984) ``Measuring organizational performance in the absence
of objective measures the case of privately-held firm and conglomerate business unitrsquorsquo
Strategic Management Journal Vol 5 pp 265-73
S u b je c t iv e in fo r m a t io n
J O U R N A L O F P R O D U C T amp B R A N D M A N A G E M E N T V O L 1 2 N O 4 2 0 0 3 2 3 3
832019 Brand Equity Mgt
httpslidepdfcomreaderfullbrand-equity-mgt 1517
Dodds WB Monroe KB and Grewal D (1991) ` Effects of price brand and store
information on buyersrsquo product evaluationrsquorsquo Journal of Marketing Research Vol 28
August pp 307-19
Gerbing DW and Anderson JC (1988) ` An updated paradigm for s cale development
incorporating unidimensionality and its assess mentrsquorsquo Journal of Marketing Research
Vol 25 May pp 186-92
Grover R and Srinivasan V (1992) ``Evaluating the multiple effects of retail promotions on
brand-loyal and brand-switching segmentsrsquorsquo Journal of Marketing Research Vol 18
February pp 76-89
Hoyer W D and Brown SP (1990) ``Effects of brand awareness on choice for a common
repeat purchase productrsquorsquo Journal of Consumer Research Vol 17 pp 141-8
Jacobson R and Aaker DA (1987) ``The strategic role of product qualityrsquorsquo Journal of
Marketing Vol 51 October pp 31-44
Kaplan RS and Johnson T (1987) Relevance Lost The Rise and Fall of Management
Accounting Harvard Business School Press Boston MA
Keller KL (1993) ``Conceptualizing measuring and managing customer-based brand
equityrsquorsquo Journal of Marketing Vol 57 January pp 1-22
Keller KL (1998) Building Measuring and Managing Brand Equity Prentice Hall
Englewood Cliffs NJ
Lane V and Jacobson R (1995) ``Stock market reactions to brand extension announcements
the effects of brand attitude and familiarityrsquorsquo Journal of Marketing Vol 59 January
pp 63-77
Lassar WM (1998) ``Control systems in supplier-retailer relationships and their impact on
brand performancersquorsquo Journal of Retailing and Consumer Services Vol 5 No 2 pp 65-75
Monroe KB and Krishnan R (1985) ` The effect of price on s ubjective product
evaluationsrsquorsquo in Jacoby J and Olson J (Eds) Perceived Quality Lexington Books
Lexington MA pp 209-32
Narus JA and Anderson JC (1986) ` Turn your industrial distributors into partnersrsquorsquo
Harvard Business Review Vol 64 MarchApril pp 66-71
Nunnally JC (1978) Psychometric Theory 2nd ed McGraw-Hill New York NY
Oliver RL (1997) Satisfaction A Behavioral Perspective on the Consumer McGraw-Hill
New York NY
Phillips LW Chang DR and Buzzell RD (1983) ``Product quality cost position and
business performance a test of some key hypothesesrsquorsquo Journal of Marketing Vol 47
Spring pp 26-43
Shocker AD Srivastava RK and Ruekert RW (1994) ``Challenges and opportunities
facing brand management an introduction to the special issuersquorsquo Journal of Marketing
Research Vol 31 pp 149-58
Spreng RA Harrell GD and Mackoy RD (1995) ` Service recovery impact on
satisfaction and intentionsrsquorsquo Journal of Service Marketing Vol 9 No 1 pp 15-23
Webster FE (2000) ` Understanding the relationships among brands consumers and
resellersrsquorsquo Journal of the Academy of Marketing Science Vol 28 No 1 pp 17-23
Yoo B and Donthu N (2001) ` Developing and validating a multidimensional consumer-
based brand equity scalersquorsquo Journal of Business Research Vol 52 pp 1-14
Yoo B Donthu N and Lee S (2000) ``An examination of selected marketing mix elements
and brand equityrsquorsquo Journal of the Academy of Marketing Science Vol 28 No 2
pp 195-211
Zeithaml VA (1988) ``Consumer perceptions of price quality and value a means-end
model and synthesis of evidencersquorsquo Journal of Marketing Vol 52 July pp 2-22
amp
2 3 4 J O U R N A L O F P R O D U C T amp B R A N D M A N A G E M E N T V O L 1 2 N O 4 2 0 0 3
832019 Brand Equity Mgt
httpslidepdfcomreaderfullbrand-equity-mgt 1617
Executive summary and implications for managers andexecutives
Brand investment benefits sales and the firmrsquos value
The debate around brand equity and brand valuation has in many ways
settled into two camps plusmn the consumer-based approach (mostly marketers)
and the aggregate sales approach (mostly accountants) I appreciate that
this is a gross over-simplification of the distinction between different approaches and that many models (and much of current theory) endeavour
to join together the two approaches However it is important for marketers
to appreciate that they have yet to fully convince others of the validity of
consumer-based approaches to the measurement of brand equity
Baldauf e t a l set out to produce further validation of the consumer-based
model by examining how the dimensions of brand equity are antecedents of
firm performance and especially sales and profitability This consideration is
important since much of the brand valuation debate concerns the treatment
of the brand on the balance sheet rather than its impact on the profit and loss
account And while marketers will always argue that brands are important
intangible assets (thereby meriting inclusion within the balance sheet) muchof our work as marketers is intended to influence sales and profitability
The antecedents of brand equity
Baldauf Cravens and Binder draw on Aakerrsquos model of brand equity in their
study focusing on the three most important antecedents of brand equity plusmn
brand loyalty brand awareness and perceived quality Aakerrsquos argument is
that where a brand has loyal customers high levels of market awareness and
is perceived to be of high quality it will have a high level of equity plusmn it is
more valuable to the firm
This means that the firmrsquos strategy needs to address each antecedent plusmn
focusing on one or other element will not necessarily deliver brand value However given that we are concerned here with the effect on sales volumes
and profits we need to ask whether achieving positive effect in this area
requires a different balance within the strategy Indeed there could
conceivably be a conflict between strategies aimed at increasing the firmrsquos
value (a balance sheet strategy) and strategies aimed at increasing sales (a
profit and loss strategy)
There is a concern that the latter approach to strategy can result in a sales
promotion led approach to marketing as a complement to the corporate
focus on cash flow and short-term profits Therefore being able to
demonstrate that strategies aimed at increasing brand value also produce
short-term benefits in terms of sales and profitability means being able to justify important brand strategies in a climate of short-term focus
Brand equity is not the only thing influencing performance
While brand strategies are important we have to recognise (and Baldauf
et al remind us) that performance is not solely influenced by brand equity
Marketers have to pay attention to other factors and especially to issues
often dismissed as tactical or mere implementation The marketing director
who fails to appreciate that tactical errors and sloppy implementation can
wreck a strategy should not keep his job
Baldauf et al identify three influences other than brand equity plusmn competition
pricing and expenses Since these clearly have an impact on performance
any marketing strategy needs to be flexible enough and the firm needs also to
J O U R N A L O F P R O D U C T amp B R A N D M A N A G E M E N T V O L 1 2 N O 4 2 0 0 3 2 3 5
T h is s u m m a ry h a s b e e n
p r o v id e d t o a ll o w m a n a g e r s
a n d e x e c u t i v e s a r a p id
a p p r e c i a ti o n o f t h e c o n t e n t
o f t h is a r ti c le T h o s e w it h a
p a r t ic u la r in t e r e s t i n t h e
t o p ic c o v e r e d m a y t h e n r e a d
t h e a r t ic l e i n t o t o t o t a k e a d v a n t a g e o f t h e m o r e
c o m p r e h e n s i v e d e s c r i p ti o n
o f t h e r e s e a r c h u n d e rt a k e n
a n d it s r e s u lt s t o g e t t h e fu ll
b e n e fit o f t h e m a t e r ia l
p r e s e n t
832019 Brand Equity Mgt
httpslidepdfcomreaderfullbrand-equity-mgt 1717
pay attention to its performance in terms of cost containment In addition the
impact of pricing and competition requires a regular reality check against
what is actually happening in the market
However too many firms concentrate on these other issues and respond to
market changes by fine tuning tactics undertaking reactive sales promotions
and trimming costs Often the equally important task of developing brand
equity gets lost in the tactical war with competitors plusmn firms must remember that investing in brand equity has a direct impact on sales (elsewhere in this
issue of JPBM Ataman and U Egrave lengin provide a substantive assessment of this
impact) as well as contributing plusmn accounting approaches allowed plusmn to the
firmrsquos overall value
Brand equity strategies plusmn options
We have noted that the dominant elements of Aakerrsquos brand equity model are
brand loyalty brand awareness and perceived quality but this does not
provide us with a direct guide to the setting of strategies Aaker also included
in his model brand associations and other proprietary assets such as
intellectual property and for some brands these considerations are of
considerable importance
The brand strategy first strikes a balance between investing in awareness plusmn
telling people about the brand plusmn and investing in brand loyalty and repeat
purchase While it remains the case that securing repeat purchase is (all
things being equal) more easy than recruiting a new customer we cannot
overlook the need to maintain and extend our brandrsquos position within the
portfolio of brands from which the consumer chooses
Brand investment therefore should consist of general advertising primarily
aimed at building brand awareness and merchandising sales promotions
direct marketing and packaging that reinforces the choice made by
consumers The price details of the mix depend on the stability of marketsrates of market growth or decline competitor activity and the tactical
demands of distribution channels (and especially retailers)
Baldauf et al provide further evidence that brand investment contributes to
overall firm performance and while such investment should not be to the
exclusion of other factors (price c ompetition etc) that affect performance it
is a central element of successful consumer goods marketing What is very
clear is that investing in the brand is about sales and profits as well as the
overall value of the brand itself
(A preAcirccis of the article ``Performance c onsequences of brand equity
management evidence from organizations in the value chainrsquorsquo Supplied byMarketing Consultants for Emerald)
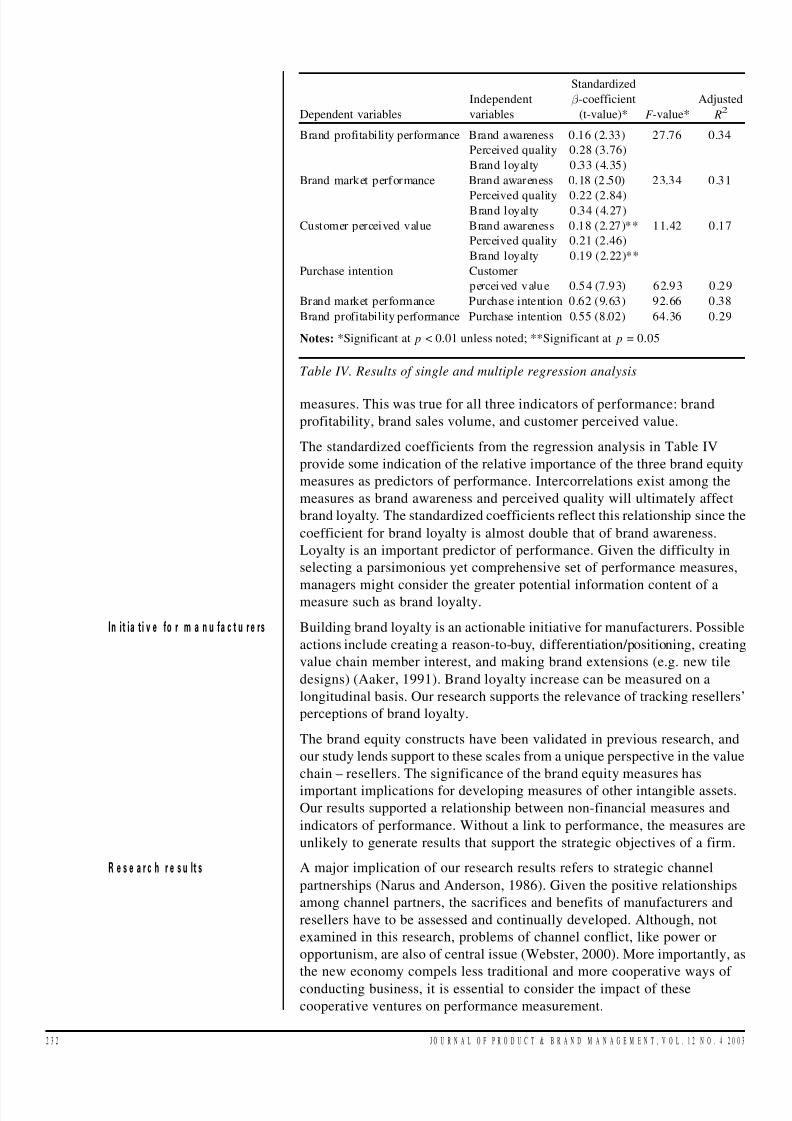
832019 Brand Equity Mgt
httpslidepdfcomreaderfullbrand-equity-mgt 1317
measures This was true for all three indicators of performance brand
profitability brand sales volume and customer perceived value
The standardized coefficients from the regression analysis in Table IV
provide some indication of the relative importance of the three brand equity
measures as predictors of performance Intercorrelations exist among the
measures as brand awareness and perceived quality will ultimately affect
brand loyalty The standardized coefficients reflect this relationship since the
coefficient for brand loyalty is almost double that of brand awareness
Loyalty is an important predictor of performance Given the difficulty in
selecting a parsimonious yet comprehensive set of performance measures
managers might consider the greater potential information content of ameasure such as brand loyalty
Building brand loyalty is an actionable initiative for manufacturers Possible
actions include creating a reason-to-buy differentiationpositioning creating
value chain member interest and making brand extensions (eg new tile
designs) (Aaker 1991) Brand loyalty increase can be measured on a
longitudinal basis Our research supports the relevance of tracking resellersrsquo
perceptions of brand loyalty
The brand equity constructs have been validated in previous research and
our study lends support to these scales from a unique perspective in the value
chain plusmn resellers The significance of the brand equity measures has
important implications for developing measures of other intangible assetsOur results supported a relationship between non-financial measures and
indicators of performance Without a link to performance the measures are
unlikely to generate results that support the strategic objectives of a firm
A major implication of our research results refers to strategic channel
partnerships (Narus and Anderson 1986) Given the positive relationships
among channel partners the sacrifices and benefits of manufacturers and
resellers have to be assessed and continually developed Although not
examined in this research problems of channel conflict like power or
opportunism are also of central issue (Webster 2000) More importantly as
the new economy compels less traditional and more cooperative ways of
conducting business it is essential to consider the impact of these
cooperative ventures on performance measurement
Dependent variables
Independent
variables
Standardized
- -coefficient
(t-value) F -value
Adjusted
R2
Brand profitability performance Brand awareness 016 (233) 2776 034
Perceived quality 028 (376)
Brand loyalty 033 (435)
Brand market perf or mance Brand awar eness 018 (250) 2334 031
Perceived quality 022 (284)Brand loyalty 034 (427)
Customer perceived value Brand awareness 018 (227) 1142 017
Perceived quality 021 (246)
Brand loyalty 019 (222)
Purchase intention Customer
p ercei ved v alu e 05 4 (79 3) 6 29 3 0 2 9
Brand market performance Purchase intention 062 (963) 9266 038
Brand profitability performance Purchase intention 055 (802) 6436 029
Notes Significant at p lt 001 unless noted Significant at p = 005
Table IV Results of single and multiple regression analysis
In it ia ti v e fo r m a n u fa c t u r e rs
R e s e a r c h r e s u lt s
2 3 2 J O U R N A L O F P R O D U C T amp B R A N D M A N A G E M E N T V O L 1 2 N O 4 2 0 0 3
832019 Brand Equity Mgt
httpslidepdfcomreaderfullbrand-equity-mgt 1417
It is apparent from the study results that factors other than brand equity also
impact performance since the variations in performance explained by brand
equity ranges from 17 to 34 percent (Table IV R-squared values) Brand
equity is an important predictor of performance but other factors such as
competition prices and expenses also impact performance A shortcoming
of our research is the focus on cross-sectional data Hence we are not able to
explore the long-term effects of brand equity on performance Clearly future
studies could refer to longitudinal data Tracking at the reseller level of the
value chain should be more feasible than end-user tracking of brand equity
The reliance on subjective information in our study might be a matter of
concern as well While brand equity from a customer-based perspective and
perceived customer value require quasi subjective information by definition
an alternative view might suggest that objective assessments are necessary
with respect to performance measures However Dess and Robinson (1984)
found no significant differences comparing the validity of subjective and
objective performance measures Nonetheless in future research the model
could be replicated using more objective performance data
Note
1 We term these intermediaries resellers as they distribute the products (tiles) to both
businesses and customers
References
Aaker DA (1989) ``Managing assets and skills the key to a sustainable competitive
advantagersquorsquo California Management Review Vol 32 Winter pp 91-106
Aaker DA (1991) Managing Brand Equity The Free Press New York NY
Aaker DA (1996a) Building Strong Brands The Free Press New York NY
Aaker DA (1996b) ``Measuring brand equity across products and marketsrsquorsquo California
Management Review Vol 38 No 3 pp 102-20Aaker DA and Jacobson R (1994) ``The financial information content of perceived
qualityrsquorsquo Journal of Marketing Research Vol 31 pp 191-201
Armstrong JS and Overton TS (1977) ` Estimating non-response bias in mail surveysrsquorsquo
Journal of Marketing Research Vol 14 August pp 396-402
Bagozzi RP Yi Y and Phillips LW (1991) ``Assessing construct validity in organizational
researchrsquorsquo Administrative Science Quarterly Vol 36 September pp 421-58
Barth ME Clement MB Foster G and Kasznik R (1998) ` Brand values and capital
market valuationrsquorsquo Review of Accounting Studies Vol 3 pp 41-68
Barwise P (1993) ``Brand equity snark or boojumrsquorsquo International Journal of Research in
Marketing Vol 10 March pp 93-104
Barwise P Higson C Likierman A and Marsh P (1989) Accounting for Brands London
Business School and the Institute of Chartered Accountants in England and Wales
London
Beatty SE and Kahle LR (1988) ``Alternative hierarchies of the attitude-behavior
relationship the impact of brand commitment and habitrsquorsquo Journal of the Academy of
Marketing Science Vol 16 Summer pp 1-10
Churchill GA Jr (1979) ` A paradigm for developing better m easures of marketing
constructsrsquorsquo Journal of Marketing Research Vol 16 February pp 64-73
Cohen J and Cohen P (1983) Applied Multiple RegressionCorrelation Analysis for the
Behavioral Sciences (2nd ed) Lawrence Erlbaum Associates Hillsdale NJ
Cronbach LJ (1951) ``Coefficient alpha and the internal structure of testsrsquorsquo Psychometrika
Vol 16 September pp 297-334
Dess GG and Robinson RB (1984) ``Measuring organizational performance in the absence
of objective measures the case of privately-held firm and conglomerate business unitrsquorsquo
Strategic Management Journal Vol 5 pp 265-73
S u b je c t iv e in fo r m a t io n
J O U R N A L O F P R O D U C T amp B R A N D M A N A G E M E N T V O L 1 2 N O 4 2 0 0 3 2 3 3
832019 Brand Equity Mgt
httpslidepdfcomreaderfullbrand-equity-mgt 1517
Dodds WB Monroe KB and Grewal D (1991) ` Effects of price brand and store
information on buyersrsquo product evaluationrsquorsquo Journal of Marketing Research Vol 28
August pp 307-19
Gerbing DW and Anderson JC (1988) ` An updated paradigm for s cale development
incorporating unidimensionality and its assess mentrsquorsquo Journal of Marketing Research
Vol 25 May pp 186-92
Grover R and Srinivasan V (1992) ``Evaluating the multiple effects of retail promotions on
brand-loyal and brand-switching segmentsrsquorsquo Journal of Marketing Research Vol 18
February pp 76-89
Hoyer W D and Brown SP (1990) ``Effects of brand awareness on choice for a common
repeat purchase productrsquorsquo Journal of Consumer Research Vol 17 pp 141-8
Jacobson R and Aaker DA (1987) ``The strategic role of product qualityrsquorsquo Journal of
Marketing Vol 51 October pp 31-44
Kaplan RS and Johnson T (1987) Relevance Lost The Rise and Fall of Management
Accounting Harvard Business School Press Boston MA
Keller KL (1993) ``Conceptualizing measuring and managing customer-based brand
equityrsquorsquo Journal of Marketing Vol 57 January pp 1-22
Keller KL (1998) Building Measuring and Managing Brand Equity Prentice Hall
Englewood Cliffs NJ
Lane V and Jacobson R (1995) ``Stock market reactions to brand extension announcements
the effects of brand attitude and familiarityrsquorsquo Journal of Marketing Vol 59 January
pp 63-77
Lassar WM (1998) ``Control systems in supplier-retailer relationships and their impact on
brand performancersquorsquo Journal of Retailing and Consumer Services Vol 5 No 2 pp 65-75
Monroe KB and Krishnan R (1985) ` The effect of price on s ubjective product
evaluationsrsquorsquo in Jacoby J and Olson J (Eds) Perceived Quality Lexington Books
Lexington MA pp 209-32
Narus JA and Anderson JC (1986) ` Turn your industrial distributors into partnersrsquorsquo
Harvard Business Review Vol 64 MarchApril pp 66-71
Nunnally JC (1978) Psychometric Theory 2nd ed McGraw-Hill New York NY
Oliver RL (1997) Satisfaction A Behavioral Perspective on the Consumer McGraw-Hill
New York NY
Phillips LW Chang DR and Buzzell RD (1983) ``Product quality cost position and
business performance a test of some key hypothesesrsquorsquo Journal of Marketing Vol 47
Spring pp 26-43
Shocker AD Srivastava RK and Ruekert RW (1994) ``Challenges and opportunities
facing brand management an introduction to the special issuersquorsquo Journal of Marketing
Research Vol 31 pp 149-58
Spreng RA Harrell GD and Mackoy RD (1995) ` Service recovery impact on
satisfaction and intentionsrsquorsquo Journal of Service Marketing Vol 9 No 1 pp 15-23
Webster FE (2000) ` Understanding the relationships among brands consumers and
resellersrsquorsquo Journal of the Academy of Marketing Science Vol 28 No 1 pp 17-23
Yoo B and Donthu N (2001) ` Developing and validating a multidimensional consumer-
based brand equity scalersquorsquo Journal of Business Research Vol 52 pp 1-14
Yoo B Donthu N and Lee S (2000) ``An examination of selected marketing mix elements
and brand equityrsquorsquo Journal of the Academy of Marketing Science Vol 28 No 2
pp 195-211
Zeithaml VA (1988) ``Consumer perceptions of price quality and value a means-end
model and synthesis of evidencersquorsquo Journal of Marketing Vol 52 July pp 2-22
amp
2 3 4 J O U R N A L O F P R O D U C T amp B R A N D M A N A G E M E N T V O L 1 2 N O 4 2 0 0 3
832019 Brand Equity Mgt
httpslidepdfcomreaderfullbrand-equity-mgt 1617
Executive summary and implications for managers andexecutives
Brand investment benefits sales and the firmrsquos value
The debate around brand equity and brand valuation has in many ways
settled into two camps plusmn the consumer-based approach (mostly marketers)
and the aggregate sales approach (mostly accountants) I appreciate that
this is a gross over-simplification of the distinction between different approaches and that many models (and much of current theory) endeavour
to join together the two approaches However it is important for marketers
to appreciate that they have yet to fully convince others of the validity of
consumer-based approaches to the measurement of brand equity
Baldauf e t a l set out to produce further validation of the consumer-based
model by examining how the dimensions of brand equity are antecedents of
firm performance and especially sales and profitability This consideration is
important since much of the brand valuation debate concerns the treatment
of the brand on the balance sheet rather than its impact on the profit and loss
account And while marketers will always argue that brands are important
intangible assets (thereby meriting inclusion within the balance sheet) muchof our work as marketers is intended to influence sales and profitability
The antecedents of brand equity
Baldauf Cravens and Binder draw on Aakerrsquos model of brand equity in their
study focusing on the three most important antecedents of brand equity plusmn
brand loyalty brand awareness and perceived quality Aakerrsquos argument is
that where a brand has loyal customers high levels of market awareness and
is perceived to be of high quality it will have a high level of equity plusmn it is
more valuable to the firm
This means that the firmrsquos strategy needs to address each antecedent plusmn
focusing on one or other element will not necessarily deliver brand value However given that we are concerned here with the effect on sales volumes
and profits we need to ask whether achieving positive effect in this area
requires a different balance within the strategy Indeed there could
conceivably be a conflict between strategies aimed at increasing the firmrsquos
value (a balance sheet strategy) and strategies aimed at increasing sales (a
profit and loss strategy)
There is a concern that the latter approach to strategy can result in a sales
promotion led approach to marketing as a complement to the corporate
focus on cash flow and short-term profits Therefore being able to
demonstrate that strategies aimed at increasing brand value also produce
short-term benefits in terms of sales and profitability means being able to justify important brand strategies in a climate of short-term focus
Brand equity is not the only thing influencing performance
While brand strategies are important we have to recognise (and Baldauf
et al remind us) that performance is not solely influenced by brand equity
Marketers have to pay attention to other factors and especially to issues
often dismissed as tactical or mere implementation The marketing director
who fails to appreciate that tactical errors and sloppy implementation can
wreck a strategy should not keep his job
Baldauf et al identify three influences other than brand equity plusmn competition
pricing and expenses Since these clearly have an impact on performance
any marketing strategy needs to be flexible enough and the firm needs also to
J O U R N A L O F P R O D U C T amp B R A N D M A N A G E M E N T V O L 1 2 N O 4 2 0 0 3 2 3 5
T h is s u m m a ry h a s b e e n
p r o v id e d t o a ll o w m a n a g e r s
a n d e x e c u t i v e s a r a p id
a p p r e c i a ti o n o f t h e c o n t e n t
o f t h is a r ti c le T h o s e w it h a
p a r t ic u la r in t e r e s t i n t h e
t o p ic c o v e r e d m a y t h e n r e a d
t h e a r t ic l e i n t o t o t o t a k e a d v a n t a g e o f t h e m o r e
c o m p r e h e n s i v e d e s c r i p ti o n
o f t h e r e s e a r c h u n d e rt a k e n
a n d it s r e s u lt s t o g e t t h e fu ll
b e n e fit o f t h e m a t e r ia l
p r e s e n t
832019 Brand Equity Mgt
httpslidepdfcomreaderfullbrand-equity-mgt 1717
pay attention to its performance in terms of cost containment In addition the
impact of pricing and competition requires a regular reality check against
what is actually happening in the market
However too many firms concentrate on these other issues and respond to
market changes by fine tuning tactics undertaking reactive sales promotions
and trimming costs Often the equally important task of developing brand
equity gets lost in the tactical war with competitors plusmn firms must remember that investing in brand equity has a direct impact on sales (elsewhere in this
issue of JPBM Ataman and U Egrave lengin provide a substantive assessment of this
impact) as well as contributing plusmn accounting approaches allowed plusmn to the
firmrsquos overall value
Brand equity strategies plusmn options
We have noted that the dominant elements of Aakerrsquos brand equity model are
brand loyalty brand awareness and perceived quality but this does not
provide us with a direct guide to the setting of strategies Aaker also included
in his model brand associations and other proprietary assets such as
intellectual property and for some brands these considerations are of
considerable importance
The brand strategy first strikes a balance between investing in awareness plusmn
telling people about the brand plusmn and investing in brand loyalty and repeat
purchase While it remains the case that securing repeat purchase is (all
things being equal) more easy than recruiting a new customer we cannot
overlook the need to maintain and extend our brandrsquos position within the
portfolio of brands from which the consumer chooses
Brand investment therefore should consist of general advertising primarily
aimed at building brand awareness and merchandising sales promotions
direct marketing and packaging that reinforces the choice made by
consumers The price details of the mix depend on the stability of marketsrates of market growth or decline competitor activity and the tactical
demands of distribution channels (and especially retailers)
Baldauf et al provide further evidence that brand investment contributes to
overall firm performance and while such investment should not be to the
exclusion of other factors (price c ompetition etc) that affect performance it
is a central element of successful consumer goods marketing What is very
clear is that investing in the brand is about sales and profits as well as the
overall value of the brand itself
(A preAcirccis of the article ``Performance c onsequences of brand equity
management evidence from organizations in the value chainrsquorsquo Supplied byMarketing Consultants for Emerald)
832019 Brand Equity Mgt
httpslidepdfcomreaderfullbrand-equity-mgt 1717
pay attention to its performance in terms of cost containment In addition the
impact of pricing and competition requires a regular reality check against
what is actually happening in the market
However too many firms concentrate on these other issues and respond to
market changes by fine tuning tactics undertaking reactive sales promotions
and trimming costs Often the equally important task of developing brand
equity gets lost in the tactical war with competitors plusmn firms must remember that investing in brand equity has a direct impact on sales (elsewhere in this
issue of JPBM Ataman and U Egrave lengin provide a substantive assessment of this
impact) as well as contributing plusmn accounting approaches allowed plusmn to the
firmrsquos overall value
Brand equity strategies plusmn options
We have noted that the dominant elements of Aakerrsquos brand equity model are
brand loyalty brand awareness and perceived quality but this does not
provide us with a direct guide to the setting of strategies Aaker also included
in his model brand associations and other proprietary assets such as
intellectual property and for some brands these considerations are of
considerable importance
The brand strategy first strikes a balance between investing in awareness plusmn
telling people about the brand plusmn and investing in brand loyalty and repeat
purchase While it remains the case that securing repeat purchase is (all
things being equal) more easy than recruiting a new customer we cannot
overlook the need to maintain and extend our brandrsquos position within the
portfolio of brands from which the consumer chooses
Brand investment therefore should consist of general advertising primarily
aimed at building brand awareness and merchandising sales promotions
direct marketing and packaging that reinforces the choice made by
consumers The price details of the mix depend on the stability of marketsrates of market growth or decline competitor activity and the tactical
demands of distribution channels (and especially retailers)
Baldauf et al provide further evidence that brand investment contributes to
overall firm performance and while such investment should not be to the
exclusion of other factors (price c ompetition etc) that affect performance it
is a central element of successful consumer goods marketing What is very
clear is that investing in the brand is about sales and profits as well as the
overall value of the brand itself
(A preAcirccis of the article ``Performance c onsequences of brand equity
management evidence from organizations in the value chainrsquorsquo Supplied byMarketing Consultants for Emerald)