Brand Equity
127
Project Report On “Brand equity of coca cala” Submitted for partial fulfillment of requirement for the award of degree Of Master of Business Administration Of GRAPHIC ERA UNIVERSITY DEHRADUN (UTTRAKHAND) Session 2010-12 Under the Supervision of Submitted By Prof. Fatima mariyam Pawan kumar Faculty of Management Studies Roll No-1401056 Enrolment No-11141056 0
-
Upload
mohitkolli -
Category
Documents
-
view
23 -
download
3
description
pepsi
Transcript of Brand Equity
Project Report
On
“Brand equity of coca cala”
Submitted for partial fulfillment of requirement for the award of degree
Of
Master of Business Administration
Of
GRAPHIC ERA UNIVERSITY
DEHRADUN (UTTRAKHAND)
Session 2010-12
Under the Supervision of Submitted ByProf. Fatima mariyam Pawan kumar Faculty of Management Studies Roll No-1401056
Enrolment No-11141056
FACULTY OF MANAGEMENT STUDIES GRAPHIC ERA UNIVERSITY
0
DECLARATION
I hereby declare that the project report entitled”Brand equity of coca cola”submitted for
the Degree of Master Of Business Administration,is my original work and the project
report has not formed the basis for the award of any degree,diploma,associate
ship,fellowship or similar other titled.It has not been submitted to any other University or
institution for the award of degree or diploma.
(singnature of student)
Name of student
Pawan kumar
1
CERTIFICATE BY GUIDE
I have the pleasure in certifying that Mr.Pawan kumar.is the student of Grapich Era
University of the Master,s Degree in Business Adminstration(MBA).His university Roll
No 1401056.
He has completed his project work Title as” Brand equity of coca cola”under the
guidance.
I certify that is his original effort and has not been copied from any other source.This
project has also not been submitted in any other University for the purpose of award of
any Degree.
This project fulfill the requirement of the curriculum prescribed by the Grapic Era
University,Dehradun for the said course.
I recommend this project work for evaluation and consideration for the award of Degree
to the student.
Signature:
Name of the Guide:
Prof. Fatima mariyam
2
ACKNOWLEDGEMENT
I express my sincere thanks to my project guide Prof.Fatima mariyam faculty of
management Deptt.,for guiding me right form the inception till the successful completion
of the project.I also guidance during the presentation of this project report.I am grateful to
Faculty of Management Studies of Graphic Era University Dehradun.
I wish to record my sincere thanks to our Parents, family members, relatives and our
friends for their help and cooperation throughout our project and for providing us
support, encouragement and suggestions at every stage of our research
My thank,s are due to those who have helped in collecting data or analysis or typesetting
etc.
(Signature of student)
Name of student
Pawan kumar
3
Project report in any organization is an attempt to provide the student a practical Input
and Exposure to the Real world situation in which he has to work in future. My Project in
COCA-COLA was an attempt in this regard. The project work provided to me was a
survey titled based on E.D.S.-Every Dealer Survey it was to find out the Effect of
Merchandising and Route Assessment on Productivity/Sales, Availability of product,
MKT. Condition, Demand & supply of product, Distribution Channel, Cooler display,
warm display, in Dehradun City. The Extract of the work is presented in this report
under various headings as, Introduction, Company’s Profile, Project Introduction,
Methodology, Data analysis, Suggestions and Conclusions.
This report provides me a chance to study and analyses the practical aspects of the topic
(Merchandising and Route Productivity). It enhanced my knowledge in the field of
marketing. This project also gave me the chance to improve logical thinking and
interacting patterns. While working on the project, we came to know about the latest
marketing strategies and trends prevailing in the market. The way of selling and
distribution network of Coca Cola was different.
4
TABLE OF CONTENT
Title page no.
I. DECLARATION BY STUDENTS
II. CERTIFICATE BY GUIDE
III. ACKNOWLEDLEMENT BY STUDENTS
IV. EXECUTIVE SUMMARY
1. INTRODUCTION
2. COMPANY PROFILE
3. REVIEW OF LITRETURE
4. RESEARCH METHODOLOGY
5. MARKETING STRATEGY OF COKE
6. DATA ANALYSIS AND INTERPRETATION
7. CONCLUSION, SUGGESTION,LIMITATION
8. BIBLOGRAPHY
9. ANNEXURE
QUESTIONNAIR
5
INTRODUCTION
6
The cola industry has phenomenal possibilities for rocketing profit growth inspite of the
sign of relief heaved by the manufacture at the abrupt sensational termination of coca
cola monopoly the tastes of cola is by no means extinguished the coca. Cola have a status
symbol to it..., generated by the sub standard, penetrated, advertising and extensive
distribution network.
Total soft drink segment is growing at the rate of 10% per year still if international
standard area considered the per capita consumption of three serving in rock bottom, less
than even our neighbors Pakistan and Bangladesh, where it is four more as much. So with
kind of a market potential coke entered in India in 1991 after the permissions of setting
up Britico Food company to coke was granted by the government in Pune in 1992 the
plant was established for is deducted then the bottle are taken out of the line and cleaned
again or rejected.
The most important step is the mixing of drink concentrate dissolved in the soft water the
sugar syrup at the same time. Carbon dioxide is passed in the drink to produce a fizz.
After the crowing of the bottle the crown contains the manufacturing data batch number
and Time. After crowing the bottle, the bottle comes again at checking screen for
checking the bottle.
7
COMPANY PROFILE
8
COMPANY PROFILE
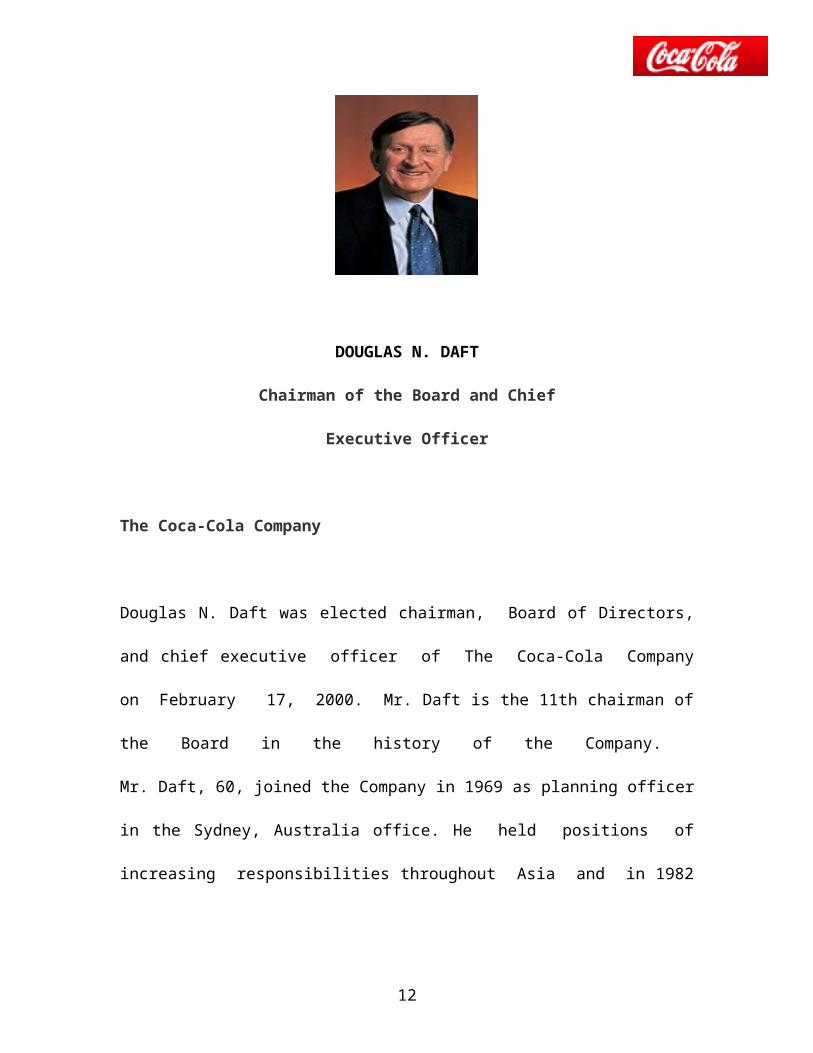
DOUGLAS N. DAFT
Chairman of the Board and Chief
Executive Officer
The Coca-Cola Company
Douglas N. Daft was elected chairman, Board of Directors, and chief executive officer
of The Coca-Cola Company on February 17, 2000. Mr. Daft is the 11th chairman of
the Board in the history of the Company.
Mr. Daft, 60, joined the Company in 1969 as planning officer in the Sydney, Australia
office. He held positions of increasing responsibilities throughout Asia and in 1982
was named vice president of Coca-Cola Far East Ltd.
In December 1988, Mr. Daft was named president of the North Pacific Division and
president of Coca-Cola (Japan) Co., Ltd. He moved to the Company’s Atlanta
headquarters
9

in 1991 to assume the responsibility of president of the Pacific Group and in 1999
his responsibilities were expanded to include the Company's Africa Group, and
Schweppes Beverage Division, as well as the Middle and Far East Group.
Mr. Daft was elected president and chief operating officer of The Coca - Cola
Company in December 1999.
He serves on the boards of Sun Trust Banks, the Boys & Girls Clubs of America,
Catalyst, the CERGE-EI Foundation(Center for Economic Research and Graduate
Education - Economics Institute) in the Czech Republic, the Lauder Institute for
Management and International Studies at the University of Pennsylvania, the Prince of
Wales International Business Leaders Forum, the Grocery Manufacturers of
America, the British - American Chamber of Commerce, the G100, the Woodruff Arts
Center, the Commerce Club, and the McGraw-Hill Companies. Mr. Daft is a trustee of
Emory University, the American Assembly and the Center for Strategic & International
Studies. He is also a member of The Trilateral Commission, The Business Council, and
The Business Round table.
AROUND THE WORLD
Although Coca-Cola® was first created in the United States, it quickly became
popular wherever it went. Our first international bottling plants opened in 1906 in
10
Canada, Cuba and Panama, soon followed by many more. Today, we produce more than
300 brands in over 200 countries. More than 70 percent of our income comes from
outside the U.S., but the real reason we are a truly global company is that our products
meet the varied taste preferences of consumers everywhere
OUR PARTNERS
The Coca-Cola Company works with a wide variety of organizations to support
health, fitness and good nutrition. Visit these sites for more information about positions,
programs and activities.
The Coalition for a Healthy and Active America (CHAA) CHAA was formed in
2003 by concerned organizations and national leaders to educate parents, children,
schools, and communities about the critical roles physical activity and nutrition education
play in reversing the alarming trends of childhood obesity. As a non-profit National
grassroots coalition, CHAA is a vigorous advocate for developing healthy and active
lifestyles for America's youth. CHAA is committed to working with schools to
rededicate time for physical fitness; giving parents the freedom to help their children
make their own nutritional choices; building school-business model relationships that
benefit our families by supporting healthy and active lifestyles; and finding solutions to
childhood obesity that are both responsible and realistic American Council for Fitness
and Nutrition The American Council for Fitness and Nutrition (ACFN) is a group of
food, beverage and consumer products companies, not-for-profit organizations and trade
associations working together to improve the health of all Americans, particularly youth,
by encouraging a healthy balance between fitness and nutrition. The cornerstone of all
ACFN initiatives is the idea that lasting solutions to the nation's obesity problem must be
11
based on sound science and behavioral research. Such policies are likely to help parents
and their children develop eating and exercise habits that lead to a healthier life.
Grocery Manufacturers of America The Grocery Manufacturers of America (GMA)
represents the food, beverage and consumer products industry on key issues that affect
the ability of brand manufacturers to market their products profitably and deliver superior
value to the consumer.
International Food Information Council (IFIC) Foundation The IFIC Foundation is a
public education foundation disseminating sound, science-based information on food
safety, nutrition and health. International Life Sciences Institute Founded in 1978, the
International Life Sciences Institute (ILSI) is a nonprofit, worldwide foundation that
seeks to improve the well-being of the general public through the pursuit of balanced
science. Its goal is to further the understanding of scientific issues relating to nutrition,
food safety, toxicology, risk assessment, and the environment by bringing together
scientists from academia, government, and industry.Kidnetic.com is a fun, interactive
Web site that
emphasizes healthy living achieved through a balance of physical activity and responsible
eating habits. The Web site gives young people and their parents the tools and ideas to
help change habits and plant the seeds for healthier families tomorrow. Kidnetic.com is a
program of the International Food Information Council (IFIC) Foundation.
National Association for Sport and Physical Education association for Sport and Physical
Education seeks to enhance knowledge and professional practice in sport and physical
12
activity through scientific study and dissemination of research-based and experiential
knowledge to members and the public.
National Soft Drink Association the National Soft Drink Association (NSDA) is the trade
association for America's soft drink industry, serving the pub
THE PRESENT POSITION OF COKE IN INDIA
Coke is a households name and is the lips of every one. In present time every person
know the name of coca cola since India is one of biggest market and sultry summer from
march the end of October and huge population has immensely helped in the sales the
sales of coke in India and its making it more economical.
Last years, the market share of Coca Cola was not specific. In this year company’s top
management adopted new policy and increased the rate of all brands of coke. By this
decision top management determined the rate of 300 ml / 10Rs. And the brand of 200 ml
determines the rate of this brand 7Rs. By which medium size family and lower level
family can be taken the enjoy of coke. By this decision company’s marketing share has
been increased.In present time coke is captured approximate 60% market share in cold
Dinks line. Now coke has defeated all the soft drinks company. According to service and
according to advertising coke has appropriate position.It has now emerged as the winner
and has a good image in the market.
13

MISSION OF THE COCA-COLA COMPANY
The mission of the Coca-Cola Company is to increase shareowner value over time. The
company accomplished the mission by working with its business partners to deliver
satisfaction and value to customers and consumers through a worldwide system of
superior brands and services, thus increasing brand equity on a global basis.
GUIDING PRINCIPLES OF COCA-COLA INDIA
1. We will conduct ourselves and our business activities with the highest standards
of honesty integrity and professionalism.
2. We will recognize the positive contributions that we make as individuals and team
members to produce our business success.
3. We will encourage a learning environment where people can constantly grow,
develop and contribute.
4. We will strive for excellence and seek continuous improvement in everything we
do.
5. We will respect all stakeholders, including employees, partners and suppliers and
instill them with a passion to deliver the highest quality goods and service.
6. We will foster initiative and creativity by empowering individual to attain well-
defined objectives.
COKE BRANDS IN INDIAN ORIGIN
COCA-COLA:
14
Developed in a brass pot in 1886, Coca-Cola is the most recognized and admired
trademark around the globe. Not to mention the best selling soft drink in the world.
SPRITE:
In 1961, a citrus-flavored drink made its U.S. debut, using
"Sprite Boy" as inspiration for its name. This elf with silver hair
and a big smile was used in 1940s advertising for Coca-Cola.
Sprite is now the fastest growing major soft drink in the U.S.,
and the world's most popular lemon-lime soft drink.
FANTA:
The name "Fanta" was first registered as a trademark in
Germany in 1941, when it was used for a few years for a soft
drink created from available materials and flavors.
The name was then revived in 1955 in Naples, Italy, when it was used for the "Fanta"
orange drink we know today. It is now the trademark name for a line of flavored drinks
sold around the world.
DIET COKE:
The extension of the Coca-Cola name began in 1982 with the
introduction of diet Coke (also called Coca-Cola light in some
15
countries). Diet coke quickly became the number- one selling low-calorie soft drink in
the world.
VANILA :
It is an Ice Cream in taste. Launched in 2004.
LIMCA:
This is thirst-quenching beverage features a fresh and light
lemon-lime taste and a lighthearted attitude. The Limca brand
was introduced in 1971 and acquired by the Coca-Cola
Company in 1993.
MAAZA :
Maaza, launched in 1984 and acquired by The Coca-Cola
Company in 1993, is a non carbonated mango soft drink with a
rich, juicy m natural mango taste.
16
THUMPS UP :
In 1993, The Coca-Cola Company acquired this brand, which
was originally introduced in 1977. Its strong and fizzy taste
makes it unique carbonated Indian Cola.
KINLEY WATER:
This is thirst-quenching beverage features fresh the fresh water
with the saturated oxygen level.
SUNFILL:
This is thirst-quenching beverage features a fresh and light
orange taste and a lighthearted attitude.
VISION
The long-term vision of Coca-Cola in India is to provide exceptional strategic
lead to the Coca-Cola in India.
17
Through Coca-Cola system resulting in consumer & customer preference and
loyalty through Coca-Cola is commitment to them and in a highly profitable
Coca-Cola Corporate branded beverage system.
MISSION
The mission of coca cola in India is:
Increase in shareholder's value over time.
To achieve the above by working with business partners to deliver satisfaction
and value to customers and consumers through world wide system of superior
brand and services thus increasing the brand equity.
To achieve the mission the company seeks the contribution from each of the given
areas:
People working in the company.
Commitment of the company.
Goals & objectives of the company.
Environmental policy.
Internal control.
Policy & producers.
18

REVIEW OF LITERATURE
19
REVIEW OF LITERATURE
A literature review discusses published information in a particular subject area, and
sometimes information in a particular subject area within a certain time period.
A literature review can be just a simple summary of the sources, but it usually has an
organizational pattern and combines both summary and synthesis. A summary is a recap
or the important information of the source, but a synthesis is a re-organization, or a
reshuffling, of that information. It might give a new interpretation of old material or
combine new with old interpretations. Or it might trace the intellectual progression of the
field, including major debates. And depending on the situation, the literature review may
evaluate the sources and advise the reader on the most pertinent or relevant.
Purpose of review of Literature is to provide a backdrop of the present study. It is the
context to wfi1ch our present study can be referred to determine its relevance
20
RESEARCH METHODOLOGY
21
RESEARCH METHODOLOGY
Operational Setup-
The success of any survey is depends upon resources, quality and timing and
integrity of the surveyor who compiles the primary data. So it is a very important task is
to manage all the available resources which make impact on the quality of survey.
Approach-
The approach behind a surveyor the project varies with the purpose of the survey.
Under this report, "quantitative" approach is used which is concerned with the objective
assessment of the availability and display that is clearly visible and can be easily
quantified. No subjective assessment is involved in this report.
Area of survey-
For performing any survey a sample is selected from the population. All the
consumers are chosen from different location of Dehradun City.
22
Planning:
For a successful compilation and best result within a limited time the planning
was must. In this way the first step was to design an appropriate data form we can say it
questionnaire that covers all the mandatory areas of information that is to be analyzed.
The data form which I was used to collect data was designed by my immediate
supervisor.
Schedule:
To achieve the desired goal it was necessary to make schedule of tasks which
were handed over to us. So keeping in view the original objective, the content of the
schedule was prepared. Then I and my group members collected data from the desired
field. Since the data form distribution and collection was an official work so it was a time
taking process. In the meantime it was our work to keep in touch with our fields.
Sampling Design :
Design is the plan, structure & strategy of investigation conceived so as to attain
answer to questions' to survey and to control the variances. According to this project's /
survey's purpose the analytical, interpretive/objective design was chosen.
23
Data Collection Method:
The two sources for data collection are documentary or secondary and field or
primary is used. Because I have to collect the information, which is fickle in nature, the
availability and display of the product changes even each and every day, therefore
questionnaire is selected as the survey instrument. The forms used for the survey were
close-ended questionnaire consisting of various items.
I have covered Dehradun City & took data of different areas it was great to
visit company like "Coca-Cola", season like "Summer" and product like "Cold Drink",
combining all the factors together make the sample design for the project very important
for the real extract from the market. According to my judgment and to cover all the major
areas the sample was selected. The sample size was 100 consumers.
Statistical Tools:
Representation of statistical data by diagram, graphs, charts or pictures is more effective
than tabular representation being easily intelligible to a layman, indeed diagrams is most
essential whenever it is required to convey any statistical information to the general
public.
The more important types of diagram which are use in statistical work are:-
1. Bar Diagram :
24
Mode of diagrammatic representation of data is the bar diagram. In this method
bar of equal width are taken for the different items of the series. The length of the bar
represents value of the variables concerned.
2. Pie Chart :
It is a circle whose area is divided proportionately among the different
components by straight lines drawn from the center to the circumference of the circle.
When statistical data are given for a number of categories and we are interested in the
comparison of various categories or between a part of the whole, such a diagram is very
helpful in effectively displaying the data.
Sample Size : 100
Type of Sampling : Random Sampling.
25
MARKETING STRATEGY OF COKE
As millions of rural Indians reach for a cold soft drink in the hottest summer in
years, Coca-Cola India seems to have discovered the consumers who could rescue its
dismal sales record. Coca-Cola India totally misjudged rural India, home to two-thirds of
the country's 1 billion population, when it re-entered the country a decade ago.
Yet as the country side emerges as the fastest-growing source of demand for
consumer products, the local arm of the US soft drinks giant seems to have learnt its
lesson. "We were just not addressing the masses, that were the problem," says Mr. Sanjeev
Gupta, Coca-Cola's operations chief.
The company's new strategy of smaller bottles, price cuts and advertising that
straddles cities and villages pushed turnover last year up by a quarter to nearly Rs.5000
crore. And Thumbs Up, a local brand that Coca-Cola bought and then ran down, is also
recovering spectacularly. The success of Thumbs Up, whose market share is now roughly
equal to that of marker leader Pepsi at 23 percent, is an embarrassment for Coca-Cola,
which is in third place with 16.5 percent (from 12 percent three years ago) in India's
Rs.8000 crore soft drinks market. Coca-Cola returned to India after being kicked out by
the government in the mid-1970s. It paid a high price for the then market leader, Thumbs
Up, and tried to kill it off in the mistaken belief that this would pave the way for Coca-
Cola's rise. Extravagance, unoptimistic and naive reading of the market and
mismanagement of its new bottling assets led Coca-Cola to write down Rs.2000 crore of
its Indian assets in 2000. The greatest indignity is that India is one of the few markets
where Pepsi has outsmarted Coca-Cola.
26
"Coca-Cola came in blazing but mishandled itself and Thumbs Up. That makes its
recovery all the more remarkable." says Mr. C Srinivasan, chairman of business
consultant AT Kearney India. Coca-Cola's Indian management, now stable after recent
flurry of departures, persuaded the US parent to persist with India, and won $100 m to fix
problems such as poor distribution. Its Atlanta headquarters was won over because of
India's potential. India's per capita consumption of carbonated drinks is less than hall the
level in Pakistan and about 8 percent of China's. Mr. Gupta argued that closing the gap
would only come by chasing the rural consumer.
"We had to address the 75 percent (that lives in rural areas) and not just the 25
percent (in cities) and that meant using small-pack innovations," says Mr. Gupta. "The
only consumer goods companies that make it in India are those that sell micro-sized
products at low prices."
Coca-Cola's 200 ml bottle (down from 300 ml) sells for Rs.7, half the price of a
conventional sized bottle. To achieve a return on this "low margin, high volume"
strategy. Coca-Cola had to shrink its ballooning costs, while raising output in a market
growing at just 8-9 percent per year. Coca-Cola added 30 assembly lines, including five
plants; cut costly staff; revamped transport; shrunk
bottles and made them lighter and packed in smaller crates to increase a truck's
carrying capacity; added distributors and expanded the number of outlets in towns and
villages by a fifth to about 1 m. Coca-Cola's aim was to "lock in" retailers in villages of at
least 1,000 people connected to usable roads. One method was to help those with no
savings or access to formal credit to buy their costliest asset: a fridge. The company
27
negotiated big discounts from fridge producers, placing an order equivalent to two
months' output of the domestic fridge industry. Discounts were passed on to the retailers,
cutting the average purchase price by Rs.3,000 more than three months' wages in a
village.
Finally, Coca-Cola dumped a global advertising campaign that was irrelevant to
the Indian market and adopted one featuring Bollywood stars. "The campaign is finally
speaking to the right market." says marketing consultant Mr. Jagdeep Kapoor. The
adverts also loudly proclaimed the Rs.5 price benchmark, meaning retailers could not
overcharge.
Marketing Mix and Strategy:
Marketing mix of any organization consists of 4 P's i.e. product, price, place and
promotion having its own significance, which varies from one organization to the other.
In Coca-Cola the information about all the 4 P's that can be available to me is given here:
PRODUCT:-
Product mix of Coca-Cola consists of the various brand packs and flavors given in
the table. Product strategy of the Coca-Cola is to promote all the brands available in all
the brands packs and to introduce the product in new flavors and. even new product.
Regarding this Kinley soda is introduced. Fanta in green apple flavor is also introduced.
28

PRICE:
Regarding the pricing policy or the price to the distributor is not disclosed to me,
but as done for the different product of the company, company has priced the product
same as that of its major competitor or the market leader.
PLACE:
The Coca-Cola Company in India is governed from its corporate office located at
Gurgaon in Haryana. It governs the working of five zones covering whole India these
zones are: - Northern zone, Eastern zone, Western zone, Southern zone and Andhra
Pradesh zone. These zones are divided in to various, plants, which govern the area
assigned to them. The areas are the various distribution centers called distributors and
C&F agents. Then comes the retailers/customer for the company's product, they receive
goods from distributors and C&F agents. Finally consumer is there, having the product
from the customer's shops or delivered to their home, it is more clearly visible through
this chart. The Coca-Cola Company, which gave its reach to the mouth of billions of
people all around the world having a wide distribution, network. In India, the pace and
speed at which Coca-Cola has widened its business is really amazing. Distribution
network is the biggest strength of the company.
PROMOTION:
29
This part of the marketing is playing a very vital and important role in the current
situation in India. Looking at the competition and promotion and advertising budget of
both the companies coca cola and Pepsi, one can easily estimate the importance of this.
The promotion mix of Coca-Cola is divided in to
COMPETITORS:
Since there is only one major competitor of the Coca – Cola i.e. Pepsi. There is
some information about the Pepsi Company.
Pepsi Cola, Headquartered N.Y., is the refreshment beverage unit of Pepsi Co.
Beverages and Foods, a division of Pepsi Co. Inc. Pepsi Co. Beverages and Foods at
North America also comprise Pepsi Co`s Tropicana, Gatorade and Quaker Foods
businesses in the United States of America and Canada also
Pepsi-Cola non-carbonated beverage portfolio includes Aquafina, Which is the
number one brand of bottled water in the United States, Dole single serve juices and
some, which offers a wide range of drinks with herbal ingredients. The company also
makes and markets North America’s best-selling, ready to drink iced teas and coffees via
joint venture with Lipton and Starbucks, respectively.
Pepsi Co, Inc. is one of the world’s largest food and beverage companies.
The company’s principle business includes:
Frito-Lay snacks
Pepsi-Cola beverages
30
Gatorade sports drinks
Tropicana juices
Quaker Foods
Pepsi Co Inc. was founded in 1965 through the merger of Pepsi-Cola and Frito-Lay.
Tropicana was acquired in 1998. In 21001 Pepsi Co merged with the QUAKER Oats
Company, creating the world’s fifth largest food and Beverage Company, with 15 brands-
each generating more than $1million in annual retail sales. Pepsi Co's success is the result
of superior products, high standards of performance, distinctive competitive strategies
and the high level of integrity of their people.
Soft drink business is built on two pillars - Brands and Distribution. We present
below comprehensive conceptual coverage of these and other key marketing concepts
1. Branding
2. Valuation of brands
3. Distribution
4. Marketing
5. Market Research
6. Market segmentation and positioning
31
7. Advertising and promotions
1. BRANDING :
What is a brand ?
A brand is name, term, sign, symbol or design or a combination of them which is
intended to identify the goods or services of one seller or group of sellers and to
differentiate them from those of competitors'
A Trade mark is "a brand or a part of brand that is given legal protection because
it is capable of exclusive appropriation."
Manufacturers can use their own brands (known as Manufacturers' brands) or
brands of their distributors (Distributors' brands).
Why branding?
Manufacturers/ distributors use brand names for a variety of reasons from simple
identification purposes to having legal protection for unique features of the products from
imitations and help consumers recognize certain quality parameters. In some cases,
brands are just used to endow the product with unique story and character which itself
can be a basis for product differentiation.
32
Special importance of brands for soft drink products
While brands can represent all types of goods or entities, they have special
importance for products. Brand equities are stronger in soft drink products as the
consumer is reluctant to try unknown brands/ unbranded products for the following
reasons
These products individually account for a small part of household spending.
Most of these products are for personal use.
In many cases, it is difficult to differentiate a product on technical or functional
grounds and therefore the consumer is reluctant to switch to an unknown brand.
Successful brands generate strong cash flows, which enable the owner of the
brand to reinvest a part of it in the form of aggressive advertisements/ promotions.
This reinforces the perceived superiority of a brand
How a brand is created?
Soft drink companies spends enormous sums on building a brand equity by way
of
- advertisements/publicity
- free samples -low entry price
- promotions (schemes for dealers, consumers etc)
33
Advertisement and promotion can induce trials but for sustained loyalty, the
manufacturer has to offer superior quality and value for money. Most successful brands
are founded on a chance discovery of a new product/ process or assiduous research and
development work. Major players invest in R&D on their existing brands and improve
the product quality continuously to maintain their edge over competitors.
34
2. VALUATION OF BRANDS :
Value of a brand is represented by the incremental cash flow resulting from a
product with a brand versus a product without a brand name or with weaker brand name.
Brand valuation is a complex process and involves a lot of subjectivity. There are
no widely accepted techniques of brand valuation. There are several considerations which
cannot be standardized or quantified such as
To pre-empt competition from taking over a brand
• Synergy with the company acquiring existing brands/ businesses
• Strategic entry into a new product category
Prevent damage to existing brands. Many a times stiff competition results in price
cutting, aggressive promotions, lower margins for all the competing brands.
Confidence in the acquirer of the brand to rejuvenate a languishing brand.
Value of an acquired brand :
In case of an acquired brand, price paid for the brand over and above the value of
tangible assets, represents value of the brand. For accounting purposes consideration paid
for the brand is typically broken up as follows:
Goodwill
Trademark and patents
Technology and know-how
35
Non compete agreement
Some of the popular methods for valuation of brands are discussed below
Bert technique (Intra-brand Pic) values brands based on following factors. It
gives scores on each factor and values the brand as multiple of sales/ earnings based on
the aggregate score.
- USP's of the brand
- Stability of the brand
- Markets namely the industry in which the brand is in use.
- International of the brand commanding a higher weightage than a local brand.
- The long term trends of the brands
- Brands receiving consistent investment are more valuable.
- Legal protection commanded by brands through registration and trade mark laws.
- Quality of support received by the brands.
Cost basis - The valuation is done by aggregating all costs incurred on a brand
from the conception stage. These costs include market survey, research & development,
launch and subsequent advertising expenditures. These costs are adjusted for inflation
and present values are calculated. Then adjustments are made to provide for discount in
case of a declining trend in the product life cycle or premium in case of ascending trend
in market share and product life cycle.
Market value - Valuation at market price (the best bidder quote) can be at
divergence from the fundamental value of the brand. For instance, a large company may
36
pay an abnormally high price to protect its major brand or remove a nuisance from the
market or derive synergies in its existing business. Such valuations are subjective.
Earnings model - In this method, valuation is done by identifying, separating and
quantifying earnings that can be attributed to the brand and capitalizing these earnings at
a suitable discounting rate. The multiple would depend on several factors such as
category growth prospect, emerging competition and brand's relative position, edge in
terms of technology, strength of loyalty to the brand etc.
3. DISTRIBUTION :
Marketing or Distribution channel refers to the set of marketing intermediaries
which manufacturer's link together to reach their products to the ultimate consumers.
Depending on the product, nature of market and manufacturers' resources/strategy, there
can be one or more links between the manufacturer and consumer.
Manufacturer – Retailers
Manufacturer - Wholesalers – Retailers
Manufacturer - Stockists - Wholesalers – Retailers
37
Why use distribution channels-
There are several benefits for a manufacturer particularly in case of consumer
goods to rely on these marketing intermediaries rather than develop one's own
distribution network.
Efficiency in performing the basic marketing task by these intermediaries who
through their experience, specialization, knowledge of local conditions, contacts
and scale, offer services.
Which manufacturers can scarcely do on their own.
Cost advantage most of these intermediaries in India are family owned outfits.
Their cost of operations and overheads are substantially lower.
Focus: Manufacturers can concentrate on their core activity and optimize return
on assets.
RETAILING :
In India, there are over 5 million retail outlets dispersed all over the country. The
retailing industry provides employment to over 18mn people. 1 out of every 25 families
in India is engaged in the business of retailing. Ownership and management are
predominantly family controlled. However in sharp contrast to developed countries, unit
average size of a retail outlet in India is very small.
Organized retailing, however, has been a recent phenomenon and is relatively
undeveloped. There are no large super market chains/ shopping malls. Consumers are
unwilling to pay a premium for convenience shopping as their counterparts in the western
38
countries do. While small chain stores called Apna Bazaars and Sahakan Bhandaars,
which offer products at reasonable prices, have been fairly popular, Department Stores
and Food Stores are slowly gaining popularity. A large number of corporates have
recently ventured into retailing.
The retail outlet in India can be broadly categorized as follows:
- Grocery stores
- General purpose stores
- Food stores
- Pan bidi shops
- Chemist/ drug stores
- Cold chains
The relative share of grocers dropped from over 50% in the early 90's to 35% in
the late 90's. Chemist outlets on the other hand, have been expanding their product range
to include high margin FMCG products from shampoos to ketchup. Pan-wallas are also
emerging as full fledged consumer product outlets
4. MARKETING :
Direct marketing :
In direct marketing manufacturers reach the consumers directly. Direct marketing
can be undertaken in several ways such as mail order, own retail outlets, mobile vans etc.
A new innovative approach to direct marketing viz multilevel marketing is becoming
39
increasingly popular. Also gaining ground slowly is E-tailing i.e. selling products through
the internet.
Multilevel marketing model :
Multi level marketing refers to direct marketing through an ever-increasing
number of direct distributors. Independent distributors sell products directly to the
consumers and appoint new distributors and train them. The distributor earns commission
at two levels; one is his/ her own commission and two a proportion of commission earned
by other distributors appointed by him/ her. None of these distributors are employees of
the company.
Distributors are not allowed to sell these products to retailers. The company saves
about 25% of realizations by eliminating retail channel, which is shared with distributors.
The company insists that the distributors should take prior appointment with the
consumer. Personal interaction is not only convenient but adds value as customer get
valuable advice on the product and how to use it.
This helps in creating awareness and removing misconceptions like cosmetics are
harmful for the skin.
Direct marketing (multi level approach) in persona care products is extremely
popular abroad. In Brazil, about 60% of personal care products are sold through direct
marketing. In India, direct marketing has been slowly growing. Word of mouth has a
strong impact on purchase decision of a consumer, specially in personal care and
40
cosmetic products. Direct marketing has mainly been undertaken by the new MNC
entrants (notably Oriflame, Avon). Hindustan Lever has also recently launched a new
personal product brand Aviance which is sold directly to consumers exclusively by
trained beauty specialists. Direct marketing has also been extensively used in marketing
of household appliances like Vacuum cleaners. However given the widely spread
geographical area in India, direct marketing cannot be easily used to build an extensive
national reach and is more likely to be used as a supplementary channel.
5. Market Research :
Market research activities encompass studies on
- market characteristics
- measurement of market potential and size,
- market share analysis,
- competitive products,
- new products acceptance/ product preference,
- sales (region wise, consumer wise etc) analysis,
- short/ long term sales forecasting,
- advertisement effectiveness
- post-shipment data (actual shipment by manufacturers),
- retail stores audit (actual sales at sample outlets)
- trade feedback and distribution,
- brand recall, point of sale material etc.
41

It requires skilled people for data collection as well as analysis. Several large
consumer companies have in-house MR department. Most others retain specialized and
professional MR agencies.
The significance of market research has increased considerably in the recent times
as
- Size of operations of major players has increased to national and international
markets.
- Marketing executives are physically away from the market and hence the need for
flow of information.
- In the environment of increasing competition and multiple products competing for
consumers' preference information about the market has tremendous utility.
- Information is required for segmenting the market and appropriate pricing and
positioning of the products.
Market research approach :
Typically, a market research activity involves the following 5 steps,
Problems definition This forms the basis of research and failure to identify the
problem precisely will result in finding a correct solution for a wrong problem.
Research design: The next step is to set out objectives of research clearly,
determined data collection methods to finalize research instruments and sampling plan.
42
Field work: After finalization of research design, the actual data collection
begins. It can be done by the agency on its own or through subcontracting to third parties.
Data is collected by questionnaires/ direct interviews, telephonic interviews, simple
observation etc.
Data analysis: The next step forms the heart of research activity. It involves
extracting meaningful information from the data collected and analyzing the information
statistically and also from business perspective. Statistical techniques include simple/
multiple linear programming models, time series, exponential series, regression analysis,
simulation, Marko chain process etc.
Report preparation: The final step is to prepare a report, present major findings in
a manner amenable to managerial decision taking. There may be some follow up and
revalidation required.
TEST MARKETING :
Test marketing refers to testing out product and marketing mix with a small
number of well chosen consumers which are representative of the target segment. Test
marketing is frequently used by consumer companies, in contrast to industrial companies
which prefer feedback through informal channels. Test marketing improves knowledge of
target consumers, potential sales and is an effective tool to pre-test alternative marketing
plan. In most products, it is important to check trial rates as well as re-purchase rates.
CONSUMER'S PANELS :
43
Consumer panels refer to a set of consumers with different demographic
characteristics (so as to be representative of target population) who agree to co-operate in
market research, typically for a consideration. Market research agencies and companies
try to collect information on buyer's characteristics by introducing a new product to the
consumer panels. The firm estimates trials as well as the repeat purchasing by this
method. There are statistical models to forecast market shares, demand, brand switching
etc.
7. ADVERTISING AND PROMOTION :
Advertising consists of non-personal form of communications. The
communication is conducted through trade media under player sponsorships. Advertising
aims at providing information about the product arouse demand for the product and
emphasize on superior features of the advertised product over others. Players have to
decide on overall advertisement budget, message and mode of presentation, type of
media, timing etc. They invariably do post audit of advertising efficacy.
Promotions are of two types viz. pull promotions where consumers are
incentivized and push promotion where dealers/ retailers are incentivized. There are
several forms of promotion such as distributing free samples, discount coupons, gift
offers for consumers and target based incentives and display schemes etc for retailers.
Marketers also sponsor charity programmes, sports etc to promote corporate/ brand
image.
44
A definition of dynamic control is also required before we go further. Dynamic
control is the distribution manager's ability to rapidly set and change priorities and modes
of transportation in response to the war fighter's requirements. If Quartermasters cannot
dynamically control the delivery of supplies and materiel, we remain at the mercy of the
transportation system and will be forced into the comfort and expense of a stockage-
based supply system.
INDIA DIVISION
The Head quarter of India is at Enkay Towers, Udyog Vihar,Gurgaon.Coca Cola became
3rd largest FMCG from zero in India in just 8 years. There are 40 producing units across
the country.
There are 5 regions in India viz., North, South, West, East & Andhra Pradesh.
The company operates in two types of Bottling operations viz.,
1. COBO (Company Owned Bottling Operations) - In COBO, the Company owns
the unit and is a property of India.
2. FOBO (Franchisee owned Bottling Operations) - FOBO is operated by Bottlers,
who are given license by the Company to bottle its products on their behalf.
THE NORTH REGION :
The headquarter of Northern Region is at JMD Towers, Regent Square, Gurgaon.
It comprises of Delhi, Western UP, Eastern UP, Jammu & Jaipur units. It has 9
production units viz, Delhi, Jaipur, Kanpur, Varanasi, Dasna, Mundka Depo, Jammu,
45
Delhi FOBOs & East-West UP FOBO. It is the largest region in India with 1313
employees
PRODUCTS OF COMPANY
It has brown colour with high content of C02 (Carbon di-oxide) which makes its
COLA flavour heavy. It is available in different volumes in market like :
1. 200 ml glass bottle
2. 300 ml glass bottle
3. 600ml pet bottle
4. 2.Litre pet bottle.
It has dark brown color with very high content of CO2 which makes the Cola
flavor is very strong. It is available in different volumes in market like:
1. 200 ml glass bottle
2. 300 ml glass bottle
3. 600ml pet bottle
4. 2.Litre pet bottle
It comes in many flavours like orange, with light content of CO2 that makes its
make its flavour delicious. It is available in different volumes in market.
1. 200 ml glass bottle
2. 300 ml glass bottle
3. 600 ml pet bottle
46
4. 2.Litre pet bottle
Limca has light grey colour with light content of CO2 that makes its flavour tasty.
It is available in market in following packs of quantities:
1. 200 ml glass bottle
2. 300 ml glass bottle
3. 600 ml pet bottle
4. 2 Litre pet bottle
It is colourless with packing in green coloured bottle. It has normal content of
CO2. It has a nice flavour available in market in following packing:
1. 200 ml glass bottle
2. 300 ml glass bottle
3. 600 ml pet bottle
4. 2 Litre pet bottle
It is of yellow colour with decent taste of mango. It doesn't contain CO2. Its
available packing in market are:
1. 250 glass Bottle
Soda- It is colourless & available in market in 300 ml glass bottle in the market.K
-Water it is a mineral water available in following volumes in the market:
1. 1 liter, pet little
47
2. 2 liter, pet little
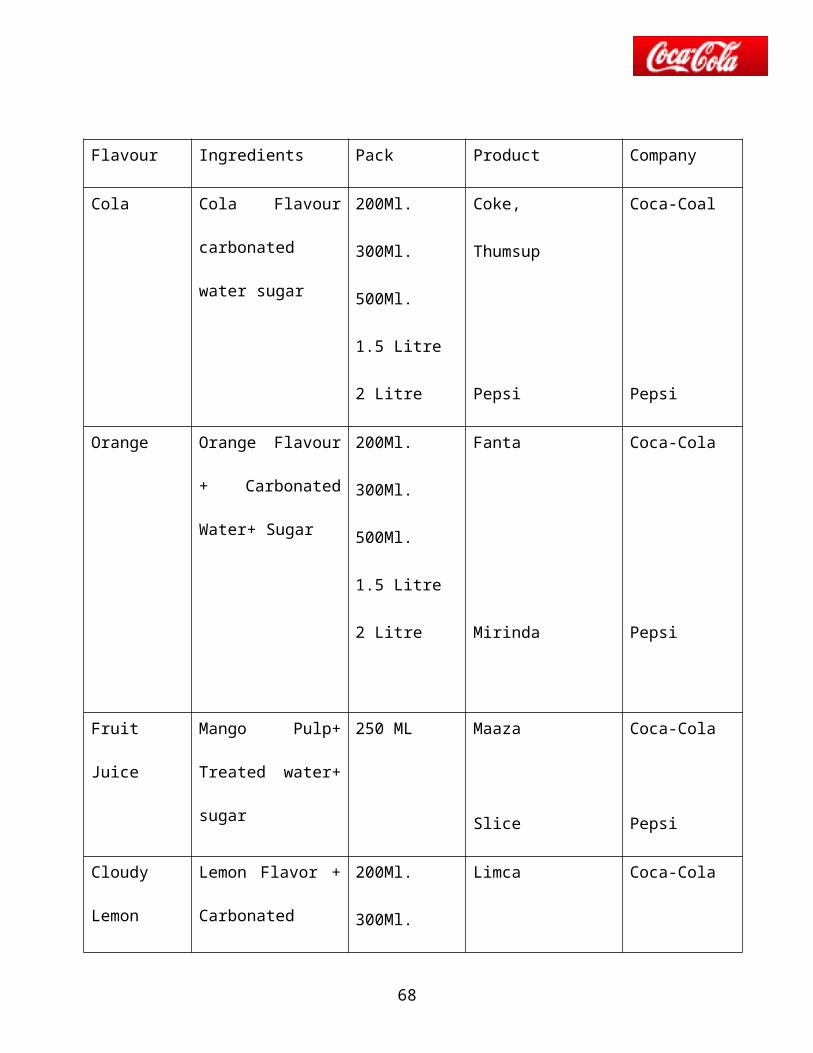
P RODUCT RANGE
Flavour Ingredients Pack Product Company
Cola Cola Flavour
carbonated water
sugar
200Ml.
300Ml.
500Ml.
1.5 Litre
2 Litre
Coke,
Thumsup
Pepsi
Coca-Coal
Pepsi
Orange Orange Flavour +
Carbonated Water+
Sugar
200Ml.
300Ml.
500Ml.
1.5 Litre
2 Litre
Fanta
Mirinda
Coca-Cola
Pepsi
Fruit Juice Mango Pulp+ Treated
water+ sugar
250 ML Maaza
Slice
Coca-Cola
Pepsi
Cloudy Lemon Flavor +
Carbonated Water+
200Ml. Limca Coca-Cola
48
Lemon Sugar 300Ml.
500Ml.
1.5 Litre
2 Litre Mirinda Lemon Pepsi
Clear Lemon Lemon Flavour+
Carbonated Water +
Sugar
200Ml.
300Ml.
500Ml.
1.5 Litre
2 Litre
Sprite
7’Up
Dew
Coca-Cola
Pepsi
49
DATA ANALYSIS AND INTERPRETATIONS
Table- I
Prefer to have cold drinks
50
Response No of Respondent Percentage ( %)
Yes 100 100%
No 00 00%
Total 100 100%
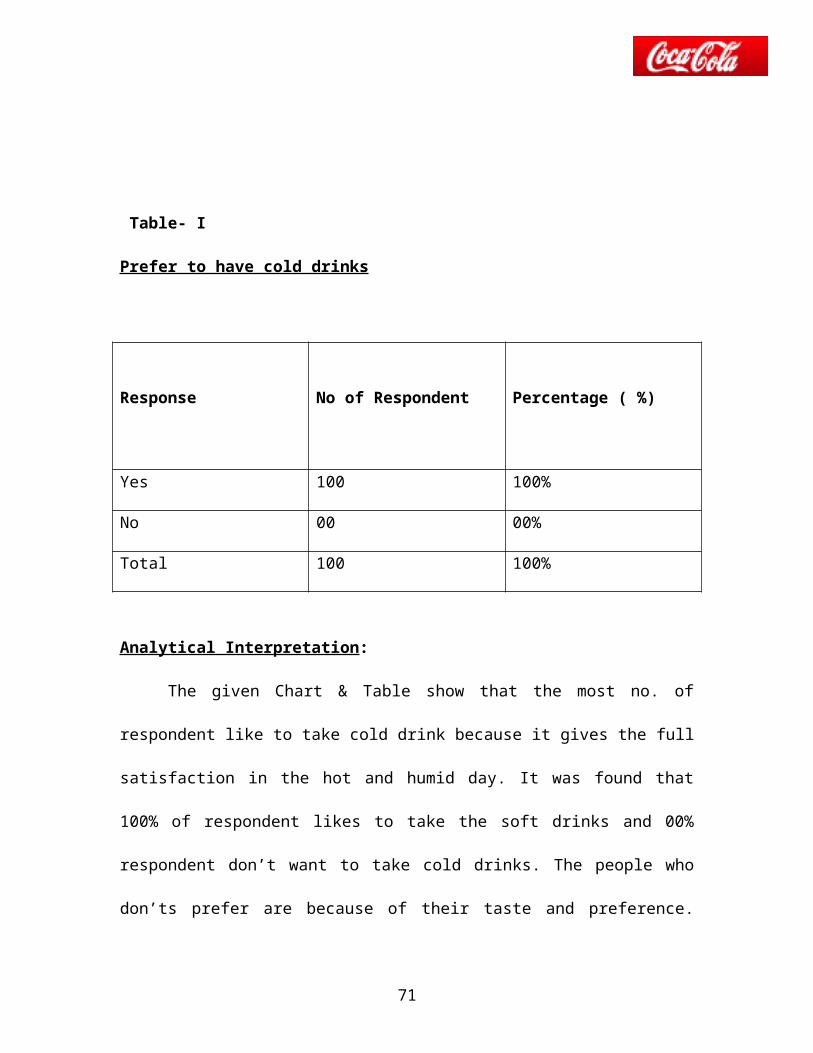
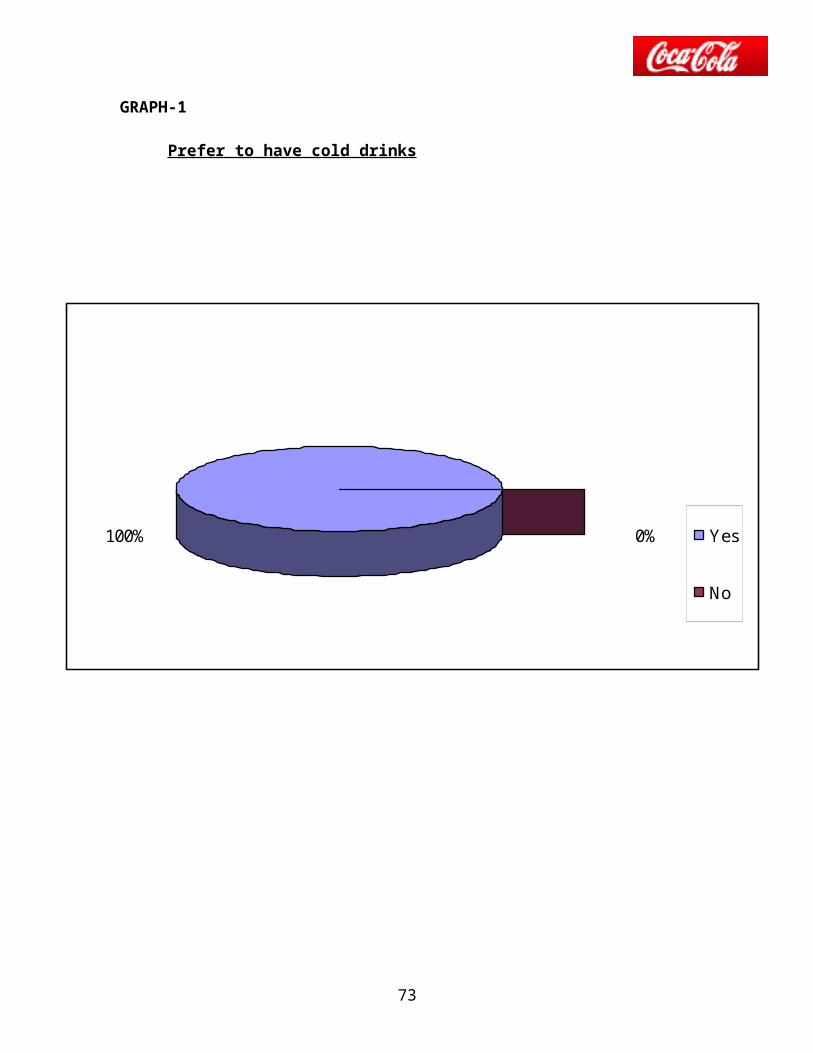
Analytical Interpretation:
The given Chart & Table show that the most no. of respondent like to take cold
drink because it gives the full satisfaction in the hot and humid day. It was found that
100% of respondent likes to take the soft drinks and 00% respondent don’t want to take
cold drinks. The people who don’ts prefer are because of their taste and preference. They
are of the perception that Lassie and Nimbu pani are beneficial than the carbonated soft
drinks.
51

0%100% Yes
No
GRAPH-1
Prefer to have cold drinks
52
Table- II
Consumption of cold drinks in a day
Response
(Time a day)No of Respondent Percentage (%)
Less than 2 54 54%
2 – 4 35 35%
More than 4 + 11 11%
Total 100 100%
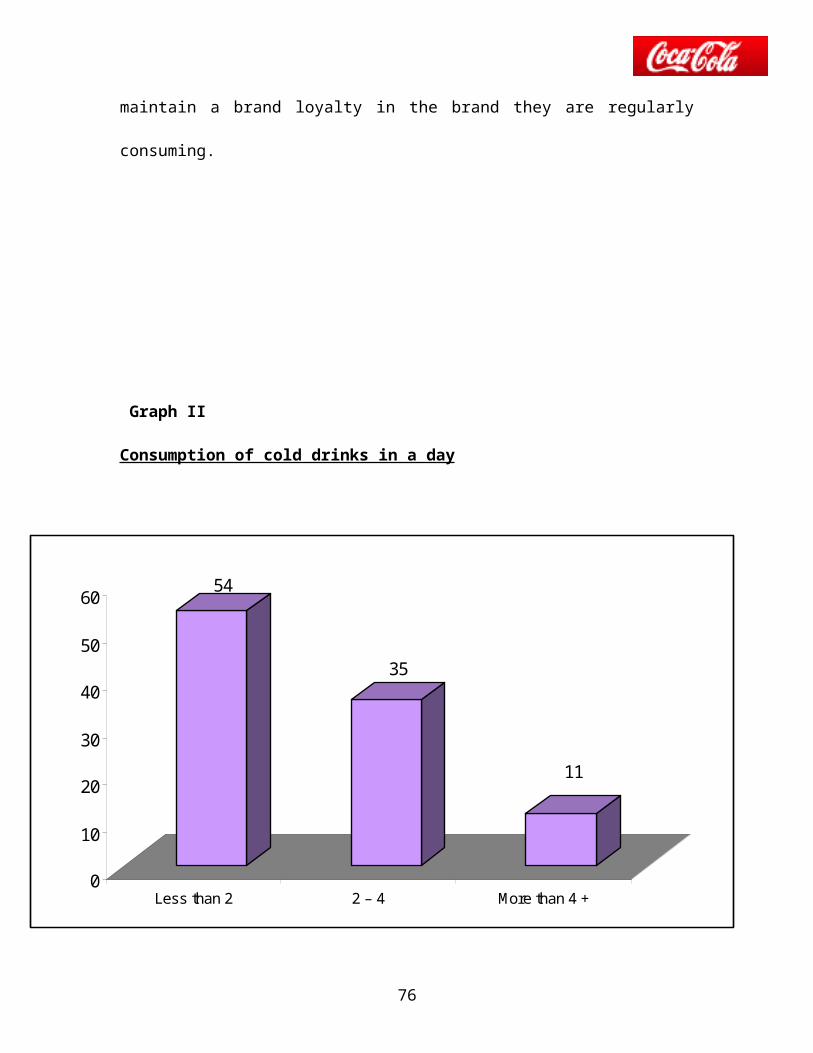
Analytical Interpretation:
The given diagram & table show the frequency of taking cold drinks in a
day. It was found that 54% of respondent takes the less than 2 cold drink a day, 35% of
respondent takes 2 – 4 cold drinks a day. And 11% of the respondent likes to takes more
than 4 cold drinks in a day. The people who consume more than two cold drinks have a
habit of a high consumption. For them a change in price doesn’t changes their demand to
a great extent. They also maintain a brand loyalty in the brand they are regularly
consuming.
53
54
35
11
0
10
20
30
40
50
60
Less than 2 2 – 4 More than 4 +
Graph II
Consumption of cold drinks in a day
54
Table- III
Preference of flavours
Flavour No of Respondent Percentage
Cola 41 41%
Citric 26 26%
Lemon 21 21%
Orange 10 10%
Others 02 02%
Total 100 100%
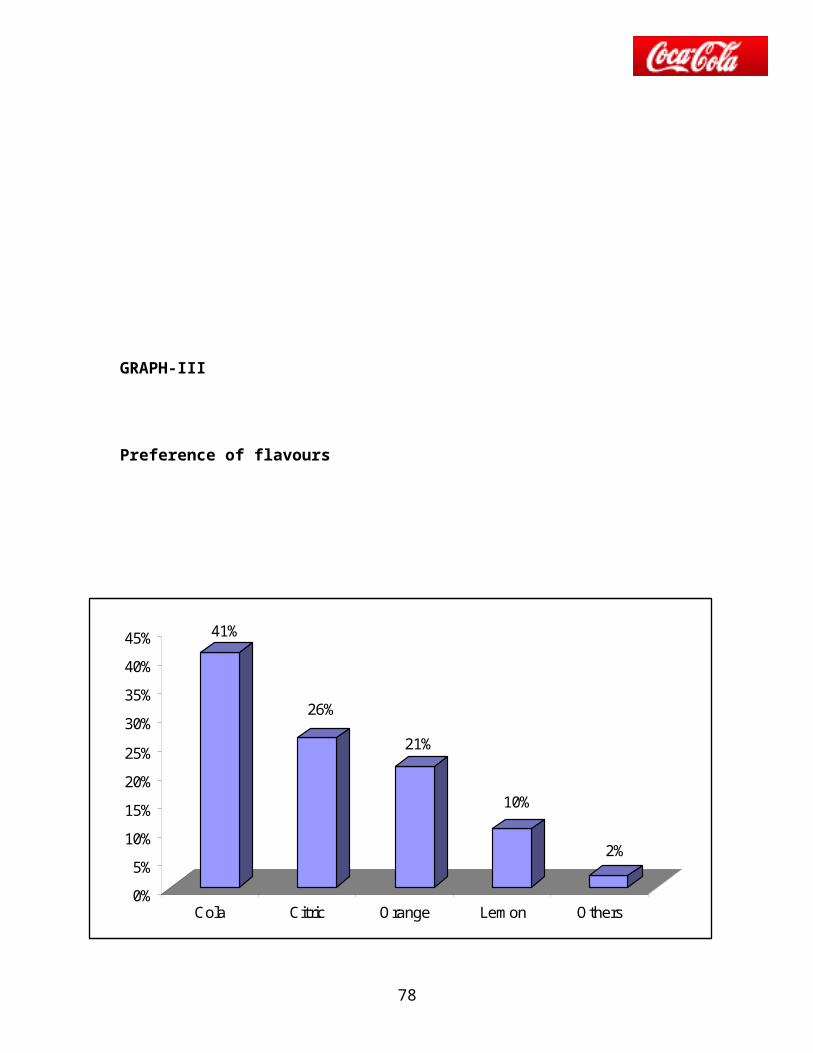
Analytical Interpretation:
The given graph & table show the most popular flavour in cold drinks is Cola. It
was found that the 41% respondent likes the Cola Flavoured, 21% of respondent likes the
Lamon flavoured, 26% of respondent likes the citric flavour, 10% likes the Orange
flavour and only 2% likes the other flavoured.
55
41%
26%
21%
10%
2%
0%
5%
10%
15%
20%
25%
30%
35%
40%
45%
Cola Citric Orange Lemon Others
GRAPH-III
Preference of flavours
56
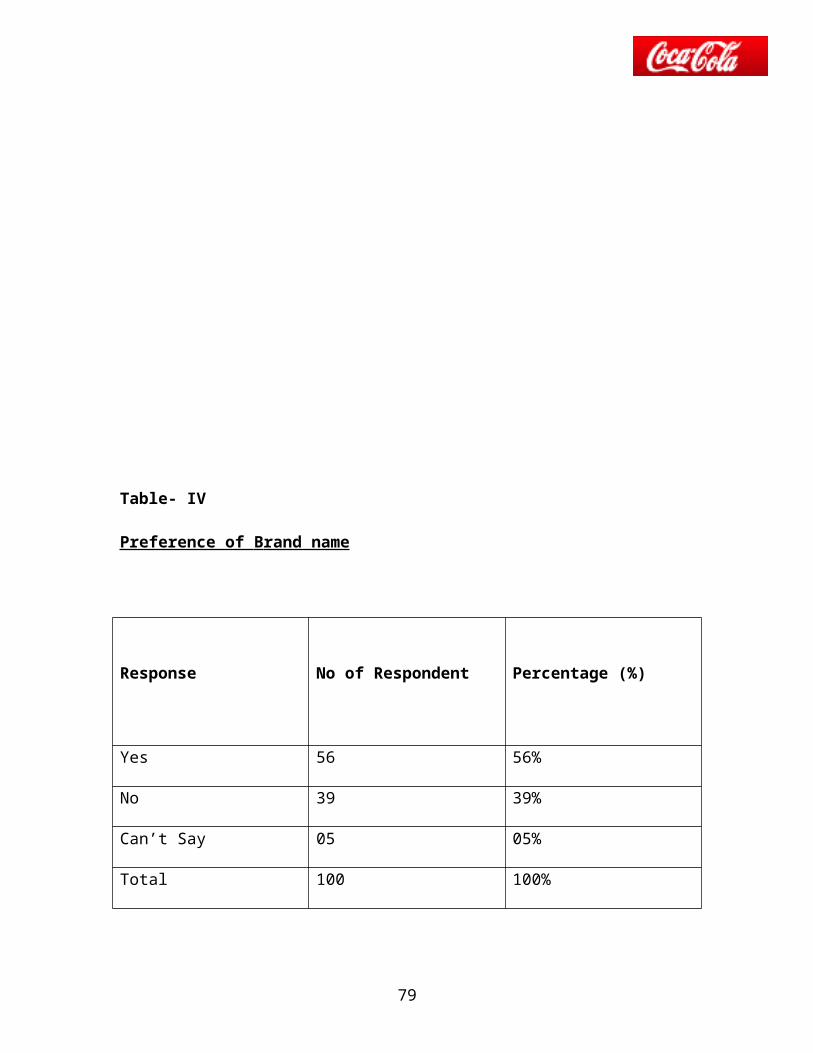
Table- IV
Preference of B rand name
Response No of Respondent Percentage (%)
Yes 56 56%
No 39 39%
Can’t Say 05 05%
Total 100 100%
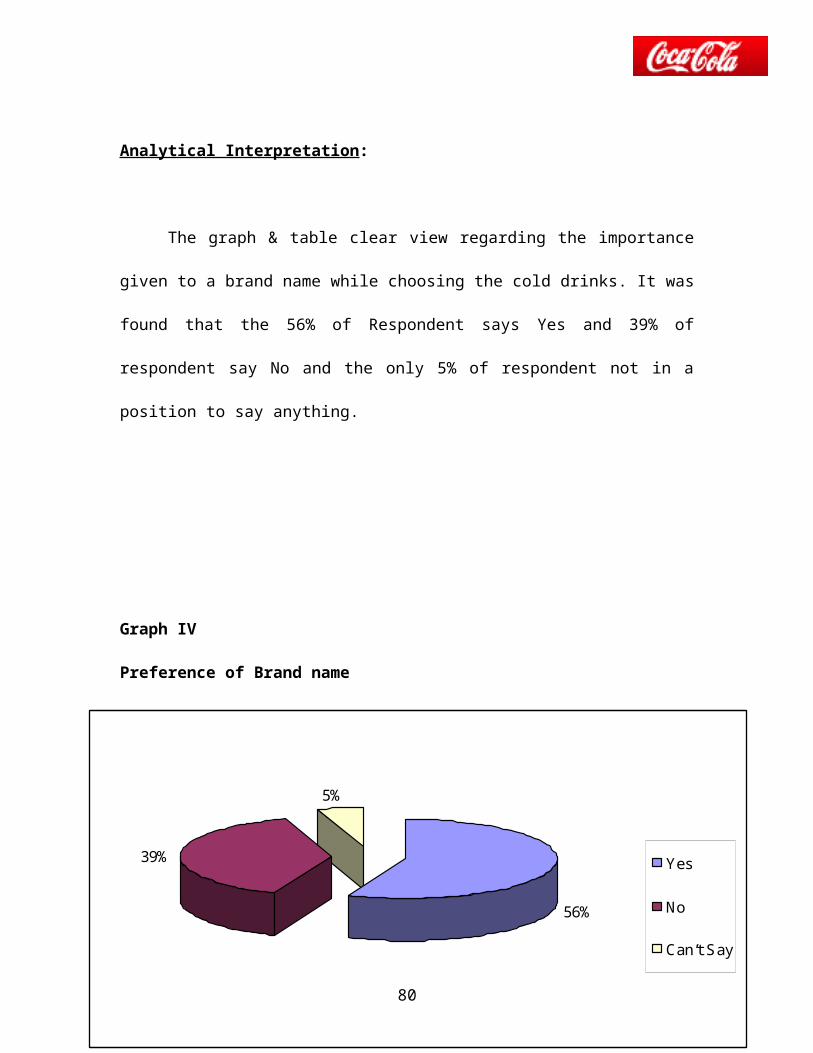
Analytical Interpretation:
The graph & table clear view regarding the importance given to a brand name
while choosing the cold drinks. It was found that the 56% of Respondent says Yes and
39% of respondent say No and the only 5% of respondent not in a position to say
anything.
57
56%
39%
5%
Yes
No
Can’t Say
Graph IV
Preference of Brand name
58
Table- V
Factors Influences choosing particular Brand
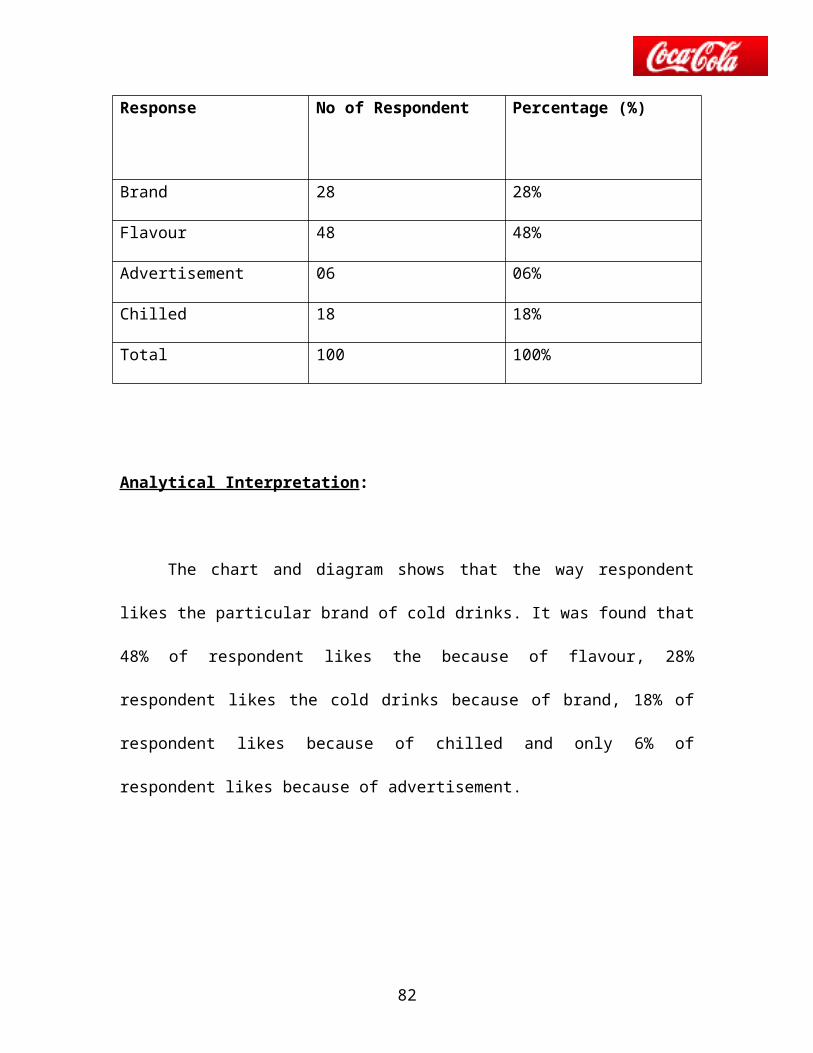
Response No of Respondent Percentage (%)
Brand 28 28%
Flavour 48 48%
Advertisement 06 06%
Chilled 18 18%
Total 100 100%
Analytical Interpretation:
The chart and diagram shows that the way respondent likes the particular brand of
cold drinks. It was found that 48% of respondent likes the because of flavour, 28%
respondent likes the cold drinks because of brand, 18% of respondent likes because of
chilled and only 6% of respondent likes because of advertisement.
59
GRAPH-V
Factors Influences choosing particular Brand
60
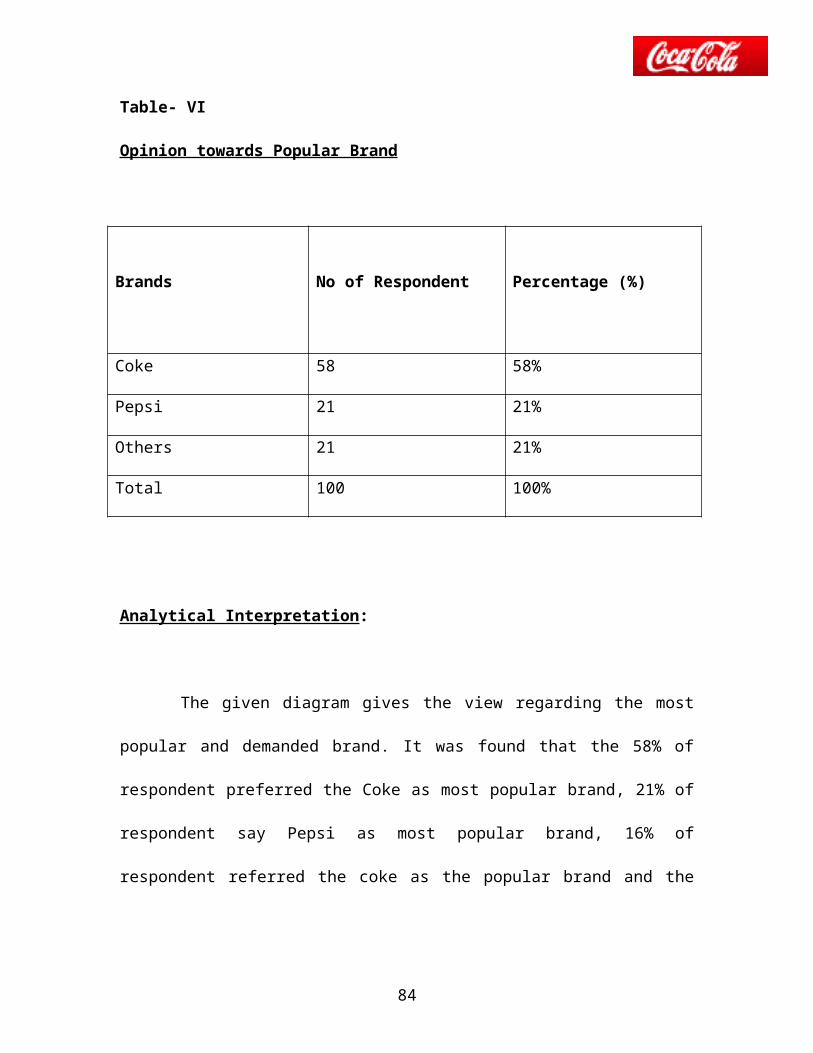
Table- VI
Opinion towards Popular Brand
Brands No of Respondent Percentage (%)
Coke 58 58%
Pepsi 21 21%
Others 21 21%
Total 100 100%
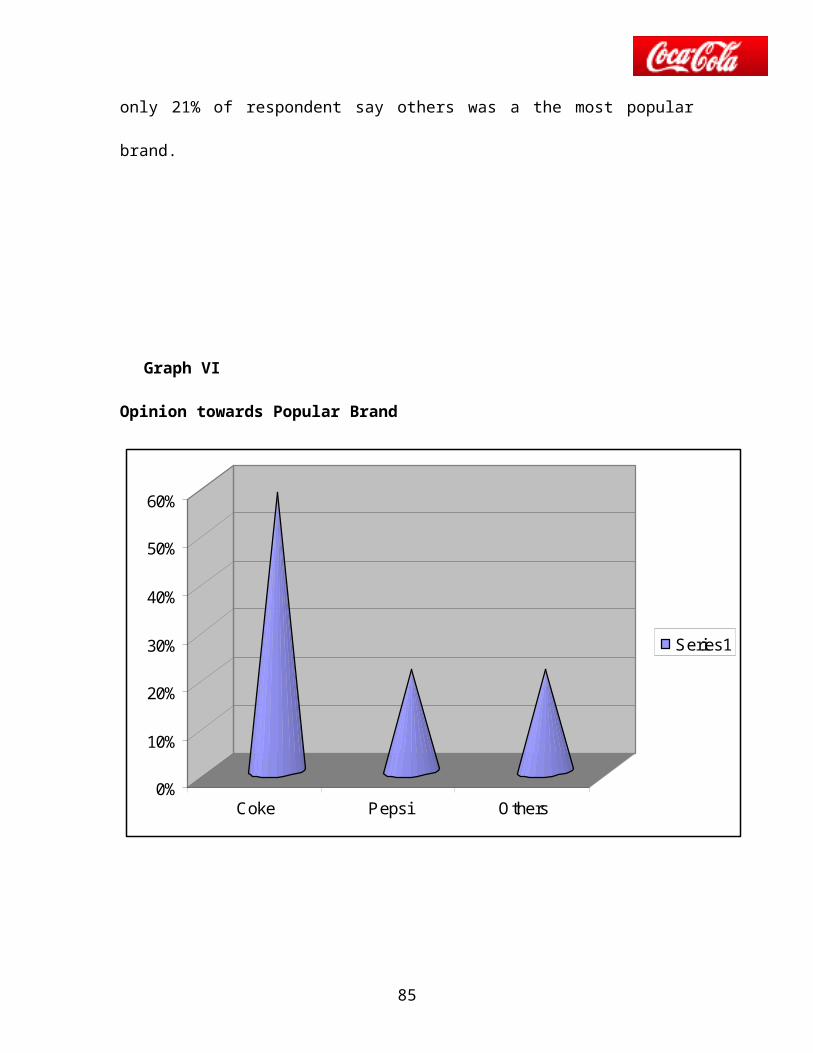
Analytical Interpretation:
The given diagram gives the view regarding the most popular and demanded
brand. It was found that the 58% of respondent preferred the Coke as most popular brand,
21% of respondent say Pepsi as most popular brand, 16% of respondent referred the coke
as the popular brand and the only 21% of respondent say others was a the most popular
brand.
61

Graph VI
Opinion towards Popular Brand
0%
10%
20%
30%
40%
50%
60%
Coke Pepsi Others
Series1
62
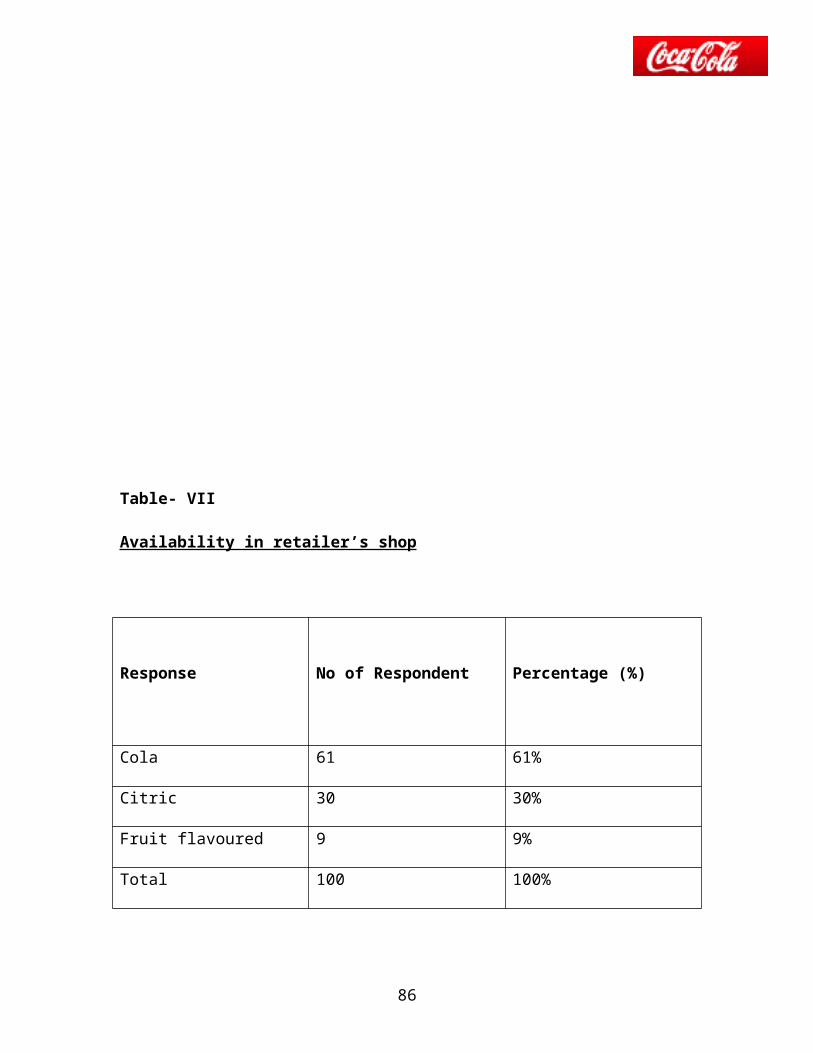
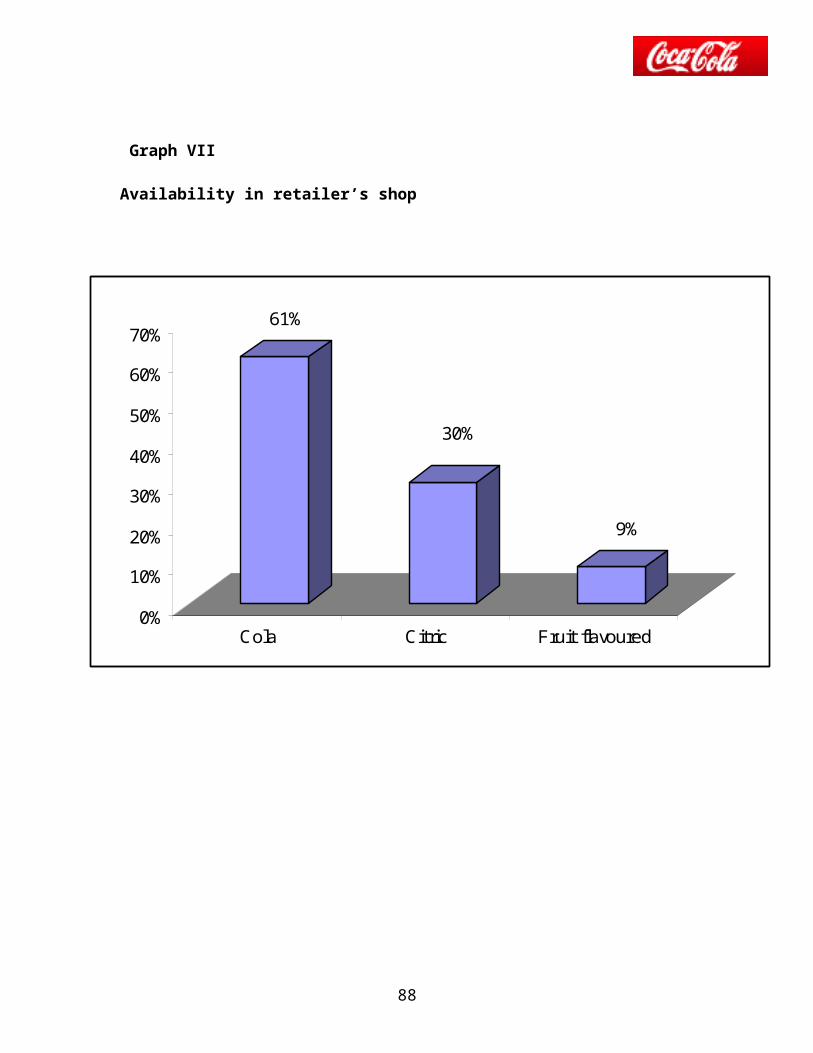
Table- VII
Availability in retailer’s shop
Response No of Respondent Percentage (%)
Cola 61 61%
Citric 30 30%
Fruit flavoured 9 9%
Total 100 100%
Analytical Interpretation:
The given chart table shows that the most available flavour on the respondent
retailer’s shops. It was found that the 61% of respondent (Consumers) say that they find
Cola flavour on their retailer’s shop.30% of respondent found the citric flavor on their
retailer’s shop. Science cola flavour is a Universal flavour in India, with consumers of
all age, sex and preference accepting it whole heartedly.
63
61%
30%
9%
0%
10%
20%
30%
40%
50%
60%
70%
Cola Citric Fruit flavoured
Graph VII
Availability in retailer’s shop
64
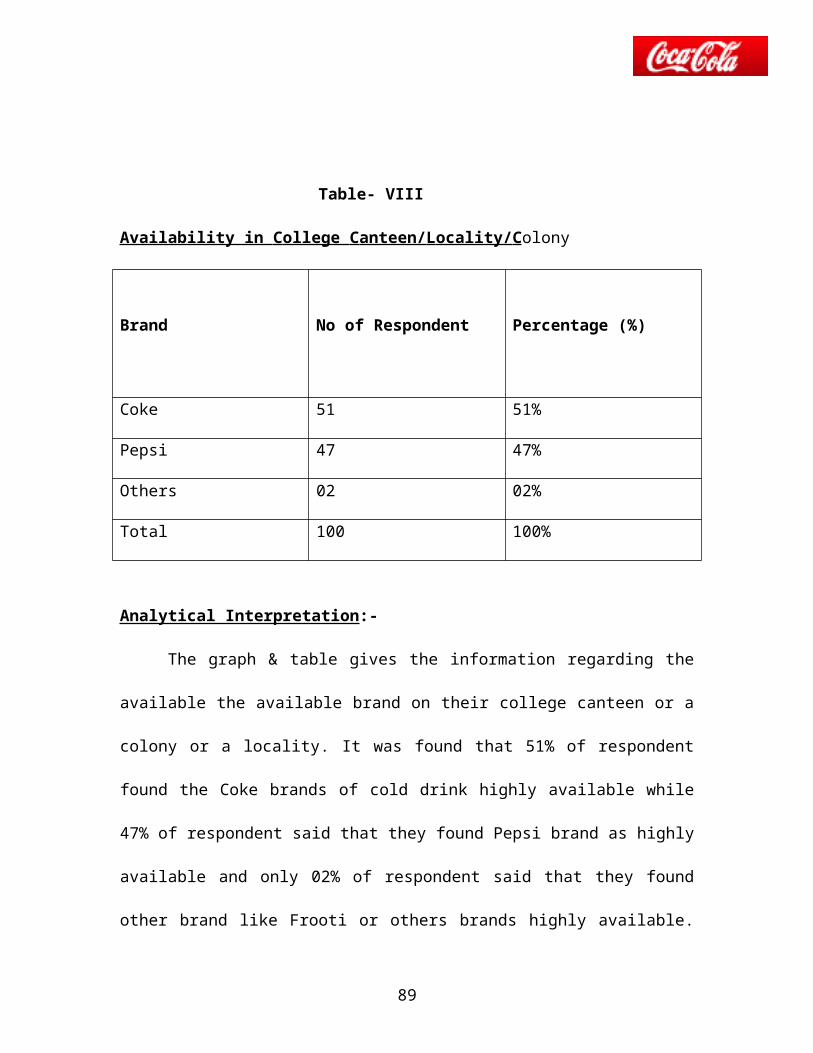
Table- VIII
Availability in C ollege C anteen/ L ocality/ C olony
Brand No of Respondent Percentage (%)
Coke 51 51%
Pepsi 47 47%
Others 02 02%
Total 100 100%
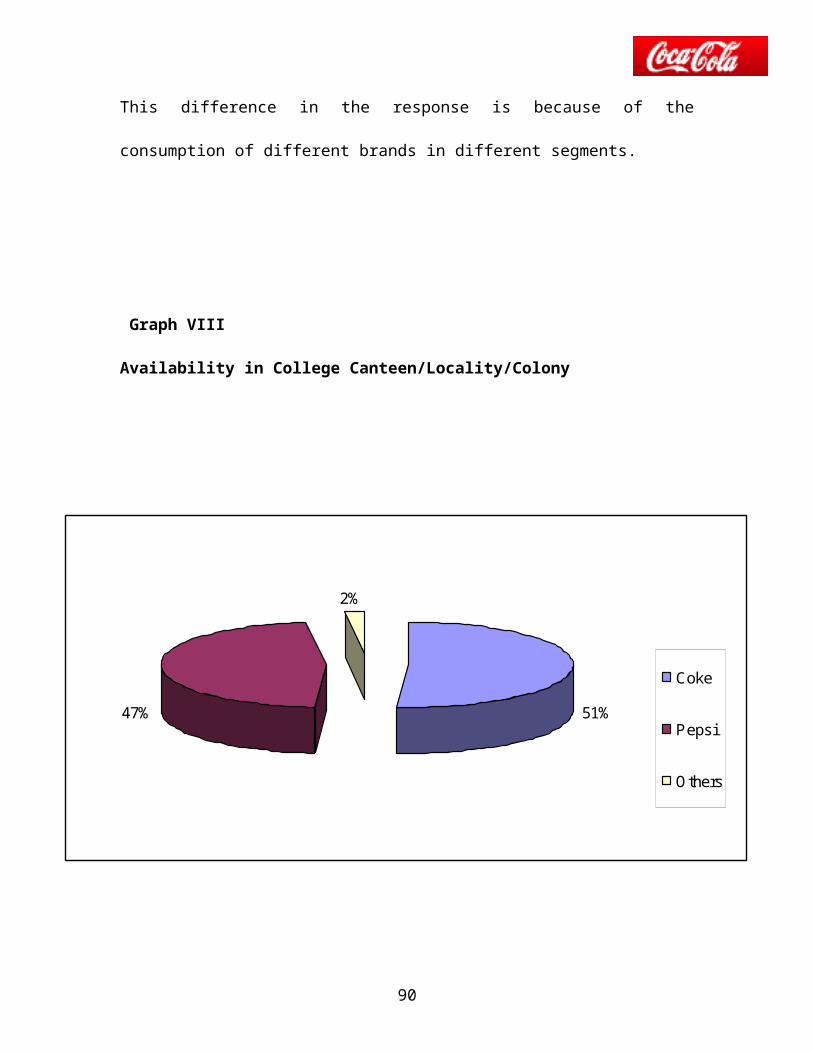
Analytical Interpretation:-
The graph & table gives the information regarding the available the available
brand on their college canteen or a colony or a locality. It was found that 51% of
respondent found the Coke brands of cold drink highly available while 47% of
respondent said that they found Pepsi brand as highly available and only 02% of
respondent said that they found other brand like Frooti or others brands highly available.
This difference in the response is because of the consumption of different brands in
different segments.
65
51%47%
2%
Coke
Pepsi
Others
Graph VIII
Availability in College Canteen/Locality/Colony
66
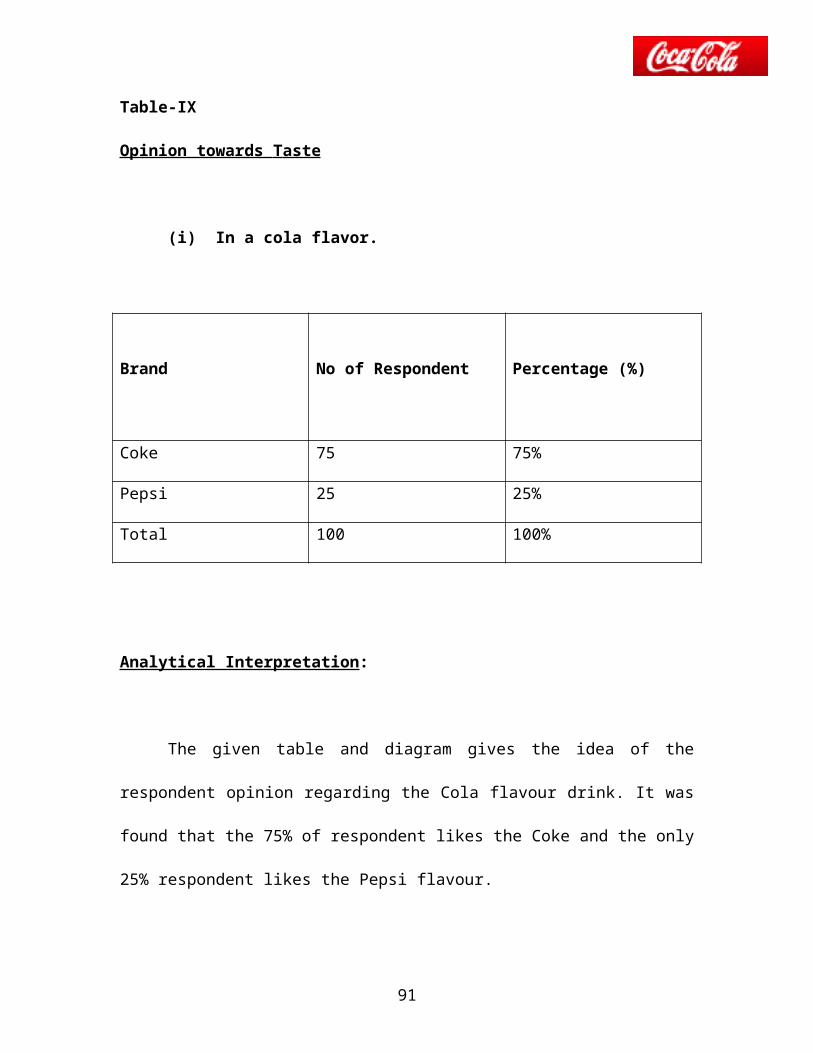
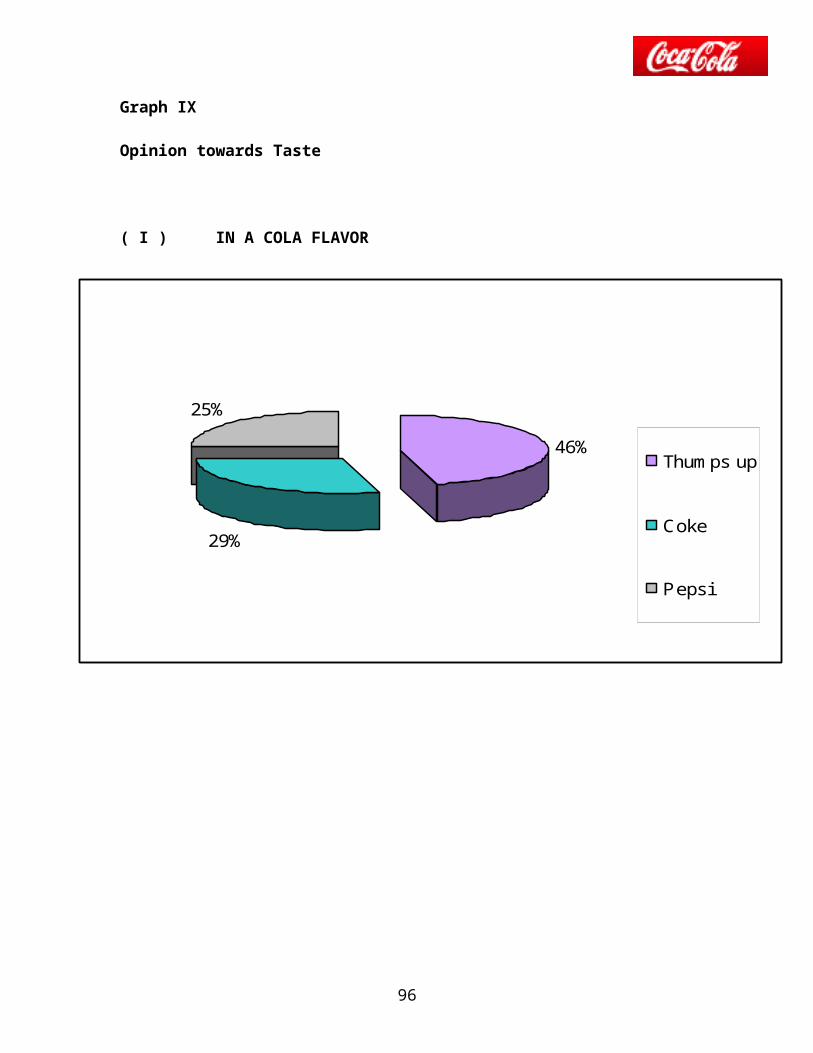
Table-IX
Opinion towards T aste
(i) In a cola flavor.
Brand No of Respondent Percentage (%)
Coke 75 75%
Pepsi 25 25%
Total 100 100%
Analytical Interpretation:
The given table and diagram gives the idea of the respondent opinion regarding
the Cola flavour drink. It was found that the 75% of respondent likes the Coke and the
only 25% respondent likes the Pepsi flavour.
67
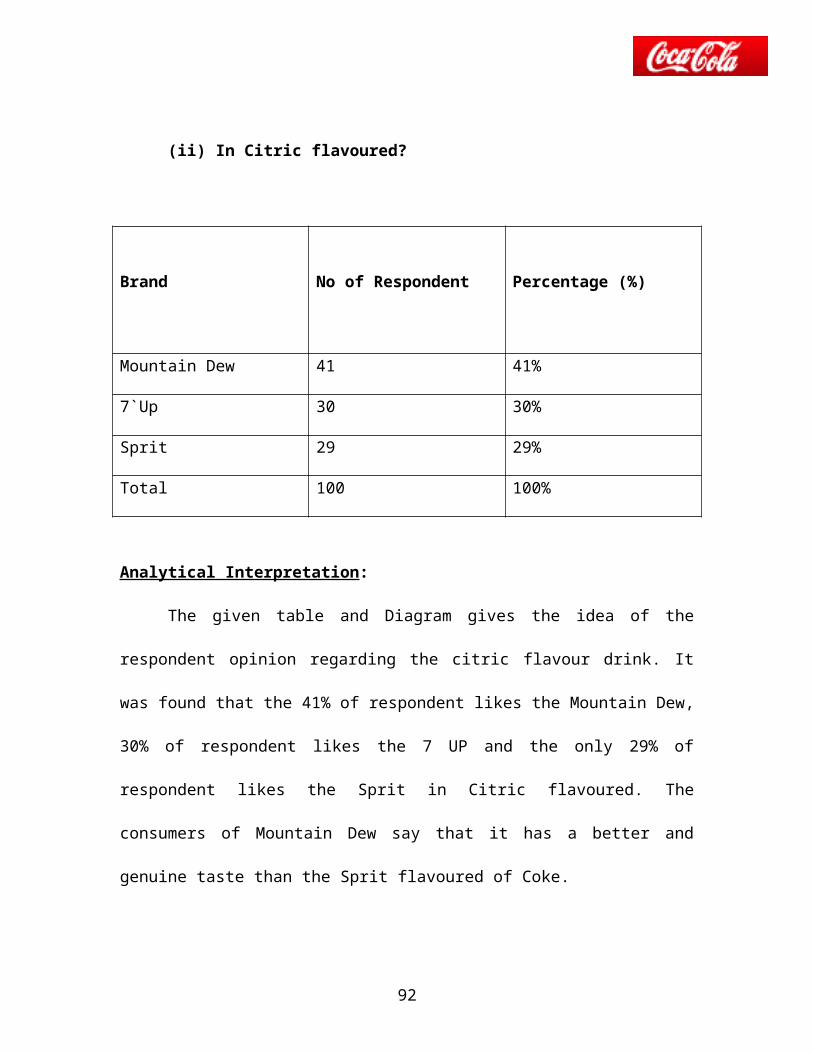
(ii) In Citric flavoured?
Brand No of Respondent Percentage (%)
Mountain Dew 41 41%
7`Up 30 30%
Sprit 29 29%
Total 100 100%
Analytical Interpretation:
The given table and Diagram gives the idea of the respondent opinion regarding
the citric flavour drink. It was found that the 41% of respondent likes the Mountain Dew,
30% of respondent likes the 7 UP and the only 29% of respondent likes the Sprit in Citric
flavoured. The consumers of Mountain Dew say that it has a better and genuine taste than
the Sprit flavoured of Coke.
68

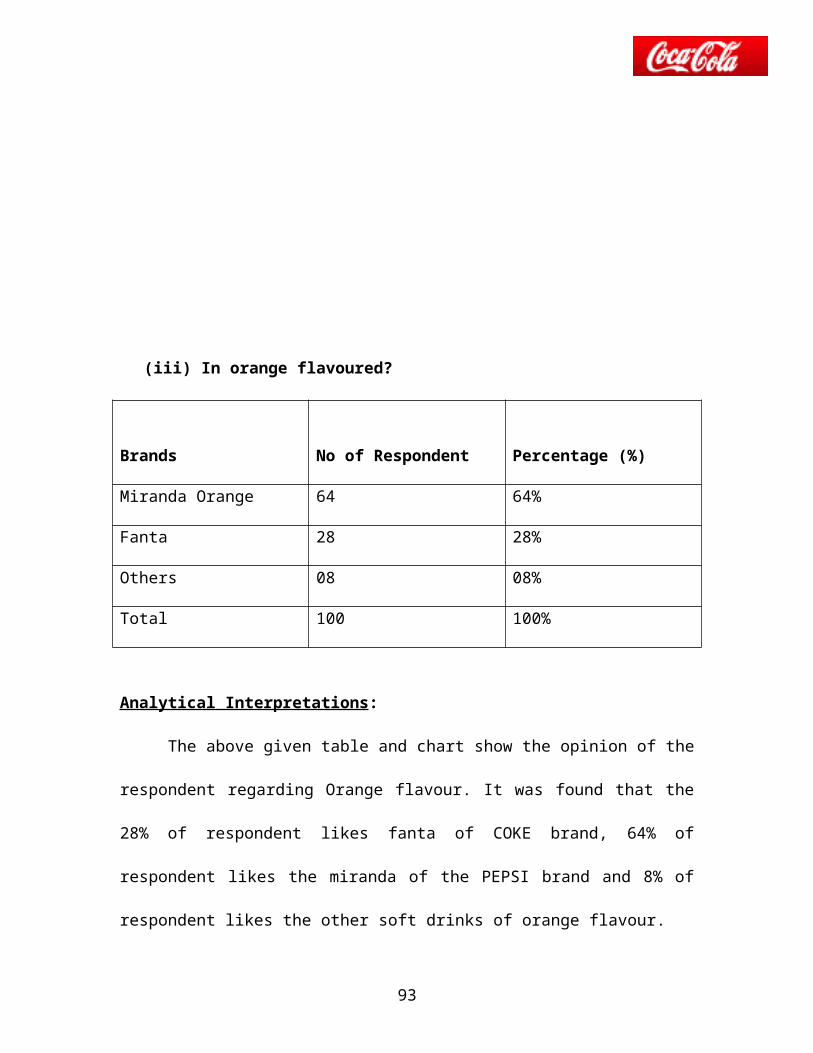
(iii) In orange flavoured?
Brands No of Respondent Percentage (%)
Miranda Orange 64 64%
Fanta 28 28%
Others 08 08%
Total 100 100%
Analytical Interpretations:
The above given table and chart show the opinion of the respondent regarding
Orange flavour. It was found that the 28% of respondent likes fanta of COKE brand, 64%
of respondent likes the miranda of the PEPSI brand and 8% of respondent likes the other
soft drinks of orange flavour.
69
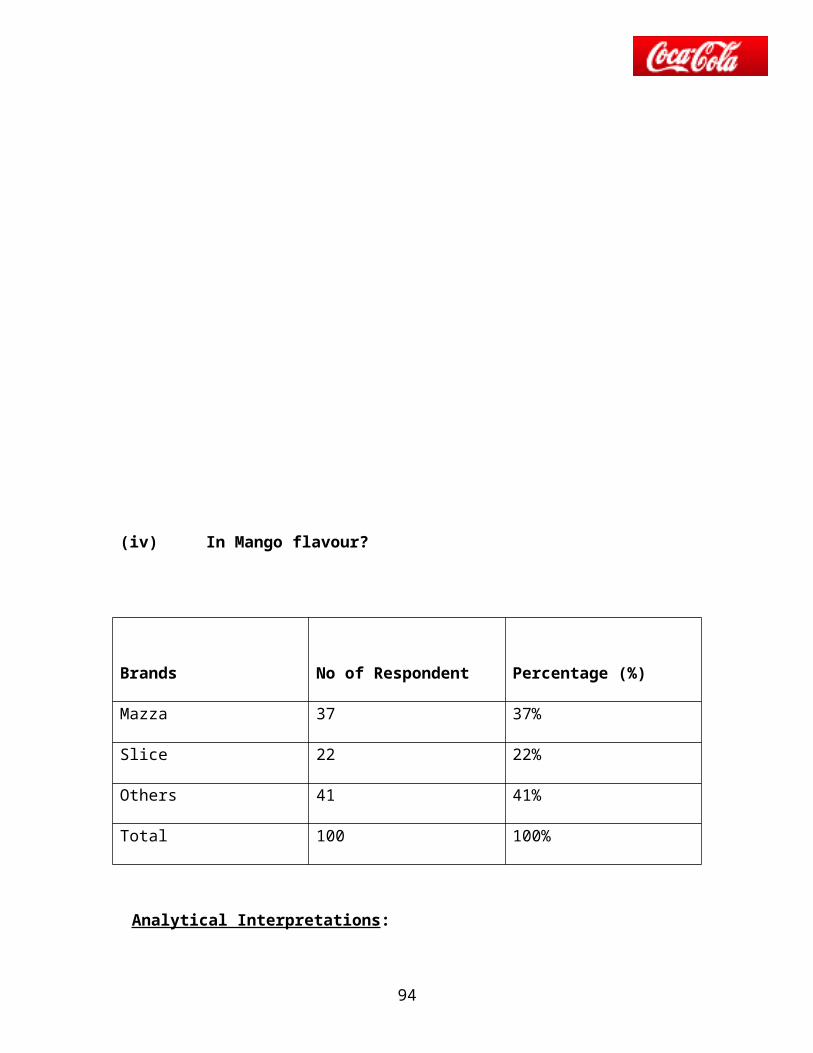
(iv) In Mango flavour?
Brands No of Respondent Percentage (%)
Mazza 37 37%
Slice 22 22%
Others 41 41%
Total 100 100%
Analytical Interpretations:
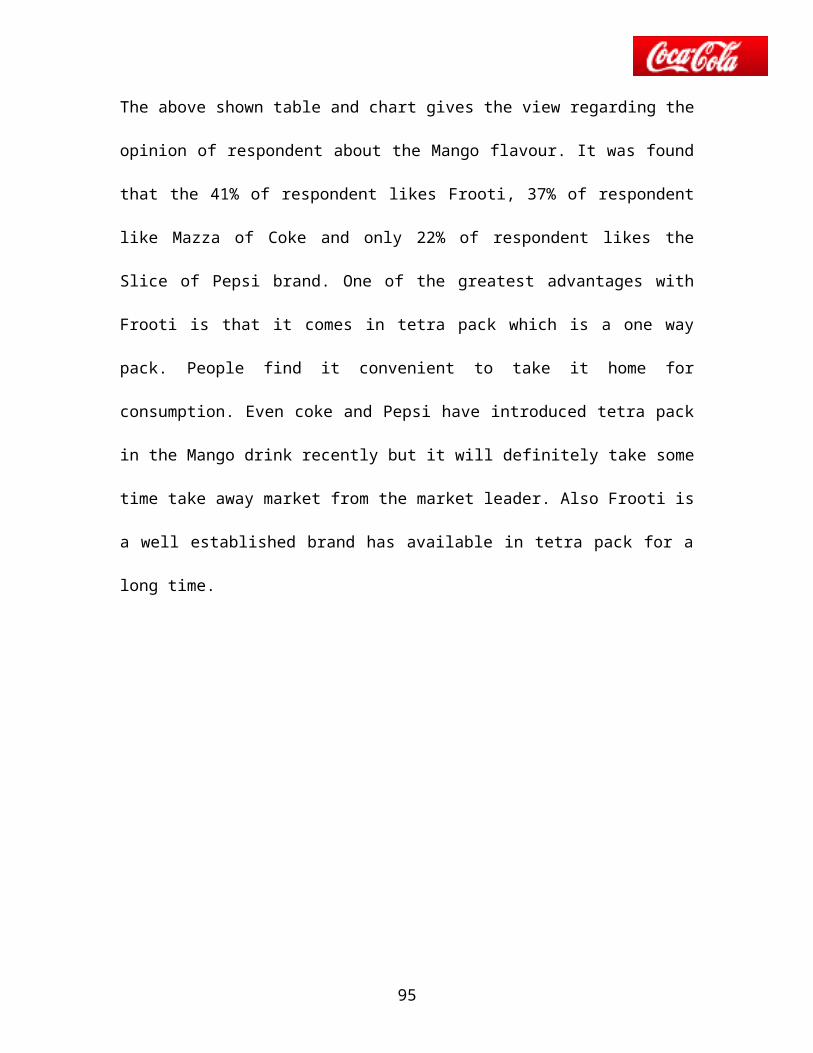
The above shown table and chart gives the view regarding the opinion of respondent
about the Mango flavour. It was found that the 41% of respondent likes Frooti, 37% of
respondent like Mazza of Coke and only 22% of respondent likes the Slice of Pepsi
brand. One of the greatest advantages with Frooti is that it comes in tetra pack which is a
one way pack. People find it convenient to take it home for consumption. Even coke and
Pepsi have introduced tetra pack in the Mango drink recently but it will definitely take
some time take away market from the market leader. Also Frooti is a well established
brand has available in tetra pack for a long time.
70
46%
29%
25%
Thumps up
Coke
Pepsi
Graph IX
Opinion towards Taste
( I ) IN A COLA FLAVOR
71
41%
30%
29%
Sprite
Mountain Dew
7`Up
Graph IX
Opinion towards Taste
(II) IN CITRIC FLAVOURED?
72
Mountain Dew
Sprit
64%
28%
8%
Fanta
Miranda Orange
Others
Graph IX
Opinion towards Taste
(III) IN ORANGE FLAVOURED
73
Fanta
Miranda Orange

37%
22%
41%
Mazza
Slice
Others
Graph IX
Opinion towards Taste
IN MANGO FLAVOUR?
74
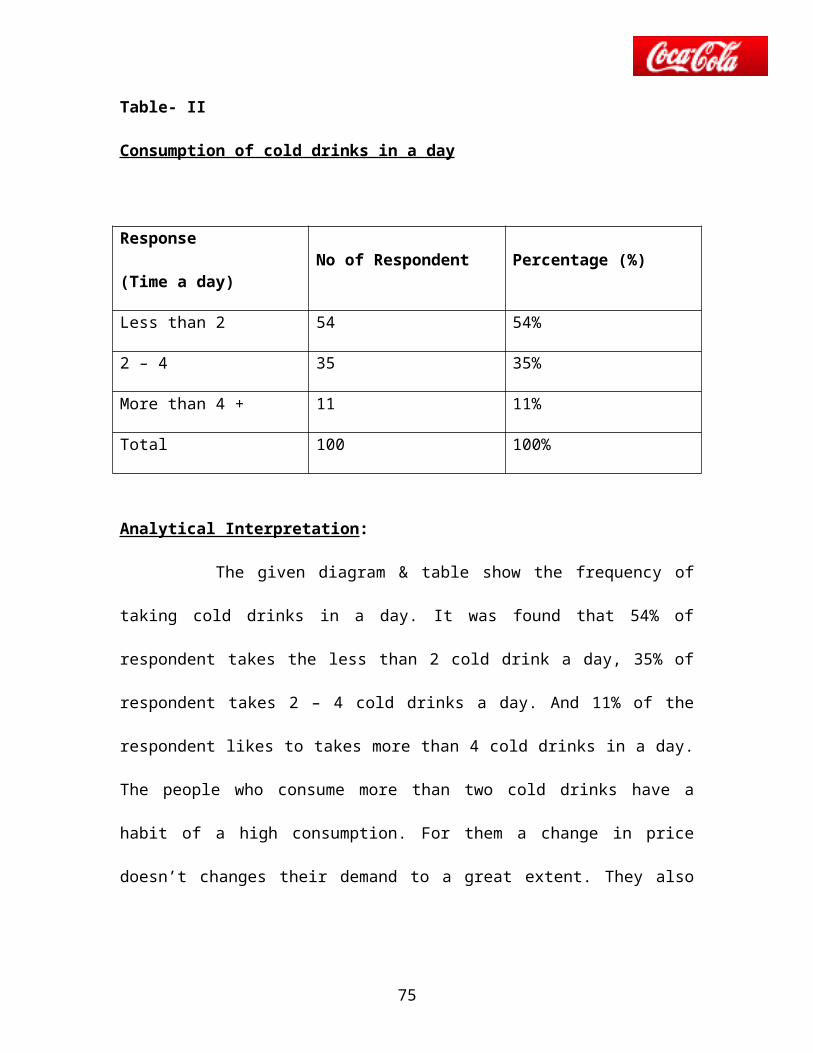
Table-X
Cause of Choosing Brand
Subject No of Respondent Percentage (%)
Blend 20 20%
Brand Image 38 38%
Availability 26 26%
Advertisement 16 16%
Total 100 100%
Analytical Interpretations:
The graph & table above say that why the respondent like their favoured brand. It
was found that 38% of respondent likes his brand because of brand Image, 26% of
respondent likes because of availability, 20% of because of Blend and only 16% of
advertisement. Brand image refer to the perception of the customers regarding the choice
of a particular brand. It comes with the kind of advertisement brought by the company.
Blend over here refers to the taste of the flavour demanded.
(IV) Graph X
75
20%
38%
26%
16%
0%
5%
10%
15%
20%
25%
30%
35%
40%
Blend Brand Image Availability Advertisement
Cause of Choosing Brand
76
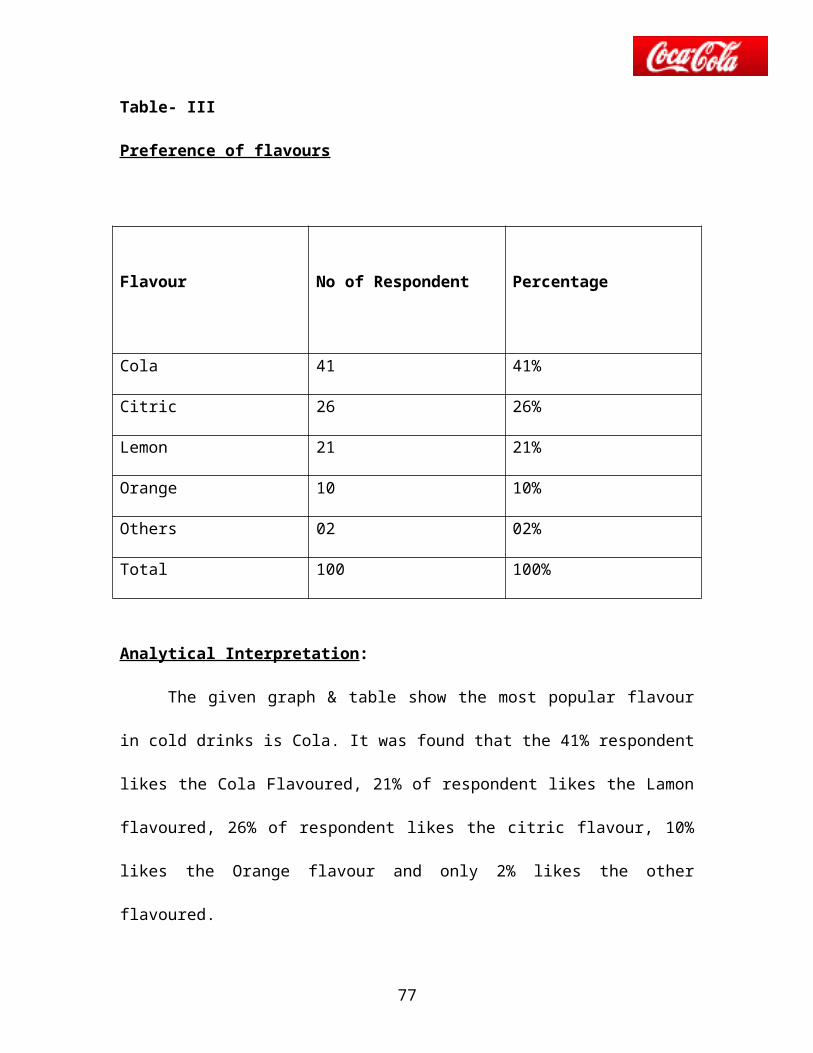
Table-XI
Most appealing Brand advertisement
Brands No of Respondent Percentage (%)
Coke 52 52%
Pepsi 48 48%
Total 100 100%
Analytical Interpretations:
The given chart shows that the respondent about the most appealing brand
advertisement. It was found that the 52% of respondent says that Coke advertisement is
most appealing, 48% of respondent says Pepsi advertisement is most appealing one. The
advertisement of Coke features Bollywood star like Aishyarwa Rai, Hritik Roshan,
Karishma Kapoor and Amir Khan who are highly acceptable by the public. The
advertisement of Coke featuring Amir Khan with a punch line
“Thanda Matlab…………….Coca-Cola”
It was a super hit which took Coke not only to the rural markets but also
overturned the market of Pepsi.
77
38%
32%30%
0%
5%
10%
15%
20%
25%
30%
35%
40%
Coke Pepsi Thumps up
Table XII
Most appealing Brand Punch Line
78
79
52%
48%
Coke
Pepsi
Graph XI
Most appealing Brand advertisement
80
Table-XII
Most appealing Brand P unch L ine
Brand No of Respondent Percentage (%)
Coke 68 68%
Pepsi 32 32%
Total 100 100%
Analytical Interpretations:
The chart shows the opinion regarding the most effective punch line in respondent
view. It was found that 68% of respondent feel that Coke punch line is most effective,
32% of respondent feels Pepsi ‘Punch line is most effective, Major no. of people thinks
that the most effective punch line is ‘Thanda Matalab……….Coca-Cola” and Punch
“Matlab ……Chota Coke”, Then “Ye pyass hai Badi” and “yeh dil mange more”
81
40%
32%
28%
Yes
No
Can’t say
Graph XIII
Opinion towards product, which is promoted by celebrity
82
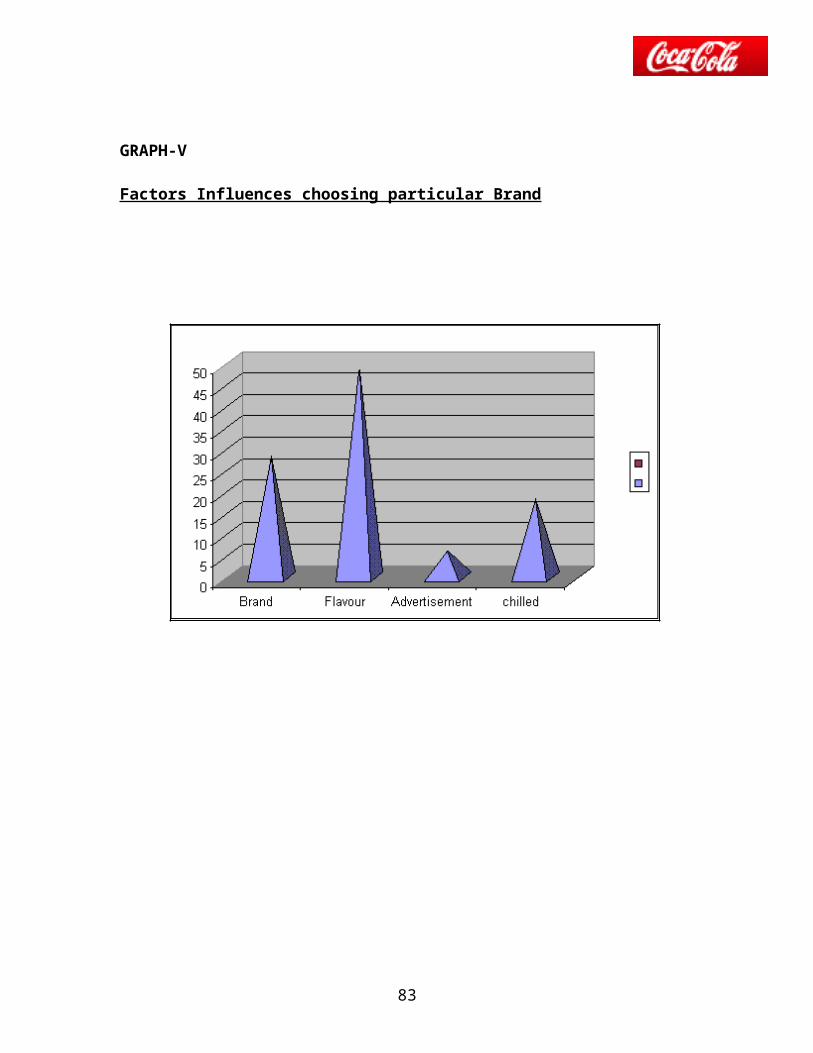
Table XIV
Opinion towards Pricing Strategy
Response No of Respondent Percentage (%)
Yes 64 64%
No 22 22%
Can`t Say 14 14%
Total 100 100%
Analytical Interpretations:
The given table & diagram shows that how effective the companies facility the
consumer. It was found 64% of respondent says yes. 22% of respondent says No and
14% respondent can’t say anything. India is a mass market for the consumer product but
at the same time it is also a very “Price Sensitive” Market. So with a small decrease in
price results in a drastic increase in the demand. Since soft drink is a consumer product,
the price has a great influence on the demand of the product.
83
64%
22%
14%
Yes
No
Can`t Say
Table XIV
Opinion towards Pricing Strategy
84
FINDINGS AND ANALYSIS
SWOT ANALYSIS
STRENGTH:
Coca-cola Potential brands position in the market.
Good quality and innovation of product for long term customer relationship.
Good advertising campaign, and brand ambassador.
Advertisement campaign more effective and change punch line make. Emotional
touch with customer and retail.
High investment in research and development.
Coca-cola has a good market share.
Segment of coke product to every age group.
To satisfy of retail or through schemes SGA, display.
WEAKNESS:
Lack of proper distribution in many areas.
Lack availability 1 it & 1.5 it product pack.
Lack supply of Kinley water in the market.
Rising No. of date dealers that will wrong effect in market condition.
Retailers are not getting schemes at the time.
No distribute enough signage to retailers.
85
OPPORTUNITY:
Coke is able to capture large mkt. Share.
More monopoly counters of coke brand.
To improve market mix (Product, price, promotion, place).
To increase the sale of Kinley water.
THREATS:
Pepsi is the major competitors, that means watch myopia in the market every
time.
Pepsi have captured major market of 500 ml, 1.5 & 2 lt.
Retailers divert to pepsi because they are getting good schemes and SGA
signage. Increase local brand in the market.
86
CONCLUSION, SUGGESTION,LIMITATION
87
SUGGESTIONS&RECOMMENDATIONS
Doing a survey on consumers market provided a lot of insight into the dynamics of the
market place and with it valuable insights were also gained into the psyche of consumer
and owners.
1. SUPPLY
The demand of Thums up & Maaza far exceed the supply especially in case of 200ml and
pet bottles. Few shop owners’ clamed that many a times no supply is made for 3 days and
some times even more.
Sometimes the delivery vans of Coca-Cola starts late from the distribution point and that
of rivals reach early .so eateries, which generally serve soft drinks in the glass, buy the
soft drinks from the delivery van which arrives first.
Salesman at the delivery van to be inconsistent on certain meters likes the concept of
broken bottles. When dealing with the shop and the eatery owners some salesman do
exchange bottles while some do not?
All flavors and all size of bottles are kindly available in the market.
2. COMPANY REPRESENTATION
Owners confirmed that Company representatives don’t come when called repeatedly.
The Company must ensure that the representatives do visit an outlet at least once in 3
days to listen and to attained to complaints, if any.
88
3. SALES PUSH BY EAT & DRINK OUTLET
The Company easily influenced many eatery owners, which provide them with better
facilities. There was a tendency to push the product of the Company which ever offered
them better scheme or benefits.
89
CONCLUSION
From this project titled "Merchandising and route productivity" in Coca-Cola, I
have learned a lot about real practical work being done in the market I have also watched
& learned the practical applicability of the various things that we have studied
theoretically.
I observed on the basis of survey in Dehradun city that Coca-Cola lay emphasis on
merchandising in order to become the No.1 brand in soft drink industry the report was
finds out the availability of different flavor and packs.
Cola-Cola adopt a good customer relationship management, it is focus on the,
segment of the product because each segment is affected by different sets of factor which
hamper or enhance sales. Each segment had its own Pros & Cons. So we have to
understand the various segment of soft drink industry that which flavor is existing more
in the market, Such as Thums-up strong brand of coke which is more popular in young
generation. I also observe about fate dealer, sub dealer, monopoly counter & its
marketing strategy. Such as fate dealer is influence wrong direction to the market. They
are supply product at high margin with low scheme.
As we know till now since ill soft drink industry the concept of brand loyalty is not in
that shape in which it is in countries. So company could take some steps to be to have a
good report with the retailers why supply them regularly and provide them with other
monetary benefit.
90
LIMITATION OF RESEARCH
1.The area of study is limited to the merchandising and route productivity aspects of the
system, while the marketing has other crucial areas too which were left uncharted
2. The study is limited to eastern region of coca cola which is a multinational company,
so the area plays as a constraint in the study.
3. The time period allotted for the study was only of two months, which may provide a
deceptive picture in comparison of the study based on long run.
4. The study was based on both primary and secondary data but the relevance of the
secondary data may not be justified.
5. The success of any survey depends upon the quality and integrity of the surveyor who
collect the basic data by expressing the subject under the study and on the respondents
who provides the data required by filling up the questionnaire .The accuracy of the data
collected solely depends upon the cooperation and truthfulness of the person who is being
interviewed.
6. Interaction skills as well as the behaviour of the respondents also played as a
constraints during the research.
91
QUESTIONNAIRE
1. Name of the Respondent:- …………………………
2. Address: - …………………………
3. Age group: -
(a) Below 15 (b) 15 – 20 (c) 20 – 25
(d) 25 – 35 (e) 35 – 45 (f) Above 45
1. Educational Background
(a) Matric & Below
(b) Intermediate
(c) Graduation
(d) Post Graduation
2. Do you take cold drink?
(a) Yes (b) No
7. If yes how frequently? (Daily)
(a) Less than 2 (b) 2 – 4 (c) More than 4
8. Which flavour do you like most?
(a) Cola (b) Citric (c) Orange
(d) Lemon (e) Others.
9. Do you give importance to brand name while choosing your cold drink?
(a) Yes (b) No (c) Can’t Say
10. Which brand you prefer most?
92
(a) Coke (b) Pepsi (c) Both (d)
Others
11. You like the particular brand of cold drink because of?
(a) Brand (b) Flavor (c) Advertisement
(d) Chilled
12 In your opinion which brand of cold drink is most demanded or popular?
(a) Coke (c) Pepsi (d) Others.
13. Which brand is more available in your retailer’s shops?
(a) Cola (b) Citric (c) Fruit Flavored.
14 Which brand of cold drink do you find most in your college
canteen/colony/locality?
(a) Coke Brand (b) Pepsi Brand (c) Others.
15. In your opinion which soft drink is better taste?
(i) In Cola Flavor
(a) Coke (c) Pepsi
(ii) In Citric Flavoured.
(a)Sprite (b) Mountain Dew (c) 7`Up
(iii) In Orange flavoured.
(a) Fanta (b) Miranda Orange
(c) Others.
(iv) In mango Flavoured.
(a) Mazza (b) Slice (c) Others.
93
16. Why do you like your brand?
(a) Blend (b) Brand Image (c) Availability
(d) Advertisement
17. Which brand advertisement appeals you most?
(a) Coke (b) Pepsi (c) Others.
18. Most effective punch line in your opinion of?
(a) Coke (b) Thumps up
(c) Pepsi (d) Others.
19. You like the product which is promoted by the celebrity?
(a) Yes (b) No (c) Can’t Say
20. Do you think that the pricing strategy adopted by the cola companies fascinate the
consumer?
(a) Yes (b) No (c) Can’t Say
21. Any Suggestion:-
………………………………………………………………………………………………
………………………………………………………...
……………………………………………………………………………….......
94
Thank You,
Signature
95
BIBLIOGRAPHY
1. Research Methodology, Kothari. C.R., Research Methodology Methods
& Techniques, New-Delhi, Wishwa Prakashan, edition 2003.
1. Multi Level & Direct Marketing, Branding, Kotler, Philip., Marketing
Management, Delhi, Pearson Education (Singapore) Pte. Ltd, 11th edition.
2. Marketing Strategy, Varshney, R.L. & Bhattacharya, B., International
Marketing Management, New-Delhi, Sultan Chand & Sons edition 2003.
3. Company Profile, Web-Site:- www.coca-cola.com <http://www.coca-
cola.com>
4. Merchandising & Route Productivity, www.ask-jeeves.com,
www.distributing-company.com.
5. Retailing, Company Souvenirs.
96