BRAND AWARENESS AND POSITIONING | 2012circle.adventist.org/files/icm/nadresearch/Brand.pdf ·...
28
______________________________________________________________________________________ ______________________________________________________________________________________ Seventh-day Adventist Church BRAND AWARENESS AND POSITIONING | 2012 A nationwide study of U.S. adults Research commissioned by: Seventh-day Adventist Church Silver Spring, Maryland Research conducted by: Barna Group Ventura, California
-
Upload
truongtram -
Category
Documents
-
view
220 -
download
0
Transcript of BRAND AWARENESS AND POSITIONING | 2012circle.adventist.org/files/icm/nadresearch/Brand.pdf ·...
______________________________________________________________________________________
______________________________________________________________________________________
Seventh-day Adventist Church
BRAND AWARENESS AND POSITIONING | 2012
A nationwide study of U.S. adults
Research commissioned by:
Seventh-day Adventist Church
Silver Spring, Maryland
Research conducted by:
Barna Group
Ventura, California
Barna Group
______________________________________________________________________________________
Seventh-day Adventist Church | OmniPollSM 2012 page 2
Copyright 2012
This information has been produced by the Barna Group for the Seventh-day Adventist
Church (SDA). The information is confidential and copyrighted information that belongs
to SDA and may not be reproduced in any form or format without the written permission
of SDA.
Barna Group
______________________________________________________________________________________
Seventh-day Adventist Church | OmniPollSM 2012 page 3
T A B L E O F C O N T E N T S
Introduction ................................................................................ 4
Data Analysis .............................................................................. 5
Appendix .....................................................................................25
Research Question
Research Definitions
Study Methodology
Guide to Survey Data
Barna Group
______________________________________________________________________________________
Seventh-day Adventist Church | OmniPollSM 2012 page 4
I N T R O D U C T I O N
This report contains the findings from a series of questions commissioned by the
Seventh-day Adventist Church in a nationwide study of adults, ages 18 and older. The
study, known publicly as OmniPollSM
, is a shared-cost research study conducted by
Barna Research (a division of Barna Group). OmniPollSM
included online surveys with
1,005 adults and was conducted in March, 2012.
Organizations commission questions in OmniPollSM
on a pay-per-item basis, while Barna
Research includes a variety of demographic and theolographic variables for cross-
tabulation purposes.
Based on the information needs expressed by the Seventh-day Adventist Church,
questions were designed to measure aided awareness and favorability of the church,
reasons for specific impressions of the church, and viewership of the HOPE Channel,
3ABN, and other faith-based or inspirational networks and programs. Where applicable,
data from a similar study conducted in 2011 is included for purposes of tracking and
comparison.
The remainder of this report provides a summary analysis of the survey data for this
question; a description of the survey methodology; and a summary of sampling error
considerations. Detailed (cross-tabulated) data tables for the question are provided in a
separate document.

Barna Group
______________________________________________________________________________________
Seventh-day Adventist Church | OmniPollSM 2012 page 5
D A T A A N A L Y S I S
Barna Group
______________________________________________________________________________________
Seventh-day Adventist Church | OmniPollSM 2012 page 6
Notes to Reader
A written analysis of the research findings, along with relevant graphics and data tables,
are included in this section. In the tables that follow, data has been marked with a () or
() sign, if applicable, to indicate if the data for that generational or faith segment is
statistically significantly higher or lower than the total response for the general
population of adults in the U.S. (or the appropriate base of respondents for each question
or data table). Where these tests have been performed, differences are statistically
significant at the 95% confidence level or higher.
The following research definitions are used throughout this report:
Generations
Mosaics: those currently ages 18 to 27
Busters: those currently ages 28 to 46
Boomers: those currently ages 47 to 65
Elders: those currently ages 66 or older
Faith Identification
Christian: those who self-identify as a Christian
Non-Christian: those of a non-Christian faith or no faith (atheist, agnostic, etc.)
Faith Segment
Evangelical: The term “evangelical” is applied to born again Christians who also
meet seven additional criteria. Those include saying their faith is very important in
their life; believing they have a responsibility to share their faith in Christ with non-
Christians; believing in the existence of Satan; believing that eternal salvation is
gained through God’s grace alone, not through our efforts; believing that Jesus
Christ lived a sinless life while on earth; believing the Bible is accurate in all that it
teaches; and choosing an orthodox definition of God. To be classified as a born
again Christian, an individual must say they have made a personal commitment to
Jesus Christ that is still important in their life today, and that after they die they will
go to Heaven because they have confessed their sins and accepted Jesus Christ as
their savior. People who meet these criteria are classified as “evangelical”
regardless of whether or not they would say they are evangelical Christians. This
definition has no relationship to church attendance, membership, or denominational
affiliation
Non-Evangelical Born Again: The term “non-evangelical born again” describes
individuals who meet the criteria for born again but do not meet the criteria for
“evangelicals.”
Notional Christians: Notional Christians are individuals who identify as Christian,
but who do not meet the definition of a born again Christian.
Barna Group
______________________________________________________________________________________
Seventh-day Adventist Church | OmniPollSM 2012 page 7
Awareness of Seventh-day Adventist Church
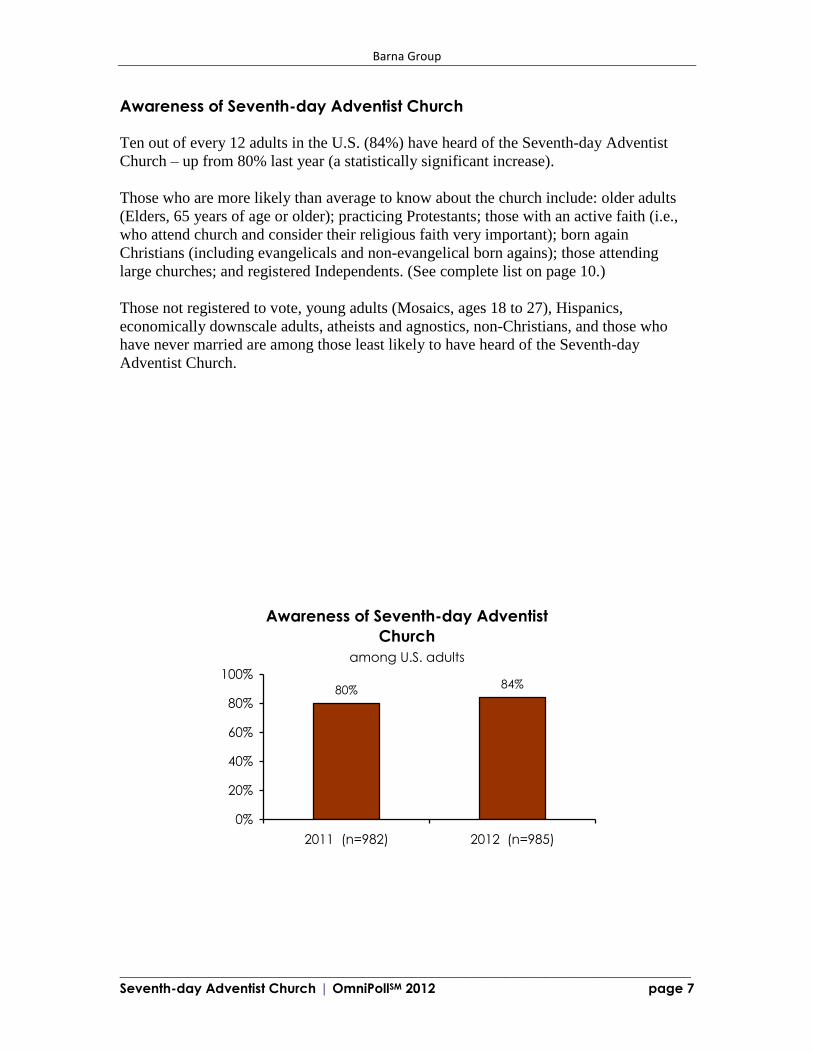
Ten out of every 12 adults in the U.S. (84%) have heard of the Seventh-day Adventist
Church – up from 80% last year (a statistically significant increase).
Those who are more likely than average to know about the church include: older adults
(Elders, 65 years of age or older); practicing Protestants; those with an active faith (i.e.,
who attend church and consider their religious faith very important); born again
Christians (including evangelicals and non-evangelical born agains); those attending
large churches; and registered Independents. (See complete list on page 10.)
Those not registered to vote, young adults (Mosaics, ages 18 to 27), Hispanics,
economically downscale adults, atheists and agnostics, non-Christians, and those who
have never married are among those least likely to have heard of the Seventh-day
Adventist Church.
Awareness of Seventh-day Adventist
Church
among U.S. adults
80%84%
0%
20%
40%
60%
80%
100%
2011 (n=982) 2012 (n=985)

Barna Group
______________________________________________________________________________________
Seventh-day Adventist Church | OmniPollSM 2012 page 8
As was the case in 2011, younger adults (Mosaics and Busters) have far less awareness of
the Seventh-day Adventist Church, while Boomers and Elders are far more likely have
heard of the church. (Differences across all four of these generational segments are
statistically significant.)
Awareness of Seventh-day Adventist Church
by Generation
84%
62%
77%
93%97%
0%
20%
40%
60%
80%
100%
U.S. adults
(n=985)
Mosaics, 18-27
(n=144)
Busters, 28-46
(n=334)
Boomers, 47-65
(n=376)
Elders, 66+
(n=130)

Barna Group
______________________________________________________________________________________
Seventh-day Adventist Church | OmniPollSM 2012 page 9
TABLE 1: AWARENESS OF THE SEVENTH-DAY ADVENTIST CHURCH
Generation Faith identification
US
adults Mosaic 18-24
Buster 28-46
Boomer 47-65
Elder 66 plus Christian
non-Christian
aware 84% 62% 77% 93% 97% 87% 75%
never heard of 16 38 23 7 3 13 25
n= 985 144 334 376 130 738 218
Note: A () or () sign indicates that data for that segment is statistically significantly higher or lower than the total response for U.S. adults. Differences are statistically significant at the 95% confidence level or higher.
2011 2012
aware 80% 84%
never heard of 20 16
n= 982 985
Barna Group
______________________________________________________________________________________
Seventh-day Adventist Church | OmniPollSM 2012 page 10
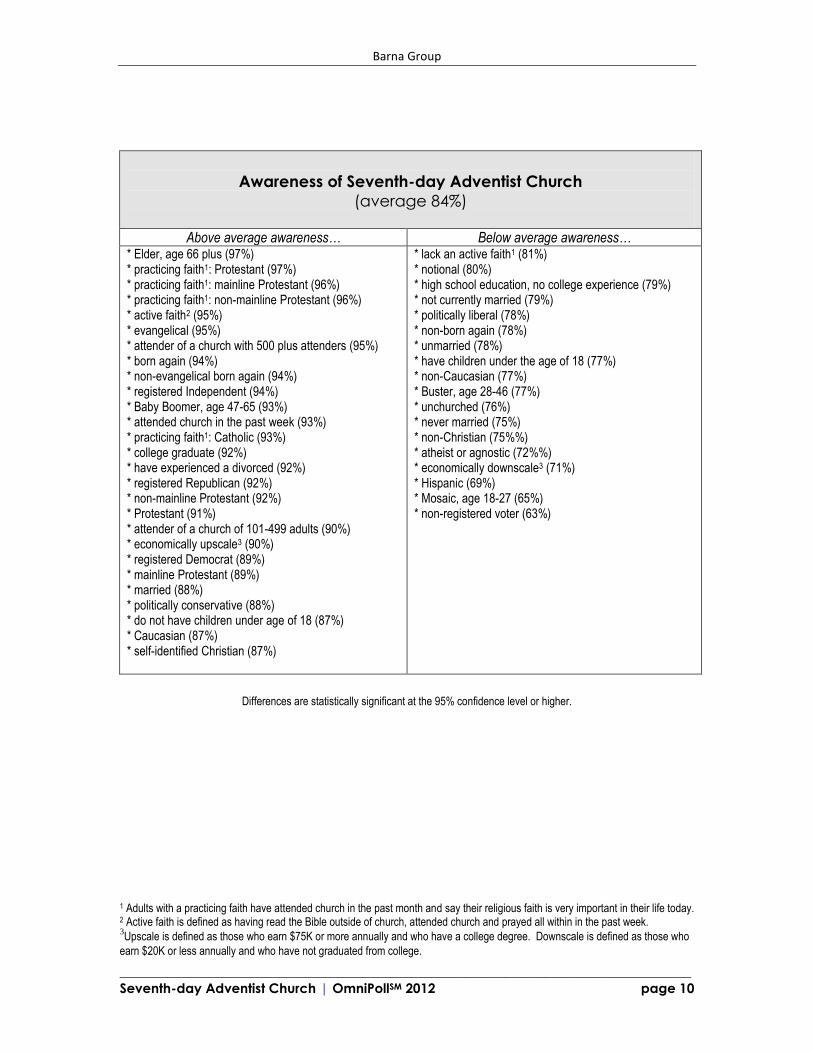
Awareness of Seventh-day Adventist Church
(average 84%)
Above average awareness… Below average awareness… * Elder, age 66 plus (97%) * practicing faith1: Protestant (97%) * practicing faith1: mainline Protestant (96%) * practicing faith1: non-mainline Protestant (96%) * active faith2 (95%) * evangelical (95%) * attender of a church with 500 plus attenders (95%) * born again (94%) * non-evangelical born again (94%) * registered Independent (94%) * Baby Boomer, age 47-65 (93%) * attended church in the past week (93%) * practicing faith1: Catholic (93%) * college graduate (92%) * have experienced a divorced (92%) * registered Republican (92%) * non-mainline Protestant (92%) * Protestant (91%) * attender of a church of 101-499 adults (90%) * economically upscale3 (90%) * registered Democrat (89%) * mainline Protestant (89%) * married (88%) * politically conservative (88%) * do not have children under age of 18 (87%) * Caucasian (87%) * self-identified Christian (87%)
* lack an active faith1 (81%) * notional (80%) * high school education, no college experience (79%) * not currently married (79%) * politically liberal (78%) * non-born again (78%) * unmarried (78%) * have children under the age of 18 (77%) * non-Caucasian (77%) * Buster, age 28-46 (77%) * unchurched (76%) * never married (75%) * non-Christian (75%%) * atheist or agnostic (72%%) * economically downscale3 (71%) * Hispanic (69%) * Mosaic, age 18-27 (65%) * non-registered voter (63%)
Differences are statistically significant at the 95% confidence level or higher.
1 Adults with a practicing faith have attended church in the past month and say their religious faith is very important in their life today. 2 Active faith is defined as having read the Bible outside of church, attended church and prayed all within in the past week. 3Upscale is defined as those who earn $75K or more annually and who have a college degree. Downscale is defined as those who
earn $20K or less annually and who have not graduated from college.
Barna Group
______________________________________________________________________________________
Seventh-day Adventist Church | OmniPollSM 2012 page 11
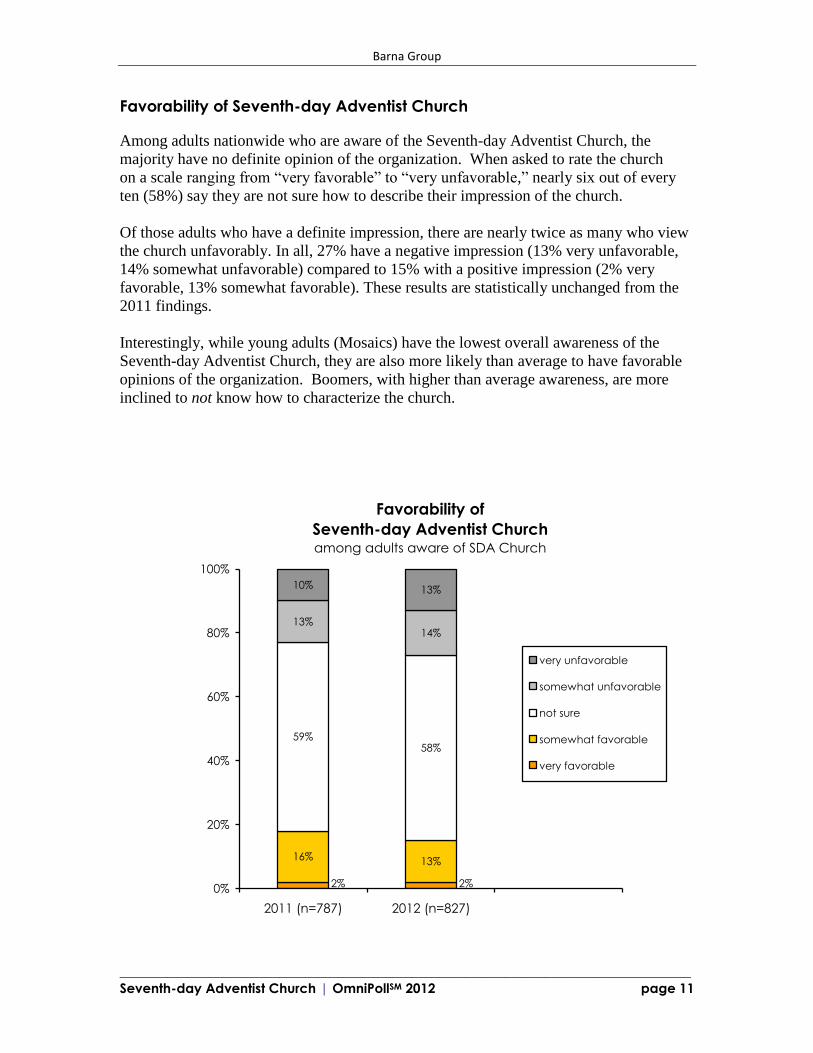
Favorability of Seventh-day Adventist Church
Among adults nationwide who are aware of the Seventh-day Adventist Church, the
majority have no definite opinion of the organization. When asked to rate the church
on a scale ranging from “very favorable” to “very unfavorable,” nearly six out of every
ten (58%) say they are not sure how to describe their impression of the church.
Of those adults who have a definite impression, there are nearly twice as many who view
the church unfavorably. In all, 27% have a negative impression (13% very unfavorable,
14% somewhat unfavorable) compared to 15% with a positive impression (2% very
favorable, 13% somewhat favorable). These results are statistically unchanged from the
2011 findings.
Interestingly, while young adults (Mosaics) have the lowest overall awareness of the
Seventh-day Adventist Church, they are also more likely than average to have favorable
opinions of the organization. Boomers, with higher than average awareness, are more
inclined to not know how to characterize the church.
Favorability of
Seventh-day Adventist Church among adults aware of SDA Church
16% 13%
59%58%
13%14%
10% 13%
2% 2%0%
20%
40%
60%
80%
100%
2011 (n=787) 2012 (n=827)
very unfavorable
somewhat unfavorable
not sure
somewhat favorable
very favorable
Barna Group
______________________________________________________________________________________
Seventh-day Adventist Church | OmniPollSM 2012 page 12
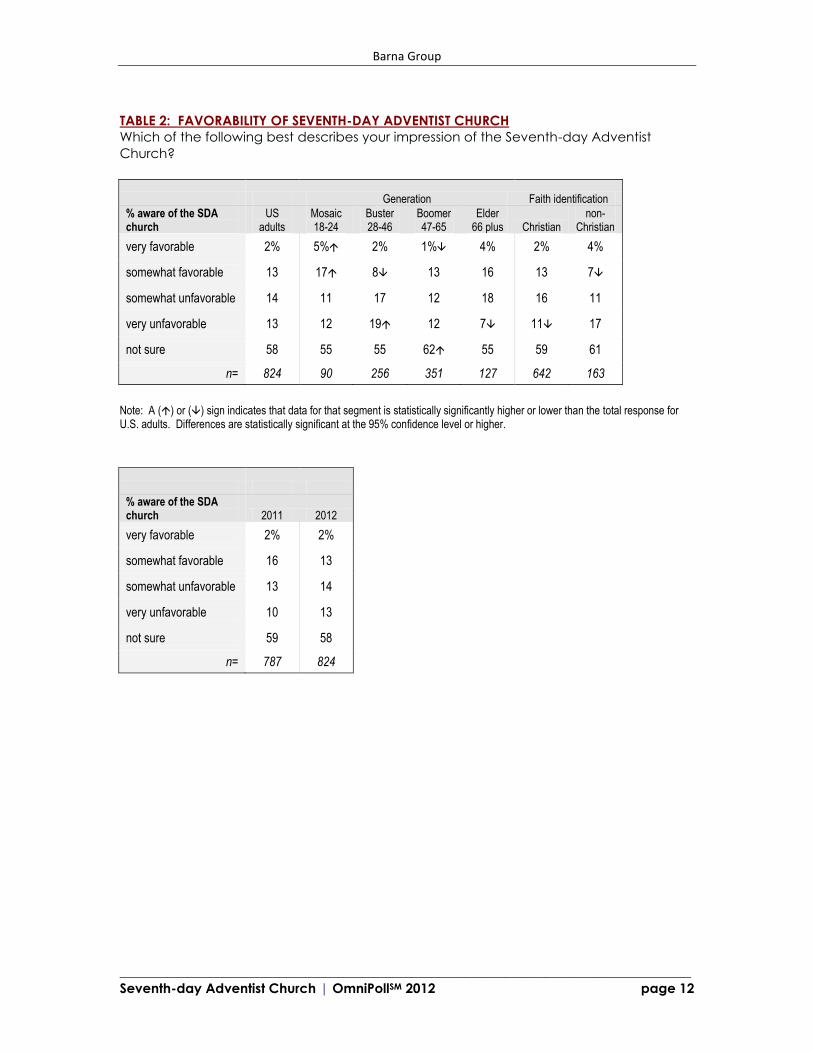
TABLE 2: FAVORABILITY OF SEVENTH-DAY ADVENTIST CHURCH
Which of the following best describes your impression of the Seventh-day Adventist
Church?
Generation Faith identification
% aware of the SDA church
US adults
Mosaic 18-24
Buster 28-46
Boomer 47-65
Elder 66 plus Christian
non-Christian
very favorable 2% 5% 2% 1% 4% 2% 4%
somewhat favorable 13 17 8 13 16 13 7
somewhat unfavorable 14 11 17 12 18 16 11
very unfavorable 13 12 19 12 7 11 17
not sure 58 55 55 62 55 59 61
n= 824 90 256 351 127 642 163
Note: A () or () sign indicates that data for that segment is statistically significantly higher or lower than the total response for U.S. adults. Differences are statistically significant at the 95% confidence level or higher.
% aware of the SDA church 2011 2012
very favorable 2% 2%
somewhat favorable 16 13
somewhat unfavorable 13 14
very unfavorable 10 13
not sure 59 58
n= 787 824
Barna Group
______________________________________________________________________________________
Seventh-day Adventist Church | OmniPollSM 2012 page 13
Reasons for Impressions of Seventh-day Adventist Church
Adults who heard of the Seventh-day Adventist Church and had definite opinions about it
were asked why they had their specific favorable or unfavorable impressions of the
organization. This question was asked in an open-ended manner.
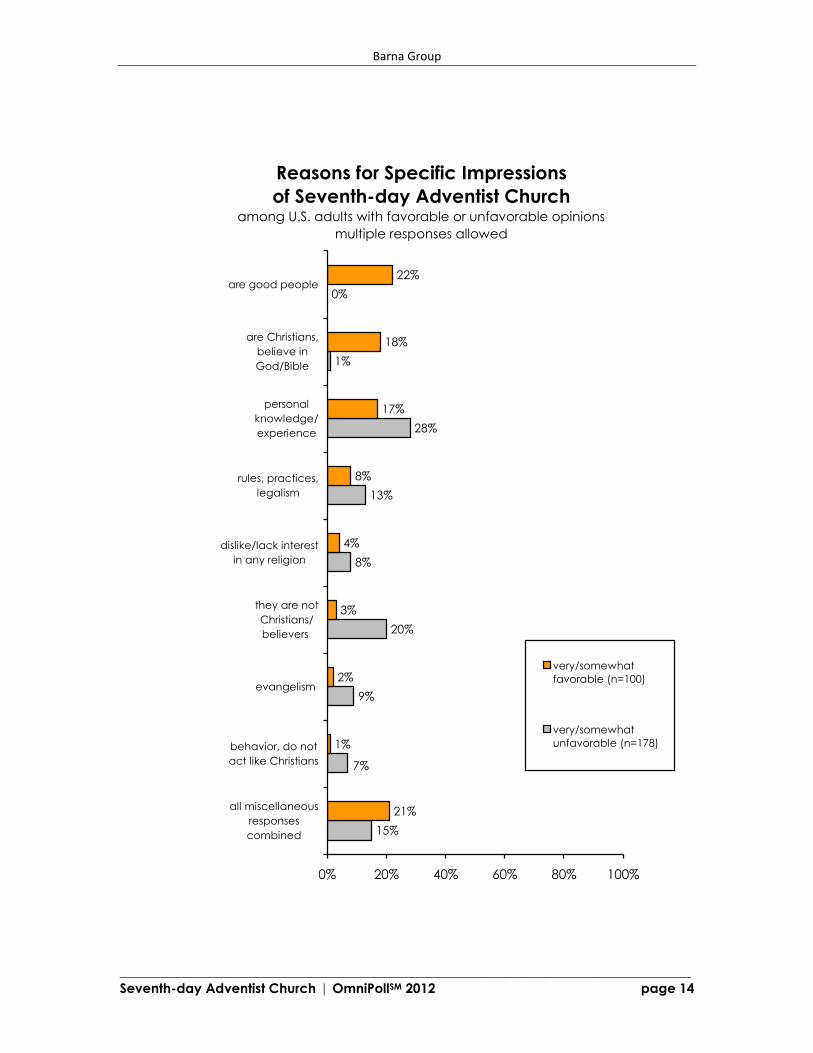
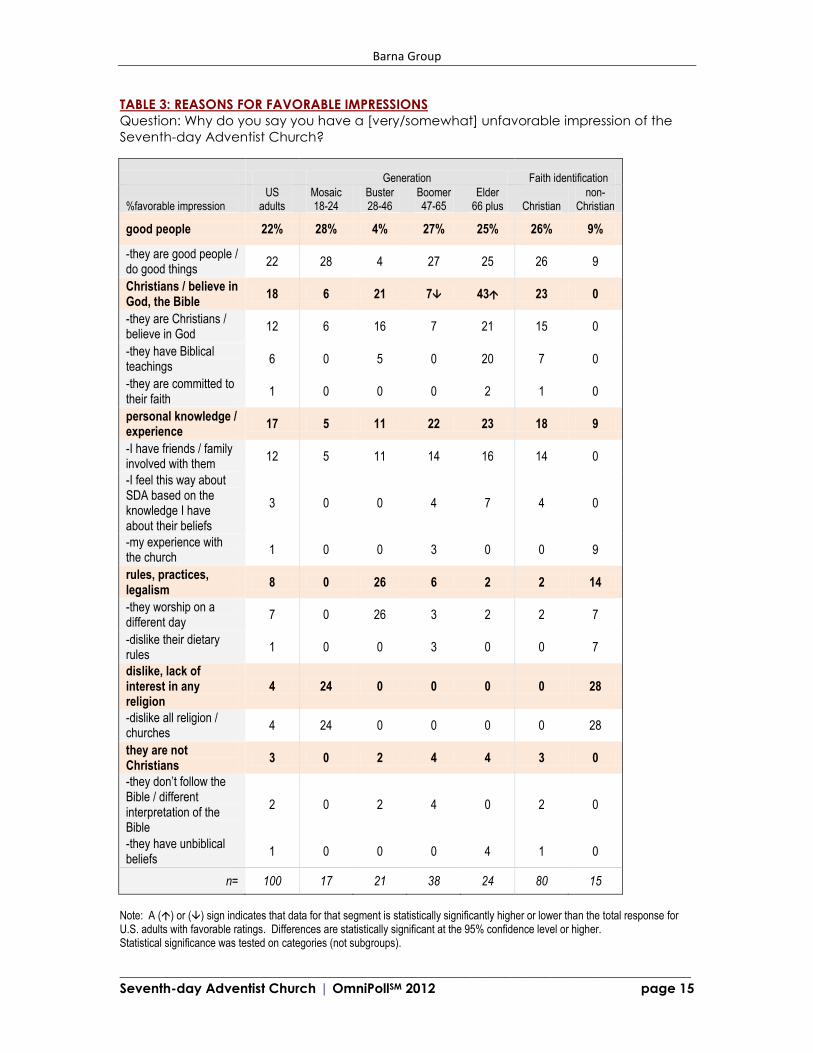
Favorable Impressions
Among adults with favorable opinions, one in five (22%) say it is because those in the
church are good people or people who do good things. Nearly the same proportion (18%)
hold the church in high regard because those who go there are Christians or because they
believe in God or the Bible. Some note that those in the Seventh-day Adventist Church
are committed to their faith.
A total of 17% of these adults have favorable opinions based on their own personal
knowledge or experience, while 8% think favorably of the rules or practices of the
church.
[Note: A few of the reasons for favorable impressions (noted on the chart and tables that follow) might
initially appear negative. One possible explanation is that they were the reasons for a “somewhat
favorable” instead of a “very favorable” rating for the church.]
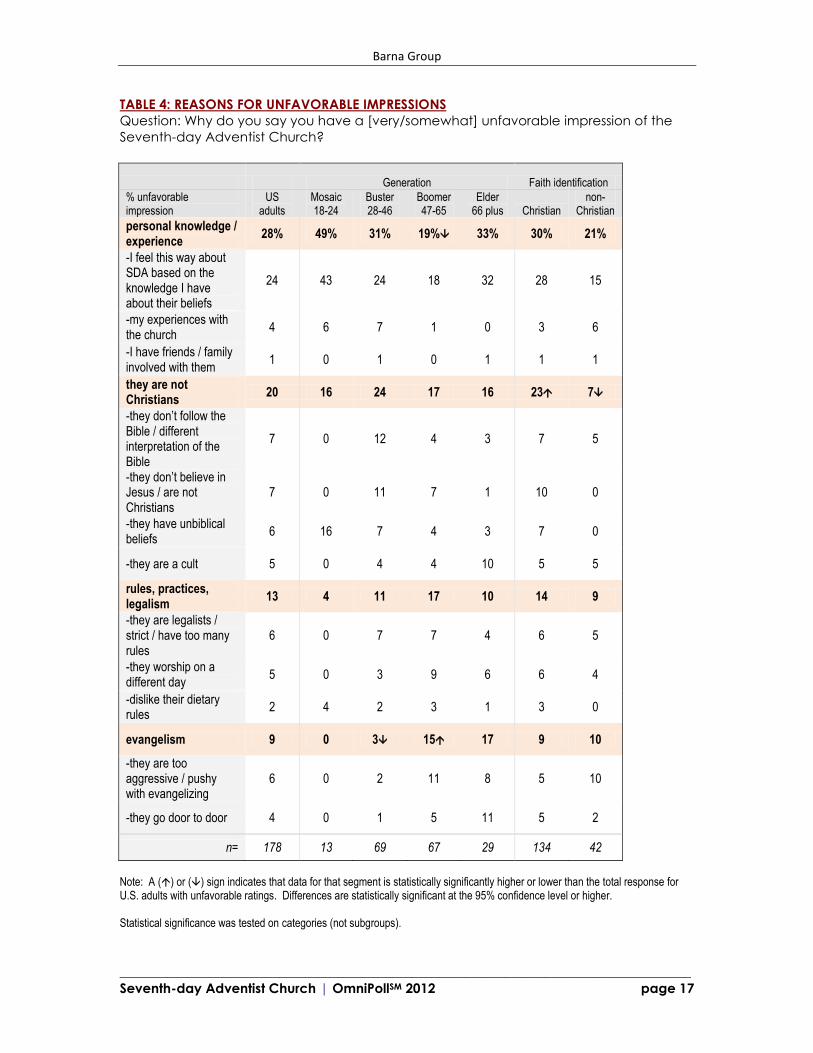
Unfavorable Impressions
Self-reported personal knowledge or experience is also the primary reason for
unfavorable impressions of the Seventh-day Adventist Church. More than one in four of
those who gave the church a negative rating (28%) cited this reason.
One in five of those who don’t have a favorable impression (20%) think the church (or
members): are not Christians, do not follow the Bible, have a different interpretation of
the Bible or “unbiblical beliefs,” do not believe in Jesus, or are “a cult.”
A total of 13% say the church has too many rules or is legalistic. These adults also
commented on the church being strict, having worship on a “different day”, or expressed
dislike for the dietary rules.
Evangelism was noted by one in eleven adults with a negative impression of the Seventh-
day Adventist Church (9%) – especially when it is done “door-to-door”. It is perceived
as too pushy or aggressive. Another 7% say that those in the church do not act like
Christians and remarked about judgmental, narrow-minded, hypocritical, and misleading
behavior.
One in 12 of these adults (8%) say they have a lack of interest or a dislike for any religion
at all (i.e., it was not specific to a church).
Barna Group
______________________________________________________________________________________
Seventh-day Adventist Church | OmniPollSM 2012 page 14
Reasons for Specific Impressions
of Seventh-day Adventist Church among U.S. adults with favorable or unfavorable opinions
multiple responses allowed
15%
9%
20%
8%
13%
28%
1%
0%
21%
1%
2%
3%
4%
8%
17%
18%
22%
7%
0% 20% 40% 60% 80% 100%
all miscellaneous
responses
combined
behavior, do not
act like Christians
evangelism
they are not
Christians/
believers
dislike/lack interest
in any religion
rules, practices,
legalism
personal
knowledge/
experience
are Christians,
believe in
God/Bible
are good people
very/somewhat
favorable (n=100)
very/somewhat
unfavorable (n=178)
Barna Group
______________________________________________________________________________________
Seventh-day Adventist Church | OmniPollSM 2012 page 15
TABLE 3: REASONS FOR FAVORABLE IMPRESSIONS
Question: Why do you say you have a [very/somewhat] unfavorable impression of the
Seventh-day Adventist Church?
Generation Faith identification
%favorable impression US
adults Mosaic 18-24
Buster 28-46
Boomer 47-65
Elder 66 plus Christian
non-Christian
good people 22% 28% 4% 27% 25% 26% 9%
-they are good people / do good things
22 28 4 27 25 26 9
Christians / believe in God, the Bible
18 6 21 7 43 23 0
-they are Christians / believe in God
12 6 16 7 21 15 0
-they have Biblical teachings
6 0 5 0 20 7 0
-they are committed to their faith
1 0 0 0 2 1 0
personal knowledge / experience
17 5 11 22 23 18 9
-I have friends / family involved with them
12 5 11 14 16 14 0
-I feel this way about SDA based on the knowledge I have about their beliefs
3 0 0 4 7 4 0
-my experience with the church
1 0 0 3 0 0 9
rules, practices, legalism
8 0 26 6 2 2 14
-they worship on a different day
7 0 26 3 2 2 7
-dislike their dietary rules
1 0 0 3 0 0 7
dislike, lack of interest in any religion
4 24 0 0 0 0 28
-dislike all religion / churches
4 24 0 0 0 0 28
they are not Christians
3 0 2 4 4 3 0
-they don’t follow the Bible / different interpretation of the Bible
2 0 2 4 0 2 0
-they have unbiblical beliefs
1 0 0 0 4 1 0
n= 100 17 21 38 24 80 15
Note: A () or () sign indicates that data for that segment is statistically significantly higher or lower than the total response for U.S. adults with favorable ratings. Differences are statistically significant at the 95% confidence level or higher. Statistical significance was tested on categories (not subgroups).
Barna Group
______________________________________________________________________________________
Seventh-day Adventist Church | OmniPollSM 2012 page 16
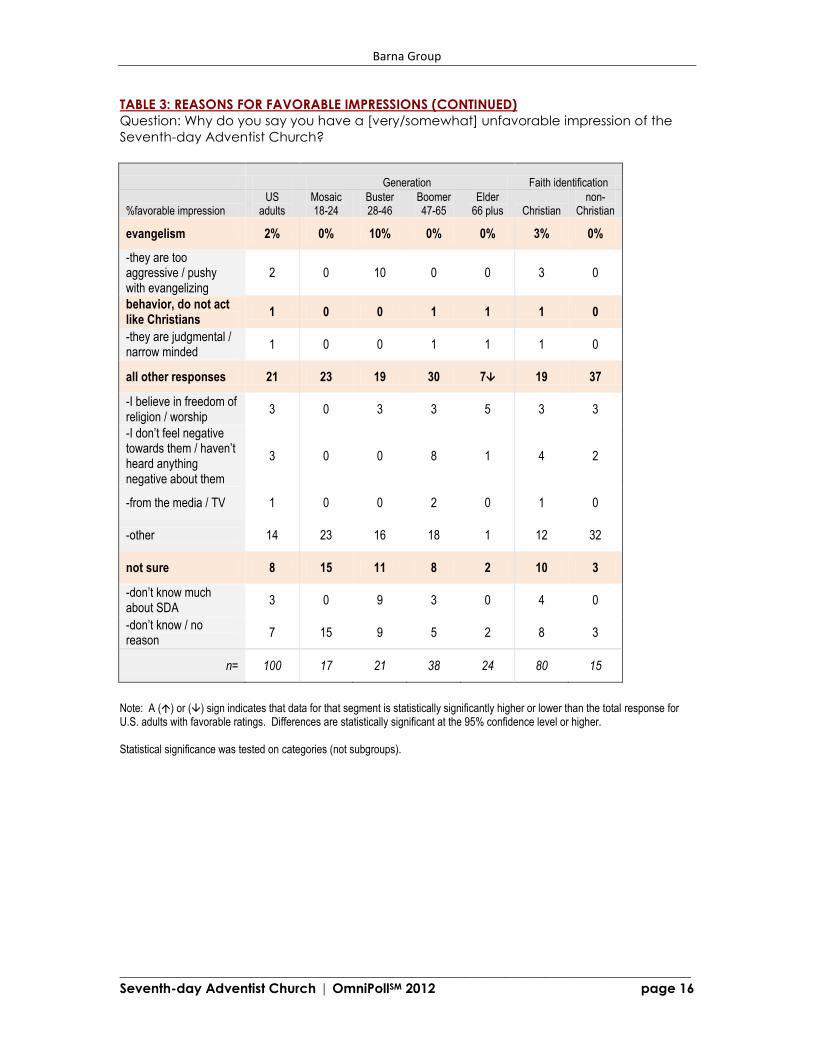
TABLE 3: REASONS FOR FAVORABLE IMPRESSIONS (CONTINUED)
Question: Why do you say you have a [very/somewhat] unfavorable impression of the
Seventh-day Adventist Church?
Generation Faith identification
%favorable impression US
adults Mosaic 18-24
Buster 28-46
Boomer 47-65
Elder 66 plus Christian
non-Christian
evangelism 2% 0% 10% 0% 0% 3% 0%
-they are too aggressive / pushy with evangelizing
2 0 10 0 0 3 0
behavior, do not act like Christians
1 0 0 1 1 1 0
-they are judgmental / narrow minded
1 0 0 1 1 1 0
all other responses 21 23 19 30 7 19 37
-I believe in freedom of religion / worship
3 0 3 3 5 3 3
-I don’t feel negative towards them / haven’t heard anything negative about them
3 0 0 8 1 4 2
-from the media / TV 1 0 0 2 0 1 0
-other 14 23 16 18 1 12 32
not sure 8 15 11 8 2 10 3
-don’t know much about SDA
3 0 9 3 0 4 0
-don’t know / no reason
7 15 9 5 2 8 3
n= 100 17 21 38 24 80 15
Note: A () or () sign indicates that data for that segment is statistically significantly higher or lower than the total response for U.S. adults with favorable ratings. Differences are statistically significant at the 95% confidence level or higher. Statistical significance was tested on categories (not subgroups).
Barna Group
______________________________________________________________________________________
Seventh-day Adventist Church | OmniPollSM 2012 page 17
TABLE 4: REASONS FOR UNFAVORABLE IMPRESSIONS
Question: Why do you say you have a [very/somewhat] unfavorable impression of the
Seventh-day Adventist Church?
Generation Faith identification
% unfavorable impression
US adults
Mosaic 18-24
Buster 28-46
Boomer 47-65
Elder 66 plus Christian
non-Christian
personal knowledge / experience
28% 49% 31% 19% 33% 30% 21%
-I feel this way about SDA based on the knowledge I have about their beliefs
24 43 24 18 32 28 15
-my experiences with the church
4 6 7 1 0 3 6
-I have friends / family involved with them
1 0 1 0 1 1 1
they are not Christians
20 16 24 17 16 23 7
-they don’t follow the Bible / different interpretation of the Bible
7 0 12 4 3 7 5
-they don’t believe in Jesus / are not Christians
7 0 11 7 1 10 0
-they have unbiblical beliefs
6 16 7 4 3 7 0
-they are a cult 5 0 4 4 10 5 5
rules, practices, legalism
13 4 11 17 10 14 9
-they are legalists / strict / have too many rules
6 0 7 7 4 6 5
-they worship on a different day
5 0 3 9 6 6 4
-dislike their dietary rules
2 4 2 3 1 3 0
evangelism 9 0 3 15 17 9 10
-they are too aggressive / pushy with evangelizing
6 0 2 11 8 5 10
-they go door to door 4 0 1 5 11 5 2
n= 178 13 69 67 29 134 42
Note: A () or () sign indicates that data for that segment is statistically significantly higher or lower than the total response for U.S. adults with unfavorable ratings. Differences are statistically significant at the 95% confidence level or higher. Statistical significance was tested on categories (not subgroups).

Barna Group
______________________________________________________________________________________
Seventh-day Adventist Church | OmniPollSM 2012 page 18
TABLE 4: REASONS FOR UNFAVORABLE IMPRESSIONS (CONTINUED)
Question: Why do you say you have a [very/somewhat] unfavorable impression of the
Seventh-day Adventist Church?
Generation Faith identification
% unfavorable impression
US adults
Mosaic 18-24
Buster 28-46
Boomer 47-65
Elder 66 plus Christian
non-Christian
dislike, lack of interest in any religion
8% 5% 7% 10% 8% 1% 29%
-dislike all religion churches
6 5 7 4 5 0 22
-I’m not interested in religion
3 0 0 6 3 1 8
behavior, do not act like Christians
7 15 9 3 6 6 8
-they are extremists / radicals / fanatics
4 15 5 2 0 4 5
-they are hypocrites / frauds / misleading
2 0 2 * 3 2 *
-they are judgmental / narrow minded
1 0 2 1 3 1 2
Christians / believe in God, the Bible
1 0 3 0 2 1 1
-they are Christians / believe in God
1 0 3 0 0 1 0
-they have Biblical teachings
* 0 0 0 2 0 1
all other responses 15 9 20 14 9 14 19
-from the media / TV 1 0 2 0 0 1 0
-other 14 9 18 14 9 13 19
not sure 5 1 1 8 9 6 0
-don’t know / no reason
3 0 1 6 3 4 0
-don’t know much about SDA
1 1 0 1 4 2 *
n= 178 13 69 67 29 134 42
* indicates less than one-half of one percent Note: A () or () sign indicates that data for that segment is statistically significantly higher or lower than the total response for U.S. adults with unfavorable ratings. Differences are statistically significant at the 95% confidence level or higher. Statistical significance was tested on categories (not subgroups).
Barna Group
______________________________________________________________________________________
Seventh-day Adventist Church | OmniPollSM 2012 page 19
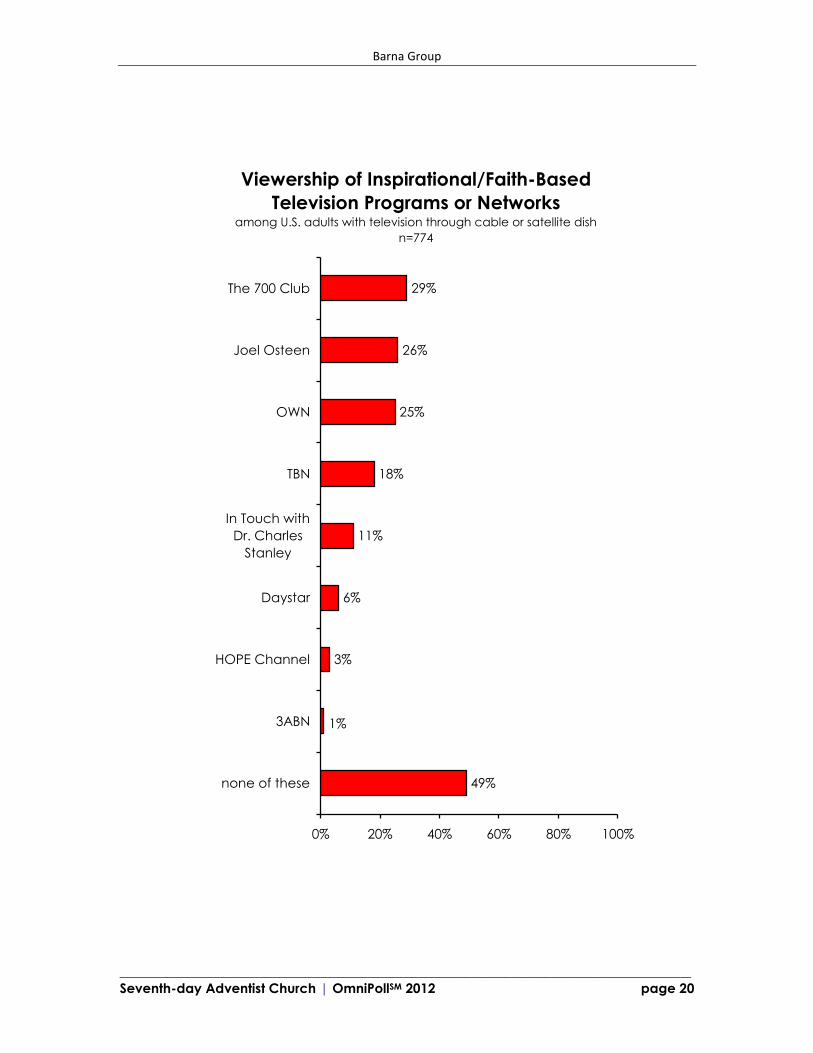
Viewership of Faith-Based Television Networks and Programs
Based on this study, more than three out of every four adults (77%) receive their
television service through cable or satellite dish. Those adults who receive their television
service by cable or satellite were asked whether or not they had seen or watched the
HOPE Channel or 3ABN (Three Angels Broadcasting Network). To provide some
additional context for these findings, other faith-based or inspirational networks and
programs were also assessed.
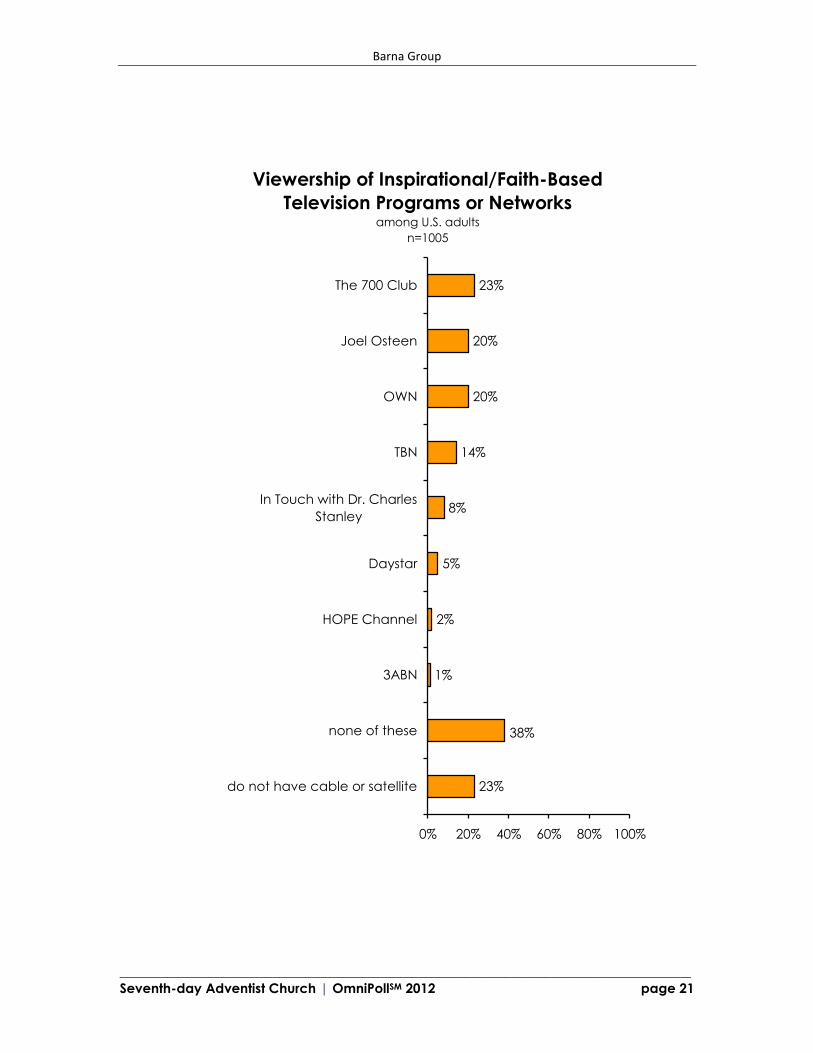
Of the eight programs and networks included in this series, the HOPE Channel (at 3%)
and 3ABN (at 1%) have the lowest levels of viewership among adults with television
access through cable or satellite dish. (When calculated among the base of U.S. adults,
HOPE Channel holds a 2% share, while 3ABN maintains a 1% share.)
The most frequently viewed programs among those assessed included The 700 Club
(29%) and Joel Osteen (26%). The most-watched networks are OWN, the Oprah Winfrey
Network, seen by one in four of these adults (25%), and TBN, the Trinity Broadcasting
Network (18%).
One in nine cable or satellite television viewers (11%) have watched In Touch with Dr.
Charles Stanley, while 6% have seen Daystar.
One-half of these adults have not watched any faith-based or inspirational programming.
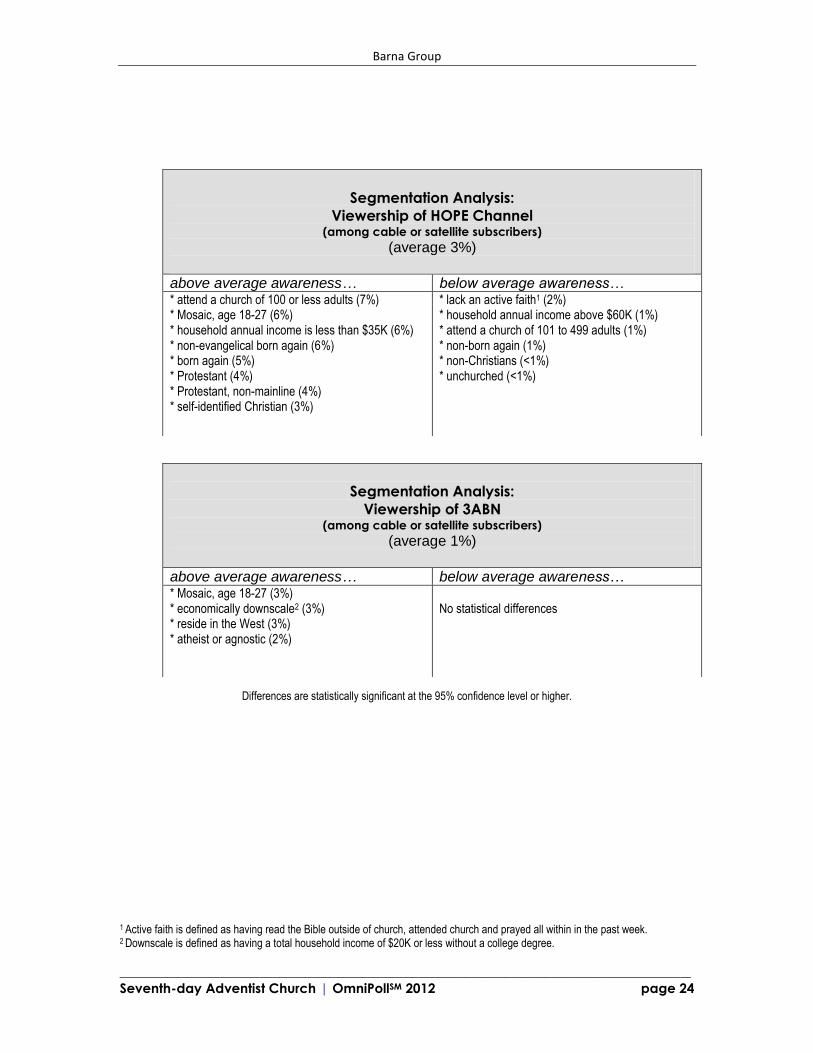
Those adults more likely than average to watch the HOPE Channel include: those
attending a small church, young adults (Mosaics, ages 18 to 27), those with a lower total
household income, born again Christians, Protestants, and self-identified Christians.
Cable or satellite television viewers who are more inclined to watch 3ABN include:
young adults (Mosaics, ages 18 to 27), those who are economically downscale (i.e., with
total household income under $20,000 and no college degree), residents in the western
U.S., and those with no religious faith (i.e., atheists and agnostics).
Barna Group
______________________________________________________________________________________
Seventh-day Adventist Church | OmniPollSM 2012 page 20
Viewership of Inspirational/Faith-Based
Television Programs or Networks among U.S. adults with television through cable or satellite dish
n=774
49%
3%
6%
11%
18%
25%
26%
29%
1%
0% 20% 40% 60% 80% 100%
none of these
3ABN
HOPE Channel
Daystar
In Touch with
Dr. Charles
Stanley
TBN
OWN
Joel Osteen
The 700 Club
Barna Group
______________________________________________________________________________________
Seventh-day Adventist Church | OmniPollSM 2012 page 21
Viewership of Inspirational/Faith-Based
Television Programs or Networks among U.S. adults
n=1005
23%
1%
2%
5%
8%
14%
20%
20%
23%
38%
0% 20% 40% 60% 80% 100%
do not have cable or satellite
none of these
3ABN
HOPE Channel
Daystar
In Touch with Dr. Charles
Stanley
TBN
OWN
Joel Osteen
The 700 Club
Barna Group
______________________________________________________________________________________
Seventh-day Adventist Church | OmniPollSM 2012 page 22
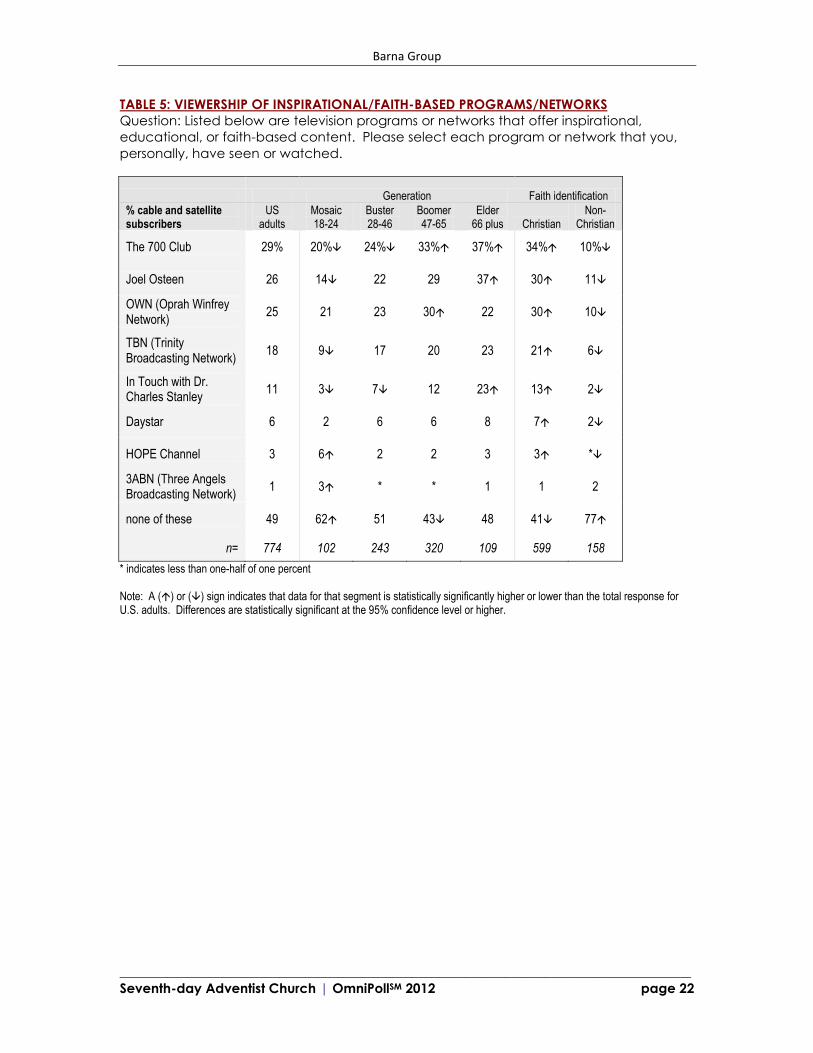
TABLE 5: VIEWERSHIP OF INSPIRATIONAL/FAITH-BASED PROGRAMS/NETWORKS
Question: Listed below are television programs or networks that offer inspirational,
educational, or faith-based content. Please select each program or network that you,
personally, have seen or watched.
Generation Faith identification
% cable and satellite subscribers
US adults
Mosaic 18-24
Buster 28-46
Boomer 47-65
Elder 66 plus Christian
Non-Christian
The 700 Club 29% 20% 24% 33% 37% 34% 10%
Joel Osteen 26 14 22 29 37 30 11
OWN (Oprah Winfrey Network)
25 21 23 30 22 30 10
TBN (Trinity Broadcasting Network)
18 9 17 20 23 21 6
In Touch with Dr. Charles Stanley
11 3 7 12 23 13 2
Daystar 6 2 6 6 8 7 2
HOPE Channel 3 6 2 2 3 3 *
3ABN (Three Angels Broadcasting Network)
1 3 * * 1 1 2
none of these 49 62 51 43 48 41 77
n= 774 102 243 320 109 599 158
* indicates less than one-half of one percent Note: A () or () sign indicates that data for that segment is statistically significantly higher or lower than the total response for U.S. adults. Differences are statistically significant at the 95% confidence level or higher.
Barna Group
______________________________________________________________________________________
Seventh-day Adventist Church | OmniPollSM 2012 page 23
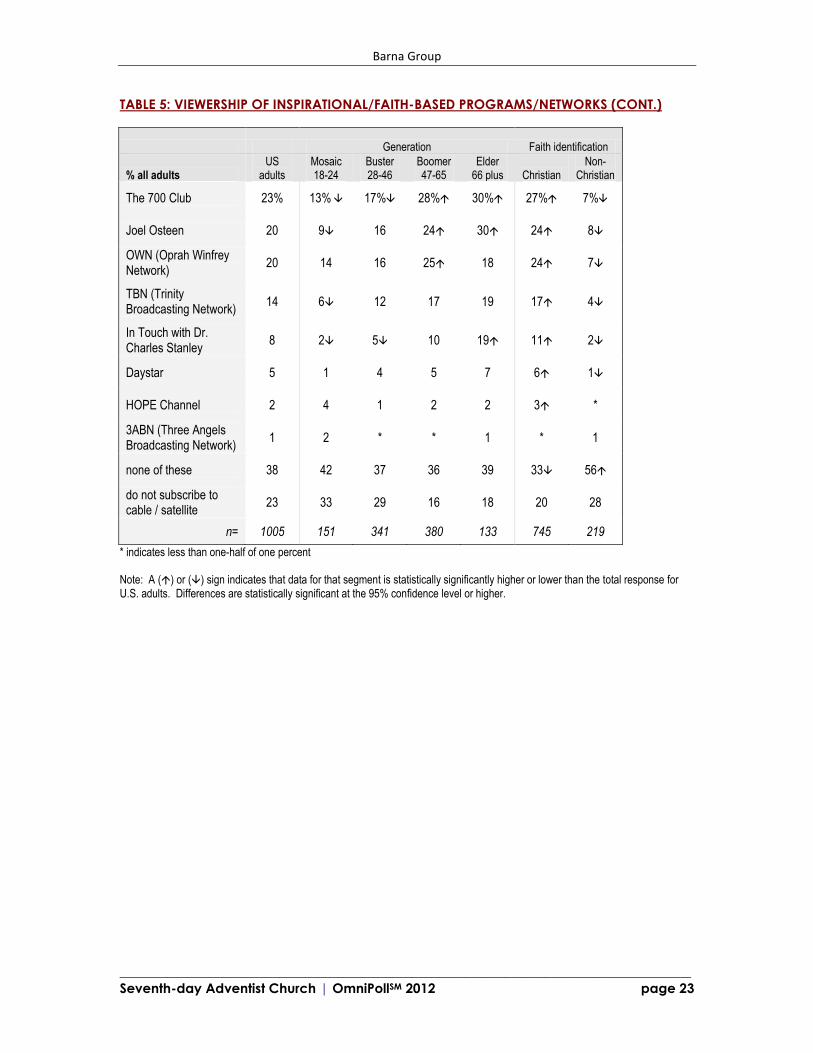
TABLE 5: VIEWERSHIP OF INSPIRATIONAL/FAITH-BASED PROGRAMS/NETWORKS (CONT.)
Generation Faith identification
% all adults US
adults Mosaic 18-24
Buster 28-46
Boomer 47-65
Elder 66 plus Christian
Non-Christian
The 700 Club 23% 13% 17% 28% 30% 27% 7%
Joel Osteen 20 9 16 24 30 24 8
OWN (Oprah Winfrey Network)
20 14 16 25 18 24 7
TBN (Trinity Broadcasting Network)
14 6 12 17 19 17 4
In Touch with Dr. Charles Stanley
8 2 5 10 19 11 2
Daystar 5 1 4 5 7 6 1
HOPE Channel 2 4 1 2 2 3 *
3ABN (Three Angels Broadcasting Network)
1 2 * * 1 * 1
none of these 38 42 37 36 39 33 56
do not subscribe to cable / satellite
23 33 29 16 18 20 28
n= 1005 151 341 380 133 745 219
* indicates less than one-half of one percent Note: A () or () sign indicates that data for that segment is statistically significantly higher or lower than the total response for U.S. adults. Differences are statistically significant at the 95% confidence level or higher.
Barna Group
______________________________________________________________________________________
Seventh-day Adventist Church | OmniPollSM 2012 page 24
Differences are statistically significant at the 95% confidence level or higher.
1 Active faith is defined as having read the Bible outside of church, attended church and prayed all within in the past week. 2 Downscale is defined as having a total household income of $20K or less without a college degree.
Segmentation Analysis: Viewership of HOPE Channel
(among cable or satellite subscribers)
(average 3%)
above average awareness… below average awareness… * attend a church of 100 or less adults (7%) * Mosaic, age 18-27 (6%) * household annual income is less than $35K (6%) * non-evangelical born again (6%) * born again (5%) * Protestant (4%) * Protestant, non-mainline (4%) * self-identified Christian (3%)
* lack an active faith1 (2%) * household annual income above $60K (1%) * attend a church of 101 to 499 adults (1%) * non-born again (1%) * non-Christians (<1%) * unchurched (<1%)
Segmentation Analysis: Viewership of 3ABN
(among cable or satellite subscribers)
(average 1%)
above average awareness… below average awareness… * Mosaic, age 18-27 (3%) * economically downscale2 (3%) * reside in the West (3%) * atheist or agnostic (2%)
No statistical differences
Barna Group
______________________________________________________________________________________
Seventh-day Adventist Church | OmniPollSM 2012 page 25
A P P E N D I X

Barna Group
______________________________________________________________________________________
Seventh-day Adventist Church | OmniPollSM 2012 page 26
R E S E A R C H Q U E S T I O N S
1. Which of the following best describes your impression of the Seventh-day Adventist
Church?
1. very favorable
2. somewhat favorable
3. somewhat unfavorable
4. very unfavorable
5. heard of, not sure how favorable
6. never heard of
2. Why do you say you have a [INSERT RESPONSE] impression of the Seventh-day
Adventist Church?
3. Listed below are television programs or networks that offer inspirational, educational,
or faith-based content. Please select each program or network that you, personally,
have seen or watched.
1. HOPE Channel
2. 3ABN (Three Angels Broadcasting Network)
3. TBN (Trinity Broadcasting Network)
4. Daystar
5. OWN (Oprah Winfrey Network)
6. Joel Osteen
7. In Touch with Dr. Charles Stanley
8. The 700 Club
Barna Group
______________________________________________________________________________________
Seventh-day Adventist Church | OmniPollSM 2012 page 27
S T U D Y M E T H O D O L O G Y
The OmniPollSM
included 1,005 online surveys conducted among a representative sample
of adults, ages 18 and older, throughout the United States. The survey was conducted
from March 14, 2012 through March 21, 2012. The margin of error for a sample of this
size is +/-3 percentage points, at the 95% confidence level.
This study used an online research panel called KnowledgePanel® based on probability
sampling that covers both the online and offline populations in the U.S. The panel
members are randomly recruited by telephone and by self-administered mail and web
surveys. Households are provided with access to the Internet and hardware if
needed. Unlike other Internet research that covers only individuals with Internet access
who volunteer for research, this process uses a dual sampling frame that includes both
listed and unlisted phone numbers, telephone and non-telephone households, and cell-
phone-only households. The panel is not limited to current Web users or computer
owners. All potential panelists are randomly selected to join the KnowledgePanel;
unselected volunteers are not able to join.
The response rate among these online OmniPollSM
participants was 55%. In every survey
there are a variety of ways in which the accuracy of the data may be affected. The
response rate is one such potential cause of error in measurement: the lower the
response, the less representative the respondents surveyed may be of the population from
which they were drawn, thereby reducing the accuracy of the results. Other sources of
error include question-design bias, question-order bias, sampling error and respondent
deception. Many of these types of errors cannot be accurately estimated. However,
having a high cooperation rate does enhance the reliability of the information procured.
Minimal statistical weighting was used to calibrate the sample to known population
percentages in relation to demographic variables.
Barna Group
______________________________________________________________________________________
Seventh-day Adventist Church | OmniPollSM 2012 page 28
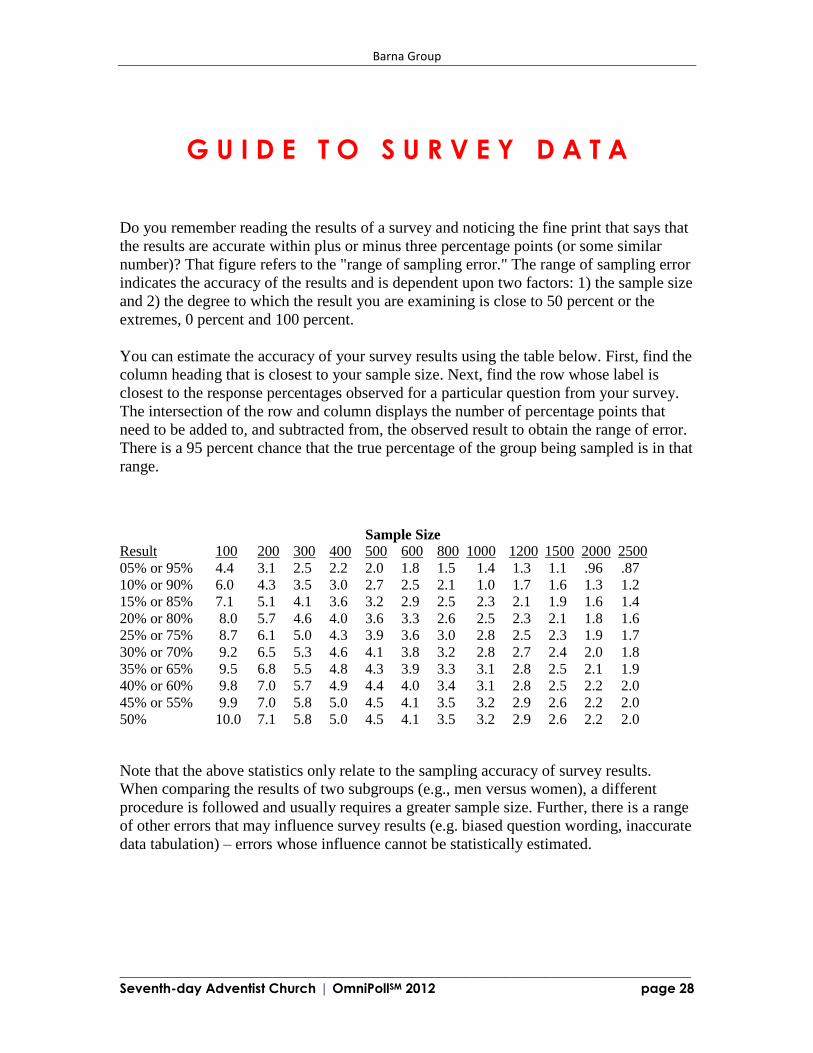
G U I D E T O S U R V E Y D A T A
Do you remember reading the results of a survey and noticing the fine print that says that
the results are accurate within plus or minus three percentage points (or some similar
number)? That figure refers to the "range of sampling error." The range of sampling error
indicates the accuracy of the results and is dependent upon two factors: 1) the sample size
and 2) the degree to which the result you are examining is close to 50 percent or the
extremes, 0 percent and 100 percent.
You can estimate the accuracy of your survey results using the table below. First, find the
column heading that is closest to your sample size. Next, find the row whose label is
closest to the response percentages observed for a particular question from your survey.
The intersection of the row and column displays the number of percentage points that
need to be added to, and subtracted from, the observed result to obtain the range of error.
There is a 95 percent chance that the true percentage of the group being sampled is in that
range.
Sample Size
Result 100 200 300 400 500 600 800 1000 1200 1500 2000 2500
05% or 95% 4.4 3.1 2.5 2.2 2.0 1.8 1.5 1.4 1.3 1.1 .96 .87
10% or 90% 6.0 4.3 3.5 3.0 2.7 2.5 2.1 1.0 1.7 1.6 1.3 1.2
15% or 85% 7.1 5.1 4.1 3.6 3.2 2.9 2.5 2.3 2.1 1.9 1.6 1.4
20% or 80% 8.0 5.7 4.6 4.0 3.6 3.3 2.6 2.5 2.3 2.1 1.8 1.6
25% or 75% 8.7 6.1 5.0 4.3 3.9 3.6 3.0 2.8 2.5 2.3 1.9 1.7
30% or 70% 9.2 6.5 5.3 4.6 4.1 3.8 3.2 2.8 2.7 2.4 2.0 1.8
35% or 65% 9.5 6.8 5.5 4.8 4.3 3.9 3.3 3.1 2.8 2.5 2.1 1.9
40% or 60% 9.8 7.0 5.7 4.9 4.4 4.0 3.4 3.1 2.8 2.5 2.2 2.0
45% or 55% 9.9 7.0 5.8 5.0 4.5 4.1 3.5 3.2 2.9 2.6 2.2 2.0
50% 10.0 7.1 5.8 5.0 4.5 4.1 3.5 3.2 2.9 2.6 2.2 2.0
Note that the above statistics only relate to the sampling accuracy of survey results.
When comparing the results of two subgroups (e.g., men versus women), a different
procedure is followed and usually requires a greater sample size. Further, there is a range
of other errors that may influence survey results (e.g. biased question wording, inaccurate
data tabulation) – errors whose influence cannot be statistically estimated.