Brain-wide pathway for waste clearance · Brain-wide pathway for waste clearance captured by...
12
Brain-wide pathway for waste clearance captured by contrast-enhanced MRI Jeffrey J. Iliff, … , Maiken Nedergaard, Helene Benveniste J Clin Invest. 2013; 123(3):1299-1309. https://doi.org/10.1172/JCI67677. The glymphatic system is a recently defined brain-wide paravascular pathway for cerebrospinal fluid (CSF) and interstitial fluid (ISF) exchange that facilitates efficient clearance of solutes and waste from the brain. CSF enters the brain along para-arterial channels to exchange with ISF, which is in turn cleared from the brain along para-venous pathways. Because soluble amyloid b clearance depends on glymphatic pathway function, we proposed that failure of this clearance system contributes to amyloid plaque deposition and Alzheimer’s disease progression. Here we provide proof of concept that glymphatic pathway function can be measured using a clinically relevant imaging technique. Dynamic contrast-enhanced MRI was used to visualize CSF-ISF exchange across the rat brain following intrathecal paramagnetic contrast agent administration. Key features of glymphatic pathway function were confirmed, including visualization of para-arterial CSF influx and molecular size-dependent CSF-ISF exchange. Whole-brain imaging allowed the identification of two key influx nodes at the pituitary and pineal gland recesses, while dynamic MRI permitted the definition of simple kinetic parameters to characterize glymphatic CSF-ISF exchange and solute clearance from the brain. We propose that this MRI approach may provide the basis for a wholly new strategy to evaluate Alzheimer’s disease susceptibility and progression in the live human brain. Technical Advance Neuroscience Find the latest version: http://jci.me/67677-pdf
Transcript of Brain-wide pathway for waste clearance · Brain-wide pathway for waste clearance captured by...

Brain-wide pathway for waste clearancecaptured by contrast-enhanced MRI
Jeffrey J. Iliff, … , Maiken Nedergaard, Helene Benveniste
J Clin Invest. 2013;123(3):1299-1309. https://doi.org/10.1172/JCI67677.
The glymphatic system is a recently defined brain-wide paravascular pathway forcerebrospinal fluid (CSF) and interstitial fluid (ISF) exchange that facilitates efficientclearance of solutes and waste from the brain. CSF enters the brain along para-arterialchannels to exchange with ISF, which is in turn cleared from the brain along para-venouspathways. Because soluble amyloid b clearance depends on glymphatic pathway function,we proposed that failure of this clearance system contributes to amyloid plaque depositionand Alzheimer’s disease progression. Here we provide proof of concept that glymphaticpathway function can be measured using a clinically relevant imaging technique. Dynamiccontrast-enhanced MRI was used to visualize CSF-ISF exchange across the rat brainfollowing intrathecal paramagnetic contrast agent administration. Key features of glymphaticpathway function were confirmed, including visualization of para-arterial CSF influx andmolecular size-dependent CSF-ISF exchange. Whole-brain imaging allowed theidentification of two key influx nodes at the pituitary and pineal gland recesses, whiledynamic MRI permitted the definition of simple kinetic parameters to characterizeglymphatic CSF-ISF exchange and solute clearance from the brain. We propose that thisMRI approach may provide the basis for a wholly new strategy to evaluate Alzheimer’sdisease susceptibility and progression in the live human brain.
Technical Advance Neuroscience
Find the latest version:
http://jci.me/67677-pdf

Technical advance
The Journal of Clinical Investigation http://www.jci.org Volume 123 Number 3 March 2013 1299
Brain-wide pathway for waste clearance captured by contrast-enhanced MRI
Jeffrey J. Iliff,1 Hedok Lee,2 Mei Yu,2 Tian Feng,3 Jean Logan,4,5 Maiken Nedergaard,1 and Helene Benveniste2,5
1Center for Translational Neuromedicine, Department of Neurosurgery, University of Rochester Medical Center, Rochester, New York, USA. 2Department of Anesthesiology and 3Department of Applied Mathematics and Statistics, Stony Brook University, Stony Brook, New York, USA.
4Biosciences Department, Brookhaven National Laboratory, Upton, New York, USA. 5Department of Radiology, Stony Brook Medicine, Stony Brook, New York, USA.
The glymphatic system is a recently defined brain-wide paravascular pathway for cerebrospinal fluid (CSF) and interstitial fluid (ISF) exchange that facilitates efficient clearance of solutes and waste from the brain. CSF enters the brain along para-arterial channels to exchange with ISF, which is in turn cleared from the brain along para-venous pathways. Because soluble amyloid β clearance depends on glymphatic pathway function, we proposed that failure of this clearance system contributes to amyloid plaque deposition and Alzheimer’s disease progression. Here we provide proof of concept that glymphatic pathway function can be measured using a clinically relevant imaging technique. Dynamic contrast-enhanced MRI was used to visualize CSF-ISF exchange across the rat brain following intrathecal paramagnetic contrast agent administration. Key fea-tures of glymphatic pathway function were confirmed, including visualization of para-arterial CSF influx and molecular size-dependent CSF-ISF exchange. Whole-brain imaging allowed the identification of two key influx nodes at the pituitary and pineal gland recesses, while dynamic MRI permitted the definition of simple kinetic parameters to characterize glymphatic CSF-ISF exchange and solute clearance from the brain. We pro-pose that this MRI approach may provide the basis for a wholly new strategy to evaluate Alzheimer’s disease susceptibility and progression in the live human brain.
IntroductionIn the classical model, cerebrospinal fluid (CSF) is actively secreted by the choroid plexus of the cerebral ventricles and travels by bulk or pulsatile flow through the ventricular system, flowing from the fourth ventricle into the subarachnoid space through the foramina of Luschka and the foramen of Magendie. From the subarachnoid space, CSF is thought to be reabsorbed into the blood stream either via arachnoid granulations of the dural sinuses or by passing out of the cranial cavity along cranial nerve sheathes to be eliminated through the cervical lymphatics (1, 2). Fluid movement along this CSF column is commonly measured by MRI. Phase-contrast MRI allows the visualization of CSF flow dynamics and is used clini-cally in the evaluation of communicating versus noncommunicat-ing hydrocephalus, normal pressure hydrocephalus, and arachnoid cysts (3). Contrast-enhanced magnetic resonance cisternography can also be used to identify CSF leaks in the treatment of sponta-neous intracranial hypotension or CSF rhinorrhea (4, 5).
In a recent study (6), we reported that, contrary to the textbook model of CSF secretion and reabsorption, a large proportion of subarachnoid CSF recirculates through the brain parenchyma along paravascular spaces and exchanges with the interstitial fluid (ISF) (a process referred to herein as CSF-ISF exchange). The flow of fluid along these paravascular routes and through the intersti-tium is supported by transglial water movement through astro-cytic aquaporin-4 (AQP4) water channels and facilitates the effi-cient clearance of interstitial solutes, including soluble amyloid β, from the brain parenchyma. Our initial description of this path-way, which we term the glymphatic system, was based upon in vivo
2-photon and ex vivo fluorescence imaging (6). Analysis of ex vivo brain slices suggested that this pathway represented a brain-wide anatomical system to facilitate the efficient clearance of interstitial solutes and wastes; however, the limitations of fluorescence-based imaging modalities prevented the direct assessment of brain-wide CSF-ISF flow dynamics in a 3D manner.
In this study, we use contrast-enhanced MRI to visualize brain-wide subarachnoid CSF-ISF exchange in the live rat brain. We first confirm the key characteristics of the pathway described in our initial study (6), including the bulk flow–dependent influx of subarachnoid CSF tracer along para-arterial routes and move-ment of tracer into and through the brain parenchyma. We use the inherent 3D nature of MRI, in combination with various pro-cessing modalities including cluster analysis, to map the CSF-ISF exchange pathway across the brain over time and to identify key anatomical influx “nodes” and clearance routes from the brain parenchyma. Most importantly, we define simple kinetic param-eters that describe the influx and clearance of the paramagnetic contrast agents throughout the brain volume. In light of the key role that this pathway plays in soluble amyloid β clearance from the brain parenchyma (6), we propose that this contrast-enhanced MRI quantification approach may provide the basis for a wholly new strategy for evaluating Alzheimer’s disease (AD) susceptibility and disease progression.
ResultsAll rats included in the study remained physiologically stable dur-ing the 6-hour imaging experiment, with respiratory rates in the range of 50 to 60 breaths per minute, O2 saturation of approxi-mately 98%–100%, heart rates of approximately 300–370 beats per minute, and body temperature of 36.5°C to 37.5°C. Several major
Conflict of interest: The authors have declared that no conflict of interest exists.
Citation for this article: J Clin Invest. 2013;123(3):1299–1309. doi:10.1172/JCI67677.
Related Commentary, page 1013
technical advance
1300 The Journal of Clinical Investigation http://www.jci.org Volume 123 Number 3 March 2013
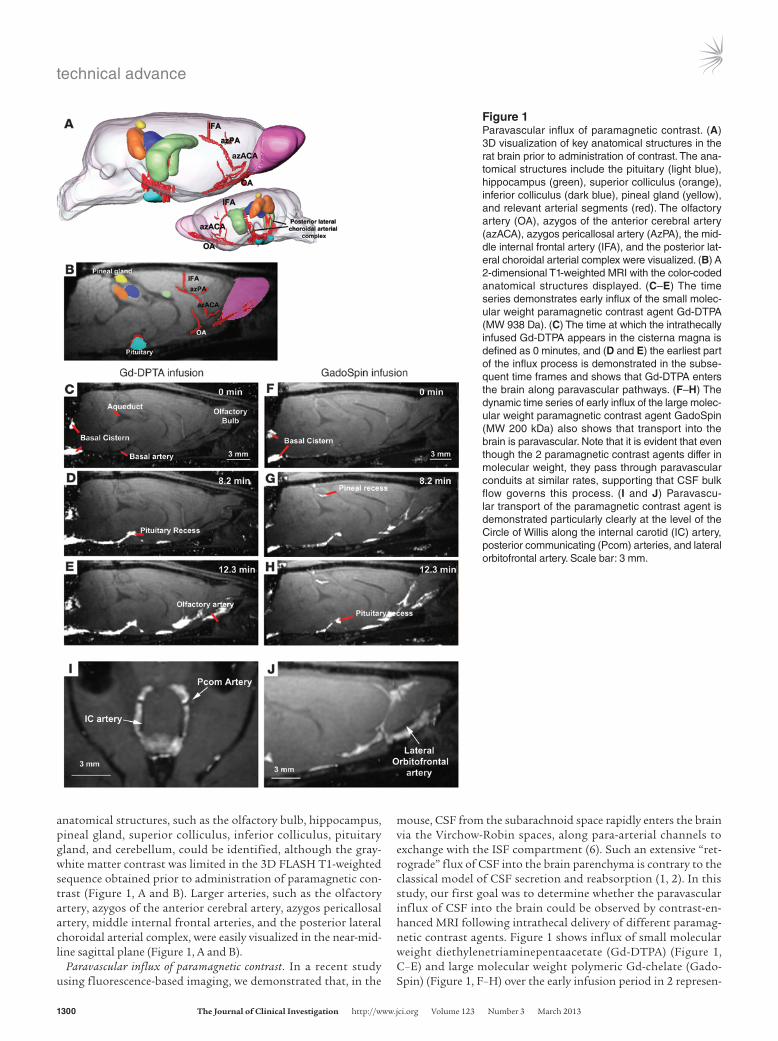
mouse, CSF from the subarachnoid space rapidly enters the brain via the Virchow-Robin spaces, along para-arterial channels to exchange with the ISF compartment (6). Such an extensive “ret-rograde” flux of CSF into the brain parenchyma is contrary to the classical model of CSF secretion and reabsorption (1, 2). In this study, our first goal was to determine whether the paravascular influx of CSF into the brain could be observed by contrast-en-hanced MRI following intrathecal delivery of different paramag-netic contrast agents. Figure 1 shows influx of small molecular weight diethylenetriaminepentaacetate (Gd-DTPA) (Figure 1, C–E) and large molecular weight polymeric Gd-chelate (Gado-Spin) (Figure 1, F–H) over the early infusion period in 2 represen-
anatomical structures, such as the olfactory bulb, hippocampus, pineal gland, superior colliculus, inferior colliculus, pituitary gland, and cerebellum, could be identified, although the gray-white matter contrast was limited in the 3D FLASH T1-weighted sequence obtained prior to administration of paramagnetic con-trast (Figure 1, A and B). Larger arteries, such as the olfactory artery, azygos of the anterior cerebral artery, azygos pericallosal artery, middle internal frontal arteries, and the posterior lateral choroidal arterial complex, were easily visualized in the near-mid-line sagittal plane (Figure 1, A and B).
Paravascular influx of paramagnetic contrast. In a recent study using fluorescence-based imaging, we demonstrated that, in the
Figure 1Paravascular influx of paramagnetic contrast. (A) 3D visualization of key anatomical structures in the rat brain prior to administration of contrast. The ana-tomical structures include the pituitary (light blue), hippocampus (green), superior colliculus (orange), inferior colliculus (dark blue), pineal gland (yellow), and relevant arterial segments (red). The olfactory artery (OA), azygos of the anterior cerebral artery (azACA), azygos pericallosal artery (AzPA), the mid-dle internal frontal artery (IFA), and the posterior lat-eral choroidal arterial complex were visualized. (B) A 2-dimensional T1-weighted MRI with the color-coded anatomical structures displayed. (C–E) The time series demonstrates early influx of the small molec-ular weight paramagnetic contrast agent Gd-DTPA (MW 938 Da). (C) The time at which the intrathecally infused Gd-DTPA appears in the cisterna magna is defined as 0 minutes, and (D and E) the earliest part of the influx process is demonstrated in the subse-quent time frames and shows that Gd-DTPA enters the brain along paravascular pathways. (F–H) The dynamic time series of early influx of the large molec-ular weight paramagnetic contrast agent GadoSpin (MW 200 kDa) also shows that transport into the brain is paravascular. Note that it is evident that even though the 2 paramagnetic contrast agents differ in molecular weight, they pass through paravascular conduits at similar rates, supporting that CSF bulk flow governs this process. (I and J) Paravascu-lar transport of the paramagnetic contrast agent is demonstrated particularly clearly at the level of the Circle of Willis along the internal carotid (IC) artery, posterior communicating (Pcom) arteries, and lateral orbitofrontal artery. Scale bar: 3 mm.

technical advance
The Journal of Clinical Investigation http://www.jci.org Volume 123 Number 3 March 2013 1301
(Supplemental Videos 1 and 2 and Supplemental Methods; sup-plemental material available online with this article; doi:10.1172/JCI67677DS1). For example, signal changes induced by GadoSpin appear and preferentially remain along the para-arterial/paravas-cular conduits, and parenchymal uptake is sparse; while the small molecular weight Gd-DTPA contrast agent has much more diffuse access to the brain parenchyma (compare Supplemental Videos 1 and 2 and see Supplemental Methods). It is also evident that, although the molecular weights of the 2 paramagnetic contrast agents are different, the passage via the paravascular conduits was largely similar from the time the contrast appeared in the cisterna magna (defined as “0 min” in Figure 1, C and F). Some variability
tative rats. The dynamic time series of T1-weighted MRIs clearly revealed the time-dependent anatomical routes of paravascular influx, including (a) arrival of paramagnetic contrast agent in the cisterna magna (Figure 1, C and F) and transport along the basilar artery (Figure 1, D and G), (b) appearance of contrast in the pituitary recess (Figure 1, D and G), (c) continued transport along the olfactory arterial complex and into the olfactory bulb (Figure 1, E and H), and (d) transport via the posterior choroidal arterial complex (Figure 1A) to the pineal recess. The videos of the dynamic time series capturing transport through the glymphatic system of Gd-DTPA and GadoSpin clearly demonstrate the differ-ence in brain-wide distribution of the small and larger molecule
Figure 2Gd-DTPA and GadoSpin transport along glymphatic pathways. The average TACs for Gd-DTPA (blue circles) and GadoSpin (red circles) are shown for the (A) pituitary recess, (B) pineal recess, (C) cerebellum, (D) olfactory bulb, (E) aqueduct, and (F) pontine nucleus. The location of each of the ROIs is shown on the sagittal brain icon displayed in the top right corner of each of the graphs. (A and B) It is evident that contrast uptake in the pituitary recess and pineal recess is largely similar for Gd-DTPA and GadoSpin. This confirms that within the proximal portions of the glymphatic pathway, paramagnetic contrast agent transport is largely independent of molecular size. It is also clear that tissue uptake of Gd-DTPA is markedly higher than that observed for GadoSpin in the (C) cerebellum, (E) aqueduct, and (F) pontine nucleus. This confirms that the movement of contrast agent from the subarachnoid/proximal paravascular pathway into and through the brain interstitium is indeed dependent upon molecular size. Data are presented as mean ± SEM.

technical advance
1302 The Journal of Clinical Investigation http://www.jci.org Volume 123 Number 3 March 2013
conduits, in which contrast uptake was clearly visualized over time. Specifically, ROIs were subdivided into the most proximal glymphatic inflow conduits (i.e., the pituitary recess and pineal recess) and “parenchymal” ROIs, such as the pontine nucleus, cer-ebellum, olfactory bulb, and aqueduct. To compare the relative kinetics within these subregions, average time “activity” curves (TACs) for Gd-DTPA and GadoSpin were calculated and plotted in Figure 2. Within the pituitary recess, the average time courses of signal intensity changes induced by Gd-DTPA and GadoSpin were largely identical over the entire study period (Figure 2A). Similar findings were observed for the pineal recess (Figure 2B). This con-firms that within the proximal portions of the glymphatic path-way, defined as the subarachnoid spaces and proximal paravascu-lar channels, contrast agent access and flux is largely independent of molecular size. In contrast, the average TACs for Gd-DTPA and GadoSpin within the cerebellum (Figure 2C), aqueduct (Figure 2E), and pontine nucleus (Figure 2F) demonstrated clear intra-agent differences in influx rate, time to peak, and efflux rates. In each case, the apparent influx of large molecular weight GadoSpin into these regions lagged considerably behind that of Gd-DTPA. For example, in rats infused with Gd-DTPA, the average uptake in the cerebellum peaked at approximately 90 minutes after injec-tion, whereas in rats infused with GadoSpin, the average cerebellar tissue uptake reached an apparent plateau at approximately 120 minutes after injection.
Mean AUC values (mAUCs), reflecting transit and uptake rates, were also calculated for Gd-DTPA and GadoSpin within each of these regions. At the pituitary recess, mAUCs derived for Gd-DTPA and GadoSpin were 743% ± 266% of signal change per time interval and 685% ± 217% of signal change per time interval, respectively (P = 0.45). As the total amount of paramagnetic contrast passing through the pituitary recess varied among rats within each group, to minimize variability when comparing tissue uptake of para-magnetic contrast within and between groups, all regional mAUCs were normalized to the mAUC of the pituitary recess (representing the most proximal portion of the glymphatic pathway and main “source” of contrast delivery). Table 1 shows the results of the regional mAUC ratio analysis and demonstrates that tissue uptake of Gd-DTPA was significantly higher than that of GadoSpin in the cerebellum, aqueduct, and the pontine nucleus.
As a second nonparametric approach to analyze brain tissue uptake and distribution patterns of Gd-DTPA compared with those of GadoSpin, we performed a cluster analysis on a series of 4 midline sagittal slices at the level of the aqueduct from each ani-mal. The results of this analysis are shown in Figure 3. Four clus-ters (K = 4) were used for optimal visualization of the perivascu-lar conduits. The different clusters were associated with different anatomical areas, including tissue immediately associated with paravascular areas (zone 1), tissue immediately adjacent to zone 1 (zone 2), and the most distally labeled voxels next to zone 2 (zone 3). The distribution pattern of the clusters and correspond-ing zones are shown in Figure 3. As shown in Figure 3B, the par-avascular zone 1 of the GadoSpin rats includes the red and the orange clusters; and as shown in Figure 3, C and D, the green and blue clusters comprise zone 2 and zone 3, respectively, and represent the slower parenchymal glymphatic pathways, such as the olfactory bulb and tissue adjacent to the pituitary recess and pineal recess. The TACs of the 4 clusters from the GadoSpin rat show that the most proximal paravascular conduits (red and orange clusters) are represented by the highest signal changes
exists as to the amount of paramagnetic contrast that appeared in the pineal recess; and no signal changes were observed in the pineal recess in 2 animals injected with Gd-DTPA. However, the paravascular nature of the influx along the glymphatic pathway is clearest at the level of the Circle of Willis, where high intensity sig-nal outlined the exit of the posterior communicating arteries (Fig-ure 1I), as well as along the lateral orbitofrontal artery (Figure 1J).
Based upon the dynamic time series, it is evident that, although Gd-DTPA and GadoSpin differ in molecular weight by more than 2 orders of magnitude, they appear to transit the paravascular con-duits at largely similar rates (Figure 1, C–H). Contrast appeared to move sluggishly through the pineal recess, typically remaining in this cistern even after more than 2 hours of wash out (Supplemen-tal Videos 1 and 2 and Supplemental Methods). The observation that paravascular contrast movement did not appreciably differ based upon agent molecular weight is consistent with bulk flow–mediated fluid transport, which is known to be independent of molecular size (7). Using contrast-enhanced MRI, these data con-firm the first basic finding of our prior study (6), that bulk flow of CSF from the subarachnoid space into the brain parenchyma occurs primarily along para-arterial pathways.
Effect of molecular size on brain-wide Gd-DTPA and GadoSpin trans-port. In our prior study, we reported that, although both small and large molecular weight tracers were able to move along the proximal para-arterial influx pathway, access from the para-arte-rial space into the surrounding brain interstitium was restricted based upon molecular size (6). Specifically, smaller molecular weight tracers, such as Texas Red–conjugated dextran (MW 3 kDa) (TR-d3) or Alexa Fluor 647–conjugated ovalbumin (MW 45 kDa), passed readily into the interstitium, while larger molecular weight tracers, such as FITC-conjugated 2,000-kDa dextran (FITC-d2000, MW 2,000 kDa), remained confined to the paravascular spaces. We surmised that overlapping astrocytic end feet, which completely ensheathe the cerebral microcirculation (8), function to restrict the access of larger molecular weight substances from the intersti-tium (6). Based upon these findings, we predicted that, as a result of better access to the brain interstitium, Gd-DTPA (MW 938 Da) would be expected to induce signal changes (T1 shortening) in a larger total brain tissue volume compared with the larger Gado-Spin (MW 200 kDa) molecule. We tested this hypothesis using different quantitative image processing strategies.
We first measured the total “time exposure” of paramagnetic contrast at key anatomical sites near large paravascular inflow
Table 1Differences in total tissue uptake between rats injected with Gd-DTPA and those injected with GadoSpin
Region Gd-DTPA (n = 8) GadoSpin (n = 6) P value mAUC mAUC Pineal recessA 1.01 ± 0.35 1.13 ± 0.53 0.629Cerebellum 0.28 ± 0.11 0.11 ± 0.08 0.007B
Olfactory bulb 0.24 ± 0.11 0.16 ± 0.06 0.113Aqueduct 0.34 ± 0.23 0.06 ± 0.04 0.012B
Pontine nucleus 0.17 ± 0.09 0.03 ± 0.02 0.002B
A2 rats in the Gd-DTPA group did not have contrast in the pineal recess. The data represent the ratio between the average mAUC of the ana-tomical ROI and the average mAUC of pituitary recess. Results are presented as mean ± SD. BP < 0.05.

technical advance
The Journal of Clinical Investigation http://www.jci.org Volume 123 Number 3 March 2013 1303
of the paravascular red cluster is approximately 90 minutes, which is similar to that observed for the paravascular red cluster of the GadoSpin rat. In other words, paravascular transport of Gd-DTPA and GadoSpin share similar kinetics.
The quantitative results of the cluster analysis for Gd-DTPA and GadoSpin rats are presented in Table 2. This includes the average total number of voxels of each cluster derived from the 4 midsa-gittal brain slices included in the analysis and the AUCs of the 3 different cluster/zone TACs × voxel number product for each cluster/zone. As can be seen from Table 2, the number of voxels allocated to zone 1 (paravascular areas) is within a similar range for Gd-DTPA and GadoSpin rats. However, in the Gd-DTPA rats, the average total number of voxels in zone 3 (blue voxels in Figure 3D) is significantly higher than that observed for GadoSpin rats (blue voxels in Figure 3H; P < 0.05).
To further compare the relationships among clusters within the 2 groups, we calculated the ratio of zone 2’s total time-weighted
(>300% signal change from baseline) when compared with the green and blue clusters, and, furthermore, that they represent the smallest compartment (Figure 3I).
In the Gd-DTPA rats, the cluster analysis similarly resulted in clusters distributed among 3 major anatomical zones; however, it included more brain tissue overall when compared with that of GadoSpin rats. As shown in Figure 3, in the Gd-DTPA rat, the red clusters are located in paravascular conduits, as observed for GadoSpin rats (compare Figure 3B and Figure 3F), and the green clusters are associated with deeper tissue areas, such as the olfactory bulb and cerebellum (Figure 3G). However, in contrast to GadoSpin rats, the blue cluster voxels of the Gd-DTPA rats included most of the cerebellum and pontine nucleus (Figure 3, G and H), suggesting that the large molecular weight GadoSpin does not gain access to the brain interstitial space as readily as the small molecular weight Gd-DTPA. The TACs of the 4 different clusters from the Gd-DTPA rat are shown in Figure 3J. The time to peak
Figure 3Cluster-based spatial distribution of Gd-DTPA and GadoSpin in the rat brain. (A) T1-weighted sagittal midline section at the level of the aqueduct (Aq), with anatomical landmarks displayed prior to administra-tion of GadoSpin. BA, basal artery; BC, basal cistern; Cb, cerebellum; GA, vein of Galen; Ob, olfactory bulb; Pin, pineal gland; Pit, pituitary gland. (B) Cluster analysis in GadoSpin rat. The paravascular cluster is overlaid on the corresponding MRI, demonstrating that the red and orange clusters match the spatial location of the basal cistern, pineal recess and pitu-itary recess, and tissue in the immediate vicinity of the major arteries. (C) Distribution of blue and green clusters from the same GadoSpin rat, demonstrating the more parenchymal location of these clusters. (D) All clusters displayed simultaneously and overlaid on the MRI. The red and orange clusters in the para-vascular conduits are classified as zone 1, the green cluster is classified as zone 2, and the blue cluster is classified as zone 3. (E) T1-weighted MRI at the level of the aqueduct, with anatomical landmarks dis-played from a rat prior to administration of Gd-DTPA. (F) Paravascular, zone 1 cluster displayed from the Gd-DTPA rat. (G) Green and blue cluster distribution in the Gd-DTPA rat. (H) All 4 clusters displayed. The red, green, and blue clusters are classified as zone 1, 2, and 3, respectively. Scale bar: 3 mm. The TACs for each of the 4 clusters for (I) a GadoSpin rat and (J) a Gd-DTPA rat are displayed in addition to the total number of voxels of each the clusters.

technical advance
1304 The Journal of Clinical Investigation http://www.jci.org Volume 123 Number 3 March 2013
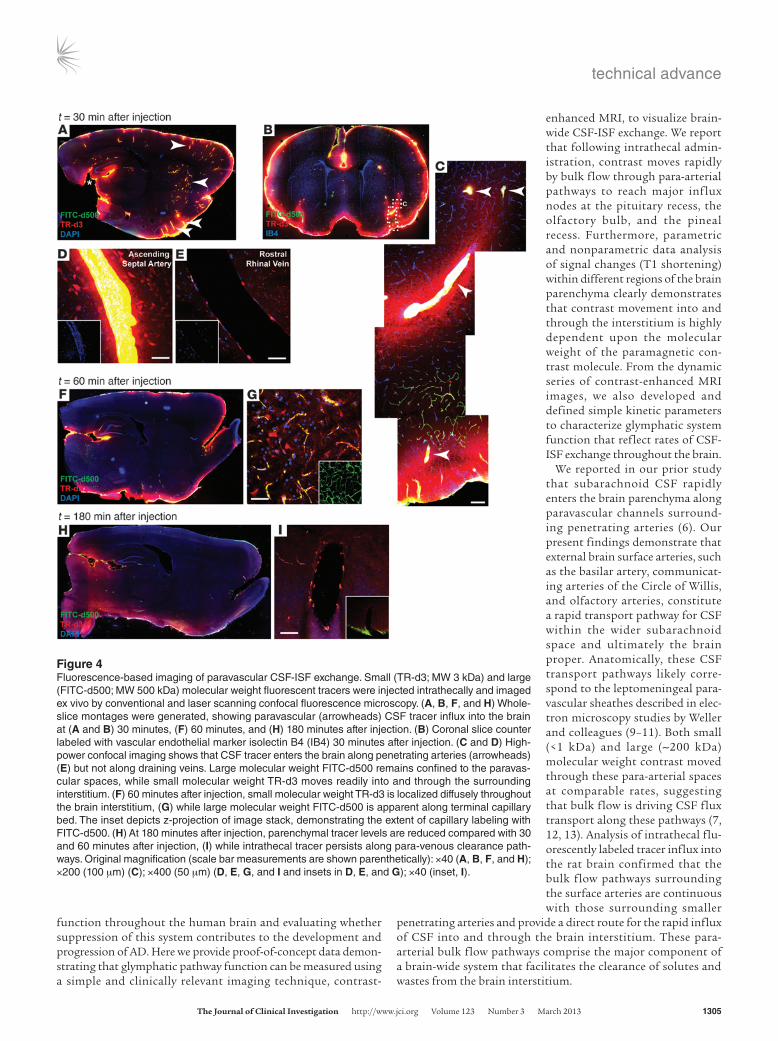
and along the margins of the pineal recess as it extends into the brain and connects with the hippocampal fissure. At these loca-tions, CSF tracer penetration into the tissue was largely dependent upon molecular size, as the small molecular weight TR-d3 readily entered the parenchyma from the subarachnoid space, while the large molecular weight FITC-d500 did not penetrate beyond the pial surface (Figure 4, A and F).
At 30 minutes after injection, paravascular CSF influx into the brain was clearly evident (Figure 4, A and B). As observed in our prior study in mice (6), paravascular influx occurred almost exclu-sively along the spaces surrounding penetrating arteries (Figure 4, C and D) rather than along veins (Figure 4E). This included smaller penetrating cortical arteries in addition to large cali-ber arteries originating at the ventral brain surface. Consistent with the differences in distribution observed between Gd-DTPA and GadoSpin, TR-d3 and FITC-d500 distribution through the brain differed markedly. At 30 minutes after injection, FITC-d500 remained restricted to the paravascular spaces and did not enter the surrounding parenchyma. In contrast, TR-d3 spread readily from the paravascular spaces into the surrounding parenchyma and was taken up by nearby neurons (Figure 4, C and D).
Signal changes induced within the parenchyma by Gd-DTPA peaked between 60 and 80 minutes after injection (Figure 2, C–F) and then declined as contrast was cleared from the brain par-enchyma. Between 30 and 60 minutes after injection, brain-wide TR-d3 fluorescence appeared to increase as the tracer spread from the proximal pial surface and paravascular pathways to distribute diffusely throughout the parenchyma (Figure 4, A and F). FITC-d500 remained confined to paravascular spaces, extending into capillary beds throughout the brain (Figure 4G). At 180 minutes after injection, brain fluorescence intensity had declined from values at 30 and 60 minutes (Figure 4H); however, tracer persisted in the surrounding para-venous pathways near the pineal recess (Figure 4I).
DiscussionWe recently reported that the glymphatic pathway is a key contrib-utor to the clearance of soluble amyloid β from the brain intersti-tium and proposed that the failure of this clearance might contrib-ute to amyloid plaque deposition and AD progression (6). In light of these findings, there may be great value in the development of a clinical prognostic test for measuring glymphatic pathway
cluster number to that of the first zone (zone 2no. voxels × AUC/ zone 1no. voxels × AUC) and the ratio of zone 3’s total time-weighted cluster number to that of the first zone (zone 3no. voxels × AUC/ zone 1no. voxels × AUC). These ratios represent the relationship between the contrast (Gd-DTPA and GadoSpin) that passes through the paravascular regions (zone 1) and that which passes through par-enchymal voxels (zones 2 and 3) over the study period. They rep-resent a way to quantify the relative ease with which contrast agent can transit from the proximal glymphatic influx pathway (red and/or orange clusters) into the deeper brain interstitium (green and blue clusters). As can be seen in Table 2, the average zone 3no. voxels × AUC/zone 1no. voxels × AUC ratio obtained in Gd-DTPA rats is significantly higher than that obtained in GadoSpin rats (Gd-DTPA, 0.89 ± 0.56 vs. GadoSpin, 0.25 ± 0.22; P = 0.027, t test). Thus, this nonparametric cluster analysis clearly confirms that while small molecular weight Gd-DTPA and large molecular weight GadoSpin enjoy largely equivalent access to the proximal glymphatic pathway (including the subarachnoid and initial par-avascular compartments), the access of the large molecular weight GadoSpin to the brain interstitial space is dramatically reduced compared with that of Gd-DTPA.
Fluorescence-based imaging of glymphatic pathway function. The vol-ume of brain parenchyma exhibiting signal changes (T1 shorten-ing) upon intrathecal contrast injection in rats was considerably more restricted than the penetration of fluorescent CSF tracers into the brain parenchyma detected by fluorescence-based imaging in mice (6). We surmised that this discrepancy stemmed from differ-ences in total amount of contrast delivered intrathecally, combined with the relative insensitivity (compared with fluorescence-based imaging) of T1-weighted MRI to detect signal changes induced by low concentrations of contrast agent when dispersed throughout the brain parenchyma. To test this, we coinjected fluorescent dex-trans (FITC-conjugated dextran [FITC-d500] and TR-d3; MW 500 kDa and 3 kDa, respectively) by the same protocol used for the MRI study and evaluated the routes and extent of tracer penetration into the brain by ex vivo fluorescence microscopy.
When imaged at low power (×4) by conventional epifluorescence microscopy, gross fluorescent tracer distribution was in broad agreement with the findings of the MRI study. Thirty to sixty minutes after tracer infusion, intense fluorescence labeling was apparent below the pial surface throughout the brain (Figure 4, A and F). Tracer intensity was greatest along the ventral brain surface
Table 2Cluster analysis for 4 midsagittal slices
Parameter Gd-DTPA (n = 6) GadoSpin (n = 6) P valueNo. voxels – zone 1, mean (SD) 4,048 (2,146) 5,112 (2,028) 0.399No. voxels – zone 2, mean (SD) 15,835 (5,690) 12,759 (4,162) 0.310No. voxels – zone 3, mean (SD) 18,295 (7,407) 6,180 (3,311) 0.004No. voxels × AUC – zone 1, mean (SD) 22,646 × 104 (15,816 × 104) 19,777 × 104 (7,368 × 104) 0.695No. voxels × AUC – zone 2, mean (SD) 30,037 × 104 (10,068 × 104) 18,335 × 104 (5,889 × 104) 0.033No. voxels × AUC – zone 3, mean (SD) 12,800 × 104 (4,448 × 104) 4,092 × 104 (3,458 × 104) 0.003Zone 2no. voxels × AUC/zone 1no. voxels × AUC, mean (SD) 1.62 (0.60) 1.01 (0.46) 0.077Zone 3no. voxels × AUC/zone 1no. voxels × AUC, mean (SD) 0.89 (0.56) 0.25 (0.22) 0.027
The quantitative results of the cluster analysis for Gd-DTPA and GadoSpin rats are presented, including (a) the total number of voxels in each zone, (b) the time-weighted number of voxels in each zone (defined as the AUC of each cluster’s TAC multiplied by the total number of voxels), (c) the ratio of zone 2’s total time-weighted cluster number to that of the first zone, and (d) the ratio of zone 3’s total time-weighted cluster number to that of the first zone. These ratios are important and represent the relationship between the contrast (Gd-DTPA and GadoSpin) that passes through the paravascular regions (zone 1) and that which passes through parenchymal voxels (zones 2 and 3) over the study period
technical advance
The Journal of Clinical Investigation http://www.jci.org Volume 123 Number 3 March 2013 1305
enhanced MRI, to visualize brain-wide CSF-ISF exchange. We report that following intrathecal admin-istration, contrast moves rapidly by bulk flow through para-arterial pathways to reach major influx nodes at the pituitary recess, the olfactory bulb, and the pineal recess. Furthermore, parametric and nonparametric data analysis of signal changes (T1 shortening) within different regions of the brain parenchyma clearly demonstrates that contrast movement into and through the interstitium is highly dependent upon the molecular weight of the paramagnetic con-trast molecule. From the dynamic series of contrast-enhanced MRI images, we also developed and defined simple kinetic parameters to characterize glymphatic system function that reflect rates of CSF-ISF exchange throughout the brain.
We reported in our prior study that subarachnoid CSF rapidly enters the brain parenchyma along paravascular channels surround-ing penetrating arteries (6). Our present findings demonstrate that external brain surface arteries, such as the basilar artery, communicat-ing arteries of the Circle of Willis, and olfactory arteries, constitute a rapid transport pathway for CSF within the wider subarachnoid space and ultimately the brain proper. Anatomically, these CSF transport pathways likely corre-spond to the leptomeningeal para-vascular sheathes described in elec-tron microscopy studies by Weller and colleagues (9–11). Both small (<1 kDa) and large (~200 kDa) molecular weight contrast moved through these para-arterial spaces at comparable rates, suggesting that bulk flow is driving CSF flux transport along these pathways (7, 12, 13). Analysis of intrathecal flu-orescently labeled tracer influx into the rat brain confirmed that the bulk flow pathways surrounding the surface arteries are continuous with those surrounding smaller
penetrating arteries and provide a direct route for the rapid influx of CSF into and through the brain interstitium. These para- arterial bulk flow pathways comprise the major component of a brain-wide system that facilitates the clearance of solutes and wastes from the brain interstitium.
function throughout the human brain and evaluating whether suppression of this system contributes to the development and progression of AD. Here we provide proof-of-concept data demon-strating that glymphatic pathway function can be measured using a simple and clinically relevant imaging technique, contrast-
Figure 4Fluorescence-based imaging of paravascular CSF-ISF exchange. Small (TR-d3; MW 3 kDa) and large (FITC-d500; MW 500 kDa) molecular weight fluorescent tracers were injected intrathecally and imaged ex vivo by conventional and laser scanning confocal fluorescence microscopy. (A, B, F, and H) Whole-slice montages were generated, showing paravascular (arrowheads) CSF tracer influx into the brain at (A and B) 30 minutes, (F) 60 minutes, and (H) 180 minutes after injection. (B) Coronal slice counter labeled with vascular endothelial marker isolectin B4 (IB4) 30 minutes after injection. (C and D) High-power confocal imaging shows that CSF tracer enters the brain along penetrating arteries (arrowheads) (E) but not along draining veins. Large molecular weight FITC-d500 remains confined to the paravas-cular spaces, while small molecular weight TR-d3 moves readily into and through the surrounding interstitium. (F) 60 minutes after injection, small molecular weight TR-d3 is localized diffusely throughout the brain interstitium, (G) while large molecular weight FITC-d500 is apparent along terminal capillary bed. The inset depicts z-projection of image stack, demonstrating the extent of capillary labeling with FITC-d500. (H) At 180 minutes after injection, parenchymal tracer levels are reduced compared with 30 and 60 minutes after injection, (I) while intrathecal tracer persists along para-venous clearance path-ways. Original magnification (scale bar measurements are shown parenthetically): ×40 (A, B, F, and H); ×200 (100 μm) (C); ×400 (50 μm) (D, E, G, and I and insets in D, E, and G); ×40 (inset, I).

technical advance
1306 The Journal of Clinical Investigation http://www.jci.org Volume 123 Number 3 March 2013
with that in Figure 3H). Although we attribute the observed dif-ferences in CSF-ISF exchange patterns between Gd-DTPA and GadoSpin to differences in molecular size, we acknowledge that other possibilities exist. For example, it is conceivable that other intrinsic molecular properties, such as shape, electrostatic forces, size (radius of gyration), conformation, or physical/chemical interactions, can contribute to the dissimilar CSF-ISF exchange patterns observed with the 2 contrast molecules. Clearly, more investigations using a range of well-characterized contrast mole-cules will be necessary to fully clarify this issue.
One apparent discrepancy between fluorescence-based and contrast-enhanced MR-based imaging under the current exper-imental protocol is the inability to detect the small molecular weight contrast agent (Gd-DTPA) in the entire brain parenchyma after intrathecal injection. This is in contrast to the widespread parenchymal labeling with small molecular weight fluorescent CSF tracers in the mouse (6). To confirm that these differences did not reflect species differences in CSF-ISF exchange, we con-ducted ex vivo fluorescence imaging in rat brain slices following intrathecal injection of similarly sized fluorescent CSF tracers (compare FITC-d500 [500 kDa] to GadoSpin [200 kDa] and compare TR-d3 [MW 3 kDa] to Gd-DTPA [MW ~1 kDa]) using an injection protocol that was otherwise identical to that used for the MRI experiments. This fluorescence-based imaging confirmed the permeation of small molecular weight CSF tracer throughout the rat brain parenchyma and restriction of the large molecular weight tracer to the paravascular spaces. We therefore conclude that Gd-DTPA, like TR-d3, does in fact move throughout the brain parenchyma. However, the Gd-DTPA contrast concentra-tions achieved under the current intrathecal infusion protocol within the broader parenchyma simply were not sufficiently high to induce detectable signal changes (T1 shortening).
Notwithstanding these limitations, the intrinsic 3D nature of MRI permitted the visualization of the entire paravascular CSF-ISF exchange pathway throughout the whole brain, allowing us to define key nodes of CSF influx into the brain at the pituitary recess, olfactory artery, and pineal recess and to assess CSF-ISF exchange at many anatomically distinct locations simultaneously (Figure 5). Through the dynamic image acquisitions, the kinetics of CSF tracer influx into and clearance from the paravascular and interstitial spaces could be measured and characterized for a given contrast molecule. For example, TACs generated for the subarach-noid pituitary recess and pineal recess after Gd-DTPA injection exhibited similar influx profiles, whereas efflux from the pineal recess was markedly slowed compared with that of the pituitary recess (compare Figure 2A and Figure 2B). Similarly, TACs gen-erated for the cerebellum and aqueduct showed similar influx kinetics, while the clearance of contrast from the aqueduct was prolonged compared with that from the cerebellar region (com-pare Figure 2C and Figure 2E). One possible explanation for the protracted clearance from the pineal recess and the aqueduct is that these anatomical regions constitute primary ISF clearance sites and thus appear to retain contrast (by accumulating it from other regions) for longer durations.
Analysis of the dynamic time series data also allowed the essen-tial comparison of CSF-ISF exchange between a small (Gd-DTPA) and a large (GadoSpin) molecular weight contrast agent (com-pare Supplemental Videos 1 and 2; Supplemental Methods). Here it is particularly important to note that, within the pituitary recess, Gd-DTPA and GadoSpin influx and clearance were virtu-
The exchange of CSF and ISF between paravascular spaces and the interstitium occurs across perivascular astrocytic end feet, which extend nearly complete coverage over the brain microvascu-lature (8). As a result, solutes that lack a specific molecular trans-port pathway (such as ion transporters or channels) across the end feet must instead pass through the approximately 20-nm cleft between overlapping end foot processes to gain access to the inter-stitial space. In our prior study in the mouse, we reported that small tracers such as TR-d3 (diameter of hydration [dH] = 6.1 nm; ref. 14) pass readily into and through the interstitium, whereas large tracers such as FITC-d2000 (dH > 32 nm; ref. 14) remained largely confined to paravascular spaces (6). In this study, we con-firm these findings in the rat using fluorescence-based imaging. In addition, we used intrathecal administration of 2 different sized contrast agents, Gd-DTPA (MW ~1 kDa) and GadoSpin (MW 200 kDa), to demonstrate a similar effect of tracer size by dynamic contrast-enhanced MRI. For example, when TACs for the 2 contrast agents are compared at different anatomical loca-tions, the large molecular weight GadoSpin entered the brain par-enchyma at a dramatically lower rate than did the small molec-ular weight Gd-DTPA (compare red and blue curves, Figure 2). Moreover, an independent cluster analysis clearly revealed that while both tracers had ready access to paravascular spaces, the brain volume accessible to Gd-DTPA was markedly larger than that accessed by GadoSpin (compare blue zone 3 in Figure 3D
Figure 5Brain-wide glymphatic pathways of CSF-ISF exchange, assessed by contrast-enhanced MRI in the rat. After injection into the subarachnoid space of the cisterna magna, contrast agent follows specific paravas-cular pathways (yellow arrows) to enter the brain parenchyma and exchange with the interstitial compartments (orange arrows and fields). Acquisition of dynamic image series identified key CSF influx nodes at the pineal (Pin) and pituitary (Pit) recesses and allowed simple kinetic parameters to be derived that deflect the extent and rate of glymphatic CSF-ISF exchange throughout the whole brain. Scale bar: 3 mm.

technical advance
The Journal of Clinical Investigation http://www.jci.org Volume 123 Number 3 March 2013 1307
fluids and supplemental anesthesia. The animal was positioned in a ste-reotaxic frame (Kopf Instruments, frame no. 9) and the head flexed to 50 degrees. For the brief surgical procedure, anesthesia was supplemented with isoflurane (0.8%–1.2%) delivered in an 1:1 O2/air mixture.
The atlanto-occipital membrane was exposed via a midline dorsal neck incision, and a small incision was made to expose the underlying dura mater. A polyethylene catheter (6-cm long, 0.28 mm ID × 0.61 mm OD [Solomon Scientific]) filled with normal saline was advanced 1 mm into the intrathecal space via a small durotomy made using a 23-gauge needle and was fixed and sealed with super glue. The skin incision was closed around the catheter.
MRI protocol. Following surgery, the rats were flipped supine and posi-tioned in a custom-made acrylic cradle fitted with a head fixation device and a snout mask for delivery of supplemental oxygen. The head of the animal was positioned on top of a 3.0-cm custom-made radio frequency receiver coil. Noninvasive, MRI-compatible monitors (pulse oximetry, respiratory rate, and rectal temperature probe; SA Instruments Inc.) were repositioned for continuous monitoring of vital signs while the animal underwent MRI. During imaging, body temperature was kept strictly within 36.5°C to 37.5°C during imaging using a computer-assisted air heating system (SA Instruments Inc.). The intrathecal catheter was con-nected to a long PE 20 line filed with paramagnetic MR contrast diluted in 0.9% NaCl attached to a 1-cc. syringe and microinfusion pump (Baxter Model AS50 Infusion Pump, Baxter Healthcare Corporation). The tail vein catheter was used for maintenance hydration (0.9% NaCl, 4 cc/kg/h) and supplemental anesthesia (Nembutal, 5–10 mg/kg i.v.) administered every 2 hours as guided by the respiratory rate.
Two different paramagnetic contrast agents were used for the experi-ments: Magnevist (Gd-DTPA, MW 938 Da; Bayer HealthCare Pharma-ceuticals Inc.) and GadoSpin P (MW 200 kDa; Miltenyi Biotec Inc.). To visualize the glymphatic pathways by contrast-enhanced MRI (T1 short-ening effects), it was essential to first establish the initial concentrations at which the 2 different paramagnetic contrast agents are matched so that decreasing concentrations produced over time in brain tissue far from the injection site were comparable. In other words, the T1 effects induced by the 2 paramagnetic contrast agents are important to match, since after they are injected into the cisterna magna they will travel through the brain-wide glymphatic pathways and become progressively diluted over time. To accomplish this, phantom experiments were carried out (see Phantom MRI experiments in Supplemental Methods and Supplemental Figures 1 and 2).
All imaging protocols were performed on a 9.4T/20 MRI instrument interfaced to a Bruker Advance console and controlled by Paravision 5.0 software (Bruker Bio Spin). A custom-made 3-cm surface radio frequency coil was used as a receiver, and a 16-cm diameter volume coil (Bruker) was used as a transmitter. Following localizer anatomical scout scans, a 3D T1-weighted FLASH sequence (TR = 15 ms, TE = 3.4 ms, flip angle = 15°, NA = 1, FOV = 3.0 × 3.0 × 3.2 cm, scanning time = 4 min 5 s, acquisition matrix size of 256 × 128 × 128 interpolated to 256 × 256 × 256, yielding an image resolution of 0.12 × 0.12 × 0.13 mm) was acquired in the sagittal or coronal plane. For all experiments, a 60 mM (1:8 volume ratio diluted in 0.9% NaCl) Gd-DTPA phantom placed in the vicinity of animal’s head was used for image intensity normalization over the time series. The scanning protocol consisted of 3 baseline scans followed by intrathecal paramag-netic contrast (0.17 mM GadoSpin and 21 mM Gd-DTPA) delivery via the indwelling catheter while MRI acquisitions continued. A total of 80 μl of the paramagnetic contrast agent was delivered intrathecally at an infusion rate of 1.6 μl per minute (total infusion time = 50 minutes). After comple-tion of the intrathecal infusion, the 3D MRI acquisitions continued over 3.9 hours. At the end of the experiment the animal was euthanized with an overdose of Nembutal.
ally identical (compare red and blue curves, Figure 2A), whereas in the parenchymal pontine nucleus, GadoSpin movement into and through the region was dramatically reduced compared with that of Gd-DTPA (compare red and blue curves, Figure 2F). Using a second approach, cluster analysis, the spatial distribution pat-tern of CSF-ISF exchange between the 2 contrast agents can be evaluated at the level of the aqueduct. Comparing either the raw brain volume occupied by zone 3 (corresponding to the most dis-tal compartment) or the normalized average zone 3no. voxels × AUC/zone 1no. voxels × AUC ratio (which reflects tracer penetration from the paravascular space into the brain parenchyma), GadoSpin penetration into and through the brain interstitium was dramat-ically restricted compared with that of Gd-DTPA (Table 2). Thus, dynamic contrast-enhanced MRI following intrathecal contrast agent administration provides a novel and simple approach to characterize both the kinetics and spatial distribution of glym-phatic CSF-ISF exchange throughout the whole brain.
In our prior study (6), we reported that the glymphatic pathway is an important contributor to the clearance of interstitial solutes such as soluble amyloid β, a peptide widely believed to be a crit-ical driver of AD pathogenesis (15, 16). Based upon those find-ings, we proposed that the failure of glymphatic pathway function may contribute to the deposition of amyloid β plaques and the progression of AD. A key motivation for evaluating glymphatic pathway function by contrast-enhanced MRI in rats was to lay the experimental groundwork for evaluating glymphatic pathway function in the human brain and in the future assess whether its failure contributes to AD progression in humans. To accomplish this, a safe, minimally invasive imaging approach to measuring glymphatic pathway function was necessary. Contrast-enhanced MR cisternography is currently used clinically to visualize CSF leaks in patients undergoing treatment for spontaneous intra-cranial hypotension and CSF rhinorrhea (4, 5), and the Gd-DTPA used in this study is already clinically approved for this purpose. While the current injection route via the cisterna magna and scan time required (>2 hours) is not clinically relevant, work within our group is underway to evaluate the suitability of single-shot intrathecal lumbar injections for evaluating glymphatic pathway function in the brain. We are additionally developing approaches to reduce data collection and scan time. However, this study dem-onstrates that, in the rat, this potentially clinically acceptable approach can be used to visualize and evaluate glymphatic path-way function, permitting assessment of kinetics and anatomical distribution patterns of paravascular CSF-ISF exchange through-out the whole brain. We propose that this approach may provide the basis for a wholly new prognostic strategy for evaluating AD susceptibility and disease progression in the future.
MethodsSurgical preparation. Female Sprague Dawley rats were used (Taconic; body weight: 220–280 g). For anesthesia, the animals were induced with 3% isoflurane in oxygen using an induction chamber and then received an intraperitoneal injection of 40 mg/kg phenobarbital (Nembutal Sodium Solution; OVATION Pharmaceuticals Inc.). The animals were allowed to breathe spontaneously during the entire experiment. Noninvasive mon-itors (pulse oximetry, respiratory rate, and rectal temperature probe; SA Instruments Inc.) were placed to assure adequate oxygenation (O2 satura-tion > 97%), ventilation (respiratory rate 50–65 breaths per minute), and normal body temperature (36.5°C–37.5°C) during the surgical procedures. A 24-gauge catheter was inserted into the tail vein for administration of

technical advance
1308 The Journal of Clinical Investigation http://www.jci.org Volume 123 Number 3 March 2013
and anatomical MRIs to verify the positions of the clusters in relation to the large vessels. The number of voxels and TACs for each cluster was extracted for further processing.
Fluorescent intrathecal tracer imaging. To evaluate the movement of intra-thecal tracers into the rat brain with higher resolution, we conducted ex vivo fluorescence imaging of FITC-d500 (MW 500 kDa) and TR-d3 (MW 3 kDa) in fixed brain slices. FITC-d500 and TR-d3 were selected to roughly correspond with the molecular weights of Gd-DTPA (MW ~1 kDa) and GadoSpin (MW 200 kDa). Intrathecal injections were conducted as detailed above. A mixture of 0.1% FITC-d500 and TR-d3 dissolved in arti-ficial CSF was injected. 30, 60, and 180 minutes after injection, animals were transcardially perfused with 4% paraformaldehyde, and the brains were removed and post-fixed overnight at 4°C. 100-μm sagittal vibratome sections were cut and mounted with Prolong Antifade Gold Reagent with DAPI (Invitrogen). A subset of coronal slices were additionally counter labeled with biotinylated Griffonia (Bandeiraea) Simplicifolia Lectin I Iso-lectin B4 (a vascular endothelial marker; 1:100; Vector Laboratories) over-night at 4°C. Secondary detection was conducted using Cy5-conjugated streptavidin (1:250; Jackson ImmunoResearch Inc.). Three-channel whole-slice montages were generated using a conventional epifluorescence micro-scope (Olympus) at ×4 objective power with a motorized stage and Micro-lucida software (Microbrightfield). High-power imaging was conducted at ×40 objective power by laser scanning confocal microscopy (Olympus).
Statistics. All data are presented as mean ± SD. Statistical analyses were performed using SAS version 9.2 (SAS Institute Inc.) and XLSTAT version 2011 (Addinsoft), with P < 0.05 described as significantly different. Differ-ences in regional tissue uptake (as represented by the average ratio between the mAUC of the anatomical ROI and the average mAUC of the pituitary recess) between the Gd-DTPA and GadoSpin rats were compared using a 2-sided t test for independent groups. The following parameters were derived from the K means cluster analysis: (a) total number of voxels in each of the 3 anatomical zones, (b) the time-weighted cluster number of each zone (no. voxels × AUC), and (c) ratios of zone 2’s and 3’s total time-weighted cluster number to that of zone 1’s time-weighted cluster number. Differences in average values of each of these parameters derived from the cluster analysis between the Gd-DTPA and GadoSpin rats were compared using a 2-sided t test for independent groups.
Study approval. All animal studies and experimental procedures were approved by the local institutional animal care and use committees at Brookhaven National Laboratory, Stony Brook University, and Rochester University and conformed to both the Animal Welfare Act and Office of Laboratory Animal Welfare regulations.
AcknowledgmentsThis work was supported by funding from the NIH (NS078304 and NS078167); Division of Science, Technology and Innovation (NYS-TAR); and the Department of Anesthesiology, Stony Brook Medicine.
Received for publication November 5, 2012, and accepted in revised form January 10, 2013.
Address correspondence to: Helene Benveniste, Department of Anes-thesiology, Stony Brook University, Health Sciences Center Level 4, Stony Brook, New York 11794, USA. Phone: 631.624.7018; Fax: 631.444.2907; E-mail: [email protected].
Data processing. The general MRI processing procedure consisted of head motion correction, intensity normalization, smoothing, and voxel-by-voxel conversion to percentage of baseline signal. For this we used SPM8 (http://www.fil.ion.ucl.ac.uk/spm/). First, the acquired T1-weighted MRI images were exported as DICOM files and converted to the 3D NIfti image format. Second, scan-to-scan misregistration caused by head movement was corrected by rigid-body alignment of each scan to the time-averaged (mean) image. Third, image intensity was normalized over the time series by dividing voxel intensity by the mean intensity of the reference phantom using the following expression: img_normalized = img_original/phantom × 1,000, where img_normalized stands for the normalized image inten-sity and img_original stands for the original image intensity, followed by 0.1 mm full width at half maximum isotropic Gaussian voxel-wise image intensity smoothing. Finally, to ensure that voxel intensity represents percentage change relative to the average baseline images, all time series images were subtracted and divided by the baseline average image using the following expression: P(i,j,k) = [I(i,j,k) – base(i,j,k)]/base(i,j,k) × 100, where P stands for the percentage signal change from the baseline, I stands for image intensity, and (i,j,k) stands for voxel position.
The signal changes measured on the T1-weighted MRIs over time in pre-selected anatomical areas were used to obtain the TACs of regional tissue uptake of the paramagnetic contrast agents. The T1-weighted averaged baseline images as well as the contrast-enhanced T1-weighted MRIs were used to anatomically guide placement of the ROIs. From near-midline sagittal MRIs, ROIs were drawn on 4 sagittal slices in each hemisphere, and the signals from each of the anatomical ROIs were averaged using PMOD software (PMOD version 3.307; PMOD Technologies Ltd.). The ROIs included the pituitary recess, pineal recess, olfactory bulb, cerebel-lum, pontine nucleus, and aqueduct. The TACs for each ROI were extracted via the PKMod module. The AUC for each ROI’s TAC was calculated using the “trapezoidal rule” (for further details see Supplemental Methods). The calculated AUCs were normalized by dividing each animal’s AUC by the number of the corresponding time intervals used for that particular study, which was referred to as mAUC and calculated as mAUC = AUC/(n – 1), where n stands for the number of the corresponding time intervals. Fur-thermore, to minimize potential differences in the amount of paramag-netic contrast delivered to each animal within groups, the mAUC of the pituitary recess (which represent the major input and source of contrast) was used to normalize the other regions mAUCs. Subsequently, we com-pared the mAUC ratios between the 2 groups for each anatomical location using a 2-sided independent t test.
Cluster analysis. Nonparametric segmentation to group voxels in the MRI images on the basis of similar kinetics was performed using a k-means cluster algorithm (PMOD version 3.307; PMOD Technologies Ltd.) on 4 sagittal slices at the level of the aqueduct from each of the 4D T1-weighted MRIs. A volume-of-interest mask containing the brain only was created for the cluster analysis. The number of clusters (K) used was determined by the K that was able to segment out voxels adjacent to the large ves-sels, such as basilar artery (including pituitary recess) and olfactory artery complex. This was done on an interactive, per animal basis. Each analy-sis was performed using a 50% percentile threshold (i.e., only 50% of the pixels with the highest signal changes [sum of squared TAC values] were used). The number of clusters that provided the most ideal visualization of paravascular inflow conduits was 4 clusters. The 4 clusters were exam-ined visually and coregistered with the corresponding contrast-enhanced
1. Brown PD, Davies SL, Speake T, Millar ID. Molecu-lar mechanisms of cerebrospinal fluid production. Neuroscience. 2004;129(4):957–970.
2. Praetorius J. Water and solute secretion by the choroid plexus. Pflugers Arch. 2007;454(1):1–18.
3. Battal B, Kocaoglu M, Bulakbasi N, Husmen G, Tuba Sanal H, Tayfun C. Cerebrospinal fluid flow imaging by using phase-contrast MR technique. Br J Radiol. 2011;84(1004):758–765.
4. Schick U, Musahl C, Papke K. Diagnostics and
treatment of spontaneous intracranial hypoten-sion. Minim Invasive Neurosurg. 2010;53(1):15–20.
5. Aydin K, et al. Localization of cerebrospinal fluid leaks by gadolinium-enhanced magnetic resonance cisternography: a 5-year single-center experience.
technical advance
The Journal of Clinical Investigation http://www.jci.org Volume 123 Number 3 March 2013 1309
Neurosurgery. 2008;62(3):584–589. 6. Iliff JJ, et al. A paravascular pathway facilitates CSF
flow through the brain parenchyma and the clear-ance of interstitial solutes, including amyloid β. Sci Transl Med. 2012;4(147):147ra111.
7. Cserr HF, Cooper DN, Suri PK, Patlak CS. Efflux of radiolabeled polyethylene glycols and albumin from rat brain. Am J Physiol. 1981;240(4):F319–F328.
8. Mathiisen TM, Lehre KP, Danbolt NC, Ottersen OP. The perivascular astroglial sheath provides a complete covering of the brain microvessels: an electron microscopic 3D reconstruction. Glia. 2010; 58(9):1094–1103.
9. Pollock H, Hutchings M, Weller RO, Zhang ET. Perivascular spaces in the basal ganglia of the human brain: their relationship to lacunes. J Anat. 1997; 3:337–346.
10. Weller RO. Microscopic morphology and histol-ogy of the human meninges. Morphologie. 2005; 89(284):22–34.
11. Zhang ET, Inman CB, Weller RO. Interrelation-ships of the pia mater and the perivascular (Vir-chow-Robin) spaces in the human cerebrum. J Anat. 1990;170:111–123.
12. Groothuis DR, et al. Efflux of drugs and solutes from brain: the interactive roles of diffusional tran-
scapillary transport, bulk flow and capillary trans-porters. J Cereb Blood Flow Metab. 2007;27(1):43–56.
13. Abbott NJ. Evidence for bulk flow of brain intersti-tial fluid: significance for physiology and pathol-ogy. Neurochem Int. 2004;45(4):545–552.
14. Sykova E, Nicholson C. Diffusion in brain extra-cellular space. Physiol Rev. 2008;88(4):1277–1340.
15. Hardy J. The amyloid hypothesis for Alzheimer’s disease: a critical reappraisal. J Neurochem. 2009; 110(4):1129–1134.
16. Hardy J, Selkoe DJ. The amyloid hypothesis of Alz-heimer’s disease: progress and problems on the road to therapeutics. Science. 2002;297(5580):353–356.