
Brain Wave Signal (EEG) of NeuroSky, Inc. - Sleep …...
22
Brain Wave Signal (EEG) of NeuroSky, Inc. December 15, 2009
Transcript of Brain Wave Signal (EEG) of NeuroSky, Inc. - Sleep …...

Brain Wave Signal (EEG) ofNeuroSky, Inc.December 15, 2009
e NeuroSky product families consist of hardware andsoftware components for simple integration of this bio-sensor technology into consumer and industrial end-applications.All products are designed andmanufactured tomeet exactingconsumer speci cations for quality, pricing, and featuresets. NeuroSky sets itself apart by providing building-block component solutions that offer friendly synergieswith related and complementary technological solutions.
Reproduction in anymanner whatsoever without the writtenpermission ofNeuroSky Inc. is strictly forbidden. Trademarksused in this text: eSense™,inkGear™,MDT™, NeuroBoy™andNeuroSky™are trademarks of NeuroSky Inc.
NOWARRANTIES: THEDOCUMENTATIONPROVIDEDIS "AS IS"WITHOUTANYEXPRESSOR IMPLIEDWARRANTYOFANYKINDINCLUDINGWARRANTIESOFMERCHANTABIL-ITY,NONINFRINGEMENTOF INTELLECTUALPROPERTY,INCLUDINGPATENTS,COPYRIGHTSOROTHERWISE,OR FITNESS FOR ANY PARTICULAR PURPOSE. IN NOEVENTSHALLNEUROSKYOR ITS SUPPLIERSBELIABLEFORANYDAMAGESWHATSOEVER (INCLUDING,WITHOUTLIMITATION,DAMAGESFORLOSSOFPROFITS, BUSINESSINTERRUPTION,COSTOFREPLACEMENTGOODSORLOSSOFORDAMAGETOINFORMATION)ARISINGOUTOFTHEUSEOFOR INABILITYTOUSETHEDOCUMENTA-TIONPROVIDED,EVEN IFNEUROSKYHASBEENADVISEDOF THE POSSIBILITY OF SUCH DAMAGES. , SOME OFTHE ABOVE LIMITATIONS MAY NOT APPLY TO YOUBECAUSESOMEJURISDICTIONSPROHIBITTHEEXCLUSIONORLIMITATIONOFLIABILITYFORCONSEQUENTIALOR INCIDENTAL DAMAGES.
Contents
What is a Biosignal? 4
What is a Neuro-Signal? 5
What is EEG? 6
Normal EEG 7
EEG Artifacts 9
EEG Signal of NeuroSky System 10
Summary 22
December 15, 2009 | © 2009 NeuroSky, Inc. All Rights Reserved.3
Chapter 1
What is a Biosignal?
e term ‘biosignal’ is de ned as any signal measured andmonitored from a biological being, althoughit is commonly used to refer to an electrical biosignal. Electrical biosignals (bio-electrical signals) arethe electrical currents generated by electrical potential differences across a tissue, organ or cell systemlike the nervous system.
Typical bio-electrical signals are ECG (Electrocardiogram), EMG (Electromyogram), EEG (Electroen-cephalogram) and EOG (Electrooculogram). GSR (Galvanic skin response) and HRV (Heart ratevariability) are also thought of as bio-electrical signals, although they are not measured directly fromelectrical potential differences.
December 15, 2009 | © 2009 NeuroSky, Inc. All Rights Reserved.4
Chapter 2
What is a Neuro-Signal?
Neuro means brain; therefore, ‘neuro-signal’ refers to a signal related to the brain. A common ap-proach to obtaining neuro-signal information is an Electroencephalograph (EEG), which is a methodof measuring and recording neuro-signals using electrodes placed on the scalp.
December 15, 2009 | © 2009 NeuroSky, Inc. All Rights Reserved.5
Chapter 3
What is EEG?
An electroencephalograph (EEG) is the recorded electrical activity generated by the brain. In general,EEG is obtained using electrodes placed on the scalp with a conductive gel. In the brain, there aremillions of neurons, each of which generates small electric voltage elds. e aggregate of these electricvoltage elds create an electrical reading which electrodes on the scalp are able detect and record.erefore, EEG is the superposition of many simpler signals. e amplitude of an EEG signal typicallyranges from about 1 uV to 100 uV in a normal adult, and it is approximately 10 to 20 mV whenmeasured with subdural electrodes such as needle electrodes.
e FFT (Fast Fourier Transform) is a mathematical process which is used in EEG analysis to inves-tigate the composition of an EEG signal. Since the FFT transforms a signal from the time domaininto the frequency domain, frequency distributions of the EEG can be observed. EEG frequency dis-tribution is very sensitive to mental and emotional states as well as to the location of the electrode(s).Two types of EEG montages are used: monopolar and bipolar. e monopolar montage collects sig-nals at the active site and compares them with a common reference electrode. e common electrodeshould be in a location so that it would not be affected by cerebral activity. e main advantage ofthe monopolar montage is that the common reference allows valid comparisons of the signals in manydifferent electrode pairings. Disadvantages of the monopolar montage include that there is no idealreference site, although the earlobes are commonly used. In addition, EMG and ECG artifacts mayoccur in the monopolar montage. Bipolar montage compares signals between two active scalp sites.Any activity in common with these sites is subtracted so that only difference in activity is recorded.erefore some information is lost with this montage.
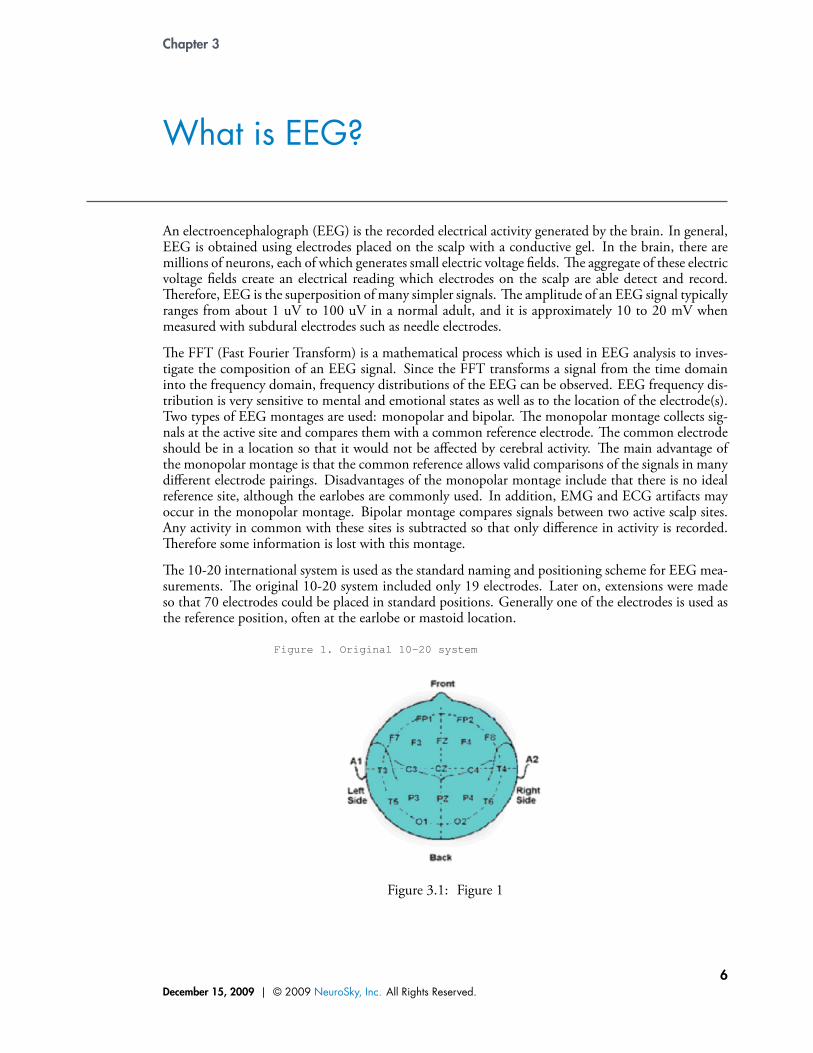
e 10-20 international system is used as the standard naming and positioning scheme for EEG mea-surements. e original 10-20 system included only 19 electrodes. Later on, extensions were madeso that 70 electrodes could be placed in standard positions. Generally one of the electrodes is used asthe reference position, often at the earlobe or mastoid location.
Figure 1. Original 10-20 system
Figure 3.1: Figure 1
December 15, 2009 | © 2009 NeuroSky, Inc. All Rights Reserved.6
Chapter 4
Normal EEG
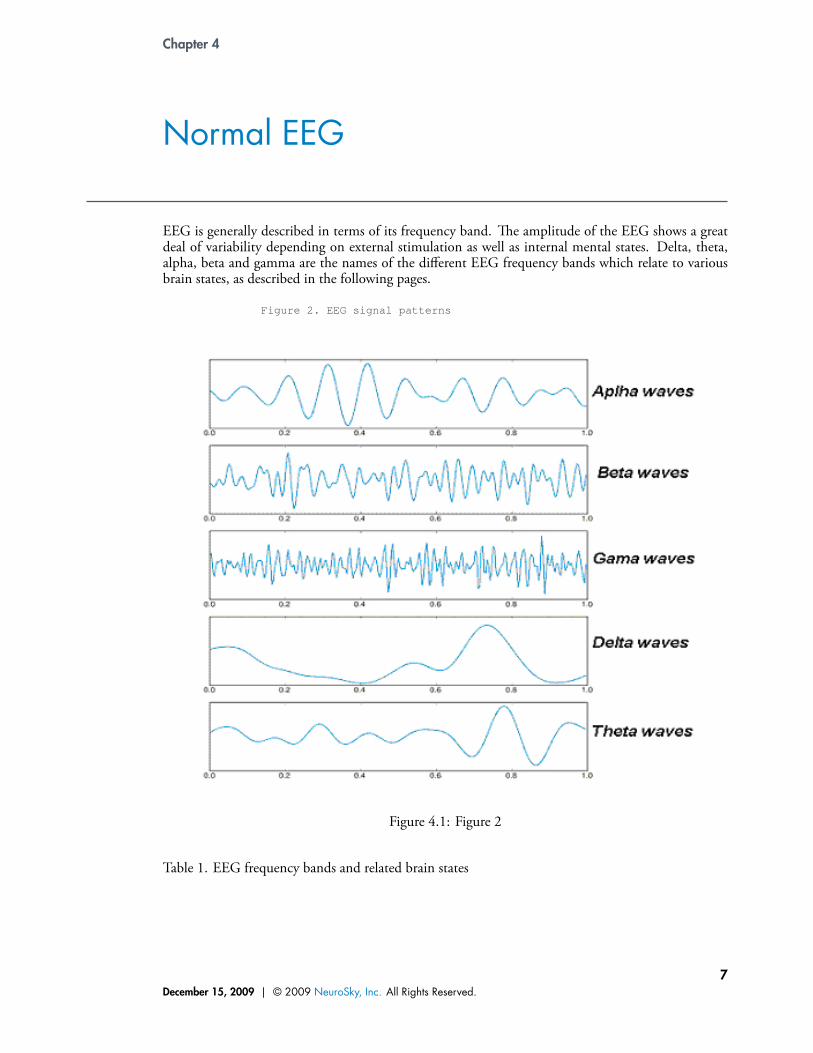
EEG is generally described in terms of its frequency band. e amplitude of the EEG shows a greatdeal of variability depending on external stimulation as well as internal mental states. Delta, theta,alpha, beta and gamma are the names of the different EEG frequency bands which relate to variousbrain states, as described in the following pages.
Figure 2. EEG signal patterns
Figure 4.1: Figure 2
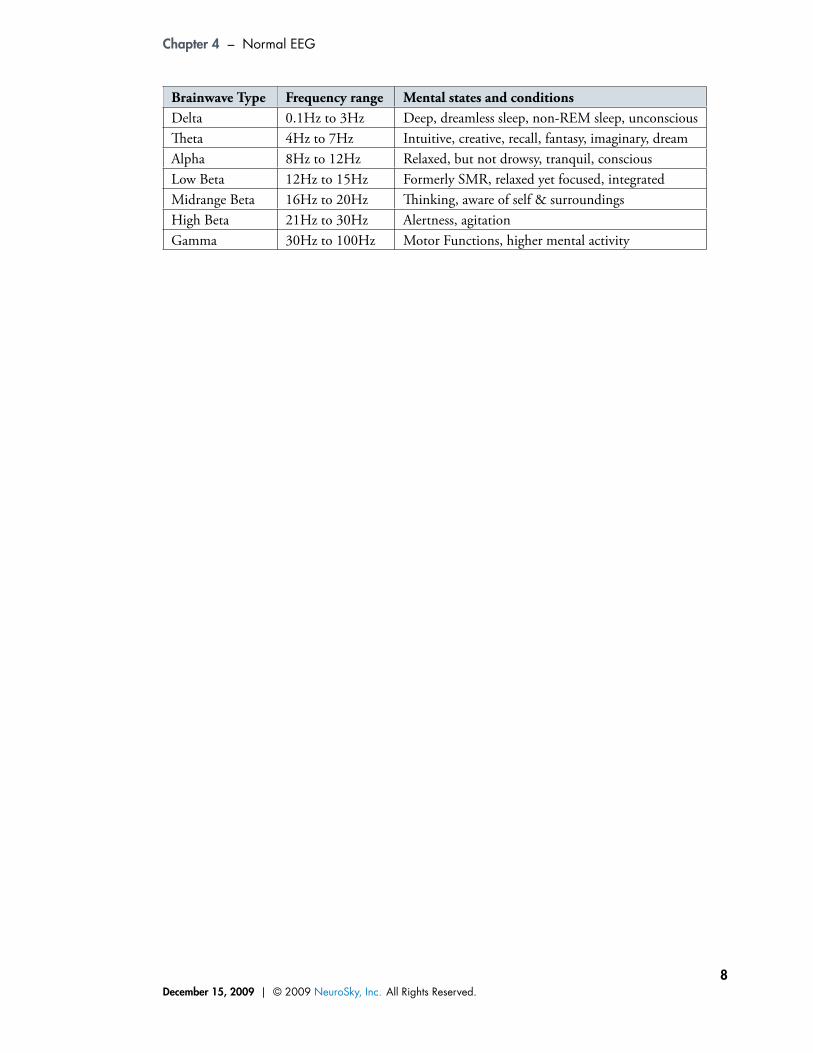
Table 1. EEG frequency bands and related brain states
December 15, 2009 | © 2009 NeuroSky, Inc. All Rights Reserved.7
Chapter 4 – Normal EEG
Brainwave Type Frequency range Mental states and conditionsDelta 0.1Hz to 3Hz Deep, dreamless sleep, non-REM sleep, unconsciouseta 4Hz to 7Hz Intuitive, creative, recall, fantasy, imaginary, dreamAlpha 8Hz to 12Hz Relaxed, but not drowsy, tranquil, consciousLow Beta 12Hz to 15Hz Formerly SMR, relaxed yet focused, integratedMidrange Beta 16Hz to 20Hz inking, aware of self & surroundingsHigh Beta 21Hz to 30Hz Alertness, agitationGamma 30Hz to 100Hz Motor Functions, higher mental activity
December 15, 2009 | © 2009 NeuroSky, Inc. All Rights Reserved.8
Chapter 5
EEG Artifacts
Since EEG signals are very weak (ranging from 1 to 100 �V), they can easily be contaminated byother sources. An EEG signal that does not originate from the brain is called an artifact. Artifacts canbe divided into two categories: physiologic and non-physiologic. Any source in the body which hasan electrical dipole or generates an electrical eld is capable of producing physiologic artifacts. eseinclude the heart, eyes, muscle, and tongue. Sweating can also alter the impedance at the electrode-scalp interface and produce an artifact.
Non-physiologic artifacts include 60 Hz interference from electric equipment, kinesiologic artifactscaused by body or electrode movements, and mechanical artifacts caused by body movement.
December 15, 2009 | © 2009 NeuroSky, Inc. All Rights Reserved.9
Chapter 6
EEG Signal of NeuroSky System
NeuroSky has developed a dry sensor system for consumer applications of EEG technology. e Neu-roSky system consists of dry electrodes and a specially designed electronic circuit for the dry electrodes.
NeuroSky has been conducting benchmark tests of the dry EEG by comparing EEG signals measuredby the dry sensor system with signals from the Biopac system, a well known wet electrode EEG systemwidely used in medical and research applications. EEG was simultaneously recorded by the NeuroSkysystem and the Biopac system. Electrodes for the two systems were placed at the same location, asclose together as possible without interfering with one another. Gold-plated dry electrodes were usedfor NeuroSky system, while silver-silver-chloride disposable electrodes with gel were used for Biopacsystem. EEG was recorded for various conditions such as with the subject relaxing and in a meditativestate, alert and in an attentive state, and during eye blink artifacts.
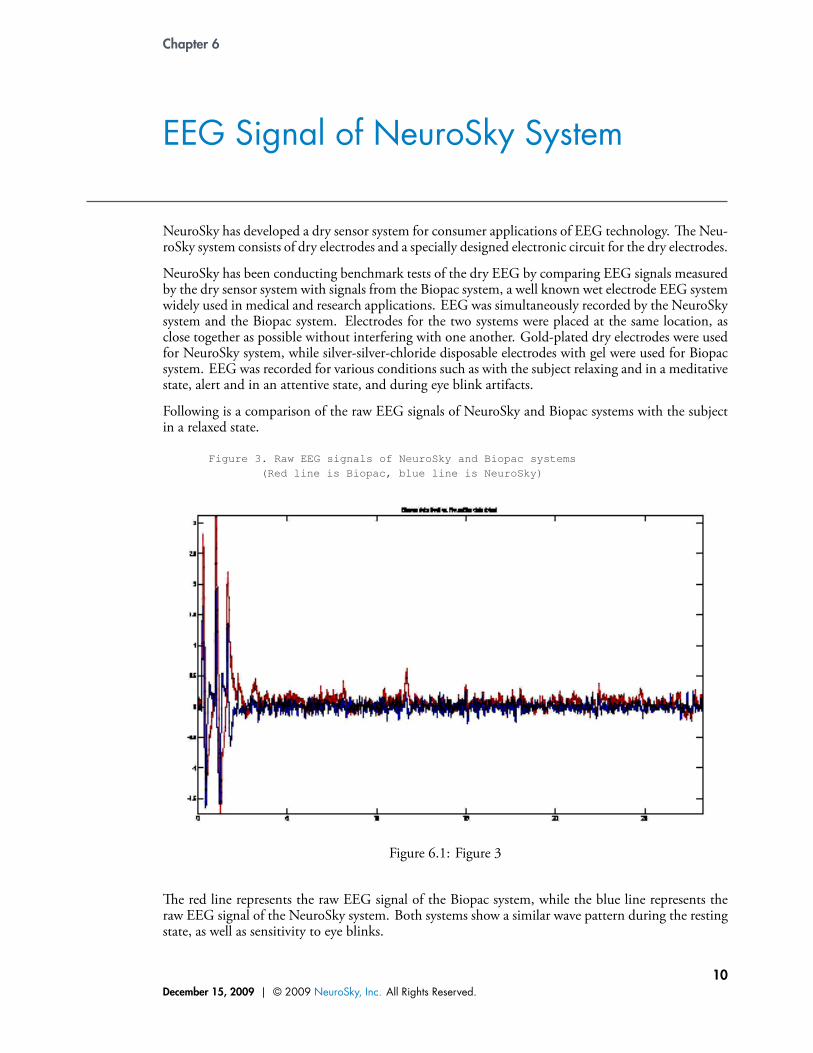
Following is a comparison of the raw EEG signals of NeuroSky and Biopac systems with the subjectin a relaxed state.
Figure 3. Raw EEG signals of NeuroSky and Biopac systems(Red line is Biopac, blue line is NeuroSky)
Figure 6.1: Figure 3
e red line represents the raw EEG signal of the Biopac system, while the blue line represents theraw EEG signal of the NeuroSky system. Both systems show a similar wave pattern during the restingstate, as well as sensitivity to eye blinks.
December 15, 2009 | © 2009 NeuroSky, Inc. All Rights Reserved.10
Chapter 6 – EEG Signal of NeuroSky System
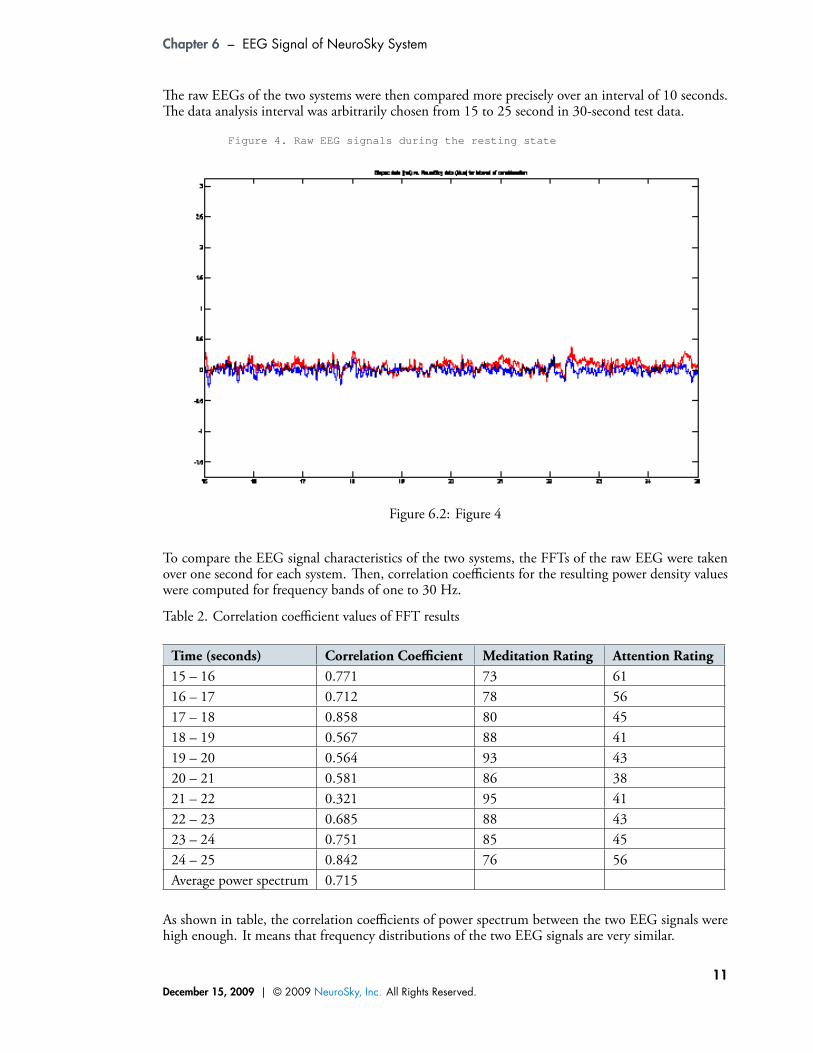
e raw EEGs of the two systems were then compared more precisely over an interval of 10 seconds.e data analysis interval was arbitrarily chosen from 15 to 25 second in 30-second test data.
Figure 4. Raw EEG signals during the resting state
Figure 6.2: Figure 4
To compare the EEG signal characteristics of the two systems, the FFTs of the raw EEG were takenover one second for each system. en, correlation coefficients for the resulting power density valueswere computed for frequency bands of one to 30 Hz.
Table 2. Correlation coefficient values of FFT results
Time (seconds) Correlation Coefficient Meditation Rating Attention Rating15 – 16 0.771 73 6116 – 17 0.712 78 5617 – 18 0.858 80 4518 – 19 0.567 88 4119 – 20 0.564 93 4320 – 21 0.581 86 3821 – 22 0.321 95 4122 – 23 0.685 88 4323 – 24 0.751 85 4524 – 25 0.842 76 56Average power spectrum 0.715
As shown in table, the correlation coefficients of power spectrum between the two EEG signals werehigh enough. It means that frequency distributions of the two EEG signals are very similar.
December 15, 2009 | © 2009 NeuroSky, Inc. All Rights Reserved.11
Chapter 6 – EEG Signal of NeuroSky System
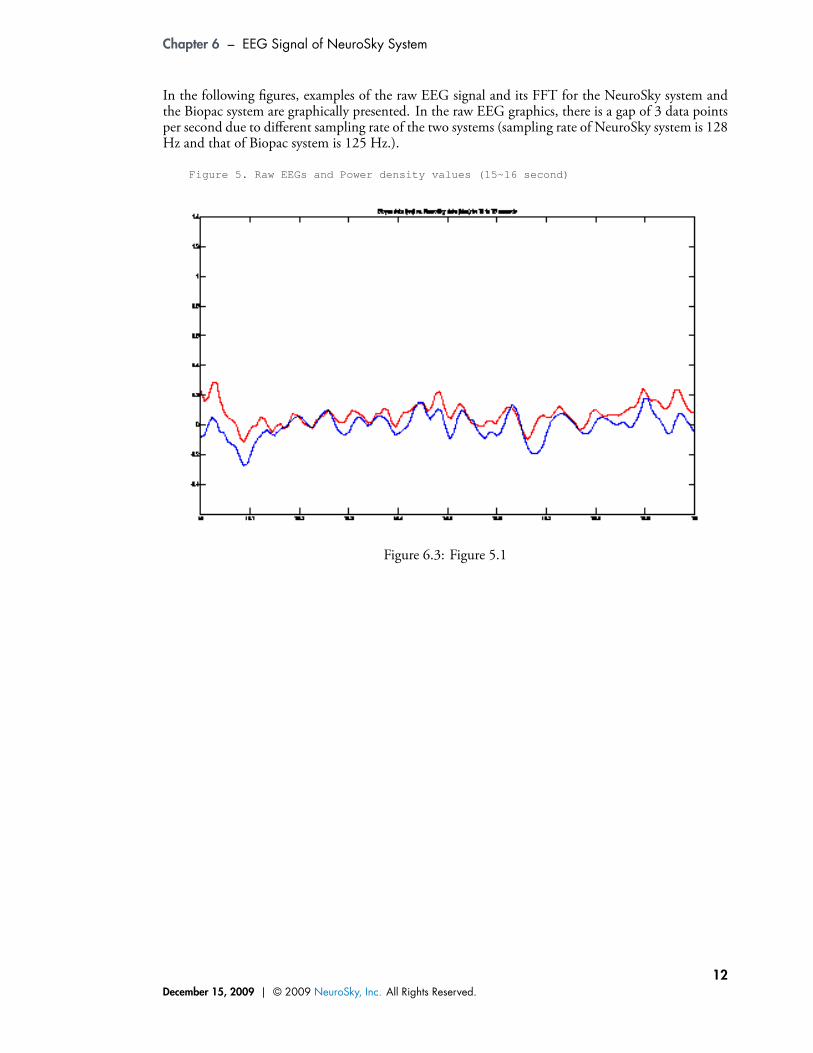
In the following gures, examples of the raw EEG signal and its FFT for the NeuroSky system andthe Biopac system are graphically presented. In the raw EEG graphics, there is a gap of 3 data pointsper second due to different sampling rate of the two systems (sampling rate of NeuroSky system is 128Hz and that of Biopac system is 125 Hz.).
Figure 5. Raw EEGs and Power density values (15~16 second)
Figure 6.3: Figure 5.1
December 15, 2009 | © 2009 NeuroSky, Inc. All Rights Reserved.12
Chapter 6 – EEG Signal of NeuroSky System
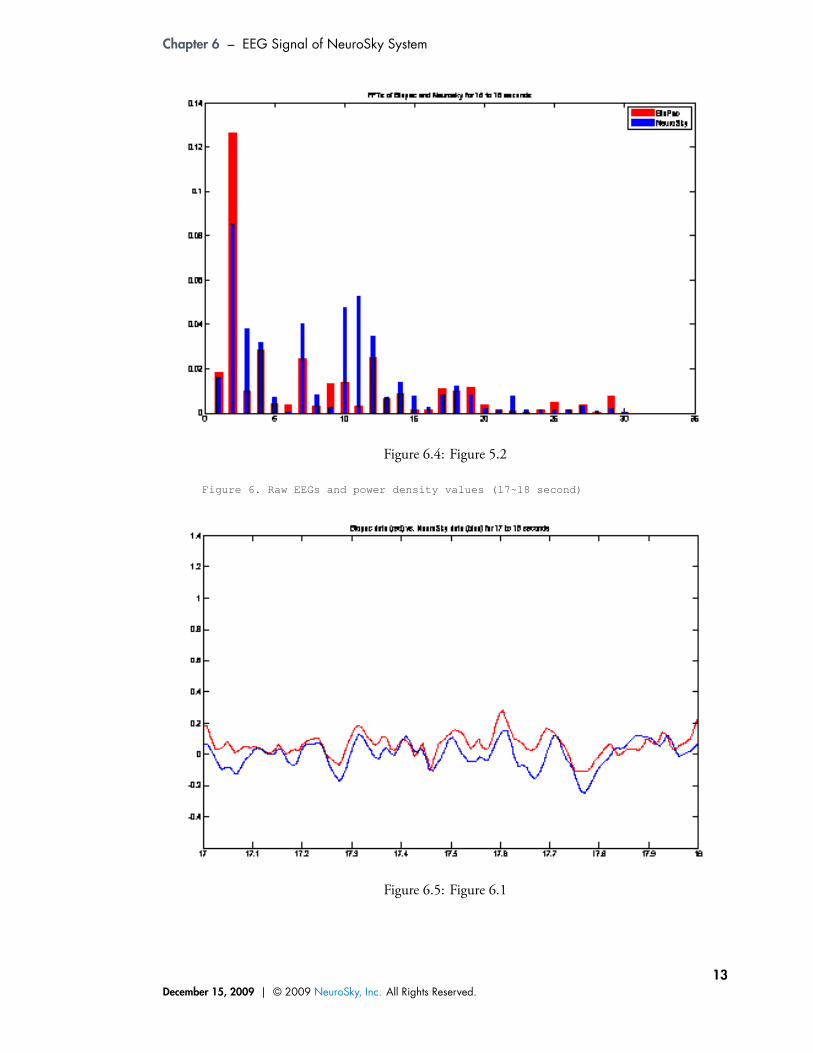
Figure 6.4: Figure 5.2
Figure 6. Raw EEGs and power density values (17~18 second)
Figure 6.5: Figure 6.1
December 15, 2009 | © 2009 NeuroSky, Inc. All Rights Reserved.13
Chapter 6 – EEG Signal of NeuroSky System
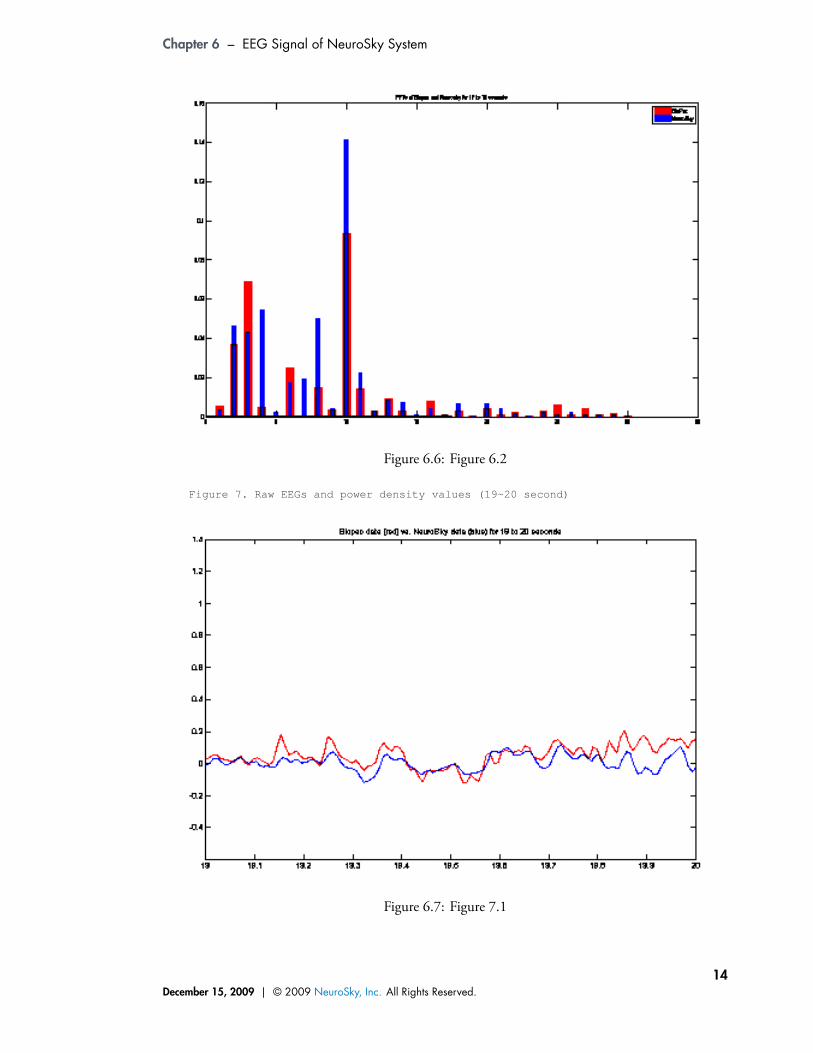
Figure 6.6: Figure 6.2
Figure 7. Raw EEGs and power density values (19~20 second)
Figure 6.7: Figure 7.1
December 15, 2009 | © 2009 NeuroSky, Inc. All Rights Reserved.14
Chapter 6 – EEG Signal of NeuroSky System
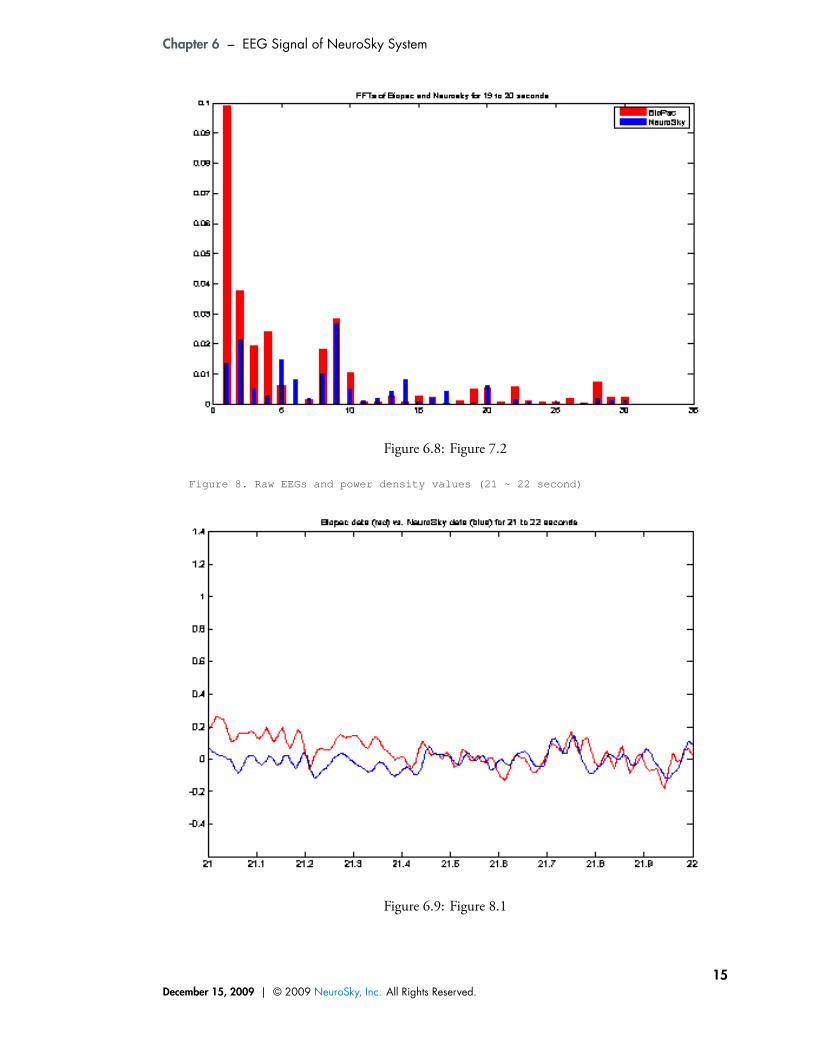
Figure 6.8: Figure 7.2
Figure 8. Raw EEGs and power density values (21 ~ 22 second)
Figure 6.9: Figure 8.1
December 15, 2009 | © 2009 NeuroSky, Inc. All Rights Reserved.15
Chapter 6 – EEG Signal of NeuroSky System
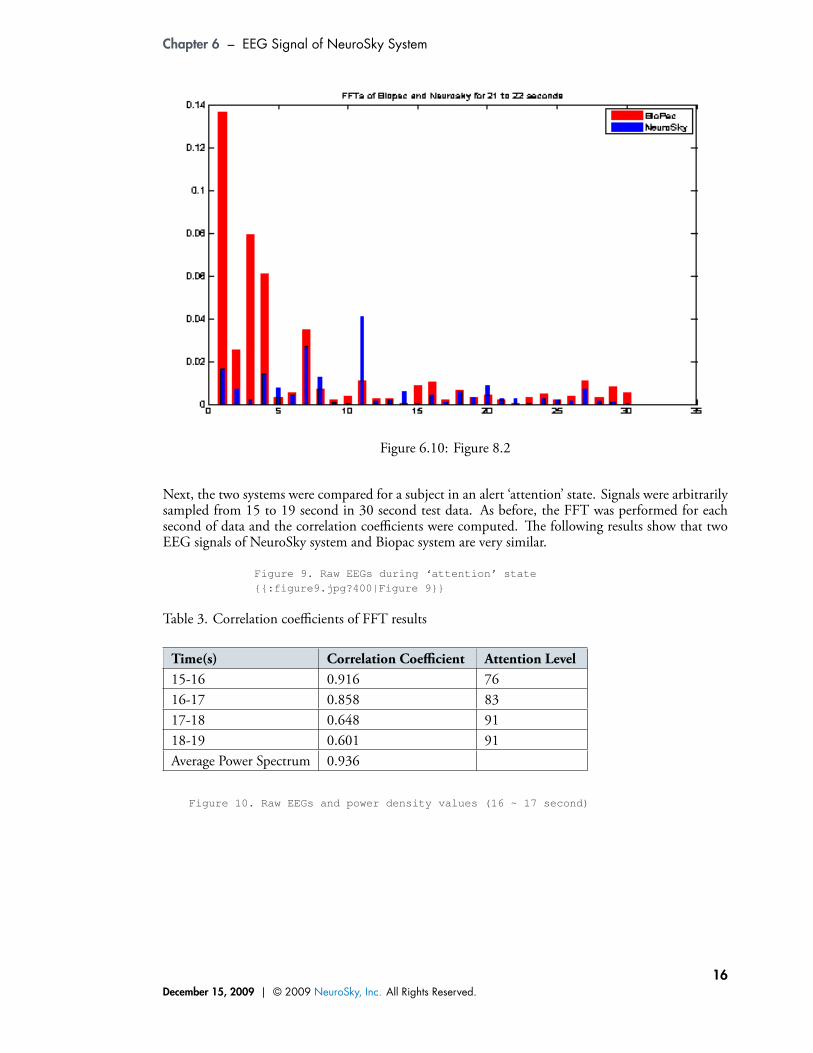
Figure 6.10: Figure 8.2
Next, the two systems were compared for a subject in an alert ‘attention’ state. Signals were arbitrarilysampled from 15 to 19 second in 30 second test data. As before, the FFT was performed for eachsecond of data and the correlation coefficients were computed. e following results show that twoEEG signals of NeuroSky system and Biopac system are very similar.
Figure 9. Raw EEGs during ‘attention’ state{{:figure9.jpg?400|Figure 9}}
Table 3. Correlation coefficients of FFT results
Time(s) Correlation Coefficient Attention Level15-16 0.916 7616-17 0.858 8317-18 0.648 9118-19 0.601 91Average Power Spectrum 0.936
Figure 10. Raw EEGs and power density values (16 ~ 17 second)
December 15, 2009 | © 2009 NeuroSky, Inc. All Rights Reserved.16
Chapter 6 – EEG Signal of NeuroSky System
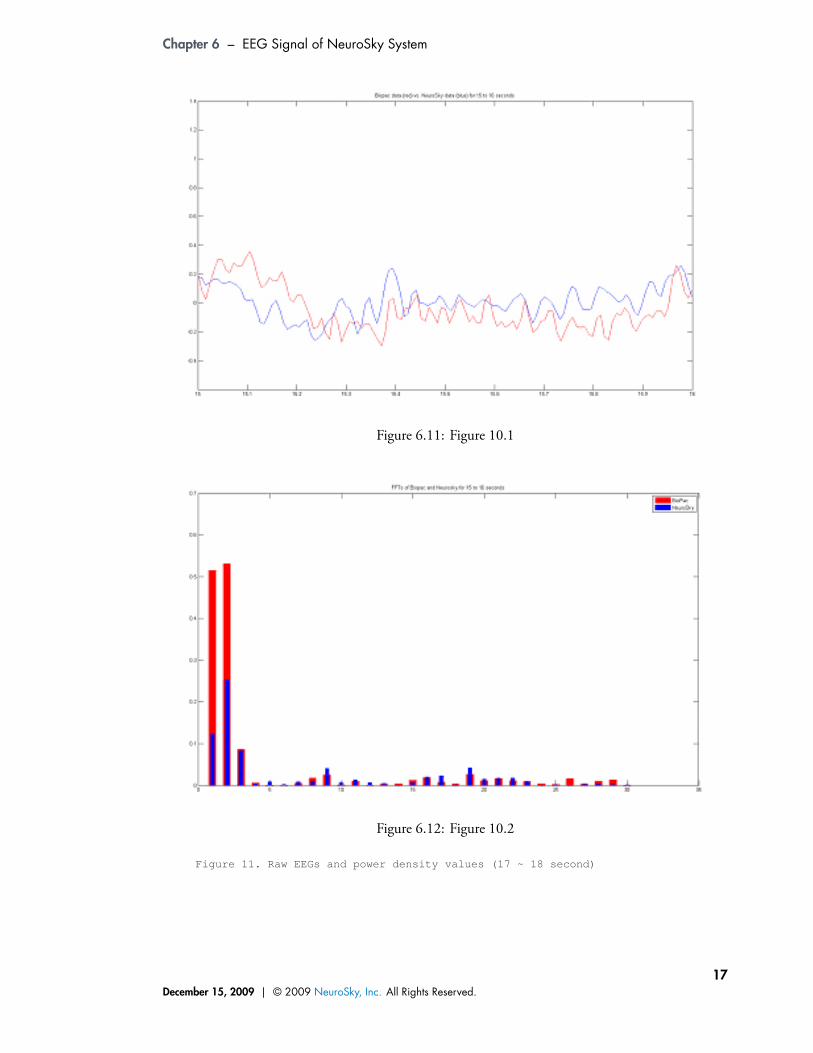
Figure 6.11: Figure 10.1
Figure 6.12: Figure 10.2
Figure 11. Raw EEGs and power density values (17 ~ 18 second)
December 15, 2009 | © 2009 NeuroSky, Inc. All Rights Reserved.17
Chapter 6 – EEG Signal of NeuroSky System
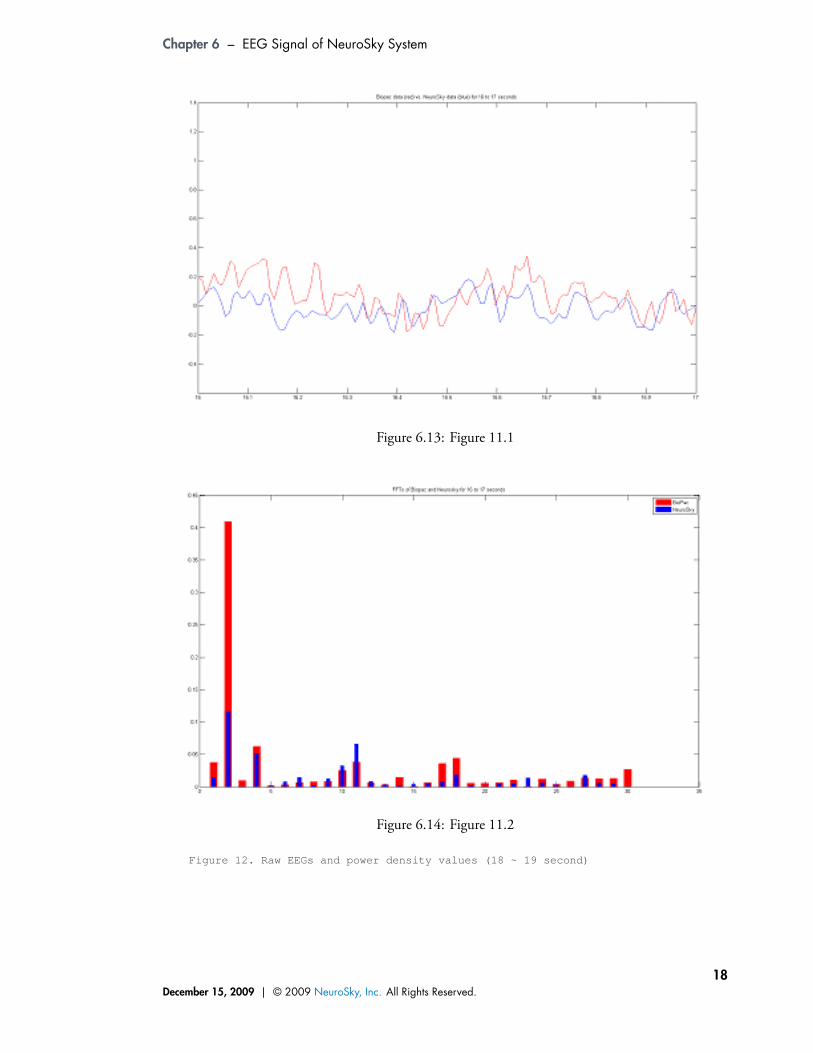
Figure 6.13: Figure 11.1
Figure 6.14: Figure 11.2
Figure 12. Raw EEGs and power density values (18 ~ 19 second)
December 15, 2009 | © 2009 NeuroSky, Inc. All Rights Reserved.18
Chapter 6 – EEG Signal of NeuroSky System
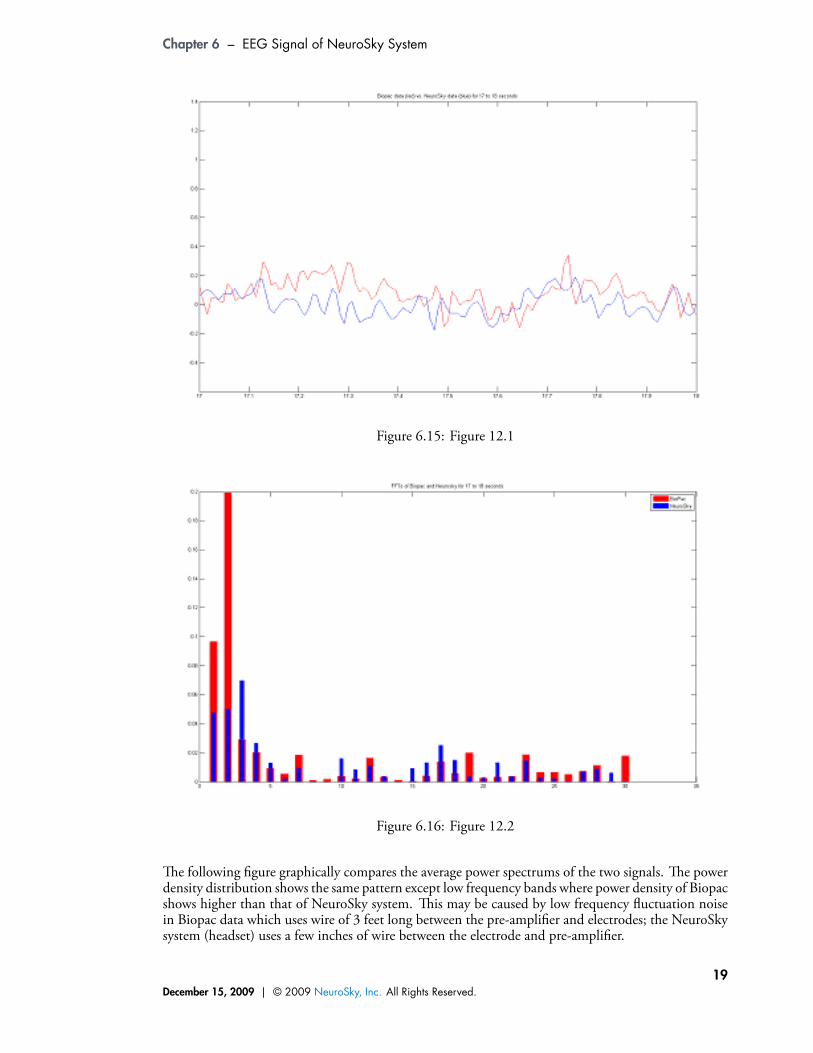
Figure 6.15: Figure 12.1
Figure 6.16: Figure 12.2
e following gure graphically compares the average power spectrums of the two signals. e powerdensity distribution shows the same pattern except low frequency bands where power density of Biopacshows higher than that of NeuroSky system. is may be caused by low frequency uctuation noisein Biopac data which uses wire of 3 feet long between the pre-ampli er and electrodes; the NeuroSkysystem (headset) uses a few inches of wire between the electrode and pre-ampli er.
December 15, 2009 | © 2009 NeuroSky, Inc. All Rights Reserved.19
Chapter 6 – EEG Signal of NeuroSky System
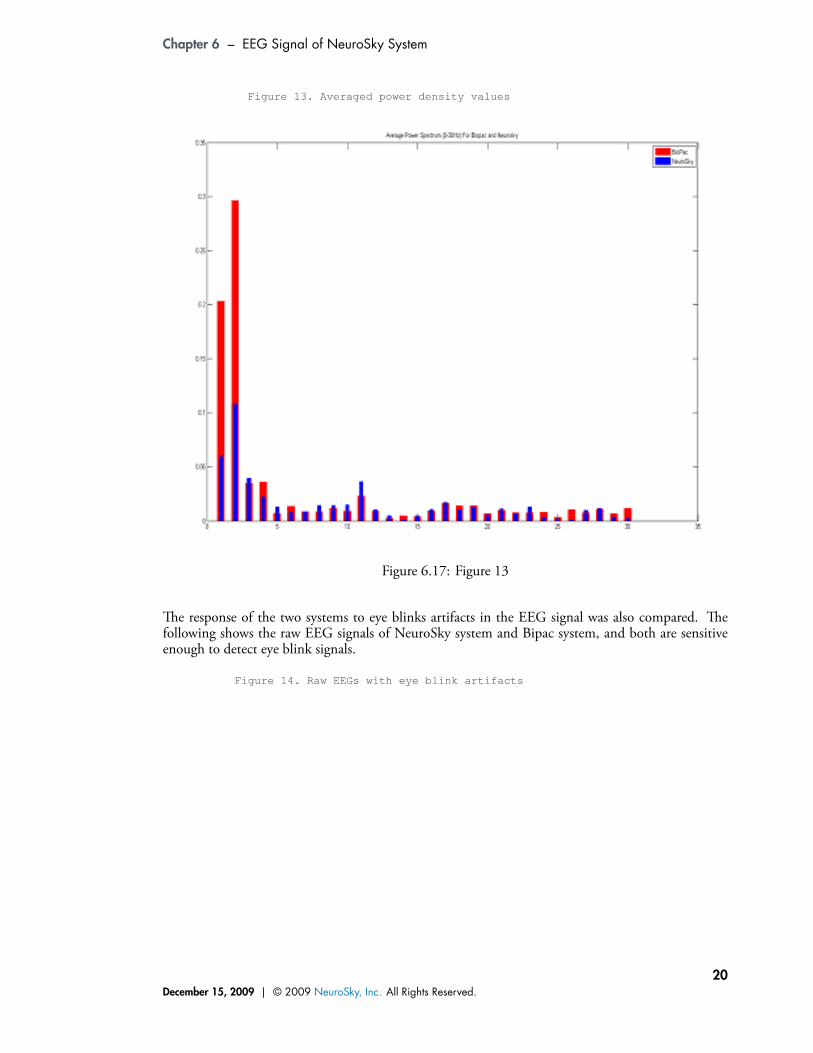
Figure 13. Averaged power density values
Figure 6.17: Figure 13
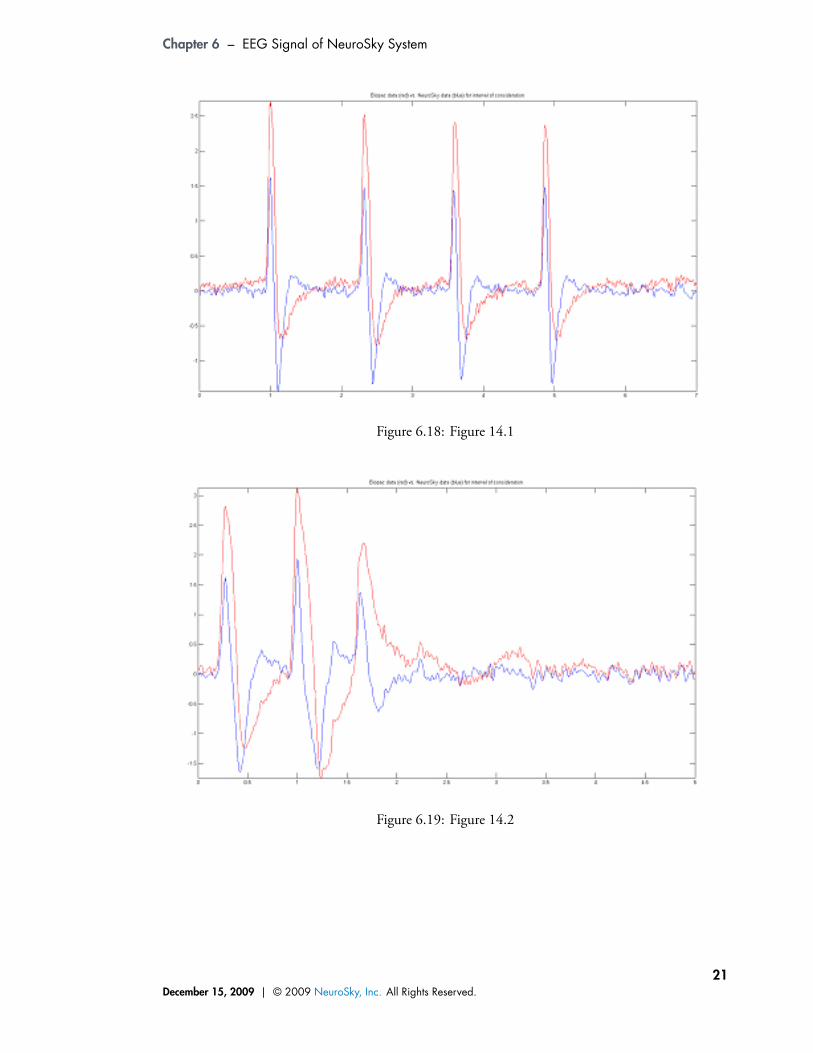
e response of the two systems to eye blinks artifacts in the EEG signal was also compared. efollowing shows the raw EEG signals of NeuroSky system and Bipac system, and both are sensitiveenough to detect eye blink signals.
Figure 14. Raw EEGs with eye blink artifacts
December 15, 2009 | © 2009 NeuroSky, Inc. All Rights Reserved.20
Chapter 6 – EEG Signal of NeuroSky System
Figure 6.18: Figure 14.1
Figure 6.19: Figure 14.2
December 15, 2009 | © 2009 NeuroSky, Inc. All Rights Reserved.21
Chapter 7
Summary
Raw EEG signals with dry electrodes of NeuroSky system were compared to those with wet electrodeswith Biopac system. FFTs were performed to compare signal characteristics of the EEGs, especiallypower spectrums. Results show that EEG signals of NeuroSky system are compatible to those ofBiopac system.
EEGs of Biopac system show a little bit more noise in low frequency bands. It may be caused by longerwires between electrodes and pre-ampli ers. e length of wires were 3 feet in Biopac system, whileshorter than 10 inches in NeuroSky system. NeuroSky system also xes the wires so that they cannotmove during EEG measurement. As a result, NeuroSky system is more noise-resistant. NeuroSkysystem may have an advantage when it is used in real living environment and consumer productapplications.
December 15, 2009 | © 2009 NeuroSky, Inc. All Rights Reserved.22


![On the Feasibility of Side-Channel Attacks with Brain ...intelli-sec.cs.berkeley.edu/papers/Usenix12_EEGattacks.pdfas Emotiv Systems [5] and NeuroSky [25] are offering low-cost EEG-based](https://static.fdocuments.net/doc/165x107/5f570ce4e1102f291e41ab6e/on-the-feasibility-of-side-channel-attacks-with-brain-intelli-seccs-as-emotiv.jpg)


![Forehead EEG in Support of Future Feasible Personal ... wearableEEG systems,such as Cognionics[32], Enobio [33] , NeuroSky[34]DSI 10/20 [35], and imec ... The presence of a new sensor](https://static.fdocuments.net/doc/165x107/5aa3cc4b7f8b9a46238ed2fc/forehead-eeg-in-support-of-future-feasible-personal-wearableeeg-systemssuch.jpg)
