Brain and Visual Perception - The Story of a 25-Year Collaboration - D. Hubel, T. Wiesel (Oxford,...
738
Transcript of Brain and Visual Perception - The Story of a 25-Year Collaboration - D. Hubel, T. Wiesel (Oxford,...

BRAIN ANDVISUAL PERCEPTION

Bevil Conway, "Spots and Bars: David Hubel and Torsten Wiesel" (2004), Hardground etchingand aquatint (edition:75).
I have depicted Hubel and Wiesel in the lab, in the early 1960s, at the pea\ of their exploration of the physiol-ogy of the early cat visual system. Hubel and Wiesel pulled bacf{ the metaphorical curtain on the blaci^-box thatwas the visual system and established a firm foundation for our understanding of visual processing in all mam-mals including humans. Their discoveries have totally transformed the way in which we understand vision, arevolution that will have repercussions in all fields of knowledge, not least of which being the practice of art: justas understanding anatomy revolutionized the way renaissance artists made art, so too will an understanding ofthe neural mechanisms of visual processing profoundly affect art making. "This frontispiece is a celebration ofHubel and Wiesel's achievement and serves as a reminder that science and art are constantly intertwined; in factit is precisely at the interface of the two that the most exciting discoveries are made.

BRAIN AND
VISUAL PERCEPTION
The Story of a 25-Year Collaboration
DAVID H. HUBEL
TORSTEN N. WIESEL
OXFORDUNIVERSITY PRESS
2005

OXPORDUNIVERSITY PRESS
Oxford New York
Auckland Bangkok Buenos Aires Cape Town Chennai
Dar es Salaam Delhi Hong Kong Istanbul Karachi Kolkata
Kuala Lumpur Madrid Melbourne Mexico City Mumbai Nairobi
Sao Paulo Shanghai Taipei Tokyo Toronto
Copyright © 2005 by Oxford University Press, Inc.
Published by Oxford University Press, Inc.
198 Madison Avenue, New York, New York 10016
http://www.oup.com
Oxford is a registered trademark of Oxford University Press
All rights reserved. No part of this publication may be reproduced,stored in a retrieval system, or transmitted, in any form or by any means,
electronic, mechanical, photocopying, recording, or otherwise,without the prior permission of Oxford University Press.
Library of Congress Cataloging-in-Publication Data
Hubel, David H.
Brain and visual perception : the story of a 25-year collaboration / David H. Hubel,
Torsten N. Wiesel.
p.; cm.
Includes index.
ISBN 0-19-517618-9
1. Visual pathways. 2. Visual perception. I. Wiesel, Torsten N. II. Title.
[DNLM: 1. Visual Perception—physiology—United States. 2. BiomedicalResearch—history—United States. 3. History of Medicine, 20th Cent.—United States. WW
11 AA1 H877b2005]
QP475.H8152005152.14—dc22 2004049553
2 4 6 8 9 7 5 3 1
Printed in the United States of America
on acid-free paper

To our wives and children,
who put up with so much.

This page intentionally left blank

CONTENTS
INTRODUCTION AND BIOGRAPHIESPARTI
1. David H.Hubel 5
2. Torsten N. Wiesel 25
PART II BACKGROUND TO OUR RESEARCH
3. Cortical Neurophysiology in the 1950s 37
4. The Group at Hopkins 41
5. The Move from Hopkins to Harvard 48
6. The New Department 53
PART III NORMAL PHYSIOLOGY AND ANATOMY
7. Our First Paper, on Cat Cortex, 1959 59
8. Recordings from Fibers in the Monkey Optic Nerve 83
9. Recording from Cells in the Cat Lateral Geniculate 91
10. Our Major Paper on Cat Striate Cortex, 1962 104
11. Recordings from Cat Prestriate Areas, 18 and 19 141
12. Survey of the Monkey Lateral Geniculate Body—A Foray into Color 193
13. Recording Fibers in the Cat Corpus Callosum 231
14. Recordings in Monkey Striate Cortex, 1968 244
15. Another Visual Representation, the Cat Clare-Bishop Area 273
16. Encoding of Binocular Depth in a Cortical Area in the Monkey 282
17. Anatomy of the Geniculo-Cortical Pathway: The Nauta Method 286
18. Ocular Dominance Columns Revealed by Autoradiography 317
VII

viii CONTENTS
19. Regular Sequences of Orientation Shifts in Monkeys 325
20. Cortical Modules and Magnification in Monkeys 354
PART IV DEPRIVATION AND DEVELOPMENT
21. The First Three Kitten Deprivation Papers 369
22. Second Group of Deprivation Papers 404
23. The Siamese Cat 455
24. Cells Grouped in Orientation Columns in Newborn Monkeys 480
25. Plasticity and Development of Monkey Ocular Dominance Columns 493
PARTV THREE REVIEWS
26. Ferrier Lecture, 1977 595
27. Nobel Lecture, David H. Hubel
Nobel Lecture, Torsten N. Wiesel 657
28. Epilogue: Summing Up 705
List of Papers Included 711
Glossary 713
Acknowledgments 721
Today, Forty-Six Years After Starting 723
Index 725

PARTI
INTRODUCTION AND
BIOGRAPHIES

This book is about a scientific collaboration that began in 1958 and lasteduntil 1983. It consists of reprints of papers we published over those years,with introductions and afterthoughts to each paper and an overall introduc-tion and final summary. We had several motives for compiling it. Having putour writing energies into our main papers, avoiding as far as we could thetemptation to write reviews or to contribute to symposia and book chapters,we hated to see our work get lost in bound journals on library shelves. Butmore than just that, we have always felt that scientific papers in the styles oftoday go out of their way to keep concealed the very things a reader maymost want to know. What led the authors to ask the questions in the firstplace? In what order were the different parts of the research taken up? Towhat extent was luck involved? What were the surprises? Was it fun? Howmuch competition was there? And above all, perhaps, who were the authorsand what were their lives like? Papers written a century ago feel much moreintimate than today's papers. One thinks of Wheatstone's introduction to thearticle in which he first described stereopsis, describing how Leonardo hadalmost, but not quite, made the discovery years before. Or Count Rumford'saccount of his discovery of colored shadows—how he "called two of myfriends who happened to lodge in the house (Lord and Lady Palmerston)into the room, and without letting them into the secret simply asked them,with a feigned air of indifference, which of the two colours they saw in thecentre of the circular piece of paper on the floor they thought the brightest".Today most papers seem dry, their juices sucked out, with little sense of thedelight that can accompany discovery. Doubtless the authors have wanted togive the impression of scientific rigor, following a custom of scientific writ-ing that treats science (with a capital S) as something with a separate exis-tence that is independent of the humans who are responsible for it. We findthe attitude unfortunate, but in our papers we have had to adhere to today'scustoms or face fierce editorial resistance. This book is in part an attempt torestore some of the juices.
Because this is the account of a collaboration between two people whocontributed equally, we began it by referring to each of us in the third per-
2

Part 1 Introduction and Biographies
son. The result seemed stilted and awkward. Today our paths have diverged,leaving me (D.H.H.) with time for writing and research, while Torsten'stime is occupied with running many scientific endeavors. Someone had to dothe writing, so the bulk of the story, except for our separate biographies, willbe told by me, in the first person. Nevertheless, what is said should beregarded as coming from the two of us in equal measure.
We apologize for not having led more adventurous lives. Neither of usclimbed Mount Everest, took part in the French Resistance, or sailed aroundthe world. Our purpose in the biographies is simply to give an impression ofhow we grew up and what kinds of people we are, things that are usuallycarefully kept out of scientific papers. Some will think that such things areunimportant, having nothing to do with science, where only facts are worthknowing. We simply don't agree. To take just two exalted examples, we wishwe had a more vivid sense of what Bach and Galileo were like as humans,and find it even harder to imagine what many of the scientists of the past cen-tury were like.
Our experiences in science do constitute a kind of adventure, and aboveall we hope that this book will convey some slight impression of that adven-ture, and of the fun of doing science. For us, on the whole, aside from the latenights and the fatigue, it has been a wonderful journey, a bit like a ride on aroller coaster. We have especially enjoyed the variety of our lives in research:the experiments, involving surgery, electronics, and any number of toy-likegadgets; the fun and torture of writing, the teaching and advising of stu-dents, interactions with a huge range of technicians, administrators, and col-leagues; the possibility of travel to all parts of the world (except Antarcticaand Greenland); and the interacting with other scientists—some ordinarylike ourselves and some giants. Above all else there has been the freedom, inchoosing problems and projects, and even in deciding what to do from onehour to the next.
From our papers one might easily be led to think that the research wasdogged, tedious, sedulous, demanding infinite patience. We are possiblyguilty of encouraging that impression in order to keep down competition.People would surely crowd into a field if they had any idea how exciting theexperiments can be. Finding a good cell and unlocking its secrets can be likefishing in richly populated streams without having to wait for the fish to bite,or playing with a wonderful new toy. Much of our time has been spent tin-kering, playing with forms, colors, and rates of movement in an effort tolearn what our cells need, in the way of stimuli, to make them react. Whenwe succeed, and suddenly can make a cell fire like a machine gun, it can bethrilling, and on a good day the thrills may come every few hours. Unlikemuch of today's science, in which the actual work is done by technicians orgraduate students, who pipette solutions from one column to another whilethe bosses write papers, raise money, or travel and talk about the graduatestudents' results, it is we who get to do the experiments—plus the otherstuff! When it comes to sheer fun, our field is hard to beat. We try to keepthat a secret.
3

PART I INTRODUCTION AND BIOGRAPHIES
It is hard to believe that we first began the project of collecting ourreprints and comments one summer far back in the late 1960s, at the SalkInstitute. We each had the loan of a beautiful studio-office, with floors cov-ered by rugs with thick piles and views of the Pacific through teak-framedwindows that would actually open, allowing us to hear the surf and distanttennis. The project did not take off, because it was so tempting either to lieon the rug and take a nap, or to escape to the tennis court or the beach. It wasso tempting that we did only one experiment that summer. If you werebrought up in Sweden or Canada and lived in Boston, La Jolla just wasn't theright place to get anything done. The ambiance was wrong. We missed therain. So the writing of the book lapsed for a few years, to be taken up again,then lapse again, finally to be almost abandoned—but not quite. Here, at last,is the final result, and we hope you enjoy it.
4

Chapter 1 • David H. Hubel •
GROWING UP IN MONTREAL
My parents were American and grew up in Detroit. In the Depression myfather, a chemical engineer, got a job as a chemist in Windsor, just across theborder in Ontario, Canada. He soon tired of the daily commute and tripsthrough customs, and finally moved permanently to Windsor, where I wasborn in 1926. At my birth my parents registered me as an American citizen,and so as a Canadian by birth and an American by derivation I grew up adual citizen with all of the mixed loyalties that implies. In 1929 my fatherwas transferred to Montreal, where I was brought up and educated andwhere I continued to live until the age of 28.
Our family lived in Outremont, a middle-class suburb of Montreal thatwas predominately French-speaking, and whose remaining English-speak-ing component was largely Jewish. English-speaking children attended the"Outremont Protestant Schools", "Protestant" meaning non-Catholic,which seems ironic given that on Jewish holidays out of a typical class ofthirty pupils at my school I would find myself in a class of about five otherProtestants. Our teachers were all English-speaking and non-Catholicbecause in Quebec, Catholics were not allowed to teach in "Protestant"schools. This had the strange and unfortunate result that French was taughteither by English-speaking teachers or by Huguenots imported from France.No effort was made to teach us to speak or understand French as spokenwith a French-Canadian accent, and after eight years of daily hour-longFrench lessons almost none of us could converse in French (Parisian orCanadian), nor could we understand the French spoken on a local radio sta-tion, or even read a French novel. At that time it was an economic necessityfor the French to master English, and they did, but English-Canadiansrarely bothered to learn French. We talked to our French neighbors inEnglish, and were unable to buy a ticket on a streetcar without beinglaughed at by the French conductors. So the potential advantages of grow-ing up in a bilingual society were largely lost.
5

PART I INTRODUCTION AND BIOGRAPHIES
We lived for the first seven years in the upper floor of a duplex, thelower floor of which was occupied by the French landlord's family. From thetime I was three years old until I turned eight I played nonstop with the land-lord's boy, Michael Fauteux, whom I first encountered on the day of ourarrival,' at a sandbox at the back of the house—so my first French word wassable, French for "sand" and pronounced in Canada "sawb". "Perhaps" was"p'tayt" (for peut-etre) and "I can't" was "poke-a-pab" (for "pas capable").We gradually concocted a language of our own, part English and partFrench, jabbering away as our parents listened amazed, unable to under-stand a word.
At school (I attended Strathcona Academy until my high school gradu-ation in 1943), the atmosphere was serious and encouraged hard work.Unfortunately, there was almost no emphasis on sports. Parents in the areawere not wealthy, and they wanted their children to get ahead. To get intoMcGill College one needed a matriculation grade of 65, unless one was Jew-ish, and then the required grade was 75. The result was that Jewish childrenworked harder and generally got better grades. Everyone was ranked in class;for the first few years I averaged around fifteenth out of a class of 30. The top-ranking three or four pupils were always girls, but in Grade 6 all the classesbecame segregated by sex, and I began to rank first in my all-boys class, a rankI continued to hold till the end of high school. Of course I would rather havebeen in a mixed class and have ranked lower. (My wife, Ruth, was more for-tunate. At her Montreal West school, pupils who got good grades wererewarded by being put in a mixed class.) Luckily for me my school was small,with about 150 pupils in each grade, divided into classes of about 28 each.Consequently the principal and the teachers knew most of the students in theschool by name. Our library was not great and lab facilities were poor, butthose things were probably far outweighed by our knowing our teachers andfellow students. Parents were not encouraged to butt into school affairs,something that must have saved the teachers much time and annoyance.
Most of our teachers were excellent. Schools in Canada were financedby the provinces rather than by the local communities, as they are in theUnited States, so that the quality of schools had nothing to do with thewealth of neighborhoods. In Montreal, the best English high school was inone of the poorest neighborhoods. My school was in a not-wealthy but not-poor part of Outremont, and ranked close to the top in the province. Withhigh school matriculation examinations set by and graded by the province,one ended by knowing one's exact grade and standing. In the last year ofhigh school I tied with a close friend for fourth place in Quebec province. Isuppose I did well partly because I was bright, but mainly because I workedhard, probably harder than I ever have since.
In my final year of high school I was especially lucky in two of myteachers. A history teacher, Miss Julia Bradshaw, was famous in QuebecProvince and vividly remembered and much loved by every graduate of myschool. Tiny, short, thin, redheaded Irish with a temper to match, sheassigned a weekly essay which she corrected with red ink, and was brutal in
6

David H.Hubd
her comments, especially with the top students. I learned more about writ-ing from her than from anyone before or since, perhaps partly because shewas more concerned with original ideas than with sentence structure. MyLatin teacher, Mr. Lindsay, was a mild-mannered man who had once taughtin a university and had a profound knowledge of classics. With his encour-agement and help I read an entire book of Caesar's Gallic Wars.
Unfortunately we were taught almost nothing about our neighbor tothe south—literally nothing, if one happened to be home with a bad sorethroat the one day U.S. history was covered. History was either British (andwonderful, with sovereigns like Henry VIII, Elizabeth I, and Edward II andthe red-hot poker) or Canadian, which was boring. In the upper high schoolgrades, world history in Miss Bradshaw's hands was superb, but tended tosteer clear of matters involving the United States. English literature meantBritish literature, plus the little that there was of English Canadian litera-ture, so we never heard of Walt Whitman or Mark Twain. And not a wordabout Tolstoy or Proust, to say nothing of French Canadian authors.
Neither of my parents was especially religious, though on my mother'sside one great-grandparent was a Methodist minister. My father's father wasborn in Nordlingen, Bavaria, and came with his family to the United Statesat the age of four. This charming Protestant town, in the centre of an ancientmeteorite crater, is separated from its strongly Catholic surroundings by astill-intact medieval wall. Both my parents were thus more anti-Catholic thansimply Protestant. I was sent to Sunday school at a United Church (Methodistunited with Presbyterian) in Outremont, but never got into the habit of reg-ular church attendance. I finally began to attend the Unitarian Church inMontreal, attracted there because beliefs are completely up to the individual,and because my piano teacher was organist. In the years that followed, mywife and I continued to attend the Unitarian Church in Washington, D.C.,where the minister, E. Powell Davies, was world-famous. Today we belongto the Wellesley Unitarian Church, though our attendance is irregular.
My mother's mild anti-Catholicism is well illustrated by an event thatoccurred years later. In 1992 I was invited along with all other living Nobelprize-winners to a celebration at the Vatican, at which the pope marked the350th anniversary of the death of Galileo, and formally apologized (as itwere) for the Church's treatment of him. After the pope's speech (which wasfor some reason in French) each prize-winner had the opportunity to be sep-arately introduced and to exchange a few words with the Holy Father. Mak-ing the introductions was an Italian gentleman with a camera, and each of uswas photographed shaking hands with the pope. On receiving copies of thepicture, some months later, I proudly sent one to my mother, I suppose toshow off the exalted company I was keeping. My mother without hesitationseized a pair of scissors, cut off the poor pope and threw that half picture inthe wastebasket. All my relatives on my mother's side of the family, theHunter side, have senses of humor that are rather special, and found thisevent hilarious in the extreme. Not all my friends have found the story quiteso funny.
7

PART I INTRODUCTION AND BIOGRAPHIES
I became interested in science at a very early age. My grandfather on myfather's side was part inventor and part businessman. He trained as a phar-macist, and became famous for devising the first process to mass-producegelatine capsules. On retirement he sold his Detroit factory and patents toPark Davis Company. My mother's father and two of her brothers werearchitects, specializing in churches that still stand in Detroit and varioustowns in Ontario.
Part of my success in school I owe to my father, whom I plagued withincessant questions until I knew more chemistry than my teachers. ForChristmas I was given my first chemistry set when I was five years old—aserious British-made set in the days before substances more interesting thansalt and sugar were considered poisons. I vividly remember, that Christmasday, watching my father transform a glass of water into a bright purple-redsolution with a single tiny crystal of potassium permanganate, and thenmake the color vanish by adding a pinch of sodium thiosulphate. In the yearsthat followed I assembled a collection of chemicals and simple apparatus. Inthose days it was easy to obtain any chemicals one wanted. At age 14 I wentdowntown by streetcar and came back with two brown glass-stoppered one-pound bottles of concentrated sulphuric acid and nitric acid. My collectionalready included a four-ounce bottle of potassium cyanide.
I produced hydrogen by pouring hydrochloric acid over zinc carpetbinding, and got the gas into a rubber balloon by looping its neck over theneck of a medicine bottle. I sent off many hydrogen balloons with attachednotes, one of which brought an answer, after many months, in French, froma farmer's daughter 100 miles away in Sherbrooke, Quebec. I mixed potas-sium chlorate (which I bought by the pound) with sugar and a small amountof potassium ferrocyanide, put the mixture in a sturdy brass cannon replicainherited from my grandfather, and packed it with a rag. A match insertedinto the Touch-hole produced a huge explosion that rattled the neighbors'kitchen pans, gave rise to a thin suspension of smoke over Outremont, andbrought two burly French policemen to the house. I told them that I had putfirecrackers in the cannon. They smiled and told me to stop doing that.
Of course I did not stop. On several occasions I climbed one of the Lau-rentian Mountains north of Montreal and fired off the cannon from the sum-mit, listening to the echoes as they came back, one by one, from the othermountains in the area.
My father was an avid photographer and we set up a darkroom in thebasement, where we developed film and made enlargements. I still keep upphotography as a hobby, and have spent hours in the darkroom at the lab, pho-tographing and reconstructing serial sections. Today black-and-whitephotography has largely given way to color, dark-room work at home hasbecome impractical, and film is increasingly replaced by digital cameras.
Another hobby, electronics, was prompted by my hearing, on a crystalset, a radio amateur broadcasting from a station a few blocks away. I builtseveral modest radios but had no one to advise me about electricity, and thefew books I could find were of little use. My main text was the Radio Ama-
8

David H.Hubd
teur's Handbook—a 1930s edition—which would have been opaque even toa college student, then or today. Nevertheless I did learn Ohm's Law andtried to understand L-C resonance. I built a more ambitious three-tubeshortwave radio that never worked despite months of effort. It suffered fromsomething called "motorboating", a series of loud clicks that drowned outany stations. Many years later I learned its cause—positive feedback thoughthe power supply—which could have been eliminated by an expert in min-utes. Discouraged, I lost interest in radio until in 1993, at age 67, my interestin radio revived and I passed five sets of ham radio exams, learned Morsecode, and took on, or revived, a new hobby.
My interest in music went back to an early age. Like most of our neigh-bors' families we had a piano, which both my parents and my older sisterplayed. I began to learn from my sister, who was three years older, andstarted formal lessons at the age of five. I acquired my first truly great musicteacher, George Brewer, a pianist and the leading organist in Montreal, whenI was midway through high school. Mr. Brewer was passionately fond ofBach and managed to impart that to me. I was only moderately talented anda hopelessly bad sight-reader: had it been otherwise I might have beentempted to go on with music as a career. I have wondered if my bad sight-reading, like my slow speed at ordinary reading, is related to my being left-handed.
A big advantage of growing up in Montreal was the easy availability ofboth skating—with rinks in almost every park—and skiing in the Lauren-tian Mountains 60 to 80 miles north of Montreal. One could take a train tosome Laurentian town and ski back one or two stations, often mostly down-hill, returning in the evening to the tune of riotous French-Canadian songslike "Alouette".
A large number of hobbies have been for me both a strength and acurse. Today I keep up interests in piano, flute, ham radio, weaving (rugs andblankets), amateur astronomy, photography, languages (French novelsmainly, some German, Japanese), and tennis. I make up for the time thoseinterests consume by reading as little as possible in my field of neurophysiol-ogy. Reading most papers today is like eating sawdust. I have been lucky inhaving co-workers who follow the literature compulsively and try to keepme informed.
In talking with young students I am impressed by the degree to whichtelevision and computers have replaced hobbies like chemistry (and explo-sives!), photography, and electronics. Our parents tended to leave us alone todevelop our own interests; they did not chauffeur us from ballet or Hebrewlessons to Little League baseball. Few of my friends' families had cars, whichwere in any case useless in Montreal's snowy and frigid winter. With parentswho didn't organize our lives it was much easier to reach the level of bore-dom necessary to think up things to do for ourselves.
As a twelve-year-old I found in a bookstore in Portland, Maine, a bookcalled The World of Science, by an Englishman named F. Sherwood Taylor. Itwas written for adults, I suppose, but was lucid, readable, and a virtual ency-
9

10 PART I INTRODUCTION AND BIOGRAPHIES
clopedia of science. I read every one of its 1050 pages. In the 1930s, books thattreated science on anything like an introductory level were almost nonexist-ent, and again and again I got caught up in puzzles to which I could not findanswers. There was of course my father, but his field was chemistry and heknew very little physics. Any science books around the house were hugeunreadable chemistry tomes by Mendeleeff and Mellor, so I spent days try-ing to figure out how electricity could go from positive to negative, when itconsisted of electron flow and electrons were negative. All I needed wassomeone to tell me that it was a matter of an unfortunate convention, andthat nothing actually went from positive to negative. That was long beforethe days when one had to consider holes as well as electrons; that wouldreally have confused me!
Given that I ended up a biologist, it is ironic that I had almost no formalinstruction in biology in grade school, high school, or college. In the final twoyears of high school our choice of concentration was between Latin, mathe-matics, and biology: Latin was recommended if one planned to go into med-icine—oddly given that the only direct application of Latin to medicine wasthe few words that would crop up in prescriptions to help make them incom-prehensible to the laity. Mathematics was for future engineers, and biologywas chosen by the less ambitious students. The advanced math that wasoffered was easy enough for me to cover one evening in the bathtub. I had got-ten to love Latin in the first two years of high school and chose that over biol-ogy, which I felt I could learn by myself or by reading The World of Science.
COLLEGE AND MEDICAL SCHOOL (1943-1951)
After high school I had hoped vaguely to go to MIT and even travelled toBoston for an interview, but that year (1939) World War II broke out, andplans to come to Boston had to be shelved. So I went to McGill College inMontreal, and lived at home. Socially, college was unexciting, partly becauseof living at home, without benefit of a car, with a daily round-trip commut-ing time of about two hours. I had developed a love for mathematics andphysics, and enrolled in a combined honors course in those subjects. I spentmuch time doing problems, which I loved, with few facts to memorize andenough time to keep up some hobbies, to attend most of the concerts in Mon-treal, and to read many novels. Physics at McGill was almost defunct, muchof the talent having been co-opted by the war. Mathematics was excellent,and although it did not turn out to be useful in any direct way in later work,it taught me the dangers of relying on reasoning that involves more than avery few steps.
Travel abroad during the war was impossible. Summers I spent mainlyworking on Quebec farms, where I learned to hitch a horse to a rake or amowing machine, to milk cows, and to thin turnips. One summer I jour-neyed with some college friends to a job on the north shore of Lake Superiorat a pulp-mill town called Red Rock. There I designed the town sewer sys-

David H.Hubel 11
tern and worked as an electricians' helper. One summer I spent on a farmnear the small town of Magog, which bordered a beautiful lake, Memphra-magog. The farm was owned by a wealthy Montreal businessman who ranit as a hobby and owned a cottage on the lake. During the day I farmed, andin the evenings I danced with the teenagers who summered on the lake. Ilook back on that summer as an oasis in what was otherwise a social desert.
At the end of my final year in college (1947) I had to decide what to donext. I did not want to be a mathematician and doubtless lacked the virtuos-ity. Attending an international physics congress in Montreal in 1943 showedme how inadequate my physics training had been, but for want of an alter-native I applied and was accepted to graduate school in physics at McGill.Almost on a whim I also applied to medical school, and to my horror wasaccepted there, too—so now I was faced with my first big career decision. Ihad no background or experience in medicine, but I suppose I had somevague ideas about applying physics to medical research, or else becoming aclinician, which sounded like fun. I also sensed that I was far from ready tomake any final career decisions. The length of medical training would giveme more time, and its breadth and greater range would ultimately give memore things to choose from.
By the time the registration date at the medical school rolled around Istill had not made up my mind. I phoned the secretary, a Miss Mudge (who,as I later learned, virtually ran the school) and explained my predicament.She replied, "Take your time, there's no hurry; just let us know what youdecide". I liked that generous attitude, and decided to give medicine a try. Soin the fall of 1947 I found myself in the first-year medical class, in which halfthe students were newly returned World War II veterans, three to four yearsolder than the rest of us, serious, and hard-working. Most of the studentswere of course men, in huge contrast with present-day medical classes.
Luckily medical school was not expensive. The fees at McGill were$400 a year, and by living at home and commuting I could end up debt-free.My father never breathed a word of protest at supporting me all those years,to say nothing of my parents' putting up with me around the house. Butsocially, compared to the lives led by most students today, life was pretty dry.
For me, medical school came as a shock. I had had almost no prepara-tion in biology. To fulfil entrance requirements, the summer before medicalschool, I had taken the equivalent of a semester each of invertebrate zoologyand botany, certainly an odd preparation for a future doctor. I looked on biol-ogy with the disdain that physicists often harbor. My worst disadvantage wasbeing unused to memorizing facts—I assumed that if I could understandwhat I read or what a lecturer said I did not need to do anything further. Theresult was that in the first set of mid-term exams I received four Cs, a com-pletely new experience. (C was in those pre-inflation days not a bad grade; itwas just average.) Obviously I had to start working, and discovered to mysurprise that if I worked at it even carbohydrate metabolism could be inter-esting. I later discovered that I could get enthusiastic over the more clinicalsubjects, even those almost devoid of intellectual content such as obstetrics. I
12 PART I INTRODUCTION AND BIOGRAPHIES
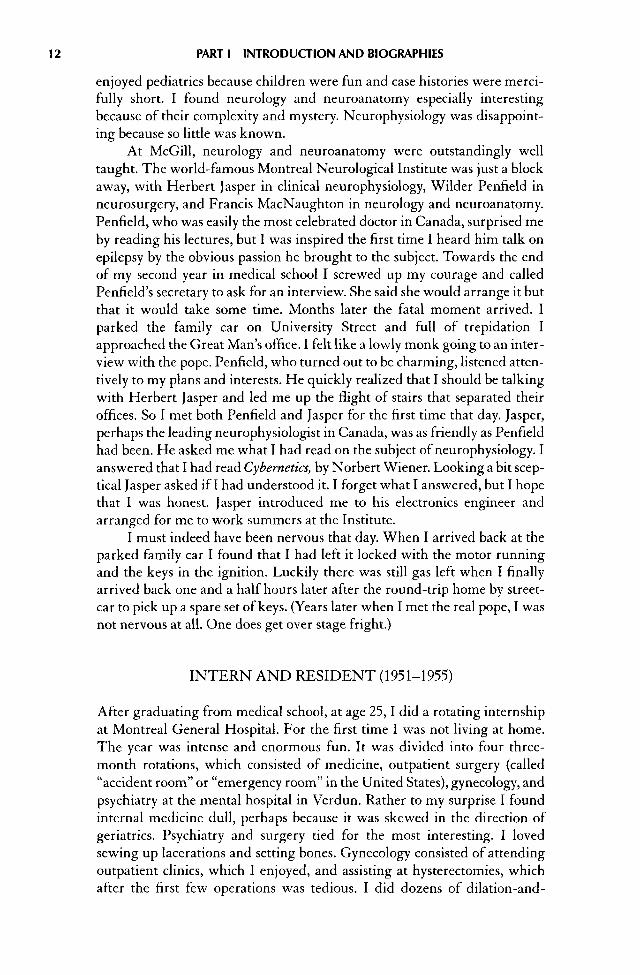
enjoyed pediatrics because children were fun and case histories were merci-fully short. I found neurology and neuroanatomy especially interestingbecause of their complexity and mystery. Neurophysiology was disappoint-ing because so little was known.
At McGill, neurology and neuroanatomy were outstandingly welltaught. The world-famous Montreal Neurological Institute was just a blockaway, with Herbert Jasper in clinical neurophysiology, Wilder Penfield inneurosurgery, and Francis MacNaughton in neurology and neuroanatomy.Penfield, who was easily the most celebrated doctor in Canada, surprised meby reading his lectures, but I was inspired the first time I heard him talk onepilepsy by the obvious passion he brought to the subject. Towards the endof my second year in medical school I screwed up my courage and calledPenfield's secretary to ask for an interview. She said she would arrange it butthat it would take some time. Months later the fatal moment arrived. Iparked the family car on University Street and full of trepidation Iapproached the Great Man's office. I felt like a lowly monk going to an inter-view with the pope. Penfield, who turned out to be charming, listened atten-tively to my plans and interests. He quickly realized that I should be talkingwith Herbert Jasper and led me up the flight of stairs that separated theiroffices. So I met both Penfield and Jasper for the first time that day. Jasper,perhaps the leading neurophysiologist in Canada, was as friendly as Penfieldhad been. He asked me what I had read on the subject of neurophysiology. Ianswered that I had read Cybernetics, by Norbert Wiener. Looking a bit scep-tical Jasper asked if I had understood it. I forget what I answered, but I hopethat I was honest. Jasper introduced me to his electronics engineer andarranged for me to work summers at the Institute.
I must indeed have been nervous that day. When I arrived back at theparked family car I found that I had left it locked with the motor runningand the keys in the ignition. Luckily there was still gas left when I finallyarrived back one and a half hours later after the round-trip home by street-car to pick up a spare set of keys. (Years later when I met the real pope, I wasnot nervous at all. One does get over stage fright.)
INTERN AND RESIDENT (1951-1955)
After graduating from medical school, at age 25,1 did a rotating internshipat Montreal General Hospital. For the first time I was not living at home.The year was intense and enormous fun. It was divided into four three-month rotations, which consisted of medicine, outpatient surgery (called"accident room" or "emergency room" in the United States), gynecology, andpsychiatry at the mental hospital in Verdun. Rather to my surprise I foundinternal medicine dull, perhaps because it was skewed in the direction ofgeriatrics. Psychiatry and surgery tied for the most interesting. I lovedsewing up lacerations and setting bones. Gynecology consisted of attendingoutpatient clinics, which I enjoyed, and assisting at hysterectomies, whichafter the first few operations was tedious. I did dozens of dilation-and-

David H.Hubel 13
curettages. I found the psychiatric patients, who were mostly psychotic, fas-cinating even though they were a complete mystery and treatment was mostunsatisfactory. The field seemed to lack theoretical underpinning, relyingeither on the ideas of Freud, which I found unconvincing, or on blandthough well-meaning recipes for living that lacked the strength and wisdomof Ann Landers.
During my year of medical internship I started going out with Ruth(my future wife), whom I met at the McGill choral society. (In the UnitedStates of America it would be called a "glee club"). One of Ruth's closestfriends was Ellen Simons, who was engaged to and later married MarioDuschenes, one of the leading flautists in Canada and also a consummaterecorder player. Ruth and I soon joined a group of about 20 recorder enthu-siasts, led by Mario. I began to work hard at the recorder, partly because nopiano was available at the hospital. I practiced at the eye clinic, which wasalways deserted in the evenings. I got good enough to be invited by Mario tojoin his recorder quartet, probably the only such quartet in Canada. I joinedthe musician's union, and in addition to doing several concerts in Montrealwe performed twice for the Canadian Broadcasting Company.
By 19521 was eager to start doing research—being 26 years old and neverhaving done a minute of research of any kind. But on Herbert Jasper's adviceI decided to do some clinical neurology as a background for future research inneurophysiology. So I put in a year of neurology residency at the MontrealNeurological Institute (MNI), and followed that by a year of clinical neuro-physiology (mostly electroencephalography [EEG]) with Herbert Jasper.
Students often ask me whether all that clinical training was really nec-essary. Would not a Ph.D. have been a more useful training for a researchcareer in neurophysiology? My answer is that I really can't say. One cannotgo back and do a control. But just out of college with a degree in mathemat-ics and physics I was certainly in no position to choose a research career. Ineeded the perspective that the medical training gave, but whether I neededseven years of perspective is anyone's guess. The research Torsten and I didlater, especially the work on visual deprivation, was clearly influenced by ourclinical backgrounds.
I was married in June, 1953, on an incredibly hot day the summer afterthe first neurology residency year. I had been engaged to Ruth far too long,but marriage had had to be postponed for lack of an income. We were mar-ried at the Montreal West United Church. Mario Duschenes played one ofour favorite pieces of music, the slow movement of the Bach solo flute par-tita. The reception that followed the wedding was marked by an incidentthat came close to a disaster. My sister, Joan, suddenly came up behind Ruthand began to slap her on the back vehemently. This unusual and seeminglynot very friendly behavior was prompted by Joan's noticing that Ruth's wed-ding dress was on fire. It turned out that the fire had nothing to do with theheat of the day—Ruth had walked a bit too close to the candles that deco-rated the festive table. The back-slapping extinguished the fire and savedRuth from a badly timed immolation. The guests must have thought that insupplying entertainment we were going a bit too far.

14 PART I INTRODUCTION AND BIOGRAPHIES
Our marriage had had to be postponed for financial reasons. As anintern and during the following year as a neurology resident I earned noth-ing, although the hospitals were generous enough to pay for our uniformsand our board and meals. The year after that, for reading so many elec-troencephalograms (EEGs), I was paid $1500 (per annum!), and during thefinal residency year at Hopkins I earned $35 a month. So for the first twoyears after we were married we lived on Ruth's slender earnings as researchassistant at one or another hospital. I am most grateful to her for keeping usgoing—and I am certainly resentful towards the medical profession of thatera for exploiting trainees the way it did. In the years that followed, Ruth wasgreat to put up so cheerfully with my late nights, and trips abroad that wereforeclosed to her because of having to take care of our children, and an oftentruculent and inconsiderate husband. Children would have to be postponeduntil I entered the army, when a captain's salary finally made that possible.
Today in medicine residents are paid infinitely more, given that thenwe were paid nothing. But at least our medical-school fees were far lower,compared with the astronomical fees of today. In the United States of Amer-ica, graduates from medical schools typically have accumulated debts of afew hundred thousand dollars. For those who wish to do research, there maybe additional years of training and little expectation of quick rewards at theend to help pay off the debts. At one point in my post-doctoral training Icould easily have used the research I had done to obtain a Ph.D. but the effortof writing a thesis seemed daunting and a bore. The doctorate would havebeen for the work I did at Walter Reed, in Washington, and would have beengranted by one of the few universities in the area. When I mentioned the pos-sibility to Steve Kuffler, he remarked, "From some universities you are bet-ter not to have a Ph.D.!"
I began the EEG year (1953-1954) at the MNI as apprentice to CosimoAjmone-Marsan, who taught me for three months but then left to take aposition as head of EEG at the labs that were just starting up at the NationalInstitutes of Health (NIH), in Bethesda. So with that brief preparation I tookover as Herbert Jasper's main assistant, being landed with all the institute'sEEGs except for those of the Penfield service, which were read by Jasperhimself. Reading EEGs was and probably still is largely empirical, with lit-tle understanding of what produces the electrical waves or why they changein conditions such as brain tumours or epilepsy. Turning the pages day afterday gave me writer's cramp. At the end of that year I resolved never again toread an EEG, though next to Jasper I was possibly the world expert on thesubject. I have stuck to that resolution.
During the EEG-fellowship year I took part in a course in which theFellows were assigned topics on which they had to give talks. By some luckychance I was given vision as my topic, a subject about which I knew almostnothing. In preparing, I happened to come across the 1952 Cold Spring Har-bor symposium, which included papers by Keffer Hartline and StephenKuffler. That was my first exposure to the idea of a set of nerve cells receiv-ing information from the environment and transforming it in a way that

David H.Hubel 15
could be useful to an organism. I was hugely impressed. I could hardly havepredicted that I would get to know both Hartline and Kuffler, and that Iwould one day become a close friend and associate of Kuffler's.
One day shortly after Ajmone-Marsan's departure, a young neurologist,Charles Luttrell, visited the Montreal Neurological Institute from JohnsHopkins Hospital to learn EEG, and it fell to me to teach him. Charles musthave been impressed with the instruction, because a few days after his returnto Baltimore he telephoned me, around 6:30 A.M., to ask if I would be inter-ested in the neurology residency at Hopkins. I consulted Jasper, and remem-ber his saying that Hopkins was not famous as a center for neurology, but wasa major center for neurophysiology, with such people as Mountcastle andKuffler. I had no other exciting prospects, and decided to accept. Up to thenI had had all my training in Montreal, and wanted to see something new.
Baltimore was insufferably hot when Ruth and I arrived from Mon-treal in July, 1954, and it was hard to find much beauty in it. To get out of theheat we went to a movie the first night. It was cooler there, but the movie,Gone with the Wind, was the longest and most tedious I have ever beenunlucky enough to sit through. (And as Canadians, we were not used to thereek of popcorn at movies.) We moved into an apartment on the ten hundredblock of North Broadway, which was very nearly a slum area but had theadvantage that most of our neighbors were Hopkins house staff. Our land-lady, who was nice enough, tried to alleviate the smell of garbage in the fronthall by liberally spraying it with cheap perfume. The combination of smellswas unpleasant but interesting. We found the cockroaches unpleasant, espe-cially the large variety that click as they scuttle along. We soon moved to abetter apartment a bit closer to the hospital and in a safer area, with a tinyback yard, small enough that the grass could be cut with a pair of kitchenscissors. Ruth got a job as assistant in the lab of Curt Richter, a famous,ingenious, eccentric psychologist, with a feel for biology. Ruth's project wasto study the history of the use of the rat as a laboratory animal. Richter hadon the wall of his laboratory a map of Baltimore that showed, by shading, theincidence of rat bites, and it was clear that we were living in the very epicen-ter of such events. (Both species, rats and cockroaches, fall into what Kafkamight have categorized as Ungezieffer in his novel Metamorphosis.} Ruth's jobgave us a tiny income. My own contribution as a resident was $17 a month,which was augmented by the kind head of neurology, Jack Magladery, whomanaged to dig up an additional $18. Rents were of course much lower thanthey are today, around $70 a month.
At Hopkins the atmosphere was exhilarating, lively, and informal. Atlunch everyone in fields related to neurology gravitated to the same table inthe doctors' dining room, and I soon met and got to know both Stephen Kuf-fler and Vernon Mountcastle, whose friendliness and informality made iteasy to forget that they were established high priests in neurophysiology.
Neurology at Hopkins was a branch of internal medicine, not a sepa-rate department, so the emphasis was quite different from what I had expe-rienced Montreal, where it was closely related to, and dominated by, neuro-

16 PART I INTRODUCTION AND BIOGRAPHIES
surgery. I saw two great clinicians in action, the pediatric neurologist FrankFord, and the neuro-ophthalmologist Frank Walsh. Their style of neurologywas far from the obsessively interminable histories and physical examina-tions that neurologists of the Queen Square tradition were famous for. Fordseemed hardly to take a history or examine his patients, and yet in thinkingabout it later one realized he had asked every important question and missednothing, and his diagnoses were almost always right. Walsh was dynamicand colorful, and introduced me to a field whose existence I had hardly evenbeen aware of. That was important, considering that I ended up a neuro-physiologist specializing in the visual system.
At Hopkins I found my previous clinical preparation no match for thehigh-powered training that was usual at the best clinical centers in the UnitedStates of America—except for my experience with epilepsy at the MontrealNeurological Institute. So I made my share of mistakes. These were to someextent eclipsed by two clinical coups that are fun to look back on. The chiefof neurology, Jack Magladery, cultivated an eccentric bedside manner. Healways began his neurological examination of a patient by listening to the eyeswith a stethoscope, never hearing anything but always impressing onlookers.One night I was prowling around the medical wards looking for interestingcases when one of the medical interns brought me to see a patient who was amajor puzzle, with a hemiparesis and an assortment of other symptoms thatI can't remember, and in any case made no sense to anyone. I began examin-ing him, and because a few house staff were looking on I started by listeningto the eyes. To my amazement, from one of the eyes came a noise like a pul-sating fire hose, a bruit the likes of which I had never heard before, and whichmade it immediately clear that this man's problem was a cerebral arteriove-nous shunt. So suddenly there were crowds of interns and residents aroundthe bed, and I had been catapulted to instant fame. That cancelled out anynumber of previous blunders. My second coup occurred when I was called tosee a young man with obvious meningitis, with stiff neck, headache, and painon straight-leg raising. The diagnosis was clear, and my job was to do the lum-bar puncture so that the spinal fluid could be cultured to determine the organ-ism. On a whim I decided to look at the spinal fluid myself instead of simplysending it to the bacteriology lab. I can still see the swarms of double bacteriaswimming in that fluid like infinity signs. So I could return to the wards tenminutes later and announce that the patient had pneumococcal meningitis,cancelling out still more former blunders and adding to my local fame.
WALTER REED AND BEGINNING RESEARCH (1955-1958)
As a dual citizen I was subject to the American draft, which up to then I hadescaped by never having resided in the United States. But I knew that onaccepting the Hopkins residency I would have to register for the doctor'sdraft. There was no war on then—it was between World War II andKorea—but because of a shortage in the armed services, doctors continued

David H.Hubel 17
to be called up for two years of service. I registered and was indeed called up,but was deferred until the end of the residency year at Hopkins. My choicewas between the army and the Public Health Service, and I applied first tothe U.S. Public Health Service, hoping to be assigned to a neurophysiologylaboratory at the NIH in Bethesda—that would have fulfilled the serviceobligation—but they were not interested. I introduced myself to a group ofneurophysiologists at Walter Reed Army Institute of Research, and probablybecause of my training in EEG they agreed to put in a request for me shouldI join the army. The Walter Reed people subsequently forgot to make therequest, and had I not reminded them just in time, I would have ended upspending the two years of service in Japan examining recruits.
So I arrived at Walter Reed Army Institute of Research, in Washing-ton, D.C., in August of 1955, as an army captain. We moved into a pleasantapartment (rat-free and roach-free) in Silver Spring, which we could affordbecause suddenly I was paid the huge annual salary of $10,000. At last wewere solvent. Ruth got a job as research assistant at the Armed Forces Insti-tute of Pathology, but worked there only up to the time of the birth of ourfirst boy, Carl. He was born at Walter Reed Army Hospital in 1955, forwhich the bill, after a week's stay, was $18.00. I have to compliment theobstetrics service at Walter Reed: among other things, at Ruth's request, noanesthetic was used for the delivery, only mild sedation. The delivery waseasy and uneventful. The experience for our second child, Eric, back in Bal-timore in 1959, was equally smooth. Our youngest, Paul, was born at BostonLying In, as it was then called. There the ultra-conservative obstetriciansinsisted on heavy anesthesia. Only at my urging was spinal anesthesiaavoided. My training in neurology was not entirely wasted!
Our three years in suburban Washington were relatively uneventful Iremember D.C. as populated mainly by civil servants, without much of a lifeor soul of its own. For amusement in the evening we would walk around theSilver Spring neighborhood looking into our neighbors' large apartmentpicture-living-room windows, which were then fashionable. We had therare opportunity to go regularly to concerts at the Library of Congress,where the Budapest String Quartet was in residence, and people in thearmed forces and their dependents could easily get tickets. Three years ofregular attendance was the musical experience of a lifetime.
To be part of the Walter Reed neurophysiology group was a fantasticpiece of luck. I had complete independence, the benefit of advice from mysupervisor, the spinal cord neurophysiologist Mike Fuortes; from RobertGalambos, a well-known auditory neurophysiologist; and the neu-roanatomist Walle Nauta, who was already one of the leaders of modernexperimental neuroanatomy and famous for developing a stain for degener-ating fibers that revolutionized that field. The entire group consisted of onlyabout a dozen people and was part of the neuropsychiatry section of WalterReed, led by the eminent psychiatrist and neuranatomist David Rioch. Noone tried to influence what I did, though everyone was helpful and generouswith advice. I could change direction of my research without consulting any-

18 PART I INTRODUCTION AND BIOGRAPHIES
one. The first day it was made clear to me that they hoped I would be thelocal EEG expert. Feeling slightly guilty over having come to Walter Reedunder false pretenses, I made my opinions about EEG clear. David Riochseemed to sympathize, and the matter was dropped.
I was lucky to have Mike (Michelangelo) Fuortes as my immediateadvisor. He was a young and vigorous Italian neurophysiologist with a won-derful biological sixth sense and a great sense of humor. The day I turned up,Mike wanted to know what, if anything, I had done in neurophysiology:Had I ever done any dissection? Had I ever anesthetized a cat? Had I evermade electrodes or run amplifiers? To all these questions the answers were"no". Mike, his face expressionless, turned and looked out the window for awhile. He then announced a plan for the day. He had intended to do a catspinal cord recording that morning, but decided that we should insteadbegin by setting up a frog sciatic-nerve recording so that I could learn aboutcompound action potentials. We postponed the cat to the afternoon. Thatwas my crash course in electrophysiology. In the next months we collabo-rated and completed a cat spinal cord project. Mike quickly composed anddictated a paper into some kind of dictaphone, the authors of which were tobe Fuortes and Hubel. That was my first publication. What impressed memost was Mike's emphasizing to me that the order of authors had nothing todo with priority but reflected the policy of The Journal of Physiology, in whichthe order of authors was strictly alphabetical. I had not heard of that rule,and in any case had not dreamed that I should be first author, but it was typ-ical of his generosity to point out the rule.
The time came to select a project of my own. Mike listed a few ideas forme to consider, one of which was to take fine insulated wires, cut them offwith scissors, poke them into cat cortex, sew up the cat, and hope to recordsingle cells when the animal recovered. I thought it worth trying, and so Ibegan a project that was to last three years.
The first experiments were utter failures, and I soon realized that Iwould have to develop an electrode fine enough to record from single cellsand stiff enough to push into the brain, and some way of advancing it in fine,controlled steps. So I began to work on developing a new electrode and ameans of holding and positioning it.
It took months before I succeeded in sharpening tungsten wire elec-trolytically—I was lucky to have the help of Irvin Levin, the head of instru-mentation, who had gotten his Ph.D. in electrochemistry. The use of potas-sium nitrite and removing metal with alternating current would never haveoccurred to me. The idea of electopolishing stainless steel wires had origi-nated with Harry Grundfest in 1950, but tungsten was better than steelbecause it was far stiffen The result was a point that looked sharp andsmooth even under an electron microscope. Finding a suitable insulatingmaterial to coat the wires took even longer, but as the weeks went by no oneever expressed the least impatience. The electrodes finally worked, betterthan any metallic electrodes then available, and suddenly the other electro-physiologists in the group had all switched to using them, and the word

David H.Hubel 19
began to spread to other laboratories. Preparing a paper on the electrode (inScience*} took some time because I wanted to see if it could be used for intra-cellular work and for direct-current (DC) recordings. It turned out that theimpedance to DC was astronomical, and the noise at low frequencies wasconsequently too high for it to be very useful. Like most others in the field, Imust have thought that more prestige attached to intracellular work than toextracellular. I abandoned any thoughts of intracellular recording, and setabout to record extracellularly from a wide sampling of different parts of thecentral nervous system. I put the electrode into the auditory cortex, cochlearnuclei (I had a free run of the auditory lab of Bob Galambos), the spinal cord,olfactory bulb, and lateral geniculate nucleus. One day, after a few months ofthis tour of the cat's central nervous system, Galambos gently asked if Iwasn't losing sight of my original plan to develop a technique for recordingfrom awake behaving cats. I took him seriously and buckled down to work.
Herbert Jasper, meanwhile, had gotten wind of the tungsten electrodeand came down from Montreal to Washington to learn to make them. Hisgroup was also trying to develop a system for recording single cells fromawake animals and had gotten as far as to plant a hollow screw in the catskull, to which an advancer could be attached. That was clearly a good strat-egy, but there remained the problem of closing the cortex to the atmosphere,to dampen the millimeter-size up-and-down cortical movements that wouldotherwise occur with each vascular and respiratory pulsation, the impor-tance of which Phil Davies had established in Mountcastle's lab some yearsbefore. I decided that to get anywhere with the project I would have todesign and develop the hardware myself. That meant learning to do machin-ing, so I got the head of the shop at a technical school in Washington, D.C.,to agree to take me on as an apprentice. In a few sessions I learned to work ametal-turning lathe, to drill metal, and to turn, face, and cut threads. AtWalter Reed I ordered and acquired a lathe and began to start work on myfirst advancer, a piston-cylinder combination made of brass, which could beattached to a 3/8-inch diameter nylon screw whose oversize threads satsolidly in the cat's skull. The first version worked well, but I slowly improvedit so that after some months I had equipment that I could continue to use forthe next few decades, at Walter Reed and later, with Torsten, at Hopkins andHarvard. (I love machining and continue to design and build equipment,almost as an additional hobby or as a form of occupational therapy. Had itnot been for Torsten's ability to keep his eye on the ball I might have squan-dered all my time playing with and designing equipment, rather than stick-ing to biology.)
Within a few months of Galambos' remark I did my first recording ofsingle cells from a cat that was looking around, purring, and unrestrainedexcept for a chest harness. The very first attempt was successful, and I was soexcited that I ran up and dragged David Rioch down to my lab to see therecording. It was not the first-ever such recording: Jasper's group had
^Science (1957, 125:549-550)

20 PART I INTRODUCTION AND BIOGRAPHIES
already succeeded doing awake-alert recordings (to be sure, with the help ofmy electrode!), but I had the satisfaction of being the first to see cells in analert cat respond to any kind of environmental stimulation.
I had chosen the visual cortex to record from, perhaps influenced by theHartline and Kuffler Cold Spring Harbor papers that I had read some yearsbefore, and partly because there was less temporal muscle covering the partof the cat skull between the visual cortex and the outside world. (Big deci-sions can sometimes depend on trivial considerations!) I began by compar-ing spontaneous activity and responses of cells in visual cortex in sleepingand alert cats. There were clear differences, but nothing that shed light onthe nature of sleep. There was also the slight difficulty that when asleep a catcloses its eyes, making visual stimulation problematic. My interests graduallyshifted to vision itself, especially to understanding what the visual cortex(area 17) was doing with the information that it gets from prior stages. I soonconfirmed the results obtained a few years before by Richard Jung and Giin-ter Baumgartner, in Freiburg, that cortical responses to diffuse visual stim-uli were of four types, "on," "off", "on-off", and an additional cell type thatthey called "Type A", which did not respond at all (Jung and Baumgartner,1955, Pfliigers Archiv. 261, 434-456).
Meanwhile, I had developed a way of making electrolytic lesions tomark recording sites so that they could be found microscopically. I wasdetermined to do this partly as a result of a conversation I had with the neu-roanatomist Jerzy Rose, on the steps of the Walter Reed Army Institute ofResearch. Jerzy was coming over regularly from Hopkins Medical School tocollaborate with Bob Galambos on an auditory neurophysiology project. Iasked him if he thought it necessary for neurophysiologists to monitor theirrecording sites histologically. He seemed a bit surprised at the question andreplied emphatically that it was, indeed, absolutely essential. Grundfest hadidentified the tip positions of his steel electrodes by passing current and stain-ing with the Prussian Blue reaction. I resolved to stick with tungsten becauseof its stiffness, and I was also afraid that depositing iron would turn the elec-trodes into windsocks. It seemed clear that I had to work out a way of mak-ing micro-lesions with my new electrodes.
I began by passing currents through egg white to get an idea of theappropriate current magnitude and time to produce a reasonable-sized spotof coagulation. The first trials in brain tissue were most encouraging; thelesions, about 100 microns in diameter, seemed perfect for assigning cells tolayers and were easy to find. I made my first lesion, in a real experiment, afterrecording from a typical Jung "on" cell (type B, in their terminology), andwas astounded on sectioning the brain to find it comfortably nestled in sub-cortical white matter. That was important because it showed that microelec-trodes like mine could easily record from fibres (something the micropipettesof those days could not do) and in raising the suspicion that the "on", "off"and "on-off" cells of Jung's group were not really cortical cells at all, butfibers coming up to the cortex from the lateral geniculate body. This at onceraised the further suspicion that many of the cells I was seeing, those that did
David H. Hubel 21
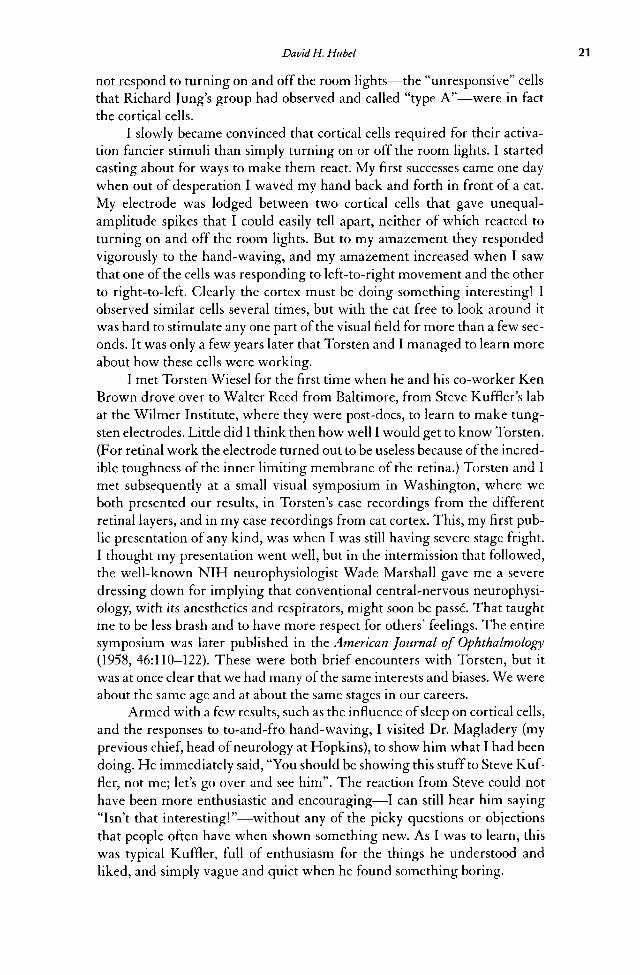
not respond to turning on and off the room lights—the "unresponsive" cellsthat Richard Jung's group had observed and called "type A"—were in factthe cortical cells.
I slowly became convinced that cortical cells required for their activa-tion fancier stimuli than simply turning on or off the room lights. I startedcasting about for ways to make them react. My first successes came one daywhen out of desperation I waved my hand back and forth in front of a cat.My electrode was lodged between two cortical cells that gave unequal-amplitude spikes that I could easily tell apart, neither of which reacted toturning on and off the room lights. But to my amazement they respondedvigorously to the hand-waving, and my amazement increased when I sawthat one of the cells was responding to left-to-right movement and the otherto right-to-left. Clearly the cortex must be doing something interesting! Iobserved similar cells several times, but with the cat free to look around itwas hard to stimulate any one part of the visual field for more than a few sec-onds. It was only a few years later that Torsten and I managed to learn moreabout how these cells were working.
I met Torsten Wiesel for the first time when he and his co-worker KenBrown drove over to Walter Reed from Baltimore, from Steve Kuffler's labat the Wilmer Institute, where they were post-docs, to learn to make tung-sten electrodes. Little did I think then how well I would get to know Torsten.(For retinal work the electrode turned out to be useless because of the incred-ible toughness of the inner limiting membrane of the retina.) Torsten and Imet subsequently at a small visual symposium in Washington, where weboth presented our results, in Torsten's case recordings from the differentretinal layers, and in my case recordings from cat cortex. This, my first pub-lic presentation of any kind, was when I was still having severe stage fright.I thought my presentation went well, but in the intermission that followed,the well-known NIH neurophysiologist Wade Marshall gave me a severedressing down for implying that conventional central-nervous neurophysi-ology, with its anesthetics and respirators, might soon be passe. That taughtme to be less brash and to have more respect for others' feelings. The entiresymposium was later published in the American Journal of Ophthalmology(1958, 46:110-122). These were both brief encounters with Torsten, but itwas at once clear that we had many of the same interests and biases. We wereabout the same age and at about the same stages in our careers.
Armed with a few results, such as the influence of sleep on cortical cells,and the responses to to-and-fro hand-waving, I visited Dr. Magladery (myprevious chief, head of neurology at Hopkins), to show him what I had beendoing. He immediately said, "You should be showing this stuff to Steve Kuf-fler, not me; let's go over and see him". The reaction from Steve could nothave been more enthusiastic and encouraging—I can still hear him saying"Isn't that interesting!"—without any of the picky questions or objectionsthat people often have when shown something new. As I was to learn, thiswas typical Kuffler, full of enthusiasm for the things he understood andliked, and simply vague and quiet when he found something boring.

22 PART I INTRODUCTION AND BIOGRAPHIES
My two years in the army at Walter Reed had gone so well that Idecided to stay on for another year as a civilian. That gave me the chance tofinish up the research and start writing it up for publication. Near the end ofthe third year I was attending one of the small informal conferences thatwere held regularly and jointly between people from Bethesda, Walter Reed,and Johns Hopkins, when Vernon Mountcastle came up to me and asked ifI would be interested in returning to Baltimore to join the physiology depart-ment at Johns Hopkins, and to continue my work on vision. I was flattered,and accepted eagerly. In the field of cortical neurophysiology Vernon was theworld leader. His discovery in 1957 of columns in cat somatosensory cortexwas the most important landmark in cortical neurophysiology since topo-graphic localization.
BACK TO BALTIMORE AND THE BEGINNINGS OFCOLLABORATION WITH TORSTEN (1958)
When the time drew close for Ruth, Carl (our two-year-old), and me to moveback from Washington (Silver Spring) to Baltimore, word came from Ver-non that there would be a delay of at least six months before I would be ableto set up a lab there, because the physiology department was remodelingtheir entire space. One day while I was wondering what I should do with thesix months, Steve Kuffler telephoned to ask if I would be interested in work-ing in the interim in his labs at the Johns Hopkins Wilmer Institute of Oph-thalmology. Kenneth Brown, who had been collaborating with Torsten, wasmoving to San Francisco, and Torsten would welcome someone to workwith. That seemed a perfect solution because it offered me the chance tolearn visual physiology, in particular retinal physiology, from experts.
In 1958, a month before the projected time of the move, I drove overfrom Washington, D.C., to Johns Hopkins Hospital in Baltimore to meetwith Stephen Kuffler and Torsten Wiesel for lunch. Torsten and I were tostart working together in July, and we wanted to make plans. What weshould set out to do seemed obvious. Torsten had the equipment and tech-niques for controlled stimulation of the retina. He had already succeeded inrecording intracellularly from all the retinal layers and was an authority onretinal physiology, a subject in which I had no first hand experience. On theother hand I had the techniques that I had developed for recording from cor-tical cells in awake cats, which could easily be adapted for use in anesthetizedanimals.
That day we decided to try to map receptive fields of cells in the visualcortex, using some of the methods Stephen Kuffler had used so successfullyin the retina. The optic nerve fibers do not project directly from the retina tothe cerebral cortex but end in two nests of cells deep in the brain, called the"lateral geniculate bodies", and it is the geniculate cells that feed into the pri-mary visual cortex. It was not clear what, if anything, the lateral geniculate

David H. Hubel 23
might be doing with the retinal input before relaying it on to the cortex, butwe decided to finesse that question and proceed right to the cortex. That ofcourse was unsystematic, even unscientific, but it seemed to us more exciting.If we found interesting differences between the behavior of retinal ganglioncells and cells in the cortex, we could always go back and look at the lateralgeniculate to see if any changes had occurred there.
We decided to revert to anesthetized animals because we had no hope oftraining cats to fix their gaze on a spot on a screen, in order to stimulate theretina in a controlled way. (Cats can be stubborn and unccoperative, and arenotoriously hard to train to do anything that is against their nature. They arenot good at visual tasks.) We had no guarantee that cortical cells in an anes-thetized animal would respond to any kind of visual stimulation, given thatanesthetics tend to suppress synaptic transmission, but that was a chance wehad to take. I hated to give up the techniques I had taken such pains to developfor working with awake behaving chronically prepared cats, but the advan-tages of joining forces with someone already expert in receptive field studieswere obvious, and I would soon be going back to the chronic studies—or soI thought.
We moved back to Baltimore in the early summer of 1958. We renteda rowhouse in an area of Baltimore called Rodgers Forge, which was attrac-tive physically but turned out to be stultifying. Baltimore consists largely ofrowhouses, red brick and of two types, older and newer, a million of each,like two species of fungus. The older ones included the houses around Hop-kins Hospital, and we had occupied one of those, with its tiny back yard,during my first neurology-residency year at Hopkins. Our neighbors hadmainly been Johns Hopkins Hospital house staff, and we had felt at home.Rodgers Forge, on the contrary, was an example of Baltimore at its most eth-nically monotonous. It happened to be Roman Catholic, where a Presbyter-ian or Unitarian was a rank outsider and a Jew or black prospective buyerwould not even be shown houses. As Unitarians we felt isolated. The houseswere like peas in a pod. One night, coming back after a late experiment, I gotto the front door before sensing vaguely that something was amiss. It turnedout that the house number was right but the street was wrong. I discoveredmy mistake before trying the key, which for all I know might have worked.I had come close to invading a Catholic neighbor's privacy.
I soon settled in at the Wilmer Institute at Hopkins. Torsten and Ishared a lab, about 15 feet by 15 feet, which included my office space. Thetime Torsten and I had to collaborate was to be short (or so it seemed then),and we felt pushed to get going. We did our first recording of cortical cells inJuly, 1958, within a few weeks of joining forces, and in a few more weeks webegan to get the first glimmerings of what lay ahead. On returning homefrom our first experiment I remember telling Ruth that I thought that thenew collaboration was going to work out well. It was clear that with similaroutlooks in science and many common outside interests, we were going toenjoy working together. This became even clearer with the passage of time.

24 PART I INTRODUCTION AND BIOGRAPHIES
I had much to gain from Torsten's profound insight into science and people.As important as anything was his drive, his reluctance ever to put off exper-iments, in marked contrast to my tendency to seize any excuses to postponethem, especially when there was a chance of developing some new tech-nique—to build some new gadget, even if we had no real need for it. Torstenhad an ability to see what was important to our progress.
Chapter 2 • Torsten N. Wiesel •
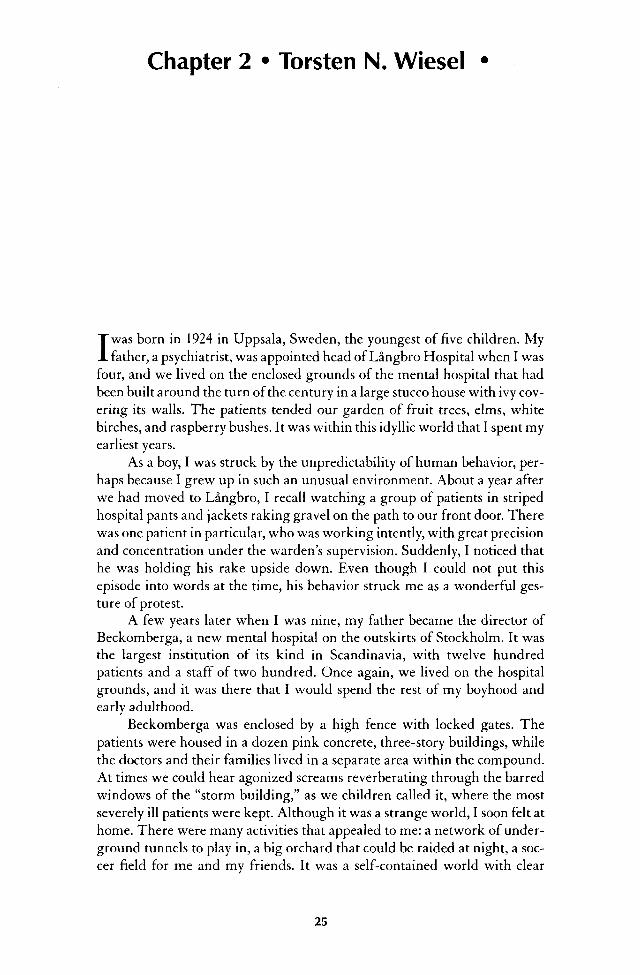
Iwas born in 1924 in Uppsala, Sweden, the youngest of five children. Myfather, a psychiatrist, was appointed head of Langbro Hospital when I was
four, and we lived on the enclosed grounds of the mental hospital that hadbeen built around the turn of the century in a large stucco house with ivy cov-ering its walls. The patients tended our garden of fruit trees, elms, whitebirches, and raspberry bushes. It was within this idyllic world that I spent myearliest years.
As a boy, I was struck by the unpredictability of human behavior, per-haps because I grew up in such an unusual environment. About a year afterwe had moved to Langbro, I recall watching a group of patients in stripedhospital pants and jackets raking gravel on the path to our front door. Therewas one patient in particular, who was working intently, with great precisionand concentration under the warden's supervision. Suddenly, I noticed thathe was holding his rake upside down. Even though I could not put thisepisode into words at the time, his behavior struck me as a wonderful ges-ture of protest.
A few years later when I was nine, my father became the director ofBeckomberga, a new mental hospital on the outskirts of Stockholm. It wasthe largest institution of its kind in Scandinavia, with twelve hundredpatients and a staff of two hundred. Once again, we lived on the hospitalgrounds, and it was there that I would spend the rest of my boyhood andearly adulthood,
Beckomberga was enclosed by a high fence with locked gates. Thepatients were housed in a dozen pink concrete, three-story buildings, whilethe doctors and their families lived in a separate area within the compound.At times we could hear agonized screams reverberating through the barredwindows of the "storm building," as we children called it, where the mostseverely ill patients were kept. Although it was a strange world, I soon felt athome. There were many activities that appealed to me: a network of under-ground tunnels to play in, a big orchard that could be raided at night, a soc-cer field for me and my friends. It was a self-contained world with clear
25

26 PART I INTRODUCTION AND BIOGRAPHIES
divisions and boundaries. I had my own key to the gates and felt more securewithin the hospital grounds than I did in the world outside its borders.
Certain patients were allowed to move freely around the grounds, andit was not unusual to see them displaying odd behavior. Since such thingswere never discussed in my family, I accepted these incongruities withoutquestion; if I wondered about them, I sought to explain them to myself. Onepatient, who worked as a carpenter on the hospital grounds, fascinated mebecause he had the ability to speak backwards. I ran into him on an afternoonwhen he was doing some repairs in the attic of one of the buildings. As wewere speaking, he took out an axe and hammer from his tool chest, and Irealized suddenly that I was in a precarious situation. This man, toweringover me with an axe, could cause me serious harm. How could I know whathe was thinking? I thought of running away, but instead, I observed inmyself a clash of emotions—respect and fear, all at once—and nonetheless Idecided to stay.
Holidays, too, were colored by the circumstances in which I lived. OnChristmas Eve, our father would take the five of us children into the wardsto wish everyone Godjul. A Christmas tree glistened in each common room,and the patients were dressed up in their best clothes, but only a few had vis-itors. That evening, we would celebrate a traditional Swedish Christmas atour home, with my father dressing up as Santa Glaus and handing out pres-ents, followed by our dancing hand-in-hand around our tree. Even so, thesefestivities did not obscure the loneliness I had witnessed earlier in the day.Images of the sick and abandoned lingered in my mind.
After our move to Beckomberga, my parents enrolled me in Whitlock-ska Samskolan, a coeducational private day school in Stockholm. My favoritesubject was history, taught by a dynamic woman instructor, but I was a poorstudent in most other courses. My parents divorced when I was fourteen, and,perhaps because of my distress, I had trouble concentrating on my home-work. I excelled only in athletics, especially track and field, and this helped toprovide me with a focus while so much else in my life seemed to be fallingapart. One of my responsibilities as head of the athletic society that year wasto give a short speech at the school's Christmas festivities. I wanted to look mybest for the occasion, so I dressed up in a dark suit and bow tie. After my talk,a girl in my class approached me and said, "I see you've left your galoshes on".I've often thought of that humiliating moment: you go up on stage, your headpuffed up with the illusion that you are somebody, but in reality, you're noth-ing but a chucklehead.
Given my interest in sports, I followed the 1936 Olympic Games closely.That was the year when Jesse Owens embarrassed Hitler and the Nazi partyby winning four gold medals. It was my first real exposure to the depth ofracial discrimination and to the nature of the Nazi regime. Around the sametime, I began to follow the developments of the civil war in Spain, and feltthe first stirrings in myself of opposition to fascism and communism. Amongmy soccer teammates, there were some whose parents were Social Demo-crats and belonged to Swedish labor unions. I learned from my teammates

Torsten N. Wiesel 27
that the unions, which could enable the less powerful to protect themselves,were forbidden in totalitarian states. It had become clear by the summer of1939 that Germany posed a serious threat to Europe; rumors were alreadyspreading about the existence of concentration camps. Nevertheless, therewas still significant pro-German sentiment in Sweden. And so I came of agein a country that was making compromises to survive.
During this period, it began to concern me that I still had no idea whatI wanted to do with my life. Then one afternoon, soon after my seventeenthbirthday, I realized that I wanted to be a doctor. In retrospect, it was an obvi-ous choice, and certainly, my family experience and upbringing had influ-enced my decision. My father was a psychiatrist, my sister had nearly died ofintestinal tuberculosis, one of my brothers had been diagnosed with a heartdefect, and my eldest brother had begun to show early signs of schizophre-nia. With new conviction, I applied myself to my schoolwork and managedto graduate with marks high enough so that I was accepted into medicalschool. At the same time, I began to read literature, history, and philosophyintensively and was especially influenced by the writings of Schopenhauerand Kant. What interested me in particular was the structure of the mindand its workings.
I was also introduced in this period to art by Curt Clemens, a painterwho was well known in Sweden. Clemens, who was then in his mid thirties,was a dipsomaniac, and when he drank he sought treatment at Beck-omberga. I was struck by how different he was from other people I knew. Hecalled me periodically, and we would get together to speak about literatureand music. Clemens asked me questions that no one else would think of ask-ing, and he possessed a freedom of thought and expression that I found lib-erating. He was the first adult to take me seriously, the first to make me real-ize that I had an identity. I became concerned when he stopped calling andwas deeply shaken to discover that he had fallen down a staircase whiledrunk and broken his neck.
In the fall of 1946, I began my studies at the Karolinska Institute inStockholm. Starting medical school was like entering a strong current thatguided me steadily through a series of interlocking channels. I was nevergood at taking lecture notes or memorizing by rote, so, out of necessity, Ideveloped a more intuitive method by reading all the texts and papers that Icould find on a particular subject. In a way, this process was not unlike thepopular Swedish sport orienteering, a game in which the participants aregiven a map and compass, and then race through the forest, navigating a tri-angular course. No trail exists, and, to succeed, you must be both a strongrunner and a skilled navigator. I have always enjoyed this sport—the feelingof running alone though the pine forest, finding my way—much like theapproach I have taken to solve scientific questions.
In Sweden, at that time, it took seven years to graduate from medicalschool. The first two years were spent studying basic science; the remainingfive were devoted to gaining practical experience in the various clinical dis-ciplines. Our lives were strictly scheduled: as soon as we reached one target,

28 PART I INTRODUCTION AND BIOGRAPHIES
another would be set. We were plugged into a system designed to producedoctors. For relief from the regimented training at medical school, I escapedevery Saturday afternoon to chamber music performances at the Lilla Kon-sert Hallen in Stockholm, where I could hear classical music one week andcontemporary music the next. My only other extravagance was to purchasefirst editions of contemporary Swedish poetry.
In my second year at the Karolinska, I began to focus on the nervoussystem and was fortunate to study with two exceptional professors in thatfield: Ulf von Euler, a professor of physiology and a future Nobel laureate,and Carl Gustav Bernhard, a professor of neurophysiology. Professor Bern-hard was a brilliant and compassionate man who would have a crucialimpact on my future in science. In those days, the typical Swedish professorpontificated from his pulpit like a bishop in a cathedral, but Bernhard satinformally on a bench facing the class and spoke without notes, explainingcomplex and intriguing facts about the brain. His spirited lectures gave methe courage to make my first presentation to the class: a ten-minute talk onthe neural control of respiration. At the end of the term, I volunteered towork as a teaching assistant in the physiology department. My responsibili-ties kept me in contact with Bernhard's laboratory, and gradually I becamepart of his extended scientific family.
Around that time, I was finally able to leave my father's home at Beck-omberga and move into a place of my own in Stockholm. After living for somany years on hospital grounds, it felt strange at first to be on the outside. Irented a tiny cold-water flat that my friend Lars Rolf, an artist, had painteda monastic white. The most notable feature of the dilapidated building wasa row of outhouses in the inner courtyard. That summer, I hitchhiked toParis with a girlfriend and, while there, picked up a few etchings for next tonothing by Bonnard, Toulouse Lautrec, and Segonzac.
To cover my living expenses, I began to work as a night nurse at Beck-omberga, where my father was still director. Four nights a week, from 8 P.M.to 7 A.M., I admitted new patients and made the rounds through each ward,administering medications. Certain patients, who had violent episodes, werekept in padded cells with bars on the windows. It was in that hospital that Isaw lobotomized patients for the first time. As a form of treatment, lobotomywas rather new at the time, and Beckomberga had brought in a surgeon whospecialized in the procedure. I can still see those three lobotomized patientslying pale and lifeless under the sheets of their high-sided beds. I felt as if Ihad entered a camp in which a horrific act had been committed. There wereindividual protests against the procedure from doctors in several countriesbut most of the medical community approved of the treatment; patients whohad been aggressive or hard to manage became docile. With hindsight, it isshocking that Egas Moniz, the Portuguese doctor who developed the psy-chosurgical procedure of lobotomy, received the Nobel Prize in 1949 forwhat he claimed was "a simple operation, always safe, which may prove tobe an effective surgical treatment in certain cases of mental disorder". Monizhad been confined to a wheelchair in 1939 after he was shot eight times atclose range in his office by one of his disturbed patients.

Torsten N. Wiesel 29
In the 1950s, a medical student in Sweden was permitted in his finalyear of training to practice as a doctor, which made it possible for me toaccept a summer position as a surgeon in the main hospital of Sundsvall inthe northern part of the country. There, I performed appendectomies andother minor operations. The work gave me a sense of purpose, and I felt thatI could actually help patients, even cure them. On one occasion, a young mancovered in blood was brought into the emergency ward. Both of his arms hadbeen severed by a machine in the factory where he worked. The head of sur-gery looked at me and said, "Don't do too much. Let him go." It is strange,the thoughts one has at such moments. I knew right away that I wanted todo everything in my power to save the man; I felt it was my duty to help him.Even if he had to live without arms, his life could still be meaningful. Yearslater, I heard that he had gotten married, had children, and was able to paintby manipulating a brush with his lips and feet.
In the fall, I returned to Beckomberga and continued to work for sixmonths as a doctor in a psychiatric ward for adult patients. Soon, it becameclear to me that the prevalent methods of treatment, such as electroshocktherapy and hypoglycemic coma, were inadequate to ameliorate the suffer-ing of patients. I decided to try child psychiatry for a year in the pediatricsward at the Karolinska Hospital, hoping that a child's brain might be moreresponsive to treatment. Although psychiatry in Sweden has always beenbiologically based, the head of child psychiatry at the Karolinska during thatperiod took a psychoanalytic approach, and under her tutelage I learnedabout those methods. The drawings and paintings of the children under mycare caught my interest, and I began to collect and analyze them for diag-nostic purposes. Still, by the end of that year I had come to the conclusionthat the psychoanalytic school was as much in the dark as the biologicalschool in understanding how to treat mental illness. Before psychiatry couldbecome a true medical science, I believed it was crucial to learn more aboutthe basic functions of the brain.
Soon after graduating from medical school, I asked Professor Bernhardwhether there might be an opening in his laboratory. I was poorly preparedfor the type of research he did, but perhaps Bernhard, who knew me both asa student and teaching assistant, had seen some latent promise, since heagreed to appoint me as an instructor in the Department of Neurophysiol-ogy at the Karolinska Institute.
My first assignment in the lab was to test a large set of local anesthetics,some of which when injected intravenously had been found to preventepileptic seizures in animal experiments. Professor Bernhard, in collabora-tion with the neurosurgeon Einar Bohm, wanted to explore the possibility ofusing a local anesthetic to halt status epilepticus, a condition of continuousepileptic activity that could occur during brain surgery. After six months ofresearch, I found that lidocaine was the most effective anesthetic in prevent-ing seizures induced in cats. The findings were published and eventually ledto the use of lidocaine as a treatment for status epilepticus during brain sur-gery. Still, I felt that this research had little to do with my primary interest,which was to explore the possibility of doing neurophysiological research at

30 PART I INTRODUCTION AND BIOGRAPHIES
a more advanced level. It was a stroke of luck that in June 1955, soon after Ihad completed the project, Professor Bernhard called me into his office andasked me, "What about going to America?"
I was then thirty-one years old, with a medical degree and no seriousobligations to keep me in Sweden. As I stood in front of Bernhard's desk, hetold me that a scientist named Stephen Kuffler was looking for a postdoc-toral fellow to continue the study of the visual system that he had pioneeredat the Johns Hopkins Medical School. Kuffler, according to Bernhard, wasalready an internationally renowned neurophysiologist, celebrated for hav-ing localized the neuromuscular junction. As a newcomer to the field, I wasignorant of his work, but intrigued when Professor Bernhard explained thatKuffler's work on the cat's visual system centered on studies of single neu-rons. That night, I went home and read Kuffler's classic paper on the center-surround receptive fields of retinal ganglion cells, which he had presented afew years earlier in June 1952 at the Cold Spring Harbor Symposium. I hadnever read a paper that documented such outstanding research, and Idecided there was no reason to hesitate joining Kuffler's laboratory inBaltimore.
So, in July 1955,1 boarded the Van Dam, a Dutch oceanliner bound forNew York, and in early August arrived in Baltimore to begin my postdoc-toral fellowship at the Wilmer Institute at Johns Hopkins Medical School. Ifound myself in a new land, a somewhat strange country, trying to learn itscustoms, its music, its ways of life. Even though I felt insecure about my abil-ity as a researcher, I was eager to meet the demands of the new lab. I expectedto return to Sweden at the end of my three-year fellowship, but, as it turnedout, I would spend the next half-century in the United States.
Steve Kuffler was a master experimentalist who always worked withhis own hands in the laboratory. He was forever in search of the ideal prepa-ration with which to pursue the guiding question of his research: how nervecells communicate across synapses. He had attracted a number of outstand-ing postdoctoral students to his lab at the Wilmer Institute: Edwin Fursh-pan, David Potter, Josef Dudel, and Taro Furokawa, among others.Together, they constituted a dynamic and interactive set of research groups.Steve created an informal tone and open style in the lab that all of us enjoyed.He hated pomposity, and never hesitated to use the needle of humor todeflate pretentious behavior. He remains my role model almost fifty yearslater.
Since the Wilmer Institute was an ophthalmologic clinic as well as aneye research institute, Steve wanted at least one of his research groups towork on vision, and that was his main reason for inviting me and anotherpostdoctoral student, Kenneth Brown, to join his lab. My first task was tolearn how to make different types of microelectrodes, which was a relativelynew technique for recording impulse activity from single nerve cells. KenBrown, who joined the lab a few weeks after me, was interested in pursuingthe cellular origins of the electroretinogram. Although this topic was notparamount among my own interests, we collaborated on this problem for the

Torsten N. Wiesel 31
three years that Ken worked there. In my spare time, I developed a fewsingle-cell projects, focusing on the receptive field properties of retinal gan-glion cells, which were published in The Journal of Physiology and in Nature.Steve must have appreciated the single-cell work I had done, because whenmy three-year fellowship came to an end, he asked me to continue in his lab.
About a year earlier, in the spring of 1957,1 had attended a conferencein Atlantic City of the Federation of Experimental Biologists and had beenimpressed by the sharp intellect of one of the speakers—a young scientistfrom Walter Reed Hospital named David Hubel. I had first met David in1956 when Ken Brown and I visited him at his lab to learn how to make hisnewly developed tungsten microelectrode. It was clear to me then that Davidhad a highly original approach to cortical neurophysiology. He had devel-oped an elegant method for making single-cell recordings in the awake cat,noting that some cells fired when he waved his hand in front of the cat's eyesin one direction, while other cells fired when he waved his hand in the oppo-site direction. As David recounted his discoveries, I realized that cells in thevisual cortex were much more sophisticated than the ganglion cells thatSteve Kuffler had reported in the retina of the cat. In a sense, David's earlystudies in the visual cortex served to stake out the ground for our future col-laborative work.
In the late spring of 1958, Steve invited David and me to lunch in thecafeteria at Johns Hopkins so we could discuss the possibility of a collabora-tion between the two of us. David and I realized that if we were to worktogether, we should start by adapting his approach to mapping receptivefields, recording from single cortical cells in anesthetized cats rather than inawake cats. And so began our collaboration, which would last for close totwenty years, first at Johns Hopkins, and then at Harvard.
David and I approached the visual cortex as explorers of a new world.Neither of us had any preconceived ideas about what we would find on ourjourney; instead, we let our discoveries dictate what questions to ask next. Attimes we felt more like naturalists of a bygone era. We made every effort tocarry out experiments twice a week, beginning early in the morning andworking late into the night. We communicated in a private shorthand, andmost of our scientific ideas were developed through those fragmentary dia-logues. I admired David's ability to communicate difficult concepts withclarity, a skill that was crucial to gaining recognition for our findings. Tohave such an imaginative partner in our scientific explorations was most for-tunate, and our time together stands out as one of the most exciting andengrossing experiences of my life.
In 1973, I succeeded my mentor Steve Kuffler as chair of the Depart-ment of Neurobiology at Harvard Medical School and became increasinglyoccupied with administrative responsibilities. At the same time, Davidbegan traveling frequently to give talks about our work. Yet, there may havebeen a more profound reason that our partnership came to an end. The addi-tional demands on our time sprang up during a period when we were inves-tigating the properties of cells of higher visual areas beyond the primary

32 PART I INTRODUCTION AND BIOGRAPHIES
Torsten Wiesel, 1975.
visual cortex, an exploration that each of us eventually regarded as a failure.Perhaps we had been spoiled by the steady pace of new discoveries. The twonaturalists, who for so long had journeyed together with a seemingly inex-haustible sense of wonder, were unaccustomed to the frustration that is thedaily bread of so much scientific research. David and I had never spent muchtime together outside the lab; what developed between us, our special bondand private dialogues, took place while we carried out our experiments.When those explorations stalled, when the wonder faded, so did our collab-oration. Perhaps it was necessary for each of us to turn to new partners andquestions.
When my partnership with David ended, I continued my research onthe visual cortex with Charles Gilbert, a former graduate student from Har-vard Medical School, who had returned to my lab as a postdoctoral candi-date. Charles and I decided to explore the new method of intracellularrecordings with microelectrodes filled with horseradish peroxidase, which,when injected into the neuron, led to an intense, dark brown staining of thecell body, its dendrites and axonal branches. This approach led to our dis-covery of extensive and precise horizontal connections between cortical cells.My collaboration with Charles continued at The Rockefeller University,where we moved in 1983. My experimental work came to an end eight yearslater, in 1991, when the Rockefeller board of trustees appointed me presidentof the university, a responsibility that I found to be an interesting challenge.
Since leaving that position in 1998, I have been able to focus on issuesthat have long concerned me. While remaining at The Rockefeller Univer-sity as director of the Shelby White and Leon Levy Center for Mind, Brain,and Behavior, I have assumed a number of advisory positions at organiza-tions that support the training of students and investigators in the United

Torsten N. Wiesel 33
States and abroad. Since its initiation, I have participated in the Pew Chari-table Trust program, which supports the training of Latin American post-doctoral students in the best laboratories in the United States. I have alsobeen involved as chair of the Committee of Human Rights of the NationalAcademies of Science in assisting colleagues who have been imprisoned orharassed for asserting their right to free speech or for their peaceful opposi-tion to the policies of their governments. In the spring of 2000, I wasappointed secretary general of the Human Frontier Science Program(HFSP), an organization which supports international and interdisciplinarycollaboration between investigators in the life sciences and sponsors thetraining of post-doctoral students from different parts of the world in lead-ing laboratories. All these endeavors have a common and quite simpletheme: to provide young scientists with the opportunity that Steve Kuffler sogenerously gave to David and me, the freedom to explore, the freedom tofail, the freedom to follow where the experiments lead you.
Even now, I am struck by the complexity of the brain and how little weknow about it. Can the brain really understand itself? Many of us in neuro-science assume there are no limits to what we can learn about the brain, butstill we hesitate to make the claim that the richness of all human behaviorand culture can be explained in biological and physical terms. In our quest,we can anticipate the benefits of new knowledge, but can we foresee the dan-gers that this knowledge might bring about in the future?
For now, most of us are not as concerned as we might be. I was takenaback not long ago on being asked, "When will you be able to control thehuman mind?" My immediate response was, "Never, I hope."

This page intentionally left blank

PART II
BACKGROUND TOOUR RESEARCH

This page intentionally left blank

Chapter 3 • Cortical Neurophysiologyin the 1950s •
Neurophysiology has changed radically since the late 1950s. The numberof neurophysiologists was then a small fraction of what it is now, per-
haps about one one-hundredth. The Society for Neuroscience, now withsome 30,000 members, did not yet exist. (The National Eye Institute wasfounded only in the late 1960s). In the United States the important meetingswere those of the Federation of Experimental Biologists. Known as the Fed-eration Meetings, they covered all experimental biology and were held everyspring in Atlantic City, of all charming places. The hundred or so neuro-physiologists who gathered there each year formed only a small minority.The big international event in physiology was the meeting, every third year,of the International Union of Physiological Sciences. It would take place atsome major city such as Brussels or Munich. The community of neurophys-iologists who attended these meetings was small and intimate, and a begin-ner could expect to get to know and talk with most of the important figuresin the field. Those working in basic nerve-synapse physiology formed aselect group that included Hodgkin, Huxley, Eccles, Katz, and Kuffler,names associated with the beginnings of an ionic, molecular-level approachto neurons and synapses that was to become the foundation of the field ofneurobiology. In the area that we now call "systems"—roughly speaking, thecentral nervous system—the main players of the previous generation hadbeen the Spaniard Ramon y Cajal in neuroanatomy, and Charles Sherring-ton and E. D. Adrian, both from England, in physiology. In the early 1960sone of the most active fields in central-nervous physiology was spinal cord,in which some of the main players were John Eccles, Karl Frank, and myfirst advisor, M. G. F. Fuortes.
In the cerebral cortex, early work was mainly concerned with localiza-tion of function, essentially a type of neuroanatomy that used clinical neu-rology and electrical stimulation and electrical recording. Decades of clinicalneurology, going back to the eighteen-hundreds, had indicated that the cor-tex was divided up into areas ranging in size from postage stamps to creditcards, each area devoted to a separate function, such as sensory or motor. Inanimals such as cats, these areas accounted for a fair percentage of the total
37

38 PART II BACKGROUND TO OUR RESEARCH
cortical area, but in humans the sensory and motor areas comprised only asmall part of the cortex, the rest of which remained terra incognita. Evenwhen a given area could be designated as visual, somatic sensory (touch andso on), or motor, the details of the mapping were still vague. In the 1940s and1950s the details began to be worked out, in humans in the operating room,using electrical stimulation and recording, in what was called clinical neuro-physiology, and in the laboratory, using cats and monkeys. Some of the mainnames in clinical neurophysiology were Jasper and Penfield, and in animalstudies Clinton Woolsey and Vernon Mountcastle.
Much of the early cortical mapping was done by the method of evokedpotentials, a technique in which relatively crude (1 mm or larger) recordingelectrodes were placed on the surface of the cortex and brief sensory stimuli,such as touch, flashes of light, and auditory clicks, led to transient changes insurface potential. These "evoked potentials" are one form of what are knownas "slow waves", as distinguished from single-cell action potentials. By thelate 1950s the topographic maps of the primary and secondary visual, audi-tory, and somatosensory receiving areas had been delineated electrically, inhumans, cats, and monkeys. In the mid-1950s, with major improvements inelectrical equipment and electrodes, it became possible to record impulsesfrom single cells, and the new methods began to be exploited in work suchas that of Vernon Mountcastle in the somatosensory cortex.
Slow waves can occur spontaneously. In the electroencephalogram(EEG), the records are made by electrodes placed on the scalp; in the electro-corticogram (EGG) the electrodes are placed directly on the cortical surface.
In the 1950s and 1960s attempts to understand the nature of slow wavesconsumed much time and effort, in many laboratories. In retrospect theseefforts would seem to have represented a cul-de-sac in the neurophysiologyof that generation. One can understand why neurophysiologists were so pre-occupied with slow waves given their usefulness in mapping sensory areas,and given the striking changes that occurred in the EEG when a human sub-ject engaged in mental activity, became drowsy, or slept. But the techniquesavailable to tackle the problem of the nature of the waves were far from ade-quate then and still seem inadequate now, despite the advent of the micro-electrode and the possibility of correlating slow waves with events in singlecells. The preoccupations of neurophysiologists gradually changed fromstudying slow waves to studying single cells, and the emphasis changed fromtrying to understand the waves and ever-enticing subjects such as sleep andconsciousness, to learning how the cortex was handling sensory information.
In vision the most important topographic mapping had been done backin 1941 by Wade Marshall (the same Wade Marshall who had bawled me outafter I gave my first paper) and Samuel Talbot, at Johns Hopkins. In a tourde force that was far ahead of its time, they stimulated the retina by havingtheir anesthetized animal (rabbit, cat, or monkey) face a screen on whichthey projected small spots of light. They placed a millimeter-sized electrodeon the cortical surface and flashed the spot on various parts of the screen,searching for the region that gave the maximum slow wave response. Thisproduced the first mapping of the cortical projection of the visual fields.

Conical Neurophysiology in the 1950s 39
To understand the importance of Talbot and Marshall in the visual cor-tex, Mountcastle's work in somatic sensory cortex, or Jasper and Penfield'smapping of human brain, one has to recall the uncertainties that prevailed inthe 1940s and 1950s, even concerning the existence of topographic represen-tation. Some psychologists had destroyed various parts of the rat brain andfailed to detect specific behavioral defects—in retrospect not because noneexisted but because of the limitations of the behavioral methods—and theyconcluded that the brain must work in some rather mushy way, like a cauli-flower rather than a computer. In vision, attempts at mapping the cortexsometimes failed because of the mistake of stimulating the retina in condi-tions of dark adaptation, using a very dim background light and flashingspots of light bright enough to scatter over the entire retina. Talbot and Mar-shall avoided this problem by having their animals face a projection screenon which they shone spots of light against a moderately bright backgroundlight. We, too, were lucky enough to avoid that pitfall, not out of any greatinsight but simply because working with dark-adapted animals made nosense to us, and groping about in very dim light is no fun.
In the mid-1950s, the first single-cell studies of the visual cortex camefrom a group led by Richard Jung and his collaborator Giinter Baumgartner,in Freiburg. It is easy to forget what an accomplishment it was, at that time,to record a single cortical cell long enough to get any idea of its behavior inresponse to sensory stimulation. The main problem was instability, the up-and-down movements of the cortex relative to the recording electrode,caused by vascular pulsations and respiration. This was before the develop-ment of the closed chamber technique, which by walling off the cortex fromthe atmosphere served to dampen the pulsations almost completely. TheFreiburg group stimulated by illuminating the retina diffusely, possibly toavoid the technical problems of obtaining a focused image on the retina. Asalready mentioned in the context of my hand-waving stimuli, it was naturalto assume that illuminating the entire retina would be the most effectivevisual stimulus, rather than the least effective, as it turned out.
In the 1950s most of the single-cell recordings from sensory cortex wereconcerned with topography. Mountcastle's studies of somatosensory cortex,however, went far beyond questions of simple mapping and led to the dis-covery of columnar organization. He showed that cells are gathered intosmall groups a millimeter or so in cross-sectional area and extending throughthe entire 2-millimeter cortical thickness. Columns differed, one from thenext, in the sensory submodality (to use Mountcastle's term) to which thecells responded, some being sensitive to light touch or bending of skin hairs,others to changes in joint position. This was a profound discovery, indicat-ing the cortex was not uniform but diced up, perhaps like a checkerboard,into small regions that differed in the information feeding in from lower lev-els, and that these regions were basic units of cortical organization. Surpris-ingly, the cells seemed to respond in much the same way as cells at lower lev-els, in dorsal column nuclei or thalamus, and it was not clear what the cortexwas doing to transform the information it received from these lower levels.This seemed quite different from the retina, where Stephen Kuffler had

40 PART II BACKGROUND TO OUR RESEARCH
shown that ganglion cells' receptive fields, with their centers and surrounds,must surely represent a major transformation of the information comingfrom the rods and cones. One thought of a sensory cortex, visual orsomatosensory, as "analyzing" the information it received from below, with-out specifying what the analysis might possibly consist of.

Chapter 4 • The Group at Hopkins •
The importance in science of what might be called mentors or role modelscan hardly be exaggerated. One can even trace genealogies of scientists,
often back many generations, and speak of cousins, brothers, and the like.One can of course have several mentors in a lifetime: I can trace my ownintellectual ancestry to three, all differing in the closeness of the relationshipsand the admiration, sometimes mixed with resentments and varieties ofcomplexes. My first such father figure was Herbert Jasper, whose own men-tor in-loco-parentis was certainly Wilder Penfield, whose very gestures andway of standing were said to derive from the famous neurosurgeon HarveyGushing. Jasper could be extremely kind, but was subject to moods thatranged from irritable depression to buoyant effervescence. When I neededsomething, I waited for a buoyant day and almost felt guilty at his cheerfulcompliance. Mike Fuortes, my first mentor in research, was not at all moody;he had a slightly sardonic sense of humor and a profound sense of what wasimportant in biology. (We became close friends, and went swimming everynoon in the summer, at the Walter Reed officers' club.) And more than any-one else, Steve Kuffler played a role that was crucial for both Torsten and me,in terms both of its day-to-day importance and the fact that it was sustainedover some thirty years.
For Steve, my third mentor, and the most important mentor to bothTorsten and me, the scientific ancestry went back at least two generations.He was born in Austria-Hungary in what must have been a well-to-do fam-ily. He went to medical school in Vienna, finishing at about the time of theoutbreak of World War II. He realized that Europe was no place for him andboarded a ship for Australia. He began as a post-doctoral fellow in pathologyin Sydney, Australia, and met Jack Eccles on a tennis court. Eccles is sup-posed to have said, "You play tennis too well to stay in pathology. You mustcome and work with me in neurophysiology". Bernard Katz was one ofEccles' other trainees, and the three of them began to collaborate. Eccles,who won a Nobel Prize in 1963, had trained in England under Sir CharlesSherrington, who shared with E. D. Adrian the distinction of being one ofthe world's leading figures in neurophysiology. The two shared the Nobel
41

42 PART II BACKGROUND TO OUR RESEARCH
Steve Kuffler, at annual department picnic, early 1970s.
prize for Medicine/Physiology in 1932. So I suppose in some sense Torstenand I could be thought of as Sherrington's great grandchildren.
We have a picture that shows Eccles, Katz, and Kuffler striding alongsome street in Australia, probably from the mid-Forties. Another picture,taken probably in the United States of America about twenty years later,again shows them striding briskly along the s treet . . . as youthful and vig-orous as ever (pp. 44, 45).
Eccles, at the time of Steve's arrival, was one of the main proponents ofthe widely held notion that synaptic transmission in the central nervous sys-tem was electrical. (Neuromuscular transmission was an exception, since itwas known to be chemical.) I once asked Steve to make me a selection of hismain reprints. As he leafed through his collection, he came upon one andsaid, "This is the paper that at last convinced Jack [Eccles] that synaptictransmission is chemical". That impressed me, because no one was less proneto boasting than Steve.
In the late 1940s, Steve left Australia and went to work for a brief timewith Ralph Gerard in Chicago. In 1949 he took a position at the WilmerInstitute of Ophthalmology at the Johns Hopkins Hospital in Baltimore, andit was there that he began his studies of single retinal ganglion cells.
Steve (as he was known by everyone—no one who knew him at allwould have dreamed of calling him "Dr. Kuffler", which would probablyhave hurt his feelings) once told us that when he left Austria-Hungary hehad to decide whether he wanted to be called Stephen or William, and hechose Stephen because he did not want to be called "Bill". From then onTorsten and I called him Bill at every opportunity, and I still have a notefrom him, from Woods Hole, that reads "Gee it's nice here", signed "Bill".Steve's broad range of interests was reflected in the group that began to formaround him in the late 1950s—first Torsten, who had already been there forseveral years when I arrived in 1958, and then Edwin Furshpan and David

The Group at Hopkins 43
Steve Kuffler, 1975.
Potter, who arrived from Bernard Katz's lab in London, just having made amajor contribution to synaptic physiology by discovering the first electricalsynapse, in the squid. Furshpan was soon joined by the Japanese neurophys-iologist Taro Furukawa, in a project on the goldfish Mauthner cell. Thusover a very few years Steve's group had grown from two or three peopleworking together to four or five independent subgroups, each consisting oftwo or more collaborators.
Steve had a special and unusual style of working that largely deter-mined the character of the group he slowly built around him. He workedalone with one colleague, or rarely with two. He loved doing experiments,especially the dissections. In the years that followed he had to put up withincreasing amounts of administration work but never complained: he wouldcome in to work early in the morning, clean up whatever letters he had towrite, and be dissecting by 9:30.
On coming to the Wilmer around 1950, Steve first collaborated withCarlton Hunt, on cat muscle spindles and the small motoneurone systemthat regulated the spindles' sensitivity. That was a major contribution tomammalian spinal cord physiology. It was followed by the epoch-makingvisual study in cats: the discovery of the center-surround organization of thereceptive fields of retinal ganglion cells, a subject that will come up again andagain in this book, because more than any topic in vision it formed the basisof all our research. Then came work with Carlos Eyzaguirre on crayfish andlobster stretch receptors. Around 1957 he took Horace Barlow and DickFitzHugh as postdoctoral fellows, and the work on vision resumed. Theymapped receptive fields of retinal ganglion cells under conditions of darkadaptation and made a statistical analysis of the firing patterns. Steve's heartwas probably not in those topics. When FitzHugh and Barlow left, hereturned to studies of synaptic mechanisms, especially synaptic inhibition.With the German physiologist Josef Dudel, he took up the subject of presy-naptic inhibition, and then went on to the role of gamma amino butyric acid(GABA) in synaptic inhibition, with David Potter and Ed Kravitz; and neu-roglia, in the medicinal leech, with John Nicholls. It was his style to switch

44 PART II BACKGROUND TO OUR RESEARCH
Steve Kuffler, ]ac\ Eccles, BernardKatz (from left to right), late 1940s.
over to an entirely new realm of neurophysiology every three or four years,often just after making a major contribution and opening up some otherfield. He would use whatever species seemed best suited to a problem, fromcrayfish and cats to leeches. Most scientists would have settled down to min-ing one problem for decades—as indeed we did—and most neurophysiolo-gists would have assumed the role of leader of a team of disciples, ceasing towork actively in the lab.
Steve presumably felt he owed it to the Wilmer Ophthalmology Insti-tute to keep up a laboratory in visual research, and after Horace Barlow andDick FitzHugh left, the tradition was continued by Kenneth Brown andTorsten, working in collaboration. They undertook the difficult project ofrecording intracellularly from the retina, layer by layer. When in 1958Torsten and I began to work together, Steve was studying presynaptic inhi-

The Group at Hopkins 45
Steve Kuffler, Bernard Katz, Jacf(Ecdes (from left to right), 1970s.
bition in the crayfish neuromuscular junction, collaborating with JosephDudel. One of the first things Steve asked me to do was to read criticallythree papers he and Dudel had just written. I was immensely flattered, andknowing nothing about that subject, I dug in and spent a full weekend cov-ering the papers with red ink. Steve must have been impressed because heand Joseph rewrote the papers completely. They must have felt, as I did, thatso important a work should be written so as to be understandable to non-experts. (Maybe Steve was getting back at us when some months later he toreinto our first abstract—about which more later.)
Heavy-handed advising was definitely not Steve's style. Though every-one talked a lot about the work they were doing, Steve would not havethought of offering anything but questions and gentle suggestions. If he wasimpressed with something one of us was doing, he would let it be knownthrough his buoyant enthusiasm, and would keep on re-expressing theenthusiasm day after day. The lab was a loose federation of small subgroupsrather than a big group led by a chief who administered but did no experi-ments, as is the style in most laboratories today. Being technically in an oph-thalmology department, he did no formal teaching, and seeking grants tookvery little of anyone's time in those happy days.
Space in the Wilmer basement was compressed, to put it mildly. All ofus together occupied the amount of space generally allotted to one assistantprofessor today. This 15x15 foot vision lab (Torsten and myself) was in aninner room across the hall from Steve's office, and included my desk.Torsten's office was a tiny partitioned space across another hall. The othergroups, including Steve's, each had about as much space as we did. The com-pression had its advantages: each group was completely independent, butthere was much communication between the labs. Every time someonewrote a paper it was handed around for criticism, and since criticism wasfierce (especially from Steve and Ed Furshpan), a manuscript ended up beingwritten and rewritten many times. Our first paper, in 1959, went through 11drafts, each of which, in those computerless days, had to be typed by one or

46 PART II BACKGROUND TO OUR RESEARCH
Neurobiology group, 1975. Bac\row: Ed Furshpan, David Hubel.
Middle row: David Potter, TorstenWiesel. Front: Ed Kravitz.
the other of us on an old Underwood non-electric typewriter. We cherishedthat typewriter (on which we wrote our experimental protocols), becausebeing mechanical it gave no electrical interference to our recordings, andbecause we quickly discovered that we could not read each other's writing.We still have filing cabinets filled to bursting with 30 years' worth of proto-cols, one folder for each experiment.
The group was broad. The two of us (and of course Steve) representedcentral nervous physiology; Furshpan and Potter (and of course Steve) rep-resented synaptic physiology; and Ed Kravitz, representing neurochemistry,arrived soon after our move to Harvard. This was a far cry from theinevitable specialization of today's big departments. We no longer try, or areasked, to read critically papers outside our immediate fields, and we all suf-fer for that.
The atmosphere in the lab was lighthearted and fun. In January, 1959,Baltimore experienced a sudden cold snap (a rare thing for Baltimore), andTorsten discovered that north of Baltimore a huge reservoir system withinterconnecting rivers had frozen over to glass ice. The two of us took theday off and went skating. The next day we rather sheepishly told Steve, butfar from being displeased over our taking the time off, he was obviously dis-

The Group at Hopkins 47
appointed that we hadn't invited him to come along. So for the rest of thatweek everyone in the lab, together with all the families (including Steve, hiswife and three children) went skating. Everyone obviously felt that firstthings should come first.
It is easy to look back 40 years with rose-tinted spectacles and forget theanxieties or hardships we must have had. Certainly it is the good things thatstand out in our minds. We were not badly paid: each of our fellowshipSalaries that year amounted to about $10,000, which was a lot for postdocs inthose days. There can be no question that in science many things were easierthen. There was far less competition: journal editors provided little of theniggling criticism that they do today; a paper was usually either accepted or(rarely) rejected. The pressure to publish was less, and more than onceTorsten and I wrote a paper and put it in a drawer for several months to letthe ideas mature. The NIH had just come into being; suddenly funding hadbecome more generous. It was hard to write a grant that was so bad it wouldnot be funded. Steve used to say that Mrs. Hughes (his middle-aged, endear-ing secretary) would probably be the last person to read our grant requests.The time for applying for a job seemed far in the distance, and jobs seemedunlikely to be a problem in a field that was clearly taking off.
The prevailing spirit of lightheartedness was a matter, not just of thetime, but also of the place. Johns Hopkins was informal and friendly, con-trasting strongly, as we later found, with the rather pompous prevailingatmosphere at Harvard. This may have been partly because the medicalschool and hospital were so close to each other, geographically and spiritu-ally, and medical schools and hospitals tend to be lively places. At Harvardthe associated hospitals are scattered all over Boston, and the closest, thePeter Bent Brigham (now Brigham and Women's) is the one that alwaysseemed to me to be the stuffiest. Our time at Hopkins seems in retrospect tohave been a truly golden era.

Chapter 5 • The Move from Hopkins to Harvard •
A t Harvard Medical School the Department of Pharmacology was led byOtto Krayer, a longtime friend of Stephen Kuffler. In 1958 one of the
quadrangle buildings (then Building B) had just been remodeled, and phar-macology had suddenly come by more space than they knew what to dowith. Dr. Krayer, sensing a weakness in neurophysiology at Harvard,decided to promote the idea of bringing in Steve as a full professor, andsomehow persuaded the ultraconservative Harvard faculty to take such anunprecedented step. At that time there were no full professors at HarvardMedical School who were not also chairmen. (Then, as now, "chairpersons"were almost always men.) Steve justifiably felt neglected at Hopkins anddecided to leave and to bring his entire group with him. (He once describedto me how he had been promoted at Hopkins to a full professorship but,until he protested, any adjustment of his salary was forgotten. He doubtlessfelt out of place in the Department of Ophthalmology, since for years he hadbeen working on almost every topic except for vision.) Everyone in the groupknew of the impending move except me, probably because Steve assumedthat I would be moving over to the Hopkins Physiology Department, asplanned. Torsten often remarked that our time was limited, and that weshould get going at writing up the results we had and press on with the work.That had puzzled me, because I would be only a few blocks away and wewould surely be able to keep on collaborating at least part of the time.
One afternoon as Steve was driving me home he asked casually howstrongly I was committed to going over to physiology at Hopkins. Would Ibe interested in moving to Boston, to Harvard, with Torsten, Ed Furshpan,David Potter, and all the rest? I was flabbergasted, having no idea such amove was in the works. This suddenly explained what the rush to publishwas all about. In the end my decision was easy: our collaboration was prov-ing so successful that any thought of breaking it up seemed ridiculous. (Ruthand I, thinking that we would be staying in Baltimore for years, had madean offer on a house just a few weeks before. Luckily at the last moment theoffer fell through—otherwise it would have been a lot harder to leave.)
48

From Hopkins to Harvard 49
David Hubel, Neurobiology Christmas party, 1973.
So in the spring of 1959 nine families moved from Baltimore to Boston,to the Department of Pharmacology, of which we became in effect a sub-department. At Hopkins, Torsten and I had just been promoted to assistantprofessorships, but the dean at Harvard Medical School said that we hardlyqualified for such exalted positions at Harvard. Perhaps by the time thepapers we had submitted were published Harvard might give the matterfurther thought. So we were demoted to the status of "Associates". The restof the world, according to the administration, must surely know that an asso-ciate at Harvard was the equivalent of an assistant professorship anywhereelse. Steve, and perhaps also we, found that amusing. In the newly remod-eled Building B, the two of us started with a 20 X 20-foot room that was tocontain our entire empire, including the lab and our two offices. We imme-diately ordered a large metal-turning lathe, which sat in the hall until OttoKrayer, our chairman, relented on space and let us have a second 20 X 20room, where we put the lathe and set up benches for histology.
From the beginning, teaching was a major new item for the group.With Sandford Palay's group in neuroanatomy, we taught medical studentsfor six weeks each spring. That was a full-time task, for us as well as for thefirst-year medical school class. It was the best teaching experience any of usever had; we all went to one another's lectures, and the feedback we got fromthe students made it clear that our course was by far the most popular in theschool. We taught it for about five years, when the medical school in its wis-dom revamped the curriculum, as faculties do periodically, and our coursedisappeared.

50 PART II BACKGROUND TO OUR RESEARCH
Some things inevitably changed in our lives, at first slowly. Our workwas becoming known, though for the first ten years we had the visual cortexalmost to ourselves. We started to get invitations to speak and to travel. I sup-pose I was more at home in writing in English than Torsten, and I took anactive part in teaching, which Torsten shunned in the interest of gettingresearch done. I was asked to be on the medical school admissions commit-tee, which was viewed as an important assignment and a step along the wayto tenure. (We were indeed made assistant professors after the first year atHarvard!) We got busier, although until the mid-Seventies we were largelyfree of administrative chores.
One day early in January of 1964, I was sitting at my desk whenthe phone rang. "This is Jonas Salk" came the voice from the other end."Yes . . . ?", I answered, " . . . I'm sorry, who did you say was speaking?" Itwas indeed Jonas Salk, calling to invite me to a meeting at the Salk Institutein La Jolla, the object of which was to inform a remarkable cast of molecular-biological celebrities, each more famous than the next, about the state of thefield of neurobiology. The molecular people included Francis Crick, SydneyBrenner, Jacques Monod, Seymour Benzer . . . and so on. The neurobiolo-gists were to include Roger Sperry, Rita Levi-Montalcini, Walle Nauta. .. and so on (including several neurobiological losers, if one may use thatterm). I was in the midst of teaching, travel, and experiments, and my firstimpulse was to decline. But the temptation was too great. One motivation foraccepting had to do with a macromolecular theory of learning that was cir-culating in neurobiology circles at that time. Some neurobiologists werewedded to a theory that memories were encoded on macromolecules, andthat the serum of an animal trained to a learning task, when injected into anai've animal, could induce learning in that animal. We all thought the ideawas nonsense, but many neurobiologists took it very seriously. I wanted tofind out if the real molecular biologists gave the idea the time of day. But,more important, it seemed a great chance to meet some of the world's lead-ing scientists. I decided to go, for one day only.
I was slated to talk for an hour, on Sunday, February 23.1 talked for thehour, on cell categories in striate cortex, simple, complex, and so on. I wasinterrupted many times with questions, especially from a young man in thefront row with a French accent, whom I took to be a very bright teenager,but who turned out to be Jacques Monod. When I finished, Francis Crickjumped up and said, "But you were supposed to tell us something aboutvisual deprivation and learning". I pointed out that my hour was up, but thatseemed to make no difference—so I went on for another hour. At whichCrick again rose up and said, "But I heard that you and Wiesel had donework on color. Are you not going to tell us about that?" Time and schedulesseemed to present no problems to these molecular biologists, so I went on forstill another hour. I felt like Fidel Castro. Their enthusiasm seemed bound-less, and I began to think that our work was not so boring after all.
In subsequent months it became clear that the Salk wanted to recruitme. Their offer was hugely tempting. But I made it clear that Torsten and I

From Hopkins to Harvard 51
did not want to break up our collaboration; they would have to take both ofus or neither. Torsten, after a visit, was enthusiastic, as were the Fellows atthe Salk Institute, but Torsten did not want to come without Steve. Steve vis-ited the Salk and became enthusiastic, but insisted that Ed Furshpan, DavidPotter, and Ed Kravitz be included. There were long discussions and nego-tiations, but finally, when the smoke cleared, it turned out that the Salkcouldn't afford to bite off so much, and whole idea evaporated. For severalsummers various ones of us went out to La Jolla on mini-Sabbaticals, and itwas during one of those, already mentioned, that the idea of the present bookwas born, and the project started.
On a two-month summer visit we made to the Salk a few years later, Iwas asked to give a lecture to the assembled Salk Fellows. Afterwards, JonasSalk approached me and apologized that his wife, Francoise Gilot (of Picassofame), had wanted to attend but could not. Would I mind repeating the lec-ture, the next day, for her? Of course I agreed—after all, I had had a dressrehearsal so it should be easy. In fact it was a sheer pleasure, because herquestions were, for an outsider, brilliant and imaginative, and I began toappreciate how potentially interesting visual neurophysiology could be to anartist. That is the only time I have given a formal lecture to an audience ofone—up to now.
In 1968 Torsten and I went together to Japan, to the International Phys-iological Congress in Tokyo. We stood the luxury of the Okura Hotel (it waswasted on us, and could have been in Chicago) for a day, and took the Giznasubway line to Asakusa and found a tiny ryokan recommended in Japan on$5 a Day. We made that our headquarters and travelled to Kyushu, where wevisited many famous rural pottery studios. I was impressed with Japaneseculture and hospitality and with the beauty of the country, and started tolearn the language, continuing with lessons at Harvard for about five years.I seriously underestimated the problem of learning the 1,850 Chinese char-acters necessary just to read a Japanese newspaper. On my next trip to JapanI was able, with intensive coaching by Masanori Otsuka and his postdoctoralfellows, to give two lectures in Japanese. The audience seemed to have notrouble in understanding my Japanese, to judge from the questions that fol-lowed, and the laughter that greeted the jokes that I put in as controls.
I was asked to give three "Special Lectures" at University College, Uni-versity of London, which took place on Monday, Wednesday, and Friday ofthe last week in January, 1965. I was amazed at the enthusiastic receptionthese received. (In England, approval of a lecture is expressed by the audi-ence's banging on the seats or stamping, and my first talk, that Monday, wasfollowed by an almost frightening noise.) On those three days I talked aboutcortical physiology in normal animals, columnar organization, and depriva-tion. On one of the intervening days I was invited to talk at Cambridge, andrather foolishly decided to talk on an entirely different topic, color—as if Ididn't already have enough to do that week. I rode up on the train from Lon-don with Andrew Huxley, whom I knew only slightly and revered as one ofthe most famous figures in neurophysiology. The train was met by Mrs.

52 PART II BACKGROUND TO OUR RESEARCH
Huxley, who drove us over to William Rushton's house, where I was to stayovernight. When we arrived there the house was empty but unlocked, so wewent in and made ourselves comfortable. Suddenly Mrs. Huxley exclaimed"Look, here is a note, now we'll see why William isn't here". The note said"One small brown"—obviously left for the baker! Finally William showedup, having been at a chamber-music gathering, playing the bassoon.
The Cambridge audience included my host, William Rushton, famousfor his work in visual psychophysics, and, most frightening of all, LordAdrian, easily the most revered neurophysiologist of that era. Rushtoninvited me to High Table Dinner at Trinity College and sat me down next tothe Master, Adrian himself. It was a bizarre experience because I quicklyrealized that to talk about our common interests was simply not done in thataugust society—so we discussed such subjects as Queen Mary (not of Scots,but Bloody Mary, Elizabeth's half-sister) never once even mentioning neuro-physiology, then or at any subsequent time.
I was beginning to take flute lessons. My recorder playing had lapsedsince leaving Montreal, and the flute seemed to be a greater challenge. But Iunderestimated the difficulties of learning a new instrument as an adult.Japanese and the flute were enjoyable projects but I have to count them bothas failures, in some sense. After about three years of flute and Japanese les-sons I finally went back to German and French, and to my original instru-ment, the piano. What finally convinced me that I should give up the flutewas trying the piano one day after a decade's interval and finding I wasimmediately far better at it than I would ever be with the flute.

Chapter 6 • The New Department •
By 1964, Steve's group had grown and multiplied exuberantly, so that as asub-department of pharmacology we were like the tail wagging the dog.
Harvard finally took the unheard-of step of creating a new department,which after some discussion we called "neurobiology". We think the termwas new, and reflected a realization that our field was being held back byartificial academic boundaries. Neurophysiology, for example, had by thencome to have much more in common with neuroanatomy and neurochem-istry than it had with renal or cardiac physiology. So despite some resistancefrom the more conservative senior faculty (but with the strong support of animaginative dean, Robert Ebert), the first-ever Department of Neurobiologywas launched, in 1966, with Steve as our chairman. Suddenly we had grad-uate students, administration, more committees. But administration neverseemed to bother Steve, who continued to be productive in research yearafter year despite major health problems that included glaucoma, diabetes,and advancing coronary disease.
Though our new department expanded greatly, Torsten and I kept ourown subgroup small. At any one time, between about 1960 and 1980, we hadtwo to four postdoctoral fellows and one or two graduate students. We didnot go out of our way to encourage graduate students, partly because we feltwe were ourselves somewhat narrowly trained, both having come from clin-ical backgrounds, with little to offer a beginning scientist by way of basicneurophysiology. Partly it was because we felt that only the most determinedyoung people should be encouraged: those who hung around and would notgo away. In the end our policy (if that is the right word) paid off handsomely,and we can credit ourselves with having had people like Jim Hudspeth andCarla Shatz as graduate students. We sometimes got beginners launched bysitting in with them on their first experiments, but we saved time by havingthe older graduate students and postdocs do much of whatever training wasdone. We shied away from giving emphatic advice on what projects a begin-ning student should undertake, feeling that it was a mistake to deprive any-one of the most important thing one can learn in research—to choose one'sown projects. To a large extent students were free to do whatever they
53

54 PART II BACKGROUND TO OUR RESEARCH
wanted, and they worked independently. Doubtless they sometimes felt neg-lected, but we felt they should learn from their own mistakes, and we hadour own work to do.
If Torsten and I had any problems in that otherwise wonderful period,in the 1960s and 1970s, they concerned the question of our continuing collab-oration. Steve was puzzled over how to justify two senior (tenure) appoint-ments to the rest of the faculty, especially two people working together in thesame field. We wanted to continue collaborating because we enjoyed it andbecause the collaboration obviously was working—well enough, we thought,to justify two full professorships. To us a partnership between equals seemedideal. Steve doubtless thought so, too: the problem was to persuade the headsof other departments at Harvard Medical School. When it came time todecide on tenure positions, Steve's solution was for me to be promoted in thedepartment and for Torsten to be appointed to a professorship technically inthe department of psychiatry, but without having to move. We would con-tinue our partnership as before, within Steve's group. Practically this workedout well enough, though a professorship in psychiatry seemed a slightly con-trived solution.
Around the time the new department was being formed, the dean ofthe medical school called me in and asked if I would be interested in beingchairman of the Department of Physiology. I was astonished, to put it mildly,and enormously flattered to be offered the chair that had once been occupiedby such figures as Henry Bowditch and Walter Cannon. But I was mostreluctant to risk putting a damper on our research, which at that time wasmoving ahead in a wonderful way. I got lots of advice from colleagues andsenior faculty, much of it to the effect that with a good secretary and a will-ingness to delegate responsibilities I could easily take on a chairmanship andkeep pulling my weight in our collaboration. I could, that is, have my cakeand continue eating it. I was also told that the least I could do was make acontribution to the school. Chairs at Harvard Medical School are like feudalfiefdoms; they are more or less lifetime jobs, with much power. Here, I wastold, was a chance to build something important. I accepted, in large partbecause it seemed like an opportunity for Torsten and me to build up a groupof our own, in parallel with Steve's department, and to obtain professorshipsand promotions for close colleagues such as Zach Hall and John Nicholls.Yet certain awkward aspects of the arrangement soon became evident.Torsten's and my backgrounds were in neurology and psychiatry, not inphysiology. Whenever we had to choose between attending a seminar in theneurobiology department and one on renal physiology (for example) in thephysiology department, the decision was easy. That tended to hurt the feel-ings of my colleagues in the physiology department. And contrary to the pre-dictions of some of my friends, there was far from enough time to do justiceto both the chairmanship and our research. Our experiments lasted all dayand well into the night; they had to be planned, and the results evaluated anddiscussed. Also, I had not realized how much of a chairman's time had to bespent helping run the school. There were many lofty committees, with deci-

The New Department 55
sions on chairmanships of other departments, curriculum, and so on. Onehad to be hospitable to visitors. I found that while shaving in the morning mypreoccupations were with the department and the school, rather than whatto do next in our research. One day during an experiment, when I com-plained about some of this, Torsten suddenly said, "You are selling yourselftoo cheaply. There is no reason to keep on doing these things if you don'twant to." Suddenly I felt the lifting of a great weight. At last I recognizedthat I had made a mistake, and I resigned the job before doing the Depart-ment of Physiology and our research irreparable harm. It was a good lesson:I was never again tempted to become chairman of anything, despite severalopportunities. Luckily we had not yet physically moved over to physiology,which was housed in another building across the Medical School quadran-gle, and the space we were slated to occupy had not yet been remodeled. Mycolleagues in neurobiology welcomed Torsten and me back to that depart-ment, heartily and cheerfully, for which I have always been grateful.

This page intentionally left blank

PART 111
NORMAL PHYSIOLOGYAN DAN ATOMY

In reprinting our papers and discussing them, it has seemed to us most nat-ural to take up separately the ones involving normal physiology and anatomyin adult animals, and those dealing with deprivation and development. Tocombine the two sets in strict chronological order would have been awk-ward, with inevitable breaks in continuity and for the reader the necessity offlipping back and forth from one set to the other. To include every last paperwould have made the book far too long, and our choices have had to be some-what arbitrary. We have found it especially hard to decide on some of thesummary papers such as the Ferrier Lecture (published in 1977), but in theend we could not resist including it despite the obvious overlap with the orig-inal papers. The Ferrier Lecture was a major exception to our tendency toshy away from writing reviews, even reviews of our own work. That wasmainly to save time, and to encourage people to read the original papers. Theother question was whether to include the two Nobel lectures—anotherexception that we could hardly avoid. The problem was one of length andprice versus completeness, but in the end it was hard to resist telling the storyof the Nature versus Science contretemps (see p. 658).
58

Chapter 7 • Our First Paper, on Cat Cortex, 1959 •
FOREWORD
In getting started, that first week in the spring of 1958 at Johns Hopkins, wesimply used whatever equipment we could assemble from Steve's old retinalsetup, together with various gadgets I had made at Walter Reed and broughtto Hopkins with me. We stimulated the retina with the same glorified two-beam ophthalmoscope that Steve had used for his retinal work. A picture ofthis apparatus is included in Steve's famous 1962 Cold Spring Harbor paperon retinal ganglion cells. Attached to the ophthalmoscope was a head holderthat had the animal rotated so that it looked more or less straight up. For ourpurposes this arrangement was awkward to say the least. It was designed todeliver to the retina precisely calibrated stimuli for precise lengths of time,and allowed one to view the retina and the recording electrode directly. Atthat stage and for years after we had little use for such niceties. We wererecording from the cortex, not the retina, and we needed to be able to stim-ulate both eyes, not just one. In generating our visual stimuli we needed flex-ibility, because we had no idea what cortical cells might require to makethem respond. Latencies (the number of milliseconds between the lightstimulus and the response of the cell) and carefully calibrated stimulus inten-sities were not uppermost in our minds.
For recording, we used a microelectrode advancer that I had designedand built with my lathe at Walter Reed. It consisted of a plexiglass cylinderthe size and shape of a fountain-pen cap through whose top we introducedthe mineral oil, which lowered the piston that held the microelectrode. Toaccomplish the electrode positioning with the atmosphere excluded (see p.19), we drilled a 2 to 3 mm hole in the skull over the visual cortex, cut thedura (the thick membrane covering the brain), positioned a hollow steelguide tube in the hole, waxed in the space between skull and guide tube, low-ered the tungsten electrode, and hoped for the best. I had designed and builtthis advancer system as part of my setup for recording from cats that wereawake and moving around. For recording from anesthetized cats or mon-
59

60 PART III NORMAL PHYSIOLOGY AND ANATOMY
keys it gave a stability that would have allowed us to continue recordingfrom a cell even in the presence of an earthquake.
In our very first experiments we used circular spots of light, or blackspots, because these had served Stephen Kuffler so well in delineating recep-tive fields of retinal ganglion cells. To produce a spot of light on the retina weinserted, into a slot in the light path of the ophthalmoscope, a small brassplate the size and shape of a microscope slide. In the brass plate a tiny holehad been drilled to determine the spot diameter. Dark spots on a light back-ground were obtained with glass microscope slides on which small circles ofmetal of various sizes had been glued. The ophthalmoscope also supplied abackground whose intensity could be varied.
Pessimists by nature, we were amazed when our system for advancingthe electrode and recording worked well even from the beginning. We foundit easy to record from single cells and observe their spontaneous all-or-nonesignals (as deflections on the oscilloscope and clicks on the audio monitor) formany hours. But for the very first day or so we had no success in getting anyclear responses. It turned out that the early failures had nothing to do with theanesthetic but were a matter of finding the right stimulus. It was hard to knowwhere to stimulate in the retina because of difficulties in keeping track of reti-nal position relative to the cat's retinal landmarks, the area centralis (equiva-lent to the primate fovea), and the optic disc. The break came one long day inwhich we held onto one cell for hour after hour. To find a region of retinafrom which our spots gave any hint of responses took many hours, but wefinally found a place that gave vague hints of responses. We worked away, inshifts. Suddenly, just as we inserted one of our glass slides into the ophthal-moscope, the cell seemed to come to life and began to fire impulses like amachine gun. It took a while to discover that the firing had nothing to do withthe small opaque spot—the cell was responding to the fine moving shadowcast by the edge of the glass slide as we inserted it into the slot. It took still moretime and groping around to discover that the cell gave responses only whenthis faint line was swept slowly forward in a certain range of orientations.Even changing the stimulus orientation by a few degrees made the responsesmuch weaker, and an orientation at right angles to the optimum produced noresponses at all. The cell completely ignored our black and white spots. Whenfinally we could think of nothing more to do with this cell, we discovered wehad worked with it for nine hours. The 1959 paper of course gives no hint ofour struggle. As usual in scientific reports we presented the bare results, withlittle of the sense of excitement or fun.
That cell was our first clear example of what we came to call orientationselectivity, which turns out to be the most striking attribute of cells in the pri-mary visual cortex. But that day, in the spring of 1958, we had no reason tobelieve that the cell was not a strange and unusual exception—the greatprevalence of orientation-selective cells only became clear in the months thatfollowed. In retrospect, that first cell was almost certainly an example of thetype that we finally came to term complex.

First Cat Cortex Paper 61
People hearing the story of how we stumbled on orientation selectivitymight conclude that the discovery was a matter of luck. While never deny-ing the importance of luck, we would rather say that it was more a matter ofbullheaded persistence, a refusal to give up when we seemed to be gettingnowhere. If something is there and you try hard enough and long enoughyou may find it; without that persistence, you certainly won't. It would bemore accurate to say that we would have been unlucky that day had we quita few hours before we did. It is hard to imagine that we would not, sooner orlater, have found orientation selectivity, provided we kept on doing experi-ments. But just as important as stubbornness, in getting results, was almostcertainly the simplicity, the looseness, of our methods of simulation. Theincredible crudeness of our first slide projectors and the projection screensthat soon replaced the ophthalmoscope, and our refusal to waste time both-ering with measuring intensities, rates of movement and so on, or to spendtime drawing graphs or histograms, all worked in our favor.
Despite our speed at getting started, everything did not always gosmoothly in those early experiments. We examined histologically all thebrains we recorded from, to verify that we had recorded from striate cortexand to determine if possible what layer each of our cells had been lodged in.So the last event in any experiment was to give the cat a lethal overdose ofbarbiturate and perfuse it with formalin, a preserving fluid consisting ofdilute formaldehyde, which we injected through the heart. One night therubber tubing coming from the huge overhead bottle of evil-smelling perfu-sion fluid broke loose and we were treated with our first formalin early-morning shower. We felt cleansed and chastened, went home smellingstrongly of a funeral home. From then on we were more careful to see thatthe tubing was securely attached.
The time came when we had enough results to write a short paper. Wehad collected about a hundred cells, some of which we felt we understoodand some of which we were sure we did not. By "understand" we mean thatwe could predict responses to slits, bars, or edges from the receptive fieldsmapped by turning on and off small stationary circular spots, in the wayKuffler had mapped his center-surround fields in the retina. We called thesecells (or receptive fields) simple. Those that we did not understand in termsof excitatory and inhibitory subregions we kept aside, hoping to be able tomake sense of them as time went on.
Jack Eccles, by then Sir John Eccles, under whom Steve Kuffler hadtrained in Australia, was a frequent visitor to Steve's lab and one of his clos-est friends. When Eccles visited, Steve usually brought him by to talk withus. On one of these visits we showed Sir John pictures of our first results. Hisreaction was to ask about the latency of the responses. Of course we had noidea. To which he commented: "You know, sooner or later you will have tostart doing neurophysiology". We did not know whether to be annoyed oramused, and we suddenly realized how far apart our neurophysiologicalworld was from his. In our experiments, as we repeatedly dragged the slit or

62 PART III NORMAL PHYSIOLOGY AND ANATOMY
edge across our cell's receptive field, the responses could vary in the time ittook them to start to fire by periods of up to 1/4 second. In Eccles' world, withits electrical stimulation of entire nerve bundles, one more millisecond in thetime it took for a cell to respond could point to an extra synapse in the circuithe was studying. We were clearly operating on very different wavelengths!
We were lucky to get into this field when we did, with the tools that wehad, the relative absence of competition, and the conviction that we must besitting on a gold mine. That conviction came from the recognition that any-thing as anatomically regular and beautiful as the striate cortex must surelybe carrying out an interesting and impressive set of functions.
One day Vernon Mountcastle came over to visit Steve and wanderedinto our lab. The night before his visit we had decided to give up on the oldophthalmoscope and try a projection screen instead. We could shine ourstimuli onto a screen, using a simple slide projector which we held by hand.We determined the positions on the screen that corresponded to the retinalarea centralis and optic disc by viewing these with an ordinary ophthalmo-scope to which we had attached a lamp that projected a spot back onto thescreen. The day of Vernon's visit we had had to devise an overhead screenbecause our head holder had the cat looking straight up. We brought in bed-sheets from home, and spread them across the many pipes that crisscrossedthe ceiling of our lab. When Vernon walked in, our room must have seemedlike a circus, complete with a tent and exotic animals. We were mapping thereceptive fields of three simultaneously recorded cells, reaching up to makemarks on pieces of paper pinned to the sheets. The receptive fields of thethree cells, recorded by a single electrode tip and hence presumably next-door neighbors, lay side-by-side but not completely overlapping, all with thesame orientation. The grouping of cells with common physiological proper-ties into columns was of course Vernon's great discovery in the mid-1950s,and given the similar orientation selectivity of our three neighboring cells,the thought that they might be lodged in a column analogous to Vernon'ssomatosensory columns was surely in the backs of all three of our minds.
Vernon naturally asked how many such cells we had seen. He had justpublished a paper on the somatosensory cortex in which he had observedsome 600 cells. To us that was an astronomical number, literally. Weanswered that in our series the three cells were numbers 3006, 3007, and3008. In order to catapult ourselves into a league that came close to Vernon's,we had begun our series of cells with No. 3000, but we did not tell Vernon.
With the Talbot-Kuffler head-holder-and-ophthalmoscope combina-tion we had the problem that it was only possible to stimulate one eye at atime. Consequently we had no idea whether our cells were binocular ormonocular. (It was clear from the anatomy of the visual pathway that thestriate cortex was the first place were the inputs from the two eyes could com-bine, but no one knew whether single cells would typically be influencedfrom the two eyes.) To be able to work with the two eyes, we obviously hadto make radical changes in our system of stimulating the eyes. (It was impos-sible to imagine using two Talbot-Kuffler ophthalmoscopes—one was bad

First Cat Cortex Paper 63
Wiesel an d Hubel, 1959, mapping a receptive field with a crude projector and screen.
enough!) In the 1940s Talbot had designed a Horsley-Clarke stereotaxicapparatus that was not only beautifully made, entirely of stainless steel, butalso sturdy and still very precise. (Some American neurobiologists tend toprefer the term stereotax, which makes me cringe. Horsley and Clarke wereBritish neurosurgeons. I'm not sure if Americans prefer stereotax because ofchauvinism, hatred of eponyms, or just a lack of feeling for the English lan-guage.) The instrument was unique in leaving the animal's visual fields com-pletely unobstructed, an obviously important consideration for us. Engravedon it were the words "Physiological Optics" and "Wilmer Institute JohnsHopkins Hospital". This instrument was first used by Talbot and Marshallin their topographic evoked-potential mapping of the visual cortex, and isshown in one of their illustrations (Am J Ophthal, 1941,24: 1255-1272, fig. 2).Steve had had no use for it in his retinal work and had lent it to Vernon, whoused it for years in the department of physiology, mapping somatosensoryrepresentations, first in the thalamus and later in the cortex. Vernon hadmentioned to us that he had just obtained and was now using a fancierstereotaxic instrument, and we concluded that the Talbot apparatus must begathering dust. One day, to look official, we donned white lab coats (the onlytime we ever wore such garments) and screwing up our courage went overto the Hopkins medical school (one block away) to reclaim the WilmerHorsley-Clarke. Vernon seemed less than pleased but had little choice. So weacquired a magnificent stereotaxic head holder, which we continued to usefor the remaining 20 years of our collaboration. If one includes the visualmapping done by Talbot and Marshall and the subsequent somatosensorymapping by Mountcastle, that piece of stereotaxic equipment undoubtedly
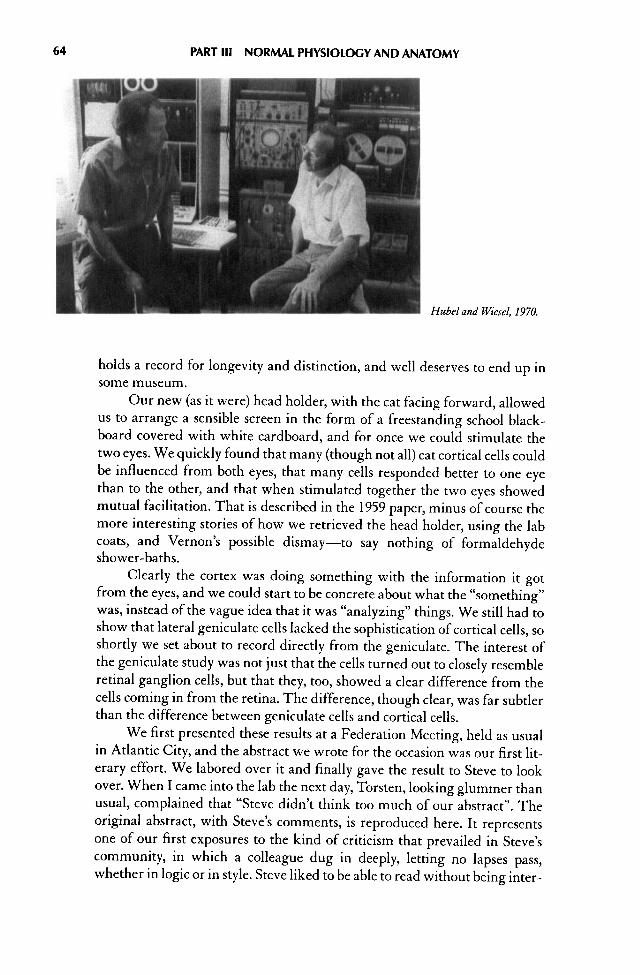
64 PART III NORMAL PHYSIOLOGY AND ANATOMY
Hubel and Wiesel, 1970.
holds a record for longevity and distinction, and well deserves to end up insome museum.
Our new (as it were) head holder, with the cat facing forward, allowedus to arrange a sensible screen in the form of a freestanding school black-board covered with white cardboard, and for once we could stimulate thetwo eyes. We quickly found that many (though not all) cat cortical cells couldbe influenced from both eyes, that many cells responded better to one eyethan to the other, and that when stimulated together the two eyes showedmutual facilitation. That is described in the 1959 paper, minus of course themore interesting stories of how we retrieved the head holder, using the labcoats, and Vernon's possible dismay—to say nothing of formaldehydeshower-baths.
Clearly the cortex was doing something with the information it gotfrom the eyes, and we could start to be concrete about what the "something"was, instead of the vague idea that it was "analyzing" things. We still had toshow that lateral geniculate cells lacked the sophistication of cortical cells, soshortly we set about to record directly from the geniculate. The interest ofthe geniculate study was not just that the cells turned out to closely resembleretinal ganglion cells, but that they, too, showed a clear difference from thecells coming in from the retina. The difference, though clear, was far subtlerthan the difference between geniculate cells and cortical cells.
We first presented these results at a Federation Meeting, held as usualin Atlantic City, and the abstract we wrote for the occasion was our first lit-erary effort. We labored over it and finally gave the result to Steve to lookover. When I came into the lab the next day, Torsten, looking glummer thanusual, complained that "Steve didn't think too much of our abstract". Theoriginal abstract, with Steve's comments, is reproduced here. It representsone of our first exposures to the kind of criticism that prevailed in Steve'scommunity, in which a colleague dug in deeply, letting no lapses pass,whether in logic or in style. Steve liked to be able to read without being inter-

Our first abstract, with Steve Koffler's comments, 1958
65

66 PART III NORMAL PHYSIOLOGY AND ANATOMY
rupted by difficulties of syntax or logic, and would mark any difficult pas-sages, complaining when something "tripped me up". When one compareshis criticisms with the kind of readings that can prevail in English courses atuniversities, in which the only comment may be a B- (or today, usually A-) atthe top of the page, one can understand why graduate students and evenpostdoctoral fellows so often lack the ability to write coherently or logically.It is hard to imagine a book-length Ph.D. thesis being criticized in the detailthat our abstract was subjected to by Steve, and a book-length thesis too oftenrepresents a beginning scientist's first efforts at serious writing. Steve took aninterest in writing for its own sake, and he and the two of us spent much timereading and discussing books on English writing by Strunk and White,Gowers, and of course Fowler.
In our first attempt to write a full-length paper we proceeded sentenceby sentence, discussing the wording as we went along. That clearly did notwork—it was like two people trying to improvise music singing alto andbass. In later papers we ended by having one author write the first draft,which the other would then edit and criticize. The burden was shared moreor less equally, though occasionally we differed in our enthusiasm or inter-est, in which case the one with the greater interest wrote the first draft.Papers were written and rewritten, and we gave each new draft to one of ourgroup to criticize as harshly as possible. Criticism took every possible form,from interpretation of results, to sentence structure and semantics. Thispaper represented, for both of us, one of our first efforts to put scientificresults into words. It was the first report that suggested any major reorgani-zation of incoming information by the cerebral cortex, and we could see thatit was important. We wanted to do the results justice, if we possibly could.
After 11 drafts, typing each draft ourselves our old Underwood type-writer (this was years before the trials and agonies of contending withMicrosoft Word) we sent the final version to the Journal of Physiology.The response was gratifying. It began, "Congratulations upon a very finepaper .. ." and made no suggestions for revisions. We assumed, withoutproof, that the reviewer was William Rushton—the same famous psy-chophysicist who had sat me down at Trinity High Table next to LordAdrian—partly because of his use of the word "upon". Meanwhile, we kepton doing experiments, recording more cells and trying to make sense of themore complex cells.
Still in the back of my mind was the feeling that my stay at the Wilmerwas to be temporary, and that we had to make the most of the limited timewe had left to collaborate.

First Cat Cortex Paper 67
Receptive Fields of Single Neurones in the Cat's Striate Cortex
D. H. HUBEL* AND T. N. WIESEL* • W/7mer Institute, The Johns Hopkins Hospital and University,
Baltimore, Maryland
In the central nervous system the visual pathwayfrom retina to striate cortex provides an opportu-nity to observe and compare single unit responsesat several distinct levels. Patterns of light stimulimost effective in influencing units at one level mayno longer be the most effective at the next. Fromdifferences in responses at successive stages in thepathway one may hope to gain some understand-ing of the part each stage plays in visual perception.
By shining small spots of light on the light-adapted cat retina Kuffler (1953) showed that gan-glion cells have concentric receptive fields, with an'on' centre and an 'off periphery, or vice versa. The'on' and 'off areas within a receptive field werefound to be mutually antagonistic, and a spotrestricted to the centre of the field was more effec-tive than one covering the whole receptive field(Barlow, FitzHugh & Kuffler, 1957). In the freelymoving light-adapted cat it was found that thegreat majority of cortical cells studied gave little orno response to light stimuli covering most of theanimal's visual field, whereas small spots shone in arestricted retinal region often evoked briskresponses (Hubel, 1959). A moving spot of lightoften produced stronger responses than a station-ary one, and sometimes a moving spot gave moreactivation for one direction than for the opposite.
The present investigation, made in acutepreparations, includes a study of receptive fields ofcells in the cat's striate cortex. Receptive fields ofthe cells considered in this paper were divided intoseparate excitatory and inhibitory ('on' and 'off')areas. In this respect they resembled retinal gan-glion-cell receptive fields. However, the shape andarrangement of excitatory and inhibitory areas dif-fered strikingly from the concentric pattern foundin retinal ganglion cells. An attempt was made tocorrelate responses to moving stimuli with recep-
tive field arrangements. Some cells could be acti-vated from either eye, and in these binocular inter-action was studied.
METHODS
In this series of experiments twenty-four cats were used.Animals were anaesthetized with intraperitoneal thio-pental sodium (40 mg/kg) and light anaesthesia wasmaintained throughout the experiment by additionalintraperitoneal injections. The eyes were immobilizedby continuous intravenous injection of succinylcholine;the employment of this muscle relaxant made it neces-sary to use artificial respiration. Pupils of both eyes weredilated and accommodation was relaxed by means of 1%atropine. Contact lenses used with a suitably bufferedsolution prevented the corneal surfaces from drying andbecoming cloudy. The lids were held apart by simplewire clips.
A multibeam ophthalmoscope designed by Talbot &Kuffler (1952) was used for stimulation and viewing theretina of the left eye. Background illumination was usu-ally about 0.17 log. metre candles (m.c.), and thestrongest available stimulus was 1.65 log. m.c. Manysizes and shapes of spots of light could be produced, andthese were well focused on the retina. Stimulus dura-tions were of the order of 1 sec.
For binocular studies a different method of lightstimulation was used. The animal faced a large screencovering most of the visual field. On this screen lightspots of various sizes and shapes were projected. Thelight source was a tungsten filament projector mountedon an adjustable tripod. Stimuli could be moved acrossthe screen in various directions and with differentspeeds. Spots subtending an angle as small as 12 min ofarc at the cat's eyes could be obtained, but generally0.5-1° spots were used for mapping receptive fields.(Dimensions of stimuli are given in terms of equivalentexternal angles; in the cat 1 mm on the retina subtendsabout 4°.) Spots were focused on the two retinas withlenses mounted in front of the cat's eyes. Lenses for
J. Physiol. (1959) 148, 574-591
Received 22 April 1959.
* Present address, Harvard Medical School, 25 Shattuck St., Boston 15, Massachusetts.

68 PART III NORMAL PHYSIOLOGY AND ANATOMY
focusing were selected by using a retinoscope. Spotintensities ranged from —0.76 to 0.69 log. cd/m2. A back-ground illuminance of—1.9 log. cd/m2 was given by atungsten bulb which illuminated the whole screen dif-fusely. Intensities were measured by a Macbeth Illumi-nometer. Values of retinal illumination corresponding tothese intensities (Talbot & Kuffler, 1952, Fig. 4) werewithin the photopic range but were lower than thoseemployed with the ophthalmoscope. Whenever the twomethods of stimulation were checked against each otherwhile recording from the same unit they were found togive similar results. This principle of projecting lightspots on a screen was described by Talbot & Marshall(1941). Areas responsive to light were marked on sheetsof paper fixed on the screen, in such a way as to indicatewhether the responses were excitatory or inhibitory. Thesheets of paper then provided permanent records ofthese responses, and showed the shape, size and orienta-tion of the regions.
Single unit activity was recorded extracellularly bytechniques described previously (Hubel, 1959). Ahydraulic micro-electrode positioner was attached to theanimal's skull by a rigidly implanted plastic peg. Thecortical surface was closed off from the atmosphere tominimize respiratory and vascular movements of thecortex (Davies, 1956). This method gave the stabilityneeded for thorough exploration of each receptive field,which often took many hours. Electrodes were elec-trolytically sharpened tungsten wires insulated with avinyl lacquer (Hubel, 1957). Cathode follower input anda condenser-coupled pre-amplifier were used in a con-ventional recording system.
Recordings were made from parts of the lateralgyrus extending from its posterior limit to about Hors-ley-Clarke frontal plane 10. At the end of each penetra-tion an electrolytic lesion was made (Hubel, 1959) and atthe end of the experiment the animal was perfused, firstwith normal saline and then with 10% formalin. Theborders of the trephine hole were marked with Indianink dots and the brain was removed from the skull andphotographed. Paraffin serial sections were made in theregion of penetration and stained with cresyl violet.These sections showed that all units described werelocated in the grey matter of the striate cortex. Correla-tion between location of units in the striate cortex andphysiological findings will not be dealt with in this paper.There is evidence that cortical cells and afferent fibresdiffer in their firing patterns and in their responses todiffuse light (Hubel, 1960). The assumption that thespikes recorded were from cell bodies is based on thesedifferences, as well as on electrophysiologic criteria fordistinguishing cell-body and fibre spikes (Frank &Fuortes, 1955; Hubel, 1960).
RESULTS
Several hundred units were recorded in the cat's
striate cortex. The findings to be described are
based on thorough studies of forty-five of these,
each of which was observed for a period of from 2
to 9 hr. Times of this order were usually required
for adequate analysis of these units.
In agreement with previous findings in the
freely moving light-adapted cat (Hubel, 1959) sin-
gle cortical units showed impulse activity in the
absence of changes in retinal illumination. Main-
tained activity was generally less than in freely
moving animals, and ranged from about 0.1—10
impulses/sec. The low rate was possibly due to
light barbiturate anaesthesia, since on a number of
occasions deepening the anaesthesia resulted in a
decrease of maintained activity. This need not
mean that all cortical cells are active in the absence
of light stimuli, since many quiescent units may
have gone unnoticed.
In most units it was possible to find a
restricted area in the retina from which firing
could be influenced by light. This area was called
the receptive field of the cortical unit, applying the
concept introduced by Hartline (1938) for retinal
ganglion cells. The procedure for mapping out a
receptive field is illustrated in Fig. 1. Shining a 1°
spot (250 JI on the retina) in some areas of the con-
tralateral eye produced a decrease in the main-tained activity, with a burst of impulses when the
light was turned off (Fig. la, b, d). Other areas
when illuminated produced an increase in firing
(Fig. \c, e). The complete map, illustrated to the
right of the figure, consisted of a long, narrow, ver-
tically oriented region from which 'off responseswere obtained (triangles), flanked on either side by
areas which gave 'on' responses (crosses). The
entire field covered an area subtending about 4°.
The elongated 'off region had a width of 1° and
was 4° long.
Most receptive fields could be subdivided into
excitatory and inhibitory regions. An area was
termed excitatory if illumination produced an
increase in frequency of firing. It was termed
inhibitory if light stimulation suppressed main-
tained activity and was followed by an 'off dis-
charge, or if either suppression of firing or an 'off
discharge occurred alone. In many units the rate of

First Cat Cortex Paper 69
Fig. 1. Responses of a cell in the cat's striate cortex to a 1° spot of light. Receptive field located in the eye con-tralateral to the hemisphere from which the unit was recorded, close to and below the area centralis, just nasalto the horizontal meridian. No response evoked from the ipsilateral eye. The complete map of the receptive fieldis shown to the right. X, areas giving excitation; A, areas giving inhibitory effects. Scale, 4°. Axes of this diagramare reproduced on left of each record, a, 1° (0.25 mm) spot shone in the centre of the field; b-e, 1° spot shone onfour points equidistant from centre; f, 5°'spot covering the entire field. Background illumination 0.17 log. m.c.Stimulus intensity 1.65 log. m.c. Duration of each stimulus 1 sec. Positive deflexions upward.
maintained activity was too slow or irregular todemonstrate inhibition during illumination, andonly an 'off discharge was seen. It was, however,always possible to demonstrate inhibitory effects ifthe firing rate was first increased by stimulation ofexcitatory regions.
As used here, 'excitatory' and 'inhibitory' arearbitrary terms, since both inhibition and excitationcould generally be demonstrated from both re-gions, either during the light stimulus or followingit. We have chosen to denote receptive field regionsaccording to effects seen during the stimulus. Fur-thermore, the word 'inhibition' is used descrip-tively, and need not imply a direct inhibitory effectof synaptic endings on the cell observed, since thesuppression of firing observed could also be due toa decrease in maintained synaptic excitation.
When excitatory and inhibitory regions (usedin the sense defined) were stimulated simultane-
ously they interacted in a mutually antagonisticmanner, giving a weaker response than wheneither region was illuminated alone. In most fieldsa stationary spot large enough to include the wholereceptive field was entirely without effect (Fig. If).Whenever a large spot failed to evoke responses,diffuse light stimulation of the entire retina at theseintensities and stimulus durations was also inef-fective.
In the unit of Fig. 1 the strongest inhibitoryresponses were obtained with a vertical slit-shapedspot of light covering the central area. The greatest'on' responses accompanied a stimulus confined tothe two flanking regions. Summation alwaysoccurred within an area of the same type, and thestrongest response was obtained with a stimulushaving the approximate shape of this area.
In the unit of Figs. 2 and 3 there was weakexcitation in response to a circular 1° spot in the

Fig. 2. Responses of a unit to stimulation with circular spots of light. Receptive field located in area centralis ofcontralateral eye. (This unit could also be activated by the ipsilateral eye.) a, 1°spot in the centre region; b, samespot displaced 3° to the right; c, 8° spot covering entire receptive field. Stimulus and background intensities andconventions as in Fig. 1. Scale, 6°.
Fig. 3. Same unit as in Fig. 2. A, responses to shining a rectangular light spot, 1° X 8°; centre of slit superimposedon centre of receptive field; successive stimuli rotated clockwise, as shown to left of figure. B, responses to a 1° X5° slit oriented in various directions, with one end always covering the centre of the receptive field: note that thiscentral region evoked responses when stimulated alone (Fig. 2a). Stimulus and background intensities as in Fig.1; stimulus duration 1 sec.
70

First Cat Cortex Paper 71
Fig. 4. Responses evoked only fromcontmlateral eye. Receptive field justoutside nasal border of area centralis.a, 1° spot covering the inhibitoryregion; b, right half of a circle 12° indiameter, c, light spot coveringregions illuminated in a and b. Bacf(-ground and stimulus intensities andconventions as in Fig. 1. Scale, 12°.
central region. A weak 'off response followedstimulation in one of the flanking areas (Fig. 2a,b}.There was no response to an 8° spot covering theentire receptive field (Fig. 2c). The same unit wasstrongly activated by a narrow slit-shaped stimu-lus, measuring 1° by 8°, oriented vertically over theexcitatory region (Fig. 3A). In contrast, a horizon-tal slit of light was completely ineffective, despitethe fact that the central area was capable of evok-ing a response when stimulated alone (Fig. 2a). Asthe optimum (vertical) orientation of the slit wasapproached responses appeared and rapidly in-creased to a maximum.
These findings can be readily understood interms of interacting excitatory and inhibitoryareas. The strength of the response to a verticallyoriented slit is explained by summation over theexcitatory region and by the exclusion of inhibitoryregions. When parts of the inhibitory flankingareas were included by rotating the slit, responseswere reduced or abolished. Thus a horizontal slitwas ineffective because it stimulated a small por-tion of the central excitatory area, and larger por-tions of the antagonistic regions.
Some units were not responsive enough topermit mapping of receptive fields with small lightspots. In these the effective stimulus pattern couldbe found by changing the size, shape and orienta-tion of the stimulus until a clear response wasevoked. Often when a region with excitatory orinhibitory responses was established the neigh-bouring opposing areas in the receptive field couldonly be demonstrated indirectly. Such an indirectmethod is illustrated in Fig. 3B, where two flank-ing areas are indicated by using a short slit in vari-ous positions like the hand of a clock, alwaysincluding the very centre of the field. The findings
thus agree qualitatively with those obtained with asmall spot (Fig. 2a).
Receptive fields having a central area andopposing flanks represented a common pattern,but several variations were seen. Some fields hadlong narrow central regions with extensive flank-ing areas (Figs. 1-3): others had a large central areaand concentrated slit-shaped flanks (Figs. 6, 9, 10).In many fields the two flanking regions were asym-metrical, differing in size and shape; in these agiven spot gave unequal responses in symmetri-cally corresponding regions. In some units onlytwo regions could be found, one excitatory and theother inhibitory, lying side by side. In these cases ofextreme asymmetry it is possible that there wasa second weak flanking area which could notbe demonstrated under the present experimentalconditions.
An interesting example of a field with onlytwo opposing regions is shown in Fig. 4. The con-centrated inhibitory region was confined to an areaof about 1° (Fig. 4a). The excitatory area situated tothe right of the inhibitory was much larger: a spotof at least 4° was required to evoke a response, anda very strong discharge was seen when the entire12° excitatory area was illuminated (Fig. 4£).Despite the difference in size between excitatoryand inhibitory areas, the effects of stimulating thetwo together cancelled each other and no responsewas evoked (Fig. 4<r). The semicircular stimulus inFig. 4£ was of special interest because the exactposition of the vertical borderline between lightand darkness was very critical for a strong re-sponse. A slight shift of the boundary to the left,allowing light to infringe on the inhibitory area,completely cancelled the response to illumination.Such a boundary between light and darkness,

72 PART III NORMAL PHYSIOLOGY AND ANATOMY
when properly positioned and oriented, was oftenan effective type of stimulus.
Cortical receptive fields with central andflanking regions may have either excitatory (Fig. 2)or inhibitory (Figs. 1,6,7) centres. So far we have noindication that one is more common than the other.
The axis of a field was defined as a linethrough its centre, parallel to an optimally orientedelongated stimulus. For each of the field typesdescribed examples were found with axes orientedvertically, horizontally or obliquely. Orientationswere determined with respect to the animal's skull.Exact field orientations with respect to the hori-zontal meridians of the retinas were not known,since relaxation of eye muscles may have causedslight rotation of the eyeballs. Within these limita-tions the two fields illustrated in Figs. 1—3 werevertically arranged: a horizontal field is shown inFig. 6, 9 and 10, and oblique fields in Figs. 7 and 8.
All units have had their receptive fieldsentirely within the half-field of vision contralateralto the hemisphere in which they were located.Some receptive fields were located in or near thearea centralis, while others were in peripheral reti-nal regions. All receptive fields were located in thehighly reflecting part of the cat's retina containingthe tapetum. So far, retinal ganglion cell studieshave also been confined to the tapetal region (Kuf-fler, 1953).
It was sometimes difficult to establish thetotal size of receptive fields, since the outer borderswere often poorly defined. Furthermore, field sizemay depend on intensity and size of the stimulusspot and on background illumination, as has beenshown for the retina by Hartline (1938) and Kuffler(1953). Within these limitations, and under thestimulus conditions specified, fields ranged in totalsize from about 4° to 10°. Although in the presentinvestigation no systematic studies have been madeof changes in receptive fields under different con-ditions of stimulation, fields obtained in the sameunit with the ophthalmoscope and with projectiontechniques were always found to be similar in sizeand structure, despite a difference of several loga-rithmic units in intensity of illumination. Thiswould suggest that within this photopic rangethere was little change in size or organization ofreceptive fields. No units have been studied instates of dark adaptation.
Responses to MovementMoving a light stimulus in the visual field was gen-erally an effective way of activating units. As waspreviously found in the freely moving animal(Hubel, 1959), these stimuli were sometimes theonly means by which the firing of a unit could beinfluenced. By moving spots of light across theretina in various directions and at different speedspatterns of response to movement could be out-lined in a qualitative way.
Slit-shaped spots of light were very effectiveand useful for studies of movement. Here also theorientation of the slit was critical for evokingresponses. For example, in the unit of Fig. 3 mov-ing a vertical slit back and forth across the fieldevoked a definite response at each crossing (Fig.5a), whereas moving a horizontal slit up and downwas without effect (Fig. 5b). The vertical slitcrossed excitatory and inhibitory areas one at atime and each area could exert its effect unopposed,but a horizontal slit at all times covered the antag-onistic regions simultaneously, and was thereforeineffective. The response to a vertical slit movedhorizontally was about the same for the two direc-tions of movement.
In some units a double response could beobserved at each crossing of the receptive field. Thereceptive field in Fig. 6 had an extensive inhibitorycentre flanked by elongated, horizontally oriented,concentrated flanking regions. A horizontal slitmoved slowly up or down over the receptive fieldevoked a discharge as each excitatory region wascrossed. A further description of this unit is givenin the binocular section of this paper (p. 584).
Many units showed directional selectivity of adifferent type in their responses to movement. Inthese a slit oriented optimally produced responsesthat were consistently different for the two direc-tions of transverse movement. In the example ofFig. 7, the receptive field consisted of a stronginhibitory area flanked by two excitatory areas, ofwhich the right was weaker than the left. Eachregion was elongated and obliquely oriented. Asusual, a large spot was ineffective (Fig. 7c). A nar-row slit, with its long axis parallel to that of thefield, produced a strong response when movedtransversely in a direction down and to the left, butonly a feeble response when moved up and to theright (Fig. 7d). A tentative interpretation of these

First Cat Cortex Paper 73
Fig. 5. Same unit as in Figs. 2 and 3.Receptive field shown in Fig. 2.Responses to a slit (1° X 8°) movedtransversely bac\ and forth across thereceptive field, a, slit moved horizon-tally, b, slit moved vertically. Back^-ground and stimulus intensities as inFig. 1; time, 1 sec.
Fig. 6. Slow up-and-down move-ments of horizontal slit (1° X 8°)across receptive field of left eye. Burstof impulses at each crossing of anexcitatory region. For details see Fig.9. X, excitatory; A, inhibitory. Bac\-ground illumination -1.9 cd/m2;stimulus intensity 0.69 cd/m ; time,1 sec.
stationary stimuli; nevertheless, by using movingstimuli it was possible to get some idea of the recep-tive field organization—for example, in this unit,the oblique orientation.
Binocular InteractionThirty-six units in this study could be driven onlyfrom one eye, fifteen from the eye ipsilateral to thehemisphere in which the unit was situated, and
findings on the basis of asymmetry within thereceptive field will be given in the Discussion.
A number of units responded well to somedirections of movement, but not at all to the reversedirections. An example of this is the unit of Fig. 8.Again a slit was moved back and forth transverselyin a number of different directions. Only move-ments up and to the right evoked responses. Aswith many units, this one could not be activated by
Fig.7.Unit activated from ipsilateral
eye only. Receptive field just tempo-
ral to area centralis. Field clongated
and obliquely oriented, Left excita-
tory flanking region stronger than
right. a, 10 * 100 slit covering central
region; b, 10 * 100 slit covering left
flanking region; c, 120 spot covering
entire receptive field; d, transverse
movement of slit (10 * 100) oriented
parallel to axis of field-note differ-
ence in response for the two direc-
tions of movement. Background and
stimulus intensities and conventions
as in Fig.6.Scale, 100; time, 1 sec.

74 PART III NORMAL PHYSIOLOGY AND ANATOMY
Fig. 8. Records from unit activated by ipsilateral eye only;unresponsive to stationary spots, influenced by movement inan area temporal to area centralis. A slit (0.5° X 8") movedbact{ and forth transversely with different orientations, asshown to the left. For slit orientations evoking responses onlyone direction was effective—up and to the right. Stimulusand background intensities as in Fig. 6; time, 1 sec.
twenty-one from the contralateral. Nine, however,could be driven from the two eyes independently.Some of these cells could be activated just as wellfrom either eye, but often the two eyes were notequally effective, and different degrees of domi-nance of one eye over the other were seen. In thesebinocular units the receptive fields were always inroughly homologous parts of the two retinas. Forexample, a unit with a receptive field in the nasalpart of the area centralis of one eye had a corre-sponding field in the temporal part of the area cen-tralis of the other eye.
Receptive fields were mapped out on a screenin front of the cat. With the eye muscles relaxedwith succinylcholine the eyes diverged slightly, sothat receptive fields as charted were usually side byside, instead of being superimposed. Whenever thereceptive fields of a single unit could be mappedout in the two eyes separately, they were similar inshape, in orientation of their axes, and in arrange-
ments of excitatory and inhibitory regions withinthe field.
The receptive fields shown in Fig. 9 wereobtained from a binocularly activated unit inwhich each field was composed of an inhibitorycentre flanked by narrow horizontal excitatoryareas. Responses of the same unit to a horizontalslit moved across the field have already been shownin Fig. 6, for the left eye.
Summation occurred between correspondingregions in the receptive fields of the two eyes (Fig.9). Thus simultaneous stimulation of two corre-sponding excitatory areas produced a responsewhich was clearly stronger than when either areawas stimulated alone (Fig. 9A). As the excitatoryflanks within one receptive field summed, the mostpowerful response was obtained with a stimuluscovering the four excitatory areas in the two eyes(Fig. 9B). Similarly, summation of 'off responsesoccurred when inhibitory areas in the two eyeswere stimulated together (Fig. 9C).
Antagonism could also be shown betweenreceptive fields of the two eyes (Fig. 10/1). Stimu-lated alone the central area of the left eye gave an'off response, and one flanking area of the righteye gave an 'on' response. When stimulated simul-taneously the two regions gave no response. Theprinciples of summation and antagonism couldthus be demonstrated between receptive fields ofthe two eyes, and were not limited to single eyes.
Finally, in this unit it was possible with amoving stimulus to show that opposite-type areasneed not always inhibit each other (Fig. 1(L4), butmay under certain circumstances be mutually rein-forcing (Fig. 105). The right eye was covered, anda spot was projected on the screen, over the centre(inhibitory) area of the left eye. Moving the spot asillustrated, away from the centre region of the lefteye, produced an 'off response (Fig. \OB, 1). Whenthe left eye was covered and the right eye uncov-ered, making the same movement again evoked aresponse as the flanking excitatory region of theright eye was illuminated (Fig. 10.6, 2). The proce-dure was now repeated with both eyes uncovered,and a greatly increased response was produced(Fig. IOB, 3). Here the movement was made insuch a way that the 'off response from the left eyeapparently added to the 'on' response from theright, producing a response much greater thanwith either region alone. It is very likely that

First Cat Cortex Paper 75
Fig. 9. This unit was activated from either eye independently. The illustration shows summation between cor-responding parts of the two receptive fields. Receptive field in the contralateral eye was located just above andnasal to area centralis; in the ipsilateral eye, above and temporal. Receptive fields of the two eyes were similar inform and orientation, as shown in upper right of the figure; scale 8°. The pairs of axes in the receptive field dia-gram are reproduced to the left of each record. Background and stimulus intensities and conventions as in Fig.6. (Same unit as in Fig. 6.) A. 1, horizontal slit covering lower flanging region of right eye; 2, same for left eye;3, pair of slits covering the lower flanging regions of the two eyes. B. 1, pair of horizontal slits covering both
flanging regions of the right eye; 2, same for left eye; 3, simultaneous stimulation of all four flanging regions. C.1, horizontal slit in central region of right eye; 2, same for left eye; 3, simultaneous stimulation of central regionsof both eyes. Time, 1 sec.
within a single receptive field opposite-type re-gions may act in this synergistic way in response toa moving stimulus.
DISCUSSION
In this study most cells in the striate cortex hadreceptive fields with separate excitatory and in-hibitory regions. This general type of organizationwas first described by Kuffler (1953) for retinalganglion cells, and has also been found in a prelim-inary study of neurones in the lateral geniculatebody (Hubel & Wiesel, unpublished). Thus at threedifferent levels in the visual system a cell can beinhibited by one type of stimulus and excited byanother type, while a stimulus combining the twois always less effective. Most retinal ganglion andgeniculate cells give clear responses to a large spotof light covering the entire receptive field. At thecortical level the antagonism between excitatoryand inhibitory areas appears to be more pro-nounced, since the majority of units showed little
or no response to stimulation with large spots. Sim-ilar findings in the cortex of unanaesthetized,freely moving cats (Hubel, 1959) suggest that this isprobably not a result of anaesthesia.
Other workers (Jung, 1953, 1958; Jung &Baumgartner, 1955), using only diffuse light stim-ulation, were able to drive about half the units inthe cat striate cortex, while the remainder couldnot be activated at all. In recent studies (Hubel,1960) about half the units recorded in striate cortexwere shown to be afferent fibres from the lateralgeniculate nucleus, and these responded to diffuseillumination. The remainder were thought to becell bodies or their axons; for the most part theyresponded poorly if at all to diffuse light. Theapparent discrepancy between our findings andthose of Jung and his co-workers may perhaps beexplained by the exclusion of afferent fibres fromthe present studies. On the other hand it may bethat cells responsive to diffuse light flashes aremore common in the cortex than our results wouldimply, but were not detected by our methods of

76 PART III NORMAL PHYSIOLOGY AND ANATOMY
Fig. 10. Same unit as in Fig. 9. A. Antagonism between inhibitory region in the left eye and an excitatory regionin the right eye; stationary spots. 1, horizontal slit in centre of left eye; 2, horizontal slit covering upper flangingregion of right eye; 3, simultaneous stimulation of the regions ofl and 2. B. Synergism between inhibitory regionin left eye and an excitatory region in the right eye; moving spot of light. 1, right eye covered, spot moved frominhibitory region in left eye, producing an 'off' response; 2, left eye covered, spot moved into excitatory region inright eye, producing an 'on' response; 3, both eyes uncovered, spot moved from inhibitory region in left eye intoexcitatory region of right eye, producing a greatly enhanced response. Time, 1 sec.
recording and stimulating. However, cortical cellsmay not be primarily concerned with levels of dif-fuse illumination. This would be in accord with thefinding that in cats some capacity for brightnessdiscrimination persists after bilateral ablation ofthe striate cortex (Smith, 1937).
The main difference between retinal gan-glion cells and cortical cells was to be found in thedetailed arrangement of excitatory and inhibitoryparts of their receptive fields. If afferent fibres areexcluded, no units so far recorded in the cortexhave had fields with the concentric configurationso typical of retinal ganglion cells. Moreover, thetypes of fields found in the cortex have not beenseen at lower levels.
Spots of more or less circular (or annular)form are the most effective stimuli for activatingretinal ganglion cells, and the diameter of the opti-mum spot is dependent on the size of the centralarea of the receptive field (Barlow et al. 1957). Atthe cortical level a circular spot was often ineffec-tive; for best driving of each unit it was necessary tofind a spot with a particular form and orientation.The cortical units described here have had in com-mon a side-by-side distribution of excitatory andinhibitory areas, usually with marked elongationof one or both types of regions. The form and sizeof the most effective light stimulus was given bythe shape of a particular region. The forms of stim-ulus used in these studies were usually simple, con-sisting of slit-shaped spots of light and boundariesbetween light and darkness. Position and orienta-tion were critical, since imperfectly placed forms
failed to cover one type of region completely, thusnot taking advantage of summation within thatregion, and at the same time could invade neigh-bouring, opposing areas (Fig. 3).
The phenomena of summation and antago-nism within receptive fields seem to provide a basisfor the specificity of stimuli, in shape, size and ori-entation. Units activated by slits and boundariesmay converge upon units of higher order whichrequire still more complex stimuli for their activa-tion. Most units presented in this paper have hadreceptive fields with clearly separable excitatoryand inhibitory areas. However, a number of unitsrecorded in the striate cortex could not be under-stood solely in these terms. These units with morecomplex properties are now under study.
Other types of receptive fields may yet befound in the cortex, since the sampling (45 units)was small, and may well be biased by the micro-electrode techniques. We may, for example, havefailed to record from smaller cells, or from unitswhich, lacking a maintained activity, would tendnot to be detected. We have therefore emphasizedthe common features and the variety of receptivefields, but have not attempted to classify them intoseparate groups.
There is anatomical evidence for convergenceof several optic tract fibres on to single geniculateneurons (O'Leary, 1940) and for a more extensiveconvergence of radiation fibres on to single corticalcells (O'Leary, 1941). Consistent with these ana-tomical findings, our results show that some singlecortical cells can be influenced from relatively large
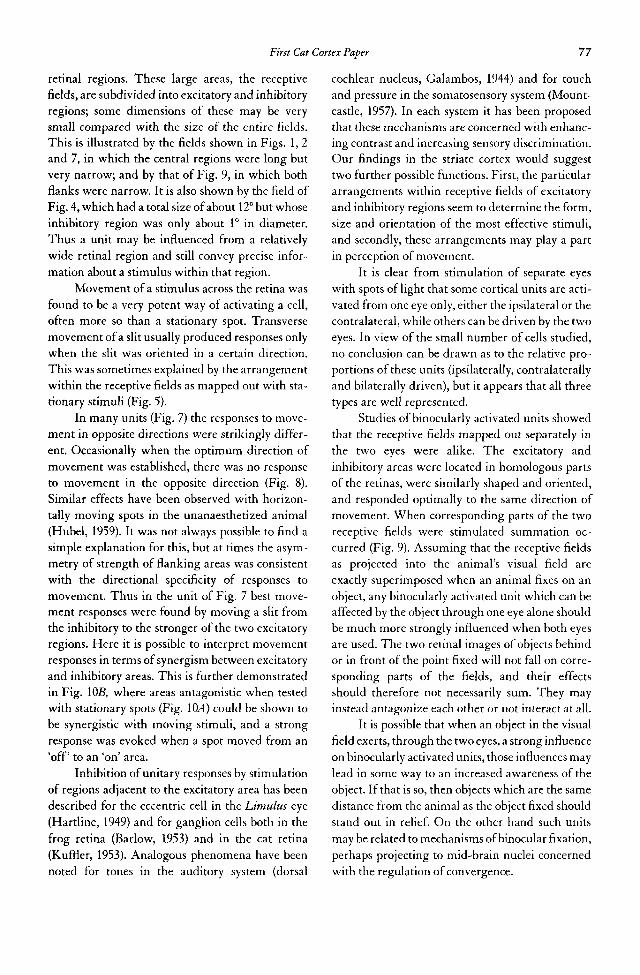
First Cat Cortex Paper 77
retinal regions. These large areas, the receptivefields, are subdivided into excitatory and inhibitoryregions; some dimensions of these may be verysmall compared with the size of the entire fields.This is illustrated by the fields shown in Figs. 1, 2and 7, in which the central regions were long butvery narrow; and by that of Fig. 9, in which bothflanks were narrow. It is also shown by the field ofFig. 4, which had a total size of about 12° but whoseinhibitory region was only about 1° in diameter.Thus a unit may be influenced from a relativelywide retinal region and still convey precise infor-mation about a stimulus within that region.
Movement of a stimulus across the retina wasfound to be a very potent way of activating a cell,often more so than a stationary spot. Transversemovement of a slit usually produced responses onlywhen the slit was oriented in a certain direction.This was sometimes explained by the arrangementwithin the receptive fields as mapped out with sta-tionary stimuli (Fig. 5).
In many units (Fig. 7) the responses to move-ment in opposite directions were strikingly differ-ent. Occasionally when the optimum direction ofmovement was established, there was no responseto movement in the opposite direction (Fig. 8).Similar effects have been observed with horizon-tally moving spots in the unanaesthetized animal(Hubel, 1959). It was not always possible to find asimple explanation for this, but at times the asym-metry of strength of flanking areas was consistentwith the directional specificity of responses tomovement. Thus in the unit of Fig. 7 best move-ment responses were found by moving a slit fromthe inhibitory to the stronger of the two excitatoryregions. Here it is possible to interpret movementresponses in terms of synergism between excitatoryand inhibitory areas. This is further demonstratedin Fig. IQB, where areas antagonistic when testedwith stationary spots (Fig. 1(L4) could be shown tobe synergistic with moving stimuli, and a strongresponse was evoked when a spot moved from an'off to an 'on' area.
Inhibition of unitary responses by stimulationof regions adjacent to the excitatory area has beendescribed for the eccentric cell in the Limulus eye(Hartline, 1949) and for ganglion cells both in thefrog retina (Barlow, 1953) and in the cat retina(Kuffler, 1953). Analogous phenomena have beennoted for tones in the auditory system (dorsal
cochlear nucleus, Galambos, 1944) and for touchand pressure in the somatosensory system (Mount-castle, 1957). In each system it has been proposedthat these mechanisms are concerned with enhanc-ing contrast and increasing sensory discrimination.Our findings in the striate cortex would suggesttwo further possible functions. First, the particulararrangements within receptive fields of excitatoryand inhibitory regions seem to determine the form,size and orientation of the most effective stimuli,and secondly, these arrangements may play a partin perception of movement.
It is clear from stimulation of separate eyeswith spots of light that some cortical units are acti-vated from one eye only, either the ipsilateral or thecontralateral, while others can be driven by the twoeyes. In view of the small number of cells studied,no conclusion can be drawn as to the relative pro-portions of these units (ipsilaterally, contralaterallyand bilaterally driven), but it appears that all threetypes are well represented.
Studies of binocularly activated units showedthat the receptive fields mapped out separately inthe two eyes were alike. The excitatory andinhibitory areas were located in homologous partsof the retinas, were similarly shaped and oriented,and responded optimally to the same direction ofmovement. When corresponding parts of the tworeceptive fields were stimulated summation oc-curred (Fig. 9). Assuming that the receptive fieldsas projected into the animal's visual field areexactly superimposed when an animal fixes on anobject, any binocularly activated unit which can beaffected by the object through one eye alone shouldbe much more strongly influenced when both eyesare used. The two retinal images of objects behindor in front of the point fixed will not fall on corre-sponding parts of the fields, and their effectsshould therefore not necessarily sum. They mayinstead antagonize each other or not interact at all.
It is possible that when an object in the visualfield exerts, through the two eyes, a strong influenceon binocularly activated units, those influences maylead in some way to an increased awareness of theobject. If that is so, then objects which are the samedistance from the animal as the object fixed shouldstand out in relief. On the other hand such unitsmay be related to mechanisms of binocular fixation,perhaps projecting to mid-brain nuclei concernedwith the regulation of convergence.

78 PART III NORMAL PHYSIOLOGY AND ANATOMY
SUMMARY
1. Recordings were made from single cells in thestriate cortex of lightly anaesthetized cats. Theretinas were stimulated separately or simulta-neously with light spots of various sizes andshapes.
2. In the light-adapted state cortical cells wereactive in the absence of additional light stimu-lation. Increasing the depth of anaesthesiatended to suppress this maintained activity.
3. Restricted retinal areas which on illuminationinfluenced the firing of single cortical unitswere called receptive fields. These fields wereusually subdivided into mutually antagonisticexcitatory and inhibitory regions.
4. A light stimulus (approximately 1 sec dura-tion) covering the whole receptive field, or dif-fuse illumination of the whole retina, was rel-atively ineffective in driving most units, owingto mutual antagonism between excitatory andinhibitory regions.
5. Excitatory and inhibitory regions, as mappedby stationary stimuli, were arranged within areceptive field in a side-by-side fashion with acentral area of one type flanked by antagonis-tic areas. The centres of receptive fields couldbe either excitatory or inhibitory. The flankswere often asymmetrical, in that a given sta-tionary stimulus gave unequal responses incorresponding portions of the flanking areas.In a few fields only two regions could bedemonstrated, located side by side. Receptivefields could be oriented in a vertical, horizon-tal or oblique manner.
6. Effective driving of a unit required a stimulusspecific in form, size, position and orientation,based on the arrangement of excitatory andinhibitory regions within receptive fields.
7. A spot of light gave greater responses for somedirections of movement than for others.Responses were often stronger for one direc-tion of movement than for the opposite; insome units these asymmetries could be inter-preted in terms of receptive field arrange-ments.
8. Of the forty-five units studied, thirty-six weredriven from only one eye, fifteen from the ipsi-lateral eye and twenty-one from the contralat-eral; the remaining nine could be driven from
the two eyes independently. In some binocularunits the two eyes were equally effective; inothers various degrees of dominance of one eyeover the other were seen.
9. Binocularly activated units were driven fromroughly homologous regions in the two reti-nas. For each unit the fields mapped for thetwo eyes were similar in size, form and orien-tation, and when stimulated with movingspots, showed similar directional preferences.
10. In a binocular unit excitatory and inhibitoryregions of the two receptive fields interacted,and summation and mutual antagonism couldbe shown just as within a single receptive field.
We wish to thank Dr S. W. Kuffler for his helpful advice andcriticism, and Mr R. B. Hosier and Mr P. E. Lockwood for theirtechnical assistance. This work was supported in part by U.S.Public Health Service grants B-22 and B-1931, and in part byU.S. Air Force contract AF 49 (638)-499 (Air Force Office of Sci-entific Research, Air Research and Development Command).
References
Barlow, H. B. (1953). Summation and inhibition in the frog'sretina./. Physiol. 119,69-88.
Barlow, H. B., FitzHugh, R. & Kuffler, S. W. (1957). Change oforganization in the receptive fields of the cat's retina duringdark adaptation./. Physiol. 137,338-354.
Davies, P. W. (1956). Chamber for microelectrode studies in thecerebral cortex. Science, 124,179-180.
Frank, K. & Fuortes, M. G. F. (1955). Potentials recorded fromthe spinal cord with microelectrodes. /. Physiol. 130,625-654.
Galambos, R. (1944). Inhibition of activity in single auditorynerve fibers by acoustic stimulation. /. Neurophysiol. 7,287-304.
Hartline, H. K. (1938). The response of single optic nerve fibersof the vertebrate eye to illumination of the retina. Amer. J.Physiol. 121,400-415.
Hartline, H. K. (1949). Inhibition of activity of visual receptorsby illuminating nearby retinal areas in the Limulus eye. Fed.Proc. 8, 69.
Hubel, D. H. (1957). Tungsten microelectrode for recordingfrom single units. Science, 125, 549-550.
Hubel, D. H. (1959). Single unit activity in striate cortex ofunrestrained cats./. Physiol. 147, 226-238.
Hubel, D. H. (1960). Single unit activity in lateral geniculatebody and optic tract of unrestrained cats. /. Physiol. (In thePress.)
Jung, R. (1953). Neuronal discharge. Electroenceph. din. Neuro-physiol. Suppl. 4, 57-71.
Jung, R. (1958). Excitation, inhibition and coordination of corti-cal neurones. Exp. Cell Res. Suppl. 5,262—271.
Jung, R. & Baumgartner, G. (1955). Hemmungsmechanismenund bremsende Stabilisierung an einzelnen Neuronen desoptischen Cortex. Pfltig, Arch. ges. Physiol. 261,434-456.
Kuffler, S. W. (1953). Discharge patterns and functional orga-nization of mammalian retina./. Neurophysiol. 16, 37—68.

First Cat Cortex Paper 79
Mountcastle, V. B. (1957). Modality and topographic properties postoperative effects of removal of the striate cortex uponof single neurons of cat's somatic sensory cortex./. Neuro- intensity discrimination./, genet. Psychol. 51,329—369.physiol. 20,408-434. Talbot, S. A. & Marshall, W. H. (1941). Physiological studies on
O'Leary, J. L. (1940). A structural analysis of the lateral genicu- neural mechanisms of visual localization and discrimina-late nucleus of the cat./, comp. Neural. 73,405-430. tion.Amer. /. Ophthal. 24,1255-1263.
O'Leary, J. L. (1941). Structure of the area striata of the cat./. Talbot, S. A. & Kuffler, S. W. (1952). A multibeam ophthalmo-comp. Neurol. 75,131—164. scope for the study of retinal physiology./, opt. Soc. Amer. 42,
Smith, K. U. (1937). Visual discrimination in the cat: V. The 931-936.
AFTERWORD
The idea that visual cells might be specialized to mediate complex forms wasnot new, having first been emphasized by Horace Barlow in 1953, in a studyof the frog optic nerve, and followed by Lettvin and Maturana's descriptionof optic fibers recorded in the frog tectum. Our first meeting with JerryLettvin took place shortly after we came to Harvard, when he came overfrom MIT to the Medical School to visit, bringing some simple equipmentand a frog, which he proceeded to use to demonstrate his convex-edge detec-tors and other wonders. We were impressed. It was clear from such earlywork that cells in the frog retina responded to stimuli that were more sophis-ticated than anything found in cat or primate retinas, and possibly morecomplex than what we had so far seen in the cortex. We obviously had muchin common with Lettvin and Maturana, especially our exploratory approachand freedom from complex apparatus, hypotheses, and so on. Jerry andHumberto Maturana carried their unusual approach to extremes, perhapsbecause they lacked an advisor like Steve, who insisted that we make at leasta few measurements for the sake of scientific respectability. They publishedrelatively seldom, sometimes in out-of-the-way places, and were oftenregarded with disbelief; quite unjustifiably, as the world came to realize.
The most flattering reaction to our paper was something we heardmuch later: that a few days after its publication in Journal of Physiology, E. D.Adrian walked into Alan Hodgkin's office holding the issue of the Journal,saying "Have you seen this paper?" To have the paper noticed by two of ourall-time heroes was an undreamed-of compliment. The reaction was notnecessarily shared by everyone, as can be appreciated by the story, mentionedabove, of Eccles' first visit.
Our paper probably did not completely conceal our qualitative, descrip-tive approach to measurements. We could have expressed many more of ourresults as graphs of responses, or thresholds, plotted against all possibleparameters—orientation, rate of movement, intensity, and so on. Today'sreferees would scream at our looseness. It is easy to forget that in the 1950sand 1960s it was much more common to present results in figures that toldstories, such as Figures 3 and 8 of the 1959 paper. Graphs, especially oneswith error bars, were uncommon in the days before computers made thingsall too easy. Steve's attitudes to quantification were refreshing. He neverasked about latencies, but insisted that we measure the light intensities we
80 PART III NORMAL PHYSIOLOGY AND ANATOMY
were using. His argument was pragmatic—that if we did not make at leasta few physical measurements we wouldn't be taken seriously.
All this was years before the appearance of computers as standard labequipment. Within five years or so we finally did buy a monster called a"PDP12", but it was several more years before we used it to do anythingexcept heat our lab at Harvard. (In those days Harvard did not have manythermostats.) At that stage of our work we wanted a qualitative descriptionof how receptive fields changed as one went further and further into thenervous system. Measurements, we felt, could wait.
Our methods were undoubtedly homespun—our enemies might callthem sloppy. The Talbot-Kuffler ophthalmoscope, together with some elec-tronics that Steve's electronics assistant, Bob Rosier, had built for the retinalwork, gave accurate stimulus timing, which we felt we did not need. Theupward-facing head holder and circus-tent bedsheets were amusing butawkward, and it was impossible to stimulate both eyes. We needed some-thing more practical even if crude. So we graduated to our blackboard—screen, and found a simple projector that resembled an old-fashioned child's(or Marcel Proust's) magic lantern—a bulb, a simple lens, and a reflector (seefigure, p. 63). To vary orientation and speed of movement we had to tilt andmove the entire projector by hand, and we produced our line stimuli by cut-ting out slits in pieces of cardboard that we stuck to a frame with maskingtape. We turned the stimulus on and off by interposing our hand in front ofthe lens. We later learned that two competing groups had attempted to acti-vate cortical cells by using more elaborate methods: the Freiburg group ledby Jung had built a device that somehow projected horizontal lines onto theretina, whereas a group in Montreal had built a projecting device that waslimited to vertical lines. Both methods were presumably used to locate recep-tive fields efficiently, but neither was capable of varying orientation, so thatit was impossible to stumble on orientation selectivity. Our methods, thoughcrude, were flexible, and paid off.
We see little to amend in this paper, perhaps because we were cautiousin our conclusions. The main conclusions were clear. Stimuli that producedresponses in retina were very different from those that were most effective incortex. For "simple" cortical cells, the geometrical arrangement of on and offregions was usually all one needed to know to predict the responses to anystimulus, stationary or moving. Generally a moving stimulus would producethe asymmetrical responses to movement predicted from the asymmetries ininhibitory flanks. Reversing contrast by substituting a slit for a dark barwould then reverse any preference for left-right or up-down movement.There were occasional exceptions, which we excused by saying, "After all,this is biology".
In subsequent papers on striate cortex, in 1962 and 1968, we quietlydropped the cell type described here in Fig. 4; in talking about it we referredto it as the "palette cell", and never again saw anything like it. Either it existsbut is a rare species, or, more likely, we were mistaken in our description.

First Cat Cortex Paper 81
At the time we wrote the 1959 paper, we had already collected and stud-ied many cells that we felt we did not understand. For the time being weexcluded these, reserving them for the next cortical paper, which appearedin 1962. We called them complex, and attempted to explain their behavior interms of neuronal circuits. Probably we would have held off and publishedthe entire story in one paper had we not felt pressured by the fear that ourcollaboration must soon end.
One of the most striking characteristics of the simple cells described inthis paper (and also the complex cells that came later) was their failure torespond to changes in diffuse light levels. Both cell types required spatial gra-dations in illumination, or contours. The cells would blissfully ignore ourturning the room lights on or off, and a flashlight directed into the animal'sface produced little or no response, even though (and indeed because] such astimulus could be expected to affect every rod or cone in the animal's retina.Steve's retinal ganglion cells responded, though weakly, to spots largeenough to include the receptive-field surround: the ability of the surround tocounteract the stimulation of the center is evidently far better developed incortical cells. All these cells were evidently interested, not in changes in over-all light levels, but in comparing the light level in one region with that inanother.
What struck us forcibly in this early work was the precision of theinterplay between excitation and inhibition, the outcome of which was toproduce the progressive specialization and specificity of cells at higher andhigher levels in the central nervous system. To get impressive responses fromcells, one had to have the excitation without the counteracting inhibition,and that called for refinement in stimuli. Such refinement was of coursealready apparent in Steve's retinal ganglion cells, but it took time for us torealize that at both levels, the point of the inhibition was to produce thespecialization.
At the time, the prevailing thought was that retinal ganglion cells andcortical cells "enhance contrast". While in some sense that is so, we look uponthe changes that occur as one goes centrally, along the visual path, as repre-senting an increase in cell specialization, a tendency for cells to ignore boringthings such as diffuse light levels in favor of objects that contrast with theirsurroundings. The contrast is already there, and needs no enhancement. Ittook us some time to realize fully that these results could explain the veryexistence of black and white—that they were matters of contrast, notabsolute energies, and that the whole point of the physiology was to free theviewer from a dependence on the energy in the light source. Only much later,when we became influenced by Edwin Land, and when we recorded fromdouble opponent cells, did we realize that the freedom extended also to theexact spectral content of the light source.
The paper came out in 1959, by which time we had already moved fromthe Wilmer Institute at Johns Hopkins to the Department of Pharmacologyat Harvard. In many ways we hated to leave Hopkins. The space there was

82 PART III NORMAL PHYSIOLOGY AND ANATOMY
certainly tight, but perhaps partly for that reason the relationships among themembers of Steve's group were rich and lively. We had felt welcome at theWilmer, though we had little contact with most of the ophthalmologiststhere. Years later our shabby old quarters, with its brick walls, pipes runningaround the ceiling, and the noise of the nearby eye clinic, were remodeled,and the ophthalmologists sent Torsten and me each a brick from the wall ofour lab with an inscribed brass plaque saying, "To David [Torsten] from hisfriends at the Wilmer, where it all began."
Chapter 8 • Recordings from Fibers in theMonkey Optic Nerve •
We began our research using cats partly because in those days they costalmost nothing, being easily available as strays that were collected and
taken to pounds. Because of this easy availability, cats were by far the mostcommonly used animals in central nervous neurophysiology, and thereexisted a rich background knowledge of cat anatomy and physiology. Thatwas especially important for us because of the work of Steve on the cat reti-nal ganglion cell. For Steve, the cat had been a lucky choice of animalbecause the complex color-coded cells one finds in the macaque monkeywere very nearly absent. That surely simplified things for him. It was onlymuch later that Nigel Daw and Alan Pearlman, postdocs in our lab, man-aged to find a few rare color-coded cells in the geniculates of cats (/ Physiol1970,211:125-137).
Perhaps because of our clinical backgrounds we were especially inter-ested in humans, and monkeys obviously had much more in common withhumans than cats did. This was especially true of the visual system. Cats haveexcellent audition, but vision is not their strong suit—their acuity is lower,their color vision and probably also their stereopsis are less important. Weforget why, at first, we chose the spider monkey—perhaps because they weremore easily available to us than macaques, and they are certainly far moreendearing and easier to work with. Monkeys were of course much moreexpensive than cats, but were still orders of magnitude cheaper then thanthey are today.
Our first experience with a spider monkey was unforgettable. To anes-thetize the animal we as usual prepared to give it an intraperitoneal injection(into the abdomen) of pentothal. Torsten held the animal's arms with onehand and the syringe with the other, while I held its legs. Suddenly thesyringe flew out of Torsten's grasp, firmly wrapped around by a coil of themonkey's tail. We knew that the tail was prehensile, with ridges on its under-surface like our fingerprints, but we had no idea how skilfully it could beused. We decided that from then on it would take three people to anesthetizeour spider monkeys.
83

84 PART III NORMAL PHYSIOLOGY AND ANATOMY
Receptive Fields of Optic Nerve Fibres in the Spider Monkey
D. H. HUBEL AND T. N. WIESEL • Neurophysiology Laboratory, Department of Pharmacology, Harvard Medical
School, Boston, Mass.
Our present knowledge of how mammalian retinalganglion-cell receptive fields are organized is basedmainly on findings in the cat by Kuffler (1953).These results have since been confirmed and ex-tended (Barlow, FitzHugh & Kuffler, 1957; Hubel,1960; Wiesel, 1960), but up to now similar studieshave not been made in primates. The retina of themonkey is of interest, since in most species, includ-ing Ateles (spider monkey) and Macaco, mulatta, it isdeeply pigmented and has a well defined fovea. Itappears to be much closer to the human retina thanto that of the cat, which has a highly reflectile tape-turn and lacks a fovea. The purpose of this report isto describe the receptive fields of single optic nervefibres in the spider monkey. In view of the mon-key's ability to discriminate colours, some observa-tions were also made on ganglion cell responses tomonochromatic stimuli.
METHODS
The four young spider monkeys (8—10 lb., 3.6—4.5 kg) inthis study were prepared in a manner similar to that
described for the cat (Hubel & Wiesel, 1959). An animal
was anaesthetized with thiopental sodium and light
anaesthesia was maintained throughout the experiment.
The head was placed in a Horsley^Clarke stereotaxic
instrument designed to permit stimulation of almost any
part of the visual field (Talbot & Marshall, 1941). The
eyes were immobilized with the muscle relaxant suc-
cinylcholine: this made it necessary to use artificial respi-
ration. The eyelids were held open and contact lenses
protected the corneas. The pupils were dilated and
accommodation was relaxed with atropine. A slit
retinoscope was used to determine the correct supple-
mentary lenses for focusing the eyes on a screen at a
given distance.
The animal faced a large tangent screen. This was
generally placed 1.5 m from the monkey, but for the
smallest stimuli it was moved to a distance of 10 m. A
distant tungsten lamp supplied a diffuse background
light which produced on the screen a variable luminance
of up to 2.0 Iog10 cd/m2. Circular or annular spots pro-
vided by a tungsten projection lamp could be shone on
different parts of the screen. The maximum spot lumi-
nance was 3.0 Iog10 cd/m2. Stimulus spots were adjusted
in intensity with an iris diaphragm so as not to exceed the
background by more than 2 Iog10 units. At 10 m distance
spots were obtainable subtending angles down to about
20 sec of arc, equivalent to about 2 JJ. on the retina. Fif-
teen interference filters (Farrand Optical Co., New
York, N.Y.) ranging from 400 to 700 mfl with a band
width at half maximum transmission of 25—50 m|J,, were
used to obtain coloured stimuli. The coloured lights
were not calibrated for equal energy, but this was not
necessary for the observations to be described.
By a projection method points corresponding to the
optic disk and the fovea were mapped out on the screen.
An ophthalmoscope was designed which permitted di-
rect vision of the fundus by means of a small spot of light.
This spot was directed through the centre of the pupil at
the fovea or optic disk and the instrument was locked in
position. The ophthalmoscope shone a second beam in a
direction exactly opposite to the retinal beam, making a
small spot on the screen. The position of this spot thencorresponded to the illuminated retinal point. Points on
the screen could thus be specified with reference to the
fovea and the optic disk, and points on the retina were
stimulated by illuminating the corresponding points on
the screen. The correspondence could be verified by illu-
minating a point on the screen (e.g. that corresponding to
the optic disk) and observing the retina directly with an
ordinary ophthalmoscope through a half-silvered mirror
placed at 45° in front of the eye.
Regions in the visual field which gave 'on' or 'off
(excitatory or inhibitory) responses to illumination were
marked on sheets of paper fixed to the screen. These pro-
vided permanent records of the size and shape of the
receptive fields and of their position with respect to the
fovea and the optic disk.
Single fibres were recorded from the optic nerve
with tungsten micro-electrodes (Hubel, 1957). Cathode-
follower input and a condenser-coupled pre-amplifier
were used in a conventional recording system. In pre-
/. Physiol. (1960), 154,/f. 572-580.
Received 12 July 1960.

Monkey Optic Nerve Fibers 85
liminary experiments, not included in this series, thenerve was approached under direct vision from below bya transpharyngeal route and from above by removingone frontal lobe. Both procedures proved tedious, andneither gave good stability. The method finally adoptedwas a modification of a technique used for single-unitrecording within the brain of the unrestrained animal(Hubel, 1960). The nerve was approached from abovethrough the intact brain. A closed system was used tolessen vascular and respiratory pulsations. A hydraulicmicro-electrode positioner was oriented by Horsley—Clarke stereotaxic methods. The co-ordinates of theoptic nerve were determined from the position of thebony optic foramen, using the average from several spi-der monkey skulls. During the actual experiment a smallhole was made in the skull and an 18-gauge steel tubeattached to the positioner was lowered through the brainuntil its tip was several millimetres above the optic nerve.The space between the tube and the skull was sealedwith dental-impression cement. The electrode, heldwithin this outer tube by an insulated 26-gauge hollowneedle, was then hydraulically advanced until it enteredthe optic nerve.
RESULTS
One hundred and twelve optic nerve fibres werestudied. In the light-adapted state all fibres showedmaintained activity; that is, they discharged im-pulses in the absence of any stimulus besides thesteady uniform background light. No systematicobservations were made in the dark-adapted state.Firing patterns resembled, at least superficially,those described for the cat's ganglion cell by Kuf-fler, FitzHugh & Barlow (1957).
If a small spot of light was projected on thescreen one could always find a restricted area overwhich firing of a fibre could be influenced. Thiswas termed the receptive field of the fibre. Recep-tive fields had the same general characteristics as
those of the cat, described by Kuffler (1953). As inthe cat, two main types could be distinguished,both concentrically arranged, one with an 'on' cen-tre and an 'off periphery, the other with an 'offcentre and an 'on' periphery. Records from an 'offcentre unit are shown in Fig. 1, and illustrate sup-pression of firing with an 'off discharge inresponse to a centred spot, and an 'on' discharge inresponse to an annulus. Responses from the pe-riphery of receptive fields were often difficult orimpossible to elicit in the monkey when stimulusand background intensities were of the same orderas those used in work on the cat's retina. However,if both the stimulus and the background lumi-nances were increased by about 2 log units, periph-eral responses could usually be obtained. The influ-ence of peripheral parts of receptive fields could bedemonstrated even with weaker stimuli, since itwas always possible to decrease a centre responseby simultaneous stimulation of regions outside thefield centre. In Fig. 2 spots of successively largersize were used to stimulate an 'on' centre fibre. Thesmallest spot did not fill the centre (Fig. 2A), and itgave a response considerably weaker than thatevoked by a second spot (B) which just filled thecentre. A still larger spot invaded the periphery (C),and the response was now less marked than withthe second.
The receptive fields studied were situated invarious parts of the retina, ranging between 4° and56° from the fovea. In any given penetrationthrough the optic nerve from above there was atendency for receptive fields of the first fibresrecorded to be located in the lower quadrants of thevisual field. As the electrode was lowered thereceptive fields tended to be located higher andhigher in the visual field. Otherwise, however,there was little order in the position of fields, and
Fig, 1. Responses of an 'off' centreunit to restricted light stimulation. Ineach example the upper line indicateswhen the stimulus light is on. A, 'A0
spot of light shone in the centre of thereceptive field; B, annulus 5° in out-side diameter, 2° inside diameter, withits centre over that of the receptivefield. Receptive field located on theretina 28° above and 12° nasal to thefovea. Duration of stimuli, 1.5 sec.

86 PART III NORMAL PHYSIOLOGY AND ANATOMY
Fig. 2. 'On' centre unit with receptive field 11° above, 4° nasal tofovea. Responses to centred spots Ye", 'A0 and 4°in diameter. Duration of stimuli, 1.5 sec.
fields of successively recorded fibres were oftenseparated by a considerable distance, in an unpre-dictable fashion. This is illustrated in Fig. 3 for aparticular penetration in which 20 fibres weremapped. From this and other penetrations one hadthe impression that there was no very detailed top-ographical representation in this part of the opticnerve, but only a coarse segregation of fibres fromthe different quadrants.
The size of receptive field centres rangedfrom 4 min to 2° of arc. The centres were mappedout by using spots of light which for each field werechosen so as to be small relative to the size of thecentre. Relatively high background illumination(1.0 Iog10 cd/m2 or more) was used to minimizeeffects of scattered light. No attempt was made todetermine accurately the total extent of each recep-tive field, but there was little doubt that for mostfields the total diameter was many times that of thecentre. There was a clear tendency for receptivefield centres near the fovea to be smaller than thosein the periphery, although there was considerablevariation in centre size at any given distance fromthe fovea. In Fig. 4 the diameters of 65 field centresare plotted against distance from the fovea. Both'on' and 'off centre units were well represented inthe series. The number of units is too small to jus-tify any conclusions about the preponderance ofone type of field over the other. In particular, theapparent predominance of 'on' centre units over
'off centre in the region near the fovea is of inter-est, but again, conclusions can hardly be drawnfrom such a small sample.
In the present work there was no attempt tomake a thorough study of responses to colouredstimuli. However, some preliminary results showedthat there are ganglion cells which respond in spe-cific ways to colour. An example is given in Fig. 5. Inthis unit a 2° spot of white light gave a weak responseconsisting of suppression of firing followed by a fee-ble 'off discharge (Fig. 5/1). A decrease in intensityof the white light produced even weaker 'offresponses. With the light source intensity set as inFig. 5A, a blue interference filter was placed in frontof the projector. Each time the blue spot of light wasshone on the screen it produced a strong 'on'response (Fig. 5B). If a red filter was substituted forthe blue the firing was strongly suppressed duringthe stimulus and this was followed by an 'off dis-charge (Fig. 5C). It is clear that either filter greatlyreduced the radiant flux of the light beam, yet theeffects of the stimulus were much enhanced. More-over, the responses to stimulation with the two dif-ferent colours were of opposite type. This was trueregardless of stimulus intensity or spot size. Twoother units studied with monochromatic light gave'on' responses to wave-lengths shorter than 498 m|J,and inhibition with 'off responses for longer wave-lengths. With 498 m|l a very feeble 'off responsewas produced.

Monkey Optic Nerve Fibers 87
Fig. 3. Location on the visual field ofreceptive fields of 20 optic nervefibres recorded in sequence as theelectrode was advanced verticallyfrom above through the left opticnerve. The vertical and horizontallines represent the vertical and hori-zontal meridia; these cross at thefovea. The optic disf^ D is situated inthe temporal field 20°from the fovea.The first unit, A, had its receptivefield in the lower temporal quadrantof the visual field; the last, B, in theupper nasal quadrant.
It is likely that the units with specific colourresponses described above form a small minority ofthe population of optic nerve fibres, since a numberof additional units studied with monochromaticstimuli gave centre responses of constant type,either 'on' or 'off, for all wave-lengths. In thesewhite light gave brisk responses. In this type ofganglion cell, however, there were indications ofsome variability in the position of spectral sensitiv-ity peaks from one unit to the next, suggesting thatthey too, conveyed information on colour.
DISCUSSION
From the results presented in this paper it is clearthat in the monkey, as in the cat, the receptive fieldsof retinal ganglion cells are of two main types, onewith an 'off centre and an 'on' periphery, the otherwith an 'on' centre and an 'off periphery. Theantagonism between centre and periphery of areceptive field is generally not so complete that dif-fuse light is ineffective.
Fields in the vicinity of the monkey fovea tendto have smaller centres than those in the periphery(Fig. 4). A similar finding has been reported for thecat (Wiesel, 1960). Differences between central andperipheral visual acuity in man may well be relatedto variations in receptive-field centre size similar tothose found in the monkey and cat. In the presentstudy the smallest centre was found for a receptivefield 4° from the fovea; this had a diameter of lessthan 4 minutes of arc. No recordings were madefrom fibres with receptive fields in the fovea, but itis likely that even smaller field centres are present inthis region, since there is less convergence in thepathway from receptors to ganglion cells in thefoveal region than in other parts of the retina(Polyak, 1957). Our failure to find foveal fields isprobably related to the small diameter of the macu-lar fibres. Moreover, the macular bundle occupies asmall part of the optic nerve, and could easily bemissed in random penetrations.
The cat has a highly reflectile tapetum behindthe retina; in contrast, the retina of the spider mon-

88 PART III NORMAL PHYSIOLOGY AND ANATOMY
Fig, 4. Diameters of receptive fieldcentres in degrees (logarithmic scale),plotted against distance in degrees ofeach field from thefovea. X, 'on' cen-tre units;A, 'off' centre units.
key is deeply pigmented. With identical stimulusconditions it was generally more difficult to pro-duce a response from the receptive-field peripheryin the spider monkey than in the cat. However, itwas found that by increasing the stimulus and back-ground luminance by two logarithmic units periph-eral responses could consistently be obtained. It isprobable that the tapetum of the cat increases theeffectiveness of the background illumination, andthis may be necessary for the production of a goodresponse from the periphery of the receptive field.
It is known, for example, that the influence of theperiphery on the centre response becomes morepronounced with increasing background illumina-tion (Barlow et al. 1957).
Several authors have described responses ofopposite type to stimulation with light of differentcolours. Svaetichin (1956) demonstrated membranehyperpolarization with short wave-lengths anddepolarization with long wave-lengths in record-ings from cells in the inner nuclear layer of the fishretina (MacNichol & Svaetichin, 1958). Similar
Fig. 5. Response of optic nerve fibre to 2° spot of light shone in centre of receptive field. Location of field, 7° below,29° temporal tofovea. A, white light; B, same as A, but with blue interference filter (pea\ transmission 480 mfj)inserted between projector and screen; C, same as A, but with red interference filter (pea\ transmission 630 m[i)inserted between projector and screen. Duration of first stimulus, 1 sec.

Monkey Optic Nerve Fibers 89
results have been reported by other workers (Moto-kawa, Oikawa & Tasaki, 1957; Tomita, Tosaka,Watanabe & Sato, 1958). In the lateral geniculatebody of the rhesus monkey de Valois, Smith, Kitai& Karoly (1958) described units responding with an'on' discharge to blue light and an 'off discharge tored light. Wagner, MacNichol & Wolbarsht (1960),recording spike discharges from ganglion cells inthe goldfish retina, have since found similar dis-charge patterns to coloured stimuli.
In the present study of the spider monkey'sextra-foveal retina three ganglion cells showedcolour responses analogous to those describedabove. The presence of maintained dischargesmade it possible to demonstrate inhibitory effectsduring long wave-length stimuli, in addition to theexcitatory responses to short wave-lengths. Whitelight was less effective than monochromatic light,provided the wave-length was either longer orshorter than about 500 m|l. The decreased respon-siveness to white light which has been noted also byde Valois (1960) is presumably due to the antago-nistic effects of monochromatic light of short andlong wave-lengths. This is strikingly similar to theway in which form specificity is obtained in thevisual system; shining a restricted light on appro-priate parts of a receptive field produces excitatoryor inhibitory responses, and the effects tend to can-cel when opposing regions are stimulated simulta-neously, for instance with diffuse light. In both casesan unspecific stimulus produces less effect on thefiring of a single cell than one restricted in form orwave-length, even though it contains more energy.
SUMMARY
1. Receptive fields of retinal ganglion cells werestudied in the light-adapted spider monkey. Allfields mapped with white light had a concentricarrangement similar to that of cat retinal gan-glion cells, with a sharply demarcated 'on' cen-tre surrounded by an antagonistic 'off periph-ery, or the reverse.
2. The smallest receptive field centres were foundnear the fovea, and the size of centres tended toincrease with increasing distance from thefovea. The smallest centre had a diameter of 4minutes of arc (corresponding to about 20 (J, onthe retina) and was located 4° from the fovea;the largest centre had a diameter of 2°.
3. Three ganglion cells out of about 100 respondedin a specific way to coloured stimuli. In thesecells light of short wave-length produced an 'on'response and light of long wave-length evokedinhibition followed by an 'off response. Transi-tion between the two types of response occurredat about 500 m|i; light of this wave-lengthevoked only feeble 'off responses. Very weakresponses were obtained to white light, presum-ably owing to the antagonism between light ofshort and long wave-lengths.
This work was supported by research grants B-2251 and B-2260United States Public Health Service, and by the United StatesAir Force Office of Scientific Research of the Air Researchand Development Command under contract no. AF 49(638)-713.
References
Barlow, H. B., FitzHugh, R. & Kuffler, S. W. (1957). Dark adap-tation, absolute threshold and Purkinje shift in single unitsof the cat's retina./. Physiol. 137, 327-337.
De Valois, R. L. (1960). Color vision mechanisms in the monkey./. gen. Physiol. 43, pt. 2, 115-128.
De Valois, R. L., Smith, C.J., Kitai, S. T. & Karoly, A. J. (1958).Response of single cells in monkey lateral geniculatenucleus to monochromatic light. Science, 127, 238—239.
Hubel, D. H. (1957). Tungsten microelectrode for recordingfrom single units. Science, 125, 549—550.
Hubel, D. H. (1960). Single unit activity in lateral geniculatebody and optic tract of unrestrained cats. /. Physiol. 150,91-104.
Hubel, D. H. & Wiesel, T. N. (1959). Receptive fields of singleneurones in the cat's striate cortex./. Physiol. 148, 574—591.
Kuffler, S. W. (1953). Discharge patterns and functional orga-nization of mammalian retina./. Neurophysiol. 16, 37—68.
Kuffler, S. W., FitzHugh, R. & Barlow, H. B. (1957). Maintainedactivity in the cat's retina in light and darkness./, gen. Phys-iol. 40,683-702.
MacNichol, E. J. & Svaetichin, G. (1958). Electric responsesfrom the isolated retinas of fishes. Amer. J. Ophthal. 46, No.3, Part II, 26-40.
Motokawa, K., Oikawa, T. & Tasaki, K. (1957). Receptor poten-tial of vertebrate retina./. Neurophysiol. 20, 186-199.
Polyak, S. (1957). The Vertebrate Visual System, ed. Kluver, H.The University of Chicago Press.
Svaetichin, G. (1956). Spectral response curves from singlecones. Acta physiol. scand. 39, Suppl. 134,17.
Talbot, S. A. & Marshall, W. H. (1941). Physiological studies onneural mechanisms of visual localization and discrimina-tion. Amer. ]. Ophthal. 24,1255-1263.
Tomita, T., Tosaka, T, Watanabe, K. & Sato, Y. (1958). The fishEIRG in response to different types of illumination. Jap. ].Physiol. 8,41-50.
Wagner, H. G., MacNichol, E. F. & Wolbarsht, M. L. (1960).The response properties of single ganglion cells in the gold-fish retina./, gen. Physiol. 43, pt. 2, 45-62.
Wiesel, T. N. (1960). Receptive fields of ganglion cells in the catretina./. Physiol. 153,583-594.

90 PART III NORMAL PHYSIOLOGY AND ANATOMY
AFTERWORD
The first nine fibers we recorded in this entire project were all on-center, andwe began to wonder if we were onto a new discovery, that primate opticnerves were all on-centers, unlike those in cats. It was a great disappointment(or perhaps relief) when the tenth one turned out to be off-center.
The surprising finding, that the optic nerve and tract fibers (between theeye and the geniculate) are scrambled for most of their extent, was contraryto accepted ideas about optic nerve organization, and was confirmed anatom-ically in 1979 by Horton, Greenwood, and Hubel (Nature, 282:720-722).
When we began this study, color was evidently not uppermost in ourthoughts, and we had no elaborate equipment for generating colored stim-uli. Ed Furshpan walked in one day just as we began using a yellow card-board Kodak 35 mm film box, getting vigorous responses from a cell thatwas oblivious to changes in white light. Ed's comment was "That's interest-ing!" Up to that time we had never heard him express such enthusiasm, andwe decided it must indeed be very interesting.
Chapter 9 • Recording from Cells in theCat Lateral Geniculate •
This little paper is one of our favorites. It represented a rare opportunityto study directly the difference between the information entering a
structure and the information leaving it, and thus to learn directly somethingabout the function of that structure. Many of our colleagues spent yearsstudying the superior cervical ganglion (to take one example) without everasking what that structure might be contributing to the animal. There is ofcourse nothing wrong with that: they were studying synapses and develop-ment and did not care at all about function. On the other hand, function waswhat we were studying and details of synaptic mechanisms could wait.
We began recording from the geniculate because we felt we had to knowwhat was coming into the cortex. Having found that cortical cells were verydifferent from optic nerve fibers, we had to be sure the transformations wereindeed occurring in the cortex, rather than in the geniculate. It took only afew experiments to satisfy ourselves that the receptive fields of geniculate cellsand retinal ganglion cells are indeed qualitatively very similar in having anantagonistic center-surround organization. We might have decided that ourmain objective had been met (as in the case of the 1991 first Gulf War) andthat the lateral geniculate was, as many people thought then, just a passiverelay that handed on information from the retina without changing it. Butfrom the first we did see clear differences. Geniculate cells had slower spon-taneous rates of firing; they responded much less well to diffuse light (i.e., tostimulation with large spots); and they often fired in short, high-frequencybursts that we called clusters, which we never saw in retinal ganglion cells. Weknew from previous work in unrestrained cats that the clusters occurred onlywhen the cat was drowsy or asleep, especially when the stimulus was such asto suppress the cell's firing (for example, an annulus in the case of an on-centercell). From this we concluded that the lateral geniculate body must be some-thing more than a simple relay station, though in the beginning we failed tounderstand what use such changes might be to the animal. We could have leftit at that, but luckily we pushed on.
If one looks only at the impulses recorded extracellularly from genicu-late cells, the main feature is the slow firing rates, compared to the rapid
91

92 PART III NORMAL PHYSIOLOGY AND ANATOMY
buzzing that occurs in spontaneously firing optic-nerve fibers—plus the ten-dency, just mentioned, for geniculate cells to fire in clusters. On closescrutiny we could see, in our records, tiny all-or-none deflections that weredwarfed by the big geniculate-cell spikes. These little spikes occurred inrapid succession, but never in clusters. They responded just as actively to dif-fuse light as retinal ganglion cells did. Their behavior in fact resembled inevery way that of retinal ganglion cells. As our electrode advanced, these tinyspikes usually increased in size and in duration, so that they came more andmore to resemble typical, intracellularly recorded, excitatory post-synapticpotentials (EPSPs). We soon noticed that nearly every geniculate spike waspreceded by one of these smaller spikes, which we termed prepotentiah.There was one exception: when the geniculate cell fired a high-frequencyburst (a cluster), only the very first spike was preceded by a prepotential. Itwas hard for us to swallow the idea that in our experiments each of thesesmall all-or-none potentials could be an EPSP related to a single optic fiber.Each geniculate cell was known to receive input from a huge number ofpresynaptic optic-fiber endings, seemingly contradicting the idea that animpulse in a single optic nerve fiber could lead to an impulse in a geniculatecell. We were hesitant to accept that an EPSP from a single afferent fibercould be recorded extracellularly. Today it is clear that one optic nerve fiberbreaks up into a huge number of branches, and that a single geniculate cellcan receive most of its direct inputs from all or a large subset of thesebranches—and hence show huge EPSPs. In this way one optic nerve fibercan virtually monopolize one geniculate cell. Though in almost all of ourwork we tried to use natural stimulation, this was one case where gradedelectrical stimulation of the optic chiasm helped convince us that the prepo-tentials did indeed represent activity of single optic nerve fibers.
We often saw several EPSPs (to use the modern term) of different sizes,all associated with the spikes of one geniculate cell, and we tentatively con-cluded that one geniculate cell could sometimes receive major excitatoryinputs from the branches of two or more such afferents. We did not empha-size this in the paper because Ed Furshpan could hardly make out thesmaller of the tiny deflections in our records and forbade us to publish them,saying, in the margin, "bullshit!" We now know that Ed was too cautious,and haven't quite forgiven him.
We called the prepotentials optic tract synaptic potentials. Since then,they have become known by the more efficient but less self-explanatory terms-potential.
Cat Lateral Geniculate 93
Integrative Action in the Cat's Lateral Geniculate Body
D. H. HUBEL AND T. N. WIESEL • Neurophysiology Laboratory, Department of Pharmacology, Harvard Medical
School, Boston 75, Massachusetts
It has often been asked whether the lateral genicu-late body contributes to the integration of incom-ing visual impulses or is a mere 'way-station' in thepathway from retina to cortex. While perhaps lesscomplex than the retina or cortex, the geniculate ishistologically far from the simple structure that theterm 'way-station' would imply (O'Leary, 1940;Glees, 1941). The presence of extensive dendriticarborizations, the profuse ramifications of incom-ing optic-tract fibres, and the existence of short-axon cells, all suggest that there may be somethingmore than a 1:1 transmission of impulses fromoptic nerve to optic radiations.
The retinal region over which a cell in thevisual system can be influenced (excited or inhib-ited) by light is called the receptive field of that cell.Largely through the work of Kuffler (1953), retinalganglion cells in the cat are known to have a welldefined, concentric, receptive field arrangement.Up to now receptive fields of cells in the dorsal lat-eral geniculate have received very little attention,although recent work (Hubel, 1960) has suggestedthat they too, are concentrically arranged. In thepresent work receptive fields in the optic tract andlateral geniculate body are compared. This pro-vides a sensitive means of detecting and studyingany modification of the visual input to the lateralgeniculate.
Details of stimulating and recording procedures havebeen described elsewhere (Hubel, 1960; Hubel & Wiesel,1960). Receptive fields were mapped on sheets of paperattached to a screen which the cat faced from a distanceof 1.5 m. Spots of light of maximum intensity 3.0 Iog1(1
cd/m2 were shone on the screen and a light-adapted statewas maintained by a uniform background luminance ofup to 2.0 log,,, cd/m2. Spot intensities were varied withneutral density filters and an iris diaphragm.
Tungsten micro-electrodes were used (Hubel,1957). Amplifiers were condenser-coupled. HorsleyClarke co-ordinates for the lateral geniculate body weretaken from a stereotaxic Atlas (Jasper & AjmoneMarsan, 1954). Penetrations were made in a dorsoventraldirection, and at one or more points in each penetrationa 50-100 (I diameter electrolytic lesion was made (Hubel,1960). A typical lesion is shown in PI. 1. All brains wereexamined histologically in serial sections, and the location of any unit was determined either from the positionof a lesion made during the recording, or by calculat ingthe distance back from lesion along an electrode track, bymeans of readings of the hydraulic micrometer dr ivecorresponding to the unit and the lesion. Because of thenecessity for allowing for shrinkage in calculating cl istances along tracks, recording sites determined directlyfrom lesions were considered more reliable. For this reason multiple lesions were often made in single penetrations; for example, each time a new layer was entered, asjudged by ocular dominance. The presence of severallesions in a track was also useful for estimating brainshrinkage.
METHODS
About 300 units were recorded in 20 micro-electrodepenetrations through the geniculate. Fifteen cats wereused. The animals were anaesthetized with thiopentalsodium and throughout the experiment light anaesthesiawas maintained and monitored by observing the electro-corticogram. The eyes were immobilized with continu-ously injected succinylcholine; this made it necessary touse artificial respiration (Brown & Wiesel, 1959).
RESULTS
Lateral Geniculate Receptive Fields
ARRANGEMENT OF GENICULATE FIELDS. Receptivefields were mapped for 190 lateral geniculate units.150 recordings were made within the nucleus; theremaining 40 were from geniculate axons encoun-tered as the electrode was lowered through the
/. Physiol. (1961), 155,/>/>. 385-398.
Received! October Wb().

94 PART III NORMAL PHYSIOLOGY AND ANATOMY
Fig. 1. Responses from an 'on'-centre cell recorded in layer A of the left lateral geniculate. Receptive field 25° tothe left of and slightly above the area centralis of the right eye. A, B, and C, centred light spots 1°, 2° and 14° indiameter. D, annular stimulus with inner diameter 2° and outer diameter 14°. Upper line in each record indi-cates when the light is on. Positive deflexions upward. Duration of stimulus in A, 1 sec.
optic radiations just above the geniculate. For com-parison, 75 optic-tract fibres (retinal ganglion cellaxons) were studied, within the geniculate body aswell as in the optic tract proper.
Criteria for distinguishing between record-ings of optic-nerve fibres and geniculate cells havebeen dealt with in detail elsewhere (Hubel, 1960).Geniculate-cell records were recognized by thecell-type spikes and the characteristic 'clustered'pattern of firing. Optic-tract fibres showed axon-type spikes, which were never clustered. In twoexperiments these criteria were controlled by elec-trically stimulating the optic nerve near the chi-asma; optic-nerve fibres could then be distin-guished from geniculate units by their shorterlatency and by their ability to follow stimulation ata more rapid rate (approximately 700/sec.).
In their general arrangement geniculatereceptive fields resembled those of retinal ganglion
cells, having an excitatory ('on') centre andinhibitory ('off') periphery, or the reverse. 'On'and 'off centre units seemed to be about equallycommon. Records from a typical 'on'—centre cellare shown in Text-fig. 1. In this unit there wassummation of the centre-type 'on'-response withina central area about 2° in diameter (Text-fig. 1 A,B); inclusion of the region surrounding this centreled to a reduction in the response (Text-fig. 1C).When the peripheral part of the receptive field wasstimulated by itself the firing of the cell was sup-pressed, and an 'off-response followed the stimu-lus (Text-fig. 1 D).
VARIATIONS IN GENICULATE RECEPTIVE FIELDS;BINOCULAR CONSIDERATIONS. In most penetrationsthe electrode advanced through the dorsal, middle,and ventral layers of the geniculate (layers A, Aj,and B) in sequence. A lesion made at the end of a

Cat Lateral Geniculate 95
penetration is shown in PI. 1. All cells in the dorsaland ventral layers were driven exclusively by thecontralateral eye, those in the middle layer by theipsilateral eye. An electrode advancing through alayer in a direction approximately normal to itencountered cells whose receptive fields had almostidentical positions on the retina. Successivelyrecorded units were seldom separated by more thanone degree of arc, and they generally overlapped orwere superimposed. On passing into the next layerone encountered cells with receptive fields in theexactly homologous position in the other eye (seeHubel & Wiesel, 1960, for projection technique fordetermining homologous retinal points).
'On'-centre and 'off-centre units were foundin all three layers. Cells recorded from the two dor-sal layers (A and Aj) had similar patterns of firing,and showed no systematic differences in size ororganization of their receptive fields. In layer B,however, receptive field centres were, on the aver-age, several times larger than those in layers A andA,. Responses from this layer were more sluggish,with longer latencies and lower frequencies of fir-ing. Anatomical differences between layer B andthe two dorsal layers are discussed by O'Leary(1940) and Hayhow (1958).
Receptive field centres situated in or near thearea centrahs tended to be smaller than those in theretinal periphery. Furthermore, the suppression ofa centre response on including the receptive fieldperiphery (peripheral suppression) was moremarked for cells near the area centralis. The ten-dency for area centralis units to have smaller fieldcentres and to exhibit more suppression by thereceptive field periphery has already been noted forretinal ganglion cells (Wiesel, 1960).
In some cells the antagonism exerted by thereceptive field periphery on the centre was so greatthat a spot completely covering both portions, evenif very bright, evoked no response at all. Using dif-fuse light exclusively, one might have been led toconclude that some geniculate units were unre-sponsive to light. On the contrary, all the geniculatecells in this series responded to a small spot appro-priately placed. So far we have no evidence thatthere are nerve cells unresponsive to visual stimu-lation, either in the optic nerve, the lateral genicu-late body, or in the striate cortex.
Attempts were made for each unit to deter-mine whether firing was influenced from only one
eye or from both eyes. After finding which eye pro-jected to a cell, and outlining its receptive field, weexplored the other eye carefully with small spots,concentrating especially on the region homologousto that containing the already mapped receptivefield. However, no responses could be evoked; nei-ther was there any effect on responses from theother eye. Between layers some cells were drivenipsilaterally and others contralaterally, and on sev-eral occasions two units were recorded simultane-ously, one driven exclusively from one eye, and oneexclusively from the other. Thus binocular interac-tion was not observed in any of the cells studied.
Hayhow (1958), using silver-impregnationmethods on degenerating fibres, has shown thatonly the interlaminar regions of the lateral genicu-late body receive fibre terminations from the twoeyes. These are therefore the regions where onemight expect to find binocularly influenced cells.In the cat single units driven by the two eyes havebeen reported by Erulkar & Fillenz (1958, I960)and by Bishop, Burke & Davis (1959), but the exactposition of these cells within the geniculate was notdetermined histologically. Our results suggest thateven in the interlaminar regions not all cells arebinocularly influenced. We conclude that binocu-lar interaction in the lateral geniculate body as awhole must be relatively unimportant.
COMPARISON OF RETINAL GANGLION CELL ANDGENICULATE CELL RECEPTIVE FIELDS SIMULTANE-OUSLY RECORDED GENICULATE CELLS AND OPTIC-TRACT FIBRES. Optic-tract fibres and geniculatecells were often recorded simultaneously with thesame electrode. Twenty-five pairs of units of thistype were studied; in all these the two receptivefields either overlapped or were closely adjacent,with less than 1° separation. Responses from an 'on'-centre optic-tract fibre and an 'off-centre genicu-late cell are shown in Text-fig. 2. The two receptivefields were almost superimposed and had centres ofabout 1° diameter. A spot covering both centres gavestrong responses from both units (Text-fig. 2A). Anincrease in spot size to 2° made little change in theresponse from the optic-tract fibre, but the 'offresponse from the geniculate cell was much reduced(Text-fig. 2B}. A further increase, to 8°, caused a def-inite reduction in the tract-fibre response; the ' o f f 'discharge from the cell was now almost completelyabolished (Text-fig. 2C). Enlarging the spot beyond

96 PART III NORMAL PHYSIOLOGY AND ANATOMY
Fig. 2. Responses from an 'on'-centre optic-tract fibre (small positive spikes) and an 'off'-centre lateral genicu-late cell (large positive-negative spikes). Cell situated in layer A} of the right lateral geniculate body; receptivefield 24" above and to the right of the area centralis of the right eye. A, B, and C, centred light spots 1°, 2° and 8°in diameter. D, annular stimulus with inner diameter 2° and outer diameter 8°. Duration of first stimulus, 1 sec.
8° had no further effect on either response. Anannulus, as might be expected, evoked peripheralresponses from both units, 'on' for the cell, 'off forthe fibre (Text-fig. 2D).
These two units illustrate a finding commonto all simultaneous recordings of geniculate cellsand optic-tract fibres, that the degree of suppres-sion of centre responses on whole-field illumina-tion appeared to be greater for geniculate cells thanfor optic-tract fibres. This observation was verifiedby comparing thresholds for different areas ofstimulation. The difference in threshold between ageniculate cell and an optic-nerve fibre was verymuch less for small spots than for large ones (seealso Text-fig. 5). Indeed, with the stimulus intensi-ties available some geniculate cells could not beactivated at all with large spots.
OPTIC-TRACT SYNAPTIC POTENTIALS. In a numberof recordings the great majority of geniculatespikes were immediately preceded by potentialswhich, by criteria given above (p. 386), were relatedto impulses in an optic-tract fibre. This suggestedthat the optic-tract fibre was an excitatory input tothe geniculate cell. In Text-fig. 3A, several optic-tract potentials are superimposed in a single frame
by triggering the oscilloscope sweep by the poten-tials themselves. The slow time course of thepotentials is discussed below. Geniculate spikesaccompanied three of these potentials, and appearon the rising phase, on the peak, and on the fallingphase. Thus the time elapsing between the optic-tract potential and the cell spike was, for a givenpair of units, variable from one pair of impulses tothe next. The generation of a spike on the fallingphase was seen many times, often after an evengreater time interval than the longest in this exam-ple (see Freygang, 1958). In an occasional genicu-late spike no optic-tract potential could be dis-cerned; presumably either the time interval ofseparation was too short to allow the two events tobe distinguished, or the geniculate cell could attimes fire in the absence of a preceding impulse inthe tract fibre. In a few units there were several dis-tinct sizes of optic-tract potentials, suggesting forthese units the convergence of a number of excita-tory tract fibres on a single cell.
An interesting though not easily interpretedaspect of these records concerns the sequence ofevents that occurred as the electrode was advanced.The cell spike showed the usual change from aninitially negative to an initially positive shape,

Cat Lateral Geniculate 97
Fig. 3. A, several superimposedsweeps showing optic-tract synapticpotentials, three of which give rise to
geniculate spikes; sweeps are trig-
gered by potentials; time marker,1 msec. B, two optic-tract synaptic
potentials, giving rise to a singlegeniculate cell spifye. Time marker, 5msec. Position deflexions upward.Time constant, 1 sec.
finally becoming predominantly positive and oftenlarge (up to 20-30 mV) (see Hubel, 1960). The optictract fibre impulse was first seen as a very small,brief, positive spike. This increased in amplitude asthe electrode moved forward, at the same timebecoming much longer in duration, so that in itsfinal form it had an abrupt rising phase of less than1 msec and a prolonged falling phase lasting up to8 or 10 msec. The forms of the cell spike and theoptic tract fibre potential are shown in Text-fig. 35.Here a second afferent impulse arising in thefalling phase of the first was successful in trigger-ing the geniculate-cell spike, presumably owing tosummation. Many similar examples of summationwere observed.
Since no resting potentials could be measuredwith the metal electrode used, it was assumed thatthe electrode tips were extracellular. Freygang(1958) and Bishop, Burke & Davis (1958), on stim-ulating the severed optic nerve electrically, haverecorded similar slow potentials extracellularlyfrom lateral geniculate cells. Freygang has inter-preted these potentials as resulting from extracellu-lar current flow related to the post-synaptic poten-tials. It should be emphasized, however, that themain conclusions of this section depend only on theassumption that each of the small potentials wasrelated to an impulse in an optic-nerve fibre,whether recorded pre- or post-synaptically. For thepurposes of this paper we shall refer to these poten-tials as 'optic-tract synaptic potentials'.
Fifteen recordings were made of geniculatecells in which the spikes were immediately pre-ceded by optic-tract synaptic potentials of the typedescribed above. The receptive fields of a geniculate
cell and its associated optic-tract fibre were concen-tric, of about the same size and of the same type,both 'on' centre or both 'off centre. Text-figure 4shows the responses of an 'on' centre pair. A small(1°) low-intensity spot covering the centre of bothreceptive fields evoked a burst of optic-tract synap-tic potentials, and many of these were followed by ageniculate-cell spike. A larger spot evoked nogeniculate impulses, but only synaptic potentials ata lower frequency. If the intensity of the larger spotwas now increased (Text-fig. 45) the rate of thesynaptic potentials could be made at least as great asin Text-fig. 4/4, but even then no geniculate-cellspikes were evoked. Thus the failure of geniculate-cell discharges was certainly not due to decreasedinput from the particular excitatory fibre recordedhere. The recorded optic-tract synaptic potentialvery likely represented an important excitatoryinput; its failure to generate geniculate-cell spikeswhen a large spot was used may have been due to adecrease in other excitatory inputs not seen here, orto a direct inhibition at the geniculate level.
Response characteristics of a geniculate celland its associated optic-tract synaptic potentialwere further compared by plotting, for each unit,the threshold intensity of a centred stimulatingspot against spot diameter (see Barlow, FitzHugh& Kuffler, 1957). Such a pair of curves is shown inText-fig. 5. Thresholds decreased with increasingspot size, up to a diameter of about 1°, indicatingsummation of centre-type responses for both unitsover this area. With stimuli at or near thresholdand confined to this central region, almost everyoptic-tract synaptic potential was followed by ageniculate spike, and thresholds for the two units

98 PART III NORMAL PHYSIOLOGY AND ANATOMY
Fig. 4. Responsesofa geniculate cell and associated optic-tract synaptic potentials to centred spots of light. A, 1°spot. B, 10° spot with brightness increased so as to mafefrequency of optic-tract synaptic potentials about equalto that in A. Time constant, 5 msec. Time marker, 10 msec.
were consequently identical. Spots larger than thereceptive-field centres invaded the antagonisticperipheral portions, and the thresholds rose. Therise was much more pronounced for the geniculatecell than for the fibre, indicating once more, as inText-fig. 4, that peripheral antagonism is morepronounced at the geniculate level than in theretina. These findings of an increased peripheralsuppression at the geniculate level make it difficultto avoid the conclusion that there are multipleinputs to a geniculate cell.
Clustered Firing PatternsUnder certain conditions lateral geniculate cellsfire in high-frequency clusters of 2-8 or morespikes. In a previous study (Hubel, 1960) clusteredfiring was observed in the unrestrained animalduring natural sleep but not in the waking state.During sleep the clusters were accentuated bystimuli that tended to suppress firing and wereabolished by stimuli that activated the unit. Itseemed clear that clustered firing was not related toinjury of the cell, since it could be eliminated by
arousing the animal, and since it was seen at everystage as the electrode was advanced during arecording. Moreover, it was observed both ingeniculate cells and in optic-radiation fibres.
In the present work clustered firing wasobserved with thiopental anaesthesia in the greatmajority of geniculate cells and was most pro-nounced in moderate or deep anaesthesia, asjudged by the electrocorticogram. This type of fir-ing was found in all three layers of the geniculate.When clusters were rare or absent they could gen-erally be brought on by a small additional intra-venous injection of thiopental (3-5 mg/kg). Theirappearance was probably not due to a direct actionof anaesthetic on the geniculate-cell membrane,since clusters also occur in natural sleep.
It is unlikely that the individual spikes of acluster could each be triggered by impulses in a sin-gle optic-tract fibre, since clustered firing does notnormally occur in retinal ganglion cells. Records ofgeniculate-cell spikes preceded by optic-tractsynaptic potentials tended to support this. In Text-fig. 6 three clusters and a single spike are shown
Fig. 5. Thresholds of an 'off'-centregeniculate cell O and an associatedoptic-tract synaptic potential (x),measured for various spot diameters.Ordinate, threshold luminance; rela-tive log. scale, 0 corresponding toscreen luminance of—2.7 log. cd/m2.Abscissa, spot diameter in degrees.Background luminance —2.5 log.cd/m2; stimulus duration 1 sec.

Cat Lateral Geniculate 99
Fig. 6. Records of four randomly occurring discharges of a geniculate cell. Optic-tract synoptic potentials are seenpreceding three of the discharges. Note clustered firing in three of the examples. Time constant, 5 msec. Timemarker, 10msec.
from a geniculate cell. An optic-tract synapticpotential preceded three of the four discharges, butnone was seen before spikes other than the first ina cluster. Similar observations made in other unitsled to the impression that an entire cluster could beinitiated by a single optic-tract synaptic potential.The presence of occasional clusters with no preced-ing optic-tract synaptic potentials suggested, as inthe case of single spikes, that other inputs mightcontribute to this type of firing. However, as withsingle spikes, it is possible that a synaptic potentialmight be undetected owing to a short time intervalbetween it and the first geniculate spike.
DISCUSSION
In combination with previous work in the retinaand striate cortex, the present study makes it possi-ble to compare receptive fields at three successivelevels in the cat's visual system. Certain similaritiesare at once evident. At each stage receptive fieldscan be divided into excitatory and inhibitory ('on'and 'off') regions. Summation of responses occursover regions of the same type, and antagonismbetween areas of opposite type. Diffuse light alwaysleads to a response weaker than that obtainablefrom a suitably chosen restricted stimulus. Thesesimilarities hold for simple cortical receptive fields(Hubel & Wiesel, 1959), but not necessarily for morecomplex ones (Hubel & Wiesel, unpublished).
In the spatial arrangement of its receptive
fields the lateral geniculate body clearly has morein common with retinal ganglion cells than withthe striate cortex. In both retina and geniculatebody the receptive fields are concentric, with an'on' centre surrounded by an 'off periphery, or thereverse. In the cortex, on the other hand, there is amuch greater variety of receptive fields, and notypes so far studied have the concentric, circularlysymmetrical pattern found at lower levels. Thismarked increase in receptive field complexity isundoubtedly related to the greater variety of celltypes and interconnexions in the cortex. Further-more, binocular interaction would seem to be min-imal at the lateral geniculate level, whereas themajority of striate cortical cells we have studiedwere influenced by both eyes (Hubel & Wiesel,unpublished).
The differences between retinal and genicu-late receptive fields are more subtle. They may beseen when centre-periphery interaction is com-pared in simultaneous recordings of a geniculatecell and an optic tract fibre with closely adjacentreceptive fields. One then finds that geniculate cellsare less responsive to diffuse light than retinal gan-glion cells. This can be interpreted as an increasedantagonistic action of the receptive field peripheryon the centre. Previous studies indicate that in thestriate cortex the process is carried still further, andthat with diffuse-light stimuli cortical cells are evenless responsive than cells of the geniculate body. Forexample, in the striate cortical projection area for
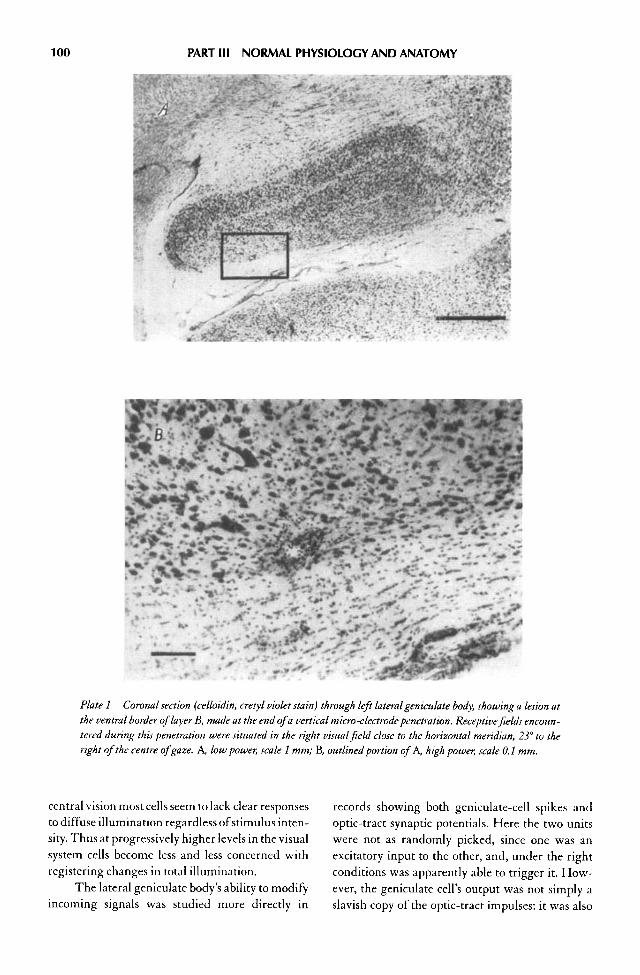
100 PART III NORMAL PHYSIOLOGY AND ANATOMY
Plate 1 Coronal section (celloidin, cresyl violet stain) through left lateral geniculate body, showing a lesion atthe ventral border of layer B, made at the end of a vertical micro-electrode penetration. Receptive fields encoun-tered during this penetration were situated in the right visual field close to the horizontal meridian, 23° to theright of the centre of gaze. A, low power, scale 1 mm; B, outlined portion of A, high power, scale 0.1 mm.
central vision most cells seem to lack clear responsesto diffuse illumination regardless of stimulus inten-sity. Thus at progressively higher levels in the visualsystem cells become less and less concerned withregistering changes in total illumination.
The lateral geniculate body's ability to modifyincoming signals was studied more directly in
records showing both geniculate-cell spikes andoptic-tract synaptic potentials. Here the two unitswere not as randomly picked, since one was anexcitatory input to the other, and, under the rightconditions was apparently able to trigger it. How-ever, the geniculate cell's output was not simply aslavish copy of the optic-tract impulses: it was also

Cat Lateral Geniculate 101
influenced by other inputs which for some reasonwere not recorded. The changes introduced by thelateral geniculate were systematic, leading to a rel-ative ineffectiveness of the optic-tract fibres whenthe receptive field periphery was included in thestimulus. A simple interpretation of this is to as-sume that the inclusion of the receptive fieldperiphery evoked responses from optic-tract fibreswith direct inhibitory endings on the geniculatecell. These would be 'on'-centre units if the genic-ulate cell was 'on'-centre in type, and 'off-centre ifthe geniculate cell was 'off-centre. One couldequally well imagine that inclusion of the fieldperiphery affected ganglion cells making excita-tory synaptic contact with the geniculate cell.These would be 'off-centre units if the geniculatecell was 'on'-centre, and conversely. Both mecha-nisms are plausible, since within the retinal areaoccupied by a geniculate cell's receptive field thereare hundreds of ganglion cells with overlappingreceptive fields of both types, 'on'-centre and 'off-centre. Any of these ganglion cells could end on thegeniculate cell, exciting or inhibiting it directly, orpossibly indirectly by short-axon cells. Intracellularrecording with micropipette electrodes may help todecide between the several alternatives.
The mechanisms demonstrated, leading to anincreased selectivity in the responsiveness of ageniculate cell, almost certainly do not representthe only type of integration occurring in this struc-ture. For example, some records showed severaldistinct sizes of optic-tract synaptic potentials, indi-cating probable convergence of several excitatoryfibres on a single geniculate cell. This is consistentwith Freygang's (1958) finding of a non-continuousgradation of synaptic potentials evoked in responseto electrical stimulation of the optic nerve, fromwhich he concluded that there were several fibressupplying the cells he studied. As a second exam-ple, the firing of geniculate cells can be influencedsimply by changing the unanaesthetized animal'sstate of arousal (Hubel, 1960), which suggests thatthere are probably other fibres ending on genicu-late cells besides those of the optic tract.
SUMMARY
1. Cells were recorded with tungsten electrodes inthe dorsal lateral geniculate body of the cat.Receptive fields of these units were mapped out,in the light-adapted state, with small spots of
light. In their general arrangement geniculatereceptive fields resembled those of retinal gan-glion cells, having an excitatory ('on') centre andinhibitory ('off) periphery, or the reverse. Thetwo portions of a receptive field were mutuallyantagonistic; the decrease in centre responsescaused by inclusion of peripheral portions ofreceptive fields was termed peripheral suppres-sion.
2. Cells recorded in layers A and B of the lateralgeniculate body were driven from the contralat-eral eye; cells in layer Aj from the ipsilateral eye.In penetrations normal to the layers receptivefields of cells in a single layer were close togetheror superimposed, and from one layer to the nextoccupied exactly homologous positions in thetwo retinas. Binocular interaction was notobserved in any of the cells studied.
3. All three layers of the lateral geniculate con-tained both 'on'-centre and 'off-centre units.Cells in layers A and Aj were similar both intheir firing patterns and in average receptivefield size. Cells in layer B were more sluggish intheir responses to light stimuli, and tended tohave larger receptive field centres.
4. Cells with receptive fields within or near thearea centralis tended to have smaller field cen-tres and stronger suppression by the receptivefield periphery than cells with their fields situ-ated in more peripheral regions of the retina.
5. In some recordings almost all geniculate cellspikes were immediately preceded by potentialsrelated to impulses in a single optic-tract fibre,suggesting that the optic-tract fibre was an exci-tatory input to the geniculate cell. The longduration of these potentials, the presence ofsummation, and their apparent ability to triggerthe geniculate cell, suggested that they were ofsynaptic origin. They were termed 'optic-tractsynaptic potentials'.
6. In simultaneous records of geniculate cells andoptic-tract fibres, and in particular in recordsshowing optic-tract synaptic potentials, anincrease in peripheral suppression at the genic-ulate level could be demonstrated (a) by com-paring responses of the two units to small andlarge spots, and (b) by measuring thresholdintensities of the two units at different spotdiameters. These comparisons made it clearthat the geniculate cell and the optic-tract fibrewere not related in a strictly one-to-one manner,and that integration leading to increased per-

102 PART 111 NORMAL PHYSIOLOGY AND ANATOMY
ipheral suppression occurred at the geniculatelevel.
7. Clustered firing in the form of brief bursts ofspikes at high frequency, previously describedin natural sleep, was observed under thiopentalanaesthesia. From simultaneous records it ap-peared that a single impulse in an optic-tractfibre could give rise to a cluster of impulses in ageniculate cell.
We wish to thank Miss Sally Fox for participating in some of theexperiments, and Mrs Jane Chen and Miss Jaye Robinson fortheir technical assistance. The work was supported in part byResearch Grants B-2251 and B-2260 from United States PublicHealth Service, and in part by the United States Air Forcethrough the Air Force Office of Scientific Research of the AirResearch and Development Command under contract No. AF49 (638)-713. The work was done during the tenure of a U.S.Public Health Service Senior Research Fellowship No. SF 304-R by D.H.H.
References
Barlow, H. B., Fitzhugh, R. & Kuffler, S. W. (1957). Change oforganization in the receptive fields of the cat's retina duringdark adaptation./. Physiol. 137, 338-354.
Bishop, P. O, Burke, W. & Davis, R. (1958). Synapse dischargeby single fibre in mammalian visual system. Nature, Land.,182,728-730.
Bishop, P. O., Burke, W. & Davis, R. (1959). Activation of single
lateral geniculate cells by stimulation of either optic nerve.Science, 130,506-507.
Brown, K. T. & Wiesel, T. N. (1959). Intraretinal recording withmicropipette electrodes in the intact cat eye./. Physiol. 149,537-562.
Erulkar, S. D. & Fillenz, M. (1958). Patterns of discharge of sin-gle units of the lateral geniculate body of the cat in responseto binocular stimulation./. Physiol. 140, 6 P.
Erulkar, S. D. & Fillenz, M. (1960). Single unit activity in the lat-eral geniculate body of the cat./. Physiol. 154,206-218.
Freygang, W. H. Jr. (1958). An analysis of extracellular poten-tials from single neurons in the lateral geniculate nucleus ofthe cat./, gen. Physiol. 41, 543-564.
Glees, P. (1941). The termination of optic fibres in the lateralgeniculate body of the cat./. Anat., Land., 75,434-440.
Hayhow, W. R. (1958). The cytoarchitecture of the lateral genic-ulate body in the cat in relation to the distribution of crossedand uncrossed optic fibers./, comp. Neurol. 110,1—64.
Hubel, D. H. (1957). Tungsten microelectrode for recordingfrom single units. Science, 125, 549-550.
Hubel, D. H. (1960). Single unit activity in lateral geniculatebody and optic tract of unrestrained cats. /. Physiol. 150,91-104.
Hubel, D. H. & Wiesel, T. N. (1959). Receptive fields of singleneurones in the cat's striate cortex./. Physiol. 148, 574—591.
Hubel, D. H. & Wiesel, T. N. (1960). Receptive fields of opticnerve fibres in the spider monkey./. Physiol. 154, 572-580.
Jasper, H. H. & Ajmone-Marsan, C. (1954). A Stereotaxic Atlas ofthe Diencephalon of the Cat. Ottawa: The National ResearchCouncil of Canada.
Kuffler, S. W. (1953). Discharge patterns and functional orga-nization of mammalian retina./. Neurophysiol. 16, 37—68.
O'Leary, J. L. (1940). A structural analysis of the lateral genicu-late nucleus of the cat./, comp. Neurol. 73,405-430.
Wiesel, T. N. (1960). Receptive fields of ganglion cells in the cat'sretina./. Physiol. 153,583-594.
AFTERWORD
This study gave us a rare opportunity to come to grips with the integrativefunctions of a structure by comparing directly the firing of a cell with the fir-ing of its excitatory inputs. Because the surround of a stimulus had a muchstronger suppressive effect on the center response for a geniculate cell, com-pared to the effect on an afferent optic tract fiber, it was clear that one majorfunction of the geniculate was to beef up the effects of the receptive-field sur-round. The work was followed in 1971 by a study by Cleland, Dubin, andLevick (Nature New Biology, 231:191-192), who performed the tour de forceof recording simultaneously from a single ganglion cell in the retina, and oneof the geniculate cells it supplied. We would have thought that such anexperiment would be well-nigh impossible and are still filled with admira-tion that anyone would have attempted it. The result confirmed our workand in addition supplied direct proof that geniculate cells can receive morethan one direct excitatory afferent (and vindicating our interpretation of thetiny deflections).

Cat Lateral Geniculate 103
We made one observation, or set of observations, that we never wroteup, and to our knowledge has not since been taken up. We noticed that dur-ing the course of a typical response, to a light turned on, say for one secondand then off, the ratio of the firing frequency of the prepotentials (today'ss-potentials) to the frequency of the geniculate spikes is continually changing.In an on-center cell, the proportion of s-potentials that trigger a geniculatespike (we coincidentally called this success rate "s") is highest just after thestimulus turns on, and lowest just after "off. It changes more or less in par-allel with the firing rate, but not simply because of the changes in firing rate.So "s" is a function not only of the amount of the surround included in thestimulus, but also of time. We prepared figures and planned to write up theresults, but other priorities must have been higher. The figures still languishin our file cabinet.

Chapter 10 • Our Major Paper onCat Striate Cortex, 1962 •
FOREWORD
This was our first magnum opus, and of all our papers it is probably the onewe would pick if we had to choose one paper to be remembered for. It took along time to write, but we did not feel pressured to write quickly. We had theadvantage of a vow we had taken early in our collaboration, that we mustnever (well, hardly ever) accept an invitation to a symposium in which a man-uscript was required. Even when we were assured by those inviting us that abook was expected to come out of the meeting, but that we would be excusedfrom contributing to it, we would decline rather than risk being seen later aspoor sports and ending up feeling guilty. To write a paper at all was difficultfor us, and we could see no point in writing up the same material more thanonce. Especially to be avoided, we thought, was the publishing of results inpreliminary form at a symposium before they had been submitted in finalform to a regular journal. That made the final, definitive paper an anticlimax.The policy of course reduced our total number of publications, and usuallywe felt happy if we produced a single paper each year. On the whole we sus-pect our careers did not suffer because of the slim list of publications. Perhapsthat is a credit to our deans—given the tendency for deans to count papersrather than read them—and to Steve for his unwavering support.
We also tended to resist the temptation to publish every new finding inpreliminary short papers in Science or Nature. Especially in the first yearswith fewer competitors there was little danger of being scooped. And weagain avoided the anticlimax effect. Sometimes we yielded, but in retrospectwe feel we gained little from the brief papers we did write. Several times theresult was a lessening the pressure to write a full account of the research. Themost important example was our failure to ever publish properly the pres-triate stereoscopic depth material, which was only presented as a brief reportto Science (see reprint no. 16). Consequently, we usually tried to discourageour postdocs from writing brief, preliminary, flashy papers—unless theresults were earth-shaking, a la Watson and Crick.
The 1962 paper was a continuation of the 1959 paper, which purposelystopped short of the complex cells because in 1959 we did not yet feel we
104

Cat Striate Cortex 105
understood them. By writing a shorter paper confined to what we later called"simple cells", we took off some of the pressure at a time when we did noteven know that we could continue to collaborate. It also allowed us toemphasize, in that first paper, the most important single point—that a majorfunction of the striate cortex was to elaborate orientation selectivity.
In the 1962 paper we deliberately chose to make a single long paper outof what could easily have been three. We felt it was esthetically more pleas-ing not to subdivide it, and were saved the trouble of writing three intro-ductions and three discussions. To have three separate papers in one yearwould have done more for us in terms of promotions, but we took a perversepleasure in bucking the trend. Today it is unlikely that one would get awaywith such a strategy (if that is the right word), from the viewpoint either ofpromotions or of competition for grant money.
What made the 1962 paper such a pleasure to write was the articulationof the different parts: first the description of the different levels of complex-ity of the fields, then the columnar organization and topographic represen-tation, including the scattering, and finally the climax in which one couldconclude that the columns were serving the purpose of grouping together thevery cells that one expected to be interconnected in the circuits we wereproposing.
At that time we were hesitant about ocular dominance columns—infact, it was only when we recorded from cats with artificial strabismus, a fewyears later, that we became convinced of their existence in cats. Also, as welater learned, they are far more conspicuous in macaque monkeys because ofthe prevalence of cells that strongly prefer one eye or the other, and theabruptness of the shifts as one crosses column boundaries, especially in layer4. In 1962 we had just begun to record from macaque monkeys, and our firstmonkey-cortex paper appeared only in 1968.
Receptive Fields, Binocular Interaction and FunctionalArchitecture in the Cat's Visual Cortex
D. H. HUBEL AND T. N. WIESEL • Neurophysiology Laboratory, Department of Pharmacology Harvard Medical
School, Boston, Massachusetts
What chiefly distinguishes cerebral cortex from ions. It would be astonishing if such a structure didother parts of the central nervous system is the not profoundly modify the response patterns ofgreat diversity of its cell types and inter-connex- fibres coming into it. In the cat's visual cortex, the
/. Physiol. (1962), 160,pp. 106-154 With 2 plates and 20 text-figures Printed in Great Britain
Received 1\]uly 1961.

106 PART III NORMAL PHYSIOLOGY AND ANATOMY
receptive field arrangements of single cells suggestthat there is indeed a degree of complexity farexceeding anything yet seen at lower levels in thevisual system.
In a previous paper we described receptivefields of single cortical cells, observing responses tospots of light shone on one or both retinas (Hubel &Wiesel, 1959). In the present work this method isused to examine receptive fields of a more complextype (Part I) and to make additional observationson binocular interaction (Part II).
This approach is necessary in order to under-stand the behaviour of individual cells, but it failsto deal with the problem of the relationship of onecell to its neighbours. In the past, the technique ofrecording evoked slow waves has been used withgreat success in studies of functional anatomy. Itwas employed by Talbot & Marshall (1941) and byThompson, Woolsey & Talbot (1950) for mappingout the visual cortex in the rabbit, cat, and monkey.Daniel & Whitteridge (1959) have recently ex-tended this work in the primate. Most of our pres-ent knowledge of retinotopic projections, binocu-lar overlap, and the second visual area is based onthese investigations. Yet the method of evokedpotentials is valuable mainly for detecting behav-iour common to large populations of neighbouringcells; it cannot differentiate functionally betweenareas of cortex smaller than about 1 mm2. To over-come this difficulty a method has in recent yearsbeen developed for studying cells separately or insmall groups during long micro-electrode penetra-tions through nervous tissue. Responses are corre-lated with cell location by reconstructing the elec-trode tracks from histological material. Thesetechniques have been applied to the somatic sen-sory cortex of the cat and monkey in a remarkableseries of studies by Mountcastle (1957) and Powell& Mountcastle (1959). Their results show that theapproach is a powerful one, capable of revealingsystems of organization not hinted at by the knownmorphology. In Part III of the present paper we usethis method in studying the functional architectureof the visual cortex. It helped us attempt to explainon anatomical grounds how cortical receptivefields are built up.
METHODS
Recordings were made from forty acutely prepared cats,anaesthetized with thiopental sodium, and maintained
in light sleep with additional doses by observing the elec-trocorticogram. Animals were paralysed with succinyl-choline to stabilize the eyes. Pupils were dilated withatropine. Details of stimulating and recording methodsare given in previous papers (Hubel, 1959; Hubel &Wiesel, 1959, 1960). The animal faced a wide tangentscreen at a distance of 1.5 m, and various patterns ofwhite light were shone on the screen by a tungsten-filament projector. All recordings were made in thelight-adapted state. Background illumination variedfrom —1.0 to +1.0 Iog10 cd/m2. Stimuli were from 0.2 to2.0 log. units brighter than the background. For each cellreceptive fields were mapped out separately for the twoeyes on sheets of paper, and these were kept as perma-nent records.
Points on the screen corresponding to the area cen-tralis and the optic disk of the two eyes were determinedby a projection method (Hubel & Wiesel, 1960). Theposition of each receptive field was measured withrespect to these points. Because of the muscle relaxantthe eyes usually diverged slightly, so that points corre-sponding to the two centres of gaze were not necessarilysuperimposed. In stimulating the two eyes simultane-ously it was therefore often necessary to use two spotsplaced in corresponding parts of the two visual fields.Moreover, at times the two eyes were slightly rotated inan inward direction in the plane of their equators. Thisrotation was estimated by (1) photographing the catbefore and during the experiment, and comparing theangles of inclination of the slit-shaped pupils, or (2) bynoting the inclination to the horizontal of a line joiningthe area centralis with the optic disk, which in the nor-mal position of the eye was estimated, by the firstmethod, to average about 25°. The combined inwardrotations of the two eyes seldom exceeded 10°. Since thereceptive fields in this study were usually centrally ratherthan peripherally placed on the retina, the rotations didnot lead to any appreciable linear displacement. Angulardisplacements of receptive fields occasionally requiredcorrection, as they led to an apparent difference in theorientation of the two receptive-field axes of a binocu-larly driven unit. The direction and magnitude of thisdifference were always consistent with the estimatedinward rotation of the two eyes. Moreover, in a givenexperiment the difference was constant, even though theaxis orientation varied from cell to cell.
The diagram of Text-fig. 1 shows the points of entryinto the cortex of all 45 microelectrode penetrations.Most electrode tracks went no deeper than 3 or 4 mm, sothat explorations were mainly limited to the apical seg-ments of the lateral and post-lateral gyri (LG and PLG)and a few millimetres down along the adjoining medialand lateral folds. The extent of the territory covered isindicated roughly by Text-figs. 13-15. Although the lat-eral boundary of the striate cortex is not always sharply

Cat Striate Cortex 107
Fig. 1. Diagram of dorsal aspect of cat's brain, to show entrypoints of45 micro-electrode penetrations. The penetrationsbetween the interrupted lines are those in which cells hadtheir receptive fields in or near area centralis. LG, lateralgyms; PLG, post-lateral gyms. Scale, 1 cm.
defined in Nissl-stained or myelin-stained material,most penetrations were well within the region generallyaccepted as 'striate'(O'Leary, 1941). Most penetrationswere made from the cortical region receiving projectionsfrom in or near the area centralis; this cortical region isshown in Text-fig. 1 as the area between the interruptedlines.
Tungsten micro-electrodes were advanced by ahydraulic micro-electrode positioner (Hubel, 1957,1959). In searching for single cortical units the retina wascontinually stimulated with stationary and movingforms while the electrode was advanced. The unresolvedbackground activity (see p. 129) served as a guide fordetermining the optimum stimulus. This procedureincreased the number of cells observed in a penetration,since the sampling was not limited to spontaneouslyactive units.
In each penetration electrolytic lesions were made atone or more points. When only one lesion was made, itwas generally at the end of an electrode track. Brainswere fixed in 10% formalin, embedded in celloidin, sec-tioned at 20 (I, and stained with cresyl violet. Lesionswere 50-100 [4, in diameter, which was small enough toindicate the position of the electrode tip to the nearestcortical layer. The positions of other units encountered ina cortical penetration were determined by calculatingthe distance back from the lesion along the track, using
depth readings corresponding to the unit and the lesion.A correction was made for brain shrinkage, which wasestimated by comparing the distance between twolesions, measured under the microscope, with the dis-tance calculated from depths at which the two lesionswere made. From brain to brain this shrinkage was notconstant, so that it was not possible to apply an averagecorrection for shrinkage to all brains. For tracks markedby only one lesion it was assumed that the first unit activ-ity was recorded at the boundary of the first and secondlayers; any error resulting from this was probably small,since in a number of penetrations a lesion was made atthe point where the first units were encountered, andthese were in the lower first or the upper second layers,or else at the very boundary. The absence of cell-bodyrecords and unresolved background activity as the elec-trode passed through subcortical white matter (see Text-fig. 13 and PL 1) was also helpful in confirming the accu-racy of the track reconstructions.
Parti
Organization of Receptive Fields in Cat's
Visual Cortex: Properties of 'Simple'
and 'Complex' Fields
The receptive field of a cell in the visual system
may be defined as the region of retina (or visual
field) over which one can influence the firing of
that cell. In the cat's retina one can distinguish two
types of ganglion cells, those with 'on'-centre
receptive fields and those with 'off-centre fields
(Kuffler, 1953). The lateral geniculate body also has
cells of these two types; so far no others have been
found (Hubel & Wiesel, 1961). In contrast, the
visual cortex contains a large number of function-
ally different cell types; yet with the exception of
afferent fibres from the lateral geniculate body we
have found no units with concentric 'on'-centre or
'off-centre fields.
When stimulated with stationary or moving
patterns of light, cells in the visual cortex gave
responses that could be interpreted in terms of the
arrangements of excitatory and inhibitory regions
in their receptive fields (Hubel & Wiesel, 1959).
Not all cells behaved so simply, however; some
responded in a complex manner which bore little
obvious relationship to the receptive fields mapped
with small spots. It has become increasingly appar-
ent to us that cortical cells differ in the complexity
of their receptive fields. The great majority of
fields seem to fall naturally into two groups, which
we have termed 'simple' and 'complex'. Although

108 PART III NORMAL PHYSIOLOGY AND ANATOMY
the fields to be described represent the commonestsubtypes of these groups, new varieties are contin-ually appearing, and it is unlikely that the ones wehave listed give anything like a complete picture ofthe striate cortex. We have therefore avoided arigid system of classification, and have designatedreceptive fields by letters or numbers only for con-venience in referring to the figures. We shall con-centrate especially on features common to simplefields and on those common to complex fields,emphasizing differences between the two groups,and also between cortical fields and lateral genicu-late fields.
RESULTS
Simple Receptive FieldsThe receptive fields of 233 of the 303 cortical cellsin the present series were classified as 'simple'. Likeretinal ganglion and geniculate cells, cortical cellswith simple fields possessed distinct excitatory andinhibitory subdivisions. Illumination of part or allof an excitatory region increased the maintainedfiring of the cell, whereas a light shone in theinhibitory region suppressed the firing and evokeda discharge at 'off. A large spot confined to eitherarea produced a greater change in rate of firingthan a small spot, indicating summation withineither region. On the other hand, the two types ofregion within a receptive field were mutually an-tagonistic. This was most forcefully shown by theabsence or near absence of a response to simultane-ous illumination of both regions, for example, withdiffuse light. From the arrangement of excitatoryand inhibitory regions it was usually possible topredict in a qualitative way the responses to anyshape of stimulus, stationary or moving. Spots hav-ing the approximate shape of one or other regionwere the most effective stationary stimuli; smallerspots failed to take full advantage of summationwithin a region, while larger ones were likely toinvade opposing regions, so reducing the response.To summarize: these fields were termed 'simple'because like retinal and geniculate fields (1) theywere subdivided into distinct excitatory andinhibitory regions; (2) there was summation withinthe separate excitatory and inhibitory parts; (3)there was antagonism between excitatory andinhibitory regions; and (4) it was possible to predictresponses to stationary or moving spots of various
shapes from a map of the excitatory and inhibitoryareas.
While simple cortical receptive fields weresimilar to those of retinal ganglion cells and genic-ulate cells in possessing excitatory and inhibitorysubdivisions, they differed profoundly in the spa-tial arrangements of these regions. The receptivefields of all retinal ganglion and geniculate cellshad one or other of the concentric forms shown inText-fig. 2A, B. (Excitatory areas are indicated bycrosses, inhibitory areas by triangles.) In contrast,simple cortical fields all had a side-to-side arrange-ment of excitatory and inhibitory areas with sepa-ration of the areas by parallel straight-line bound-aries rather than circular ones. There were severalvarieties of fields, differing in the number of subdi-visions and the relative area occupied by each sub-division. The commonest arrangements are illus-trated in Text-fig. 2C—G: Table 1 gives the numberof cells observed in each category. The departure ofthese fields from circular symmetry introduces anew variable, namely, the orientation of the bound-aries separating the field subdivisions. This orien-tation is a characteristic of each cortical cell, andmay be vertical, horizontal, or oblique. There wasno indication that any one orientation was morecommon than the others. We shall use the termreceptive-field axis to indicate a line through thecentre of a field, parallel to the boundaries separat-ing excitatory and inhibitory regions. The axis ori-entation will then refer to the orientation of theseboundaries, either on the retina or in the visualfield. Axes are shown in Text-fig. 2 by continuouslines.
Two common types of fields, shown in Text-fig. 2C, D, each consisted of a narrow elongatedarea, excitatory or inhibitory, flanked on either sideby two regions of the opposite type. In these fieldsthe two flanking regions were symmetrical, i.e.they were about equal in area and the responsesobtained from them were of about the same mag-nitude. In addition there were fields with long nar-row centres (excitatory or inhibitory) and asym-metrical flanks. An example of an asymmetricalfield with an inhibitory centre is shown in Text-fig.2E. The most effective stationary stimulus for all ofthese cells was a long narrow rectangle ('slit') oflight just large enough to cover the central regionwithout invading either flank. For maximum cen-tre response the orientation of the slit was critical;

Cat Striate Cortex 109
Fig. 2. Common arrangements of lateralgeniculate and cortical receptivefields. A. 'On'-centregemculate recep-tive field. B. 'Off'-centre geniculate receptive field. C—G. Various arrangements of simple cortical receptivefields. X, areas giving excitatory responses ('on' responses); A, areas giving inhibitory responses ('off responses).Receptive-field axes are shown by continuous lines through field centres; in the figure these are all oblique, buteach arrangement occurs in all orientations.
changing the orientation by more than 5-10° wasusually enough to reduce a response greatly or evenabolish it. Illuminating both flanks usually evokeda strong response. If a slit having the same size asthe receptive-field centre was shone in either flank-ing area it evoked only a weak response, since it
Table 1. Simple Cortical Fields
Text-fig.No. ofcells
(a) Narrow concentrated centres(i) Symmetrical flanks
Excitatory centres 2C 23Inhibitory centres 2D 17
(ii) Asymmetrical flanksExcitatory centres — 28Inhibitory centres 2E 10
(b) Large centres; concentrated 2F 21flanks
(c) One excitatory region and 2G 17one inhibitory
(d) Uncategorized — 117
Total number of simple fields 233
covered only part of one flank. Diffuse light wasineffective, or at most evoked only a very weakresponse, indicating that the excitatory and in-hibitory parts of the receptive field were verynearly balanced.
In these fields the equivalent but opposite-type regions occupied retinal areas that were farfrom equal; the centre portion was small and con-centrated whereas the flanks were widely dis-persed. A similar inequality was found in fields oftype F, Text-fig. 2, but here the excitatory flankswere elongated and concentrated, while the centrewas relatively large and diffuse. The optimumresponse was evoked by simultaneously illuminat-ing the two flanks with two parallel slits (see Hubel&Wiesel, 1959, Fig. 9).
Some cells had fields in which only tworegions were discernible, arranged side by side asin Text-fig. 2G. For these cells the most efficientstationary stimulus consisted of two areas of differ-ing brightness placed so that the line separatingthem fell exactly over the boundary between theexcitatory and inhibitory parts of the field. Thistype of stimulus was termed an 'edge'. An 'on' or
110 PART III NORMAL PHYSIOLOGY AND ANATOMY
an 'off response was evoked depending onwhether the bright part of the stimulus fell over theexcitatory or the inhibitory region. A slight changein position or orientation of the line separating thelight from the dark area was usually enough toreduce greatly the effectiveness of the stimulus.
Moving stimuli were very effective, probablybecause of the synergistic effects of leaving aninhibitory area and simultaneously entering anexcitatory area (Hubel & Wiesel, 1959). The opti-mum stimulus could usually be predicted from thedistribution of excitatory and inhibitory regions ofthe receptive field. With moving stimuli, just aswith stationary, the orientation was critical. In con-trast, a slit or edge moved across the circularly sym-metric field of a geniculate cell gave (as one wouldexpect) roughly the same response regardless of thestimulus orientation. The responses evoked whenan optimally oriented slit crossed back and forthover a cortical receptive field were often roughlyequal for the two directions of crossing. This wastrue of fields like those shown in Text-fig. 1C, Dand E For many cells, however, the responses totwo diametrically opposite movements were dif-ferent, and some only responded to one of the twomovements. The inequalities could usually beaccounted for by an asymmetry in flanking re-gions, of the type shown in Text-fig. 2E (see alsoHubel & Wiesel, 1959, Fig. 7). In fields that hadonly two discernible regions arranged side by side(Text-fig. 2G), the difference in the responses to amoving slit or edge was especially pronounced.
Optimum rates of movement varied from onecell to another. On several occasions two cells wererecorded together, one of which responded only toa slow-moving stimulus (l°/sec or lower) the otherto a rapid one (10°/sec or more). For cells with fieldsof type F, Text-fig. 2, the time elapsing between thetwo discharges to a moving stimulus was a measureof the rate of movement (see Hubel & Wiesel, 1959,Fig. 5).
If responses to movement were predictablefrom arrangements of excitatory and inhibitoryregions, the reverse was to some extent also true.The axis orientation of a field, for example, wasgiven by the most effective orientation of a movingslit or edge. If an optimally oriented slit produced abrief discharge on crossing from one region toanother, one could predict that the first region wasinhibitory and the second excitatory. Brief re-
sponses to crossing a very confined region werecharacteristic of cells with simple cortical fields,whereas the complex cells to be described belowgave sustained responses to movement over muchwider areas.
Movement was used extensively as a stimulusin experiments in which the main object was todetermine axis orientation and ocular dominancefor a large number of cells in a single penetration,and when it was not practical, because of time lim-itations, to map out every field completely. Becausemovement was generally a very powerful stimulus,it was also used in studying cells that gave little orno response to stationary patterns. In all, 117 of the233 simple cells were studied mainly by movingstimuli. In Table 1 these have been kept separatefrom the other groups since the distribution oftheir excitatory and inhibitory regions is notknown with the same degree of certainty. It is alsopossible that with further study, some of thesefields would have revealed complex properties.
Complex Receptive FieldsIntermixed with cells having simple fields, andpresent in most penetrations of the striate cortex,were cells with far more intricate and elaborateproperties. The receptive fields of these cells weretermed 'complex'. Unlike cells with simple fields,these responded to variously-shaped stationary ormoving forms in a way that could not be predictedfrom maps made with small circular spots. Oftensuch maps could not be made, since small roundspots were either ineffective or evoked only mixed('on-off') responses throughout the receptive field.When separate 'on' and 'off regions could be dis-cerned, the principles of summation and mutualantagonism, so helpful in interpreting simplefields, did not generally hold. Nevertheless, therewere some important features common to the twotypes of cells. In the following examples, four typesof complex fields will be illustrated. The numbersobserved of each type are given in Table 2.
The cell of Text-fig. 3 failed to respond toround spots of light, whether small or large. Bytrial and error with many shapes of stimulus it wasdiscovered that the cell's firing could be influencedby a horizontally oriented slit Ys° wide and 3° long.Provided the slit was horizontal its exact position-ing within the 3°-diameter receptive field was notcritical. When it was shone anywhere above the

Cat Striate Cortex 111
Table 2. Complex Cortical Receptive Fields
(a) Activated by slit — non-uniform field
(b) Activated by slit — uniformfield
(c) Activated by edge(d) Activated by dark bar
Total number of complex fields
Text-fig.
3
4
5-67-8
No. ofcells
11
39
146
70
centre of the receptive field (the horizontal line of
Text-fig. 3) an 'off response was obtained; 'on'
responses were evoked throughout the lower half.
In an intermediate position (Text-fig. 3C) the cell
responded at both 'on' and 'off. From experience
with simpler receptive fields one might have
expected wider slits to give increasingly better
responses owing to summation within the upper or
lower part of the field, and that illumination of
either half by itself might be the most effective
stimulus of all. The result was just the opposite:
responses fell off rapidly as the stimulus was
widened beyond about %°, and large rectangles
covering the entire lower or upper halves of the
Fig. 3. Responses of a cell with acomplex receptive field to stimulationof the left (contralateral) eye. Recep-tive field located in area centralis.The diagrams to the left of eachrecord indicate the position of a hori-zontal rectangular light stimuluswith respect to the receptive field,marked by a cross. In each record theupper line indicates when the stimu-lus is on. A-E, stimulus '/& X 3°,F—G, stimulus I £> X 3° (4° is equiva-lent to 1 mm on the cat retina). Forbackground illumination and stimu-lus intensity see Methods. Cell wasactivated in the same way from righteye, but less vigorously (ocular-dom-inance group 2, see Part II). An elec-trolytic lesion made while recording
from this cell was found near the bor-der of layers 5 and 6, in the apical seg-ment of the post-lateral gyrus. Posi-tive deflexions upward; duration ofeach stimulus 1 sec.
receptive field were quite ineffective (Text-fig. 3F,G). On the other hand, summation could easily bedemonstrated in a horizontal direction, since a slitVs° wide but extending only across part of the fieldwas less effective than a longer one covering theentire width. One might also have expected the ori-entation of the slit to be unimportant as long as thestimulus was wholly confined to the region abovethe horizontal line or the region below. On the con-trary, the orientation was critical, since a tilt of evena few degrees from the horizontal markedlyreduced the response, even though the slit did notcross the boundary separating the upper and lowerhalves of the field.
In preferring a slit specific in width and ori-entation this cell resembled certain cells with sim-ple fields. When stimulated in the upper part of itsfield it behaved in many respects like cells with'off-centre fields of type D, Text-fig. 2; in thelower part it responded like 'on'-centre fields ofText-fig. 2C. But for this cell the strict require-ments for shape and orientation of the stimuluswere in marked contrast to the relatively large lee-way of the stimulus in its ordinate position on theretina. Cells with simple fields, on the other hand,showed very little latitude in the positioning of anoptimally oriented stimulus.

112 PART III NORMAL PHYSIOLOGY AND ANATOMY
The upper part of this receptive field may beconsidered inhibitory and the lower part excita-tory, even though in either area summation onlyoccurred in a horizontal direction. Such subdivi-sions were occasionally found in complex fields,but more often the fields were uniform in thisrespect. This was true for the other complex fieldsto be described in this section.
Responses of a second complex unit areshown in Text-fig. 4. In many ways the receptivefield of this cell was similar to the one justdescribed. A slit was the most potent stimulus, andthe most effective width was again Vs°. Once morethe orientation was an important stimulus variable,since the slit was effective anywhere in the field aslong as it was placed in a 10 o'clock-4 o'clock ori-entation (Text-fig. 4A-D). A change in orientationof more than 5-10° in either direction produced amarked reduction in the response (Text-fig.4E-G). As usual, diffuse light had no influence onthe firing. This cell responded especially well if theslit, oriented as in A-D, was moved steadily acrossthe receptive field. Sustained discharges wereevoked over the entire length of the field. The opti-
mum rate of movement was about IVsec. If move-ment was interrupted the discharge stopped, andwhen it was resumed the firing recommenced.Continuous firing could be maintained indefinitelyby small side-to-side movements of a stimuluswithin the receptive field (Text-fig. 4//). The pat-tern of firing was one characteristic of many com-plex cells, especially those responding well to mov-ing stimuli. It consisted of a series of shorthigh-frequency repetitive discharges each contain-ing 5-10 spikes. The bursts occurred at irregularintervals, at frequencies up to about 20/sec. For thiscell, movement of an optimally oriented slit wasabout equally effective in either of the two oppositedirections. This was not true of all complex units,as will be seen in some of the examples given below.
Like the cell of Text-fig. 3 this cell may bethought of as having a counterpart in simple fieldsof the type shown in Text-fig. 2C-E. It shares withthese simpler fields the attribute of responding wellto properly oriented slit stimuli. Once more the dis-tinction lies in the permissible variation in positionof the optimally oriented stimulus. The variation issmall (relative to the size of the receptive field) in
Fig. 4. Responses of a cell with acomplex field to stimulation of theleft (contralateral) eye with a slit 1/s X
2'/ 2°. Receptive field was in the areacentralis and was about 2x3° in size.A-D, 1/g wide slit oriented parallel
to receptive field axis. E-G, slit ori-ented at 45 and 90° to receptive-fieldaxis. H, slit oriented as in A-D, is onthroughout the record and is movedrapidly from side to side where indi-cated by upper beam. Responses from
left eye slightly more marked thanthose from right (Group 3, see Part
II). Time 1 sec.

Cat Striate Cortex 113
the simple fields, large in the complex. Thoughresembling the cell of Text-fig. 3 in requiring a slitfor a stimulus, this cell differed in that its responsesto a properly oriented slit were mixed ('on-off') intype. This was not unusual for cells with complexfields. In contrast, cortical cells with simple fields,like retinal ganglion cells and lateral geniculatecells, responded to optimum restricted stimulieither with excitatory ('on') responses or inhibitory('off') responses. When a stimulus covered oppos-ing regions, the effects normally tended to cancel,though sometimes mixed discharges were ob-tained, the 'on'and 'off components both beingweak. For these simpler fields 'on-off responseswere thus an indication that the stimulus was notoptimum. Yet some cells with complex fieldsresponded with mixed discharges even to the mosteffective stationary stimuli we could find. Amongthe stimuli tried were curved objects, dark stripes,and still more complicated patterns, as well asmonochromatic spots and slits.
A third type of complex field is illustrated inText-figs. 5 and 6. There were no responses tosmall circular spots or to slits, but an edge was veryeffective if oriented vertically. Excitatory or in-hibitory responses were produced depending onwhether the brighter area was to the left or theright (Text-fig. 5A, E). So far, these are just theresponses one would expect from a cell with a ver-tically oriented simple field of the type shown inText-fig. 2G. In such a field the stimulus placementfor optimum response is generally very critical. Onthe contrary, the complex unit responded to verti-cal edges over an unusually large region about 16°in length (Text-fig. 6). 'On' responses wereobtained with light to the left (A-D), and 'offresponses with light to the right (E—H), regardlessof the position of the line separating light fromdarkness. When the entire receptive field was illu-minated diffusely (/) no response was evoked. Aswith all complex fields, we are unable to accountfor these responses by any simple spatial arrange-ment of excitatory and inhibitory regions.
Like the complex units already described, thiscell was apparently more concerned with the ori-entation of a stimulus than with its exact position inthe receptive field. It differed in responding well toedges but poorly or not at all to slits, whether nar-row or wide. It is interesting in this connexion thatexchanging an edge for its mirror equivalent re-
Fig. 5. Responses of a cell with a large (8 X 16°) complexreceptive field to an edge projected on the ipsilateral retina soas to cross the receptive field in various directions. (Thescreen is illuminated by a diffuse background light, at 0.0
loglo cd/m2. At the time of stimulus, shown by upper line ofeach record, half the screen, to one side of the variable bound-ary, is illuminated at 1.0 Iog1() cd/m2, while the other half is%ept constant.) A, vertical edge with light area to left, darkerarea to right. B—H, various other orientations of edge. Posi-
tion of receptive field 20° below and to the left of the areacentralis. Responses from ipsilateral eye stronger than thosefrom contralateral eye (group 5, see Part II). Time 1 sec.
versed the response, i.e. replaced an excitatoryresponse by an inhibitory and vice versa. The inef-fectiveness of a slit might therefore be explained bysupposing that the opposite effects of its two edgestended to cancel each other.
As shown in Text-fig. 6, the responses of thecell to a given vertical edge were consistent in type,being either 'on' or 'off for all positions of the edgewithin the receptive field. In being uniform in itsresponse-type it resembled the cell of Text-fig. 4. Afew other cells of the same general categoryshowed a similar preference for edges, but lackedthis uniformity. Their receptive fields resembled

114 PART III NORMAL PHYSIOLOGY AND ANATOMY
Fig. 6. Same cell as in Text-fig. 5.A-H, responses to a vertical edge invarious parts of the receptive field:A-D, brighter light to the left; E-H,brighter light to the right; \, largerectangle, 10 X 20°, covering entirereceptive field. Time, 1 sec.
the field of Text-fig. 3, in that a given edge evokedresponses of one type over half the field, and theopposite type over the other half. These fields weredivided into two halves by a line parallel to thereceptive-field axis: an edge oriented parallel tothe axis gave 'on' responses throughout one of thehalves and 'off responses through the other. Ineither half, replacing the edge by its mirror imagereversed the response-type. Even cells, which wereuniform in their response-types, like those in Text-fig. 4—6, varied to some extent in the magnitude oftheir responses, depending on the position of thestimulus. Moreover, as with most cortical cells,there was some variation in responses to identicalstimuli.
A final example is given to illustrate the widerange of variation in the organization of complexreceptive fields. The cell of Text-figs. 7 and 8 wasnot strongly influenced by any form projectedupon the screen; it gave only weak, unsustained'on' responses to a dark horizontal rectangleagainst a light background, and to other forms itwas unresponsive. A strong discharge was evoked,however, if a black rectangular object (for example,a piece of black tape) was placed against thebrightly illuminated screen. The receptive field ofthe cell was about 5 X 5°, and the most effectivestimulus width was about !/3°. Vigorous firing wasobtained regardless of the position of the rectangle,as long as it was horizontal and within the recep-
Fig. 7. Cell activated only by left(contralateral) eye over a fieldapproximately 5 X 5° situated 10°above and to the left of the area cen-tralis. The cell responded best to ablacJ^ horizontal rectangle, 1A X 6°placed any where in the receptive field(A—C). Tilting the stimulus renderedit ineffective (D-Ej. The blacl^ barwas introduced against a light bact(-ground during periods of 1 sec, indi-cated by the upper line in eachrecord. Luminance of white bacl{-ground, 1.0 loglf) cd/m2; luminanceof blacf{ part, 0.0 Iog10 cd/m2. Alesion, made while recording fromthe cell, was found in layer 2 of api-cal segment of post-lateral gyrus.

Cat Striate Cortex 115
Fig. 8. Same cell as in Text-fig. 7. Movement ofblacl^ rectangle 'A X6° bac\ and forth across the receptive field:A, horizontally oriented (parallel to receptive-field axis); B, vertically oriented. Time required to move acrossthe field, 5 sec. Time, 1 sec.
tive field. If it was tipped more than 10° in eitherdirection no discharge was evoked (Text-fig. 7D,E). We have recorded several complex fields whichresembled this one in that they responded best toblack rectangles against a bright background. Pre-sumably it is important to have good contrastbetween the narrow black rectangle and the back-ground; this is technically difficult with a projectorbecause of scattered light.
Slow downward movement of the dark rec-tangle evoked a strong discharge throughout theentire 5° of the receptive field (Text-fig. 8/4). If themovement was halted the cell continued to fire, butless vigorously. Upward movement gave onlyweak, inconsistent responses, and left-right move-ment (Text-fig. SB) gave no responses. Dischargesof highest frequency were evoked by relativelyslow rates of downward movement (about 5-10 secto cross the entire field); rapid movement in eitherdirection gave only very weak responses.
Despite its unusual features this cell exhibitedseveral properties typical of complex units, partic-ularly the lack of summation (except in a horizon-tal sense), and the wide area over which the darkbar was effective. One may think of the field ashaving a counterpart in simple fields of type D,Text-fig. 2. In such fields a dark bar would evokedischarges, but only if it fell within the inhibitoryregion. Moreover, downward movement of the barwould also evoke brisker discharges than upward,provided the upper flanking region were strongerthan the lower one.
In describing simple fields it has already beennoted that moving stimuli were often more effec-
tive than stationary ones. This was also true of cellswith complex fields. Depending on the cell, slits,edges, or dark bars were most effective. As withsimple fields, orientation of a stimulus was alwayscritical, responses varied with rate of movement,and directional asymmetries of the type seen inText-fig. 8 were common. Only once have we seenactivation of a cell for one direction of movementand suppression of maintained firing for the oppo-site direction. In their responses to movement, cellswith complex fields differed from their simplecounterparts chiefly in responding with sustainedfiring over substantial regions, usually the entirereceptive field, instead of over a very narrowboundary separating excitatory and inhibitoryregions.
Receptive-Field DimensionsOver-all field dimensions were measured for 119cells. A cell was included only if its field wasmapped completely, and if it was situated in thearea of central vision (see p. 135). Fields variedgreatly in size from one cell to the next, even forcells recorded in a single penetration (see Text-fig.15). In Text-fig. 9 the distribution of cells accordingto field area is given separately for simple andcomplex fields. The histogram illustrates the varia-tion in size, and shows that on the average complexfields were larger than simple ones.
Widths of the narrow subdivisions of simplefields (the centres of types C, D and E or the flanksof type F, Text-fig. 2) also varied greatly: the small-est were 10-15 minutes of arc, which is roughly thediameter of the smallest field centres we have
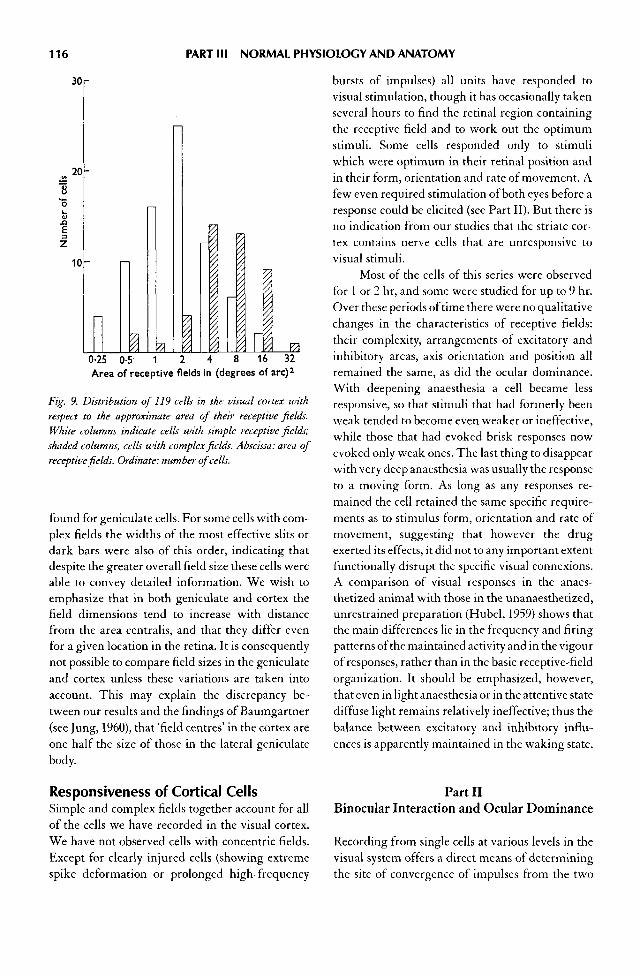
116 PART III NORMAL PHYSIOLOGY AND ANATOMY
Area of receptive fields in (degrees of arc)2
Fig. 9. Distribution of 119 cells in the visual cortex withrespect to the approximate area of their receptive fields.White columns indicate cells with simple receptive fields;shaded columns, cells with complex fields. Abscissa: area ofreceptive fields. Ordinate: number of cells.
found for geniculate cells. For some cells with com-plex fields the widths of the most effective slits ordark bars were also of this order, indicating thatdespite the greater overall field size these cells wereable to convey detailed information. We wish toemphasize that in both geniculate and cortex thefield dimensions tend to increase with distancefrom the area centralis, and that they differ evenfor a given location in the retina. It is consequentlynot possible to compare field sizes in the geniculateand cortex unless these variations are taken intoaccount. This may explain the discrepancy be-tween our results and the findings of Baumgartner(see Jung, 1960), that 'field centres' in the cortex areone half the size of those in the lateral geniculatebody.
Responsiveness of Cortical CellsSimple and complex fields together account for allof the cells we have recorded in the visual cortex.We have not observed cells with concentric fields.Except for clearly injured cells (showing extremespike deformation or prolonged high-frequency
bursts of impulses) all units have responded tovisual stimulation, though it has occasionally takenseveral hours to find the retinal region containingthe receptive field and to work out the optimumstimuli. Some cells responded only to stimuliwhich were optimum in their retinal position andin their form, orientation and rate of movement. Afew even required stimulation of both eyes before aresponse could be elicited (see Part II). But there isno indication from our studies that the striate cor-tex contains nerve cells that are unresponsive tovisual stimuli.
Most of the cells of this series were observedfor 1 or 2 hr, and some were studied for up to 9 hr.Over these periods of time there were no qualitativechanges in the characteristics of receptive fields:their complexity, arrangements of excitatory andinhibitory areas, axis orientation and position allremained the same, as did the ocular dominance.With deepening anaesthesia a cell became lessresponsive, so that stimuli that had formerly beenweak tended to become even weaker or ineffective,while those that had evoked brisk responses nowevoked only weak ones. The last thing to disappearwith very deep anaesthesia was usually the responseto a moving form. As long as any responses re-mained the cell retained the same specific require-ments as to stimulus form, orientation and rate ofmovement, suggesting that however the drugexerted its effects, it did not to any important extentfunctionally disrupt the specific visual connexions.A comparison of visual responses in the anaes-thetized animal with those in the unanaesthetized,unrestrained preparation (Hubel, 1959) shows thatthe main differences lie in the frequency and firingpatterns of the maintained activity and in the vigourof responses, rather than in the basic receptive-fieldorganization. It should be emphasized, however,that even in light anaesthesia or in the attentive statediffuse light remains relatively ineffective; thus thebalance between excitatory and inhibitory influ-ences is apparently maintained in the waking state.
Part IIBinocular Interaction and Ocular Dominance
Recording from single cells at various levels in thevisual system offers a direct means of determiningthe site of convergence of impulses from the two

Cat Striate Cortex 117
eyes. In the lateral geniculate body, the first point atwhich convergence is at all likely, binocularlyinfluenced cells have been observed, but it wouldseem that these constitute at most a small minorityof the total population of geniculate cells (Erulkar& Fillenz, 1958,1960; Bishop, Burke & Davis, 1959;Grusser & Sauer, 1960; Hubel & Wiesel, 1961).Silver-degeneration studies show that in each layerof the geniculate the terminals of fibres from a sin-gle eye are grouped together, with only minoroverlap in the interlaminar regions (Silva, 1956;Hayhow, 1958). The anatomical and physiologicalfindings are thus in good agreement.
It has long been recognized that the greaterpart of the cat's primary visual cortex receives pro-jections from the two eyes. The anatomical evi-dence rests largely on the observation that cells in allthree lateral geniculate layers degenerate followinga localized lesion in the striate area (Minkowski,1913). Physiological confirmation was obtained byTalbot & Marshall (1941) who stimulated the visualfields of the separate eyes with small spots of light,and mapped the evoked cortical slow waves. Stillunsettled, however, was the question of whetherindividual cortical cells receive projections fromboth eyes, or whether the cortex contains a mixtureof cells, some activated by one eye, some by theother. We have recently shown that many cells inthe visual cortex can be influenced by both eyes(Hubel & Wiesel, 1959). The present section con-tains further observations on binocular interaction.We have been particularly interested in learningwhether the eyes work in synergy or in opposition,how the relative influence of the two eyes variesfrom cell to cell, and whether, on the average, oneeye exerts more influence than the other on the cellsof a given hemisphere.
RESULTS
In agreement with previous findings (Hubel &Wiesel, 1959) the receptive fields of all binocularlyinfluenced cortical cells occupied correspondingpositions on the two retinas, and were strikinglysimilar in their organization. For simple fields thespatial arrangements of excitatory and inhibitoryregions were the same; for complex fields the stim-uli that excited or inhibited the cell through oneeye had similar effects through the other. Axis ori-entations of the two receptive fields were the same.
Indeed, the only differences ever seen between thetwo fields were related to eye dominance: identicalstimuli to the two eyes did not necessarily evokeequally strong responses from a given cell. Forsome cells the responses were equal or almost so;for others one eye tended to dominate. Wheneverthe two retinas were stimulated in identical fashionin corresponding regions, their effects summed, i.e.they worked in synergy. On the other hand, ifantagonistic regions in the two eyes were stimu-lated so that one eye had an excitatory effect andthe other an inhibitory one, then the responsestended to cancel (Hubel & Wiesel, 1959, Fig. 10,4).
Some units did not respond to stimulation ofeither eye alone but could be activated only bysimultaneous stimulation of the two eyes. Text-figure 10 shows an example of this, and also illus-trates ordinary binocular synergy. Two simultane-ously recorded cells both responded best totransverse movement of a rectangle oriented in a1 o'clock—7 o'clock direction (Text-fig. 10/1, B). Forone of the cells movement down and to the right wasmore effective than movement up and to the left.Responses from the individual eyes were roughlyequal. On simultaneous stimulation of the two eyesboth units responded much more vigorously. Nowa third cell was also activated. The threshold of thisthird unit was apparently so high that, at least underthese experimental conditions, stimulation of eithereye alone failed to evoke any response.
A second example of synergy is seen in Text-fig. 11. The most effective stimulus was a verticallyoriented rectangle moved across the receptive fieldfrom left to right. Here the use of both eyes notonly enhanced the response already observed witha single eye, but brought into the open a tendencythat was formerly unsuspected. Each eye mediateda weak response (Text-fig. 11 A, B) which wasgreatly strengthened when both eyes were used inparallel (C). Now, in addition, the cell gave a weakresponse to leftward movement, indicating thatthis had an excitatory effect rather than aninhibitory one. Binocular synergy was often a use-ful means of bringing out additional informationabout a receptive field.
In our previous study of forty-five corticalcells (Hubel & Wiesel, 1959) there was clear evi-dence of convergence of influences from the twoeyes in only one fifth of the cells. In the presentseries 84% of the cells fell into this category. The

118 PART III NORMAL PHYSIOLOGY AND ANATOMY
Fig. 10. Examples of binocular synergy in a simultaneous recording of three cells (spikes of the three cells arelabelled 1—3). Each of the cells had receptive fields in the two eyes; in each eye the three fields overlapped andwere situated 2° below and to the left of the area centralis. The crosses to the left of each record indicate the posi-tions of the receptive fields in the two eyes. The stimulus was '/« X 2°slit oriented obliquely and moved slowlyacross the receptive fields as shown; A, in the left eye; B, m the right eye; C, in the two eyes simultaneously. Sincethe responses in the two eyes were about equally strong, these two cells were classed in ocular-dominance group4 (see Text-fig. 12). Time, 1 sec.
difference is undoubtedly related to the improvedprecision in technique of binocular stimulation. Afield was first mapped in the dominant eye and themost effective type of stimulus determined. Thatstimulus was then applied in the correspondingregion in the other eye. Finally, even if no responsewas obtained from the non-dominant eye, the twoeyes were stimulated together in parallel to see iftheir effects were synergistic. With these methods,an influence was frequently observed from the
non-dominant eye that might otherwise have beenoverlooked.
A comparison of the influence of the two eyeswas made for 223 of the 303 cells in the presentseries. The remaining cells were either not suffi-ciently studied, or they belonged to the small groupof cells which were only activated if both eyes weresimultaneously stimulated. The fields of all cellswere in or near the area centralis. The 223 cellswere subdivided into seven groups, as follows:
Fig. 11. Movement of a % X 2° slitbaci^ and forth horizontally across thereceptive field of a binocularly influ-enced cell. A, left eye; B, right eye; C,both eyes. The cell clearly preferredleft-to-right movement, but whenboth eyes were stimulated together itresponded also to the reverse direc-tion. Field diameter, 2°, situated 5°from the area centralis. Time, 1 sec.

Cat Striate Cortex 119
Group Ocular Dominance
12*
3
4
56*7
Exclusively contralateralContralateral eye much more effective than
ipsilateral eyeContralateral eye slightly more effective than
ipsilateralNo obvious difference in the effects exerted by
the two eyesIpsilateral eye slightly more effectiveIpsilateral eye much more effectiveExclusively ipsilateral
* These groups include cells in which the non-dominant eye, ineffective
by itself, could influence the response to stimulation of the dominant eye.
A histogram showing the distribution of cellsamong these seven groups is given in Text-fig. 12.Assignment of a unit to a particular group was tosome extent arbitrary, but it is unlikely that manycells were misplaced by more than one group. Per-haps the most interesting feature of the histogramis its lack of symmetry: many more cells were dom-inated by the contralateral than by the ipsilateraleye (106 vs. 62). We conclude that in the part of thecat's striate cortex representing central vision thegreat majority of cells are influenced by both eyes,and that despite wide variation in relative oculardominance from one cell to the next, the contralat-eral eye is, on the average, more influential. As theshaded portion of Text-fig. 12 shows, there is noindication that the distribution among the variousdominance groups of cells having complex recep-tive fields differs from the distribution of the pop-ulation as a whole.
A cortical bias in favour of the contralateraleye may perhaps be related to the preponderance ofcrossed over uncrossed fibres in the cat's optic tract(Polyak, 1957, p. 788). The numerical inequalitybetween crossed and uncrossed tract fibres is gen-erally thought to be related to an inequality in sizeof the nasal and temporal half-fields, since bothinequalities are most marked in lower mammalswith laterally placed eyes, and become progres-sively less important in higher mammals, primatesand man. Thompson et al. (1950) showed that inthe rabbit, for example, there is a substantial corti-cal region receiving projections from that part ofthe peripheral contralateral visual field which isnot represented in the ipsilateral retina (the 'Tem-poral Crescent'). Our results, concerned with morecentral portions of the visual fields, suggest that in
Receptive fieldsI [Simple
ES3 Complex
^ContralateralEqual IpsilateralOcular dominance
Fig. 12. Distribution of 223 cells recorded from the visualcortex, according to ocular dominance. Histogram includescells with simple fields and cells with complex fields. Theshaded region shows the distribution of cells with complexreceptive fields. Cells of group 1 were driven only by the con-tralateral eye; for cells of group 2 there was marked domi-nance of the contralateral eye, for group 3, slight dominance.For cells in group 4 there was no obvious difference betweenthe two eyes. In group 5 the ipsilateral eye dominatedslightly, in group 6, markedly; and in group 7 the cells weredriven only by the ipsilateral eye.
the cat the difference in the number of crossed anduncrossed fibres in an optic tract is probably notaccounted for entirely by fibres having their recep-tive fields in the temporal-field crescents.
Part IIIFunctional Cytoarchitecture of the
Cat's Visual Cortex
In the first two parts of this paper cells were stud-ied individually, no attention being paid to theirgrouping within the cortex. We have shown thatthe number of functional cell types is very large,since cells may differ in several independent phys-
Eye preference of 23 cells

120 PART III NORMAL PHYSIOLOGY AND ANATOMY
iological characteristics, for example, in the retinalposition of their receptive fields, their receptive-field organization, their axis orientation, and theirocular-dominance group. In this section we shalltry to determine whether cells are scattered at ran-dom through the cortex with regard to these char-acteristics, or whether there is any tendency for oneor more of the characteristics to be shared by neigh-bouring cells. The functional architecture of thecortex not only seems interesting for its own sake,but also helps to account for the various complexresponse patterns described in Part I.
RESULTS
Functional architecture of the cortex was studied bythree methods. These had different merits and lim-itations, and were to some extent complementary.
(1) CELLS RECORDED IN SEQUENCE. The most usefuland convenient procedure was to gather as muchinformation as possible about each of a long succes-sion of cells encountered in a micro-electrode pen-etration through the cortex, and to reconstruct theelectrode track from serial histological sections.One could then determine how a physiologicalcharacteristic (such as receptive-field position,organization, axis orientation or ocular domi-nance) varied with cortical location. The success ofthis method in delineating regions of constantphysiological characteristics depends on the possi-bility of examining a number of units as the elec-trode passes through each region. Regions mayescape detection if they are so small that the elec-trode is able to resolve only one or two cells in each.The fewer the cells resolved, the larger the regionsmust be in order to be detected at all.
(2) UNRESOLVED BACKGROUND ACTIVITY. To someextent the spaces between isolated units werebridged by studying unresolved background activ-ity audible over the monitor as a crackling noise,and assumed to originate largely from actionpotentials of a number of cells. It was concludedthat cells, rather than fibres, gave rise to this activ-ity, since it ceased abruptly when the electrode leftthe grey matter and entered subcortical white mat-ter. Furthermore, diffuse light evoked no changein activity, compared to the marked increasecaused by an optimally oriented slit. This sug-gested that terminal arborizations of afferent fibres
contributed little to the background, since mostgeniculate cells respond actively to diffuse light(Hubel, 1960). In most penetrations unresolvedbackground activity was present continuously asthe electrode passed through layers 2—6 of the cor-tical grey matter.
Background activity had many uses. It indi-cated when the cells within range of the electrodetip had a common receptive-field axis orientation.Similarly, one could use it to tell whether the cellsin the neighbourhood were driven exclusively byone eye (group 1 or group 7). When the back-ground activity was influenced by both eyes, onecould not distinguish between a mixture of cellsbelonging to the two monocular groups (1 and 7)and a population in which each cell was drivenfrom both eyes. But even here one could at leastassess the relative influence of the two eyes uponthe group of cells in the immediate neighbourhoodof the electrode.
(3) MULTIPLE RECORDINGS. In the series of 303 cells,78 were recorded in groups of two and 12 in groupsof three. Records were not regarded as multipleunless the spikes of the different cells showed dis-tinct differences in amplitude, and unless each unitfulfilled the criteria required of a single-unitrecord, namely that the amplitude and wave shapebe relatively constant for a given electrode position.
In such multiple recordings one could be con-fident that the cells were close neighbours and thatuniform stimulus conditions prevailed, since thecells could be stimulated and observed together.One thus avoided some of the difficulties in evalu-ating a succession of recordings made over a longperiod of time span, where absolute constancy ofeye position, anaesthetic level, and preparationcondition were sometimes hard to guarantee.
Regional variations of several physiologicalcharacteristics were examined by the three meth-ods just outlined. Of particular interest for thepresent study were the receptive-field axis orienta-tion, position of receptive fields on the retina,receptive-field organization, and relative oculardominance. These will be described separately inthe following paragraphs.
Orientation of Receptive-Field AxisThe orientation of a receptive-field axis was deter-mined in several ways. When the field was simplethe borders between excitatory and inhibitory re-

Cat Striate Cortex 121
gions were sufficient to establish the axis directly.For both simple and complex fields the axis couldalways be determined from the orientation of themost effective stimulus. For most fields, when theslit or edge was placed at right angles to the opti-mum position there was no response. The recep-tive-field axis orientation was checked by varyingthe stimulus orientation from this null position inorder to find the two orientations at which aresponse was only just elicited, and by bisecting theangle between them. By one or other of these pro-cedures the receptive-field orientation could usu-ally be determined to within 5 or 10°.
One of the first indications that the orienta-tion of a receptive-field axis was an important vari-able came from multiple recordings. Invariably theaxes of receptive fields mapped together had thesame orientations. An example of a 3-unit record-ing has already been given in Text-fig. 10. Cellswith common axis orientation were therefore notscattered at random through the cortex, but tendedto be grouped together. The size and shape of theregions containing these cell groups were investi-gated by comparing the fields of cells mapped insequence. It was at once apparent that successivelyrecorded cells also tended to have identical axis ori-entations and that each penetration consisted ofseveral sequences of cells, each sequence having acommon axis orientation. Any undifferentiatedunits in the background responded best to thestimulus orientation that was most effective in acti-vating the cell under study. After traversing a dis-tance that varied greatly from one penetration tothe next, the electrode would enter an area wherethere was no longer any single optimum orienta-tion for driving background activity. A very slightadvance of the electrode would bring it into aregion where a new orientation was the most effec-tive, and the succeeding cells would all have recep-tive fields with that orientation. The change inangle from one region to another was unpre-dictable; sometimes it was barely detectable, atother times large (45-90°).
Text-figure 13 shows a camera lucida tracingof a frontal section through the post-lateral gyrus.The electrode track entered normal to the surface,passed through the apical segment in a directionparallel to the fibre bundles, then through thewhite matter beneath, and finally obliquelythrough half the thickness of the mesial segment. Alesion was made at the termination of the penetra-
tion. A composite photomicrograph (PL 1) showsthe lesion and the first part of the electrode track.The units recorded in the course of the penetrationare indicated in Text-fig. 13 by the longer linescrossing the track; the unresolved backgroundactivity by the shorter lines. The orientations of themost effective stimuli are given by the directions ofthe lines, a line perpendicular to the track signify-ing a vertical orientation. For the first part of thepenetration, through the apical segment, the fieldorientation was vertical for all cells as well as forthe background activity. Fibres were recordedfrom the white matter and from the grey matterjust beyond it. Three of these fibres were axons ofcortical cells having fields of various oblique orien-tations; four were afferent fibres from the lateralgeniculate body. In the mesial segment three shortsequences were encountered, each with a differentcommon field orientation. These sequences to-gether occupied a distance smaller than the fullthickness of the apical segment.
In another experiment, illustrated in Text-fig.14 and in PL 2, two penetrations were made, bothin the apical segment of the post-lateral gyrus. Themedial penetration (at left in the figure) was at theoutset almost normal to the cortex, but deviatedmore and more from the direction of the deep fibrebundles. In this penetration there were three dif-ferent axis orientations, of which the first and thirdpersisted through long sequences. In the lateraltrack there were nine orientations. From thebeginning this track was more oblique, and itbecame increasingly so as it progressed.
As illustrated by the examples of Text-figs. 13and 14, there was a marked tendency for shifts inorientation to increase in frequency as the anglebetween electrode and direction of fibre bundles(or apical dendrites) became greater. The extremecurvature of the lateral and post-lateral gyri intheir apical segments made normal penetrationsvery difficult to obtain; nevertheless, four penetra-tions were normal or almost so. In none of thesewere there any shifts of axis orientation. On theother hand there were several shifts of field orien-tation in all oblique penetrations. As illustrated byText-fig. 14, most penetrations that began nearlynormal to the surface became more and moreoblique with increasing depth. Here the distancetraversed by the electrode without shifts in recep-tive-field orientation tended to become less and lessas the penetration advanced.

122 PART III NORMAL PHYSIOLOGY AND ANATOMY
Fig. 13. Reconstruction of micro-electrode penetration through the lateral gyrus (see also PI. 1). Electrodeentered apical segment normal to the surface, and remained parallel to the deep fibre bundles (indicated by radiallines) until reaching white matter; in grey matter of mesial segment the electrode's course was oblique. Longerlines represent cortical cells. Axons of cortical cells are indicated by a crossbar at right-hand end of line. Field-axis orientation is shown by the direction of each line; lines perpendicular to trac\ represent vertical orientation.Brace-brackets show simultaneously recorded units. Complex receptive fields are indicated by 'Cx'. Afferentfibres from the lateral geniculate body indicated by X,for 'on' centre; A, for 'off centre. Approximate positionsof receptive fields on the retina are shown to the right of the penetration. Shorter lines show regions in whichunresolved background activity was observed. Numbers to the left of the penetration refer to ocular-dominancegroup (see Part II). Scale 1 mm.
It can be concluded that the striate cortex isdivided into discrete regions within which the cellshave a common receptive-field axis orientation.Some of the regions extend from the surface of thecortex to the white matter; it is difficult to be cer-tain whether they all do. Some idea of their shapesmay be obtained by measuring distances betweenshifts in receptive-field orientation. From thesemeasurements it seems likely that the generalshape is columnar, distorted no doubt by any cur-
vature of the gyrus, which would tend to make theend at the surface broader than that at the whitematter; deep in a sulcus the effect would be thereverse. The cross-sectional size and shape of thecolumns at the surface can be estimated onlyroughly. Most of our information concerns theirwidth in the coronal plane, since it is in this planethat oblique penetrations were made. At the sur-face this width is probably of the order of 0.5 mm.We have very little information about the cross-

Cat Striate Cortex 123
Fig. 14. Reconstructions of two penetrations in apical segment of post-lateral gyrus, near its anterior end (justbehind anterior interrupted line in Text-fig. 1, see also PI. 2). Medial penetration is slightly oblique, lateral oneis markedly so. All receptive fields were located within 1° of area centralis. Conventions as in Text-fig. 13. Scale1 mm.
sectional dimension in a direction parallel to thelong axis of the gyrus. Preliminary mapping of thecortical surface suggests that the cross-sectionalshape of the columns may be very irregular.
Position of Receptive Fields onthe Retina
GROSS TOPOGRAPHY. That there is a systematic rep-resentation of the retina on the striate cortex of thecat was established anatomically by Minkowski(1913) and with physiological methods by Talbot &Marshall (1941). Although in the present study noattempt has been made to map topographically allparts of the striate cortex, the few penetrationsmade in cortical areas representing peripheralparts of the retina confirm these findings. Cellsrecorded in front of the anterior interrupted linesof Text-fig. 1 had receptive fields in the superiorretinas; those in the one penetration behind theposterior line had fields that were well below thehorizontal meridian of the retina. (No recordingswere made from cortical regions receiving projec-tions from the deeply pigmented non-tapetal partof the inferior retinas.) In several penetrationsextending far down the mesial (interhemispheric)segment of the lateral gyrus, receptive fields moved
further and further out into the ipsilateral half ofeach retina as the electrode advanced (Text-fig. 13).In these penetrations the movement of fields intothe retinal periphery occurred more and more rap-idly as the electrode advanced. In three penetra-tions extending far down the lateral segment of thepost-lateral gyrus (medial bank of the post-lateralsulcus) there was likewise a clear progressive shiftof receptive-field positions as the electrodeadvanced. Here also the movement was along thehorizontal meridian, again into the ipsilateralhalves of both retinas. This therefore confirms thefindings of Talbot & Marshall (1941) and Talbot(1942), that in each hemisphere there is a secondlaterally placed representation of the contralateralhalf-field of vision. The subject of Visual Area IIwill not be dealt with further in this paper.
Cells within the large cortical region lyingbetween the interrupted lines of Text-fig. 1, andextending over on to the mesial segment and intothe lateral sulcus for a distance of 2-3 mm, hadtheir receptive fields in the area of central vision.By this we mean the area centralis, which is about5° in diameter, and a region surrounding it byabout 2-3°. The receptive fields of the great major-ity of cells were confined to the ipsilateral halves ofthe two retinas. Often a receptive field covering

124 PART III NORMAL PHYSIOLOGY AND ANATOMY
several degrees on the retina stopped short in thearea centralis right at the vertical meridian. Onlyrarely did a receptive field appear to spill over intothe contralateral half-retina; when it did, it wasonly by 2—3°, a distance comparable to the possibleerror in determining the area centralis in some cats.
Because of the large cortical representation ofthe area centralis, one would expect only a veryslow change in receptive-field position as the elec-trode advanced obliquely (Text-fig. 13). Indeed, inpenetrations through the apex of the post-lateralgyrus and extending 1—2 mm down either bankthere was usually no detectable progressive dis-placement of receptive fields. In penetrations made1—3 mm apart, either along a parasagittal line or inthe same coronal plane (Text-fig. 14) receptivefields again had almost identical retinal positions.
RETINAL REPRESENTATION OF NEIGHBOURING CELLS.A question of some interest was to determinewhether this detailed topographic representation ofthe retina held right down to the cellular level.From the results just described one might imaginethat receptive fields of neighbouring cortical cellsshould have very nearly the same retinal position. Ina sequence of cells recorded in a normal penetrationthrough the cortex the receptive fields should besuperimposed, and for oblique penetrations anydetectable changes in field positions should be sys-tematic. In the following paragraphs we shall con-sider the relative retinal positions of the receptivefields of neighbouring cells, especially cells within acolumn.
In all multiple recordings the receptive fieldsof cells observed simultaneously were situated inthe same general region of the retina. As a rule thefields overlapped, but it was unusual for them to beprecisely superimposed. For example, fields wereoften staggered along a line perpendicular to theiraxes. Similarly, the successive receptive fieldsobserved during a long cortical penetration variedsomewhat in position, often in an apparently ran-dom manner. Text-figure 15 illustrates a sequenceof twelve cells recorded in the early part of a pene-tration through the cortex. One lesion was madewhile observing the first cell in the sequence andanother at the end of the penetration; they are indi-cated in the drawing of cortex to the right of thefigure. In the centre of the figure the position ofeach receptive field is shown relative to the area
centralis (marked with a cross); each field was sev-eral degrees below and to the left of the area cen-tralis. It will be seen that all fields in the sequenceexcept the last had the same axis orientation; thefirst eleven cells therefore occupied the same col-umn. All but the first three and the last (cell 12)were simple in arrangement. Cells 5 and 6 wererecorded together, as were 8 and 9.
In the left-hand part of the figure the approx-imate boundaries of all these receptive fields areshown superimposed, in order to indicate thedegree of overlap. From cell to cell there is no obvi-ous systematic change in receptive-field position.The variation in position is about equal to the areaoccupied by the largest fields of the sequence. Thisvariation is undoubtedly real, and not an artifactproduced by eye movements occurring betweenrecordings of successive cells. The stability of theeyes was checked while studying each cell, and anytendency to eye movements would have easily beendetected by an apparent movement of the receptivefield under observation. Furthermore, the fieldpositions of simultaneously recorded cells 5 and 6,and also of cells 8 and 9, are clearly different; herethe question of eye movements is not pertinent.
Text-figure 15 illustrates a consistent andsomewhat surprising finding, that within a columndefined by common field-axis orientation therewas no apparent progression in field positionsalong the retina as the electrode advanced. Thiswas so even though the electrode often crossedthrough the column obliquely, entering one sideand leaving the other. If there was any detailed top-ographical representation within columns it wasobscured by the superimposed, apparently randomstaggering of field positions. We conclude that atthis microscopic level the retinotopic representa-tion no longer strictly holds.
Receptive-Field Organization
MULTIPLE RECORDINGS. The receptive fields of cellsobserved together in multiple recordings werealways of similar complexity, i.e. they were eitherall simple or all complex in their organization. Inabout one third of the multiple recordings the cellshad the same detailed field organization; if simple,they had similar distributions of excitatory andinhibitory areas; if complex, they required identicalstimuli for their activation. As a rule these fields

Cat Striate Cortex 125
Fig. 15. Reconstruction of part of an electrode tracf{ through apical and mesial segments of post-lateral gyrusnear its anterior end. Two lesions were made, the first after recording from the first unit, the second at the end ofthe penetration. Only the first twelve cells are represented. Interrupted lines show boundaries of layer 4.
In the centre part of the figure the position of each receptive field, outlined with interrupted lines, is givenwith respect to the area centralis, shown by a cross. Cells are numbered in sequence, 1-12. Numbers in paren-theses refer to ocular-dominance group (see Part II). Units 5 and 6, 8 and 9 were observed simultaneously. Thefirst three fields and the last were complex in organization; the remainder were simple. X, areas giving excita-tion; A, areas giving inhibitory effects. Note that all receptive fields except the last have the same axis orienta-tion (9.30-3.30 o'cloc^). The arrows show the preferred direction of movement of a slit oriented parallel to thereceptive-field axis.
In the left part of the figure all of the receptive fields are superimposed, to indicate the overlap and varia-tion in size. The vertical and horizontal lines represent meridia, crossing at the area centralis. Scale on horizon-tal meridian, I" for each subdivision.
did not have exactly the same retinal position, butwere staggered as described above. In two thirds ofthe multiple recordings the cells differed to varyingdegrees in their receptive field arrangements. Twotypes of multiple recordings in which field ar-rangements differed seem interesting enough tomerit a separate description.
In several multiple recordings the receptivefields overlapped in such a way that one or moreexcitatory or inhibitory portions were superim-posed. Two examples are supplied by cell-pairs 5and 6, and 8 and 9 of Text-fig. 15. Their fields areredrawn in Text-fig. 16. The fields of cells 5 and 6are drawn separately (Text-fig. 16/1) but they actu-ally overlapped so that the reference lines are to be
imagined as superimposed. Thus the 'on' centre ofcell 6 fell directly over the upper 'on' flank of 5 andthe two cells tended to fire together to suitablyplaced stimuli. A similar situation existed for cells8 and 9 (Text-fig. 16 B). The field of 9 was placed sothat its 'off region and the lower, weaker 'on'region were superimposed on the two regions of 8.Again the two cells tended to fire together. Suchexamples suggest that neighbouring cells may havesome of their inputs in common.
Cells responded reciprocally to a light stimu-lus in eight of the forty-three multiple recordings.An example of two cells responding reciprocally tostationary spots is shown in Text-fig. 17. In each eyethe two receptive fields were almost superimposed.

126 PART III NORMAL PHYSIOLOGY AND ANATOMY
Fig. 16. Detailed arrangements of the receptive fields of two pairs of simultaneously recorded cells (nos. 5 and 6,and 8 and 9, of Text-fig. 15). The crosses of diagrams 5 and 6 are superimposed as are the double crosses of 8 and9. Note that the upper excitatory region of 5 is superimposed upon the excitatory region of 6; and that bothregions of 8 are superimposed on the inhibitory and lower excitatory regions of 9. Scale, 1".
The fields consisted of elongated obliquely orientedcentral regions, inhibitory for one cell, excitatoryfor the other, flanked on either side by regions of theopposite type. Instead of firing together in responseto an optimally oriented stationary slit, like the cellsin Text-fig. 16, these cells gave opposite-typeresponses, one inhibitory and the other excitatory.Some cell pairs responded reciprocally to to-and-fro movements of a slit or edge. Examples have beengiven elsewhere (Hubel, 1958, Fig. 9; 1959, Text-fig.6). The fields of these cell pairs usually differed onlyin the balance of the asymmetrical flanking regions.
RELATIONSHIP BETWEEN RECEPTIVE FIELD ORGANI-ZATION AND CORTICAL LAYERING. In a typical pene-
tration through the cortex many different fieldtypes were found, some simple and others com-plex. Even within a single column both simple andcomplex fields were seen. (In Text-fig. 13 and 14complex fields are indicated by the symbol 'Cx'; inText-fig. 15, fields 1-3 were complex and 4-11 sim-ple, all within a single column.) An attempt wasmade to learn whether there was any relationshipbetween the different field types and the layers ofthe cortex. This was difficult for several reasons. InNissl-stained sections the boundaries between lay-ers of the cat's striate cortex are not nearly as clearas they are in the primate brain; frequently eventhe fourth layer, so characteristic of the striate cor-tex, is poorly demarcated. Consequently, a layer
Fig. 17. Records of two simultaneously observed cells which responded reciprocally to stationary stimuli. Thetwo receptive fields are shown to the right, and are superimposed, though they are drawn separately. The cell cor-responding to each field is indicated by the spikes to the right of the diagram. To the left of each record is shownthe position of a slit, 1/4~x2'/f, with respect to these fields.
Both cells binocularly driven (dominance group 3); fields mapped in the left (contralateral) eye; positionof fields 2° below and to the left of the area centralis. Time, 1 sec.

Cat Striate Cortex 127
could not always be identified with certainty evenfor a cell whose position was directly marked by alesion. For most cells the positions were arrived atindirectly, from depth readings and lesions madeelsewhere in the penetrations: these determina-tions were subject to more errors than the directones. Moreover, few of the penetrations were madein a direction parallel to the layering, so that thedistance an electrode travelled in passing through alayer was short, and the error in electrode positioncorrespondingly more important.
The distribution of 179 cells among the dif-ferent layers is given in the histograms of Text-fig.18. All cells were recorded in penetrations in whichat least one lesion was made; the shaded portionsrefer to cells which were individually marked withlesions. As shown in the separate histograms,simple-field cells as well as those with complexfields were widely distributed throughout the cor-tex. Cells with simple fields were most numerousin layers 3, 4 and 6. Especially interesting is theapparent rarity of complex fields in layer 4, wheresimple fields were so abundant. This is also illus-trated in Text-fig. 15, which shows a sequence ofeight cells recorded from layer 4, all of which hadsimple fields. These findings suggest that cells mayto some extent be segregated according to fieldcomplexity, and the rarity with which simple andcomplex fields were mapped together is consistentwith this possibility.
Ocular DominanceIn thirty-four multiple recordings the eye-domi-nance group (see Part II) was determined for bothor all three cells. In eleven of these recordings therewas a clear difference in ocular dominance be-tween cells. Similarly, in a single penetration twocells recorded in sequence frequently differed ineye dominance. Cells from several different eye-dominance categories appeared not only in singlepenetrations, but also in sequences in which allcells had a common axis orientation. Thus within asingle column defined by a common axis orienta-tion there were cells of different eye dominance. Asequence of cells within one column is formed bycells 1-11 of Text-fig. 15. Here eye dominanceranged from wholly contralateral (group 1) tostrongly ipsilateral (group 6). The two simultane-ously recorded cells 5 and 6 were dominated byopposite eyes.
Fig. 18. Distribution of 179 cells, 113 with simple fields, 66with complex, among the different cortical layers. All cellswere recorded in penetrations in which at least one elec-trolytic lesion was made and identified] the shaded areas referto cells marked individually by lesions. Note especially themarked difference in the occurrence, in layer 4, between sim-ple and complex fields.
While these results suggested that cells of dif-ferent ocular dominance were present within sin-gle columns, there were nevertheless indications ofsome grouping. First, in twenty-three of the thirty-four multiple recordings, simultaneously observedcells fell into the same ocular-dominance group.Secondly, in many penetrations short sequences ofcells having the same relative eye dominance wereprobably more common than would be expectedfrom a random scattering. Several short sequencesare shown in Text-fig. 13 and 14. When suchsequences consisted of cells with extreme unilateraldominance (dominance groups 1, 2, 6, and 7) theundifferentiated background activity was usuallyalso driven predominantly by one eye, suggesting

128 PART III NORMAL PHYSIOLOGY AND ANATOMY
that other neighbouring units had similar eye pref-erence. If cells of common eye dominance are infact regionally grouped, the groups would seem tobe relatively small. The cells could be arranged innests, or conceivably in very narrow columns orthin layers.
In summary, cells within a column defined bya common field-axis orientation do not necessarilyall have the same ocular dominance; yet neither docells seem to be scattered at random through thecortex with respect to this characteristic.
DISCUSSION
A Scheme for the Elaboration of Simpleand Complex Receptive FieldsComparison of responses of cells in the lateralgeniculate body with responses from striate cortexbrings out profound differences in the receptive-field organization of cells in the two structures. Forcortical cells, specifically oriented lines and borderstend to replace circular spots as the optimum stim-uli, movement becomes an important parameter ofstimulation, diffuse light becomes virtually ineffec-tive, and with adequate stimuli most cells can bedriven from the two eyes. Since lateral geniculatecells supply the main, and possibly the only, visualinput to the striate cortex, these differences must bethe result of integrative mechanisms within thestriate cortex itself.
At present we have no direct evidence on howthe cortex transforms the incoming visual informa-tion. Ideally, one should determine the propertiesof a cortical cell, and then examine one by one thereceptive fields of all the afferents projecting uponthat cell. In the lateral geniculate, where one can, ineffect, record simultaneously from a cell and one ofits afferents, a beginning has already been made inthis direction (Hubel & Wiesel, 1961). In a structureas complex as the cortex the techniques availablewould seem hopelessly inadequate for such anapproach. Here we must rely on less direct evi-dence to suggest possible mechanisms for explain-ing the transformations that we find.
The relative lack of complexity of simple cor-tical receptive fields suggests that these representthe first or at least a very early stage in the modifi-cation of geniculate signals. At any rate we havefound no cells with receptive fields intermediate in
type between geniculate and simple cortical fields.To account for the spatial arrangements of excita-tory and inhibitory regions of simple cortical fieldswe may imagine that upon each simple-type cellthere converge fibres of geniculate origin having'on' or 'off centres situated in the appropriate reti-nal regions. For example, a cortical cell with areceptive field of the type shown in Text-fig. 2Cmight receive projections from a group of lateralgeniculate cells having 'on' field centres distributedthroughout the long narrow central region desig-nated in the figure by crosses. Such a projection sys-tem is shown in the diagram of Text-fig. 19. A slitof light falling on this elongated central regionwould activate all the geniculate cells, since foreach cell the centre effect would strongly outweighthe inhibition from the segments of field peripheryfalling within the elongated region. This is thesame as saying that a geniculate cell will respond toa slit with a width equal to the diameter of its fieldcentre, a fact that we have repeatedly verified. Theinhibitory flanks of the cortical field would beformed by the remaining outlying parts of thegeniculate-field peripheries. These flanks might bereinforced and enlarged by appropriately placed'off-centre geniculate cells. Such an increase in thepotency of the flanks would appear necessary toexplain the relative indifference of cortical cells todiffuse light.
The arrangement suggested by Text-fig. 19would be consistent with our impression thatwidths of cortical receptive-field centres (or flanks,in a field such as that of Text-fig. 2F) are of thesame order of magnitude as the diameters of genic-ulate receptive-field centres, at least for fields in ornear the area centralis. Hence the fineness of dis-crimination implied by the small size of geniculatereceptive-field centres is not necessarily lost at thecortical level, despite the relatively large total sizeof many cortical fields; rather, it is incorporatedinto the detailed substructure of the cortical fields.
In a similar way, the simple fields of Text-fig.2 D—G may be constructed by supposing that theafferent 'on'- or 'off-centre geniculate cells havetheir field centres appropriately placed. For exam-ple, field-type G could be formed by having genic-ulate afferents with 'off centres situated in theregion below and to the right of the boundary, and'on' centres above and to the left. An asymmetry offlanking regions, as in field E, would be produced

Cat Striate Cortex 129
if the two flanks were unequally reinforced by 'on'-centre afferents.
The model of Text-fig. 19 is based on excita-tory synapses. Here the suppression of firing on illu-minating an inhibitory part of the receptive field ispresumed to be the result of withdrawal of tonicexcitation, i.e. the inhibition takes place at a lowerlevel. That such mechanisms occur in the visual sys-tem is clear from studies of the lateral geniculatebody, where an 'off-centre cell is suppressed onilluminating its field centre because of suppressionof firing in its main excitatory afferent (Hubel &Wiesel, 1961). In the proposed scheme one should,however, consider the possibility of direct inhibi-tory connexions. In Text-fig. 19 we may replace anyof the excitatory endings by inhibitory ones, pro-vided we replace the corresponding geniculate cellsby ones of opposite type ('on'-centre instead of'off -centre, and conversely). Up to the present the twomechanisms have not been distinguished, but thereis no reason to think that both do not occur.
The properties of complex fields are not easilyaccounted for by supposing that these cells receiveafferents directly from the lateral geniculate body.Rather, the correspondence between simple andcomplex fields noted in Part I suggests that cellswith complex fields are of higher order, havingcells with simple fields as their afferents. Thesesimple fields would all have identical axis orienta-tion, but would differ from one another in theirexact retinal positions. An example of such ascheme is given in Text-fig. 20. The hypotheticalcell illustrated has a complex field like that of Text-figs. 5 and 6. One may imagine that it receives
afferents from a set of simple cortical cells withfields of type G, Text-fig. 2, all with vertical axisorientation, and staggered along a horizontal line.An edge of light would activate one or more ofthese simple cells wherever it fell within the com-plex field, and this would tend to excite the higher-order cell.
Similar schemes may be proposed to explainthe behaviour of other complex units. One needonly use the corresponding simple fields as build-ing blocks, staggering them over an appropriatelywide region. A cell with the properties shown inText-fig. 3 would require two types of horizontallyoriented simple fields, having 'off centres abovethe horizontal line, and 'on' centres below it. A slitof the same width as these centre regions wouldstrongly activate only those cells whose long nar-row centres it covered. It is true that at the sametime a number of other cells would have smallparts of their peripheral fields stimulated, but wemay perhaps assume that these opposing effectswould be relatively weak. For orientations otherthan horizontal a slit would have little or no effecton the simple cells, and would therefore not acti-vate the complex one. Small spots should give onlyfeeble 'on' responses regardless of where they wereshone in the field. Enlarging the spots would notproduce summation of the responses unless theenlargement were in a horizontal direction; any-thing else would result in invasion of opposingparts of the antecedent fields, and cancellation ofthe responses from the corresponding cells. Themodel would therefore seem to account for manyof the observed properties of complex fields.
Fig. 19. Possible scheme for explain-ing the organization of simple recep-tive fields. A large number of lateralgeniculate cells, of which four areillustrated in the upper right in the
figure, have receptive fields with 'on
centres arranged along a straight line
on the retina. All of these project
upon a single cortical cell, and thesynapses are supposed to be excita-tory. The receptive field of the corti-cal cell will then have an elongated
'on' centre indicated by the inter-rupted lines in the receptive-field dia-gram to the left of the figure.

130 PART HI NORMAL PHYSIOLOGY AND ANATOMY
Fig. 20. Possible scheme for explain-ing the organization of complexreceptive fields. A number of cellswith simple fields, of which three areshown schematically, are imagined toproject to a single cortical cell ofhigher order. Each projecting neu-rone has a receptive field arranged asshown to the left: an excitatory regionto the left and an inhibitory region tothe right of a vertical straight-lineboundary. The boundaries of thefields are staggered within an areaoutlined by the interrupted lines. Anyvertical-edge stimulus falling acrossthis rectangle, regardless of its posi-tion, will excite some simple-fieldcells leading to excitation of thehigher-order cell.
Proposals such as those of Text-figs. 19 and 20are obviously tentative and should not be inter-preted literally. It does, at least, seem probable thatsimple receptive fields represent an early stage incortical integration, and the complex ones a laterstage. Regardless of the details of the process, it isalso likely that a complex field is built up fromsimpler ones with common axis orientations.
At first sight it would seem necessary to imag-ine a highly intricate tangle of interconnexions inorder to link cells with common axis orientationswhile keeping those with different orientationsfunctionally separated. But if we turn to the resultsof Part III on functional cytoarchitecture we see atonce that gathered together in discrete columns arethe very cells we require to be interconnected inour scheme. The cells of each aggregate have com-mon axis orientations and the staggering in thepositions of the simple fields is roughly what isrequired to account for the size of most of the com-plex fields (cf. Text-fig. 9). That these cells areinterconnected is moreover very likely on histolog-ical grounds: indeed, the particular richness ofradial connexions in the cortex fits well with thecolumnar shape of the regions.
The otherwise puzzling aggregation of cellswith common axis orientation now takes on newmeaning. We may tentatively look upon each col-umn as a functional unit of cortex, within whichsimple fields are elaborated and then in turn syn-
thesized into complex fields. The large variety ofsimple and complex fields to be found in a singlecolumn (Text-fig. 15) suggests that the connexionsbetween cells in a column are highly specific.
We may now begin to appreciate the signifi-cance of the great increase in the number of cells inthe striate cortex, compared with the lateral genic-ulate body. In the cortex there is an enormousdigestion of information, with each small region ofvisual field represented over and over again in col-umn after column, first for one receptive-field ori-entation and then for another. Each column con-tains thousands of cells, some cells having simplefields and others complex. In the part of the cortexreceiving projections from the area centralis thereceptive fields are smaller, and presumably morecolumns are required for unit area of retina; hencein central retinal regions the cortical projection isdisproportionately large.
Complex Receptive FieldsThe method of stimulating the retina with smallcircular spots of light and recording from singlevisual cells has been a useful one in studies of thecat's visual system. In the pathway from retina tocortex the excitatory and inhibitory areas mappedout by this means have been sufficient to accountfor responses to both stationary and moving pat-terns. Only when one reaches cortical cells withcomplex fields does the method fail, for these fields
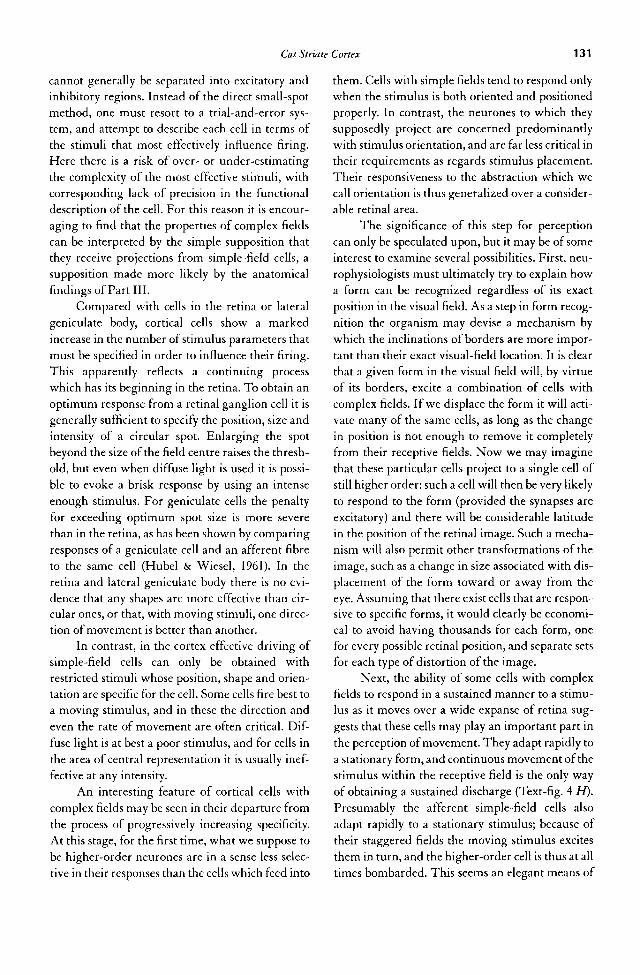
Cat Striate Cortex 131
cannot generally be separated into excitatory andinhibitory regions. Instead of the direct small-spotmethod, one must resort to a trial-and-error sys-tem, and attempt to describe each cell in terms ofthe stimuli that most effectively influence firing.Here there is a risk of over- or under-estimatingthe complexity of the most effective stimuli, withcorresponding lack of precision in the functionaldescription of the cell. For this reason it is encour-aging to find that the properties of complex fieldscan be interpreted by the simple supposition thatthey receive projections from simple-field cells, asupposition made more likely by the anatomicalfindings of Part III.
Compared with cells in the retina or lateralgeniculate body, cortical cells show a markedincrease in the number of stimulus parameters thatmust be specified in order to influence their firing.This apparently reflects a continuing processwhich has its beginning in the retina. To obtain anoptimum response from a retinal ganglion cell it isgenerally sufficient to specify the position, size andintensity of a circular spot. Enlarging the spotbeyond the size of the field centre raises the thresh-old, but even when diffuse light is used it is possi-ble to evoke a brisk response by using an intenseenough stimulus. For geniculate cells the penaltyfor exceeding optimum spot size is more severethan in the retina, as has been shown by comparingresponses of a geniculate cell and an afferent fibreto the same cell (Hubel & Wiesel, 1961). In theretina and lateral geniculate body there is no evi-dence that any shapes are more effective than cir-cular ones, or that, with moving stimuli, one direc-tion of movement is better than another.
In contrast, in the cortex effective driving ofsimple-field cells can only be obtained withrestricted stimuli whose position, shape and orien-tation are specific for the cell. Some cells fire best toa moving stimulus, and in these the direction andeven the rate of movement are often critical. Dif-fuse light is at best a poor stimulus, and for cells inthe area of central representation it is usually inef-fective at any intensity.
An interesting feature of cortical cells withcomplex fields may be seen in their departure fromthe process of progressively increasing specificity.At this stage, for the first time, what we suppose tobe higher-order neurones are in a sense less selec-tive in their responses than the cells which feed into
them. Cells with simple fields tend to respond onlywhen the stimulus is both oriented and positionedproperly. In contrast, the neurones to which theysupposedly project are concerned predominantlywith stimulus orientation, and are far less critical intheir requirements as regards stimulus placement.Their responsiveness to the abstraction which wecall orientation is thus generalized over a consider-able retinal area.
The significance of this step for perceptioncan only be speculated upon, but it may be of someinterest to examine several possibilities. First, neu-rophysiologists must ultimately try to explain howa form can be recognized regardless of its exactposition in the visual field. As a step in form recog-nition the organism may devise a mechanism bywhich the inclinations of borders are more impor-tant than their exact visual-field location. It is clearthat a given form in the visual field will, by virtueof its borders, excite a combination of cells withcomplex fields. If we displace the form it will acti-vate many of the same cells, as long as the changein position is not enough to remove it completelyfrom their receptive fields. Now we may imaginethat these particular cells project to a single cell ofstill higher order: such a cell will then be very likelyto respond to the form (provided the synapses areexcitatory) and there will be considerable latitudein the position of the retinal image. Such a mecha-nism will also permit other transformations of theimage, such as a change in size associated with dis-placement of the form toward or away from theeye. Assuming that there exist cells that are respon-sive to specific forms, it would clearly be economi-cal to avoid having thousands for each form, onefor every possible retinal position, and separate setsfor each type of distortion of the image.
Next, the ability of some cells with complexfields to respond in a sustained manner to a stimu-lus as it moves over a wide expanse of retina sug-gests that these cells may play an important part inthe perception of movement. They adapt rapidly toa stationary form, and continuous movement of thestimulus within the receptive field is the only wayof obtaining a sustained discharge (Text-fig. 4 H).Presumably the afferent simple-field cells alsoadapt rapidly to a stationary stimulus; because oftheir staggered fields the moving stimulus excitesthem in turn, and the higher-order cell is thus at alltimes bombarded. This seems an elegant means of

132 PART III NORMAL PHYSIOLOGY AND ANATOMY
overcoming a difficulty inherent in the problem ofmovement perception, that movement must excitereceptors not continuously but in sequence.
Finally, the above remarks apply equally wellto displacements of retinal images caused by smalleye movements. The normal eye is not stationary,but is subject to several types of fine movements.There is psychophysical evidence that in man thesemay play an important part in vision, transforminga steady stimulus produced by a stationary objectinto an intermittent one, so overcoming adaptationin visual cells (Ditchburn & Ginsborg, 1952; Riggs,Ratliff, Cornsweet & Cornsweet, 1953). At an earlystage in the visual pathway the effect of such move-ments would be to excite many cells repeatedly andin turn, rather than just a few continuously. Agiven line or border would move back and forthover a small retinal region; in the cortex this wouldsequentially activate many cells with simple fields.Since large rotatory movements are not involved,these fields would have the same axis orientationsbut would differ only in their exact retinal posi-tions. They would converge on higher-order cellswith complex fields, and these would tend to beactivated continuously rather than intermittently.
Functional CytoarchitectureThere is an interesting parallel between the func-tional subdivisions of the cortex described in thepresent paper, and those found in somatosensorycortex by Mountcastle (1957) in the cat, and byPowell & Mountcastle (1959) in the monkey. Here,as in the visual area, one can subdivide the cortexon the basis of responses to natural stimuli intoregions which are roughly columnar in shape, andextend from surface to white matter. This is espe-cially noteworthy since the visual and somatic areasare the only cortical regions so far studied at thesingle-cell level from the standpoint of functionalarchitecture. In both areas the columnar organiza-tion is superimposed upon the well known systemsof topographic representation—of the body sur-face in the one case, and the visual fields in theother. In the somatosensory cortex the columns aredetermined by the sensory submodality to whichthe cells of a column respond: in one type of col-umn the cells are affected either by light touch orby bending of hairs, whereas in the other the cellsrespond to stimulation of deep fascia or manipula-tion of joints.
Several differences between the two systemswill at once be apparent. In the visual cortex thecolumns are determined by the criterion of recep-tive-field axis orientation. Presumably there are asmany types of column as there are recognizabledifferences in orientation. At present one can besure that there are at least ten or twelve, but thenumber may be very large, since it is possible thatno two columns represent precisely the same axisorientation. (A subdivision of cells or of columnsinto twelve groups according to angle of orienta-tion shows that there is no clear prevalence of onegroup over any of the others.) In the somatosensorycortex, on the other hand, there are only two rec-ognized types of column.
A second major difference between the twosystems lies in the very nature of the criteria usedfor the subdivisions. The somatosensory cortex isdivided by submodality, a characteristic dependingon the incoming sensory fibres, and not on anytransformations made by the cortex on the afferentimpulses. Indeed we have as yet little informationon what integrative processes do take place in thesomatosensory cortex. In the visual cortex there isno modality difference between the input to onecolumn and that to the next, but it is in the connex-ions between afferents and cortical cells, or in theinterconnexions between cortical cells, that the dif-ferences must exist.
Ultimately, however, the two regions of thecortex may not prove so dissimilar. Further infor-mation on the functional role of the somatic cortexmay conceivably bring to light a second system ofcolumns, superimposed on the present one. Simi-larly, in the visual system future work may discloseother subdivisions cutting across those described inthis paper, and based on other criteria. For the pres-ent it would seem unwise to look upon the columnsin the visual cortex as entirely autonomous func-tional units. While the variation in field size fromcell to cell within a column is generally of the sortsuggested in Text-figs. 9 and 15, the presence of anoccasional cell with a very large complex field (up toabout 20°) makes one wonder whether columnswith similar receptive-field orientations may notpossess some interconnexions.
Binocular InteractionThe presence in the striate cortex of cells influ-enced from both eyes has already been observed by

Cat Striate Cortex 133
several authors (Hubel & Wiesel, 1959; Cornehls &Griisser, 1959; Burns, Heron & Grafstein, 1960),and is confirmed in Part II of this paper. Ourresults suggest that the convergence of influencesfrom the two eyes is extensive, since binoculareffects could be demonstrated in 84% of our cells,and since the two eyes were equally, or almostequally, effective in 70% (groups 3—5). This repre-sents a much greater degree of interaction than wassuggested by our original work, or by Griisser andGriisser-Cornehls (see Jung, 1960), who found thatonly 30% of their cells were binocularly influenced.
For each of our cells comparison of receptivefields mapped in the two eyes showed that, exceptfor a difference in strength of responses related toeye dominance, the fields were in every way similar.They were similarly organized, had the same axisorientation, and occupied corresponding regions inthe two retinas. The responses to stimuli applied tocorresponding parts of the two receptive fieldsshowed summation. This should be important inbinocular vision, for it means that when the twoimages produced by an object fall on correspondingparts of the two retinas, their separate effects on acortical cell should sum. Failure of the images to fallon corresponding regions, which might happen ifan object were closer than the point of fixation orfurther away, would tend to reduce the summation;it could even lead to mutual antagonism if excita-tory parts of one field were stimulated at the sametime as inhibitory parts of the other. It should beemphasized that for all simple fields and for manycomplex ones the two eyes may work either syner-gistically or in opposition, depending on how thereceptive fields are stimulated; when identical stim-uli are shone on corresponding parts of the two reti-nas their effects should always sum.
Although in the cortex the proportion ofbinocularly influenced cells is high, the mixing ofinfluences from the two eyes is far from complete.Not only are many single cells unequally influ-enced by the two eyes, but the relative eye domi-nance differs greatly from one cell to another. Thiscould simply reflect an intermediate stage in theprocess of mixing of influences from the two eyes;in that case we might expect an increasing unifor-mity in the eye preference of higher-order cells.But cells with complex fields do not appear to dif-fer, in their distribution among the different eye-dominance groups, from the general population of
cortical cells (Text-fig. 12). At present we have noclear notion of the physiological significance of thisincomplete mixing of influences from the two eyes.One possible hint lies in the fact that by binocularparallax alone (even with a stimulus too brief toallow changes in the convergence of the eyes) onecan tell which of two objects is the closer (Dove,1841; von Recklinghausen, 1861). This wouldclearly be impossible if the two retinas were con-nected to the brain in identical fashion, for then theeyes (or the two pictures of a stereo-pair) could beinterchanged without substituting near points forfar ones and vice versa.
Comparison of Receptive Fields in theFrog and the CatUnits in many respects similar to striate corticalcells with complex fields have recently been iso-lated from the intact optic nerve and the optic tec-turn of the frog (Lettvin, Maturana, McCulloch &Pitts, 1959; Maturana, Lettvin, McCulloch & Pitts,1960). There is indirect evidence to suggest that theunits are the non-myelinated axons or axon termi-nals of retinal ganglion cells, rather than tectal cellsor efferent optic nerve fibres. In common withcomplex cortical cells, these units respond toobjects and shadows in the visual field in ways thatcould not have been predicted from responses tosmall spots of light. They thus have 'complex'properties,in the sense that we have used this term.Yet in their detailed behaviour they differ greatlyfrom any cells yet studied in the cat, at any levelfrom retina to cortex. We have not, for example,seen 'erasible' responses or found 'convex edgedetectors'. On the other hand, it seems that somecells in the frog have asymmetrical responses tomovement and some have what we have termed a'receptive-field axis'.
Assuming that the units described in the frogare fibres from retinal ganglion cells, one may askwhether similar fibres exist in the cat, but havebeen missed because of their small size. We lackexact information on the fibre spectrum of the cat'soptic nerve; the composite action potential suggeststhat non-myelinated fibres are present, though insmaller numbers than in the frog (Bishop, 1933;Bishop & O'Leary, 1940). If their fields are differentfrom the well known concentric type, they musthave little part to play in the geniculo-cortical path-way, since geniculate cells all appear to have con-

134 PART III NORMAL PHYSIOLOGY AND ANATOMY
centric-type fields (Hubel & Wiesel, 1961). Theprincipal cells of the lateral geniculate body (thosethat send their axons to the striate cortex) are offairly uniform size, and it seems unlikely that alarge group would have gone undetected. Thesmallest fibres in the cat's optic nerve probablyproject to the tectum or the pretectal region; inview of the work in the frog, it will be interestingto examine their receptive fields.
At first glance it may seem astonishing thatthe complexity of third-order neurones in thefrog's visual system should be equalled only by thatof sixth-order neurones in the geniculo-corticalpathway of the cat. Yet this is less surprising if onenotes the great anatomical differences in the twoanimals, especially the lack, in the frog, of any cor-tex or dorsal lateral geniculate body. There isundoubtedly a parallel difference in the use eachanimal makes of its visual system: the frog's visualapparatus is presumably specialized to recognize alimited number of stereotyped patterns or situa-tions, compared with the high acuity and versatil-ity found in the cat. Probably it is not so unreason-able to find that in the cat the specialization of cellsfor complex operations is postponed to a higherlevel, and that when it does occur, it is carried outby a vast number of cells, and in great detail. Per-haps even more surprising, in view of what seem tobe profound physiological differences, is the super-ficial anatomical similarity of retinas in the cat andthe frog. It is possible that with Golgi methods acomparison of the connexions between cells in thetwo animals may help us in understanding thephysiology of both structures.
Receptive Fields of Cells in thePrimate CortexWe have been anxious to learn whether receptivefields of cells in the monkey's visual cortex haveproperties similar to those we have described in thecat. A few preliminary experiments on the spidermonkey have shown striking similarities. Forexample, both simple and complex fields have beenobserved in the striate area. Future work will verylikely show differences, since the striate cortex ofthe monkey is in several ways different morpho-logically from that of the cat. But the similaritiesalready seen suggest that the mechanisms we havedescribed may be relevant to many mammals, andin particular to man.
SUMMARY
1. The visual cortex was studied in anaesthetizedcats by recording extracellularly from singlecells. Light-adapted eyes were stimulated withspots of white light of various shapes, stationaryor moving.
2. Receptive fields of cells in the visual cortex var-ied widely in their organization. They tended tofall into two categories, termed 'simple' and'complex'.
3. There were several types of simple receptivefields, differing in the spatial distribution ofexcitatory and inhibitory ('on' and 'off') regions.Summation occurred within either type ofregion; when the two opposing regions wereilluminated together their effects tended to can-cel. There was generally little or no response tostimulation of the entire receptive field with dif-fuse light. The most effective stimulus configu-rations, dictated by the spatial arrangements ofexcitatory and inhibitory regions, were longnarrow rectangles of light (slits), straight-lineborders between areas of different brightness(edges), and dark rectangular bars against alight background. For maximum response theshape, position and orientation of these stimuliwere critical. The orientation of the receptive-field axis (i.e. that of the optimum stimulus) var-ied from cell to cell; it could be vertical, hori-zontal or oblique. No particular orientationseemed to predominate.
4. Receptive fields were termed complex when theresponse to light could not be predicted fromthe arrangements of excitatory and inhibitoryregions. Such regions could generally not bedemonstrated; when they could the laws ofsummation and mutual antagonism did notapply. The stimuli that were most effective inactivating cells with simple fields—slits, edges,and dark bars—were also the most effective forcells with complex fields. The orientation of astimulus for optimum response was critical, justas with simple fields. Complex fields, however,differed from simple fields in that a stimuluswas effective wherever it was placed in the field,provided that the orientation was appropriate.
5. Receptive fields in or near the area centralis var-ied in diameter from Vz—1° up to about 5—6°. Onthe average, complex fields were larger thansimple ones. In more peripheral parts of the

Cat Striate Cortex 135
Plate 1. Coronal section through post-lateral gyms. Composite photomicrograph of two of the sections used toreconstruct the micro-electrode tracf( of Text-fig. 13. The first part of the electrode tract( may be seen in the upperright; the electrolytic lesion at the end of the trac\ appears in the lower left. Scale 1 mm.
6.
retina the fields tended to be larger. Widths ofthe long narrow excitatory or inhibitory portionsof simple receptive fields were often roughlyequal to the diameter of the smallest geniculatereceptive-field centres in the area centralis. Forcells with complex fields responding to slits ordark bars the optimum stimulus width was alsousually of this order of magnitude.Four fifths of all cells were influenced inde-pendently by the two eyes. In a binocularlyinfluenced cell the two receptive fields had thesame organization and axis orientation, andwere situated in corresponding parts of the tworetinas. Summation was seen when correspon-
ding parts of the two retinas were stimulated inidentical fashion. The relative influence of thetwo eyes differed from cell to cell: for some cellsthe two eyes were about equal; in others one eye,the ipsilateral or contralateral, dominated.
7. Functional architecture was studied by (a) com-paring the responses of cells recorded insequence during micro-electrode penetrationsthrough the cortex, (b] observing the unresolvedbackground activity, and (r) comparing cellsrecorded simultaneously with a single electrode(multiple recordings). The retinas were foundto project upon the cortex in an orderly fashion,as described by previous authors. Most record-

Plate 2. A, coronal section through the anterior extremity of post-lateral gyrus. Composite photomicrographmade from four of the sections used to reconstruct the two electrode traces shown in Text-fig. 14. The first partof the two electrode traces may be seen crossing layer 1. The lesion at the end of the lateral tracf( (to the right inthe figure) is easily seen; that of the medial trac\ is smaller, and is shown at higher power in B. Scales: A, 1 mm,B, 0.25 mm.
136
A
B

Cat Striate Cortex 137
ings were made from the cortical region receiv-ing projections from the area of central vision.The cortex was found to be divisible into dis-crete columns; within each column the cells allhad the same receptive-field axis orientation.The columns appeared to extend from surfaceto white matter; cross-sectional diameters at thesurface were of the order of 0.5 mm. Within agiven column one found various types of simpleand complex fields; these were situated in thesame general retinal region, and usually over-lapped, although they differed slightly in theirexact retinal position. The relative influence ofthe two eyes was not necessarily the same for allcells in a column.
8. It is suggested that columns containing cells withcommon receptive-field axis orientations arefunctional units, in which cells with simple fieldsrepresent an early stage in organization, possiblyreceiving their afferents directly from lateralgeniculate cells, and cells with complex fields areof higher order, receiving projections from anumber of cells with simple fields within thesame column. Some possible implications ofthese findings for form perception are discussed.
We wish to thank Miss Jaye Robinson and Mrs Jane Chen fortheir technical assistance. We are also indebted to Miss Sally Foxand to Dr S. W. Kuffler for their helpful criticism of this man-uscript. The work was supported in part by Research GrantsB-2251 and B-2260 from United States Public Health Service,and in part by the United States Air Force through the AirForce Office of Scientific Research of the Air Research andDevelopment Command under contract No. AF 49 (638)-713.The work was done during the tenure of a U.S. Public HealthService Senior Research Fellowship No. SF 304-R by D.H.H.
References
Bishop, G. H. (1933). Fiber groups in the optic nerve. Amer. ].Physiol. 106,460-474.
Bishop, G. H. & O'Leary, J. S. (1940). Electrical activity of thelateral geniculate of cats following optic nerve stimuli. /.Neurophysiol. 3,308-322.
Bishop, P. O., Burke, W. & Davis, R. (1959). Activation of singlelateral geniculate cells by stimulation of either optic nerve.Science, 130, 506-507.
Burns, B. D., Heron, W. & Grafstein, B. (1960). Response ofcerebral cortex to diffuse monocular and binocular stimula-tion. Amer. ]. Physiol. 198,200-204.
Cornehls, U. & Grusser, O.-J. (1959). Ein elektronisch ge-steuertes Doppellichtreizgerat. Pfliig. Arch. ges. Physiol. 270,78-79.
Daniel, P. M. & Whitteridge, D. (1959). The representation ofthe visual field on the calcarine cortex in baboons and mon-keys. J. Physiol. 148, HP.
Ditchburn, R. W. & Ginsberg, B. L. (1952). Vision with stabi-lized retinal image. Nature, Land., 170,36-37.
Dove, H. W. (1841). Die Combination der Eindriicke beiderOhren und beider Augen zu einem Eindruck. Mber. preuss.Akad. 1841,251-252.
Erulkar, S. D. & Fillenz, M. (1958). Patterns of discharge of sin-gle units of the lateral geniculate body of the cat in responseto binocular stimulation. /. Physiol. 140, 6—IP.
Erulkar, S. D. & Fillenz, M. (1960). Single-unit activity in thelateral geniculate body of the cat./. Physiol. 154, 206-218.
Grusser, O.-J. & Sauer, G. (1960). Monoculare und binoculareLichtreizung einzelner Neurone im Geniculatum lateraleder Katze. Pfliig. Arch. ges. Physiol. 271, 595-612.
Hayhow, W. R. (1958). The cytoarchitecture of the lateral genic-ulate body in the cat in relation to the distribution of crossedand uncrossed optic fibers./, comp. Neural. 110,1—64.
Hubel, D. H. (1957). Tungsten microelectrode for recordingfrom single units. Science, 125, 549-550.
Hubel, D. H. (1958). Cortical unit responses to visual stimuli innonanesthetized cats. Amer. J. Ophthal. 46, 110-121.
Hubel, D. H. (1959). Single unit activity in striate cortex ofunrestrained cats./. Physiol. 147, 226-238.
Hubel, D. H. (1960). Single unit activity in lateral geniculatebody and optic tract of unrestrained cats. /. Physiol. 150,91-104.
Hubel, D. H. & Wiesel, T. N. (1959). Receptive fields of singleneurones in the cat's striate cortex./. Physiol. 148, 574—591.
Hubel, D. H. & Wiesel, T. N. (1960). Receptive fields of opticnerve fibres in the spider monkey./. Physiol. 154, 572-580.
Hubel, D. H. & Wiesel, T. N. (1961). Integrative action in thecat's lateral geniculate body./. Physiol. 155,385-398.
Jung, R. (1960). Microphysiologie corticaler Neurone: EinBeitrag zur ^Coordination der Hirnrinde und des visuellenSystems. Structure and Function of the Cerebral Cortex, ed.Tower, D. B. and Schade, J. P. Amsterdam: Elsevier Pub-lishing Company.
Kuffler, S. W. (1953). Discharge patterns and functional orga-nization of mammalian retina./. Neurophysiol. 16,37—68.
Lettvin, J. Y., Maturana, H. R., McCulloch, W. S. & Pitts, W. H.(1959). What the frog's eye tells the frog's brain. Proc. Inst.Radio Engrs, N.Y., 47,1940-1951.
Maturana, H. R., Lettvin, J. Y, McCulloch, W. S. & Pitts, W. H.(1960). Anatomy and physiology of vision in the frog (Ranapipiens}.J.gen. Physiol. 43, part 2, 129-176.
Minkowski, M. (1913). Experimentelle Untersuchungen iiberdie Beziehungen der Gross-hirnrinde und der Netzhaut zuden prima'ren optischen Zentren, besonders zum Corpusgeniculatum externum. Arb. hirnanat. Inst. Zurich, 7,259-362.
Mountcastle, V. B. (1957). Modality and topographic propertiesof single neurons of cat's somatic sensory cortex. /. Neuro-physiol. 20,408-434.
O'Leary, J. L. (1941). Structure of the area striata of the cat./.comp. Neurol. 75,131-164.
Polyak, S. (1957). The Vertebrate Visual System, ed. Kliiver, H.The University of Chicago Press.
Powell, T. P. S. & Mountcastle, V. B. (1959). Some aspects of thefunctional organization of the cortex of the postcentralgyrus of the monkey: a correlation of findings obtained in asingle unit analysis with cytoarchitecture. Johns Hopf(. Hosp.Bull. 105,133-162.
Riggs, L. A., Ratliff, F, Cornsweet, J. C. & Cornsweet, T. N.(1953). The disappearance of steadily fixated visual testobjects./, opt. Soc. Amer. 43,495-501.
Silva, P. S. (1956). Some anatomical and physiological aspectsof the lateral geniculate body. /. comp. Neurol. 106, 463-

138 PART III NORMAL PHYSIOLOGY AND ANATOMY
Talbot, S. A. (1942). A lateral localization in the cat's visual cor- Thompson, J. M., Woolsey, C. N. & Talbot, S. A. (1950). Visualtex. Fed. Proc. 1, 84. areas I and II of cerebral cortex of rabbit./. Neurophysiol. 13,
Talbot, S. A. & Marshall, W. H. (1941). Physiological studies on 277-288.neural mechanisms of visual localization and discrimina- von Recklinghausen, F. (1861). Zum korperlichen Sehen. Ann.tion. Amer. J. Ophthal. 24,1255-1263. Phys. Lpz. 114,170-173.
AFTERWORD
In the decade that followed this paper, we had few comments from otherneurophysiologists, perhaps partly because so few people were doing single-cell studies in the cortex. But slowly this changed: papers appeared that elab-orated, extended, and to an extent complicated what we had thought was afairly clean picture. Our main interlocutors in the beginning were PeterBishop and his colleagues, and the main problem was his redefining ourterms simple and complex on the basis of recordings made almost exclusivelywith moving stimuli. To qualify as a simple cell, by our definition, one hadto show a clear segregation of the receptive field into regions that respondedto stationary stimuli with excitation or inhibition (for example, with on or offresponses). One could not object to the use of moving stimuli, only to the ter-minological confusion. It was hard for us to be sure that Bishop's simple cellsdid not include cells we would have classed as complex. We did not writerebuttals, but over the years we simply continued to use the terms simple andcomplex in the way we originally defined them. Much of the same confusionarose again in subsequent work in macaque monkeys, though here the quar-rel (much too strong a word!) was with a different Peter (in this case,Schiller). In our opinion there was again the problem of using moving stim-uli in defining simple and complex cells. If those terms were to be used, itseemed to us important to show beyond doubt that they were being used torefer to same cell categories—or else invent new terms. (Some authors didinvent new terms, such as s for simple, but we thought that only perpetuatedthe confusion.)
In a book of his collected papers on audition, von Bekesy stresses theimportance and usefulness of enemies in keeping one honest, and he empha-sizes the distinction between good enemies and bad ones. Both Peters weregood enemies, of the highest quality, but in a field as complex as ours it wouldbe strange if there had been no differences. With time, this problem of defi-nition seems to have receded, and our original definitions of simple and com-plex cells seem to have prevailed. What is gratifying is the possibility of hav-ing scientific differences with one's contemporaries, and yet maintainingclose friendships and lively dialogues with them.
Charles Gilbert, one of our first graduate students, and later a close col-league of Torsten's at Harvard and then at the Rockefeller Institute, devotedhis graduate thesis to a close layer-by-layer examination of receptive fields ofcells in the cat striate cortex. Compared to his thorough study, our results inthis 1962 paper can only be regarded as "preliminary".

Cat Striate Cortex 139
We can perhaps be forgiven for missing the hypercomplex cells (latercalled end-stopped) in these our first ventures into the striate cortex. Wemissed them partly because they are less common in cat striate cortex, andprobably partly because we failed to try short slits when cells failed torespond to longer ones. Cells that are injured often show it by failing torespond to otherwise effective stimuli, so that an unresponsive cell can behard to assess. The story of our discovery of hypercomplex cells, first in catcortical area 19, then in cat visual 2, and finally by Charles Gilbert in striatecortex, will be told in the context of our long 1965 paper (Chapter 11).
Our proposals as to how simple cells are built up from center-surroundcells, and complex from simple (immortalized in Figs. 19 and 20) have beenthe subject of much debate in the ensuing decades, and numbers of alterna-tive circuits have been proposed. Our schemes were merely the simplest wecould think of, and neither of us would have been heartbroken had theyneeded radical amendment or been proven completely wrong. Our mainpoint was that the cells' behavior must surely be the product of some circuitinvolving excitation or inhibition, or both. The commonest proposed alter-native circuits have involved inhibition, perhaps because of a wistful hope(still largely unfulfilled) of finding a use for the inhibitory synapses said byneuroanatomists to be so prevalent in cortex.
One the first of these invokers of inhibition was Otto Creutzfeldt, inMunich and later Gottingen. He proposed that for a simple cortical cell withan excitatory center strip, the center should be determined by an excitatoryinput from a single incoming geniculate on-center cell, and the orientationselectivity be supplied by inhibitory inputs from other on-center geniculatecells, with fields cutting in at either side. We felt that this ingenious idea wasmade less likely by our observation that, for any given eccentricity, thewidths of the center strips of simple fields were about the same as the diam-eters of the centres of geniculate fields, and that the lengths of the strips weremany times greater. Another set of proposals, championed mainly by ColinBlakemore, was based in part on the psychophysical phenomenon known asthe tilt effect: that a set of parallel vertical lines is seen as tilted after prolongedviewing of parallel lines that are not quite vertical. Here the idea was that acell's orientation selectivity should be sharpened if it received inhibitory con-nections from other cells whose optimal orientations were slightly different.Against that, we felt, was our failure to see any marked differences in degreeof orientation selectivity between simple and complex cells. The possibilitythat preparing tuning curves of hundreds of simple and complex cells mightbring out such differences did not bother us, because we could hardly getexcited about an effect so feeble as to require statistics for its demonstration.
An inhibitory mechanism to explain orientation selectivity was felt bysome to be supported by the lessening or elimination of the selectivity byantagonists of inhibition such as bicuculline (Sillito, A. M. 1975,/ Physiol 250,305—329). We had for years observed that orientation selectivity can beimpaired by any form of injury, and suspected that the effects Sillito haddescribed were the result of nonspecific injury by the bicuculline.

140 PART III NORMAL PHYSIOLOGY AND ANATOMY
Meanwhile subsequent work has served to justify our original scheme,especially the work of Clay Reid (Reid and J. M. Alonso [1995] Nature,378:281-284) and David Ferster (Ferster, Chung & Wheat, 1996, Nature, 380,249-252). We are sure that the last word has not been said on this topic, butwe continue to be interested, if relaxed. In a Nature "News and Views" com-mentary on Ferster's paper (Nature, 1996; 380:197-198), I remarked that theevidence supporting our original scheme for the geniculate-to-simple cellprojection scheme had been 35 years in coming, and hoped that it wouldn'ttake until A.D. 2031 for the simple- to complex circuit to be vindicated ordisproved.

Chapter 11 • Recordings from Cat PrestriateAreas, 18 and 19 •
FOREWORD
This is one of our all-time longest papers, so long, indeed, that neither of ushad carefully reread it until writing the present book made that necessary.Our readers must have shared our enthusiasm, because we still have hun-dreds of reprints left over. It is probably more a monograph than a paper inthe usual sense, and shares with monographs its tiny readership. Its range iswide, encompassing topography, columnar architecture, physiological map-ping, conventional Nissl, myelin, and silver-degeneration (Nauta-method)histology, and receptive-field analysis. It contains the first description of end-stopped (hypercomplex) cells. It represents our first use of single-cell record-ings combined with electrolytic lesions and Nauta silver-degenerationanatomy, a combination we were to exploit further a few years later in exam-ining geniculo-cortical connexions in monkeys.
Had we split the paper into three or four shorter papers it might havehad more impact—or more readers.
Obviously our main purpose in this research was to continue the questthe two of us and Steve had outlined that morning at the Hopkins canteen,to learn what happens to visual information as one goes farther and fartheralong the visual path. The next place to look was visual 2, which had alreadybeen mapped retinotopically in the cat by Talbot, way back in 1942 (Fed Proc1:84)—not in 1941 by Talbot and Marshall, as our references suggest. Ourpaper was thus a followup of Talbot's work, all of 23 years later. Betweenthose dates the only study of visual area 2 was that of Thompson, Woolsey,and Talbot, in 1950, with a more thorough description of the topography inthe rabbit.
141

142 PART III NORMAL PHYSIOLOGY AND ANATOMY
Receptive Fields and Functional Architecture in Two NonstriateVisual Areas (18 and 19) of the Cat1
DAVID H. HUBEL AND TORSTEN N. WIESEL • Neurophysiology Laboratory, Department of Pharmacology,
Harvard Medical School, Boston, Massachusetts
To understand vision in physiological terms repre-sents a formidable problem for the biologist. Itamounts to learning how the nervous system han-dles incoming messages so that form, color, move-ment, and depth can be perceived and interpreted.One approach, perhaps the most direct, is to stim-ulate the retina with patterns of light while record-ing from single cells or fibers at various pointsalong the visual pathway. For each cell the opti-mum stimulus can be determined, and one cannote the characteristics common to cells at eachlevel in the visual pathway, and compare a givenlevel with the next.
From studies carried out in the cat it is clearthat visual messages undergo considerable modifi-cation, within the retina and the lateral geniculatebody, and especially within the striate cortex (16,12, 10, 13). Retinalganglion and geniculate cellsrespond optimally to an appropriately placed spotof light of just the right size; a smaller or larger spotis less effective. Cells at these levels therefore regis-ter not simply the illumination of a region on theretina, but also the difference in illuminationbetween a region and its surround. In the striatecortex cells are far more complex and diverse intheir response properties. The great majorityrespond best to straight-line stimuli: for a given cellthe optimum stimulus may be a white or dark line,or an edge separating light from dark. A line stim-ulus is effective only when shone in an orientationthat is characteristic for the cell; there is typicallyno response when the stimulus is shone at 90° to theoptimum orientation, and the range of orientationsover which a response is evoked may be 30° or evenless. Some cells prefer one inclination, othersanother, and we have no evidence that any one ori-
entation, such as vertical or horizontal, is morecommon than another. For some cells, termed"simple," the exact position of the stimulus is criti-cal: even a slight displacement of the line to a newposition, without changing its orientation, pro-duces a dramatic decrease in the response. Theseproperties of simple cells are dictated by thearrangement of excitatory and inhibitory regionsof the receptive field, as mapped with small-spotstimulation (10). The simplest assumption is thateach of the simple cortical cells receives its inputdirectly from a specific group of cells in the lateralgeniculate body (13, text-Fig. 19). Other cells,termed "complex," respond to an appropriatelyoriented stimulus regardless of where in the recep-tive field it is positioned. These cells behave asthough they received projections from a largenumber of simple cortical cells, all having the samereceptive-field arrangement and orientation, butdiffering in the exact retinal positions of thesefields (13, text-Fig. 20).
All of this suggests a highly specific and intri-cate set of cortical connections, first between theincoming geniculate axons and the simple corticalcells, and then between certain simple cells and cer-tain complex ones. Strong indirect support for thespecific connections between simple and complexcells comes from a study of cortical functionalarchitecture. From single long microelectrode pen-etrations and from multiple short penetrations itcan be shown that neighboring cells in the striatecortex usually have the same receptive-field orien-tation, and roughly the same receptive-field posi-tion. In fact, cells having the same receptive-fieldorientation are aggregated into regions of colum-nar shape extending from surface to white matter,
From/. Neurophysiol. (1965) 28,229-289
Received for publication August 24, 1964.
'This work was supported in part by Research Grants NB-02260-05 and NB-02253-06 from the National Institutes of Health, and in part by Research
Grant AF-AFOSR-62-76 from the U.S. Air Force.

Cat Prestriate Areas, 18 and 19 143
with walls perpendicular to the cortical layers (13,14). Such an arrangement means that the very cellsthat are supposed to be interconnected on physio-logical grounds—simple and complex cells withthe same receptive-field orientation, and a certainsmall variation in receptive-field position—are infact grouped together, and are therefore highlylikely to be interconnected also on anatomicalgrounds. This columnar system presumably makesfor great economy in length and number of inter-connections.
A given small region of retina is thus repre-sented in the striate cortex many times, first in acolumn representing one orientation, then in a col-umn representing another. For the entire visualfield such an analysis must require a very largenumber of columns, and an even greater numberof cells. One can now begin to understand the dra-matic increase in the number of cells as one goesfrom geniculate to striate cortex.
To pursue this work further it is obviouslynecessary to learn where the next steps in integra-tion occur. The efferent connections of the cat stri-ate cortex have not been worked out in any greatdetail, but a number of results in the cat and otherspecies suggest that there are multiple projections,both cortical and subcortical. We have begun bylooking at the cortex itself, first examining the cor-tical regions just lateral to the striate. These areashave long been suspected, on various grounds, ofbeing involved in vision. The strongest physiologi-cal evidence for this was presented in 1941 by Tal-bot and Marshall (27). Stimulating the retinas withsmall spots of light, and recording evoked poten-tials, they mapped out in each hemisphere of thecat cortex two orderly topographic projections ofthe contralateral half-field of vision. The moremedial of the two areas, which they termed "visualarea I," seems from their maps to correspondroughly to the anatomically defined striate cortex;the lateral area, termed "visual II," has not yet beencorrelated with cytoarchitecture.
In the present study we explored the cortexfrom medial to lateral in successive penetrations,crossing from visual I into Talbot and Marshall'svisual II, and then continuing into what has provedto be a third distinct topographically organizedvisual area lying lateral to the second. We havecalled this region "visual area III."
In analyzing visual II and III we have fol-lowed our usual procedure of describing cells in
terms of their responses to visual stimulation, at-tempting at the same time to build up a picture ofcortical architecture by comparing the behavior ofneighboring cells, and of cells recorded in sequence,in long penetrations. Our hope has been to learnhow the next stages of integration make use of theinput from cells of the striate cortex, and to find outwhether the columnar plan of architecture that ispresent in the primary visual area holds also forhigher areas. Finally, we have made a correlation ofthe three physiologically defined visual areas withthe histological variations of the cortex as seen onNissl- and myelin-stained sections, and have usedthe Nauta technique to establish that visual areas IIand III actually receive direct projections fromvisual I.
METHODS
Seventeen cats were used. Procedures for preparing theanimal, including anesthesia, immobilization of eyes,correction of refractive errors, and mapping of area cen-tralis and optic discs on the projection screen, have allbeen described elsewhere (10, 11, 13). The retinas werestimulated by shining spots or patterns of light from atungsten filament projector onto a wide movable tangentscreen at 1.5 m. distance. Recordings were made in thelight-adapted state. Background illumination was about1.0 cd/m2, and stimuli were 0.5-1.5 log units brighterthan the background. All recordings were made withtungsten microelectrodes (8). In nine experiments (11penetrations) a small hole was drilled in the skull overthe right hemisphere, the dura incised, and a 19-gaugehollow stainless steel needle cemented into the hole withits lumen close to the cortex, to form a closed chamber;the electrode was hydraulically introduced through theneedle. In each of the remaining eight experiments anumber of penetrations were made through a modifiedDavies chamber (4) which was cemented onto the skull(14); the brain was photographed through a dissectingmicroscope and an enlarged print was used to indicatethe points of entry of the electrode relative to corticalblood vessels. Forty-two penetrations were made inthese mapping experiments. At the end of each experi-ment the brain was perfused with saline followed byformol-saline, the calvarium removed, and the brainphotographed again. All brains were imbedded in cel-loidin, sectioned serially at 26 (I., and stained with cresylviolet (Nissl) or Loyez stain (myelin). In each penetrationone or several lesions were made by passing direct cur-rent through the electrode (about 5 (O.A. for 5 sec.). Thelesions were used to reconstruct electrode tracks (9, 13).Destructive lesions for silver-degeneration studies by theNauta method (22) were made in four cats with coarse

144 PART III NORMAL PHYSIOLOGY AND ANATOMY
electrodes (30—35 (I. from end of insulation to tip); cur-rents of the order of 10 |J,A. were passed for 10 sec. In twocats lesions were made by stabbing the cortex with a 25-gauge hypodermic needle.
RESULTS
Part I. Visual Areas I, II, and III:Physiological Mapping and Correlation with
Histology
Topographical Representation2
All of the 53 penetrations of the present experi-ments were made from the lateral, postlateral, andmiddle and posterior suprasylvian gyri, at levelsclose to the junction or region of overlap of the lat-eral and postlateral sulci (Horsley-Clarke coordi-nates P 4.0-A 4.0). Topographic mapping was thusconfined to regions of cortex in and lateral to thestriate representation of the area centralis and partsof the visual field a few degrees below it. We haveshown previously that in the course of a long pene-tration down the mesial (interhemispheric) seg-ment of the lateral or postlateral gyrus parallel tothe surface, the receptive fields of successivelyrecorded cells tend gradually to move out into thecontralateral half-field of vision (13: Text-fig. 13and p. 134). The visual I representation of the mid-line (the vertical meridian) is located deep in thelateral bank of the postlateral gyrus at posteriorlevels, while more anteriorly it appears on the sur-face of the lateral gyrus close to where the postlat-eral sulcus ends, and then crosses the gyrusobliquely from lateral to medial. This line formsthe lateral border of visual area I (compare theboundary between 17 and 18 in Fig. 37).
The cortical region lateral to visual I was firstexplored by making deep microelectrode penetra-tions along both walls of the postlateral sulcus. Inthe experiment illustrated in Fig. 1 the electrode tippassed obliquely along the entire medial wall of thesulcus, crossed the underlying white matter, andended in the upper bank of the splenial sulcus. Thepositions of the receptive fields in the contralateralvisual field are shown to the left of the figure. Eachdiagram shows one or several receptive fields inrelation to the center of gaze (the area centralis pro-jection), which is re-represented in each diagram
by the crossing of the short horizontal lines and thelong common vertical line. Fields of successive cellsare shown on the same diagram if their orienta-tions are the same, i.e., if they are located in thesame column (see below). At the outset the cellshad their receptive fields very close to the verticalmeridian. As the electrode advanced from one cellto the next there were slight, more or less randomfluctuations in field positions. Superimposed onthese fluctuations one could detect a gradual trendoutward, into the contralateral half-field of vision,so that deep in the postlateral sulcus the fields hadmoved out about 8—10°. In the white matter a fewgeniculate axons were recognized by their clus-tered firing pattern (9, 12), and by the concentriccenter-surround arrangement of their receptivefields; some of the fields were located near the cen-ter of gaze, others in the far periphery. Finally, fourcells recorded from suprasplenial striate cortex(i.e., from visual I) had their receptive fields 35—50°out in the contralateral visual field, close to the hor-izontal meridian.
In another experiment the postlateral sulcuswas explored in its lateral bank at a slightly moreposterior level (Fig. 2). The first cells had theirreceptive fields 15—20° out in the contralateral fieldof vision close to the horizontal meridian. As theelectrode advanced down the bank there was arapid inward drift in field position, so that halfwaydown the fields were about 5—10° from the centerof gaze. The electrode then crossed the sulcus tothe opposite bank; here the fields of six cells wereonly about 5° out, and there was little or nodetectable over-all drift as the full thickness of cor-tex was traversed, undoubtedly because this part ofthe penetration was almost perpendicular to thecortical layering. Several geniculate axons wererecorded from white matter: their fields (not illus-trated) were near the area centralis. Finally, a sin-gle cell recorded from the interhemispheric graymatter had its receptive field 17° out from themidline.
These two experiments suggest that as oneproceeds laterally along the cortex, starting at thelateral margin of the primary visual area, thereceptive fields of cells move out from the verticalmeridian into the contralateral half-field of vision.This, together with other experiments to be illus-
2Names of gyri and sulci used in this study are generally those of Winkler and Potter (31); they are illustrated in Fig. 37.

Fig. 1. Reconstruction of an electrode trac\ which passed down along the medial wall ofthe right postlateral sulcus. Tracing of a coronal section through the postlateral gyrus isshown near the center of the figure. To the upper right is a tracing of a photograph of thedorsal view of the brain (anterior is to the top of the figure); point of entry of electrode isindicated by a dot. Electrode entered cortex close to the 17-18 boundary (i.e., the visual I-visual II boundary); and a lesion was made at the point where the first cells were recorded(indicated by a circle). A second lesion was made at the end of the penetration, in the upperban\ of the splenial sulcus. Lines intersecting the electrode tract^ indicate single units; the
longer lines, cells; the shorter, axons. Orientations of receptive fields of cells are indicated bythe directions of these lines: a line perpendicular to trac\ represents a vertical orientation;a line-plus-dot perpendicular to tracf^ represents a horizontal orientation. To the left, theposition of each receptive field in the visual field is given with respect to the area centralis(center of gaze), which is indicated separately for every change of receptive-field orienta-tion, by the intersection of the long common vertical line (the vertical meridian) and theshort horizontal crossbars. Receptive-field orientations are shown by interrupted lines.

146 PART III NORMAL PHYSIOLOGY AND ANATOMY
Fig. 2. Reconstruction of an electrode tracf^ that passed down the lateral ban\ of the postlateral sulcus, thenthrough gray matter deep in the postlateral sulcus, and finally ended in area 17 (visual I) after crossing whitematter. Of five axons recorded from white matter, four were from geniculate cells, and one was from a complexcortical cell. For conventions see legend of Fig. 1. Note how receptive fields move in toward the vertical merid-ian as the electrode moves medially across the cortex of visual II.
trated below (Figs. 3, 29, 32), confirms the findingof Talbot and Marshall (27) that there is a topo-graphically organized second visual area lateral tothe primary one. Other characteristics of cells invisual II, such as field size and response properties,will be discussed below.
We were naturally interested in establishingthe lateral boundaries of visual II, and in learningwhat lay beyond that area. The first of eight map-ping experiments is illustrated in Fig. 3A A seriesof four microelectrode penetrations was made atthe level of the posterior end of the lateral gyrus,
Fig. 1. (continued)The field of the first cell, oriented at 2:00, was thus about 5° below the area centralis, near the vertical meridian. (For tech-nical reasons one cannot be sure that this field actually crossed into the ipsilateralfield.) The next three cells had overlappingfields oriented at 1:30, slightly to the left of the first field, and overlapping it. Note the gradual drift of receptive fields awayfrom the midline, so that the final ones recorded from area 18 lie almost 10° in the contralateral (left) visual field. All of thefields in 18 were complex. Geniculate axons in white matter, and cells in the suprasplenial gyrus, have fields whose positionsare indicated in the same way, to the right of the figure. For convenience, fields of cortical cells are shown as rectangles; theirprecise borders were not always determined, but the diagrams by their width and length show accurately the optimum stim-ulus length, and the distance over which the stimulus was effective.

Fig. 3. A: four mic roele ctrode penetrations through the right lateral gyrus near its posterior end. Points of entry
are shown in brain tracing (upper right) and in a photograph of the exposed brain surface made at the beginningof the experiment (upper left; width of photograph, 8 mm.). Penetrations I, II, and III are superficial; in each ofthese a lesion was made at the positions of the first units recorded, and the electrode was then removed. Note that
there was a progressive movement out into the contralateral visual field as the electrode moved laterally across
18. Penetration IV passed down along the lateral ban]^ of the lateral gyrus. Fields 1-15 oftracf( IV illustratethe large size and wide scattering seen far out in 18. At cell 16 of trac\ IV, the 18-19 (visual II-visual III)
(continued)
147
A

Fig. 3. (continued)boundary, the fields began to move bac/( toward the midline, and a high proportion were hypercomplex. Dia-grams of fields 16—28 show the positions of the fields, and the optimum stimulus shape, orientation, and direc-tions of movement. Cells 16, 20, and 22 responded to a light tongue on a darl{ background (a double-stoppededge); 27 and 28, to a dar/^ tongue; 17, 24, and 25 to a dar\ corner on a light background', 21 to a light corner;and 19 (a complex cell) to an edge. The area over which a cell was driven was mapped carefully only for cell 24,and is shown by the interrupted rectangle. B and C; same experiment as Fig. 3 A. Coronal sections through lat-eral gyrus; Nissl stain (cresyl violet) and myelin stain (Loyez). Same scale as coronal tracing in Fig. 3A. Arrowin Nissl section indicates second lesion of penetration IV. Note the lac\ of any dramatic transition in Nissl archi-tecture between 17 and 18, and the very coarse myelination of radial fibers in 18.
148

Fig. 4. A: reconstructions of five microelectrode penetrations in the lateral gyrus, from a single experiment. Con-ventions as in Figs. 1 through 3. Lines perpendicular to tracl( represent a vertical receptive-field orientation forall penetrations except IV, where they indicate horizontal orientation. Note 1) how fields move progressively outas one moves laterally in area 18, but apparently no further, in this experiment, than 15—20° (penetration IV);2) the relatively long sequences of cells with the same receptive-field orientations, in penetration III, which wasalmost perpendicular to the cortical surface; 3) the mixture of complex cells (rectangles) and hypercomplex cells(drawn with crosshatching) in area 19. Cells 31, 32, and 38 responded to darf^ corners; 34 to a dart{ tongue (dou-ble-stopped edge); 36 to a double-stopped slit. Areas over which cells 32 and 38 responded are indicated by inter-rupted rectangles: the activating portion of field 36 is shown by the continuous rectangle. Arrow through recep-tive field indicates most effective direction of movement. B and C: Nissl-stained and myelin-stained coronalsections of lateral gyrus in experiment of Fig. 4 A. The Nissl section shows part of the electrode tracl( and thelesion of penetration V. Note in the myelin section the coarse pattern formed by the radial fibers in area 18. D:left, photograph of cortical surface, showing entry points of the five penetrations. Right, tracing from photographof brain surface; anterior is up. (continued)
149

150 PART III NORMAL PHYSIOLOGY AND ANATOMY
Fig. 4. (continued)
beginning about 2.5 mm. from the midline andworking laterally. In the first penetration, two cellshad receptive fields situated in the contralateralhalf-field of vision about 5° out from the midline.The second and third penetrations showed a clear
progressive outward movement, establishing thatthese two penetrations (and probably also the first)were in visual II. In the fourth penetration most ofthe first 15 cells had tremendous receptive fields,some extending out as far as 60°. From cell 16 on,

Cat Prestriate Areas, 18 and 19 151
however, as the electrode advanced down the lat-eral bank of the gyrus, the receptive fields came tooccupy positions closer and closer to the midline,indicating a reversal of the outward trend. At thesame time there was an abrupt change in receptivefield size and response characteristics (to be dis-cussed below). This experiment, which was subse-quently confirmed in similar mapping experi-ments in 7 other animals (see for example, Fig. 31),indicates that there is a third topographicallyorganized visual area lateral to the second. Weterm this area "visual III."
Some notion of the regions of cortex exploredso far can be obtained from Fig. 37. The area cen-tralis representation in visual III appears to be quitelarge, including much of the knee-like junction ofthe middle and posterior suprasylvian gyri. There islittle doubt that visual III is arranged in a mannersimilar to visual I, in that as one proceeds forwardalong the cortex the receptive fields occupy pro-gressively lower positions in the visual field. Wehave made no attempt to define physiologically thelateral borders of visual III, though in several shortpenetrations along the medial bank of the suprasyl-vian gyrus at the levels of Figs. 3 and 4 we failed torecord responses to visual stimuli. At these levels,visual III would thus seem to occupy the entire lat-eral bank of the lateral gyrus (see area marked 19 inFig. 37). A little further back visual III occupies thelateral half of the accessory interlateral gyrus (Fig.375), and extends over to the medial bank of thesuprasylvian gyrus (see Fig. 29). Still further back(Fig. 37C; also Figs. 30 and 31) visual III begins inthe medial wall of the posterior suprasylvian gyrusand extends laterally for an unknown distance.
In a few experiments involving a succession ofpenetrations from medial to lateral we failed tomove far out into the periphery of the contralateralvisual field while crossing visual II and III in suc-cession. Figure 4 provides an illustration of this.Here as we proceeded laterally across the posteriorpart of the lateral gyrus the fields moved out in theusual manner, except that none of them extendedfurther than about 15°; it seems unlikely that theentire remaining periphery could have been repre-sented in the small unexplored area between pene-trations IV and V. A similar experiment is illus-trated in Fig. 29. It is thus our impression that theextreme lateral parts of the visual field may some-times have no representation at these antero-poste-rior levels. It is as if the large regions of visual I, II,
and III devoted to area centralis had crowded thelateral representations into more anterior and pos-terior parts of the cortex.
Correlation of the Three Visual Areaswith Microscopic AnatomyAn obvious question concerns the correlation ofthese three physiologically defined areas withcytoarchitectural subdivisions. The borders ofareas 17, 18, and 19 were, accordingly, determinedin Nissl- and myelin-stained sections of all theexperimental brains, using slides that showed theelectrode tracks and lesions. The criteria used werethose given in a recent comprehensive study of thevisual areas of the cat by Otsuka and Hassler (23).For determining both the medial and lateral bor-ders of area 18 we have found especially useful thepresence of large third-layer pyramidal cells in 18,and, in myelin-stained sections, the coarse, irregu-lar, and often oblique pattern of fibers in the deepercortical layers. In Figs. 1 through 4 and 29 through32 the designations 17,18, and 19 are based entirelyon histological criteria.
A comparison of the physiologically definedvisual areas I, II, and III with the anatomicallydetermined 17, 18, and 19 has shown a remarkablyexact correspondence. An example is shown in Fig.3, where the border between visual II and III is pre-cisely defined physiologically as occurring betweencells 15 and 16. The correlation between this and theborder between 18 and 19 seen on the myelin-stained section (Fig. 35) is quite striking. In no casehas there been any disagreement between physio-logical and anatomical findings. Moreover, ourcomposite picture of the borders between visual I,II, and III from all experiments coincides well withthe gross borders shown by Otsuka and Hassler (23:Fig. 8£), which are based on their own microscopicanalysis.
Part II. Responses of Single Cells in VisualAreas II and III
General CommentsFor every spontaneously firing cell in visual II andIII, it was sooner or later possible to find a visualstimulus that evoked a response, unless the cell wasbadly injured or the cortex was in a pathologicstate. By continuously stimulating the retina as theelectrode advanced one could even activate and

152 PART III NORMAL PHYSIOLOGY AND ANATOMY
hence study a number of otherwise quiescent cells.There may, of course, be cells that neither firespontaneously nor respond to visual stimuli. As invisual I (13), deepening the level of anesthesia sup-pressed spontaneous activity and made responsesmore sluggish, without, however, lowering theresponse specificity.
Outside of visual I no simple cells were found,and no axons with geniculate properties wereencountered in gray matter. In visual II and III onecan distinguish several distinct categories of cells.The first group contains cells that resemble com-plex cells of the striate cortex. A second large groupconsists of cells with more elaborate properties. Allcells that exceed the complex type in the intricacyof their behavior we have called "hypercomplex,"and within this group we distinguish lower orderand higher order cells. The types of cells found invisual II and III are summarized in Table 1.
Complex CellsComplex cells were common both in visual II andvisual III. In visual II they were in the overwhelm-ing majority, forming 96% of the cells studied. Thisfigure may, however, be misleading, since itincludes cells recorded in early experiments doneat a time when hypercomplex cells had not beenrecognized: 90% would probably be a closer esti-mate. In visual III, of 109 cells recorded, 46 (42%)were complex and 63 (58%) were hypercomplex.
Complex cells in visual II and III closelyresembled those in visual I in their responses toretinal stimulation. Diffuse light or small circularspots evoked little or no response. A given cell wasaffected most by a line regardless of its precise posi-tion in the receptive field, provided the orientationwas optimal; at 90° to the best orientation noresponses were evoked. The preferred orientationdiffered from one cell to another, and there was noindication that any one orientation was more com-mon than the others. If the adequate stimulus wasa slit or a dark bar, its width was usually important:making it narrower or wider than some optimumusually rendered it ineffective. In the present con-text it is particularly worth emphasizing the effectsof varying the stimulus length. A maximum re-sponse was obtained when the full length of areceptive field was covered; making the stimuluseven longer had no additional effect, a result that isimplicit in the term "receptive field," since we usethis term in the sense of the entire region of theretina functionally connected with the cell. Therewas, in other words, simple summation of stimuluseffects over the entire receptive field along thedirection of the field orientation. This was not trueof the higher order cells to be described below.
Movement of an optimally oriented line stim-ulus in a direction perpendicular to the orientationwas usually the most powerful way of activating acell. The two directions of movement were not
Table 1. 290 cells recorded in areas 18 and 19
Cell Type
Complex
Total
Hypercomplex*
Total
Totals
Activated by
EdgeDark barSlitMixedUncategorized
Edgesingle-stopped (corner)double-stopped (tongue)
Slit (double-stopped)Dark bar (double-stopped)Uncategorized
Visual II
3812721734
173
602008
181
Visual III
61223
05
46
1833
534
63
109
*Eleven of the cells in visual III were classed as higher order hypercomplex.

Cat Prestriate Areas, 18 and 19 153
Fig. 5. Response of a complex cell, recorded from visual II, toa vertical 1° X 4° slit moved slowly to the right at a speed ofabout 2°/sec. Stimulation of right (ipsilateral) eye; ocular-dominance group 5. Receptive field extended from the centerof gaze out into the contralateral visual field for about 10°. Aportion of the same response is shown with a faster sweep inthe lower record, to illustrate the pattern of firing. Time,upper sweep, 10 sec., lower sweep, 200 msec. Backgroundintensity, 0 log l(>cd/m-; slit, 1.3 Iog1(jcd/m~.
necessarily equally effective, and sometimes onedirection of movement produced no response at all.The rate of movement was usually an importantvariable, since the cell's firing frequency tended tofall off sharply if the rate was less or greater thansome optimum. The most effective rates of move-ment varied from cell to cell, from about O.lVsec.up to about 20°/sec.
Figure 5 illustrates a type of cell commonlyseen in both visual I and II. These cells fired rap-idly, and in a characteristic pattern of very briefhigh-frequency bursts, as a line stimulus slowlycrossed the receptive field. The cell of Fig. 5 wastypical in that it responded when a slit was movedin one direction, but was neither excited nor inhib-ited by the reverse movement. (Edges or dark barsevoked only feeble responses). It was rare for a cellto be activated by movement in one direction andinhibited by movement in the reverse direction;one of the few convincing examples is shown inFig. 6. Here the cell responded to a slit, bar, oreither type of edge, with excitation to movementup and suppression of firing to movement down.Inhibition of this sort would, of course, tend to beoverlooked in cells with a slow maintained rate offiring, and may be more common than our resultssuggest.
In visual II complex receptive fields tended tobe larger than those in visual I. As in visual I, fieldsize was loosely correlated with distance from thearea centralis, a relationship that is illustrated inFig. 7, where the area of each field is plotted againstthe distance of its geometric center from the areacentralis. In some experiments in which visual IIwas explored from medial to lateral, receptivefields of successively recorded cells expanded insuch a way, as they moved into the periphery, thattheir inner borders continued to extend mediallyalmost to the vertical meridian. A field whose cen-ter was 30—40° out thus came to occupy a large partof the contralateral visual field. As in visual I, allfields were confined entirely or almost entirely tothe contralateral half-field of vision; many in fact
Fig. 6. Responses of another complexcell recorded in visual II, in the samepenetration as the cell of Fig. 5. Stim-ulation of left (contralateral) eye,ocular-dominance group 3. Size ofreceptive field 3° X 4°. Upper record,optimally oriented slit, 6° Xl°, movedup across receptive field. Lowerrecord, same slit, moved downward;note inhibition of resting discharge,beginning at 2, when slit enters field,and ending at 1, when it leaves. Rateof movement 0.5°/sec. Duration ofsweeps, 10 sec. Stimulus intensities asin Fig. 5.

154 PART III NORMAL PHYSIOLOGY AND ANATOMY
Distance of field from area centralis
Fig. 7. Receptive-field areas in (degrees of arc)2 of 72 cells invisual II, plotted against distance of the geometric center ofeach field from the area centralis.
stopped abruptly at the vertical meridian, andthose that extended across it did so for such a smalldistance as to make it doubtful whether this repre-sented a genuine encroachment on the ipsilateralfield, or whether it was an artifact related to anerror in estimation of the vertical meridian (see DIS-CUSSION).
Complex cells in visual III were similar in allrespects to those found in the striate cortex. Whileno analysis was made of receptive-field size, as wasdone for visual II cells, we have the impression thatthe complex fields of visual III were similar in sizeto those of visual I.
Hypercomplex CellsCells even more specialized than complex cellswere present in both visual II and III. In visual IIthey formed about 5—10% of the population. Invisual III they were much more numerous, com-prising about half of the cells in some penetrationsand almost all of them in others. A useful indica-tion that an electrode had passed from visual II tovisual III was the abrupt increase in the numbers ofhigher order cells. This is shown particularly wellin Fig. 3, penetration IV.
We term these more complicated cells of areas18 and 19 "hypercomplex." Cells in this groupshowed certain common features, but variedwidely in other respects, both in the types of stim-uli they responded to and in their apparent order ofcomplexity. These common features and differ-
ences can best be described by several examples,and we shall begin by describing the responses offour lower order hypercomplex cells, and shall fol-low this with two examples of cells of higher order.
LOWER ORDER HYPERCOMPLEX CELLS. Records of ahypercomplex cell in visual II are shown in Figs. 8through 11 (see Fig. 32, unit 7). This cell respondedbest to a 2:00—8:00 edge with dark below, movedupward at about 2°/sec. over a circumscribedregion as shown in Fig. 8C. The area over whichresponses were evoked, about 2° X 2°, is indicatedroughly by the left half of the interrupted rectan-gle. As more and more of this area was stimulatedthe response steadily improved (Fig. 8, A throughC). The orientation of the edge was critical, sincechanging it by more than 10°—15° produced amarked decrease in the response, and a 30° changemade the stimulus ineffective. Downward move-
Fig. 8. Records from a hypercomplex cell in visual II (seeFig. 32, unit 7). Stimulation of right (ipsilateral) eye, ocular-dominance group 6. Receptive field, 2° X 4°, indicated byinterrupted rectangle. Stimulus consisted of an edge orientedat 2:00, with darf^ below, terminated on the right by a secondedge intersecting the first at 90°. Brighter regions, 1.3 Iog10
cd/m2; dari^ areas, 0.0 Iog10 cd/m2. A through C: up-and-down movement across varying amounts of the activatingportion of the field; D-E: movement across all of the acti-vating portion and varying amounts of the antagonistic por-tion. Rate of movement 4°/sec. Each sweep 2 sec.

Cat Prestriate Areas, 18 and 19 155
Fig. 10. Same cell as in Figs. Sand 9. Each time an optimally
oriented stopped edge is moved up across the activating (left)part of the receptive field at optimal speed (2°I sec.), a secondedge is simultaneously moved up to the right of the first, atvarying distances. The antagonistic effect, first noted about
2° from the boundary between the two parts of the field,
increases the closer the edge is to this boundary. Sweep dura-tion, 2 sec.
Fig. 9. Same cell as in Fig. 8. Stimulation with two inter-
secting edges moved up across the receptive field as shown.Inhibition is maximum when the right (antagonistic) half ofthe receptive field is stimulated with an edge having the sameorientation as the optimum edge for the left (activating) half(F). Duration of each sweep, 2 sec.
ment was entirely ineffective, as were small circu-lar spots, diffuse light, or up-and-down movementof an edge with dark above. The cell was driven byboth eyes, the ipsilateral one giving the betterresponses (group 5).
From these responses alone one would con-clude that this was an ordinary complex cell,responding to an edge at 2:00 with dark below,moved up. The situation was more complicatedthan that, however. The remainder of Fig. 8 showsthat as more and more of the right half of the inter-rupted rectangle was included in the stimulus, sim-ply by extending the edge further to the right, theresponse became progressively weaker, until itfailed completely when the entire rectangular areawas stimulated.
It would seem from Fig. 8 that this cellrequired as a stimulus an edge crossing the left half
of the rectangular field, but also required that asimilar edge should not simultaneously cross theright half. There are, however, several possiblealternatives. Perhaps it was important to have the11:00—5:00 edge come somewhere near the bound-ary between the two halves. Or perhaps it was nec-essary to have some kind of interruption in the con-tinuity of the 2:00 edge at the boundary. Therecords of Figs. 9 through 11 allow one to eliminatesome of these possibilities. In all of the records ofFig. 9, the left half of the interrupted rectangle wasstimulated in the most powerful way; the orienta-tion of the stimulus to the right was meanwhilevaried through all possible angles. From the selec-tion of records shown it is clear that the closer theorientation was to that of the left edge, the weakerwas the response. Stimulating the right ("antago-nistic") region thus effectively suppressed theresponse, provided the orientation of the edgecrossing that region was not more than about 15° orso from the inclination that was optimal for the lefthalf. This represents an orientation specificitycomparable to that of the left ("activating") region.
By stimulating the left and right subdivisionsof the field separately, and varying the length of the

156 PART III NORMAL PHYSIOLOGY AND ANATOMY
right-hand stimulus, as shown in Fig. 10, it wasfound that the antagonistic region had roughly thesame length as the activating. Records IOC andIQD suggest, moreover, that merely having a dis-continuity near the dotted line dividing the rectan-gles, even in the form of an 11:00—5:00 edge, wasnot enough to make the 2:00 edge effective. This isfurther supported by the experiment of Fig. 11, inwhich a notch of varying width interrupted theedge. Here, moreover, one could map roughly theextent of the antagonistic area in the 11:00—5:00direction, and show that it was roughly equal to theextent of the activating region.
From these experiments the essential prop-erty of the cell seems to have been its responsive-ness to a specifically oriented edge, provided theedge was limited in its length at one end (in thiscase the right). As to the extent of the edge to theleft, the longer it was the better was the response,until it passed the left boundary of the interruptedrectangle; beyond that point the length made nodifference. For convenience we shall refer to cellsof this type as responding to a "stopped edge." Aterm such as "corner cell" has the disadvantage thatthe cell responded not to all corners, but to a par-ticular class of corners (those of Fig. 9, B and G)over a narrow range of orientations and positions.
Fig. 11. Same cell as in Figs. 8 through 10. The two halvesof the field are stimulated simultaneously by two edges sepa-rated by a step of varying height; antagonistic effects are firstseen when the step equals the width of the field, and increaseas the step is narrowed, to about 112°, after which no changeis seen. Each sweep, 2 sec.
Fig. 12. Recordings from a cell in area 19 of the right hemi-sphere; stimulation of left eye. Receptive field about 8° belowthe center of gaze, about 13" long and 6" wide. Rapid(30°/sec.) up-and-down movement of a long edge with dar\above evoked no response (A). Responses to downwardmovement began to appear when the stimulus was limited inits length (B, C), and became maximal when a 2'/2°-wideregion in the center was stimulated (D), at which point anoccasional response occurred even to upward movement.Further narrowing made the response weaker (E and F).Duration of each sweep, 1 sec.
A hypercomplex cell of a second type, this onerecorded from visual III, is described in Figs. 12through 15. It was driven from the contralateraleye only (group 1). It responded to an edge movedvery rapidly down and to the right, but only if theregion stimulated was restricted on both sides. InFig. 12/4, for example, moving a very long edgedown gave no response. The edge became effectivewhen it was shortened by blocking out both ends ofthe region being stimulated, and the responsesincreased until all but the center 2%° was elimi-nated (Fig. 12,5 and D). At this point there was notonly a brisk response to movement down, but alsoa weak response to movement up. Further narrow-ing of the area stimulated reduced the response.
The 2%° stimulus of Fig. \2D was most potentwhen it was oriented in a 2:00 direction. As shownin Fig. 13, a 30° change in either direction all buteliminated the response.

Cat Prestriate Areas, 18 and 19 157
Fig. 14. Same cell as in Figs. 12 and 13. In A and B portionsof the field to the right and left of the 21/2°-wide center areblocked separately, to show that the more important antago-nistic region is to the right. The equivalent experiment isrepeated in D and E, using dai\ corners. In F, which corre-sponds to C, a dart{ tongue is used instead of an edge blockedto either side: a darf^ tongue moved in from above (F) isequivalent to a light tongue moved out from below (C).Duration of each sweep, 2 sec.
To assess the relative effectiveness of the endzones of the interrupted rectangle in interferingwith the response, each end was blocked off in turn(Fig. 14, A and B). Both end regions were clearlycapable of antagonizing the responses, the rightone somewhat more so than the left, and eliminat-ing both produced the best response, with even an
Fig. 15. Same cell as in Figs. 12 through 14. A dar\ tongue2'/2°-wide crosses receptive field from above downward, indifferent positions. Maximum excitation occurs when thecentral (activating) strip of field is stimulated. Varying theposition by 1/2° either way greatly reduces the response.Duration of each sweep, 1 sec.
occasional impulse in response to upward move-ment. One can say that this field was "stopped" atboth ends. The region stimulated could be con-stricted either by blocking off the end regions (as inFigs. 12 and 13; or 14,^4 through C) or by reducingthe length of the edge (Fig. 14,Z) through F); whenthe length was reduced the optimum stimulusbecame a 21/2° tongue moved rapidly into the acti-vating part of the field in a 11:00—5:00 orientation(Fig. 14F). The exact positioning of the stimuluswas then highly critical, since introducing it evenslightly to the left or right of the central region pre-sumably meant reducing the activating area cov-ered and at the same time including some of theantagonistic. This is shown in Fig. 15.
For this cell and the previous one the recep-tive field, defined as the entire area functionallyconnected with the cell, is outlined by the inter-rupted rectangles. The fields so defined are subdi-vided into activating and antagonistic regions in amanner analogous to the excitatory and inhibitoryparts of simple fields we have described in previouspapers (10, 13). The terms "excitatory" and "in-hibitory," if used for hypercomplex fields, must beunderstood in a more abstract way, since the effectsof the regions do not add or subtract in any simplespatial sense, but only along a line parallel to the
Fig.13. Same cell as in Fig.12. Effects of varying the orien-
tation of the edge. Duration of each sweep, 1 sec.

158 PART III NORMAL PHYSIOLOGY AND ANATOMY
Fig. 16. Responses of a cell recorded in area 19, right hemi-sphere (see cell 22, penetration V, Fig. 29). Receptive fieldwas 10° below and to the left of the center of gaze. Excitatoryportion roughly 2° X2° represented by interrupted rectangle.A through C, stimulation with an optimally oriented slit,1/8° X 2°, in various parts of receptive field in right (ipsilat-eral) eye. D: same slit, shone at 90° to optimum orientation.E: optimally oriented slit 5 1/2° long, extending beyond exci-tatory region on both sides. For each record upper line showswhen stimulus light was on. Duration of each sweep, 1 sec.Intensity of slit, 1.0 logw cd/m2; background, 0.0 log]0 cd/m2.
Fig. 17. Same cell as in Fig. 16. Responses to 118°-wide slitsof various lengths moved downward across receptive field atabout 3°/sec. A: stimulation of activating part only; Bthrough F: stimulation of activating part, as well as varyingportions of the antagonistic flanks. Right flanl{ is weakerthan left. Sweep duration, 1 sec.
receptive-field axis (see DISCUSSION). For the cellsdescribed below (Figs. 16 through 20), interruptedrectangles are used to outline the excitatory (oractivating) subdivision of receptive fields and theantagonistic regions are not shown.
The two cells just described responded best toedge stimuli. Two examples of cells responding toslits and dark bars are shown in Figs. 16 and 17 andFigs. 18 through 20. These cells were recorded insequence from a single penetration of visual III inthe right hemisphere (see Fig. 29, units 21 and 22).Unit 22, illustrated in Figs. 16 and 17, respondedbest to a slit 1/8° wide and 2° long, oriented about15° to the horizontal. It was driven by both eyes,but preferred the ipsilateral (group 5). Briskresponses were evoked with stationary stimuli:shining the slit anywhere within a 2° X 2° regionevoked an "on" response (Fig. 16, A through C),provided the orientation was within about 20—30°of the optimum. At 90° to the optimum there wasno response (Fig. 16D). A slit 1/8° wide, as used inA through C, was clearly optimal, and this dimen-
Fig. 18. Cell recorded near that of Fig. 16 and 17 (see Fig.29, cell 21, penetration V). Receptive field 8° below and tothe left of the center of gaze; activating portion, roughly 4°long and 3—4° wide, denoted by the interrupted rectangle.Responses to up-and-down movement of a slit 1/8° X 3° (Aand E), and 118° X 8° (C and D). Intensity of slit, 1.3 logw
cd/m2; background, 0.0 loglo cd/m2. Rate of movementabout 3°/sec.; sweep duration 2 sec.
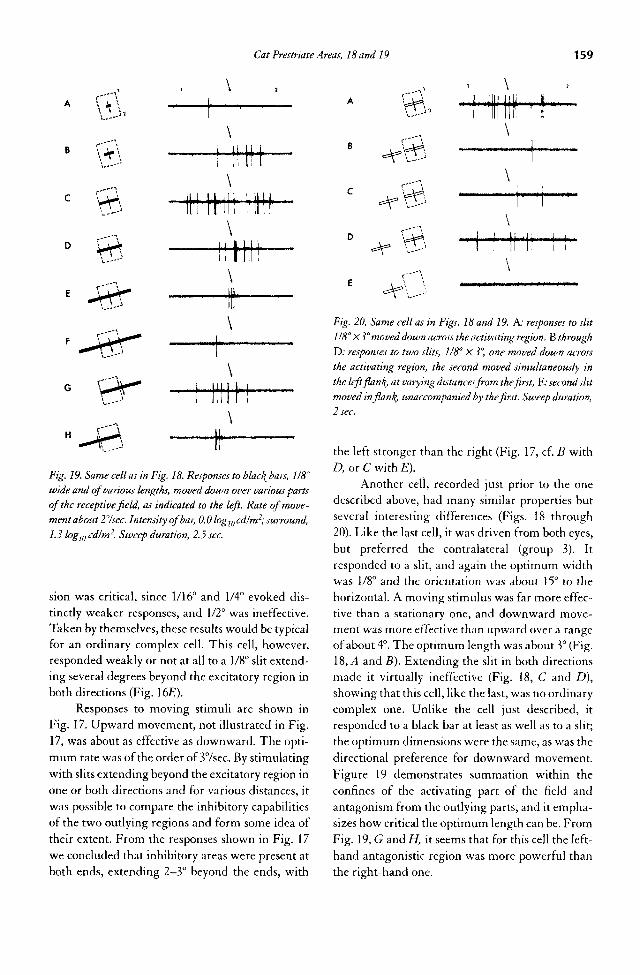
Cat Prestriate Areas, 18 and 19 159
Fig. 19. Same cell as in Fig. 18. Responses to blac^ bars, 118°wide and of various lengths, moved down over various partsof the receptive field, as indicated to the left. Rate of move-
ment about 2°I sec. Intensity of bar, 0.0 logIO cd/m2; surround,1.3 Iog10 cd/m2. Sweep duration, 2.5 sec.
sion was critical, since 1/16° and 1/4° evoked dis-tinctly weaker responses, and 1/2° was ineffective.Taken by themselves, these results would be typicalfor an ordinary complex cell. This cell, however,responded weakly or not at all to a 1/8° slit extend-ing several degrees beyond the excitatory region inboth directions (Fig. \6E).
Responses to moving stimuli are shown inFig. 17. Upward movement, not illustrated in Fig.17, was about as effective as downward. The opti-mum rate was of the order of 37sec. By stimulatingwith slits extending beyond the excitatory region inone or both directions and for various distances, itwas possible to compare the inhibitory capabilitiesof the two outlying regions and form some idea oftheir extent. From the responses shown in Fig. 17we concluded that inhibitory areas were present atboth ends, extending 2-3° beyond the ends, with
Fig. 20. Same cell as in Figs. 18 and 19. A: responses to slit1/8° X3° moved down across the activating region. B through
D: responses to two slits, 1/8° X 3°, one moved down acrossthe activating region, the second moved simultaneously inthe leftfian\, at varying distances from the first; ̂ second slit
moved inflan\, unaccompanied by the first. Sweep duration,2 sec.
the left stronger than the right (Fig. 17, cf. B withD, or C with E).
Another cell, recorded just prior to the onedescribed above, had many similar properties butseveral interesting differences (Figs. 18 through20). Like the last cell, it was driven from both eyes,but preferred the contralateral (group 3). Itresponded to a slit, and again the optimum widthwas 1/8° and the orientation was about 15° to thehorizontal. A moving stimulus was far more effec-tive than a stationary one, and downward move-ment was more effective than upward over a rangeof about 4°. The optimum length was about 3° (Fig.18, ./I and B). Extending the slit in both directionsmade it virtually ineffective (Fig. 18, C and D),showing that this cell, like the last, was no ordinarycomplex one. Unlike the cell just described, itresponded to a black bar at least as well as to a slit;the optimum dimensions were the same, as was thedirectional preference for downward movement.Figure 19 demonstrates summation within theconfines of the activating part of the field andantagonism from the outlying parts, and it empha-sizes how critical the optimum length can be. FromFig. 19, G and H, it seems that for this cell the left-hand antagonistic region was more powerful thanthe right-hand one.

160 PART III NORMAL PHYSIOLOGY AND ANATOMY
The experiment of Fig. 20 was designed tomeasure how far the left antagonistic areaextended, by stimulating the activating area with adownward-moving slit, at the same time movingdown a second slit at varying distances to the left ofthe first. It would seem that most of the antagonis-tic region was within about 2—3° of the activatingregion. In Fig. 20E we show that stimulation of theflanking region by itself was without effect. Per-haps this was because there was too little sponta-neous activity for any inhibition to be apparent. Afailure to respond to stimulation of an antagonisticregion alone has been observed in all hypercom-plex cells so far studied.
The four cells just described had in commona close resemblance to complex cells, except thattheir receptive fields were stopped at one or bothends. Hypercomplex fields, like complex ones,occurred in all orientations, with no indication thatone orientation was more common than any other.From these and other examples we find that themain types of ordinary complex cells—distin-guished by whether they respond to slits, edges ordark bars, or any combination of these—all havetheir counterparts among the hypercomplex cells.A hypercomplex cell driven by edges may have itsfield stopped at one end (Figs. 8 through 11) or atboth ends (Figs. 12 through 15). So far, hypercom-plex cells activated by slits or bars (Figs. 16 through20) have all had fields stopped at both ends. Thefrequency with which these various cell types wereobserved is shown in Table 1.
Fig, 21. Responses of a cell recorded in area 19, right hemi-sphere (see cell no. 2, Fig. 31). Receptive field 6°from centerof gaze. Regions from which responses were evoked are indi-cated roughly by the two interrupted rectangles, of which theright was 3° X 4° in size. A right-angled corner with dar\ upand to the right (B) evoked responses when moved down orup over the left-hand region; no response was evolved in theright-hand region. A corner with darkness up and to the leftevoked responses to up-and-down movement only over theright-hand region (D). Little or no response was obtainedwith corners with dart^ below (A and C), or with unstoppededges (E). A tongue (F), combining stimuli B and D, gavethe most powerful responses. Rate of movement, about0.5°/sec. Duration of each sweep, 20 sec. Intensities, shadedareas 0.0 loglo cd/m2; background, 1.0 Iog10 cd/m2.
HIGHER ORDER HYPERCOMPLEX CELLS. Twelvehypercomplex cells recorded in visual III had prop-erties that could not be described in these relativelysimple terms. We have called such cells "higherorder hypercomplex."
One of the main characteristics of higherorder cells was an ability to respond to two sets ofstimuli with orientations 90° apart. Figures 21 and22 show records of unit 2 in the experiment of Fig.30. This cell responded to stimulation of either eye(group 5), to a 2:00 edge with dark above. With astimulus stopped to the left (Fig. 215) the cellresponded to movement down or up throughoutan oval area indicated roughly by the left inter-rupted rectangle. With the edge stopped to theright (Fig. 2LD) the cell responded over a separateregion suggested by the right interrupted rectan-
gle. Corners made from an edge with dark belowwere almost ineffective (Fig. 21, A and C), as was anunstopped edge with dark above (Fig. 2 \E). A darktongue 5° wide, combining the two corners of Fig.21, B and D, evoked a very brisk response when itwas moved in from above (Fig. 2 IF). The re-sponses shown in B, D, and F were highly sensitiveto the orientation of the stimulus, and fell offquickly if the orientation was changed by morethan 10—15°. Up to this point, then, the cell behavedin many respects like a lower order hypercomplexcell responsive to a double-stopped edge, such asthat of Figs. 12 through 15. Considered in that way,the field would have a central activating region,presumably including most of the two rectangularareas and the region between them, flanked onboth ends by antagonistic areas. It seems doubtful,

Cat Prestriate Areas, 18 and 19 161
however, whether such a simple arrangementcould explain the properties of this cell. The rela-tively large regions over which corners evokedresponses indicate that the points at which theedges were stopped were not very critical. This wasnot generally true for a lower order hypercomplexcell (cf. Fig. 15): usually the more of the activatingregion the stimulus covered the more active wasthe response, with a sharp dropoff in response assoon as the inhibitory region was invaded. In thiscell the responses to each corner were, on the con-trary, surprisingly vigorous and uniform over itsown entire rectangle, suggesting a complexity oforganization greater than that of any hypercom-plex cells described up to now. A better example ofthis kind of behavior is provided by the cell to bedescribed next (Figs. 23 through 26).
That the cell just described was complex instill another way is shown in Fig. 22. The cellresponded vigorously when the corner used in Fig.2\D was moved down and to the left or up andright (Fig. 22/1). Sidewise movement, like down-ward movement, evoked responses only when thestimulus corner was oriented as shown in Fig. 22, Aand B; a change of 15—20° was enough to abolishthe response. The range over which a response wasevoked was very nearly the same as before, and isindicated by the same interrupted rectangle. Thecorner of Fig. 2\B similarly evoked a briskresponse when moved sidewise over the left-hand
rectangular area, as shown in Fig. 22B. Combiningthe two stimuli by using a wide bar produced avery powerful response (Fig. 22D), whereas therewas no response when the bar extended below theexcitatory regions (Fig. 22C).
This cell would seem to combine the attrib-utes of two sets of lower order hypercomplex cells,one set having a 2:00 receptive-field orientation,the other a 5:00 orientation. Such complicated cells,combining characteristics of two groups of lowerorder hypercomplex cells with orientations 90°apart, seem to be much less common than ordinarylower order hypercomplex cells, in that we haveseen only 11 of a total of 63 hypercomplex cells invisual III, and have found none in visual II. A highproportion (8 cells) were recorded in two of thepenetrations (see Figs. 30 and 31), both of whichwere in the region of area centralis representation.The behavior of these cells can be better under-stood by considering responses of other neighbor-ing cells recorded simultaneously or in the samepenetration, a topic that is taken up in a later sec-tion (p. 261).
A second example of a higher order cell isshown in Figs. 23 through 26. Recorded in the
Fig. 23. Responses of a cell recorded in area 19, right hemi-
sphere (see cell no. 6 of Fig. 31). Region from whichresponses were evoked, 4°Xl 'A0, are indicated approximatelyby the interrupted rectangle. Responses to a darl( tongue 1/2°
wide introduced from below in four different positions, at arate of about 0.5°/sec. Intensities as in Fig. 21. Duration of
each sweep, 5 sec.
Fig. 22. Same cell as Fig. 21. Responses to movement downand to the left, and up and to the right, of corners with dar\
above (A and B); failure to respond to an unstopped dar\ bar(C); strong response to a darl^ bar stopped below (D), com-bining stimuli (A) and (B). Sweep duration, 20 sec.

162 PART I I I NORMAL PHYSIOLOGY AND ANATOMY
same penetration as the last cell (see Fig. 30, unit 6),its receptive field was in roughly the same region,and measured 4° X 11/2°. A powerful response wasevoked by an edge with dark below, inclined at 15°to the horizontal, stopped at both ends, and intro-duced into the field from below at a rate of aboutl°/sec. The response was markedly reduced bychanging the orientation by 20—30°. Although thefield itself was 4° long, the optimum length of thestimulus edge was only 1/2°. Indeed, the mostinteresting feature of this cell was its ability torespond regardless of where along the 4°-longlower border of the field the stimulus was intro-duced (Fig. 23)—this despite the fact that an edgeonly slightly longer than 1/2° was distinctly lesseffective, and a 2° edge evoked no response (Fig.24). Active responses were evoked not only to al/2°-long double-stopped edge, but also to a dou-ble-stopped slit or dark bar, whose optimal length
Fig. 24. Effects of varying the width of tongue, in cell of Fig.23. Movement from below up over center of field at rate of0.5°/sec. Widths, A through F, are '/4°, '/2°, 3/4°, 1°, l'/2°, and 2°;optimum width (B), 1/2°. Duration of each sweep, 5 sec.
was again 1/2°: the thickness of the stimulus wasnot critical provided it exceeded 1/4°.
This cell, then, had many features similar tothe cell of Figs. 12 through 15, in responding to anappropriately oriented edge stopped at both ends: itdiffered in that it responded over a wide area ofreceptive field, whereas with the other cell therewas a well-defined region from which responseswere evoked, flanked by regions from which re-sponses could be suppressed. Indeed, it is as if prop-erties like those of the previous cell had been gen-eralized over a considerable expanse of retina. Thisgeneralization was probably also a feature of thelast cells (Figs. 21 and 22), though in that case it wasperhaps not so clear. These two cells were also sim-ilar in their ability to respond to either of two stim-uli 90° apart. A powerful response was obtainedwith a l/4°-wide slit or dark bar, oriented at 2:30and introduced into the receptive field from theright at a rate of about l°/sec. (Fig. 25); left-to-rightmovement gave a much weaker response. Thestimulus worked regardless of the exact level atwhich it crossed the field (Fig. 25, A through C).Yet a slit or dark bar 1° wide evoked no response(Fig. 25D). The orientation was again critical towithin 15—20°; but, surprisingly, changing the ori-entation of the 11:30 leading edge by using insteada sharply pointed slit or bar did not lessen thepotency of the stimulus, so that the important thing
Fig. 25. Same cell as in Figs. 23 and 24. A through C:responses to a dar\ 114° tongue moved across the field fromright to left in various positions as shown, at a rate of 1°I sec.D: response to a 1° tongue moved across field. Duration ofeach sweep, 10 sec.

Cat Prestriate Areas, 18 and 19 163
was probably the direction of movement of thestimulus, and not the orientation of the leadingedge.
Finally, this cell showed a phenomenon thatwe have occasionally seen in complex cells as wellas hypercomplex ones. As a stimulus was repeatedtime after time at intervals of 2—3 sec. it tended tobecome progressively less effective, until finally thecell failed to respond. For example, in Fig. 26 a 1/2°tongue was brought in from below and moved upslowly through the field, and this was repeatedonce every 3 sec. After four stimuli the responsebegan to fail, and after nine stimuli the cell had vir-tually stopped responding. Now no stimulus wasdelivered for about 10 sec. A new stimulus (10)introduced after this resting period was once morequite effective. If the dark bar was introduced eachtime in a different part of the field, there was noprogressive decline in the response. If it was rein-troduced repeatedly in the same place, as in Fig. 26,until the response faded, a brisk response occurredwhen it was suddenly introduced in a new place.
2 3
Fig. 26. Same cell as in Figs. 23 through 25. Continuousrecord. Dar\ tongue 114° wide is moved up and down overcenter of field at l°/sec., and the stimulus is repeated every
2—3 sec. By the eighth or ninth repetition the cell is failing to
respond. No stimulus is given for 10 sec. The tenth stimulus
is then highly effective. Each sweep, 10 sec.
This kind of progressive decline in respon-siveness has often been seen in complex cells invisual I and II. For example, many cells arestrongly influenced by a critically oriented station-ary line stimulus regardless of its position withinthe receptive field (13: Text-fig. 7). Such cells oftenfail to respond after several applications of thestimulus in the same place; changing the part of thefield stimulated revives the response. In cells of thistype, moving the stimulus generally produces avigorous discharge, perhaps because new regionsof the receptive field are being stimulated succes-sively.
Binocular InteractionFor most cells in visual II and III the receptive-fieldcharacteristics were worked out separately for eacheye, and then both eyes were stimulated together.The results were very similar to those we have pre-viously reported for cells in visual I (13). Most cells,though not all, were influenced independentlyfrom the two eyes. A cell that could be driven fromboth eyes always had receptive fields in correspon-ding positions in the two retinas, at least to withinthe limits of accuracy of the method: the two recep-tive fields thus occupied the same position in thecontralateral visual field. The two receptive fieldswere of the same size and arrangement, so thatwhatever stimulus was the most effective in oneeye—in form, orientation, and direction and rateof movement—was also the most effective in theother eye. Both stimuli together gave more vigor-ous responses than either applied alone. For a givencell the two eyes were not necessarily similar intheir ability to evoke responses. Some cellsresponded equally well to the two eyes, othersfavored the ipsilateral eye, still others the contralat-eral. A few cells responded only to one eye. Thusall shades of relative ocular dominance were found,from cells driven exclusively by the contralateraleye to those driven exclusively by the ipsilateralone. As in previous studies (13), we have dividedcells into seven groups according to relative oculardominance; these groups are defined in Fig. 28.
In Fig. 27 the relative influence of the twoeyes was determined for two cells recorded simul-taneously in visual area III. One cell was drivenalmost equally well from the two eyes, and wasclassed as group 4 (Fig. 27, A and B). The second

164 PART III NORMAL PHYSIOLOGY AND ANATOMY
Fig. 27. Two cells simultaneouslyrecorded from area 19; these werecells 35 (complex, large spikes) and36 (hypercomplex, small spikes), inFig. 4, penetration V. A and B:responses of the hypercomplex cell(no. 36) to a vertical slit, 1/2° X 2°,moved rapidly bac/( and forth acrossthe receptive field of the left eye (A),and the right eye (B); no responsefrom the complex cell. C and D:movement of a slit 112° X 12° pro-duces no response from the hyper-complex cell, but a brisf( responsefrom the complex cell (no. 35), in theleft eye only. Intensity of stimulus,1.0 Iog10 cd/m2; background, 0.0Iog10cd/m2. Rate of movement about20°/sec. Sweep duration, 1 sec.
cell, on the other hand, responded only from theleft or contralateral eye and was placed in group 1.This record is an example of a simultaneousrecording from a complex and a hypercomplex celland will be referred to again.
One hundred and forty-nine of the cells invisual area II, and 89 of those in visual III, were cat-egorized as to ocular dominance. The distributionof these cells among the seven different groups isgiven in Fig. 28,5 and C. It will be seen that for both
visual areas, cells driven by the two eyes (groups 2through 6) form the great majority, and that cellsfavoring the contralateral eye (groups 1 through 3)exceed those favoring the ipsilateral (groups 5through 7). Comparison with Fig. 28/1 shows amarked similarity between these histograms andthe one obtained previously for visual I. In the his-tograms for visual II and III the shaded area repre-sents hypercomplex units. While one can say littleabout the ocular-dominance distribution of hyper-
Fig. 28. Distribution according to ocular dominance of (A), 223 cells in visual I (13: text-Fig. 12), (B), 149 cellsin visual II, and (C), 89 cells in visual III. Cells of group 1 are driven only by the contralateral eye; for cells ofgroup 2 there is marked dominance of the contralateral eye; for group 3, slight dominance. For cells in group 4there is no obvious difference between the two eyes. In group 5 the ipsilateral eye dominates slightly, in group 6,markedly; and in group 7 the cells are driven only by the ipsilateral eye.

Cat Prestriate Areas, 18 and 19 165
complex cells in visual II, in visual III the distribu-tion of these cells seems to run parallel to that of thegeneral population. It seems surprising that thefunctional separation of the two eyes should persistwith so little change from one level to the next in thehierarchy, beginning with simple and then complexcells in visual area I, and proceeding to complex andthen hypercomplex cells in visual III.
Part HI. Functional Architecture of VisualAreas II and III
In this section we examine similarities betweenneighboring cortical cells, with the object of learn-ing whether there are discrete regions of cortexthroughout which the cells share certain receptive-field characteristics. As in previous studies (13, 14)we have proceeded by studying 1) sequences ofcells in single penetrations, 2) unresolved back-ground activity, and 3) multiple-unit recordings.The advantages and limitations of these threeapproaches have already been discussed (13).
Receptive-Field Orientation
COLUMNS WITH SINGLE ORIENTATION. We wereanxious to examine the receptive-field orientationsof neighboring cells in visual areas II and III, sincein visual I the relative constancy of receptive-fieldorientation from cell to cell forms the basis for theentire columnar system. Remarkably similar re-sults were found in both areas of nonstriate visualcortex. At any stage in a penetration through graymatter the background activity of unresolved sin-gle units was driven best by a line stimulus in a spe-cific orientation, and was silent if the stimulus wasoriented at 90° to that orientation. When a singlecell was isolated its receptive-field orientation andthe optimum orientation for the unresolved back-ground activity almost always coincided. In allmultiunit recordings (16 two-unit and 3 three-unitrecordings) the cells studied together had identicalreceptive-field orientations. As the electrode ad-vanced the optimum stimulus orientation for unre-solved background activity and for isolated cellswould remain constant for varying distances, andwould then change abruptly. At the transitionpoint there was either no clear preferred orienta-tion or there were two preferred orientations, thatof the cells in the region the electrode was leaving,
and that of cells in the new region. Like area 17,areas 18 and 19 are thus subdivided into discreteregions in which cells have similar receptive-fieldorientations.
By observing distances between shifts in ori-entation as the electrode advanced in various direc-tions through gray matter it was possible to assessthe size and shape of these regions. In visual area II,examples of two oblique penetrations are seen inFigs. 1 and 2. The short sequences of cells betweenshifts in orientation—here the longest sequencescontained only four to five cells—were typical ofsuch oblique penetrations. On the other hand, inpenetrations that were almost normal to the sur-face the sequences of cells with a similar orienta-tion tended to be much longer. In the experimentof Fig. 4, penetration III was almost perpendicularto the cortex of area 18: here after three shortsequences there was a relatively long one, contain-ing all cells from no. 15 to no. 24. Other examplesof penetrations more or less normal to the surfacecan be seen in Fig. 4, penetration II, where asequence of five cells occupies a large part of thecortical thickness, and Fig. 29, penetration IV, witha sequence of four cells. From these and otherexperiments we conclude that visual area II, likevisual I, is subdivided into discrete regions withinwhich cells have a common receptive-field orienta-tion. The variation of sequence lengths with obliq-uity of electrode path makes it very likely that herealso the regions are columnar in shape and extendfrom surface to white matter, with walls perpendi-cular to the radial fiber bundles.
Similar results were found in visual III. Fig-ure 4 shows an oblique penetration (V) containingfour shifts of orientation and no very longsequences. Figure 29, on the other hand, shows aparticularly long sequence of 15 cells occupying anentire penetration (V) that was very nearly perpen-dicular to the cortical layers. Thus here too thereseems to be a distribution of cells in columnsaccording to receptive-field orientation. (Oneimportant exception to this principle for columnsin visual III will be discussed in the next section.)
In the striate cortex one finds within a singlecolumn both simple cells and complex cells in largenumbers (13). In areas 18 and 19 there were bothcomplex cells and hypercomplex cells in a singlecolumn. Examples of both types of cells in a singlesequence can be found in Fig. 29, penetration IV(visual II), and penetration V (visual III). A clear
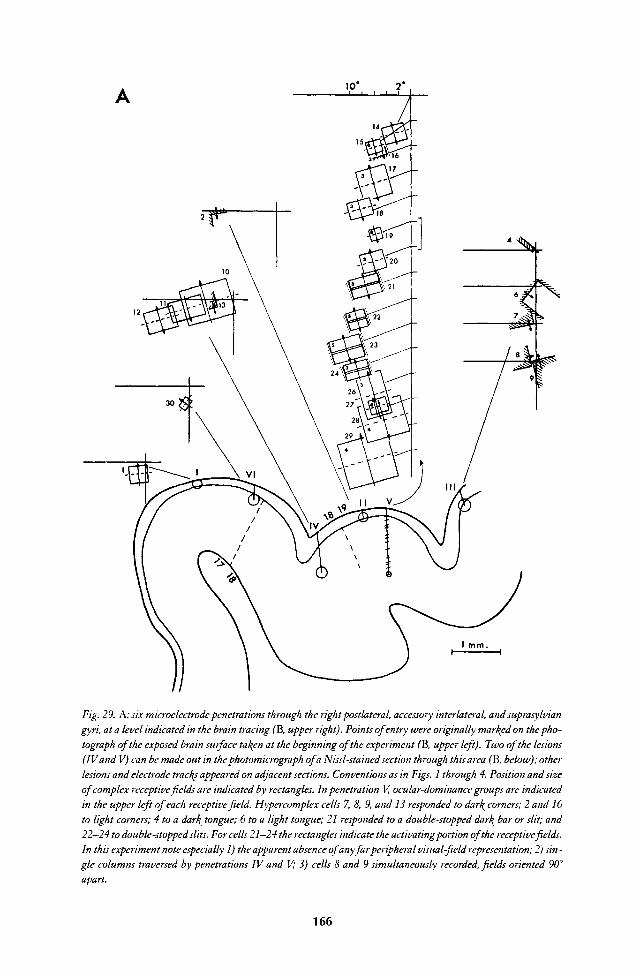
Fig. 29. A: six microelectrode penetrations through the right postlateral, accessory interlateral, and suprasylviangyri, at a level indicated in the brain tracing (E, upper right). Points of entry were originally marked on the pho-tograph of the exposed brain surface fallen at the beginning of the experiment (B, upper left). Two of the lesions(IV and V) can be made out in the photomicrograph of a Nissl-stained section through this area (B, below); otherlesions and electrode traces appeared on adjacent sections. Conventions as in Figs. 1 through 4. Position and sizeof complex receptive fields are indicated by rectangles. In penetration V, ocular-dominance groups are indicatedin the upper left of each receptive field. Hypercomplex cells 7, 8, 9, and 13 responded to darf( corners; 2 and 16to light corners; 4 to a darl^ tongue; 6 to a light tongue; 21 responded to a double-stopped darf( bar or slit; and22-24 to double-stopped slits. For cells 21-24 the rectangles indicate the activating portion of the receptive fields.In this experiment note especially 1) the apparent absence of any far peripheral visual-field representation; 2) sin -gle columns traversed by penetrations IV and V; 3) cells 8 and 9 simultaneously recorded, fields oriented 90°apart.
166

Cat Prestriate Areas, 18 and 19 167
Fig. 29. (continued)
demonstration can also be seen in Fig. 27, in whicha complex cell and a hypercomplex one were re-corded simultaneously. A short slit, covering theentire activating portion of the hypercomplex cell'sfield, evoked a strong response from that cell (smallspikes, A and B), but failed to activate the complexcell, presumably because it crossed only a smallpart of the complex cell's field. A long slit (C andD), on the contrary, crossed most or all of the com-plex cell's field and evoked a strong response fromthe complex cell; in so doing it crossed both theactivating and antagonistic portions of the hyper-complex cell's field, and consequently evoked noresponse.
In visual I there was an indication that simpleand complex cells were to some extent segregated
by layers, since complex cells seemed to be virtuallyabsent from layer 4 (13: Text-fig. 18). So far wehave insufficient material to make a similar analy-sis of visual II and III, though from examples likethat of Fig. 29 it seems that there is no strict segre-gation of complex and hypercomplex cells bylayers.
Figure 29 illustrates one further point, thatwithin a single column one can find representativesof all ocular-dominance groups; in this case the twocells belonged to groups 1 and 4. In penetration Vof Fig. 29 the ocular-dominance groups of all of thecells (except 14, for which the grouping was notdetermined) are noted inside each receptive-fielddiagram; all groups from 2 to 6 were represented inthe one column.

168 PART III NORMAL PHYSIOLOGY AND ANATOMY
COLUMNS WITH DUAL ORIENTATION. In PART n wehave described hypercomplex cells of higher orderthat responded to stimuli in either of two orienta-tions 90° apart. The relationship of these cells toneighboring ones, especially to complex and lowerorder hypercomplex cells, obviously presents a spe-cial case, since columns so far described have con-tained cells with a single common receptive-fieldorientation. The three penetrations in which cellswith dual orientation were found were particularlyinteresting in that some of the lower order neigh-boring cells responded to one of the two orienta-tions, while others responded to the other. A goodexample of this type of cell sequence can be seen inFig. 30. Four of the first nine cells were hypercom-plex, and each responded to two stimulus orienta-tions, 2:30 and 11:30. Of the remaining five cells,no. 5 and no. 6 were hypercomplex and respondedto dark bars with an 11:30 orientation, but not tostimuli oriented at 2:30. On the other hand, no. 7(complex) and no. 8 (hypercomplex), responded tostimuli oriented in a 2:30 direction, but not to an11:30 stimulus. Cells no. 6 and no. 7 were recordedsimultaneously and had fields oriented 90° apart,an event that is exceedingly rare in visual I, occur-ring only at the boundary between two columns.
Another example is to be seen in the shortsequence formed by cells 4 through 6 of Fig. 31.Here cell no. 4 responded to a 2:30 edge moveddownward: the cell was hypercomplex, with thefield stopped at both ends. Cell no. 5 responded toan edge oriented at 11:30 (i.e., 90° to the previousstimulus), and the field was stopped above andbelow. Cell no. 6, whose records are illustrated inFigs. 23 through 26, responded to both stimulusorientations (though it will be recalled that herethere was some doubt as to just what it was aboutthe horizontal tongue that activated this cell). Inthe same figure a similar sequence is formed bycells no. 1 to no. 3: cell no. 1 had a complex field ori-ented at 2:00, no. 2 was hypercomplex andresponded to 2:00 and 11:00 orientations (describedin Figs. 21 and 22), and no. 3, recorded simultane-ously with no. 2, responded only to a 2:00 edgestopped on the left.
The few dual-orientation hypercomplex cellsthat we have studied (11 in all) have all occurred insequences of this type. Such sequences may thusrepresent a different type of column, containingcomplex and hypercomplex cells with either of two
receptive-field orientations 90° apart, and alsohigher order complex cells responding to bothstimulus orientations. If these columns are a dis-tinct kind within visual III, it would be interestingto know whether they are scattered among theordinary visual III columns, or are groupedtogether, as Figs. 30 and 31 would seem to suggest.
RELATIONSHIP BETWEEN NEIGHBORING COLUMNS.In most penetrations through visual areas II and IIIthere was no obvious relation between receptive-field orientations of cells in neighboring columns.Just as in visual I, however (14), there were a fewstartling exceptions. In the experiment of Fig. 32the electrode passed obliquely down the lateralbank of the postlateral gyrus, with the usual verygradual outward drift of receptive fields, typical forvisual II, beginning in this case at about 10° and end-ing some 20° out from the area centralis. The shiftsin orientation were meanwhile highly regular.Each shift was small and clockwise, except for thebrief reversal in direction between cells 15 and 16,and the large shift in orientation between 13 and 14.We conclude that at least some groups of columnsin visual II are organized in a regular way.
In this example one is struck by the minutewidths of the columns, at least in the coronal plane:it is unusual to find a shift of orientation at almostevery new unit (cf. Figs. 1 and 2, for example). Ittherefore seemed worth asking whether theremight not be some relation between the shifts inorientation and the radial fiber bundles. Closeexamination of Nissl sections in the region betweenthe middle and lower lesions suggested that therewere in the order of 30 radial fiber bundles andassociated cell fascicles. Within this area, betweencells 15 and 25 (a distance of ca. 0.6 mm.), about 10clockwise shifts in orientation were detected. Sincethere may have been more shifts in orientationthan were actually observed, it is at least possiblethat each of the radially oriented anatomical subdi-visions represented a column. The columns maythus be no more than about 20 (J,. across, though itis not known whether this would represent thediameter of a more or less circular cylinder, or, asseems more likely, the width of a slab-shaped struc-ture of long, narrow cross section (14). No surfacemapping has been done in visual II or III, but tojudge from oblique microelectrode penetrations,the columns in these two areas, like those in visual

Fig. 30. Single penetration part way through visual III. All cells were hypercomplex, with double-stoppedfields,except for no. 7, which was complex. First nine cells were apparently in the same column, within which orien-tations 2:30 and 5:30 were both represented. For hypercomplex cells, interrupted rectangles indicate roughly theregions from which responses were evoked, where these were mapped. Cells 1—4, 8—10, and 12-14 responded bestto dar\ tongues; 5, 6, and 11 to double-stopped dar\ bars. Cells 4 and 5, 6 and 7, and 11 and 12 were simulta-neously recorded pairs. All receptive fields were located in or near the area centralis. Whether any of these fieldsextended beyond the vertical meridian into the ipsilateral half visual field is uncertain.
169

Fig. 31. Single oblique penetration through visual HI. The deeper of the two lesions is shoum in the Nissl sec-tion in upper left. Cells I and 8 were complex, 2-7 hypercomplex. Units 2 and 3 were recorded simultaneously.Conventions as in previous figures.
170

Fig. 32. A.

Fig. 32. Oblique penetration through visual II. The middle and final lesions areindicated by arrows on the Nissl section (lower left); this final lesion is also seenin the myelin section (lower right). In diagrams of complex receptive fields (1-6,8,10-12, 14,15, 18-25) the length of a stimulus indicates the breadth of the field,the arrow indicates the field length and the preferred direction of movement, ifany. For the hypercomplex receptive fields, the diagrams of the optimal stimulus
suggest the breadth of the excitatory part of the field; the interrupted line, thebreadth of the inhibitory area; the arrow, the field length and the preferred direc-tion of movement. Note 1) the gradual tendency of fields to move out toward theperiphery; 2) the steady systematic clockwise rotation of receptive-field orienta-tion, illustrated in the circular diagram to the left of the tracing of the brain sur-face.

Fig. 33. A: myelin-stained section showing lesion in area 17, made for the purpose of studying degeneratingfibers. Stab wound made by needle can be seen extending down medial aspect of lateral gyrus (arrow). Note alsothe transition between 17 and 18, indicated by coarser pattern of my elinatedfibers. (Loyez stain.) B: Nauta stainof a section close to A, showing degenerating fibers leaving in the radial fiber bundles. Brain perfused 10 days
after lesion was made.
173

174 PART III NORMAL PHYSIOLOGY AND ANATOMY
1mm
Fig. 34. Same brain as in Fig. 33. Camera-lucida tracings of degenerating fibers (broken lines) in lateral andsuprasylvian gyri. Lesion is shown in B, C, and D as the blac^ area in the right hemisphere. The four sectionsare taken approximately 750 ]U. apart.
I, can have cross-sectional diameters of up to about0.5 mm.
Receptive-Field PositionAs described in PART i, during an oblique penetra-tion or in a penetration parallel to the cortical lay-
ers, the receptive fields of successively recordedcells tended to drift across the retina in an orderlyfashion, in accordance with the topographicalmapping of visual fields onto the cortex. In visual IIand III, as in visual I (13), this topographic orderli-ness did not hold down to the cellular level. In pro-
CONTRALATERAL IPSILATERAL
Cat Prestriate Areas, 18 and 19 175
ceeding from cell to cell in a single penetration thepositions of successively mapped receptive fieldswere instead staggered in an apparently randomway (Figs. 1 through 4, 29 through 31). Even incrossing a single column or several columns therewas never any clear change in average receptive-field position. Only in very long penetrations (Figs.1 through 3, etc.), traversing many columns, was anet change in receptive-field position seen againstthe otherwise random staggering. In a penetrationperpendicular to the surface, as the electrodeadvanced from surface to white matter, there wasno net change in receptive-field position. Whentwo or three cells were recorded simultaneouslythey had receptive fields in the same general part ofthe retina, differing slightly in their positions, butusually overlapping. The area over which fields ofcells in a single column were dispersed in thisapparently random way was of the same order asthe area occupied by the largest receptive fields inthe column. For a column in the part of the cortexrepresenting the area centralis, the upper limit ofreceptive-field size was small (perhaps about 3°),and so was the variation in position; whereas inregions representing peripheral retina, field sizeand variation in position both tended to be larger.The correlation between field size and dispersionwas especially impressive in visual area II, whereperipheral receptive fields tended to be very largeand widely scattered (see Fig. 3, upper part of pen-etration IV).
In summary, a column is defined as a regionwithin which cells have a common receptive-fieldorientation (with the one exception describedabove). These cells differ in their ocular domi-nance, in the details of the organization of theirfields, and, to a small extent, in the retinal positionsof their fields. A given region of retina must be rep-resented by a number of columns, corresponding tothe different possible orientations. In experimentslike that of Fig. 32 one can distinguish at least10—15 orientations, so that this would be a possiblelower limit for the number of columns required torepresent any given small retinal area.
Part IV. Projections from Striate Cortex toOther Cortical Areas
The findings of the preceding sections are difficultto interpret without information on the intercon-
nections of areas 17, 18, and 19. It would be espe-cially desirable to know, for example, whether area17 sends direct connections to 18 and 19. To learnmore about the projections of 17 to other corticalareas we accordingly made small lesions in area 17in six cats, and subsequently traced degeneratingfibers by the method of Nauta and Gygax (22). Inthree cats the lesions were made in the interhemi-spheric segment of the lateral gyrus; in the otherthree they were made further back, in the medialaspect of the exposed part of the postlateral gyrus.To determine the boundaries of 17, 18, and 19, sec-tions were stained at 1/2-mm. intervals withmyelin and Nissl stains.
The results of an anterior lesion are illus-trated in Figs. 33 and 34. In this experiment thecortex was simply stabbed with a 25-gauge hypo-dermic needle. The track began 1—2 mm. medial tothe boundary between 17 and 18 (as determinedfrom adjacent Nissl- and myelin-stained sections;Fig. 33/1), and extended for about 3 mm. in a direc-tion almost tangential to the layers of the cortex.Silver stains showed degenerating axons in largenumbers fanning out from the site of the lesion,many following the direction of the radial fiberbundles and proceeding toward white matter (Fig.33#), many others streaking through the cortextoward area 18, seemingly by as direct a route aspossible (Fig. 34, B and C). In serial sections someof the axons could be followed down through thewhite matter as far as the corpus callosum, andthen across and up the other side; others were lostdeep in white matter, and were presumed to bebound for subcortical structures. On the side of thelesion large numbers of degenerating axons werefound in three areas: 1) A region confined to 18,extending laterally from a point close to the bound-ary between 17 and 18, along the lateral gyrus forabout 1—2 mm.; axons could often be traceddirectly in single sections from the lesion to thisarea. 2) A region in the lateral wall of the lateralgyrus, well within area 19. 3) A region confined tothe lateral wall of the suprasylvian gyrus, chiefly inits lower half. In each of these three areas thedegeneration was maximal a few millimeters ante-rior to the site of the lesion, and extended for onlyseveral millimeters in an anterior-posterior direc-tion. The fibers entered the cortex obliquely oreven almost tangentially, showing no tendency toassume the orderly radial pattern that might beexpected from examining Nissl- or myelin-stained

176 PART III NORMAL PHYSIOLOGY AND ANATOMY
sections of these regions. This contrasted stronglywith the pronounced radial pattern of the fibersleaving area 17, shown in Fig. 33B. In the con-tralateral hemisphere degenerating fibers werefound in the most medial millimeter or so of area18. The border between 17 and 18 was not sharpenough, even in the myelin-stained sections, toexclude the possibility of some projections to con-tralateral 17. If any fibers did reach 17, they wereconfined to a small area near the 17—18 border; nofibers were seen on the medial (interhemispheric)segment. Thus there is no evidence for a set of con-nections linking homologous regions of 17 on thetwo sides (see DISCUSSION). Some contralateral pro-jections were also found in 19 and in the lateralwall of the suprasylvain gyrus.
In the experiment of Figs. 35 and 36 an elec-trolytic lesion was made with a microelectrode deepin the cortex of the interhemispheric segment of thepostlateral gyrus, in layers 5 and 6, well within area17, probably in a portion receiving projections fromthe contralateral visual field 4—8° out along the hor-izontal meridian (13: Text-fig. 13). No recordingswere made, and the electrode was withdrawn im-mediately after the current was passed. The result-ing lesion was roughly 125 (I. in diameter (Fig. 35/1).Compared with acutely made electrolytic lesions(9), those in which several days elapsed before thedeath of the animal showed a dense infiltration withphagocytes and glial cells. At the level of the lesionthere was again a massive outpouring of fibersdirected radially toward white matter, and a muchsparser group of fibers coursing through 17 in alldirections for about 1—2 mm. tangentially andobliquely, extending superficially at least to the sec-ond layer. A few fibers heading down obliquelyalong the medial wall of the hemisphere appearedbound for white matter; otherwise there were nodegenerating fibers in distant parts of area 17.
Again three discrete regions of cortex werefound in the ipsilateral hemisphere, in area 18, area19, and along the medial wall of the suprasylviansulcus (Fig. 36). It is interesting to notice how theprojection to 19 moves, in sections taken at pro-gressively more posterior levels, from the lateralbank of the lateral gyrus (Fig. 36/4) to the crest ofthe interlateral accessory gyrus (B), and finally tothe medial part of the posterior suprasylvian gyrus(C). These are precisely the areas occupied by visualIII in physiological experiments (Fig. 37). Thusstudies of Nissl-stained and myelin-stained mate-
rial and experiments with silver degeneration allcorrelate well with the physiological findings.
In posterior sections, fibers projecting to thelateral bank of the suprasylvian gyrus came tooccupy a higher position in the sulcus, and the gapbetween this area and the degeneration in 19 nar-rowed so that the two almost coalesced. In boththese regions the degeneration was again at a levelslightly anterior to the lesion, and extended over anarea of cortex only a few millimeters in diameter.In this brain, stains of the contralateral hemispherewere unsatisfactory.
Almost identical results were obtained fromthe other four experiments. In summary, then, agiven small region of area 17 gives cortical projec-tions to at least three small discrete regions in theipsilateral and contralateral hemispheres; one inarea 18, one in 19, and a third in a region of cortexoccupying the lateral bank of the suprasylviangyrus.
These results appear to be similar to thosegiven in a preliminary account by Policy andDirkes (25), except that they found degeneration inarea 17 of the contralateral hemisphere. The find-ings are difficult to compare, however, withoutmore detailed information on where their lesionswere placed.
The projection to the lateral wall of the supra-sylvian gyrus seems to involve precisely the areafrom which Clare and Bishop (1) recorded re-sponses to stimulation of the optic nerve and thestriate cortex (see also 5, 29). As to areas 18 and 19,we conclude that these are "higher" visual areas, inwhich messages from 17 are further elaborated.Whether 18 and 19 are interconnected, or whetherthey receive projections from other parts of thevisual pathway (tectum, thalamus, etc.), are mat-ters for future anatomical studies.
DISCUSSION
Cortical Visual AreasTo casual inspection one of the striking features ofthe cerebral cortex is its relative anatomical unifor-mity. It is true that there are occasional abrupt andobvious transitions, such as occur between somaticsensory and motor cortex, or in primates betweenareas 17 and 18. On the other hand, there are largeareas in which variations in structure as seen withNissl or myelin stains are more subtle, requiring
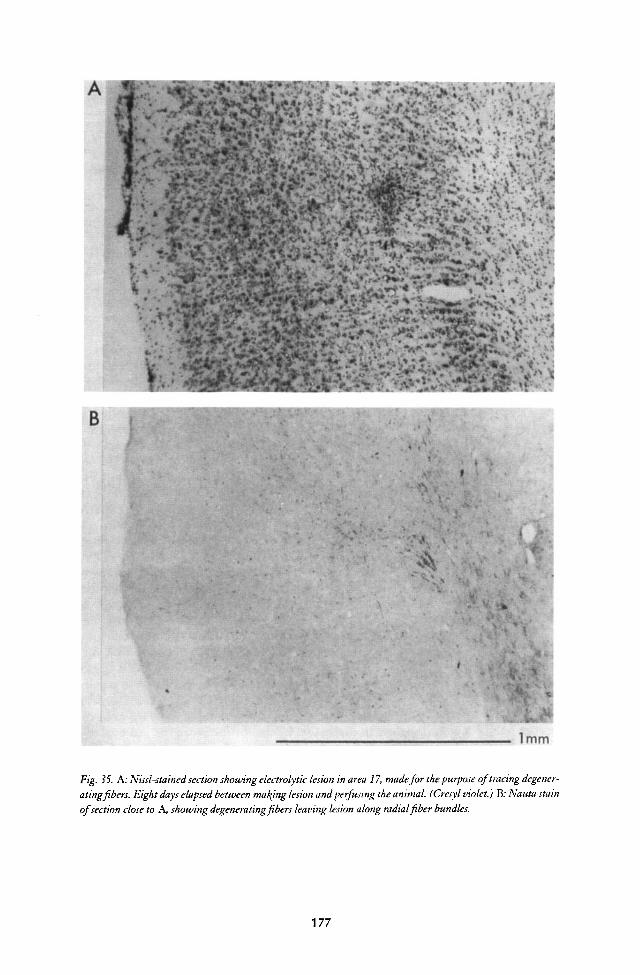
Fig. 35. A: Nissl-stained section showing ele ctrolytic lesion in area 17, made for the purpose of tracing degener-ating fibers. Eight days elapsed between making lesion and perfusing the animal. (Cresyl violet.) B: Nauta stainof section close to A, showing degenerating fibers leaving lesion along radial fiber bundles.
177
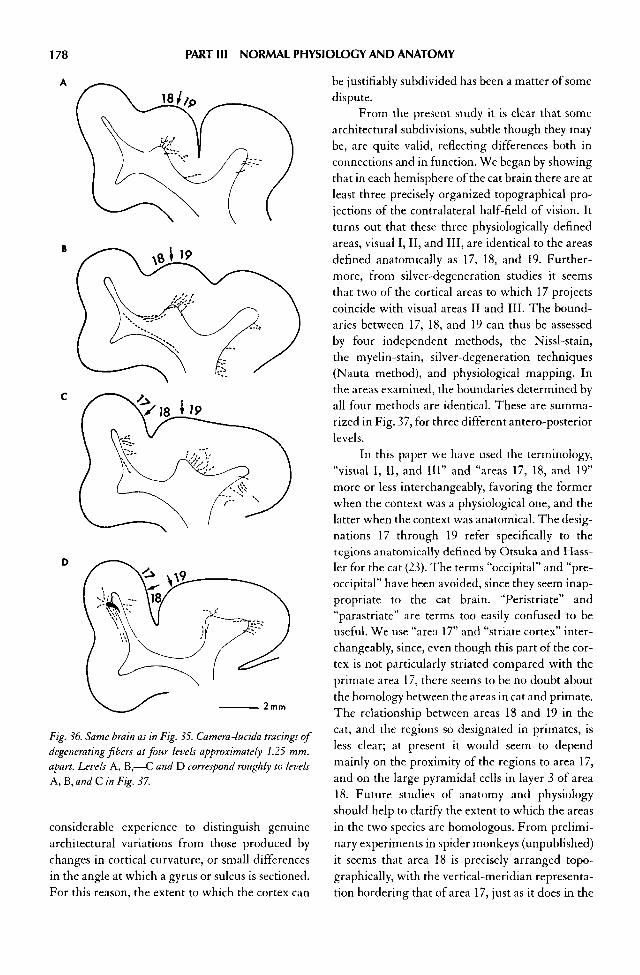
178 PART III NORMAL PHYSIOLOGY AND ANATOMY
Fig. 36. Same brain as in Fig. 35. Camera-lucida tracings ofdegenerating fibers at four levels approximately 1.25 mm.apart. Levels A, B,—C and D correspond roughly to levelsA, 'Q, and C in Fig. 37.
considerable experience to distinguish genuinearchitectural variations from those produced bychanges in cortical curvature, or small differencesin the angle at which a gyrus or sulcus is sectioned.For this reason, the extent to which the cortex can
be justifiably subdivided has been a matter of somedispute.
From the present study it is clear that somearchitectural subdivisions, subtle though they maybe, are quite valid, reflecting differences both inconnections and in function. We began by showingthat in each hemisphere of the cat brain there are atleast three precisely organized topographical pro-jections of the contralateral half-field of vision. Itturns out that these three physiologically definedareas, visual I, II, and III, are identical to the areasdefined anatomically as 17, 18, and 19. Further-more, from silver-degeneration studies it seemsthat two of the cortical areas to which 17 projectscoincide with visual areas II and III. The bound-aries between 17, 18, and 19 can thus be assessedby four independent methods, the Nissl-stain,the myelin-stain, silver-degeneration techniques(Nauta method), and physiological mapping. Inthe areas examined, the boundaries determined byall four methods are identical. These are summa-rized in Fig. 37, for three different antero-posteriorlevels.
In this paper we have used the terminology,"visual I, II, and III" and "areas 17, 18, and 19"more or less interchangeably, favoring the formerwhen the context was a physiological one, and thelatter when the context was anatomical. The desig-nations 17 through 19 refer specifically to theregions anatomically defined by Otsuka and Hass-ler for the cat (23). The terms "occipital" and "pre-occipital" have been avoided, since they seem inap-propriate to the cat brain. "Peristriate" and"parastriate" are terms too easily confused to beuseful. We use "area 17" and "striate cortex" inter-changeably, since, even though this part of the cor-tex is not particularly striated compared with theprimate area 17, there seems to be no doubt aboutthe homology between the areas in cat and primate.The relationship between areas 18 and 19 in thecat, and the regions so designated in primates, isless clear; at present it would seem to dependmainly on the proximity of the regions to area 17,and on the large pyramidal cells in layer 3 of area18. Future studies of anatomy and physiologyshould help to clarify the extent to which the areasin the two species are homologous. From prelimi-nary experiments in spider monkeys (unpublished)it seems that area 18 is precisely arranged topo-graphically, with the vertical-meridian representa-tion bordering that of area 17, just as it does in the

Cat Prestriate Areas, 18 and 19 179
Fig. 37. Composite diagram showing coronal sections at three antero-posterior levels through visual areas I, II,and III (or 17, 18, and 19). Boundaries are based on several criteria, including histology as studied in Nissl- andmy elm-stained sections, distribution of projections from area IT to nonstriate visual cortex by the silver-degen-
eration technique, and physiological recordings.
cat. Similar results have been reported for thesquirrel monkey and the rhesus monkey by Cowey(2).
In the rabbit, visual areas I and II have beenprecisely mapped by the method of evoked poten-tials by Thompson, Woolsey, and Talbot (28). Sofar the two visual areas have not been correlatedwith cytoarchitectonics. As in the cat, visual II wassituated anterolateral to visual I, with the verticalmeridian projecting to the boundary between thetwo. Visual II was more extensive in the rabbitthan in the cat, and there was a smaller region ofbinocular projection, reflecting the more lateralposition of the rabbit's eyes.
We have limited our comparison betweenphysiological mapping and cytoarchitecture to thepart of the cat cortex indicated in Fig. 37. No stud-ies were made of the posterior portions of 17, 18,and 19, where the superior visual fields presumablyhave their representation. Neither have we any
information on the cortical area that adjoins 17deep in the splenial sulcus, a region that Otsukaand Hassler designate as 19. For the present wetentatively assume that the entire visual II lies lat-eral to visual I; whether, as the cytoarchitecturalstudies suggest, some of visual III lies next to visualI in the splenial sulcus—i.e., whether some parts ofthe visual fields have their visual III representationthere and not lateral to visual II—remains to bedetermined.
As many authors have stressed (20, 23), thelateral boundary of area 17 in the cat is often diffi-cult to define sharply, especially in Nissl sections.Myelin stains are usually helpful, for in these thetransition is seen as an abrupt coarsening of theradial efferent fibers (23; see also Figs. 3, 4, 32), andas an increase in the proportion of obliquely run-ning fibers. The difficulty in pinpointing this 17-18border, added to possible variations from cat to cat,probably accounts for the differences in position
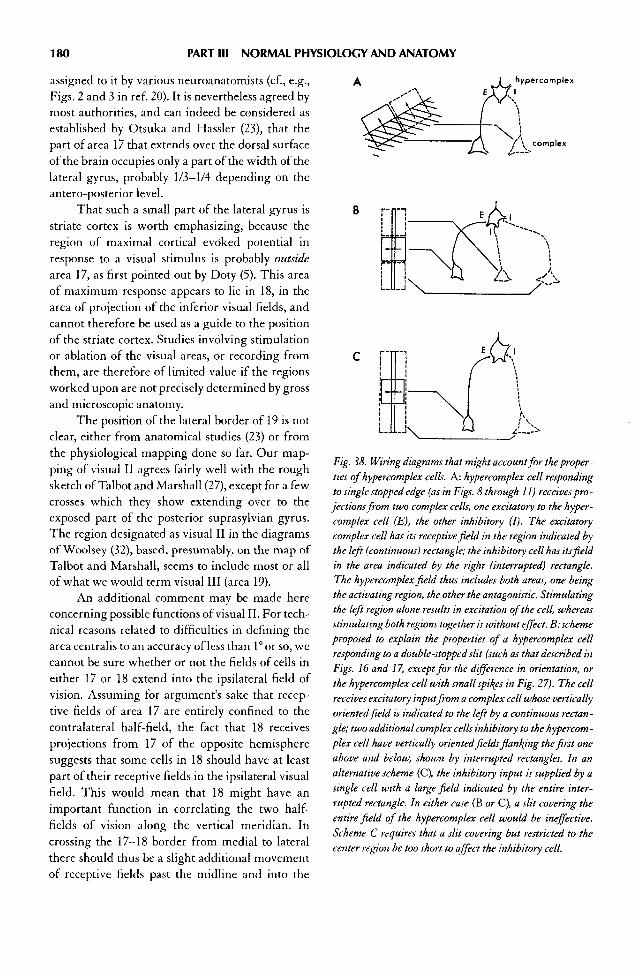
180 PART III NORMAL PHYSIOLOGY AND ANATOMY
assigned to it by various neuroanatomists (cf., e.g.,Figs. 2 and 3 in ref. 20). It is nevertheless agreed bymost authorities, and can indeed be considered asestablished by Otsuka and Hassler (23), that thepart of area 17 that extends over the dorsal surfaceof the brain occupies only a part of the width of thelateral gyrus, probably 1/3—1/4 depending on theantero-posterior level.
That such a small part of the lateral gyrus isstriate cortex is worth emphasizing, because theregion of maximal cortical evoked potential inresponse to a visual stimulus is probably outsidearea 17, as first pointed out by Doty (5). This areaof maximum response appears to lie in 18, in thearea of projection of the inferior visual fields, andcannot therefore be used as a guide to the positionof the striate cortex. Studies involving stimulationor ablation of the visual areas, or recording fromthem, are therefore of limited value if the regionsworked upon are not precisely determined by grossand microscopic anatomy.
The position of the lateral border of 19 is notclear, either from anatomical studies (23) or fromthe physiological mapping done so far. Our map-ping of visual II agrees fairly well with the roughsketch of Talbot and Marshall (27), except for a fewcrosses which they show extending over to theexposed part of the posterior suprasylvian gyrus.The region designated as visual II in the diagramsof Woolsey (32), based, presumably, on the map ofTalbot and Marshall, seems to include most or allof what we would term visual III (area 19).
An additional comment may be made hereconcerning possible functions of visual II. For tech-nical reasons related to difficulties in defining thearea centralis to an accuracy of less than 1° or so, wecannot be sure whether or not the fields of cells ineither 17 or 18 extend into the ipsilateral field ofvision. Assuming for argument's sake that recep-tive fields of area 17 are entirely confined to thecontralateral half-field, the fact that 18 receivesprojections from 17 of the opposite hemispheresuggests that some cells in 18 should have at leastpart of their receptive fields in the ipsilateral visualfield. This would mean that 18 might have animportant function in correlating the two half-fields of vision along the vertical meridian. Incrossing the 17—18 border from medial to lateralthere should thus be a slight additional movementof receptive fields past the midline and into the
Fig. 38. Wiring diagrams that might account for the proper-ties of hype rcomplex cells. A: hypercomplex cell respondingto single stopped edge (as in Figs. 8 through 11) receives pro-jections from two complex cells, one excitatory to the hyper-complex cell (E), the other inhibitory (I). The excitatorycomplex cell has its receptive field in the region indicated bythe left (continuous) rectangle; the inhibitory cell has its fieldin the area indicated by the right (interrupted) rectangle.The hypercomplex field thus includes both areas, one beingthe activating region, the other the antagonistic. Stimulatingthe left region alone results in excitation of the cell, whereasstimulating both regions together is without effect. B: schemeproposed to explain the properties of a hypercomplex cellresponding to a double-stopped slit (such as that described inFigs. 16 and 17, except for the difference in orientation, orthe hypercomplex cell with small spikes in Fig. 27). The cellreceives excitatory input from a complex cell whose verticallyoriented field is indicated to the left by a continuous rectan-gle; two additional complex cells inhibitory to the hypercom-plex cell have vertically oriented fields flanging the first oneabove and below, shown by interrupted rectangles. In analternative scheme (C), the inhibitory input is supplied by asingle cell with a large field indicated by the entire inter-rupted rectangle. In either case (B or C), a slit covering theentire field of the hypercomplex cell would be ineffective.Scheme C requires that a slit covering but restricted to thecenter region be too short to affect the inhibitory cell.

Cat Prestriate Areas, 18 and 19 181
ipsilateral field, prior to a movement in the reversedirection. We have no evidence yet that this occurs.An absence of projections linking correspondingparts of area 17 in the two hemispheres wouldmake good sense, especially for parts of 17 notadjoining 18, since it is difficult to imagine whycells having receptive fields in a particular part ofthe visual field should have connections with othercells in the contralateral hemisphere, with fields ina mirror position in the other half-field of vision.Previous studies of this subject, anatomical (26) andphysiological (3,6), have been somewhat contradic-tory, and it is hard to evaluate them because ofchanging notions about the exact definition andlocation of 17, 18, and 19 in the cat.
Schemes for Elaboration ofHypercomplex FieldsWith areas 18 and 19 well established as anatomi-cal and physiological entities, and with the evi-dence that area 17 sends strong projections to bothof them, it is natural to ask what further processingof the visual messages takes place in 18 and 19. Inboth areas a proportion of cells seem to have prop-erties identical to those of higher order cells of area17—i.e., they have complex properties. Complexcells are in the great majority in visual II, and seemto form about half the population in visual III. Invisual II the very large size of some receptive fieldssuggests that one cell may receive input from anumber of fibers from the striate cortex. Theseincoming fibers would presumably all have thesame receptive-field orientation and a similar pref-erence as to form of stimulus (slit vs. bar, etc.); theywould only need to differ from one another in theirprecise receptive-field positions. In visual III, onthe other hand, complex cells did not differ in anyobvious way from cells of visual I, so that one neednot propose any extensive convergence of afferentsonto complex cells.
Since the next step in complexity is repre-sented by the hypercomplex cell, it seems reason-able to try to interpret hypercomplex properties byassuming that these cells receive their afferentsfrom complex cells. To see how this might work, itmay be useful to contrast complex properties withhypercomplex. With complex cells the responsesare more vigorous the longer the stimulus line,until the stimulus reaches the boundaries of thereceptive field. Beyond this it makes no difference
how long the stimulus is. There is, in other words,summation across the entire receptive field in thedirection of the receptive-field orientation. Withhypercomplex cells of lower order (Figs. 8 through27) a similar summation occurs in one portion ofthe field, which can be loosely termed excitatory. Ifthe stimulus extends beyond this part intoinhibitory regions the response no longer increases,but, on the contrary, is suppressed, and a line cross-ing the entire receptive field is indeed usually inef-fective. Here one can speak of excitatory andinhibitory subdivisions of a hypercomplex field, orperhaps better, an activating region and an antago-nistic one, provided it is clearly understood that itis not simple illumination of these regions thatdetermines whether the cell is excited or itsresponse prevented. Each region by itself is typi-cally complex, i.e., a cell responds when an appro-priately oriented line (slit, bar, or edge) is shone ormoved anywhere within the activating area, andthe response is prevented with similar and simulta-neous stimulation of the antagonistic region. Sum-mation occurs in each region, in the sense thatwithin one region the longer the line the greater itseffect; mutual antagonism occurs in the sense thatadequate stimulation of the activating region is off-set by adequate stimulation of the opposing one.Summation and mutual antagonism thus occuronly along the direction of the receptive-field ori-entation, and not in any simple spatial sense, as is sofor simple cortical cells and cells at lower levels. Inhypercomplex cells it is of course the similarity ofthe orientation of the two opposing subdivisions ofthe field that makes a long straight line ineffective,and a stopped line, properly placed and oriented,the most effective stimulus.
It is perhaps worth emphasizing this distinc-tion between a pair of antagonistic regions withineach of which simple areal summation occurs, anda pair of antagonistic regions with more complexproperties. It has recently been suggested that theretinal ganglion cells in the frog termed "convexedge detectors" by Lettvin and colleagues (17) havereceptive fields with an excitatory center and aninhibitory surround (7). To judge from the ac-counts of Lettvin and co-workers it seems likelythat if the fields in question have a center-surroundorganization it is only in some highly complexsense. They seem to be quite different from retinalganglion cells or geniculate cells in the cat, and

182 PART III NORMAL PHYSIOLOGY AND ANATOMY
indeed they may have a complexity approachingthat of hypercomplex cells in areas 18 and 19.
The properties of a hypercomplex cell aremost easily explained by supposing that the affer-ents to the cell are complex, and that some synapsesare excitatory and others inhibitory. It is only neces-sary to assume that the excitatory input is a complexcell (or perhaps more than one) with a receptivefield identical in position and arrangement to theexcitatory or activating part of the hypercomplexfield, and that inhibitory inputs originate fromcomplex cells with fields in the territory of theantagonistic flanks. This general scheme is illus-trated in Fig. 38. The simplest case, that of a cellwith its field stopped at only one end, is given in Fig.38/1; the cell could be the one illustrated in Figs. 8through 11. Only two afferent cells are shown, anexcitatory and an inhibitory, but there might bemany of each type. In Fig. 38, B and C, two possiblearrangements are suggested to account for theproperties of a double-stopped hypercomplex cell(see Figs. 16 through 20, and 27). Figure 385requires two inhibitory cells, or sets of cells, bothcomplex, with their fields covering the two flankingareas. In an alternative scheme (Fig. 38C), thehypercomplex cell receives an excitatory input froma complex cell whose field covers the activating cen-ter, as before, and an inhibitory input from a singlecomplex cell with a field having the same size andposition as the entire hypercomplex field, both cen-ter and flanks. This arrangement could only workefficiently if the inhibitory afferent gave a goodresponse to a long slit, but little or no response to astimulus confined to the activating area. This wastrue for the complex cell (large spikes) of Fig. 27,which responded well to a large slit, but not to asmall one. Except for the difference in ocular dom-inance, one might imagine that the two simultane-ously recorded cells in Fig. 27 were interconnected,the complex cell sending inhibitory connections tothe hypercomplex one.
In the schemes just proposed, the highly spe-cific properties of hypercomplex cells in 18 and 19seem to demand highly specific sets of connectionsfrom lower order cells. Compelling evidence tosupport the schemes is given by the functionalarchitecture of visual II and III. As we have shown,these areas, like visual I, are subdivided intocolumns each containing complex and hypercom-plex cells with identical receptive-field orientations
and a certain variation in receptive-field position—in short, the very cells that the physiology predictedshould be interconnected. It is known from Golgipreparations of the cortex that cells within a regionhaving the size and shape of a column would in factbe richly interconnected. As in area 17, then, themorphological anatomy, the functional architec-ture, and the single-cell physiology all seem to becompletely consistent. The columns of areas 18 and19, like those of 17, may be considered as functionalunits of cortex, there being many interconnectionsbetween cells of one column, far fewer betweencells of adjacent columns. The main purpose of theaggregation of cells into columns is presumably anenormously efficient reduction in the lengths ofthese connections.
Hypercomplex Cells of Higher OrderAn even higher degree of complexity, and stillanother example of a correlation between responseproperties and functional architecture, is providedby the cells in area 19 that responded to two orthog-onal stimulus orientations. The simplest mecha-nism for the dual receptive-field orientation wouldinvolve convergence upon the cell of two sets ofafferent hypercomplex cells having their receptive-field orientations 90° apart. Cells with dual orienta-tion seemed to occur within columns that also con-tained complex and lower order hypercomplexcells, some having one receptive-field orientation,others an orientation at right angles to the first. Itseems, in fact, that here again the very cells that thephysiological experiments suggest are intercon-nected are aggregated in columns. Perhaps itshould be stressed, however, that our notions aboutthese higher order cells and the columns contain-ing them are tentative, based as they are on a veryfew cells (11 in all), in only three penetrations.Experiments with more cells and penetrations mayhelp to settle a number of questions, especially therelation, within visual area III, between thesecolumns and ones in which a single orientation isrepresented.
A second quite different type of higher ordertransformation was seen in several cells. The cellrecorded in Figs. 23 and 24 responded best to adouble-stopped edge with a sharply defined orien-tation and length (Fig. 24). This was no ordinaryhypercomplex cell, however, since there was nodivision of its field into excitatory and inhibitory

Cat Prestriate Areas, 18 and 19 183
areas, and since it responded to movement over anarea many times the width of the optimum stimu-lus (Fig. 23), so that the hypercomplex propertieswere, in a sense, generalized in the direction of thereceptive-field orientation. (A similar generaliza-tion was probably also present, though to a lesserextent, in the higher order hypercomplex field ofFigs. 21 and 22.) Such behavior could obviously beexplained by imaging a convergence of many lowerorder hypercomplex cells onto a cell of higherorder, the afferent cells differing only with respectto the exact positions of the boundaries betweencenters and flanks. This convergence could occurin the same columns in which the lower orderhypercomplex properties were elaborated.
The phenomenon of progressive attenuationof responses shown by this cell (Fig. 26) is one thatwe have seen from time to time in all three visualareas. Here it was clearly not a question of progres-sive unresponsiveness of the cell itself, since theresponses came back as soon as the stimulus wasintroduced in a new part of the receptive field. Pre-sumably the failure was somewhere along one par-ticular pathway leading to the cell. Lettvin et al.(18) have found cells with somewhat similar behav-ior in the frog tectum.
Transformations in the ThreeVisual AreasWe have already referred, in the first part of thisDISCUSSION, to the relative structural uniformity ofthe cerebral cortex. It seems astonishing that neuralaggregations so similar in organization can be con-cerned with functions so diverse as vision, audition,somatic sensation, and motor movements. It be-comes important to learn whether the anatomicalsimilarity of the different cortical areas reflectscommon functional features. For this reason itseems worth while to compare the different trans-formations that occur in visual areas I, II, and III.
In the striate cortex one can distinguish twosuccessive processes of convergence, each involvingmany excitatory afferents. The convergence ofincoming geniculate fibers onto a simple cell isapparently such that the cell responds maximallyonly when most of the excitatory afferents aresimultaneously activated. A spot is a feeble stimu-lus, but a slit may be a powerful one; if the cell hasconnections with the two eyes, a maximal responseoccurs only when the eyes are stimulated together.
The result of the process is an enormous increase inspecificity, each cell requiring a particular stimulusposition, shape, and orientation, and preferablystimulation of both retinas. This increased special-ization is attained by an immense increase in thenumber of cells, and through multiple branchingof the afferent fibers. At the next stage, from sim-ple to complex cells in the striate cortex, the con-vergence is again excitatory, but with the differ-ence that for activation of the complex cell only asmall proportion of the afferents need be activatedat any one time. For example, a slit becomes effec-tive wherever it is shone within the receptive field,and, for reasons not clear, two parallel slits shone inthe same receptive field seldom give a more power-ful response than either by itself. On the otherhand, sequential activation of the afferents bymovement of a line across the field is generally avery powerful stimulus, perhaps partly becausenone of the antecedent cells has time to adapt. Thetransformation from simple receptive field to com-plex involves a generalization of one of the quali-ties of the stimulus, namely its orientation.
In 18 and 19 a still different mode of conver-gence takes place, apparently one in which excita-tory and inhibitory influences come together onone cell. Here the result is again to increase stimu-lus specificity, rather than to generalize. Thehypercomplex cell does not necessarily respond to aproperly oriented line crossing the receptive field;it accepts only a line that is appropriately termi-nated. A line covering the entire field presumablyactivates two processes that mutually cancel to anamazingly precise degree. This powerful mecha-nism for enhancing stimulus specificity has alreadybeen encountered in two different contexts in themammalian visual system. In the retina, the genic-ulate, and the striate cortex, it is used to discrimi-nate against diffuse light in favor of patternedstimulation; in the monkey retina it is used toenhance specificity of the response to certain mono-chromatic wavelengths at the expense of othersand of white light. Analogous mechanisms involv-ing inhibition are known to occur in the soma-tosensory and auditory systems.
The next step, shown in the example of Figs.23 and 24, and seen so far only in a few penetrationsin area 19, seems again to be one of convergence ofexcitatory afferents. For the higher order hyper-complex cell to respond, the line must now be

184 PART III NORMAL PHYSIOLOGY AND ANATOMY
properly oriented (sometimes with two possibleorientations 90° apart) and limited in its extent, asbefore, but it need not necessarily be accuratelyspecified as to position. Still more generalizationhas taken place, this time along a direction parallelto the receptive-field orientation, i.e., at rightangles to the direction of generalization in thetransformation from simple cells to complex. Hereagain the convergence must be such that one onlyneed activate small sets of antecedent hypercom-plex cells in order to activate the higher order cell.The transformation is thus analogous to thatbetween simple and complex cells in the striate cor-tex. Indeed, there is an analogy between simplecells and lower order hypercomplex cells, withtheir centers and flanks and high specificity, andalso between complex and higher order hypercom-plex cells, in each of which generalization hastaken place.
Though these transformations show certainsimilarities in their details they also exhibit a con-siderable variety, and there seems to be no doubtthat impressive differences exist in the details ofconnections between one cortical area and the next.These differences are undoubtedly related to thecytoarchitectural distinctions between the variousareas. The common features are perhaps morefundamental—the occurrence of one or moreintricate transformations between incoming andoutgoing messages, taking place within a system ofmore or less independent columns with little lat-eral dissemination of information, and the possibil-ity of explaining the transformations by simple,relatively well-known neural mechanisms like thenerve impulse, excitatory and inhibitory synapses,convergence, and so on, with the strong indicationthat the connections are not random, but highlyspecified.
The highly structured and specific nature ofthese connections raises the question of their ori-gin, and in particular whether they are develop-mentally determined, or depend for their evolutionon visual experience after birth. For connections upto and including the striate cortex it is clear that thedevelopment is largely innate, since kittens shortlyafter birth and prior to any visual experience showvirtually the same response specificity as is found inthe adult (15). In some respects this seems quitenatural, since at these levels in the visual pathwayone is still dealing with what are undoubtedly
building blocks of perception, elements that wouldhardly be expected to differ from individual toindividual with experience (except for pathologicalearly experience such as results from sensory dep-rivation (30)). If this reasoning is valid for the stri-ate cortex, it is probably also valid for 18 and 19;one would expect to find the connections innatelydetermined there too. The experiments have notyet been done.
Columnar Organization of the CortexThe most conspicuous property common to thethree visual regions is to be found not in the detailsof the transformations that occur there, but in thecolumnar organization. Although Lorente de No(19) had emphasized the richness of the radial con-nections and the relative paucity of horizontal con-nections in the cortex, Mountcastle (21) was thefirst to show that one area of cortex, the somatosen-sory, was organized in discrete columnar regions,and to enunciate the principle that the column wasthe elementary unit of organization. This notionwas based on the anatomically known richness ofconnections between cells in a column, and theassumption that neighboring columns, containingcells that subserved entirely different sensory sub-modalities, were functionally independent. Ademonstration of columnar organization in theprimary visual cortex (13,14) showed that this planwas not unique to the somatosensory system. In thestriate cortex, furthermore, the subdivision intocolumns depended on more subtle criteria: not onthe submodality of the afferents, but rather on theconnections within the columns. The present studyshows that the columnar organization is not con-fined to sensory receiving areas, but holds also forcertain higher visual areas. Thus all four corticalareas in which functional architecture has beenexamined show a columnar organization; it wouldbe surprising if other cortical areas were not simi-larly subdivided. It is perhaps worth noting thatfunctional parcellations of gray matter nuclei havebeen found outside the cortex, for example by Pog-gio and Mountcastle (24) in the ventrobasal com-plex of the thalamus. These subdivisions, likecolumns in the somatosensory cortex, are definedby differences in submodality from one cell aggre-gate to the next. The lateral geniculate body pro-vides an extreme example of an especially coarseaggregation of cells within an otherwise function-

Cat Prestriate Areas, 18 and 19 185
ally uniform mass of gray matter: in the monkeythe small-cell and large-cell portions of the genicu-late are each parcellated into layers according toeye dominance. Perhaps it is a rule, in the centralnervous system, for sets of cells that are intercon-nected to be grouped together, and separated fromother similar groups with which they have few orno connections.
The most interesting aspect of columnarorganization, in the visual system at any rate, is theclear role that it appears to play in function. Theconcept of the column as a functional unit becomesmore vivid when the transformations occurringwithin it are known, and it is realized that the seg-regated cells are just those that must be intercon-nected to explain the transformations. Far frombeing a mere aggregation of cells with commoncharacteristics, the column emerges as a dynamicunit of function.
In the visual areas the columnar system canprobably be looked on as a solution to the problemof dealing with three independent variables—twoto specify a position on the retina, and the third forreceptive-field orientation—in a structure, the cor-tex, that is in a sense two-dimensional. If therewere four variables one might expect there to betwo columnar systems, superimposed, as it were;this in fact appears to be the case in the monkeystriate cortex where cortical subdivisions depend-ing on ocular dominance are superimposed on thereceptive-field orientation columns (unpublished).
So far nothing has been said of the horizontalcortical subdivisions into layers, divisions that areanatomically far more obvious than the verticalcytoarchitectonic subdivisions. In area 17 there arestrong hints of physiological differences amonglayers (13), in that the fourth-layer cells seem to bealmost exclusively simple. In 18 and 19 the resultsare even less clear. Part of the reason for our igno-rance about the significance of layering is that inthe cat the boundaries between layers are notalways easy to find accurately in Nissl-stained sec-tions. Moreover, most layers contain a variety ofcell types, so that one cannot expect physiologicalproperties of cells in one layer to be uniform.Finally, it is technically difficult to localize a partic-ular cell along a given electrode track. For thesereasons we have deferred a study of this aspect ofthe physiology, with the hope that the problem may
be more easily undertaken in the monkey, wherethe layering is more clean-cut.
Implications for PerceptionIt remains to discuss the possible implications ofthis work for an understanding of perception. Thiscan be approached by asking what cells in a givenarea are responding to any particular part of animage. In the striate area cells respond to the con-tours of a form: most cells whose receptive fields lieentirely inside the homogeneous part of an imageare uninfluenced, since for them the stimulus is ineffect diffuse. A portion of the boundary of a figurewill activate that population of complex cellswhose receptive fields are not only crossed by theboundary but also oriented in the direction of theboundary. A segment of a curve will activate acomplex cell best if the tangent to the curve doesnot greatly change its direction within the recep-tive field. The impression of the homogeneousinterior of a figure as bright or dark is presumablyderived from the activity of cells whose fields coverthe boundaries, and from the lack of any signalsfrom cells whose fields are entirely within.
Hypercomplex cells are still more selective.From these cells continuous straight boundaries, orboundaries that curve to a negligible degree withinthe confines of a receptive field, evoke no response.There must be discontinuities such as interruptionsof a line or changes in direction. A simple imagelike a square activates only hypercomplex cellswhose fields include the vertices, and then only ifthe receptive-field orientations are appropriate.Awareness of a straight edge may thus be derivedfrom signals in hypercomplex cells activated by theends of the edge, plus the failure of other hyper-complex cells to signal other directional changes inthe edge. If perception of an entire line can arisesolely from information on changes in directionone may have an explanation for the "completion"phenomenon, in which patients with an occipitallobe lesion perceive a line as uninterrupted eventhough it crosses the blind part of the visual field.
The hypercomplex cell can, in a sense, serveto measure curvature; the smaller the activatingpart of the field, the smaller the optimal radius ofcurvature would be. To term such cells "curvaturedetectors" seems unwise, however, since the termneglects the importance of the orientation of thestimulus, and does not capture the essential impor-

186 PART III NORMAL PHYSIOLOGY AND ANATOMY
tance of a line stimulus to one region and theabsence of a line stimulus to an adjacent, antago-nistic region. Similar objections would apply toterms like "corner unit." The word "hypercom-plex," while ugly and unwieldy, and perhaps alsounwise in view of the possibility of finding evenmore complex cells, is at least relatively neutral.
Finally, it should perhaps be stressed that aproper understanding of the part played by any cellin a sensory system must depend not simply upon adescription of the cell's responses to sensory stim-uli, but also on a knowledge of how the informa-tion it conveys is made use of at higher levels. Justas one can better grasp the meaning of cells in theretina or geniculate, with their on-center or off-center fields, by knowing that such cells convergeon the more specific cells of area 17, so an under-standing of hypercomplex cells will be incompleteuntil we have a description of the cells they con-verge upon. How far such analysis can be carried isanyone's guess, but it is clear that the transforma-tions occurring in these three cortical areas go onlya short way toward accounting for the perceptionof shapes encountered in everyday life.
SUMMARY
In 1941 Talbot and Marshall (27) mapped the cat'svisual cortex by recording slow potentials evokedby small-spot stimulation of the retina. In eachhemisphere they found two separate but adjacentprojections of the contralateral field of vision,which they termed visual areas I and II. In record-ings from single cells we have confirmed thesefindings and have found a third systematic projec-tion (visual III) of the contralateral visual field bor-dering on and lateral to visual area II. In crossingvisual areas I, II, and III from medial to lateral, thecorresponding receptive-field areas in the con-tralateral visual field moved progressively into thevertical meridian, then out into the periphery ofthe visual field, and finally back into the verticalmeridian. On correlating the areas so mapped withmicroscopic anatomy as seen in Nissl- and myelin-stained sections, we conclude that the three visualareas are identical to areas 17,18, and 19, as definedin the cat by Otsuka and Hassler (23).
In experiments using silver-degeneration(Nauta) techniques, cells in area 17 (visual I) pro-
jected both to 18 and 19 bilaterally, suggesting thatvisual messages are transmitted from visual I tovisual II and III for further processing.
Cells in visual areas II and III, like those invisual I, responded best to line stimuli such as slits,edges, and dark bars; for optimum response theorientation of the stimulus was critical. The greatmajority of cells in visual II and half of the cells invisual III were "complex," in the sense that wehave used this term in visual I. Other cells, whichwe term "lower order hypercomplex," formed5—10% of the cells in visual II and about half ofthose in visual III. Finally, a few cells in visual IIIwith even more elaborate response properties weretermed "higher order hypercomplex."
A lower order hypercomplex cell, like a com-plex one, responded either to a slit, an edge, or adark bar, but the length of the stimulus had to belimited ("stopped") in one or both directions. Theadequate stimulus was thus a critically orientedline stimulus falling within a given region of retina(the "activating" region), provided a similarly ori-ented line did not fall over an adjacent ("antago-nistic") region. For a cell that responded to an edgelimited at one end only, a powerful stimulus wasthus a right-angle corner formed by two edges, oneof which fell across the activating region in theoptimum orientation, while the other fell on theboundary between the activating and the antago-nistic regions. A lower order hypercomplex cellthus behaved as though it received inputs from twocomplex cells (or sets of cells), one excitatory to thecell, with a receptive field occupying the activatingportion, and one inhibitory to the cell, having itsfield in the antagonistic portion.
Higher order hypercomplex cells, of whichonly 11 were studied, resembled lower order hyper-complex cells in requiring that a line stimulus belimited in length at one or both ends. The higherorder cells, however, differed in responding to theline in either of two orientations 90° apart, and thepoint where the terminus of the line or edge fellwithin the receptive field was not necessarily criti-cal. These hypercomplex cells behaved as thoughthey had their input from a large number of lowerorder hypercomplex cells.
Visual areas II and III were both organized incolumns which appeared to extend from surface towhite matter, within which there were both com-plex and hypercomplex cells, all with the same

Cat Prestriate Areas, 18 and 19 187
receptive-field orientation, but differing in the pre-cise position and arrangement of receptive fields.In visual II and III a single column thus containedhypercomplex cells and also the complex cells thaton physiological grounds one would predict pro-jected to the hypercomplex cells. In addition, invisual III there were columns in which some cellshad one receptive-field orientation, others had anorientation at 90° to the first, and still others, higherorder hypercomplex cells, responded to both theseorientations. Again the cells that seem to be inter-connected on physiological grounds are apparentlyall contained within a single column.
In visual II, as in visual I, some groups ofcolumns were arranged in a highly ordered fashion:as one moved across the cortical surface, the orien-tation of the underlying columns changed in smallregular steps. In other regions the shifts in orienta-tion between neighboring columns appeared to berandom in direction and variable in size, sometimessmall but sometimes approaching 90°.
The majority of cells of visual II and III weredriven from both eyes. A cell that was binocularlydriven had fields in corresponding parts of the tworetinas, which were, as far as one could tell, identi-cal in their arrangements. Ocular dominance var-ied from cell to cell, ranging from cells that weredriven only from the contralateral eye, throughthose driven equally well by the two eyes, to thosedriven exclusively by the ipsilateral eye. The distri-bution of cells according to relative ocular domi-nance was remarkably similar in the three visualareas, and in visual III the distribution of hyper-complex cells was similar to that of complex cells.Thus the partial functional separation of cellsaccording to ocular dominance seems to be main-tained as far centrally as area 19.
ACKNOWLEDGMENT
We express our thanks to Jane Chen and Janet Tobie for theirtechnical assistance.
References
1. Clare, M. H. and Bishop, G. H. Responses from an associ-ation area secondarily activated from optic cortex./. Neu-rophysiol., 1954,77/271-277.
2. Cowey, A. Projection of the retina on to striate and prestri-ate cortex in the squirrel monkey, Saimiri sciureus. ]. Neu-rophysiol., 1964, 27: 366-393.
3. Curtis, H. J. Intercortical connections of corpus callosum as
indicated by evoked potentials. /. Neurophysiol., 1940, 3:407-413.
4. Davies, P. W. Chamber for microelectrode studies in thecerebral cortex. Science, 1956,124: 179-180.
5. Doty, R. W. Potentials evoked in cat cerebral cortex by dif-fuse and by punctiform photic stimuli. /. Neurophysiol.,1958,27:437-464.
6. Carol, H. W. Cortical origin and distribution of corpus cal-losum and anterior commissure in the cat. III./. Neuropath.Exp. Neural., 1942,1: 422-429.
7. Gaze, R. M. and Jacobson, M. 'Convexity detectors' in thefrog's visual system./. Physiol., 1963, 769: 1P-3P.
8. Hubel, D. H. Tungsten microelectrode for recording fromsingle units. Science, 1957, 725: 549-550.
9. Hubel, D. H. Single unit activity in lateral geniculate bodyand optic tract of unrestrained cats./. Physiol., 1960, 750:91-104.
10. Hubel, D. H. and Wiesel, T. N. Receptive fields of singleneurones in the cat's striate cortex. /. Physiol., 1959, 148:574-591.
11. Hubel, D. H. and Wiesel, T. N. Receptive fields of opticnerve fibres in the spider monkey. /. Physiol., 1960, 154:572-580.Hubel, D. H. and Wiesel, T. N. Integrative action in thecat's lateral geniculate body./. Physiol., 1961, 755: 385-398.Hubel, D. H. and Wiesel, T. N. Receptive fields, binocularinteraction and functional architecture in the cat's visualcortex./. Physiol., 1962, 760: 106-154.
14. Hubel, D. H. and Wiesel, T. N. Shape and arrangement ofcolumns in cat's striate cortex./. Physiol., 1963,765:559-568.
15. Hubel, D. H. and Wiesel, T. N. Receptive fields of cells instriate cortex of very young, visually inexperienced kittens./. Neurophysiol., 1963,26:994-1002.
16. Kuffler, S. W. Discharge patterns and functional organiza-tion of mammalian retina./. Neurophysiol., 1953, 76: 37—68.
17. Lettvin, J. Y, Maturana, H. R., McCulloch, W. S., and Pitts,W. H. What the frog's eye tells the frog's brain. Proc. Inst.Radio Engrs., 1959,47: 1940-1951.
18. Lettvin, J. Y., Maturana, H. R., Pitts, W. H., and McCul-loch, W. S. Two remarks on the visual system of the frog.In: Sensory Communication, edited by W. A. Rosenbhth.Cambridge, Mass, and New York, M.I.T. Press and Wiley,1961, pp. 757-776.
19. Lorente de No, R. Cerebral cortex: Architecture, intracor-tical connections, motor projections. In: Physiology of theNervous System (2nd ed.), edited by J. F. Fulton. Cambridge,England, Oxford Univ. Press, 1943, pp. 274-301.
20. Minkowski, M. Experimentelle Untersuchungen iiber dieBeziehungen der Gross-hirnrinde und der Netzhaut zuden primaren optischen Zentren, besonders zum Corpusgeniculatum externum.^rZ'. Hirnanat. Inst. Zurich, 1913, 7:259-362.
21. Mountcastle, V. B. Modality and topographic properties ofsingle neurons of cat's somatic sensory cortex./. Neurophys-iol., 1957,20:408-434.
22. Nauta, W. J. H. and Gygax, P. A. Silver impregnation ofdegenerating axons in the central nervous system: A modi-fied technique. Stain Tech., 1954,29: 91-93.
23. Otsuka, R. and Hassler, R. Uber Aufbau und Gliederungder corticalen Sehsphare bei der Katze. Arch. Psychiat. Ner-venkr. 1962,20^:212-234.
24. Poggio, G. F. and Mountcastle, V. B. The functional prop-erties of ventrobasal thalamic neurons studied in unanes-thetized monkeys./. Neurophysiol., 1963,26: 775—806.
25. Policy, E. H. and Dirkes, J. M. The visual cortical (genicu-locortical) area of the cat brain and its projections. Anat.Rec., 1963,745:345.
12
13

188 PART III NORMAL PHYSIOLOGY AND ANATOMY
26. Polyak, S. An experimental study of the association, cal-losal, and projection fibers of the cerebral cortex of the cat./. comp. Neural., 1927, 44: 197-258.
27. Talbot, S. A. and Marshall, W. H. Physiological studies onneural mechanisms of visual localization and discrimina-tion. Amer.J. Ophthai, 1941,24: 1255-1263.
28. Thompson, J. M., Woolsey, C. N., and Talbot, S. A. Visualareas I and II of cerebral cortex of rabbit./. Neurophysiol.,1950,13:277-288.
29. Vastola, E. F. A direct pathway from lateral geniculatebody to association cortex. /. Neurophysiol., 1961, 24:469-487.
30. Wiesel, T N. and Hubel, D. H. Single-cell responses instriate cortex of kittens deprived of vision in one eye. /.Neurophysiol., 1963,26:1003-1017.
31. Winkler, C. and Potter, A. An Anatomical Guide to Experi-mental Researches on the Cat's Brain. Amsterdam, W. Ver-sluys, 1914.
32. Woolsey, C. N. Organization of somatic sensory and motorareas of the cerebral cortex. In: Biological and BiochemicalBases of Behavior, edited by H. F. Harlow and C. N.Woolsey. Madison, Wis., Univ. Wisconsin Press, 1958, pp.63-81.
AFTERWORD
When this paper was written, the quest of finding a progressive increase incomplexity of behavior of cells as one went centrally along the visual pathseemed to be panning out. Finding hypercomplex cells in 18, and evenhigher-order hypercomplex cells in 19, seemed to give ample evidence for apath in which form analysis became increasingly elaborate. Cells could bethought of as forming a hierarchy, with ones of progressively higher com-plexity housed in successive areas. Just as 17 contained simple and complexcells, so 18 contained complex and hypercomplex cells, and 19 containedordinary hypercomplex cells and ones of higher order. Presumably one hadonly to forge ahead to find more areas, and more elaborate and sophisticatedphysiology.
One of the most exciting moments in these experiments was when, pro-ceeding laterally across the cat's cortex, in penetration after penetration, wesuddenly realized that the fields were moving back in toward the verticalmidline, and had become decidedly smaller—indicating a third visual arealateral to V-2. Just as exciting was our first realization that some cells in thisnew area failed utterly to respond to long slits, indicating that we had stum-bled on cells of a new cell type. We called them hypercomplex. We thought atfirst that these cells were confined to visual 3—they were so common therethat we could hardly miss them—but we went back to visual area 2 to be surewe hadn't missed them there—and we had. Before writing the paper weshould have returned to 17 and checked there, but we were too negligent orlazy. In his thesis work in cats, our graduate student, Charles Gilbert, foundclear end-stopping (as hypercomplexity came to be called), in simple cells oflayer 4, and complex cells of layers 1 and 2 (J Physiol, 1977; 268:391-421).
A need to revise some of our ideas came around 1968 when GeoffreyHenry and Bogdan Dreher, in Australia, discovered cat cortical cells thatresembled our simple cells except that they did not respond to long lines. Inthese cells one had to imagine six receptive-field subregions, not three, as inordinary simple fields. A slit of light of limited length might produce an on-response, but a longer slit would produce no response, as though three zoneswere arranged along a line, giving "off", "on", and "off" responses, eachregion flanked on either side by antagonistic areas. Henry agreed, by andlarge, with our description of the hypercomplex cells of our '1965' paper, but

Cat Prestriate Areas, 18 and 19 189
considered them to result from the convergence of many of these more com-plicated simple cells, just as ordinary complex cells resulted from the con-vergence of many ordinary simple cells. These cells came to us as a surprise,and at first we were sceptical. But subsequently we saw clear examples ofthem in cats, and we had to agree with Henry and Dreher. The term hyper-complex, besides being cumbersome, seemed no longer appropriate. Thesimple cells we had described would have to assume a sibling relationship tothese more complicated simple cells (or end-stopped simple cells, as they cameto be called) and ordinary complex and end-stopped complex cells wouldthen be first cousins. "End-stopped" was in any case more descriptive andneutral than "hypercomplex".
There nevertheless seemed to be no question that cells differed indegree of complexity; a hierarchy clearly existed, and the details had to befilled out. In macaque monkeys we have not recorded anything like the sim-ple end-stopped cells of Henry and Dreher, and if we were only concernedwith primates we could probably forget the matter and continue using hyper-complex.
In a hypercomplex cell, one had to think of receptive fields as extend-ing beyond the region from which explicit responses could be evoked. It wasnot clear, and is still not clear, why no explicit opposing responses areobtained from end-stopped cells when the outlying antagonistic areas arestimulated alone: even spontaneous activity, when present in these anes-thetized animals, was unaffected when the outlying areas were stimulated bythemselves. We were not totally surprised at our failure to get responses tostimulating these end regions, because we had seen analogous examples evenat the retinal ganglion cell and geniculate cell levels. In the geniculate, espe-cially in cells close to the fovea, it is generally difficult to obtain responses toannuli unless one illuminates the field center with a steady light. In thesecases it is not that the inhibition is weak: it is strong enough to abolish thecenter responses completely, as one finds on comparing responses to smallspots with responses to large ones. It seems that the inhibition has to work,as it were, through the center. One can probably dream up a mechanism thatwould explain this, perhaps one involving presynaptic inhibition.
What seemed important to us, in this paper, was showing that the out-lying antagonistic areas of these cells were themselves complex. To bring outthe antagonism one had to stimulate the outlying area with lines in the sameorientation as the optimal orientation for the activating area. This was ourjustification for the circuits shown in Fig. 38, for which evidence was foundsome years later by Charles Gilbert. He was the first to describe long, narrowcomplex fields in layer 6 of cat cortex (/. Physiol, 1977, 268: 391-421) whichseemed tailor-made to fulfil the role of the cell proposed in Figure 38C. (Bolz& Gilbert Nature 1986,320: 362-365)
We have often been asked how we can be sure that the behavior weascribe to our cells is not determined by the stimuli we use. How can weknow that some other, even more complex, behavior would not be broughtout by stimuli we haven't had the imagination to try? Of course that is aproblem, as our early failure to see hypercomplex cells illustrates. But we

190 PART III NORMAL PHYSIOLOGY AND ANATOMY
have generally used as wide a range of stimuli as we could dream up. We var-ied our stimuli as much as our imaginations would permit; indeed, our verysloppiness in devising stimuli must have added to the variety. That is doubt-less why eventually we caught on to hypercomplex cells (or why we missedthem in the beginning). It is worth emphasizing that our use of lines was nota preconception that lines were some magical concept in form analysis. Thenotion that orientation-selective cells are "line detectors" seems to us a seri-ously mistaken one. What most cortical cells are concerned with is surely ori-entation or, what amounts to the same thing, a responsiveness to orientedshort line segments. Strictly speaking, to represent a straight line, a cellshould receive convergent input from many such short-line-segment cells,with their fields arranged in collinear fashion; specialization for curved lineswould require convergence of many cells with appropriately positionedreceptive fields, with progressively differing orientations, and preferablyend-stopped. Perhaps future work will reveal such cells.
It is tempting to speculate about what end-stopped cells are for. Theycertainly respond well to interruptions in lines, and to curves. One can per-haps go further: to detect, or represent, a straight line it should be sufficientto localize the terminations of the line and show that no change in orienta-tion has taken place between the terminations. Similarly, to represent theinterior, diffusely lit, part of any form such as a square or circle it should log-ically be enough to establish the boundaries separating the outside from theinside, and show the absence of any intensity changes in the interior. To a stu-dent who has trouble accepting such ideas—that in the case of a brightly litcircle the perceptual apparatus need not react to the innards of the circle, butattend only to the borders—we simply answer that any engineer interestedin building a machine to process forms in the most efficient way would prob-ably do it just this way. Any requirement that the nervous system should "fillin" a form—for a square, the interior, or for a line, the region between theends—thus would seem unnecessary.
We recognize that form perception may not be done this way. For lines,we have plenty of ordinary complex cells to take care of the parts between theterminations. For a circle or a square, cells that respond to diffuse light willbe activated by the interior, and though such activation is usually weak, weonly have to suppose that weak activation of many cells could define theform. The point here is that lines or squares or circles do not logically haveto be "filled in", that the edges and terminals are logically sufficient to definethe line or form.
Meanwhile, we do not know how long straight lines or curves are han-dled by the brain, any more than we know what happens when we see tri-angles, boats, or faces. All we can do is to plod along from one stage in thepath to another, asking what kinds of stimuli make cells fire. Our attitude,perhaps a mistaken one, is that it is best to proceed without prejudices as tohow things work, and let the chips fall where they may. Until we happenedon orientation selectivity, no one to our knowledge had even remotely sug-gested that visual information might in the early stages be processed in thatway.
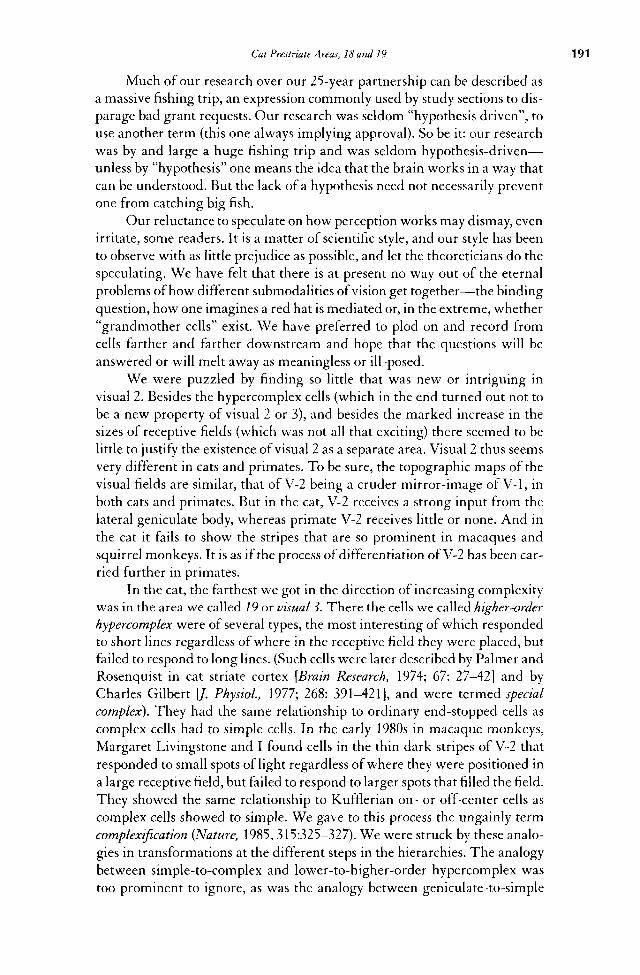
Cat Prestriate Areas, 18 and 19 191
Much of our research over our 25-year partnership can be described asa massive fishing trip, an expression commonly used by study sections to dis-parage bad grant requests. Our research was seldom "hypothesis driven", touse another term (this one always implying approval). So be it: our researchwas by and large a huge fishing trip and was seldom hypothesis-driven—unless by "hypothesis" one means the idea that the brain works in a way thatcan be understood. But the lack of a hypothesis need not necessarily preventone from catching big fish.
Our reluctance to speculate on how perception works may dismay, evenirritate, some readers. It is a matter of scientific style, and our style has beento observe with as little prejudice as possible, and let the theoreticians do thespeculating. We have felt that there is at present no way out of the eternalproblems of how different submodalities of vision get together—the bindingquestion, how one imagines a red hat is mediated or, in the extreme, whether"grandmother cells" exist. We have preferred to plod on and record fromcells farther and farther downstream and hope that the questions will beanswered or will melt away as meaningless or ill-posed.
We were puzzled by finding so little that was new or intriguing invisual 2. Besides the hypercomplex cells (which in the end turned out not tobe a new property of visual 2 or 3), and besides the marked increase in thesizes of receptive fields (which was not all that exciting) there seemed to belittle to justify the existence of visual 2 as a separate area. Visual 2 thus seemsvery different in cats and primates. To be sure, the topographic maps of thevisual fields are similar, that of V-2 being a cruder mirror-image of V-l, inboth cats and primates. But in the cat, V-2 receives a strong input from thelateral geniculate body, whereas primate V-2 receives little or none. And inthe cat it fails to show the stripes that are so prominent in macaques andsquirrel monkeys. It is as if the process of differentiation of V-2 has been car-ried further in primates.
In the cat, the farthest we got in the direction of increasing complexitywas in the area we called 19 or visual 3. There the cells we called higher-orderhypercomplex were of several types, the most interesting of which respondedto short lines regardless of where in the receptive field they were placed, butfailed to respond to long lines. (Such cells were later described by Palmer andRosenquist in cat striate cortex [Brain Research, 1974; 67: 27-42] and byCharles Gilbert [/. PhysioL, 1977; 268: 391-421], and were termed specialcomplex). They had the same relationship to ordinary end-stopped cells ascomplex cells had to simple cells. In the early 1980s in macaque monkeys,Margaret Livingstone and I found cells in the thin dark stripes of V-2 thatresponded to small spots of light regardless of where they were positioned ina large receptive field, but failed to respond to larger spots that filled the field.They showed the same relationship to Kufflerian on- or off-center cells ascomplex cells showed to simple. We gave to this process the ungainly termcomplexification (Nature, 1985, 315:325-327). We were struck by these analo-gies in transformations at the different steps in the hierarchies. The analogybetween simple-to-complex and lower-to-higher-order hypercomplex wastoo prominent to ignore, as was the analogy between geniculate-to-simple

192 PART III NORMAL PHYSIOLOGY AND ANATOMY
and complex-to-hypercomplex. Some kinds of circuits seem to occur repeat-edly in the cortex, serving analogous purposes but in very different con-texts—a little like positive or negative feedback in electronics. We began towonder just how general such circuits are—whether comparable transfor-mations occur in the auditory or somatosensory cortex, or in the hippocam-pus or the frontal lobes.
Today (to come back to earth), research in vision at levels central to theretina is done mainly in primates. The cat has lost its place as the most stud-ied mammal in central nervous system (CNS) neurophysiology, for severalreasons. First, its cost has been artificially driven up through the efforts ofanimal rights groups, so much so that cats, while still far less expensive thanmacaque monkeys, are very far from cheap. (Ironically, cats are plentiful.Strays are picked up every day in large numbers and taken to "shelters",where they are killed. But in most states in the United States of Americathese cats cannot be obtained for research from shelters because of animal-rights activity.) Second, the trend today is away from research in acutely pre-pared animals, in favor of work in awake behaving animals, and cats aretotally unsuited to vision research in which training is required. Unfortu-nately, monkeys are so expensive today that to kill one just to obtain theanatomy after each acute experiment, as we did decades ago, is out of thequestion. The result, sadly, is a marked trend away from experiments inwhich one can combine physiology with experimental anatomy.
Pressing forward along the cortical visual path has not continued tomeet with spectacular success in unearthing cells that respond to more andmore complex spatial configurations. An exception seems to be the face-recognition cells in the inferotemporal cortex first discovered by CharlesGross, and subsequently confirmed in many ways—by replication of theoriginal results and by clinical observation coupled with magnetic resonanceimaging (MRI). We still have little knowledge of the intermediate stepsinvolved in building up such cells.

Chapter 12 • Survey of the Monkey LateralGeniculate Body—A Foray into Color •
FOREWORD
In this survey of the lateral geniculate, our original intent was not particu-larly to study color. We mainly wanted to learn whether geniculate cells inmonkeys had orientation selectivity or movement direction selectivity or anyof the other properties we had found in the monkey cortex—or whether theywere more like retinal ganglion cells, in having circularly symmetric recep-tive fields. We wanted to be certain that the properties we were finding in themonkey cortex were ascribable to cortical circuits, and not just a passivehanding-on of properties arising in the geniculate. Our motives were thesame as those for looking at the cat geniculate. What we found, in bothspecies, was that the orientation selectivity and so on must be elaborated inthe cortex, rather than at prior levels.
But as soon as we got started we found that the monkey geniculate isloaded with cells with specific color properties. This paper consequently rep-resents the first effort in mammalian visual neurophysiology to examine thecolor sensitivities of the different spatial subdivisions of receptive fields.
Mammalian color neurophysiology had gotten off to a terrible start.Ragnar Granit had the misfortune to choose the cat for physiological studiesof color, a poor choice of species, given the cat's poor color capabilities. Onlywith heroic effort was it possible, by behavioral methods, to demonstrate acat's ability to discriminate color. Nancy Mello and Neil Peterson finallyaccomplished the feat in 1964 (/ Neurophysiol 27:323—333), as did Sechzerand Brown that same year (Science 144:427-429). It took a long search for ourcolleagues Nigel Daw and Alan Pearlman to demonstrate color coding con-vincingly in a few rare cells in the C-layers of the cat lateral geniculate (/Physiol 1970, 211:125—137). To Granit's work on retinal ganglion cells in thecat we owe terms such as modulators and dominators, which to the two of usand to Stephen Kuffler were complete mysteries. Students must have beenbewildered by these terms, but for years no one was brave enough to expresstheir mystification aloud. So every graduate student's studies of color physi-ology began with Granit and puzzlement. We were no exceptions, but we
193

194 PART III NORMAL PHYSIOLOGY AND ANATOMY
had the benefit of Steve's complete disdain for authority, and he made nobones about his inability to understand Granit on any subject. A milestonecame in 1960 with Giles Brindley's book on vision (The Physiology of theRetina and Visual Pathway, 1960, London, Edward Arnold). Here Brindleymakes it clear that he has really no idea what "modulators" are supposed tobe. To us that came as a great relief.
Work by deValois, in 1958, had clearly shown color coding in monkeygeniculate cells, with excitation to one set of wavelengths and inhibition toothers (De Valois, Smith, Kitai, and Karoly, Science 127:238-239). A similarresult had been obtained in fish by Svaetichin, in 1956 (Acta Physiol Scand 39,suppl. 134:17-46), in records that he attributed to receptors but were proba-bly horizontal cells. DeValois's stimuli were diffuse, so that the contributionsof different parts of the receptive fields were confounded. As we were to learn,the color properties of center and surround are often strikingly different.
For years, a large part of everyone's fascination by the lateral geniculatehad been its subdivision into clearly defined layers. The significance of thelayering had excited much speculation—for example, Le Gros Clark'snotion (1941, 1942) that each of the three pairs of layers might be related toone of the three cone receptor types. The results of DeValois failed to bearout the Le Gros Clark prediction, but rather suggested that the cells in thedorsal pair of layers gave on responses; the middle pair, on and off responses;and the ventral pair, off responses. But again, the use of diffuse light tendedto confuse the picture and, ironically, in the present (1966) paper we showthat ventral layer cells are usually on-center but with the off-surround dom-inating the center when diffuse light is used.
In our cat geniculate study of 1961, we had had the excitement of learn-ing an important way in which the geniculate transforms information com-ing in from the eye. There the power of the receptive-field surround toantagonize the effects of the center is greatly increased. The prepotentials,which we showed were produced by retinal ganglion cell axons, had made itpossible to compare directly the firing of geniculate cells with that of retinalganglion cells. We had hoped to make this same comparison in the monkeygeniculate but failed to. We did not see the prepotentials, perhaps becausemonkey geniculate cells are much smaller than cat geniculate cells, with cor-respondingly smaller impulse amplitudes. We still do not know whether themonkey geniculate carries out this function, though our guess would be thatit does.
The main precedent for our color studies was work done in the gold-fish, in papers that appeared beginning in 1960, by Wagner, MacNichol, andWolbarsht (/ Gen Physiol, 43:45—62) and subsequently, in various permuta-tions of those names. They led the way in emphasizing the need to look atwavelength sensitivities as a means of learning the cone inputs, not of theentire receptive field lumped together, but of its different parts taken sepa-rately. (Strictly speaking, in fish the receptive-field center and surround com-ponents overlap, and one has to use "on" and "off" responses to separatethem. In monkeys, overlap surely exists, especially in type 2 cells; in type 1cells the small size of the field centers makes the overlap less important.) At

Monkey Lateral Geniculate 195
a meeting around 1960, Myron Wolbarsht said to me: "The trouble with youguys is that you don't know what a receptive field is". We, who regarded our-selves as authorities in that domain, were annoyed—though we should nothave been, given Wolbarsht's well-known brashness. We had the sense totake his remarks seriously, and the present paper reflects the influence of thegoldfish work, more than any other set of contemporary studies.
We have another reason to forgive Wolbarsht: he made a completelyunrelated contribution to our progress in science by letting us in on animportant technical secret. In the early 1960s we had been plagued by elec-trical interference from a nearby hospital paging system (probably the PeterBent Brigham's), and had even given up trying to do recording in one of ourfew available rooms, which we finally made into a tearoom. TV interference,that bane of the modern neurophysiologist, was seldom a problem in ourlabs, probably because of the thick marble medieval-castle-like walls of Har-vard Medical School, and we had never had to install the expensive shieldedcages that are so common in our field. But the paging transmitting antennawas directly in line with one of our windows. Wolbarsht had a trick: he sim-ply placed, in series, two small resistors, right at the input of his preamplifier.This simple R-C circuit made use of stray capacitance to ground to bypassthe high-frequency FM and TV stuff. We installed the two resistors andwere never again bothered by paging or background music, and for fourdecades all of our input stages have been graced with Myron's filters. Thatmore than made up for his cheekiness, and saved us a fortune in coppersheetmetal shielding.
Spatial and Chromatic Interactions in the Lateral Geniculate Bodyof the Rhesus Monkey1
TORSTEN N. WIESEL AND DAVID H. HUBEL • Neurophysiology Laboratory, Department of Pharmacology,
Harvard Medical School, Boston, Massachusetts
The receptors and nerve cells that make up the the degree to which nerve cells are specialized forvisual pathway must convey and interpret infor- handling these types of information. In a visualmation on both the form and the color of retinal stimulus the importance of spatial attributes, andimages. In higher mammals little is known about especially of dark-light contours, first became obvi-
Received for publication March 9, 1966.
From/. Neurophystol. (1966) 29, 1115-1156
'This work was supported in part by Research Grants NB-05554-02, NB-15304-06, NB-02260-06, and NB-02253-06 from theNational Institutes of Health, and in part by Research Grant AF-AFOSR-410-62 from the U.S. Air Force.

196 PART III NORMAL PHYSIOLOGY AND ANATOMY
ous with the discovery by Hartline (20) of lateralinhibition in the Limulus, a type of study that wasextended to mammals when Kuffler (28) demon-strated that the receptive fields of retinal ganglioncells in the cat are subdivided into a center and anopponent surround. The opponent principle, inwhich spatially separated excitatory and inhibitoryregions are pitted against each other, has now beenobserved for retinal ganglion cells in the frog (1),the lizard (9), the rabbit (3), the rat (4), the groundsquirrel (33), and the monkey (24). Similar effectshave been seen in the lateral geniculate body andvisual cortex in the cat (23,25,26), and also recentlyat these levels in the monkey.
In 1958 De Valois and his collaborators (15)observed geniculate cells in the macaque monkeythat were excited by one set of wavelengths andinhibited by another, making it apparent that inhigher mammals the spectral composition of thestimulus was also an important variable. Similaropponent-color effects have since been described inthe primate at the level of the retinal ganglion cell(24), and in the visual cortex (34). In the cat theabsence or rarity of opponent-color mechanisms(19, 36) may be related to an inferior ability to dis-criminate color (31, 32, 40); indeed since Svaeti-chin's (41) original observation of opponent-colorresponses in the fish retina (S-potentials), similarresponse patterns have been seen only in animalsthought to have good color vision.
Given the existence of two opponent mecha-nisms in the monkey visual system, one for the spa-tial variable and the other for color, it is natural toask whether these occupy the same channels, or areconfined to separate groups of cells. In the goldfishit is clear from the work of Wagner, MacNichol,and Wolbarsht (43, 45) that opponent-color andopponent-spatial effects can be found in commonretinal ganglion cells. In the monkey, with its greatvisual capacity, similar mechanisms are to beexpected, perhaps in more developed form. Therhesus monkey was chosen for the work to bedescribed because behaviorally its vision seems tobe very similar to that of man(10). In this species,moreover, absorption spectra of the three conetypes are possibly identical to those of man, withmaxima at about 445,535, and 570 m(I. (5,30). Anyknowledge of the receptor properties obviouslymakes it easier to interpret responses to color atmore central levels of the nervous system.
The purpose of the present study was toexamine in detail how cells respond to variations instimulus size, shape, and wavelength. By workingin various states of light and dark adaptation wealso tried to learn something about the connectionsof rods and cones with single fourth-order cells.The decision to record from the geniculate wasmade because of the obvious interest in learninghow cells function at an early stage of the visualpathway, especially the stage that forms the inputto the striate cortex. We also hoped to learn moreabout the significance of the layering in this puz-zling structure.
Some of the findings of the present paperhave already been described in preliminary notes(27,47).
METHODS
Sixteen monkeys were used, ranging in age from 1 to 3years. Animals were anesthetized with intraperitonealsodium Pentothal (35 mg/kg.), and additional doses ofthe drug were given at half-hour intervals. The head washeld rigidly in a Horsley-Clarke stereotaxic apparatus(42). The eyes were immobilized with a continuous infu-sion of succinylcholine (20-40 mg/kg. per hour). Forcomplete immobilization it was often necessary to giveadditional intramuscular injections of gallamine tri-ethiodide (10 mg/hour). Pupils were dilated with 1%homatropine. Contact lenses were fitted to the corneasafter measuring corneal curvature with a keratometer(Bausch & Lomb, type 71-21-35). Focus was checked at adistance of 1.5 m. (the distance from the eyes to the pro-jection screen) with a slit retinoscope, and any necessarycorrection was made with supplementary lensesmounted in front of the animal's eyes. With a properlyfitted contact lens, correction by more than ±1.0 diopterswas seldom necessary.
For most work the animal faced a large white screenat a distance of 1.5 m. When receptive-field centers weresmaller than about 10 min. of arc, the screen was movedback to a distance of 5 m., and the eyes refocused. Theprojected positions of the foveas and the optic discs ofeach eye were marked out on the screen by an opthhal-moscopic projection method (24, 42), which with ourpresent instrument was accurate to within about 1/2°.
For work in the light-adapted state the screen waslit diffusely with a tungsten lamp at a distance of about5 m. This background measured about 1.0 log cd/m2,and the light impinging on the screen was bright enoughso that fine print could easily be read and objectsappeared normally colored. The spectral energy contentof the background light is discussed below.

Monkey Lateral Geniculate 197
Stimuli consisted of spots of white light or mono-chromatic light projected onto the screen with a modi-fied slide projector containing a 500-W. tungsten bulb.Stimulus durations of about 1 sec. were produced by acrude mechanical shutter. Monochromatic light wasobtained by placing interference filters (Baird Atomic,B-l, half-bandwidth 7 m|l.) directly in front of the pro-jection lens, which was far enough from the screen thatthe rays could be regarded as practically parallel. Sixteenfilters gave wavelengths about 20 m|J,. apart over the vis-ible range (400-700 m|I.). Spots at the highest intensitiesavailable showed up brightly against the high mesopicbackground, at all but the longest and shortest wave-lengths.
To calibrate the stimulator it was necessary to havea sensitive photometer whose spectral sensitivity wasknown. We used a Photovolt model 520M (PhotovoltCorp., New York City) with a photomultiplier tube typeIP28 (RCA). The spectral-sensitivity curve of the indi-vidual tube was supplied by the manufacturer, and thiswas checked independently by comparing the set of pho-tomultiplier readings for beams of monochromatic lightat different wavelengths with readings made on a ther-mopile (Kipp and Zonen: Delft, Holland, model E-20).The light from the stimulator, having passed throughthe optical system consisting of slide projector, neutraldensity wedge, and an interference filter, was directedinto the calibrated photometer. With the wedge at someconstant setting, readings were made on the photometerfor each interference filter, and these were converted intorelative energy units and then into quanta. This set ofnumbers furnished corrections which, when added tothe wedge reading, gave the relative energy of anymonochromatic beam of light.
The system was calibrated for several projectionlamps that had been in use for various periods, and nosignificant differences were found in the spectral energycontent. Although the absorption spectrum of the glasspart of the neutral density wedge was taken care of in theover-all calibration, the emulsion was not, since this dif-fered in density for different settings. We thereforerecalibrated the stimulator at wedge settings 2 log unitsapart. From 440 m|l. to 680 m{l. the curves were similarin shape to within 0.02 log units, for our purposes a neg-ligible error. The interference filters together with theirblocking filters were calibrated in a Beckman spec-trophotometer to check bandwidth and center fre-quency. It was fortunate that these precautions weretaken, since a number of filters were unacceptable andhad to be replaced. The whiteness of the screen wasexamined by comparing readings made directly from theprojector (as described above) with readings made uponlight reflected from the screen. The reflectivity was con-stant to within 0.05 log units from 440 m(0,. to 660 m^l.
The background lamp was run at less than its ratedvoltage, and was slightly yellow in appearance. To obtaina measure of its spectral energy content, photometerreadings were made with the different interference fil-ters interposed, and the results compared with thoseobtained when a standard lamp (U.S. Bureau of Stan-dards, color temperature 2,854°K) was used as source.The two curves of energy versus wavelength whenplaced so as to cross at 540 mjl. deviated so that the back-ground had a spectral content 0.14 log units below that ofthe standard lamp at 440 m[l., and 0.17 log units above itat 640 m|I.; deviations were proportionately less at inter-mediate wavelengths. The background was used at afixed intensity for all measurements to be described,except in the studies of chromatic and dark adaptation,and in studies specifically designed to test the effects ofvarying background intensity and color temperature.
The animal's eyes were dark adapted by turning outthe background light and waiting 1/4 to 1 hour beforemaking further measurements. For chromatic adapta-tion the white background light was left on, and themonochromatic light from a second identical stimulatorwas directed so as to fill most of the screen. This light wasintensely colored, and the areas of screen lit by it con-trasted vividly with the parts lit only with the whitelight. The white background was kept on in order tokeep the retinas light adapted, something that was espe-cially important for chromatic adaptation at long wave-lengths. The 1 sec. duration spot was superimposed uponboth of these diffuse, steady adapting lights. In severalcells we examined the effects of confining the mono-chromatic adapting light to the center or the surround ofthe receptive field.
Threshold stimulus intensities were determined bylistening for a change in maintained firing while stimu-lating once every 5 sec., gradually raising or lowering thewedge setting to find the weakest intensity at whichsome change could be heard. For "on" responses thechange took the form of an increase in firing rate whilethe light was on; for "off responses it was either theburst of impulses on turning off the light or the suppres-sion of firing while the stimulus was on, whichever wasdetected first. This procedure has the obvious disadvan-tage that auditory thresholds may vary with the listener,and may depend upon whether the response is excitatoryor inhibitory and upon the amount of maintained activ-ity. The method nevertheless usually gave results repro-ducible to within 0.1-0.2 log units, and had the advan-tages of convenience and speed, important in a surveythe object of which was to make a variety of studies oneach cell and to sample many cells. Many of the irregu-larities in the curves were probably due to the problemsof threshold determinations, and, while more accuratecurves would doubtless have been obtained by suitable

198 PART III NORMAL PHYSIOLOGY AND ANATOMY
averaging techniques, we do not feel that this wouldhave changed any of our main conclusions.
Methods of recording have been described in detailelsewhere (21,23). Tungsten microelectrodes were intro-duced through a closed chamber. The electrode was pro-tected by a 19-gauge needle, which was stereotaxicallyinserted vertically until the tip came to rest 2 mm. abovethe lateral geniculate; the electrode was then advancedby a hydraulic driver. All recordings were extracellular.Criteria for distinguishing cells from fibers have beendiscussed elsewhere (22). One or two lesions were madein each track (21) and Nissl-stained sections of the for-malin-fixed, celloidin-embedded brain were used toreconstruct the tracks. No cells were included in thestudy unless the track and lesions were histologicallyidentified.
Procedure. When a single cell was identified the eyeswere stimulated separately with white light (or withmonochromatic light if white was ineffective), and theeye that did not drive the cell was then covered. With thewhite background light turned on the receptive field wasfound and the field-center size roughly estimated. Spec-tral sensitivities were determined by measuring thethresholds for monochromatic light at different wave-lengths, first for small (center-size) spots and then forlarge. Log sensitivity (the negative of log threshold) wasthen plotted against wavelength. The spectral-sensitivitycurves were used as a guide in making the choice ofbackground wavelengths for chromatic adaptation andstimulus wavelength in plotting area-sensitivity curves.Finally, the measurements were remade in the dark-adapted state.
Note on anatomical terminology. The six layers of thelateral geniculate are conventionally numbered fromventral to dorsal, the most dorsal layer being the sixth.This system has the disadvantage that it can be confusedwith a second system, seldom if ever used today, in whichthe layers are numbered in the opposite direction. A sec-ond difficulty is that of remembering which layersreceive input from the contralateral eye and which fromthe ipsilateral. In the present paper we introduce analternative system of labeling the layers. The four dorsal,histologically identical small-cell layers we label "D,"numbering them Dj to D4 from dorsal to ventral. Thetwo ventral (large-cell) layers are labeled "V," and num-bered from ventral to dorsal. The six layers in order ofpenetration from above by an electrode are therefore Dj,D2, D3, D4, V2, Vj. Reversing the numbering for the ven-tral layers makes the odd-numbered layers receive inputfrom the contralateral eye, and the even-numbered lay-ers from the ipsilateral. Separate numbering of the dor-sal and ventral layers is consistent with the relative histo-logical and physiological uniformity within each set, andthe marked differences between them.
RESULTS
Eighteen penetrations were made in 16 monkeys,and 244 units were examined in enough detail topermit their categorization. Spectral sensitivitieswere determined in 49 of these cells for both large
and small spots, and 25 of the 49 were also exam-ined in the dark-adapted state. Physiologically themonkey geniculate turns out to be more complexthan that of the cat, the difference being related
mainly to a large variety of responses to coloredlight. In the 4 dorsal layers one can distinguish 3main cell groups, which we designate type I, typeII, and type III. Each of these contains several sub-groups. In the ventral layers there are at least 2major groups. Receptive fields of all of the cells had1 common feature, that of circular symmetry, andthe great majority (though not all) showed a con-
centric center-surround arrangement. No direc-tional asymmetries were seen with stationary or
moving stimuli, and no cells showed the types ofcomplex behavior seen in the cat and monkey cor-tex. In these respects the geniculates of cat andmonkey seem to be similar.
In the following paragraphs we first describethe properties of dorsal layer cells, considering thebehavior of the three main groups, first in the light-adapted state and then in the dark-adapted state.Next, we discuss the organization of the four dor-sal layers, considering the distribution of differentcell types within the layers and the size of receptivefields. Finally, we describe the cells of the two ven-tral layers.
DORSAL LAYERS
Type I Cells: Center-Surround Fieldsand Opponent-Color ResponsesTwo hundred thirteen cells were recorded in thefour dorsal layers. Of these, 164, or 77%, were
classed as type I (see Table 1). A cell was placed inthis group if it had a receptive field with an antag-onistic center-surround arrangement and if the
center and surround had different spectral sensi-tivities. These properties may best be illustrated by
an example.Figure 1 shows the responses of a type I cell
situated in the most dorsal layer (Dj). A white spotilluminating the center of the field gave a brisk on-

Monkey Lateral Geniculate
liable 1. 213 cells recorded from the dorsal layers
199
Layer
TYPE I TYPE III
Red, Red, Green, Green, Blue, TYPE non-center off-center on-center off-center on-center On-center Off-center Totals
DID2
D3D4
39 (45%)19 (37%)10 (23%)
7 (22%)
11(13%)8(16%)
13 (30%)6 (19%)
12(14%)9(18)%6 (14%)8 (25%)
2 (2%)5 (10%)4(9%)2 (6%)
2 (2%)
1 (2%)
4(5%)5(10%)3 (7%)3(9%)
11(13%)2(4%)1 (2%)0
6(7%)3(6%)5 (12%)6(19%)
87514332
Totals 75(35%) 38(18%) 35(16%) 13(6%)
164 (77%)
3(1%) 15(7%) 14(7%) 20(9%)
15 (7%) 34 (16%) 213
response (lower left record, Fig. 1); a white spotcovering the entire receptive field gave no
response.2 A small red spot made by placing a 620-m|I. interference filter in front of the stimulatorevoked a vigorous on-response. A large spot of the
same intensity produced a similar response, neitherweaker nor stronger. This suggested that the cen-
ter was sensitive to light of long wavelength butthat the periphery was not, since including it hadno effect upon the response. A blue spot of center
size evoked no consistent change in the irregularbackground discharges, whereas a large blue spot
suppressed the maintained firing and evoked abrisk off-discharge. Thus within the receptive fieldonly the surround was sensitive to short wave-lengths.
In summary, the receptive field as examined
by these rough tests appeared to have an excitatorycenter and an inhibitory periphery, with the centerdifferentially sensitive to long wavelengths and the
Fig. 1. Responses of a dorsal-layer geniculate cell to white and monochromatic light. Top line, red, 640 mfJ..;middle line, blue, 480 m[l.; bottom line, white. Left: illumination of field center with 1/2° spot. Right: illumi-nation of whole receptive field. Colored spots were produced by placing an interference filter in the beam ofwhite light. They therefore contain far less energy than the white stimuli. Light-adapted state. Field center 19°from thefovea, 6° below the horizontal meridian. Recorded from layer Dt. Further studies of this cell are illus-trated in Figs. 2-4.
2So far, these responses are typical for an on-center geniculate cell in the cat. However, using monochromatic light it became clear thatthe situation was more complex.

200 PART III NORMAL PHYSIOLOGY AND ANATOMY
surround to short wavelengths. The responses towhite light, seen in the lower records of Fig. 1, cannow be understood as the resultant of the effects oflong and short wavelengths. On the other hand,the responses to diffuse light, shown to the right inthe figure, suggest immediately that the cell wasspecialized to register color stimuli, and was notparticularly interested in diffuse white light.
Measurements were made in this cell to deter-mine spectral sensitivities of the center and sur-round, separately and together, and to establishmore accurately the spatial distributions of the twosystems. Here, as in every cell in which measure-ments were made, our first step was to determinesensitivities at different wavelengths, first for acenter-size spot and then for a large one. This rela-tively simple procedure gave enough informationto categorize the cell. In Fig. 2 sensitivities areshown for center-size spots with interrupted linesand for large spots with continuous lines; crossesdesignate on-responses and triangles off-responses.The peak sensitivity of the center system (inter-rupted lines) was at about 580 mji.. At long wave-
Fig. 2. Spectral sensitivity of the red on-center geniculate cellof Fig. 1. Relative sensitivities obtained by determining logreciprocal thresholds. Crosses = on-responses; triangles = off-responses. No response to 540 m\l. at any available intensity.Light-adapted state; stimuli are superimposed on a 1 cd/m2
steady diffuse white background. (In this and other similarcurves, points corresponding to "no response" are eitheromitted or plotted as circles slightly below zero on the logsensitivity scale.)
lengths the small-spot and large-spot curves almostcoincided, reflecting the insensitivity of the periph-ery to red. As wavelength was progressively short-ened, the influence of the inhibitory surroundbecame more and more powerful. Thus between560 and 600 m)I., sensitivities to large spots fellbelow those to small ones, indicating that over thisrange there was peripheral suppression. At 540mJJ,., the neutral point, the two effects balanced anda large spot gave no response at any available inten-sity. At still shorter wavelengths the surrounddominated the center and large spots evoked off-responses. This inhibitory limb of the curve forlarge spots might well have been displayed belowthe wavelength axis, but the use of a log sensitivityscale made this awkward. It will be noted that at480 m|0,. and 460 m|J,. a bright center-size spotevoked an on-response. The small blue spot usedin Fig. 1 was evidently below threshold for aresponse.
To determine the spectral sensitivity of thereceptive-field periphery alone, the most directmethod would be to use an annulus. Technicallythis was difficult because of the small center size,and we therefore studied the opposing systems sep-arately by chromatic adaptation of the entire recep-tive field. With the white background still on toavoid dark adaptation, the screen was flooded withdiffuse light at 640 m(J,., a wavelength to whichpresumably only the center system was sensitive(Fig. 2). With this background the spectral sensi-tivity to large monochromatic spots, measured asbefore by observing the cell's transient response, isgiven by the curve labeled 640 in Fig. 3. Off-responses were now evoked from 460 mfi. to 580m)J,., and the peak response, though not welldefined, was somewhere around 540 m|Ll. Theeffect of the adapting light in suppressing the cen-ter system was the same whether it was confined tothe center or covered the entire receptive field, andin fact it now made no difference whether the stim-ulus was an annulus covering all but the center sys-tem, or a large spot. This curve was therefore takento represent the spectral sensitivity of the surround.By using an adapting light at 460 m|I. the effective-ness of the surround region was differentiallyreduced, and under this condition the sensitivitiesto diffuse light (dotted line, labeled 460) were aboutthe same as those obtained with a small spot, shownin Fig. 2. The mechanism underlying these differ-
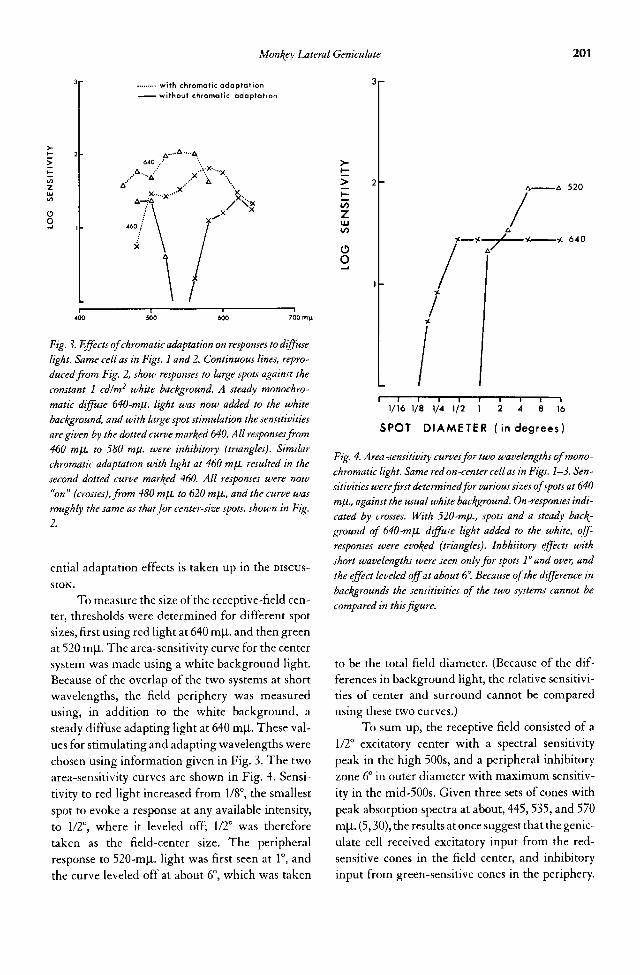
Monkey Lateral Geniculate 201
Fig. 3. Effects of chromatic adaptation on responses to diffuselight. Same cell as in Figs. 1 and 2. Continuous lines, repro-duced from Fig. 2, show responses to large spots against theconstant 1 cd/m2 white background. A steady monochro-matic diffuse 640-mfJ,. light was now added to the whitebackground, and with large spot stimulation the sensitivitiesare given by the dotted curve marked 640. All responses from460 m\L to 580 mfJ.. were inhibitory (triangles). Similarchromatic adaptation with light at 460 m\L resulted in thesecond dotted curve marked 460. All responses were now"on" (crosses), from 480 m\L to 620 mfJL, and the curve wasroughly the same as that for center-size spots, shown in Fig.2.
ential adaptation effects is taken up in the DISCUS-SION.
To measure the size of the receptive-field cen-ter, thresholds were determined for different spotsizes, first using red light at 640 m(0,. and then greenat 520 m|J,. The area-sensitivity curve for the centersystem was made using a white background light.Because of the overlap of the two systems at shortwavelengths, the field periphery was measuredusing, in addition to the white background, asteady diffuse adapting light at 640 m|I. These val-ues for stimulating and adapting wavelengths werechosen using information given in Fig. 3. The twoarea-sensitivity curves are shown in Fig. 4. Sensi-tivity to red light increased from 1/8°, the smallestspot to evoke a response at any available intensity,to 1/2°, where it leveled off; 1/2° was thereforetaken as the field-center size. The peripheralresponse to 520-m|Ll. light was first seen at 1°, andthe curve leveled off at about 6°, which was taken
SPOT DIAMETER (in degrees)
Fig. 4. Area-sensitivity curves for two wavelengths of mono-chromatic light. Same red on-center cell as in Figs. 1-3. Sen-sitivities were first determined for various sizes of spots at 640m/u., against the usual white background. On-responses indi-cated by crosses. With 520-mfJ-., spots and a steady bact^-ground of 640-mjA. diffuse light added to the white, off-responses were evoked (triangles). Inbhiitory effects withshort wavelengths were seen only for spots 1° and over, andthe effect leveled off at about 6°. Because of the difference inbackgrounds the sensitivities of the two systems cannot becompared in this figure.
to be the total field diameter. (Because of the dif-ferences in background light, the relative sensitivi-ties of center and surround cannot be comparedusing these two curves.)
To sum up, the receptive field consisted of a1/2° excitatory center with a spectral sensitivitypeak in the high 500s, and a peripheral inhibitoryzone 6° in outer diameter with maximum sensitiv-ity in the mid-500s. Given three sets of cones withpeak absorption spectra at about, 445, 535, and 570m|4,. (5,30), the results at once suggest that the genic-ulate cell received excitatory input from the red-sensitive cones in the field center, and inhibitoryinput from green-sensitive cones in the periphery.

202 PART III NORMAL PHYSIOLOGY AND ANATOMY
This cell seems identical to the "red-green" typealready described by De Valois and co-workers (12)in the monkey lateral geniculate body. De Valoiswas not concerned with spatial aspects of stimula-tion, but using chromatic adaptation and diffuselight stimulation he found that the two opponentsystems had peak spectral sensitivities around 540and 580 m(I.
As discussed below, it seems most likely thatonly red- and green-sensitive cones provided theinput to this cell, but it is conceivable that the fieldperiphery received contributions from the blue-sensitive cones also. Evidence that this cell receivedinput from rods as well as cones is presented below,in the section on dark adaptation.
Subgroups within Type IThe cell just described belonged to a subgroupwhich we term "red-on center, green off-sur-round." This was by far the commonest subgroup,there being 75 examples of a total of 213 dorsal-layer cells (35%). Assuming the existence of bothon-center and off-center fields, and given threecone types, there are obviously many possible sub-groups within type I. Besides the red no-center celljust described, we have seen four other varieties,several of which are described in the followingparagraphs (see also Table 1).
Thirty-eight cells (18% of 213) had fields ofthe "red off-center, green on-surround" type, anarrangement that was, in a sense, the reverse of thatfound in the cell just described. An example of oneof these is given below in the section on dark adap-tation. "Green on-center, red off-surround" was acombination that occurred in 35 of the 213 cellsrecorded in the dorsal layers (16%). Figure 5 showsspectral-sensitivity curves for a cell of this type;they are similar to the curves of Fig. 2, the two setsbeing roughly mirror images of one another. A"green off-center, red on-surround" combinationwas found for 13 cells (roughly 6%). Thus manyexamples were seen of the four possible red-greencombinations. On the other hand, there were onlythree clear examples of type I cells that received ablue cone contribution. The cell of Fig. 6 had a fieldwith a blue-sensitive on-center and a green-sensitive off-surround, the two opponent systemshaving spectral-sensitivity peaks at about 450 m|H.and 540 m|J,. No examples were seen of cells receiv-
Fig. 5. Spectral sensitivities for small spots and large spots, ina "green on-center, red off-surround" cell recorded fromlayer D2. Field center 10—12 min. in diameter, situated 10°from thefovea.
ing opponent inputs from blue- and red-sensitivecones.
To identify a particular cell as a member ofone or another subgroup it was not necessary tomake detailed measurements of the type justdescribed. In order to classify enough cells to studythe distribution of the different subtypes in thegeniculate, some quick means of identification wasnecessary. Using white spots we usually first estab-lished the center-surround arrangement and thefield-center position and size; then with mono-chromatic light peripheral suppression was com-pared at different wavelengths, and the neutralpoint determined. This gave enough informationto identify the cell group. Detailed measurements,like those described above, were made in aboutone-fifth of the cells.
The balance between the center and surroundsystems varied from cell to cell, as reflected in theposition of the neutral point and in the type ofresponse, "on" versus "off," to white light. A cell-to-cell variation in the balance between opponentsystems was far more prominent in type I cells thanin type II.
The neutral point of the individual type I cellvaried also to some extent with the intensity andspectral composition of the "white" backgroundlight. To estimate roughly the importance of color
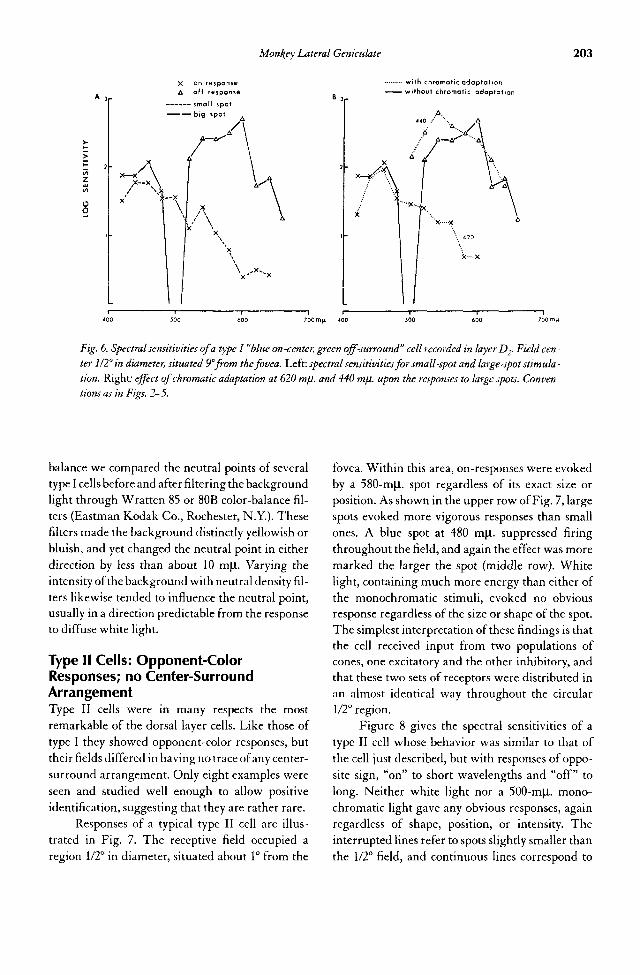
Monkey Lateral Geniculate 203
Fig. 6. Spectral sensitivities of a type I "blue on-center, green off-surround" cell recorded in layer D2. Field cen-ter 112° in diameter, situated 9°from thefovea. Left: spectral sensitivities for small-spot and large-spot stimula-tion. Right: effect of chromatic adaptation at 620 m/n. and 440 m/J.. upon the responses to large spots. Conven-tions as in Figs. 2—5.
balance we compared the neutral points of severaltype I cells before and after filtering the backgroundlight through Wratten 85 or SOB color-balance fil-ters (Eastman Kodak Co., Rochester, N.Y.). Thesefilters made the background distinctly yellowish orbluish, and yet changed the neutral point in eitherdirection by less than about 10 m|0,. Varying theintensity of the background with neutral density fil-ters likewise tended to influence the neutral point,usually in a direction predictable from the responseto diffuse white light.
Type II Cells: Opponent-ColorResponses; no Center-SurroundArrangementType II cells were in many respects the mostremarkable of the dorsal layer cells. Like those oftype I they showed opponent-color responses, buttheir fields differed in having no trace of any center-surround arrangement. Only eight examples wereseen and studied well enough to allow positiveidentification, suggesting that they are rather rare.
Responses of a typical type II cell are illus-trated in Fig. 7. The receptive field occupied aregion 1/2° in diameter, situated about 1° from the
fovea. Within this area, on-responses were evokedby a 580-m|l. spot regardless of its exact size orposition. As shown in the upper row of Fig. 7, largespots evoked more vigorous responses than smallones. A blue spot at 480 m(J,. suppressed firingthroughout the field, and again the effect was moremarked the larger the spot (middle row). Whitelight, containing much more energy than either ofthe monochromatic stimuli, evoked no obviousresponse regardless of the size or shape of the spot.The simplest interpretation of these findings is thatthe cell received input from two populations ofcones, one excitatory and the other inhibitory, andthat these two sets of receptors were distributed inan almost identical way throughout the circular1/2° region.
Figure 8 gives the spectral sensitivities of atype II cell whose behavior was similar to that ofthe cell just described, but with responses of oppo-site sign, "on" to short wavelengths and "off" tolong. Neither white light nor a 500-m(I. mono-chromatic light gave any obvious responses, againregardless of shape, position, or intensity. Theinterrupted lines refer to spots slightly smaller thanthe 1/2° field, and continuous lines correspond to

204 PART III NORMAL PHYSIOLOGY AND ANATOMY
Fig. 7. Responses of a type II "blue-off, green-on" cell. Top line, yellow, 580 mfJi.; middle line, blue, 480 m//.;lower line, white. Small spots, 3/8° in diameter; large spots, 6° in diameter. Cell located in layer Dp at the pos-terior tip of the lateral geniculate. Field 112° in diameter, about l°from thefovea.
10° spots. The two curves were similar in shape andvirtually parallel, the increased sensitivity to thelarger spots reflecting spatial summation withinthe receptive field. The neutral point was at 500m(I. for all spot sizes and shapes. These curveswere thus quite different from the corresponding
ones for type I cells (Figs. 2, 5, 6A), where the neu-tral point could be shifted from one end of the spec-trum to the other by changing the region of thefield that was stimulated.
The most direct evidence that the two oppo-nent systems converging upon this cell had the
Fig. 8. Spectral sensitivities of a typeII "blue-on, green-off" cell fromlayer D2. Field 112° in diameter, 9°from fovea. Small spots were about0.4° in diameter, large spots 10°.

Monkey Lateral Geniculate 205
same spatial distributions came from a comparisonof area-sensitivity curves. Figure 9 shows twocurves, one for on-responses using spots at 460 m|l.,the other for off-responses to spots at 560 m[l. Thecurves were almost identical, indicating that thetwo systems were balanced throughout the field.On comparing area-sensitivity curves of type I cells(Fig. 4) with those of type II (Fig. 9), the differencein arrangement of receptive fields is obvious at aglance.
Chromatic adaptation was used in an attemptto obtain the spectral sensitivities of the two sys-tems. Figure 10 shows the results of adapting 7)with light at 440 m|J,. and 2) with light at 620 m(0,.The two resulting curves (dotted) have their peaksat about 460 m[l. and 530 m(4,., suggesting that theexcitatory input was from blue-sensitive cones andthe inhibitory input was from the green. That thetwo opponent systems had overlapping spectralsensitivities was confirmed by adapting with light
Fig. 10. Effects of chromatic adaptation on large-spotresponses of the cell of Figs. 8 and 9. Adapting lights at 620mfj,. and 440 m/l.
at 500 mjl., i.e., light that was precisely at the neu-tral wavelength and evoked no response at anyavailable intensity (cf. Fig. 8) Flooding the screenwith this light, on top of the white background,produced a uniform suppression in sensitivity at allwavelengths, shown by the curves of Fig. 11.
The eight most thoroughly studied type IIcells had properties practically identical to those ofthe two just described. All had neutral points at 500m(i., with spectral sensitivities suggesting oppo-nent inputs from both blue and green cones. In allthese examples the spatial distributions of theopponent systems seemed to be identical. Besidesthese cells there was a group of seven that had neu-tral points at 600 m(X., and whose spectral sensitiv-ities suggested opponent inputs from red and greencones. These cells were not thoroughly studied,and it is not clear whether any of them were trulytype II cells, i.e., whether they had opponent sys-tems with identical spatial distributions. Theresults we did obtain suggested that the two com-ponents of the receptive field had spatial distribu-tions that overlapped but were not identical. Theover-all size of the regions occupied by the oppo-nent systems seemed to differ slightly, with thesuggestion that one component (the excitatory orthe inhibitory) prevailed in the center and the othertoward the periphery. The arrangement may thus
Fig. 9. Area-sensitivity curves for the cell of Fig. 8, for lightat 460 m/J,. (on-responses) and 560 m^l. (off-responses).Background in both cases white, 1 cd/m2.
SPOT D IAMETER ( in degrees)

206 PART III NORMAL PHYSIOLOGY AND ANATOMY
Fig. 11. Effects of chromatic adaptation with light at 500m/J.., the neutral wavelength, in the cell of Figs. 8—10.Though producing no response by itself, the adapting lightlowered the sensitivity of the cell to stimulation at otherwavelengths.
be similar to that described by Wolbarsht, Wagner,and MacNichol (49) for some goldfish retinal gan-glion cells. These cells are for the time beingclassed as type II in Table 1.
Type III Cells: no Opponent-ColorMechanismOf 213 cells recorded in the dorsal layers, 34, or16%, were classed as type III cells. These weredefined as cells showing no opponent-colorresponses. Receptive fields were subdivided intocenter and concentric surround, some centersbeing excitatory and others inhibitory. In most cellsthere was moderate or marked peripheral suppres-sion, with little or no response to diffuse light, butin some the effect of the periphery was small oreven negligible. For all cells, however, the periph-eral suppression was the same at all wavelengths.
Figure 12 shows some results from a typicaltype III on-center cell. In Fig. 12/1 spectral sensitiv-ities are given for the on-responses evoked by a 1°center spot (crosses), and off-responses from a 1°—8°annulus covering all of the receptive field exceptthe center area (triangles). The two curves arenearly parallel, showing that there was little or no
difference in the spectral sensitivities of the twoopposing systems. This would mean, as a corollary,that peripheral suppression should be just as pro-nounced at all wavelengths, and this was directlydemonstrated by further measurements. Figure12.B shows area-sensitivity curves made at two dif-ferent wavelengths, 540 mjl. and 620 m|4,. For eachwavelength the sensitivity increased (spatial sum-mation) for spots up to about 1°, the diameter of thefield center. Sensitivity then decreased progres-sively (peripheral suppression) up to 5° or 6°, whereit leveled off, indicating the outer boundary of thefield. The shapes of the two curves are almost iden-tical. This result is to be contrasted with thatobtained for a type I cell in Fig. 4, in which entirelydifferent area-sensitivity curves were obtained attwo different wavelengths, and with that for a typeII cell shown in Fig. 6 in which the curves wereidentical, but the responses were of opposite sign.Behavior of this type III cell in the dark-adaptedstate is discussed below.
It is probably easiest to understand the behav-ior of a type III cell by supposing that it receives anexcitatory input from cones in one part of thereceptive field (center or surround) and inhibitoryinput from the remainder, and that in these twosets of cones the relative representations of thethree cone types are the same. From cell to cell therelative contributions of the three cone typesdoubtless differ, since the spectral-sensitivitycurves of different cells have different peaks. Thishas long been known to be so for retinal ganglioncells in the cat (19), which resemble type III cells inmost respects. Type III cells are probably the sameas the nonopponent broad-band cells described inthe rhesus monkey by DeValois (11). Further evi-dence that more than one cone type supplies thesecells has been obtained by chromatic adaptationstudies (Fig. 205).
To sum up the properties of these dorsal-layercells, there seem to be three rather sharply definedtypes: type I with center-surround receptive fields,in which center and opposing surround have dif-ferent spectral sensitivities; type II with two oppos-ing systems having different spectral sensitivitiesand identical spatial distributions; and type IIIwith opponent center and surround systems hav-ing the same spectral sensitivity. In addition, a fewcells seem to have properties somewhere between

Monkey Lateral Geniculate 207
SPOT DIAMETER (in degrees)
Fig. 12. Type HI cell with an on-center 1° in diameter, located 25°from fovea. Recorded from layer Dt. A: spec-tral sensitivities to small spots 1° in diameter, and annuli with inner diameter 1°, outer diameter 8°. Light-adapted state. B: area-sensitivity curves at two wavelengths, 540 mfJ.. and 620 mfj..
those of type I and type II, but these have not beenthoroughly studied.
Cells of all three types had the interestingproperty that on-off responses were rare. This is inmarked contrast to retinal ganglion cells andgeniculate cells in the cat (26,28) and to retinal gan-glion cells of the goldfish (48), where on-offresponses are often seen when opponent systemsare simultaneously stimulated. The absence of on-off responses in the monkey presumably indicatesthat the on-system and the off-system have similartime courses, excitation in one always beingopposed by inhibition in the other.
Dark AdaptationWe were naturally interested in learning whetherall types of geniculate cells were connected to bothrods and cones, or whether some were connected torods and others to cones. Twenty-five cells weretherefore observed and categorized first in thelight-adapted state and then after dark adaptingthe eyes for 15—20 min.
TYPE I CELLS. Not all cells in this group wereaffected in the same way by dark adaptation. Anexample of one pattern of adaptation is given inFig. 13. The cell was a typical red on-center, greenoff-surround, similar to the cell of Figs. 1—4(which, in fact, reacted to dark adaptation in thesame way). After 15 min. dark adaptation the cell's
sensitivity increased by about 4 log units, as shownin Fig. 13 by the interrupted curve. With diffuselight, on-responses were now obtained throughoutthe spectrum, with peak sensitivity at about 500mjl. Our own thresholds for perceiving the spotwith dark-adapted eyes agreed to within a fewtenths of a log unit with those obtained for the cell.Moreover, for all wavelengths below about 620 m(I.the spot appeared colorless at threshold intensitiesand for the first few log units above threshold.
We conclude that this cell received input fromrods as well as from cones. Thresholds were thesame in the dark-adapted state for a center-sizespot and for diffuse light, indicating that any rodcontribution from the surround was not detectableat levels of intensity that were capable of stimulat-ing the cell from the field center. Unfortunately theperiphery of the field was not tested at suprathresh-old scotopic levels, so that we do not know whetherthe cell made connections with rods in the fieldperiphery.
The shift in response patterns between thetwo states of adaptation took place very quickly,this being especially obvious when the change inbackground reversed the response type from "on"to "off" and vice versa. Thus for the cell of Fig. 13,diffuse light at 500 m(J,. gave off-responses with thebackground turned on, and on-responses with thebackground off. Here the response type reversedwith a delay too short to be detected on rough test-

208 PART III NORMAL PHYSIOLOGY AND ANATOMY
Fig. 13. Dar\-adaptation effects in atype I red on-center cell in layer D4.Field center 1/2° in diameter, situated19° from the fovea. Lower curvesshow spectral sensitivities to smalland large spots in the usual way (cf.Figs. 2, 5, and 6), with a 1 cd/m2
white background light. Eliminatingpractically all the background for 15min. produced the marked increase insensitivity and shift in the maximumon-response sensitivity toward theshort wavelengths shown for big spotsby the upper curve. All responseswere now "on" in type. Note that forwavelengths below 520 mp..,responses to large spots were "off" inlight adaptation, "on" in darl^ adap-tation. As far as one could tell thechange occurred immediately uponswitching the background light on or
off-
ing, but certainly no more than a few seconds. Itshould be emphasized that the background in thelight-adapted state was probably not intenseenough to produce much bleaching of rod pig-ments; with a high photopic background the rodswould undoubtedly have taken several minutes toreassert themselves.
Four of the 17 type I cells examined in thedark-adapted state had input from rods, showingsimilar increases in sensitivity and a Purkinje shift.In all four the response evoked from the center indark adaptation ("on" or "off") corresponded tothe center-type response in light adaptation. Therewas no obvious change in field-center size withdark adaptation, and stimuli that were threshold
for the center seemed to have no influence on theperiphery.
The remaining 13 type I cells showed neithera Purkinje shift nor any comparable increase insensitivity on dark adaptation. The red off-centercell of Fig. 14 is an example. Spectral-sensitivitycurves for small spots and for diffuse light weretypical for red off-center cells. The diffuse-lightcurves are plotted in Fig. 144 in the light-adaptedstate and after 15 min. of dark adaptation. Eachopponent system increased in sensitivity byroughly 1 log unit, and there was little difference inthe cells' behavior, with peripheral suppressionoccurring at intermediate wavelengths as before.The thresholds of our own dark-adapted eyes were

Monkey Lateral Geniculate 209
Fig. 14. Effects of darf( adaptation in a type I cell with a red sensitive off-center 3 1/2°from thefovea. Recordedfrom layer D2. Center size was 1/4° and the whole field was about 4° in diameter. A: spectral sensitivities for largespots before and after darl{ adaptation. Both systems increased in sensitivity, but only by about 1 log unit. B: com -parison ofdar{(-adaptation effects in the cell of A with that of a simultaneously recorded green on-center, red off-surround cell. Though studied under identical conditions, one cell has sensitivity some 2 log units greater thanthe other.
several log units lower than those of the cell, and itwas interesting to observe that the cell began react-ing to the stimuli at about the intensities at whichthe spot first appeared colored.
While making the determinations on this cellwe noticed a second, simultaneously recorded unitof lower spike amplitude, which turned out to havea much lower threshold, one close, in fact, to that ofour own dark-adapted eyes. A spectral-sensitivitycurve of this cell was made for comparison, and isshown in Fig. 14R Thresholds were as much as 2log units lower than those of the first cell, withpeak sensitivity at about 520 m(J,. This type I cellwas a green on-center. It seems clear from this thatcells with only cone input can exist side by side inthe geniculate with cells having both rod and coneconnections.
To sum up these results, some geniculate typeI cells have connections with rods and cones, asmanifested by about a 4 log unit increase in sensi-tivity, a disappearance of opponent-color effects atscotopic stimulus levels, and a shift in peak spectral
sensitivity to the low 500s. Others show none ofthese changes and appear to make connectionswith cones only, even though having their fieldsoutside of the fovea, where rods are abundant. Therelative frequency of cells with and without rodinput is not at all clear, but presumably it varieswith position of receptive fields in the visual field,so that a thorough study would require a generoussampling from different parts of the geniculate.
TYPE II CELLS. Two type II cells were examinedwith the eyes dark adapted. In both there was anincrease ins ensitivity of about 0.5—1 log unit forboth systems, with no change in neutral point, sug-gesting a lack of any rod input. (It is worth notingthat once again changing the white backgroundlight produced some change in sensitivity, eventhough white light, like the 500-m|I. light, evokedno response itself.)
TYPE III CELLS. Of the four dorsal-layer type IIIcells tested, two showed only a slight increase in

210 PART III NORMAL PHYSIOLOGY AND ANATOMY
sensitivity with no Purkinje shift, suggesting thatthey lacked connections with rods. The other twocells increased markedly in sensitivity and showeda clear shift in spectral sensitivity. One of these, anon-center cell, was studied in some detail. Theresults for the light-adapted state have alreadybeen given in Fig. 12. There it was shown that cen-ter and surround had practically identical spectralsensitivities and that peripheral suppression wasthe same at two widely separated wavelengths.When the eyes were dark adapted the thresholdfell by over 2 log units (Fig. 15). At stimulus inten-sities just above threshold a large spot gave aweaker response than a small spot, indicating thatrods fed into the cell from both center and sur-round, in opponent fashion. For a center-size spotthe spectral sensitivity, shown by dotted lines inFig. 15A had a peak in the low 500s, being dis-placed to the short end of the spectrum comparedwith the light-adapted curve. Stimulation of thesurround alone failed to evoke any response. If,
however, a just-suprathreshold white spot wasdirected on the center and left there, monochro-matic stimuli now evoked clear peripheralresponses in the form of suppression of firing withoff-discharges. Thresholds for these responses atdifferent wavelengths are shown in the upper,interrupted curve of Fig. 155. Again there was amarked threshold decrease with a clear Purkinjeshift giving further evidence that rods from theperiphery of the field were connected to the cell.
On comparing the area-sensitivity curves forlight and dark adaptation in Fig. 16, it appears thatthe field-center size remained about the same inthe two states, yet to our surprise the contributionof the periphery was not evident, there being nodecline in sensitivity for large spots. Stimuli thatwere just suprathreshold, on the other hand,evoked much stronger responses from the centerthan from the whole receptive field, indicating thatthe surround made an important contribution, andthat its threshold was in fact not much higher than
Fig. 15. Effects ofdar^ adaptation in the cell of Fig. 12. A: on-responses to 1° spots. B: off-responses to an annu-lus, inner and outer diameters 1° and 6°, respectively. A suprathreshold 1° white spot was directed steadily on thefield center during these measurements, so that thresholds are not strictly comparable with those of A.
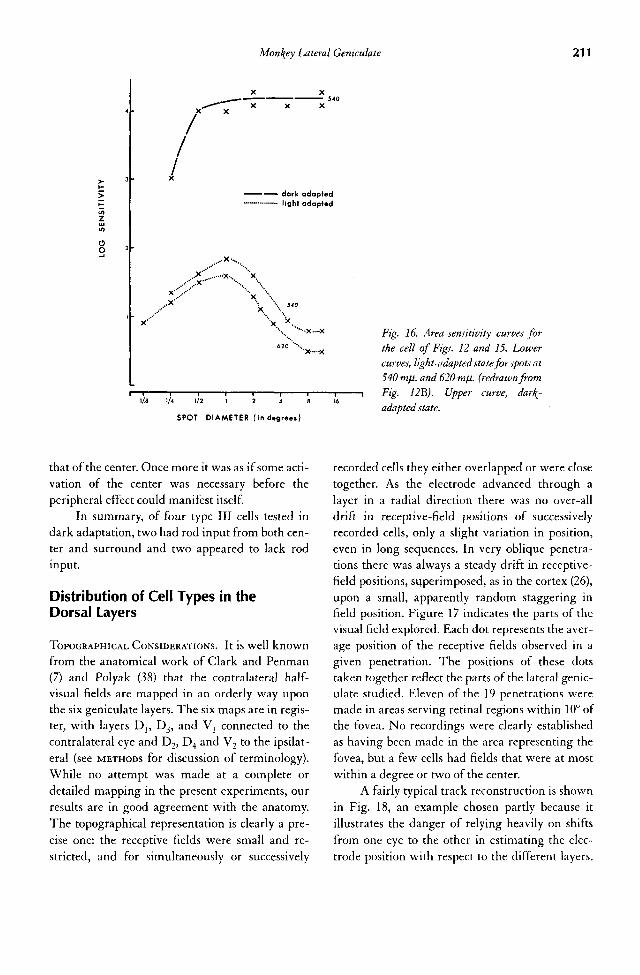
Monkey Lateral Geniculate 211
SPOT DIAMETER (in degrees)
Fig. 16. Area-sensitivity curves forthe cell of Figs. 12 and 15. Lowercurves, light-adapted state for spots at540 m^i. and 620 mfj.. (redrawn fromFig. 12E). Upper curve, dar\-adapted state.
that of the center. Once more it was as if some acti-vation of the center was necessary before theperipheral effect could manifest itself.
In summary, of four type III cells tested indark adaptation, two had rod input from both cen-ter and surround and two appeared to lack rodinput.
Distribution of Cell Types in theDorsal Layers
TOPOGRAPHICAL CONSIDERATIONS. It is well knownfrom the anatomical work of Clark and Penman(7) and Polyak (38) that the contralateral half-visual fields are mapped in an orderly way uponthe six geniculate layers. The six maps are in regis-ter, with layers Dl5 D3, and Vj connected to thecontralateral eye and D2, D4 and V2 to the ipsilat-eral (see METHODS for discussion of terminology).While no attempt was made at a complete ordetailed mapping in the present experiments, ourresults are in good agreement with the anatomy.The topographical representation is clearly a pre-cise one: the receptive fields were small and re-stricted, and for simultaneously or successively
recorded cells they either overlapped or were closetogether. As the electrode advanced through alayer in a radial direction there was no over-alldrift in receptive-field positions of successivelyrecorded cells, only a slight variation in position,even in long sequences. In very oblique penetra-tions there was always a steady drift in receptive-field positions, superimposed, as in the cortex (26),upon a small, apparently random staggering infield position. Figure 17 indicates the parts of thevisual field explored. Each dot represents the aver-age position of the receptive fields observed in agiven penetration. The positions of these dotstaken together reflect the parts of the lateral genic-ulate studied. Eleven of the 19 penetrations weremade in areas serving retinal regions within 10° ofthe fovea. No recordings were clearly establishedas having been made in the area representing thefovea, but a few cells had fields that were at mostwithin a degree or two of the center.
A fairly typical track reconstruction is shownin Fig. 18, an example chosen partly because itillustrates the danger of relying heavily on shiftsfrom one eye to the other in estimating the elec-trode position with respect to the different layers.

212 PART III NORMAL PHYSIOLOGY AND ANATOMY
Fig. 17. Regions of visual fields explored in 18 penetrations of the lateral geniculate. Each dot represents the aver-age visual-field position of the receptive fields in a single penetration. Most penetrations were normal to thegeniculate layering, so that there was little variation in the positions of the individual receptive fields.
In this experiment one might have concluded fromthe eye shifts that the penetration terminated in V1}
the most ventral layer, instead of layer D3. In fact,had the penetration continued in the same direc-tion through the interlocking folds it would havepassed through D2 three times instead of once, andwould never have reached the ventral layers.
DISTRIBUTION OF CELL TYPES IN THE DORSAL LAY-ERS. It was obviously important to learn whetherthe various cell types were evenly distributedthroughout the four dorsal layers. The results aresummarized in Table 1. The sampling of cells waslargest for layer Dj and progressively smaller foreach of the other layers, because many penetrationswere discontinued before the deeper layers werereached. To allow for this, the number of cells in aparticular layer is given also as a per cent of thetotal number of cells in that layer, so that in com-paring the different layers it is the percentages thatare important.
Table 1 shows that all major cell types wererepresented in both pairs of dorsal layers, indicat-ing a lack of any rigid separation of functional
groups. There was some unevenness in the distri-bution of red on-center cells, these being almosttwice as common in the dorsal two layers as in themiddle two. On the other hand, the red off-centercells were about twice as common in the middlelayers. We are nevertheless hesitant to accept whatappears at first glance to be a statistically significantresult for reasons having to do with the distribu-tion of cells within each layer. Within a given layerthere was no obvious systematic segregation of thedifferent cell types, yet as the electrode advancedfrom cell to cell there were frequent sequences inwhich one subtype occurred two to six times in arow. As might be expected, this was most oftenseen with red on-center cells, for these were themost common. Clearly even a slight tendencytoward grouping makes one cautious about inter-preting the relatively small samples represented byTable 1. Meanwhile one can sum up the table bysaying that 7) no group of cells is confined to anylayer or pair of layers; 2) red on-center cells, redoff-center cells, green on-center cells, and greenoff-center cells are all represented in all four layers;and 3} the two dorsal layers are perhaps richer than

Fig. 18. A: reconstruction of an electrode tract^ through right lateral geniculate. Coronal section. Electrode tracf^is shown entering layer D1 and ending in layer D$ lesions made near the beginning of the penetration and at theend are outlined as irregular ovals. Short lines intersecting the electrode tracf( show the positions of cells studiedduring the penetration. Labels indicate, by their position to left or right of figure, whether cells were recordedfrom contralateral or ipsilateral eye. Distance from entry oftrac\ into geniculate to end oftracf( was about 1.5mm. B: one of the Nissl sections from which the trac\ was reconstructed, showing lesions (arrows) and first partof electrode tract( (outlined by inflammatory reaction).
213

214 PART III NORMAL PHYSIOLOGY AND ANATOMY
the middle two in red on-center cells and poorer inred off-center cells.
SIZES OF RECEPTIVE-FIELD CENTERS. Cell centersranged in diameter from 2 min. of arc up to about1°. Distributions of type I cells according to field-center size are given in Fig. 19, with separate his-tograms for on-center (left) and off-center (mid-dle). On comparing the two histograms, it can beseen that, though the size ranges overlapped, on-centers tended to be smaller than off-centers, andin fact all of the very small field centers (1/32° to1/16°) were "on" in type. This agrees with our pre-vious observations in spider monkey optic nerve(24). The relative proportions of red-center andgreen-center cells (shaded versus unshaded) wereabout the same for all center sizes. Fields of type IIIcells (Fig. 19, right) tended to be larger than those
of type I, though again the size ranges overlapped.For both type I and type III cells there was a loosecorrelation between field-center size and distancefrom fovea. The smallest centers, 1/32° to 1/16°,were all within 10° of the fovea. Type II fieldsranged in size from 1/4° to 1°, and were found asclose as 2° from the fovea and as far out as 12°.
VENTRAL LAYERS
Thirty-one cells were recorded from the ventrallayers. The sampling was relatively small becausemany penetrations either did not reach the ventrallayers or missed them entirely (Fig. 18), andbecause the ventral layers are relatively thin. Cellsin these layers fell into two main groups: those ofthe first resembled type III cells in the dorsal layers;cells in the second group were different from any
C E N T E R D I A M E T E R IN DEGREES
Fig. 19. Distribution ofgeniculate cells with respect to size of field centers. Left and middle histograms: type Icells. Right: type HI cells.

Monkey Lateral Geniculate 215
seen in the dorsal layers, and are termed type IVcells.
Ventral-Layer Type III CellsAs with dorsal-layer type III cells, both on-centers(7 cells) and off-centers (14 cells) were seen. By def-inition, a cell in this group responded in the sameway ("on" versus "off) to a spot of a given size orshape for all effective wavelengths, and showed thesame degree of peripheral suppression over theentire spectrum. Most cells were unresponsive, orvirtually so, to diffuse light, peripheral suppressionbeing practically complete for white light and allwavelengths of monochromatic light, and at allavailable intensities.
An off-center type III cells was examined tolearn whether more than one cone type con-tributed to the receptive field. To estimate centerand surround dimensions, sensitivity (reciprocalthreshold) was plotted against spot size for whitestimuli in the light-adapted state (Fig. 2CL4).Peripheral suppression was complete at 6—8° spotdiameter, sensitivity falling by over 3 log unitsfrom the maximum at 1/2°. Next, spectral sensitiv-ity was determined for spots just under center size
(Fig. 2ftB). After adapting the field center withlight at 640 m|J,., threshold measurements wererepeated for stimuli at 480, 520, and 620 m(I. Theeffect of the steady adapting light, shown by thearrows, was to reduce sensitivity at all three wave-lengths, but more for the long than the short. Thisresult is just what one would expect if the cellreceived contributions from more than one type ofcone in the field center, in a nonopponent system.
Dark adaptation was not done for any ven-tral-layer type III cells, so that we have no infor-mation about the possible contribution of rods tothese cells. The fields were found as close as 3° fromthe fovea and as far out as 12°. Center diametersranged from 1/8° to 1/2°. Sampling was too small toallow any comparison of field-center sizes in ven-tral as opposed to dorsal layers.
Type IV CellsType IV cells, of which 10 were studied in detail,were quite unlike anything seen in the dorsal lay-ers, or in the cat retina or geniculate. A typicalexample is illustrated in Fig. 2L4. As with everycell in this group the receptive field was concentricin type, with an excitatory center and an inhibitory
SPOT D I A M E T E R ( in degrees)
Fig. 20. Off-center type III cell recorded in light-adapted state from layer V2. Field center 6°from fovea. A: area-sensitivity curve for white light stimuli, showing field-center size to be about 1/2°, and overall field at least 6-8°in diameter. B: spectral sensitivity plotted for 3/8° spots. Empty triangles, off-responses with the usual white backcground. Filled triangles, three measurements made in the presence of 640-m^l. diffuse steady background.Decline in sensitivity is greater for long wavelengths than for short, suggesting that more than one type of conehad a nonopponent connection with the cell.
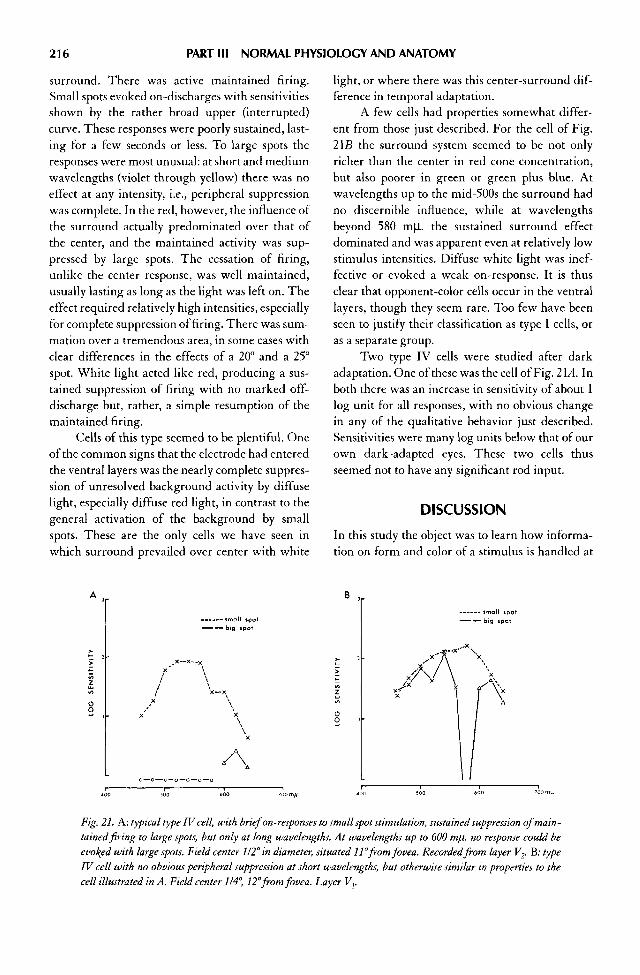
216 PART III NORMAL PHYSIOLOGY AND ANATOMY
surround. There was active maintained firing.Small spots evoked on-discharges with sensitivitiesshown by the rather broad upper (interrupted)curve. These responses were poorly sustained, last-ing for a few seconds or less. To large spots theresponses were most unusual: at short and mediumwavelengths (violet through yellow) there was noeffect at any intensity, i.e., peripheral suppressionwas complete. In the red, however, the influence ofthe surround actually predominated over that ofthe center, and the maintained activity was sup-pressed by large spots. The cessation of firing,unlike the center response, was well maintained,usually lasting as long as the light was left on. Theeffect required relatively high intensities, especiallyfor complete suppression of firing. There was sum-mation over a tremendous area, in some cases withclear differences in the effects of a 20° and a 25°spot. White light acted like red, producing a sus-tained suppression of firing with no marked off-discharge but, rather, a simple resumption of themaintained firing.
Cells of this type seemed to be plentiful. Oneof the common signs that the electrode had enteredthe ventral layers was the nearly complete suppres-sion of unresolved background activity by diffuselight, especially diffuse red light, in contrast to thegeneral activation of the background by smallspots. These are the only cells we have seen inwhich surround prevailed over center with white
light, or where there was this center-surround dif-ference in temporal adaptation.
A few cells had properties somewhat differ-ent from those just described. For the cell of Fig.2\B the surround system seemed to be not onlyricher than the center in red cone concentration,but also poorer in green or green plus blue. Atwavelengths up to the mid-500s the surround hadno discernible influence, while at wavelengthsbeyond 580 m)J,. the sustained surround effectdominated and was apparent even at relatively lowstimulus intensities. Diffuse white light was inef-fective or evoked a weak on-response. It is thusclear that opponent-color cells occur in the ventrallayers, though they seem rare. Too few have beenseen to justify their classification as type I cells, oras a separate group.
Two type IV cells were studied after darkadaptation. One of these was the cell of Fig. 2L4. Inboth there was an increase in sensitivity of about 1log unit for all responses, with no obvious changein any of the qualitative behavior just described.Sensitivities were many log units below that of ourown dark-adapted eyes. These two cells thusseemed not to have any significant rod input.
DISCUSSION
In this study the object was to learn how informa-tion on form and color of a stimulus is handled at
Fig. 21. A.: typical type IV cell, with brief on-responses to small spot stimulation, sustained suppression of main-tained firing to large spots, but only at long wavelengths. At wavelengths up to 600 mjii. no response could beevoked with large spots. Field center 1/2° in diameter, situated 11°from fovea. Recorded from layer V2. B: typeIV cell with no obvious peripheral suppression at short wavelengths, but otherwise similar in properties to thecell illustrated in A. Field center 114°, 12° from fovea. Layer V{.

Monkey Lateral Geniculate 217
an early stage in the central nervous system. Giventwo opponent processes in the monkey, a chro-matic and a spatial, it seemed important to learnwhether these existed in independent pathways orwere combined in common cells. The answerseems to be that both things occur: some cells aremainly concerned with form, others mainly withcolor, while the majority handle both variables atthe same time. In the case of color, as originallyshown by De Valois (10, 11), a cell may be excitedby one group of cones and inhibited by anothergroup with a different spectral sensitivity, so thatwhite light covering a large retinal area and stimu-lating both groups of cones may evoke little or noresponse. For the spatial variable the receptors mayexcite or inhibit a cell, depending on retinal posi-tion, with the result that diffuse light has littleeffect regardless of wavelength (24). In any givencell one or both of these mechanisms may be found.Both opponent mechanisms seem aimed at increas-ing the specialization of single cells, in the directionof color as opposed to white, or spatial contrast asopposed to diffuse light. Thus the existence ofinhibitory mechanisms leads to the surprisingresult that the optimum response of a cell in thevisual pathway is not obtained by stimulation of allof the receptors—in general that is the least effi-cient stimulus. For the cell to respond optimally aparticular set of receptors must be activated, the setvarying from one cell to the next. The function of astructure like the geniculate can thus be studied byasking how the receptors are categorized into setand subsets by the different cells.
The findings can be summed up by sayingthat in the light-adapted state practically all cellsare influenced by two antagonistic sets of connec-tions, one excitatory and the other inhibitory.Depending upon the details of these connections,three main cell types can be distinguished. For typeIII cells the opponent inputs take origin from twogroups of receptors that are spatially separated intocenter and surround. A given cell is generally sup-plied by cones of more than one type, and the rela-tive proportions of the three cone types are thesame for center and surround, though from cell tocell they undoubtedly differ. This is shown dia-grammatically in Fig. 22A for a type III on-centercell; here a cell is considered to receive excitatoryinput from cones in the field center, with the red-,blue-, and green-sensitive cones represented in the
ratio of 1:1:1, and inhibitory input from peripher-ally located cones in the same ratio. (For simplicity,intervening synaptic stages are omitted, as are therods.) Type III cells presumably represent an ele-mentary step in form analysis, registering not sim-ply the general level of illumination but rathercomparing light that falls on one retinal regionwith that falling on the immediate surround. Thisis done to a large extent irrespective of wavelength.For these cells unevenness of illumination is apowerful stimulus, and diffuse light tends to beinadequate.
For type II cells the scheme is just the con-verse: opponent sets of receptors of different spec-tral sensitivities are distributed in identical fashionthroughout the same retinal area. The cell of Fig.225 receives excitatory input from green-sensitivecones over the entire receptive field, and inhibitoryinput from blue cones throughout the same region;over all parts of the receptive field the proportion ofexcitatory to inhibitory cones is constant. Thusthese cells react mainly to unevenness of spectralenergy distribution, and diffuse light is as good astimulus as an optimally placed spot.
For type I cells, finally, the two sets of recep-tors are not only spatially segregated but also havedifferent spectral sensitivities. The red on-centercell of Fig. 22C is supplied by the red-sensitivecones from the field center, and the green-sensitivecones from the periphery. The properties of theother two cell types are thus combined in the type Icell, which deals with black-white images in thesame way as the type III cell does, but for diffuselight or parts of images lacking spatial intensitygradients has all of the wavelength-discriminatingability of the type II cell. In sum, diffuse light is tothe type III cell what white light is to the type II,and what diffuse white light is to the type I.
The schemes proposed in Fig. 22 must be con-sidered tentative, with several details still unset-tled. The first of these concerns the relative contri-bution of the three cone types. While the simplestassumption consistent with the experimental evi-dence is that each opponent-color cell receivesinput from two of the cones, it is often difficult tobe sure that the third cone does not also contribute.Cells that we regard as receiving opponent inputsfrom red and green cones could, for instance,receive contributions from the blue-sensitive conesalong with the green. The result would be to

Fig. 22. Three types of cones areillustrated by letters 'r, 'g and 'b'.A:proposed contribution of cones to atype III on-center cell. Three types ofcones are illustrated by colors and, forsimplicity, receptors are shown onlyalong a line through the field center.Cones project to the cell, via inter-vening synapses which are notshown, and activation of those in thecenter of the receptive field leads toexcitation of the cell (e), those in theperiphery to inhibition (i). The threecone types from the center are arbi-trarily shown as being present in theratio of 1:1:1, and this ratio is thesame for the periphery. B: schematicrepresentation of a type II cell,receiving excitatory input fromgreen-sensitive cones and inhibitoryinput from the blue. The relativecontributions of the two afferent conetypes are the same in all parts of thereceptive field. C: representation of atype I cell receiving excitatory inputfrom red-sensitive cones in the fieldcenter and inhibitory input fromgreen-sensitive cones in the periph-ery. Note that in these figures "i" isused simply to imply that light fallingon the cone leads to an increased ten-dency toward cessation of firing of thecell. This could depend on aninhibitory synapse at any stage in thepath from receptor to geniculate cell,and need not imply active inhibitionat the geniculate cell itself.
218

Monkey Lateral Geniculate 219
broaden the spectral sensitivity of the short-wave-length system and displace the peak even further tothe short-wavelength end of the spectrum. Since,in fact, the spectral sensitivity of the short-wave-length system in these cells generally has its peak inthe mid-500s, falling off markedly by the mid-400s,the contribution of the blue cones must at most bea minor one. But if the ratio of green cones to bluein the input to the short-wavelength system werethe same as it is in the local cone population thecontribution of the blue cones would be hard todetect, for even outside the fovea there are proba-bly far fewer blue cones than green ones.
The situation is different in the case of theblue-versus-green opponent cells (a few type I cellsand most of the type II). Here the problem is to tellwhether or not the red cones as well as the greencontribute to the long-wavelength system, and inwhat proportion. This is not easy, since the twocones have extensively overlapping spectral sensi-tivities. Thus whether the green cones make up theentire contribution to the long system, or just halfof it, will determine whether the spectral-sensitiv-ity peak is at 540 m(J,. or 560 m(l., a subtle differ-ence for techniques as coarse as those used in thisstudy.
Finally, there is the possibility of opponent-color cells having one system fed by green conesand the other by red cones plus blue cones. Theresult would be two neutral points, a cell beingexcited at intermediate wavelengths and inhibitedat the long and short ends of the spectrum, or thereverse. So far we have not seen any cells of thistype, though they should be easy to recognize. DeValois and Jones (13), recording also from themacaque geniculate, have reported finding suchcells, but the results may not necessarily have to beinterpreted in terms of three cone inputs, sincewith the eyes dark adapted a contribution fromrods would seem possible. For example, a "red off-center, green on-surround" cell with inhibitory rodinput, a type we have seen, might well masqueradeas a "purple-off, green-on" cell if examined only inthe scotopic state.
A second qualification to the interpretationsimplied by Fig. 22 concerns the arrangement of thereceptive field of type I cells. The problem can bestbe approached by comparing our results in themonkey geniculate with a similar study made inthe goldfish retina by Wagner, MacNichol, and
Wolbarsht (43-45, 48, 49). The comparison revealssome striking similarities but also certain differ-ences in the details of receptive-field organization.In the goldfish some cells showed no opponent-color effects, but had center-surround receptivefields of the type described by Kuffler (28) (type IIIin the present study). Other cells showed oppo-nent-color responses, but in these the opponent sys-tems overlapped instead of being distributed on theretina in a center-surround manner. The two sys-tems had sensitivities that were maximal in thefield center, but tapered off toward the periphery atdifferent rates so that the effects of one predomi-nated in the center and those of the other in thesurround.
One might ask whether in the monkey thefields of type I cells are not also organized as twopartially overlapping opponent systems with dif-ferent spatial distributions. Experimentally, it isdifficult to obtain a clear answer to this. As a rulethe size of receptive-field centers of type I cells isvery small relative to the size of the whole field, sothat a spot of center-size placed anywhere in theperiphery evokes no response at any wavelength orintensity. On the other hand, a small spot in thecenter evokes only center-type responses regardlessof wavelength. Thus if the opposing system is acti-vated at all from the center, its effects are appar-ently outweighed. In the goldfish, on-off responsesindicate that opposing systems are being simulta-neously activated, but in the monkey these mixedresponses do not occur—either one system is dom-inant and completely submerges the other or thetwo mutually cancel and no response is seen. In anycase, a distinction between overlapping and non-overlapping arrangements seems of theoreticalrather than practical importance in the monkey,given the small size of field centers relative to thetotal field size. The scheme suggested in Fig. 22seems to us the simplest consistent with the results.If, as seems likely on anatomical grounds, there areganglion cells in or near the fovea whose field cen-ters are supplied by single cones, then the recep-tive-field periphery of such cells must obviously beannular. Type II cells have overlapping opponentsystems, but with the important difference that thesensitivities of the two systems have the same spa-tial distribution. No such cells have been reportedin the goldfish. Possibly the model proposed byWolbarsht et al. (49) might apply in the monkey to

220 PART III NORMAL PHYSIOLOGY AND ANATOMY
the relatively rare red-green opponent cell thatseems to combine features of the type I and type IIcells (see RESULTS section, under Type II cells).
Here a comment may be made on the organi-zation of center-surround fields of types I and III.The descriptions in this and other papers may givethe impression that the center and surround of aconcentric receptive field are roughly equal andopposite in their influence on a cell. This is notstrictly so. Peripheral responses are often difficult toevoke with annular stimuli alone, especially in thelateral geniculate of the cat and monkey. This hasalso been noted for retinal ganglion cells in the rab-bit (3). Nevertheless it is clear that the periphery ishighly effective, since a large spot evokes a weakerresponse (excitatory or inhibitory) than a small one,and often evokes none at all. In cells of the catgeniculate diffuse light has on the average less effectthan it does at the retinal ganglion cell level (25),reflecting an increase in the potency of the recep-tive-field periphery; yet, compared with retinalcells, geniculate cells respond especially grudginglyto annuli. This is true both for on-center and off-center cells. Apparently the more potent the sur-round is in suppressing the center effects the moredifficult it is to obtain a response from the surroundalone. One can, however, always obtain a responsefrom the periphery by first shining a spot steadily onthe center and then turning on and off the annu-lus—it was necessary, for example, to use this deviceto obtain a spectral-sensitivity curve for the fieldsurround in the dark-adapted type III on-centercell of Fig. 155. The reciprocal phenomenon doesnot seem to occur, in that a center stimulus is notmade more effective by shining a steady annulus inthe periphery. It is as though the surround systemcould only exert its effects provided the center sys-tem was also activated. As indicated below, thispeculiarity may help explain the difficulty indemonstrating peripheral effects at threshold in thedark-adapted state. The point to be emphasized isthat the center and surround of concentric receptivefields seem to function in quite different ways, theeffects of the surround working as it were, throughthe center.
CHROMATIC ADAPTATION. The importance of neu-ral mechanisms in light and dark adaptation is wellrecognized and has most recently been emphasizedby Rushton (39) and Dowling (16); they found, by
very different methods, that within a wide rangeof intensities the amounts of pigment actuallybleached were too small to account for the observedlarge changes in sensitivity. In the present experi-ments the rapid recovery from the rather moderateintensities of adapting lights likewise suggests thatneural mechanisms are important: the effects ofchromatic adaptation on opponent responses sub-side within seconds of the time the adapting light isturned off, rather than after several minutes as onewould expect if it were solely a matter of pigmentbleaching and regeneration. It is thus likely thatchromatic adaptation involves a change in the stim-ulus-response relationship in one opponent systemwithout any equivalent change in the other, theeffect presumably occurring at some point prior tothe convergence of the two systems. In the cat it iswell known that the response to an intermittentwhite stimulus of constant intensity declines asthe white background is turned up. Presumably inthe monkey the decline in sensitivity with chro-matic adaptation is similar in nature but the effectis selective, being confined to one of the opponentsystems.
These remarks apply to chromatic adaptationof the type employed in our experiments, in whichthe intermittent stimulus is superimposed upon asteady adapting light. Obviously the mechanismswould be quite different if the adapting light werefirst turned out and then the stimulus applied. Wehave avoided this method because of the complica-tions involved in stimulating during the transientoff-effects following the change in background.
DARK ADAPTATION. That rods and cones may con-verge on single retinal ganglion cells in the cat wasshown first by Granit (19) and later confirmed byBarlow, FitzHugh, and Kuffler (2). In the monkeysimilar conclusions have been reached by Gouras(18). From the results of De Valois (10, 15) in therhesus geniculate it seems clear that some lateralgeniculate cells receive input from rods and cones,and others from cones only. Our findings confirmthose of De Valois, and further show that cells withfields clearly outside of the rod-free fovea mayreceive input from rods and cones, or from conesonly. Indeed, to our surprise, the majority of cellsrecorded from the 10° parafoveal region receivedno rod input. We have seen no examples of cellswith connections to rods but not to cones. As

Monkey Lateral Geniculate 221
shown in Fig. 145, two cells can exist side by side,one with a powerful rod input and the other withnone. This, then, is still another example of thestriking specificity of connections seen already inthe geniculate in other contexts.
In the present work we were particularlyinterested in the receptive-field organization ofcells that receive both rod and cone input. In thetype I cell the receptive fields in the dark-adaptedand light-adapted states had about the same centersize, and in all cells the center responses were thesame (on versus off) in the two states. The questionof whether the receptive-field periphery suppliesrods as well as cones in type I cells is still notanswered, and while it is true that at threshold noeffects were seen from the periphery, this was alsothe case in the type III cell of Fig. \5B, which turnedout to have a clear input from rods in the periphery.
It seems that some type III cells receive rodcontributions and others do not. In the one well-studied cell the rods from the center were excita-tory and those from the surround inhibitory, andthe same was true for the cones, so that there wasno basic difference in the field arrangement in thetwo states. Only at threshold did the surround failto manifest itself (Fig. 16), perhaps, as discussedabove, because of the necessity for having somecenter activation for the surround to work upon.
The dark-adaptation effects in type III cells arein some ways similar to those obtained in the cat byBarlow, Fitztiugh, and Kuffler (2). They found thatrods project onto single retinal ganglion cells, pro-ducing excitatory effects from the center andinhibitory effects from the surround, or the reverse.After some hours of adaptation the surround effectswere no longer detectable, not only from area-threshold measurements but also on comparingsmall and large spots as much as several log unitsabove threshold. In these cells both center and sur-round increased in sensitivity as the rods becameeffective in dark adaptation, but ultimately the cen-ter sensitivity considerably exceeded that of theperiphery. As shown in Fig. 15, no such center-periphery differences were seen in the monkey. Thissuggests a possible difference in dark-adaptationmechanisms in the two species, which would not besurprising since the cat is a nocturnal animal.
Just as with chromatic adaptation, the changein spectral sensitivity occurred within a second orless of the time that the background light was
turned off. This would surely not have been so hadour background been a high photopic one. Thequickness of the change, from responses dictatedprimarily if not entirely by cones to responses dueto rods, suggests that neural mechanisms werechiefly involved.
DISTRIBUTION OF CELL TYPES IN THE LATERALGENICULATE BODY. The significance of the layer-ing in the geniculate has puzzled anatomists andneurophysiologists for many years, and a numberof theories have been proposed, notably those ofClark (6) and Walls (46). In the present study one ofour main objectives was to learn whether cells ascategorized by receptive-field organization dif-fered from layer to layer. It was no surprise to findthe biggest disparity between the four dorsal layersand the two ventral, given the glaring histologicaldissimilarities in the two sets of layers. Distribu-tions of cell types were entirely different, therebeing no typical type I or type II cells in the ventrallayers, and no type IV cells in the dorsal. Amongthe four dorsal layers the only difference, besidesthe obvious one related to ipsilateral and contralat-eral eyes, was in the distribution of the type I sub-groups, the red on-centers being somewhat morecommon in the dorsal two layers than in the mid-dle two, and the red off-centers somewhat lesscommon. Both groups were nevertheless clearlyrepresented in both pairs of layers. The lack of anyfundamental differences in response properties ofcells in these four layers once more fits well withthe lack of any distinguishing histological features.
Our results are to some extent inconsistentwith those of De Valois and co-workers (14), whoconcluded that cells are segregated into threegroups by response type, with on-responses occur-ring in the two most dorsal layers (Dj and D2 in ourterminology), on- and off-responses in the middletwo, and off-responses (with inhibition during thestimulus) in the ventral layers. With respect to theventral layers our findings actually are not in dis-agreement, since practically all of the cells we haveobserved were either unresponsive to diffuse lightor, in the case of type IV, were inhibited. Neverthe-less, type IV cells are, ironically, on-center in type,having a periphery that dominates in diffuse light,and type III contains both on-center and off-center,so that it would be misleading to continue speakingof the ventral layer cells as "off" or "inhibitory."

222 PART III NORMAL PHYSIOLOGY AND ANATOMY
The middle pair of layers was shown byDe Valois et al. (14) to contain predominantlyopponent-color cells, giving on-responses or off-responses to diffuse light depending on wave-length. Our results confirm this. On the other hand,the dorsal pair of layers was initially described ascontaining on-cells, which constituted at first "theoverwhelming majority" (14) and later 75% (13) ofthe cells. These cells were originally thought to benarrow band "modulators" of five types, but subse-quently, as a result of using chromatic adaptation,they were found to have opponent-color properties(12). Our results show that the majority of dorsal-layer cells are opponent color in type and tend tosuggest that there are more on-center cells than off-center in these two layers, though off-center cellsare certainly quite common.
Anatomically and physiologically, the signifi-cance of the layering of the lateral geniculate bodycontinues to be obscure. Anatomically, one wouldlike to learn more about the afferent supply and theefferent projections of the different layers: whether,for example, ventral-layer and dorsal-layer cellsreceive projections from separate classes of retinalganglion cells, and whether the axons of the dorsallayers have cortical terminations different fromthose of ventral layers. The present physiologicalstudy, like that of De Valois and collaborators (13),fails to bear out either the trichromatic theory ofClark (6) or the photopic-scotopic theory of Walls(46). What one can say in summary is that in thedorsal four layers the cells are predominantly ofthe opponent-color type, at least for the part of thegeniculate representing parafoveal parts of theretina, whereas in the ventral two layers the impor-tance of color seems to be reduced.
SIZES OF RECEPTIVE FIELDS. The smallest field cen-ters measured in the present work were of theorder of 2 min. of arc, which would correspond toabout 10 |I. on the retina. These receptive fieldswere all type I, suggesting that the center was sup-plied by one type of cone only. The intercenter dis-tance between cones is 2.0—2.5 fl. in the central partof the human fovea and, to judge from 0sterberg'sdrawings, it is probably several times larger 1° fromthe center of the fovea (35, 37, 38). The smallestfield centers were thus supplied by a few cones atthe most, and possibly some were made up of onecone only, though more careful measurements
would be necessary to establish that. No area-threshold measurements were made on these cellsso the exact size of field centers and surrounds arenot known, but it is clear that the peripheries wereorders of magnitude larger than the centers.
FUNCTIONS OF THE LATERAL GENICULATE. Itshould be emphasized that the present study tellsus little about the part the lateral geniculate plays invision. The electron microscope leaves no doubtthat something more than a one-to-one relation-ship exists between optic fibers and geniculate cells(8), and it would be most interesting to know whatphysiological interactions these complex connec-tions subserve. We have no reason to think that theclasses of cells we have described for the geniculatedo not also exist in the optic nerve, since opponent-color responses have been described in the spidermonkey optic nerve (24), and several fibers whichwe recorded from the optic tract in the presentwork were not obviously different in their proper-ties from geniculate type I cells. It is true that in thespider monkey optic nerve opponent-color cellswere not nearly as common as in the rhesus genic-ulate, but this was probably related to the speciesdifference and to the large area of visual fieldsexplored in the spider monkey rather than to anydifference between retina and geniculate. Theexact function of the monkey geniculate is proba-bly more subtle. In the cat there are clear differ-ences between responses of geniculate cells andthose of retinal ganglion cells, one contribution ofthe geniculate being a more precise adjustment ofthe balance between field center and surround,with decreased effectiveness of diffuse light (25).Similar kinds of interactions may well occur in themonkey but, if so, a different type of study willprobably be required to reveal them.
There are, finally, some obvious correlationsbetween the responses observed in the geniculateand perceptual phenomena. Given a cell whosereceptive field is organized in center-surroundfashion, and supposing, for simplicity, that diffuselight is ineffective, illuminating the field centerwith a white spot of a particular intensity can pro-duce excitation or inhibition depending on whetherthe surround is simultaneously illuminated with abrighter or dimmer white light. There is a com-pelling parallel between these responses and one'simpression of the spot as "white" or "black," and it

Monkey Lateral Geniculate 223
is hard to think that the two events are not in someway related. Type I and type III cells are of courseequally capable of mediating these black-white sen-sations. In the case of color there is a similar paral-lel between the virtual ineffectiveness of diffusewhite light in opponent-color cells of type I or II,and the addition of complementary colors to pro-duce the sensation "white." This involves the as-sumption that a necessary condition for a white sen-sation is a failure of an opponent-color cell torespond. Here the type II cells would seem to playthe more important part, since in these the re-sponses depend predominantly on stimulus wave-length and to a much smaller extent on stimulusgeometry.
One is naturally inclined to ask whether asimilar parallel can be made between spatial color-induction effects or the spatial-color effects de-scribed by Land (29) and the behavior of the type Icell. Surprisingly, it turns out that type I cells are ofno direct help. The responses to a centered red spotare not enhanced by simultaneously shining greenin the surround, since for type I cell this amounts tothe same thing as using diffuse white light. Forcolor contrast in this situation one would seem torequire something like a red on-center green on-surround, a field type we have not so far seen. Onthe other hand, as already indicated, the type I cellis as good a candidate as the type III for the media-tion of black-white contrast mechanisms. It may bethat color contrast effects are not dealt with at aretinal or geniculate level at all, but only in the cor-tex. This would be consistent with the finding thatLand's effects can occur when the two images arepresented binocularly (17), which suggests that thenecessary machinery is present in the cortex—-though of course it does not rule out its existence atlower levels as well.
SUMMARY
In the visual system of primates, mechanisms existfor the analysis of both spatial and chromatic qual-ities of a retinal image. The present study wasdesigned to examine these processes at the lateralgeniculate level in the rhesus monkey. Extracellu-lar recordings were made from 224 cells whilestimulating the retina with spots of light of varioussizes and wavelengths, and in various states of lightand dark adaptation.
In the four dorsal (small cell) layers three typesof cells were distinguished. Type I cells were by farthe most common. In the light-adapted state theyhad concentrically arranged receptive fields whichwere divided into an excitatory or inhibitory centerand an opponent surround, the center and sur-round having different spectral sensitivities. Withdiffuse light stimuli they showed opponent-colorresponses, giving on-responses to one set of wave-lengths, off-responses to another set, and noresponse at some intermediate wavelength—the"neutral point." Chromatic-adaptation studies sug-gested that the cell had connections with one of thethree types of cones in the field center, and anotherin the surround. Five varieties were seen, in orderof frequency: 1) red on-center, green off-surround;2) red off-center, green on-surround; 3) green on-center, red off-surround; 4) green off-center, redon-surround; and 5) blue on-center, green off-surround. All type I cells behaved in the same wayto white light, showing the usual center-surroundarrangement seen in the retina or geniculate in thecat. On-off responses were rare or absent.
Type II cells made up a small minority of thedorsal-layer cells. They lacked any center-surroundreceptive-field arrangement, but gave opponent-color responses over all regions of the receptive fieldand had a 500-mfJ,. neutral point that was inde-pendent of stimulus geometry. These cells behavedas though they received opponent inputs from twosets of cones with identical distributions over theretina. Two types were seen: green-on, blue-off, andgreen-off, blue-on. A few cells seemed to haveopponent connections with green and red cones.Here the two cone types were distributed through-out overlapping regions, but one set of conesseemed to predominate in the field center and theother in the surround.
Type III cells had concentrically arranged on-center or off-center receptive fields, the center andsurround having identical spectral sensitivities. Alarge spot evoked a weaker response than a smallone regardless of wavelength. These cells probablyreceived input from cones of several types, the pro-portions of the three types being the same for thefield center as for the surround.
A number of cells with fields outside thefovea were studied also in the dark-adapted state.Some type I cells behaved as though they had noconnections with rods, while others showed clear
224 PART III NORMAL PHYSIOLOGY AND ANATOMY
evidence for rod input, giving a 4 log unit increasein sensitivity with a shift in the peak sensitivity to apoint near 500-520 m(l. Opponent-color effectswere no longer seen, and center-type responsesoccurred over the entire spectrum except at highstimulus intensities in the red. At threshold levelsof intensity these responses were evoked from thefield center only, so that whether they receive inputfrom rods in the field periphery is still uncertain.Two type II cells examined in dark adaptationshowed no evidence for rod connections. Of fourtype III cells two lacked a rod input, and the othertwo had rods feeding in from center and surround,forming opponent systems just as in the light-adapted state; for these cells scotopic thresholdswere practically the same for center and surround.
All of the cell types were seen in both pairs ofdorsal layers, and there were no differences in dis-tribution of cell types in these four layers except fora suggestion that red on-center cells were morecommon in the two dorsal layers than in the twomiddle, and red off-center cells less common.Field-center sizes were generally smaller for type Icells than for type III, and among type I cells on-centers tended to be smaller than off-centers. Fieldcenters were smaller the closer they were to thefovea, the smallest being 2 min. of arc in diameter,for fields 1° or 2° from the fovea; the largest werearound 1°. Fields of type II cells ranged in diame-ter from 1/4° to 1°.
Ventral-layer cells were of two kinds. Thefirst seemed similar to type III as described above.The second, termed type IV, had concentricallyarranged on-center fields with a very large off-surround whose spectral sensitivity was displacedto the red with respect to the center. With red light,and generally also with white, the receptive-fieldperiphery prevailed over the center, so that diffuselight produced a well-maintained suppression ofthe background firing.
In summary, a wide variety of cell types arepresent in the monkey geniculate. Some are con-cerned mainly with spatial variables, others withcolor, but most are able to handle both variables.Some have connections both with rods and conesand others with cones only.
ACKNOWLEDGMENTS
We express our thanks to Jane Chen, for histological work, andto Janet Tobie Wiitanen and John Tuckerman for their techni-cal assistance.
References
1. Barlow, H. B. Summation and inhibition in the frog'sretina./. PhysioL, 1953,119: 69-88.
2. Barlow, H. B., FitzHugh, R, and Kuffler, S. W. Change oforganization in the receptive fields of the cat's retina duringdark adaptation./. PhysioL, 1957,137: 338-354.
3. Barlow, H. B., Hill, R. M., and Levick, W. R. Retinal gan-glion cells responding selectively to direction and speed ofimage motion in the rabbit./. PhysioL, 1964,173:377-407.
4. Brown, J. E. and Rojas, A. J. Rat retinal ganglion cells:receptive field organization and maintained activity. /.NeurophysioL, 1965,28:1073-1090.
5. Brown, P. K. and Wald, G. Visual pigments in single rodsand cones of human retina. Science, 1964,144: 45—52.
6. Clark, W. E. L. Anatomaicl basis of colour vision. Nature,Land., 1940,746:558-559.
7. Clark, W. E. L. and Penman, G. G. The projection of theretina in the lateral geniculate body. Proc. my. Soc., Ser. B.1934,774:291-313.
8. Colonnier, M. and Guillery, R. W. Synaptic organization inthe lateral geniculate nucleus of the monkey. Z. Zellforsch.,1964,62:333-355.
9. Dejours, S. F. Receptive Fields of Optic Tract Fibers in Lizards(Sceloporus SPP) (Doctoral dissertation). Cambridge, Mass.,Harvard Univ., 1965.
10. De Valois, R. L. Color vision mechanisms in the monkey./.gen. PhysioL, 1960,43(6), Part II: 115-128.
11. De Valois, R. L. Behavioral and electrophysiological studiesof primate vision. In: Contributions to Sensory Physiology,edited by W. D. Neff. New York, Academic, 1965, vol. I, pp.137-178.
12. De Valois, R. L., Jacobs, G. H., and Jones, A. E. Responsesof signle cells in primate red-green color vision system.Opti\, 1963 20: 87-98.
13. De Valois, R. L. and Jones, A. E. Single-cell analysis of theorganization of the primate color-vision system. In: TheVisual System: Neurophysiology and Psychophysics, edited byR. Jung and H. Kornhuber. Springer, Berlin, 1961,178-191.
14. De Valois, R. L, Smith, C. J., Karoly, A. J., and Kitai, S. T.Electrical responses of primate visual system: I. Differentlayers of macaque lateral geniculate nucleus. /. comp. Phys-ioL PsychoL, 1958,51: 662-668.
15. De Valois, R. L., Smith, C. J., Kitai, S. T., and Karoly, A. J.Response of single cells in monkey lateral geniculate nucleusto monochromatic light. Science, 1958,727:238—239.
16. Dowling, J. E. Neural and photochemical mechanisms ofvisual adaptation in the rat./, gen. PhysioL, 1963, 46: 1287—1301.
17. Geschwind, N. and Segal, J. R. Colors of all hues frombinocular mixing of two colors. Science, 1960, 737: 608.
18. Gouras, P. Primate retina: duplex function of dark-adaptedganglion cells. Science, 1965,147:1593-1594.
19. Granit, R. Sensory Mechanisms of the Retina. London,Oxford Univ. Press, 1947.
20. Hartline, H. K. Inhibition of activity of visual receptors byilluminating nearby retinal areas in the Limulus eye. Fed.Proc. 1949,8: 69.
21. Hubel, D. H. Single unit activity in striate cortex of unre-strained cats./. PhysioL, 1959,147:226-238.
22. Hubel, D. H. Single unit activity in lateral geniculate bodyand optic tract of unrestrained cats./. PhysioL, 1960, 750:91-104.
23. Hubel, D. H. and Wiesel, T. N. Receptive fields of singleneurones in the cat's striate cortex. /. PhysioL, 1959, 148:574-591.
24. Hubel, D. H. and Wiesel, T. N. Receptive fields of optic nervefibers in the spider monkey./. PhysioL, 1960,154: 572-580.

Monkey Lateral Geniculate 225
25. Hubel, D. H. and Wiesel, T. N. Integrative action in thecat's lateral geniculate body./. Physiol., 1961, 755: 385-398.
26. Hubel, D. H. and Wiesel, T. N. Receptive fields, binocularinteraction and functional architecture in the cat's visualcortex./. Physiol., 1962, 260:106-154.
27. Hubel, D. H. and Wiesel, T. N. Responses of monkeygeniculate cells to monochromatic and white spots of light.Physiologist, 1964, 7:162.
28. Kuffler, S. W. Discharge patterns and functional organiza-tion of mammalian retina./. Neurophysiol., 1953,16: 37-68.
29. Land, E. H. Color vision and the natural image. Parts I andII. Proc. not. Acad. Sci., Wash., 1959,45:115-129,636-644.
30. Marks, W. B., Dobelle, W. H., and MacNichol, E. F. Jr.,Visual pigments of single primate cones. Science, 1964,143:1181-1182.
31. Mello, N. K. and Peterson, N. J. Behavioral evidence for colordiscrimination in cat./. Neurophysiol., 1964,27:323—333.
32. Meyer, D. R. and Anderson, R. A. Color discrimination incats. In: Color Vision (Ciba Foundation Symposium).Boston, Little, Brown, 1965, pp. 325-339.
33. Michael, C. R. Receptive Fields of Simple Optic Nerve Fibersin the Ground Squirrel (Doctoral dissertation). Cambridge,Mass., Harvard Univ., 1965.
34. Motokawa, K., Taira, N., and Okuda, }. Spectral responsesof single units in the primate visual cortex. Tohotyt ]. exp.Med., 1962, 78: 320-337.
35. O'Brien, B. Vision and resolution in the central retina. /.opt. Soc. Amer., 1951,41: 882-894.
36. Okuda, }., Taira, N., and Motokawa, K. Spectral responsecurves of postgeniculate neurons in the cat. Toho^u /. exp.Med., 1962, 78:147-157.
37. Osterberg, G. Topography of the layer of rods and cones inthe human retina. Acta ophthal., Kbh., 1935, Suppl. 6.
38. Polyak, S. The Vertebrate Visual System. Chicago, Univ.Chicago Press, 1957.
39. Rushton, W. A. H. Increment threshold and dark adapta-tion./, opt. Soc. Amer., 1963,51" 104-109.
40. Sechser, J. A. and Brown, J. L. Color discrimmination in thecat. Science, 1964,144:427-429.
41. Svaetichin, G. II. Spectral response curves from singlecones. Acta physiol. scand., 1956,39, Suppl. 134: 19-46.
42. Talbot, S. A. and Marshall, W. H. Physiological studies onneural mechanisms of visual localization and discrimina-tion. Amer. J. Ophtal., 1941,2* 1255-1263.
43. Wagner, H. G., MacNichol, E. E, Jr., and Wolbarsht, M. L.Opponent color responses in retinal ganglion cells. Science,1960,^7:1314.
44. Wagner, H. G., MacNichol, E. E, Jr., and Wolbarsht, M. L.The response properties of single ganglion cells in the goldfish retina./, gen. Physiol., 1960,43, Part II: 45-62.
45. Wagner, H. G., MacNichol, E. E, Jr., and Wolbarsht, M. L.Functional basis for "on"-center and "ofF'-center receptivefields in the retina./, opt. Soc. Amer., 1963,53:66-70.
46. Walls, G. L. The lateral geniculate nucleus and visual histo-physiology. Univ. Calif. Publ. Physiol., 1953,9:1-100.
47. Wiesel, T. N. and Hubel, D. H. Receptive fields of monkeygeniculate cells in the dark adapted state, Physiologist, 1964,7:287.
48. Wolbarsht, M. L., Wagner, H. G., and MacNichol, E. E, Jr.The origin of "on" and "off responses of retinal ganglioncells. In: The Visual System: Neurophysiology and Psy-chophysics, edited by R. Jung and H. Kornhuber. Springer,Berlin, 1961, pp. 163-170.
49. Wolbarsht, M. L., Wagner, H. G., and MacNichol, E. E, Jr.Receptive fields of retinal ganglion cells: extent and spectralsensitivity. In: The Visual System: Neurophysiology and Psy-chophysics, edited by R. Jung and H. Kornhuber. Springer,Berlin, 1961, pp. 170-175.
AFTERWORD
In tackling the monkey lateral geniculate, we got into color studies whetherwe wanted to or not. Little did we know what kind of hornet's nest we wereinvading. Scientists who study color do not comprise a pure culture of con-tentious or surly people, but the atmosphere in the field is hardly what onewould call calm. When provoked, some of our best and warmest color-visionfriends can rise up in intense wrath at public meetings, as William Rushtononce did at a seminar at Harvard conducted by George Wald. I forget exactlywhat provoked William, but the audience, largely of undergraduate stu-dents, must have been perplexed at the heat generated in these two titanicfigures in science by such a seemingly pacific topic. As we left the auditoriumand proceeded to the elevators, William said to me, "David, I feel terrible. Ido not know what can possibly have come over me to make such an out-burst". An early reaction to this monkey-color paper came when Williamvisited us shortly after its publication. As he walked into our tearoom, helaunched forth with a heated denouncement of our failure to attribute theearly determinations of the three cone spectral sensitivities to him, ratherthan to the quintet of Wald, Brown, Dobelle, MacNichol, and Marks. Wehad admired those people because they were the first to make such measure-ments in single receptors, but Rushton was certainly right. His work not only

226 PART III NORMAL PHYSIOLOGY AND ANATOMY
had the priority, but was celebrated for its ingenuity and elegance. We feltterrible and heartily apologized. He accepted our apologies and at oncebecame his usual friendly self—and the matter was never again mentioned.But our omission was inexcusable and we still feel guilty.
A few years later I visited a group of visual scientists at Tallahassee,Florida, where William Rushton was doing a sabbatical. He greeted mewarmly, saying, "David, I know neither of us wants to sit here talking aboutdry science. Let's go outside to the swimming pool, where there are far moreinteresting things to look at than slides and posters". William died in 1980.He was brilliant, warm, with a wonderful sense of humor, and we miss himsorely.
In the mid-1960s our methods were far cruder and less flexible thanthose available today. We had no computers, and because of the bizarreaction spectra of video-monitor phosphors no one had thought of usingcolor-TV techniques to generate stimuli. Reverse correlation methods formapping receptive fields were far in the future, as were cone-isolation tech-niques. We mapped our receptive fields by generating white or monochro-matic stimuli with an optic bench whose main components were a slide pro-jector, a shutter, and a set of interference filters. To evaluate responses theideal method would have been to measure light intensities required to evokeresponses of criterion magnitudes for different wavelengths. We would haveplotted responses against stimulus intensities and extrapolated back to zeroresponse, but we lacked the equipment and the electronics engineer to buildit. So we decided to use thresholds as our "criterion response magnitudes",and to do that by ear. Anyone who tries that soon learns that it is not easy.That is the reason for the alpine profiles of many of our threshold-versus-wavelength curves.
It almost immediately became apparent that the dorsal four geniculatelayers contain a mixture of cells, which we designated types 1, 2, and 3. Webegan by calling them A, B, and C, but changed over to 1,2, and 3 whenRichard Jung objected that A—C would make for confusion with his labelsfor cat cortical cells. Ironically, it turned out that his types B, C, D, and Ewere, after all, almost certainly geniculate axons.
Type 1 cells (opponent-color center-surround) are still the subject ofsome disagreements. The field centers are clearly supplied by a single conetype. The main question concerns the makeup of the receptive-field sur-rounds—whether these are supplied by a single cone type, as we had thought(or two, in the case of blue center yellow (red & green) surround cells) or allthree, and therefore "broadband". The argument goes back and forth, withparticipants ranging from retinal anatomists, predominately Peter Sterling,our erstwhile postdoc—and physiologists. We still find our main evidence,comparing responses to small and large spots at short and long wavelengths,simple and compelling. Present-day techniques (cone isolation, reverse cor-relation) should help settle the question.
As we point out in the paper, it may well be that the centers and sur-rounds of type 1 cells interpenetrate, so that one might, if one had mathe-

Monkey Lateral Geniculate 227
matical leanings, describe the fields as "difference-of-Gaussians". For thegoldfish cells of Wolbarsht et al. this was easy to establish, because in gold-fish the time courses of the on and off systems are not perfectly complimen-tary, and stimulating both together produces on-off responses. That makes itrelatively easy to map separately the two opponent systems, using "on"responses to assess excitation and "off" responses to assess inhibition. Inmacaques the time courses of the two opponent systems are apparently wellenough matched so that their effects cancel, and instead of on-off responsesone sees little or no response. Mapping the separate overlapping componentsthen becomes difficult. Still, there seems little doubt that the two opposingsystems overlap. The question seems somewhat academic given the tiny sizeof the field centers. We are, perhaps pedantically, unhappy with the term"difference-of-Gaussians", which we suspect represents wishful or wistfulthinking by mathematically oriented biologists. To call any bell curve"Gaussian" seems to us like the solecism of using the word "ellipse" to referto any oval.
We found broadband cells (type 3) fairly common in the dorsal fourlaminae. Peter Schiller once flatly declared to me that all dorsal-layer cellsare type 1, and Margaret Livingstone has tended to agree with him, in think-ing that all parvocellular cells are color-coded. Modern methods, again,should easily resolve this.
We had, looking back, amazingly few examples of type 2 cells. Moreexamples are sadly needed. These were cells in which the two opponent sys-tems (red vs. green, or yellow vs. blue) overlapped extensively or completely.We now think that they—at least the yellow-blue ones—are confinedmainly to the narrow interlaminar leaflets, the thin and thinly populated lay-ers between the principal six geniculate layers. That would help explain therelative rarity of type 2 cells in our penetrations. For the yellow-blue cells(called "blue vs. green" in the paper), the almost perfect superimposition ofthe area-threshold curves obtained with short and middle wavelengths(shown in Fig. 9) convinced us of the complete overlap of the two opponentsystems. For our red-green type 2 cells, the overlap of the two systems wasusually incomplete, one of the two components exceeding the other in diam-eter. Nevertheless, these cells seemed quite unlike type 1 cells, whose centerswere far smaller, and whose surrounds were larger. The dimensions of thetype 2 receptive-field regions seemed to fit better with our acuity for colorthan was true for the type 1 cells. Our present guess is that these are the cellsthat feed into the double-opponent cells of cortical V-l.
Type 4 cells, the commonest in the magnocellular layers, are in someways the most interesting and puzzling of all the geniculate cells. Outside ofour paper, one has to search the literature for any inkling of the special pecu-liarities of these cells: the clear color opponency present in the receptive-fieldsurrounds; the extremely sustained quality of the surround responses; thevery transient quality of the responses from the broadband field centers; thedominance, in the case of the sustained response components, of the sur-round over the center when longwave light is used. From one magnocellu-

228 PART III NORMAL PHYSIOLOGY AND ANATOMY
lar cell to the next these cells show a stereotyped behavior. When an electrodeenters the ventral layers, the effect of bathing the projection screen with redlight is to produce utter and sustained silence from all the cells within record-ing range, whereas with diffuse white light the suppressive effect is muchweaker, or entirely lacking. We found this to be the easiest way of knowingthat an electrode has passed from the parvocellular layers to the magnocel-lular. Adding short or middle wavelength light to the red in the surroundimmediately brings back the activity, demonstrating vividly the color oppo-nency in the surround. Nevertheless, magnocellular geniculate cells are stillwidely regarded as not color coded, and as giving transient responses.
Strangely, we have seen no reflection of any of this type 4 behavior incells in layer 4C alpha of cortical V-l, even though that layer receives itsgeniculate input exclusively from magnocellular cells.
We wonder what function these prominent and bizarre cells serve.Why the importance of red? Why the very sustained quality of the surroundresponses, compared to the brief responses to centre stimuli? Above all, whyhas their strange behavior largely been ignored? Perhaps part of the reasonfor the neglect is the extensive and exclusive use, in many of the studies thatfollowed ours, of sine wave grating stimuli, which seems far from ideal if onewants to study receptive field centers and surrounds separately. Given theconcentric organization of the centers and surrounds of geniculate fields, touse gratings in working out the cells' properties seems to us a mistake; onemight even say, perverse.
To return to type 1 cells, we ask what part they can be playing in pri-mate color vision. That they are color coded in any ordinary sense is undeni-able. The opposite-type responses ("on" vs. "off") to diffuse light at differentends of the spectrum and their failure to respond to diffuse white light isprima facie evidence for color coding. Yet there are reasons to be scepticalabout their role in color vision. First, as already mentioned, the small size oftheir field centers seems to match our acuity for luminance, but to be a poormatch for our relatively coarser acuity for color, to which the larger size oftype 2 fields seems a better fit. Second, to explain color contrast or color con-stancy would seem to require receptive fields with a center fed by one conetype and a surround fed by a different one, but both should be excitatory, orboth inhibitory, surely not one of each. A cell with a red-on center and green-off surround is the very thing one does not want for red-green color contrast:rather, one expects a red-on center and green-o« surround. The closest thingto this is found in the blobs of monkey V-l cortex, in the double-opponentcells. Thus the candidate for red-green contrast would be a cell with red-ongreen-off center and red-off green-on surround. Such cells were originallydescribed in the goldfish retina by Nigel Daw (J Physiol 1968,197:567-592),by us in our 1968 monkey cortex paper, by Charles Michael in squirrel genic-ulate (/ Neurophysiol 1973,36:536—550) and monkey striate cortex (/ Neuro-physiol 1978, 41:572—588), by Margaret Livingstone and Hubel in corticalblobs (/ Neurosci 1984, 4:309-356) and by Bevil Con way in striate cortex(Journal of Neuroscience, 2001, 21(8): 2768-2783). How double-opponent

Monkey Lateral Geniculate 229
cells are built up from simpler antecedents is still not known. It would seemeasiest to imagine that they are derived from type 2 cells, rather than fromtype 1, in which the field centers seem too small and the surround suppres-sion is of the wrong sign.
Another reason to doubt that type 1 parvocellular cells play an impor-tant part in color vision comes from studying cells in the upper layers of stri-ate cortex (V-l). The massively preponderant inputs to these cortical cells,the parvocellular geniculate cells, are type 1. We might therefore haveexpected upper-layer cortical cells to be overwhelmingly color coded, but wequickly found that they are not. We wondered if combining the effects of thevarious subtypes of type 1 cells might have led to the loss, through pooling,of the color information. To test whether a cell is totally color-blind, one canstimulate with a slit of one color moving against a background of another,and vary the relative intensities of the two. If a cell is totally color blind, atsome pair of relative intensities the cell should fail to respond. Work byGouras and Kruger (/ Neurophysiol 1979, 42:850—860) and confirmed byHubel and Margaret Livingstone (/ Neurosci 1990, 10(7), 223-2237) showedthat about half of the cortical cells responded to slits of one color against abackground of another, at all relative intensities. Hence for these cells thecolor information is not lost, even though they show no overt opponency. Forexample, they respond well to white light, whereas opponent-color cells donot. Such cells could be useful in defeating camouflage, but it seems unlikelythat they play a major part in color recognition.
Though we delight in our color vision and sympathize with those thatlack it, clearly our vision depends mainly for its success on luminance differ-ences. That is something the upper-layer cortical cells handle very well,doubtless because geniculate parvocellular cells when studied with whitelight likewise do very well. For the fovea the case is clear: there, a cell whosefield center is fed by a single cone has to be fed by some kind of cone, and wesee black-white well enough with our foveas.
Given that most of the receptors in our retinas are rods, it seemedimportant to ask whether the geniculate cells we studied received any rodinput. For a time we avoided the question because it is tiresome to work inthe dark—one has to grope, and we tended to fall asleep. Moreover we hadthought that to test each of our cells for rod inputs we would have to turn outthe lights and wait for at least a half hour. We used ourselves to assesswhether at any given moment we and the monkey were dark-adapted ornot: we turned down the background light, made a green stimulus spot pro-gressively fainter, and waited until it disappeared when we looked right at it,and reappeared and became grey when we looked away. To our surprise thatusually happened after five to 10 minutes, provided the room was not daz-zlingly bright to begin with. So we found we could test every cell for rodinputs fairly quickly, without waiting for complete dark adaptation.
Our first effort to study dark adaptation was exciting and a cause ofsome hilarity (at least on our part). To avoid the scattering of light from ourpowerful tripod-supported Leitz slide projector, we had draped a large black

230 PART III NORMAL PHYSIOLOGY AND ANATOMY
cloth over the entire rig. On that occasion Dr. Otto Krayer, our chairman,paid us a rare visit—we don't remember his reason. Just as he entered theroom the entire cloth burst into flames. Dr. Krayer must have wonderedwhat kinds of postdocs Steve had imported to his department. He was, asusual, kind, but obviously did not think the whole thing was very funny.
In our small sample of dark-adapted cells we showed that both mag-nocellular and parvocellular cells can receive rod inputs, though not all do.All the cells we recorded received cone inputs. For cells that do receive rodinputs, it was always the case that if the centre was "on" in photopic condi-tions, it was also "on" in dark adaptation, and the same for off-center cells.Contrary to the impression given by Barlow, Fitzhugh, and Kuffler in theirstudy of dark adaptation in cats in 1957 (/ Physiol 137:327-337), we foundthat all the type 1 cells that we examined in scotopic conditions showed clearrod input to the surrounds. We saw no obvious change in field center sizewhen the eye was dark-adapted. Our overall impression, from measure-ments of thresholds of dark-adapted cells, was that a cell either receivedabundant rod input (i.e., had a very low threshold, matching our own behav-ioral thresholds) in dim light, or it failed to show any rod input. If centersizes are the same in scotopic and photopic conditions, how can one accountfor our lowered acuity in dim light? We suspect that outside the fovea it isthe cells with smaller field centers that receive no rod input. One obviouslyneeds a survey of different parts of the lateral geniculate to correlate recep-tive field size with distance from the fovea (eccentricity).
One lesson from this paper seems to be that if we had wished to makea lasting impact on a field, we should have extended the work, pushing it fur-ther, using newer and more powerful methods to build on what we hadalready done, and correcting any errors along the way. As usual in research,one has to make choices. I doubt if today we would trade our work on visualdeprivation and columnar organization for a more thorough account ofgeniculate cells. And perhaps we chose wisely after all, given the primitivenature of the equipment available to us in the mid-1960s.
Chapter 13 • Recording Fibers in theCat Corpus Callosum •
FOREWORD
This paper represents a slight deviation from our receptive-field research innormal animals. We had found it hard to imagine what part the corpus cal-losum might play in vision. It had long been thought to link homologousparts of the two hemispheres, with little idea of how, exactly, that might beuseful. For the prefrontal areas, about which so little was known in terms offunction, it was impossible to think about the problem at all. For thesomatosensory cortex or the visual cortex one could ask some more clearlydefined questions. It would make no sense, it seemed to us, to link regions ofcortex subserving the two thumbs or the two feet, or two mirror-symmetricregions of the peripheral left and right visual fields. It was not until welearned that callosal connections in the visual system linked cortical regionssubserving the midline that the structure began to make any sense.
Rarely, humans are born without a corpus callosum. Occasionally it isnecessary to sever the corpus callosum surgically, either to prevent the spreadof epileptic seizures from one hemisphere to the other, or to allow the sur-geon to reach deeply buried brain or pituitary tumors. In such cases little ornothing had been found in the way of neurological deficits. The first exper-imental demonstration of major deficits from callosal sectioning came fromthe work in cats by Ronald Myers, in Roger Sperry's laboratory (/ CompPhysiol Psychol 1955, 48:470-473). Ronald showed that a task learned by onehemisphere failed to transfer to the other side. The findings were striking,and provided vivid examples of the necessity, in brain research, of designingingenious behavioral tests, rather than simply noting the absence of obviousdefects. Roger Sperry, J. Bogen, and M. S. Gazzaniga extended Myers' workto humans (Gazzaniga et al., Brain 1965, 88:221-236; Gazzaniga and SperryBrain 1967, 90:131-148), taking advantage of the relative ease of doingbehavioral work in humans, and making use of human attributes such asspeech, whose function is largely lodged in the left hemisphere. As an exam-ple of such tests, one could show an object to a person's (or animal's) leftvisual field, and consequently the right visual cortex, and ask the subject to
231

232 PART III NORMAL PHYSIOLOGY AND ANATOMY
grasp it with the right hand, which would require the information to getover to the left motor cortex. Such a problem proved easy for a normal per-son or animal, but impossible after the corpus callosum had been cut.
In the case of vision it was not hard to think of reasons for linking thetwo hemispheres. Our schemes for the elaboration of simple and complexcells in striate cortex pointed to abundant, very local, short, lateral connec-tions, linking neighboring cells whose receptive fields were overlapping oradjacent. So it was natural to think that cells whose receptive fields cameclose to the midline of the visual fields or straddled them should be similarlyinterconnected. Some such cells would be in one hemisphere of the brain andsome in the opposite hemisphere; and many connections would thereforehave to cross from one hemisphere to the other. (Presumably delays, causedby the distance to be traversed, could be made up for simply by addingmyelin to the axons.) Work by Choudhury, Whitteridge, and Wilson in catsalso pointed strongly to this idea (Quarterly J Exp Physiol 1965, 50:214-219).Having cut the optic chiasm in the midsagittal plane, so that the left eye wasconnected to the left hemisphere and the right eye to the right hemisphere,they stimulated the left eye, and observed responses from both cortical hemi-spheres. The only way to get from the left eye to the right hemisphere thenhad to be via the corpus callosum. We decided to test these ideas directly bylooking for receptive-field overlap of cells near the 17-18 border, and byrecording directly from the corpus callosum.
Cortical and Callosal Connections Concerned with the VerticalMeridian of Visual Fields in the Cat1
DAVID H. HUBEL AND TORSTEN N. WIESEL • Department of Physiology, Harvard Medical School, Boston,
Massachusetts
In higher mammals the left half of the visual field present paper deals with the physiological proper-is represented in the right visual cortex, and the ties of some of these connections,right half in the left cortex. The fact that our visual In the cat the vertical midline of the visualfields appear uniform, with no obvious interrup- field has its primary representation in and close totion along the vertical midline, would seem to call the poorly defined boundary between areas 17 andfor connections linking the two hemispheres. The 18 (7, 10). Each half-visual field is represented in
From/. Neurophysiol. (1967), 30, 1561-1573
Received for publication March 20,1967.
'This work was supported by Research Grants NM-02260-08 and NB-05554-03 from the National Institutes of Health.

Cat Corpus Callosum 233
both 17 and 18 in mirror fashion, so that as one pro-ceeds away from the 17-18 boundary in eitherdirection, medially along 17 or laterally along 18,the corresponding region of visual fields movesoutward from the vertical meridian into the con-tralateral visual field. Recent anatomical evidenceindicates that the part of area 17 adjacent to the 17-18 boundary sends callosal projections to the otherhemisphere, ending in 18 near the 17-18 boundary(2, 7, 8) and possibly also in the adjacent part of 17(8). Thus the parts of 17 and 18 having to do withthe vertical midline of the visual fields are appar-ently connected on the two sides by the corpus cal-losum. In contrast, the more medial parts of 17,representing the peripheral parts of the visualfields, seem not to be reciprocally interconnected,and indeed one would hardly expect that cells con-cerned with a particular part of the left visual fieldshould be connected specifically to cells concernedwith the corresponding region in the right field.
These anatomical findings have lately beenconfirmed in the elegant physiological experimentsof Choudhury, Whitteridge, and Wilson (1). Theyshowed that with one optic tract cut, responses tolight could be evoked in the ipsilateral hemisphereonly near the 17-18 border, and only when thestimulus was applied near the vertical meridian.The responses were abolished either by cooling thecorresponding region in the contralateral hemi-sphere or by cooling or cutting the posterior corpuscallosum.
Several lines of evidence thus indicate thatfibers in the corpus callosum originating in themost lateral part of 17 and projecting to 18 on theother side have special functions involving the ver-tical midline of the visual field. If this is so, thensome cells in 18 near the 17-18 boundary ought tohave receptive fields that straddle the vertical mid-line. Experimentally this is difficult to verifydirectly, since in the cat the exact position of thevertical midline is not easy to establish. Our firstobjective was to circumvent the difficulty by mak-ing simultaneous recordings from visual areas inthe two hemispheres, looking for possible overlapbetween receptive fields of cells on the two sides.Any overlap would of course mean that at least oneof the two receptive fields extended across the ver-tical meridian. A second objective was to recordfibers directly from the corpus callosum, examinetheir responses to visual stimulation, and see to
what extent they are preoccupied with the verticalmidline.
METHODS
The experimental preparation was similar to that used inour previous work (4—6). The cat was anesthetized withintraperitoneal thiopental, the head held in a Horsley-Clarke stereotaxic apparatus, the eyes paralyzed withintravenous succinylcholine and held open facing awhite tangent screen at a distance of 1.5 m. Pupils weredilated with homatropine, and the corneas protectedwith contact lenses. The focus of images on the screenwas determined with a slit retinoscope, and if necessaryadjusted by interposing spherical lenses. Positions on thescreen corresponding to the area centralis and optic discof each eye were determined by using an ophthalmo-scope (4), and the points were remeasured every hour orso, or whenever there was suspicion that the eyes hadmoved. Stimuli consisted of black or white lines or edgesprojected against a diffuse white background (6).
Cortical recordings were made with two indepen-dently positioned tungsten electrodes connected to sepa-rate recording channels. The electrodes were introducedthrough small holes in the skull and dura 1—2 mm toeither side of the midline at the same Horsley-Clarkelevel. The corpus callosum was explored between planesA2 and A6 with a single electrode inserted stereotaxi-cally 1-2 mm to the left or right of the midline. In allpenetrations electrolytic lesions were made to identifythe electrode tracks by passing 1—5 ^la for 5-10 sec (4).
RESULTS
Simultaneous Recordings from the TwoHemispheresAn exploration was first made of the cortical rep-resentation of the vertical midline of the visualfield, looking especially in 17 and 18 for any possi-ble overlap between the two half fields across themidline. Five such experiments were done. In eachof these, two electrodes were placed initially inroughly corresponding parts of the postlateralgyrus, close to the region representing the area cen-tralis (Horsley-Clarke frontal plane -2 to +1).Receptive-field positions were mapped for severalcells in each hemisphere, and if necessary one elec-trode was moved forward or back until the fieldswere at about the same horizontal level.
In the experiment of Fig. \A one penetrationwas made on the left side and three on the right.

234 PART III NORMAL PHYSIOLOGY AND ANATOMY
Fig. 1. Receptive fields of cells plotted in simultaneous recordings from the two hemispheres. Fields outlined byinterrupted lines correspond to cells in the left hemisphere; continuous lines, right hemisphere. AC = area cen-tralis. A: one penetration was made in the left hemisphere (L) and three (P1—P3) in the right (R), at differentanteroposterior levels. All penetrations were in 17, close to the 17-18 border. Simultaneous recordings were madeof units 1 (R) and 2 (L); then 4 (R) and 2 (L); then 4 (R) and 5 (L); and finally 6 and 7 (R) together with 5(L). In none of these simultaneous recordings was there any trace of overlap. B: a similar experiment in whichthe left electrode was in IT and the right in the transition zone between 17 and 18. Unit 2 recorded simultane-ously with 3 and then with 4; unit 4 recorded simultaneously with 5 and then 6.
Both electrodes were in area 17, close to the 17-18border. Some fields of simultaneously recordedcells touched, but in no case was there a commonregion of visual field within which a stimulusexcited cells in both hemispheres simultaneously.Cells 2 and 6, whose fields might seem to overlap,were studied some time apart, and it is possible that
small eye movements may have occurred in theinterval. Because of the imprecision in estimatingthe exact center of gaze, the vertical meridian in allthese figures is only a rough estimate, to the nearestdegree or so.
Two other experiments also failed to show aconvincing overlap across the midline. In one of
Cat Corpus Callosum 235
these, both electrodes again were in 17; in the other(Fig. 15), one electrode was in 17 and one in thetransitional region between 17 and 18.
In two of the five experiments there was clearoverlap between fields of cells on the two sides. Inthe first animal one electrode was in 17 and theother in 18. In the second experiment, illustrated inFig. 2, both electrodes were in the 17-18 transi-tional zone. The field maps of Fig. 2 were obtainedby first advancing one electrode and then the other,making a number of simultaneous recordings. InFig. 2A the two maps correspond to two sets ofsimultaneously recorded cells. In the upper set cells1 and 2 were studied together, then 3 and 2, andthen 3 and 4, one electrode always being kept inplace while the other was advanced, to be sure thatthe eyes had not moved in the meanwhile. Simi-larly for the lower set, cell 9 was recorded from theleft hemisphere together with units 10 and 11 onthe right; then the left electrode was advanced andcell 12 was observed together with 10 and 11. Inboth these sets the stimulus could be moved strictlywithin the region of overlap while the responses ofthe two cells were observed.
The fields of all 22 cells recorded in thisexperiment are shown superimposed in Fig. 2B.Eleven cells were recorded from the right hemi-sphere (continuous lines) and 11 from the left(interrupted lines). By always having a cell underobservation in one hemisphere or the other wecould be certain that there were no eye movementsof more than about 1/4°. As usual in studies ofvisual cortex, the total visual-field area occupied bythe overlapping receptive fields of a group of cellsin a small region of cortex was two to four timesthat of an average receptive field in the group. Thetwo groups of receptive fields from the two hemi-spheres themselves overlapped over about 1/3 oftheir total area.
CORRESPONDENCE OF RECEPTIVE-FIELD POSITION INBINOCULARLY DRIVEN CELLS. The following ob-servations have little direct bearing upon the prob-lem of midline overlap of receptive fields, but weremade incidentally while recording from pairs ofcells simultaneously with two electrodes. The tworeceptive fields of a binocularly driven cell areknown to occupy corresponding positions in thetwo retinas, at least to within a degree or so (6).Obviously, any slight departures from correspon-
dence from one cell to the next would be of greatinterest, especially if one found a variation in thehorizontal direction and not in the vertical, for thiswould suggest that some cells were specialized torespond to images of objects in front of or behindsome surface of reference determined by thedegree of convergence of the two eyes. Whether acell's two receptive fields always correspond pre-cisely in position has been hard to judge, becausethe position of the area centralis cannot be accu-rately determined by ophthalmic inspection. More-over, the relative positions of the receptive fields inthe two eyes as one proceeds from cell to cell oftenseem to vary slightly, but it is difficult to evaluatethis apparent variation because of occasional smalleye movements. The problem of eye movementscan be overcome in double recordings by keepingone binocularly driven cell under observation at alltimes and noting any change of position of either ofthe projected receptive fields.
In the experiment of Fig. 3, recordings weremade from area 17 on the two sides. Here thereceptive fields are shown just as they weremapped on the projection screen. With the eyesparalyzed the two visual axes were crossed, and thefields in the right eye were to the left of those in theleft eye. For each pair of cells one then askedwhether the relative positions of the receptive fieldsin the two eyes were the same. In all of the eightsimultaneous recordings the positions matched towithin about 1/2°. Moreover, the directions of thedeviations were more or less random, with no par-ticular tendency for horizontal variation.
It is hard to say whether or not these varia-tions represent departures from true correspon-dence, given the difficulties in comparing the tworeceptive-field positions precisely. For example, ifone eye is strongly dominant the field in theweaker eye generally appears smaller than itscounterpart in the dominant eye, since the moreperipheral parts of a field often exert progressivelyweaker effects on the cell. Thus the possible errorin determining the positions of such large fieldscould be of the order of 1/2°. Judging from humanexperience, a horizontal variation in receptive-fieldcorrespondence of up to about 1—2° would berequired if such a mechanism were to be linked tobinocular depth perception, but in this and otherexperiments one can be reasonably sure that therewere no variations this great, and certainly no pref-

236 PART III NORMAL PHYSIOLOGY AND ANATOMY
Fig. 2. A: fields of cells recorded with two electrodes in the 17-18 transition zone on the two sides, showing over-lap across the midline. Upper sequence: simultaneous recordings made of cells 1 and 2, 2 and 3, 3 and 4. Lowersequence: 9, 10, and 11 recorded simultaneously; then 10, 11 and 12. B (opposite page): same experiment, allfields from the two penetrations shown superimposed. Fields of cells from the right hemisphere are outlined bycontinuous lines; from left hemisphere, by interrupted lines.
(continued)
erential horizontal variations. The possibilityremains that there are regional specializationswithin 17 or 18, with variation in relative field posi-tions in some areas and not in others. This might
partly explain the apparent discrepancy betweenour results and those of Bishop and Pettigrew, andof Pettigrew and Barlow; in a more extensive studyof binocular correspondence of cortical cells in the

Cat Corpus Callosum 237
cat these workers found considerable variation inrelative field positions in the two eyes, both hori-zontal and vertical (unpublished).
Recordings from Corpus CallosumIn three experiments, seven successful penetrationswere made in the corpus callosum, at Horsley-Clarke levels ranging from A2 to A6. Spikes typi-cal of large myelinated fibers (3) were observedimmediately after the electrode entered the corpuscallosum, and with one or two exceptions the dis-charges were easily driven by visual stimulation,suggesting that this part of the callosum is stronglypreoccupied with vision. In each penetration, from2 to 8 fibers were recorded, and in all, 34 responsivefibers were studied. Just as in cortical recordings,diffuse light was without obvious effect, but byexploring with a narrow slit of light (occasionallyan edge or dark line) and constantly varying its ori-entation, responses were soon obtained and thereceptive-field position and orientation estab-lished.
For 15 fibers an attempt was made to find outwhether the field was simple or more complex. Ofthe 34 neurons, 7 had simple fields, with clear sub-
division into excitatory and inhibitory areas; 7 wereclearly complex and 1 was hypercomplex. The restwere not studied long enough for categorization.Fibers with simple fields presumably had their ori-gin in area 17, while those with complex andhypercomplex fields could have originated from17, 18, or 19.
For our present purposes the most interestingcharacteristic of these cells was the distribution oftheir receptive fields. Of 34 fibers, all but 2 or 3 hadfields that came up to within a degree or so of thevertical meridian or overlapped it, and only 1 cell(no. 17, penetration E, Fig. 5) had a field more than4° from the midline. Figures 4 and 5 summarizethe receptive-field positions for the cells of all 7penetrations. About half of the fields were in orvery near the area centralis, and most of the otherswere scattered above and below it along the verti-cal meridian. Some indication of a crude topo-graphic organization may be seen in Fig. 5, the cellsof a given penetration tending to be mostly in thearea centralis (penetration B), or all in the inferiorfields of vision (penetration C and E), or the supe-rior (penetration ^4). It was shown histologicallythat all of these penetrations passed through the
Fig. 2 (continued)

238 PART III NORMAL PHYSIOLOGY AND ANATOMY
Fig. 3. Penetrations were made in the two hemispheres (area 17) at the same time, and a number of simultane-ous recordings made of cells on the two sides. For each recording the object was to compare the relative positionsof the two fields as mapped in one eye with the relative positions of the corresponding fields in the other eye. Fieldsare shown just as they were mapped on the screen, the left member of each pair corresponding to a cell in theright hemisphere, and conversely. The two visual axes were crossed, so that in each section (A-F) the fields in theright eye appear to the left, those from the left eye, to the right.
corpus callosum, as illustrated in Fig. 6 for one ofthe penetrations of Fig. 4 (cells 8—13).
All of the fibers in the corpus callosum werebinocularly driven, but just as in cortical record-ings there was wide variation in the relative influ-ence of the two eyes, from fibers strongly domi-nated by the left eye, through equal influence, tostrong right-eye dominance. As usual, the fields inthe two eyes had otherwise identical characteris-tics, including field position, size, and orientation.
DISCUSSION
From the present results it seems clear that close tothe 17-18 border in the cat cortex there is a bilateralrepresentation of the vertical meridian of the visualfield. Stated in terms of single cells, there are in this17-18 border region cells whose receptive fields are
not confined to the contralateral half of the visualfield, but spill over into the ipsilateral half. Thequestion immediately arises as to the connectionsresponsible for this encroachment on the ipsilateralfield. An indication that callosal connections areinvolved comes from the experiments in whichChoudhury et al. (1) cooled the contralateral cortexor the corpus callosum, or cut the callosum whilerecording from the cortex on the side of the cutoptic tract. Their conclusion receives support fromour observations that the fibers in the posterior cal-losum are largely concerned with the midline.
At first glance the fact that the midline regionof the visual fields is bilaterally represented in thecat cortex might seem to bear on the well-knownbut controversial question of macular sparing fol-lowing total occipital lobe removal in man. Obvi-ously, however, any bilateral representation which

Cat Corpus Callosum 239
Fig. 4. Receptive-field positions of10 cells recorded from thecorpus callosum in 2 penetrations. Histology from the secondelectrode tracl^ (units 8-13) is illustrated in Fig. 6.
depends on projections from visual areas in thecontralateral hemisphere could play no part inmacular sparing attending the removal of thesevisual areas.
One should perhaps point out that the optictract and lateral geniculate probably receive someipsilateral input, and indeed it would be strange ifgeniculate cells with field centers along the verticalmeridian were not just as plentiful as any others.These cells would have to have input from the ipsi-lateral half of the visual field to take care of a partof their field centers and about half of the fieldperipheries. The retrograde-degeneration studiesof Stone (9) indeed indicate that the ganglion cellpopulations projecting to the two optic tracts over-lap along the midline by about 0.9°.
Our results, as well as those of Choudhury etal. (1), fit well with anatomical studies which indi-cate that area 17 on one side projects to contralat-eral 18 and 19 and to the lateral bank of the supra-sylvian gyrus (Clare and Bishop area; 7). We haverecently found from Nauta silver-degenerationstudies that 18 also has rich connections with 18 onthe opposite side, but probably sends little or noth-ing to contralateral 17. These commissural connec-tions by themselves would make one expect someoverlap in receptive field position of cells in the twohemispheres, and indicate that one such regionshould be the part of 18 near the 17-18 border. Thepresent experiments with two electrodes were toofew in number to allow one to say conclusively thatthe region of overlap is entirely in 18. Moreover,the frequent difficulty in being certain of the exactposition of the 17-18 border makes it hard to besure that the most medial strip of 17 is not alsoinvolved. This problem is likely to be less serious inthe monkey, where the 17-18 border is far moreprecise. Taken together, the results of Choudhuryet al. (1), the two experiments described here, andthe anatomical studies (2, 7, 8) all indicate that aspecial set of connections exists for dealing with themidline representation of the visual fields. Thesefibers might be expected to serve the same func-tions as intracortical fibers linking cells with recep-tive fields clustered in other, more outlying parts ofthe visual fields. The kinds of connections requiredcan be reasonably inferred from what is knownabout the single-cell physiology of 17,18, and 19. Acomplex cell in 18 which overlaps the midlinecould, for example, receive input from simple cells,some directly from nearby 17 in the same hemi-

Fig. 5. Receptive-field positions of cells recorded in five penetrations in the corpus callosum. Penetration A isfrom one experiment, B—Efrom a different one. In each diagram the intersection of vertical and horizontal linesindicates the area centralis, to within a degree or so. (Field 8 of penetration D occupied the entire upper rightquadrant.) The anterior-posterior position of the electrode in Horsley-Clarke coordinates is indicated for eachpenetration.
240

Cat Corpus Callosum 241
<i*"
Fig. 6. Coronal section through corpus callosum at Horsley-Clarke level AS, showing microelectrode trac\andterminal lesion (arrow) for the penetration in which cells 8-13 of Fig. 4 were recorded. Cresyl violet stain.
sphere, and some from the opposite hemisphere viathe corpus callosum. For this reason it seems inter-esting that the corpus callosum contains clearexamples of fibers with simple receptive fields,which are not found, as far as is known, in area 18.From the fact that 17 projects to contralateral 19 onthe two sides, one may similarly infer analogousconnections for the elaboration in 19 of hypercom-plex receptive fields which straddle the two half-visual fields.
SUMMARY
By recording single cells simultaneously in oppo-site hemispheres in the cat it was shown that the
receptive fields of some cortical cells near the 17-18boundary overlap the vertical midline of the visualfields. Overlapping was found only in the transi-tional zone between 17 and 18, and the adjacentpart of 18. These areas are known anatomically tobe interconnected, and to receive connections fromthe most lateral part of area 17.
Of 34 single fibers recorded from the poste-rior corpus callosum, all but 1 or 2 could be drivenby visual stimulation, and of these all but 1 hadreceptive fields that overlapped the vertical mid-line or came up to within a degree or less of it.About half of the receptive fields were clusteredaround the area centralis; the rest were scatteredwidely above and below the horizontal meridian.

242 PART III NORMAL PHYSIOLOGY AND ANATOMY
Seven cells had "simple" properties, the othersbeing complex or hypercomplex.
These results suggest that certain fibers in thecorpus callosum link cells whose fields are closetogether but lie on opposite sides of the verticalmeridian or straddle it. These fibers would there-fore seem to serve the same functions as intracorti-cal fibers linking cells with receptive fields clus-tered in more outlying parts of the visual fields.
ACKNOWLEDGMENT
We express our thanks to Jane Chen and Janet Wiitanen fortheir invaluable technical assistance.
ADDENDUM
Since this paper was submitted, Gazzaniga, Berlucchi, and Riz-zolatti have published a preliminary report on single-unitrecordings in cat corpus callosum (Federation Proc. 26: 1864,1967). Their main findings are in agreement with those re-ported here.
References
1. Choudhury, B. P., Whitteridge, D., and Wilson, M. E. Thefunction of the callosal connections of the visual cortex.Quart.}. Exptl. Physiol. 50: 214-219,1965.
2. Ebner, F. F. and Myers, R. E. Distribution of corpus callo-sum and anterior commissure in cat and raccoon. /. Comp.Neural. 124:353-366,1965.
3. Hubel, D. H. Single unit activity in lateral geniculate bodyand optic tract of unrestrained cats./. Physiol., London 150:91-104,1960.
4. Hubel, D. H. and Wiesel, T. N. Receptive fields of singleneurones in the cat's striate cortex./. Physiol., London 148:574-591,1959.
5. Hubel, D. H. and Wiesel, T. N. Integrative action in the cat'slateral geniculate body./. Physiol., London 155:385-398,1961.
6. Hubel, D. H. and Wiesel, T. N. Receptive fields, binocularinteraction and functional architecture in the cat's visualcortex./. Physiol., London 160: 106-154, 1962.
7. Hubel, D. H. and Wiesel, T. N. Receptive fields and func-tional architecture in two nonstriate visual areas (18 and 19)of the cat./. Neurophysiol. 28: 229-289,1965.
8. Policy, E. H. and Dirkes, J. M. The visual cortical (genicu-locortical) area of cat brain and its projections. Anat. Record145:345,1963.
9. Stone, J. The naso-temporal division of the cat's retina. /.Comp. Neural. 126: 585-599, 1966.
10. Talbot, S. A. and Marshall, W. H. Physiological studies onneural mechanisms of visual localization and discrimina-tion. Am./. Ofhthalmol. 24: 1255-1263,1941.
AFTERWORD
The results were as we had expected. When we put two electrodes into oppo-site hemispheres, at or near the 17-18 borders on the two sides, the two recep-tive fields that we mapped often overlapped. In the corpus callosum, thereceptive fields of the crossing fibers were almost always close to the verticalmidline or straddled it. This indicated that, for cells subserving the verticalmidline of the visual fields, the callosum carries out the same functions thatthe connections between neighboring cells carry out, away from the midline.Its purpose is at least partly to deal with the awkward and artificial circum-stance of having a cortical representation that is split along the midline.
We would have liked to know the exact origin and destination of thefibers in the callosum: did they come from, and go to, 17 or 18 (V-l or V-2)?Here we had the problem of the vagueness, in the cat, of this 17-18 borderregion. In primates it is histologically as sharp as a knife, but in cats it is notwell defined, and consequently, over a millimeter or so of its extent, one can-not be sure which of the two areas, 17 or 18, one is looking at, or recordingfrom. This border region is the representation of the vertical midline, and isthe region that the callosum interconnects. Because of the poor definition ofthe border in cats, the question of whether it is 17 or 18 that sends or receivescallosal fibers becomes hard to answer. One even wonders if there is a borderin any well-defined sense. In primates the geniculate projects only to 17, notto 18, so that the border is at the place were the geniculo-cortical projections
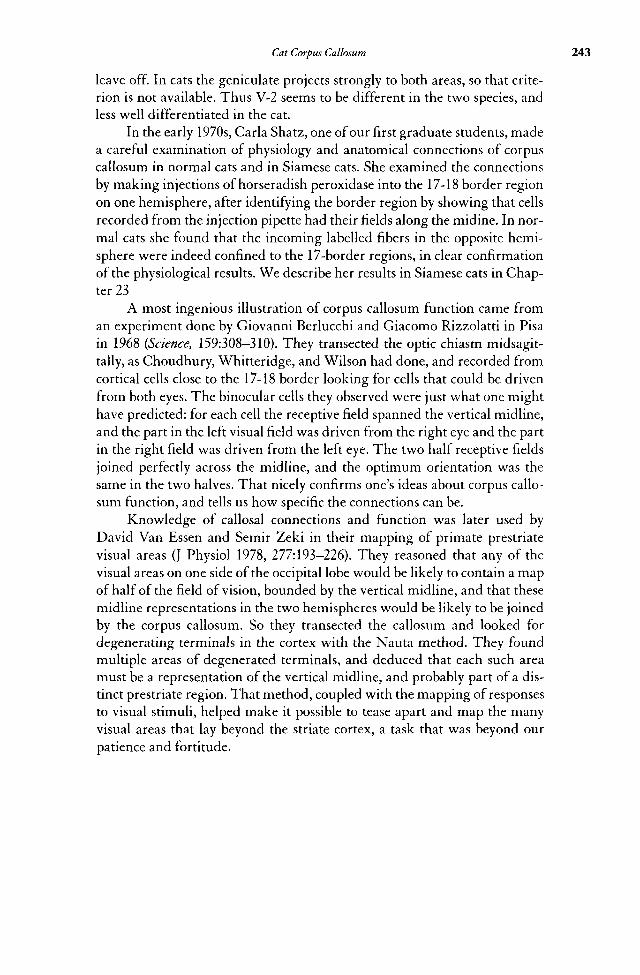
Cat Corpus Callosum 243
leave off. In cats the geniculate projects strongly to both areas, so that crite-rion is not available. Thus V-2 seems to be different in the two species, andless well differentiated in the cat.
In the early 1970s, Carla Shatz, one of our first graduate students, madea careful examination of physiology and anatomical connections of corpuscallosum in normal cats and in Siamese cats. She examined the connectionsby making injections of horseradish peroxidase into the 17-18 border regionon one hemisphere, after identifying the border region by showing that cellsrecorded from the injection pipette had their fields along the midine. In nor-mal cats she found that the incoming labelled fibers in the opposite hemi-sphere were indeed confined to the 17-border regions, in clear confirmationof the physiological results. We describe her results in Siamese cats in Chap-ter 23
A most ingenious illustration of corpus callosum function came froman experiment done by Giovanni Berlucchi and Giacomo Rizzolatti in Pisain 1968 (Science, 159:308—310). They transected the optic chiasm midsagit-tally, as Choudhury, Whitteridge, and Wilson had done, and recorded fromcortical cells close to the 17-18 border looking for cells that could be drivenfrom both eyes. The binocular cells they observed were just what one mighthave predicted: for each cell the receptive field spanned the vertical midline,and the part in the left visual field was driven from the right eye and the partin the right field was driven from the left eye. The two half receptive fieldsjoined perfectly across the midline, and the optimum orientation was thesame in the two halves. That nicely confirms one's ideas about corpus callo-sum function, and tells us how specific the connections can be.
Knowledge of callosal connections and function was later used byDavid Van Essen and Semir Zeki in their mapping of primate prestriatevisual areas (J Physiol 1978, 277:193-226). They reasoned that any of thevisual areas on one side of the occipital lobe would be likely to contain a mapof half of the field of vision, bounded by the vertical midline, and that thesemidline representations in the two hemispheres would be likely to be joinedby the corpus callosum. So they transected the callosum and looked fordegenerating terminals in the cortex with the Nauta method. They foundmultiple areas of degenerated terminals, and deduced that each such areamust be a representation of the vertical midline, and probably part of a dis-tinct prestriate region. That method, coupled with the mapping of responsesto visual stimuli, helped make it possible to tease apart and map the manyvisual areas that lay beyond the striate cortex, a task that was beyond ourpatience and fortitude.

Chapter 14 • Recordings in Monkey StriateCortex, 1968 •
FOREWORD
Between our 1962 cat-area-17 paper and this monkey striate-cortex paper isa lapse of six years. That may seem strange given that we began working inmonkey cortex, in parallel with the cat work, while we were still at JohnsHopkins, in 1959. But the monkey cortex was far more intricate, like a RollsRoyce compared with a Model-T Ford, and the work went more slowly. Weregarded these animals as precious and wanted to begin by covering as muchground as possible in cats.
Another reason for the delay in publishing our results in the monkeystriate cortex was the near-absence of competitors, which made us feel lesspressure to publish small bits of work as we went along. In this complicatedfield we thought that we would have a better chance of getting things rightif we took our time. That luxury hardly exists today, given the competitionfor grants, for publication, and for jobs and promotions. In 1968 we did notfeel that we lacked time for lunch with colleagues or afternoon tea. Over-population in science can have sad consequences, as we see when, in a newfield such as olfaction, one breakthrough leads to the piling in of competitorsfrom all sides, and priority for discoveries can be determined by days orweeks, not years. For us that would have taken away much of the fun. Wewere lucky.
Today it would be far harder to do a project like this one. Monkeys areso much more expensive, and regulations as to their use so much more oner-ous, that recording from one monkey each week and then sectioning thebrain for the anatomy would be almost out of the question. One is forced touse awake-behaving techniques, with the obvious advantage that one mon-key can be recorded from for months or years, and that anesthetics can beavoided. Also a recording session can begin at 10:00 A.M. and end at 3:00 inthe afternoon, allowing one to get home for dinner, in contrast to our acuteexperiments, which typically started at 8:30 A.M. and went on to the nextday, to the dismay of our wives. But awake-behaving methods have the grave
244

Monkey Striate Cortex 245
shortcoming of being far less compatible with the anatomical studies that arenecessary to identify electrode placements.
Our work had come to rely increasingly on combining the neurophys-iology and anatomy. We routinely examined the brains of all the monkeysthat we recorded from to determine the exact location of our recording elec-trodes, using electrolytic lesions to mark each electrode track in severalplaces. To get maximum information from every monkey, in an unrelated setof studies, we would also usually make a geniculate or cortical lesion (forNauta degeneration studies, see below) or tracer injections (of horseradishperoxidase or a radioactive amino acid), five days or so before the recording.The time interval between the injections or lesions and the final recordingallowed the axons from the damaged cells to degenerate or the injected labelto be transported. In alert monkey research there is little hope, when theanimal is finally killed, of recognizing particular electrode tracks among 50or more others, or of recovering lesions months after they are made. Acuteexperiments such as the ones we did every week have become much lesscommon, and progress in working out functional architecture of the differ-ent cortical areas has consequently been slow or nonexistent.
Magnetic resonance imaging techniques (MRI) may allow us to over-come some of these problems. Richard Born has shown in rats that electrodetip positions marked by depositing iron from stainless steel electrodes can berecovered after many months, and the iron deposits show up beautifully inthe images. It seems almost certain that such a method will be used exten-sively in monkeys. MRI has a resolution that is far from what one gets withconventional histology, so identifying recording sites in terms of cortical lay-ers or blobs may still be out of reach.
To someone reading this paper today, the nomenclature we used forlabelling the cortical layers will surely be a source of confusion. Any logicalsystem of labelling layers must rely at least partly on knowing the sites of ter-mination of the inputs to the cortex and the destinations of fibers leaving thedifferent layers. In 1968 we knew neither. We adopted a compromisebetween the various nomenclatures that had been based on the cytoarchitec-tonics of Brodmann, von Bonin, and Lorente de No. In subsequent paperswe used a slightly different terminology, because we finally learned muchmore about where the fibers coming in from the different geniculate layersterminated in the cortex. What made this possible was the use of our tung-sten electrodes to make lesions (as already mentioned), in geniculate layersthat we identified by recording, coupled with Nauta staining of the fibersthat degenerated as a result of the lesions (1972). Later we came more andmore to inject radioactive tracers, whose transport we could follow withautoradiography. Finally we made increasing use of stains for cytochromeoxidase, which gave a much sharper definition of layer 4, and incidentally theblobs in area 17. (All this will be described in subsequent papers in this book.)The Golgi studies of Jennifer Lund have made for a more logical modernterminology for numbering and lettering these layers, on which most neuro-biologists have come to agree.

246 PART III NORMAL PHYSIOLOGY AND ANATOMY
The following paragraph compares the terminology used in our 1968paper with today's terminology, and is meant to help anyone particularlyinterested in the history of the subject, or the details. For everyone else thetable that follows will sum things up. The main thing to realize is that layerterminologies differ from author to author and from one time to the next.
In present-day terminology (and do skip this paragraph unless you arevery zealous) we call layer 4A the upper tier of parvocellular geniculate ter-minations. This is roughly the deepest part of what in the present (1968)paper we call layer III. What is now called 4C-alpha is the site of terminationof magnocellular inputs and what we call 4C-beta is the termination of thebulk of the parvocellular inputs. Together these comprise what in 1968 wecalled layer 4B. What we then called 4A is more or less congruent with theclassical line of Gennari, which was formerly thought to be the site of genic-ulate terminals, but was found in our Nauta studies to be free of them. Wewill have more to say about the physiology of the layers in the afterword tothis paper, and when we come to the papers on geniculo-cortical connections.
Comparison of layer designations in the 1968 paper with more modern terminology.
Today 1968 Paper Nissl Connections (partial list)
12,34A4B (Gennari)4C alpha & beta56
12,3 minus deepest partdeepest part of 2,34A4B56
sparsedensedensesparsedensesparsedense
from 4C betafrom parvo geniefrom 4C alpha & betafrom mgno & par genie
from Igb and upper layersof 17, to m & p genie
Receptive Fields and Functional Architecture of MonkeyStriate Cortex
D. H. HUBEL AND T. N. WIESEL • Department of Physiology, Harvard Medical School, Boston, Mass., U.S.A.
SUMMARY stimulating the retinas with spots or patterns or
1. The striate cortex was studied in lightly anaes- light. Most cells can be categorized as simple,thetized macaque and spider monkeys by complex, or hypercomplex, with response prop-recording extracellularly from single units and erties very similar to those previously described
From/. Physiol. (1968), 195,215-243
Received 6 October 1967.

Monkey Striate Cortex 247
in the cat. On the average, however, receptivefields are smaller, and there is a greater sensitiv-ity to changes in stimulus orientation. A smallproportion of the cells are colour coded.
2. Evidence is presented for at least two indepen-dent systems of columns extending verticallyfrom surface to white matter. Columns of thefirst type contain cells with common receptive-field orientations. They are similar to the orien-tation columns described in the cat, but areprobably smaller in cross-sectional area. In thesecond system cells are aggregated into columnsaccording to eye preference. The ocular domi-nance columns are larger than the orientationcolumns, and the two sets of boundaries seem tobe independent.
3. There is a tendency for cells to be groupedaccording to symmetry of responses to move-ment; in some regions the cells respond equallywell to the two opposite directions of movementof a line, but other regions contain a mixture ofcells favouring one direction and cells favouringthe other.
4. A horizontal organization corresponding to thecortical layering can also be discerned. Theupper layers (II and the upper two-thirds of III)contain complex and hypercomplex cells, butsimple cells are virtually absent. The cells aremostly binocularly driven. Simple cells arefound deep in layer III, and in IV A and IV B.In layer IV B they form a large proportion of thepopulation, whereas complex cells are rare. Inlayers IV A and IV B one finds units lackingorientation specificity; it is not clear whetherthese are cell bodies or axons of geniculate cells.In layer IV most cells are driven by one eye only;this layer consists of a mosaic with cells of someregions responding to one eye only, those ofother regions responding to the other eye. Lay-ers V and VI contain mostly complex andhypercomplex cells, binocularly driven.
5. The cortex is seen as a system organized verti-cally and horizontally in entirely different ways.In the vertical system (in which cells lying alonga vertical line in the cortex have commonfeatures) stimulus dimensions such as retinalposition, line orientation, ocular dominance,and perhaps directionality of movement, aremapped in sets of superimposed but indepen-dent mosaics. The horizontal system segregatescells in layers by hierarchical orders, the lowest
orders (simple cells monocularly driven) locatedin and near layer IV, the higher orders in theupper and lower layers.
INTRODUCTION
Over the past ten years we have studied thesequential processing of visual information in thecat by examining the responses of single cells atvarious points along the visual pathway. In extend-ing this work it seemed natural to turn to the mon-key, an animal that comes close to man in its visualcapabilities, especially its high acuity and welldeveloped colour vision. In contrast with the cat,moreover, most primates have a visual pathwaythat is further differentiated, with a rod-free fovea,a six-layered geniculate, and a striate cortex thatlends itself well to studies of functional architec-ture, being conspicuously laminated and welldemarcated from neighbouring cortical areas.In this paper we present the results of a series ofrecordings from the monkey striate cortex. Thestudy may be regarded as a continuation of previ-ous work on the monkey optic nerve (Hubel &Wiesel, 1960) and lateral geniculate body (Wiesel &Hubel, 1966). The early experiments were done inthe cortex of the spider monkey (Ateles), but therhesus (Macaca mulatto} was used in all of the morerecent work.
METHODS
Six spider monkeys and sixteen macaques were used.Details of stimulating and recording procedures havebeen published elsewhere (Hubel & Wiesel, 1962; Wiesel& Hubel, 1966). Animals, 2—3 kg in weight, were anaes-thetized with thiopental sodium, and light anaesthesiawas maintained throughout the experiment. Since intra-venous succinylcholine alone was often insufficient toprevent all eye movements, gallamine triethiodide (2—3mg/kg) was also usually given intramuscularly at half-hour intervals.
When only one or two penetrations were planned ina single animal, a small hole was drilled in the skull, thedura incised keeping the arachnoid intact, and the elec-trode introduced through a hollow 19-gauge stainless-steel needle, which was cemented into the hole to makea closed chamber. In a few experiments designed toexplore a wider area of cortex a modified Davies cham-ber was cemented to the skull (Hubel & Wiesel, 1963).Microelectrodes were sharpened tungsten wire insulatedwith a clear vinyl lacquer (Hubel, 1957).

248 PART III NORMAL PHYSIOLOGY AND ANATOMY
To help reconstruct the electrode tracks, one or sev-eral lesions were made in each penetration by passingdirect current through the electrode (Hubel, 1959). Inthe monkey cortex 2|J,A for 2 sec (electrode negative) wasusually sufficient. All brains were fixed in formalin, pho-tographed, embedded in celloidin, sectioned serially at20 [i, and stained for Nissl substance with cresyl violet.
RESULTS
Part I. Receptive Field Types
This study is based upon recordings of 150 cells inseven penetrations in six spider monkeys, and 272cells in twenty-five penetrations in sixteenmacaque monkeys. Most of the penetrations weremade in cortical regions subserving the 0—4°parafoveal region; a few passed through buriedcortical folds subserving the mid or far periphery,and in two laterally placed penetrations the fieldswere in the fovea. The approximate recording sitesin the sixteen rhesus experiments are shown for arepresentative brain in Text-fig. 1.
Fig. 1. Recording sites for the sixteen rhesus experiments.Diagram of monkey brain viewed from above; anterior is up.Many of the dots represent several closely spaced penetrationsin a single monkey. Several deep penetrations went intoburied folds of stnate and non-striate cortex.
We begin by describing the various types ofreceptive fields that can be distinguished in themonkey striate cortex, emphasizing especially anydifferences between monkey and cat. Implicit inthese descriptions is the possibly over-simplifiedconcept of a hierarchical system dependent onanatomical wiring, in which geniculate cells withconcentric fields converge on simple cortical cells,simple cells in turn converge upon complex cells,and complex on hypercomplex. The evidence forsuch connexions (Hubel & Wiesel, 1962, 1965<z) isderived from the properties of the fields them-selves, and also from the functional architecture ofthe cortex.
SIMPLE CELLS. As in the cat, these cells are definedas having receptive fields with spatially distinct 'on'and 'off areas separated by parallel straight lines(Hubel & Wiesel, 1959). Twenty-five of the 272 cellsstudied in rhesus were definitely established assimple, and a similar proportion was seen in thespider monkey. This small number almost cer-tainly does not reflect the actual proportion of sim-ple cells in striate cortex, since judging from spikesize and difficulties in isolation these cells aremostly small. Moreover, some penetrations stoppedshort of the layers where simple cells are most pop-ulous. In a typical penetration through the full cor-tical thickness, when the electrode was fine enoughto isolate cells easily, three or four out of thirty or socells could be expected to be simple. An example ofsuch a penetration is described in detail in the nextsection.
Even in this small sampling, we found repre-sentatives of all of the 'simple' receptive field sub-types described in the cat (Hubel & Wiesel, 1962,Fig. 2). The commonest simple fields were thosewith long narrow 'on'-centres sandwiched be-tween two more extensive 'off regions, and thosewith an 'on' and an 'off region lying side by side,but a few examples of each of the other types werealso seen. Knowing the exact configuration of afield made it possible to predict the optimum stim-ulus: its size, shape, orientation, and position on theretina. As described below, and in contrast withwhat we found in the cat, most simple cells weredriven by one eye only. Six of the twenty-five cellsshowed opponent-colour properties, suggestingthat the proportion of colour coded cells may behigher in simple cells than in complex.

Monkey Striate Cortex 249
Fig. 2. Responses of a complex cell in
right striate cortex (layer IV A) tovarious orientations of a moving
blacky bar. Receptive field in the lefteye indicated by the interrupted rec-
tangles; it was approximately % X 3/fin size, and was situated 4° below and
to the left of the point of fixation.
Ocular-dominance group 4. Dura-tion of each record, 2 sec. Bac!(-ground intensity 1-3 log!0 cd/m2,dark, bars O'O Ing cd/m2.
COMPLEX CELLS. Complex cells are the commonestof all types, making up 177 of the 272 cells in the rhe-sus. The properties of these cells were similar tothose we have described for the cat (Hubel &Wiesel, 1962). By definition, there was no separa-tion of receptive fields into excitatory and inhibitoryparts. As for simple cells, a line stimulus (slit, darkbar, or edge) in a particular orientation evoked opti-mum responses, and as the orientation was variedthe responses fell off, usually failing long before anangle 90° to the optimum was reached. Prolongingthe line in either direction did not reduce theresponse. But whereas for the simple cell the posi-tion of the stimulus was crucial, in the complex aresponse was evoked on shining the correctly ori-ented line on any part of the field, or by moving theline over the field. As in the cat, about half of thecells showed highly asymmetrical responses to dia-metrically opposite directions of movement, whilethe rest showed little or no directional preference.Even when responses were highly asymmetrical,the less effective direction of movement usuallyevoked some minimal response (see Text-fig. 2), but
there were a few examples in which the maintainedactivity was actually suppressed.
I ndividual complex cells differed markedly intheir relative responsiveness to slits, edges, or darkbars. The majority responded very much better toone than to the other two, but some reacted brisklyto two of them, and a few to all three. For a cell thatwas sensitive to slits, but not to edges, the responsesincreased as slit width was increased up to someoptimal value, and then they fell off sharply; theoptimum width was always a small fraction of thewidth of the whole field. For complex cells thatresponded best to edges, some reacted to one con-figuration and also to its mirror image, while oth-ers responded only to one edge configuration. Inthe first type a broad slit or dark bar usually gavemore vigorous responses than an edge, as though itcombined the advantages of the two types of edge.On narrowing the stimulus down to a width thatmight be close to the optimum for the usual slit ordark-bar complex cell, the response usually failed.Presumably the two types of cells are connected tosimple cells in entirely different ways.

250 PART III NORMAL PHYSIOLOGY AND ANATOMY
A complex cell that responded best to a mov-ing dark bar is illustrated in Text-fig. 2. Here theoptimally oriented stimulus (Text-fig. 2 D) gavevery different responses to the two different direc-tions of movement, with a minimal, inconstant dis-charge to movement down and to the left. The rateof decline of this cell's responses as the stimulus ori-entation deviated from the optimum was fairlytypical; while the decline varied to some extentfrom cell to cell (see below), it was generally steeperin the monkey than in the cat. Most field orienta-tions could be specified to within 5-10°, as com-pared to 10—15° in the cat.
HYPERCOMPLEX CELLS. Fifty-three of the 272 cellsrecorded from the rhesus were lower-order hyper-complex. For these, extending the line (slit, edge ordark bar) beyond the activating part of the recep-tive field in one or both directions caused a markedfall-off in the response, and there was usually noresponse at all if the line was made long enough.The proportion of hypercomplex cells occurringhere may well be higher than our figures suggest,since in the early monkey experiments we did notknow that such cells existed and did not systemati-cally vary the lengths of the stimuli. We haverecently found hypercomplex cells in the cat striatecortex, but they seem to be less common than in themonkey.
Responses of a typical hypercomplex cell areshown in Text-fig. 3. The more or less square cen-tral activating region, indicated by interruptedlines, was flanked by a weak antagonistic regionabove and by a stronger one below, so that to evokea consistent response a line (edge or bar) had to beterminated within the rectangle or at its borders(Text-fig. 3>A—D). When it extended beyond them,as in Text-fig. 3 E— G, the response was reduced orobliterated. Another example is shown in Text-fig.4; here the most powerful stimulus was anobliquely oriented slit moving in either directionacross the region marked by broken lines. Length-ening the stimulus in both directions again greatlyreduced the response, though this time the sup-pression was not complete.
No higher-order hypercomplex cells wereseen in monkey striate cortex (Hubel & Wiesel,19650).
SIZES OF RECEPTIVE FIELDS. For comparable re-gions of the visual field, simple receptive fields in
the monkey were on the average much smallerthan in the cat. At 1—4° from the centre of gaze, forexample, fields ranged from % X 1A° up to % X %°,as against about V2 X
l/2° up to about 4 x 4 ° for thecat. Complex and hypercomplex fields in the mon-key were likewise smaller than in the cat, perhapsabout one quarter the size in linear dimensions.They tended to be somewhat larger than simplefields, perhaps 11A to 2 times as big, in linear dimen-sions.
In the two experiments made in the regionrepresenting the fovea one or two simple fieldswere less than % X %°, but their exact boundarieswere not determined. Surprisingly, the range ofsizes of complex and hypercomplex fields was notvery different from that seen a few degrees furtherout. As we have discussed elsewhere (Hubel &Wiesel, 1962), acuity is probably not closely relatedto over-all receptive field dimensions, but rather tothe widths of optimally shaped stimuli.
UNITS LACKING ORIENTATION SPECIFICITY. In layerIV we usually recorded monocularly driven unitswhose receptive fields were similar to those ofgeniculate cells. The spikes of these units weresmall and negative, being quite different from thetypical spikes of myelinated fibres seen in optictract and radiations, and corpus callosum (Hubel,1959; Hubel & Wiesel, 1967). The field propertiesand localization of these IVth layer units makesone suspect that they are axons or axon-terminalsof geniculate cells, but they could be cortical cells,and it will probably be necessary to stimulate elec-trically the subcortical optic radiations to settle thequestion. Some units with concentric receptivefields had more complex responses to colouredstimuli than anything we saw in the lateral genicu-late; these are discussed below.
CELLS WITH SPECIFIC COLOUR RESPONSES. In therhesus lateral geniculate body the majority of thedorsal-layer cells have opponent-colour properties,light exciting them at some wave-lengths, inhibit-ing them at others, diffuse white light evoking lit-tle or no response (De Valois, Jacobs & Jones, 1963;Wiesel & Hubel, 1966). For cortical cells, weexpected that with this input there might be a sim-ilar emphasis on wave-length discrimination.Motokawa, Taira & Okuda (1962) have in factdescribed opponent colour cells in monkey cortex.It was surprising to us, however, that the great

Monkey Striate Cortex 251
Fig. 3. Responses of a hypercomplexcell from layer III of monkey striatecortex. (This was cell 9 in Text-figs. 7
and 8). 'Activating portion of recep-
tive field (% X 3/g) is outlined by
interrupted lines. Stimulus of thisregion by a moving edge activates cell(A—D). Below this region, and tosome extent above it, are regionsappropriate stimulation of which
suppresses the response to an edge(E—G). Duration of each record 5 sec.Stimulus intensities as in Text-fig. 2.
majority of cells could discriminate precisely theorientation or direction of movement of a stimulus,but had no marked selectivity regarding wave-length. There were interesting and striking excep-tions to this, which are described below, but on thewhole the colour responses seen in area 17 havebeen disappointing: for a high proportion of cellsthe response to a given stimulus shape was qualita-tively the same—firing being increased or firingbeing suppressed—regardless of wave-length, andthe optimum stimulus shape was independent of
wave-length. Even in the two penetrations in theregion representing fovea most cells seemed to berelatively unconcerned with colour, though herethe proportion of cells with colour specificresponses seemed higher than it was 2—4° from thefovea.
Of the twenty-five simple cells recorded inrhesus, six had more specific colour-coded behav-iour, the excitatory and inhibitory parts of thereceptive field differing in spectral sensitivity in themanner of geniculate Type I cells (Wiesel & Hubel,
Fig. 4. Hypercomplex cell recordedfrom right striate cortex, layer II. A:
stimulus of left eye by moving slitwithin activating region (%X %°); B:
similar stimulation with slit extend-ing beyond activating region. Eac\-ground, log 0.0 cd/m2; stimulus, log
1.3 cd/m2. Duration of each record
10 sec.

252 PART III NORMAL PHYSIOLOGY AND ANATOMY
Fig. 5. Complex cell with colour coded properties recorded inlayer II ofstriate cortex. Responses to movement of optimallyoriented slits of white light and monochromatic light at var-ious wave-lengths. Monochromatic light made by interpos-ing interference filters in a beam of white light: stimulusenergies are greatest for A, and progressively less for E, D, Cand B. None of the responses was improved by lowering theintensity. Size of receptive field 'A X '/?. Ocular dominancegroup 1. Background and white stimulus intensities as inText-fig. 4. Time for each record 5 sec.
1966). All six fields were similar in organization,with a long narrow excitatory region with highestsensitivity to long wave-lengths, flanked on eitherside by more extensive inhibitory regions with rel-atively greater blue-green sensitivity. These cellsbehaved as though they received input from a set ofType I red on-centre, green off- surround genicu-late cells, the commonest variety found in the dor-sal geniculate layers. Certain features of two of thecells were not so easily explained, however: oneresponded well to a properly positioned red slit butnot at all well to a white slit; another failed torespond to diffuse white light, as expected, but also
Fig. 6. Same cell as Text-fig. 5. Responses to two orthogonalstimulus orientations at 480 mfl.
responded poorly to diffuse red. Obviously it willbe necessary to sample many more cells of this type,and to study them more thoroughly.
COMPLEX AND HYPERCOMPLEX CELLS WITH COLOURSELECTIVITY. Of the 177 complex cells examined inrhesus, only twelve (about 7%) were identified ashaving clear colour specificity. Not all cells werestudied with monochromatic stimuli, but enoughwere to be reasonably sure that colour coded cellsare a small minority, probably not more than 10%for regions 2-4° from the fovea. Four cells gaveresponses to coloured stimuli that were qualita-tively similar to their responses to white stimuli,but only over an unusually restricted band of wave-lengths. A cell might respond actively in the blue-violet (or the red), but not to light at the other endof the spectrum.
Six cells showed still more specific reactions tocoloured stimuli. They responded actively to aproperly oriented slit at some wave-lengths but notothers, and gave little or no response to a similarlyoriented white slit at any intensity. An example isillustrated in Text-figs. 5 and 6. This cell had typi-cal complex properties, favouring up-and-leftmovement of a 1 o'clock oriented slit and showingno response to a slit oriented at right angles to this.The only stimuli that evoked brisk responses wereblue ones, and it was striking that white slits pro-duced by removing the interference filter from thelight path were completely ineffective. The otherfive cells behaved in a similar way, but favouredlong wave-lengths.
Three cells, finally, had opponent-colourproperties like the ones just mentioned, favouringmonochromatic slits over white, but also hadhypercomplex characteristics, in that a long slit wasdistinctly less effective than one of limited length.
CELLS WITH CONCENTRIC FIELDS AND DUAL-OPPO-NENT SYSTEMS. Under this heading we group avery few cells with centre-surround receptive-fieldorganization, but with more complex behaviourthan anything we have seen in the geniculate. Thefields appeared to be organized in centre-surroundfashion. With centre-size spots the cells wereexcited by long wave-lengths and inhibited byshort, with little response to white light. On theother hand a large spot was almost completely inef-fective regardless of wave-length, suggesting thatthe surround was red-off green-on, i.e. the reverse

Monkey Striate Cortex 253
of the centre. It was as if two Type III (non oppo-nent-colour) geniculate fields, an on-centre withmaximum sensitivity in the red, and an off-centrewith maximum sensitivity in the blue-green, hadbeen superimposed. Since these cells were influ-enced from one eye only it is possible that they wereaxons of geniculate cells. We saw nothing thiscomplicated in the rhesus geniculate, but our sam-pling there was small enough so that a relativelyrare type could easily have been missed. Ganglioncells with somewhat similar fields have beendescribed recently by Daw (1967) in the retina ofthe goldfish. In the units described above, however,the situation seems somewhat simpler, there beinga single boundary between centre and surroundinstead of a separate boundary for each of the twoopponent systems, as was found in the goldfish.
In summary, cells with interesting colourproperties occur in the cortex but are in the minor-ity, and, as in the geniculate, seem very diverse intype, with fields ranging in their spatial character-istics from non-oriented to hypercomplex. Thissurvey is intended only to suggest the diversity; asatisfactory study will probably mean recordingfrom thousands, rather than hundreds of corticalcells.
Part II. Functional Architecture
A Representive Penetration ThroughStriate Cortex (Area 17)As shown in Fig. 1, most of the penetrationsthrough area 17 were made from the smoothexposed part of the occipital lobe a few millimetresbehind the lunate sulcus, i.e. just behind the 17-18border, which runs parallel to and just behind thesulcus. In all rhesus experiments the brain was sec-tioned in the parasagittal plane, which has theadvantage of intersecting the lunate sulcus and the17-18 boundary at right angles. The convention ofnumbering the layers (PI. 1) combines that of vonBonin (1942) for layers I-IV, and that of Lorente deNo (1943) and Brodmann (1909) for V and VI. Inthis system each layer can be identified easily in aNissl preparation, except for the poorly definedII—III boundary, which we place arbitrarilybetween the upper !/3 and the lower % of the cell-rich layer making up II and III. The pale layerbeneath III is termed IV A, and the alternatingcell-rich, pale, and cell-rich layers are termed IV B,V, and VI.
In the penetration to be described, three smalllesions 50—70 jl in diameter were made at roughly!/z mm intervals, to help estimate shrinkage duringfixation and embedding, and to increase the accu-racy of estimating positions of the cells encoun-tered (Text-fig. 7; PI. 1). Except for cells taggedspecifically by lesions, or cells very close to lesions,estimations made by this method are neverthelessonly approximate. Sometimes, for example, theposition of a superficial lesion corresponded poorlywith depths calculated from two or more deeperlesions, possibly because of uneven shrinkage, orpossibly due to dimpling of the cortex in the firstpart of some penetrations. The security with whichone can assign a cell to a particular layer thus varieswidely from cell to cell even in the same penetra-tion, and statistics are difficult to compile. Specificquestions can, nevertheless, often be answeredwith some certainty by placing lesions near cells ofa particular type in penetration after penetration(see Text-Figs. 11 and 12 below). The penetrationof Text-figs. 7 and 8 was exploratory, and lesionswere not placed according to any particular plan.
In Text-figs. 7 and 8 the first nine cells weresituated in layers II and III, lesion 1 marking theposition of unit 9. Six of the nine cells were com-plex and, as in the cat, some showed highly asym-metrical responses to diametrically opposite direc-tions of movement (cells 1 and 2), while the othersshowed no such directional preference. Cell 9 ofthis penetration was lower-order hypercomplex,and has already been illustrated in Text-fig. 3.
In layer IV A four complex cells wererecorded, 10 and 11 responding best to dark bars,12 and 13 to slits.
In IV B the fields of four successively recordedcells were simple in type. The second of these (unit15) was marked by lesion 2. In three of the simplecells (14, 16, and 17) the long narrow excitatoryregion was most sensitive to light of long wave-lengths, with hardly any responses in the green andblue, whereas the inhibitory flanks were most sensi-tive in the greens and blues with little response to red.It was as if these cells had received input only from agroup of red on-centre green off-surround genicu-late cells. In contrast to these opponent-colour cells,unit 15, whose field was similar geometrically,seemed identical to the usual simple cell in cat cortex,with no hint of opponent colour properties.
The remaining cells in this penetration werecomplex. The only one with remarkable colour
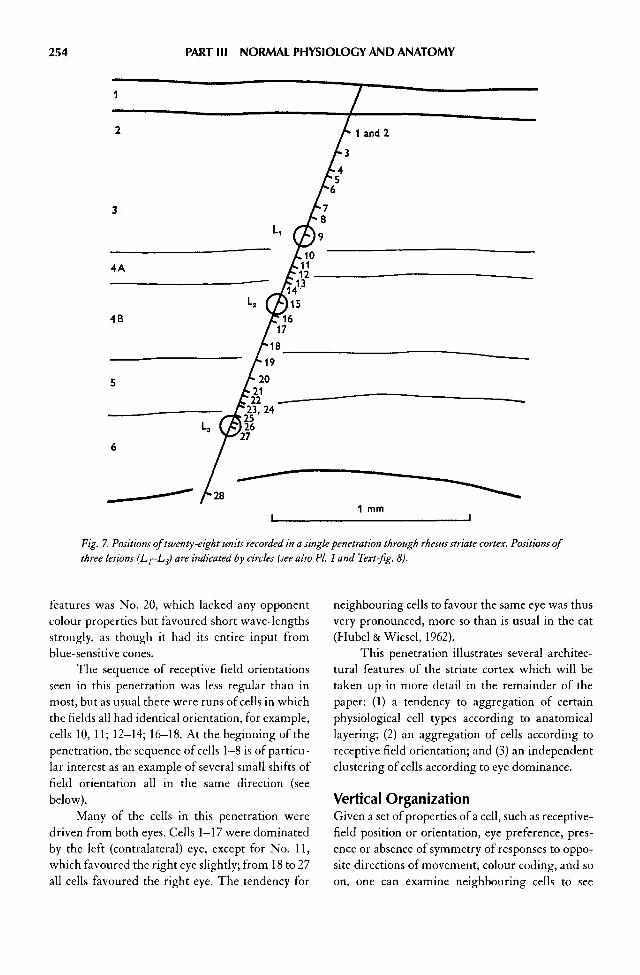
254 PART III NORMAL PHYSIOLOGY AND ANATOMY
Fig. 7. Positions of twenty-eight units recorded in a single penetration through rhesus striate cortex. Positions ofthree lesions (Lj-L3) are indicated by circles (see also PL 1 and Text-fig. 8).
features was No. 20, which lacked any opponentcolour properties but favoured short wave-lengthsstrongly, as though it had its entire input fromblue-sensitive cones.
The sequence of receptive field orientationsseen in this penetration was less regular than inmost, but as usual there were runs of cells in whichthe fields all had identical orientation, for example,cells 10, 11; 12-14; 16-18. At the beginning of thepenetration, the sequence of cells 1—8 is of particu-lar interest as an example of several small shifts offield orientation all in the same direction (seebelow).
Many of the cells in this penetration weredriven from both eyes. Cells 1—17 were dominatedby the left (contralateral) eye, except for No. 11,which favoured the right eye slightly; from 18 to 27all cells favoured the right eye. The tendency for
neighbouring cells to favour the same eye was thusvery pronounced, more so than is usual in the cat(Hubel & Wiesel, 1962).
This penetration illustrates several architec-tural features of the striate cortex which will betaken up in more detail in the remainder of thepaper: (1) a tendency to aggregation of certainphysiological cell types according to anatomicallayering; (2) an aggregation of cells according toreceptive field orientation; and (3) an independentclustering of cells according to eye dominance.
Vertical OrganizationGiven a set of properties of a cell, such as receptive-field position or orientation, eye preference, pres-ence or absence of symmetry of responses to oppo-site directions of movement, colour coding, and soon, one can examine neighbouring cells to see
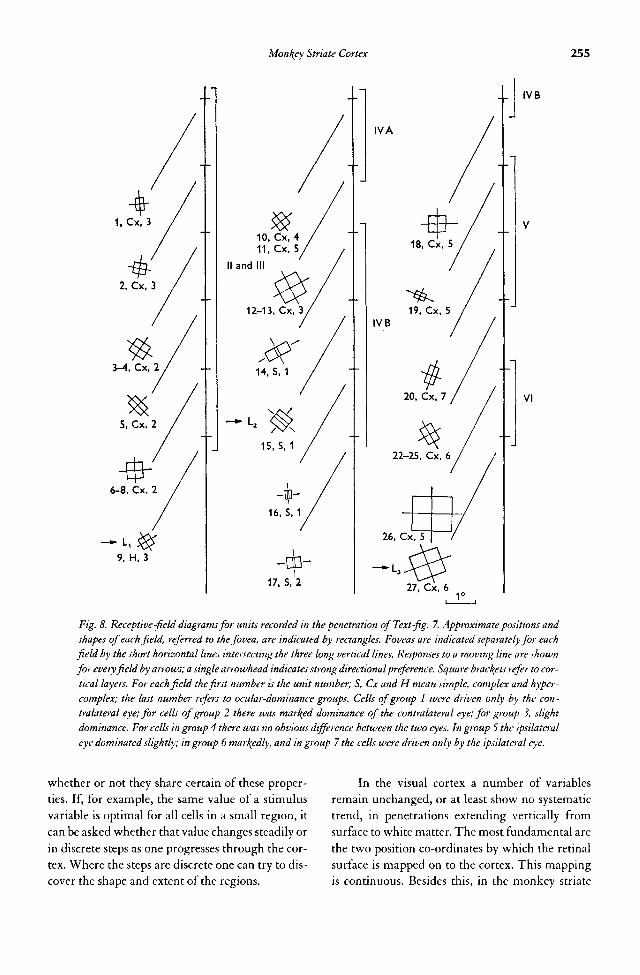
Monkey Striate Cortex 255
Fig. 8. Receptive-field diagrams for units recorded in the penetration of Text-fig. 7. Approximate positions andshapes of each field, referred to thefovea, are indicated by rectangles. Foveas are indicated separately for eachfield by the short horizontal lines intersecting the three long vertical lines. Responses to a moving line are shownfor every field by arrows; a single arrowhead indicates strong directional preference. Square brackets refer to cor-tical layers. For each field the first number is the unit number; S, Cx and H mean simple, complex and hyper-complex; the last number refers to ocular-dominance groups. Cells of group 1 were driven only by the con-tralateral eye; for cells of group 2 there was marked dominance of the contralateral eye; for group 3, slightdominance. For cells in group 4 there was no obvious difference between the two eyes. In group 5 the ipsilateraleye dominated slightly; in group 6 markedly, and in group 7 the cells were driven only by the ipsilateral eye.
whether or not they share certain of these proper-
ties. If, for example, the same value of a stimulus
variable is optimal for all cells in a small region, it
can be asked whether that value changes steadily or
in discrete steps as one progresses through the cor-
tex. Where the steps are discrete one can try to dis-
cover the shape and extent of the regions.
In the visual cortex a number of variables
remain unchanged, or at least show no systematic
trend, in penetrations extending vertically from
surface to white matter. The most fundamental are
the two position co-ordinates by which the retinal
surface is mapped on to the cortex. This mapping
is continuous. Besides this, in the monkey striate

256 PART III NORMAL PHYSIOLOGY AND ANATOMY
cortex, as in that of the cat, each small area dealingwith a particular part of the retina is subdivided bysets of vertical partitions into several independentsystems of discrete cell aggregations. One of thesesystems is defined by receptive-field orientation,another by ocular dominance. It seems very likelythat these aggregations are columnar, with wallsparallel to the vertically running fibre bundles andperpendicular to the layering pattern. The evi-dence for this is chiefly that sequences of cells withcommon physiological characteristics tend to belong in penetrations that are perpendicular oralmost perpendicular to the cortical surface, andshort in oblique penetrations. In the cat the mostdirect evidence that aggregations were columnarin shape came from multiple closely spaced paral-lel penetrations in which a lesion was made at eachchange of receptive field orientation (Hubel &Wiesel, 1963). This type of experiment was notdone in the monkey, but we have no reason tothink that the results would be different.
RETINOTOPIC REPRESENTATION. Neighbouring cellsin area 17 invariably have receptive fields in roughlythe same part of the retina, and movement along thecortex corresponds to movement along the retinaaccording to the well known retinotopic represen-tation. We have not tried to make a detailed topo-graphic mapping, but in a limited exploration of thedorsal convexity and ten or so additional penetra-tions through the buried calcarine fissure, ourresults agree well with Talbot & Marshall's earlysurvey of the convexity (1941), and the subsequentextensive mapping by Daniel & Whitteridge (1961).This detailed topographic representation does nothold at a microscopic level. As in the cat (Hubel &Wiesel, 1962), the fields of successively recordedcells in a perpendicular track are not preciselysuperimposed: instead there is an irregular varia-tion in field position from cell to cell, small enoughso that the fields overlap, and large enough so that,in a perpendicular penetration with fifteen ortwenty fields superimposed, the area covered isabout 2—4 times that of the average receptive field.In a long oblique penetration one finds some drift infield position corresponding to the gross topogra-phy, but when the component of movement alongthe surface is only a millimetre or so, for the part ofthe cortex subserving regions of retina within about5° of the fovea, the drift is considerably less than the
random staggering, and is obscured by it. In theperipheral retina the topographic representationbecomes coarser, but to compensate for this thereceptive fields become larger, and the situation istherefore similar.
This topographic representation does not byitself constitute a columnar system even though theretinal position co-ordinates remain virtually con-stant in a penetration perpendicular to the corticalsurface. The term 'column' as first used by Mount-castle (1957) and as it is used here, refers to a dis-crete aggregation of cells, each aggregation beingseparated from its neighbours by vertical walls thatintersect the surface (or a given layer) in a mosaic.In the retinotopic projection the representation iscontinuous; there are no sudden jumps as the sur-face is traversed. It is upon this continuous topo-graphic map that the column-systems describedbelow are engrafted.
RECEPTIVE-FIELD ORIENTATION. Sequences of cellswith identical receptive-field orientations can beseen in Text-figs. 8, 10, 11, and 12. The sequencestended to be shorter than in the cat, and penetra-tions in which the same orientation was main-tained from surface to white matter were some-what less common, occurring only when the trackwas normal to the cortical surface or almost so. Anexample can be seen in Fig. 12, penetration 1. Someidea of the cross-sectional size of a column can beobtained by projecting the distance spanned by asingle sequence on to the cortical surface. Thisprojected distance was seldom more than aboutl/4 mm, and most sequences were considerablyshorter, an average being more like 0.1—0.2 mm(see Text-fig. 10).
ORDERED ORIENTATION COLUMNS. In several ex-periments in the cat certain regions of the striatecortex seemed to be highly organized, withchanges in orientation from column to column tak-ing place in small regular progressive steps, all inthe same direction, either clockwise or counter-clockwise. Hints of such organization were seen inmany penetrations in the monkey, but thesequences tended to be short. For example, in thefirst six cells of Text-fig. 7, five orientations are rep-resented, each shifted about 20° clockwise com-pared with the previous. Following such asequence there was often a shift of orientation in

Monkey Striate Cortex 257
Fig. 9. Reconstruction of a penetration through striate cortex about 1 mm from 17-18 border, near occipital poleof spider monkey. To the left of the figure the lines indicate orientations of columns traversed; each line repre-sents one or several units recorded against a rich unresolved background activity. Arrows indicate reversal ofdirections of shifts in orientation. Histological section through first part of this penetration is shown in PI. 2.
the reverse direction, perhaps followed by aresumption of the sequence for a few more stepsand then another similar interruption. Large shifts,of 45—90°, while not rare, were less common thansmall ones.
By far the most impressive example of orderlysequences was seen in one experiment in the spidermonkey, illustrated in Text-fig. 9. The penetrationentered area 17 very close to the 17—18 border, at anangle of about 30° to the normal. Fields of the firstcells were oriented almost vertically. Subsequentcells and unresolved unit activity showed regularsmall shifts in orientation, consistently in acounter-clockwise direction, so that at a depth ofabout 1 mm, after eighteen shifts, the orientationhad revolved through 180° and was again vertical.The progression continued in a counter-clockwisedirection for another 45°, and then, at the pointmarked by the first arrow, the direction of shiftssuddenly reversed. Now fifteen clockwise changesin orientation took place in the next 180°, followedby another ten clockwise shifts through almostanother 180°. Finally, near the end, the processseemed to be reversing itself again, with counter-clockwise shifts beginning at the second arrow.There were, in all, 52 shifts in orientation, thesmallest being about 6° and the largest around 20°,
and in the course of the penetration each orienta-tion was represented about 4 times. The field posi-tions of the final cells were in exactly the same placeas those of the first, indicating that the distance tra-versed in a direction parallel to the surface hadbeen too small to produce a measurable shift inreceptive field position.
In this penetration the average shift was about13°, associated with an average electrode move-ment of 40 (I, or, given the obliquity of 30°, a move-ment parallel to the cortical surface of 20 Ji. Fromthe higher-power photomicrograph of the cortexin the area of this penetration, shown in Pi. 2, 20 (J,seems to be the order of magnitude of the widths ofthe vertical pallisades of cells in this area. The ver-tically orientated striations may thus represent theactual columns of cells, at least in this experiment,and the columns must have close to the minimumpossible width, since the pallisades are only one ora very few cells wide. From this degree of orderli-ness and the probability that a similar order wouldhave held for any direction of horizontal move-ment across the cortical surface, it seems likely thatcolumns have the form of parallel sheets ratherthan pillars. In the cat this sort of geometry wasalso suggested in one surface-mapping experiment(Hubel & Wiesel, 1963, Text-fig. 4 and PI. 2).

258 PART III NORMAL PHYSIOLOGY AND ANATOMY
OCULAR DOMINANCE. In the monkey there was amarked tendency for successively recorded cells tohave the same eye-preference (Text-figs. 8, 10, 11and 12). Neighbouring cells did not necessarily fallinto the same ocular-dominance group, but theyusually favoured the same eye. Since there wereseveral vertical penetrations from surface to whitematter in which there was no change in eye prefer-ence, it is likely that the aggregations of cells arecolumnar. It is also evident that these regions ofcommon eye-preference have nothing to do withorientation columns, the two systems apparentlyhaving entirely independent borders. Of the twotypes of columns, those associated with eye domi-nance seem to be larger, often including several ori-entation columns.
Aggregation of cells according to ocular dom-inance was first established in the cat striate cortex(Hubel & Wiesel, 1962; 1965£), but in the cat theorganization was less clear cut, since, besidesregions in which all cells had similar eye prefer-ence, there were regions of mixed allegiance, inwhich cells of all ocular-dominance groups, includ-ing group 4, were mingled. (For definitions of ocu-lar-dominance groups see legend of Fig. 8.) Thesemixed regions tended to obscure the parcellationinto columns in the cat (Hubel & Wiesel, 1962, p.140), and indeed it was not until the columns hadbeen accentuated by raising cats with strabismusthat we became fully convinced of their existence(Hubel & Wiesel, I965i>). In the monkey the par-cellation is far more obvious: the columns are pos-sibly larger, mixed columns are racer if they exist atall, and cells of dominance groups 1, 2, 6 and 7make up a larger proportion of the population.
DIRECTION OF MOVEMENT. As noted above, themonkey striate cortex resembles that of the cat inthat complex cells tend to respond actively to amoving stimulus, with great cell-to-cell variationin directional selectivity—some firing actively todiametrically opposed directions, others respond-ing to one direction and hardly at all to the other,and still others with various degrees of intermedi-ate directional asymmetry. There is some intermix-ing between these groups, in that two simultane-ously recorded cells are often driven by oppositedirections of movement (Hubel, 1958). In the pres-ent series there nevertheless appeared to be somegrouping of cells according to the presence or
absence of directional preference. In most penetra-tions there were sequences, sometimes long ones,in which all cells showed strong directional prefer-ence, followed by sequences in which the cells allresponded well to both directions of movement.This is seen in Text-fig. 10, which illustrates a pen-etration cutting across a gyrus in the spider mon-key. Cells 1-5, 13-20, 23-27, 30-33, were all bidi-rectional, whereas those of sequence 6—12 wereunidirectional. There may thus be another inde-pendent, perhaps columnar system of cortical sub-divisions, this one dependent on symmetric vs.asymmetric responses to movement.
Finally, there was some indication of a group-ing of cells according to their preference for stimu-lus form—slits, edges, or dark bars. Colour codedcells similarly often came in clusters. The shape ofthe aggregations for these systems is not clear: theycould be nests or columns.
Horizontal OrganizationThe most conspicuous anatomical feature of thestriate cortex is its rich layering—indeed it was sonamed for that reason. From the outset it has beenclear that there are differences from layer to layerin the physiological properties of cells in area 17.These differences are more prominent than in thecat, just as the histological differences in layers aremore prominent. In five experiments done specifi-cally to investigate the layering differences, four-teen penetrations were made, six through the fullcortical thickness and eight to the 4th layer. Twoexperiments, to be discussed in more detail below,are illustrated in Text-figs. 11 and 12, and theresults from all rhesus experiments are tabulated inthe histograms of Text-figs. 13 and 14.
RECEPTIVE FIELD ORGANIZATION. In the secondlayer and upper part of the third almost all of thecells were complex or hypercomplex, and as a rulethe optimum stimulus orientation was preciselydefined. We found no simple cells in layer II, andin III they occurred only in the deepest parts, closeto IV. On entering this border zone and crossinginto upper IV the first simple cells appeared,hypercomplex cells were no longer seen, and incomplex cells the orientation specificity began torelax, with brisk responses over a wider range oforientations to either side of the optimum, but stillno response at 90° to the optimum.

Monkey Striate Cortex 259
Usually in IV A, but sometimes only on enter-ing IV B, a sudden change took place in the unre-solved background activity: it became more promi-nent, higher in pitch, and lost all trace of orientationpreference. Text-figure 11 and PI. 3 illustrate anexperiment done expressly to determine the depthat which the background lost its orientation speci-ficity. In each penetration this point was marked bya lesion, shown as a filled circle. All lesions were inIV A or near the IV A-IV B border. A similar
experiment, with the same outcome, is illustrated inText-fig. 12. Here the points of appearance of non-oriented background are shown to the left of eachpenetration by open circles.
Throughout IV B there was a mixture of sim-ple cells and units which lacked orientation speci-ficity. This was the layer with the fewest complexunits and the most non-oriented ones (Text-fig. 13).In V and VI the background again became selec-tively responsive to specifically oriented lines, and
Fig. 10. Reconstruction of an oblique penetration through striate cortex of spider monkey. This experiment indi-cates laminar grouping of cells according to complexity, and aggregation according to orientation, directional-ity of movement, and ocular-dominance. As in Text-fig. 8, 19 Cx 6 means 'Unit 19, complex, ocular-dominancegroup 6'.

260 PART HI NORMAL PHYSIOLOGY AND ANATOMY
Fig. 11. Six closely spaced parallelpenetrations through rhesus striatecortex made to determine the layer inwhich background and some unitslacked orientation specificity, and inwhich most cells were driven by oneeye exclusively. Lesion made in theseregions are indicated by blac\ circles.Lines within the open circles indicateoptimum stimulus orientation. Num-bers to right of each penetration referto ocular dominance group of eachisolated unit.
the units were mainly complex, with some hyper-complex ones intermixed.
Some of these laminar differences in fieldtypes are illustrated also in Text-fig. 10.
BINOCULAR INTERACTION. One marked differencebetween layers was related to binocular interac-tion. This is illustrated in the histograms of Text-fig. 14, and in Text-figs. 11 and 12. At the begin-ning of a typical penetration one eye or the otherwas consistently dominant, and through layer IIand most or all of III one encountered a mixture ofcells in groups 2 and 3 with a few from group 1, orelse a mixture of 5 and 6 with an occasional group7. At some stage, usually in upper IV, but occasion-ally as deep as the border of IV A and IV B, the eyethat had been non-dominant would drop out com-pletely, and through the remainder of layer IV cellafter cell would be in group 1 instead of 2 or 3, orgroup 7 instead of 5 or 6. This was just the point atwhich the background became poorly oriented (i.e.the regions marked by lesions in Text-figs. 11 and12). Simple cells recorded here were almost alwaysgroups 1 or 7, but a few exceptions were seen ingroups 2 and 6 and there was a single group 4 sim-ple cell. In penetrations that extended through
most of the cortical thickness, binocularly drivenunits remained scarce as layer IV was traversed,but reappeared abruptly in layer V, and persistedthroughout V and VI.
Finally, ocular-dominance differed markedlywith cell type (Text-fig. 14). This is not surprisingsince both ocular dominance and cell type tendedto vary from layer to layer. There was an increasein binocular interaction in going from simple tocomplex and from complex to hypercomplex, withgroups 1 and 7 becoming rarer, and the intermedi-ate groups more common. But in general cellsdriven equally by the two eyes were less commonin the monkey than in the cat, most monkey cellsfalling in groups 1, 2, 6 and 7. The ocular-dominance distribution of cells in the cat is closer tothat of monkey area 18, than to monkey 17 (unpub-lished). These results suggest that in monkey stri-ate cortex impulses from the two eyes probablyconverge not so much on the simple cell, as occursin the cat, but chiefly on the complex cell.
DISCUSSION
From this and previous studies it is clear that anysmall region of the striate cortex analyses some

Monkey Striate Cortex 261
Fig. 12. Five close-spaced penetrations in rhesus area 17. Open circles indicate a lac^ of background orientationspecificity; other conventions as in Text-fig. 11.
small part of the visual field in terms of the direc-tion of light-dark contours (in particular, the tan-gent to the contour lines), a detection of movementof the contours, a registration of the type of contour(light against dark, edge, and the like), and, at thehypercomplex level, a detection of any change indirection (curvature) of the contours. At any onetime only a small proportion of cells are likely to beinfluenced (activated or suppressed), since contoursof inappropriate orientation and diffuse light havelittle or no effect on a cell.
Hypercomplex cells, which we had thoughtoccurred only in 18 and 19 in the cat, turn out to befairly common in 17, both in cat and monkey. Pre-sumably in early studies their presence was notdetected because they gave no response to a linethat was too long, or perhaps they were classed ascomplex when they responded well to a line thathappened to be the correct length. For these cellsthe proportion responding to a given contour mustbe extremely small, since even an appropriately ori-ented line is ineffective if it maintains that orienta-tion over too great a distance.
The elaboration of simple cortical fields fromgeniculate concentric fields, complex from simple,and hypercomplex from complex is probably theprime function of the striate cortex—unless thereare still other as yet unidentified cells there. Oneneed not assume, of course, that the output consistsentirely of the axons of hypercomplex cells, the
other types being merely interposed as linksbetween input and output. We know, for example,that in the cat the posterior corpus callosum con-tains axons of all three cell types (Hubel & Wiesel,1967).
A second function of the striate cortex con-cerns the convergence upon single cells of inputfrom the two eyes. At the geniculate level anybinocular interaction must be relatively subtle,since no one has yet mapped out receptive fields inthe two eyes for a single geniculate cell, as can bedone routinely for cortical cells. In the cortex stim-ulation of both eyes in corresponding parts of thereceptive fields usually gives a greater responsethan stimulation of either eye alon. In the monkeyas in the cat, this convergence takes a special formin which the influence of the two eyes is combinedin varying proportions in different cells. Indeed, inthe monkey the process of amalgamation of thetwo inputs is further delayed, so that interaction isminimal for simple cells, distinctly more for com-plex, and possibly still more for hypercomplex.
Given that contour analysis and binocularconvergence are two prime functions of striate cor-tex, the parallel and independent manner in whichthe processes are carried out by this structure isworth noting. For both functions columns are theunits of organization. In a given 'eye-preference'column one eye is emphasized, in the next the othereye. In a superimposed but quite independent sys-

262 PART III NORMAL PHYSIOLOGY AND ANATOMY
Fig. 13. Histograms of 272 cortical cells showing numbers ofthe different cell categories, in each layer. Only the cells fromrhesus monkeys are included. In the right-hand set of his-tograms, cells are expressed as a percentage of the total num-ber in a given layer.
tern, one 'orientation' column subserves one orien-tation, another column a different one. In bothtypes of column the contour analysis and binocularconvergence occur in a vertically interconnectedsystem of layers, with the earliest stages in IV B, thelatest ones in II and III, and probably also in V andVI. Thus IV B is made up chiefly of simple cellsand units (possibly afferent fibres) that show noorientation preference, and these are almost allmonocularly driven, whereas in II and III one findscomplex and hypercomplex cells, mostly binocu-larly driven. This difference by layers in complex-ity of responses and in binocular interaction isentirely consistent with the Golgi type anatomy ofCajal (1911) and Lorente de No (1943), since in
terms of connexions cells of layer IV are closest tothe input, and the upper and lower layers are fur-thest away. It is hardly surprising that physiologi-cally the populations of individual layers are notpure, in view of the mixture of morphological celltypes in each layer, and the presence of axons pass-ing up and down from other layers. In the cat thelayering is less distinct, and the tendency for eachlayer to contain a mixture of cell types seems to begreater—in any case the physiological evidence forsegregation of different cell types in different lay-ers, while suggestive in the cat (Hubel & Wiesel,1962), was not nearly as clear as in the monkey. Thepresent demonstration of a clear difference in func-tion between cells in different cortical layers is, ofcourse, only a first step toward the goal of correlat-ing histologically defined cell types with function.
The form taken by the two systems ofcolumns deserves some comment. The existence ofregions in which orientation columns are highlyordered continues to be baffling, for if there aretwo kinds of striate cortex, one ordered and theother not, the anatomy gives no hint of this. Thereis a suggestion that the narrow orderly columnsmay sometimes correspond to the radial fasciclesseen microscopically, but these are seen everywherein 17, and the ordered regions seem not to be pres-ent everywhere. Where columns are ordered, itseems likely that they are very long narrow slabs,perhaps not straight, but swirling, if one can judgefrom the reversals in shifts seen in Text-fig. 9. It ispossible that these ordered regions may be morecommon than we realize, for their detectiondepends on rather ideal recording conditions inwhich the electrode moves forward steadily ratherthan in jumps, and records activity at all times. Thepossible purpose served by such an ordered systemof columns has been discussed elsewhere (Hubel &Wiesel, 1963).
In view of the recent work of Campbell &Kulikowski (1966) showing a difference in abilityof humans to discriminate between horizontal orvertical lines and oblique lines, we have looked forany differences in the occurrence of horizontallyand vertically oriented fields as opposed to obliquefields, but have seen none, in cat or in monkey. Theproblem is presumably one of comparing the fre-quency or size of the various orientation columns,and our series is doubtless too small to permit this,especially if one wishes to detect a difference of a

Monkey Striate Cortex 263
Fig. 14. Left: Distribution of 272rhesus cells among the various layersaccording to ocular-dominancegroup. Right: Distribution of 272cells among the different cell-classes,according to ocular-dominance
group.
few per cent. At least it is clear that horizontal andvertical orientations are not many times more com-mon than others.
In the binocular columnar system the columnsseem to be coarser, and take a special form. At thelevel of layer IV B there is a mosaic of alternatingleft-eye and right-eye representation, each appar-ently almost pure. This presumably simply reflectsthe tendency for afferents to the cortex to begrouped (Hubel & Wiesel, 1965£), as is so for thecolumns of the somatosensory cortex described byMountcastle (1957). As the visual input is transmit-ted over several stages to the more complex cells inthe upper and lower layers, there must be progres-sively more intermixing between the eyes, presum-ably by interconnexions that run obliquely. Thecolumns nevertheless remain discrete, with almostall cells in one column favouring one eye, though nolonger dominated completely by it. There do notseem to be regions of mixed dominance, as one finds
in the cat. For the binocular columns the physiolog-ical evidence thus indicates that there is some inter-change between one column and its immediateneighbours, minimal in layer IV, but increasing inthe superficial and deep layers. (By definition twoadjacent binocular columns must favour oppositeeyes.) This is in sharp contrast to the orientationcolumns, since for these there is no evidence to sug-gest any cross talk between one column and itsimmediately adjoining neighbours. There is ofcourse no reason why an orientation column shouldnot have rich connexions with another column ofidentical field orientation even though the two maybe separated by as many as 15-18 different columns.Indeed, if eye-preference columns are intercon-nected, and if one eye-preference column does con-tain many orientation columns, then the intercon-nexions must be highly specific, one orientationcolumn being connected to another some distanceaway. These suggestions depend of course on rather

264 PART III NORMAL PHYSIOLOGY AND ANATOMY
indirect inferences from physiological experiments,but they may have some value in indicating certainpatterns of connexions to look for with morpholog-ical techniques.
If there are indications that the orientationcolumns take the form of parallel pillars, or, in moreordered areas, parallel slabs, we have no hints at allabout the shape of the eye-preference columns.They differ from the orientation columns in beingof just two types, instead of more than a dozen, andthe two should be about equally prominent, giventhe lack of any marked dominance of one eye orother in the cortex as a whole. One would thereforeexpect a patchwork of alternating columns like achecker board, or a confluent matrix of one typewith pillars of the other type embedded within it, ora series of parallel slabs. These possibilities are men-tioned here because the term 'column' itself impliesa series of pillar-like structures, which is probablythe least likely form in this case.
The columnar system seems to represent amethod by which many areas of cortex—somatosensory (Mountcastle, 1957) visual, includ-ing 17, 18 and 19, and perhaps motor (Asanuma &Sakata, 1967)—deal with multi-dimensional prob-lems using a two-dimensional surface. In the visualsystem the two co-ordinates of the visual field aremapped on the two surface co-ordinates; othervariables, notably line orientation, eye dominance,possibly movement directionality, are handled bysubdividing this surface into overlapping mosaicswhich are independent, just as the picture of a jig-saw puzzle is independent of the borders separat-ing the pieces. With two such mosaics known anda third suspected, it will not be surprising if moreare found in the future.
To conclude, it is easy to draw up a large listof gaps still to be filled in our understanding of thisstructure. To mention only a few, the binocularinteraction we have described tells us nothingabout mechanisms for handling stereoscopic depthperception. Bishop's group in Sydney and Barlow'sin California have evidence for horizontal non-correspondence of some cells in cat area 17, and therelation of these to the binocular mechanismsdescribed here for the monkey will be most inter-esting. Our knowledge of cortical colour mecha-nisms is still very sketchy. Anatomically one is justbeginning to understand the layering of the cortex,and some features, such as the significance of layers
I, V and VI are still a complete mystery. At a synap-tic level the correlation of structure with physiol-ogy, as is now being done in the retina (Dowling &Boycott, 1966), is still lacking in the cortex. Thepart, if any, that area 17 plays in attention mecha-nisms in conscious animals is completely obscure.But despite the large areas still unexplored, inbroad outline the function of area 17 is probablynow relatively well understood. One knowsroughly how the output differs from the input, andit is possible to make guesses that can be tested con-cerning the circuits that underly these transforma-tions. Knowing what image is falling on the retinaat any given moment, one can predict with someconfidence what most types of cells will be doing.
Specialized as the cells of 17 are, comparedwith rods and cones, they must, nevertheless, stillrepresent a very elementary stage in the handling ofcomplex forms, occupied as they are with a rela-tively simple region-by-region analysis of retinalcontours. How this information is used at laterstages in the visual path is far from clear, and repre-sents one of the most tantalizing problems for thefuture.
We thank Janet Wiitanen for her excellent technical assistance.This work was supported by N.I.H. Research Grants, Nos. 5RO 1 NB 02260 and 5 RO 1 NB 05554.
References
Asanuma, H. & Sakata, H. (1967). Functional organization of acortical efferent system examined with focal depth stimula-tion in cats./. Neurophysiol. 30,35-54.
Brodmann, K. (1909). Vergleichende Lofyalisationslehre der Gross-hirnrinde. Leipzig: J. A. Barth.
Cajal, S. Ramon Y (1911). Histologie du systeme nerveux deI'homme et des vertebres, vol. 2. Paris: Maloine.
Campbell, F. W. & Kulikowski, }. J. (1966). Orientational selec-tivity of the human visual system./. Physiol. 187,437—445.
Daniel, P. M. & Whitteridge, D. (1961). The representation ofthe visual field on the cerebral cortex in monkeys./. Physiol.159,203-221.
Daw, N. W. (1967). Color coded units in the goldfish retina.Ph.D. Thesis, Johns Hopkins University, Baltimore.
De Valois, R. L., Jacobs, G. H. & Jones, A. E. (1963). Responsesof single cells in primate red-green color vision system.Opti\ 20, 87-98.
Dowling, J. E. & Boycott, B. B. (1966). Organization of the pri-mate retina: electron microscopy. Proc. R. Soc. B 166,80—111.
Hubel, D. H. (1957). Tungsten microelectrode for recordingfrom single units. Science, N.Y. 125, 549-550.
Hubel, D. H. (1958). Cortical unit responses to visual stimuli innonanesthetizecl cats. Am. J. Ophthal. 46, 110-121.
Hubel, D. H. (1959). Single unit activity in striate cortex ofunrestrained cats./. Physiol. 147, 226-238.
Monkey Striate Cortex 265
Hubel, D. H. & Wiesel, T. N. (1959). Receptive fields of singleneurones in the cat's striate cortex./. Physiol. 148, 574—591.
Hubel, D. H. & Wiesel, T. N. (1960). Receptive fields of opticnerve fibres in the spider monkey. /. Physiol. 154, 572-580.
Hubel, D. H. & Wiesel, T. N. (1962). Receptive fields, binocularinteraction and functional architecture in the cat's visualcortex./. Physiol. 160,106-154.
Hubel, D. H. & Wiesel, T. N. (1963). Shape and arrangement ofcolumns in cat's striate cortex. /. Physiol. 165, 559-568.
Hubel, D. H. & Wiesel, T. N. (1965a). Receptive fields and func-tional architecture in two non-striate visual areas (18 and 19)of the cat./. Neurophysiol. 28,229-289.
Hubel, D. H. & Wiesel, T. N. (1965£). Binocular interaction instriate cortex of kittens reared with artificial squint./. Neu-rophysiol. 28,1041-1059.
Hubel, D. H. & Wiesel, T. N. (1967). Cortical and callosal con-nections concerned with the vertical meridian of visualfields in the cat./. Neurophysiol. (In the Press.)
Lorente de No, R. (1943). Cerebral cortex: architecture, intra-cortical connections, motor projections. In Physiology of theNervous System, ed. Fulton, J. F., 2nd edn., pp. 274-301.New York: Oxford University Press.
Motokawa, K., Taira, N. & Okuda, J. (1962). Spectral responsesof single units in the primate visual cortex. Toho/^u J. exp.Med. 78,320-337.
Mountcastle, V. B. (1957). Modality and topographic propertiesof single neurons of cat's somatic sensory cortex. /. Neuro-physiol. 20,408-434.
Talbot, S. A. & Marshall, W. H. (1941). Physiological studies onneural mechanisms of visual localization and discrimina-tion. Am.]. Ophthal. 24,1255-1263.
von Bonin, G. (1942). The striate area of primates./, comp. Neu-rol. 77,405-429.
Wiesel, T. N. & Hubel, D. H. (1966). Spatial and chromaticinteractions in the lateral geniculate body of the rhesusmonkey./. Neurophysiol. 29,1115-1156.
AFTERWORD
This paper represents a first attempt to survey physiologically the monkeystriate cortex. Since 1968 our knowledge has greatly expanded with regardto of the properties of the cells in the different layers. End-stopping has beendiscovered to be present in monkey striate cortex, the geometry of the twomain types of columns (orientation and ocular dominance) has been deter-mined, and more of the color properties have been worked out. It was notuntil around 1980 that the blobs were discovered, together with their relationto the double opponent cells that were so briefly mentioned in the 1968 paper.There have been some disagreements as to the existence of blobs and theexistence of double opponent cells in V-l. Fortunately, the case for the latterhas now been well established through the combined use, by Bevil Conway,of reverse correlation receptive-field mapping and cone-isolation techniques.
ColumnsOur missing the blobs in all the early years of exploring the monkey striatecortex has long been a puzzle to us, and probably also the the rest of theworld of cortical neurophysiology. When, around 1980, blobs were firstdrawn to our attention by Margaret Wong Riley, who sent us slides ofcytochrome-oxidase stained transverse sections, we were mystified, did notknow what to make of them, and tried to forget them. We thought theyprobably had something to do with ocular dominance columns (as indeedwas so), but it was only on seeing tangential sections that we realized thatthey could not be dominance columns and must be something quite new.Then a graduate student, Jonathan Horton, and I reconstructed tangentialelectrode tracks through upper-layer monkey striate cortex, stained forcytochrome oxidase, and found that the blobs coincided with regions ofcenter-surround non-oriented cells. That we missed these structures for solong must at least partly be related to our custom of making vertical pene-trations through the cortex. On examining old protocols it seems clear that
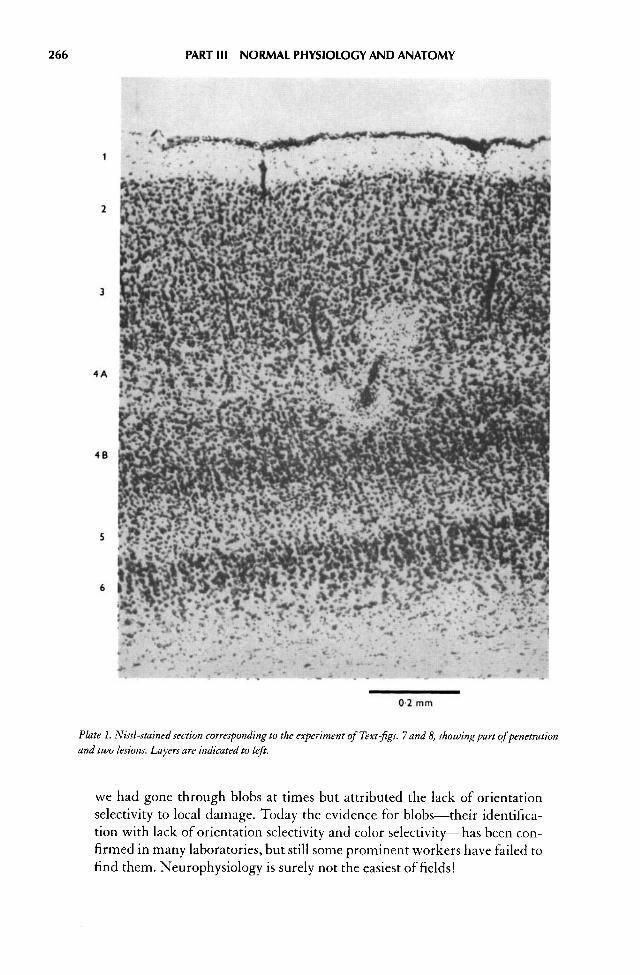
266 PART III NORMAL PHYSIOLOGY AND ANATOMY
Plate 1. Nissl-stained section corresponding to the experiment of Text-figs. 7 and 8, showing part of penetrationand two lesions. Layers are indicated to left.
we had gone through blobs at times but attributed the lack of orientationselectivity to local damage. Today the evidence for blobs—their identifica-tion with lack of orientation selectivity and color selectivity—has been con-firmed in many laboratories, but still some prominent workers have failed tofind them. Neurophysiology is surely not the easiest of fields!

0 2 mm
Plate 2. Nissl-stained section through the electrode trac\ of Text-fig. 9, showing first part of the trac^ outlinedby inflammatory reaction.
267

Plate 3. Nisil section showing four of the five lesions of Text-fig. 11.
268
Monkey Striate Cortex 269
Ocular dominance columns, described in this paper in detail for thefirst time, were much easier to study in macaques than in cats, because theyare so much better defined. In cats we only became convinced of their exis-tence when we brought up kittens with artificial squint, which leads to amarked sharpening of their borders. In macaques there is much less mixingof inputs from the two eyes near the borders of columns, so that the transi-tions, as an electrode advances parallel to the surface, are far more abrupt.The abruptness is especially marked in layer 4C, in which the cells aremonocular. Our physiological studies, in both cats and macaques, were donebefore we began to apply the anatomical methods that put ocular dominancecolumns on a firmer footing. Those studies are described in the next fewpapers.
In 1968 we were puzzled by how rarely we saw regions of highlyordered orientation shifts. We had the one overwhelming example of Figure9 of the present paper, in a spider monkey named George. That memorablerecording session lasted five hours, during which neither of us budged fromour seats. We had previously seen a few examples that were less compelling,and in most penetrations we had seen little trace of such order. The reasonsare now clear, and we have abundant physiological evidence that order is therule, and breaks in the order are the exception. It is much easier to see theregularity if one makes very oblique microelectrode penetrations, and it iseasiest if one uses electrodes that not too selective, so that one can see andhear a continuous background of undifferentiated activity as the electrode isadvanced, in addition to a succession of occasional well isolated cells. Veryselective electrodes give nice big well-isolated impulse deflections, but sizeand isolation are not so important when looking at properties that are sharedby neighboring cells, such as optimum orientation. To struggle to obtainlarge isolated units is important for impressing visitors but can be carried toofar. Perhaps our gravest early mistake in looking for order was in not realiz-ing how useful it is to plot orientation against position along the cortex. Veryselective electrodes record cells only here and there, and only by plotting thepoints does one realize that they usually fall along a straight-line trajectory.We did this plotting for George, our monkey of Figure 9, though in that caseit was hardly necessary because the electrode happened to be relatively un-selective. (Since 1985, with the advent of optical mapping, the evidence fororder has become still more compelling.)
Our disdain of quantification and graph plotting had some advantages,including the freeing up of time, but on some occasions it could be a hin-drance!
LayeringCell properties in relation to layering presented some of the most difficultproblems. In this paper we have almost nothing to say about the deeper lay-ers, 5 and 6, partly because so many of our penetrations left off before we evergot that deep. We could have plunged in and started observing cells halfwaydown, but being human we always found it hard to forge ahead when we

270 PART III NORMAL PHYSIOLOGY AND ANATOMY
were recording nice big juicy cells. We could have doggedly kept on to thewhite matter, but we needed sleep, and never worked in relays or carriedexperiments over to the next day. It is not just that we were lazy: it wasimportant to be sure of recovering the anatomy, and we hated to take chanceson the animal dying before we could perfuse it.
We still have little to say about properties of cells in the very thin genic-ulate-recipient layer 4A (to use modern terminology). In 1968 we had no ideaof this layer's existence, which only became clear as a result of our 1972 studyof geniculate afferents using the Nauta method, and our subsequent autora-diographic studies. (Recent recordings by Chatterjee and Callaway, made inV-l of monkeys in which mucimol was used to inactivate the cells, haveshown that geniculate blue-yellow afferent fibers end in layer 4A and deep3, whereas red-green afferents end only in deeper layers. [Nature, in press]).Layer 4B, now known to be the layer to which cells in the upper part of 4Cproject (layer 4C-alpha) and hence a continuation of the magnocellular path,seems to contain mainly complex cells, many of which are highly selective tomovement direction, and many of which are sharply selective for binoculardisparity.
In monkeys one of the biggest surprises was the center-surround orga-nization of a large proportion of cells in layer 4. In cats, units with center-surround fields had been common, but we convinced ourselves these weregeniculate afferent fibers. In the macaque things were more difficult. In 1968we had no idea that the upper and lower halves of 4C received inputs fromthe magno and parvo geniculate subdivisions—that first became clear whenwe began our anatomical work around 1972 (see below). The units recordedfrom the deeper half of layer 4C were tiny and the spike shape was hard toassess. And unlike records from cats, in which the background unresolvedactivity is always orientation-selective, records from deep layer 4 of macaques(4C-beta) showed no hint of orientation selectivity. It was a surprise to learnthat monkeys differed so markedly from cats, in having an interpolated stageof cortical cells lacking orientation selectivity. Gradually the consistent lackof any hint of orientation selectivity in layer 4C-beta convinced us of this extrastage, but at the time of the paper we were still undecided.
Though it is fairly clear that the units we recorded from 4C-beta werecells, and not afferent fibers, amazingly little is known even today aboutthem. We do not know to what extent they resemble or differ from the par-vocellular geniculate cells that feed this layer. They have concentric center-surround fields and the centers are tiny, but we do not know how many aretype 1 or type 2 or 3. At present both parvocellular geniculate cells and cellsof cortical 4C-beta are suffering from neglect.
We had a hard time learning the properties of cells in the upper half oflayer 4c (4c alpha), probably because we were using Nissl stained sections toreconstruct our electrode tracks, and we now know that in Nissl material theborder between this layer and 4b is not well defined. The border is moresharply defined in a cytochrome oxidase stain, and we have learned that itcoincides with the upper margin of the projection of the magnocellular genie-

Monkey Striate Cortex 271
ulate cells. This has made it far easier to relate track reconstructions to layers,and in subsequent anatomically controlled recordings, Margaret Livingstoneand I found that this uppermost half of 4c contains a mixture of center-sur-round cells and well-oriented simple cells (/ Neurosci 1984, 4:309—356). Allthis suggests that the magnocellular stream of macaques may be in some wayshomologous with the geniculo-cortical projection in cats, in which the pathproceeds directly from geniculate center-surround cells to cortical orientationselective simple cells, without having a second center-surround stage inter-posed—as one finds in the monkey parvocellular stream. If so, we wonderwhat, in the cat, corresponds to the monkey parvocellular system
We have, strangely, seen little suggestion of similarities between cells in4c-alpha and the geniculate magnocellular cells that feed them, with theirpeculiar color properties and sustained surround responses.
Examples of simple cells in monkey striate cortex have been clear andplentiful, but the clearest examples we have seen have been in layer 4B. Theprevailing evidence had until recently indicated that 4B received its maininput from 4C-alpha, and must therefore be part of the magnocellularstream. Yet results by Sawatari and Callaway (Nature 1996, 380:442-446)suggest that some cells in layer 4B receive a substantial parvocellular input.In the parvocellular stream we would have expected to find simple cells inthe deep part of layer 3, since it is here that cells of 4C-beta had been thoughtmainly to project. Simple cells of layer 4B need to be re-examined physio-logically for signs of parvocellular input, such as color opponency.
ColorIn the upper cortical layers, in addition to the massively preponderant groupof cells that lack overt color coding, we have two major types of overtly color-coded cells, that respond best to specific sets of wavelengths, and often do notrespond to white light. First, we have the orientation-selective color selectivecells. In their orientation selectivity these relatively rare cells resemble themuch more common non-color-coded complex or hypercomplex (end-stopped) cells, with their high spatial precision. They show marked colorselectivity, responding selectively to a single group of wavelengths—long,middle, or short—and often give little or no response to white light. Most ofthe examples we have seen (perhaps 10 to 20 over 30 years or so) have pre-ferred red slits, rather than green or blue.
Second, in this paper we identified double opponent cells for the firsttime in mammals, following their discovery by Nigel Daw in the goldfishretina. This foreshadowed results that were obtained in our separate labora-tories, in cytochrome oxidase blobs, which is where these double opponentcells are lodged (Livingstone and Hubel, / Neurosci 1984, 4:309—356; Ts'oand Gilbert,/ Neurosci 1988, 8(5):1712-1727). Blobs also contain center-sur-round cells that lack color coding but resemble double-opponent cells in hav-ing rather large on or off centers. The evidence that these cells (color codedand otherwise) are in blobs is direct and anatomical, consisting of identify-ing, with electrolytic lesions, the electrode-tip positions where the cells are

272 PART III NORMAL PHYSIOLOGY AND ANATOMY
recorded, and demonstrating, in adjacent sections stained for cytochromeoxidase, that the lesions are in blobs. In the past few years Bevil Conway, apostdoctoral fellow in our labs, has used cone-isolation stimuli to screen forover one hundred red-green double opponent cells in awake-behaving mon-key V-l (/ Neurosci 2001, 21(8):2768-2783). In these awake, alert animals,direct anatomical evidence that these cells are in blobs is lacking, but theassociation seems highly likely given that the cells tend to occur in shortsequences. Double-opponent cells would seem to form the most likely basis,at the level of V-l, for color contrast, color constancy, and the related colorphenomena described by Edwin Land.
Recent failures by some workers to find double-opponent cells inmacaque V-l is hard to explain—Kandel, Schwartz, and Jessel's textbook(Principles of Natural Science, 4th edition, 2000, Chap. 29) makes no mentionof double opponency. It is important to examine any cells with poor orienta-tion selectivity with stationary colored-spot stimuli, and it is helpful to screenfor cells using small-spot cone-isolation stimuli.
Like our efforts in the monkey lateral geniculate, the cortical record-ings leave us with the feeling that there is still much to do if we are ever toget a complete picture of the physiology of striate cortex. And this may be agood place to admit that the account, in this book, of the progress that hasbeen made in mammalian CNS vision neurobiology is necessarily very farfrom complete, and to apologize to the many workers whose contributionshave been omitted. Had we tried to be complete, the book would never havebeen finished, and if finished would have cost an order of magnitude moremoney. And we would have had to be real scholars!

Chapter 15 • Another Visual Representation, theCat Clare-Bishop Area •
FOREWORD
This was not one of our favorite papers, perhaps unjustly. We were naturallycurious to record from a region that had long been known to be part of thecat visual path—in fact, since 1943, when Marshall, Talbot, and Ades dis-covered that it responded with slow waves to electrical stimulation of theoptic nerve. There followed, in 1954, a study by George Bishop and MargaretClare that showed that this area responded also to stimulation of the 17—18region. We recorded from it because we hoped to find evidence for still moreelaborate processing, beyond the hypercomplex cells we had seen in area 19.In that we were disappointed. We found no new interesting properties todistinguish the area from 17,18, or 19—indeed, the only major difference wesaw was in the very large receptive field size. To us it was simply a boring, ifpuzzling, area.
Visual Area of the Lateral Suprasylvian Cyrus (Clare-Bishop Area)of the Cat
DAVID H. HUBEL AND TORSTEN N. WIESEL • Department of Neurobiology, Harvard Medical School, 25
Shattuck Street, Boston, Massachusetts
SUMMARY receive strong visual projections both from the lat-eral geniculate body and area 17. We have mapped
On anatomical and physiological grounds a zone of c , i f • , n • *u- • • u*r ; & & receptive fields or single cells in this area in eightcat cortex deep in the medial bank of the suprasyl-vian sulcus (the Clare—Bishop area) is known to
From/. Physiol. (1969), 292, pp. 251-260
Received 16 December 1968.
273
cats.

274 PART III NORMAL PHYSIOLOGY AND ANATOMY
Active responses to visual stimuli were foundover most of the medial bank of the suprasylviansulcus extending to the depths and over to the low-est part of the lateral bank. The area is clearly topo-graphically arranged. The first responsive cells,recorded over the lateral convexity and 2—3 mmdown the medial bank, had receptive fields in thefar periphery of the contralateral visual fields. Thereceptive fields tended to be large, but showed con-siderable variation in size and scatter in their posi-tions. As the electrode advanced down the bank,fields of successively recorded cells graduallytended to move inwards, so that in the depths of thesulcus the inner borders of many of the fieldsreached the vertical mid line. Here the fields weresmaller, though they still varied very much in size.
Receptive fields were larger than in 17, 18, or19, but otherwise were not obviously differentfrom the complex and lower-order hypercomplexfields in those areas. No simple fields, or concentricfields of the retino-geniculate type, were seen. Cellswith common receptive-field orientation weregrouped together, but whether or not the groupingoccurs in columns was not established.
Most cells were driven independently by thetwo eyes. Fields in the two eyes seemed to be iden-tical in organization. Cells dominated by the con-tralateral eye were much more common than ipsi-laterally dominated ones, but when cells withparafoveal and peripheral fields were consideredseparately, the asymmetry was seen to apply mainlyto cells with peripheral fields.
INTRODUCTION
In 1943, Marshall, Talbot & Ades, while recordingthe responses of cat cortex to visual stimulation,observed evoked activity in a region close to thesuprasylvian sulcus, some distance from the classi-cal visual receiving areas. They could not abolishthe response by making lesions in the lateral gyrus,and concluded that the area received projectionsfrom the lateral geniculate body or structures closeto the geniculate. Over a decade later Clare &Bishop (1954) narrowed the responsive zone downto a strip of cortex deep within the suprasylviansulcus, lying along its medial lip (Fig. 1). Theresponses were evoked by stimulating either theoptic nerve or the lateral gyrus of the cortex (pre-sumably areas 17 and 18 of Otsuka & Hassler(1962)).
Over the past few years anatomical studieshave also implicated this same suprasylvian regionas part of the visual system. Nauta methods havedemonstrated projections to it from the lateralgeniculate body (Glickstein, King, Miller &Berkley, 1967; Wilson & Cragg, 1967); from area 17of either side (Hubel & Wiesel, 1965; Wilson, 1968);and from areas 18 and 19 of either side (Wilson,1968). Removal of cortex lateral to areas 17, 18 and19 gives by itself minimal retrograde degenerationin the lateral geniculate body (Sprague, 1966); toproduce complete degeneration one must destroythese more lateral areas as well as 17, 18 and 19(Garey & Powell, 1967). There is thus anatomicaland physiological evidence for projections to the
Fig. 1. Diagram of cat brain, as seen from above (anterior is up) and in coronal section, defining topographicalterms used in this paper. For each of four topographically organized regions, arrows are directed from peripheralrepresentation towards mid line representation.
The Cat Clare-Bishop Area 275
lateral suprasylvian region from the lateral genicu-late body and from 17, 18, and 19.
By studying responses of single cells torestricted spots and patterns of light, we haverecently identified three distinct cortical visualareas in the cat (visual areas I, II, and III), and foundthem to be identical with architectonically dennedareas 17, 18 and 19 of Otsuka & Hassler (1962). Itseemed natural to extend this work by exploring thesuprasylvian region, and the present paper repre-sents a beginning in this direction. Cells in the areaare easily influenced by visual stimuli, and theirreceptive fields are in many ways similar to those in17, 18, and 19. The region is topographicallyordered. We have seen little evidence that the analy-sis of form is carried further in this region, and sofar its physiological significance remains a puzzle.
METHODS
Methods for stimulating and recording have beendescribed in previous papers (Hubel & Wiesel, 1962,1965), and will only be summarized here. A cat wasanaesthetized with intraperitoneal thiopental, givenintravenous succinylcholine to paralyse the eye muscles,and artificially respirated. Light anaesthesia was main-tained throughout the experiment. The animal wasplaced in a stereotaxic head holder, and the eyes fittedwith contact lenses to obtain a focus upon a screen at adistance of 1.5 m. Stimuli consisted of stationary andmoving patterns of light projected against a diffuse pho-topic background. A tungsten micro-electrode wasadvanced hydraulically in a closed-chamber system, andseveral electrolytic lesions were made in each penetra-tion. For track reconstruction all brains were fixed informalin, embedded in celloidin, sectioned at 25 (1, andstained with cresyl violet.
Experiments were done in eight adult cats. Themicro-electrode was inserted into the lateral part of thesuprasylvian gyrus, at about Horsley—Clark level A4 toA6, and lowered along the medial bank of the suprasyl-vian sulcus. The regions explored consisted of the medialbank to the depths of the sulcus, and part way round toinclude the lowest part of the lateral bank.
RESULTS
Brisk activity was seen in response to visual stimu-lation either on first entering the suprasylviangyrus or after descending about one-third of theway along its lateral bank (Fig. 1). As in 17,18, and19, diffuse light gave virtually no responses, butline stimuli (slits, dark bars, and edges) were very
effective over restricted regions. For optimumresponse the stimulus orientation was also critical,varying from cell to cell, and a moving stimuluswas usually much more effective than a stationaryone. About two thirds of the cells were 'complex',and the remainder 'hypercomplex' (Hubel &Wiesel, 1965). No 'simple' cells were seen. Hyper-complex cells were almost all of lower order. Therewas little suggestion that the kinds of form analysisoccurring in 19 or even in 17 are carried further inthe Clare—Bishop region.
Perhaps the main distinguishing feature ofthis area was the large size, and the great variationin size, of the receptive fields. On the average thefields even exceeded those of 18 in the territory theyoccupied, often taking up most of a visual-fieldquadrant. A second, less conspicuous differenceconcerned the responses to moving lines. As in 17,18, and 19, the best responses were obtained to opti-mally oriented lines swept across the receptivefield, and the responses were either about equal, formovements in the two diametrically oppositedirections, or were very unequal. In the Clare—Bishop area cells strongly preferring one directionover the opposite were about three times as numer-ous as those showing no preference, in contrast tothe more nearly equal representation of the twogroups in 17, 18, and 19. To give an extreme exam-ple, in one penetration, described below (Fig. 3),only three out of thirty-two cells responded equallywell to an optimally oriented slit moved in the twoopposite directions.
Simultaneously recorded cells always had thesame receptive-field orientation, and this was alsousually true of successively recorded cells (see Fig.3, below). Moreover, the orientation that was mosteffective for a given cell was also most effective forany unresolved activity audible in the background.There thus seems little doubt that cells of commonreceptive field orientation are grouped, as they arein 17, 18, and 19. We still lack compelling evidencethat the groupings are in the form of columns, evi-dence such as comparisons between normal andtangential penetrations, lesions at points of transi-tion in orientation in multiple parallel penetra-tions, or surface maps. Nevertheless, a columnarsystem seems a very likely possibility.
OCULAR DOMINANCE. Most cells were driven inde-pendently from the two eyes. As in areas 17-19there were no obvious differences in the field struc-

276 PART 111 NORMAL PHYSIOLOGY AN D ANATOMY
Contralateral Equal Ipsilateral
Ocular dominanceContralateral Equa l Ipsilateral
Ocular dominance
Fig. 2. Histograms showing distribu-tion of cells according to ocular dom-inance. Cells with field centreswithin 10° of the area centralis areplotted separately from those withmore peripheral fields. Cells of group1 were driven only by the contralat-eral eye; for cells of group 2 there wasmarked dominance of the contralat-eral eye, for group 3, slight domi-nance. For cells in group 4 there wasno obvious difference between thetwo eyes. In group 5 the Ipsilateraleye dominated slightly, in group 6,markedly; and in group 7 the cellswere driven only by the ipsilateraleye.
ture of a single cell in the two eyes, either in orien-tation, position, or optimal stimulus (Hubel &Wiesel, 1962,1965). No thorough search was madefor horizontal disparity in field positions. As inother areas, the ocular dominance varied from cellto cell. The relative abundance of cells in the dif-ferent ocular dominance groups varied dependingon the position of the fields, and hence in the regionof the suprasylvian gyrus from which recordingswere made. Figure 2A shows the ocular dominancedistribution for cells having fields within 10° of thearea centralis. This histogram resembles those pre-viously obtained for cells in 17,18, and 19 (Hubel &Wiesel, 1965) most of which likewise had centrallylocated fields, for reasons having to do with sam-pling. Cells whose field centres were further outthan 10° tended strongly to favour the Contralateraleye, as shown by the histogram of Fig. 2B. The sur-prisingly large number of group 1 cells (thoseresponding only to the Contralateral eye) would beeven larger if it included cells whose fields were inthe extreme periphery of the visual field, beyondthe region of overlap of the two eyes.
TOPOGRAPHY, FIELD SIZE, AND SCATTER. All theexperiments showed a clear but rather crude topo-graphic representation of the Contralateral field of
vision. Two typical examples are shown in Figs. 3and 4. In the experiment of Fig. 3 the first respon-sive cells were found at point a (Fig. 3A). Fields ofthe twelve cells recorded between a and b werescattered over a region below the horizontalmeridian, extending out 20—50 from the verticalmid line. These fields are shown diagrammaticallysuperimposed in Fig. 3B. As the electrodeadvanced, the fields tended to be situated closerand closer to the mid line, so that by mid-penetra-tion, between points b and c (Fig. 3C), they werecentred some 10—15° out, and in the deepest part ofthe penetration, between c and d (Fig. 3D), theyhad moved in to within a few degrees of the verti-cal mid line. A graph summarizing the inwardtrend of field centres with electrode depth is givenin Fig. 3A
In the second example, illustrated in Fig. 4,responsive cells were recorded from the outset ofthe penetration. In this Figure the horizontal linesrepresent the horizontal extent of each field, andthe short vertical marks indicate either the geomet-ric centre or the region from which strongestresponses were evoked. The first cells had fieldsthat reached beyond 70° from the mid line. Againthe inward trend with increasing depth was clear,though over any small segment of the penetration
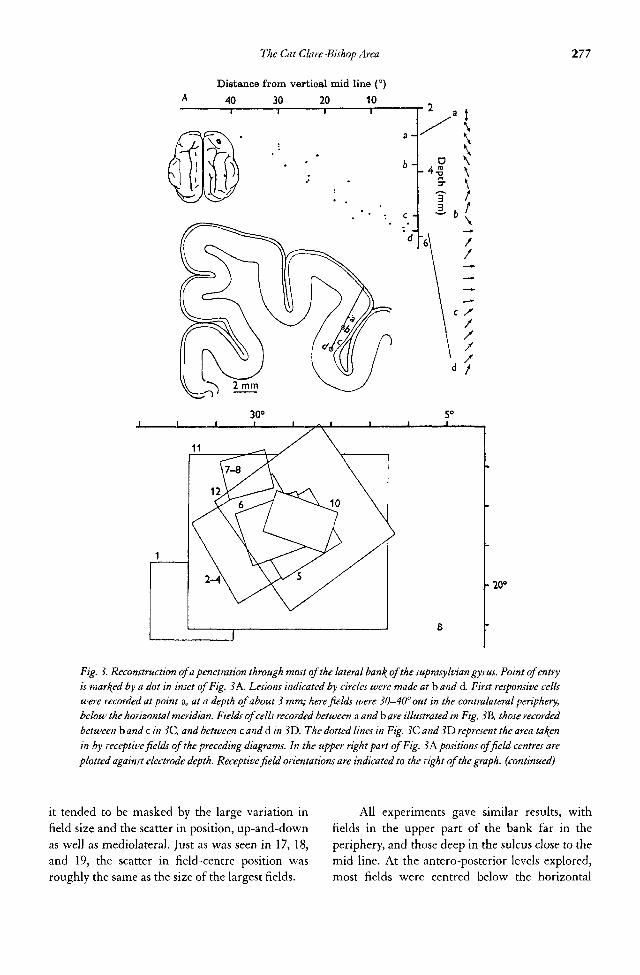
The Cat Clare-Bishop Area 277
Fig. 3. Reconstruction of a penetration through most of the lateral ban\ of the suprasylvian gyrus. Point of entryis marked by a dot in inset of Fig. 3 A. Lesions indicated by circles were made at b and d. First responsive cellswere recorded at point a, at a depth of about 3 mm; here fields were 30—40° out in the contralateral periphery,below the horizontal meridian. Fields of cells recorded between a and b are illustrated in Fig. 3E, those recordedbetween b and c in 3C, and between c and d in 3D. The dotted lines in Fig. 3C and 3D represent the area ta^enin by receptive fields of the preceding diagrams. In the upper right part of Fig. 3K positions of field centres areplotted against electrode depth. Receptive field orientations are indicated to the right of the graph, (continued)
it tended to be masked by the large variation in
field size and the scatter in position, up-and-down
as well as mediolateral. Just as was seen in 17, 18,
and 19, the scatter in field-centre position was
roughly the same as the size of the largest fields.
All experiments gave similar results, with
fields in the upper part of the bank far in the
periphery, and those deep in the sulcus close to the
mid line. At the antero-posterior levels explored,
most fields were centred below the horizontal

278 PART III NORMAL PHYSIOLOGY AND ANATOMY
meridian: presumably the superior visual fields arerepresented more posteriorly in the cortex, just asthey are in 17, 18, and 19, but this was not investi-gated.
On the average, fields close to the area cen-tralis were much smaller than those in the periph-ery. This was seen in most experiments, and is wellshown in Fig. 3B, C, and D. The tendency was lessobvious in the experiment of Fig. 4, which wasexceptional in this respect.
Many of the fields bordered on the verticalmid line, some of them extending into the ipsilat-eral field for several degrees. This overlap across
the mid line presumably reflects the input the areareceives from area 17 of the opposite hemisphere,and hence, ultimately, from the ipsilateral visualfield. A similar overlap has been seen in recordingsfrom 18 (Hubel & Wiesel, 1967).
DISCUSSION
When one compares this lateral suprasylvian areawith areas 17, 18, and 19, the similarities are farmore marked than the differences. The preferencefor precisely oriented lines, especially lines movingthrough the visual field, the presence of asymmet-
Fig. 3. (continued)

279
Fig. 4. Reconstruction of a penetra-tion in the lateral ban\ of the supra-sylfian gyms. Circles (L1-L4) rep-resent four electrolytic lesions madealong the electrode trajectory. In thegraph the horizontal lines show themediolateral extent of the receptivefields, and the short vertical linesindicate either the geometrical centreor the area from which responseswere maximal.
ric responses to the two opposite directions ofmovement of an optimally oriented line, and thetopographic representation with staggering in fieldposition, all are common to all four cortical regions.So far, receptive fields in the Clare-Bishop areaseem roughly similar to those in the other threeareas, except that there are no simple cells of thetype seen in 17, and fewer higher-order hypercom-plex cells than in 19, if indeed there are any at all.
The main differences between this area andthe other three lie in the enormous size of many ofthe fields, the variability in size, and the corre-spondingly large scatter in field positions. In thecoarseness of representation implied by the largefields and wide scatter this area exceeds 18, just as18 exceeds 17 and 19. It is as though many of thesame processes were taking place in the Clare-Bishop area and in 18, in parallel fashion, but withdifferent degrees of refinement.
A paper recently published by Sterling &Wickelgren (1968) gives a description of cells in thecat optic tectum, studied by methods similar to theones used here. The authors showed that althoughtectal cells resemble cortical cells in many respectsthey are also in many respects different, particularly
in not responding specifically to lines, in being rela-tively insensitive to orientation of contours, and instrongly preferring movement away from the midline of the visual fields. The Clare-Bishop area thusseems much more akin to the other cortical areasthan to the tectum. One reason for emphasizing thecontrast between the tectum on the one hand and 18or the Clare-Bishop area on the other concerns thedual projections that each of these receives: the tec-tum from the optic nerve and the 17,18,19 complex;18 and the Clare-Bishop area from the geniculateand from 17, 18, and 19. In the optic tectum Wick-elgren & Sterling (1968) showed that the more com-plex properties, e.g. the preferred direction ofmovement and much of the binocular convergence,disappear when the 17—19 complex is ablated; howthe optic nerve contributes to the responses of thenormal tectum is still not clear. For the Clare-Bishop area we found in one experiment that theresponses similarly disappear on removal of 17, 18,and 19, but retrograde degeneration in the genicu-late makes this result difficult to interpret. Thus,the question of the relative contributions of 17, 18and 19 and the geniculate to the suprasylvian visualarea still remains to be answered.
The Cat Clare-Bishop Area
280 PART III NORMAL PHYSIOLOGY AND ANATOMY
We are left, finally, with the puzzlingprospect of an area for which we can, in our pres-ent state of knowledge, assign no obvious function.The main object of this study was to verify the exis-tence of a region separate from the classical areasand strongly concerned with vision, to determineat least some properties of the cells, and to establishroughly the topographic organization, if any. Abetter understanding of its function, however, willrequire much more work on the receptive fields,and especially, perhaps, a comparison of the prop-erties of cells in different layers. Some idea ofwhere this region projects would also be useful.
We wish to thank Janet Wiitanen for her excellent technicalassistance. This work was supported by N.I.H. ResearchGrants, nos. 5 RO 1 NB 02260 and 5 RO 1 NB 05554.
References
Clare, M. H. & Bishop, G. H. (1954). Responses from an associ-ation area secondarily activated from optic cortex./. Neuro-physiol. 17,271-277.
Garey, L. J. & Powell, T. P. S. (1967). The projection of the lat-eral geniculate nucleus upon the cortex in the cat. Proc. R.Soc. B 169,107-126.
Glickstein, M., King, R. A., Miller, J. & Berkley, M. (1967). Cor-tical projections from the dorsal lateral geniculate nucleusof cats./, comp. Neural. 130, 55-76.
Hubel, D. H. & Wiesel, T. N. (1962). Receptive fields, binocularinteraction and functional architecture in the cat's visualcortex./. Physiol. 160,106-154.
Hubel, D. H. & Wiesel, T. N. (1965). Receptive fields and func-tional architecture in two nonstriate visual areas (18 and 19)of the cat./. Neurophysiol. 28, 229-289.
Hubel, D. H. & Wiesel, T. N. (1967). Cortical and callosal con-nections concerned with the vertical meridian of visualfields in the cat./. Neurophysiol. 30, 1561-1573.
Marshall, W. H., Talbot, S. A. & Ades, H. W. (1943). Corticalresponse of the anesthetized cat to gross photic and electri-cal afferent stimulation./. Neurophysiol. 6, 1—15.
Otsuka, R. & Hassler, R. (1962). Uber Aufbau und Gliederungder corticalen Sehsphare bei der Katze. Arch. Psychiat.NervKmnty. 203,212-234.
Sterling, P. & Wickelgren, B. G. (1968). Visual receptive fields inthe superior colliculus of the cat./. Neurophysiol. 32, 1-15.
Sprague, J. M. (1966). Visual, acoustic and somesthetic deficits inthe cat after cortical and midbrain lesions. In The Thalamus,ed. Purpura, D. P. & Yahr, M. D. New York: Columbia Uni-versity Press.
Wickelgren, B. G. & Sterling, P. (1968). Influence of visual cor-tex on receptive fields in cat superior colliculus. /. Neuro-physiol. 32,16-23.
Wilson, M. E. (1968). Cortico-cortical connexions of the catvisual areas./. Anat. 102,375-386.
Wilson, M. E. & Cragg, B. G. (1967). Projections from the lateralgeniculate nucleus in the cat and monkey. /. Anat. 101,677-692.
AFTERWORD
A careful rereading of the paper shows that we made one casual observation,ignored by ourselves and everyone else, that turned out to hold the key tomuch subsequent work in the cat and especially the monkey. Most of the cellswere directionally selective, like the cell I had seen so many years before,waving my hands in front of my awake-behaving cats. Such cells are com-mon enough in cat areas 17 and 18, where they are mixed in with the some-what more prevalent non-direction-selective cells, and where, furthermore,cells responding to one direction are mixed with ones responding to the dia-metrically opposite direction, as was the case with the two hand-wavingcells. In the Clare-Bishop area we had a strong suggestion of grouping ofcells favoring a given direction of movement, such as left-to-right, perhapsinto columns. We should have picked up on this, given the absence, in striatecortex, of columnar groupings of cells with common directional preference.
We not only did not follow up this result, but when we came to recordfrom prestriate cortex of macaques we happened upon a region in the ante-rior lunate sulcus with very similar properties. The fields were again hugeand again, to us, boring. We again failed to notice that such a large propor-tion of the cells were direction-selective, though it is obvious when we lookback at the protocols. We recorded about 200 cells, but found the results so

The Cat Clare-Bishop Area 281
similar to those of the Clare-Bishop area that we abandoned the project anddid not even write up the results. We had other priorities: we had no ideawhat the area was, and we were lazy and not very bright. This region ofmonkey cortex, now called MT or V-5, was one of the first prestriate areas tobe mapped out and to be examined physiologically, by Allman and Kaas in aNew World monkey, the owl monkey (in the middle temporal gyrus, orMT) (Brain Research 1971, 31:85-105), by Zeki in owl monkeys (/ Physiol1980, 207:239-248) and in macaques by Van Essen, Maunsell, and Bixby (/Comp Neurol 1981, 199:293-326). It is an important component of the dorsalvisual stream of Mishkin and Ungerleider. It is now known to be organizedin columns: one set defined by movement directionality rather than orienta-tion (Albright, Desimone and Gross, 1984, /. NeurophysioL, 51: 16-31; Born,2000, /. NeurophysioL, 84: 2658-2669), and a second set whose cells are sensi-tive to binocular disparity (De Angelis & Newsome, 1999, /. NeurophysioL 19:1938-1451).
The Clare-Bishop area has subsequently been mapped topographically,and christened "PMLS", perhaps because eponyms are regarded in some cir-cles as unscientific.

Chapter 16 • Encoding of Binocular Depth in aCortical Area in the Monkey •
FOREWORD
Like the recordings from MT just discussed, this represents another of ourearly forays into the prestriate monkey cortex, and again, not an entirely suc-cessful one. Like the MT work, the study has a curious and contorted history.We began looking at binocular interactions by following in the footsteps ofthe two groups already expert in stereopsis: Barlow, Blakemore, and Petti-grew, and Bishop, Nikara, and Pettigrew, in various arrangements of thosenames. They had the brilliant idea to put an adjustable prism in front of oneeye to vary the relative directions of gaze, in order to look for cells that weretuned selectively for near or far objects or for objects at the fixation distance.The work of the two groups was in cats, and we had no success in reproduc-ing it. The cat seemed to us an unfortunate choice for such work: eye move-ments are hard to control and monitor, and the cat lacks a rod-free fovea,having instead what is called the area centralis, which is in some ways equiv-alent to the primate fovea but is much larger and has poorly defined borders.This lack of a well-defined fovea made it difficult to line up the eyes preciselyfor studies of stereopsis.
We adapted their idea of using a prism in our work in the monkey, inwhich we explored a cortical gyrus buried deep in the lunate sulcus, justahead of the primary visual cortex. We happened by chance upon this area,which was full of cells very responsive to visual stimuli, especially to stimuliof the two eyes. We soon realized that these cells were highly selective for theexact setting of the prism, and we established that some cells respondedwhen the prism was set for near objects, others for far objects, and others forthe distance on which the animal was fixated. For still others, about half, thesettings were not critical. It was almost always the case that the cells thatresponded best for some critical prism setting, and therefore preferred someprecisely determined stimulus distance, gave little or no response to stimula-tion of separate eyes. This was quite different from most of the cells we hadstudied in V-l, where binocular cells were common but responded well tostimulation through either eye alone. There was a marked tendency for cells
282

Encoding of Binocular Depth 283
that responded to similar prism settings to be grouped, presumably intocolumns, for near, far, and zero disparities.
Cells Sensitive to Binocular Depth in Area 18 of the MacaqueMonkey Cortex
D. H. HUBEL AND T. N. WIESEL • Department of Neurobiology, Harvard Medical School, 25 Shattuck Street,
Boston, Massachusetts
Barlow, Blakemore and Pettigrew1, and Nikara,Bishop and Pettigrew2, have described a group ofcells in the cat visual cortex that respond selectivelyto horizontally disparate stimulation of the tworetinas. It seems very likely that such cells play animportant part in stereoscopic depth perception.We wished to determine whether similar cells werepresent in the monkey cortex, especially in view ofE. W. Bough's behavioural demonstration of stereo-scopic depth perception in the monkey (Nature,1970,225:42-44).
In fifteen macaque monkeys we have exam-ined binocular interaction in 547 cells of area 18, atopographically ordered region anterior to area 17(the striate cortex). Parallel anatomical studiesshow that there is an ordered projection from area17 to area 18 on the same side; there is no evidencefor any direct input to 18 from the lateral genicu-late body3'4.
Recordings were made simultaneously froman extracellular electrode in each hemisphere .The main recording electrode was inserted intoarea 18, either in the posterior bank of the lunatesulcus or in the annectant gyrus, which is buried inthe lunate sulcus. An adjustable prism in front ofthe left eye allowed the relative directions of gazeof the two eyes to be varied. Eye movements werealmost completely prevented by the use of intra-venous curare and gallamine2. The second elec-trode monitored the eye positions and detected any
residual movements. A binocular unit was re-corded in area 17 and kept, if possible, for the dura-tion of the experiment. The receptive fields in thetwo eyes were mapped on a projection screen 1.5 maway. The field positions were checked each time anew unit was studied with the main recording elec-trode; eye movements could thus be detected andcorrected for immediately.
About half (57 per cent) of the cells in area 18react to simultaneous stimulation of the two eyes ina manner similar to that of complex and hypercom-plex cells of area 17 (ref. 6). We term these "ordinarycells of area 18". Most ordinary cells respondactively to either eye stimulated by itself, and theresponses of the two separate eyes are usually aboutequal. Receptive fields of these cells are in anatom-ically corresponding parts of the two retinas. Thereis often moderate summation when the two eyes arestimulated together, and the relatve positioning ofstimuli within the two fields is generally not criticalfor a cell to show maximum response.
Forty-three per cent of cells in 18 show morespecialized properties. We term these "binoculardepth cells". There are several distinct types ofbinocular depth cells; we describe here only themost common. In these, stimulation of either eyeseparately gives no response or only weakresponses, whereas appropriate stimulation of thetwo eyes together results in very brisk responses.Some of these cells respond best with the two eyes
From Nature, Vol. 225, No. 5227, 41-42, January 3, 1970.
Received November 4, 1969.

284 PART III NORMAL PHYSIOLOGY AND ANATOMY
Fig. 1. Responses of a cell recorded from area 18 in righthemisphere 12 mm lateral to the midline, on the anterior lipof the lunate sulcus about 3 mm in front of the 17-18 bound-ary. Cell was in layer 6. It responded best to a slit 1 ° long andVs wide, oriented 20° clockwise from the vertical. The recep-tive field was approximately 1° by 0-75° in size, and in theright eye was situated 1-75° below and 1° to the left of thefovea. In the left eye it was displaced, relative to this, 0-5° tothe right and slightly downwards. I: Both eyes stimulatedtogether in anatomically corresponding regions (A). In B-E,position of stimulus to left eye was horizontally displaced tothe right on the screen in steps of 15 min of arc. Maximumresponses were obtained with a displacement of 30 min. (Dis-placement was produced by shifting direction of gaze of lefteye to the left, with a prism.) Duration of each sweep was
lined up so that exactly corresponding retinalregions are stimulated simultaneously; in othersthere is a disparity in the positions of the two recep-tive fields. The displacement of the field in one eye,relative to the field in the other, is usually at rightangles to the receptive field orientation. Verticallyoriented fields are thus horizontally displaced,whereas with oblique fields there is a vertical com-ponent to the disparity as well. In binocular stimu-lation, when the position of one eye (or the prismsetting) is varied along a line at right angles to theorientation of the optimal stimulus (the receptivefield orientation), the response rises from zero orsome low value to a maximum and then falls offover a range that is usually very small comparedwith the dimensions of the receptive field. Varia-tion in position along a line parallel to the orienta-tion of the optimal stimulus gives a much moregradual rise and fall in response. Because of this,the responses of cells with obliquely oriented fieldsalso peak sharply when the prism displacement ispurely horizontal (Fig. 1). Binocular depth cellswith receptive fields oriented within 15° of the hor-izontal are much less common than one wouldexpect in a random distribution, and their re-sponses have not yet been adequately analysed.
The frequency with which one encountersbinocular depth cells varies in a systematic way inarea 18. Just in front of the 17-18 border and 10-15mm lateral to the midsagittal plane (representingthe vertical midline, 3°—4° below the fovea), mostcells are "ordinary"; many of these have fieldsstraddling the vertical midline. As one proceedsforwards and down into the lunate sulcus, and thenup over the buried annectant gyms, the retinal rep-resentation moves out from the midline. At thesame time, the proportion of binocular depth cellsincreases to more than 50 per cent. As an electrodetraverses the cortex, sequences of cells that are allordinary, or all of the binocular depth type, arerecorded; neighbouring binocular depth cells often
Fig. 1. (continued)4s. II A, Right eye, stimulated alone; B, left eye, stimulatedalone; C, both eyes, stimulus to left eye shifted 30 min to theright. Projection screen was 1-5 m away from the monkey.With eyes fixed on the screen, maximum response to a longobject moved in front of the animal occurred when the objectwas 0-5 m in front of the screen. For eyes fixed at infinity thiswould be equivalent to a stimulus about 3 mfrom the animal.

Encoding of Binocular Depth 285
have the same horizontal disparity, though varyingin orientation. This suggests an organization inwhich cells representing a given stereoscopic depthrelative to the surface of fixation are groupedtogether, and segregated from cells that are notparticularly concerned with depth. These group-ings may have the form of columns that extendfrom surface to white matter. There is probablyalso an independent system of columns containingareas of similar receptive field orientation as isfound in area 17 (ref. 6). Sequences of cells with thesame receptive field orientation are rather brief,suggesting that the orientation columns are verynarrow compared with the depth columns.
We have also studied hundreds of cells in area17, but have found no convincing examples ofbinocular depth cells. In this respect the monkeyseems to differ from the cat1'2. Possible differencesbetween binocular depth cells in cat area 17 andmonkey area 18 are the failure of most depth cellsin the monkey to respond to stimulation of eithereye alone, and the linking, in the monkey, of verti-cal disparity to receptive field orientation.
Area 18 in the monkey seems, therefore, tohave at least two independent functions, that oflinking the two visual half fields across the verticalmidline (as in the cat5'7), and the elaboration ofstereoscopic depth mechanisms. The parts of 18near the vertical meridian representation haveboth functions, whereas more peripheral areasprobably lack the first.
We thank Janet Wiitanen for technical assistance. This workwas supported in part by US National Institutes of Healthresearch grants and in part by the Bell Telephone ResearchLaboratories, Inc.
References
1. Barlow, H. B., Blakemore, C, and Pettigrew, J. D,/. Pfiys-iol., 193,327 (1967).
2. Nikara, T., Bishop, P. O., and Pettigrew, J. D., Expt. BrainRes., 6,353(1968).
3. Wilson, M. E., and Cragg, B. G.J. Anat., 101,677 (1967).4. Hubel, D. H., and Wiesel, T. N., Nature, 221, 747 (1969).5. Hubel, D. H., and Wiesel, T. N.,/. Neurophysiol., 30, 1561
(1967).6. Hubel, D. H., and Wiesel, T. N.,/. Physiol., 195,215 (1968).7. Choudhury, B. P., Whitteridge, D., and Wilson, M. E., Quart.
]. Exp. Physiol., 50,214 (1965).
AFTERWORD
In modern terminology this area was probably what is known as the V-3/V-3A complex, and not 18 or visual area 2 as we thought at the time. Thiswas long before the mapping out of primate visual regions beyond area 17,by Kaas and Allman in New World monkeys and by Zeki and Van Essen inmacaques. At that time, anything north of the 17-18 borders was terra incog-nita. We hesitated to write a full-length paper when we did not even knowfor sure what area we were recording from, even though we had recordedfrom more than 600 cells and reconstructed 23 penetrations with the resultstabulated and figures drawn, in what would have been a long paper even forus. Later Gian Poggio and Fisher had the insight to realize that the problemcould best be addressed in awake behaving monkeys that could be trained tofixate to levels of accuracy of minutes of arc (/ Neurophysiol 1977,40:1392-1405). We wrote this short Nature paper on our results and aban-doned our studies of stereopsis, returning to V-l to learn more about topicssuch as columns.

Chapter 17 • Anatomy of the Geniculo-CorticalPathway: The Nauta Method •
FOREWORD
The first phase of this work had been reported in a preliminary way inNature three years before. The research gave us the rare satisfaction oneexperiences on thinking up an experiment that should work, and it turns outthat it does work.
Our history with the Nauta method had its origin in the mid-1950s. Ihad met and become friends with Walle Nauta at Walter Reed, where heworked just down the hall. Neither Torsten nor I dreamed that one day wewould make such extensive use of an anatomical method that was reputed tobe forbiddingly difficult—we were, after all, not even trained anatomists.But one day, shortly after our move to Boston, James Sprague, a neu-roanatomist and a good friend—and an established expert in the Nautamethod—wrote from Philadelphia to tell us that his head technician, JaneChen, had to move to Boston for personal reasons: was there any chance wecould employ her? We thought it over and asked ourselves: Why not? Wecould probably think up uses for the Nauta silver-degeneration technique. Itwas the first of the new and powerful methods that were revolutionizing thefield of neuroanatomy. It was the first reliable method for telling where anygiven group of cells in the central nervous system sent their axons. WithJane's help we could make lesions here and there in the brains of our cats andmonkeys, wait a week for the axons of the killed cells to degenerate, and thendo one of our usual recording experiments—which usually had nothing todo with the anatomy/lesion experiment. We would then section the brain toidentify our electrode tracks, and also stain for degenerating fibers using themethods devised by Nauta, to find the terminals of the degenerating fibersthat resulted from our lesion. In that way we could get extra mileage out ofeach of our experimental animals. We took a chance. Jane arrived, full ofenergy, and was soon turning out hundreds of beautiful slides. Our firstlesions were made in cat striate cortex and allowed us to map some of theregions to which the striate cortex projected. Those results are included inour long paper on areas 18 and 19 of the cat.
286

Anatomy of the Geniculo-Cortical Pathway 287
We then had our exciting idea. We were already making tiny elec-trolytic lesions to identify our recording sites. Why not record from the mon-key's lateral geniculate body, identify the layer our electrode tip was in bynoting which eye produced the responses, make a lesion, wait the necessarydays for fiber degeneration to occur, and use the Nauta method to reveal thedegenerated projections to the cortex? That way we might hope to bring outanatomically the ocular dominance columns, whose existence we increas-ingly suspected, especially following our cat strabismus experiments in 1965(see below). Perhaps we could confirm our suspicions that these were stripesrather than checkerboard-like patches. The Nauta method had recentlybeen modified by Fink and Heimer to reveal degenerating nerve terminalsrather than degenerating fibers, making the final destinations of the fiberseasier to determine. (Degenerating fibers tend to obscure degenerating ter-minals.) The Fink-Heimer method had not been adapted for use in mon-keys, but here again we were lucky. Jane Chen had to leave, but was replacedby Janet Tobie (later Wiitanen), who was a paragon of neatness and obsessivepersistence. By varying concentrations of every possible reagent, she got themethod to work beautifully in monkeys. We worried over two possibleobstacles: a lesion would have to be very small for it to be confined to a sin-gle geniculate layer, but big enough to produce cortical degeneration that wecould detect, over a wide enough cortical area to include at least severalcolumns; second, we wondered if projections from one layer would not becontaminated by fibers passing up from deeper layers. Both problems provedsurmountable, but at the start we had no assurance of success. At least theexperiments were taking very little additional time, and no additionalanimals.
None of this work would ever have been approved by an Eye Institutestudy section. We had no experience in neuroanatomy, let alone the Nautamethod, and no preliminary results. But the experiments cost us nothingover what we were paying for our usual experiments. And we had no assur-ance that the microlesion-plus-Nauta strategy would work.
We were lucky. In one of our first attempts the electrode passedobliquely along the most dorsal geniculate layer, and by listening toresponses of unresolved cells we could make lesion after lesion as the elec-trode advanced, resulting in a nice long cigar-shaped area of destruction con-fined to the one layer. So it turned out that we could after all make ratherlarge lesions. Our first glimpse of a cross-section through striate cortex (likethat of Fig. 2) was one of those hugely satisfying treats when it is clear thateverything has, after all, really worked. It took much labor to align, trace andreconstruct the sections, but the final picture of parallel stripes completelyconvinced us that the columns were in fact stripes. The fiber-of-passageproblem solved itself by the obliquity of the trajectory that most fibers takeafter they leave their layer of origin.
But there was another pay off, probably just as important and com-pletely unforeseen. Until then, no one knew which cortical layers receivedthe geniculo-cortical inputs. It was widely assumed that the site of termina-

288 PART III NORMAL PHYSIOLOGY AND ANATOMY
tion was the cell-sparse myelin-rich Line of Germari, the component of layer4 that gives the striatedness to the striate cortex on a freshly cut section. Butour result showed quite unexpectedly that the Line of Gennari is virtuallyfree of geniculate terminals. There had been one previous hint of this: LeGros Clark and Sunderland had years before undercut the striate cortex andfailed to see the loss of myelin that would be expected in this layer because ofcutting the incoming geniculate fibres. (/. Anat., 73: 563-574) For some rea-son their finding had been largely ignored.
When we first looked closely at the sections we could hardly believe oureyes. Instead of occupying the Gennari line, the terminals from the twogeniculate subdivisions, the magnocellular and parvocellular, were distrib-uted in quite distinct and separate sublayers just below the Gennari line.Endings from the parvocellular layers formed a dense thicket in the deephalf of the cell-rich part of layer 4, and those from the magnocellular layersoccupied the superficial half. From parvocellular geniculate we found a sec-ond thin layer lying just above the Gennari line in what we called the uppertier. The magnocellular and parvocellular sublayers of degeneration in layer4C did not overlap at all. It took some Nissl counterstaining and careful com-parisons to convince us of this palpable difference between the two inputs. Inpresent day terminology of Jennifer Lund we say the magnocellular input isto 4C-alpha, and the parvocellular input to 4C-beta and 4A (/. Comp. Neu-rol 147:455-496).
Laminar and Columnar Distribution of Geniculo-Cortical Fibers inthe Macaque Monkey
DAVID H. HUBEL AND TORSTEN N. WIESEL • Department of Neurobiology, Harvard Medical School, 25
Shattuck Street, Boston, Massachusetts
ABSTRACT
Single cell recordings in monkey striate cortex have shown differences in response properties fromone cell layer to the next and have also shown that the I Vth layer, which receives most of its inputfrom the geniculate, is subdivided into a mosaic of regions, some connected to the left eye, others tothe right. In the present study small lesions were made in single layers or pairs of layers in the lateralgeniculate body, and the striate cortex was later examined with a Fink-Heimer modification of theNauta method. We hoped to correlate the laminar distribution of axon terminals in the cortex withfunctional differences between layers, and to demonstrate the IVth-layer mosaic anatomically.
After lesions in either of the two most dorsal (parvocellular) layers, terminal degeneration wasfound mainly in layer IVc, with a second minor input to a narrow band in the upper part of IVa. Avery few degenerating fibers ascended to layer I. In contrast, lesions in either of the two ventral (mag-
From the Journal of Comparative Neurology Vol. 146, No. 4, December 1972.

Anatomy of the Geniculo-Cortical Pathway 289
nocellular) layers were followed by terminal degeneration confined, apparently, to IVb, or at timesextending for a short distance into the upper part of IVc; no degeneration was seen in layer IVa or inlayer I.
After a lesion confined to a single geniculate layer, a section through the corresponding regionof striate cortex showed discrete areas or bands of degeneration in layer IV, usually 0.5—1.0 mm long,separated by interbands of about the same extent in which there was no terminal degeneration.When serial sections were reconstructed to obtain a face-on view of the layer-IV mosaic, it appearedas a series of regular, parallel, alternating degeneration-rich and degeneration-poor stripes. When ageniculate lesion involved both layer VI (the most dorsal, with input from the contralateral eye) andthe part of layer V directly below (ipsilateral eye), the cortical degeneration, as expected, occupied avirtually continuous strip in layer IVc and the reconstructed face-on view of this layer showed a largeconfluent region of degeneration.
In some of the reconstructions the cortical stripes seemed highly regular; in others there was avariable amount of cross connection between stripes. The stripes varied in width from 0.25 to 0.50mm, and width did not seem to correlate with region of retinal representation.
It is concluded that the long narrow stripes of alternating left-eye and right-eye input to layerIV are an anatomical counterpart of the physiologically observed ocular-dominance columns.Because of this segregation of inputs, cells of layer IV are almost invariably influenced by one eyeonly. A cell above or below layer IV will be dominated by the eye supplying the nearest IVth layerstripe, but will generally, though not always, receive a subsidiary input from the other eye, presum-ably by diagonal connections from the nearest stripes supplied by that eye.
A glance at a section through the cerebral cortexshows that it is subdivided into alternately cellsparse and cell rich horizontal layers. This subdivi-sion is especially striking in the primary visual, orstriate, cortex (area 17) of the monkey. By record-ing from single cells in this area it has been possibleto demonstrate clear differences in responses tovisual stimuli from the different layers. Not sur-prisingly, cells of layer IV, which is the site of ter-mination of afferents from the lateral geniculatebody, have the simplest properties and show theleast intermingling of inputs from the two eyes.The more complex cell-types, for the most partbinocularly driven, are found in layers above andbelow. In its structure layer IV is itself non-uniform, consisting of several distinct subdivisions;up to the time of the present study the exact distri-bution of the afferent endings within this layer wasnot known, though this is of obvious importancefor an interpretation of the physiology.
Physiological studies have shown that the cor-tex is also parcelled by vertical partitions into atleast two independent but overlapping systems ofcolumns (Hubel and Wiesel, '68). In the first ofthese, cells with similar orientation preference aregrouped together. In the second system, cells aregrouped according to eye dominance, the cells ofone column mostly favoring the left eye, those ofthe next the right. Layer IV, whose cells are strictly
monocular, is thus divided into a mosaic of left-eyeand right-eye patches. While it has long beenknown that cells deep to a given point on the corti-cal surface are richly interconnected, there hasbeen no hint from the anatomy that the intercon-nected cells occur in discrete groupings.
The primary object of the present work wasto demonstrate the ocular-dominance columnsanatomically. We were anxious to have the satisfac-tion of actually seeing the mosaic whose existencethe physiology suggested, and wanted especially tolearn if it had the form of a checkerboard, or ofislands of one type embedded in a matrix of theother type, or of alternating left-eye and right-eyestripes.
The following method of demonstrating theocular-dominance columns occurred to us. A lesionin the lateral geniculate body leads to degenerationof thalamocortical axons and axon terminals thatcan then be selectively stained by silver-impregna-tion methods. The geniculate consists of six cell lay-ers, each of which receives input from one eye only.If a lesion could be confined to a single geniculatelayer there might be some hope of seeing the pre-dicted patchy distribution of degenerating axon ter-minals entering the cortex. By using extracellularmicroelectrodes it should be possible to ascertainthe position of the electrode tip by single-cellrecording and then to make small lesions by passing

290 PART III NORMAL PHYSIOLOGY AND ANATOMY
current. Among silver-degeneration methods, theFink-Heimer modification of the Nauta method
seemed especially suitable, since it stains not only
degenerating axons, but also what are almost cer-
tainly degenerating presynaptic terminals.
Such an experimental approach promised not
only to outline the ocular-dominance columns, but
also to show the exact distribution of the afferent
terminals within layer IV of the cortex. It also
opened the possibility of comparing the termina-
tions of axons from the four dorsal geniculate layers
with those from the two ventral layers, a matter of
some interest because the two sets of layers differ
both in their morphological appearance and their
physiological properties (Wiesel and Hubel, '66). A
preliminary account of some of this work has
already been published (Hubel and Wiesel, '69).
METHODS
Eighteen monkeys were used, but not all lesions weresuitably placed and for unknown reasons the stainingwas unsatisfactory in some animals. In all, 12 successfullesions were made, and complete reconstructions of theresulting intracortical fiber degeneration were made foreight of these. Survival times were 4-6 days.
The animal was anesthetized with thiopental andprepared for recording in the usual way (Hubel andWiesel, '68), except that no neuromuscular blockingagent was used and intubation and artificial respirationwere therefore not necessary. Tungsten microelectrodeswith a shaft diameter of 125 JJ, were tapered to a tip of lessthan 1 |J, over a distance of about 1 cm, and had an unin-sulated tip length of 35 |Ll. The electrode was insertedinto the lateral geniculate body either vertically, throughthe folds of cortex and white matter directly above, or inthe coronal plane at an angle of 45° to the vertical. It wasusually possible to tell where the electrode tip was inrelation to the layers by observing successive changes inthe eye from which cells could be driven. On passingfrom the third to the second layer there was of course nochange in the eye from which responses were evoked,but one could recognize the point of transition by thechanges in response properties and receptive-field char-acteristics of single cells (Wiesel and Hubel, '66). By low-ering and raising the electrode, the depths correspondingto the point of entering or leaving a given layer weredetermined. A large lesion or a series of lesions was thenmade between these points. When several lesions weremade along a track they were spaced closely enough toproduce a single long cigar-shaped lesion. This was anespecially useful method when the electrode entered thelateral geniculate obliquely and advanced for some dis-tance parallel to a single layer (fig. 8a).
Before the lesions were made the position of genic-ulate-cell receptive fields was noted on the projectionscreen, relative to the center of gaze. Because of eyemovements it was usually possible to do this only towithin a degree or so. From the receptive-field positionsthe site of the lesion in the geniculate could be estimated,and one could predict the region of striate cortex inwhich degenerating fibers would be found.
After perfusion-fixation with 10% formol-saline thecortex was cut in parasagittal serial frozen sections at 30|4,, and stained by a variant of the Nauta method (Nautaand Gygax, '54; Fink and Heimer, '67; Wiitanen, '69).The lateral geniculate body was sectioned in the coronalplane and alternate sections stained for Nissl substanceor for degenerating fibers.
Degenerating fibers appeared, as in any Nautapreparation, as chains of black dots or black elongatedparticles about 2-4 (4, in diameter that could usually befollowed as long as the fiber remained in the plane of sec-tion. What we assumed were degenerating synaptic end-ings appeared as round dark-staining particles, alsoabout 1-2 |J, in diameter, peppered at random through-out sharply demarcated regions (see below) rather thanin orderly chains. These dots could possibly be confusedwith background dust that is often found in these stains,but the dust, when it occurred, was much finer in consis-tency and was widely distributed throughout each sec-tion. The great majority of sections were fortunatelyalmost totally free of this dust. It should be emphasized,however, that the main weakness of this method is theimpossibility of knowing for certain whether any partic-ular dot is a degenerating terminal: the recognition ofendings must depend mainly on their grouping. In thepresent material the endings in layers IVa and IVc wereso strikingly dense as to leave little doubt to their identi-fication. On the other hand, it is not possible to say thatthere were no degenerated endings in the other layers.The proof that the large particles are presynaptic termi-nals will depend ultimately on electron microscopy. Sim-ilar particles in other material have in fact been so iden-tified (Heimer and Peters, '68). While in the descriptionsgiven below we shall refer to the particles as boutons,omitting quotation marks or qualifications, the absenceof a rigorous identification should be borne in mind. Animportant feature of this modified Nauta stain is the easewith which (at least in the system in which we wereworking) the boutons were sharply distinguishable fromdegenerating fibers. The very feasibility of the presentstudy depends on this distinction.
Fibers of PassageA lesion in any but the most ventral geniculate
layer will not only destroy cells, but also, presum-
ably, geniculo-cortical fibers passing through the
lesion site from the layers below. There was a risk

Anatomy of the Geniculo-Cortical Pathway 291
that destruction of these fibers of passage mighthopelessly contaminate the degeneration arisingfrom destruction of cell bodies. As the geniculateaxons leave a given layer, however, they tend to fanout, crossing the more dorsal layers not radially,along corresponding points in the successiveretinotopic maps (lines of projection), but along themost direct route upwards and posteriorly. A lesionin a given layer might therefore be expected to leadto a dense and focal cortical projection due to cell-body destruction, and a more diffuse projectiondue to interruption of fibers of passage. Theobserved thalamo-cortical projections in fact tookthis form, with a main focus of dense degenerationoccupying a restricted region a few millimeters indiameter, and a region of much lighter degenera-tion usually extending for many millimeters alongthe cortex, generally only on one side of the mainfocus and resembling the tail of a comet. In recon-structing lesions or determining the cortical lami-nar distribution of afferents, this sparse projectionwas ignored. As would be expected, lesions of themost ventral layer showed only the dense focus,with no comet tail.
ReconstructionsOnce the region of cortical degeneration was foundit was necessary to make a detailed reconstruction.Negative enlargements (X 33) were made directlyfrom each slide, and the regions showing terminaldegeneration, as seen by microscopic examination,were indicated on the print in ink. Small blood ves-sels and other features that appeared on theenlargement were used as a guide in positioningthese marks (see Fig. 9). The regions of layer IVbor IVc showing degenerating terminals were thentraced onto 1 mm lined tracing paper, using a newline for each successive section. Blood vessels wereused in bringing successive sections into register.(Where the cortex was curved it was obviously nec-essary to straighten, in effect, layer IV; this wasdone by dividing it into a number of segments).The result was a face-on view of layer IV magni-fied 33 times. No attempt was made to correct forshrinkage, but comparisons of cortical thicknesssuggested that it did not differ grossly from onebrain to the next. To assess the sites of terminationof afferent fibers relative to the cortical layering,occasional sildes were counterstained with cresyl-violet.
RESULTS
Of the 12 lesions, seven were in the dorsal (parvo-cellular) part of the geniculate, and five were in theventral (magnocellular) part. No lesions were madein dorsal layers 3 and 4 and, while it seems highlylikely that these layers project in the same way as theupper two parvocellular layers, studies are nowunder way to verify this. The lesions were scatteredwidely through the geniculate, two being within adegree or two of the foveal representation, eight inthe midperiphery, and two in areas representing thefar periphery, 50—80° from the fovea. The positionof each of the lesions is given in Table 1.
The occipital cortex, and cortex associatedwith the lunate and superior temporal sulci wereexamined. No degeneration was seen outside thestriate cortex.
For the present paper we have adopted Brod-mann's layering system for the striate cortex. Asuperficial inspection of the Nissl-stained Macaquearea 17 (Fig. 1) shows it to be composed of threecell-sparse layers alternating with three cell-denselayers. In Brodmann's system the cell sparse layersare I, IVb and V; the cell dense layers are II, III andIVa (which appear as a single layer in theMacaque), IVc, and VI. In previous papers (Hubeland Wiesel, '68, '69) we saw no justification for sep-arating layers III and IVa, since we did not realizethat geniculate afferents reach the lower part of theuppermost cell-dense region (II, III, IVa). Wetherefore adopted von Bonm's layering system,which makes no distinction between III and IVa.The results of the present work show that someafferents indeed ascend further than was previ-ously realized, ending in the lower portions of theupper cell-dense region. We have thereforereverted to Broadmann's system, calling this regionIVa even though it cannot easily be distinguishedfrom layer III in Nissl preparations.
Laminar Distribution of Afferent Fibers
LESIONS OF DORSAL (PARVOCELLULAR) GENICULATELAYERS The laminar distribution of degeneratingafferents following a dorsal-layer geniculate lesionformed a highly consistent pattern in the sevenmonkeys. Figure 2, from monkey 12, shows thedegenerating fibers and terminals in a section thatwas not counterstained. Degenerating fibersentered from the white matter with uniform den-sity throughout the entire main focus, criss-cross-

292 PART III NORMAL PHYSIOLOGY AND ANATOMY
Table 1
RECEPTIVE-FIELD POSITIONS RELATIVE
TO FOVEAL PROJECTION
Monkeynumber
89
11121415161933363741
Layer ofLGB lesion
Dorsal (6)Dorsal (6)Ventral (2)Dorsal (6)Dorsal (5, 6)Dorsal (5)Dorsal (6)Ventral (1,2)Dorsal (3), Ventral (2)Ventral (1)Ventral (1,2)Ventral (1)
Vertical1
-2.5°8.5°
4°-9°-8°
0°-10°-30°
2°6°
-1°
TotalHorizontal distance
4.5°11°10°10°12°0°20°40°10°13°
2.5°
5°13.5°10°14°14.5°0°22.5°50°10°14.5°40-90°3°
Period of Figurestripes number
mm1.2
0.70.60.80.7
0.5
0.5
14
2,5,15
16
6,
3, 7-1011-13
17
'Negative numbers indicate field positions below the foveal projection.
ing diagonally in all directions and apparentlybranching as they ascended through layers VI andV, but giving off no obvious terminal arborizations.In IVc fibers were also abundant, but they wereprobably slightly thinner at this level. Here, how-ever, there was a sudden very dense aggregation ofdegenerating boutons, so dense that at first glanceit tended to obscure the fibers. The position of theseendings relative to the layering is shown in a Nissl-counterstained section in figure 3. The boutonsappeared abruptly at the base of IVc (which inNissl sections is sharply demarcated from layer V),and showed a uniform density over its lower two-thirds, becoming gradually less dense in the upperthird, paralleling, more or less, the decline in celldensity. There were very few boutons within theuppermost part of IVc, and none in IVb. LayersIVb and IVc showed considerable numbers ofdegenerating fibers, perhaps one-third the numberthat were seen in the deeper layers.
In layer IVa there was another horizontalband of degenerating boutons, thinner than theband in IVc (roughly 1/4 the thickness, or about 30|J.), and less dense (fig. 2). Counterstained sections(Fig. 3B) showed that this upper tier of degenera-tion was not situated immediately above layer IVb,i.e., not right at the base of the cell-dense II-III-IVacomplex, but somewhat above this level.
Although Nissl and myelin stains showed nohint of a separate layering correlated with thisupper tier of degeneration, the Fink-Heimer mate-rial often showed a faint but clear line precisely atthis level, that appeared as a white band in the neg-ative prints (Figs. 9, 12, arrows). The line was seenboth within the focus of degeneration and well out-side it, in the normal cortex, and so could not havebeen produced by degenerating fibers or endings.We do not know what is being stained to produce it.
Although Nissl stains of Macaque area 17showed nothing that would correlate with thisupper tier, favorable sections of Ateles striate cortexshow a cell-sparse lamina in roughly the sameregion (Fig. 4). A similar lamination was noted byvon Bonin in Cercocebus and Cebus monkeys ('42,Figs. 7, 8). It would be interesting to make genicu-late lesions in the New-World monkeys in order tosee how the upper tier, if there is one, correlateswith the more elaborate layering pattern.
Above the upper tier of degeneration an occa-sional degenerating fiber was seen running verti-cally. In lesions that produced the densest degener-ation (such as that in monkey 14) an occasionalfiber ran all the way to layer I, and then turned, ordivided in the form of a T, the branches runninghorizontally precisely in the middle of the firstlayer (Fig. 5). On an occasional section, two or

0.5mm
Fig. 1. Nissl- (cresyl-fiolet) (A) and myelin-(Loyez) (B) stained sections through striate cortex (area 17) ofMacaque monkey to show the layering system used in this paper. The Nissl stain shows three cell-sparse regions,layers I, IVb and V, and three cell-dense regions, layers II, III and IVa collectively, layer We, and layer VI. The
line ofGennan is roughly located in layer IVb.
293

294 PART III NORMAL PHYSIOLOGY AND ANATOMY
Figs. 2A, 2B. Low and high power photographs of a Fin^-Heimer stained section through the striate cortex ofmonkey 12 in which a microelectrode lesion had been made in LGR layer 6, four days prior to perfusion (seeTable I and Figs. 3, 7-10). Degenerating fibers ascend diagonally through layers VI and V, and presumablybranch extensively in IVc, which is densely loaded with boutons. A moderate number of fibers ascend furtherthrough layer IVb to IVa, where more boutons are seen, (continued)
three such horizontal fibers could be seen runningclosely spaced at this level for at least 0.5 mm beforeleaving the plane of section. At least one or twosuch fibers were seen on each section in monkey 14,undoubtedly because the lesion in this animal wasrelatively large. Very rarely, a vertical fiber on its
way to layer I could be seen emitting a horizontalbranch in layers II or III.
In summary, there appears to be a three-folddistribution of endings from the dorsal (parvocel-lular) layers of the lateral geniculate to area 17: adense thicket of terminals in IVc, a second much

Anatomy of the Geniculo-Cortical Pathway 295
Fig. 2B.
smaller but still substantial outcropping in IVa,and a third very sparse set of fibers running in themidthickness of layer I, whose terminals were notseen. One cannot, of course, rule out a scanty dis-tribution of endings, or the presence of very fineendings, in layers II, III, V, or VI.
LESIONS OF VENTRAL (MAGNOCELLULAR) GENICU-LATE LAYERS A different distribution of degenerat-ing endings was seen following lesions of the ven-tral layers. Figure 6 shows the results of a lesion in
the most ventral layer (cf. Fig. 17, monkey 41). Asbefore, obliquely running fibers threaded their wayup through layer VI and V but instead of producinga dense mass of boutons in IVc, they bypassed thislayer in its lower portions. There was a dense layerof terminal particles in the deeper half of IVb,extending into IVc for a distance that varied frombrain to brain. The very cell-dense part of IVc waseither spared entirely or was occupied only in itsupper one-third or one-half. Precise estimates of theregions involved are made difficult by the lack of

296 PART III NORMAL PHYSIOLOGY AND ANATOMY
0.2mm
Figs. 3A, 3B, 3C. Counterstamed Fin^Heimer section showing relationship between distribution of degener-ated boutons and the cytoarchitecture. A, low power, B and C, high power of enclosed areas. Same monkey asin Figure 2. (continued)
sharpness in the boundaries between these layers.What was clear, however, was that following everyventral-layer lesion the region occupied by the
degenerating terminals was at a higher level thanthe degeneration following dorsal-layer lesions.Results from the two ventral-layer experiments inwhich the staining was of best quality suggest thatin some monkeys the two sites of termination maynot overlap at all (compare Figs. 3C, 6B).
Layers above IVb and IVc showed no degen-erating fibers and no hint of terminals; there wasthus no obvious upper tier of degeneration follow-ing ventral-layer lesions. The ventral layers of thegeniculate are much thinner than the dorsal ones,and presumably as a consequence of this the corti-cal degeneration was considerably less dense thanthat following lesions in the dorsal layers. Since inthe dorsal-layer lesions the upper tier of degenera-

Figs. 3B, C.
297
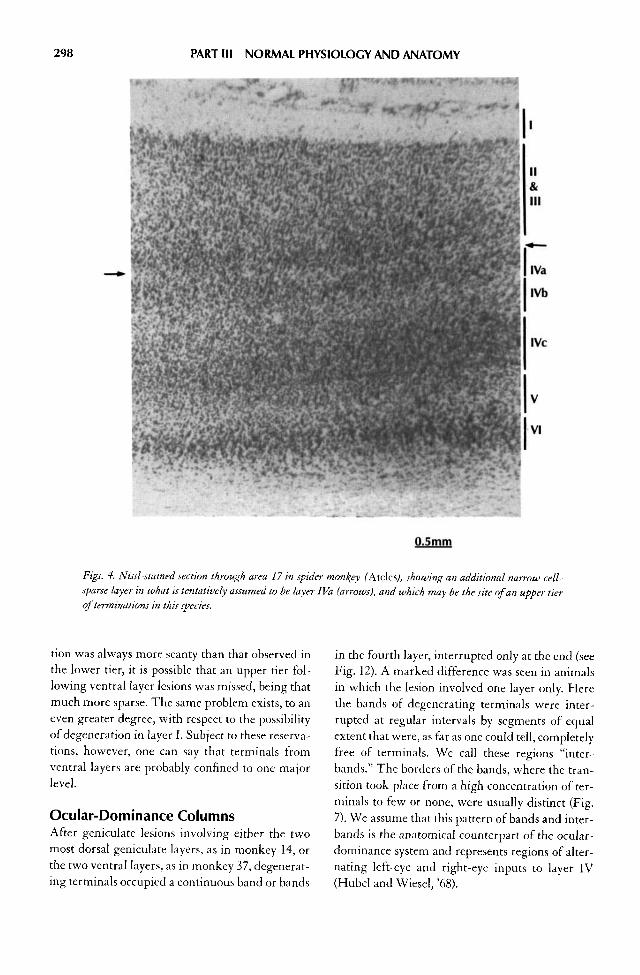
298 PART III NORMAL PHYSIOLOGY AND ANATOMY
Figs. 4. Nissl-stained section through area 17 in spider monkey (Aides), showing an additional narrow cell-sparse layer in what is tentatively assumed to be layer IVa (arrows), and which may be the site of an upper tierof terminations in this species.
don was always more scanty than that observed inthe lower tier, it is possible that an upper tier fol-lowing ventral layer lesions was missed, being thatmuch more sparse. The same problem exists, to aneven greater degree, with respect to the possibilityof degeneration in layer I. Subject to these reserva-tions, however, one can say that terminals fromventral layers are probably confined to one majorlevel.
Ocular-Dominance ColumnsAfter geniculate lesions involving either the twomost dorsal geniculate layers, as in monkey 14, orthe two ventral layers, as in monkey 37, degenerat-ing terminals occupied a continuous band or bands
in the fourth layer, interrupted only at the end (seeFig. 12). A marked difference was seen in animalsin which the lesion involved one layer only. Herethe bands of degenerating terminals were inter-rupted at regular intervals by segments of equalextent that were, as far as one could tell, completelyfree of terminals. We call these regions "inter-bands." The borders of the bands, where the tran-sition took place from a high concentration of ter-minals to few or none, were usually distinct (Fig.7). We assume that this pattern of bands and inter-bands is the anatomical counterpart of the ocular-dominance system and represents regions of alter-nating left-eye and right-eye inputs to layer IV(Hubel and Wiesel, '68).

Anatomy of the Geniculo-Cortical Pathway 299
Figs. 5A, 5B. Two photomicrographs from upper part of cortex in monkey 14 (see also Figs. 11-13). One or twofibers ascend vertically through layers III and II, branch a few times in II and I and then run horizontallythrough the middle of layer I. Fint^-Heimer stain.
In the smallest lesions, such as that made inmonkey 8 (Fig. 14) a single cortical section showedonly one or two patches of degeneration, whereaswith longer lesions there were as many as 6—8 setsof bands and interbands (Figs. 8—10). Following alesion of a dorsal layer, the band appeared as beforein layers IVa and IVc. Here, as a rule, the bandsand interbands lay in register one above the other,though this pattern was sometimes distorted when
the cortex was markedly curved or was cut in aplane that was not perpendicular to the surface.
The degenerating fibers entering cortex fromwhite matter did so rather uniformly and criss-crossing fibers were present throughout layers VIand V. It was as if a fiber only decided on its desti-nation after entering the cortex, and took a diagonalcourse in the deeper layers in order to get to anappropriate band or interband in layer IV. In the

300 PART III NORMAL PHYSIOLOGY AND ANATOMY
Fig. 5B.
interbands of layer IV there were many horizon-tally or diagonally running degenerating geniculatefibers, perhaps as many as in the bands themselves.These seemed frequently to be spanning the gapbetween one band and its neighbor, supplyingbranches and terminals in the bands but none at allin the interbands. Layer I Vb, though having few orno terminals, nevertheless showed numbers ofdegenerating fibers, running mostly vertically orobliquely, in about the same numbers over the bandsas over the interbands. It is perhaps worth empha-sizing that degenerating fibers in a given layer werefairly uniform in their horizontal distribution, sothat the conventional Nauta method, staining fibersbut not terminals, would not necessarily havedemonstrated the columnar organization.
Horizontal Distribution ofDegeneration: Reconstruction ofColumns from Serial SectionsThe most extensive lesion confined to a single layerwas seen in monkey 12 (Figs. 8, 9). Here the elec-trode entered layer 6 of the left lateral geniculate at
its medial aspect, and lesions were made over a dis-tance of 1 mm. The initial receptive fields werelocated in the visual field 9° below the horizontal,and 10° from the vertical midline, and as the elec-trode advanced these moved out and down. Asexpected from the known topography, the result-ing degeneration appeared in the anterior corner ofthe mushroom-like buried calcarine cortex, occu-pying a region of cortex measuring about 4 mm X 8mm. Each section showed some six to eight bandsof degeneration. In the final reconstruction (Fig.10) the degeneration in layer IVc took the form ofa series of more or less distinct parallel stripes,roughly 0.35 mm wide, separated by spaces ofroughly the same width. The definition of thestripes is best on the right of the figure (anteriorly)and becomes progressively poorer towards the leftof the map. This parallels the abrupt beginning ofthe degeneration anteriorly and a gradual taperingoff posteriorly. In terms of topography, the point ofentry of the electrode into the geniculate corre-sponds to the anterior boundary of the corticaldegeneration. It is likely, therefore, that the lesion

Anatomy of the Geniculo-Cortical Pathway 301
0.2mm
Figs. 6A, 6B. Law and high-power photographs showing distribution of degenerating terminals following a ven-tral-layer geniculate lesion (layer 1) in monkey 41. Degenerating terminals are confined to cortical layer IVb inits deeper half, for the most part. Fin\-Heimer counterstained section.
caught fibers of passage from deeper layers des-tined for the most posterior part of the degenera-tion area.
The stripes are not entirely independent, butin places are cross-linked to their neighbors. Theoriginal slides were rechecked carefully and it wasverified that two neighboring stripes do at timescoalesce, and that single stripes in places split toform two. The reciprocal situation, of a stripebeing interrupted by coalescence of two interspaces
(representing the other eye) was not seen in thisexperiment but was very common in one of theothers (monkey 41, Fig. 17).
If destruction confined to one geniculatelayer, corresponding to one eye, gives stripes of cor-tical degeneration separated by equal blank spaces,the assumption is that the blank spaces representthe destination of fibers linked to the other eye.Since the maps from the contralateral half visualfield in the different geniculate layers are in exact

302 PART III NORMAL PHYSIOLOGY AND ANATOMY
Fig. 6B.
register a lesion involving layer 6 and layer 5directly beneath should give a continuous patch ofdegeneration, rather than a series of stripes. Thelesion in monkey 14 (Figs. 11—13) was designed totest this. Here the electrode entered the geniculatein almost the same place as in the previous monkey(12), with the initial receptive fields situated about8° below the horizontal and 12° out from the mid-line. This time the lesion was extended into layer 5,the final fields being 15° out and 19° down in thevisual field. The cortical area showing terminaldegeneration was found in almost exactly the samepart of area 17, but now in most sections there wasa long continuous strip of degeneration in layersIVc and IVa, interrupted only at the two ends. Thereconstruction showed a dense elongated central
patch of degeneration, with a suggestion of stripeson both sides. We assume that the continuous bandof degeneration reflects the destruction of genicu-late cells lying in the two most dorsal layers alongthe same radial projection lines, and therefore rep-resenting the same region of visual field, whereasthe stripes to the upper left and lower right in thefigure arise because at the beginning of the lesionthe sixth (most dorsal) layer was involved withoutcorresponding involvement of the fifth, and simi-larly at the end, the fifth was injured without aninvolvement of the corresponding part of the sixth.Thus a stripe beginning in the upper left shouldcontinue into an interband in the lower right:unfortunately the method is not good enough, orthe stripes themselves are not quite orderly

Anatomy of the Geniculo-Cortical Pathway 303
0.2mm
Figs. 7A, 7B. Terminal degeneration following lesion of a dorsal geniculate layer (layer 6) showing boundarybetween a band, to the left, and an interband, to the right. Note abruptness of the transition in both the upperand lower tiers of degeneration (layers IVa and IVc), the fact that the transition points lie roughly one above theother. Monkey 12. Fint^-Heimer stain.
enough, for one to be sure of this, given the size ofthe dense overlapping region.
It may be worth noting that the direction ofthe stripes in the first experiment, and the directionsuggested by the second, are almost identical. Thisraises the question of whether the stripes alwayshave the same direction in a given part of the cor-tex, and whether they bear any constant relation-ship to the coordinates of the visual field, parallel-
ing the horizontal or vertical meridians, or lyingalong circles concentric about the fovea, for exam-ple. The material we have so far is too scanty andthe lesions too widely spread through the visualfields to allow us to answer this.
The results from two other dorsal-layerlesions (monkeys 8, 15) are shown in figures 14 and15. These were close to, and probably within, thefoveal region.

304
Fig. 7B.
Two ventral layer lesions are illustrated inFigures 16 and 17. The layer-1 lesion in monkey 36(Fig. 16) was in the superior visual-field represen-tation (lateral aspect of geniculate, posterior half ofcalcarine cortex). That of monkey 41 (Fig. 17) wasalso in the most ventral layer, in the region receiv-ing input from an area 2-3° from the fovea, close tothe horizontal meridian. The pattern in this mon-key was again striped, in some sense, but here thetendency for interlacing and cross links was verymarked, and was seen in both the areas of degener-ation and in the spaces between.
We were interested in learning whether therewas any obvious relationship between the widthsof the bands of degeneration, i.e., the period of thealternating stripes, and the distance of the visual-field representation from the fovea. The magnifi-cation factor, or degrees of visual field per millime-ter of cortex (Daniel and Whitteridge, '61) is wellknown to be related to distance from fovea, so thatour question was the same as asking whether thestripe periodicity was constant in terms of millime-ters along cortex, or in terms of degrees of visualfield. The apparent period of stripes varied from
PART III NORMAL PHYSIOLOGY AND ANATOMY

Anatomy of the Geniculo-Cortical Pathway 305
Figure 8A Figure 8B
Fig. 8A. Tracing of left lateral gemculate body in monkey 12 to show the extent of the lesion in the most dorsallayer. Coronal section. Left is lateral, c, input from contralateral eye; i, input from ipsilateral eye.
Fig. 8B. Site of degeneration in left striate cortex of some monkey. Parasagittal section about 1 cm frommidlme, left is posterior. Shading indicates region with degenerating terminals.
about 0.5 mm for monkeys 36 and 41, up to 1.2 mmfor lesion monkey 8. These measurements aretaken from the frozen-section Nauta-degenerationslides, and have not been corrected for shrinkage.It is common experience that shrinkage may besubstantial, up to 30% or more, in linear dimen-sions, and is far from constant from brain to brainor even in the same brain. Furthermore, theprocess of reconstruction may have led to distor-tions that could influence stripe width. But fromthe present material one can say that, at least inorder of magnitude, the stripe periods were from0.5 to 1.0 mm or slightly more, and that there wasno obvious systematic variation in stripe widthover the cortex, certainly none that would be com-parable with the variation in magnification factoror in the size of cortical receptive fields. For exam-ple, Daniel and Whitteridge ('61, Fig. 4) found thatin the fovea 1° is represented by about 6 mm of cor-tex, whereas about 15° from the fovea 1° occupiesroughly 0.2-0.3 mm. If the stripe widths had var-ied by a factor of 20—30 this would surely have beendetected in the present study.
DISCUSSION
The findings of this paper are of two differentkinds, one having to do with the distribution in thestriate cortex of terminals from the magnocellularand parvocellular geniculate layers, the other withthe anatomical identification of the ocular-domi-nance columns and a description of their three-dimensional shape. The first of these represents astep towards understanding the wiring of the stri-ate cortex, for clearly, not even a rudimentarydescription can exist if the site of terminations ofthe afferents is not known to the nearest layer, or ifit is not appreciated that the two main subdivisionsof the geniculate project to different corticalregions, or if, to take another example, a structureas conspicuous as the line of Gennari is erroneously(and despite the study of Clark and Sunderland,'39) thought to consist largely of afferent fibers.This is not to say that with the present study theinput end of the wiring diagram of the striate cor-tex is by any means solved. Perhaps the most seri-ous gap in our knowledge of area 17's morphology

Fig. 9. Enlargement made directly from one pamsagittal section through the occipital lobe in the region ofdegeneration in monkey 12 (Fig. 8). (Light areas are dar\ on the original slide.) The areas showing degenera-
tion have been dotted in. A complete set of photographs such as this was used to mafy the reconstruction shown
m Figure 10. Note the pale band at the same level as the upper tier of degeneration {arrows). Fin^-He imer stain.
306

Fig. 10. Reconstruction of region showing terminal degeneration in layer We in monkey 12 (see Figs. 8, 9). The
figure shows a face-on view of the flattened cortex at the level of layer We. Each horizontal line segment repre-
sents the degeneration in a single band of a single section such as that shown in Figure 9. Adjacent 30 fJ.-thic\sections were plotted on 1 mm graph paper. Curved sections ofgyrus were straightened graphically. Anterior isto the right, medial is up. The vertical lines represent the point of sharpest curvature ofthegyrus (see Fig. 9).
Fig. HA. Tracing of left lateral geniculate body in monkey 14 to show the extent of the lesion in the two mostdorsal layers. Coronal section, left is lateral. Fig. 11B. Site of degeneration in left striate cortex of same monkeyin parasagittal section about 1 cm from midline. Left is posterior. Shading indicates region with degenerated ter-
minals.
307
Fig. 11A Fig. 1 IB

308
Fig. 12. Enlargement made directly from one parasagittal section through occipital lobe in the region of degen-eration in monkey 14 (Fig. 11). The areas showing degeneration have been dotted in. A complete set of photo-
graphs was used to make the reconstruction shown m Figure 13. Note the pale band at the same level as the uppertier of degeneration (arrows). Fin\-Heimer stain.

Anatomy of the Geniculo-Cortical Pathway 309
Fig. 13. Reconstruction of region showing terminal degeneration in layer We in monkey 14 (see Figs. 11, 12).Other conventions as in Figure 10.
concerns the class of cells upon which the afferentsterminate—whether these are stellate or pyrami-dal cells. This question has been a somewhat vexedone (see Garey and Powell, 71), but recent Golgistudies in the monkey (Valverde, 71; Lund, inpress) suggest that, after all, the stellate cells areprobably the main targets of the input. Certainly,results of the present study, given the dense pack-
ing in layer IVc of an almost pure stellate-cell pop-ulation, provide little encouragement to the ideathat the afferents end primarily on pyramidal cells.
The finding that the dorsal geniculate layersproject to two very distinct regions of layer IV(Hubel and Wiesel, '69) has been noted by Policy(71) and confirmed by Garey and Powell (71) bothof whom used the Fink-Heimer method. Earlier
Fig. HA Fig. 14B
Fig. 14. Monkey 8. (A) Tracing of left lateral geniculate body to show the extent of a lesion in the most dorsallayer. Coronal section. (B) Site of degeneration in left striate cortex. Parasagittal view about 1.5 cm from mid-line. (C) Reconstruction of region showing terminal degeneration in layer IVc. Conventions in Figure 10.

310 PART III NORMAL PHYSIOLOGY AND ANATOMY
Fig. 14C.
studies (e.g., Wilson and Cragg, '67) alreadyobserved dense degeneration following geniculatelesions, extending superficially as far as layer III(perhaps what we have termed IVa) but the Nautamethod did not make it possible to observe two dis-tinct regions of termination. So far there is no hintof the physiological meaning of this two-tieredinput. Our previous studies (Hubel and Wiesel,'68) showed the presence of simple cells and strictlymonocular responses throughout layer IV. Giventhe present results, it would be worthwhile to studyarea 17 looking particularly at responses from thevarious subdivisions of layer IV. The fact that fibersfrom the dorsal and ventral layers of the geniculateterminate in different parts of layer IV is also diffi-cult to interpret at present, but it is of potentialinterest since one knows that these two sets of
geniculate layers have very different physiologicalproperties (Wiesel and Hubel, '66). Thus ventrallayer cells, on the whole, seem to have less of thecolor specificity and the variety of receptive-fieldtypes that are found in the dorsal group of layers. Ifone wishes to understand the reasons for themagno-parvo cellular duality in the geniculate,perhaps the best hope is to learn how the informa-tion transmitted by the two types of cells is used athigher levels. It thus comes as welcome news thatthe terminals are not immediately intermixed inthe cortex, but are kept to a very large extentseparate.
In recording from monkey visual cortex oneof the most striking findings has been the verticalsubdivisions into ocular-dominance columns. Ananatomical demonstration of the corresponding

Anatomy of the Geniculo-Cortical Pathway 311
Fig. 15. Monkey 15. (A) Tracing of left lateral geniculatebody to show extent of the lesion in layer 5. Coronal sectionwhich passes through geniculate in its most posterior part. (Band C) Two parasagittal section through left striate cortex,very far lateral. Foveal representation. C is a few millimeterslateral to B. (D) Reconstruction of region showing terminaldegeneration in layer We. Conventions as in Figure 10.
IVth layer left-eye right-eye mosaic not only con-firms this observation but also gives some idea ofthe geometry and degree of regularity of themosaic. It turns out that the form is a highly regu-lar one, consisting of alternating parallel stripes,with a variable amount of cross linking. The widthof the stripes seems fairly constant at about 0.25—0.5mm; any variation with position in the cortex wastoo little to detect, and in any case was certainly farless than the variation in magnification factor. Theproblem of constancy of stripe direction from ani-mal to animal will be difficult to solve withoutdoing many more experiments of this type. Atpresent we are attempting to evolve a method thatwill show the stripe pattern over very wide areas ofcortex in a single animal.
It is worth stressing that the IVth-layermosaic brought out by these anatomical methods isonly one manifestation of the system of ocular-dominance columns. Each column, as definedphysiologically, extends from surface to white mat-ter. In layer IV the cells almost always have fieldsthat are concentrically arranged or simple, andthey are almost always strictly monocular. (Wehave seen exactly one example of a binocularlydriven simple cell in the monkey). In upper andlower layers most cells are binocularly influenced,but even here cells favoring a given eye aregrouped together, and the grouping occurs in sucha way that cells favoring, say, the left eye aredirectly above and below the IVth layer regionmonopolized by the left eye. The conclusion thatthe boundaries between neighboring columns arevertical is based on vertical and oblique microelec-trode penetrations, but it receives anatomical sup-port from the fact that the upper-tier patches in thepresent material are directly above and in registerwith the lower patches except occasionally inregions of high cortical curvature, where it is likelythat the planes of section were oblique.
The surprising regularity of the ocular-domi-nance columns naturally makes one wonder if theorientation columns are similarly regular and longand narrow in cross section. There are some hintsthat they may be. Long oblique cortical penetra-tions (e.g., Hubel and Wiesel, '68, fig. 9) have some-times, though not always, shown a marked regu-larity, with long sequences of small shifts inorientation all in the same direction clockwise orcounter-clockwise. In 1968 we argued that this in

312 PART III NORMAL PHYSIOLOGY AND ANATOMY
Fig. 15D.
itself suggested that the columns might be slab-likein shape. The evidence for this was indirect,though surface mappings had also pointed to thesame conclusion (Hubel and Wiesel, '63, Fig. 4).The finding that the ocular-dominance columnsare slabs would seem to strengthen the possibilitythat the orientation columns are also. If they are, itwould be especially interesting to know whether inhorizontal section the stripes are orthogonal to theocular dominance stripes, or parallel, or have anyfixed relationship. The answer to this may beimportant, for the input that a binocular complexcell, lying above or below layer IV, receives fromtwo adjacent ocular-dominance columns must atthe same time originate from the same orientationcolumn—unless it comes from two similar orienta-tion columns and has to cross over all the interven-ing ones. The problem is obviously easily solved byhaving the two systems orthogonal to each other. Adiagrammatic example of such an arrangement isgiven in Figure 18.
The two coexisting column systems are ofcourse superimposed upon the two-coordinatemapping of the visual fields. It might reasonably beasked whether a complex cell receiving input fromtwo neighboring ocular-dominance columnswould not necessarily, as a consequence, receive itsinput from two disparate positions on the two reti-nas. The answer seems to be that the topographicrepresentation does not hold over distances compa-rable to column widths; in an oblique penetrationtraversing a single column from one side to theother, no overall drift in receptive-field positions
can be discerned against the random variations(Hubel and Wiesel, '62). Even in a penetration thatcrossed 53 orientation columns (Hubel and Wiesel,'68) there was no detectable change in receptive-field position. The retinocortical mappings aredecidedly not point-to-point, but are region-to-region.
In comparing the results of recordings fromstriate cortex in cat and monkey, one of the mostconspicuous differences has been the sharpness ofdefinition of the ocular-dominance columns. Whatwas such a striking feature in the monkey was onlybarely detectable in the cat (Hubel and Wiesel, '62,'65). We have repeated the experiments describedin the present paper in the cat, and, as might havebeen predicted from the physiology, find no obvi-ous suggestion of a right-eye left-eye mosaic inlayer IV. In cats brought up from birth with stra-bismus (Hubel and Wiesel, '65) the relative num-bers of binocularly influenced cells drops sharply toabout 20% and there is a concomitant strong ten-dency to grouping of cells according to eye domi-nance. Our hope was that a mosaic might bedemonstrable in these animals by making laminargeniculate lesions, and studies with this objectiveare now under way, though the results so far havenot been very encouraging.
In a previous paper (Hubel and Wiesel, '68)we have drawn attention to the similarity betweenocular-dominance columns in the visual cortex,and the "skin" versus "deep" columns originallydescribed by Mountcastle ('57) in the somatosen-sory cortex. Both are two-fold columnar systems,
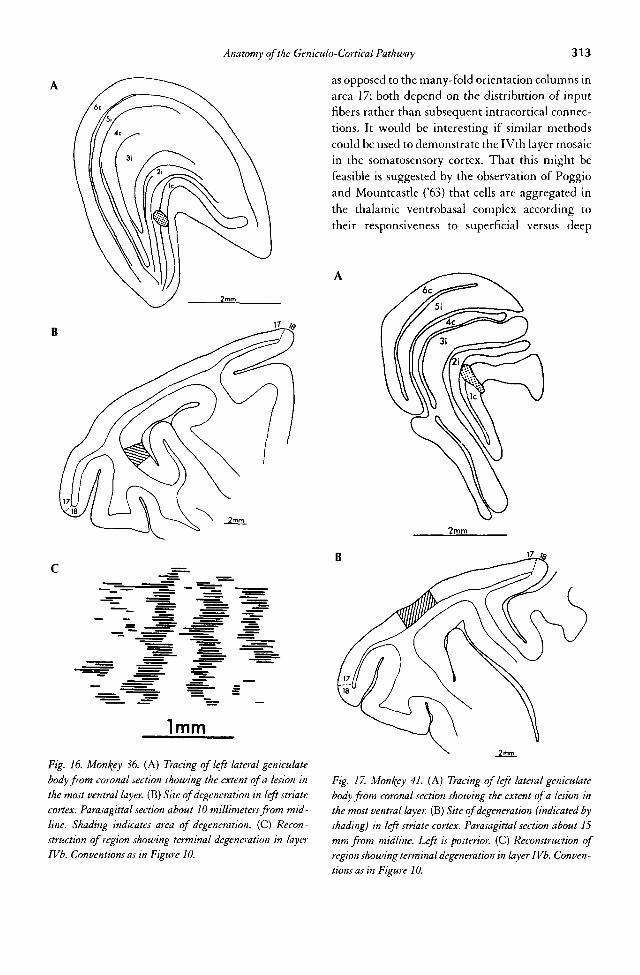
Anatomy of the Geniculo-Cortical Pathway 313
Fig. 16. Monkey 36. (A) Tracing of left lateral geniculatebody from coronal section showing the extent of a lesion inthe most ventral layer. (B) Site of degeneration in left stnatecortex. Parasagittal section about 10 millimeters from mid-line. Shading indicates area of degeneration. (C) Recon-struction of region showing terminal degeneration in layerIVb. Conventions as in Figure 10.
as opposed to the many-fold orientation columns in
area 17; both depend on the distribution of input
fibers rather than subsequent intracortical connec-
tions. It would be interesting if similar methods
could be used to demonstrate the I Vth layer mosaicin the somatosensory cortex. That this might be
feasible is suggested by the observation of Poggio
and Mountcastle ('63) that cells are aggregated in
the thalamic ventrobasal complex according to
their responsiveness to superficial versus deep
Fig. 17. Monkey 41. (A) Tracing of left lateral geniculatebody from coronal section showing the extent of a lesion inthe most ventral layer. (B) Site of degeneration (indicated byshading) in left striate cortex. Parasagittal section about 15mm from midline. Left is posterior. (C) Reconstruction ofregion showing terminal degeneration in layer IVb. Conven-tions as in Figure 10.

314 PART III NORMAL PHYSIOLOGY AND ANATOMY
Fig. 17C.
stimuli. In a sense, these aggregations may be anal-ogous to the geniculate layers.
It is worth noting that the elegant system of"barrels" described by Woolsey and Van der Loos('70) in the mouse somatosensory cortex seems torepresent a columnar system in which the IVthlayer mosaic is visible by routine staining methods,especially if the cortex is sectioned tangentially.Here each column apparently represents a singlewhisker of the snout of the mouse, being a part ofthe two-dimensional cortical topography but nev-ertheless fulfilling the requirement of discreteness.This is the only case so far where a correlation ofcolumns was observed anatomically before a phys-iological identification had been made. One won-ders, of course, whether cells below and above thebarrels represent the site of convergence from sev-eral neighboring whiskers.
Finally, the development of these highly reg-ular column systems is worth considering. Theocular-dominance columns are evidently deter-
mined by the mode of ingrowth of the afferentfibers. The orientation columns, as we have arguedbefore, must be determined by patternings of intra-cortical connections, perhaps at the first or secondsynapse. The orientation columns are probablypresent at birth (Hubel and Wiesel, '63); we have asyet done too few studies of infant monkeys to knowwhether ocular-dominance columns are also, but itseems very likely that they are. How such orderedsystems can develop innately promises to be a chal-lenging question for the future.
ACKNOWLEDGMENTS
We wish to think Julia Currie and Martha Egan for histologicalassistance, and Marian Carlson for help with the cortical recon-structions. Our special thanks to Janet Wiitanen for her invalu-able assistance with the photomicrographs and in the prepara-tion of the manuscript, to say nothing of her contribution to thestaining method! This work was supported by NIH Researchgrants 5RO1 EY00605-13 and 5RO1 EY00606-08 and alsogrant 4916 from Bell Telephone.

Fig. 18. Diagram showing a possible relationship between ocular-dominance columns and orientation columnsassuming the orientation columns are also long narrow parallel slabs, and that their arrangement is very orderly.Note that the width of these orientation slabs is much less than that of the ocular-dominance columns. A com-plex cell in an upper layer is shown receiving input from two neighboring ocular-dominance columns, but fromthe same orientation column.
315
316 PART III NORMAL PHYSIOLOGY AND ANATOMY
Literature Cited
Clark, W. E. Le Gros, and S. Sunderland 1939 Structuralchanges in the isolated visual cortex. J. Anat., 78: 563—574.
Daniel, P. M., and D. Whitteridge 1961 The representation ofthe visual field on the cerebral cortex in monkeys. J. Phys-iol.,159: 203-221.
Fink, R. P., and L. Heimer 1967 Two methods for selective sil-ver impregnation of degenerating axons and their synapticendings in the central nervous system. Brain Res., 4:367-374.
Garey, L. J., and T. P. S. Powell 1971 An experimental study ofthe termination of the lateral geniculo-cortical pathway inthe cat and monkey. Proc. Roy. Soc. Lond. B., 779: 41—63.
Heimer, L., and A. Peters 1968 An electron microscope study ofa silver stain for degenerating boutons. Brain Res., 8:337-346.
Hubel, D. H., and T. N. Wiesel 1962 Receptive fields, binocularinteraction and functional architecture in the cat's visualcortex. J. Physiol., 160:106-154.
1963 Shape and arrangement of columns in cat's stnatecortex. J. Physiol., 765: 559-568.
1965 Binocular interaction in striate cortex of kittensreared with artificial squint. J. Neurophysiol., 28: 1041-1059.
1968 Receptive fields and functional architecture ofmonkey striate cortex. J. Physiol., 795: 215-243.
1969 Anatomical demonstration of columns in themonkey striate cortex. Nature, 227: 747-750.
Lund, J. S. 1972 Organization of neurons in the visual cortex,
area 17, of the monkey (Macaca mulatta). J. Comp. Neur., inpress.
Mountcastle, V. B. 1957 Modality and topographic properties ofsingle neurons of cat's somatic sensory cortex. J. Neuro-physiol., 20:408-434.
Nauta, W. J. H., and P. A. Gygax 1954 Silver impregnation ofdegenerating axons in the central nervous system: A modi-fied technic. Stain Technol., 29: 91-93.
Poggio, G. E, and V. B. Mountcastle 1963 The functional prop-erties of ventrobasal thalamic neurons studied in unanes-thetized monkeys. J. Neurophysiol., 26: 775—806.
Policy, E. H. 1971 Intracortical distribution of lateral geniculateaxons in cat and monkey. Anat. Rec., 769: 404.
Valverde, F. 1971 Short axon neuronal subsystems in the visualcortex of the monkey. Intern. J. Neuroscience, 7: 181—197.
von Bonin, G. 1942 The striate area of primates. J. Comp. Neur.,77:405-429.
Wiesel, T. N., and D. H. Hubel 1966 Spatial and chromaticinteractions in the lateral geniculate body of the lateralgeniculate body of the Rhesus monkey. J. Neurophysiol., 29:1115-1156.
Wiitanen, J. T. 1969 Selective silver impregnation of degenerat-ing axons and axon terminals in the central nervous systemof the monkey (Macaca mulatta). Brain Res., 14: 546-548.
Wilson, M. E., and Cragg, B. G. 1967 Projections from the lat-eral geniculate nucleus in the cat and monkey. J. Anat., 707:677-692.
Woolsey, T. A., and H. Van der Loos 1970 The structural orga-nization of layer IV in the somatosensory region (SI) ofmouse cerebral cortex. Brain Res., 77: 205—242.
AFTERWORD
This was the first indication that the magno and parvo subdivisions of thegeniculate keep their separated identities at central levels in the visual path.How much further into the brain they maintain their separation—howmuch they overlap, if they do—is a major source of discussion among neu-robiologists. Jennifer Lund has extended the story by showing with Golgitechniques that 4C-beta projects to the deepest part of layer 3, whereas themagno-affiliated 4C-alpha projects to 4B, roughly to the Line of Gennari. Asmentioned in the afterthoughts to our 1968 monkey paper, it appears that 4Bmay receive substantial input from 4C-beta.
It was hugely gratifying to be invited to present these results at a meet-ing of the austere Cajal Club, at the anatomy meetings in Chicago in 1970,and to be treated like respected members of that august society. All thanks toJim Sprague, Jane Chen, Janet Wiitanen, and of course Walle Nauta.

Chapter 18 • Ocular Dominance ColumnsRevealed by Autoradiography •
FOREWORD
In these experiments we used the relatively new (at least to us) method ofaxon transport of radioactive labels coupled with autoradiography, to repro-duce and extend the experiments with the Nauta method. Autoradiographywas just beginning to be used in neuroanatomy, and we had been looking fora chance to try it. The method consists of injecting a radioactive aminoacidinto some part of the nervous system; the amino acid is incorporated into aprotein that is taken up by the cells and, one hopes, transported by the cells'axons to their terminals, perhaps some distance away. One then sections thetissue and mounts it on slides that are covered by silver emulsion and devel-oped just as a photographic negative is. The radioactivity will have produceda reduction of the silver compounds in the emulsion, so that the terminationsof the labelled cells show up as black.
In 1971 Bernice Grafstein and R. Laureno, at the Cornell UniversityMedical College (Exp Neurol 38,44-57), reported a result that made us sit up.They injected a radioactive amino acid into the eye of a mouse, and found byautoradiography not only the expected transport to the superior colliculusand lateral geniculate, but also in small amounts to the primary visual cortex.That meant that the tracer had gone beyond the geniculate, somehow pre-sumably crossing the synapse there—an unprecedented result. We thoughtof trying the same thing in a monkey but worried that the amounts thatmade it to the cortex might not be enough to detect. When we finally madethe attempt, with a rather huge eye injection of tritiated fucose and proline,our pessimism seemed to be confirmed: we saw large amounts of tracer in theappropriate layers of the geniculate but no hint of silver grains in the striatecortex. In the spring of 1974 I visited the labs of the neuroanatomist RayGuillery in Madison, Wisconsin, to give a seminar. Guillery was makingmuch use of autoradiography of transported tracers and was routinely view-ing his slides under dark-field illumination. Evidently everyone but a rankbeginner knew that the scattering of light by silver grains in the photo-graphic image was greatly enhanced when viewed under dark field. I made
317

318 PART III NORMAL PHYSIOLOGY AND ANATOMY
no mention of our experiment to Guillery, but within minutes of my returnto Boston out came the slides—and there under dark field, were the columnsin all their glory. Because the entire eye had been injected we could of coursesee the columns throughout the entire binocular part of the striate cortex,compare their sizes near the foveal representation and in the periphery, andcompare the two temporal crescents—none of which could be done with thetiny local geniculate lesions in the Nauta experiments. On the other hand weobviously could not distinguish magnocellular and parvocellular projections,so each method had its own advantages.
This convinced us that travel can sometimes pay dividends, especially ifone chooses carefully the people one visits.
Autoradiographic demonstration of ocular-dominance columns inthe monkey striate cortex by means of transneuronal transport
T. N. WIESEL, D. H. HUBEL AND D. M. K. LAM • Harvard Medical School, Department of Neurobiology,
Boston, Mass. 02775 (U.S.A.)
In the past few years the technique of mapping path-ways in the central nervous system by anterogradeaxoplasmic transport of radioactive molecules hascome into wide use and is now an important sup-plement to Nauta degeneration methods2'6'10'13.Several investigators1'3'7'9'12 have noted radioactivesubstances in the postsynaptic cells, which suggeststhat these cells take up labeled material releasedfrom the terminals1'3'7. Grafstein4 was the first toexplore the possibility of tracing a pathway beyondthe terminals of the initially labeled cells, by exam-ining also the projections of the recipient postsynap-tic neurons. By radiochemical measurements and byautoradiography, it was shown that after injection of[3H] proline and [3H]fucose into one eye of a mousethe contralateral striate cortex was more heavilylabeled than the ipsilateral, and that the label wasconcentrated in layer IV5'14
In the macaque monkey the geniculostriatepathway terminates in a very dense, highly local-
ized manner, mainly in layer IV C. Furthermore,projections from the 2 eyes end in a characteristicalternating stripe-like pattern of ocular-dominancecolumns8. It occurred to us that if radioactive sub-stances were transported transneuronally, injectionof labeled material into one eye followed by autora-diography of the cortex might reveal the entire sys-tem of ocular-dominance columns.
For the autoradiographic study of transneu-ronal transport in the primate visual system, 50 |llof a saline solution containing L-[6-3H]fucose (2.5mCi/ml, 13.4 Ci/mmole) and L-[3Hlproline (7.5mCi/ml, generally labeled, 6.8 Ci/mmole) wasinjected into the vitreous of the left eye of a 3 kg nor-mal Rhesus macaque. This injection was repeated 5times at 12 h intervals (total dose 3.0 mCi). The ani-mal was perfused with 10% formalin 3 weeks afterthe initial injection. The lateral geniculate nucleuswas cut into 20 Jim frozen sections, and the striatecortex was embedded in paraffin and cut into 15 Jim
From Brain Research, 79 (1974) 273-279
Accepted July 3rd, 1974.

Ocular Dominance Columns 319
sections. The sections were coated with Ilford K5emulsion, left in the dark for 2-4 months and devel-oped in Dektol. Sections were counter-stained withthionin.
In the lateral geniculate nucleus all layersreceiving projections from the injected eye werestrongly labeled (Fig. 1A and B). The other layersshowed grain counts higher than background, per-haps partly because of fibers of passage from theretina, but also, probably, because of diffusion ofradioactive material from recipient layers to adja-cent ones.
In the striate cortex an accumulation of silvergrains in layer IV was most easily visualized underdark-field illumination. A typical section is shownin Fig. 2. Deposition of granules can be seen inlayer IV C and as a thin 'upper tier' in layer IV A.This distribution agrees well with that seen inFink-Heimer stained material after a geniculatelesion8. An apparent difference between the twomethods was a lack of any obvious concentration ofradioactive material in layer I, which receives avery sparse input in Nauta stained material.
The accumulation of silver grains in layer IV
Fig. 1. Autoradiograph of left (A) and right (B) lateral geniculate bodies; coronal sections, Nissl counterstained,bright-field illumination. 1-6, the layers are numbered 1—6 from ventral to dorsal.

320 PART III NORMAL PHYSIOLOGY AND ANATOMY
Fig. IB.
was interrupted by conspicuous gaps in which thedensity of grains was considerably less, although itwas higher than that of the background (Fig. 2).The widths of the dark and light bands were aboutequal, measuring 0.3-0.5 mm. Fig. 3 shows a mon-tage reconstruction of a section through cortex inthe calcarine fissure. The plane of section is almosttangential to the cortex, cutting through layer IV Cand grazing layer V. The alternating bands of IV Cthus form an oval surrounding layer V. In theupper part of the reconstruction 5 or 6 columns arecut tangentially and appear as parallel stripes. The
pattern revealed by Figs. 2 and 3 is identical to thatseen with the Fink-Heimer modification of theNauta method after a lesion confined to one layerof the lateral geniculate nucleus, and certainly rep-resents the morphological equivalent of the physi-ologically defined ocular-dominance columns. Inthe monocular segment of the cortex, contralateralto the injected eye, there were, as expected, no gaps,but a continuous band of silver grains in the I Vthlayer (Fig. 4). No attempt was made to reconstructthe columns in the entire occipital lobe, since wehave subsequently found a simpler method of

Fig. 2. Autoradiograph of a section through calcarine cortex(area 17), photographed under darl^-field illumination. Brightbands of silver-granule accumulations appear in layer IV C atregular intervals, separated by gaps of equal width in which
grains are fewer, although still more numerous than in the layersimmediately above and below. Similar bands, much fainter andthinner, form an upper tier in layer IV A.

Fig. 3. Montage of a set of dar^-field micraphotogmphs froma section through calcarine cortex. The section passes almosttangentiatty through a dome-shaped region of cortex, cuttingthrough layer IV to form an oval ring of alternating light anddai\ patches. The oval encloses a part of layer V which hasbeen grazed by the plane of section. Above, 5-6 of the layer IV
C patches are cut tangentially and form a set of parallel stripes.Two-thirds of the way from pia to layer IV C, one can see asuggestion of the thin layer IV A 'upper tier'. Below, the thinpial surface is visible; together with the pial surface of adjacentcortex it forms parallel lines lifye train traces.

Fig. 4. Autoradiograph of a section through the stem of the calcarine ipsilateral eye has no input to this region, the granules form a con-cortex, photographed under darf^-field illumination. Same section as tinuous band in layer IV C, with a sparse accumulation in IV A.in Fig. 2, but shows the temporal-crescent representation. Since the

324 PART III NORMAL PHYSIOLOGY AND ANATOMY
demonstrating ocular-dominance columns in nor-mal material11.
The presence of labeled material within theIVth-layer gaps may be due to fibers of passagefrom the geniculate layers representing the injectedeye. It may also be the result of diffusion within thegeniculate, from the 3 layers on each side receivinginput from the injected eye, to their neighbors.
In summary, this study confirms Grafstein'soriginal findings of transneuronal transport inthe mammalian visual system and also providesan additional independent demonstration of theocular-dominance columns in the striate cortex.
We wish to thank Sarah Kennedy for her technical assistance.The work was supported by NIH Grants 5ROIEYO 0605 and5ROI EYO0606 and grants from the Rowland Foundation, Inc.and the Esther A. and Joseph Klingenstein Fund, Inc.
References
1. Alvarez, J., and Piischel, M., Transfer of material fromefferent axons to sensory epithelium in the goldfish vestibu-lar system, Brain Research, 37 (1972) 265-278.
2. Cowan, W. M., Gottlieb, D. I., Hendrickson, A. E., Price, J.L., and Woolsey, T. A., The autoradiographic demonstra-tion of axonal connections in the central nervous system,Brain Research, 37 (1972) 21-51.
3. Droz, B., Koenig, H. L., and Di Giamberardino, L., Axonalmigration of protein and glycoprotein to nerve endings. I.Radioautographic analysis of the renewal of protein in nerveendings of chicken ciliary ganglion after intracerebral injec-tion of [3H]lysine, Brain Research, 60 (1973) 93-127.
4. Grafstein, B., Transneuronal transfer of radioactivity in thecentral nervous system, Science, 172 (1971) 177—179.
5. Grafstein, B., and Laureno, R., Transport of radioactivityfrom eye to visual cortex in the mouse, Exp. Neural., 39(1973) 44-57.
6. Hendrickson, A. E., Electron microscopic distribution ofaxoplasmic transport,/, comp. Neural., 144 (1972) 381-397.
7. Hendrickson, A., Electron microscopic radioautography:identification of origin of synaptic terminals in normalnervous tissue, Science, 165(1969) 194-196.
8. Hubel, D. H., and Wiesel, T. N., Laminar and columnardistribution of geniculocortical fibers in the macaque mon-key,/, comp. Neural., 146 (1972) 421-450.
9. Korr, I. M., Wilkinson, P. N., and Chornock, F. W, Axonaldelivery of neuroplasmic components to muscle cells, Sci-ence, 155(1967)342-345.
10. Lasek, R., Joseph, B. S., and Whitlock, D. G., Evaluation ofradioautographic neuroanatomical tracing method, BrainResearch, 8(1968)319-336.
11. LeVay, S., Hubel, D. H., and Wiesel, T. N., The pattern ofocular dominance columns in macaque visual cortexrevealed by a reduced silver stain, (1974), in preparation.
12. Miani, N., Transport of S-100 protein in mammalian nervefibers and transneuronal signals, Acta neuropath. (Berl.), 6,Suppl.V (1971) 104-108.
13. Moore, R. Y., and Lenn, N. J., A retinohypothalamic pro-jection in the rat,/, comp. Neural., 146 (1972) 1-14.
14. Specht, S., and Grafstein, B., Accumulation of radioactiveprotein in mouse cerebral cortex after injection of 3H-fucose into the eye, Exp. Neural., 41 (1973) 705-722.
AFTERWORD
We made much subsequent use of radioactive labels and autoradiography, innormal monkeys and in monkeys after various kinds of visual deprivation,and in a variety of other species including mouse and tree shrew, looking atboth superior colliculus and cortex. We were most interested to find, in mon-key superior colliculus, a marked clumping of projections especially fromthe ipsilateral eye, very reminiscent of cortical ocular dominance columns.That finding came at the same time as results by Ann Graybiel on work donein the cat, published in 1976 (Brain Res 114:318-327). It came some yearsbefore her remarkable discovery of clumps of several kinds in corpus stria-turn. Evidently columns, or structures analogous to columns, must be wide-spread in the central nervous system.

Chapter 19 • Regular Sequences of OrientationShifts in Monkeys •
FOREWORD
This paper is concerned with the geometry of orientation columns—estab-lishing that they are slabs perpendicular to the cortical surface, discussingwhether the slabs are discrete or continuous, and the question of the orderli-ness of the sequences. Some of the topics were already addressed in the first,1968 monkey cortex paper, and the purpose of this one was to enlarge onthose topics in the light of what we had learned in the intervening six years.Lurking in the background is the fact that we still, at this stage, had noanatomical picture of the face-on geometry of the columns. In several dis-cussions published separately, (e.g., Hubel, D. H., Wiesel, T. N., & LeVay, S.,1976 Cold Spring Harbor on Quantitative Biology, 40: 581-589) we illustratethe columns as though they were strictly parallel slabs, more or less orthog-onal to the ocular dominance slabs, in what we came to call our "ice-cubemodel", but we had no evidence for this assumption: we simply took it as thesimplest possibility. Indeed, the reversals and fractures suggested that theslabs could hardly be parallel planes. The subsequent discovery by Blasdel,with optical methods, of the complexity of the orientation columns as seenface-on, with the swirls and pinwheel formations, came to us as a completesurprise (see p. 352).
325

326 PART III NORMAL PHYSIOLOGY AND ANATOMY
Sequence Regularity and Geometry of Orientation Columns in theMonkey Striate Cortex
DAVID H. HUBEL AND TORSTEN N. WIESEL • Department of Neurobiology, Harvard Medical School, 25
Shattuck Street, Boston, Massachusetts
ABSTRACT
The striate cortex of the macaque monkey is subdivided into two independent and overlapping sys-tems of columns termed "orientation columns" and "ocular dominance columns." The present paperis concerned with the orientation columns, particularly their geometry and the relationship betweensuccessive columns. The arrangement of the columns is highly ordered; in the great majority ofoblique or tangential microelectrode penetrations the preferred orientations of cells changed system-atically with electrode position, in a clockwise or counterclockwise direction. Graphs of orientationvs. electrode track distance were virtually straight lines over distances of up to several millimeters;such orderly sequences were often terminated by sudden changes in the direction of orientation shifts,from clockwise to counterclockwise or back. The orientations at which these reversals occurred werequite unpredictable. Total rotations of 180—360° were frequently seen between reversals. In tangen-tial or almost tangential penetrations orientation shifts occurred almost every time the electrode wasmoved forward, indicating that the columns were either not discrete or had a thickness of less than25—50 (I, the smallest order of distance that our methods could resolve. In penetrations that werealmost perpendicular to the surface, the graphs of orientation vs. track distance were relatively flatter,as expected if the surfaces of constant orientation are perpendicular to the cortical surface. Stepwisechanges in orientation of about 10° could sometimes be seen in perpendicular penetrations, each ori-entation persisting through several clear advances of the electrode, suggesting a set of discrete colum-nar subdivisions. The possibility of some kind of continuous variation in orientation with horizontaldistance along the cortex was not, however, completely ruled out. Occasionally a highly orderedsequence was broken by an abrupt large shift in orientation of up to 90°. Shifts in ocular dominanceoccurred roughly every 0.25—0.5 mm and were independent of orientation shifts. In multiple parallelpenetrations spaced closer than about 250 (J, the slopes of the orientation vs. track distance curves werealmost the same; reconstruction of these penetrations indicated that the regions of constant orienta-tion are parallel sheets. On crossing perpendicular to these sheets, a total orientation shift of 180° tookplace over a distance of 0.5—1.0 mm. Column thickness, size of shifts in orientation, and the rate ofchange of orientation with distance along the cortex seemed to be independent of eccentricity, at leastbetween 2° and 15° from the fovea. A few penetrations made in area 17 of the cat and in area 18 of themonkey showed similar orderly sequences of receptive-field orientation shifts.
In the monkey striate cortex there exist two inde-pendent and overlapping systems of columnswhich we have termed "orientation columns" and"ocular-dominance columns" (Hubel and Wiesel,'68). The ocular-dominance columns are parallelsheets or slabs arranged perpendicular to the corti-cal surface subdividing it into a mosaic of alternat-ing left-eye and right-eye stripes 0.25—0.5 mm inwidth (Hubel and Wiesel, '72). For the orientationcolumns the geometry is less clear, though we havehad indications that they are slab shaped. The pres-
ent paper is concerned in part with this question.The main subject, however, is the degree to whichthe orientation columns are ordered. As the cortexis explored with a tangentially or obliquely movingelectrode, the sequence of ocular-dominancecolumns is obviously back and forth from one eyeto the other, since there are by definition only twokinds of ocular-dominance columns. For the orien-tation columns one can distinguish something like18—20 possible orientations, and it is not trivial toask whether the electrode encounters a random or
From Journal of Comparative Neurology, Vol. 158, No. 3, December 1, 1974.

Sequences of Orientation Shifts 327
ordered sequence. We have previously had hintsthat the columns were highly ordered (Hubel andWiesel, '63, '68) and the results to be describedmake it very clear that this order is the rule ratherthan the exception.
METHODS
The series consisted of nine macaque monkeys (rhesusand stumptail) one to three years of age, and one cat. Ofthe nine monkeys seven were normal, one had long-standing monocular blindness, and one had artificialstrabismus from birth. The cat also had strabismus frombirth. The total number of cells recorded in monkeyswas 1410, in 45 penetrations.
Most penetrations were made from the convexity ofthe occipital lobe, 2 to 7 mm posterior to the 17-18 bor-der and about 10-15 mm lateral to the midline. This cor-responds to a region of visual field 4-10° below and outfrom the fovea. Four penetrations were made far lateral,in the cortical region representing the fovea, and twowere made in the buried calcarine cortex, with fields 12°and 18° from the fovea. In one experiment five penetra-tions were made in area 18, in the posterior bank of thelunate sulcus about 10 mm from the mid-sagittal plane(Fig. 12). To help reconstruct the electrode tracks one ormore electrolytic lesions were made in each penetration.
Methods for animal preparation, stimulation, andrecording were generally those described in previouspapers (Hubel and Wiesel, '68). Since it was important torecord activity continuously as the electrode advanced,we made the tungsten electrodes slightly coarser thanusual, with 25-35 [I of uncoated tip rather than 15-25 |l.With such electrodes many isolated units were stillrecorded in each penetration, but background activitywas more plentiful, with fewer gaps during which noresponses to stimulation could be heard on the audiomonitor.
The electrode was advanced in steps of 25-50 (I, andat each advance the responses were checked for changesin optimal stimulus orientation. Steps smaller than 25 (J,usually did not result in a change of optimal orientationor of electrical activity, either because the uncoated tiplength was 25 (I or more, or because of the inevitablestickiness in the movement of the electrode relative tothe tissue. Obviously these factors impose a lower limiton the size of the columns that can be resolved.
We stimulated routinely by sweeping a slit of whitelight of variable length and width across the receptivefield in different orientations. When necessary we useddark bars or monochromatic slits. As the electrodeadvanced through the cortex each new optimal orienta-tion for activating single cells or groups of cells wasrecorded as a line drawn on the receptive field chart (Fig.1). The accuracy in estimating optimal orientations var-
ied from cell to cell, from roughly ±2-3° at best, to±5-10° for less sharply tuned cells; in layer IV C mostcells lack orientation specificity. Orientations were plot-ted against micrometer readings of electrode position,with a new point marked each time the orientationchanged or each time any change in electrical activitymade it clear that the electrode had advanced. To deter-mine orientation we occasionally used a PDF-12 com-puter to produce a graph of average response vs. orienta-tion, generating the slit electronically on a televisionscreen. This method took much longer, and the usualminute-to-minute variations in responsiveness of thecells tended to make the curves broader and noisier. Weconcluded that for both speed and for precision it is hardto beat judgements based on the human ear. Certainly acurve such as the one in Figure 2 could not have beenobtained with computer averaging methods before theauthors reached the age of mandatory retirement.
For binocular cells in which the two eyes wereequally effective or almost so (groups 3, 4, 5 ... Hubeland Wiesel, '62), orientation was determined separatelyfor the two eyes. For cells dominated strongly by one eye(groups 1, 2, 6, 7) only one point corresponding to thedominant eye was plotted. Open circles in the graphsrepresent contralateral eye, closed circles, ipsilateral.Thus an idea of the dominant eye and the degree ofbinocular interaction can be obtained from the graphs ata glance. When the orientations of a binocular cell con-sistently differed in the two eyes by a measurable amount(as in Fig. 6, for example), the discrepancy could beaccounted for by a relative rotation of the paralyzed eyesin the equatorial plane.
After perfusion of the brain with 10% formol salinethe occipital lobes were embedded in celloidin, cut in theparasagittal plane at 25 [1, and stained with cresyl violet.The angle of the electrode track was measured in the his-tological slides either with respect to the cortical surfaceand the layers or by taking the complement of the anglemade with the radial fascicles. In estimating this angle anerror is introduced by sectioning the brain in theparasagittal plane rather than in a plane perpendicular tothe surface, but this was small in penetrations that werewithin 10-15 mm of the midline. Small errors in estima-tion of track angles were important only in nearly per-pendicular penetrations, and then only in calculationsinvolving estimates of the horizontal component of trackdistance. Numbers based on such calculations are omit-ted from Table 1.
RESULTS
Regularity of Orientation ColumnsIn this study the main finding was the high degreeof order in the arrangement of orientation columns.For many years our only good example of this order

328 PART III NORMAL PHYSIOLOGY AND ANATOMY
was a single experiment in a spider monkey (Hubeland Wiesel, '68, Fig. 9), but since we began to uselower impedance electrodes and the plotting proce-dure described below we have seen a high degree oforder in almost every penetration.
Figure 1A shows an example of a typicalordered sequence in a very oblique penetration in anormal monkey. The first cell or group of cells inthe sequence (No. 96 in the experiment) stronglyfavored the right (ipsilateral) eye and had a1 o'clock—7 o'clock receptive-field orientation. Thenext 14 (Nos. 97-110) were all strongly dominatedby the right eye and had the orientations shown,each counterclockwise to the one before, with stepsthat were small and fairly uniform. At cell No. I l lthe right eye suddenly became ineffective, and sub-sequently recorded cells were all strongly domi-nated by the left eye. The sequence, however, con-
tinued in a counterclockwise direction withoutinterruption.
These results are shown graphically in FigureIB. Orientations are plotted against electrode-track distance in millimeters. In plotting orienta-tions, 0° is taken as vertical, angles clockwise up to90° are designated as positive, counterclockwise to89° as negative. The first cell in the sequence thushad an orientation of +32°. Track distances aretaken directly from the micrometer advancer read-ings, with zero as the depth at which unit activitywas first encountered.
The graph, like others obtained in this series,showed a high degree of regularity, and indeed alinearity, over long distances. Almost every 25—30|I advance of the electrode was followed by a fairlyconstant small shift of about 10° in the optimalstimulus orientation. Since any particular orienta-
right eye
left eye
Fig. 1A. Normal 2-3 year-old monkey. Observations during an oblique microelectrode penetration through stri-ate cortex. The drawing was made on a sheet of paper affixed to the tangent screen 146 cm from the monkey. Theeyes converged slightly so that the visual axes crossed, with the left and right foveas ophthalmoscopically projectedas shown (1 f and r f). The receptive fields of 22 cells or clusters of cells were distributed through the regionsmarked with interrupted circles, 3° below and 3° to the left of the foveas. The first cell in the sequence, No. 96 inthe experiment, had an orientation 32° clockwise to the vertical, and was influenced from both eyes but morestrongly from the right (ipsilateral). Cells 97-110 were likewise strongly dominated by the right eye; at No. Illthere was an abrupt switch to the left (contralateral) eye, which dominated for the rest of the sequence (samepenetration as in Fig. 8,A,D). (Experiment No. 5).

Sequences of Orientation Shifts 329
Fig. IB. Graph of orientation vs. tracf^ distance for thesequence of Figure 1A. In plotting orientations, 0° is vertical,angles clockwise up to 90° are positive, counterclockwise to89°, negative. Closed circles, ipsilateral (right) eye; open cir-cles, contralateral (left) eye. Tracf( distance is taken frommicrometer advancer readings.
tion could be measured only to the nearest 2—5° itwas at times hard to be sure that a shift had actuallyoccurred, but once the slope of the curve had beenestablished the orientation arrived at after severaladvances in 25—30 (I steps was predictable with sur-prising accuracy.
As pointed out in the method section, anadvance of the electrode by a substantially smallerdistance, such as 15—20 (I, often did not result in anorientation shift, but with such a small advance itwas difficult to be sure the electrode had movedrelative to the tissue. Since most 25—30 (J. advancesof the electrode did result in orientation shifts theregions of constant orientation were obviously thatsize or smaller. Thus the distances betweenobserved shifts in orientation, or their horizontalcomponents ("horizontal distance/shift" in Table1), represent an upper bound to the thickness of thecolumns, and not necessarily the true values. Thisshould be kept in mind in interpreting Figures forthe distance between orientation shifts, or thenumber of degrees for each orientation shift, givenin the present descriptions and in Table 1. The pos-sibility that orientation may vary in some sensecontinuously with horizontal electrode movementis taken up in the discussion, but here it may be
Fig. 1C. Reconstruction of the electrode trac\. Electrodeentered the striate cortex 8 mm behind the lunate sulcus inthe parasagittal plane, 10 mm to the right of the midline,intersecting the surface at 20°. The sequence described herewas recorded between the two arrows. Circles represent elec-trolytic lesions. Anterior is to the right.
well to point out that 25—30 |i is close to the dimen-sions of a cell body, so that the column widths arealready close to the lower limit. As shown below,the distance an electrode traveled between shifts inorientation was large enough to be measurable innearly perpendicular penetrations, but then thehorizontal component of the distance became crit-ically dependent on the angle between electrodeand cortex, and could not be accurately estimated.
The part of the electrode track in which thesequence of Figure 1 occurred is shown betweenthe arrows in the track reconstruction of Figure1C. The sequence was part of a longer one de-scribed in Figure 8D. The span of 158° was coveredin 22 shifts, giving a mean orientation shift of 7.2°± 2.8° (S.D.), (Linear coefficient of correlation,0.98). The 22 shifts in orientation took place over adistance of 0.59 mm, giving an average distancebetween shifts of 27 |J,, or 25 jl in terms of distanceparallel to the cortical surface. This is equivalent to40 shifts/mm horizontal excursion. Since the radialcolumn-like bands of cells seen in Nissl-stainedtransverse sections of striate cortex are separated byintervals of about this order of magnitude wethought it might be interesting to compare the sizesdirectly. Figure ID shows a photomicrograph ofthe cortex with two lesions made before and afterthe sequence of 22 shifts; the part of the track inwhich the sequence occurred is indicated byarrows. (The track could only be seen with dark-field illumination.) The bands are not sharplydefined and can be counted only very roughly, but

330
Fig. ID. Photomicrograph of a Nissl-stained section through the two lesions and the electrode tracf^. The tracl^was visible only with darJ^-field illumination. The sequence of 22 orientation shifts occurred between the twoarrows, within which space roughly 32 vertical bands of cells can be counted.
in this part of the track there appear to be about 32,or 54 bands/mm.
Reversals in the direction of rotation wereseen in about half of the penetrations in the series.Several examples of such reversals are shown inFigure 2, a graph from a highly regular penetrationin a normal macaque monkey. Here one longclockwise progression spanning 188° in 17 orienta-tion shifts (average ll.l°/shift) was followed by aneven longer counterclockwise rotation through267° in 26 shifts (10.37shift). This in turn was fol-lowed by two shorter sequences. The total numberof orientation shifts in the 2.2 mm track was 53, or24 shifts/mm of horizontal excursion. The numberof radial bands of cells counted along the electrodetrack was about 110, giving 50 bands/mm.
Throughout almost the entire penetration theipsilateral eye (closed circles) was strongly domi-nant, though the contralateral eye was able to influ-
ence most of the cells. Towards the end of the pen-etration the dominance began to change, with afew cells influenced about equally from the twoeyes, and by the very end the contralateral eye hadbecome dominant. The relationship between ori-entation columns and ocular-dominance columnsis considered below.
The regularity shown in these two exampleswas typical. Within any progressive sequence,clockwise or counterclockwise, the slope of thecurve was generally fairly constant. The total rota-tion taking place before a reversal in direction ofrotation was highly variable, but the majority ofuninterrupted spans were over 100°, one-thirdexceeded 200°, and a few were over 300°. Many lin-ear sequences were cut short, not because of areversal in direction of rotation, but because thepenetration was terminated or entered white mat-ter or layer IV C (in which most cells have no ori-
PART III NORMAL PHYSIOLOGY AND ANATOMY

Sequences of Orientation Shifts 331
Fig. 2A. Graph of orientation vs. trac\ distance for an oblique penetration through striate cortex in a normalmonkey. Note the reversals in direction of orientation shifts, the first two of which bracket a long sequence span -ning 267°. (Experiment No. 7.)
Fig. 2B. Reconstruction of the electrode trac\, which enteredthe striate cortex 10 mm behind the lunate sulcus and 10 mmto the right of the midline, making an angle of 7° with thesurface. Section is parasagittal. One lesion was made at theend of the 2.2 mm penetration. Receptive fields were 1°below and 7.5° to the left ofthefovea.
entation specificity). The angles at which reversalsoccurred were quite unpredictable, there being notendency for any particular orientations, such asvertical or horizontal, to be favored as points ofreversal.
Though most of the sequences were regular,isolated large jumps in orientation did occur. Someof these may simply have reflected a sudden move-ment forward of the electrode after sticking rela-tive to the tissue, but others were certainly genuine.An example of a pair of breaks in the order of asequence is shown in Figure 3 from a penetrationdescribed further in another context below (Fig.8C). Here the orientation had been systematicallychanging in a counterclockwise direction whensuddenly there was a 70° counterclockwise jump,followed by a short regular clockwise sequence andthen a second counterclockwise jump of 105°. Theprevious counterclockwise sequence was finallyresumed with the same slope, just as though it had

332 PART III NORMAL PHYSIOLOGY AND ANATOMY
Fig. 3. Graph of orientation vs. trac\ distance for a sequencethat showed two clear breads in regularity (Experiment No.5, penetration 2; see Fig. 8C).
never been interrupted. At this point the electrodewas pulled back slowly and then readvanced,whereupon the entire sequence was reproduced,making it almost certain that the jumps were not insome way related to uneven electrode movements.
Effects of Varying the Direction of aPenetration through the CortexFor reasons taken up in the discussion the preva-lence of regularity in the sequences makes it likelythat the columns have the form, not of pillars, asthe word "column" implies, but of parallel slabs.Further evidence for this will be presented below.Here we discuss the variation in slope of graphs oforientation vs. track distance as the direction of theelectrode through a given set of orientation slabs isvaried.
Most penetrations that were parallel or almostparallel to the cortical surface gave relatively steepcurves of orientation vs. track distance, with slopesranging from 100°/mm to 400°/mm. The absence offlatter curves may seem surprising, since there is noobvious reason why tangential penetrations shouldnot meet the slabs at all possible angles, from 0° to90°, with equal likelihood. As pointed out in thediscussion, however, it is not the angle itself that isimportant in determining the slopes of the curves,but the sine of the angle, so that with randomly dis-tributed angles between electrode and slabs it isexpected that the slopes of the curves should beskewed towards large values, i.e., most curves
should be relatively steep. It would have beeninteresting to test this directly by making severaltangential penetrations through some small regionof cortex in various directions, but for the presentthe idea was abandoned because of the difficultiesin finding a suitable plane of sectioning for histo-logical reconstruction. The results of making mul-tiple parallel penetrations are taken up below.
In tangential penetrations individual shifts inorientation tend to be obscured in orientation-vs.-distance curves because of limitations in resolutionalong the distance axis. On the other hand a pene-tration that is deliberately made almost normal tothe surface should intersect the columns at a verysmall angle and pass through relatively few ofthem; the curve should be relatively flat, and indi-vidual shifts should be further apart and conse-quently more easily seen.
The two penetrations of Figure 4 were madeabout 1.5° from the foveal representation of theright hemisphere in a normal monkey. In penetra-tion 3 (Fig. 4B), which was almost normal to thesurface, the slope of most of the curve was—54°/mm, the flattest of the entire series. Steps wereconspicuous, occurring about every 120 (I. In con-trast, penetration 4 (Fig. 4C), which made an angleof 46° to the surface, had a slope of 273°/mm andthe orientation changed with each 25—30 (1 advanceof the electrode, i.e., too frequently for individualsteps to be resolved. The interruption in this pene-tration between 1.8 and 2.5 mm marks the passageof the electrode through layer IV C, where as usualthere was no hint of any orientation specificityand responses were strictly monocular (Hubel and
Fig. 4A. Reconstructions of two penetrations in the right stri-ate cortex. P3 was almost normal to the surface, whereas P4made an angle of 46° with it. Fields were 1" below and 1° tothe left ofthefovea. (Experiment No. 10.)

Fig. 4B. Graph of orientation vs. tracf( distance for the perpendicular penetration P3. Slope-54°I mm, uncor-rectedfor angle to surface. The filled dart( bar represents activity in layer IV C, which was influenced exclusivelyfrom the ipsilateral eye and showed no orientation selectivity; the bar's placement along the orientation axis isarbitrary.
Fig. 4C. Orientation vs. trac1{ distance for the oblique penetration P4. Slope, 2737mm, uncorrected.
333

334 PART III NORMAL PHYSIOLOGY AND ANATOMY
Wiesel, '68). Following this interruption the curveshowed about the same slope as before, andappeared to represent a simple continuation of thesequence. This is what is expected if the columnsextend through the full thickness of cortex.
A second example comparing oblique andnearly perpendicular penetrations is shown in Fig-ure 5. After crossing the outermost thickness ofcortex and white matter beneath, the electrodeentered the mushroom-shaped calcarine cortex,where it pierced one fold completely, at 82° to thesurface, and finally entered the next fold at 51°. Inthe first of these calcarine folds the receptive fieldswere 12° from the fovea, in the second, 18°. Onceagain the more perpendicular traverse gave a rela-tively flat curve (—106°/mm), whereas for theoblique portion the curve was much steeper(283°/mm). (It is not clear why discrete steps didnot occur in the first curve.)
A third comparison between perpendicularand oblique penetrations is shown below in Figure13, for the cat.
That the three perpendicular penetrations inthese examples gave very flat curves agrees withour previous experience (Hubel and Wiesel, '62,'68), and is in marked contrast with the relativelysteep slopes observed for the straight segments ofthe curves in virtually every oblique or tangentialpenetration in the series.
Dimensions of Orientation ColumnsA summary of the information obtained from allthe penetrations of the series is given in Table 1.Our purpose here is chiefly to convey an overallimpression of the degree of variability of theresults. The mean value for the total orientationshift in 1 mm of tangential component of the elec-trode movement ("slope corrected") is 281°/mm. Asalready mentioned, the distribution of the slopesfavored high values, with only one slope less thanlOOVmm. The mean slope of 281°/mm, corre-sponds to 640 (I for a full sweep through 180°, avalue that is likely to be a somewhat high estimateof the thickness of a full 180° complement of orien-tation slabs since, as mentioned above, we have noway of knowing in single penetrations the anglebetween the slabs and the horizontal component ofthe electrode tracks. The mean value for "horizon-tal distance/shift" of 43 |I is also probably a highestimate for slab width, partly for the same reason,and partly because it is likely that some orientation
shifts went unobserved. The same applies to themean value for "angle/shift" of 11.9°, as an estimateof the angular shift between slabs.
A closer approach to the true values of theseitems can probably be obtained from the penetra-tions that gave the most frequent intervals, withthe smallest shifts in angle. The sequence shown inFigure 1, for example, gives a mean value for "hor-izontal distance/shift" of 25 |I and a mean "angle/shift" of 7.2°; the comparable numbers from thesecond sequence of Figure 2 (experiment no. 7) are31 |I and 10.3°. In the present study one objectivewas to obtain some rough estimate of column size.As a summary statement it seems reasonable to saythat the columns are 25—50 |Ll wide and arearranged in sequences of 9—10° steps. Both of thesefigures are upper limits and obviously would bemeaningless if orientation were a continuous func-tion of horizontal distance, in the statistical sensediscussed below (DISCUSSION). In either case, anarray of columns subserving a full 180° has a totalwidth of 0.5—1 mm.
Systematic shifts in orientation were seen inall layers of the cortex with the exception of layer 1,where no responses were generally seen, and IV C,in which responses were not orientation specific.There were otherwise no obvious differences fromlayer to layer in the shapes of the curves, the size ofthe orientation shifts, or slab thickness. Most of therecordings were made from layers II and III, how-ever, and with such a limited survey one cannotrule out the existence of subtle differences betweenlayers.
Variation of Columns Size withEccentricityMost of our experiments were done in corticalareas representing visual fields 5—10° from thefoveal representation (Table 1), in order to formsome idea of the range of variation of the columnsin at least one region. One pair of penetrations,however, was made in the foveal representation(Fig. 4) and another went beyond the exposed sur-face of area 17 into the calcarine fissure where itintersected the cortex twice (Fig. 5), with receptive-field positions 12° and 18° from the fovea. Asexpected, in the fovea the fields and the randomvariation in field position ("scatter") were both verymuch smaller than what was found 5—10° out, andthese in turn were smaller than the fields and scat-ter 12—18° out. In contrast, there was no indication

Sequences of Orientation Shifts 335
Fig. 5A. Comparison of perpendicular and oblique penetrations. Reconstruction of a penetration that passed
through two folds of striate cortex deep in the calcarine fissure. Field positions 12° and 18° from the fovea;
parasagittal section, 10 mm to right ofmidline. Parts oftracl^ indicated by continuous line are plotted in Figure
5B. Electrode intersected the first calcarine fold at 82°, and the second at 51°. Monkey had an artificial strabis-mus from birth. (Experiment No. 3.)
Fig. 5B. Orientation vs. trac\ distance, for the portion of penetration indicated by a continuous line, in Figure5A. Open circles, contralateral eye; closed circles, ipsilateral eye. Slopes, -106°/mm, 283°/mm.
that the column size varied with eccentricity: theslopes of the graphs of orientation vs. track length,the frequency of occurrence of shifts and theirangular size, and the frequency of changes in ocu-lar-dominance were all similar (Table 1).
To be certain that the columnar organizationis uniform in all respects over the entire cortexwould of course require a much more extensivesurvey. One can, however, be confident that thereare no gross differences between center and

Table 1
Experi-mentNo.
4
5
6
7
9
Penetra-tion No.
1231
2
31231
12
3
Sequence1
No.
1211211
12
1212
S/VO«
fl«^
j-to/f Horizontal2 Vertical* Total4
(degrees)macaque 0 —3.5 3.5normal
macque 3 - 3 4normal
macaque 3 -4.5 5.5normal
macaque 7.5 -1 7.5normalmacaque 6normal
Span
°f ,sequence
(deg.)130159146215
61282
423232712041741882671571318397
191
Tracl^length
mm.1.010.500.780.840.291.220.281.271.240.590.620.730.821.680.480.820.370.87
AngleO)6
deg.4031292525202020123131775825251717
Horizontaltracl{length7
mm.0.770.430.680.760.261.150.261.191.210.510.530.720.810.890.440.740.350.83
Slope0
uncorrectea
°/mm.-154-307-177-200226-218154-26220436330726341764263112284227
Number
ofshifts
1611131983172824141517261315111223
Angle/shrftw
deg.8.114.511.28.07.69.16.011.511.314.611.611.110.312.18.77.68.18.3
Horizontaldistlshift"
\\m483952403337374350363542316829672936
Figurenumber
6
8B8B3,8C3,8C1,8D10101022

10 34
3 1
2
32 7
98 1
4Means12
s.d.
12123412
1221
macaquenormal
macaquesquint
macaquearea 18
Cat
1
2210.5102221
1
-1
-4.5-4.5-5.5-15-4.5-4.5-4.5-4
2
1.5
5512185554
2.25
5922415214510752134291614891491758960180
1.070.900.850.560.540.580.431.410.362.061.10.90.641.071.24
(90)46464232(82)51191939674538(90)3
—0.630.590.420.46—0.271.330.341.600.410.640.50—1.24
-54283263320-244-106283219219219142-194-13954-16522283
9211310—97277—11991417
—10.711.714.5—5.819.110.78.7—13.519.49.94.310.611.913.4
—304542——394949—377055—7343.2611.5
4B4C4C
5B5B7B
1212
13b13c
'"Sequence" refers to a group of orientation shifts all in one direction. Figure 8D (expt. 5, penetration 3) contains one sequence; Figure 2 (expt. 7, penetration 1) contains two major and two (untabulated) minor sequences.2Horizontal component of distance from fovea.
Vertical component, positive values upward.4Distance from fovea.
Length of the sequence in degrees.6Angle between electrode track and cortical surface (METHODS).
'Horizontal track length = track length X cos 6 pene.sVery roughly, this is given by span -=- track length; usually computed from graphs: 177.2/tan (angle of curve to orientation axis).
''Uncorrected slope/cos 9.loSpan/(no. of shifts).
"Horizontal track length/(no. of shifts).12Means for all normal and abnormal macaque area 17 (all of Table 1 except Experiments 2 and 8).

338 PART III NORMAL PHYSIOLOGY AND ANATOMY
periphery such as exist in magnification factor orreceptive-field size. From the curve of Daniel andWhitteridge ('61, Fig. 4) the magnification factorscorresponding to fovea and to points 7° and 15°from the fovea are roughly 6.3, 1.3 and 0.4 mm/0.Had the orientation columns differed in size inthese proportions (16:3:1) it should have beenevident. Our conclusion concerning the ocular-dominance columns (Hubel and Wiesel, '72), basedon anatomical methods, was similar: there is novery striking change in the widths of the stripeswith eccentricity.
Relationship between Ocular-Dominance and Orientation ColumnsPhysiological and anatomical studies in themacaque monkey indicate that the width of ocular-dominance columns is in the order of 0.25—0.5 mm(Hubel and Wiesel, '68, '72). In an average tangen-tial penetration one should therefore expect to seemany shifts in receptive-field orientation for eachshift in eye dominance. The relation between thetwo types of column can be illustrated in severaltypical penetrations. In the example shown in Fig-ure 6, from a normal monkey, cells in the first 0.5mm of the penetration were driven almost exclu-sively from the ipsilateral eye. Then, for about 0.3mm, the cells were roughly equally influencedfrom the two eyes. Finally, in the last 0.2 mm, thecontralateral eye had complete control. All thistime the orientation progressed steadily in a coun-terclockwise direction, at virtually the same ratefor all parts of the penetration regardless of eyedominance.
In the strabismic animal the results were sim-ilar except that transitions from one eye to theother were abrupt, with, at most, only very shortspans in which both eyes were represented. Anexample of this has already been seen in Figure 5,and another example from a different penetrationin the same experiment (No. 3) is shown in Figure7. The curve from the first part of this penetration,before entering layer IV, was the closest approachof any to a straight line (coefficient of linear corre-lation 0.996), and the line was again virtually unin-terrupted by the transition from ipsilateral to con-tralateral eye. (The slight apparent shift in thecurve is explained by a relative outward rotation ofthe eyes in the equatorial plane.) During the 2 mmlong passage through layer IV C, marked by
Fig. 6. Relation of orientation shifts to changes in ocularcominance, in crossing from one ocular-dominance columnto another. Graph of orientation vs. trac\ distance, for a pen-etration that entered striate cortex in the parasagittal plane10 mm from the midline, making an angle of 40° to the sur-face. Normal monkey. Most of the first cells were stronglydominated by the ipsilateral eye (closed circles), but after theelectrode passed through a region of mixed dominancebetween 0.6 and 0.9 mm, it entered a region of contralateraleye dominance (open circles). (Experiment No. 4.)
arrows in the reconstruction, there were three ocu-lar-dominance shifts, and a final shift occurred inthe traverse through layer V
These results, in summary, indicate thatsequences of orientation shifts are undisturbed byocular dominance; to this extent the two columnsystems are certainly independent.
Reconstruction of Closely-SpacedPenetrationsIt should be possible to test the idea that orientationcolumns are parallel slabs by making several paral-

Sequences of Orientation Shifts 339
Fig. 7A. Relation of orientation shifts to changes in ocular-dominance. Reconstruction of a penetration in the samemonkey as in Figure 5 (strabismic), but at a slightly smallerangle to the surface (19°) and 200 [i lateral. Region of pene-
tration in which responses lacked orientation specificity is
marked with arrows. This coincides closely with layer IV C.(Experiment No. 3.)
lei penetrations through a small region of cortex,comparing receptive-field orientations of adjacentpoints. In practice this proved difficult. In our firstattempt, two parallel penetrations were made 1 mmapart, and though both sequences were regular therotation was clockwise in the first and counter-clockwise in the second. This result is perhaps notsurprising, considering how abruptly a sequencecan go from clockwise to counterclockwise or backin a single penetration, but if one is to understandthe geometry of the columns a closer spacing ofpenetrations is clearly required.
Figure 8 illustrates the results of an experi-ment (No. 5) in which three penetrations weremade 0.2 mm apart in a normal monkey. Threetracks intersected the surface of the cortex at anglesof 25°, 20° and 20°. The pattern of shifts in each ofthe three penetrations was highly regular, and theslopes of the three graphs were reasonably similar,with values, corrected for inclination to the surface,of -221, -232, and -2807mm. It is difficult to con-trol the exact point of entry in a penetration that isclose to tangential, and penetration 1 overlappedthe other two for only about one-half of its length.
A reconstruction of these penetrations fromthe histology is shown in Figure 9. To the left in thefigure the three penetrations are viewed fromabove, as though projected onto the plane of the cor-tical surface; in the right half of the figure they areviewed from the side as in Figure 8A. On compar-ing the receptive-field orientations in neighboring
Fig. 7B. Graph of orientation vs. tract^ distance. Closed cir-cles, ipsilateral eye; open circles, contralateral. The relativecounterclockwise displacement of the graph at the point oftransition from one eye to the other near the beginning of thepenetration was caused by a relative extortion of the twoeyes.
tracks one can imagine the slab walls running inroughly the directions indicated by the thin contin-uous lines. These lines are drawn every 45° exceptin one place where they are spaced at 9° to give anindication of the probable upper limit of the columnthickness. The lines representing the tracks areshown as continuous in regions of ipsilateral-eyedomination, and interrupted where the contralat-eral eye dominated. While there is too little territorymapped to do more than suggest roughly the formof the ocular-dominance columns (dotted lines),one can at least get some idea of their size relative tothat of the orientation columns.
The abrupt breaks in penetration 2 (Fig. 8C)have already been discussed above (Fig. 3). Curi-ously, just at the second discontinuity the cellsresponded to specifically oriented red slits but notto white stimuli of any kind. We have previouslyobserved that color-coded cells in the monkey stri-ate cortex tend to be aggregated in small groups(Hubel and Wiesel, '68), but whether or not theseare columnar is not known. That such a groupoccurred here together with discontinuities in themain orientation sequence is interesting, and per-haps not entirely coincidental since it may be thatgroups of color-coded cells are interjected as sepa-

Fig. 8A. Reconstruction of three closely spaced penetrations (Pj - P^) in right striate cortex. Each penetrationwas in theparasagittalplane, with Pj most medial, P2 200[l lateral to it, and P3 200 fj. lateral to P2. In the recon-struction, the three are seen in profile, as though they were in the same parasagittal plane. All three penetrationswere restricted to layers I—HI. (Experiment No. 5)
Fig. 8B. Orientation vs. tract{ distance ofP}. The gap begin-ning at about 0.95 mm is caused by the first lesion (L;).Activity at the outset was dominated by the left eye (con-tralateral, open circles), but the dominance soon switched tothe ipsilateral eye, and finally it switched bact( again to thecontralateral at 1.5 mm. Angle to surface, 25°. Slope of thefirst, descending, sequence, -2007mm uncorrected,—221°/mm corrected, for the inclination of the electrode.
Fig. 8C. Graph for P2, of orientation vs. trac\ distance. Elec-trode inclination 20°; slope of the main sequence, uncor-rected for inclination, -2187mm; corrected, -232°/mm. Fordescription of the breads in the sequence at 0.3 mm and 0.6mm, see text and Figure 3.
340

Sequences of Orientation Shifts 341
Fig. 8D. Orientation vs. tracf( distance for P3. Electrodeinclination 20°. Slope -262°/mm uncorrected, —280°/mmcorrected, for inclination.
rate islands with separate sequences of orientation,in an otherwise well-ordered matrix of columns.No color-coded cells or abrupt jumps were seen inthe other two penetrations, but in the reconstruc-tion the clockwise sequence of penetration 2 isphysically very close to the similar clockwise pro-gression at the end of penetration 1, and is proba-bly related to it.
A second set of parallel penetrations in a nor-mal monkey is illustrated in Figure 10 and recon-structed in Figure 11. Here the lateral spacingbetween penetrations was 0.1 mm; again one of thepenetrations entered some distance beyond theothers so that there was no overlap with them. Theslopes of all three penetrations were again verysimilar, and the reconstruction of penetrations 2and 3 are once more consistent with the idea thatthe columns are parallel slabs.
Area 18In one monkey six penetrations were made in area18 and 111 shifts in orientation were observed. Onepenetration in which 44 cells were recorded is illus-trated in Figure 12. The animal had had one eyeremoved at birth for a different study, so that vari-ation in ocular-dominance could obviously not be
examined. Although six penetrations are far fromenough to allow any close comparisons betweenareas 17 and 18, it is clear that in area 18 orientationcolumns are present and are systematicallyarranged, with similar long sequences of orienta-tion shifts broken occasionally by reversals. A sim-ilar orderliness in arrangement of orientationcolumns in area 18 was previously observed in thecat (Hubel and Wiesel, '65, Fig. 32). The fineness oforientational representation and the size of thecolumns seem not to differ very greatly in area 17and 18.
Recordings from CatFour penetrations were made in the striate cortexof one cat. Systematic variations in orientationwere seen in all four penetrations, two of which aredescribed in Figure 13. Penetration 1 was almostperpendicular to the cortical surface, and penetra-tion 4 in its latter part was almost parallel. As in themonkey, the slope of the graph of orientation vs.track distance was much less for the perpendicularpenetration.
In comparing cat and monkey one major dif-ference suggested by Figure 13 is in the size of theorientation columns. In the tangential penetration(P. 4, Fig. 13C) steps were evident, whereas in themonkey, as already mentioned, the steps were usu-ally too small to be resolved by our methods exceptin nearly perpendicular penetrations. The hori-zontal distance/orientation shift for this penetra-tion was 73 |I, compared with a mean of 43 (1 in themonkey. The column thickness suggested by sur-face mapping techniques in our previous work inthe cat was about 100 \l (Hubel and Wiesel, '63,Fig. 4).
The histological sections in the region of thistangential penetration were especially favorablefor comparing numbers of radial bands of cellswith the steps seen physiologically, since the pointof entry into cortex from white matter was clearlymarked by the track, and the end of the track by alesion. We counted roughly 35 bands along thistrack (23 bands/mm, i.e., average width of band 43J4,) whereas the number of observed shifts was 17(14/mm, average distance between shifts 73 |l). Asin the monkey, the two seem to be about the sameorder of magnitude, the number of bands/mmagain being somewhat larger than the number ofshifts.

342 PART III NORMAL PHYSIOLOGY AND ANATOMY
Fig. 9. Reconstruction of the threepenetrations of Figure 8. To the rightof the figure the traces are seen fromthe side, as in Figure 8A. To the left,the three penetrations are seen asthough the cortex were viewed fromabove. Each penetration is drawn as avertical line, continuous for regions ofcontra lateral-eye dominance, inter-rupted for ipsilateral. Blacf^ dots indi-cate points where the penetrationsbegan: in P^ no activity was recordedfor roughly the first 1 mm. Dottedlines are intended to suggest bound-aries between ocular-dominance col-umns. Continuous thin lines indicateboundaries of orientation columns,spaced at 45° except near L$, wherespacing is 9° to give a rough impres-sion of the size of the individual ori-entation columns.
DISCUSSION
The Column ConceptThe results of this paper indicate that orientationcolumns are highly ordered and probably have theform of parallel slabs. This seems to be true in thecat as well as in the monkey and in area 18 as wellas in area 17. That stimulus orientation turned outto be so systematically related to position along thecortical surface was not entirely a surprise, since wehad observed a compelling example of it before(Hubel and Wiesel, '68). Until the present study,however, with the use of lower impedance elec-trodes and the plotting of orientation against dis-tance, we had not realized that the orderliness isthe rule rather than the exception. Since such ahighly patterned machinery must surely have some
important biological significance, it may be usefulto think through once more the concept of the cor-tical column before discussing the implications ofthe orderliness.
The cortical column may generally be lookedupon as arising from the necessity to portray morethan two variables upon a two-dimensional sur-face. The two surface coordinates are used up bythe topographic representation of the visual fields,and it is the engrafting upon this representation oftwo more variables in the form of receptive-fieldorientation and ocular dominance that leads to thetwo sets of subdivisions. It is important here toemphasize the hierarchy: the topographic projec-tion is the primary one, and for each position in thevisual field there is a machinery for each orienta-tion and for each eye. How the topographic repre-

Fig. 10. Graphs of orientation vs. trac^distance for three parallel penetrations in parasagittal planes 100 fj. apart.(The three reconstructions are seen in profile and plan views in Fig. 11.) Slopes, uncorrected and corrected forelectrode inclination, Pp 204, 208; P2, 363, 424; P? 307, 358—all in "/mm. P, entered the cortex behind theother two, so that the total extent of cortex explored was about 2.2 mm, throughout which the trend of orienta-tions was clockwise, going posteriorly. (Experiment No. 6.)
343
TRACK DISTANCE - mm

344 PART III NORMAL PHYSIOLOGY AND ANATOMY
Fig. 11. Reconstruction of threeparasagittal penetrations 100 [imapart, whose graphs of orientation vs.tracl{ distance appear in Figure 10.Side view is shown in the right part ofthe figure', surface view on the left.The large dots indicate points ofentry of electrode into cortex; in P7
and Pj no responses were recorded forthe first 0.5-0.75 mm.
sentation and the two columnar systems interre-late, in detail, is taken up in a later paper (Hubeland Wiesel, 74a).
That we speak of the cortex as a two-dimen-sional structure in this context is deliberate, for thethree variables, visual-field position, orientation,and ocular dominance, all remain virtually con-stant during a perfectly perpendicular penetration.The cortical depth dimension is apparently con-cerned with other problems, such as the relativecomplexity of cells and their hierarchical order. Fora columnar system, then, a prime criterion is thatthere be subdivisions extending vertically throughthe full cortical thickness, with walls perpendicularto the surface and to the layers. This is fulfilled by
the ocular-dominance columns, as we know fromboth anatomical and physiological evidence. Forthe orientation columns previous evidence (Hubeland Wiesel, '62, '63) has been reinforced, in thepresent paper, by comparing slopes of orientation-vs.-distance curves in perpendicular penetrationswith those obtained in tangential or oblique ones.
The requirement that the walls of the colum-nar subdivisions be perpendicular to the surfaceand to the layers predicts a cylindrical shape (or aconical shape, if the cortical surface is curved). Since"cylinder" summons up visions of highball glasses,coins, or Greek pillars, the word "column" origi-nally seemed a natural choice. In the somatosensorysystem, where the term was first used by Mountcas-

Sequences of Orientation Shifts 345
Fig. 12A. Penetration in monkey area 18. Electrode enteredthe cortex in the parasagittal plane just anterior to the 17-18border.
tie ('57), the geometry is still unclear, but in the twocolumn systems so far described for the visual cor-tex the cylinders seem to take the extreme form of aset of sheets, a shape that does not come to mind onhearing the word "column." We retain the termpartly for historical reasons and partly because it hasbecome associated, in cortical physiology, as muchwith the principle of grouping of cells with certainphysiological similarities, as with any special shape.
Furthermore, before considering a change in ter-minology, it is well to note that even in the ocular-dominance system, where by anatomical methodswe have obtained some inkling of the surfacemosaic, the form seems to be one of stripes only to afirst approximation: in some experiments thestripes seemed to subdivide and rejoin or to becrossconnected, occasionally to such an extent thatthe geometry resembled an interlacing kind of lat-tice rather than parallel plates (Hubel and Wiesel,72, Fig. 17).
An additional requirement that has usuallybeen insisted upon for a columnar system is thatthe subdivisions be discrete. This means thatwithin a certain finite volume of cortex the variableconcerned must remain constant. The ocular-dominance columns are certainly discrete, andhence properly named. With the orientationcolumns, on the other hand, the situation is lessclear, especially in view of the present results. Intangential or oblique penetrations in the monkeyany discrete steps were too small to be resolved,since every clear-cut advance of the electrode wasaccompanied by an orientation shift. The onlyexceptions to this were the relatively infrequentbut nevertheless very clear large shifts such as thetwo illustrated in Figure 3; in cases like these there
Fig. 12B. The graph of orientation vs. trac1{ distance shows that orientation varied systematically with position.This animal, from a separate study, had had its right eye removed from birth, so that nothing can be said about
eye dominance. (Experiment No. 2.)

Fig. 13A. Cat striate cortex. Reconstruction, in the coronal plane, of two penetrations in the postlateral gyrus,roughly at Horsley-Clarl^ P 2.0. Penetration in right hemisphere was virtually perpendicular to the layersthroughout. On the left side the electrode passed through the dorsal thickness of grey matter, and then throughwhite matter, finally re-entering the mesial segment of striate cortex, intersecting the radial fascicles at about 87°.(Experiment No. 8.)
Fig. 13B. Graph of orientation vs. tracf( distance for the perpendicular penetration in the right hemisphere.Slope, uncorrected, 54°/mm.
346

Sequences of Orientation Shifts 347
Fig. 13C. Graph of orientation vs. trac\ distance for the fart of the penetration in the left hemisphere indicatedby a continuous line. Slope, corrected for the 3" inclination, —165°/mm.
can be no doubt that the change in orientation withmovement parallel to the surface was abrupt anddiscrete. Otherwise the notion that the orientationshifts are discrete relies, in the monkey, upon a veryfew penetrations that were virtually perpendicularto the surface, in which the distance from slab toslab was presumably magnified, and in which thecurves showed clear steps (Fig. 4B). In the cat cor-tex, where the columns are probably thicker, stepswere apparent even in a penetration parallel to thesurface (Fig. 13C), so that here the existence of dis-crete orientation columns seems reasonably clear.
Though it is conceivable that orientation mayvary continuously with movement along the cor-tex, there are certain difficulties in the idea. Takenliterally, it is contradicted by the fact that the cellswhich make up the cortex and from which onerecords are discrete entities. A kind of continuousvariation might nevertheless be achieved if therewere a small random variation in the orientationsof neighboring cells, and if accompanying horizon-
tal movement through the cortex there were super-imposed a steady drift or progression in the orien-tation. This would be analogous to the randomvariation or staggering in receptive-field positionsof neighboring cells, upon which is superimposed asteady drift in receptive-field position with move-ment parallel to the surface. We did not, however,observe any such random variations in orientation,from one cell to the next. Variations comparable tothose seen in receptive-field position would haveproduced jagged curves, not the smooth monoto-nic ones found in this study. Moreover the multi-unit background activity showed an orientationpreference that was generally the same as that ofsimultaneously recorded cells, and no less sharplytuned. There is thus no evidence to support theexistence of a local random variation in orientation,but at present this possibility cannot be ruled outconclusively.
To recapitulate, the orientation slabs in themonkey, if discrete entities, are so thin that they

348 PART III NORMAL PHYSIOLOGY AND ANATOMY
Fig. 14. Theoretical effects of varying the angle between a setof parallel orientation slabs and a tangential electrode, uponcurves of orientation vs. tracf( distance. The uppermost curvecorresponds to a head-on 90C'intersection of the electrode andthe slabs; a slope of400°/mm was arbitrarily selected for theexample because the steepest experimental curves were in therange of 400—450°/mm. As the angle between the electrodeand the slabs varies, the slope falls according to the sine of theangle, with little change up to about 40—50°, giving curvesthat are far from flat even at 20°. Thus if tangential penetra-tions intersect the slabs at random angles there should be ast^ew distribution of slopes, with a preponderance of steepcurves. If the slabs are parallel but curved, reversals in direc-tion of rotation from clockwise to counterclockwise or bacl^should be abrupt.
cannot be clearly resolved in tangential penetra-tions, because of imprecision in measurementsboth of electrode distance and receptive-field ori-entation. The evidence favoring discrete entitiescomes from perpendicular penetrations, from theoccasional abrupt discontinuities seen in tangentialpenetrations, and from results in the cat, where thecolumns are coarse enough to be resolved. Thealternative notion, that substantial regions of visualcortex are organized with respect to the orientationvariable in some kind of continuous manner, can-not be ruled out, though it seems rather less likely.Independent of which alternative is correct, thecentral concept of a subdivision of cortex intoregions of common orientation specificity by sur-faces arranged perpendicular to the cortical layersstill holds. If the slabs are not discrete it obviouslybecomes incorrect to speak of steps of 9—10° or slabs25-50 (I thick, but the notion of 180° being covered
in 0.5—1 mm movement normal to the surfaces isstill valid.
If one accepts the notion that the orientationcolumns are discrete, with an interval of roughly9-10°, does this mean that orientation over theentire 180° is quantized into 18—20 strictly definedgroups in terms of angle? If, beginning at a certainpoint on the cortex, corresponding to a certainoptimal stimulus orientation, one proceeds alongthe surface from orientation to orientation until afull cycle of 180° has taken place, will one havereturned to precisely the same orientation, or will itbe slightly different? At present we have no way ofknowing the answer to this, and given the breadthof the tuning curves and the limitations in preci-sion of measurement, it is not likely that an answerwill be easily found. Intuitively the idea of strictquantization seems somewhat unattractive, sinceto develop such a system would probably be moredifficult, with no obvious advantages over thefuzzier alternative.
To summarize: the column is usually definedas a discrete aggregate of cells whose shape is thatof a sheet, or more generally a cylinder, with wallsperpendicular to the surface. The physiologicalvariable that defines a set of columns is representedby being engrafted upon a pre-existing two-dimensional mapping. Although field position inthe cortex remains constant (aside from a randomscatter) along the depth axis, this by itself does notresult in a columnar system unless one is willing tosee the concept of the column degraded, since thereare no discrete aggregates, and since the topogra-phy itself forms the system upon which columnsare engrafted. Similarly the projection-line systemof topographic representation in the lateral genicu-late body (Bishop et al., '62) should not be regardedas columnar. The mouse cortical whisker barrelsare certainly discrete (Woolsey and Van der Loos,70), but they constitute a topographic representa-tion rather than being superimposed on one.Whether they should be considered columns seemsa matter of taste and semantics. The orientationcolumns, finally, if discrete, certainly fall within thedefinition of the term column. If orientation variescontinuously with distance there are again seman-tic difficulties—either one must broaden the defi-nition of the column or decide that the system is notstrictly columnar. In fact, however, the distinctionmay be somewhat academic, since if the columns

Sequences of Orientation Shifts 349
are discrete their thickness is close to the size of asingle cell body.
Geometry of Orientation ColumnsEver since our finding with silver-degenerationtechniques that ocular-dominance columns are to afirst approximation slab shaped, we have hoped tofind a similar method for revealing the shape of theorientation columns. None has yet been forthcom-ing, though direct physiological evidence for a slabshape was obtained by making multiple superficialpenetrations in the cat (Hubel and Wiesel, '63), andby reconstructions of parallel penetrations in thepresent study. To obtain a more exact idea of theshape of the slabs will require more studies usingmultiple penetrations but meanwhile we are givena much better insight into the geometry of thecolumns by the observation that their arrangementis highly regular. The slab shape, in fact, seems aninescapable consequence of the regularity. Supposethat whenever an electrode moves tangentiallythrough the cortex it records either small regularorientation shifts or no shifts at all. Then a three-dimensional graph of orientation (as the Z-axis)against cortical position (X- and Y-axes) will give asmooth surface, or strictly speaking one terraced in9—10° steps. Each of the curves of orientation vs.track distance simply represents the intersection ofthis surface with a plane perpendicular to the X-Yplane and passing through the electrode track. Onsuch a surface the contour lines of constant orienta-tion represent the column mosaic as it appearswhen the cortex is viewed face-on. These contourlines define the tops of the slabs. Thus withoutappealing to rigorous arguments involving topol-ogy or mathematical theories of continuity it seemsintuitively obvious that the absence of breaks inregularity implies a set of slabs. These may bestraight or curved depending on the shape of thesurface in the three-dimensional graph.
If the columns indeed have the form of slabs,one may predict that in tangential penetrationssome of the tracks should thread their way alongthe plane of the slabs, producing a flat or nearly flatgraph of orientation vs. track distance just as wasobtained with penetrations perpendicular to thesurface. In this study most tangential penetrationsgave relatively steep curves. Since most penetra-tions were made in the parasagittal plane, onewonders if the slab orientation is constant, from
animal to animal, running perpendicular to theparasagittal plane, i.e., parallel to the 17-18 borderbehind the lunate sulcus. This seemed only aremote possibility until recently, with the findingthat the ocular-dominance columns do in fact havea consistent pattern from animal to animal, inter-secting the 17—18 border at right angles (LeVay etal., '75). As mentioned below, it is theoreticallyattractive to suppose that the two sets of slabs, ifthey have any constant relationship, intersect eachother at right angles.
It turns out, however, from simple trigonom-etry, that a parameter such as the slope of thesecurves is very little affected by the angle of inter-section of a horizontal track with the slabs, untilthat angle becomes very small. As an example (Fig.14), suppose that an electrode intersecting the slabsat right angles were to give a curve of slope400°/mm. How is the steepness of the curveaffected for approaches different from 90°? Thecalculations show that the change in slope forangles up to about 50° is slight (the slope is 400 sin50°, or 306°/mm), and even at 20° the curves arehardly what would be called flat (137°/mm). Thesame applies to variations in the angle between theelectrode and the surface of the cortex, and indeedcurves as flat as those of Figures 4B, 5B (first part)and 13B were obtained only in penetrations thatwere within a few degrees of perpendicular. Thusin tangential penetrations, at what are presumablyrandom angles with respect to the slabs (since wedo not have any idea of the slab orientations), theslopes cannot be expected to be distributed evenlybetween some maximum value, such as 400°/mm,and zero. In fact the slopes we obtained (Table 1)were not so distributed but were, as would be pre-dicted, skewed markedly towards higher values.
One curious property of the orientationcolumns, illustrated in Figures 2A and 8B, is thereversal of the sequences from clockwise to coun-terclockwise and back between uninterruptedspans of the order of 270—360°. Only more ambi-tious mapping will help in understanding the ori-gin of these reversals. Possibly the columns are vir-tually straight parallel slabs, and the order maysimply reverse at irregular intervals. This wouldmean that the surface generated by plotting orien-tation against position on the cortical surfacewould be corrugated like the bellows of a camera.The abruptness of the reversals might seem to

350 PART III NORMAL PHYSIOLOGY AND ANATOMY
argue for this: the curves of orientation vs. trackdistance are not at all sinusoidal, but the sequencesprogress with remarkable linearity and reverse notby gradual flattening but fairly suddenly. A secondpossibility, however, is that the slabs, viewed fromabove, are not straight but form whorls, in whichcase the surface would consist of mountains andvalleys. If that were so, a straight electrode trackwould constantly change its angle to the slabs, andwould be expected at times to become tangentialand then to reverse its direction through them. Onemight expect, on first thought, that this would givecurves with gradually changing slopes, but aspointed out above the slopes of the graphs are notgreatly affected until the approach becomes almosttangential. The result of this would be to increasethe abruptness of the reversals. The informationfrom reconstructions of parallel penetrations is sofar too fragmentary to allow us to choose betweenthese possibilities, but presumably more extensivemapping can settle the question.
The degree of order must be limited, for thereseem to be regions that are more or less chaotic, andthere are occasionally clear breaks between orderedregions, as if the slabs had been fractured or brokenapart and other parallel arrays inserted in differentdirections. These intercalated slabs may conceiv-ably represent some minor imperfections in devel-opment, or perhaps they have some special func-tion, as suggested in connection with color by theexperiment of Figure 8C. It seems likely that cellsconcerned with color are arranged in columns(Hubel and Wiesel, '68), and the relationship ofthese columns to the orientation slabs described inthis paper should be very interesting.
The geometric relationship between ocular-dominance columns and orientation columns isstill not clear, but the fact that when the electrodecrosses from a left-eye to a right-eye region there isno noticeable disturbance in the sequence of orien-tation columns argues for a certain degree of inde-pendence between the two systems. It would beinteresting to know whether the two sets of slabsare parallel or cut each other at right angles or haveany consistent relationship. We have argued previ-ously (Hubel and Wiesel, 72, p. 444) that it wouldput a great burden on the connections if the twocolumn systems were parallel. A binocular cellwith some particular receptive-field orientationmust receive its input from two sets of monocular
cells having the same receptive-field orientation;the two sets must, by definition, be located in sepa-rate ocular-dominance columns. Obviously it ismost efficient if the binocular cell and the monocu-lar cells supplying it are all housed in the same ori-entation column, for the alternative—the only onepossible if the two column systems are parallel—isto have connections run from one orientation col-umn through an entire array of interveningcolumns, stopping only when they reach the nextcolumn subserving the same orientation.
Histological CorrelatesIt is curious that in contrast to the horizontally-run-ning layers, which are obvious at a glance, theboundaries between the vertical columnar subdivi-sions seem not to be evident by ordinary stainingmethods. The ocular-dominance columns are high-ly discrete, especially in layer IV C, yet to identifythem histologically has required the use of special-ized silver-degeneration techniques following lam-inar geniculate lesions, a method which depends onthe fact that left-eye and right-eye columns differbecause their inputs differ (Hubel and Wiesel, '72).Orientation columns are distinguished from eachother by differences in intracortical connections,and consequently no analogous method is possiblefor their demonstration. It may be that the verticallyrunning bands of cells are the slabs cut in transversesection: the measurements are consistent with this,for in the present series the horizontal distancebetween shifts was less than double the size of thebands in penetrations in which the two were com-pared. One would perhaps not expect better agree-ment, since some orientation shifts were probablymissed, and the figures for distance between shiftswere consequently probably overestimates. If thevertical bands of cells do indeed represent orienta-tion slabs cut in cross section, tangential sectionsthrough the cortex might also be expected to revealparallel lines of cells, straight or in whorls. In a fewobservations in the monkey we have so far seennothing like this.
In this context the question discussed above ofwhether the orientation columns are discrete ormerge continuously may be of some importance; ifthe variation is in some sense continuous onewould hardly expect to find discrete anatomicalsubdivisions. Perhaps, indeed, the solution to thisproblem of discreteness vs. continuity should be

Sequences of Orientation Shifts 351
sought using anatomical rather than physiologicalmethods.
There is one puzzling apparent discrepancybetween these physiological results and the mor-phology. The orientation-column (or slab) thick-ness is at most in the order of 25-50 (1, yet from sec-tions of Golgi material most cells are known tohave dendritic and axonal arborizations thatextend, apparently in all directions, for distances ofup to several millimeters. Perhaps the connectionsmade by these processes have a selectivity nothinted at by the anatomy, for the physiological re-sults predict strongly that different orientationcolumns should not be linked by important excita-tory connections. Neighboring columns might, onthe other hand, be linked by inhibitory connectionssubserving movement directional selectivity or thesharpening of response-vs.-orientation tuningcurves. At present one can only say that, except forthe cortical barrels seen in mice and related species(Woolsey and Van der Loos, '70), there is no exam-ple of a correlation between any of the columnsyet described and the Nissl, Golgi or electron-microscopic anatomy.
The presence of highly ordered orientationsequences in area 18 deserves some comment. Area18 in the monkey receives a powerful, systematicand orderly projection from 17 (Spatz et al. '70), butunlike area 18 in the cat it has not been shown toreceive any direct input from the lateral geniculatebody. For example, after small discrete lesions madein single dorsal or ventral layers of the geniculatewe found no obvious Nauta degeneration in area18, despite a careful search of the parts of 18 topo-graphically corresponding to the lesion sites (Hubeland Wiesel, '72). Other inputs to area 18 in themonkey, for example from thalmus outside thegeniculate, are at present conjectural. Thus the onlywell established direct visual input to 18 comesfrom 17. It therefore seems likely that a cell in 18with high orientation specificity derives those prop-erties from cells in 17 having the same orientationspecificity and receives no important excitatoryinputs from cells with different optimal orienta-tions. By extension, cells within a given orientationcolumn must receive most of their inputs fromcolumns with identical orientations in 17. The factthat receptive fields in 18 are several times largerthan those in 17 (Hubel and Wiesel, unpublished)suggests that several columns of like orientation
specificity in 17 may feed into one column in 18. Inany case, the existence of two similar columnar sys-tems in the two visual areas implies a specificity ofl7-to-18 connections far transcending a mereregion-to-region projection.
Biological Advantages of OrderedOrientation ColumnsWhat advantage can such an ordered system of ori-entation columns be to the animal? We have sug-gested before that an economy of connections mayresult if columns subserving very similar orienta-tions are close together. To build a simple receptivefield from a set of geniculate afferents whose "on"or "off" field centers are arranged along a line callsfor a specific set of convergent connections. Bydropping a few geniculate inputs and adding a few,the orientation of the line can be changed slightly,but the inputs to the old line and the new will stillbe largely the same. On the other hand, two over-lapping simple receptive fields with very differentorientations would have far fewer afferents incommon. Undoubtedly the wiring is made simplerand more efficient if cells with similar inputs areclose together.
A second possible advantage is related to thesuggestion by Blakemore and Tobin ('72) that ori-entation selectivity may be sharpened by a cell'sreceiving inhibitory inputs from cells with slightlydifferent orientations, in a fashion analogous to thesurround inhibition of receptive fields of retinalganglion cells and geniculate cells. Again it wouldbe an advantage, in terms of efficiency of wiring, ifthe interconnected cells could be kept closetogether. Psychophysical observations (Blakemoreet al., '70) support the idea of mutual inhibitionbetween neighboring orientation columns, but it isdifficult to think of a direct way of testing thisphysiologically. Although Blakemore's experi-ments showing an inhibitory effect from a grid oflines moving outside the activating part of a corti-cal receptive field are suggestive, his results can alsobe explained by supposing that the cells hedescribes have hypercomplex properties.
As a third possibility, an orderly arrangementof columns may have advantages for development.Perhaps the order reflects a mechanism for guar-anteeing that all orientations be represented onceor only a few times in each part of the visual field,with no omissions and minimal redundancy. In

352 PART III NORMAL PHYSIOLOGY AND ANATOMY
this connection, the third paper in this series pres-ents evidence that the entire ordered system isinnately determined, and does not depend for itsdevelopment on early experience (Hubel andWiesel, 74b).
ACKNOWLEDGMENTS
We wish to thank Sandra Spinks, David Freeman and ClaireWang for technical assistance. The work was supported byNIH grants 5R01EY00605 and 5R01EY00606, and a grant fromthe Esther A. and Joseph Klingenstein Fund, Inc.
Literature Cited
Bishop, P. O., W. Kozak, W. R. Levick and G. J. Vakkur 1962The determination of the projection of the visual field on tothe lateral geniculate nucleus in the cat. J. Physiol., 163:503-539.
Blakemore, C., and E. A. Tobin 1972 Lateral inhibition betweenorientation detectors in the cat's visual cortex. Exp. BrainRes., 15: 439-440.
Blakemore, C., R. H. S. Carpenter and M. A. Georgeson 1970Lateral inhibition between orientation detectors in thehuman visual system. Nature, 228: 37-39.
Daniel, P. M., and D. Whitteridge 1961 The representation ofthe visual field on the cerebral cortex in monkeys. J. Phys-iol., 759: 203-221.
Hubel, D. H., and T. N. Wiesel 1962 Receptive fields, binocularinteraction and functional architecture in the cat's visualcortex. J. Physiol., 760: 106-154.
1963 Shape and arrangement of columns in cat's striatecortex. J. Physiol., 765: 559-568.
1965 Receptive fields and functional architecture in twonon-striate visual areas (18 and 19) of the cat. J. Neurophys-iol., 28: 229-289.
1968 Receptive fields and functional architecture ofmonkey striate cortex. J. Physiol., 795: 215-243.
1972 Laminar and columnar distribution of geniculo-cortical fibers in the macaque monkey. J. Comp. Neur., 146:421-450.
1974a Uniformity of monkey striate cortex: a parallelrelationship between field size, scatter, and magnificationfactor. J. Comp. Neur., 158: 295-306.
1974b Ordered arrangement of orientation columns inmonkeys lacking visual experience. }. Comp. Neur., 755:307-318.
LeVay, S., D. H. Hubel and T. N. Wiesel 1975 The pattern ofocular dominance columns in macaque visual cortexrevealed by a reduced silver stain. J. Comp. Neur. (in press).
Mountcastle, V. B. 1957 Modality and topographic properties ofsingle neurons of cat's somatic sensory cortex. J. Neuro-physiol., 20:408-434.
Spatz, W. B., }. Tigges and M. Tigges 1970 Subcortical projec-tions, cortical associations, and some intrinsic interlaminarconnections of the striate cortex in the squirrel monkey(Saimiri). }. Comp. Neur., 140: 155-173.
Woolsey, T. A., and H. Van der Loos 1970 The structural organ-ization of layer IV in the somatosensory region (SI) ofmouse cerebral cortex. Brain Res., 77: 205-242.
AFTERWORD
What was lacking in the sequence-regularity study was a means of picturingthe map of orientations face-on, for without that it was almost impossible tointerpret the reversals and the breaks in the sequences of orientation versuselectrode track distance. This came suddenly, like a thunderclap, in 1985 ata Society of Neuroscience meeting in a 10-minute paper presented by GaryBlasdel, a young investigator in the labs of Jenny Lund, then in Pittsburgh.Gary had the idea of using TV techniques to detect optical changes accom-panying neural activity in the cortex, but was told it was not possible becauseof noise, weakness of signals, and so on. Urged on by Jenny he persisted, andsucceeded, and here suddenly was the memorable map with color standingfor orientation, with all the whorls that later came to be called pinwheels.
Gary's maps relied on the use of voltage-sensitive dyes, which had firstbeen developed at Yale by Amiram Grinvald and Larry Cohen, in Larry'slab. The technique was further developed in Torsten's lab by Grinvald andTobias Bonhoeffer, and has become one of the most important modernmethods for cortical mapping. The voltage-sensitive dyes enhance the sensi-tivity of the technique, but are toxic to the cortex, so it was a step forwardwhen Amiram Grinwald discovered that the dyes are not strictly necessary,and that what became known as intrinsic signals could supply the entire pic-

Sequences of Orientation Shifts 353
ture. This has made it possible to employ the method in human neuro-surgery.
I must hasten to add that the two authors of the present book are not infull agreement over the history of the development of these optical methods.In a scientific partnership that lasted 25 years and that goes back 40 years, itwould be surprising if the two of us had not found one or two things to dis-agree on, and on this story I believe the two of us are in agreement—that wedisagree!
The optical methods have gone a long way in explaining the reversalsin direction of orientation shifts, but have perhaps been less successful inexplaining the fractures. And I still have no clear idea of the exact relation-ship between the pinwheel centers, sometimes called singularities, and thecenters of blobs. Recent work by Eric Schwartz suggests that the apparentoffset in the positions of blobs as shown in cytochrome-oxidase stains, andpinwheel centers as revealed in the optical recordings, may be an artifactcaused by the limitations in resolution of the optical method and by averag-ing vectors as opposed to sealer quantities. Probably the most important lim-itation has been the method's inability to map parts of the cortex that are hid-den from the brain surface by being buried in sulci. Surely future technicaladvances will overcome this limitation.

Chapter 20 • Cortical Modules andMagnification in Monkeys •
FOREWORD
This is one of our all-time favorite papers, occupying in our minds a placebeside the 1959 and 1962 cortex papers. It resembles the 1962 cortex paper indeepening our understanding of this fascinating structure. It goes beyonddescription and attempts to get at the essence of what the cortex in generalmay be doing. It addresses the question of what determines the three-dimen-sional shape of any cortical area, and how any one area of cortex can be souniform anatomically despite certain marked variations in function as thesurface is traversed—in the case of area 17, variations especially in field sizeand magnification.
Our study stemmed from the discovery in the early 1960s, by Danieland Whitteridge, (] Physiol 1961, 159:203-221), that the topological shape ofthe cortex—whether it is a plane or a sphere or something else—is dictatedby its function. They were the first, to our knowledge, to point out that, inconsidering shape, what counted was the form taken by the cortical platewhen the trivial crinkles are smoothed out. A paper crumpled before throw-ing it in the wastebasket is still basically a flat surface. In the case of the cor-tex, what one wants to know is the essential shape revealed when one goesinside the structure and blows gently. This is in effect what Daniel andWhitteridge did by using serial sections of cortex to model it in rubber, anddiscovering that its shape after unfolding was neither flat nor spherical, butrather like a pear. Given that the eye is necessarily spherical, as it has to be foroptical reasons, one might have expected the cortex to have that shape too.But Daniel and Whitteridge showed that the pear shape could be exactlypredicted from the variations in the retina-to-cortex magnification (a termthey originated): the fact that the number of millimeters of cortex corre-sponding to a degree of visual field varies in a regular and consistent waywith distance from the fovea (the eccentricity).
Around 1961 Whitteridge visited our group at Harvard and gave aseminar in which he demonstrated his India-rubber model and how it couldeasily be refolded to reproduce the shape it has in the skull, with calcarine fis-
354

Cortical Modules and Magnification 355
sure and all. At the time I thought it only mildly interesting, but slowly cameto appreciate its profundity. It gradually dawned on us that any corticalregion must have some basic (unfolded) shape and that the exact shape mustbe dictated by its function. So the somatosensory hand representation shouldbe that of a distorted glove, perhaps with rips and splices, given the obviousawkwardness of having a region of cortex with anything like the shape of aglove.
The second realization that led to this paper came as a result of a visit Ipaid to Tubingen, where I presented our work on columns. WernerReichardt was in the audience, and in the discussion he asked how the shiftsin orientation, as one proceeded along the cortex, were related to positions ofthe receptive field in the visual field. If you got into a new region of visualfield without having covered all the orientations, what then? We had takenit for granted that steady movement across the visual field, on moving alongthe cortex, would be slow enough that the visual fields would not be pep-pered with scotomata for specific orientations. I remember thinking that hisquestion was rather silly. And once more, as weeks went by, it dawned on usthat the question was profound. So we did experiments to correlate positionsof receptive fields in the visual field, field size, and magnification—as onemoved across the cortex. Was there a systematic relationship between the x-y cortical topography and receptive field size? Would examining it tell usanything interesting about the cortex in general?
The result was deeply satisfying in extending our ideas about how theretina can be so non-uniform; for example, there is a huge difference in layerthickness near the fovea and far out from it, whereas the visual cortex showsno comparable variations in thickness. The study also led to the concept ofmodules, small blocks of cortex each carrying out a set of functions withroughly the same machinery, for a given region of visual field. The termmodule seems not to be used in our papers. Where it originated, in the con-text of cortical function, is not clear to us, though I use it in the title of Chap-ter 6 in my book Eye, Brain and Vision (Scientific American Libras, Leslesz,New York, 1988), to refer to these blocks of cortex. The term hypercolumndesignated all the columns of a given type (either ocular dominance or ori-entation) within a module. So within any one module, an ocular dominancehypercolumn would mean a left- plus a right-eye column; and an orientationhypercolumn would mean a set of columns subserving each orientation, onceonly. Some writers have used the term hypercolumn as roughly synonymouswith module, to mean a complete set of columns of all kinds. That was nothow we defined the word, but terminologies do tend to get degraded overtime, and we should perhaps be tolerant.
Obviously, we are talking about these chunks of cortex not in a literal,but in an abstract sense, as it is arbitrary where one module begins and whereit leaves off.
356 PART III NORMAL PHYSIOLOGY AND ANATOMY
Uniformity of Monkey Striate Cortex: A Parallel Relationshipbetween Field Size, Scatter, and Magnification Factor
DAVID H. HUBEL AND TORSTEN N. WIESEL • Department of Neurobiology, Harvard Medical School, 25
Shattuck Street, Boston, Massachusetts 02775
ABSTRACT
This paper is concerned with the relationship between orientation columns, ocular-dominancecolumns, the topographic mapping of visual fields onto cortex, and receptive-field size and scatter.Although the orientation columns are an order of magnitude smaller than the ocular-dominancecolumns, the horizontal distance corresponding to a complete cycle of orientation columns, repre-senting a rotation through 180°, seems to be roughly the same size as a left-plus-right ocular domi-nance set, with a thickness of about 0.5—1 mm, independent of eccentricity at least out to 15°. We usethe term hypercolumn to refer to a complete set of either type (180°, or left-plus-right eyes).
In the macaque monkey several penetrations were made at various eccentricities in variousparts of the striate cortex subserving the fovea, parafovea and midperiphery. As observed many timespreviously, in any vertical penetration there was an apparently random scatter in receptive-field posi-tions, which was of the same order of magnitude as the individual receptive fields in that part of thecortex; the field size and the scatter increased in parallel fashion with eccentricity. The movementthrough the visual field corresponding to a 1 mm horizontal movement along the cortex (the recip-rocal of the magnification factor) also increased with eccentricity, in a manner that was strikinglyparallel with the increase in receptive field size and scatter. In parts of the cortex representing retina,at least out to about 22° from the fovea, a movement along the cortical surface of about 1 mm wasenough to displace the fields so that the new position they collectively occupied half overlapped theold. Such an overlap was thus produced by moving along the cortex a distance about equal to thethickness of a left-plus-right set of ocular-dominance columns, or a complete 180° array of orienta-tion columns. It therefore seems that, independent of eccentricity, a 2 mm X 2 mm block of cortexcontains by a comfortable margin the machinery needed to analyze a region of visual field roughlyequal to the local field size plus scatter. A movement of 2—3 mm corresponds to a new visual fieldregion and to several new sets of hypercolumns. The cortex thus seems remarkably uniform physio-logically, just as it is anatomically.
As a recording electrode moves through the mon-key striate cortex in a direction parallel to the sur-face, the position in the visual fields from whichresponses are evoked changes in a predictable man-ner, according to a systematic topographic map(Talbot and Marshall, '41; Daniel and Whitteridge,'61). Engrafted on this projection of the visualfields are two columnar systems, one subservingreceptive-field orientation, the other, ocular domi-nance. In the preceding paper (Hubel and Wiesel,'74) we showed that changes in orientation withtangential movement occur in a highly systematicmanner, in small, relatively constant steps of at
most about 10°. These orientation columns appar-ently have the form of parallel slabs, with a thick-ness of 25—50 )J, or less. We had found in a previousstudy that the ocular-dominance columns are like-wise slab shaped, with a thickness of 0.25—0.5 mm(Hubel and Wiesel, '72). Over the regions of cortexso far examined the dimensions of both columntypes are roughly constant, a result that is not unex-pected given the relative histological uniformity ofthe striate cortex.
From a different standpoint, however, thisrelative constancy of column size over the cortexseemed surprising, since it is known that the num-
F torn Journal of Comparative Neurology, Vol. 158, No. 3, December 1, 1974.
Cortical Modules and Magnification 357
her of degrees of visual field corresponding to1 mm movement along the cortex (the reciprocal ofthe magnification factor) is far from constant,being small for the foveal representation andlarger—by a factor of about 35—for the periphery.Both receptive-field size and scatter in the fieldpositions of neighboring cells are likewise small inthe foveal region and large in the periphery. Thepresent paper addresses itself to resolving thisapparent inconsistency between a relatively con-stant histological appearance and column size, onthe one hand, and a markedly inconstant magnifi-cation and field size, on the other. The crux of theproblem turns out to lie in the exact relationshipbetween field size, field scatter, and magnification,as position in the cortex (or in the visual field) isvaried. Our conclusion is that the cortex is, after all,a remarkably uniform structure.
METHOD
Seven penetrations were made in two normal adult rhe-sus monkeys. In all, 125 cells were studied. Methods ofrecording and stimulating were generally the same as inprevious studies (Hubel and Wiesel, '68, '74). Since inestimating field scatter and magnification it was impor-tant to determine the positions of receptive fields pre-cisely, we used an eye-monitoring technique originallydevised for measurements of retinal disparity (Hubeland Wiesel, '70). Cells were recorded in the usual waywith an electrode in one hemisphere, and eye positionswere monitored by recording from a single binocular cellfor long periods with a second electrode placed in theopposite striate cortex; after recording from each newcell with the main recording electrode we quicklychecked eye positions by switching the input stage to thereference electrode and re-mapping the receptive fieldsof the reference cell. Electrodes were selected to be fineenough to resolve single units easily, but coarse enoughso that there was a reasonably high likelihood of dual-unit recordings.
RESULTS
In our previous work in cats ('62) we observed anapparently random variation in receptive-fieldposition on recording from successive cells duringa penetration perpendicular to the cortical surface.
The amount of variation in receptive-field positionwas such that the total visual-field area covered bythe superimposed receptive fields in one penetra-tion was several times the area occupied by a singlefield; most of the fields either overlapped orabutted each other. In a long tangential penetra-tion, a gradual drift in field positions was superim-posed on the random scatter, but electrode move-ments of a few tenths of a millimeter were far toosmall for this drift to be apparent. We concludedthat there are limitations to the precision of thetopographic map of visual fields on to cortex.
In the monkey we have had the strong impres-sion that the organization is similar, but we wishedto re-examine the problem in order to learn moreabout the relationship between receptive-field sizeand amount of scatter on the one hand, and topog-raphy on the other. The first step was to record fromenough cells in a perpendicular penetration, in aparticular region of monkey cortex, to form an ideaof the range of receptive-field sizes and the amountof scatter. We monitored eye movements with a sec-ond electrode to be absolutely sure that the scatterwas real (METHODS).
In the perpendicular penetration of Figure 1,the receptive-field positions of 14 consecutivelyrecorded cells are superimposed. The penetrationwas made about 15 mm behind the lunate sulcusand 10 mm to the left of the midline, correspon-ding to a visual-field area 10° to the right of thefovea and 1—2° above it. The track ended in layerIV B, 1.3 mm from the surface. All cells werestrongly dominated by the right (contralateral) eye.As expected, the fields overlapped extensively, andthe total size of the region through which the fieldswere spread (about 4° X 4°) was several times theaverage size of the individual fields (about 1.3° X1.3°). Two pairs of simultaneously recorded cellsare indicated, one by heavy lines (13, 14) and theother by interrupted lines (15,16). In both pairs thefields are certainly not superimposed and in facthardly overlap, but instead come into contact alongone border: such a degree of separation in thereceptive fields of neighboring cells is not unusual,though it is more common to find some overlap.Simultaneous recordings such as these supply addi-
lNote on magnification factor: This term refers to millimeters of cortex corresponding to 1° of visual field (Daniel and Whitteridge, '61).The reciprocal of this index was found more useful in the present study. We designate it as "magnification"1." "Eccentricity" refers todistance from fovea, in degrees.

358 PART III NORMAL PHYSIOLOGY AND ANATOMY
Fig. 1. Scatter of receptive fields in a perpendicular penetration. Receptive-field positions of 14 consecutivelyrecorded cells from monkey striate cortex 10 mm to the left of the midline and 15 mm behind the lunate sulcus.The fields, mapped in the right eye, were 10°from the right fovea, just above the horizontal meridian. Fields 13and 14 (heavy lines) are mapped for simultaneously recorded cells, as are fields 15 and 16 (interrupted lines). Eyepositions are monitored with a reference electrode in the left striate cortex by repeatedly checking receptive-fieldpositions of a binocular cell. The scatter, relative to the receptive-field size, is typical for area 17.
tional evidence that the scattering is real and not anartifact produced by eye movements. The relation-ship shown in this figure between overlap and scat-ter is typical of what we have seen in all perpendi-cular penetrations in striate cortex.
Our next step was to determine the number ofdegrees of visual field corresponding to a 1 mmhorizontal movement along this part of the cortex,i.e., magnification""1. To do this we inserted theelectrode into the same cortical area but tilted it soas to penetrate in a posterior direction, making asacute an angle to the surface as feasible (30—35°).We first mapped the fields of whatever cells werewithin recording distance by stopping to stimulateand record each 20 (J, for the first 100 (J,. We thenquickly advanced the electrode 900 JI. The wholeprocedure was repeated, mapping out four or fivefields over the next 100 (LI and advancing a further900 (J,. In this way a group of fields was plottedroughly every millimeter until after four groups (adistance of 3 mm) white matter was reached. Theresults are shown in Figure 2. Several shifts in eyedominance were seen, as expected for a movementof this length: cells were influenced first by the lefteye only, next by both eyes with the right eyestrongly dominant, then by the two eyes equally,
and finally once more by the left eye only. Thus the3 mm penetration cut through at least three eye-dominance columns. At each advance of 1 mmthere was a displacement of the mean field positionupwards in the visual field, as expected from theknown topography. Each displacement was rough-ly the amount required to produce a 50% overlapbetween the new territory over which the fieldswere scattered, and the old. Allowing for the elec-trode inclination (30°), the value of magnification""1
corresponding to this eccentricity of 10° was esti-mated to be 0.65°/mm.
A similar experiment was done in the samemonkey for a region of the right striate cortexslightly further lateral and anterior, subserving avisual-field territory 7° from the fovea instead of10°. From the results shown in Figure 3, allowingfor electrode obliquity, it can be calculated that1 mm represents about 0.5° in the visual field. Asexpected, both the receptive fields and the scatterwere now smaller. Thus in both penetrations a1 mm movement through the cortex produced ashift of receptive-field positions that was largeenough to be obvious above the random stagger-ing, but still small enough so that the two sets offields overlapped.

Cortical Modules and Magnification
Fig. 2. Relationship between receptive-field size-plus-scatter and magnification for an eccentricity of 10°. Samemonkey as in figure 1, same region of cortex. In a penetration making an angle of'30° to the cortical surface, thefields of several cells were mapped in the first 0.1 mm and the electrode was advanced 900 fl • This procedure wasrepeated until white matter was reached. In this figure the first cluster of fields, marked "o," is drawn with thincontinuous lines; the second, marked "I," with dots, and so on. Note the alternation of eyes as the electrode passedthrough successive ocular-dominance columns.
The same procedure was repeated in two
more monkeys, in regions with eccentricities of 1°
and 4°. The diagram for 1° is shown in Figure 4.
From the inset, which is the same diagram drawn
to the scale of Figures 2 and 3, it can be seen that the
fields and scatter are now much smaller, and so is
the field displacement corresponding to each mil-
limeter of movement. Magnification l was calcu-
lated to be 0.257mm.
For more peripheral penetrations a different
strategy had to be adopted, since this part of the
cortex is buried deep in the calcarine fissure and
tangential penetrations are impractical. We there-
fore first made a long parasagittal penetration
Fig. 3. Relationship between field size-plus-scatter and magnification, for a 7° eccentricity. Same monkey as inFigures 1 and 2, right hemisphere. Angle between electrode tract^ and surface of cortex, 30°. Scale is the same asin Figure 2. Note the decrease in field size and scatter and in the displacement in position with each 1 mmadvance of the electrode.

360 PART III NORMAL PHYSIOLOGY AND ANATOMY
Fig. 4. Relationship between fieldsize-plus-scatter and magnification,for a 1° eccentricity. Here the scale ofthe figure is about four times that ofFigures 2 and 3, but the inset showsthe same diagram reduced to matchFigures 2 and 3. Different monkeyfrom that of Figures 1-3. Angle ofelectrode to surface, 5°.
(same monkey as that of the 4° penetration)through the convexity (8.5°) and through two foldsof the buried calcarine cortex (18° and 22°). A sec-ond penetration was then made parallel and 3 mmlateral to the first. The two tracks are reconstructedin Figure 5. As expected, the three field positionswere now slightly displaced. Each time a thicknessof cortex was traversed, four-six fields, on the aver-age, were mapped. Thus for each of three field
positions the average field size could be deter-mined, and magnification"1 obtained by dividingthe field displacements by three.
The results of all seven determinations areshown in Figure 6A, in which we plot magnifica-tion"1 (open circles) and field size (crosses) againstdistance from fovea. As a measure of field size wetook (length X width)0'5. Given the smallness of thesamples and the large variation in field size at each
Fig. 5. Reconstruction of two electrode traces, in two parasagittal planes 3 mm apart. Eccentricity for the sur-face traverse, 8.5°; for the two folds of the calcarine fissure, 18° and 22°. The results were used in plotting the 8.5°,18° and 22°points in Figure 6A.

Cortical Modules and Magnification 361
Fig. 6A. Graph of average field size (crosses) and magnification 1 (open circles) against eccentricity, for five cor-tical locations. Points for 4°, 8°, 18° and 22° were from one monkey; for l°,from a second. Field size was deter-mined by averaging the fields at each eccentricity, estimating size from (length X width)0-5.
eccentricity (Figs. 1—4), it is perhaps surprising thatthe graph of field size vs. eccentricity is not morechaotic than it is. Cells in layer IV C, whose fieldsare very small, were excluded from the series, butin an exhaustive study of field size one would haveto consider cells layer by layer. Despite this diffi-culty the graph confirms our expectation that fieldsize and magnification"1 change with eccentricityin strikingly parallel fashion, at least as far periph-eral as 22°.
Figures 2—4 suggest that magnification andreceptive-field size are roughly proportional. InFigure 6B this is confirmed by plotting a graph offield size against magnification"1, using informa-tion from the graph of Figure 6 A.
Figure 7 sums up these results by showing asingle cluster of fields from each of the 1°, 7° and 10°penetrations in relation to the fovea (f). For eachpair of circles the two members are separated by adistance corresponding to a 1 mm movement alongthe cortex (i.e., by a distance equal to "magnifica-tion"1") so that magnification and field size-plus-scatter can be compared directly. As eccentricityincreases so does the distance between circles ineach pair (magnification"1), and parallel with this
there is a corresponding increase in the area takenup by each cluster of receptive fields.
DISCUSSION
Central to the concept of the cortical column is theidea of a group of cells with one common physio-logical characteristic, such as a particular value ofsome variable. The cells behave as though theyshared certain connections among themselves, butnot with cells of neighboring columns, and in thissense a single group of cells is looked upon as a moreor less autonomous functional unit. If the variablehas only two values, as is so for the somato-sensorycolumns described by Mountcastle ('57) or for theocular-dominance columns, then on moving hori-zontally across the cortical surface the values of thevariables must obviously simply alternate, from oneeye to the other, for example. If the variable canhave many values, as in the orientation columns,one can expect either an ordered sequence or a ran-dom one. In the preceding paper (Hubel andWiesel, '74) the chief finding was that the orienta-tion columns are arranged with great regularity, sothat a probe moving along the cortex horizontally
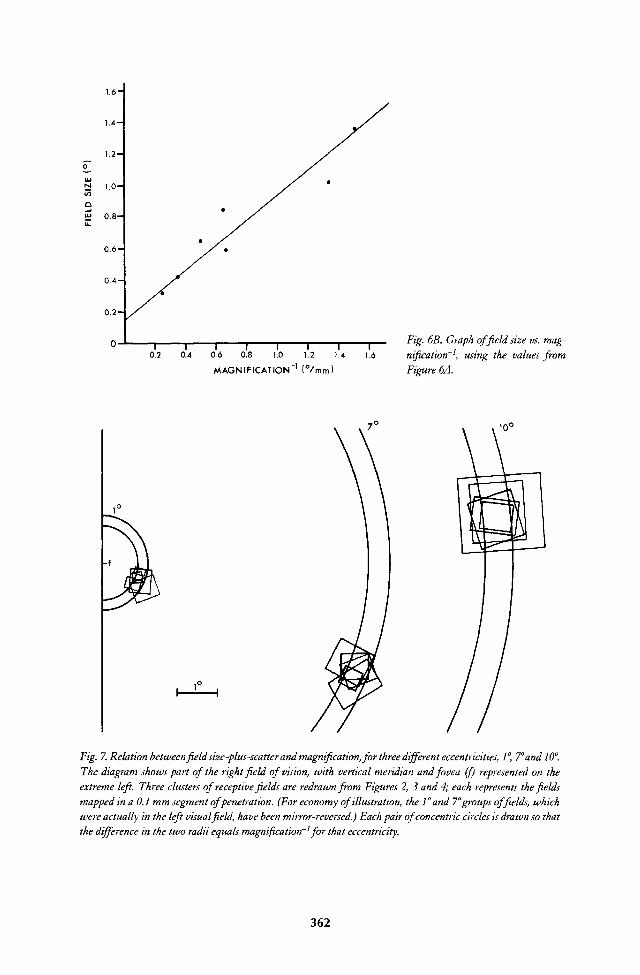
Fig. 6B. Graph of field size vs. mag-nification'1, using the values fromFigure 6A.
Fig. 7. Relation between field size-plus-scatter and magnification, for three different eccentricities, 1°, 7° and 10°.The diagram shows part of the right field of vision, with vertical meridian and fovea (f) represented on theextreme left. Three clusters of receptive fields are redrawn from Figures 2, 3 and 4; each represents the fieldsmapped in a 0.1 mm segment of penetration. (For economy of illustration, the 1° and 7° groups of fields, whichwere actually in the left visual field, have been mirror-reversed.) Each pair of concentric circles is drawn so thatthe difference in the two radii equals magnification'1 for that eccentricity.
362

Cortical Modules and Magnification 363
may generally be expected to encounter all values oforientation (roughly 18—20) in regular sequencebefore any one value is repeated.
Given this result, it seems useful to extend theconcept of the column, and consider a completearray of columns as a small machine that looksafter all values of a given variable. For the orienta-tion system this would be a full set of slabs subserv-
ing an entire 180° cycle, while for the ocular domi-
nance system it would be a left-eye column plus aright-eye column. We may refer to such a group asa hypercolumn.
We had long been puzzled by the observationthat ocular-dominance columns are 0.25—0.5 mmwide, and therefore an order of magnitude largerthan the orientation columns. Only on seeing theorderliness of the orientation columns did we real-ize that there is a close similarity in total widthbetween an array of orientation slabs that takes inall 180° of orientation, and a left-plus-right set of
ocular-dominance columns. Both of these amountto something like 0.5—1 mm. That the two kinds ofhypercolumns are of the same order of magnitudemay not be purely coincidence, for the size itselfmust be of some importance. Suppose, for example,that orientation columns were so large that ingoing through a large angle, say 90°, the distancealong the cortex corresponded to a considerablemovement in the visual field. The result would be
bizarre indeed: the animal would be sensitive tohorizontal lines in one part of its visual field, to var-ious obliques in others, and to verticals in still oth-
ers. A similar problem would arise with respect toeye preference—the visual fields would be carvedup into a mosaic of left-eye and right-eye areas,with each eye seeing only its own subdivisions. Butit has been clear since our '62 paper that the preci-sion of cortical representation holds only down to acertain size of cortical surface, and only down to acertain area of visual field. Cells in a given corticalregion have finite sized receptive fields and a finite(and proportional) random variation in position; acertain constant distance along the cortex, amount-
ing to 2—3 mm, must be traversed in order to obtain
a shift in field position comparable to the size of thefields plus their scatter. Within such a distance onecan have many subregions subserving different ori-entations of receptive fields, or subregions domi-nated first by one eye and then by the other, with-
out getting into difficulties related to topography.
It is remarkable that this distance is about the sameas the size of the hypercolumns—it would be moreaccurate to say that it is about double or triple, sinceroughly a 2—3 mm displacement is required to getout of one region of visual field and into an entirelynew one, as compared with 0.5—1 mm for thewidths of the hypercolumns. In a sense, then, a 2—3mm region of cortex can be said to contain by a
comfortable margin the machinery it needs to ana-lyze the region of visual field that it subserves. It is
probably significant that 2—3 mm is also roughlythe horizontal distance over which cortical cells areinterconnected (Fisken et al., '73).
The relationship seems to hold throughout
the visual cortex, for everywhere the columns, andhence the hypercolumns, are probably about thesame size and, at least over the region explored, thespan of cortex corresponding to the local receptive-field size plus scatter seems to be constant. The
receptive-field size plus associated scatter variestremendously over the cortex, but so does thevisual-field area corresponding to 1 mm of cortex.The degree to which these are matched is strikingand surely no accident.
Thus the machinery may be roughly uniformover the whole striate cortex, the differences beingin the inputs. A given region of cortex simplydigests what is brought to it, and the process is thesame everywhere. Certainly this general idea is notrefuted by any striking histological non-unifor-
mity over the visual cortex, from fovea to farperiphery. If it is assumed that the number of optic-radiation fibers entering a square millimeter ofcortex is roughly constant (Clark, '41) then differ-ences from one region to the next must simply berelated to the size of the geniculate receptive fieldsand their scatter.
Another example of this stereotyped process-ing of input can be seen on comparing striate cor-tex of normal and Siamese cats (Hubel and Wiesel,'71). The 17—18 border region in the ordinary cat
subserves the visual-field midline, whereas in onetype of Siamese cat the seemingly identical area,
morphologically, serves a region 20° in the ipsilat-
eral periphery, where the fields and scatter are
much larger. Apparently this segment of cortex cancarry out the same operation on the two widely dif-fering sets of inputs. The capability is evidently anintrinsic property of the cortex, depending ongenetically determined connections and not on

364 PART III NORMAL PHYSIOLOGY AND ANATOMY
postnatal experience, since the topography is thesame in Siamese kittens whose eyes have beenclosed since birth.
This is not to deny the possibility of certainnon-uniformities over the cortex—indeed regionaldifferences are to be expected, given the relativepreoccupation of the central visual fields with formand color, of the periphery with scotopic vision andmovement, and the absence, in the far periphery, ofbinocular interaction. It would be surprising ifcareful studies even of such crude indices as corti-cal thickness failed to reveal differences betweenfoveal and peripheral representations. The pointhere is that if differences in histology exist they arenot so glaring as to be obvious at a glance and arecertainly minor when one considers the 30—40 foldvariation in magnification factor.
The tasks that a given region of cortex mustfulfill are many and varied and include themachinery for establishing orientation specificity,directional selectivity, degree of complexity, selec-tivity to color, and binocular convergence, all for aparticular region of visual field. It may be thatthere is a great developmental advantage in design-ing such a machinery once only, and repeating itover and over monotonously, like a crystal, for allparts of the visual field. The problem is to achievethe uniformity despite the great difference in detailof representation between central and peripheralvisual fields.
How successfully the problem has beensolved can be appreciated by comparing the rela-tive uniformity of the cortex with the striking non-uniformity of the retina. The ganglion-cell layer ofthe monkey retina, for example, is some five cellsdeep near the fovea, whereas in the far peripherythere are not enough cell bodies to make up onecontinuous layer (Van Buren, '63). For simple rea-sons of optics, the retina cannot adopt the strategythat the cortex employs; if the retinal surface mustbe spherical, the magnification factor has to be thesame throughout, despite the difference in preci-sion of representation between central and periph-eral visual fields. Hence its histological non-unifor-mity. The cortex has no such arbitrary restrictionson surface shape. If the retina is mapped onto thecortex in such a way that magnification is at everypoint independent of direction and falls off witheccentricity, the resultant surface must be far fromspherical. (If magnification is constant, the spheri-
cal retina obviously maps onto a sphere. If magni-fication falls off with eccentricity, one may imaginebuilding up the cortical surface by beginning at thefoveal projection and adding on successive circularrings having the foveal projection as a commoncenter. The circumference of each ring is the prod-uct of the circumference of the corresponding reti-nal ring and the magnification, so that a variationin magnification will produce distortion of thesphere.) In 1962 Daniel and Whitteridge modelledthe striate cortex in rubber and smoothed out thefolds so as to examine the overall shape. Asexpected, the surface was far from spherical andwas roughly what was predicted from a knowledgeof the magnification factor at every eccentricity.The distortion in the shape of the cortical surfacecan be regarded as a consequence of the need tokeep the histology uniform.
Despite this marked difference betweenretina and cortex in histological uniformity, similarprinciples probably prevail in the two structures. Inthe cortex, magnification changes with eccentricity,while cell density remains roughly constant: in theretina, magnification is constant but ganglion celldensity (cells/unit area) varies. If the field size ofcortical cells is matched to the magnification, wemay reasonably ask if field sizes of retinal ganglioncells are matched to cell density. Just such anenquiry has been made in the cat retina by Fischer('73), who measured field-center sizes at differenteccentricities and correlated the results with gan-glion cell densities as estimated by Stone ('65). Withincreasing eccentricity receptive-field center areasincrease (Wiesel, '60), but ganglion-cell densitydeclines, and Fischer found that the two varyinversely, the average number of ganglion cells in areceptive field center having a roughly constantvalue of about 35 throughout the retina. The twosets of results, in retina and cortex, are probablyequivalent, for in the cortex the counterpart of theretinal receptive field under which Fischer esti-mates cell numbers is the cortical projection of theboundaries of an average cortical receptive field.The present study shows that the cortical area soenclosed is constant (in fact, it is the square of theslope of the graph of fig. 6B, i.e., 0.66 mm2). If celldensity in the cortex is roughly uniform the num-ber of cells under this area will obviously be con-stant. It would be of great interest to make ananalysis similar to Fischer's in the monkey retina

Cortical Modules and Magnification 365
and in the geniculate, for comparison with thepresent results in the cortex.
ACKNOWLEDGMENTS
We wish to thank Sandra Spinks, David Freeman and ClaireWang for technical assistance. The work was supported byNIH Grants 5ROI EYO 0605 and 5ROI EYO 0606, and a grantfrom the Esther A. and Joseph Klingenstein Fund, Inc.
Literature Cited
Clark, W. E. LeGros 1941 The laminar organization and cellcontent of the lateral geniculate body in the monkey. }.Anat, Lond., 75:419-433.
Daniel, P. M., and D. Whitteridge 1961 The representation ofthe visual field on the cerebral cortex in monkeys. J. Phys-iol., 759: 203-221.
Fischer, B. 1973 Overlap of receptive field centers and represen-tation of the visual field in the cat's optic tract. Vision Res.,71-2113-2120.
Fisken, R. A., L. J. Garey and T. P. S. Powell 1973 Patterns ofdegeneration after intrinsic lesions of the visual cortex (area17) of the monkey. Brain Res., 53: 208-213.
Hubel, D. H., and T. N. Wiesel 1962 Receptive fields, binocularinteraction and functional architecture in the cat's visualcortex. J. Physiol., 760: 106-154.
1968 Receptive fields and functional architecture ofmonkey striate cortex. }. Physiol., 795: 215—243.
1970 Cells sensitive to binocular depth in area 18 of themacaque monkey cortex. Nature, 225: 41—42.
1971 Aberrant visual projections in the Siamese cat. J.Physiol., 218:33-62.
1972 Laminar and columnar distribution of geniculo-cortical fibers in the macaque monkey. J. Comp. Neur., 146:421-450.
1974 Sequence regularity and geometry of orientationcolumns in the monkey striate cortex. J. Comp. Neur., 158:267-294.
Mountcastle, V. B. 1957 Modality and topographic properties ofsingle neurons of cat's somatic sensory cortex. J. Neuro-physiol., 20: 408-434.
Stone, }. 1965 A quantitative analysis of the distribution of gan-glion cells in the cat's retina. J. Comp. Neur., 124: 337—352.
Talbot, S. A., and W. H. Marshall 1941 Physiological studies onneural mechanisms of visual localization and discrimina-tion. Am. J. Ophthal., 24: 1255-1263.
Van Buren, }. M. 1963 The Retinal Ganglion Cell Layer.Charles C Thomas, Springfield, 111.
Wiesel, T. N. 1960 Receptive fields of ganglion cells in the cat'sretina. J. Physiol., 153: 583-594.
AFTERWORD
To the Uniformity paper there has not been much reaction. It would seem tohave impressed the world less than it did us. I find the students I teach havetrouble absorbing its messages. And ultimately, what one finds attractive inscientific ideas is a matter of taste. I would not trade it for any of our otherpapers, except perhaps the 1962 cortical paper.

This page intentionally left blank

PART IV
DEPRIVATION ANDDEVELOPMENT

This page intentionally left blank

Chapter 21 • The First Three KittenDeprivation Papers •
FOREWORD
These three papers represent a major stream of studies that were done inparallel with the work in normal adult cats and monkeys. We made our firstrecording from a normal newborn kitten on June 22, 1961, about three yearsafter the time we began our work in adult cats. By then we felt we hadbecome familiar enough with the normal physiology of the adult visual cor-tex that we could begin to ask some questions about the development of thevisual system, and about the effects of early visual deprivation.
Our motives for studying kittens were clearly tied to our clinical back-grounds. We wanted to know whether the response properties of the cells wehad been studying in adults were innate or were developed in early life bysome process analogous to learning. We wanted to learn whether we couldalter the responses by modifying the animals' early experience, a questionthat had been raised and discussed by philosophers since the time ofDescartes. Our experiments were undoubtedly influenced by the observa-tions, described in detail by von Senden (Space and Sight, The Free Press,Glencoe, 1960), that children with congenital cataracts have substantial andoften permanent visual deficits after removal of the cataracts. In animals,behavioral studies by Riesen had shown that dark rearing, or being raised inan environment devoid of contours, can similarly lead to severe visualimpairments. It seemed important to establish whether these impairmentswere occurring in the eye or further downstream. Behavioral tests of visionare just one means of assessing the system, and we felt that our knowledge ofcortical physiology might supply another useful index.
So we decided to sew closed the lids of one eye of a newborn kitten, waitfor a few months, and then do a recording to see if anything interesting hadhappened. Parallel with that approach, we recorded from a series of normalkittens at various ages to see how the system developed. It turned out thatafter monocular deprivation the cortex was far from normal, and at thatpoint it was natural to ask whether the abnormalities were a matter of a fail-ure of the connections to develop postnatally, presumably the result of lack
369

370 PART IV DEPRIVATION AND DEVELOPMENT
of experience, or were the results of a disuse-related deterioration of connec-tions that were already present at birth. Whether we originally formulatedthese questions as clearly as this is hard to remember after so many years. Weclosed eyes to see what would happen, and if the cortical physiology of thedeprived cats had been normal we would probably have dropped the project.
Our first recordings in young kittens were not without difficulties. Thenewborn animals simply died when we anesthetized them with a scaled-down dose of our usual anesthetic, thiopental (commonly known as pen-tothal). We soon found, to our surprise, that the local anesthetic we wereusing to suture the eyelids was, for kittens, not just an analgesic but also anexcellent general anesthetic, and we did not need the thiopental at all. Immo-bilizing the head with its soft skull was impossible with our usual Horsley-Clarke stereotaxic head holder, so we cemented a cylindrical chamber to theskull and clamped the lid of the chamber to the head holder.
Our very first recording from a kitten began badly, with nothing butelectrical artifacts during the first penetration. For penetration 2, ourunedited typewritten records read:
Even before contact with a new electrode the same damn crap. Firstunit rather close or 1 mm below the red line.1 Syringe zeroed here.Unit 2: After an untold amount of buggaring around we get rid ofthe cathode follower2 altogether, and thereby most of the artefact. At0.488 we find a unit, contralaterally driven, i.e., by right eye this time,by a 10:00—4:00 slit moving downwards especially, slow movement,complex, T. thinks jibbery.3 From ipsilateral eye we get nil.4 [Theexperiment finally closes with the note]: We seem to have normalboth simple and complex fields in a 31A month old kitten and thatreally all we wanted to know. Since it soon midnight we quit. Nolesion and no perfusion. N. B.: A. C. [area centralis, corresponding toprimate fovea] not mapped out carefully in this experiment.
The coarseness, even obscenity of this description is useful in reminding usjust how trying some of these experiments could be. Even with the patienceof a couple of oysters we could end up yearning for the day to end, regard-less of whether or not it was successful.
By September of 1961 we had obtained a rough idea of the physiologyof normal kittens at the time of eye opening. Some cells showed virtuallynormal orientation selectivity and could be influenced from both eyes. Inother cells, sluggish responses and poor orientation selectivity were hard tointerpret, given the relative opacity of the media and, sometimes, the poorphysical shape of the kittens, but there was no avoiding the conclusion thatat least some cells had acquired their connections by mechanisms that mustbe innate.
'A line made with grease pencil on the plexiglas advancer to mark the piston's expected position at contact.2Our input amplification stage, connected to the electrode.JThe term we used to describe a firing pattern in rapidly occurring high frequency bursts.4There followed a succession of three cells, each well oriented, two of them clearly driven from both eyes.

First Kitten Deprivation Papers 3 71
Around the time of our first recordings from newborn kittens, webegan our series of unilateral eye closures. These studies, too, had their diffi-culties, the main one being a tendency for a sutured eyelid to reopen after afew days to a week. A reclosure was then necessary, but a day or so of visualexperience made the interpretation messy. We got better at the surgery, butfor a time we had to contend with a mixture of clean experiments and a fewthat were contaminated by the intermittent periods of both eyes being open.
We wanted to have a rough idea of the deprived kittens' visual capabil-ities, so just before some of the recording sessions we opened the closed eyeand fitted the normal eye with an opaque contact lens. No elaborate testingof vision was necessary. When we put the animal on a table it groped its wayto the edge and tumbled onto a cushion we had placed on the floor. That issomething that no self-respecting kitten would ever do. We took it as primafacie evidence that the animal was for all intents and purposes blind in thedeprived eye.
When we looked at the histological sections from the monocularlydeprived kittens, we were amazed at the pallor of cells in the geniculate lay-ers supplied by the eye that had been closed. In a three-month closure thethinness and paleness of these layers was obvious even without the aid of amicroscope. The phenomenon of tramneuronal degeneration—shrinkage andpallor following transsection of the optic nerve—was of course well known,but it was not known that simple disuse would cause abnormalities that werealmost as severe. On the other hand the visual cortex, when stained for Nisslsubstance, appeared normal. As more sophisticated anatomical methodsbecame available to us, and as we got more familiar with the normal colum-nar architecture in normal adults, we applied the new methods to our depri-vation-development studies and found that the cortical anatomy was any-thing but normal. So what started as a minor sideline gradually blossomedinto a major effort—so much so that when in 1981 we shared the NobelPrize we were cited for two pieces of work: the mainline physiology, and thedeprivation-development work.
Only recently did it occur to us that we did deprivation studies for sev-eral years before applying for funds to support them. Cats and monkeys werecheap enough, and the prospect of writing another grant request repellentenough (even in those easy days) that we simply let the work we were doingin normal animals support the deprivation studies. Perhaps we were reluc-tant to publicize the deprivation work before our first papers came out. Weknew (or soon learned) how easy it would be for competitors to charge in andbegin closing eyes of monkeys, which was the next item on our list of thingsto do.
We submitted the first three deprivation papers in June 1963, and theycame out that year. These were our first major papers that were not pub-lished in the British Journal of Physiology. We had no quarrel with that jour-nal: the editors were wonderful to work with, and we were delighted withtheir handling of the illustrations. We only made the shift when it becameclear that their policy of strict alphabetical order of authors was having anadverse effect on the one of us not blessed with a last name beginning with a

372 PART IV DEPRIVATION AND DEVELOPMENT
letter close to A. Alphabetical order had the advantage of relieving authorsof worries over priority, but one could not realistically expect deans to under-stand the ways of the British. The problem must have reached its ludicrouspeak in the case of Edwin Furshpan and Taro Furukawa, who had to turnto \L\\tJournalofNeurophysiology to publish their Mauthner-cell work if Tarowas to have any chance of being promoted on his return to Japan.
The order of these first three deprivation papers, while logical, had lit-tle to do with the order in which we did the work. We began with record-ings from very young normal kittens and from of monocularly sutured kit-tens, more or less alternating the two. Only when it became clear that we hadpalpable deprivation effects in the cortex did we go back and look at genic-ulate responses. Of course the anatomical abnormalities we found in thegeniculates made it doubly imperative to look at the geniculate physiology.But had we been real scientists we would probably have started by recordingfrom the retina and then have continued inexorably downstream, to thegeniculate and finally, if we lived long enough, the cortex, all in newborns,and only then have started sewing eyelids. Such an approach still seems to usto be soulless. As it is, the order in which we placed these first deprivationpapers seems artificial, tending to promote false ideas about how the sciencewas actually done.
Effects of Visual Deprivation on Morphology and Physiology ofCells in the Cat's Lateral Geniculate Body1
TORSTEN N. WIESEL AND DAVID H. HUBEL • Neurophysiology Laboratory, Department of Pharmacology,
Harvard Medical School, Boston, Massachusetts
INTRODUCTION
The importance of normal sensory stimulation inthe development and maintenance of the nervoussystem is now generally recognized. In the visualsystem this problem has usually been approachedby examining the effects of sensory deprivation onstructure and behavior (see reviews by Hebb (12)and Riesen (28)). An obvious way of extending this
work would be to examine electrophysiologicallythe functional effects of visual deprivation, butsuch experiments require some knowledge of nor-mal function. During the last 10 years single-cellresponses have been examined and receptive-fieldarrangements compared at several levels in thecat's visual pathway: in the retina (21), the lateralgeniculate body (18), and the visual cortex (17, 19).
From/. Neurophysiol. 1963,26, 978-993.
Received for publication June 26, 1963.
'This work was supported in part by Research Grants GM-K3-15,304 (C2), B-2260 (C2), and B-2253-C2S1 from the Public HealthService, and in part by Research Grant AF-AFOSR-410-62 from the U.S. Air Force.

First Kitten Deprivation Papers 373
This information provides the necessary back-
ground for a study of the immature and the stimu-
lus-deprived visual system.
The results of a physiological and anatomical
study of the visual pathways in normal and visually
deprived kittens will be presented in a series of
three papers. In the present paper we describe
single-unit recordings in the optic tract and lateral
geniculate body of kittens in which one eye had
been deprived of vision, and an anatomical exami-
nation of the visual pathways in these animals. The
second paper (20) will describe single-unit record-
ings in the striate cortex of newborn kittens. The
final paper (32) will deal with responses of cells in
the visual cortex of visually deprived animals.
METHODS
Nine kittens and one adult cat were used in studying themorphological effects of 1—4 months of monocular visualdeprivation. In two of the kittens recordings were madefrom the lateral geniculate body and the optic tract. Inaddition, three kittens were used in a study of the devel-opment of lateral geniculate cells. Table 1 summarizesthe procedures carried out in the experimental animals.
Deprivation procedures. The most common methodof deprivation was to suture together the lids of the righteye. Under local or general anesthesia the lid marginswere trimmed and then sutured end to end. The reduc-tion in intensity of a light beam passing through the eye-lid, measured with a photoelectric cell, was found to varybetween 4 and 5 log units, depending on fur color. Thelid-sutured eyes were thus completely deprived of formstimulation, and also, to a large extent, of stimulation bydiffuse light.
In two kittens a translucent plastic contact lens wasplaced over the right eye. This type of cover allowedmore light to enter the eye but still excluded pattern
Table 1. Experimental Animals
stimulation. The technique was not wholly satisfactorybecause of a tendency to recurrent conjunctivitis. In athird kitten, to overcome this difficulty, the nictitatingmembrane was brought across the cornea of the righteye, and the edge of the membrane was trimmed andsutured to the abraded conjunctiva of the upper lid.These two types of covering were found by direct mea-surement to reduce retinal illumination by only about1-2 log units.
Physiological methods. Single-unit recordings weremade from the optic tract and lateral geniculate bodies intwo kittens. Both animals were 3 months old and hadhad the right eyelid sutured before the time of normaleye-opening. The recordings were done under generalanesthesia. Procedures for preparing the animals anddetails of methods for stimulating and recording havebeen described elsewhere (15, 18, 19). In both kittens,after separating the previously closed lids, we observedthat the cornea was moist and clear; the fundus, includ-ing the optic disc, appeared normal, and the direct andconsensual light reflexes were normally active.
Single units were recorded in the lateral geniculatebody with tungsten microelectrodes (14), and electrodepositions were marked by electrolytic lesions (15). Recep-tive fields were mapped by projecting small spots ofwhite light on a wide screen which the animal facedfrom a distance of 1.5 m. The screen was lit diffusely bya moderately bright background light (—1 to +1Iog10cd/m2). Intensities of stimulus and backgroundlights were adjusted so that the difference between thetwo did not exceed 2 log units.
Anatomical methods. After the acute experiments allanimals were perfused with normal saline followed by10% formalin. The eyes were also perfused separatelywith formalin according to a method described by Po-lyak (25). Brains and eyes were embedded in celloidin:the brains were serially sectioned at 26 [1 and the sectionsstained with cresyl violet; the retina was sectioned at 10|1 and the sections stained alternately with hematoxylinand eosin and with cresyl violet.
Procedure,Right Eye
No. ofAnimals
Age at Onset of Duration of Age at Time ofDeprivation, weet^s Deprivation, weet^s Experiment, weefys
Lid closure
Lid closureLid closureLid closurePlastic translucent
occluderOcclusion with
nictitatingmembrane
Just before normal 9—13eye opening
9 169 4Adult 12Just before normal 8—10
eye-opening5 12
10-14
2513Adult9-11
17
4
111
2
1

374 PART IV DEPRIVATION AND DEVELOPMENT
A quantitative method for measuring areas of theentire cell, the nucleus, and the nucleolus was adaptedfrom the method of Matthews, Cowan, and Powell (23).Cell outlines were traced on 1-mm. graph paper after alinear magnification of 1,000. The number of square mil-limeters within a particular outline gave a direct mea-sure of the projected area in square microns. Only cellsshowing a distinct nucleus and nucleolus were traced.Measurements in the two dorsal layers (A and Aj) didnot give rise to any difficulties since these layers areclearly defined, relatively thick, and rich in cells. On theother hand, the ventral layer (B) was comparatively thinin coronal section. Here special care was taken to avoidthe large intralaminar cells since they are considered bysome to have binocular input (10). In the two dorsal lay-ers cell density was estimated by counting the number ofcells within a given area, using a Whipple net microme-ter disc.
RESULTS
Single-Unit RecordingsSingle units were studied in the lateral geniculatebodies of two kittens monocularly deprived of lightand form by lid suture. The kittens were 3 monthsold and had had the right eyelids sutured togetherjust before the time of normal eye-opening.Records were made from the left lateral geniculatebody, and detailed receptive fields were mappedfor 34 geniculate cells. Twenty of the cells wererecorded in layers receiving input from thedeprived eye, 19 in the dorsal layer (A) and one inthe ventral layer (B); the remaining 14 wererecorded in the middle layer (Aj), whose input wasfrom the normal eye.
All cells, whether they received their inputfrom the normal or from the deprived eye, had theusual concentric receptive-field arrangement con-sisting of an excitatory or inhibitory center and aperipheral region of the opposite type (18). With afew exceptions, which will be described below, thecells had field centers of normal size. Theyresponded well to stimuli restricted to the field cen-ters, and if the antagonistic periphery was includedin the area stimulated by using large spots or dif-fuse light, there was a marked decrease in theresponse. From this it is clear that cells can havenormal receptive-field arrangements in immature(3-month-old) kittens, and that patterned-lightstimulation is not required for the development ofthe necessary connections.
Records were also made from seven optic-tractfibers, which were recognized by their firing pat-tern, response characteristics, and spike shape (16).Two of the fibers were activated from the normal eyeand five from the stimulus-deprived eye. All fibershad normal concentric receptive-field arrange-ments, with "on" centers and "off" peripheries, orthe reverse (21). The field centers were well definedand of normal size, and the units responded stronglywhen the centers alone were stimulated. The nor-mality of the receptive fields of at least some retinalganglion cells in these kittens is hardly surprisingsince, as already described, lateral geniculate cellswith normal fields were found in the same animals.
In previous studies (18) we showed that genic-ulate cells were very similar to retinal ganglioncells in their receptive-field arrangements, themain difference being an increase in the peripheralsuppression at the geniculate level. This differencewas demonstrated directly in simultaneous record-ings from a geniculate cell and its main excitatoryafferent: the probability that the excitatory afferentwould trigger the geniculate cell varied in such away as to render diffuse light less effective at thegeniculate level. In the present study simultaneousrecordings were made of a geniculate cell and itsmain excitatory afferent on three occasions; in twoof these the driving was from the normal eye and inthe third it was from the deprived eye. In all threecases there was a clear increase in the peripheralsuppression for the geniculate cells, indicating thatthe lateral geniculate body in a 3-month-old kitten,like that of the adult cat, is not merely a relay sta-tion, but modifies the input in an important way.Moreover, geniculate cells possess this power ofmodification even in animals that have not previ-ously been exposed to patterned light.
Although the majority of the geniculate cellsreceiving input from the previously closed eyeappeared normal, there were a few exceptions.Four cells, all in the dorsal (A) layer, were strik-ingly sluggish in their responses to light stimula-tion. These had field centers four to six times thediameter of neighboring cells—indeed, the centerswere larger than any we have seen in the lateralgeniculate body of the normal adult cat—and theyshowed less than normal peripheral suppression.Furthermore, in the two kittens in which record-ings were made from the geniculate, the over-allactivity seemed to be less in the visually deprived

First Kitten Deprivation Papers 375
layers than in the normal ones; fewer units could beisolated, and the unresolved background activitywas unusually sparse. Despite these signs of abnor-mal function, it was our general impression fromthese recordings that the geniculate physiology wasrelatively normal, a somewhat surprising findingin view of the striking anatomical changes to bedescribed below.
Morphological Changes in the LateralGeniculate Body Induced by Light andForm Deprivation
KITTENS MONOCULARLY DEPRIVED FROM BIRTH BYLID CLOSURE. In the two kittens described aboveand in two others also deprived for about 3 monthsthe lateral geniculate bodies showed striking histo-logical changes. In all four animals there was a pro-found atrophy in the geniculate layers receivinginput from the covered eye. This is illustrated forone kitten in Fig. 1: coronal sections of the left lat-eral geniculate body, contralateral to the closed eye,show atrophy in the dorsal (A) and ventral (B) lay-ers (Fig. 1/1); in the right lateral geniculate bodythere is atrophy in the middle (AL) layer (Fig. IB).These changes were observed throughout theentire extent of the lateral geniculate bodies.
The abnormal layers stood out by virtue of sev-eral morphological changes (Figs. 1—3). Through-out their entire extent these layers were thinner thannormal and appeared somewhat collapsed. The col-lapse was in part produced by a general reduction incell size; a lack of Nissl substance gave most cells apale, often ghost-like appearance, though a few nor-mally stained, healthy-looking cells were inter-spersed among the mass of atrophic cells. Also con-tributing to the thinness of these layers was areduction in the volume of the apparently homoge-neous space between cell bodies, as a result of whichthe cells seemed to be more thickly packed. Therewas no obvious glial infiltration.
Cross-sectional areas of lateral-geniculate cellbodies, nuclei, and nucleoli were estimated for 50cells in each layer. As shown in Table 2, cell bodiesand nuclei were much smaller for layers receivingtheir input from the closed eye. Comparison of cor-responding layers on the two sides showed a reduc-tion of about 40% in mean cell area for the left dor-sal (A) layer, and a similar reduction for the rightmiddle (A t) layer. The reduction in the left ventral
(B) layer was about 25%. These differences arehighly significant (P < 0.001). Comparable shrink-ages were found for the nuclei and nuceoli.
The distribution of cell areas in the differentlayers is shown in the histograms of Fig. 4. In thenormal layers the variation in cell size was rela-tively large, ranging from about 180 to 600 JI. Incontrast, in the layers receiving input from thelight-deprived eye, cell areas ranged from 150 to300 (I, reflecting a marked reduction in the numberof large cells. In all three abnormal layers the pro-portion of cells with small areas was greatlyincreased. Values given here for upper limit andaverage cell areas in normal layers varied to someextent from one cat to the next, probably because ofdifferences in details of fixation and histologicalprocessing. These variations emphasize the advan-tage of using monocular deprivation, since here thenormal layers furnish the control in each animal.That cells in the "normal" layers were not hyper-trophied was checked by measuring cell areas in a3-month-old kitten raised with both eyes open.
The determination of cell areas, while usefulin comparing the degree of atrophy produced bydifferent schedules or types of deprivation (seebelow), did not seem to us as sensitive an index ofabnormality as ordinary microscopic examinationof the Nissl-stained sections. Histological changesin layers whose mean area was decreased by only10% were obvious at a glance. This was probablybecause the measurements were based on only onecriterion, the area, whereas in examining the slidesone can to some extent unconsciously comparemany features such as cell area, staining properties,cell density, and layer thickness, both in adjacentlayers and in corresponding layers on the two sides.
Several other parts of the visual system wereexamined for anatomical changes. The normal andlight-deprived retinas showed no gross morpho-logical differences: there were no obvious differ-ences in the thickness of the entire retinas or of thevarious layers, and the size and staining propertiesof retinal ganglion cells appeared normal. The twooptic nerves, stained with osmium, appeared iden-tical, as did the two superior colliculi and the stri-ate cortex on the two sides. While more specializedhistological methods might have shown abnormal-ities at various levels in the visual system, the mostobvious changes undoubtedly occurred at the levelof the lateral geniculate body.

Left LGB
Fig. 1. Coronal sections through the lateral geniculate bodies of a fatten, aged 3'A months, whose right eye wasclosed by lid suture just before the time of normal eye-opening. Celloidin, cresyl violet. A: left lateral geniculatebody (contralateral to the covered eye); B: right lateral geniculate body (ipsilateral to the covered eye).
376

Left Right
Fig. 2. High-power photographs of dorsal and middle layers. Same sections as in Fig. 1.
377

Left Right
Fig. 3. Same sections as in Figs. 1 and 2, but still higher magnification.
378

First Kitten Deprivation Papers 379
Table 2. Mean Areas ±S£ of Mean) and Per Cent Shrinkage in Deprived Layers Relative to Corresponding Normal Layers
Layer Left.n2
AREA OF CELLS AREA OF NUCLEI
Right, V Shrinkage, % Left, V2 Right, in2
All / values exceed 4.0 (P < 0.001).
•Sample calculation: difference of means x 100 = 365- 198 v 10() = 46%
mean of normal 365
Shrinkage, %
A
A,B
198 ±340 ±236 ±
7157
365201303
±20±6± 14
46*4122
88 ±4136 ±106 ±
63
135 ±85 ±4142 ±
7
5
353825
MONOCULAR LIGHT DEPRIVATION IN ANIMALS WITHPREVIOUS VISUAL EXPERIENCE. Monocular lid clo-sure was performed in two kittens aged 2 months.In one of the kittens, deprived for 4 months, thelateral geniculate layers receiving input from theclosed eye showed strong atrophic changes whichwere, however, less severe than those found in kit-tens deprived from birth. The other kitten had theright eye closed for only 1 month. In this animal theappropriate layers showed even less atrophy, al-though the changes were still very clear both onmicroscopic inspection and on measuring cellareas. Thus deprivation by lid closure causedatrophic geniculate changes in spite of the previousvisual experience; furthermore, the changes couldbe observed after only 1 month of lid closure.
Finally, it seemed important to ask whethersimilar changes would occur in mature cats aftersimilar periods of monocular light and form depri-vation. Accordingly, the right eye was closed for3 months in an adult cat. In this animal there wasno difference between corresponding geniculatelayers on the two sides: layers that received inputfrom the closed eye were of normal thickness andcontained cells normal in size and staining proper-ties. Apparently there is an important differencebetween a growing kitten and an adult cat in sus-ceptibility to these atrophic changes.
VISUAL DEPRIVATION WITH TRANSLUCENT COV-ERS. In the experiments described so far the kittenswere visually deprived of form and also, to a largeextent, of light. To assess the relative importance ofform and light deprivation some experiments weredone using translucent eye covers. In two kittens
the cornea of the right eye was covered with a con-tact occluder made of translucent plastic. This waskept in place from the time of normal eye openingto an age of 2 months in one kitten, and 2Vz monthsin the other. The occluder reduced retinal illumi-nation by about 2 log units (compared to 4-5 logunits in kittens with lid suture) and excluded allform vision. In both kittens the geniculate layersreceiving input from the covered eye showed histo-logically obvious cell atrophy, with a reduction incell area of 10-15% for the appropriate dorsal andmiddle layers. This may be compared with thereduction, following lid closure for a similar period,of 40%. The histological changes in the lateralgeniculate body thus seemed to vary with thedegree of diffuse light deprivation, strong lightdeprivation giving severe atrophy, moderate depri-vation giving moderate atrophy.
In one of the experimental kittens morpho-logical changes were completely absent. This kit-ten was raised in a normal environment for the first5 weeks after birth and was then deprived for 3months by suturing the nictitating membraneacross the cornea. This procedure reduced retinalillumination by about 1 log unit and excluded formvision, but unlike translucent plastic occluders, itcaused no infection or irritation of the conjunctiva.The lateral geniculate bodies of this kittenappeared quite normal: layers with input from thecovered eye had the same thickness and the samemean cell areas as the corresponding layers withnormal input. In the case of deprivation by lidsuture, as described in a previous section, clearatrophy was found in kittens normally raised for 2months and then deprived for as little as 1 month.

380 PART IV DEPRIVATION AND DEVELOPMENT
This again supports the conclusions of the lastparagraph, that for the production of geniculateatrophy the amount of light deprivation is animportant variable.
GROWTH OF GENICULATE CELLS DURING THE FIRSTWEEKS AFTER BIRTH. A few experiments weredone with the object of learning whether the genic-ulate cells of light-deprived kittens were smallbecause of failure to grow at the normal rate orbecause of a decrease in size following previousgrowth. We therefore examined brains to deter-mine geniculate cell size in visually naive kittens at1 day of age and at 8 days (i.e., before the time ofnormal eye-opening), and at 16 days in a kittenwith plastic translucent contact occluders kept onboth eyes from the eighth to the sixteenth day.
In the 1-day-old kitten the layering of the lat-eral geniculate body was poorly developed. Thecells were densely packed and small, with a meancell area for the dorsal layers of about 100 (J2, asopposed to about 300 |12 in a normal 3-month-oldkitten. In the 8-day-old kitten the layers were bet-ter differentiated: the cells were not so denselypacked, and they had increased in size so that thoseof layers A and Aj had reached a mean area of170-180 (I2, and those of layer B an area of 130 |H2.At 16 days the mean cell areas for layers A and Ajhad further increased to about 200 (I2, and for lay-ers B to about 170|J,2.
In summary, in newborn kittens geniculatecells are smaller than in the adult, and even smallerthan cells in the atrophic layers of 3-month-old kit-tens deprived from birth. Moreover, even in theabsence of patterned-light stimulation growthoccurs, so that at 16 days the cells reached about thesize of those in kittens deprived for 3 months. Itwould thus seem that under these conditions ofdeprivation cells continue to grow up to some timebetween the eighth and sixteenth days, and thenremain stationary. It is conceivable that growthcontinues beyond this time, and that atrophyoccurs subsequently; to rule this out would requiremore studies in animals deprived for intermediateperiods. That visual deprivation can cause atrophyin the strict sense of a diminution in cell size was, ofcourse, demonstrated in the experiments alreadydescribed, in which light deprivation of 2-monthold kittens was found to cause a clear decrease incell area.
Fig. 4. Distribution by layers of cell areas in the two lateralgeniculate bodies; fatten deprived by right eye-closure fromthe time of normal eye-opening to an age of 3'/2 months.Same kitten as in Figs. 1-3. Continuous lines, left lateralgeniculate body; interrupted lines, right lateral geniculatebody.

First Kitten Deprivation Papers 381
DISCUSSION
Our recordings from visually deprived kittensshow that geniculate cells and optic-tract fibers canhave normal receptive-field arrangements, indicat-ing highly complex and functionally normal con-nections, even though the associated retinas havenever been exposed to patterned-light stimulation.That this is also true for cells in the primary visualcortex will be shown in a subsequent paper (20).Consistent with these results are behavioral exper-iments in the rat by Lashley and Russel (22), Hebb(11), and Walk and Gibson (30), which show that atleast in some mammals certain simple visual dis-criminations are not necessarily learned.
Such abnormalities as were found in lateral-geniculate receptive fields were minor but none-theless interesting. The large center size seen in afew of the fields may be the result of some derange-ment in the lateral geniculate body, but it may alsoreflect a similar abnormality in the fields of incom-ing optic-nerve fibers. While no such abnormaloptic-nerve fields were seen, the sampling was fartoo meager to rule out their existence. The appar-ent enlargement of some geniculate-field centersmight seem to suggest some kind of proliferationof connections. It might also be accounted for by adiminution of input opposing the center response,from the transitional zone between field center andsurround. Whatever the explanation, the observa-tion suggests that sensory deprivation can lead to adistortion of function.
That there were at least some physiologicalabnormalities is not surprising in view of themarked atrophic changes observed in the lateralgeniculate body of visually deprived kittens. Theatrophy, present in all layers receiving input fromthe closed eye, was most pronounced in kittensdeprived from birth, less marked in kittensdeprived at later ages, and absent in the deprivedadult cat. The exact age beyond which cat genicu-late cells are no longer sensitive to light and formdeprivation of several months duration was notdetermined. This age may represent the end of acritical period in the development of the nervoussystem, a period during which an animal is notonly more sensitive to sensory deprivation, but alsocan more easily make new nervous connections,adapting itself to variations in sensory stimulation.
The marked anatomical changes in the lateralgeniculate body were especially surprising since
similar findings have not previously been reported.In 1889 von Gudden (9) introduced the method ofdepriving animals of visual stimulation by suturingthe lids. Later Berger (1), using this technique innewborn kittens, could find no anatomical changesin the lateral geniculate body after 2Vz months ofbinocular deprivation. Goodman (6) raised rabbitsin darkness from birth to an age of 6 months, andChow (3) kept immature monkeys (age not speci-fied) in darkness for 8 months; no geniculatechanges were found in either of these two studies.All of this work, then, has been unanimous in find-ing no geniculate abnormalities by conventionalhistological techniques. There may be several rea-sons for this discrepancy, besides the obvious one ofspecies difference. In our study the deprivation wasmonocular, whereas all of those referred to abovewere binocular. The monocular technique tends tobe more sensitive, since in each experiment thestructures to be compared, deprived and nonde-prived, appear in the same animal and on the sameslide. But beyond this there is the possibility that insome way monocular deprivation may be very dif-ferent from binocular: we might have found noatrophy had we closed over both eyes. Such a pos-sibility is of course easy to test experimentally, andis now under study.
Apparently in kittens it is especially the lat-eral geniculate body that is sensitive to light depri-vation, since similar atrophic changes could not befound in other parts of the visual system. In theretina, however, certain studies have demonstratedclear structural changes following light depriva-tion. An X-ray micrographic study of single retinalganglion cells by Brattgard (2) showed markedreduction of cellular proteins in rabbits kept indarkness from birth to an age of 10 weeks; the sameganglion cells appeared normal when examinedwith ordinary histological techniques. Markedabnormalities, even complete disappearance ofretinal ganglion cells, were first shown by Chow,Riesen, and Newell (4) in 2- to 3-year-old chim-panzees kept in darkness from birth. Less pro-nounced retinal changes have been reported in thecat (31,27, 26).
The morphology of the deprived geniculatelayers is strikingly similar to the transneuronalchanges that occur some time after sectioning theoptic nerve (24,5,23). In both conditions the abnor-mal layers are thin and contain small cells which

382 PART IV DEPRIVATION AND DEVELOPMENT
lack Nissl substance. Comparing our results withthose of Cook, Walker, and Barr (5), it appears thatfor similar periods of deprivation and deafferenta-tion the amounts of cell atrophy were of the sameorder. Such a result might at first glance seem sur-prising, since the geniculate cells of light-deprivedkittens, in contrast to the deafferented cells, mayreceive input from spontaneously active retinalganglion cells (7, 21, 8); this input should, if any-thing, tend to limit the atrophy. The difference inage between the two types of preparation must,however, be taken into consideration: in the adultcat, in which optic-nerve section produces markedgeniculate changes, visual deprivation was withoutdiscernible effect. Furthermore, transneuronalatrophy is known to be more pronounced and todevelop faster in immature animals (13, 29), so thatin a newborn kitten optic-nerve section might wellproduce a geniculate atrophy more severe than thatwhich follows form and light deprivation. Prelim-inary studies indeed suggest that this is so (unpub-lished). In any case it is clear that such activity asdoes remain in optic-nerve fibers after prolongeddeprivation is insufficient to maintain the cells intheir normal healthy state.
We speak of the changes in deprived kittensas an "atrophy" because of the close histologicalresemblance to transneuronal atrophy found inadult cats, but it is important to realize that for thekittens one may be dealing at least in part with fail-ure to grow rather than an atrophy in the strictsense. Ideally one would wish to compare twogrowth curves, one for normal cells, the other forvisually deprived ones. In the present work wehave shown that geniculate cells of newborn kit-tens are small by adult standards, and that they doincrease in size even without benefit of visual stim-ulation. What is still not known is whether cells inthe deprived cat grow to anything like a normaladult size and then atrophy, or whether they sim-ply grow at a slower rate. In any case, in the normalkitten of about 2 months the geniculate cells are ofabout adult size, so that the changes observed whenthese kittens are then visually deprived can betermed an atrophy without any reservation.
From these experiments the exclusion of lightseems to be an important factor in the developmentof atrophy in lateral geniculate cells, since theamount of atrophy varied with the amount of lightdeprivation, and, furthermore, a visually experi-
enced kitten when subsequently light-deprivedshowed atrophy, whereas there was no atrophy in acomparable animal subjected to a similar period ofform deprivation. These results are in line with thefindings of Chow, Riesen, and Newell (4), that a fewhours of diffuse light stimulation each day isenough to prevent degeneration of retinal ganglioncells in animals raised in darkness. It remains to beestablished whether geniculate atrophy can becaused by form deprivation alone, and also whetherit can be caused by diffuse light deprivation withoutform deprivation.
SUMMARY
1. Kittens were subjected to deprivation of formand light in one eye, at various ages and for var-ious periods. Deprivation was accomplishedeither by suturing the lids together or by placinga translucent contact occluder over the cornea.
2. In kittens with the lids of one eye sutured frombirth for 3 months, most geniculate cells withinput from the deprived eye had normal recep-tive fields, with an on-center and an off-periph-ery, or the reverse. The normal process bywhich the peripheral suppression demonstrablein retinal ganglion cells is increased at the genic-ulate level was observed. The over-all activity ofcells in layers fed by the deprived eye was, how-ever, diminished, and a few cells had sluggishresponses and receptive fields with abnormallylarge centers.
3. Marked histological changes were present inlayers fed by the deprived eye. Mean cell areaswere decreased by about 40% for the dorsal andmiddle layers and 25% for the ventral layer, andnuclei and nucleoli were also shrunken. Noobvious histological changes were found in theretinas, optic nerves, superior colliculi, or striatecortex.
4. Lid closure for comparable periods in 2-month-old, visually experienced kittens produced sim-ilar but less severe histological changes in thelateral geniculate bodies. No changes were seenin an adult cat visually deprived by lid suture ofone eye for 3 months.
5. A translucent contact occluder placed over oneeye from birth for 2 to 2'/2 months producedsimilar histological changes, but again thesewere less marked, with 10—15% reduction in

First Kitten Deprivation Papers 383
mean cell area, in the appropriate dorsal andmiddle layers. In one kitten a translucentoccluder was placed over one eye at 5 weeks fora 3-month period; there was no atrophy ofgeniculate cells.
6. Geniculate cells measured in a newborn kittenare smaller than those in the adult, and are evensmaller than cells in the atrophic layers of kit-tens deprived from birth by lid suture for 3months, indicating that some growth of cellsoccurs subsequent to birth, in spite of visualdeprivation.
ACKNOWLEDGMENT
We express our thanks to Jane Chen and Janet Tobie for theirtechnical assistance.
References
1. Berger, H. Expenmentell-anatomische Studien iiber diedurch den Mangel optischer Reize veranlassten Ent-wicklungshemmungen im Occipitallappen des Hundesund der Katze.Arch. Psychiat. Nervenfy:, 1900,JJ: 521-567.
2. Brattgard, S.-O. The importance of adequate stimulationfor the chemical composition of retinal ganglion cells dur-ing early postnatal development. Acta radial., Stockh., 1952,Suppl. 96: 1-80.
3. Chow, K. L. Failure to demonstrate changes in the visualsystem of monkeys kept in darkness or in colored lights./.comp. Neural., 1955,102: 597-606.
4. Chow, K. L., Riesen, A. H., and Newell, F. W. Degenera-tion of retinal ganglion cells in infant chimpanzees rearedin darkness./, comp. Neural., 1957,107: 27-42.
5. Cook, W. H., Walker, J. H., and Barr, M. L. A cytologicalstudy of transneuronal atrophy in the cat and rabbit. /.comp. Neural., 1951, 94: 267-292.
6. Goodman, L. Effect of total absence of function on the opticsystem of rabbits. Amer. ]. Physiol, 1932,100: 46-63.
7. Granit, R. Sensory Mechanisms of the Retina. London,Oxford Univ. Press, 1947.
8. Granit, R. Receptors and Sensory Perception. New Haven,Yale Univ. Press, 1955.
9. Gudden, B. A. von. In: Gesammelte und hinterlasseneAbhandlungen, edited by H. Grashey. Wiesbaden,Bergmann, 1889.
10. Hayhow, W. R. The cytoarchitecture of the lateral genicu-late body in the cat in relation to the distribution of crossedand uncrossed optic fibers./, comp. Neural., 1958,110: 1-64.
11. Hebb, D. O. The innate organization of visual activity: I.Perception of figures by rats raised in total darkness. /.comp. Neural., 1937,57: 101-126.
12. Hebb, D. O. Organization of Behavior. New York, Wiley,1949.
13. Hess, A. Optic centers and pathways after eye removal infetal guinea pigs./, comp. Neural., 1958, 709: 91-115.
14. Hubel, D. H. Tungsten microelectrode for recording fromsingle units. Science, 1957, 725: 549-550.
15. Hubel, D. H. Single unit activity in striate cortex of unre-strained cats./. Physiol., 1959, 747: 226-238.
16. Hubel, D. H. Single unit activity in lateral geniculate bodyand optic tract of unrestrained cats./. Physiol., 1960, 750:91-104.
17. Hubel, D. H. and Wiesel, T. N. Receptive fields of singleneurones in the cat's striate cortex. /. Physiol., 1959, 148:574-591.
18. Hubel, D. H. and Wiesel, T. N. Integrative action in thecat's lateral geniculate body./. Physiol., 1961, 755: 385-398.
19. Hubel, D. H. and Wiesel, T. N. Receptive fields, binocularinteraction and functional architecture in the cat's visualcortex./. Physiol., 1962, 760: 106-154.
20. Hubel, D. H. and Wiesel, T. N. Receptive fields of cells instriate cortex of very young, visually inexperienced kittens./. Neurophysiol., 1963,26: 994-1002.
21. Kuffler, S. W. Discharge patterns and functional organiza-tion of mammalian retina./. Neurophysiol., 1953, 76: 37—68.
22. Lashley, K. S. and Russel, J. T. The mechanism of vision:XI. A preliminary test of innate organization./, genet. Psy-chol., 1934,45: 136-144.
23. Matthews, M. R, Cowan, W. M., and Powell, T. P. S.Transneuronal cell degeneration in the lateral geniculatenucleus of the Macaque monkey./. Anat., Land., 1960, 94:145-169.
24. Minkowski, von M. Uber den Verlauf, die Endigung unddie zentrale Representation von gekreuzten und unge-kreuzten Sehnervenfasern bei einigen Saugetieren undbeim Menschen. Schweiz. Arch. Psychiat., 1920, 6: 201-252.
25. Polyak, S. L. The Retina. Chicago, Univ. of Chicago Press,1941.
26. Rasch, E., Swift, H., Riesen, A. H., and Chow, K. L.Altered structure and composition of retinal cells in dark-reared mammals. Exp. Cell Res. 1961, 25: 348-363.
27. Riesen, A. H. Effects of stimulus deprivation on the devel-opment and atrophy of the visual sensory system. Amer. J.Orthopsyckiat., 1960, 30: 23-36.
28. Riesen, A. H. Stimulation as a requirement for growth andfunction in behavioral development. In: Functions of VariedExperience, edited by D. W. Fiske and S. R. Maddi. Home-wood, 111., Dorsey Press, 1961, pp. 57-105.
29. Torvik, A. Transneuronal changes in the inferior olive andpontine nuclei in kittens./. Neuropath., 1956, 75: 119-145.
30. Walk, R. D. and Gibson, E. J. A comparative and analyticalstudy of visual depth perception. Psychol. Mongr., 1961, 75:1-44.
31. Weiskrantz, L. Sensory deprivation and the cat's opticnervous system. Nature, Land., 1958,181: 1047-1050.
32. Wiesel, T. N. and Hubel, D. H. Single-cell responses in stri-ate cortex of kittens deprived of vision in one eye./. Neuro-physiol., 1963,26:1003-1017.

384 PART IV DEPRIVATION AND DEVELOPMENT
Receptive Fields of Cells in Striate Cortex of Very Young, VisuallyInexperienced Kittens1
DAVID H. HUBEL AND TORSTEN N. WIESEL • Neurophysiology Laboratory, Department of Pharmacology,
Harvard Medical School, Boston, Massachusetts
INTRODUCTION
In a series of studies on the cat over the past 5 years
we have recorded from single cells in the striate
cortex and mapped receptive fields using patterned
retinal stimulation. The results suggest that con-
nections between geniculate and striate cortex, and
between cortical cells, must be highly specific (5).
Indeed, cells in the striate cortex respond in such a
characteristic way that departures from the normal
adult physiology should be easily recognizable.
In the present study we have made similar
experiments in kittens ranging in age from 1—3
weeks. Our purpose was to learn the age at which
cortical cells have normal, adult-type receptive
fields, and to find out whether such fields exist even
in animals that have had no patterned visual stim-
ulation.
METHODS
Four kittens were included in this series. Three of thesewere from the same litter. The youngest was 8 days oldat the time of the experiment, and had not yet opened itseyes. The second had both its eyes covered by translucentcontact occluders at 9 days, at which time the eyes werejust beginning to open; the experiment was done 1 weeklater, at 16 days of age. The third kitten had the right eyecovered by a translucent occluder at 9 days, and the othereye was allowed to open normally; the experiment wasdone on the nineteenth day. The fourth kitten, from adifferent litter, was brought up normally and used in anexperiment on the twentieth day, after 11 days of normalvisual exposure. Thus two kittens had, at the time of theexperiment, no patterned-light experience; the third hadsuch experience in one eye only, and the fourth had nor-mal visual stimulation in both eyes. Before the experi-
ments the two kittens that had been exposed to patternedlight were beginning to show following movements ofthe eyes and visually guided behavior.
Procedures for stimulating and recording have forthe most part been described in previous papers (4, 5). Afew modifications were necessary for newborn and veryyoung kittens. Since doses of barbiturate large enough togive surgical anesthesia were usually lethal, the kittenswere first given a small dose of thiopental (15—20mg/kg.), and just before surgery the appropriate regionsof skin were infiltrated with local anesthetic (Xylocaine,2%). A few minutes after injection of the local anestheticthe animal usually fell asleep and showed no sign of dis-comfort during the surgery or the experiment. Fromobservations on these and other newborn kittens wehave the impression that the Xylocaine has central effectsas well as local ones. Since eye movements were not trou-blesome, no paralyzing agent was used, and artificial res-piration was not necessary. The skull, too soft to be heldby ear plugs, was supported by cementing it to a modi-fied Davies chamber (2) which was then clampedsecurely. The electrode was introduced through a hole inthe skull and dura a few millimeters wide. Tungstenmicroelectrodes were used for recording, and severalelectrolytic lesions in each track served to identifyrecording sites in histological sections. All brains wereexamined histologically.
Patterned stimuli were shone on a diffusely litscreen which the kittens faced from a distance of 1.5 m.Background light was about 1 c.d/m2, and stimuli weregenerally 0.5-1.5 log units brighter. Identification of areacentralis and optic discs by our usual projection method(4) was difficult because the cornea and media have acloudy appearance and because the tapetum in cats doesnot develop fully until 3-4 weeks after birth (3). Recep-tive-field position could therefore not be determinedaccurately, though it was our rough impression thatfields were within about 10° of the center of gaze.
From/. Neurophysiol. 1963, 26, 994-1002
Received for publication June 26, 1963.
'This work was supported in part by Research Grants GM-K3-15,304 (C2), B-2260 (C2), and B-2253-C2S1 from the Public HealthService, and in part by Research Grant AF-AFOSR-410-62 from the U.S. Air Force.

First Kitten Deprivation Papers 385
RESULTS
Cortical Activity and Responses inKittens without Visual Experience
RESTING ACTIVITY AND RESPONSIVENESS. Seventeensingle cells were recorded from the two visuallynaive kittens, nine from the 8-day-old and eightfrom the 16-day-old. Perhaps the most marked dif-ference between these experiments and our usualrecordings from cortex in adult cats was in themaintained activity and responsiveness of the cells.With steady diffuse background illumination cellstended to be silent or to fire at a very low rate. Per-haps partly because of this paucity of maintainedactivity the number of cells studied in a penetrationwas unusually small, a few in each passage fromsurface to white matter as against 20—30 in an ordi-nary adult penetration. Cells were not only sluggishin their spontaneous activity but also respondedgrudgingly to the most effective patterned stimuli.This relative difficulty in eliciting responses re-minded one of similar difficulties in driving cells invery deeply anesthetized adult cats (5, p. 122). Justas in deeply anesthetized adults, some cells did notrespond at all to patterned stimuli unless the stim-uli were moving.
Finally, cortical cells, especially in the 8-day-old kitten, showed a marked tendency to fatigue.To be sure of obtaining brisk responses one some-times had to wait for as long as a minute betweenstimuli. While a tendency to such fatigability isoccasionally found in cells of mature cats, it is farfrom the rule, and when the depressed responsive-ness occurs, it does not last nearly so long. Thefatigue would seem to be cortical, since similareffects were not seen in geniculate cells, and sincein a binocularly influenced unit the intervals be-tween effective stimuli could not be shortened bystimulating first one eye and then the other.
RECEPTIVE-FIELD CHARACTERISTICS. Except for thissluggishness, cortical cells of visually inexperiencedkittens strongly resembled cells of mature cats intheir responses to patterned stimuli. The cellsresponded poorly, and often not at all, to changes indiffuse retinal illumination. They responded best tostraight-line stimuli (i.e., slits, dark bars, or edges),but only when these were appropriately orientedwithin the receptive fields, which averaged about
2—5° in diameter. The optimum orientation wasfound by moving the stimulus back and forth acrossthe receptive field, adjusting the orientationbetween stimuli. In Fig. 1, a single-unit recordingobtained from the 8-day-old kitten, a long narrowrectangle of light was moved back and forth acrossthe receptive field as shown. Brief responses wereconsistently obtained when the slit was oriented ina 1 o'clock—7 o'clock direction (A) whereas therewas no response when it was oriented at 90° to this(B). A similar kind of preference in stimulus orien-tation was common to all of the units isolated. Sev-eral of the cells, especially those in the 8-day-old kit-ten, gave responses over a range of stimulusorientations that was unusually wide by adult stan-dards, yet even in these cells stimulating at an ori-entation of 90° to the optimum evoked no responseat all. Moreover, the responses to moving an opti-mally oriented stimulus across the receptive fieldwere not necessarily the same for the two diametri-cally opposite directions of movement (see Fig. 4).As in the adult cat, this kind of directional prefer-ence varied from cell to cell; some cells respondedequally well to the two opposing directions ofmovement, while some responded well to onedirection and not at all to the other.
The combination of sluggish responses andpoor optics made it difficult to map receptive fieldsin a detailed way. Of those that could be mapped,however, some were clearly "simple" in type andothers were "complex" (5).
BINOCULAR INTERACTION. The great majority ofcells recorded from the two immature kittens (16out of 17) could be influenced from each eye sepa-rately. Just as in adult cats (5), the receptive fields ofthese cells were situated in corresponding regionsin the two eyes, and the two fields were, as far asone could tell, identical in arrangement, in degreeof complexity and in orientation. Furthermore, thetwo eyes often differed in their relative ability toinfluence a given cell. We have again subdividedcells into seven groups according to the relativeinfluence of the two eyes (see Fig. 2, legend). Thedistribution of cells among the groups is given inTable 1 and in the histogram of Fig. 2 (shaded por-tion). Comparison of this histogram with the cor-responding one in the adult (9, Fig. 1) suggests thatthere is little or no difference in ocular-dominancedistribution with age or visual experience.

386 PART IV DEPRIVATION AND DEVELOPMENT
Fig. 1. Single-cell responses from cortex of an 8-day-old fatten with no previous visua experience. A rectangle oflight 1° X5°is moved bact{ and forth across the receptive field in the contralateral eye. Unit binocularly activated,ocular-dominance group 3. Receptive-field sizes about 5° X 5°; fields situated in the central part of the con-tralateral visual field. A: stimulus oriented 12:30-6:30 (parallel to receptive-field axis). B: stimulus oriented9:30-3:30 (at right angles to the optimal orientation). Rate of movement, 5°I sec. Time, 1 sec.
OCULAR DOMINANCE
Fig. 2. Distribution of '28 cells among the seven ocular-dom-inance groups, defined as follows: cells of group 1 weredriven only by the contralateral eye] for cells of group 2 there
was marked dominance of the contralateral eye', for group 3,slight dominance. For cells in group 4 there was no obviousdifference between the two eyes. In group 5 the ipsilateral eyedominated slightly, in group 6 markedly; and in group 7 thecells were driven only by the ipsilateral eye. The shaded por-tion refers to 17 cells recorded from two fyittens with no priorvisual experience (aged 8 and 16 days). The unshaded por-tion refers to cells recorded from the 20-day-old normal kit-ten.
FUNCTIONAL ARCHITECTURE. In penetrations per-pendicular to the surface of the cortex and parallelto the radial fiber bundles there were longsequences of cells all having the same receptive-field orientation. In oblique penetrations more fre-quent shifts in orientation were seen. An obliquecortical penetration in the 16-day-old kitten isreconstructed in Fig. 3. Here there were threeshifts in receptive-field orientation within a rela-tively short distance, and between each shift cellsand unresolved background activity had the samefield orientation. All of this is in good agreementwith previous studies of the functional architectureof the visual cortex in adult cats (5), suggesting thatthe organization of cortex into columns of cellshaving common receptive-field orientations isalready present in immature kittens that havenever received patterned visual stimulation.
KITTENS WITH VISUAL EXPERIENCE
In their maintained activity, cortical cells of older,visually experienced kittens were much closer tonormal. Most cells were active in the absence ofpatterned stimulation, so that isolation of singlecells was much easier. Responses to restricted stim-uli were brisker, and showed little of the fatiguethat was so apparent in the 8-day-old kitten. As arule the optimum stimulus was more preciselydefined, especially the receptive-field orientation;in this respect these two kittens were closer to the

First Kitten Deprivation Papers
Table 1. Distribution of Cells Among the Ocular-Dominance Groups
387
Kitten
NUMBER OF CELLS IN EACH GROUP
8-day-old16-day-old19-day-old*20-day-old
Totals
1
12
4
2
11
4
3522
12
322
7
133
7
22
4
1
1
*Not included in histogram of Fig. 2.
adult than they were to the 8- and 16-day-old visu-ally naive kittens. Both simple and complex typesof fields were mapped, and reconstructions of elec-trode penetrations again tended to confirm thecolumnar organization of the cortex. In the re-sponses to stimulation of the two eyes there wereno obvious differences between the younger visu-ally naive kittens and the older experienced ones:the 11 cells recorded from the 20-day-old normalkitten varied greatly in ocular dominance, and areincluded in the histogram of Fig. 2, where they arerepresented by the unshaded portion.
The third, 19-day-old kitten was a useful con-trol, since the right eye was covered from the timeof normal eye-opening by a translucent occluder,and the left was allowed to remain uncovered. Inthe cortical recordings there was, on the whole, noobvious difference between the two eyes in their
ability to influence cortical cells; the previouslyoccluded eye was dominant about as often as thenormal eye (see Table 1). In Fig. 4, a two-unitrecording obtained from this kitten, a slit stimuluscrossed the receptive field in three different orien-tations. The units responded well only to the sec-ond of these; to the first and third and to orienta-tions still further from the optimum there was littleor no response. The unit from which the smallerspikes were recorded gave hardly any responses tostimulation of the right eye (which had been cov-ered), but responded well to the left. On the con-trary, the cell giving the larger spikes strongly pre-ferred the eye that had been occluded.
There was no tendency for cells dominated bythe occluded eye to have less maintained activity orto respond less briskly and precisely than the othercells. We are therefore inclined to think that the
Fig. 3. Reconstruction of an obliquemicroelectrode penetration throughthe postlateral gyrus of a 16-day-oldkitten without previous visual expe-rience. Longer lines intersecting theelectrode tract{ represent single well-isolated cortical cells; directions ofthese lines represent receptive-fieldorientations, a line perpendicular tothe trac\ standing for a vertical ori-entation. Shorter lines show regionsin which unresolved backgroundactivity was observed. At the end of apenetration an electrolytic lesion wasmade] this is indicated by the circle.Scale, 0.5 mm.
1 2 3 4 5 6 7

388 PART IV DEPRIVATION AND DEVELOPMENT
Fig. 4. Two-unit recording from a 19-day-old ^itten whose right eye had been covered from the time of normaleye-opening by a translucent occluder. Each eye stimulated separately by a slit 0.5° X 0.4°, moved across thereceptive field at a rate of about l°/sec. Size of fields 2° X4°. Time, 1 sec.
sluggishness of maintained activity and responsesin the first two kittens was related to age ratherthan to visual experience. This is simply a tentativeimpression, since the difference in the two groupsof kittens may be more related to differences in theanimals' susceptibility to anesthesia than to a dif-ference in properties of cortical cells, especiallysince we know that suppression of maintainedactivity and of responses is a characteristic effect ofanesthesia in adult cats.
What can be concluded from this kitten isthat even as late as 19 days of age a cell need nothave had previous patterned stimulation from aneye in order to respond normally to it. This will beof some interest when the effects of longer periods
of monocular deprivation are considered, as dis-cussed in the accompanying paper (9).
DISCUSSION
The main result of this study has been to show thatmuch of the richness of visual physiology in thecortex of the adult cat—the receptive-field organi-zation, binocular interaction, and functional archi-tecture—is present in very young kittens withoutvisual experience. Our conclusion is that the neuralconnections subserving these functions must alsobe present, in large part, at or near the time of birth.This extends the work of the previous paper (8) inwhich we showed that visual experience was not

First Kitten Deprivation Papers 389
necessary for the development of optic-nerve orgeniculate receptive fields.
These findings were somewhat unexpected inview of behavioral observations in very young kit-tens. At birth a bright light evokes a lid reflex (10),as well as a sluggish pupillary response (1), suggest-ing that the visual system is to some extent func-tional. Nevertheless, kittens appear quite unable touse their eyes at the time of normal eye-opening,which usually occurs between the sixth and thetenth day. Avoidance of objects is seen at the veryearliest around 14 days, while pursuit, followingmovements, and visual placing appear only at20—25 days (10, 7). Visual acuity, measured byobserving optokinetic nystagmus, increases rapidlyfrom the second week and approaches adult levelsby about the fourth week (7). To parallel thisbehavioral development in the first weeks we havein cortical cells only the increase in briskness ofresponses and extent of maintained activity—which may be related to differences in reaction orour experimental procedures rather than to realdifferences in the physiology—and the heightenedprecision of responses, especially to variations instimulus orientation. This leads one to wonderwhether the inability of young kittens to use theirvision is related not so much to incomplete devel-opment of the visual pathway as to a lack of visuo-motor ability.
From the behavioral observations alone onemight easily imagine that the improvement invisual skill during the first weeks after birth isclosely paralleled by development in neural con-nections in the visual pathway. Such a concept hasprobably been reinforced by studies on the delay indevelopment of visual ability produced by raisinganimals in darkness or in diffuse light (for reviewssee ref. 6); it has been natural to assume that in thenormal animal neural connections subservingvision are developed only if pattern stimuli fall onthe retina. The present results make it clear thathighly complex neural connections are possiblewithout benefit of visual experience. In interpret-ing the results of visual deprivation, both thebehavioral and the physiological, one must there-fore consider the possibility that lack of stimulationmay lead not simply to a failure in forming con-nections, but rather to the disruption of connec-tions that were there from the start.
SUMMARY
Responses of single cells to visual stimuli werestudied in the striate cortex of very young kittens.Two animals, aged 8 and 16 days, had had no pre-vious exposure to patterned stimuli. Responses ofcortical cells in these animals were strikingly simi-lar to those of adult cats. Fields were simple orcomplex, with a clear receptive-field orientation.Cells with similar orientations appeared to begrouped in columnar regions. The majority of cellswere driven by the two eyes, with patterns ofbinocular interaction that were similar to those inthe adult. Compared with cells in the mature cat,those in young kittens responded somewhat moresluggishly to visual stimuli, and receptive-field ori-entations tended to be not quite so well defined.
In two other kittens, one monocularly de-prived by translucent occluder from birth for 19days, the other a normal 20-day-old, responses topatterned stimulation of either eye were entirelynormal by adult standards.
It is concluded that many of the connectionsresponsible for the highly organized behavior ofcells in the striate cortex must be present at birth orwithin a few days of it. The development of theseconnections occurs even in the absence of patternedvisual experience.
ACKNOWLEDGMENT
We express our thanks to Jane Chen and Janet Tobie for theirtechnical assistance.
References
1. Abelsdorff, G. Bemerkungen iiber das Auge der neuge-borenen Katze, im Besonderen die retinale Sehzellen-schicht.ylrcA. Augenheilk,, 1905,53:257-262.
2. Davies, P. W. Chamber for microelectrode studies in thecerebral cortex. Science, 1956, 724:179-180.
3. Hilbert, R. Ueber die nach der Geburt eintretendenentwickelungsgeschichtlichen Veranderrungen der bre-chenden Medien und des Augenhintergrundes der Katze.v. GraefesArch. Ophthal., 1884,30:245-250.
4. Hubel, D. H. and Wiesel, T. N. Receptive fields of opticnerve fibres in the spider monkey. /. Physiol., 1960, 154:572-580.
5. Hubel, D. H. and Wiesel, T. N. Receptive fields, binocularinteraction and functional architecture in the cat's visualcortex./. Physiol., 1962, 760:106-154.
6. Riesen, A. H. Stimulation as a requirement for growth andfunction in behavioral development. In: Functions of VariedExperience, edited by D. W. Fiske and S. R. Maddi. Home-wood, 111., Dorsey Press, 1961, pp. 57-105.

390 PART IV DEPRIVATION AND DEVELOPMENT
7. Warkentin, J. and Smith, K. U. The development of visualacuity in the cat./.genet. Psychoi, 1937,50:371-399.
8. Wiesel, T. N. and Hubel, D. H. Effects of visual depriva-tion on morphology and physiology of cells in the cat's lat-eral geniculate body./. Neurophysiol., 1963,26: 978-993.
9. Wiesel, T. N. and Hubel, D. H. Single-cell responses in stri-ate cortex of kittens deprived of vision in one eye./. Neuro-physiol., 1963,26:1003-1017.
10. Windle, W. F. Normal behavioral reactions of kittens corre-lated with the postnatal development of nerve-fiber densityin the spinal gray matter./, comp. Neural., 1930,50:479-503.
Single-Cell Responses in Striate Cortex of Kittens Deprived ofVision in One Eye1
TORSTEN N. WIESEL AND DAVID H. HUBEL • Neurophysiology Laboratory, Department of Pharmacology,
Harvard Medical School, Boston, Massachusetts
INTRODUCTION
In the first paper of this series (11) we showed thatin a kitten 2—3 months of monocular light andform deprivation can produce a marked atrophy ofcells in the lateral geniculate body. The changeswere confined to layers receiving projections fromthe deprived eye. Despite the atrophy, most of thecells recorded had normal receptive fields. Thepresent paper extends this physiological study ofmonocularly deprived kittens to the next level inthe visual pathway, the striate cortex. We wished tolearn whether one could influence cortical cellsfrom the deprived eye, and whether the receptivefields were normal.
At the cortical level any long-term effects oftampering with one eye might be expected to showup as a change in normal patterns of binocularinteraction. It may therefore be useful to begin bysummarizing some previous findings on binocularinteraction in the normal cat. Approximately four-fifths of cells in the cat striate cortex are binocularlyinfluenced. For any given cell the receptive fieldsmapped in the two eyes are similar in arrange-ment and occupy corresponding retinal positions.Although stimuli to corresponding retinal pointsthus produce qualitatively similar responses, the
strengths of the responses from the two eyes are notnecessarily equal: some cells respond best to thecontralateral eye; others prefer the ipsilateral. Fig-ure 1, reproduced from a previous study (7), showsthe distribution of 223 cells according to eye-domi-nance. It will be seen from this histogram that onthe whole the contralateral eye is decidedly themore influential. In the second paper of this series(9) we showed that very young kittens resembledadults in all of these respects. This was true even ofanimals with no previous patterned visual expe-rience.
We have been particularly interested in learn-ing whether the distribution of cells among the dif-ferent ocular-dominance categories would be ap-preciably altered in recordings from monocularlydeprived kittens. The histogram of Fig. 1 repre-sents the lumped results of 45 penetrations, andcannot necessarily be used to predict the distribu-tion of cells in a single penetration. To interpret theresults of the present paper we need to knowwhether this distribution varies markedly fromone penetration to the next. It might be much nar-rower and less constant from penetration to pene-tration if, for example, there were a strong ten-dency for cells with the same eye-preference to be
From J. Neurophysiol. 1963,26, 1003-1017.
Received for publication June 26, 1963.
'This work was supported in part by Research Grants GM-K3-15,304 (C2), B-2260 (C2), and B-2253-C2S1 from the Public HealthService, and in part by Research Grant AF-AFOSR-410-62 from the U.S. Air Force.

First Kitten Deprivation Papers 391
OCULAR DOMINANCE
Fig. 1. Ocular-dominance distribution of 223 cells recordedfrom striate cortex of adult cats in a series of 45 penetrations(7). Cells of group 1 were driven only by the contralateraleye; for cells of group 2 there was marked dominance of thecontralateral eye, for group 3, slight dominance. For cells ingroup 4 there was no obvious difference between the twoeyes. In group 5 the ipsilateral eye dominated slightly, ingroup 6, markedly; and in group 7 the cells were driven onlyby the ipsilateral eye.
grouped together in the cortex. To have a better
idea of the variation in distribution from penetra-
tion to penetration we have therefore taken 12 sep-
arate consecutive penetrations from the series used
to construct Fig. 1, and plotted each of their ocular-
dominance distributions separately (Fig. 2). Itappears from these histograms that there is no very
marked tendency for cells to be anatomically
grouped by eye-preference: penetrations 2 and 4
represent the extremes in the two directions, of
dominance by the ipsilateral eye (2) or the con-
tralateral eye (4), and even in these two penetra-
tions both eyes make a substantial contribution. In
judging an individual penetration it is therefore
probably reasonably safe to take the distribution of
Fig. 1 as the normal, regarding as probably signifi-
cant only departures much greater than those of
penetrations 2 and 4.
METHODS
Seven kittens and one adult cat were used. The animalswere monocularly deprived either by lid closure or by atranslucent eye cover (11). Closure of lids preventedform vision and reduced the level of diffuse retinal illu-mination by about 4-5 log units. The translucent occlud-ers also prevented pattern stimulation, but reduced thediffuse illumination by only about 1-2 log units. Four ofthe kittens were deprived from the time of normal eye-opening; the others had some prior visual experience.Deprivation was for periods of 1-4 months. Before someexperiments the lids of the closed eye were separated orthe translucent eye cover was removed. The normal eyewas then covered with an opaque contact occluder andthe animal's visual behavior was observed.
Experimental procedures for preparing the animalsand for stimulating and recording are given in previouspapers (5, 6, 7, 11). Extracellular recordings were madewith tungsten microelectrodes in the part of the lateralgyrus receiving projections from the retinal area cen-tralis. In one animal electroretinograms and evoked cor-tical potentials were recorded, the electroretinogramswith chlorided silver electrodes placed on the limbus ofthe upper outer quadrant of the cornea, the evokedpotentials with similar electrodes placed on the duraover homologous points on the two lateral gyri (Horsley-Clarke frontal plane zero, 1 mm. from the midline); theindifferent electrode was the frame of the Horsley-Clarke head holder. Responses were evoked with a Grassphotostimulator (model PS 2) set at maximum intensityand held 6 in. from the animal's eyes. The eyes werestimulated separately by covering each in turn with apatch of thick black rubber.
All brains were subsequently examined histologi-cally in order to reconstruct electrode tracks marked byelectrolytic lesions.
RESULTS
Behavioral Effects of MonocularDeprivationPrior to some experiments in animals deprived
from birth, the obstruction was removed from the
right eye (by separating the lids or removing the
translucent contact occluder), and an opaque
occluder was placed over the normal left eye.
Pupillary light reflexes were normal, and there was
no nystagmus. No visual placing reactions could be
obtained, though tactile placing was normal.
As an animal walked about investigating its
surroundings the gait was broad-based and hesi-
tant, and the head moved up and down in a pecu-

392 PART IV DEPRIVATION AND DEVELOPMENT
OCULAR DOMINANCE
Fig. 2. Ocular-dominance distribution of 12 separate consecutive penetrations from the same series as Fig. 1 (7).
liar nodding manner. The kittens bumped intolarge obstacles such as table legs, and even collidedwith walls, which they tended to follow using theirwhiskers as a guide. When put onto a table the ani-mals walked off into the air, several times fallingawkwardly onto the floor. When an object wasmoved before the eye there was no hint that it wasperceived, and no attempt was made to follow it.As soon as the cover was taken off of the left eye thekitten would behave normally, jump gracefullyfrom the table, skillfully avoiding objects in its way.We concluded that there was a profound, perhapscomplete, impairment of vision in the deprived eyeof these animals.
Physiological Findings in KittensDeprived of Vision in one Eye from BirthOf the 84 cortical cells recorded in kittens deprivedfrom birth, 83 were completely uninfluenced bythe deprived eye. The dominance of the normal eyein these cells was all the more striking since all butone of the five penetrations were made in the hemi-sphere contralateral to, and hence normallystrongly favoring, the deprived eye (see Fig. 1).
The ocular-dominance histogram of a kittenwhose right eye was sutured at 8 days for a 2Vz-month period is shown in Fig. 3. Of the 25 cellsexamined in a single penetration of the left striatecortex, 20 were driven exclusively by the normal

First Kitten Deprivation Papers 393
Fig. 3. Ocular-dominance distribution of 25 cells recorded inthe visual cortex of a 2'/2-month-old fatten. Experimentalprocedures are indicated beneath; during the first wee/{ theeyes were not yet open; on the eighth day the lids of the righteye were sutured, and they remained closed until the time ofthe experiment (cross-hatched region). The left eye openednormally on the ninth day. Recordings were made from theleft visual cortex, contralateral to the eye that had beenclosed. Five of the cells, represented by the interrupted col-umn on the right, could not be driven from either eye. Theremaining 20 were driven only from the normally exposed(left, or ipsilateral) eye, and were therefore classed as group7.
(ipsilateral) eye, and none could be influenced fromthe deprived (contralateral) eye. The 5 remainingcells could not be driven from either eye, andwould have gone unnoticed had it not been fortheir spontaneous activity. The presence in most ofthese penetrations of a small number of unrespon-sive cells is worth stressing, since in normal adultcats it has been possible to drive all cells withappropriate visual stimuli (7). The electrode trackof this penetration, reconstructed from the histo-logical slides, is shown in Fig. 4. The 20 cells whosereceptive fields were mapped in the normal eye allresponded to line stimuli, and each stronglyfavored one orientation and failed to respond to aslit, edge, or dark bar placed at right angles to theoptimum. The receptive fields were arranged in
the usual "simple" or "complex" manner (in thesense that we have previously used these terms (7))and varied in their orientation in a way consistentwith a columnar arrangement. Unresolved back-ground activity was present throughout the pene-tration, and, like the isolated units, it was stronglyinfluenced by the normal eye but not at all by thedeprived one.
In another 3-month-old kitten whose righteye had been closed from birth, penetrations weremade in homologous regions in both hemispheres.The ocular-dominance histograms of these pene-trations are shown in Fig. 5, and again illustrate afailure to drive any cell from the abnormal eye.Again there were several cells that could not bedriven from either eye.
The one cell in the series that could be drivenfrom the deprived eye was recorded from a thirdkitten, lid-sutured from birth to an age of 2/4months. This cell was unusual in having abnormalfields in both eyes. Unlike other cells in the samepenetration, which were normal except for theirunresponsiveness to stimulation of the deprivedeye, this cell had no particular orientation-prefer-ence, and the responses were more sluggish thanthose of the other cells. The receptive fields were inroughly corresponding parts of the two retinas.
To try to evaluate the relative importance ofform deprivation as against light deprivation weraised one kitten from birth to an age of 2 monthswith a translucent contact occluder over the righteye. This prevented patterned retinal stimulationand reduced the general retinal illumination byabout 2 log units, as opposed to 4—5 for the suturedlids. The ocular-dominance distribution of 26 cellsrecorded from the left hemisphere (contralateral tothe occluded eye) is shown in Fig. 6. Just as in thelid-suture experiments, all cells were driven exclu-sively from the normal (left) eye, except for threewhich could not be driven at all. The cells thatcould be driven had normal receptive fields. Fromthe electrode track reconstruction shown in Fig. 7,the electrode is seen to have traversed threecolumns, both shifts in orientation being small, dis-crete, and anticlockwise. Such orderly sequenceshave been seen in penetrations in adult cats (8), andsupport our impression that in parts of the striatecortex the columns are arranged in an orderlymanner. As in the first two kittens there was con-tinuous unresolved activity throughout the pene-

Fig. 4. Reconstruction of a microelectrode penetration through the post lateral gyrus of'the left hemisphere. This2'/2-month-old kitten had its right eye covered from birth by lid suture. Lines intersecting the electrode trac/{ rep-resent cortical cells; directions of these lines indicate the receptive-field orientations. Crosses indicate cortical cellsuninfluenced by light stimulation. Simultaneous recordings from two units, which occurred three times in thispenetration, are each indicated by only one line or cross. A lesion was made while recording from the first unit,and another at the end of the penetration: these are marked by small circles. The ocular-dominance distributionof units recorded in this penetration is shown in Fig. 3. All fields positioned 5—6° to the left of the area centralis,slightly below the horizontal meridian. Scale, 0.5 mm.
R i g h t Hemisphere
Fig. 5. Histograms showing ocular-dominance distribution of cells recorded in two penetrations, one in the leftvisual cortex and one in the right. A 3-month-old kitten with right eye closed by lid suture at 8 days (i.e., priorto normal eye-opening). Of a total of 23 cells, 3 were not influenced from either eye (interrupted lines). Theremaining 20 could be driven only from the left (normally exposed) eye: 8 were recorded in the left hemisphere,and are therefore classed as group 7; 12 were recorded in the right hemisphere, and are classed as group 1.
394
L e f t Hemisphere

First Kitten Deprivation Papers 395
Fig. 6. Ocular-dominance distribution of 26 cells recorded inthe visual cortex contralateral to the deprived eye. This2-month-old fyitten had had its right eye covered from thetime of normal eye-opening by a translucent contact lens; the
left eye was normally exposed. Twenty-three cells weredriven by the normally exposed (left, or ipsilateral) eye, and
were therefore assigned to ocular-dominance group 7. Threecells could not be activated by either eye (interrupted lines).
tration, briskly responsive to stimuli of the left eye,but with no hint of a response from the right.
In order to have a gross over-all impression ofthe retinal and cortical activity in this kitten, bilat-eral electroretinograms and evoked potentialrecordings were made (Fig. 8). The corneal elec-troretinograms evoked from either eye by a briefflash showed the normal a- and b-waves (Fig. 8, Aand B). Successive responses were almost identical,and with stimulation rates of I/sec. There was nosign of fatigue. (The amplitude was, if anything,greater from the deprived eye, but this could easilybe due to minor differences in stimulating condi-tions.) This is consistent with the findings ofZetterstrom (12), that the electroretinogram devel-ops normally except for a somewhat delayed timecourse in kittens raised in darkness. On the otherhand, cortical potentials evoked from the two eyes
were far from equal. This was true for either hemi-sphere (Fig. 8, C—F). Responses from the previ-ously occluded eye showed an initial positive com-ponent, but the later negative wave, so prominentin responses from the normal eye, was almost com-pletely lacking. Moreover, the latency to stimula-tion of the deprived eye was 35—40 msec., asopposed to 25—30 msec, from the normal eye. Thatany cortical wave was evoked from the deprivedeye indicates that some impulses originating fromthe eye must be relayed to the cortex, a finding thatis not surprising since normal geniculate receptivefields were found in these animals. The strikingdifferences in the negative phase support the sin-gle-unit findings in indicating that form depriva-tion and perhaps also moderate light deprivationduring the first 3 months after birth can causemarked changes in the normal physiology of thestriate cortex.
Deprivation of Kittens with PreviousVisual ExperienceIn the first paper of this series (11) we showed thatthe geniculate atrophy resulting from 2—3 monthsof visual deprivation is much less if the animal hashad 1 or 2 months of normal visual exposure, andthat in the adult cat no detectable atrophy resultsfrom 3 months of monocular lid closure. Theeffects of delayed deprivation on the responses ofcortical cells closely paralleled these anatomicalfindings. Figure 9 shows the ocular-dominancehistograms from a kitten deprived by lid closure atthe age of 9 weeks, for a period of 4 months. Forboth hemispheres the eye that had not beenoccluded was again abnormally dominant. Partic-ularly abnormal was the large number of cellsdriven exclusively by the normal eye. Now, how-ever, some cells (11 of the 34) could be driven alsoby the deprived eye, and while the deprived eyewas dominant in only 3 of these, it clearly exertedfar more influence than the deprived eyes of kittensoperated on at birth. The responses of all cellsseemed normal, and, in contrast to experimentsdone in kittens deprived from birth, there were nocells that could not be driven.
A second kitten was light-deprived by lid clo-sure at the age of 2 months for a period of only 1month. The ocular-dominance distribution of apenetration contralateral to the deprived eye wasclearly abnormal (Fig. 10), though it was less so

396 PART IV DEPRIVATION AND DEVELOPMENT
Fig. 7. Reconstruction of a micro-
electrode penetration through the leftpostlateral gyrus; ocular-dominancedistribution of this penetration isgiven in Fig. 6. Conventions as inFig. 4. Of the 17 recordings indicated,8 were single-unit and 9 were 2-unit.Scale, 0.5 mm.
than that of the previous kitten. Again, all cellswere responsive to patterned-light stimulation andhad normal receptive fields.
In one kitten the nictitating membrane wassewn across the right eye at 5 weeks, for a 3-monthperiod. It will be recalled that this animal showedno geniculate atrophy (11). Nevertheless the ocu-lar-dominance distribution was clearly abnormal(Fig. 11), suggesting that a decrease in effectivenessof the deprived eye in driving cortical cells is notnecessarily of geniculate origin. Once again, theocular-dominance distribution of cortical cells wasless distorted than that of a kitten deprived by atranslucent occluder from birth, for an evenshorter time (Fig. 6)
Finally, a single penetration made in the lefthemisphere of an adult cat whose right eyelids hadbeen sewn for 3 months was completely normal.Here again it will be recalled that the lateral genic-ulate bodies were histologically normal (11). Theocular-dominance distribution of 26 cells (Fig. 12)shows the usual over-all dominance of the con-tralateral eye—in this cat the eye that had beendeprived. A few months of monocular lid closurewas thus not enough to cause any obvious change
in cortical function; whether a longer period wouldhave is not known.
DISCUSSION
The results of the present paper show that in kit-tens monocular deprivation of light and form frombirth can produce both behavioral blindness in thedeprived eye and a failure of cortical cells torespond to that eye. These findings must be viewedin the light of those reported in the preceding paper(9), that the specific responses seen in cortical cellsof normal adult cats are present also in newbornand very young visually inexperienced kittens. Weconclude that monocular deprivation producesphysiological defects in a system that was oncecapable of functioning.
In view of the anatomical findings describedin the first paper of this series (11), the results of thepresent study may at first seem paradoxical: thatdeprivation by lid closure from birth should pro-duce in the geniculate marked atrophy of cells withonly mild physiological effects, and in the cortexjust the reverse, no obvious anatomical changes butprofound physiological deficits. The reasons for

First Kitten Deprivation Papers 397
the differences in morphological effects in the twostructures are easy to imagine. Each geniculate cellreceives visual input almost exclusively from oneeye, and the cells receiving afferents from a giveneye are aggregated in separate layers, so that anyanatomical change is easy to see, the more so sinceit tends to contrast with the normality of the adja-cent layers. The majority of cortical cells, on theother hand, have a binocular input (7), and the rel-atively few cells that are fed exclusively from oneeye are intermixed with the others. One wouldtherefore not expect a selective atrophy of themonocularly driven cells to stand out histologically.
It remains to account for the striking unre-sponsiveness of cortical cells to stimulation of thedeprived eye, compared with the relative normal-ity of geniculate responses and receptive fields. Thecortical impairment was just as marked after dep-
rivation with a translucent occluder as with lid clo-sure an especially surprising result since in the lat-eral geniculate the amount of light deprivationseemed to be important in determining the degreeof anatomical change (11). These differencesbetween geniculate and cortical cells can perhapsbe best understood if we recall that in the normalcat cortical cells are much less responsive thangeniculate cells to diffuse light (5, 6). Any lightreaching the retina would thus help to keep genic-ulate cells active. On the other hand, most corticalcells would be practically uninfluenced regardlessof the type of occlusion, and over a long period theymight become unable to respond even to patternedstimulation of the deprived eye.
In discussing morphological changes in thelateral geniculate following visual deprivation (11),we pointed out that the maintained activity persist-
Fig. 8. Corneal electroretinograms and cortical evoked potentials (ECGs) in a 2-month-old fatten whose righteye had been covered by a translucent contact lens from the time of normal eye-opening (same fatten as in Figs.6 and 7). A, C, E: stimulation of right (previously occluded) eye. B, D, F: stimulation of left (normal) eye. A,B: electroretinograms. C, D: cortical evoked potentials, left hemisphere. E, F: cortical evoked potentials, righthemisphere. Positive deflections upward.

398
Fig. 9. Histograms of ocular-dominance distribution of 34 cells recorded in two penetrations, one in the leftvisual cortex and one in the right. Kitten whose right eye was closed by lid suture at 9 weeks, for a period of 4
months. Seventeen cells recorded from each hemisphere. All cells were influenced by patterned-light stimulation.
ing in the retina under these conditions of lidsuture or translucent occlusion is insufficient toprevent the atrophy. The same obviously applies tothe present cortical recordings: the functional path-way up to the cortex was evidently not maintainedby whatever activity persisted in the lateral genicu-late body.
Though we have no direct way of knowingthe exact site of the abnormality responsible forcortical unresponsiveness, the main defect must becentral to the lateral geniculate body, since genicu-late cells respond well to stimulation of thedeprived eye. Nevertheless these geniculateimpulses have no apparent effect on cortical cells,even though the cortical cells fire perfectly well tostimulation of the normal eye. This suggests thatthe abnormality is in the region of the synapsebetween the axon terminals of geniculate cells(those receiving input from the deprived eye) andthe cortical cells on which these terminals end.
Though the most abnormal feature in thephysiological studies was the ocular-dominancedistribution, there was another consistent differ-ence from normal penetrations: in every experi-ment in kittens deprived from birth there were afew cells that could not be driven from either eye.This probably cannot be explained by the immatu-rity of the kittens, since in a previous study of even
younger animals all of the cells could be driven byappropriate stimuli (9). A more likely explanationis that the unresponsive cells were connected exclu-sively with the covered eye—at least the proportionof nondriven cells was about what one would
Fig. 10. Ocular-dominance histogram from a fatten whose
right eye was closed by lid suture at the age of 9 weeks, for 1
month. Twenty-one cells were recorded from the left visualcortex. All cells were influenced by patterned-light stimula-tion.
L e f t Hemisphere R i g h t Hemisphere
PART IV DEPRIVATION AND DEVELOPMENT

First Kitten Deprivation Papers 399
Fig. 11. Ocular-dominance histogram of 22 cells recorded
from the left visual cortex; fatten with nictitating membrane
sutured across the right eye at an age of 5 weel^s, for 3
months. The left (ipsilateral, normal) eye dominated
markedly, and all cells were influenced by patterned-light
stimulation.
Fig. 12. Ocular-dominance distribution of 26 cells recorded
in the left visual cortex of an adult cat whose right eye had
been covered by lid suture for a period of 3 months. As in the
normal cat, the contralateral eye—in this case the deprived
eye—dominated.
expect on that assumption. Had it not been fortheir maintained activity these cells would proba-bly have gone undetected, and one wonders if themaintained firing does not reflect some other, non-visual input.
While the site of the physiological defect maybe within the cortex, as suggested above, it wouldprobably be wrong to assume that abnormalities atthe geniculate level did not also contribute to theunresponsiveness of the cortical cells. Many of thegeniculate cells were atrophic; in recordings fromthe geniculate there was an over-all decrease inactivity in the layers connected with the deprivedeye, and a few fields seemed abnormal (11). Thecortical evoked responses to a flash made it clearthat impulses in at least some geniculate fibers asso-ciated with the deprived eye reached the cortex ofboth hemispheres, but the marked increase inlatency suggests that this input may have beenabnormal. Thus it is probable that defects at severallevels, from retina to primary visual cortex, con-tributed to the observed physiological abnormali-ties. At present we have no direct way of assessingtheir relative importance.
The behavior of our monocularly deprivedkittens, under conditions in which they could useonly the deprived eye, suggested the presence of
gross visual deficits. This confirms the binocular-deprivation studies of other observers in severaldifferent mammalian species (2, 4, 10, 3). Inmonocularly deprived animals the visual pathwaybeyond the point of convergence of impulses fromthe two eyes was presumably intact, since corticalcells were actively driven from the normal eye, andsince the animals were able to see with that eye.This suggests that also in bilaterally deprived ani-mals the defect may not necessarily be at a far cen-tral level: e.g., the defect need not be in visuallyguided motor function, or the result of some emo-tional disturbance. There may indeed be suchdefects, but our results make it likely that abnor-malities exist at a more peripheral level as well.
In interpreting the blindness resulting fromraising animals in darkness it has generally beenassumed that some of the neural connections neces-sary for vision are not present at birth, and that theirdevelopment depends on visual experience early inlife. Our results suggest the alternative possibility,that certain connections are intact at birth andbecome defective through disuse. One must, how-ever, make one reservation: deprivation of one eyemay be quite different in its morphological andphysiological effects from binocular dark-raising.Conceivably if one eye is not stimulated, the fate of
400 PART IV DEPRIVATION AND DEVELOPMENT
its projections in the central visual pathway maypartly depend on whether or not the other eye isstimulated. This question of a possible competitionbetween the eyes can only be settled experimentally,by studying animals that have been binocularlydeprived of vision. For example, Baxter (1), com-paring records from the visual cortex of normal anddark-raised kittens, could find no striking differ-ence in the size or shape of the evoked potentials inthe two groups. This finding contrasts sharply withthe difference we saw in cortical potentials evokedfrom the normal, as opposed to the deprived eye(Fig. 8), and it remains to be learned whether or notthe discrepancy reflects a difference in the two typesof preparation.
The susceptibility of very young kittens to afew months of visual deprivation apparently doesnot extend to older animals, since there is adetectable lessening of effects when deprivation isbegun at 2 months, and an absence of behavioral orphysiological effects in adults. This is a clear dem-onstration of a pronounced difference between kit-tens and adults in susceptibility to deprivation, adifference one might have expected from the pro-found visual defects observed after removal of con-genital cataracts in man, as opposed to the absenceof blindness on removal of cataracts acquired laterin life.
SUMMARY
1. Single-unit recordings were made from striatecortex of kittens in which one eye had beendeprived of vision either from birth or subse-quently, and for various periods of time.
2. Kittens deprived from birth for 2—3 monthsshowed profoundly defective vision in the de-prived eye. Visual placing and following reac-tions were absent, and there was no hint of anyability to perceive form. Pupillary light reflexeswere nevertheless normal.
3. In kittens deprived from birth, either by sutur-ing the lids of one eye or by covering the corneawith a translucent contact occluder, the greatmajority of cortical cells were actively drivenfrom the normal eye, with normal receptivefields. On the other hand, only 1 cell out of 84was at all influenced by the deprived eye, and inthat cell the receptive fields in the two eyes wereabnormal. A few cells could not be driven fromeither eye.
4. In one 2-month-old kitten monocularly de-prived with a translucent contact occluder, thecorneal electroretinograms were normal in thetwo eyes. On flashing a light in the previouslyoccluded eye the slow-wave potentials evokedin the visual cortex of the two hemispheres werehighly abnormal, compared with responsesfrom the normal eye.
5. One to two months of normal visual experienceprior to monocular deprivation by lid suture orwith a translucent occluder reduced the severityof the physiological defect, even though theability of the deprived eye to influence corticalcells was still well below normal. On the otherhand, 3 months of deprivation by lid closure inan adult cat produced no detectable physiologi-cal abnormality.
6. We conclude that monocular deprivation in kit-tens can lead to un-responsiveness of corticalcells to stimulation of the deprived eye, and thatthe defect is most severe in animals deprivedfrom bith. The relative normality of responsesin newborn kittens (9) suggests that the physio-logical defect in the deprived kittens representsa disruption of connections that were present atbirth.
ACKNOWLEDGMENT
We express our thanks to Jane Chen and Janet Tobie for theirtechnical assistance.
References
1. Baxter, B. L. An Electrophysiological Study of the Effects ofSensory Deprivation Doctoral dissertation (unpublished).University of Chicago, 1959.
2. Berger, H. Experimentell-anatomische Studien iiber diedurch den Mangel optischer Reize veranlassten Entwick-lungshemmungen im Occipitallappen des Hundes und derKztze.Arch. Psychiat. Nerventy., 1900,^: 521-567.
3. Chow, K. L. and Nissen, H. W. Interocular transfer oflearning in visually nai've and experienced infant chim-panzees./, comp. Physiol. Psycho!., 1955,48: 229-237.
4. Goodman, L. Effect of total absence of function on the opticsystem of rabbits. Amer. J. Physiol., 1932,100: 46-63.
5. Hubel, D. H. Single unit activity in striate cortex of unre-strained cats./. Physiol., 1959,147: 226-238.
6. Hubel, D. H. and Wiesel, T. N. Receptive fields of singleneurones in.the cat's striate cortex./. Physiol., 1959, 148:574-591.
7. Hubel, D. H. and Wiesel, T. N. Receptive fields, binocularinteraction and functional architecture in the cat's visualcortex./. Physiol, 1962,160: 106-154.
8. Hubel, D. H. and Wiesel, T. N. Shape and arrangement ofcolumns in cat's striate cortex./. Physiol., 1963,165:559—568.
First Kitten Deprivation Papers 401
9. Hubel, D. H. and Wiesel, T. N. Receptive fields of cells in 11. Wiesel, T. N. and Hubel, D. H. Effects of visual deprivationstriate cortex of very young, visually inexperienced kittens. on morphology and physiology of cells in the cat's lateral/. Neurophysiol., 1963, 26: 994-1002. geniculate body./. Neurophysiol., 1963,26: 978-993.
10. Riesen, A. H., Kurke, M. I., and Mellinger, J. C. Interocu- 12. Zetterstrom, B. The effect of light on the appearance andlar transfer of habits learned monocularly in visually na'ive development of the electroretinogram in newborn kittens,and visually experienced cats./, comp. Physiol. Psychol., Acta physiol. scand., 1955, :?5: 272-279.1953,46:166-172.
AFTERWORD
If one were to sum up the main message of the first of these three papers, thestress would be on the relative normality of the geniculate physiology in theface of the marked abnormality of the anatomy. Part of the explanation ofthe apparent discrepancy could lie in the methods: for the anatomy one hadthe possibility of a direct comparison of neighboring layers, whereas it washarder in interpreting the physiology to compare sluggishness of responsesand the sizes of the field centers. In retrospect, the relatively mild differenceswe saw in the physiology of the left-eye and right-eye layers were probablyreal. The final explanation for the anatomical shrinkage came much later,with Ray Guillery's discovery that the geniculate cell shrinkage was proba-bly the result of paring down of the axonal terminals of these cells in the cor-tex, accompanying the shrinkage of the cortical ocular dominance columns.We shall come back to this topic when we discuss the relative roles, in depri-vation, of disuse and eye competition.
The second paper gives evidence that some at least of the wiring of thecat visual system is present at birth. The responses of cortical cells in the new-born clearly had some of the specificity that we had seen in the adult catvisual cortex. Because of the frailty of the newborn kittens and the relativeopacity of the ocular media in the first few weeks, we usually waited for afew weeks before testing, sewing both eyes closed just at the time of normaleye opening and hoping that in the few weeks that followed any deprivationeffects would be minimal. What surprised us was the presence of any orien-tation selectivity in these kittens. In retrospect, if we had given more stress tothe differences between normal kittens and normal adult cats (the broaderorientation tuning curves and so on, in the kittens) we might have saved our-selves some of the controversy that came in the years that followed. We neverdoubted the importance of experience or learning in the development ofneural connections—that would be tantamount to claiming that learninghad nothing to do with neural connections—but what was new was our evi-dence for any innate connections. The newborn brain was (and perhaps stillis) thought by some psychologists to be a tabula rasa on which postnatal expe-rience writes its messages. In the 1960s, to claim otherwise could get one intopolitical trouble. We felt that in this series of studies we had bolstered thearguments for both sides, for both nature and nature. One of our main dis-coveries was, after all, the importance of postnatal experience for the main-tenance of cortical connections.
Much of the controversy that followed these results was settled by oursubsequent deprivation studies in macaque monkeys, because the relative

402 PART IV DEPRIVATION AND DEVELOPMENT
maturity of responses in the newborn is so much more evident. In newbornkittens the relative immaturity of visual capabilities made the state of theconnections far harder to establish, and it was no wonder that others weremore impressed by the lack of responsiveness than by the specificity that onehad to struggle to detect.
In at least one respect we may have gone too far in interpreting ourresults. We thought that the connections responsible for the orientationselectivity, and so on, in the newborn, must necessarily be the result ofgenetic coding. Nevertheless, we were careful, at least in our mainlinepapers, not to make any such claims in public: our molecular-biologicalfriends had stressed to us the unlikelihood of there being enough genes tocode for even a small percentage of the connections that must be present inthe newborn animal. It had not occurred to us, or presumably to anyone else,that prenatal retinal activity unrelated to the environment could play a partin promoting cortical connections. Today we know from work by Meister,Wong, Baylor, and Shatz (Science 1991, 252:939) that in the months prior tobirth, waves of activity crisscross the retina and are accompanied by impulsesin retinal ganglion cells. Although there is as yet no evidence that this activ-ity is responsible for specificity of connections beyond the retina, we are nolonger forced, by exclusion, to the notion that the richly detailed connectionsthat must exist in the visual cortex must all be determined by purely geneticprocesses.
The results of this second paper on innate connections were importantin our interpretation of the third paper, reporting the physiological results ofeye closures. We were forced to recognize the possibility that the abnormal-ities were caused by some kind of withering of disused connections that hadexisted at birth, as opposed to a failure to develop them though lack of expe-rience. This went against interpretations, expressed or implied, of all thedark-rearing work that had been done previously. We would not havedenied the importance of experience in developing connections (one is afterall not born knowing the alphabet), but suddenly one had to admit that dep-rivation might, at least in part, be a matter of failure through disuse.
What had probably not occurred to us was the possibility that some-thing more than simple disuse might be involved. Only when we deprivedboth eyes of vision, and when we induced artificial squint—the subject of thenext set of deprivation/development papers—were we forced to concludethat our cortical deprivation effects were more related to competition than tosimple disuse. That of course left the geniculate anatomical defects, the pal-lor and shrinkage, unaccounted for, since geniculate cells are fed exclusivelyby one eye, with no chance of competition. Or so we thought—until thework of Guillery and his colleagues, to be described in the Afterwords to thenext set of deprivation papers.
Finally, today we are so used to thinking of the visual cortex as housingtwo types of columns, one subserving orientation and the other, ocular dom-inance, that we tend to forget how long it took to recognize the existence ofthe ocular-dominance columns. In our 1962 magnum opus on normal cat

First Kitten Deprivation Papers 403
cortex, we do, somewhat reluctantly, admit to seeing hints of grouping ofcells according to eye dominance, but only, as it were, to keep the possibilityopen. At the time of these three papers, ocular dominance columns were stillonly vaguely in our minds. Later, three kinds of evidence forced us to recog-nize ocular dominance columns: the strabismus experiments in the cat,which made them obvious; our studies of the normal adult macaque monkeycortex, in which they are better developed; and the use of transport labelsafter eye injection, done by us in monkeys and by Torsten, Carla Shatz, andSivert Lindstrom in cats.

Chapter 22 • Second Group ofDeprivation Papers •
FOREWORD
The next three deprivation papers (pp. 404-439), which came out in 1965, dealwith the effects of binocular eye closure, artificial strabismus (cross-eye orwall-eye), and the recovery induced by eye reopening. Finally, in the fourth(1970) paper (pp. 440—452), we examined the time course of the critical period.
In our first deprivation studies we had obvious reasons for closing oneeye rather than both. Interpretation of responses was easier (or so it seemedto us at the time) because we had the normal eye as a control, and the proce-dure was certainly kinder to the kittens. This approach seemed vindicatedwhen, in the very first monocular eye-closure experiments, practically all thecells were monopolized by the normal eye, with only rare responses from theeye that had been sutured. Furthermore, it was hard enough, in the begin-ning, to suture one eye closed and keep it closed, without attempting a dou-bly difficult binocular suture. Finally, it would have been much harder to seethe geniculate morphological changes had we closed both eyes and not hadthe built-in control that let us compare neighboring geniculate layers. Nev-ertheless, out of a stubborn sense of rigor, we finally decided to do a binocu-lar suture, with every expectation that we would be unable to drive cells fromeither eye. The result came as a complete surprise and convinced us thatwhile controls can seem a bore, they should not be avoided indefinitely. (Ourgraduate students know this very well—they even believe in controls—butwe were trained to be clinicians, not scientists. One colleague, a scientist, nev-ertheless remarked that her definition of a fool was one who did the controlbefore doing the experiment.) In any case, along with the results on strabis-mus, the binocular-closure result provided the first indications that the dep-rivation effects we had been seeing were not related just to disuse, but mustinvolve competition between the two eyes. This first binocularly deprivedanimal showed such striking and convincing differences from what we hadexpected that we wrote the paper on the strength of that animal alone andsent it, along with the two companion papers, to Eric Kandel for his com-
404

Second Group of Deprivation Papers 405
ments. He wrote back full of enthusiasm, but with the plea that, given theimportance of the binocular closure result, would we please consider doingjust a few more binocular animals. We decided he was right and reluctantlyrolled up our sleeves and spent an extra month or so. The results were essen-tially the same. We are glad we took the extra time and feel indebted to Eric.
The strabismus experiments, like the eye closures, were motivated byour clinical backgrounds. The unilateral blindness that can result from thecross-eye or wall-eye state, also known as lazy eye or amblyopia ex anopsia, isone of the commonest forms of human blindness in the Western world. Itseems fair to say that before these experiments no one had thought that thesite of the abnormality could be anywhere but the eye itself. We had no ideawhat we would find, but our knowledge of the physiology of the visual pathup to and including the primary visual cortex seemed to put us in a goodposition to ask. We took a litter of six newborn kittens and proceeded to cutthe right medial rectus muscle in all of them, causing the eye to turn out.After about three months we tested vision behaviorally in one of the kittensby putting an opaque contact lens over first one eye and then the other oneand watching the animal get around. To our dismay vision seemed normalin both eyes. What we had obviously produced was an alternating strabis-mus, the condition commonly seen in humans with divergent squint, inwhich vision remains normal in both eyes but the eyes take turns fixating,while the non-fixating eye diverges. There seemed little point in going anyfurther with these kittens. We were saddled with a roomful of wall-eyed kit-tens and no expectation of learning anything from them.
We debated whether to do any recordings, but finally we tossed a coinand decided to go ahead and waste a day recording from one kitten. We weredumbfounded at the result. We encountered one monocular cell after theother, first a batch driven from only one eye, then a batch from only the othereye. We had to concede that we did indeed have a result. That week, for thefirst and only time, we did a crash program of three experiments, on Mon-day, Wednesday, and Friday, and wrapped up the entire squint project. Thesquint experiments were thus unlike the slow plodding of most of the depri-vation work.
We obviously had to find out whether the squint result was a matter ofnot using the eyes together in the normal way, or not using them together atall. This motivated us to do the next series using alternating occlusion, inwhich we placed an opaque occluder over one eye one day and the other eyethe next, over a period of several weeks. Again we were surprised by theclear and striking result, practically identical to the strabismus results. (Wenaturally worry about the implications of this result for the commonlyemployed treatment of human lazy eye by placing a patch over the normaleye. That procedure does indeed work, to the extent of improving the visionof the lazy eye, but can only impair any possible residual stereopsis. Andstereopsis is presumably a large part of the reason we have two eyes.)
The artificial squint experiments provided an unexpected byproduct, aclear demonstration of ocular dominance columns in cats. We had detected
406 PART IV DEPRIVATION AND DEVELOPMENT
some grouping of cells according to ocular dominance in our 1962 paper butwere relatively unimpressed. In normal cats, contrary to what one finds inmonkeys, the variations in eye dominance are gentle rather than abrupt.Strabismus apparently had the effect of sharpening the differences in oculardominance, so that a cell that in early life only mildly favored one eye wouldcome to favor it markedly or end up responding only to that eye. (Groups 2and 3 cells would thus become group 1, and 5 and 6 become 7.) In the squintanimals we saw striking sequences of cells, ten or twenty in a row, all monop-olized by one eye, then another stream of cells monopolized by the other eye.We concluded that similar groupings according to eye preference must bepresent in normal cats, but that the squint had made them more obvious.
The cat recovery study, like the strabismus study, was motivated byclinical considerations. The slow and unsatisfactory recovery of childrenafter removal of congenital cataracts had led us not to expect dramatic recov-ery when our cats' eyes were reopened after prolonged deprivations, andindeed we saw little. Obviously our use of reverse suturing—opening the lidsof the deprived eye and closing the lids of the normal eye—was modelled onthe use of eye patching in cases of human amblyopia, and it certainly encour-aged the recovery from amblyopia. The results further strengthened ourimpression that we were dealing with competitive effects and not simply dis-use. Our alternating-occlusion results, on the other hand, suggested that eyepatching in humans should only lead to a further loss of the ability of the twoeyes to act together, and should if anything lead to further impairment ofstereopsis.
We still had to establish the critical period for eye closures. In the thirdpaper of the first set, on the physiological results of deprivation, we hadshown a diminished effect when the closure was delayed and absence ofeffects in an adult. It remained to narrow down the time course. This, thetopic of the fourth paper in this series (pp. 440-452), was slow work—wethought of it as plotting a set of graphs in which we varied two parameters,the onset and the cessation of the deprivation, and required an experiment,and a kitten, for each point.
The concientious reader of this book will probably notice that the ref-erences to the second paper in this series, on strabismus (p. 430), are some-what less generous than those that follow most of our papers. When wewrote the penultimate draft we noticed that all but one of the referenceswere to ourselves. We looked at each other, and one of us asked, "Do wereally need this one?" We agreed that generosity should have its limits, andremoved it.
Second Group of Deprivation Papers 407
Comparison of the Effects of Unilateral and Bilateral Eye Closureon Cortical Unit Responses in Kittens1
TORSTEN N. WIESEL AND DAVID H. HUBEL • Neurophysiology Laboratory, Department of Pharmacology,
Harvard Medical School, Boston, Massachusetts
INTRODUCTION
In the normal cat or kitten about four-fifths of cellsin the striate cortex can be driven by both eyes (3,4). If, however, one eye of a newborn kitten is sewnshut and the visual cortex recorded from 3 monthslater, only a small fraction of cells can be drivenfrom the deprived eye (8). In contrast, many cells inthe lateral geniculate are driven normally from thedeprived eye (7), suggesting that the abnormalityoccurs somewhere between geniculate cells andcortex. Since clear receptive-field orientations anddirectional preferences to movement are seen incortical cells of newborn visually inexperiencedkittens, the deprivation effects presumably repre-sent some sort of disruption of innately determinedconnections, rather than a failure of postnataldevelopment related to lack of experience.
In these experiments the use of monoculardeprivation made it possible to compare adjacentgeniculate layers, and also to compare the two eyesin their ability to influence cortical cells, so that eachanimal acted, in a sense, as its own control. Theresults led us to expect that depriving both eyes forsimilar periods would lead to an almost total unre-sponsiveness of cortical cells to stimulation of eithereye. That should be so, provided the effects ofdepriving one eye were independent of whether ornot the other eye was simultaneously deprived. Itseemed worthwhile to test such an assumption,since any interdependence of the two pathwayswould be of considerable interest. We accordinglyraised kittens with both eyes covered by lid suture,and recorded from the striate cortex when the ani-mals had reached an age of 2'/2—4% months.
METHODS
In 5 kittens the lids of both eyes were sutured togetherbilaterally 6—18 days after birth, just before normal eye
opening or up to 8 days after (Table 1). Lid closurereduces retinal illumination by 4—5 log units (7), andundoubtedly prevents any form vision. One kitten wasobserved behaviorally at 3 months of age and was keptaside for physiological studies of recovery (9). Single-cellrecordings were made in the other 4 kittens (no. 3-6) at21/2-4'/2 months of age. In all, 10 penetrations were madeand 139 units studied.
In two additional kittens the lids of one eye weresutured before the time of normal eye opening. Theseanimals (no. 1 and 2) were recorded from at 8-10 weeks,and the results, together with those from three monocu-lar closures previously reported (8), were compared withthe results of the binocular closures.
The acute experiments were done under thiopentalanesthesia, and succinylcholine was injected intra-venously in order to paralyze the extraocular muscles.Tungsten micro-electrodes were used in a closed-cham-ber system (2, 3). Receptive fields were mapped by pro-jecting small spots of white light upon a wide white tan-gent screen, which the animal faced from a distance of1.5 m. A background light was set at low photopic ormesopic levels (-1 to +1 Iog10 cd/m2), and the intensity ofthe stimulating light was 1—1.5 log units brighter thanthe background.
After the recordings the animals were perfusedwith normal saline followed by 10% formalin. Thebrains were embedded in celloidin, sectioned at 25 (I, andstained with cresyl violet. These histological sectionswere used for reconstruction of the electrode tracks andfor a morphological study of the visual pathways. Meth-ods of measuring the size of cells in the lateral geniculateare described in a previous paper (7).
RESULTS
MONOCULAR CLOSURES. In our first series of depri-vation experiments (8) three kittens were deprivedby monocular lid closure from birth to 2M> to 3months. Recordings made at that time gave highlyconsistent results: in each of the 4 penetrationsthere were steady successions of cells responding to
From/. Neurophysiol. (1965) 28: 1029-1040
Received for publication December 23, 1964.
'This work was supported in part by Public Health Service Grants NB-02260-05 and NB 05554-01, and in part by U. S. Air ForceContracts AF-AFOSR-410-63A and AF 49(638)1443.

408 PART IV DEPRIVATION AND DEVELOPMENT
the eye that had been open, interrupted by an occa-sional cell that would not respond to either eye,against an almost continuous background of unre-solved unitary activity responding briskly to thenormal eye. With a single exception, all of the 85cells recorded gave no response to the previouslyclosed eye, and at no stage in any of the penetra-tions was the unresolved background responsive tothat eye.
In the paper that follows (5) it is shown thatnormal cortical cells are to some extent segregatedwith respect to eye dominance. The possibility arosethat after monocular deprivation any cells stillinfluenced from the deprived eye might be aggre-gated into small isolated islands, and might there-fore not be encountered in a small number of pene-trations. We therefore made a more intensivesearch, recording from 115 more cells in 2 kittensdeprived by monocular closure from birth to an ageof 2—3 months. Five additional penetrations weremade, the results of which are shown schematicallyin Fig. 1. Each electrode track is expanded so as toillustrate the relative depths at which cells wererecorded. The position of each cell is represented bya short horizontal line placed in the appropriatevertical row according to ocular dominance group;positions of cells that could not be driven are shownin a separate row to the right of the others.
Two penetrations were made in the first ofthese kittens, and are illustrated to the left in Fig. 1.No cells were driven from the right (deprived) eye.Cells recorded from the left hemisphere, all drivenfrom the left eye, were therefore classed as group 7;cells recorded from the right hemisphere were allgroup 1. These two penetrations were thus similarto almost all of those made in the previous monoc-ular deprivation series.
Three penetrations, reconstructed to the rightin Fig. 1, were made in kitten no. 2. Two of theseturned out to contain a region in which succes-sively recorded cells and unresolved backgroundactivity were driven from both eyes or from thedeprived eye alone. Each region formed only asmall portion of the whole penetration. In the thirdpenetration cells were driven entirely by the nor-mal eye, with one exception, a cell that was influ-enced by the deprived eye but strongly dominatedby the normal eye.
Of the 12 cells that were driven by thedeprived eye, all but 1 were abnormal in one way or
another. Most of them responded in a vague, unpre-dictable manner, and most lacked a precise recep-tive-field orientation. Some showed an unusuallypronounced decline in responsiveness after severalseconds of repeated stimulation. Curiously, somecells were driven abnormally not only from thedeprived eye but also from the eye that had beenopen all along. Similar abnormal cells were foundafter binocular deprivation, as described below, andafter attempts to induce recovery (9).
Figure 2 shows the ocular-dominance his-togram of all 199 cells recorded in monocular dep-rivation experiments. The 13 cells that were influ-enced from the deprived eye amounted to about7% of the total. While this figure is larger than theoriginal monocular deprivation experiments sug-gested, it is undoubtedly more reliable, and con-firms our impression that the proportion of cellsinfluenced from the deprived eye is small. Theproportion driven normally must be very smallindeed. Perhaps more important is the suggestionthat such cells may be aggregated in small regionsof cortex which together make up only a smallfraction of the total volume.
BINOCULAR CLOSURE. From the monocular clo-sures one might have expected to find large areas ofcortex containing no responsive cells, and onlysmall islands of tissue with cells responding in anaberrant way to one eye or both. Right from theoutset, however, it was clear that we were not deal-ing with cortex in which most cells were unrespon-sive. Throughout the greater part of all nine pene-trations in kittens no. 3—6, most cells not onlyresponded to visual stimuli, but over half of theones that responded did so normally.
The cortex of these animals was neverthelessby no means normal. Numerous sluggishly re-sponding unpredictable cells with vaguely definedreceptive field properties made the penetrationsdifficult and frustrating. Of 139 cells recorded, 45(32%) were classed as abnormal, as opposed to 57(41%) normal cells. Thirty-seven cells (27%) couldnot be driven by visual stimulation at all, and wererecognized only by their maintained firing. Thecortex may have contained unresponsive cellswithout maintained firing; they would not havebeen observed, in which case 27% would be toolow. These results are for the 4 kittens takentogether, but figures for the individual experiments

Second Group of Deprivation Papers 409
Fig. 1. Schematic reconstructions of five microelectrode penetrations in two fattens. Kitten 1 was 8 weeks oldand kitten 2, 10 weeks; both had the right eye closed by lid suture at 8 days. Each penetration extended into cor-tical gray matter for about 1.5 mm. The penetrations are drawn so as to indicate relative positions of individualcells; each cell is represented by a short horizontal line placed in the appropriate vertical row according to ocu-lar-dominance group. The separate row to the right of group 7 is for unresponsive cells. The total number of cellsin each group is indicated in the histogram at the bottom. (For definitions of ocular-dominance groups see leg-end of Fig. 2.)
were in reasonable agreement (Table 1); the pro-portion of cells that could be driven, normally orabnormally, ranged from 67% for kitten no. 3 to80% for no. 5.
The normal cells showed all of the usual spe-cific responses to properly oriented line stimuli.Some receptive fields were "simple" and others"complex," in the sense in which we have usedthese terms elsewhere (2, 3). Cells that respondedabnormally had lost much of their specificity for
precisely oriented lines, reacting with uniformbriskness over a wide range of angles, and oftenshowing no orientation preference at all. Some ofthese cells were driven from both eyes, and gaveabnormal responses to both. Like most normal cor-tical cells, the abnormal ones generally gave noresponses to diffuse light. None had concentriccenter-surround fields of the type found in the lat-eral gemculate body or retina. Many showed a ten-dency to fire actively the first time a stimulus was

410 PART IV DEPRIVATION AND DEVELOPMENT
Fig. 2. Ocular-dominance distribution of 199 cells recordedin the visual cortex of 5 monocularly deprived fyttens. The
animals were 8—14 weel^s old and all had the right eye closedby lid suture from the time of normal eye opening. Shadingindicates cells that had the usual specific response propertiesto visual stimulation; absence of shading indicates cells thatlacked the normal orientation specificity. Interrupted linesindicate cells that did not respond to either eye. Cells of group1 were driven only by the contralateral eye; for cells of group2 there was marked dominance of the contralateral eye; forgroup 3, slight dominance. For cells in group 4 there was noobvious difference between the two eyes. In group 5 the ipsi-
lateral eye dominated slightly; in group 6, markedly, and in
group 7 the cells were driven only by the ipsilateral eye.
introduced but with declining vigor as the stimuluswas repeated. A period of 1/2 to 1 min. withoutstimuli was usually enough to revive a cell fully.We have observed this behavior in cells of normaladult cats in all three visual areas, but not as fre-quently or to as pronounced a degree.
The ocular-dominance distribution is shownfor one binocularly deprived kitten (no. 3) in Fig.3A, and for all four kittens in Fig. 3B. The major-
ity of cells could be driven from both eyes. Normaland abnormal cells were present in all groups inFig. 3B, though there was probably some decreasein the proportion of cells in groups 3—5 comparedwith the distribution in normal cats. The most con-spicuous abnormality was seen in the large groupof nonresponding cells, shown by the interruptedcolumn to the right of each histogram. We have noevidence that unresponsive cells occur in the nor-mal striate cortex (3, 4).
In Fig. 4 one of three penetrations made inkitten 4 is reconstructed in detail. To the right ofthe figure is a tracing of a coronal section throughthe right postlateral gyrus. To the left, the electrodetrack is expanded as in Fig. 1. Lines within the cir-cles indicate by their tilt the receptive-field orienta-tion. As in the normal animal, cells were aggre-gated according to receptive-field orientation.Within a single column, such as that formed bycells 1—10 and 13—16 and indicated by the largebrackets, there were both normal cells and cellswith nonoriented fields. Unresponsive cells weresometimes grouped together (cells 23—27), but werealso frequently intermixed with more normal cells(12, 19, and 20). Finally, the figure illustrates a ten-dency for cells to be aggregated in the cortexaccording to the predominating eye. For example,cells 1—13 form a sequence in which the contralat-eral eye consistently dominated. As mentionedabove, this grouping according to eye dominance isalso found in normal cats, and is examined in moredetail in the next paper (5).
HlSTOLOGICAL OBSERVATIONS IN THE VlSUAL PATH-WAYS. Since the cortical physiology was so differ-ent from what might have been expected from themonocular closures, we were anxious to learnwhether or not the geniculate histology would beconsistent in the two studies. In monocular closures(7) there were marked abnormalities in the layersreceiving input from the deprived eye, consistingof a change in staining characteristics of cells, adecrease in the volume of cell bodies and nuclei,and a loss of the clear unstained substance betweencell nests. The changes were obvious at a glance, oncomparing the normal and abnormal layers. Thedecrease in mean cross-sectional area of cell bodiesamounted in the dorsal layers to 30-40%.
In animals with binocular closure there wassurprisingly little to see on casual inspection. This

Second Group of Deprivation Papers
Table 1. Effects of Bilateral Eye Closure on Cortical Cells
Kitten 3 Kitten 4 Kitten 5 Kitten 6
411
Age at time of eye closure, daysAge at time of recording, monthsNumber of penetrationsNormal cellsAbnormal but responsive cellsUnresponsive cellsTotals (cells)
184'/2
314 (36%)12(31%)13 (33%)39
184317(46%)10(27%)10 (27%)37
621/2215 (43%)13 (37%)7 (20%)35
63211 (39%)10 (36%)7(25%)28
Totals (cells)
57(41%)45 (32%)37 (27%)139
is illustrated in the photomicrograph of Fig. 5AThe difference, however, was apparent rather than
real. The changes were not obvious since abnormalcells did not stand out against normal ones on thesame slide. Nevertheless, comparison with a nor-mal geniculate as in Fig. 5B, or with normal layersin monocularly deprived kittens, showed that thesame abnormalities were indeed present, and to anequal degree. In kitten 3 measurement of 200 cellsin the two dorsal layers (A and Aj) showed a meancross-sectional area of about 180 LI2, compared witha normal value of about 300 LI2. This represents ashrinkage of about 40%. The nucleus and nucleo-
lus likewise showed marked shrinkage. No obvi-ous histological changes were seen on simpleinspection of Nissl or myelin sections of retina,optic nerve, superior colliculus, or cortex.
BEHAVIORAL EFFECTS. As the lid-sutured kittens
grew up they adapted remarkably well to theirblindness. They learned to move about adroitly inthe large room where they were kept, and becameso familiar with the objects in the room that acasual observer would hardly have guessed theycould not see. Vision was tested in one kitten at 3'/zmonths by observing its behavior after separating
Fig. 3. A: distribution of 32 cells according to eye preference, in a tytten (no. 3) raised for the first 3 months withboth eyes sutured closed. One penetration was made in each hemisphere. B: ocular-dominance distribution of 126cells recorded from the 4 binocularly deprived kittens (no. 3—6), in 10 penetrations.

412 PART IV DEPRIVATION AND DEVELOPMENT
Fig. 4. Reconstruction of a penetration through the right postlateral gyrus in a fatten deprived by bilateral lidsuture for the first 3 months. To the right is a tracing of a coronal section passing through the electrode tracfy anelectrolytic lesion, made at the end of the penetration, is indicated by a circle. This track^ is expanded to the leftof the figure. As in Fig. 1, cells are indicated by short horizontal lines placed in the appropriate vertical rowsaccording to ocular-dominance group, and to the right of group 7 is a separate row for unresponsive cells. The
total number of cells in each group is indicated by the histogram at the bottom. To the right of the reconstruc-
tion receptive-field orientations are indicated by the inclination of the lines inside circles; a circle without a lineindicates absence of any clear receptive-field orientation (kitten no. 4).
the lids of one eye under a general anesthetic. Thecornea and media appeared normal, the pupillaryreflex was brisk, and there was no nystagmus. Tac-tile placing reactions were present, but there wasno visual placing. As the kitten moved about theroom there were no indications that visual cueswere used; placed in an unfamiliar room, it fre-
quently bumped into large obstacles in its path. Weconcluded from these crude behavioral observa-tions that for practical purposes the animal wasblind. The result is in agreement with behavioralstudies on animals raised in darkness (6), and issimilar to that obtained for the deprived eye in kit-tens raised with one eye covered (8).

Fig. 5. A: corona! section through the right lateral geniculate body ofu kitten (no. 3) in which both eyes wereclosed for the first 3 months of life. Celloidin, cresyl violet. Same animal as in Fig. iA. B: coronal section throughright lateral geniculate body of a normal ^-month-old kitten, for comparison with A.
413

414 PART IV DEPRIVATION AND DEVELOPMENT
DISCUSSION
The experiments with binocular eye closure con-firm the monocular results in showing that com-plete form deprivation with virtually completeexclusion oflight can lead to marked morphologi-cal changes in the geniculate, and marked func-tional changes in the cortex. The surprising thingwas not the extent of the physiological changes, buton the contrary the fact that they were not moresevere. Penetration after penetration with little orno driving of cortical cells from the deprived eye inmonocular closures had led us to expect little or nodriving from either eye in the binocular experi-ments. In all nine penetrations it was as if theexpected ill effects from closing one eye had beenaverted by closing the other. Taken together, thetwo sets of experiments seem to suggest that earlyin life the functional integrity of the pathway maydepend not only on the amount of afferent impulseactivity, but also on the interrelationships betweenthe various sets of afferents. This suggestionreceives support from the results of the next paper(5), which describes the cortical effects of interfer-ence with normal binocular interaction.
The mechanism of this apparent interactionbetween the two converging pathways is at presentquite obscure. The site of the interaction is pre-sumably the cortex, since the evidence so far avail-able indicates that few cells in the geniculatereceive input from the two eyes. Within the cortexthe most important site for anatomical conver-gence of the two paths is probably the simple cells,for these seem to be the first cells in the path thatcan be driven by both eyes. The similarity of simpleand complex cells in their ocular-dominance distri-bution suggests that no further binocular conver-gence takes place at the complex cell (3). Noattempt was made in these experiments to distin-guish simple and complex cells; to sample as manycells as possible we confined our efforts to mappingfield position, size and orientation, and oculardominance. If simple cells are the site of the inter-acting deprivation effects, it may be possible tolearn more about underlying mechanisms bystudying these cells separately.
Regardless of where the interaction takesplace, it is almost as though the afferent paths werecompeting for control over the cell, so that a reduc-tion in efficiency in one set of synapses permittedthe other set to take over at the first set's expense.
This could simply be a matter of competition forspace on the postsynaptic membrane, somesynapses shrinking, others expanding to fill thespace, and, as it were, pushing the first ones aside.If anything like that did occur one would expectthat with monocular closure the effectiveness ofthe open eye would, on the whole, be enhanced.Unfortunately, it is difficult to establish such animprovement experimentally because of the greatvariation in briskness of responses from one cell tothe next. A possible way of settling this and otherquestions would be to look in kittens for changes inresponses of simple cortical cells over periods ofmany hours or a few days.
Our previous finding that visual experience isnot necessary for the formation of specific connec-tions at the striate level (4) is confirmed by the factthat in the bilaterally lid-sutured animals manycells were driven normally. We have no hint as towhy some cells remained apparently normal whileothers became unresponsive and still others devel-oped pathological responses. The presence of ahigh proportion of responsive cells in these experi-ments is consistent with Baxter's observation (1) ofnormal evoked responses in dark-reared cats.
It remains to comment on the relationbetween the physiological findings in these experi-ments and the behavioral defects. Monocular dep-rivation led to a marked decline in responsivenessof cortical cells to stimulation of the deprived eye,which agreed well with the marked blindness inthat eye. Binocular deprivation produced a bilat-eral blindness even though there were plenty ofresponsive cells in the cortex, many of them appar-ently normal. The visual defects found in the twoexperiments may thus have different origins. Theabnormalities in area 17 could by themselvesaccount for the loss of vision following monocularocclusion. With binocular occlusion one may haveto look for impairment at levels central to area 17to explain the blindness we observed, and also thatwhich follows dark rearing (6).
SUMMARY
If a kitten is raised from birth with one eye suturedclosed, recordings from the visual cortex at 3months show that very few cells can be driven fromthe deprived eye (8). As part of the present studythese results were confirmed and extended in twokittens monocularly deprived for 8—10 weeks. In

Second Group of Deprivation Papers 415
the 5 monocularly deprived kittens studied to date,13 of 199 cells could be driven from the previouslyclosed eye; all of these except 1 had abnormalreceptive fields. Cells that responded to stimulationof the deprived eye tended to be aggregated intosmall regions of the cortex, so that over most pene-trations no responses were seen from the deprivedeye. From these results it was predicted that if ani-mals were binocularly deprived for similar periodsmost of the striate cortex would be unresponsive tostimulation of either eye. To test this, the lids ofboth eyes were sutured together in 5 kittens shortlyafter the time of normal eye opening, and the ani-mals raised in normal surroundings to an age of2!/z—41/2 months. Responses in single cells of the stri-ate cortex were observed in 4 animals. Contrary towhat had been expected, responsive cells werefound throughout the greater part of all penetra-tions, and over half of these cells seemed perfectlynormal. The cortex was nevertheless not normal inthat many cells responded abnormally, and manywere completely unresponsive. In the fifth kittenan eye was opened and vision tested. The pupillaryresponse was normal but the animal from itsbehavior appeared to be blind.
Histologically the lateral geniculate bodyshowed changes similar to those found after mono-cular deprivation, but they occurred throughout alllayers bilaterally: the Nissl-stained cells appearedpale, cross-sectional areas of cell bodies were re-duced by about 40%, and the pale substance be-tween cell nests was greatly reduced in volume.There were no obvious changes in retinas or cortex.
It thus appears that at the cortical level theresults of closing one eye depend upon whether theother eye is also closed. The damage produced bymonocular closure may therefore not be causedsimply by disuse, but may instead depend to a largeextent on interaction of the two pathways.
ACKNOWLEDGMENT
We express our thanks to Jane Chen, Janet Tobie, and JohnTuckerman, for their technical assistance.
References
1. Baxter, B. L. An Electrophysiological Study of the Effects ofSensory Deprivation (doctoral dissertation; unpublished).University of Chicago, 1959.
2. Hubel, D. H. Single unit activity in striate cortex of unre-strained cats./. Physiol., 1959,147: 226-238.
3. Hubel, D. H. and Wiesel, T. N. Receptive fields, binocularinteraction and functional architecture in the cat's visual cor-tex./. Physiol., 1962,160: 106-154.
4. Hubel, D. H. and Wiesel, T. N. Receptive fields of cells instriate cortex of very young, visually inexperienced kittens./.Neurophysiol., 1963,26: 994-1002.
5. Hubel, D. H. and Wiesel, T. N. Binocular interaction in stri-ate cortex of kittens reared with artificial squint. /. Neuro-physiol., 1965,25:1041-1059.
6. Riesen, A. H. Stimulation as a requirement for growth andfunction in behavioral development. In: Functions of VariedExperience, edited by D. W. Fiske and S. R. Maddi. Home-wood, 111., Dorsey Press, 1961, pp. 57-105.
7. Wiesel, T. N. and Hubel, D. H. Effects of visual deprivationon morphology and physiology of cells in the cat's lateralgeniculate body./. Neurophysiol., 1963, 26: 978-993.
8. Wiesel, T. N. and Hubel, D. H. Single-cell responses in stri-ate cortex of kittens deprived of vision in one eye. /. Neuro-physiol., 1963,26: 1003-1017.
9. Wiesel, T. N. and Hubel, D. H. Extent of recovery from theeffects of visual deprivation in kittens./. Neurophysiol., 1965,28: 1060-1072.

416 PART IV DEPRIVATION AND DEVELOPMENT
Binocular Interaction in Striate Cortex of Kittens Reared withArtificial Squint1
DAVID H. HUBEL AND TORSTEN N. WIESEL • Neurophysiology Laboratory, Department of Pharmacology,
Harvard Medical School, Boston, Massachusetts
INTRODUCTION
Before a kitten opens its eyes, and long before theeyes are used in visual exploration, single cells ofthe primary visual cortex respond to natural stim-ulation with the same specificity as is found in theadult (5). This suggests that the anatomical connec-tions between retina and striate cortex are for themost part innate. During the first 3 months of lifethe connections are highly susceptible to the effectsof visual deprivation, to the extent that exclusion ofall form and some light from one eye leads to asevere decline in the ability of that eye to influencecortical cells. Anatomical and physiological evi-dence suggests that the defect is chiefly, though notentirely, a cortical one (7—9).
The object of the present study was to influ-ence cortical connections by some means less dras-tic than covering one or both eyes. We wished ifpossible to alter the input in such a way that therewould be no question of effects on the visual path-way below the level of the striate cortex. A methodwas suggested by the well-known clinical observa-tion that a child with a squint (strabismus or non-parallel visual axes) may suffer a deterioration ofvision in one eye (amblyopia ex anopsia). Since thevisual pathways from the two eyes are for practicalpurposes separate up to the level of the striate cor-tex, it is unlikely that in these children the defect isin the retina or geniculate. An artificial squinttherefore seemed to provide a possible means ofobtaining a cortical defect while sparing the retinaand lateral geniculate body. Accordingly, we pro-duced a divergent strabismus by cutting one of theextraocular muscles in each of four newborn kit-tens, with the plan of testing vision and recording
from single cortical cells after several months to ayear.
When at length each eye was tested in thesekittens by observing the animal's behavior with theother eye covered the results were disappointing:there was not the slightest suggestion of any defectin vision in either eye. This was not entirely unex-pected, since with both eyes uncovered the animalshad appeared to fix at times with one eye and attimes with the other. At this stage there seemed tobe little point in proceeding further, for there wasno reason to doubt that the cortical recordingswould be entirely normal—especially since we hadnot yet studied the kittens with binocular lid clo-sure, and had no idea of the extent of interdepen-dence of the two eyes in sustaining normal function(9). Nevertheless, we decided to record from thekittens before abandoning the project. The resultsfrom all four animals were to our surprise quiteabnormal; they are presented in the first part of thispaper, together with a related set of experiments onalternating monocular occlusion. An incidentalfinding in the course of these experimentsprompted us to re-examine the problem of distri-bution of cortical cells by ocular dominance in thenormal animal.
METHODS
Four kittens were operated upon at 8-10 days after birth,just at the time the eyes were beginning to open. Perior-bital tissues on the right were infiltrated with a localanesthetic (Xylocaine, 2%), which was sufficient to pro-duce general anesthesia for 10-15 min. (7). The righteyeball was retracted laterally and the conjunctiva cut atits medial scleral attachment. The medial rectus muscle
From/. Neurophysiol. 1965, 28: 1041-1059.
Received for publication December 23, 1964.
'This work was supported in part by Public Health Service Grants NB-02260-05 and NB-05554-01, and in part by U.S. Air ForceContracts AF-AFOSR-410-63A and AF-49(638)1443.

Second Group of Deprivation Papers 417
was caught with a blunt hook and cut. An asymmetry inthe position of the two eyeballs was usually immediatelyobvious, and after recovery from anesthesia all four kit-tens had a marked divergent squint, with the sclera visi-ble medial to the limbus. Except for some limitation inturning the eye inward there was no obvious reductionin movements of the right eye, which were as free andactive as those of the normal one.
We recorded from three of the animals, no. 1, no. 3,and no, 4, at 3 months of age, and no. 2 was studied at 1year. Two kittens (no. 5 and no. 6) were brought up fromthe time of normal eye opening with an opaque contactoccluder covering one eye one day and the other eye thenext. These animals were studied at 10 weeks. Two nor-mal adult cats were recorded from as controls for thestudies of distribution of cells by ocular dominance.Methods of stimulating and recording are described inother papers (1-4).
RESULTS
Strabismus
CORTICAL PENETRATIONS. Seven penetrations weremade in four kittens. The first kitten (no. 1) wasstudied at 3 months of age. When it was anes-thetized and paralyzed in the usual way the eyesdiverged by 21°, as measured by the projected areacentralis, instead of the normal 2—3°. We concludedthat with the animal awake the eyes must havediverged by about 18°. In the remaining three ani-mals the squints estimated in this way amounted to29°, 12°, and 23°.
To begin with, the cortical activity seemedperfectly normal. The penetration were unusuallyrich, spikes from a new unit growing up to replacethose of a declining one each time the electrode wasadvanced. The unitary discharges were seenagainst a background of almost continuous unre-solved activity. Each cell was briskly responsive toone or the other eye and had the normal preferencefor a slit, edge, or dark bar in a particular orienta-tion, which varied from one column to the next.
As more and more cells were studied itbecame obvious that the amount of binocular inter-action was far less than normal. Most cells weredriven by one eye only, some by the ipsilateral, oth-ers by the contralateral. Even more startling wasthe finding that there were regions of completecontralateral or ipsilateral dominance in which oneeye drove cell after cell as well as the unresolved
background activity, with no trace of a response tostimulation of the other eye. As the electrode wasadvanced a region dominated by one eye wouldgive way to a region dominated by the other. Mixedregions were also seen, containing cells drivenfrom one eye and cells driven from the other, inter-spersed with an occasional cell driven from botheyes.
One of the two penetrations made in cat 2 isreconstructed in Fig. 1. To the left of the figure thelong vertical lines separate the 7 ocular-dominancegroups. The 61 cells are represented as short hori-zontal lines placed in the appropriate spaces atpoints corresponding to the electrode depths asinterpolated from the two lesions, L and L . Inthis penetration, except for cells 7-9 and cell 13, allof the first 33 cells were completely dominated bythe contralateral eye. The electrode then entered aregion of strong, almost exclusive ipsilateral domi-nance which extended to cell 46. After a brief tran-sitional phase (cells 47—50), the electrode entered athird region, from 51 to the end, which showedcomplete contralateral domination.
Similar results were seen in the other six pen-etrations. In these, however, the regions of mixeddominance were more prominent. Figure 2 showsreconstructions of two penetrations made in cat 3,at an age of 3 months. In the penetrations made inthe left hemisphere (Fig. 2A) an area of mixeddominance occurred between cells 22 and 28, andanother brief episode between cells 40 and 42. Thepenetration in the left hemisphere (Fig. 2B)showed even more extensive mixed zones. After aninitial region of ipsilateral domination (cells 50—59)the first mixed region extended from 60 to about91. There was then another ipsilaterally dominantarea from about 91 to 106, followed by a secondmixed area. In the first mixed zone there were sev-eral examples of dual-unit recordings (indicated bydots) in which one cell was group 1 and the othergroup 7. Cell 64 in group 1 was recorded with 65and 66, both in group 7. In the single penetrationmade in cat 4 at 3 months (Fig. 3) the middlegroups (no. 3—5) were especially poorly repre-sented. Here the mixed areas consisted almostentirely of cells of group 1 intermixed with cells ofgroup 7 (cells 49-67; cells 90-95). It thus appearsthat in these kittens the cortex is subdivided intoregions of three types, one containing contralater-ally dominated cells, the second containing ipsilat-

Fig. 1. Reconstruction of a penetration through right hemisphere of a 12-month-old cat with divergent strabis-mus from birth (cat 2). To the right is shown a coronal section through the right postlateral gyrus. The electrodetracl^ is shown passing through two electrolytic lesions, L' and L", indicated approximately to scale by circles.To the left of the figure the trac\ is reconstructed, each cell being indicated by a short horizontal line placed inits appropriate ocular-dominance group. Two lines close together, or dots between pairs of lines, indicate two-unit recordings. Total numbers are shown for each group in the histogram below. Lines to the right within thecircles indicate by their tilt the receptive-field orientations of the cells within the brackets. Note the strong ten-dency for cells of a particular ocular-dominance group to occur in sequence.
418

Fig. 2 A. Reconstruction of penetration through right hemisphere of cat 3, a 3-month-old animal with divergentstrabismus from birth. To right of figure is a photomicrograph of a Nissl-stained coronal section through the post-lateral gyrus.
419

420 PART IV DEPRIVATION AND DEVELOPMENT
Fig, 2E. Reconstruction of penetration through left hemisphere of cat 3. Conventions as in Fig. 1.
erally dominated cells, and the third containingcells of both types as well as a few binocularlydriven cells. As shown in a later section of thispaper, the three types of region represent an exag-geration of regional variations in ocular dominancethat occur in normal animals.
OCULAR-DOMINANCE DISTRIBUTION. The ocular-dommance distributions of cortical cells recordedin four of the penetrations in animals with strabis-mus are given in Figs. 1-3 below each track recon-struction. In all these penetrations the distributionswere abnormal, with the extreme groups (no. 1 and
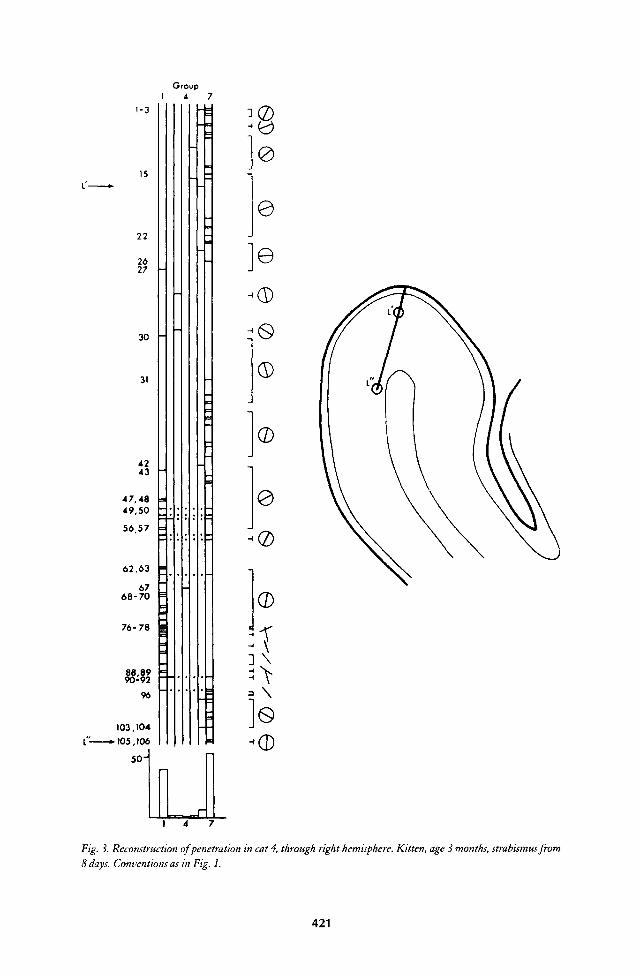
Fig. 3. Reconstruction of penetration in cat 4, through right hemisphere. Kitten, age 3 months, strabismus from8 days. Conventions as in Fig. 1.
421
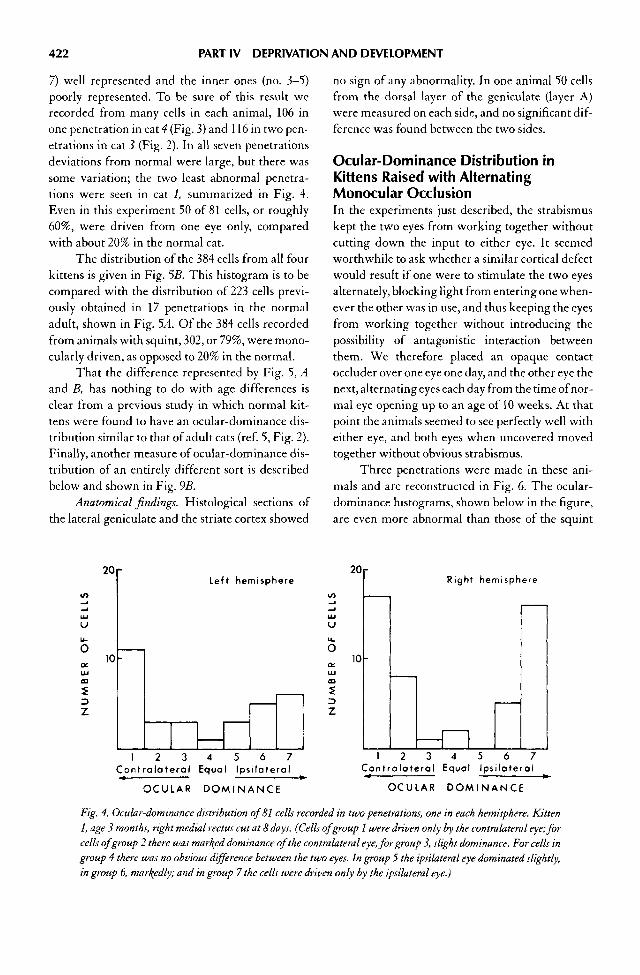
422 PART IV DEPRIVATION AND DEVELOPMENT
7) well represented and the inner ones (no. 3—5)poorly represented. To be sure of this result werecorded from many cells in each animal, 106 inone penetration in cat 4 (Fig. 3) and 116 in two pen-etrations in cat 3 (Fig. 2). In all seven penetrationsdeviations from normal were large, but there wassome variation; the two least abnormal penetra-tions were seen in cat 1, summarized in Fig. 4.Even in this experiment 50 of 81 cells, or roughly60%, were driven from one eye only, comparedwith about 20% in the normal cat.
The distribution of the 384 cells from all fourkittens is given in Fig. 5B. This histogram is to becompared with the distribution of 223 cells previ-ously obtained in 17 penetrations in the normaladult, shown in Fig. 5A. Of the 384 cells recordedfrom animals with squint, 302, or 79%, were mono-cularly driven, as opposed to 20% in the normal.
That the difference represented by Fig. 5, Aand B, has nothing to do with age differences isclear from a previous study in which normal kit-tens were found to have an ocular-dominance dis-tribution similar to that of adult cats (ref. 5, Fig. 2).Finally, another measure of ocular-dominance dis-tribution of an entirely different sort is describedbelow and shown in Fig. 9B.
Anatomical findings. Histological sections ofthe lateral geniculate and the striate cortex showed
no sign of any abnormality. In one animal 50 cellsfrom the dorsal layer of the geniculate (layer A)were measured on each side, and no significant dif-ference was found between the two sides.
Ocular-Dominance Distribution inKittens Raised with AlternatingMonocular OcclusionIn the experiments just described, the strabismuskept the two eyes from working together withoutcutting down the input to either eye. It seemedworthwhile to ask whether a similar cortical defectwould result if one were to stimulate the two eyesalternately, blocking light from entering one when-ever the other was in use, and thus keeping the eyesfrom working together without introducing thepossibility of antagonistic interaction betweenthem. We therefore placed an opaque contactoccluder over one eye one day, and the other eye thenext, alternating eyes each day from the time of nor-mal eye opening up to an age of 10 weeks. At thatpoint the animals seemed to see perfectly well witheither eye, and both eyes when uncovered movedtogether without obvious strabismus.
Three penetrations were made in these ani-mals and are reconstructed in Fig. 6. The ocular-dominance histograms, shown below in the figure,are even more abnormal than those of the squint
Fig. 4. Ocular-dominance distribution of 81 cells recorded in two penetrations, one in each hemisphere. Kitten1, age 3 months, right medial rectus cut at 8 days. (Cells of group 1 were driven only by the contralateral eye; forcells of group 2 there was marked dominance of the contralateral eye, for group 3, slight dominance. For cells ingroup 4 there was no obvious difference between the two eyes. In group 5 the ipsilateral eye dominated slightly,in group 6, markedly; and in group 7 the cells were driven only by the ipsilateral eye.)
Left hemisphere Right hemisphere

Second Group of Deprivation Papers 423
Fig. 5. A: ocular dominance of 223 cells recorded from a series of normal adult cats (3). B: ocular dominance of384 cells recorded from all four strabismus experiments.
animals, with 176 of 194 cells (91%) driven by oneeye only. The track reconstructions again showstrong evidence for spatial aggregation of cellsaccording to ocular dominance. We conclude thatthe results of the strabismus experiments do notdepend on the fact that the two eyes were bothopen at the same time.
Spatial Distribution of Cells Accordingto Ocular Dominance in Normal CatsWe were naturally interested in whether the divi-sion of striate cortex into areas according to oculardominance was an abnormal state produced bysquint, or alternating occlusion, or whether it alsoexisted in the normal animal and was merely mademore obvious by the exaggerated ocular domi-nance of the cells. Our previous studies of normalstriate cortex had suggested that there was sometendency to aggregation of cells according to oculardominance (ref. 3, p. 140 and Text-fig. 13). To helpsettle this problem we made four penetrations intwo normal adult cats and reconstructed the resultsin Figs. 7 and 8. Here there indeed seemed to be a
subdivision of cortex according to eye dominance.In penetration 1 of Fig. 7, the first 13 cells favoredthe ipsilateral eye; this was followed by a small areaof mixed dominance (cells 14—17), and then thecontralateral eye prevailed to the end (cell 25). Inpenetration 2, the first few cells favored the ipsilat-eral eye and from then on there was a mixture. InFig. 8, the penetration in the right hemisphere wasfirst predominantly ipsilateral in emphasis, and atthe end contralateral (cells 24—26), cells 3 and 4 giv-ing the only hint of intermixing in the early part.Penetration 2, made in the left hemisphere, waslargely mixed.
This tendency for cortical cells in the normalcat to be segregated according to ocular dominancecomplicates the assessment of cortex as normal orabnormal in animals with strabismus. But whilethe ocular-dominance distributions for the individ-ual penetrations in the squint and alternatingmonocular occlusions vary to some extent (Figs.1-4; Fig. 6), the marked preponderance of cells inthe two end groups (no. 1 and 7) is common to allof them. For the normal cat, on the other hand, an
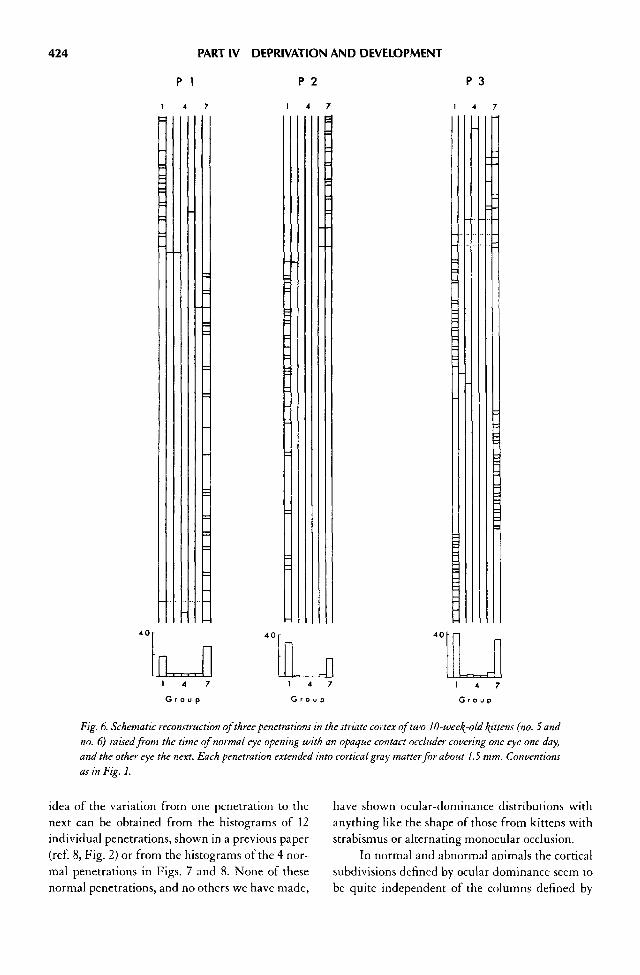
424 PART IV DEPRIVATION AND DEVELOPMENT
Fig. 6. Schematic reconstruction of three penetrations in the striate cortex of two 10-weet^-old kittens (no. 5 andno. 6) raised from the time of normal eye opening with an opaque contact occluder covering one eye one day,and the other eye the next. Each penetration extended into cortical gray matter for about 1.5 mm. Conventionsas in Fig. 1.
idea of the variation from one penetration to thenext can be obtained from the histograms of 12individual penetrations, shown in a previous paper(ref. 8, Fig. 2) or from the histograms of the 4 nor-mal penetrations in Figs. 7 and 8. None of thesenormal penetrations, and no others we have made,
have shown ocular-dominance distributions withanything like the shape of those from kittens withstrabismus or alternating monocular occlusion.
In normal and abnormal animals the corticalsubdivisions defined by ocular dominance seem tobe quite independent of the columns defined by

Fig. 7. Two penetrations in the right stnate cortex (postlateral gyrus) of a normal adult cat. Conventions as inFig. 1.
425

Fig. 8. One penetration in each hemisphere through striate cortex (post-lateral gyrus) of a normal adult cat. Con-ventions as in Fig. 1.
426

Second Group of Deprivation Papers 427
receptive-field orientation. Within an orientationcolumn there may be more than one region definedby ocular dominance (Fig. 1, cells 33—40 and cells50-58; Fig. 2A, cells 27-25; Fig. 2B, cells 77-99)and, conversely, an ocular-dominance region maycontain a large number of receptive-field orienta-tion columns (see especially Figs. 1 and 3).
To study the interrelationship of the twokinds of aggregations we reexamined a series ofexperiments made originally for the purpose ofmapping receptive-field orientation columns (4).Each experiment consisted of a number of superfi-cial cortical penetrations. A typical map is redrawnin Fig. 9A (ref. 4, Text-fig. 3). The columnarregions of constant receptive-field orientation areroughly outlined as before by interrupted lines.Superimposed upon and cutting across these lines,the continuously drawn contours outline areas ofmarked ipsilateral eye dominance. Presumably, inan extensive enough mapping one might also out-
line regions of contralateral and mixed dominance,but in this experiment there were too few pointsand they were too far apart for comfort. The mapdoes, however, reinforce the impression that thesystem of parcellation by ocular dominance is inde-pendent of, and cuts across, that of the orientationcolumns so that the same surface of cortex is simul-taneously subdivided in two different ways.
The ocular-dominance distribution of cells innormal cat cortex has been estimated from a rela-tively small number of deep penetrations (3, 5, and8). To obtain an entirely different measure of thisdistribution we tabulated the ocular dominance ofthe first units recorded, in all 167 superficial pene-trations made in the mapping experiments (4). Theresulting histogram, given in Fig. 9B, agrees rea-sonably well with those obtained from deep corti-cal penetrations (Fig. 5A; and ref. 5, Fig. 2).
We are still not absolutely clear about theshape and size of the regions of one-eye or mixed
Fig. 9. A: normal adult cat. Map showing receptive-field orientations and ocular dominance of first cells encoun -tered near the surface, in 31 penetrations. The entire map covers a region of the right striate cortex measuringabout 1x3 mm. Interrupted lines separate regions of relatively constant receptive-field orientation, partly out-lining 3 columns. The numbers refer to ocular-dominance groups. Continuous lines separate areas of strong ipsi-lateral dominance from areas of mixed or contralateral dominance (redrawn from ref. 4, text-Fig. 3 and PlateI). B: ocular-dominance distribution of the first units recorded in 167'superficial penetrations made in five nor-mal adult cats.

428 PART IV DEPRIVATION AND DEVELOPMENT
eye dominance. Penetrations like that of Fig. 1,together with the surface-mapping experimentsdescribed above, suggest that the regions may belarge, extending along the cortex for some mil-limeters. Deep microelectrode penetrations (ref. 3,Text-fig. 13) indicate that they can, at least some-times, extend from surface to white matter. Thus itseems likely that the regions are columnar, thoughevidence that the walls separating them are per-pendicular to the cortical layers is still lacking.
The spatial segregation of cells by oculardominance may have a relatively simple anatomi-cal explanation. Geniculate axons as they enter thecortex may be grouped into small bundles, all ofthe fibers in a given bundle coming from the samegeniculate layer and consequently all connectedwith the same eye. These fiber groups, entering thecortex and fanning out, could establish certainregions in which one or the other eye stronglydominated, and other regions of mixed dominancein which groups of the two types intermingled.The ocular dominance of a given cell in the cortexwould then be determined by the relative regionalconcentration of the two types of axon.
DISCUSSION
The results presented here show that it is possibleto produce abnormalities in neural functioning byalterations in sensory input that are relatively sub-tle, compared with light or form deprivation orcutting an afferent nerve. The neural abnormalitywas a severe decline in the number of cells thatcould be driven by both eyes in area 17 of the cor-tex. In the case of strabismus the sensory impair-ment was simply a misalignment of the two eyes;on the average, both retinas must have received thesame sensory input. Thus it seems fairly certainthat the squint produced no impairment of trafficalong the two paths emanating from the separateeyes, up to the point of their convergence in thecortex. The changes in cortical function musttherefore have been produced by the abnormalrelationship between signals in the two paths. Thenature of this faulty relationship can best be seen byconsidering what is known about binocular con-vergence at the cortical cell.
In the normal cat, the two receptive fields of asingle cortical cell are similar in arrangement andoccupy corresponding retinal positions in the two
eyes. If the eyes fix normally on a flat object, thetwo retinal images, falling on corresponding partsof the retinas, will affect the cell in the same quali-tative way by either eye, exciting it through both orinhibiting it through both. The amount of influ-ence, excitatory or inhibitory, may differ for thetwo eyes, and when it does the direction and degreeof the difference decides which ocular-dominancegroup the cell occupies in our rough and arbitraryscheme of classification. There is indirect evidence(3; and ref. 9, DISCUSSION) to suggest that impulsesoriginating from the two eyes converge mainlyupon simple cells in the cortex. If that is so, anychanges in ocular dominance in a complex cellwould merely reflect, in a passive way, interactioneffects at the simple cell.
Now suppose that the retinas are exposed toan ordinary, real-life visual stimulus, and considerthe response of a cell in group 2. In the normal ani-mal the images fall on corresponding parts of theretinas (neglecting parallax) and the response willbe determined mainly by impulses coming in fromthe dominant (here, the contralateral) eye, thoughthere will be some help from the nondominant one.In the animal with strabismus this relationship iscompletely changed: the cell will tend to follow thecommands of the dominant eye, and whether theother eye helps, hinders, or has no effect at all willbe more or less a matter of chance, depending onthe make-up of the stimulus and the amount ofsquint. It must be this lack of synergy between thetwo afferent paths that somehow, over a period oftime, gives rise to the changes in over-all ocular-dominance distribution.
The new ocular-dominance distributioncould result from a simple dropping out of binocu-larly driven cells. This seems unlikely experimen-tally, because of the wealth of responsive cells andabsence of unresponsive cells, and because a drop-ping out of binocularly driven cells would leaveshort alternating sequences of group 1 and group 7cells, rather than the very long sequences actuallyobserved. A far more likely possibility is that thelack of synergy in the two paths causes the oculardominance of cells to change, with an over-allincrease in the number of group 1 and group 7 cellsat the expense of the others. This would happen ifthere were a decrease in the effectiveness of thenondominant eye. There might also be an absoluteincrease in the effectiveness of the dominant eye,

Second Group of Deprivation Papers 429
but that would be difficult to detect because of dif-ferences in the responsiveness from one cell to thenext. In any case, given the initial normal tendencyfor grouping of cells by ocular dominance, a shift inocular dominance, cells of groups 2 and 3 becom-ing group 1 and 5 and 6 becoming group 7, wouldexplain very well the long sequences of cells ofgroups 1 or 7.
One may ask whether in these experiments itis the mere absence of synchronous visual inputthat produces the result, or whether it is the pres-ence of asynchronous inputs. It seems reasonablyclear that absence of synchrony by itself is notenough, since binocular occlusion in the earlymonths of life did not give the marked loss ofbinocular driving found in strabismus. On theother hand, the alternating occlusion experimentsgave substantially the same result as the squintexperiments, showing that the result does notdepend on simultaneous nonsynchronous activa-tion of the two eyes. What does seem necessary toproduce the result is absence of synchrony, andactivation of at least one of the two afferent path-ways at any one time.
Regardless of detailed mechanisms, theresults of this paper are interpreted as suggestingthat, in some systems at least, the maintenance of asynapse depends not only on the amount of incom-ing impulse activity but also on a normal interrela-tionship between activity in the different afferents.That two sets of synapses on the same cell can beinterdependent is also suggested by a previousstudy comparing the effects of monocular andbinocular eye closure (8, 9). In attempting to imag-ine how an organism can be influenced by experi-ence—to account in synaptic terms for learning,imprinting, and other phenomena that demandneural plasticity—the possibilities would seem tobe greatly increased by adding, to the ordinary use-disuse concept, that of the interdependence of dif-ferent synapses on a single cell.
The plasticity demonstrated in the occlusionand strabismus experiments has two obvious limi-tations. First, it is probably confined to the earlymonths of life. This was clearly shown for theocclusion experiments, inasmuch as three monthsof deprivation produced no changes in an adult cat(7, 8) and even several months, deprivation startingat 2-3 months was less severe in its effects thandeprivation for a similar period from birth. Simi-
larly, the failure to obtain full recovery on openingthe eyes after 3 months' deprivation from birthmay be a matter of age rather than of ir reversibilityas such (10). The effects of cutting an eye muscle inolder cats have not been studied, but one wouldprobably find a similar age dependence, in view ofthe common clinical experience that strabismusacquired in the adult produces no permanenteffects on mechanisms for fusion of images or forstereoscopic depth perception. A second limitationconcerns the pathological nature of the changes. Inall of the experiments of this series, both depriva-tion and strabismus, normal, fully formed connec-tions were rendered abnormal by distorting thesensory input. The next step would be to look atmore central parts of the visual path for changes inconnections resulting from normal experience.The changes could involve the development ofentirely new connections, or simply a modifica-tion—a relative strengthening or weakening—ofinnately determined ones, as in the present experi-ments. Here also the influence of age on plasticitywould obviously be of interest.
In all of the experiments of this series therehas been a certain correspondence between the sen-sory deprivation employed and the nature of thedefect produced. Monocular form deprivationwith only minor light deprivation led to an unre-sponsiveness of cortical cells to stimulation of thedeprived eye, with very minor anatomical changesin the lateral geniculate body; whereas monoculardeprivation of both form and light gave similarcortical unresponsiveness plus marked morpho-logical changes in the lateral geniculate. This fitsvery well with the reactions of cells at the two lev-els to diffuse light—the virtual unresponsivenessof cortical cells and the brisk responses of mostgeniculate cells. With strabismus the result wassimilar: here the defect was precisely in the area ofbinocular interaction, with other cortical functionsapparently intact. All of this makes one wonderwhether more subtle types of deprivation—an ani-mal brought up in isolation or a bird kept fromhearing the call of another bird of the samespecies—may not likewise exert their ill effectsthrough the deterioration of complex central path-ways that either were not used or else were usedinappropriately.
Finally, the results of these studies may havesome bearing on the problem of strabismus in man.

430 PART IV DEPRIVATION AND DEVELOPMENT
It is recognized that a squint in a child must be cor-rected in the first few years of life if capability ofusing both eyes in binocular vision is to be retained.This correlates well with our finding that in cats amechanical misalignment of the two eyes early inlife produces a deterioration in cortical connec-tions. We have made no attempt at testing thereversibility of the damage by straightening theeyes surgically, but our failure to produce any sig-nificant recovery in the occlusion experiments (10)would make us pessimistic. Furthermore, giveneven a normal mechanical apparatus for aligningthe eyes, perfect binocular fixation presumablydepends also upon a normal set of neural connec-tions in the visual pathway, possibly the very con-nections concerned with binocular interaction thatare lost in these experiments. In that case even aperfect mechanical repair would not guarantee therealignment necessary to promote recovery ofbinocular vision.
SUMMARY
In four kittens the right medial rectus was severedat about the time of normal eye opening, producingan obvious divergent squint. The animals wereraised under normal conditions for periods of 3months to 1 year. When the two eyes were thentested separately no behavioral visual defects wereseen. Recordings from the striate cortex were nor-mal, except for a marked decrease in the propor-tion of binocularly driven cells: instead of about80%, only 20% could be influenced from the twoeyes. The cortex appeared normal microscopically.In a given penetration there was a marked ten-dency for cells driven from a particular eye to occurin long uninterrupted sequences. These resultssuggest that the strabismus caused cells to shift intheir ocular dominance, a given cell coming tofavor more and more the eye that dominated it atbirth, ultimately losing all connections with thenondominant eye. We conclude that a lack of syn-ergy in the input from the two eyes is sufficient tocause a profound disruption in the connections thatsubserve binocular interaction.
In two kittens an opaque contact occluder wasplaced over one eye one day and the other eye the
next, alternating eyes each day from shortly afterbirth to an age of 10 weeks. This kept the eyes fromworking together without introducing the possibil-ity of antagonistic interaction between them. Visionin either eye seemed normal. Penetrations in thestriate cortex gave results similar to those obtainedin squint animals; if anything, the shift in oculardominance was more extreme, 91% of cells beingdriven by only one eye. Again cells were spatiallyaggregated according to ocular dominance.
Recordings from normal adult cats indicatethat besides being grouped according to receptive-field orientation, cells in the striate cortex aregrouped by ocular dominance into regions of ipsi-lateral, contralateral, and mixed dominance. Theexaggeration of eye dominance of individual cells,in animals raised with squint or alternatingmonocular occlusion, produces an accentuation ofthese cortical subdivisions.
ACKNOWLEDGMENT
We express our thanks to Jane Chen, Janet Tobie, and JohnTuckerman, for their technical assistance.
References
1. Hubel, D. H. Single unit activity in striate cortex of unre-strained cats./. Physiol., 1959,147: 226-238.
2. Hubel, D. H. and Wiesel, T. N. Receptive fields of singleneurones in the cat's striate cortex. /. Physiol., 1959, 148:574-591.
3. Hubel, D. H. and Wiesel, T. N. Receptive fields, binocularinteraction and functional architecture in the cat's visualcortex./. Physiol., 1962,160: 106-154.
4. Hubel, D. H. and Wiesel, T. N. Shape and arrangement ofcolumns in cat's striate cortex./. Physiol., 1963,165:559—568.
5. Hubel, D. H. and Wiesel, T. N. Receptive fields of cells instriate cortex of very young, visually inexperienced kittens./. Neurophysiol., 1963,26: 994-1002.
6. Hubel, D. H. and Wiesel, T. N. Receptive fields and func-tional architecture in two nonstriate visual areas (18 and 19)of the cat./. Neurophysiol., 1965,28:229-289.
7. Wiesel, T. N. and Hubel, D. H. Effects of visual depriva-tion on morphology and physiology of cells in the cat's lat-eral geniculate body./. Neurophysiol., 1963,26: 978-993.
8. Wiesel, T. N. and Hubel, D. H. Single-cell responses in stri-ate cortex of kittens deprived of vision in one eye./. Neuro-physiol., 1963,26:1003-1017.
9. Wiesel, T. N. and Hubel, D. H. Comparison of the effectsof unilateral and bilateral eye closure on cortical unitresponses in kittens./. Neurophysiol., 1965, 28: 1029-1040.
10. Wiesel, T. N. and Hubel, D. H. Extent of recovery from theeffects of visual deprivation in kittens. /. Neurophysiol.,1965,25:1060-1072.

Second Group of Deprivation Papers 431
Extent of Recovery from the Effects of Visual Deprivationin Kittens1
TORSTEN N. WIESEL AND DAVID H. HUBEL • Neurophysiology Laboratory, Department of Pharmacology,
Harvard Medical School, Boston, Massachusetts
INTRODUCTION
In kittens, deprivation of form and light over sev-eral months can lead to marked abnormalities in thevisual pathway. These include behavioral blind-ness, morphological changes in the lateral genicu-late body, and disruption of innately determinedcortical connections (2, 6—8). This type of plasticityseems to be greatest in the early months of life andto decline rapidly with age; an adult cat deprived forsimilar periods showed no changes at all. We werenaturally interested in whether the deprivationeffects were permanent or whether they could bereversed by allowing normal stimuli to reach theretina again. Several kittens were therefore raisedwith the lids of one or both eyes sutured together for3 months, as in previous experiments (6), and thenthe closed eye was reopened and the animals wereallowed to live for another 3—14 months beforemaking observations.
METHODS
Seven kittens were used, and the various procedures ofdeprivation and subsequent studies are summarized inTable 1. In six animals the lids of one eye were closed forthe first 3 months of life. In the recovery period two ofthese kittens had the deprived eye opened. The otherfour had the deprived eye opened and the other (previ-ously open) eye was closed. The seventh animal had botheyes closed for 3 months; the right eye was then opened.Recovery periods varied from 3 to 18 months. The ani-mals were all kept together in a large, bright room,and were frequently played with by attendants andpassersby.
Anatomical and physiological methods are de-scribed in other papers (1, 6, 8). Behavioral studies con-sisted mainly of observing the animal's use of vision to
guide his activities. Tests of visual discrimination usingoperant-conditioning techniques are still being made onseveral animals; these will be reported elsewhere.
RESULTS
BehaviorThe first kitten of this series had the right eyesutured shut from the tenth day up to 3 months ofage. The lids were then separated under anesthesia.As with all the animals in this study the cornea wasmoist and clear; the fundus appeared normal, aswere the direct and consensual pupillary lightreflexes. At the outset the animal appeared to beblind in the deprived eye (7). The first signs of anyrecovery were noticed only after 2—3 weeks. Withthe good eye covered, the animal then seemed to bealerted by large objects moved in front of it, and attimes would appear to follow them. These follow-ing movements showed some slight improvementwith time, until after 3 months a large object wasoccasionally followed for several seconds. Eventhen, the animal did not always lock in on theobject, but tended to lose it and go looking aboutwildly. Visual placing never returned. When put onthe floor to roam freely, the animal would at timesavoid large obstacles, but at other times would col-lide with them. It seldom avoided small objects suchas chair legs. Placed on a chair, it would slide down,feeling its way with its forepaws. If the good eye wasuncovered, the kitten would promptly jump to thefloor.
This behavior was typical of all animals tested.Animal 2 (Table 1) was allowed to go for 18 monthsafter the deprived eye was opened, but it showed lit-tle if any recovery after the first 3 or 4 months.
From/. Neurophysiol. 28:1060-1072
Received for publication December 23, 1964.
'This work was supported in part by Research Grants NB 02260-06, NB-05554-01, NB-02253-06 from the National Institutes ofHealth, and in part by Research Grant AF-49-638-1443 from the U. S. Air Force.

432 PART IV DEPRIVATION AND DEVELOPMENT
Table 1. Summary of Procedures Performed on the Seven Experimental Animals
DEPRIVATION RECOVERY PROCEDURE
AnimalNo.
1234567
Right eye
ClosedClosedClosedClosedClosedClosedClosed
Left eye
OpenOpenOpenOpenOpenOpenClosed
Time,months
3333333
Right eye
OpenOpenOpenOpenOpenOpenOpen
Left eye
OpenOpenClosedClosedClosedClosedClosed
Time,months
31838
141814
Anatomy Physiology
X
X X
X
X X
X X
Behavior
X
X
X
X
X
X
X
To test the possibility that, with both eyesopen, the animals might in some way be "neglect-ing" the previously deprived eye, we sutured closedthe normal eye at the time of opening the deprivedone. This was done in four kittens (no. 3—6, Table1). Following the eye reversal these animals didjust as badly as the others, indicating that theycould not be forced to use the deprived eye. Thechange in behavior was dramatic, especially for cat6, which during the first 3 months had been theleader of about a dozen animals. This large, huskyanimal lost his prominent position in the group,became meek and cowardly, and even after 18months is still subdued and anxious. Finally, thesame kind of slow and inadequate recovery wasseen in one animal (no. 7) that was initiallydeprived by bilateral suture, following which oneeye was opened for over a year.
Single-Unit Recordings
RECOVERY AFTER MONOCULAR DEPRIVATION. Cor-tical recordings were made from 3 of the 7 animals.In kitten 3 (Table 1) the right eye had been closedfor the first 3 months, after which that eye wasopened and the left eye closed for another 3months. Two penetrations were made in striatecortex, one in each hemisphere, and 54 cells wererecorded. The great majority of cells (45 of 54)were still driven exclusively from the left eye. Only9 cells could be driven from the right eye; of these8 were abnormal, and 7 were still strongly domi-nated by the left eye. Two cells were exclusivelydriven by the right eye. The ocular-dominance dis-tribution, given in Fig. 1, was thus still highlyabnormal; indeed it was probably not significantly
different from that of animals monocularlydeprived for 3 months, as can be seen by comparingthis figure with Fig. 2 in the paper on binoculardeprivation (8). The 8 abnormal cells responded toa line stimulus regardless of its orientation; andshowed a strong tendency to fatigue. That it wasthe connections between these cells and the righteye that were abnormal, rather than the cells them-selves, is shown by the fact that the cells weredriven in a perfectly normal manner by the left eye,having a precise receptive-field orientation andshowing little tendency to fatigue. The 3 months'deprivation of the left eye immediately precedingthe recording apparently had little or no effect onthat eye's ability to drive cortical cells, despite themarked atrophy of the geniculate layers connectedto the left eye (see below). In contrast to this, a sim-ple closure of one eye following several months ofnormal vision produces a marked cortical defect(7). Taken together, these two results reinforce ourconclusions from the binocular closures and stra-bismus experiments (8, 3) in suggesting a stronginterdependence in the pathways originating fromthe two eyes.
Kitten 5 likewise had the right eye closed forthe first 3 months, after which the right eye wasopened and the left closed. It was then kept for overa year before recordings were made. The results ofobserving 72 cells in 2 penetrations are shown inFig. 2. Again, the effects of the original deprivationto the right eye appear to have been irreversible ornearly so.
One result common to these two experimentsis the absence of unresponsive cells. This contrastswith the usual monocular closure, in which some10% of cells were not driven by either eye.

Second Group of Deprivation Papers 433
Fig. 1. Ocular-dominance distribution of 54 cells recorded from a 6-month-old cat (no. 3) in which the right eyewas closed for the first 3 months of life, following which the right eye was opened and the left eye closed for thenext 3 months. (Definitions of the ocular-dominance groups are as follows: cells of group 1 are driven only bythe contralateral eye; for cells of group 2 there is marked dominance of the contralateral eye; for group 3, slightdominance. For cells in group 4 there is no obvious difference between the two eyes. In group 5 the ipsilateral
eye dominates slightly; in group 6, markedly, and in group 7 the cells are drive only by the ipsilateral eye.)
RECOVERY AFTER BINOCULAR DEPRIVATION. It willbe recalled that the cortical effects of deprivingboth eyes for the first 3 months of life are not at allwhat one would have predicted from the monocu-lar deprivations (8): instead of only a very fewresponsive cells, 73% of the cells could be driven,and 41% responded normally. These results aresummarized in the left-hand part of Table 2. Instudying the cortical effects of reopening an eyeone therefore begins with a totally different situa-tion from that following monocular closure.
Cat 7 was brought up with both eyes closedfor the first 3 months, at which time the right eyewas opened. The animal then went for over a yearwith the left eye closed. Ninety-nine cells werestudied in the two hemispheres, with the resultsshown in Fig. 3 and Table 2. The histograms showno striking predominance of the opened eye, indi-cating that, just as in the monocular closures, therewas little tendency for recovery. On the other hand,an examination of Table 2 suggests that openingthe eye did produce some changes. As in the other
recovery studies, unresponsive cells were dimin-ished, amounting to 10% of the cells instead of27%. At the same time, cells with abnormalresponses (lack of receptive-field orientation) wentfrom 32% to 60%. The abnormal responses camemainly from the right or opened eye, whichaccounted for twice as many abnormal fields as theleft (52 as opposed to 25). Normal cells were, if any-thing, slightly reduced, and fewer of these weredriven by the right eye (15%) than by the left (30%).
The asymmetry in the two eyes is furtherillustrated by the 31 cells that were driven fromboth eyes. Eight of these were driven normallyfrom the left eye and abnormally from the right,having in that eye fields that lacked any clear ori-entation. The reverse was not true for any of thecells. Moreover, in our study of binocularlydeprived animals without recovery there werenone of these asymmetric cells, normal for one eye,but abnormal for the other. Here again it is asthough the number of abnormal connections fromthe opened eye had greatly increased.
Left hemisphere Right hemisphere

434 PART IV DEPRIVATION AND DEVELOPMENT
Fig. 2. Ocular dominance of 72 cells recorded from a cat (no. 5) in which the right eye was closed for the first 3months of life, following which the right eye was opened and the left eye closed for the next 14 months.
In summary, it would seem that the recoveryprocess had re-established connections betweencortical cells and the opened eye, but that these con-nections were distorted ones. The fact that follow-ing recovery fewer cells were driven normallyfrom the opened (right) eye than from the closed
one is at first glance surprising. The "normal" cat-egory is, however, somewhat arbitrary and, in ani-mals before the recovery period, it might includecells that had lost some connections and thereforeresponded less briskly than normal but with fullspecificity. If during the recovery process the lost
Table 2. Comparison of Single-Cell Responses Following 3-Month Binocular Deprivation, with and without
Periods of Recovery
3-MONTH BINOCULAR
DEPRIVATION (8)
3-MONTH BINOCULAR DEPRIVATION
FOLLOWED BY 14 MONTHS RECOVERY OF
RIGHT EYE (CAT j)
Normal cellsAbnormally drivenUnresponsive
Total cells
Cells
574537
139
Percent
413227
100
Cells
2861*10
99
Percent
6010
100
* Includes cells that were driven abnormally by one eye and normally by the other, as well as cells driven abnormally by both eyes.
Right hemisphereLeft hemisphere

Second Group of Deprivation Papers 435
Fig. 3. Ocular-dominance distribution of 99 cells in a cat (no. 7) in which both eyes were closed for the first 3months of life, following which the right eye was opened for the next 14 months.
connections were re-established, but in distortedform, one would have an increase of abnormal cellsat the expense of the normal category. It does seemunlikely that opening an eye would cause abnor-mal connections to be established between that eyeand otherwise normal cells.
Finally, this animal showed a marked in-crease in the proportion of cells driven only by oneeye, cells of groups 1 and 7. The change resemblesthat seen in animals raised with squint or withalternating contact occluders (3), both conditions inwhich the synergic action of the two eyes is elimi-nated without the complication of complete disuse.Three months of binocular occlusion gave no com-parable defect (8), suggesting that in the presentexperiment the relative increase in groups 1 and 7must have taken place during the recovery period.Perhaps the process simply requires more timewhen the lack of synergy is produced by disuse, apoint that could easily be settled by binocular dep-rivation for longer periods.
Morphology of the LateralGeniculate BodyOf the 5 animals whose brains have been sectionedso far, 4 were studied by examining the Nissl-stained sections and by measuring cross-sectionalareas of 50 cells in each geniculate layer. The resultswere unanimous in failing to show the least evi-
dence for any recovery. They are summarized inTable 3. For comparison, figures are included froman animal whose right eye was closed for the first 3months. The average cell size of the dorsal pair oflayers (A and Aj) in the normal cat at 3 months orolder is about 300|I2. (As discussed previously (6),cell sizes vary to some extent from one animal tothe next, partly, no doubt, because of differences infixation. We have found no evidence that cellsincrease significantly in size beyond 3 months ofage. This seems to be confirmed by comparing inTable 3 the size of normal cells in the 3-month-oldcontrol cat with the normal cell size in the 6-month-old cat 1.)
The simplest assessment of recovery can bemade for cat 1, in which the right eye was closed forthe first 3 months and was open for the next 3, theleft having been open at all times. Coronal sectionsof the two geniculates are shown in Fig. 4. Thedegeneration of layers A on the left and At on theright is roughly the same as in animals with one eyeclosed for 3 months, and no recovery period (seeref. 6, Fig. 1). Cell sizes in corresponding layers onthe two sides still differ by some 30%.
The other three animals confirm this finding,and show that if growth of cells is retarded by eyesuture for the first 3 months, there is little or no sub-sequent recovery even if the eye is reopened for over1 year. This is particularly impressive in cat 7 in

436 PART IV DEPRIVATION AND DEVELOPMENT
Table 3. Effects of the Various Experimental Procedures on Size of Cells in the Two Dorsal Layers of the Lateral Geniculate Body
Description of Cat
Control: simple sutureR. eye closed 3 monthsL. eye open 3 months
Cat 1 : simple eye openingR. eye closed 3 months, open 3 monthsL. eye open throughout
Cat 3: eye reversalR. eye closed 3 months, open 3 monthsL. eye open 3 months, closed 3 months
Cat 5: eye reversalR. eye closed 3 months, open 14
monthsL. eye open 3 months, closed 14
months
Cat 7: binocularR. eye closed 3 months, open 14
monthsL. eye closed throughout
Layer L. Side, fj2 R. Side {J2
A
A,
A
A,
A
A,
A
A, 203 ±11 172 ± 10
A
AI 201 ± 7 202 ± 9
Dijf. BetweenSides, %
37 (t
38 (t
28 (t
30 (t
11 (t
25 (t
16 (t
15 (t
= 4.8)
= 5.6)
= 6.3)
= 5.7)
= 0.6)
= 1.2)
= 2.8)
= 2.1)
DEV. FROM ASSUMED
NORMAL OF 3OOJJ2, *%
Left
39
39
43
30
47
33
43
33
Right
34
34
36
47
36
43
38
33
* Assumed normal based on average of 10 cats ranging in age from 3 months to 1 !4years. According to our measurements any growth in cells after 3 monthsis negligible.
which both eyes were closed for 3 months and theright eye was then opened for 14 months. Herethere was no significant difference in correspon-ding geniculate layers on the two sides. A coronalsection through the right lateral geniculate is shownin Fig. 5, and actual cell sizes are given in Table 3.
Finally, the eye-reversal results (cats 3 and 5)confirm our previous impression that late eye clo-sure can produce an actual atrophy of cells (asopposed to the failure to grow produced by clo-sure). The shrinkage is not as pronounced as thatproduced by initial closure, as can be seen directlyin coronal sections of the geniculates of cat 5 (Fig.6), and also from the actual measurements of cellsize given in Table 3. A comparison of the atrophyin cats 3 and 5 indicates that the main atrophicchanges occur within the first 3 months of the lateclosure. Comparing cats 5 and 7 suggests that itmakes little difference to the abnormality pro-duced, whether an eye is closed for the first 3months or the first 17.
DISCUSSION
The absence of any great degree of recovery in thisstudy was surprising, since previous reports onbehavioral recovery following deprivation in man(5) and in animals (4) had led us to expect somereturn of function, slow and perhaps incomplete, tojudge from human experience, and prompt andvirtually complete, to judge from the animal exper-iments. It is difficult to reconcile these results. Thehuman material is particularly hard to assess, sinceone frequently does not know certain crucial factssuch as the age of onset of cataracts, the degree ofreduction of retinal illumination, and the finalextent of return of vision after cataract removal. Inbehavioral studies in animals a direct comparisonof results is not possible, since schedules of visualdeprivation and testing procedures have differedfrom those used in the present experiments. Theevaluation of visual abnormalities in animals is inany case difficult, there being no generally accepted

Fig. 4. Coronal sections of left (A) and right (B) lateral geniculate bodies of a 6-month-old fatten (no. 1) inwhich the right eye was closed for the first 3 months of life and open for the next 3, the left being open at all times.Celloidin, cresyl violet.
437

438 PART IV DEPRIVATION AND DEVELOPMENT
Fig. 5. Coronal sections through right lateral geniculate body of a cat (no. 7) in which both eyes were closed forthe first 3 months of life, and then the right eye was opened for the next 14 months. Note that cells in the middlelayer (A;), corresponding to the right eye, appear no different from those of the dorsal layer (A). Celloidin, cre-syl violet.
or well-evaluated procedures for testing vision innormal animals.
All three phases of the present study—thebehavioral, the physiological, and the morphologi-cal—agree in indicating only very minimal recov-ery from the effects of eye closure during the first 3months of life. In the cortex such connections asdid reform apparently did so in a distorted manner.There would seem to be two possible interpreta-tions. Either connections, once lost, are incapableof properly re-establishing themselves, or the fail-ure of recovery may simply be a matter of age—another manifestation of the decline in flexibilitythat occurs in the system some time between thethird month and the first year. Experimentally it isdifficult to know how to decide between theseinterpretations, since it probably requires a monthor two to produce the abnormalities, by which timethe period of flexibility may well be almost over.
SUMMARY
In kittens, monocular or binocular deprivation bylid suture for the first 3 months of life leads to vir-tual blindness, marked morphological changes inthe lateral geniculate body, and a severe deteriora-tion of innate cortical connections. In seven kittenswhose eyes had been sutured at birth for 3 months,six unilaterally and one bilaterally, an attempt wasmade to assess the extent of recovery by reopeningan eye and allowing the animals to live for another3-15 months. In two of the monocular closures thedeprived eye was opened and the normal eye closed.
In all kittens there was some slight behavioralrecovery during the first 3 months, but the animalsremained severely handicapped and never learnedto move freely using visual cues. There was no mor-phological improvement in the lateral geniculatebody. Our previous impression that atrophy can

B
Fig. 6. Coronal sections through left (A) and right (B) lateral geniculate bodies of a cat (no. 5) in which the righteye was closed for the first 3 months of life, following which the right eye was opened and the left eye closed forthe next 14 months. Note the small size of cells in the dorsal layer of the left geniculate and the middle layer ofthe right, corresponding to the originally closed right eye. Celloidin, cresyl violet.
439

440 PART IV DEPRIVATION AND DEVELOPMENT
develop with deprivation beginning at 3 monthswas confirmed. In monocularly deprived animals afew cells in the striate cortex may have recoveredresponses to stimulation to the originally deprivedeye, but in many of these cells the responses wereabnormal. In the binocularly deprived kitten therewas a marked increase in the proportion of cellsresponding abnormally to the eye that was re-opened, without any obvious increase in the totalnumber of cells responding to that eye.
We conclude that the animals' capacity torecover from the effects of early monocular orbinocular visual deprivation, whether measuredbehaviorally, morphologically, or in terms of single-cell cortical physiology, is severely limited, even forrecovery periods of over a year.
ACKNOWLEDGMENT
We express our thanks to Jane Chen, Janet Tobie, and JohnTuckerman for their technical assistance.
References
1. Hubel, D. H. and Wiesel, T. N. Receptive fields, binocularinteraction and functional architecture in the cat's visual cor-tex./. PhysioL, 1962,160:106-154.
2. Hubel, D. H. and Wiesel, T. N. Receptive fields of cells instriate cortex of very young, visually inexperienced kittens./.Neurophysiol., 1963,26: 994-1002.
3. Hubel, D. H. and Wiesel, T. N. Binocular interaction in stri-ate cortex of kittens reared with artificial squint. /. Neuro-physiol., 1965,25:1041-1059.
4. Riesen, A. H. Stimulation as requirement for growth andfunction in behavioral development. In: Functions of VariedExperience, edited by D. W. Fiske and S. R. Maddi. Home-wood, 111., Dorsey Press, 1961, pp. 57-105.
5. Von Senden, M. Raum-und Gestaltauffassung bet openertenBlindgeborenen vor und nach der Operation, edited by J. Barth.Leipzig, 1932, English translation under the title: Space andSight. Glencoe, 111., Free Press, 1960.
6. Wiesel, T. N. and Hubel, D. H. Effects of visual deprivationon morphology and physiology of cells in the cat's lateralgeniculate body./. Neurophysiol., 1963, 26: 978-993.
7. Wiesel, T. N. and Hubel, D. H. Single-cell responses in stri-ate cortex of kittens deprived of vision in one eye. /. Neuro-physiol., 1963,26:1003-1017.
8. Wiesel, T. N. and Hubel, D. H. Comparison of the effects ofunilateral and bilateral eye closure on cortical unit responsesin kittens./. Neurophysiol., 1965,25: 1029-1040.
The Period of Susceptibility to the Physiological Effects ofUnilateral Eye Closure in Kittens
D. H. HUBEL AND T. N. WIESEL • Department of Neurobiology, Harvard Medical School, Boston, Massachusetts
02775, U.S.A.
SUMMARY
1. Kittens were visually deprived by suturing thelids of the right eye for various periods of timeat different ages. Recordings were subsequentlymade from the striate cortex, and responsesfrom the two eyes compared. As previouslyreported, monocular eye closure during the firstfew months of life causes a sharp decline in thenumber of cells that can be influenced by thepreviously closed eye.
2. Susceptibility to the effects of eye closure beginssuddenly near the start of the fourth week,
From/. PhysioL (1970), 206,#?. 419-436
Received 11 August 1969.
remains high until some time between the sixthand eighth weeks, and then declines, disappear-ing finally around the end of the third month.Monocular closure for over a year in an adult catproduces no detectable effects.During the period of high susceptibility in thefourth and fifth weeks eye closure for as little as3—4 days leads to a sharp decline in the numberof cells that can be driven from both eyes, as wellas an over-all decline in the relative influence ofthe previously closed eye. A 6-day closure isenough to give a reduction in the number ofcells that can be driven by the closed eye to a
3

Second Group of Deprivation Papers 441
fraction of the normal. The physiological pic-ture is similar to that following a 3-monthmonocular deprivation from birth, in which theproportion of cells the eye can influence dropsfrom 85 to about 7%.
4. Cells of the lateral gemculate receiving inputfrom a deprived eye are noticeably smaller andpaler to Nissl stain following 3 or 6 days' depri-vation during the fourth week.
5. Following 3 months of monocular deprivation,opening the eye for up to 5 yr produces only avery limited recovery in the cortical physiology,and no obvious recovery of the geniculate atro-phy, even though behaviourally there is somereturn of vision in the deprived eye. Closing thenormal eye, though necessary for behaviouralrecovery, has no detectable effect on the corticalphysiology. The amount of possible recovery inthe striate cortex is probably no greater if theperiod of eye closure is limited to 7 weeks, butafter a 5-week closure there is a definite en-hancement of the recovery, even though it is farfrom complete.
INTRODUCTION
Neurophysiological studies of single cells indicatethat the highly specialized neurones in the catvisual cortex establish their proper connexionsthrough innate mechanisms (Hubel & Wiesel,1963). During the first months after birth theseconnexions are vulnerable, and can be disruptedthrough various procedures of visual deprivationsuch as closing the lids of one or both eyes, or sur-gically producing a strabismus (Wiesel & Hubel,1963£; Hubel & Wiesel, 1965). For example, afteran eye has been closed for the first 10—12 weeks oflife only a small fraction of recorded cortical cellscan be driven from that eye, while nearly all cellscan be driven from the normal eye. In the adult cat,in contrast, there is no such sensitivity to depriva-tion; the cortical cells retain their inborn ability torespond to stimulation of an eye that has beenclosed for 3 months.
The disruption of cortical connexions follow-ing early eye closure is not accompanied by anyanatomical changes that can be seen with stains forNissl substance or myelin. In contrast, cells in thelateral geniculate body are virtually normal in theirresponses but show marked morphological changes
(Wiesel & Hubel, \963a). Again, such abnormalitiesare not seen following a comparable period of clo-sure in the adult.
These experimental results show that theremust be a critical vulnerable period in the first10—12 weeks, after which the animal is immune todeprivation procedures. In the present paper we setout to examine the timing more precisely. Wewished to learn when the susceptibility was great-est, how long it lasted, the duration of deprivationnecessary to produce a severe deficit, and the rela-tion between timing of deprivation and ability to
METHODS
Experiments were done on twenty-one monocularlydeprived kittens and on two normal 4-week-old kittens.The deprived animals all had their right eyes closed bylid suture at various ages and for varying lengths of time.In some animals the right eyes were subsequentlyreopened to test recovery, and in some of these the lefteye was closed at the time the right eye was opened ('eyereversal').
At the time of recording the kittens were anaes-thetized with thiopentone and paralysed with intra-venous succinylcholine to prevent eye movements.Recordings were made from single cells with extracellu-lar tungsten micro-electrodes. Receptive fields weremapped by projecting white-light stimuli upon a wideflat white screen which the animal faced from a distanceof 1.5 m. A white background light was kept at mesopiclevels (-1 to +1 log,0cd/m2) and the intensity of the stim-ulating light was 1—1.5 log units brighter than the back-ground. As in previous studies (Wiesel & Hubel, 1963£)recordings were usually made in the hemisphere con-tralateral to the previously closed eye. In the normal catabout twice as many cells are dominated by the con-tralateral eye as by the ipsilateral, so that a shift in favourof the ipsilateral eye is all the more significant.
At the end of the experiments the animals were per-fused with normal saline followed by 10% formalin, thebrains were embedded in celloidin, sectioned at 25 |I andstained with cresyl violet. The histological material wasused for reconstruction of electrode tracks and for stud-ies of morphologic changes in the lateral geniculatebodies.
RESULTS
In the normal adult cats about four fifths of thecells in the striate cortex can be influenced fromboth eyes (Hubel & Wiesel, 1962). The relative
recover

442 PART IV DEPRIVATION AND DEVELOPMENT
influence of the two eyes on cortical cells variesfrom one cell to the next. Some cells receiveroughly equal inputs from the two eyes, while inothers one eye is strongly dominant or completelyso. Cells dominated by one eye show a tendency tobe grouped in columns (Hubel & Wiesel, 1965), sothat in any micro-electrode penetration perpendic-ular to the surface of the cortex most or all of theobserved cells prefer one eye, though over halfshow some response to the other.
These findings apply also to kittens with nopatterned visual experience, for example animalsexamined close to the time of birth (Hubel &Wiesel, 1963). We conclude from this that the con-nexions underlying the observed responses areinnate. In the present study many of the deprivedkittens were recorded from at an age of 4—6 weeks.We therefore began by recording from normal kit-tens at this age, to rule out the unlikely possibilitythat the ocular-dominance distribution might dif-fer from that of either newborn kittens or adult
cats. Figure IA shows the ocular-dominance distri-bution obtained in three micro-electrode penetra-tions in two normal kittens 3—4 weeks old. Thecomposite histogram for all three penetrations isshown in Fig. IB. As expected, the results are sim-ilar to those previously obtained in new-born kit-tens and in adult cats (Hubel & Wiesel, 1962,1963).
Monocular Closure from Birth, forPeriods of Varying LengthIn ten kittens from five litters the lids of the righteye were sutured together at about 10 days andrecordings were made at various times during thenext 2—3 months. For any given period of depriva-tion during the sensitive period there was somevariation in results from one kitten to the next,which was minimized by first comparing individ-uals within the same litter, and then comparing lit-ters. The earliest recordings, made at about onemonth of age, were already abnormal. Figure 2Ashows the results obtained from a kitten whose
Fig. 1. Upper three histograms: ocular-dominance distributions of cells from three penetrations in striate cortexof two normal kittens, 3—4 weeks old. Lower histogram: sum of above three histograms. (Definition of ocular-dominance groups: cells of group 1 were driven only by the contralateral eye; for cells of group 2 there wasmarked dominance of the contralateral eye; for group 3, slight dominance. For cells in group 4 there was no obvi-ous difference between the two eyes. In group 5 the ipsilateral eye dominated slightly; in group 6, markedly, andin group 7 the cells were driven only by the ipsilateral eye.)

Second Group of Deprivation Papers 443
Fig. 2. Ocular-dominance distribution of cells recorded in the left visual cortex of two t(ittens, litter-mates, in
which the right eye was closed (A) from the 10th to 31st day; (B)from the 10th to 37th day. LJ normal response;\ ] no orientation; K%% no response. Coiling as in Fig. 1.
right eye was closed from day 10 to day 31. Thethirty-eight cells recorded in two penetrations gavea lopsided histogram showing clear dominance ofthe normal eye. Moreover, the responses from theright eye were generally more sluggish and fa-tigued more easily than those from the left, whichseemed entirely normal.
Six days later, at 37 days, a litter-mate of thiskitten gave the results shown in Fig. 25. Now the
shift in favour of the left eye was virtually com-plete, with only two cells out of fifty-four driven bythe closed eye. Four cells were uninfluenced byeither eye, an abnormality commonly found inmonocularly deprived kittens (Wiesel & Hubel,1963£).
Results from a second litter, also with right eyeclosure from birth, are shown in Fig. 3. The firstkitten in this litter (Fig. 3A) was studied at 37 days
Fig. 3. Ocular-dominance histograms for cells in the left visual cortex in three kittens, litter-mates, deprived byright-eye closure during days (A) 10 to 37; (B) 10 to 41; (C) 10 to 75. Coding of responses as in Fig. 1.

444 PART IV DEPRIVATION AND DEVELOPMENT
of age. Here the shift was not as marked as that ofFig. 2B, even though the duration of closure was thesame. The histogram was nevertheless abnormal,with a shift in favour of the open eye and a droppingout of most binocularly driven cells. Four days later(41 days) a second member of the litter showeddecidedly more advanced changes (Fig. 3B), thoughagain some cells were still driven from the right eye.Many of these cells, however, responded sluggishlyto the right eye and failed to show the usual selec-tivity to oriented line stimuli, whereas the responsesseen from the left eye were normal. In a third ani-mal, taken from the same litter at 75 days, thechanges were still more pronounced (Fig. 3C). Noweven fewer cells could be driven from the right eye,and with one exception all cells responded weaklyfrom that eye, with none of the usual preference fora specific stimulus orientation. In this litter, then,the most dramatic changes seem to have occurredduring the sixth week of life, between the record-ings of Fig. 3/1 and B.
The results shown in Figs. 2B, 3>B and 3Cagree with our previous studies in 2—3 month de-prived kittens. They are at variance with the find-ings of Ganz, Fitch & Satterberg (1968), who, usingcomparable durations of deprivation, found aroughly equal number of cells activated from thedeprived and normal eyes. The reason for this dif-ference in results is not clear, but in any case thereis agreement that responses from the deprived eyeare grossly abnormal.
Figures 2 and 3 illustrate the variations thatcan occur from one litter to the next. The earliest
abnormalities were found in two litter-matesdeprived from days 10—30 and 10—32 (not illus-trated). In both of these kittens almost all the cellsobserved were driven by only the eye that had beenopen, giving a histogram similar to that of Fig. 2B.
The results from all five litters suggest thatthe changes begin by about the fifth week of life,and can become very marked in a matter of a fewdays.
Monocular Closure During theSensitive PeriodOur next step was to close an eye for only a fewdays in normal animals 3—5 weeks old, comparingvarious ages and durations of closure. The his-togram of Fig. 4/1 shows the results of a 3-day clo-sure in the 4th week (days 23—26). Even with sucha brief period of deprivation the results wereabnormal, comparable to those from an animaldeprived from birth to 37 days (Fig. 3/1). In thisanimal and in several others with eye closure frombirth (e.g. the animals of Fig. 3/1 and B), there wasnot only some shift in favour of the normal eye, butalso a marked decline in the number of binocularlydriven cells, especially those in which the two eyesmake almost equal contributions (groups 3 to 5). Atthis stage, before the normal eye has taken overcompletely, the ocular-dominance distribution thustends to resemble that of animals with strabismus(Hubel & Wiesel, 1965). It is as though connexionsfrom the open eye were in some way competingwith connexions from the closed eye, hasteningtheir disruption. By this line of reasoning, one
Fig. 4. Ocular-dominance histograms for cells in the left visual cortex in three tyttens deprived by right-eye clo-sure during days (A) 23 to 26; (B) 23 to 29; (C) 30 to 39. Kittens B and C were litter-mates. Coding as in Fig. 1.
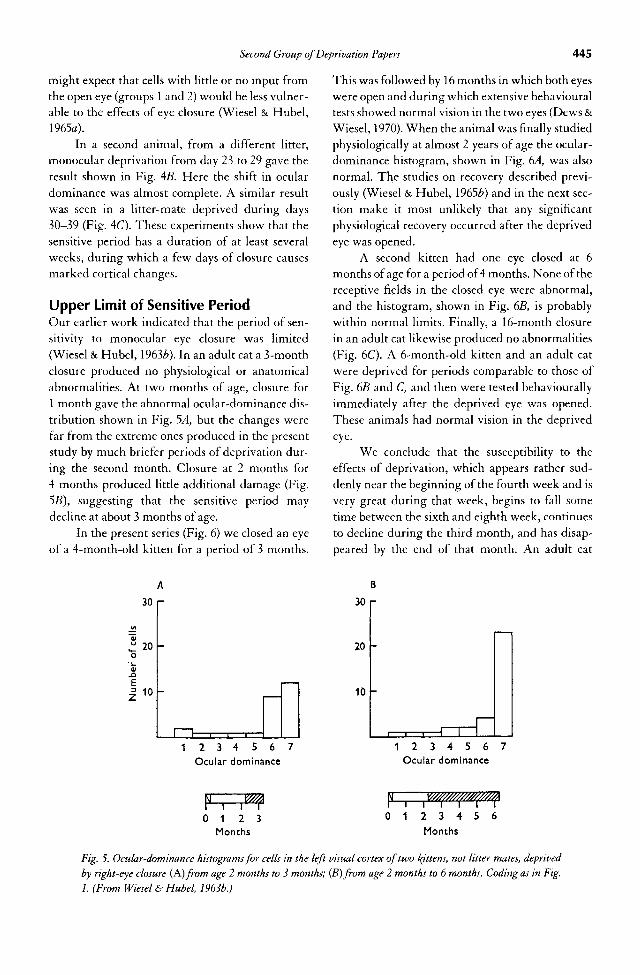
Second Group of Deprivation Papers 445
might expect that cells with little or no input fromthe open eye (groups 1 and 2) would be less vulner-able to the effects of eye closure (Wiesel & Hubel,19650).
In a second animal, from a different litter,monocular deprivation from day 23 to 29 gave theresult shown in Fig. 4fi. Here the shift in oculardominance was almost complete. A similar resultwas seen in a litter-mate deprived during days30—39 (Fig. 4C). These experiments show that thesensitive period has a duration of at least severalweeks, during which a few days of closure causesmarked cortical changes.
Upper Limit of Sensitive PeriodOur earlier work indicated that the period of sen-sitivity to monocular eye closure was limited(Wiesel & Hubel, 1963£). In an adult cat a 3-monthclosure produced no physiological or anatomicalabnormalities. At two months of age, closure for1 month gave the abnormal ocular-dominance dis-tribution shown in Fig. 5A, but the changes werefar from the extreme ones produced in the presentstudy by much briefer periods of deprivation dur-ing the second month. Closure at 2 months for4 months produced little additional damage (Fig.55), suggesting that the sensitive period maydecline at about 3 months of age.
In the present series (Fig. 6) we closed an eyeof a 4-month-old kitten for a period of 3 months.
This was followed by 16 months in which both eyeswere open and during which extensive behaviouraltests showed normal vision in the two eyes (Dews &Wiesel, 1970). When the animal was finally studiedphysiologically at almost 2 years of age the ocular-dominance histogram, shown in Fig. 6A, was alsonormal. The studies on recovery described previ-ously (Wiesel & Hubel, 1965£) and in the next sec-tion make it most unlikely that any significantphysiological recovery occurred after the deprivedeye was opened.
A second kitten had one eye closed at 6months of age for a period of 4 months. None of thereceptive fields in the closed eye were abnormal,and the histogram, shown in Fig. 6B, is probablywithin normal limits. Finally, a 16-month closurein an adult cat likewise produced no abnormalities(Fig. 6C). A 6-month-old kitten and an adult catwere deprived for periods comparable to those ofFig. 6B and C, and then were tested behaviourallyimmediately after the deprived eye was opened.These animals had normal vision in the deprivedeye.
We conclude that the susceptibility to theeffects of deprivation, which appears rather sud-denly near the beginning of the fourth week and isvery great during that week, begins to fall sometime between the sixth and eighth week, continuesto decline during the third month, and has disap-peared by the end of that month. An adult cat
Fig. 5. Ocular-dominance histograms for cells in the left visual cortex of two fattens, not litter-mates, deprivedby right-eye closure (A) from age 2 months to 3 months; (B)from age 2 months to 6 months. Coding as in Fig.
1. (From Wiesel & Hubel, 1963b.)

446 PART IV DEPRIVATION AND DEVELOPMENT
Fig. 6. Ocular-dominance histograms for cells in the left visual cortex of cats deprived by (A) right-eye lid sutureat 4 months, eye opened at 7 months and recordings made at 2 years of age; (B) right-eye lid suture at 6 months,recording at 10 months; (C) right-eye lid suture in adult, recording 16 months later. Coding as in Fig. 1.
seems completely resistant to monocular depriva-tion.
Recovery from Monocular Deprivationof Various DurationsThe effects of monocular deprivation for the first 3months of life tend to be permanent, with very lim-ited morphological, physiological, or behaviouralrecovery (Wiesel & Hubel, 1965£). It seemed im-portant to ask whether the recovery would begreater in animals deprived only for the minimumtime necessary to give severe physiological changes.For this purpose we used two litter-mates of the
kitten whose 10-37 day deprivation effects areshown in Fig. 2B. These kittens had their righteyelids sutured at 10 days and reopened at 37 days;one was studied physiologically after a 12-monthrecovery period, the other after 14 months. Record-ings were almost identical in the two animals (Fig.7A and B), and indicate a recovery that was clearlygreater than that seen after 3 months deprivation,although it was still very limited. The degree ofrecovery is perhaps greater than indicated by thehistograms alone, since a high proportion of thecells driven by the right eye were normal in theirresponses and stimulus requirements, and also
Fig. 7. Ocular-dominance histograms for cells in the left visual cortex of two litter-mates of kitten of Fig. 2B.Rig/it-eye suture at 10 days, opened at 37 days. Recordings made at (A) 12 months (cat no. 13, Dews & Wiesel,1970); and (B) 14 months after eyes were opened (cat no. 12, Dews & Wiesel, 1970). Coding as in Fig. 1.

Second Group of Deprivation Papers 447
since the number of cells that could not be drivenby either eye was low compared with what is usu-ally seen immediately after monocular deprivation.This decrease in unresponsive cells after a recoveryperiod has been a consistent finding (Wiesel &Hubel, 1965*).
In both animals the scarcity of binocular cellsis striking; only about one fifth of the cells, insteadof the normal four fifths, received inputs from botheyes. Thus it appears that the normal binocularconnexions are not only among the first to go (Figs.3A and 4^4), but are the least likely to recover. Inthese penetrations the cells that were driven exclu-sively by the closed eye tended to occur in groups,as though they were clustered together in the cor-tex. Normally cells tend to be grouped according toeye dominance (Hubel & Wiesel, 1965), so that pre-sumably the cells that re-establish functional con-nexions with the deprived eye are those that werestrongly dominated by that eye in the first place.
The effect of an additional 2 weeks of depri-vation upon subsequent recovery is seen in Fig. 8.Here a pair of litter-mates were monocularlydeprived between days 10 and 51, and then one wasrecorded from and the other allowed to recoverafter opening the lids for 11 months. As expected,the deprivation in the first kitten resulted in virtu-
ally complete domination by the left eye (Fig. 8/1).After 11 months there was some minor recovery inthe litter-mate, but considerably less than that seenin the animals of Fig. 7. Many of the cells driven byright eye showed abnormal responses. Thus in thecritical period even a slight increase in duration ofdeprivation, to an age of 7 weeks as opposed to 5,may be important in further limiting the recovery.This is supported by the behavioural studies ofsome of these same animals (Dews & Wiesel, 1970).
Finally, in two kittens (not litter-mates) theright eyes were closed for the first 3—4 months oflife and then opened. In one animal both eyes thenremained open for the next 30 months. In the other,the left eye was closed for a year and then opened,and from then on both eyes were open for the next58 months. When these animals were ultimatelystudied physiologically neither showed any spec-tacular recovery (Fig. 9), but just the usual slightincrease in cells driven by the originally closed eyeand a decline in the number of unresponsive cells.Eye reversal, comparable to patching an amblyopichuman eye, thus had no detectable effects in thephysiological studies. In contrast there was a cleardifference in the behavioural recovery of the twoanimals, for the first (not reversed) cat remainedcompletely and permanently form-blind in the
Fig. 8. Ocular-dominance histograms for cells in the left visual cortex of two litter-mates. (A) Right eyelidssutured from day 10 to day 51. (B) Right eyelids sutured from days 10 to 51, right eye than opened for 11 months.

448 PART IV DEPRIVATION AND DEVELOPMENT
Fig. 9. Ocular-dominance histograms for cells in the left visual cortex of two fattens whose right eyes were closedfor the first 3-4 months and then opened. (A) Both eyes were then fept open for 30 months (cat no. 10, Dews &Wiesel, 1970). (B) Left eye was then closed for 1 year, and then opened. From then on both eyes remained open
for the next 4 years and 10 months. The cat was finally recorded from at age 6 years and 1 month (cat no. 1, Dews& Wiesel, 1970). Coding as in Fig. 1.
deprived eye whereas the reversal in the second catled to some return of vision in the originallydeprived eye (Dews & Wiesel, 1970). It is worthemphasizing this disparity between the physiolog-ical and behavioural recovery in the eye-reversedcat. Such an animal either learns to do very wellwith the few cortical cells that recover their con-nexions or else learns to use some other less dam-aged part of its visual system.
Morphologic Changes in LateralGeniculate Body Following MonocularDeprivationOur previous studies (Wiesel & Hubel, 1963<z)showed that after three months of monocular clo-sure from birth the geniculate layers receivinginput from the deprived eye are thinner, and thecell bodies within these layers are smaller and stainless deeply with basic dyes. The atrophy was lessmarked the later the closure, with no changes in anadult cat deprived for 3 months. Most (though notall) of the cells in the affected layers responded wellto visual stimulation and had the usual centre-surround receptive fields. There is considerableadditional evidence that the physiological changesseen in cortical cells depend on cortical rather thanon geniculate abnormalities; for example, formdeprivation with a translucent occluder led to only
slight shrinkage in geniculate cells but gave a cor-tex just as abnormal physiologically as that follow-ing eye closure. Again, binocular occlusion gavesurprisingly less cortical abnormality than wouldhave been predicted from monocular closures, butresulted in just as severe shrinkage in all geniculatelayers (Wiesel & Hubel, 1965a). The absence ofgeniculate abnormalities in animals raised withstrabismus affords still another example of the lackof parallel between geniculate morphological andcortical physiological abnormalities.
The effects of deprivation on geniculate cellsseem to involve both a retardation in normalgrowth and also atrophy in the usual sense (Wiesel& Hubel, \961a; Kupfer & Palmer, 1964). At birththe cells are about one fourth adult size, in terms ofcross-sectional area; they grow rapidly to abouthalf size in 2—3 weeks and to full size in about 8—10weeks. During the first 3 weeks eye closure seemsto have little effect on this normal growth, not sur-prisingly perhaps, since even after the tenth day,when the eyes normally open, the animal sleeps orsuckles most of the time, often in a dimly lit hidingplace. After the third week sensory deprivationgives an irreversible arrest in growth, so that by thesecond month there is a 30—40% reduction in sizerelative to the normal. A kitten deprived at 2months of age for one month shows a reduction in

Second Group of Deprivation Papers 449
Fig. 10. Coronal section through (A) left and (B) right lateral geniculate bodies of a kitten whose right eye was
closed from days 23—26; same cat as in Fig. 4A; cresyl violet.
cell size (Wiesel & Hubel, 1963a) and this must betermed atrophy in the strict sense, since normalgrowth is practically complete at about 2 months.
During the most critical period for physiolog-ical changes in the cortex even a few days of depri-vation gave a distinct difference between geniculate
layers. Figure 10 gives the results of 3 days' depri-vation (days 23-26) in the animal of Fig. 4A Whilenot approaching the shrinkage seen following a3-month deprivation the effects are still obvious ata glance, particularly in the right geniculate, whichwas for some reason more seriously affected than

450 PART IV DEPRIVATION AND DEVELOPMENT
the left. In Fig. 11 the deprivation lasted 6 days (days23—29, same cat as in Fig. 4C); here the shrinkagewas bilateral and more marked, though the changewas still not so severe as that seen after a 3-monthdeprivation. It seems unlikely that differences aslarge as these could result simply from a cessation ofgrowth during these brief periods, and we assumethat there was in addition some atrophy.
Lateral geniculate bodies were examined his-tologically in both the animals of Fig. 9, in whichthe recovery period was protracted. Both showedthe usual marked reduction in cell size and inabil-ity to take up Nissl stain in layers receiving inputfrom the eye that was deprived in the first fewmonths. This agrees with our previous findings(Wiesel & Hubel, \965b). Even in the animal (Fig.9B) whose right eye was closed only for the first 3months and then the left eye closed for a year, thelayers corresponding to the right eye were col-lapsed and the cells shrunken, compared to theother layers. It seems evident that the abnormali-ties produced by the original closure are virtuallyirreversible. Furthermore, the normal appearanceof the layers receiving input from the left eye indi-cate that after 3 months of age, eye closure causesno appreciable changes. This fits well with theabsence of any changes in the geniculate of a catwith an eye sutured at 4 months of age for 3 months(Fig. 6/4), or in an adult cat with one eye shut for 16months (Fig. 6C). Here the evidence is especiallycompelling since one can compare adjacent de-prived and non-deprived layers. Burke & Hayhow(1968) have kept adult cats in darkness for over 2years without finding any morphological changesin the lateral geniculate.
DISCUSSION
The most surprising result of this paper is the highdegree of sensitivity a kitten shows to a few days ofmonocular deprivation during a very restrictedperiod in life. The susceptibility begins suddenlynear the start of the fourth week, at about the timea kitten begins to use its eyes, and persists untilsome time between the sixth and eighth weeks; itthen begins to decline, disappearing ultimatelyaround the end of the third month. After 4 monthscats seem to be insensitive even to very long periodsof monocular deprivation as tested by behavioural,physiological or morphological criteria.
An ability to recover from the physiologiceffects of monocular deprivation seems to beclosely related to this vulnerable period. Depriva-tion for the first 2—3 months produced virtuallyirreversible defects even when the normal eye wasclosed during the period of attempted recovery.When the deprivation period was shorter (Fig. 7)the recovery was greater, though it was still rela-tively slight. Perhaps this difference in ability torecover is simply an expression of a lesser degree ofpermanent damage from the shorter deprivationperiod. On the other hand, it may be that betweenthe fourth and eighth weeks an animal's nervoussystem is better able to recover, just as it is moresusceptible to damage. The immunity to depriva-tion effects after the third month and the failure torecover after that period may both be manifesta-tions of a similar rigidity.
The observation of a critical period of suscep-tibility to deprivation or abnormal experience is byno means new. Examples have been found in manyanimals, including birds, dogs, monkeys, and man.The period of susceptibility to deprivation variesfrom animal to animal and no doubt from systemto system within a given species. One extreme isseen in 'following responses' of certain birds,where the critical period peaks sharply within thefirst day of hatching (Lorenz, 1935). The otherextreme is found in man, in whom language capa-bilities, for example, can be laid down in the non-dominant hemisphere following injury in thedominant one during early childhood, but not afterthe age of about 8—10. The present studies indicatean age of maximum susceptibility to visual depri-vation between the fourth and eighth weeks. It iscommon experience that kittens handled exten-sively by humans during this period are subse-quently tamer and more tractable than ones iso-lated from humans, and behavioural studies suchas those of Scott & Fuller (1965) indicate a similarcritical period for social development in dogs. Itmay be that the critical period coincides with thetime when a particular system is being formed anddeveloped and that use during this time is essentialfor its full maturation and sustenance.
One may reasonably ask whether mechanismsin which neural connexions become impairedthrough abnormal experience can possibly serveany use, or possess any survival value. Here one canonly speculate, but it is worth emphasizing that in

Fig. 11. Coronal section through (A) left and (B) right lateral geniculate bodies of a fatten whose right eye wasclosed from days 23-29; same cat as in Fig. 4C; cresyl violet.
451
Scale: 1 mm.

452 PART IV DEPRIVATION AND DEVELOPMENT
monocular deprivation the failure of cortical con-nexions from the closed eye may well be accompa-nied by an enhancement of connexions from thenormal eye. It seems from the results of binocularclosure that the failure of connexions from theclosed eye is largely dependent on the other eye'sbeing open (Wiesel & Hubel, \965a). The abnor-malities we see may thus be part of a larger processof adjustment to the loss or impairment of one eye.Similarly in animals reared with strabismus frombirth, the falling out of connexions responsible formixing of inputs from the two eyes may have theadvantageous effect of overcoming double vision.But while it is easy to think of advantages to the ani-mal in possessing some flexibility, it is difficult tounderstand why the sensitive period should declineso completely after a few months. A second possi-bility is that the flexibility is important for certainfine adjustments in the neural connexions from theeyes relative to each other. Such adjustments mightbe important early in life, and once made, might besufficient to last a lifetime.
As yet we know nothing about the chemicalchanges and have only begun to learn about themorphologic changes that occur in the cortex as aresult of visual deprivation. Light microscopicobservations in dark-raised mice indicate that thevisual cortex is thinner than in the normal animal(Gyllensten, Malmfors & Norrlin, 1965). It hasbeen reported by Valverde (1967) that in such micethe number of spines on apical dendrites of layer Vpyramidal cells are reduced in the parts passingthrough layer IV. Globus & Scheibel (1967), study-ing dark-raised rabbits, found that in the portionsof the apical dendrite receiving geniculate inputthe spines were abnormal in size and shape but notreduced in numbers; otherwise cortical cells werenormal in size and dendritic branching.
In considering the possible implications ofstudies like the present one for human develop-ment it is important to stress that in the cat, withinthe critical period between the fourth and eighthweeks, a deprivation as brief as a few days can havemarked effects. This implies that for normal devel-opment normal environmental conditions mustprevail throughout the critical period and not justduring some small part of it. What an analogouscritical period might be in man is of course notknown though experience with squint would sug-gest that it is longer, possibly several years. We are
now attempting to define this period in themacaque monkey; from the few animals alreadystudied it is clear that 2 weeks of monocular depri-vation during the first 5 weeks of life produces atleast temporary blindness in the eye that has beenclosed and an absence of responses of cortical cellsto stimulation of that eye. This suggests that thesensitive periods of cats and monkeys may not betoo dissimilar.
We wish to thank Janet Wiitanen for her excellent technicalassistance. This work was supported in part by N.I.H. ResearchGrants, No. 5 RO 1 NB 02260 and in part by No. 5 RO 1 NB05554 Bell Telephone Laboratories Inc.
References
Burke, W. & Hayhow, W. R. (1968). Disuse in the lateral genic-ulate nucleus of the cat./. Physiol. 194, 495-519.
Dews, P. B. & Wiesel, T. N. (1970). Consequences of monoculardeprivation on visual behaviour in kittens. /. Physiol. 206,437-455.
Ganz, L., Fitch, M. & Satterberg, J. A. (1968). Selective effect ofvisual deprivation on receptive field shape determined neu-rophysiologically. Expl Neural. 22, 614-637.
Globus, A. & Scheibel, A. B. (1967). Effect of visual deprivationon cortical neurons: aGolgi study. Expl Neural. 19,331-345.
Gyllensten, L., Malmfors, T. & Norrlin, M.-L. (1965). Effect ofvisual deprivation on the optic centers of growing and adultmice./, comp. Neural. 124, 149-160.
Hubel, D. H. & Wiesel, T. N. (1962). Receptive fields, binocularinteraction and functional architecture in the cat's visualcortex./. Physiol. 160,106-154.
Hubel, D. H. & Wiesel, T. N. (1963). Receptive fields of cells instriate cortex of very young, visually inexperienced kittens./. Neurophysiol. 26, 994-1002.
Hubel, D. H. & Wiesel, T. N. (1965). Binocular interaction instriate cortex of kittens reared with artificial squint./. Neu-rophysiol. 28,1041-1059.
Kupfer, C. & Palmer, P. (1964). Lateral geniculate nucleus: his-tological and cytochemical changes following afferent de-nervation and visual deprivation. Expl Neural. 9, 400—409.
Lorenz, K. (1935). Der Kumpan in der Umwelt des Vogels./.Orn.,Lpz. 83,137-213.
Scott, J. P. & Fuller, J. L. (1965). Genetics and the Social Behaviourof the Dog. Chicago: University of Chicago Press.
Valverde, F. (1967). Apical dendritic spines of the visual cortexand light deprivation in the mouse. Expl Brain Res. 3,337-352.
Wiesel, T. N. & Hubel, D. H. (1963a). Effects of visual depriva-tion on morphology and physiology of cells in the cat's lat-eral geniculate body./. Neurophysiol. 26, 978-993.
Wiesel, T. N. & Hubel, D. H. (1963*). Single-cell responses instriate cortex of kittens deprived of vision in one eye./. Neu-rophysiol. 26,1003-1017.
Wiesel, T. N. & Hubel, D. H. (1965*). Comparison of the effectsof unilateral and bilateral eye closure on cortical unitresponses in kittens./. Neurophysiol. 28, 1029-1040.
Wiesel, T. N. & Hubel, D. H. (1965*). Extent of recovery fromthe effects of visual deprivation in kittens. /. Neurophysiol.28,1060-1072.

Second Group of Deprivation Papers 453
AFTERWORD
Before this work was done, we had considered that the deprivation effectswe had found were ascribable to disuse, analogous to the muscular atrophythat results when an arm is put in a cast. The first three of these papers, andto some extent also the fourth, made it clear that the effects we were seeingmust have involved more than simple disuse; that competition between thetwo eyes must be playing a major part.
It was hard for us to imagine that everything could be accounted for interms of competition, however. The geniculate cell pallor and shrinkageespecially were difficult to explain, given the fact that all the cells in anygiven layer were strictly monocular. The first hint that our reasoning wasfaulty came in 1970, when Guillery and Stelzner noticed, in examining ourillustrations, that the shrinkage and pallor of the deprived layers was con-fined to the main body of the geniculates, and that the most lateral parts—the parts receiving input from the temporal crescents of the contralateraleyes only—were normal (/ Comp Neurol 139:413-422). Needless to say, wefelt slightly embarrassed not to have noticed this ourselves. Evidently wewere so busy measuring cell sizes, in an effort to be quantitative, for once,that we had ignored the temporal crescents completely. The sparing of thetemporal crescent representations strongly suggested that somehow or other,in the geniculates, the two eyes must be competing.
A further ingenious demonstration reinforced the evidence supplied bythe normal temporal crescent representation. In 1972, Guillery (/ CompNeurol 144:117-130) made a destructive lesion in a small region of one tem-poral retina of a kitten, and then sewed closed the eyelids of the other eye.When he finally examined the lateral geniculate, he found the expected smallpatch of profound atrophy in the middle (Al) geniculate layer on the sameside as the eye with the lesion, and the expected atrophy in the dorsal (A)geniculate layer on the side opposite the closed eye—except for a regionimmediately opposite the atrophic patch in the middle layer, where therewas less atrophy than expected. So, clearly, making the retinal lesion hadremoved the competition from that small part of the retina. Later, Sherman,Guillery, Kaas, and Sanderson (/ Comp Neurol 1974, 158:1—18) went evenfurther, in showing that the focal retinal lesion prevented behavioral blind-ness and preserved single-cell responses in the corresponding region of visualfield of the eye that had been closed.
All this seemed to uphold the idea of competetion at the geniculatelevel, but a fuller understanding of how that could happen only came whenwe finally established, in our 1977 papers with Simon LeVay, that at andaround the time of birth the cortical ocular dominance columns are not yetcompletely segregated in layer 4C (pp. 493—539). This was clear from physi-ological recordings and from the autoradiography following eye injection.Evidently, at the time the deprivations took place, there was still mingling ofthe axons from the left- and right-eye geniculate layers, and hence the possi-bility of competition.

454 PART IV DEPRIVATION AND DEVELOPMENT
The squint result soon led us to examine the Siamese cat, whichacquires squint honestly—at least without surgical intervention—with sur-prising and unexpected results, to be discussed in the next paper.
Our next step was obviously to repeat these experiments in monkeys,and we would have forged ahead sooner, except that writing up the cat worktook time, and it was obviously economical to learn as much as possible fromcats before graduating to monkeys, just as we had done in our work on nor-mal physiology. Our postponing the monkey deprivation studies almostended in disaster, however, because one of us (Torsten), carried away by ourprogress in cats, described the results of these first six papers to a colleague ina different department during a squash game. A short time later we learnedthat the colleague, and a colleague of his, were beginning to do monocularclosures in monkeys. Such leap-frogging is not immoral, ("all is fair in loveand . . .") but it does have the effect of dampening one's tendency to talkopenly and enthusiastically about current work. It lessens the fun. In the endthis scare (if that is the right word) came to naught, perhaps because ourinterlocutors had not had the practice in closing eyes that we had had in cats.
As stated so frequently in this book, we cannot really complain aboutcompetition, having had the field of single-cell visual cortex neurophysiologylargely ourselves for almost a full decade. Still, ideas are scarce, and ofteneasy to carry out, and a few lessons like this one taught us to keep our cardscloser to our chests.
All these deprivation experiments took many cats, and later manymonkeys. Many of our kittens were born to pregnant cats in the lab, and costus nothing. Today the increased cost of the kittens (close to $500 each),together with the endless number of forms to be filled out, protocols to beprepared and revised, cost of daily upkeep, and inspections would certainlyput a severe damper on such a project. This seems ironic, given the impor-tance of the work in clinical ophthalmology.
Some years later, an ingenious and thoughtful paper by Gunther Stententitled "A physiological mechanism for Hebb's postulate of learning" (ProcNatlAcadSci USA 1973, (4):997-100) drew attention to the support our dep-rivation experiments provided for Donald Hebb's ideas on synapse strength-ening or weakening through experience. The arguments are spelled out inStent's paper and in my later book (Eye, Brain and Vision). I had met Hebb inthe early 1950s, when he was head of the Department of Psychology atMcGill—we happened to sit together on a Westmount-NDG bus after aseminar at the Montreal Neurological Institute, and we met several times insubsequent years when I was invited to Montreal to give seminars. I mayhave been mistaken, but had the impression, in the 1950s, that there was lit-tle communication between the Montreal Neurological Institute and otherdepartments at McGill. At that time, few would have dreamed that some dayHebb would be regarded as one of the most distinguished of Canadianscientists.

Chapter 23 • The Siamese Cat •
FOREWORD
We decided to study Siamese cats for several reasons. It is common knowl-edge that Siamese cats are often cross-eyed, and we wondered whether theirstrabismus would be accompanied by the same central defects that occurredin our artificially strabismic cats; namely, a marked decline in cells that couldbe driven from the two eyes.
In 1969, Ray Guillery had discovered that the lateral geniculate bodiesof Siamese cats are anatomically strikingly abnormal. Part of the middlelayer, which normally receives its input from the ipsilateral eye, insteadreceives input from the contralateral eye, not, as expected, from the con-tralateral visual field but from parts of the ipsilateral. Apparently some opticfibers that remain uncrossed in the chiasm of normal cats mistakenly cross tothe opposite hemisphere in Siamese cats. We were anxious to learn how theseaberrant optic fibers are mapped in the geniculate, and what happens tofibers from the abnormally connected parts of the geniculate when they getto the cortex. So we set out to record single cells in Siamese cats, mappingreceptive field positions, first in the lateral geniculate and then in the striatecortex.
To someone not steeped in the vagaries of mammalian retinal projec-tions, the onslaught in this paper of terms such as nasal, temporal ipsilateral,and contralateral may seem intimidating. Indeed, we, who must have had agrasp of this material at one time, have found the going rough after therelaxed intervening thirty years. We found that the best strategy in re-attack-ing this subject is to begin with the discussion section of the paper: the sum-mary is too compressed for a beginner, and the results section will seem toodetailed. We hope the richness of the subject and the bizarre nature of theresults will make the effort worthwhile.
455

456 PART IV DEPRIVATION AND DEVELOPMENT
Aberrant Visual Projections in the Siamese Cat
D. H. HUBEL AND T. N. WIESEL • Department of Neurobiology, Harvard Medical School, Boston, Massachusetts
SUMMARY
1. Guillery has recently shown that the Siamesecat has a grossly abnormal lateral geniculatebody. His anatomical study suggested that cer-tain fibres originating in the temporal retina ofeach eye cross in the chiasm instead of remain-ing uncrossed. They thus reach the wronghemispheres, but in the geniculate they termi-nate in the regions that the missing fibres fromthe ipsilateral eye would normally have occu-pied. The result is that each hemisphere receivesan input from parts of the ipsilateral field ofvision, this input being entirely from the oppo-site eye. The purpose of the present work was tostudy the physiological consequences of thisaberrant projection, in the lateral geniculatebody and visual cortex.
2. Single-cell recordings from the lateral genicu-late body confirmed the presence of projectionsfrom the ipsilateral visual field of the contralat-eral eye. The part of layer Aj receiving theseprojections was arranged so that the receptivefields of the cells were situated at about the samehorizontal level and at the same distance fromthe vertical meridian as the fields of cells in thelayers above and below (layers A and B), butwere in the ipsilateral visual field instead of thecontralateral. They thus occupied a regiondirectly across the mid line from their normalposition.
3. In the cortex of all animals studied, we found asystematic representation of part of the ipsilat-eral visual field, inserted between the usual con-tralateral representations in areas 17 and 18.When the visual cortex was crossed frommedial to lateral the corresponding region ofvisual field moved from the contralateralperiphery to the mid line, and then into the ipsi-lateral field for 20°. The movement thenreversed, with a return to the mid line and a
steady progression out into the contralateralfield. The entire double representation was,with some possible exceptions, a continuousone. The point of reversal occurred at or nearthe 17—18 boundary, as judged histologically,and this boundary was in about the same posi-tion as in ordinary cats.
4. Cells in the part of the cortex representing theipsilateral fields had normal receptive fields,simple, complex, or hypercomplex. These fieldstended to be larger than those in correspondingparts of the contralateral visual fields. Recep-tive-field size varied with distance from the areacentralis, just as it does in the normal cat, so thatcells with the smallest fields, in the area centralisprojection, were situated some distance fromthe 17-18 border.
5. Projections originating from the first 20° fromthe midvertical in both visual half-fields hadtheir origin entirely in the contralateral eye, aswould be expected from the abnormal crossingat the chiasm. Beyond this visual-field region,and out as far as the temporal crescents, therewere projections from both eyes, but we foundno individual cells with input from the two eyes.The cells were aggregated, with some groups ofcells driven by one eye and some by the other.
6. From previous work it is known that ordinarycats raised with squint show a decline in the pro-portion of cells that can be driven binocularly,whereas animals raised with both eyes closedshow little or no decline. A Siamese cat raisedwith both eyes closed had binocular cells in theregions of 17 and 18 subserving the peripheralvisual fields, suggesting that the absence ofbinocular cells seen in the other Siamese cats wasindeed secondary to the squint.
7. In two Siamese cats there were suggestions of anentirely different projection pattern, superim-posed upon that described above. In the parts of
From/. Physiol. (1971), 218,pp. 33-62
Received 75 February 1971.

The Siamese Cat 457
17 and 18 otherwise entirely devoted to the con-tralateral visual field, we observed groups ofcells with receptive fields in the ipsilateral fieldof vision. The electrode would pass from aregion where cells were driven from some partof the contralateral visual field, to regions inwhich they were driven from a part of the ipsi-lateral field directly opposite, across the verticalmid line. The borders of these groups were notnecessarily sharp, for in places there was mixingof the two groups of cells, and a few cells hadinput from two discrete regions located oppositeone another on either side of the vertical midline. The two receptive-field components ofsuch cells were identical, in terms of orientation,optimum direction of movement, and complex-ity. Stimulation of the two regions gave a betterresponse than was produced from either onealone, and the relative effectiveness of the twovaried from cell to cell. These cells thus behavedin a way strikingly reminiscent of binocularcells in common cats.
8. The apparent existence of two competingmechanisms for determining the projection ofvisual afferents to the cortex suggests that anumber of factors may cooperate in guidingdevelopment. There seems, furthermore, not tobe a detailed cell-to-cell specificity of geniculo-cortical connexions, but rather a tendency totopographic order and continuity, with one partof a given area such as 17 able to substitute foranother. Whether or not these tentative inter-pretations are ultimately proved correct, itseems clear that this type of genetic anomaly haspotential usefulness for understanding mecha-nisms of development of the nervous system.
INTRODUCTION
Among animal breeders it is common knowledgethat Siamese cats are frequently cross-eyed. A fewyears ago we showed that ordinary cats raised withsquint from an early age develop marked abnor-malities in the connexions subserving binocularinteraction in the cortex (Hubel & Wiesel, \965b),and we wondered whether Siamese cats woulddevelop similar abnormalities, or if they might pos-sibly show them at birth.
Recently Guillery (1969) has observed thatSiamese cats possess a strikingly abnormal lateral
geniculate body. Patterns of fibre degeneration fol-lowing removal of one eye revealed that in eachgeniculate body parts of the layers that in the nor-mal cat connect to the ipsilateral eye, in the Siamesereceived their input from the contralateral eye.Guillery suggested that some fibres from the tem-poral retina, which are normally uncrossed,become misdirected and cross to the oppositehemisphere during development.
If optic fibres that normally are uncrossed atthe chiasm instead become crossed, there should becells in the geniculate with receptive fields in theipsilateral half-field of vision. One may then askhow these cells project to the cortex, whether, forexample, there is in each hemisphere an added sys-tematic topographic representation of part of theipsilateral field of vision, or whether the aberrantprojections become scrambled with the normalones. What happens when the cortex is presentedwith an abnormal input could obviously be ofinterest for an understanding of normal develop-ment. Because of this, and our interest in thesquint, we decided to investigate the central path-way of Siamese cats and kittens, particularly thetopographic projections of the retinas to areas 17and 18 of the visual cortex, and the receptive-fieldproperties and binocular interaction of cells inthese areas.
METHODS
Seven purebred Siamese cats were used: a litter of fivekittens whose parents both had overt strabismus, andone additional adult cat and a 4-month-old kitten. Theadult cat had no obvious squint. In the two kittens thatwere observed from birth to age 5 months, one devel-oped a clear squint by about 2 months, though it was notnearly as marked as in some adult Siamese cats. Theother kitten had only a suggestion of a squint by 5months (as described below, however, both had a readilydemonstrable convergent strabismus when the eyes wereparalysed).
Methods of stimulating and recording from kittensand adult cats have already been described in detail(Hubel & Wiesel, 1962, 1963). The 5-month-old kittenswere anaesthetized with thiopentone, but in two 2-week-old kittens xylocaine was used both as a generalanaesthetic and for local infiltration of the skin wounds.The anaesthetized animal was placed in a stereotaxichead holder and the corneas protected with contactlenses, which also focused the eyes on a projection screen1.5 metres away. The eye muscles were paralysed with

458 PART IV DEPRIVATION AND DEVELOPMENT
succinylcholine, making it necessary to use artificial res-piration. Tungsten electrodes were positioned in aclosed-chamber system. Receptive fields were mappedwith spots, slits, dark bars and edges, produced by ahand-held slide projector. Our main concern was tocompare the responses of cells driven from the two eyesand to localize the receptive fields in the visual fields foras many cells and over as wide a region of visual cortexas possible, examining area 18 as well as 17. In each elec-trode track one or more electrolytic lesions were made,and the tracks were later reconstructed in the usual man-ner from serial Nissl-stained sections.
RESULTS
Recordings from the LateralGeniculate BodyIn the lateral geniculate body of the normal cat(Text-fig. 1) the nasal half-retina of the contralat-eral eye projects to the most dorsal layer (A) and tothe most ventral (B), while the temporal half-retinaof the ipsilateral eye projects to the intermediate
layer, Aj. (Guillery, 1970, has shown in the normalcat that there is a sublamina of layer B which alsoreceives ipsilateral projections.) The contralateralhalf-field of vision is mapped on to each layer sys-tematically, with the three maps in precise register,so that in any vertical penetration one first recordscells driven from the contralateral eye, then cellsdriven from the ipsilateral, and then the contralat-eral, all with their receptive fields in the same partof the contralateral field of vision (Hubel & Wiesel,1961; Bishop, Kozak, Levick & Vakkur, 1962). Thefurther medial the penetrations, the closer thereceptive fields are to the vertical meridian of thevisual fields.
If, in the Siamese cat, part of layer Aj is sup-plied by the temporal retina of the contralateraleye, rather than the ipsilateral, the sequence ofevents during a vertical penetration should be verydifferent from the normal. To study this we madefour penetrations in the lateral geniculate bodies oftwo Siamese kittens, one 5 months old (No. 3), andthe other 4 months old (No. 7). In three of the pen-
Text Fig. 1. Diagram to illustrate visual-field topography for areas 17 and 18 of normal cat cortex. The right-hand diagram shows a view of the cortex from above. The continuous line shows the level of the coronal sectionillustrated to the left. Geniculate and cortex are shown in coronal section, since for both structures a medio-lat-eral movement at a given coronal level corresponds roughly, in the visual field, to a movement to or away fromthe vertical mid line. (An anterior or posterior movement in geniculate or cortex corresponds to movement downor up in the visual fields.) For simplicity, connexions from geniculate to area 18, and from 17 to 18, are omitted.

The Siamese Cat 459
etrations some of the cells had their receptive fieldsclearly in the ipsilateral field of vision, severaldegrees from the vertical meridian. Two of thethree penetrations, however, were far forward inthe geniculate, where the anatomy is not easilyinterpreted. The third, shown in Text-fig. 2, wasnear the middle of the left geniculate's antero-posterior extent.
The first group of cells in penetration 3,recorded from layer A, had fields some 5—6° fromthe mid line in the right (contralateral) field of theright eye. The next cells, from what we interpret tobe Aj, instead of being in the right field of the lefteye, were in the left field of the right eye, in aroughly mirror-symmetric position across the ver-tical mid line. The last cells, from layer B, were
driven from the right eye and right field, as wouldbe expected in the dorsal part of this layer. Thefinal electrode position was marked by a lesion(Text-fig. 2, Pi. 1). Except for their positions in thewrong visual field of the wrong eye, all of the cellsrecorded from layer A t behaved normally. Thesefindings agree with Guillery's results concerningcontralateral-eye input to Aj, and support hisinterpretation that the input originated from thetemporal half of the contralateral retina.
Cortical Recordings
NORMAL CATS. The general topographic arrange-ment of the normal cat visual cortex is shown inText-fig. 1 (Talbot & Marshall, 1941; Hubel &
Text Fig. 2. Penetration through the left lateral geniculate body of a Siamese kitten (No. 7); Horsley-Clarke lat-eral 9.0, anterior 4.0. Each receptive field is shown relative to the area centmlis, which is indicated, for each cell,by a short horizontal cross bar intersecting the long vertical line. The first cells, 23-25, were recorded from layerA, and had receptive fields in the right eye, 5-6° to the right of the mid-vertical and 1.5° above the horizontalmeridian. Cells 26-28, recorded from layer A p and again driven from the right eye only, had fields 4-5° to theleft of the mid line, 1° below the horizontal. Finally a cell recorded in the uppermost part ofB had fields in theright eye in the same position as the fields of cells 23-25. The area centralis was not well defined, and no attemptwas made to correct for eye rotation in the equatorial plane. OT = optic tract.

460 PART IV DEPRIVATION AND DEVELOPMENT
Wiesel, \965a). The lateral geniculate body proj-ects to the primary visual cortex in a systematicmanner. There is also a direct projection from themain part of the lateral geniculate body to area 18(Garey & Powell, 1967; Glickstein, King, Miller &Bailey, 1967). From Nauta-degeneration experi-ments in a series of normal cats, with small lesionsconfined to layers A or Aj of the geniculate, wehave shown that this projection to area 18 is a sys-tematic one, consistent with the topographic repre-sentations as determined physiologically, and withthe known anatomical projection from 17 to 18.
A given location in either 17 or 18 receives pro-jections from a region in each of the three genicu-late layers, one lying directly above or below theother, as would be expected from the fact that thethree topographic maps are in register. As oneexplores the cortex from medial to lateral, at a givencoronal level, there is a displacement in the corre-sponding positions in the visual fields, beginning inthe contralateral visual field and moving inwards tothe vertical mid line, and then out again to the con-tralateral periphery (Talbot & Marshall, 1941). Thepoint of reversal at the vertical meridian is repre-sented by the anatomical 17—18 border (Otsuka &Hassler, 1962; Hubel & Wiesel, 1965a). The ipsilat-eral field of vision, of course, projects to the otherhemisphere. A forward movement along the cortexcorresponds to a downward movement in the visualfield. Within 50—60° of the vertical mid line, theprojection to the cortex is from both eyes. Thevisual field beyond this (the temporal crescent) isrepresented by the contralateral eye only.
A vertical penetration entering the cortexnear the medial border of the lateral gyrus (seeText-fig. 1) should thus record cells in 17 or 18 withfields close to the vertical meridian. If the penetra-tion extends far down the medial bank of the gyrusthe receptive fields should gradually move out fur-ther and further into the contralateral visual field.On the other hand a series of vertical penetrationsbeginning at successively more lateral positionsalong the lateral gyrus should record cells in area18 with fields that again occupy progressively moreperipheral positions in the contralateral field of
SIAMESE CATS: TOPOGRAPHY AND BINOCULAR INTER-ACTION. In Seven Siamese cats, sixteen penetra-tions were made, and 303 cells were adequately
studied. The first cat (No. 3) was examined at anage of 5 months. When awake and alert the animalwas obviously strabismic. When it was anaes-thetized and paralysed, the eyes took up a rest posi-tion with their axes converged by 12°, instead of theusual divergent separation of about 5° (Hubel &Wiesel, 1962; Bishop, Kozak & Vakkur, 1962). Bythis method of measurement there was thus about17° of convergent squint.
Two cortical penetrations were made in thiskitten, one in each hemisphere. Both penetrationswere abnormal, in that all cells responded only tothe contralateral eye and had abnormal receptive-field positions. Otherwise the cells responded nor-mally, showing typical simple, complex, andhypercomplex properties. The first penetration(Text-fig. 3) entered the right post-lateral gyrus ata point that normally is well within area 17, andcorresponds to a visual-field region 1—2° or lessfrom the area centralis (Talbot & Marshall, 1941;Hubel & Wiesel, 1965<z). In this cat, however, thefields began 15—20° in the ipsilateral field of vision,some 5—10° below the horizontal meridian. As theelectrode descended along the medial bank therewas a clear systematic trend first towards the verti-cal mid line, which was crossed at about cell 36, andthen out into the contralateral field of vision, end-ing about 15° from the mid line. A second penetra-tion down the medial aspect of the left hemispheregave very similar results.
The ipsilateral-to-contralateral progressionof receptive fields shown in Text-fig. 3 is what isnormally seen with a lateral-to-medial movementof an electrode across area 17; what was mostunprecedented was the inclusion of 15—20° of ipsi-lateral visual field in this progression. Clearly inthis animal part of the cortex was devoted to a sys-tematic representation of the medial part of theipsilateral visual fields. The extent of the represen-tation was not established, and the lateral parts ofthe lateral gyrus were not explored. In neither pen-etration was there any sign of responses from theipsilateral eye in either field of vision; this wasexpected, given that the optic nerve fibres repre-senting the central 30—40° of visual field were, inthe Siamese cat, presumably virtually all crossed.From the morphological normality of the lateralparts of the lateral geniculate bodies in these ani-mals one would predict a normal binocular inputto parts of the cortex representing the contralateral
vision

461
Text Fig. 3. First penetration in the right hemisphere of a 5-month-old Siamese cat (No. 3). The diagram at leftshows a dorsal view of the brain surface, indicating the points of entry of two micro-electrode traces. Right partof the Figure shows a reconstruction of the microelectrode trac\ in the right hemisphere. The plane of section(Horsley-Clarke 0.0) is indicated on the brain surface map by a dotted line. Positions of units are indicated bynumbered cross bars to the right of the electrode tracJ^. Lp L2 and L^ refer to three electrolytic lesions made inthe course of the penetration. Numbers just outside the cortical tracing refer to approximate azimuth positionsof receptive fields, positive numbers standing for regions of visual field contralateral to the hemisphere recordedfrom; negative standing for ipsilateral.
In the diagram on p. 41 the position of each receptive field is shown relative to the area centralis, which isindicated for each cell or set of cells by a horizontal cross bar intersecting the long vertical line. Ipsilateral visual
field is to the right, contralateral to the left, of each vertical line. All cells in this penetration were influenced onlyfrom the left (contralateral) eye. Orientations, for most receptive fields, are indicated by two short lines. Thusunit 1 had a 10 o'clock^-4 o'cloc\ orientation.
Note (1) the gradual drift of receptive-field positions from ipsilateral to contralateral as the electrodedescended along the medial banfy (2) the decrease infield size with decreasing distance from the area centralis,for both ipsilateral and contralateral fields, and (3) the larger average size of ipsilateral fields, compared withcontralateral ones, (continued)
visual fields beyond 20° or so. Obviously, what wasneeded next was an exploration of both 17 and 18,including parts representing the more peripheralcontralateral visual fields.
Cat No. 4, a litter-mate of the previous cat,was also studied at 5 months of age. In this animalthere was only a faint suggestion of a strabismus onsimple inspection, but the convergent strabismusestimated from the rest position with musclesparalysed was 16°.
The entire lateral gyrus was explored at coro-nal level +5 by making five penetrations, as shownin Text-fig. 4. In the first, most medial penetration(PI) the first fields were 10-20° ipsilateral to thevertical meridian, and later ones, in the medialbank, showed a steady trend outwards beginningat the mid line and ending 30° in the contralateralvisual field. Up to a point half way down themedial bank, near lesion 2 (unit 23), all cellsresponded only to the contralateral eye; here, how-
The Stamese Cat

462 PART IV DEPRIVATION AND DEVELOPMENT
Text Fig. 3. (Continued)
ever, we came upon a group of cells driven onlyfrom the ipsilateral eye. Receptive fields wereabout 15° from the mid line, in about the sameplace as the fields of the contralateral-eye cellsrecorded just before. It can be seen in Text-fig. 4that these cells occurred in groups (the fields aredrawn in dashed lines): first units 23—26, later unit32, and finally units 34-40. It seemed that we weregoing from regions where all cells were driven byone eye to regions where they were all driven bythe other, an impression that was reinforced onnoting that the background activity was influencedby one or the other eye, but not by both, except verybriefly at the transition points.
In penetrations 2—5, as the recording sitemoved laterally, the fields shifted from the ipsilat-
eral visual field (penetration 2) into the contralat-eral (penetration 3), moving further and furtherout, as far as 30° in penetration 4, and 50° in pene-tration 5. All cells were driven from the contralat-eral eye except for two in penetration 4 which wereinfluenced only from the ipsilateral eye and whosereceptive fields were about 15-20° out from themid line in the contralateral visual field.
We interpret these experiments as indicatingthat the extra 20° or so of ipsilateral visual field, in17 and 18, had been, as it were, inserted into thecortex at the 17—18 boundary. It seemed that theextra piece was organized so that in a medio-lateralexploration of the cortex the visual-field represen-tation proceeded not from the contralateral periph-ery to the vertical mid line and back out again, as it

The Siamese Cat 463
Text Fig. 4. Five penetrations in the right visual cortex of a 5-month-old Siamese cat (cat. No. 4, a litter-mateofNos. 1, 2, 3, and 5). Horsley-Clarke anterior 5.0. Receptive fields drawn with continuous lines indicate thatcells were driven from contralateral eye only; dashed lines, ipsilateral eye only. Penetration 1 (PI), from unit 10on, shows a steady drift of receptive fields out into the contralateral field of vision; this is typical of area 17. Com -paring field positions in the upper part of penetration 1 and penetrations 2-5, the movement from ipsilateral tocontralateral in the visual field suggests that these recordings were all in area 18; this is supported by the largesize of the fields and their wide scatter, in contrast to the smaller and better ordered fields in area 17. Up to cell23 all responses were from the contralateral eye only. Beyond about 15°, in both 17 and 18, occasional cells weredriven from the ipsilateral eye only. No cells were binocularly driven. Arrow shows the approximate position ofthe 17-18 border, as estimated from Nissl and myelin-stained sections. (Continued)
normally does (Text-fig. 9, left half), but insteadprogressed from the contralateral periphery to themid line and beyond, into the ipsilateral field forsome 20°. Then, in the region of cortex where the17—18 border normally comes, there was a reversalin direction and, on traversing 18, a return to themid line and a progression into the contralateralvisual field (Text-fig. 9, right half). The predictionwas confirmed that in the peripheral part of thevisual fields, beyond about 20°, there should beinput from both eyes. Even here, however, therewas no evidence for binocular convergence uponsingle cells.
EFFECTS OF STRABISMUS ON SIAMESE CAT COR-TEX. In ordinary cats reared with artificial strabis-mus, there is a striking decline in the number ofcells driven by both eyes. One sees instead a mix-ture of cells, some driven by one eye, others driven
by the other (Hubel & Wiesel, 1965£). We naturallywondered if in Siamese cats the lack of binocularconvergence in the periphery was secondary to thestrabismus. The most direct way of settling this isto record from kittens at a very early age, before acritical period of susceptibility to deprivationbegins. For eye closure the onset of this period isabout 4 weeks of age (Hubel & Wiesel, 1970) and itseems reasonable to assume that for squint it isprobably the same, though this has not been stud-ied extensively. Two kittens (Nos. 1 and 2) wereaccordingly studied at 15 and 16 days of age, butneither survived long enough for examination ofthe outlying parts of the visual-field representa-tions. We recorded from a total of fifty cells in theapex of the lateral gyrus, and, as expected fromrecordings in the older animals, all cells weredriven exclusively from the contralateral eye. Theresponses seemed normal for animals at this age,

Text Fig. 4. (Continued)
464

The Siamese Cat 465
but difficulties in seeing the retinal landmarksbecause of the cloudy ocular media prevented ourlocalizing the receptive fields in relation to the areacentralis and optic disk.
To circumvent the difficulties in workingwith very young animals, we brought up one of thekittens (No. 5) to an age of 5 months with both eye-lids sutured. This procedure does not lead to anyobvious change in binocular interaction in the cor-tex (Wiesel & Hubel, 1965), and with both eyesclosed the proportion of binocularly driven cellsshould obviously not be influenced by the presenceof a squint. When the eyelids were separated andthe muscles paralysed there was a convergence of 2°and a vertical disparity of about 8°. Deviations aslarge as this are occasionally seen in normal cats
and in cats with binocular closures, after paralysiswith succinylcholine. Clearly this cat differed fromits littermates of the same age in having no markedconvergent squint. Both this difference and the factthat the squint in the other animals developed onlyafter several months of vision suggest that thesquint is secondary to the neural abnormality.
A single penetration was made down themedial bank of the lateral gyms at coronal level +3(Text-fig. 5). Thirty-nine cells were recorded from,their fields localized, and responses to stimulationof the two eyes compared. As usual in binocularlydeprived animals, about half the cells failed torespond, responded sluggishly, or showed otherabnormalities such as a decline in orientation selec-tivity. Once more the initial fields were about 20°
Text Fig. 5. Five-month-old Siamese cat (No. 5) whose eyelids had both been sutured shut from birth. Thirty -nine cells were recorded from apex and medial aspect of lateral gyrus; all of these except possibly the very firstwere in area 17, to judge from the steady ipsilateral-to-contralateral progression in field position. Cells wereinfluenced from the contralateral eye only, up to unit 32, whose field was 20° contralateral to the midvertical;from this point on there was a mixture of cells driven from both eyes (represented by dashed and continuous rec-tangles superimposed) and cells driven only from the contralateral eye. Numbers in parentheses following unitnumbers refer to ocular-dominance groupings; e.g. '2' means that contralateral eye gave much stronger responsesthan ipsilateral, etc. (see Hubel & Wiesel, 1962). Note the relatively large size of ipsilateral receptive fields, andthe very much smaller contralateral ones. Receptive fields represented by circles were not clearly oriented, a fre-quent finding in cats reared with both eyes closed from birth (cells 29—33 are out of sequence because electrodewas withdrawn and then readvanced). (Continued)

466 PART IV DEPRIVATION AND DEVELOPMENT
Text Fig. 5, (Continued)
out from the vertical in the ipsilateral field of visionand the cells were driven only by the contralateraleye; subsequent fields progressed steadily inwardsto the vertical meridian. Following a gap betweenunits 20 and 21, during which the electrode crossedlayer I, the trend continued, with the first fields 15°contralateral and the final ones 30° contralateral.Ipsilateral fields in the first part of the penetrationwere several times larger than the contralateralfields recorded in the latter part, even though thetwo groups were about the same distance from thevertical meridian. This tendency was also seen,though not quite so compellingly, in the penetra-tion of Text-fig. 3.
All cells were driven only by the contralateral(left) eye until unit 32, whose field was 20° con-tralateral; that cell was driven from both eyes, theleft eye slightly dominating (group 3). We thenobserved a series of cells driven from both eyes,after which the cells, with one exception, againbecame monopolized by the contralateral eye.Thus this cat, unlike the previous two, showedclear convergence of input from both eyes on singlecells. It is not possible to say whether the actual dis-tribution of cells according to ocular dominance isnormal, given such a small sampling of cells, but itseems clear that binocular convergence on to singlecells is present at birth, and subsequently disap-

The Siamese Cat 467
pears because of strabismus, just as it does in ordi-nary cats or monkeys when a squint develops earlyin life.
ABERRANT INPUT. At this stage it appeared to usthat the project of surveying the Siamese cat wasreasonably complete, but since all the animals hadbeen from the same litter we thought it wise torepeat the experiments in one or two unrelatedSiamese cats. Accordingly the next experimentconsisted of four penetrations made in an adult cat
(No. 6). The results, in terms of topographic repre-sentation and binocular interaction, were entirelyconsistent with the previous ones, with one inter-esting addition.
The first three penetrations were made atHorsley-Clarke coronal level 0.0 (Text-fig. 6). Inthe most medial penetration, PI, units 1—10 hadfields in the vertical mid line area about 10° belowthe centre of gaze. This upper part of the penetra-tion was slightly inclined so that there was a com-ponent of movement relative to the surface in a lat-
Text Fig. 6. First three penetrations in cat No. 6, an adult Siamese unrelated to cats 1-5. Horsley-Clarke 0.0.Upper part of penetration 1 and penetrations 2 and 3 were all in area 18, as judged by the histology and the ipsi-lateral-to-contralateral progression in receptive-field positions accompanying media-lateral movement acrossthe cortex. In the deeper half of penetration, and in penetration 3 there were occasions in which cells and bac\-ground activity could be driven by stimuli in the ipsilateral visual field, roughly across the mid line from the partof the visual field from which the prevailing responses were obtained. In area 17, cells 14, 15, and 19 had dualfields, with components roughly symmetrically placed in each visual field. (Fig. 7 illustrates a recording from cell14.) For these fields, the orientations of the two components, as well as the field sizes and directional preferences,were identical. (Fields 11—18 are numbered in the order in which they were recorded, but are illustrated in theiranatomical order.) In area 18, background activity recorded simultaneously with unit 46 was again driven fromthe mirror-symmetric position in the ipsilateral field (46a). All cells were driven only from the contralateral eye,except for Nos. 32 and 33, which were driven also by the ipsilateral eye (group 2). (Continued)

468 PART IV DEPRIVATION AND DEVELOPMENT
Text Fig. 6. (Continued)
eral-to-medial direction. The drift in receptive-field positions from contralateral to ipsilateral sug-gested that this region of cortex was area 18. Aftercrossing white matter, the electrode, as expected,entered a region in which the first cells (Nos. 11and 12) had fields in the contralateral visual field,in this case about 15° out; these cells were drivenfrom the contralateral eye. Advancing the elec-trode rather rapidly, we suddenly entered a regionin which the background activity was still drivenby the contralateral eye, but now from the ipsilat-eral visual field, about the same distance out, and atabout the same horizontal level. There was notrace of a response from the contralateral visualfield. A well isolated cell, No. 13, had its field in thisipsilateral area. We withdrew the electrode slowly,to see if there was any overlap between these twomirror-symmetric cortical representations. A shortdistance back there was indeed a region in whichactivity was driven from both areas of visual field,with no response from the vertical mid line regionbetween. Here we came upon a well isolated cell(No. 14) which was driven from both areas, a find-ing so unprecedented that we went to great pains tobe sure that the recording was not from two differ-
ent cells. We finally convinced ourselves that it wasa single cell by adjusting the electrode positionback and forth, watching the spikes from the unitwax and wane, nevertheless remaining identical insize at any electrode position regardless of theregion of visual field stimulated.
A recording from this cell is illustrated inText-fig. 7. The two components of the field wereexactly the same size, and both showed identicalpreferred stimulus orientations, with a moderatedirectional preference for downward movement.The situation was thus reminiscent of the usualcortical cell with a receptive field in each eye; allthis time, however, the right eye was absolutelysilent, and the fields, far from being in correspon-ding positions, were in virtual mirror-symmetry.What reinforced the analogy to the usual system ofbinocular interaction in cat cortex was the exis-tence of clear summation when the two areas werestimulated together, and especially the fact thatwhile the regions had similar properties in mostrespects, the responses were not equally brisk, thecontralateral region giving slightly stronger burststhan the ipsilateral (the difference is not apparentin Text-fig. 7). In the normal cat it will be recalled

469
Text Fig. 7. Responses of cell 14 of Text-fig. 6 (cat No. 6, penetration 1). The cell was driven from two regions,each 4° X4° in size, one 9° to the left of the vertical mid line and l21/2 below the horizontal (left records), theother 8° to the right of the vertical mid line and 13° below the horizontal (right records). Between these regions(middle set of records) no responses were evoked. Since this cat had a poorly defined area centralis, estimates ofthe vertical mid line could have been off by 2-3° in either direction. In each area the best responses were to a2:30—8:30 slit moving downwards. Responses from the contralateral region were slightly brisker than those fromthe ipsilateral (though this does not show in the illustration). Duration of each trace, 4 sec.
that cortical cells are not necessarily driven withequal vigour from the two eyes (Hubel & Wiesel,1962).
Advancing the electrode, we recordedanother unit with a double field (No. 15), whosecomponents had the same positions and orienta-tions as unit 14. Again the contralateral regiondominated slightly. Cells 16—18 had fields only inthe ipsilateral area, with no background activityevoked from the contralateral region. Cell 19 had adouble field with the ipsilateral region nowstrongly dominant, while No. 20, recorded simul-taneously, was driven only from the ipsilateralarea. The next cell, No. 21, again responded only inthe ipsilateral region. From that point on all activ-ity disappeared from the ipsilateral area, and as cellafter cell was mapped the receptive fields as usualmoved gradually further into the contralateralvisual field. Late in the penetration two more cells,Nos. 31 and 35, had receptive fields confined to theipsilateral side. These fields were not as far out on
that side as were the fields of their neighbours onthe contralateral side. All this time the ipsilateral(right) eye gave no hint of activity until cells 32 and33, both of which were, however, strongly domi-nated by the contralateral eye (group 2), and wereinfluenced only from the contralateral field ofvision.
Cells recorded in penetration 2, lateral to 1(Text-fig. 6), again had fields that were virtually inthe mid line. In penetration 3 the fields of the ini-tial cells were, as expected, further out in the con-tralateral field. A careful scrutiny of the ipsilateralvisual field during the entire penetration againshowed one small patch of cortex, containing cell46, in which background activity was influencedboth from the region of that cell's field and fromthe same eye in an area of ipsilateral field roughlyopposite (No. 46a); cell 46 itself was driven onlyfrom the contralateral region. The two mirrorregions were too close together for us to be ab-solutely certain that they did not merge across the
The Siamese Cat

470 PART IV DEPRIVATION AND DEVELOPMENT
mid line, but it was clear that in this part of area 18there were patches in which there was input fromthe ipsilateral field.
In a final penetration made 6 mm further for-ward, a long traverse of the medial segment gaveresults very similar to those of Fig. 4, penetration 1.There were no patches of mirror representation.
Cat No. 7, a 4-month-old Siamese unrelatedto the others (Text-fig. 8), was examined to confirmthe existence of these ipsilateral patches of input.The animal already had a clear convergent squint.As in cat No. 6, the areae centrales were unusuallypoorly defined, and our estimate of their positionscould have been off by several degrees in any direc-tion. A penetration down the medial cortical bankrevealed a topography virtually identical to that ofprevious experiments—an ipsilateral progression,a jump to the mid line after crossing white matter,and a subsequent progression into the contralateralfield. Careful monitoring of the ipsilateral fieldduring these recordings showed two portions ofthe penetration (cells 47—50; 54—56) in whichresponses were obtained from two separate regionsof visual field, one on each side of the verticalmeridian. On the first of these occasions two cells(47 and 48) were recorded together, one with a fieldabout 12° in the contralateral visual field, the otherwith a field of slightly different orientation, about7° in the ipsilateral visual field and slightly lower inposition. There was abundant background activityinfluenced from both areas. Cells 49 and 50 werelikewise simultaneously recorded. Two other cells,Nos. 54 and 56, had fields ipsilateral to the midver-tical; in both recordings there was simultaneousactivity driven from the contralateral field. At nopoint in the penetration were responses evokedfrom the ipsilateral eye.
This experiment, then, confirmed the pres-ence of patches of input from the ipsilateral visualfield superimposed on what was predominantly arepresentation of the contralateral field of vision.The lack of a strict mirror symmetry in the posi-tioning of these receptive fields, and the relativelylarge scatter in their field positions, agrees with asimilar finding in the previous experiment (Text-fig. 6, cells 31 and 35), but contrasts with the regu-larity suggested earlier in the same penetration(Text-fig. 6, cells 13-21). On the whole we had theimpression that the ipsilateral-field input was less
well organized than the input from the contralat-eral field, which is as orderly as in the normal cat.
DISCUSSION
These experiments confirm Guillery's observationthat the central visual pathway of the Siamese cat ishighly abnormal, and they support his idea that theabnormality consists primarily of a mistake at thechiasm, with some optic fibres from the temporalretina crossing instead of remaining uncrossed. Inthis paper we have tried with the help of physio-logical tools to learn how the brain deals with theaberrant fibres, with the ultimate hope of gainingmore insight into normal developmental processes.
At the geniculate level the problem of aber-rant fibres is solved, it would seem, in the simplestand most obvious way. A medial segment of layerA! on one side should normally receive the inner-most 15—20° of temporal fibres from the ipsilateraleye; these fail to reach the geniculate, which insteadmust deal with the innermost 15—20° of temporalfibres from the contralateral eye. Not surprisingly,the aberrant fibres project to just the gap in thegeniculate that the absent optic fibres would havefilled. Text-fig. 2 suggests that they do so in a sys-tematic manner, since as the electrode crosses fromlayer A to Aj the fields of cells jump from a regionin the contralateral visual field to a region roughlyin the corresponding part of the ipsilateral field,with mirror-like symmetry. Normally the site oftermination of a retinal fibre relative to the medialborder of the geniculate depends on the distance ofits origin in the retina from the retinal vertical midline, and the mirror-symmetry suggests that this istrue even for aberrant fibres from the ipsilateralfield. This ability of optic fibres to grow to preciselythe right location in the geniculate, but on thewrong side with mirror symmetry, implying anabsence of strict left-right specificity, is reminiscentof experiments in which Sperry (1945) obtainedrestoration of vision in frogs after crossing the opticnerves; his behavioural result seems to imply thatthe fibres had succeeded in growing back to theappropriate parts of the tectum, but on the wrongside.
The next question is how the cortex dealswith such a complex input. In trying to predict theanswer one may imagine several possibilities. The

Text Fig. 8. Siamese fytten (No. 7) 4 months of age. A single penetration in the right visual cortex at coronallevel 0.0. The first cells were recorded from area 18, as judged by the large size of receptive fields and progressionout into the ipsilateral visual field. In the medial segment, presumably area 17, there was the usual regular con-tralateral drift of relatively small fields, broken only by two brief episodes of activity from the ipsilateral field ofvision. No cells were seen with dual fields, but there were three examples in which the two simultaneouslyrecorded cells were driven from regions to either side of the midvertical (47 and 48; 49 and 50; 54 and 55). Allcells were driven from the contralateral eye only.
471

472 PART IV DEPRIVATION AND DEVELOPMENT
projections from layer At of the geniculate mightbe organized very much as they are in the normalvisual pathway, with groups of cells in Aj con-nected to the same region of cortex as cells directlyabove, in layer A of the geniculate, and below, inthe ventral set of layers (B). Or an entirely separateregion of cortex might be set aside for the projec-tions from the additional 15—20° of ipsilateralvisual field, in which case neighbouring cells fromA and Al would project to very different places.Finally, fibres from the abnormal part of Aj couldbe mixed in with, and superimposed upon, the nor-mal projection from the contralateral field in moreor less random fashion.
The result, in fact, is a mixture of the first andsecond possibilities. Of these the second plan, inwhich part of the cortex of each hemisphere isdevoted specifically to the 0—20° region of ipsilat-eral field, seems the dominant one, for it occurredin all of the Siamese cats in which topographicmappings were made. One of the most surprisingfindings in these experiments was the high degreeof order shown by the new ipsilateral representa-tions. Far from the scrambled topographic picturethat one might have expected, the arrangementwas almost as systematic as in the normal animal.In response to the problem of where in the cortexto represent an additional 20° of ipsilateral visualfield, the answer has been to wedge it in neatlyalong the 17—18 boundary, which normallyreceives projections from the vertical meridian ofthe visual field. This is illustrated for the righthemisphere in Text-fig. 9: as the visual cortex iscrossed from medial to lateral the visual-field rep-resentation begins as usual in the far left peripheryand moves to the mid line. Instead of reversinghere, it proceeds for another 20° into the right field.With further progression laterally across the cortexthe movement reverses itself, going from 20° in theright field back to the mid line, and then advancingagain across the left visual field. Presumablymedial cortex, up to the reversal point, is area 17,and cortex lateral to this is area 18. Unfortunately,in none of the experiments was the point of rever-sal in the cortex precisely established, chieflybecause the extreme curvature of cortex in thisregion makes it difficult to do so in a small numberof electrode penetrations. Our estimates of it, how-ever, coincided well with the anatomical 17—18borders in Nissl and myelin sections, which are
marked by arrows in Text-figs. 4, 5, 6 and 8. Theseanatomical transition points were as usual notsharply defined, but they can be estimated withreasonable confidence to within a millimetre or so.The anatomical borders and reversal points wereroughly the same in position as the 17—18 border inthe common cat (Otsuka & Hassler, 1962; Hubel &Wiesel, 1965*).
The presence of an added 20° of course dis-torts the normal topography, so that in any coronalsection a point in area 17 representing a givenregion of visual field is shifted medially by up to4-5 mm, and similarly the representation in 18 isshifted laterally (see Text-fig. 9). There may also besome distortion in the anteroposterior direction,since all of our receptive-field positions seemedslightly low; a survey of much more of the striatecortex and area 18 would probably be necessary tolearn whether such a distortion exists.
There are several hints that in the Siamese catthe topography is in places more complex and lessregular than what we have described. Guillery'spaper shows that, at least at some anteroposteriorlevels, there may be two segments of layer Aj thatreceive aberrant contralateral-eye input, separatedby a normal segment. In terms of topography amovement medially along A or A] corresponds toa visual-field displacement inward towards thevertical meridian. One would therefore expect thatthe part of temporal retina yielding crossed aber-rant fibres would not necessarily extend uninter-rupted to the mid line of the visual field, but mightform several islands or strips in the ipsilateral field.In that case one would also expect in the cortex acorresponding discontinuity in the ipsilateral-fieldrepresentation. This seemed not to be so in some ofour cortical penetrations, such as that of Text-fig. 3,for in that experiment there was a continuous pro-gression extending from 15° ipsilateral across themid line to 15° contralateral. Text-fig. 5 likewiseshows no gap. Moreover, there was no hint of anyipsilateral-eye input to the contralateral fields intheir most medial parts, though Guillery's resultmight predict such an input. But the inner 10—20°of visual field, contralateral or ipsilateral, were inmost experiments not thoroughly enough exploredto rule out minor discontinuities, and it may be thatthe part of the temporal retina giving rise tocrossed fibres extends uninterrupted to the midline at some horizontal levels but not at others, or
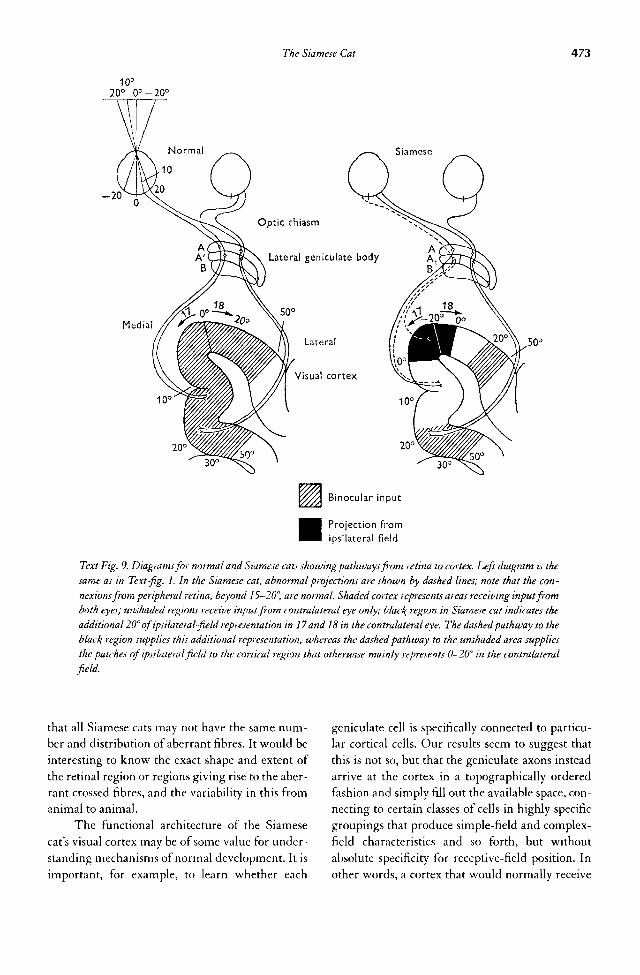
The Siamese Cat 473
Text Fig. 9. Diagrams for normal and Siamese cats showing pathways from retina to cortex. Left diagram is thesame as in Text-fig. 1. In the Siamese cat, abnormal projections are shown by dashed lines; note that the con-nexions from peripheral retina, beyond 15-20°, are normal. Shaded cortex represents areas receiving input fromboth eyes; unshaded regions receive input from contralateral eye only; blac\ region in Siamese cat indicates theadditional 20°ofipsilateral~field representation in 17 and 18 in the contralateral eye. The dashed pathway to theblacl{ region supplies this additional representation, whereas the dashed pathway to the unshaded area suppliesthe patches of ipsilateral field to the cortical region that otherwise mainly represents 0-20° in the contralateralfield.
that all Siamese cats may not have the same num-ber and distribution of aberrant fibres. It would beinteresting to know the exact shape and extent ofthe retinal region or regions giving rise to the aber-rant crossed fibres, and the variability in this fromanimal to animal.
The functional architecture of the Siamesecat's visual cortex may be of some value for under-standing mechanisms of normal development. It isimportant, for example, to learn whether each
geniculate cell is specifically connected to particu-lar cortical cells. Our results seem to suggest thatthis is not so, but that the geniculate axons insteadarrive at the cortex in a topographically orderedfashion and simply fill out the available space, con-necting to certain classes of cells in highly specificgroupings that produce simple-field and complex-field characteristics and so forth, but withoutabsolute specificity for receptive-field position. Inother words, a cortex that would normally receive

474 PART IV DEPRIVATION AND DEVELOPMENT
fibres representing only the contralateral field ofvision finds itself confronted with input from anadditional 20° of ipsilateral field. The solution is toplace the fibres with the furthest ipsilateral repre-sentation where the innermost ones would nor-mally go, at the 17—18 border, and pack in the rest,as usual, in an ordered double representation. Evenif the size of the visual field representation is largerfor each hemisphere, the total number of incomingfibres is presumably not increased, since over theanomalous 20° there is input from the contralateraleye only.
This apparent lack of rigid specificity ingeniculo-cortical connexions is reminiscent of thefindings of Gaze, Jacobson & Szekely (1963), inXenopus embryos with compound eyes (doublenasal or double temporal), that optic fibres whichwould normally have projected to only half of thecontralateral tectum regenerate so as to fill thewhole tectum. The analogy is of course a tenuousone since our results do not involve regenerationafter surgical intervention, and furthermore theprocess is one of compression of a topographicalrepresentation after an addition of visual-fieldinput rather than an expansion after a field deletion.
In the common cat, cortical receptive fields inor near the area centralis tend to be very muchsmaller than those in the periphery. The same istrue in the Siamese cat, to judge from experimentslike that of Text-fig. 3, even though the region ofarea 17 representing the area centralis is displaced.This suggests that the detailed interconnexions andtransformations in the cortex are not very differentfrom region to region of a given subdivision such as17 or 18. In parts of cortex subserving the area cen-tralis there is more cortex per degree of visual fieldthan in peripheral parts (i.e. the magnification fac-tor is larger), but there are also more entering genic-ulate fibres, whose receptive fields are smaller. Ifdifferences in precision of representation that occurin various parts of the visual field, in 17 and 18, arenot reflected in differences in architecture, then anypart of area 17 may substitute for any other, as thepresent results in the Siamese cat seem to imply.This idea is also supported by the relative histolog-ical uniformity of these regions.
If a new topographic order is the chief princi-ple used to deal with the anomalous cortical input,there seems to be a second competing process inwhich cells of the anomalous segment of geniculate
layer Aj connect to the same regions as their imme-diate neighbours in layers A and B, above andbelow. In a normal animal, of course, these twotendencies need not compete, since the topographicmaps of the visual fields in the three layers A, Ajand B are in precise register. In the Siamese cat cor-tex, the second tendency results in alternatingregions or patches (possibly columns) of two types:not left eye—right eye regions, as is found in com-mon cats, but areas with contralateral-field input,mixed with occasional patches representing moreor less mirror-symmetric ipsilateral-field regions.Here the two mirror-symmetric inputs are fromthe contralateral eye only. At boundaries betweenthe two kinds of region, or where the two overlap,cells with receptive fields on one side of the verticalmid line may be inter-mixed with cells havingfields on the opposite side, and an occasional cellmay even be driven by one eye from two separateregions, one in the left and one in the right visualfield. In the three cells of this type that were seenthe orientations of the two regions were identical,showing that in some respects there was a highdegree of specificity of connexions. Moreover, theresponses from the two regions were not necessar-ily equal. This system thus strikingly resembles thesystem for binocular convergence in the cat, aswould be expected if both systems depend on thesame connexions.
The mirror-like patches of ipsilateral-fieldrepresentation resemble even more closely the pat-tern of binocular convergence in ordinary catsbrought up with strabismus, for here one sees espe-cially sharp separation of left-eye and right-eyepatches, with only a small proportion of cellsreceiving input from both eyes (Hubel & Wiesel,1965£). In ordinary cats raised with strabismus theseparation is the result of the long-term absence ofcorrelated stimulation of corresponding regions inthe two retinas. The same could well be true in theSiamese, for only by chance would identical stimuliever fall upon points symmetrically disposed oneither side of the vertical meridian of the visualfield. In the present study we used an animal witheyes bilaterally occluded from birth to show thatthere is initially binocular convergence on corticalcells in the peripheral fields, from 20° to the tempo-ral crescents, and that this convergence breaksdown in the presence of squint early in life. A sim-ilar strategy might be used to test whether in

The Siamese Cat 475
Siamese cats cells with double fields in one eye aremore common in very young animals. Indeed, thequestion might have been asked in cat No. 5, but atthat time we were not aware that such cells existed,and even if they had been more frequent in that cat,we may simply have missed them. In any case, therelative scarcity of ipsilateral patches seems to indi-cate that the main ipsilateral projections go to thetopographically organized regions near the 17—18border.
Patches of mirror-symmetric ipsilateral fieldrepresentation were found in the predominantlycontralateral-field region (in Text-fig. 9, theunshaded parts of the cortex), both in 17 and 18.We look upon this as a process reflecting a ten-dency for axons from adjacent parts of A, Aj and Bto travel to a common destination, namely the cor-tical region where contralateral fields are repre-sented. There would be no reason to expect patchesof contralateral-field input (from layers A and B) tobe engrafted on the cortical ipsilateral-field repre-sentation (the black region in Text-fig. 9) and infact no such mirror patches were found.
If all of the ipsilateral visual field input went tothe new topographically ordered region (black, inText-fig. 9), one might expect this projection to bejust as detailed as its counterpart in the contralateralfield. The ipsilateral input is divided, however,some going to the topographically ordered area,some to the patches in the otherwise purely con-tralateral region. The prediction from this wouldbe that the ipsilateral projection should be cruderthan the contralateral. The relatively larger size ofreceptive fields in the ipsilateral field representationin area 17 (see Text-fig. 3 and Text-fig. 6) may be onereflexion of a coarser representation.
All of these results indicate that the Siamesecat lacks any of the cortical mechanisms for binoc-ular vision in the central 40° or so of its visual field.If these mechanisms play any part in binocular fix-ation it may not be surprising that a marked squintdevelops. The notion that the squint is secondary tothe neural abnormality is supported by the absenceof squint during the first few months in our ani-mals, and the failure of a convergent squint todevelop after 5 months when the eyes are keptclosed. That the squint is convergent seems tomake sense, since that would lead to a favouring ofthe nasal half retinas over the temporal halves. It is,of course, the temporal half retinas that give rise to
the aberrant projections, producing from the con-tralateral eye the crude ipsilateral-field representa-tion in the cortex. With a marked convergentsquint these projections may not receive much use.The fact that cat breeders have virtually eliminatedsquint in Siamese cats suggests that the extent ofthe neural abnormality may vary from one pedi-gree to the next.
Though as far as we know the visual capabil-ities of Siamese cats have never been tested behav-iourally, the anatomical and physiological resultssuggest that this breed may be very defective.Surely even in the absence of squint there should beno stereoscopic depth perception for the first 20° ofthe visual fields in either direction out from thevertical mid line. Mirror-like patches of cortex, andcells such as the doublets of Text-figs. 6 and 8, arealso hardly likely to enhance an animal's visualcapacity.
In all of this discussion it has been assumedthat the primary visual defect in the Siamese cat isan error occurring at the optic chiasm. At present,however, one has no idea what it is that causes suchmistakes to occur in cat after cat. The real difficultyis that one does not know what guides the fibres indeciding whether or not to cross at the chiasm; if itis some kind of chemical attractant in the lateralgeniculate, then the error in the Siamese cat mayarise either from a misreading of the directions bya certain set of optic fibres, or a faulty specificationof the geniculate cells. It would be of great interestto know why only certain fibres go astray. It hardlyseems likely that one gene looks after a special setof temporal retinal fibres and another looks after adifferent set. Perhaps instead the error is one ofprogramming, in which the timing of events isfaulty. Thus the fibres that cross by mistake may doso because they arrive at the chiasm earlier or laterthan the others, before or after the normal sig-nalling mechanism is in force.
It is of course surprising to find such anom-alies in an animal that has been on the doorstep forso many centuries. Such a visual mutation in aspecies with a highly evolved visual system seemsexperimentally very useful, especially since theeffects are mild enough not to destroy the visualsystem but severe enough to be interesting. Finally,one is encouraged to look for other mutants inhigher mammals, and also to study the genetics ofthis one more thoroughly.
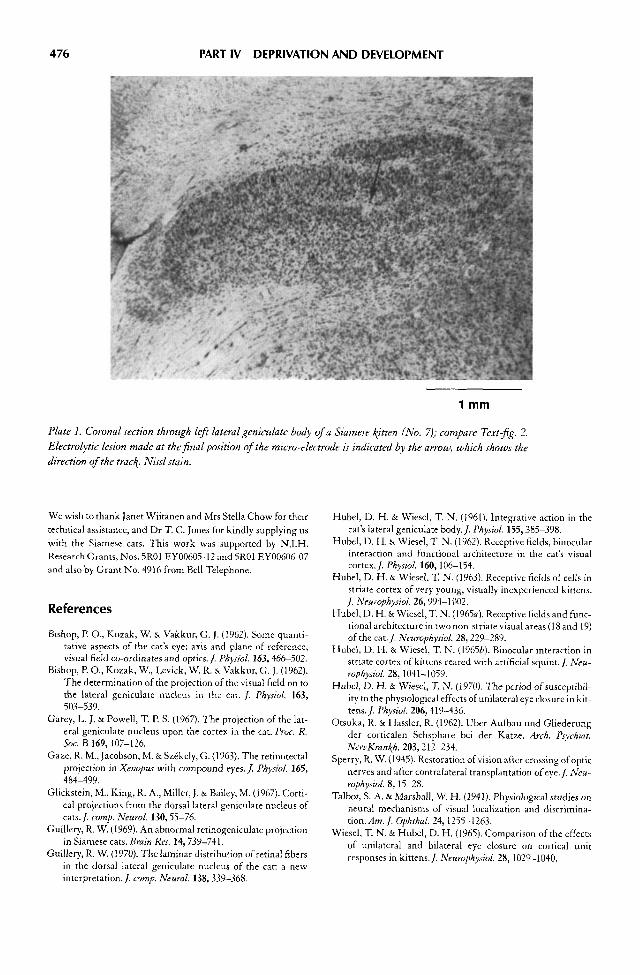
476 PART IV DEPRIVATION AND DEVELOPMENT
Plate 1. Coronal section through left lateral geniculate body of a Siamese kitten (No. 7); compare Text-fig. 2.Electrolytic lesion made at the final position of the micro-electrode is indicated by the arrow, which shows thedirection of the trac\. Nissl stain.
We wish to thank Janet Wiitanen and Mts Stella Chow for theirtechnical assistance, and Dr T. C. Jones for kindly supplying uswith the Siamese cats. This work was supported by N.I.H.Research Grants, Nos. 5R01 EY00605-12 and 5R01 EY00606-07and also by Grant No. 4916 from Bell Telephone.
References
Bishop, P. O., Kozak, W. & Vakkur, G. J. (1962). Some quanti-tative aspects of the cat's eye: axis and plane of reference,visual field co-ordinates and optics./. Physiol. 163,466-502.
Bishop, P. O., Kozak, W., Levick, W. R. & Vakkur, G. J. (1962).The determination of the projection of the visual field on tothe lateral geniculate nucleus in the cat. /. Physiol, 163,503-539.
Garey, L. J. & Powell, T. P. S. (1967). The projection of the lat-eral geniculate nucleus upon the cortex in the cat. Proc. R.Sac. R 169,107-126.
Gaze, R. M, Jacobson, M. &Szekely, G. (1963). The retinotectalprojection in Xenopus with compound eyes. /. Physiol. 165,484-499.
Glickstein, M., King, R. A., Miller, J. & Bailey, M. (1967). Corti-cal projections from the dorsal lateral geniculate nucleus ofcats./, comp. Neural. 130,55-76.
Guillery, R. W. (1969). An abnormal retinogeniculate projectionin Siamese cats. Brain Res. 14,739-741.
Guillery, R. W. (1970). The laminar distribution of retinal fibersin the dorsal lateral geniculate nucleus of the cat: a newinterpretation./ comp. Neural. 138,339-368.
Hubel, D. H. & Wiesel, T. N. (1961). Integrative action in thecat's lateral geniculate body./. Physiol. 155,385-398.
Hubel, D. H. & Wiesel, T. N. (1962). Receptive fields, binocularinteraction and functional architecture in the cat's visualcortex./. Physiol. 160,106-154.
Hubel, D. H. & Wiesel, T. N. (1963). Receptive fields of cells instriate cortex of very young, visually inexperienced kittens./. Neurophysiol. 26,994-1002.
Hubel, D. H. & Wiesel, T. N. (1965a). Receptive fields and func-tional architecture in two non-striate visual areas (18 and 19)of the cat./. Neurophysiol. 28, 229-289.
Hubel, D. H. & Wiesel, T. N. (1965*). Binocular interaction instriate cortex of kittens reared with artificial squint./. Neu-rophysiol. 28,1041-1059.
Hubel, D. H. & Wiesel, T. N. (1970). The period of susceptibil-ity to the physiological effects of unilateral eye closure in kit-tens./. Physiol. 206, 419-436.
Otsuka, R. & Hassler, R. (1962). Uber Aufbau und Gliederungder corticalen Sehsphare bei der Katze. Arch. Psychiat.NervKmnkh. 203,212-234.
Sperry, R. W. (1945). Restoration of vision after crossing of opticnerves and after contralateral transplantation of eye./. Neu-rophysiol. 8,15-28.
Talbot, S. A. & Marshall, W. H. (1941). Physiological studies onneural mechanisms of visual localization and discrimina-tion.^/?!./. Ophthal. 24,1255-1263.
Wiesel, T. N. & Hubel, D. H. (1965). Comparison of the effectsof unilateral and bilateral eye closure on cortical unitresponses in kittens./. Neurophysiol. 28, 1029-1040.
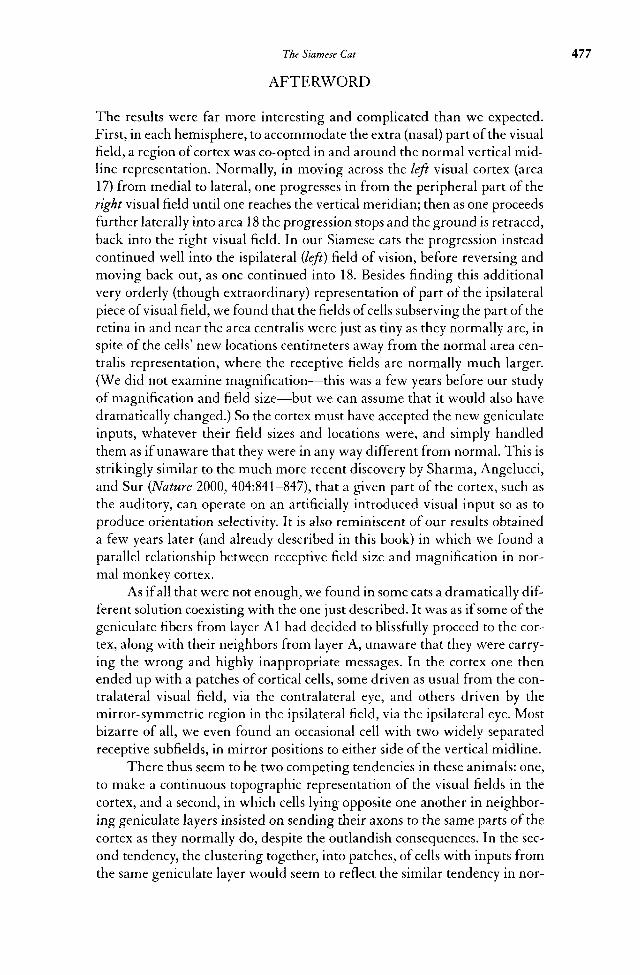
The Siamese Cat 477
AFTERWORD
The results were far more interesting and complicated than we expected.First, in each hemisphere, to accommodate the extra (nasal) part of the visualfield, a region of cortex was co-opted in and around the normal vertical mid-line representation. Normally, in moving across the left visual cortex (area17) from medial to lateral, one progresses in from the peripheral part of theright visual field until one reaches the vertical meridian; then as one proceedsfurther laterally into area 18 the progression stops and the ground is retraced,back into the right visual field. In our Siamese cats the progression insteadcontinued well into the ispilateral (left) field of vision, before reversing andmoving back out, as one continued into 18. Besides finding this additionalvery orderly (though extraordinary) representation of part of the ipsilateralpiece of visual field, we found that the fields of cells subserving the part of theretina in and near the area centralis were just as tiny as they normally are, inspite of the cells' new locations centimeters away from the normal area cen-tralis representation, where the receptive fields are normally much larger.(We did not examine magnification—this was a few years before our studyof magnification and field size—but we can assume that it would also havedramatically changed.) So the cortex must have accepted the new geniculateinputs, whatever their field sizes and locations were, and simply handledthem as if unaware that they were in any way different from normal. This isstrikingly similar to the much more recent discovery by Sharma, Angelucci,and Sur (Nature 2000, 404:841-847), that a given part of the cortex, such asthe auditory, can operate on an artificially introduced visual input so as toproduce orientation selectivity. It is also reminiscent of our results obtaineda few years later (and already described in this book) in which we found aparallel relationship between receptive field size and magnification in nor-mal monkey cortex.
As if all that were not enough, we found in some cats a dramatically dif-ferent solution coexisting with the one just described. It was as if some of thegeniculate fibers from layer Al had decided to blissfully proceed to the cor-tex, along with their neighbors from layer A, unaware that they were carry-ing the wrong and highly inappropriate messages. In the cortex one thenended up with a patches of cortical cells, some driven as usual from the con-tralateral visual field, via the contralateral eye, and others driven by themirror-symmetric region in the ipsilateral field, via the ipsilateral eye. Mostbizarre of all, we even found an occasional cell with two widely separatedreceptive subfields, in mirror positions to either side of the vertical midline.
There thus seem to be two competing tendencies in these animals: one,to make a continuous topographic representation of the visual fields in thecortex, and a second, in which cells lying opposite one another in neighbor-ing geniculate layers insisted on sending their axons to the same parts of thecortex as they normally do, despite the outlandish consequences. In the sec-ond tendency, the clustering together, into patches, of cells with inputs fromthe same geniculate layer would seem to reflect the similar tendency in nor-

478 PART IV DEPRIVATION AND DEVELOPMENT
mal animals for cells of like ocular dominance to gather into ocular domi-nance columns. It is again as if the cortex were just doing its usual job withthe inputs coming in, unaware of their inappropriateness. Evidently the poorSiamese cat is simply trying, one way or another, to make the best of the messbequeathed it by the abnormal crossing in the chiasm. We do not understandthe processes underlying these cats' problems—and still less can we imaginewhat the outside world must look like to these creatures—but the abnormalcrossing of optic fibers is probably related to the abnormalities of pigmentepithelium that affect skin and fur coloring and also retinal pigment epithe-lium. Somehow the pigment epithelium must play a part in the crossing ofretinal ganglion cell axons at the chiasm.
To complicate the story even further, the two types of results wedescribe in this paper are quite different from those obtained by Guillery andCasagrande (/ Comp Neurol 1977, 174:15—46) presumably in a differentbreed of Siamese cats, which they call "Midwestern", in contradistinction toour cats, which they call "Boston". Those authors have stressed that the dif-ferences are almost certainly in the breeds, not in the techniques used by thetwo sets of workers.
In the Midwestern results, there is no systematically reorganized topog-raphy. Instead, the cortical inputs from the abnormal portions of the genicu-late Al layers, which receive their inputs from the ipsilateral visual fields andtemporal retinas, are suppressed in the cortex. These Siamese cats throw inthe sponge, at least figuratively: parts of the nasal visual fields in each eye areblind. In their anatomy, Midwestern and Boston animals are clearly differ-ent: in the Midwestern animals the very most medial part of geniculate layerAl receives uncrossed optic fibers, just as it does in the normal animal. InBoston cats this "medial normal segment" is lacking or very small. The dis-ruption of the orderly progression in Midwestern cats, as one progressesfrom medial to lateral along layer Al, is consequently more severe, with ajump in representation on both sides of the aberrant segment. In our BostonSiamese cats there is topographic continuity as one goes medially along themost medial part of layer A, then down to the most medial part of Al, andthen laterally until the lateral part of the abnormal segment is reached. Thatdegree of continuity possibly makes it easier to establish order in the cortex.Apparently the Midwestern animal abandons any attempt to produce anordered cortical topography for the ipsilateral eye.
The full story coming from the work of Guillery and his colleague islong and fascinating, and includes raising their animals with lid closures,and making cortical lesions to produce retrograde degeneration in the genic-ulates, to map the paths anatomically. It all makes for a rewarding weekend'sreading.
Carla Shatz, already mentioned in the context of normal callosal con-nections in the cat, also examined anatomically, with horseradish peroxidaseinjections, the callosal connections in the Boston variety of Siamese cats. Inthese animals the callosal projections from the 17—18 border regions of onehemisphere were absent, or alomost so, from the border region of the other

The Siamese Cat 479
side, but were instead located more medially, well within area 17, and alsolateral to the border in 18.
Since we can think of little more to add to the already lengthy discus-sion in the paper, our readers may perhaps breathe a sigh of relief. Given thattoday even ordinary alley cats can cost around $800, it seems doubtful thatmuch more work will soon be done on this even more expensive, special, andmuch-prized breed.

Chapter 24 • Cells Grouped in OrientationColumns in Newborn Monkeys •
FOREWORD
We were probably fortunate during the first decade of our working togetherin having our results virtually unchallenged by others in the field. This is nodoubt because we were lucky enough to begin at a time when only a fewgroups had attempted to record from any part of the cortex, and thosegroups, especially the Mountcastle-Bard-Woolsey-Rose group at the JohnsHopkins physiology department, were close at hand and had already devel-oped many of the important methods—the closed chamber, metallic elec-trodes, the use of curare-like agents to paralyze the eyes, and so on. We prof-ited immensely from our interactions with them. Only by the end of the1960s did the world begin to catch up and competition begin to develop.Within a few years almost no phase of our work had been unchallenged.There was considerable difference of opinion, especially in the area of thedegree of specificity of cells in newborn kittens (Blakemore and VanSluyters,/PA)/^'o/ 1975,248:663-716). Cats, to be sure, have poorly developedvision at birth (the eyelids are closed, the media are opaque), and in those ani-mals we had to base our claims on a rather small number of cells that showeda grudging, if to us convincing, orientation selectivity. Later, in macaquemonkeys, we were astonished at the degree to which a newborn or visuallyinexperienced monkey a few weeks old resembled an adult in the specificityof its responses. We had been convinced of the result in the 1963 kitten paper,but the challenges had continued unabated. Thus in the present study we feltthat we needed to, so to speak, beat the matter into the ground. That waswhy we delivered a fetal monkey by caesarean section, to dispense with anyarguments that an animal might have had a few moments of visual experi-ence. It is also why we welcomed our evidence for regular sequences of ori-entation in newborn monkeys.
Nevertheless, one of the pleasures of science is the very existence ofcompetition, especially when it is without rancor, and what made our dia-logue with Colin Blakemore and others a pleasure was the total absence of
480

Orientation Columns in Newborn Monkeys 481
ill-feeling, as far as we could judge. There was much admiration (we hope)on both sides, and we enjoyed the disagreements, just as one can enjoy aheated tennis game.
Ordered Arrangement of Orientation Columns in MonkeysLacking Visual Experience
TORSTEN N. WIESEL AND DAVID H. HUBEL • Department of Neurob/o/ogy, Harvard Medical School, 25
Shattuck Street, Boston, Massachusetts 02775
ABSTRACT
The main object of this study was to see whether ordered sequences of orientation columns are pres-ent in very young visually naive monkeys. Recordings were made from area 17 in two macaque mon-keys three and four weeks of age, whose eyes had been closed near the time of birth. The first mon-key was born normally, but one day elapsed before eye closure could be done. The second wasdelivered by Cesarean section and the lids sutured shut immediately. The results in these two ani-mals were very similar; in both, highly ordered sequences of orientation shifts were present, and werein no obvious way different from those seen in the adult. For example, average values for the size oforientation shifts, for the horizontal component of the distance between shifts, and for the slopes oforientation vs. track distance curves, were all similar to adult values. This indicates that the orderedcolumn system is innately determined and not the result of early visual experience. In these two mon-keys and a third one, sutured at two days and examined at 38 days, most of the cells seemed normalby adult standards, with simple, complex or hypercomplex receptive fields, showing about the samerange in orientation specificity as is found in adults. About 10—15% of cells showed abnormalitiessimilar to those seen in monkeys binocularly deprived of vision for longer periods. Furthermore, allthree deprived monkeys showed a decided lack of cells that could be influenced from both eyes,whereas a normal three-week-old control animal seemed similar to the adult, with binocular cellscomprising over half of the total population. A monkey deprived by binocular closure from the thirdto the seventh week also showed a diminution in number of binocularly influenced cells, suggestingthat the deprivation from birth resulted in a deterioration of innate connections subserving binocu-lar convergence. To be sure that the abnormalities in the deprived animals represented a deteriora-tion of connections, we recorded from 23 cells in a normal two-day-old monkey: here the oculardominance distribution of cells was about the same as in the adult, and the response characteristicsof the cells were normal by adult standards.
In the past few decades evidence has steadily particular, to the relative importance of genetic asmounted for an astonishing degree of specificity of opposed to postnatal environmental factors. In theconnections in the mature central nervous system. striate cortex of newborn and visually inexperi-Not surprisingly, more and more attention has enced kittens, we recorded several years ago frombeen given to the origin of this specificity and, in cells responding to specifically oriented stimuli,
from Journal of Comparative Neurology, Vol. 158, No. 3, December 1, 1974.

482 PART IV DEPRIVATION AND DEVELOPMENT
and found evidence suggesting that the orientationcolumns are already formed (Hubel and Wiesel,'63; Wiesel and Hubel, '65). Monkeys brought upfor several months with both eyes sutured closedlikewise have cells with orientation specificity inarea 17 (Wiesel and Hubel, unpublished). In thefirst paper of the present series (Hubel and Wiesel,'74) we found in adult and juvenile monkeys aremarkable degree of orderliness in the arrange-ment of orientation columns: it was thus natural topush the question of innate specificity a step fur-ther by asking whether the entire system ofcolumns is present at birth and hence probablygenetically programmed. This is the purpose of thepresent study.
METHODS
Six monkeys were used. Of these, two were normal andfour had both eyes sutured at various ages and for vary-ing periods (Table 1). Techniques for stimulating andrecording were generally the same as in previous papers(Hubel and Wiesel, '68, '74). For the experiment of Fig-ure 4B, in the 2-day-old normal monkey, the moving-slitstimuli were generated on a television screen using a spe-cially designed electronic stimulator, and the averageresponses for each orientation from 0° to 360° were plot-ted on-line using a PDP12 computer.
RESULTS
Because experiments designed to examine orienta-tion-shift sequences tend to be protracted, we
decided against attempting them in newborn mon-keys. In two monkeys we sutured both eyes closedand waited a few weeks before doing the acuteexperiments. One of these animals (Table 1, no. 1)had the eyes sutured two days after birth and wasrecorded from at 17 days. The second (Table 1, no.2) was delivered by Cesarian section and the eyessutured immediately; this monkey was born withthe eyes closed, and the lids had to be pried open inorder to trim the margins so that they could besutured. Careful examination of the lids in the en-suing weeks showed the suturing to be completelysuccessful (as was so for all animals in this series).Since no sign of the pupils or sclerae could be seenthrough the lids, it seemed unlikely that any imagesfell on the retinae. A third monkey was sutured attwo days of age and studied at 38 days; in this ani-mal our object was to examine receptive fields andocular dominance.
Graphs of receptive-field orientation versuselectrode-track position are shown for the firstmonkey in Figure 1 and for the second in Figure 2.These graphs are generally similar to those weobtained in normal adult (or juvenile) monkeysand indicate that the orientation-column system ispresent in the newborn monkey, with the samehigh degree of order.
Table 2 gives the results of measurementsmade from these graphs. This table is to be com-pared with a similar one for the normal adult(Hubel and Wiesel, '74, Table 1). As before, eachstraight-line sequence is listed separately. A com-
Table 1
Monkey
1
2
3
4
5
6
Type
binoc closure2-1 7 days
binoc closure (Cesarian)0-30 days
binoc closure2-38 days
21 day normal
binoc closure2 1-49 days
2 day normal
Type of study
orientation shiftsocular dominance distribution
orientation shiftsocular dominance distribution
receptive fieldsocular dominance distribution
ocular dominance distributionorientation specificity
ocular dominance distributionorientation specificity
ocular dominance distributionorientation specificity
Figure
1,3A
2,3B
3C
3D
3F
4

Orientation Columns in Newborn Monkeys 483
Fig.lA
Fig. 1. Graphs of receptive-field orientation vs. electrode-track^ distance for two penetrations in the right striate cor-tex of a baby monkey whose eyes were sutured closed from the second to the seventeenth day (when the recordingswere made). A Penetration no. 1. B. Penetration no. 2, about 0.6 mm from no. 1 and parallel to it. C. Reconstruc-tion of the two electrode traces. Lj-L3 are lesions made to identify the traces. Closed circles, ipsilateral eye; opencircles, contralateral eye. Open bar, contralaterally dominated activity in layer IV C, unoriented. (continued)
parison of the four averages (uncorrected and cor-rected slopes, angle/shift, horizontal distance/shift)in adult and visually naive baby monkeys showsvery little difference between the two, and in par-ticular there is nothing to suggest that the system oforientation columns is any coarser in the visuallynaive monkeys. For example, the average shift inthe baby monkey was 11.90°, compared with 11.91°for the adult. There is a suggestion that the hori-
zontal distance/shift may be smaller in the new-born monkey (33 JJ, compared with 43 (I for theadult), possibly indicating a thinner orientation-slab width in a brain that is smaller than adult size.In a previous study in monkeys (Hubel and Wiesel,'68), we observed that sharpness of tuning variesconsiderably, especially from one layer to the next.Similar variations were observed in these youngvisually naive monkeys. Our impression was that

484 PART IV DEPRIVATION AND DEVELOPMENT
Fig. 1 (Continued)
the cells in these animals, except for 10—15% whichappeared distinctly abnormal (see below), were onthe whole no less sharply tuned than are cells in theadult. Otherwise sequences such as the initial onesin the two penetrations in monkey 1, or the secondsequence of the first penetration in monkey 2, inwhich the average value of angle/shift was less than10°, would have been difficult or impossible to plot.
Because of the claim that in kittens a fewhours of visual experience can modify or affect the
subsequent orientation preference of cortical cells(Blakemore and Mitchell, 73; Pettigrew et al., 73),it is perhaps worth mentioning that minutes afterthe eyes were reopened the very first cell recordedin the monkey born by Cesarian section (no. 2)showed a precise orientation preference from theoutset. Moreover, if any orientation was used morethan any other to stimulate this cell while testing itwas the cell's own optimal orientation. Yet the nextcell, recorded a few minutes after the first, showed

Orientation Columns in Newborn Monkeys 485
Fig. 2. Graphs of receptive-field orientation vs. electrode-track^ distance for two penetrations in the right striatecortex of a baby monkey whose eyes were sutured closed from birth (by Cesarian Section) to the thirtieth day(when the recordings were made). A. Penetration no. 1. B. Penetration no. 2, about 0.25 mm from no. 1 and par-allel to it. C. Reconstruction of the two parallel electrode traces, about 0.3 mm apart. (Continued)
a new optimum shifted in a counter-clockwisedirection, the next showed a further shift, and soon. It would be difficult to imagine that the testingprocedure was in any way responsible for produc-ing the specificities that we observed.
In the course of recording from the first threemonkeys there were several groups of cells,amounting to about 10-15% of the total, that couldonly be driven with difficulty, or whose orientationseemed less critical than usual. On one of theseoccasions, at the outset of penetration 1 in monkeyno. 1, the level of CO2 in the expired air waschecked and found to be excessive. Within a fewmoments of correcting this the cells were respond-ing with an orientation precision seen in normaladult cells. It is thus likely that at least some of thecells were abnormal because of the general state ofthe animal. On the other hand, monkeys, like cats,
when deprived by bilateral lid suture for several,rather than a few, weeks have substantial propor-tions of such abnormal cells (see Fig. 3, C and F);we therefore assume that some of the abnormalcells in the present series reflect the early stages ofdeprivation effects. That these abnormal cells arerelated to immaturity is unlikely, since no such cellswere seen in the normal two-day-old monkey (seebelow).
In the present experiments our major aim wasto establish whether or not the ordered orientationcolumn system is present in visually naive animals,and we made no attempt to analyze receptive fieldsthoroughly or to make statistical comparisonsbetween these monkeys and adults. In particular,we did not make careful measurements of recep-tive field size. Nevertheless, several general com-ments can be made concerning receptive fields. We

486 PART IV DEPRIVATION AND DEVELOPMENT
Fig. 2. (Continued)
found examples of all three receptive-field types,simple, complex, and hypercomplex. Complexcells, as in the adult, constituted the great majorityof cells in the layers above and below layer IV. Sim-ple cells were typical in firing brisk "on" or "offresponses to properly oriented stationary slits, darkbars, or edges. Orientation specificity to stationarystimuli, which we have also seen in visually inex-perienced kittens, is of some interest in view of theassertion (Barlow and Pettigrew, '71; Pettigrew,'74) that it is direction specificity rather than orien-tation specificity that is present in visually naivekittens.
In Figures 1 and 2, the shifts in eye preferenceindicated by the periodic switching from contralat-eral eye (open circles) to ipsilateral eye (closed cir-cles) and back indicate that the system of ocular-
dominance columns develops by innate mecha-nisms and is present either at birth or within threeto four weeks of birth. It would be worthwhile totest this further by anatomical methods (Hubel andWiesel, 72).
What was very different in these two mon-keys, compared with normal adults, was the over-all degree of mixing of influence from the two eyes.Figure 3, A, B, and C shows ocular-dominance his-tograms for the three visually naive animals, ascompared with the histogram for a normal three-week-old control (Fig. 3D) and for the adult (Fig.3E). Compared with the normal monkey, the threedeprived animals show a marked reduction in thenumber of cells that could be binocularly influ-enced. The few binocular cells that were foundseemed quite normal, with fields in the two eyes in

Table 2
PenetrationExperiment no.
l.binoc. 1closure2-1 7 days 2
2. Cesarian 1bin. closure0-30 days 2
Averages
Averages,adult normals
Sequenceno.
12121212
Fielddistancefromfovea
deg44448888
Span ofsequence
deg87
174179
74107517299
Trac/^length
mm0.3950.7761.0160.2260.3390.2250.3390.185
Angle
(0)
deg3636414148484848
Horizontaltracf^length
mm0.3190.6280.7670.1700.2250.1500.2270.124
Slopeuncorrected
°/mm+219+273+ 183-284-320+219+219-134231±59222±83
Slopecorrected
°/mm+271+337+243-376-478+327+327-200320±86281±93
Numberof shifts
9161947676
Angle/shift
deg9.710.89.418.515.08.510.313.011.90±3.411.91±3.4
Horizontaldistance/shift
H353940433225322133.38±7.543.26±11.5
Figureno.
1
2
(Hubel and Wiesel, 74, Table 1)
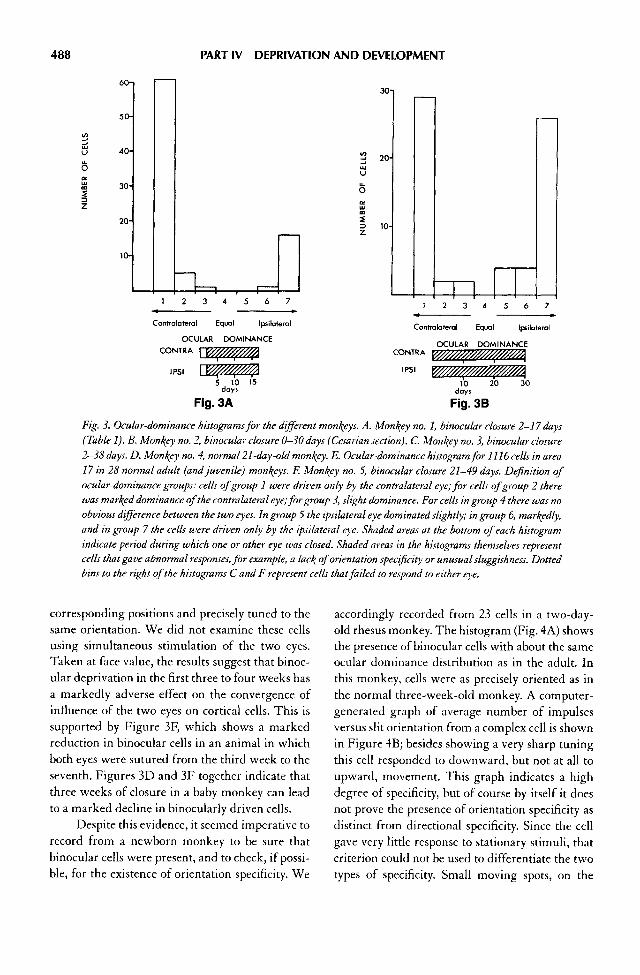
488 PART IV DEPRIVATION AND DEVELOPMENT
Fig. 3. Ocular-dominance histograms for the different moneys. A. Monkey no. 1, binocular closure 2-17 days(Table 1). B. Monkey no. 2, binocular closure 0-30 days (Cesarian section). C. Monkey no. 3, binocular closure2-38 days. D. Monkey no. 4, normal 21-day-old monkey. E. Ocular-dominance histogram for 1116 cells in area17 in 28 normal adult (and juvenile) monkeys. F. Monkey no. 5, binocular closure 21—49 days. Definition ofocular-dominance groups: cells of group 1 were driven only by the contralateral eye; for cells of group 2 therewas marked dominance of the contralateral eye; for group 3, slight dominance. For cells in group 4 there was noobvious difference between the two eyes. In group 5 the ipsilateral eye dominated slightly; in group 6, markedly,and in group 7 the cells were driven only by the ipsilateral eye. Shaded areas at the bottom of each histogramindicate period during which one or other eye was closed. Shaded areas in the histograms themselves representcells that gave abnormal responses, for example, a lacl^ of orientation specificity or unusual sluggishness. Dottedbins to the right of the histograms C and F represent cells that failed to respond to either eye.
corresponding positions and precisely tuned to thesame orientation. We did not examine these cellsusing simultaneous stimulation of the two eyes.Taken at face value, the results suggest that binoc-ular deprivation in the first three to four weeks hasa markedly adverse effect on the convergence ofinfluence of the two eyes on cortical cells. This issupported by Figure 3F, which shows a markedreduction in binocular cells in an animal in whichboth eyes were sutured from the third week to theseventh. Figures 3D and 3F together indicate thatthree weeks of closure in a baby monkey can leadto a marked decline in binocularly driven cells.
Despite this evidence, it seemed imperative torecord from a newborn monkey to be sure thatbinocular cells were present, and to check, if possi-ble, for the existence of orientation specificity. We
accordingly recorded from 23 cells in a two-day-old rhesus monkey. The histogram (Fig. 4 A) showsthe presence of binocular cells with about the sameocular dominance distribution as in the adult. Inthis monkey, cells were as precisely oriented as inthe normal three-week-old monkey. A computer-generated graph of average number of impulsesversus slit orientation from a complex cell is shownin Figure 4B; besides showing a very sharp tuningthis cell responded to downward, but not at all toupward, movement. This graph indicates a highdegree of specificity, but of course by itself it doesnot prove the presence of orientation specificity asdistinct from directional specificity. Since the cellgave very little response to stationary stimuli, thatcriterion could not be used to differentiate the twotypes of specificity. Small moving spots, on the

489
Fig. 3. (Continued)
other hand, evoked no responses; consistentresponses were seen only to lines one-third to one-half the width of the field, and the responsesimproved steadily with increasing line length, sug-gesting that the cell was indeed selective for lineorientation. In every way the behavior of this cell
was typical of that seen in upper layer cells in adultmonkeys.
During this penetration there were severalsequences of regular shifts in orientation. For thebinocular cells the positions of the fields in the twoeyes seemed in exact correspondence, and to within
Orientation Columns in Newborn Monkeys

490 PART IV DEPRIVATION AND DEVELOPMENT
OCULAR DOMINANCE
Fig. 4A. Ocular-dominance histogram for 23 cells in a nor-mal two-day-old macaque monkey.
a few degrees the optimal stimulus orientationswere identical. In these respects the cells were noless specific than cells in the adult monkey. Thoughit is not possible to make a detailed comparisonbetween newborn cats and monkeys, given such asmall sampling of cells, we were struck by theabsence, in the two-day-old monkey, of unrespon-sive, very sluggish, or non-oriented cells in theupper and lower layers, in view of the presence ofsuch cells in the ten-day-old kitten.
DISCUSSION
The present results show that the highly orderedsystem of orientation columns seen in adult mon-keys is innately determined and not the result ofvisual experience early in life. Just as striking as theordered sequences of orientation shifts was the pre-cision with which the orientations of cells could bedetermined; evidently a newborn monkey is in thisrespect virtually mature. This is perhaps not sur-prising since already at birth a macaque monkeyobserves and follows objects. Anatomical studieson the birth days of cells in monkey visual cortexlikewise indicate that, compared with otherspecies, the macaque at birth is already well-devel-oped (Rakic, 74).
The cat, in contrast, is visually very immatureat birth. It does not open its eyes for about the firstten days of life, and at that time the optic media arequite cloudy, so that the fundus cannot be visual-ized. The cortex is likewise anatomically immature(Cragg, 72). Presumably this relative immaturityof the newborn kitten contributes to the difficultiesone finds in observing orientation specificity. Nev-ertheless, the adult cat, like the monkey, has a well-ordered system of orientation columns (Hubel andWiesel, '63a, 74, Fig. 13). The individual cells, ex-cept perhaps for those in layer 4C, are also remark-ably similar in their basic properties in the twospecies. The similarity in the two visual systems
Fig. 4B. Computer graph, plotted on-line, of average response in impulses/stimulus (roughly 10 stimuli for eachpoint) vs. orientation. Each stimulus consisted of a long narrow slit (6°X 1/4°) automatically swept in one direc-tion across the receptive field in the orientation indicated. U = up. L = left. D = down. R = right. In addition toshowing a high degree of orientation selectivity, this cell was completely unidirectional in its responses.

Orientation Columns in Newborn Monkeys 491
increases our confidence that the orientation speci-ficity we saw in some cells in an eight-day-old kit-ten was genuine (Hubel and Wiesel, '63b), that itsabsence in other cells is a matter of maturation, andthat the development of orientation specificity withall its orderliness is similarly determined in the twospecies, i.e., genetically.
At present this confidence is not shared bysome others in the field (Barlow and Pettigrew, 71;Blakemore and Van Sluyters, '74; Pettigrew, '74).While is seems to be generally agreed that speci-ficity of responses is present in some cells in new-born kittens, this has been said to take the form ofa selectivity to direction of movement of virtuallyany shape of stimulus, whereas selectivity to lineorientation is absent at birth and develops onlywith experience (Barlow and Pettigrew, '71). Thepresent position of these authors is unclear, how-ever, since both Pettigrew ('74) and Blakemore('74) appear now to have found orientation specificcells in visually naive kittens. We have recentlyextended our experiments on visually naive kittensand have observed cells whose responses to a mov-ing specifically oriented line improve as the line islengthened and which also respond to the line if itis stationary, but only in the proper orientation(Hubel and Wiesel, unpublished). This is probablyconvincing enough evidence for orientation speci-ficity as opposed to a directional specificity of thetype seen in rabbit retina or cat tectum. In newbornmonkeys the columnar arrangement seems to beidentical to that found in the adult, and it is diffi-cult to imagine that we are observing two distinctsets of cells, in newborn monkeys and in adults,arranged in the same architectural pattern, espe-cially when their responses seem to be so similar.
An incidental and somewhat surprising find-ing in the present study was the marked decline inbinocularly activated cells following a few weeks ofbinocular deprivation. The resulting ocular domi-nance histogram is very similar to that resultingfrom strabismus in cat (Hubel and Wiesel, '65) andin monkey (Hubel and Wiesel, unpublished; alsoBaker et al., '74). In binocularly deprived kittensthere was some decline in the proportion of binoc-ular cells in the middle groups, but certainly nochange comparable to that seen in the present mon-keys (Wiesel and Hubel, '65). This lack of anymarked decline in binocular cells after binoculardeprivation complicated the interpretation of the
kitten squint histograms, as resulting simply from achronic lack of synchronous input from the twoeyes onto single cells (Hubel and Wiesel, '65); hereit was necessary to add the stipulation that there besome on-going input from single eyes. In the mon-key, this extra condition seems not to be necessary—apparently a simple lack of synchrony is enough.
ACKNOWLEDGMENTS
We are grateful for the use of the excellent facilities at the NewEngland Regional Primate Center and to the staff for theirassistance. In particular, we wish to thank Dr. F. Garcia for per-forming the Caesarian section. We thank Claire Wang andSharon Mates for histological assistance and David Freeman forhis help with electronics and computer programming. Thework was supported by NIH Grants 5ROI EYO 0605 and 5ROIEYO 0606, and a grant from the Esther A. and Joseph Klingen-stein Fund, Inc.
Literature Cited
Baker, F. H., P. Grigg and G. K. von Noorden 1974 Effects ofvisual deprivation and strabismus on the response of neu-rons in the visual cortex of the monkey, including studies onthe striate and prestriate cortex in the normal animal. BrainRes., 66: 185-208.
Barlow, H. B., and J. D. Pettigrew 1971 Lack of specificity ofneurones in the visual cortex of young kittens. }. Physiol.,218: 98-1 OOP.
Blakemore, C. 1974 Development of the mammalian visual sys-tem. Br. Med. Bull., 30: 152-157.
Blakemore, C., and D. E. Mitchell 1973 Environmental modifi-cation of the visual cortex and the neural basis of learningand memory. Nature, 241: 467-468.
Blakemore, C., and R. C. Van Sluyters 1974 Reversal of thephysiological effects of monocular deprivation in kittens:further evidence for a sensitive period. J. Physiol., 237:195-216.
Cragg, B. G. 1972 The development of synapses in cat visualcortex. Invest. Ophthal, 11: 377-385.
Hubel, D. H., and T. N. Wiesel, 1963a Shape and arrangementof columns in cat's striate cortex. J. Physiol., 765: 559—568.
1963b Receptive fields of cells in striate cortex of veryyoung, visually inexperienced kittens. J. Neurophysiol., 26:994-1002.
1965 Binocular interaction in striate cortex of kittensreared with artificial squint. J. Neurophysiol.,28:1041-1059.
1968 Receptive fields and functional architecture ofmonkey striate cortex. J. Physiol., 795: 215-243.
1972 Laminar and columnar distribution of geniculo-cortical fibers in the macaque monkey. J. Comp. Neur., 146:421-450.
1974 Sequence regularity and geometry of orientationcolumns in the monkey striate cortex. }. Comp. Neur., 158:267-295.
Pettigrew, J. D. 1974 The effect of visual experience on thedevelopment of stimulus specificity by kitten cortical neu-rones. J. Physiol., 237:49-74.
Pettigrew, J., C. Olson and H. B. Barlow 1973 Kitten visual cor-tex: short-term, stimulus-induced changes in connectivity.Science, 180:1202-1203.

492 PART IV DEPRIVATION AND DEVELOPMENT
Rakic, P. 1974 Neurons in rhesus monkey visual cortex: system- Wiesel, T. N., and D. N. Hubel 1965 Comparison of the effectsatic relation between time of origin and eventual disposi- of unilateral and bilateral eye closure on cortical unitdon. Science, 183: 425-427. responses in kittens. J. Neurophysiol., 28: 1029-1040.
AFTERWORD
That the word 'genetic' occurs more than once in this paper is regrettable ifunderstandable. What had not occurred to us was that a process resemblinglearning could possibly occur before birth. The fact that retinal ganglion cellsare active before birth, and that their activity can be synchronized by wavesof depolarization travelling across the retina, was undreamed of. We stillhave no idea whether the development of orientation selectivity depends onanything like that, but it is clear that 'innate' and 'genetic' are different bydefinition, and we should have been more careful. So for 'genetic' please read< • ^ 'iinnate !
We had had indications that orientation columns are present at birthbut wanted to press the point. If orderly sequences could be demonstrated,orientation columns and orientation selectivity must exist a fortiori.
We were surprised to learn that a monkey brought up with both eyesclosed for a few weeks would suffer a decline in binocularly driven cells.That, as we say in the paper, made us think a bit differently about the inter-pretation of our strabismus results, just as the alternating-occlusion experi-ments had.
And at last we had gotten started writing up monkey deprivation stud-ies. Still on the near horizon were the new anatomical methods, especiallyautoradiography, waiting to be applied to the subject of visual deprivation inmonkeys.

Chapter 25 • Plasticity and Development ofMonkey Ocular Dominance Columns •
FOREWORD
These papers, two of our longest—and that is saying a lot—represent one ofthe first successful uses of modern methods of experimental anatomy instudying the cortex of the newborn monkey and the effects of visual depri-vation. The previous work in kittens did not involve these newer anatomi-cal methods, and only came a little later, with the collaboration of CarlaShatz, Sievert Lindstrom, and Torsten (Brain Res, 1977, 131:103—116). Thefirst demonstration of ocular dominance columns using the Fink-Heimer-modified Nauta method, coupled with microlesions of identified geniculatelayers, immediately suggested the extension of those methods to the depri-vation work. That this took from 1969 to 1977 to accomplish is not too sur-prising: deprivation studies go slowly, especially if the experiments are doneseriatim rather than all together. The photography alone required weeks inthe darkroom and many hours of mounting the reconstructions.
These two lengthy papers represent an abandoning of our folie-a-deuxin favor of making it a trio. We were very fortunate in being joined by SimonLeVay in this work: unlike ourselves he was a trained card-carryinganatomist, with a wonderful British sense of humor, a very gentle disposi-tion, and a command of English as fluent as anyone we had ever met. (Notleast of his accomplishments was the winning of many bicycle races, and thewriting of his Ph.D. thesis in, of all languages, German.) We are lucky tohave had the chance to work with him, and find it sad, for the field of neu-roanatomy and the larger field of neuroscience, that a few years after leavingBoston for the Salk Institute in San Diego he left science to concentrate onsocial issues. The already underpopulated field of neuroanatomy could illafford to lose someone with his talents.
493

494 PART IV DEPRIVATION AND DEVELOPMENT
Plasticity of Ocular Dominance Columns in Monkey Striate Cortex
D. H. HUBEL, T. N. WIESEL AND S. LEVAY • Department of Neurobiology, Harvard Medical School,
25 Shattuck Street, Boston, Massachusetts
Ocular dominance columns were examined by a varietyof techniques in juvenile macaque monkeys in whichone eye had been removed or sutured closed soon afterbirth. In two monkeys the removal was done at 2 weeksand the cortex studied at 1 Vi years. Physiological record-ings showed continuous responses as an electrodeadvanced along layer IV C in a direction parallel to thesurface. Examination of the cortex with the Fink-Heimer modification of the Nauta method after lesionsconfined to single lateral-geniculate layers showed amarked increase, in layer IV C, in the widths of columnsbelonging to the surviving eye, and a correspondingshrinkage of those belonging to the removed eye.
Monocular lid closures were made in one monkey at2 weeks of age, for a period of 18 months, in another at 3weeks for 7 months, and in a third at 2 days for 7 weeks.Recordings from the lateral geniculate body showedbrisk activity from the deprived layers and the usualabrupt eye transitions at the boundaries between layers.Cell shrinkage in the deprived layers was moderate—farless severe than that following eye removal, moremarked ipsilaterally than contralaterally, and moremarked the earlier the onset of the deprivation. Inautoradiographs following eye injection with a mixtureof tritiated proline and tritiated fucose the labelling ofterminals was confined to geniculate layers correspon-ding to the injected eye. Animals in which the open eyewas injected showed no hint of invasion of terminals intothe deprived layers. Similarly in the tectum there was noindication of any change in the distribution of terminalsfrom the two eyes.
The autoradiographs of the lateral geniculates pro-vide evidence for several previously undescribed zonesof optic nerve terminals, in addition to the six classicalsubdivisions.
In the cortex four independent methods, physiolog-ical recording, transneuronal autoradiography, Nautadegeneration, and a reduced-silver stain for normalfibres, all agreed in showing a marked shrinkage ofdeprived-eye columns and expansion of those of the nor-mal eye, with preservation of the normal repeat distance(left-eye column plus right-eye column). There was asuggestion that changes in the columns were more severewhen closure was done at 2 weeks as opposed to 3, and
more severe on the side ipsilateral to the closure. Thetemporal crescent representation in layer IV C of thehemisphere opposite the closure showed no obviousadverse effects. Cell size and packing density in theshrunken IVth layer columns seemed normal.
In one normal monkey in which an eye was injectedthe day after birth, autoradiographs of the cortex at 1week indicated only a very mild degree of segregation ofinput from the two eyes; this had the form of parallelbands. Tangential recordings in layer IV C at 8 days like-wise showed considerable overlap of inputs, thoughsome segregation was clearly present; at 30 days the seg-regation was much more advanced. These preliminaryexperiments thus suggest that the layer IV C columns arenot fully developed until some weeks after birth.
Two alternate possibilities are considered to accountfor the changes in the ocular dominance columns in layerIV C following deprivation. If one ignores the above evi-dence in the newborn and assumes that the columns arefully formed at birth, then after eye closure the afferentsfrom the normal eye must extend their territory, invad-ing the deprived-eye columns perhaps by a process ofsprouting of terminals. On the other hand, if at birth thefibres from each eye indeed occupy all of layer IV C,retracting to form the columns only during the first 6weeks or so, perhaps by a process of competition, thenclosure of one eye may result in a competitive disadvan-tage of the terminals from that eye, so that they retractmore than they would normally. This second possibilityhas the advantage that it explains the critical period fordeprivation effects in the layer IV columns, this beingthe time after birth during which retraction is com-pleted. It would also explain the greater severity of thechanges in the earlier closures, and would provide aninterpretation of both cortical and geniculate effects interms of competition of terminals in layer IV C for terri-tory on postsynaptic cells.
INTRODUCTION
Physiological experiments in cats and monkeysvisually deprived from a young age indicate a cer-tain amount of plasticity in central-nervous path-
From Phil. Trans. R. Soc. Land. B. 278,377-409 (1977)

Plasticity of Ocular Dominance Columns 495
ways, especially at the cortical level. The nature ofthis plasticity is unclear. Connections present atbirth can certainly be made nonfunctional as aresult of deprivation, but whether there are actualmorphological changes is not known. Neither is itknown whether deprivation can lead to abnormalconnections, either through sprouting or by thepathological persistence of connections that exist atbirth and normally disappear postnatally.
In cats and monkeys deprived of vision in oneeye by lid suture early in life, the cells in area 17come to be strongly dominated by the eye thatremained open (Wiesel & Hubel 1963, 1971; Baker,Grigg & von Noorden 1974). This is illustrated inFigure 1 (left), an ocular dominance histogramfrom a series of experiments in normal adult mon-keys, and (right) in a histogram from a monkeydeprived by monocular suture at 2 weeks of age fora period of 18 months. The takeover by the goodeye at the expense of the bad seems to be duelargely to competition between the two eyes, sinceclosing both eyes produces effects that are farmilder than would be predicted if the binocularclosure were equal to the sum of two monocular
closures (Wiesel & Hubel 1965). The idea that com-petition is involved was borne out by the effects ofmonocular deprivation on geniculate responses,since here the physiological changes are rathermild, possibly because at this stage the inputs fromthe two eyes are largely kept separate, anatomicallyand physiologically, with little chance for competi-tion. There is, to be sure, considerable cell shrink-age throughout the layers connected to the closedeye, except for the monocular crescent representa-tion, but this may be secondary to a deterioration,through competition, of terminals in the cortex,and not a direct result of a lessening of input fromthe deprived eye (Guillery & Stelzner 1970;Guillery 1972a).
In the macaque monkey, binocular conver-gence in area 17 is delayed beyond what are proba-bly the first and second synaptic stages (Hubel &Wiesel 1968). Cells representing both these stages,with concentric receptive fields and 'simple' fields,are located in layer IV and are perhaps confined tothat layer. The bulk of the geniculate afferents ter-minate in the deep part of layer IV (layer IV C),where they segregate themselves into a series of
Fig. 1. Ocular dominance histograms in normal and monocularly deprived macaque monkeys. Histogram on the left is basedon 1256 cells recorded from area 17 in normal adult and juvenile rhesus monkeys. Cells in layer IV C are excluded. Histogramon the right was obtained from monkey no. 3 of the present series; the right eye was closed from 2 wee^s to 18 months, andrecordings were then made from the left hemisphere. Shading in histogram indicates cells with abnormal responses. (Cells ingroup 1 are driven exclusively from the contralateral eye, those in group 7 exclusively from the ipsilateral, group 4 cells areequally influenced, and the remaining groups are intermediate.)

496 PART IV DEPRIVATION AND DEVELOPMENT
roughly parallel alternating stripes, one set con-nected to the left eye, the other to the right. Giventhe apparent lack of convergence of input from thetwo eyes onto single cells in layer IV, we were anx-ious to learn whether monocular deprivationwould result in a redistribution of the afferent ter-minals to layer IV, or whether the boundarieswould prove to be relatively immutable, as theyseem to be in the lateral geniculate body. From theoutset, in our studies of monocular deprivation inmonkeys, we had been struck by the normality ofthe cortex in Nissl stains, and particularly by theabsence of any hint of bands of cell atrophy in layerIV C to parallel the marked cell shrinkage in thedeprived geniculate layers. This suggested that thegeniculate and cortical layers were reacting in avery different way to deprivation.
We began by recording from layer IV C inmonocularly deprived monkeys (lid sutured orenucleated). In addition to the technique of physi-ological recording there now exist three indepen-dent morphological methods for demonstratingocular dominance columns (Hubel & Wiesel 1972;Wiesel, Hubel & Lam 1974; LeVay, Hubel & Wiesel1975), and we were anxious to use these in examin-ing the deprived cortex. It turned out that the phys-iological and the three anatomical methods allrevealed very marked abnormalities, with clearevidence for an expansion of one set of columns atthe expense of the other set. We also studied thedistribution of geniculo-cortical terminals at birth,to learn whether the increase in the size of thecolumns corresponding to the open eye involvedthe formation of new connections or a regression ofconnections present at birth.
METHODS
Ten macaque monkeys were used, of which 9 wererhesus (Macaco, mulatto) and one, no. 7, a pig-tailedmacaque (M. nemestrina}. The procedures used inthese animals are summarized in table 1. Twomonkeys had one eye removed at 2 weeks of age;three had the lids of one eye sutured at 2 days-3weeks of age, and four served as controls. Resultsfrom one of the normal monkeys (no. 6) havealready been published (Wiesel, Hubel & Lam1974). In another control (no. 7), a 4/4-year-oldadult, the right eyelids had been sutured at 2Vzyears of age, and reopened 6 months later; behav-
ioural testing showed no visual defects in the eyethat had been sutured, and this animal was there-fore assumed, for our purposes, to be normal.
The lids of an infant monkey are surprisinglytranslucent; measurements showed that they atten-uate light by about 0.5 log units. The lid tissue isnevertheless cloudy enough to prevent any dark-light contours from falling on the retinas.
Brains were examined by one or more of fourprocedures:
1. Nauta method (Hubel & Wiesel 1972). In someanimals electrolytic lesions were placed withmicroelectrodes in single laminae of the lateralgeniculate nucleus; the brains were perfusedfour days later, cut in frozen section at 30 (J,mand stained by the Nauta—Fink—Heimer—Wiitanen method (Wiitanen 1969).
2. Autoradiography (Wiesel etal. 1974). In six mon-keys, one eye was injected with 2.0 mCi of amixture of tritiated proline and tritiated fucoseor with tritiated fucose alone. The brains wereperfused 14 days later, and 25 |Im thick frozensections were prepared for autoradiography.
3. Liesegang stain (Le Vay et al. 1975). Other sec-tions were examined by a reduced-silver stain,which has been shown to reveal ocular domi-nance columns in layer IV in normal juvenile oradult monkeys.
In conjunction with these special morpho-logical procedures, every fourth section wasstained by a Nissl method (Cresyl Violet), andalso some of the autoradiographs were counter-stained for Nissl substance. Cell size was deter-mined in the lateral geniculate and in layer IVof the cortex by measuring cross sectional areasof neuronal somata in which nucleoli were visi-ble. Planimetry was done on the profiles tracedin camera lucida, using an X— Y tablet.
4. Neurophysiology. Finally, most of these animalswere recorded from. In the monkeys used forNauta-degeneration studies, the geniculatelesions were placed by electrophysiologicalmonitoring of the electrode position. On theseoccasions we also looked for possible abnormal-ities in the responses, and for any signs of spreadof influence of the open eye beyond its normalterritory. In the cortex, recordings were made atan acute angle to the surface, usually at 30—40°.Because of the gentle convex curvature of the

Table 1
no.
identifyingnos. anddates pages figs. procedure
age whenproceduredone age studied physiology
TECHNIQUES IN CORTEX
Nauta autoradiographyreducedsilver
eye removals:1
2
lid closures
3
4
5
controls
6
7
8
9
10
LM 50, 19 June1972
LM 57, 17 Jan.1974
LM 58, 23 Apr.1974 157
202, 23 Dec. 1974
201
197, 28 Aug. 1973(W. H. & L.)
186,21 Aug. 1974
209, 30 Jan. 1975
230
243, 30 Oct. 1975
2, 4£, 6, 7 eye removal (rt)
3 eye removal (rt)
1,8«, 9, 11 lid closure (rt)14-18
Sb, 10, 19-21, lid closure (rt)27
22 lid closure (rt)
— normal
12, 13 late lid closure(rt)
— normal
23-25 normal
26 normal
2 weeks
2 weeks
2 weeks
3 weeks
2 days reopened7 weeks
—
2'/2 years reopened3 years
—
left eye inj.at 1 day
—
19 months X
18 months X
18 months X
3 weeks at 3 weeks7 months at 7 months
7 months —
juvenile —
4'/4 years —
juvenile (LGB —cell size)
1 week —
8 days X
X —
X —
X X (normal eye inj.)f
— —X (deprived eyeinj.)t
— X (deprived eye
inj.)t
— X (left eye inj.)$
— X (rt eye inj.)t
— —
— X (left eye inj.)§
— —
—
—
X
—
X
—
X
—
—
—
t 1 mCi L-proline [2,3-3H(N)], S.A. 30-50 Ci/mmol, and 1 mCi L-fucose [6-3H], S.A. 10-15 Ci/mmol, in 100 |J.l normal saline.
% 1.5 mCi prohne and 1.5 mCi fucose.
§ 2 mCi fucose.

498 PART IV DEPRIVATION AND DEVELOPMENT
exposed part of area 17, the electrode tended tobecome more and more tangential as itadvanced, so that if ideally positioned it took acourse precisely tangential to layer IV or V (seeFigure 3). This usually required severalattempts, with the electrode either first missinglayer IV completely or traversing it at too steepan angle to allow the recording of more thanone eye-dominance shift. Each shift wasmarked by an electrolytic lesion (1 (J.A X 1 s; d.c.,electrode negative). Recording procedures wereotherwise the same as described previously(Hubel & Wiesel 1968).
RESULTS: PART I. EYE REMOVAL
In the first two monkeys of the present series oneeye was enucleated rather than lid-sutured in orderto maximize the likelihood of producing changesin the cortical columns. In retrospect such a drasticoperation was not necessary, but it provided anopportunity to compare the effects of enucleationand eye closure. In these two animals the Nauta—Fink—Heimer was the only anatomical methodused.
Lateral Geniculate Body
PHYSIOLOGY Recordings were made in the lateralgeniculate bodies of the two eye-enucleated mon-keys (nos. 1 and 2), primarily in order to positionthe electrode for making electrolytic lesions in thenormal and deafferented layers, but also to learnwhether the deafferented layers had been invadedby fibres from the normal eye. Without this knowl-edge it was obviously difficult to interpret any pos-sible changes in the cortex.
In the geniculate contralateral to the normaleye, entrance of the electrode into the most dorsallayer was indicated by rich unit activity and briskresponses to visual stimulation. This persisted forabout 0.5 mm; the electrode then suddenly entereda virtually silent region, with no hint of responsesto stimulation of the normal eye and almost nospontaneous activity. As the electrode was furtheradvanced a region of rich activity with briskresponses was again suddenly encountered, andwas followed, again, by a silent region. Thissequence of events of course reflected the passageof the electrode first through a normal layer, thenthrough a deafferented one, and so on, as expected
from the well-known layering pattern of the genic-ulate. The position of the electrode in a given layerwas later verified histologically. The results suggestthat there was no significant reinnervation of cellsin the deafferented layers by terminals from thenormal eye.
HISTOLOGY As expected from previous studies(Minkowski 1920; Matthews, Cowan & Powell1960) there was profound transneuronal atrophy ofcells in the deafferented layers. This can be seen inFigure 2, Plate 1, for monkey 1, whose right eyewas removed at 2 weeks and the brain examined at18 months. The results of measurements of thecross sectional areas in the normal and deprivedlayers in the eye-removal and eye-sutured mon-keys are given in table 2; the ratio of areas in thetwo sets of layers (average of the two sides) was 2.80for monkey no. 1 and 1.86 for no. 2, the large val-ues in both cases reflecting the severity of the atro-phy. (We have no explanation for the difference inthese values.) The atrophy was uniform throughthe entire thickness of each deprived layer, with anabrupt transition from atrophic to normal at theboundaries between layers supplied by oppositeeyes. This by itself suggests an absence of anyextensive reinnervation of the deprived layers bythe remaining eye. Both physiological and anatom-ical results thus indicate that enucleation shortlyafter birth caused a permanent deafferentation ofthe corresponding geniculate layers, with no exten-sive sprouting between layers.
Striate Cortex
PHYSIOLOGY In the normal macaque monkey stri-ate cortex the geniculate afferents associated withthe two eyes are segregated as they terminate in theIVth layer in such a way that cells innervated bythe left and right eyes form parallel alternatingbands about 400 |Im wide. This is the basis for theocular dominance columns, regions in which oneor other eye dominates, and which are mostsharply defined in layer IV C but extend throughall layers of the cortex. Thus in a typical tangentialpenetration the electrode moves from a region inwhich one eye gives the best responses to another inwhich the other eye dominates. In the IVth layerthe cells are strictly monocular and their segrega-tion according to eye input is very sharp; conse-quently transitions here are extremely abrupt. If

Plasticity of Ocular Dominance Columns 499
Fig. 2. Coronal sections through lateral geniculate bodies of monkey no. 1, whose right eye was removed at 2weeks, and the brain examined at 19 months. Brain embedded in celloidin; cresyl violet stain.
there is any overlap at all, the regions must be 25Jim or less. In all our normal material we have seenno difference in widths of bands innervated by thecontralateral as opposed to the ipsilateral eye: in thebinocular part of area 17 (i.e. outside the represen-tation of the temporal crescents) the two eyes seemto make almost exactly equal contributions. Thisequality is doubtless related to the symmetry sug-gested by the left histogram of figure 1, in whichgroups I—III are about as well represented asgroups V—VII.
In the enucleated animals we were mainlyinterested in learning whether any changes hadtaken place in this arrangement of layer IV C ocu-lar-dominance bands. If not, then in a tangentialpenetration one should expect an alternationbetween silent regions and regions of responsive-ness to the remaining eye, as was found in the lat-eral geniculates of these animals. The results, infact, were very different. Figure 3, Plate 1, showsthe reconstruction of a long (13.3 mm) tangentialpenetration through the striate cortex of monkeyno. 2. In the layers above IV all of the cells encoun-tered responded normally to stimulation of the
remaining (left) eye. This was not entirely unex-pected, since normally the majority of these cellsare binocularly innervated. What was more sur-prising was to find that the cells in layer IVresponded well to left-eye stimulation over theentire 3.7 mm during which the electrode was inthat layer (3.0 mm entering the cortex, and 0.7 mmleaving). The recordings were typical for layer IVC, showing rich background activity, responsivecells with centre-surround receptive fields, and noclear tendency for the cells to prefer oriented linestimuli. There were no silent areas, only some wax-ing and waning of the evoked activity as the elec-trode advanced, perhaps more than is seennormally.
In the other eye-removal monkey (no. 1), thetwo penetrations in area 17 gave results that wereconsistent with this in showing continuous re-sponses through the entire extent of layer IV C.The angle to the surface was too steep and the dis-tance traversed in layer IV therefore too short topermit any conclusions to be drawn from this ani-mal alone, but taken together, the results frommonkeys nos. 1 and 2 suggested an expansion of the
Plate 1

500 PART IV DEPRIVATION AND DEVELOPMENT
Table 2. Comparisons ofGeniculate Cell Sizes and of Cortical Column Areas
(LATERAL GENICULATE BODY 50 CELLS/LAYER)
monkey no.
1. rt. eye removal
2. rt. eye removal
3. rt. eye closure
4. rt. eye closure
7. 'control' (late closureright eye)
8. control
side
L
R
L
R
L
R
L
R
L
R
L
R
layer
65
65
65
65
65
65
65
65
65
65
65
65
mean area,fJm2
5^§135
15954
91170
17193
128184
150108
156197
184154
196188
229194
268258
248280
s.d.,film2 ratio
36 2'65
s -11 >-
n '-"
£ >•«
28 '••'8
£ >-
I -
H 1.04
48 U8
6868 L04
7054 1.12
cortex, ratio ofsignificance f column areas f
<0.01
<0.01
<0.01
<0.01
<o.o, 277
<0.01 ~~
<o.o, L6°
<0.0! '-97
N.S.
<o.oi '-05
N.S.
<0.02
t Welch test.
^Swollen/shrunken (see table 3).
§ Right eye layer italics.
II Larger/smaller.
territory occupied by the columns of the normaleye at the expense of the set corresponding to theenucleated eye. One might, of course, explain thecontinuous IVth layer activity by supposing thatthe electrode had approached this layer in a direc-tion almost parallel to the borders separating thebands, and had stayed in a single left-eye bandthroughout the entire penetration. In many previ-ous tangential penetrations in normal monkeys wehave never, in fact, recorded so long a sequence ofcells dominated by one eye. In any case, theanatomical results to be described below rule outsuch an explanation.
MORPHOLOGY An apparent disappearance of ocu-lar-dominance stripes in layer IV C, in physiologi-cal recordings, could conceivably be due not to atakeover by the good eye, but rather to a simpledropping out (i.e. death) of the cells in these stripes,with either an absolute shrinkage of cortex to halfits surface area or a spreading out of the remaininglayer IV C cells together with an associated thin-ning of the layer. A routine examination of themorphology of the striate cortex using a Nissl stainfailed to show any hint of such changes (Fig. 3); thetotal extent of the striate cortex was normal, therewas no obvious reduction in thickness or cell den-
15
29
33
42
53

Plasticity of Ocular Dominance Columns 501
Fig. 3. Electrode trac\ in a tangential penetration through the left striate cortex of monkey no. 2; right eyeremoved at 2 tveef^s and the recordings made at 18 months. The electrode passed antero-posteriorly through layerIV C for a total of 3.7 mm, during which responses were continuously obtained from the remaining (left) eye.Cresyl violet. Anterior is to the right; parasagittal section. Circle at end oftract^ indicates electrolytic lesion.
sity in any of the layers, and layer IV C appeareduniform along its horizontal extent, with cells ofnormal size. In short, any reorganization hadtaken place in such a way as to leave no trace inroutine histology.
In a previous study in normal monkeys theocular dominance stripes in layer IV were visual-ized and reconstructed in serial sections by makinglesions restricted to single laminae in the lateralgeniculate body and later staining the cortex fordegenerating terminals by a modified Nautamethod (Hubel & Wiesel 1972). In any one sectionin these normal monkeys there were patches of ter-minal degeneration interrupted by equally widepatches with no degenerating terminals. Figure ^a,Plate 1, shows an example of the cortical degenera-tion pattern in a normal monkey after a smalllesion restricted to the most dorsal geniculate layer.Regions of layer IV C containing terminals aresharply delineated from the terminal-free gaps,which are bridged by only an occasional degener-ating afferent axon running between one zone ofdegenerating terminals and another. Figure 5
shows a serial reconstruction of the entire, neces-sarily relatively small, area of cortex containingdegenerating terminals, to illustrate the character-istic striped pattern of normal ocular dominancecolumns, each with a width of about 400 |Im(Hubel & Wiesel 1972, Figs. 8 and 10).
Similar single-layer lesions were made inboth enucleated animals. Figure 4£ shows theresult of a geniculate lesion in layer 3 of monkeyno. 1, on the left side, ipsilateral to (and innervatedby) the normal eye. In contrast to what was foundin the normal animals, the terminals in the cortexwere distributed over virtually the entire regionreceiving input from the area of the lesion. Withinthis region there were variations in the density ofdegeneration, but gaps free of degenerating end-ings were only occasionally seen and were usuallyill-defined and small, only a fraction of the size ofthe terminal-free gaps seen normally. A typical gapis shown in Figure \b. Except for the waxing andwaning and the small gaps in terminal degenera-tion, the picture was reminiscent of the continuousdegeneration seen after a lesion in a normal mon-
Plate 1

502 PART IV DEPRIVATION AND DEVELOPMENT
Fig. 4. Darkjleld photographs ofNauta—Fin^—Heimer stained stri-ate cortex in monkeys followinglesions confined to a single geniculatelayer, (a) Normal monkey, followinglesion in layer 6 of the left geniculate.(monkey no. 12 in Hubel & Wiesel1972; cf. figure 5 of present paper andFigures 7-10 in Hubel & Wiesel1972). (b) 19-month-old monkey inwhich right eye was removed at 2wee^s (monkey no. 1 of presentpaper.) Lesion was in layer 3 of leftgeniculate, this layer being inner-vated from the remaining (normal)eye; cf. figure 6. Each photographincludes white matter, near the bot-tom, but does not quite reach layer Iabove. In a the band of degenerationin IV C is about equal in width to thegap between. In b the gap betweenbands is ill defined and smaller thanthe band to the right.
key involving two adjacent dorsal layers (Hubel &Wiesel 1972).
A serial reconstruction of the entire region ofterminal degeneration associated with this lesion, inmonkey no. 1, is shown in Figure 6. No attempt hasbeen made to illustrate the variation in terminaldensity; the regions free or almost free of degener-ating fragments have simply been shown as gaps. Astriped pattern is strongly suggested, with a drasticnarrowing of one set of stripes and a probablewidening of the other. The combined widths of theexpanded and shrunken columns, assuming a 30%shrinkage in processing the tissue, is roughly 800(J,m, a value close to the normal (see below).
Lesions in this monkey were also made ingeniculate layer 6 on the side contralateral to theenucleated eye, i.e. a deafferented layer. The result-ing degeneration in the cortex was very weak, and
was confined to small narrow patches separated bywide regions with no degeneration. The picturewas thus the complement of that observed after alesion in a layer corresponding to the surviving eye.A reconstruction of one of these projection areas isshown in Figure 7.
Very similar results were found in monkeyno. 2 both for normal layer lesions and for deaffer-ented layer lesions.
Thus in both the recordings and the Nautadegeneration studies it was as though the genicu-late afferents serving the normal eye had invadedand virtually taken over the layer-IV territory ofthe enucleated eye. As Part II shows, similar resultswere found in animals with prolonged lid suture.Part III, however, will present evidence that castsdoubt upon the notion of an invasion of one regionby another, at least in any literal sense.
Plate 1

Plasticity of Ocular Dominance Columns 503
Fig. 5. Normal monkey. Reconstruction of cortical area ofNauta degeneration, made from 121 serial parasagit-tal sections. The projection site in area 17, shaded in the drawing on the upper right, corresponds to the layer 6gemculate lesion on the upper left. Each interrupted horizontal line in the reconstruction is derived from a sin-gle cortical section, by graphically straightening the shaded part of the mushroom shaped calcarine cortex, andtracing the regions of degeneration (cf. Fig. 4a). When these lines are assembled the result is a surface view oflayer IV C bands, which appear as roughly parallel stripes separated by equal-size gaps, with a repeat distanceof about 0.8 mm (Hubel & Wiesel 1972, monkey no. 12, Figures 8—10).
Part II. Monocular Lid Suture
In three monkeys (Table 1, nos. 3—5) the lids of oneeye were sutured closed in the first few weeks oflife. Nos. 3 and 4 were expressly prepared to exam-ine the results of long standing deprivation. No. 5was part of a study on the time course of sensitivityto deprivation: an eye was closed from 2 days to 7
weeks and then reopened, and the animal wasexamined at 7 months. This monkey is mentionedin the present paper as a further illustration ofmonocular deprivation effects, because there is lit-tle likelihood that the reopening of the eye had anyinfluence on the outcome.
Four control animals (nos. 6—10) are included:nos. 6 and 7 provide examples of normal cortical

504 PART IV DEPRIVATION AND DEVELOPMENT
Fig. 6. Reconstruction of an area of terminal degeneration similar to that of Figure 5, but in a 19-month-oldmonkey (no. 1) in which the right eye was removed at 2 weeks. Lesion in layer 3 of the left lateral geniculate,supplied by the left (normal) eye. Compared with Figure 5, the regions of degeneration in the reconstruction aremostly much wider and the gaps narrower, the repeat distance being unchanged.
autoradiography; no. 7 (also part of the time-coursestudy) had a six month period of monocular closureat 2/4—3 years, but no abnormalities were found in avariety of behavioural tests; no. 8 was used for deter-mination of normal geniculate cell size; nos. 9 and 10represent a preliminary study of eye dominancecolumns in newborn and very young monkeys.
For the animals with eye closure two newmethods were available for demonstrating oculardominance columns, besides physiological record-
ing and Nauta degeneration. These were, first,transneuronal autoradiography (Wiesel, Hubel &Lam 1974), in which radioactive compounds areinjected into one eye and the cortex later examinedautoradiographically for label transported up tolayer IV of the striate cortex. The second methoddepends on preparing of sections tangential tolayer IVC with a reduced-silver stain (LeVay et al.1975). The four methods—physiological recording,Nauta degeneration, autoradiogaphy, and reduced-

Plasticity of Ocular Dominance Columns 505
Fig. 7. Reconstruction similar to that of figure 6 and in the same monkey, following a lesion in a deafferentedgeniculate layer (no. 6 on the left side). Now the areas of degeneration are shrunken and the gaps widened.
silver stain—are entirely independent, relying asthey do on a nerve fibre's ability to conduct impulsesand on synaptic integrity, on degeneration follow-ing injury, on axonal transport, and on the ability ofcertain fibres to take up a particular stain.
Lateral Geniculate Body
PHYSIOLOGY In monkeys with monocular eye clo-sure one could observe responses from thedeprived geniculate layers to stimulation of the eyethat had been closed—something that was obvi-ously impossible in the eye removal animals. Lat-eral-geniculate recordings were made only in mon-
key no. 3, in the course of making lesions for theNauta degeneration studies. About a dozen cellswere recorded from the deprived layers: theseseemed to have normal receptive field properties,giving vigorous responses to stimulation withsmall spots. Transitions from normal to deprivedlayers and back, as judged by responses, wereabrupt, with no hint in the deprived layers of anydriving from the normal eye. The sample of unitrecordings was obviously too small and our exami-nation too cursory to permit any conclusions exceptthat there were no gross physiological abnormali-ties, and no signs of invasion of the deprived layersby the fibres from the normal eye.

506 PART IV DEPRIVATION AND DEVELOPMENT
HISTOLOGY: NISSL STUDIES Nissl stained sectionsthrough the lateral geniculate bodies of monkeysnos. 3 and 4 showed moderate pallor and shrinkagein the layers corresponding to the deprived eye.These results are thus similar to those seen byHeadon & Powell (1973). Not surprisingly, thechanges were far less marked than those followingeye removal. The black and white photomicro-graphs of figure 8, plate 2, are perhaps deceptive,however, since they show the changes much lessvividly than would be expected from simpleinspection of the sections at low power, perhapsbecause the colours help bring out the differencesin staining between normal and deprived layers.Measurements of cell size are given in table 2: theratio of cross sectional areas in presumably normalvs. deprived layers was 1.46:1 for monkey no. 3 and1.23:1 for no. 4. This is to be compared with anaverage of 2.33:1 for the two eye-removal monkeys.
That the deprivation effects were more severein monkey no. 3 than in no. 4 can be seen both infigure 8 and in the cell measurements. In the cor-tex, as described below, the effects were likewisemore severe in monkey no. 3. These differencescould either be related to the week's difference inthe time of eye closure or to the difference in dura-tion of closure. Other results in the cortex ofdeprived and newborn monkeys suggest, however,that in eye closures lasting more than a few monthsthe time of closure is more important than theduration.
In both of these eye sutured animals (nos. 3and 4) the geniculate changes were most markedon the side ipsilateral to the suture—indeed, in thecontralateral sections of monkey no. 4 (figure 8) itis not easy to see the changes at all. A similar asym-metry was seen by Headon & Powell (1973). Curi-ously, no difference between the sides showed up inthe cell measurements, perhaps again because mildeffects are expressed more in cell pallor than inshrinkage. A difference in susceptibility of the twosides, with more severe effects ipsilaterally, hasbeen observed in many monkeys besides those ofthe present series. It also occurs in the corticalcolumns (see below), and there seems to be littledoubt that it is genuine. (The interpretation of theapparently significant difference in a control mon-key (Table 2, no. 7), in cell sizes of layers 5 and 6 onthe right side, is not clear.)
In describing the differences in cell size in thevarious pairs of layers it has been tacitly assumedthat it is shrinkage in the closed-eye layers that pro-duces the disparity. Whether there is an enlarge-ment of cells in the normal-eye layers is difficult todetermine because of the large variations in aver-age cell size from one brain to the next, related pos-sibly to small differences in technique. Obviouslythis is a question of some interest, given theincrease in width of the corresponding corticalcolumns, to be demonstrated below.
HISTOLOGY: AUTORADIOGRAPHY In monkeys nos. 3,4 and 5 one eye was injected with radioactive label.The resulting autoradiographs in the lateral genic-ulate bodies are illustrated in darkfield, in Figure 9,Plate 3, for monkey no. 3 and Figure 10, Plate 4, forno. 4. There was heavy labelling of the appropriatelayers, even in monkey no. 4, whose closed eye hadbeen injected. In both animals the label in the lay-ers corresponding to the non-injected eye was onlyslightly above background levels. This is well seenin Figure 11, Plate 4, a higher power light-fieldphotomicrograph from the geniculate of monkeyno. 3 (normal eye injected). Here the deprivedlayer, to the right, showed none of the grain clumpswhich indicate the positions of the optic nerve ter-minals belonging to the injected eye. Thus theautoradiography gave no indication of transgres-sion of terminals beyond the normal boundaries.Obviously this was important in interpreting possi-ble changes in the cortical columns.
A consistent finding in these autoradiographsof the lateral geniculate body was an accumulationof grains in several regions besides the classical 6layers. In Figure 9 one can see a bilateral accumu-lation of grains in a narrow band between layers 2and 3, best seen on the left in light field, and on theright in dark field. Also there is a band of grains ofcontralateral origin ventral to layer 1 on the right,best seen in light field, and a clump of ipsilateralorigin near the hilum, interrupting and lying ven-tral to layer I (left, dark field). Higher power exam-ination suggested that the grains were mostly interminals rather than in fibres. These additionalinputs to the geniculate were not seen at more cau-dal levels (Figure 9). They are discussed further inPart III, where similar aggregations are describedin a normal newborn animal.

Plate 2
Fig. 8. Coronal Nissl-stained sectionsthrough lateral geniculates of (a)Monkey no. 3, right eye closed at 2wee^s for 18 months, (b) Monkey no.4, right eye closed at 3 weeks for 7months. Note that the atrophy of thelayers receiving input from the closedeye is more marked on the ipsilateral(right) side and more marked in athan in b. Cresyl violet; frozen sec-tions. (Continued)
507

Fig. 8. (Continued)
508
Plate 2

Plasticity of Ocular Dominance Columns 509
Plate 3
Fig. 9. Autoradiographs of genicu-lates from monkey no. 3 (right eyeclosed at 2 wee\sfor 18 months) fol-lowing injection of label into left(normal) eye. Coronal sections.Upper half, light-field, counter-stained with cresyl violet. Lowerhalf, dar1{-field of same sections. Notethe band of label between classicallayers 3 and 2, in the dart(-field pic-ture on the right (comparefigure 24,layer d). (Continued)
Superior ColliculusThe distribution of optic-nerve terminals from thetwo eyes in the superior colliculus takes a very spe-cial form (Hubel, LeVay & Wiesel 1975). In thesuperficial grey, where the bulk of the input ends,the contralateral terminals tend to make up a con-tinuous band whose lower half frequently containscavities, and whose lower border is irregular andscalloped. The ipsilateral terminals tend to form a
row of clumps which are concentrated at a levelmatching these holes and scallops; thus they appearto be embedded in the deep part of the contralat-eral input. Towards the foveal representation theipsilateral input also comes close to the surface, inpatches that appear to alternate with the contralat-eral input. On the whole the contralateral inputprobably exceeds the ipsilateral, and while theextent to which the two overlap is not clear

510 PART IV DEPRIVATION AND DEVELOPMENT
Fig. 9. (Continued)
anatomically, recordings indicate that the two eyesare not kept entirely separate.
We were curious to learn whether the eye clo-sures had produced any changes in this patchy dis-tribution of terminals, and especially whetherthere were signs of an expansion of the territory ofone eye or contraction of that belonging to theother. Autoradiographs showed no hint of any
changes: as in the geniculates, the distribution ofterminals was normal in monkeys nos. 3 and 4. Insections counterstained with cresyl violet an exam-ination of cells showed no hint of shrinkage orchange in cell packing density in regions whichfrom the autoradiography were known to receiveinput from the closed eye. Thus from the anatom-ical studies the superior colliculi seemed to be nor-
Plate 3

Plasticity of Ocular Dominance Columns 511
Fig. 10. Autoradiographs from genie-ulates of monkey no. 4 (right eyeclosed at 3 weeks, for 7 months) fol-lowing injection of label into right(lid-sutured) eye. Upper half, light
field; lower half, dart^ field, of samesections. Counterstained with cresylviolet. (Continued)
mal. We have not made recordings in the colliculiof deprived monkeys.
Striate Cortex
CONTROL MONKEYS (Nos. 6 AND 7): MORPHOL-OGY The brains of monkeys nos. 3, 4 and 7 werecut in tangential sections in the region of theexposed striate cortex (the operculum). Brains ofmonkeys nos. 3, 4, 6 and 7 were also cut in sections
that were either parasagittal or in a plane tippedback 45° from the coronal; in most places they wereroughly perpendicular to cortex, and passedthrough the calcarine fissure. We begin by showingautoradiographs of presumably normal cortex(monkeys nos. 6 and 7) following injection of oneeye.
The transverse section from monkey no. 7,shown in Figure \2a, Plate 5, is perpendicular tothe occipital operculum (i.e. to the exposed surface
Plate 4

512 PART IV DEPRIVATION AND DEVELOPMENT
Fig. 10. (Continued)
of the occipital lobe) and to part of the underlyingcalcarine fissure: almost all of the cortex in this sec-tion is striate, ipsilateral to the injected eye. LayerIV as expected shows a series of patches rich inlabel (brightly glowing in this darkfield photo-graph) interrupted by label free gaps. In this figureabout 56 pairs of columns can be counted.
Figure \2b shows a parasagittal sectionthrough the calcarine fissure of monkey no. 6, con-
tralateral to the injected eye. Layer IV C is cut inmost places transversely, forming a large irregularring surrounding a smaller one, again with patchesof label separated by gaps as in Figure \2a. To thelower right the two rings join, and here IV C is cuttangential! y, forming parallel stripes arranged inan oval (as occurs in Figure 13). The upper rightpart of the outer ring of layer IV C in the figure iscontinuously labelled: this is the temporal crescent
Plate 4
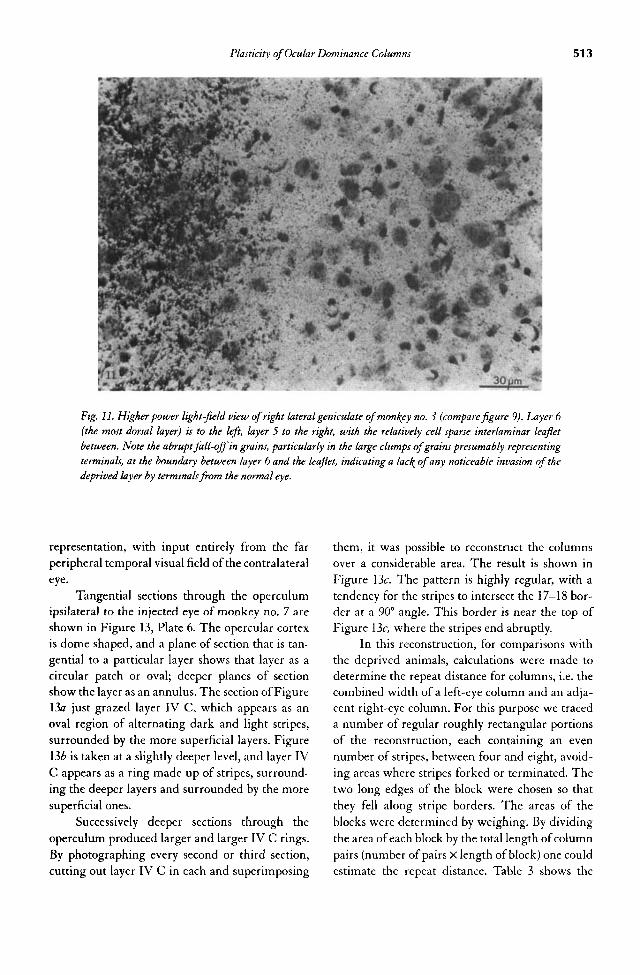
Plasticity of Ocular Dominance Columns 513
Fig. 11. Higher power light-field view of right lateral geniculate of monkey no. 3 (compare figure 9). Layer 6(the most dorsal layer) is to the left, layer 5 to the right, with the relatively cell sparse interlaminar leafletbetween. Note the abrupt fall-ojf in grains, particularly in the large clumps of grains presumably representingterminals, at the boundary between layer 6 and the leaflet, indicating a lac\ of any noticeable invasion of thedeprived layer by terminals from the normal eye.
representation, with input entirely from the farperipheral temporal visual field of the contralateraleye.
Tangential sections through the operculumipsilateral to the injected eye of monkey no. 7 areshown in Figure 13, Plate 6. The opercular cortexis dome shaped, and a plane of section that is tan-gential to a particular layer shows that layer as acircular patch or oval; deeper planes of sectionshow the layer as an annulus. The section of Figure13« just grazed layer IV C, which appears as anoval region of alternating dark and light stripes,surrounded by the more superficial layers. FigureI3b is taken at a slightly deeper level, and layer IVC appears as a ring made up of stripes, surround-ing the deeper layers and surrounded by the moresuperficial ones.
Successively deeper sections through theoperculum produced larger and larger IV C rings.By photographing every second or third section,cutting out layer IV C in each and superimposing
them, it was possible to reconstruct the columnsover a considerable area. The result is shown inFigure 13<r. The pattern is highly regular, with atendency for the stripes to intersect the 17-18 bor-der at a 90° angle. This border is near the top ofFigure 13<r, where the stripes end abruptly.
In this reconstruction, for comparisons withthe deprived animals, calculations were made todetermine the repeat distance for columns, i.e. thecombined width of a left-eye column and an adja-cent right-eye column. For this purpose we traceda number of regular roughly rectangular portionsof the reconstruction, each containing an evennumber of stripes, between four and eight, avoid-ing areas where stripes forked or terminated. Thetwo long edges of the block were chosen so thatthey fell along stripe borders. The areas of theblocks were determined by weighing. By dividingthe area of each block by the total length of columnpairs (number of pairs X length of block) one couldestimate the repeat distance. Table 3 shows the

Plate 5
Fig. 12. Dar\-field autoradiographs ofstriate cortex in normal adult monkeys following right-eye injection ofradioactive fucose-proline mixture 2 weeJ^s before, (a) Transverse section through right striate cortex, perpendi-cular to occipital operculum, in a plane normal to the sagittal, tipped bacJ^from coronal by about 45°. Labelledbands can be clearly made out in layer IV C. In the finger-lifye gyrus, the opercular cortex above and the supe-rior banf( of the calcarine fissure below are separated by a brightly labelled continuous band; this represents theoptic radiations. (The lower ban\ of the calcarine fissure has fallen away.) Medial is to the right. (Monkey no.7.) (b) Parasagittal section through the buried calcarine cortex contralateral to the injected eye; most of the cor-tex is cut in a plane perpendicular to the layers, but onefold is intersected tangentially, and here the layer IV Ccolumns are seen as parallel bands. The upper tier in layer IV A can just be made out in most places. The stretchof continuous label in layer IV C in the upper right part of the ring represents the temporal crescent. Anterior isup and to the right; the operculum would be just to the left of the figure. (Monkey no. 6.)
514

Plasticity of Ocular Dominance Columns 515
Table 3. Estimation of Column Areas
monkey no.
3 (157)4 (202)
7 (186) ('control')
hemisphere
leftleftrightright
eyeinjected
leftrightrightright
eye closed
rightrightright(right)§
combinedwidth, /Jm
892817831848
ratiof
2.241.451.611.05
shrinkagedeprivedcolumns (%)
381823—
ratiof
2.771.601.971.05
shrinkagedeprivedcolumns (%)
472333—
t Determined from small regular patches within reconstruction.
£ Determined from virtually the entire reconstructions (figures 13, 15, 20).
results for monkey no. 7 and also for eye-closedmonkeys nos. 3 and 4 (see below). The repeat dis-tance for monkey no. 7 was 848 |J,m.
The relative areas occupied by the two sets ofcolumns were estimated from the reconstruction offigure \3c by tracing the borders, cutting apart thetwo sets, and weighing them. The difference inweight amounted to 5%, the contralateral setexceeding the ipsilateral (Table 3, ratio:}:). This dif-ference is probably not significant. Similar deter-minations were made from the selected regularblocks described above, with a difference again of5% (Table 3, ratio|). This figure agrees well with asimilar comparison made previously using thereduced silver method in another monkey (LeVayetal. 1975). Thus the anatomy and physiology bothsuggest that in the binocular representation of stri-ate cortex the contributions of the two eyes areabout equal.
MONKEY No. 3: PHYSIOLOGY In this monkey theright eye was closed from 2 weeks to age 18months. The left eye was then injected. A weeklater 5 lesions were made in the right lateral genic-ulate body for Nauta studies. A week after that,finally, four penetrations were made in a directionalmost parallel to the layers, in an effort to havelong traverses through layer IV so that points of eyetransition could be noted and marked with elec-
trolytic lesions. In two of the penetrations (nos. 2and 3) the tilt was sufficient so that more than oneeye transition occurred in layer IV.
As expected from the eye-removal results andfrom previous work in cats, the great majority ofcells were strongly dominated by the normal eye.In the layers outside of IV only about one-fifth ofcells were influenced from the deprived eye, manyof these weakly but with the normal orientationspecificity. The ocular dominance histogram fromthis monkey has already been shown in Figure 1.(A detailed account of the physiological propertiesof the cells in these animals will be presented else-where.)
In layer IV C, on the contrary, there wereperiods in which the activity was dominatedstrongly or completely by the deprived eye. Thetransitions from dominance by one eye to domi-nance by the other were as abrupt as in normalmonkeys. In regions of domination by the deprivedeye the responses seemed, surprisingly, to be quitenormal, with the usual briskness and lack of anyorientation specificity. These regions were never-theless all distinctly shorter than those in which thenormal eye dominated. Both the micromanipula-tor readings and the histological reconstructionshowed that the spans in the left (normal) eyeregions were 2—3 times as long as the spans in theright-eye regions. This is illustrated in Figure 14a,
Fig. 13. (following page) Normal monkey (no. 7). Autoradiographs tafyen in dar/^ field, of tangential sections
through the dome shaped exposed surface of the right occipital lobe (operculum), ipsilateral to the injected (right)
eye. The section shown in (a) passes tangential to layer IV C, which is seen as a series of light stripes, represent-
ing the labelled right-eye columns, separated by gaps of the same width representing the left eye. (b) is some 160
Urn deeper than a, passing tangential to layer V and showing layer IV C as a ring ofdart^ and light stripes into
which the oval of a can befitted, (c) is a reconstruction made by fitting together eight parallel sections including
those of a and b. Anterior is up, medial to the left.

Plate 6
Fig. 13.
516

Plate 7
Fig. 14. Reconstruction of two pene-trations, P2 and P3 through the leftstriate cortex in monkey no. 3. Bothpenetrations were almost tangentialto the surface, aimed in a roughlymediolateral direction through theoperculum and placed 1 mm apart.(Autoradiographs and reduced-silversections from the same region areshown in Figures 15 and 17.) At thetop are shown the reconstructionsmade from micrometer depth read-ings. Dots numbered 1—6 representlesions made in layer IV while with-drawing the electrode, at the points ofpassing from one eye's territory tothat of the other eye. L and R indi-cate the dominant eye where only oneeye evoked responses: R(L) meansthat the right eye dominated but theleft evoked a lesser response from themultiunit activity. Middle portionshows a cresyl-violet stained tangen-tial section roughly in the plane of thepenetrations, passing through thecentre of lesion 6 and almost throughthe centres ofl and 5. No. 6 is clearlyin layer IV C, as were 1, 2 and 5,when the appropriate sections wereexamined. Lower section, a reduced-silver fibre stain (LeVay et al. 1975),passing through the centre of lesion 4and just missing the centre of 3. Bothare at the border of layers IV B(which contains most of the densely-staining line of Gennari) and IV C.This section is not ideally placed toshow the columnar banding: a moresuperficial section at lower powerappears in figure 17.
517

518 PART IV DEPRIVATION AND DEVELOPMENT
Plate 7, which shows the relation between penetra-tions 2 and 3, and the lesions made at the transitionpoints. Both penetrations were made in the lefthemisphere, from medial to lateral. The lesionswere made on withdrawing the electrode so thatthe points of transition could be checked—hencethe order of the lesion numbers. Figure 14£ showsa Nissl-stained section almost in the plane of thepenetrations and thus almost parallel to the sur-face, passing through the centre of lesion 6 and justmissing the centres of 1 and 5. Appropriate sectionsthrough their exact centres demonstrated thatlesions 1, 2, 5 and 6 were all well within layer IV C,and that lesions 3 and 4 were at the border betweenIV B and IV C, as seen in the fibre-stained sectionof Figure 14<r.
Throughout all of the left-eye (nondeprived)columns no activity could be evoked from the right(deprived) eye. In the right-eye dominated columnsweak but clearly audible responses could be heardin the span between lesions 3 and 4. This is not sur-prising, given that these lesions were made on theIV B—IV C border, since in normal animals the eyesegregation in layer IV B is not as strict as in layerIV C. In the deeper right (deprived) eye segments(1—2 and 5—6) the left eye was silent.
In summary, there were small regions withinlayer IV in which cells were actively driven andstrongly dominated by the deprived eye, in contrastto the virtual absence of influence of that eye in theupper layers. Within layer IV C there was a strik-ing and consistent difference in the distances theelectrode travelled in the two sets of columns.
MONKEY No. 3: MORPHOLOGY Two neighbouringopercular sections are shown in Figure 15a and b,Plate 7, and a reconstruction from nine neighbour-ing sections including these two is shown in Figure15c. Confirming the results of the recordings, thelabelled columns (normal eye) are very much widerthan normal, and the gaps (closed eye) are very
much narrower. Comparing Figures 13 and 15 it isevident that the repeat distance—the combinedwidths of two neighbouring columns, one fromeach eye—is roughly the same in the two animals.Measurements made as described above for monkeyno. 7 showed a combined width (repeat distance) of892 |J,m, as opposed to 848 |J,m for the control (Table3). (Unlike the millimetre scales on the illustrations,which refer to distances on the microscopic slides,these figures have been calculated from the histol-ogy by assuming a 30% shrinkage. This is only arough estimate based on reconstructions of elec-trode tracks in other animals, but the comparison isvalid, provided the brains have shrunk roughlyequally.) The fact that the repeat distance wasapparently unchanged in monkey no. 3 is consistentwith the conclusion that the expansion of one set ofcolumns is complemented by a contraction of theother. In addition to being reduced in width thedeprived columns were pinched off at irregularintervals of a millimetre or so.
The relative areas occupied by the labelledcolumns and the gaps were estimated by the meth-ods outlined above for the normal. Taking theentire reconstruction and cutting apart the left-eyeand right-eye regions the result was a ratio of 2.77:1for labelled columns to unlabelled ones, as com-pared with 1.05:1 for the normal (Table 3, ratio:]:).The ratio from selected regular blocks, calculatedas for monkey no. 7 (Table 3, ratiof, was lower,amounting to 2.24:1. The lower ratio presumablyresulted partly from the omission of pinched offareas, in selecting these blocks.
We found that electrolytic lesions of the ratherminiscule size necessary to mark the points of tran-sition from one eye to the other, in the physiologicalrecordings, were impossible to identify in dark-field autoradiographs. They were easily found,however, in the Nissl and reduced-silver sectionsthat were interspersed between the autoradi-ographs (see Figure 14), so that comparison of adja-
Fig. 15. This figure is the counterpart of figure 13, in monkey no. 3, whose right eye was closed from age 2 wee\to 18 months. Left hemisphere operculum: (a) is tangential to layer IV C, (b) is 200 jUm deeper, and (c) is theresult of cutting and pasting 9 such sections, representing a total depth of 900 jUm. Label in TV C, representinginput from the normal eye, is in the form of swollen bands which in places coalesce, obliterating the narrow gapswhich represent the columns connected to the closed eye. The thin, almost continuous belt of label in the uppertier (IV-A) is seen in all three parts. The six dots in (c) represent the positions of the six lesions of Figure 14, iden-tified on neighbouring cresyl-violet or reduced-silver sections and superimposed on the autoradiographs. Thelesions are clearly at or close to the column boundaries.

Plate 7
Fig. 15.
519

520 PART IV DEPRIVATION AND DEVELOPMENT
Plate 8
Fig. 16. Monkey no. 3; right eye closed from 2 wee\s to 18 months. Left eye injected. Darf^-field autoradiographthrough right calcarine cortex. Over the mushroom, label representing input from the contralateral (normal) eyehas almost obliterated the gaps, representing the deprived eye, and greatly narrowed them even where they arebest preserved, in the dorsal stem. Anterior is up and to the right.
cent sections made it possible to determine theirprecise position on the autoradiographs, with re-spect to the column boundaries. These are markedin Figure 15c.
An autoradiograph through the calcarine fis-sure (Figure 16, Plate 8) likewise showed gaps,between labelled regions, that were markedlyshrunk and in places almost obliterated. The sec-tion is taken from the side ipsilateral to the closedeye. Though it is difficult to compare the severityof shrinkage on the two sides, given the differencein planes of section, our impression from this andother examples is that deprivation effects weremore marked on the side ipsilateral to the closedeye (compare Figures 2la and 2\b}.
The reduced-silver stains gave results thatfaithfully paralleled the autoradiographs and thephysiology. The bands corresponding to columns inlayer IV could be seen only in tangential or veryoblique sections, and were seen best at very lowpower in the upper part of IV C, just beneath theline of Gennari. In Figure 17, plate 8, an alternationof wide (W) and narrow (N) dark bands can easilybe seen. The narrow bands were clearly identified
as corresponding to the deprived columns, and thewide bands to the non-deprived, by noting theirpositions with respect to the lesions in penetrations2 and 3, and to the columns as shown in the autora-diographs.
Another abnormality observed in thereduced-silver sections was the appearance ofbroad pale bands (P) in layer V, where normally nobanding is visible. These bands, which stand outclearly in the central part of Figure 17, were in reg-ister with the set of shrunken ocular dominancecolumns just above, in layer IV C. Similar bandscould be seen, though less clearly, in layer III. Closeinspection of layer V showed that within the palebands the tangential fibres were of abnormally finecalibre. The tangential fibre plexus of layer V con-sists largely of collaterals of the descending axonsof layer III pyramidal cells (Spatz, Tigges & Tigges1970; Lund & Boothe 1975). These observationsthus suggest a deterioration of descending connec-tions between layers III and V within the deprived-eye columns.
Finally, we were anxious to determine thedegree of overlap (if any) between the widened and

Plasticity of Ocular Dominance Columns 521
Fig. 17. Monkey no. 3. Reduced-silver stained section parallel to those of Figure 15, and 40 }lm deep to the sec-tion of Figure 15b. The Gennari Line, layer IV B, appears as the most densely stained blac\ ring. Dar\ bandscorresponding to the layer IV C columns are best seen in the most superficial part of IV C, i.e. just deep to IV Bor the Gennari Line—in this section just inside the darl^ ring. These bands are alternatingly wide (W) and nar-row (N). In autoradiographs neighbouring this section, such as the one shown in Figure 15b, the labelled(bright) columns were found to correspond precisely to the wide bands and the unlabelled (darty gaps to the nar-row bands. Still further inside the Gennari ring is a prominent light area, the cell-dense part of layer IV C;within this is layer V, with its pale bands (P) in register with the narrowed dar\ bands of IV C (N).
the apparently narrowed columns of this animal.The recordings, as described above, indicated thatthe deprived-eye columns were reduced, and noactivity was evoked from the deprived eye in thenormal-eye columns in layer IVC, suggesting thatthere was little or no overlap. Autoradiographsfrom normal-eye injections by themselves couldobviously prove nothing about the width of thestripes corresponding to the closed eye, and wewished to confirm morphologically the impressionfrom the physiology-plus-lesions (Figure 14, 15<r)that the gaps in the autoradiographic picture didactually represent the deprived-eye columns. Twostudies in which deprived eyes were injected sup-port this contention (see below), but for more directevidence Nauta studies were made in monkey no.3, and the results were correlated with the results ofthe autoradiography.
Five geniculate lesions were made in thehemisphere ipsilateral to the removed eye, 1 each inlayers 1, 3, and 4, and two lesions in layer 6, and forthree of these lesions the corresponding regions ofdegenerating terminals in the cortex were found.Figure l&z, Plate 8, shows a lesion in geniculatelayer 3, which receives input from the closed eye,and Figure 18c (lower right) a Nauta-stained sec-tion from the corresponding region in the calcarinefissure. A single focus of degenerating terminals isconspicuous deep in layer IVC (arrow). This couldbe followed in neighbouring sections, and repre-sented a wormlike structure 150 |J,m wide, extend-ing some 400 (Urn in a direction normal to the planeof the section.
An autoradiograph made from the sectionimmediately neighbouring that of Figure 18c isshown in Figure 18£. The gap between labelled
Plate 8

Plate 8
Fig. 18. Monkey no. 3. The results of making a lesion in the right lateral geniculate nucleus, confined to layer 3,a layer corresponding to the closed eye. The lesion and electrode trac\ are shown in the cresyl-violet section in a.The resulting Nauta degeneration was deep in the calcarine fissure, no more than one or two small patchesoccurring in any one section. One such patch of terminals is shown in the darJ^field photograph in c. The nextsection to this was dipped for autoradiography, with the result shown in b: here layer IV C is almost continuouslylabelled except for a narrow gap at the f(nee where the calcarine stem joins the mushroom. Sections b and c weresuperimposed, and in d the region showing Nauta degeneration is indicated by white, in the autoradiograph. Thetwo regions match precisely, except that the Nauta degeneration appears only in bottom half of IV C (IV C /3),as expected following a parvocellular geniculate lesion.
522

Plasticity of Ocular Dominance Columns 523
columns corresponds precisely to the region of ter-minal degeneration (Figure \Sd), providing a wel-come mutual confirmation of the two methods.The fact that the space taken by degeneratingfibres in the Nauta section and the size of the gapin the autoradiograph were roughly the same sug-gests, as had the recordings, that there was little ifany overlap between the inputs from the normaland abnormal eyes.
Figure ISd shows that the terminal degenera-tion in layer IV following this dorsal-layer genicu-late lesion was confined to the deeper half of layerIVC (IVCJ3), in agreement with what was found ina previous study (Hubel & Wiesel 1972). Theradioactive label following eye injection of courseoccupied the full thickness of IVC, since both dor-sal and ventral geniculate layers were involved inthe transport.
The remaining lesions were made in genicu-late layers corresponding to the open eye. In all ofthese the corresponding degeneration in the cortexresembled that found in the eye-removal monkeys(Figure 6) and was present only in portions of layerIVC which, in the autoradiographs, were occupiedby silver grains.
MONKEY No. 4: PHYSIOLOGY The right striate cor-tex of this monkey was recorded from twice, at 22days, at which time the right eye was suturedclosed, and then at 7 months, after just over 6months of deprivation. On the first occasion 66cells were recorded in two penetrations. The ocu-lar dominance histogram was entirely normal byadult standards, as may be seen by comparing thehistogram from these two penetrations (Figure 19)with that of Figure 1 for the normal adult. The
Fig. 19. Ocular dominance histograms from striate cortex of monkey no. 4, at 3 weef{s, when the right eye wasclosed, and in a second recording session at age 7 months. The histogram at 3 wee^s (right hemisphere) is simi-lar to the adult histogram (Figure 1). After the deprivation the histogram is as expected strikingly abnormal, andalmost identical to that of monkey no. 3 (see Figure 1). Here four penetrations were made, three on the right sideand one on the left. 'Ipsilateral' refers to domination by the right (deprived) eye. Shading in histogram indicatescells with abnormal responses.

524 PART IV DEPRIVATION AND DEVELOPMENT
results of this recording session will be described inmore detail in Part III.
The ocular-dominance histogram at 7months is shown to the right in figure 19. Fourpenetrations were made, all tangential. Again, cellsfrom layer IVC are not included. (We wished tostudy layer IV in detail, and therefore recorded asmany cells as possible from it. The inclusion ofthese cells would have greatly increased the num-ber of cells in groups 1 and 7.) The pronouncedeffects of the eye closure on the upper and lowerlayers is obvious, as can be seen by comparing thetwo parts of the figure.
In all four penetrations the activity recordedfrom layer IVC was strictly monocular, and in oneof these penetrations the positions of six lesionsmade at the points of transition matched the col-umn boundaries as revealed in subsequent autora-diography (compare Figure \5c).
MONKEY No. 4: MORPHOLOGY This monkey dif-fered from monkey no. 3 in that the deprived(right) eye, rather than the normal one, wasinjected. Also the eye was closed at 3 weeks insteadof 2, and the closure lasted 7 months rather than 18(see Table 1). Sections of the operculum ipsilateralto the injected and deprived eye are shown in Fig-ure 20, plate 9. Part a shows a single section whichjust grazed layer IVC, and b shows a slightlydeeper section cutting layer V in two places, pre-sumably reflecting some dimpling of the cortex;here IVC has the shape of an 8. These sections formthe central part of the reconstruction shown in fig-ure 20<r. Cutouts of the two sets of columns on thisside showed a ratio of areas, normal to deprived, of1.97:1 (Table 3). On the contralateral side this ratiowas 1.60:1, suggesting, as in monkey no. 3, that theside ipsilateral to the closed eye was the moreseverely affected.
The calcarine cortex of the two hemispheresis shown in Figure 21, Plate 10, contralaterally (A)and ipsilaterally (B); again there is a suggestion thatin the ipsilateral hemisphere the labelled columnsare narrower than in the contralateral. In additionone can see that the deep part of layer IVC (IVC(3)is labelled much more heavily than the superficial.This difference is seen in normal monkeys, butseems more pronounced here, while it might betaken to mean that the IVCot component is more
susceptible than IVCJ3 to deprivation effects, theresults in monkey no. 3 (see Figure 16) suggest, ifanything, the very reverse. In the geniculate, fur-thermore, there was no indication that the magno-cellular layers, which correspond to IVCOC, weremore atrophic than the parvocellular. This is inagreement with the findings of Headon & Powell(1973).
In Figure 210, Plate 10, a long continuousexpanse of layer IV label can be seen over the ante-rior stem of the calcarine fissure in the regionknown to represent the part of the visual field tem-poral periphery that is visible only to one eye (tem-poral crescent). This label is at least as heavy as inany of the shrunken deprived-eye columns else-where on the same slide, and occupies as extensivean area of cortex as it does in the normal monkey.It thus seems that the temporal-crescent represen-tation is little affected by the deprivation proce-dure. This again supports the suggestion that theeffects of monocular deprivation depend on com-petition between the two eyes rather than simpledisuse.
In this monkey the reduced-silver sectionsshowed no banding, perhaps because the animalwas too young. (The method has so far been suc-cessful only in animals a year or more old.) Nogeniculate lesions were made, and consequently noNauta preparations were available.
MONKEY No. 5 (201): MORPHOLOGY This animal isincluded as a second example of monocular closurewith deprived eye injected. The right eye wasclosed at 2 days and opened at 7 weeks, and the ani-mal lived up to an age of 7 months. A more com-plete description of this monkey will be given aspart of a separate paper on duration of the sensitiveperiod and extent of recovery. The opercularautoradiographs were unsatisfactory, showingalmost no label, probably because of uneven distri-bution of the injected material in the eye. A part ofthe calcarine cortex was labelled, however, and isshown in transverse section in Figure 22, Plate 10.We include this monkey here because it forms analmost exact complement to monkey no. 3 (Figure16), with the deprived eye injected instead of thenormal. Again, as in monkey no. 4, layer IVCotseems more severely affected than IVCP, in appar-ent contradiction to what was seen in monkey no. 3.

Plate 9
Fig. 20. This is the counterpart ofFigures 13 and 15, for monkey no. 4;right eye closed at 3 weeks, until age7 months; right eye injected. Dar\-
field autoradiographs of right occipi-tal operculum. (a) tangential to layerIVC; (b) 120 fJ.m deeper than a, tan-gential to layer V and intersecting ittwice because of dimple in cortex, (c)reconstruction made up of 7 sectionsincluding a and b; total depth 640fim. The labelled columns, corre-sponding to the closed eye, aremarkedly shrunken.
525

Plate 10
Fig. 21. Monkey no. 4, dar\ field autoradiographs through calcarine cortex, (a) contralateral to the closed,injected eye, (b) ipsilateral to the injected eye Note that the deprived columns are more severely shrunken on theipsilateral side. The temporal-crescent representation is very conspicuous in a, and seems not to be affected at all.
526
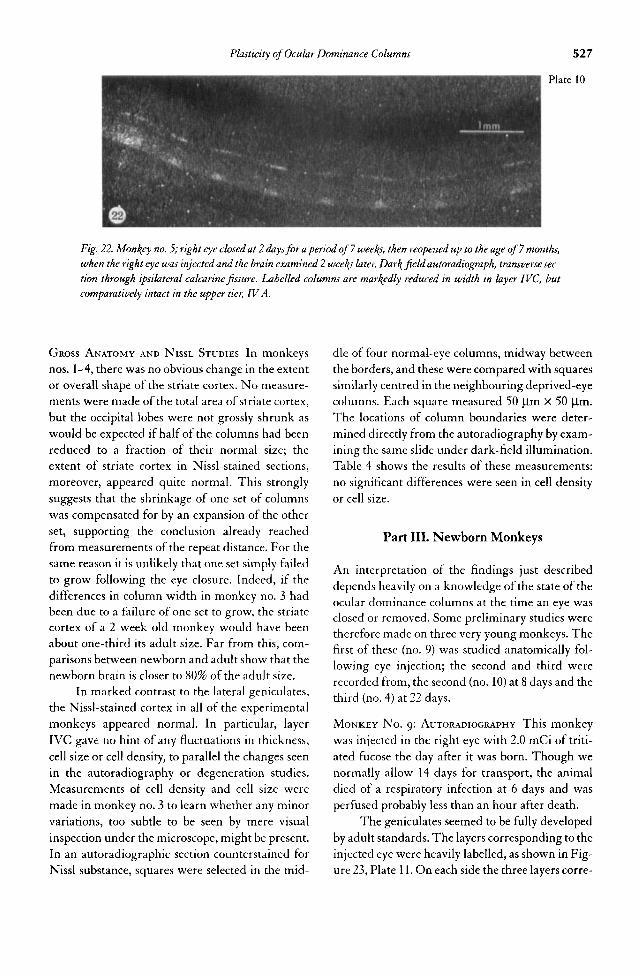
Plasticity of Ocular Dominance Columns 527
Fig. 22. Monkey no. 5; right eye closed at 2 days for a period of7wee%$, then reopened up to the age of 7 months,when the right eye was injected and the brain examined 2 wee^s later. Darf{-field autoradiograph, transverse sec-tion through ipsilateral calcanne fissure. Labelled columns are markedly reduced in width in layer TVC, butcomparatively intact in the upper tier, IV A.
GROSS ANATOMY AND NISSL STUDIES In monkeysnos. 1—4, there was no obvious change in the extentor overall shape of the striate cortex. No measure-ments were made of the total area of striate cortex,but the occipital lobes were not grossly shrunk aswould be expected if half of the columns had beenreduced to a fraction of their normal size; theextent of striate cortex in Nissl-stained sections,moreover, appeared quite normal. This stronglysuggests that the shrinkage of one set of columnswas compensated for by an expansion of the otherset, supporting the conclusion already reachedfrom measurements of the repeat distance. For thesame reason it is unlikely that one set simply failedto grow following the eye closure. Indeed, if thedifferences in column width in monkey no. 3 hadbeen due to a failure of one set to grow, the striatecortex of a 2 week old monkey would have beenabout one-third its adult size. Far from this, com-parisons between newborn and adult show that thenewborn brain is closer to 80% of the adult size.
In marked contrast to the lateral geniculates,the Nissl-stained cortex in all of the experimentalmonkeys appeared normal. In particular, layerIVC gave no hint of any fluctuations in thickness,cell size or cell density, to parallel the changes seenin the autoradiography or degeneration studies.Measurements of cell density and cell size weremade in monkey no. 3 to learn whether any minorvariations, too subtle to be seen by mere visualinspection under the microscope, might be present.In an autoradiographic section counterstained forNissl substance, squares were selected in the mid-
dle of four normal-eye columns, midway betweenthe borders, and these were compared with squaressimilarly centred in the neighbouring deprived-eyecolumns. Each square measured 50 Jim X 50 )J,m.The locations of column boundaries were deter-mined directly from the autoradiography by exam-ining the same slide under dark-field illumination.Table 4 shows the results of these measurements:no significant differences were seen in cell densityor cell size.
Part III. Newborn Monkeys
An interpretation of the findings just describeddepends heavily on a knowledge of the state of theocular dominance columns at the time an eye wasclosed or removed. Some preliminary studies weretherefore made on three very young monkeys. Thefirst of these (no. 9) was studied anatomically fol-lowing eye injection; the second and third wererecorded from, the second (no. 10) at 8 days and thethird (no. 4) at 22 days.
MONKEY No. 9: AUTORADIOGRAPHY This monkeywas injected in the right eye with 2.0 mCi of triti-ated fucose the day after it was born. Though wenormally allow 14 days for transport, the animaldied of a respiratory infection at 6 days and wasperfused probably less than an hour after death.
The geniculates seemed to be fully developedby adult standards. The layers corresponding to theinjected eye were heavily labelled, as shown in Fig-ure 23, Plate 11. On each side the three layers corre-
Plate 10

528 PART IV DEPRIVATION AND DEVELOPMENT
Table 4. Cell Density and Size, Monkey No. 3, Layer IVC (3, R.H. f
MEAN AREA
Column Type Density (Cells/2500 \lrn2) (ym2) (s.d) Significance (Welch test)
normaldeprived
normaldeprived
normaldeprived
normaldeprived
total:
normaldeprived
3130
3323
2237
2926
(cells/10000 Urn2)
115116
4848
5041
5454
5049
5049
8.911.1
11.810.7
12.914.6
9.68.4
N.S.
p < 0.05
N c.0.
N.S.
N.S.
t 4 pairs of samples from normal and deprived columns. Each consists of all the neurones in a 2500 (1m2 square in the middle ofthe column and the middle of the layer.
spending to the uninjected eye showed some labelin excess of background, perhaps somewhat morethan was seen in monkeys nos. 3 and 4. Compar-isons are difficult, however, given the large amountof label injected relative to the size of the eye or themonkey's weight, the use of fucose alone instead ofa fucose-proline mixture, the differences in the timeallowed for transport, and a number of other vari-ables that could not be completely controlled.
In addition to the six classical layers, Figure23 shows four subsidiary groups of terminations.These are labelled in Figure 24, Plate 11. Fromventral to dorsal they consist of: (1) a thin layer aventral to layer 1, contralaterally supplied, and sep-arated from most of 1 by a thin label-free gap. (2) Aclump of label b near the hilum, supplied ipsilater-ally and sandwiched between a and layer 1. This isseen as a small aggregation of label on the left, andits position is marked by a space on the right. (3) Athin leaflet c just dorsal to layer 1, contralaterallyinnervated, and, like, a, separated from layer 1 by alabel free gap. (4) A thin leaflet d sandwichedbetween layers 2 and 3, contralaterally innervatedso that it stands out clearly between these two,especially in dark-field illumination (Figure 23,lower right). This layer is probably also ipsilater-ally innervated as shown in light field (see also Fig-
ure 9). c and d appear to be joined in some sectionsby bands of label that pass through layer 2. Layersa, b and d are also shown in Figure 9. a and b prob-ably correspond to the single lamina 'S', describedby Campos-Ortega & Hayhow (1970), and thoughtby them to receive only ipsilateral innervation.
The findings in the striate cortex came as asurprise. At first glance no columns were evident atall. Sections cut in the parasagittal plane throughthe calcarine fissure contralateral to the injected eyeshowed almost continuous moderately dense labelin layer IVC. This is shown in Figure 25a, Plate 12.The minor fluctuations in density of layer IV labelwere hard to evaluate in these sections and we weretempted to dismiss them until we examined tan-gential sections through the dome of the mushroomof the calcarine fissure on the ipsilateral side (Figure25b). Though the parallel bands in the central ovalregion through IVC are faint their regularity is veryclear, with a repeat distance of about 700 |J,m, or20% less than our value for the normal adult. Evenin the regions of minimum label the density is con-siderably higher than outside IVC. It is difficult tocompare the sides ipsilateral and contralateral to theinjected eye because of differences in the planes ofsection, but our impression is that the fluctuationsin density were more marked ipsilaterally.

Plasticity of Ocular Dominance Columns 529
Plate 11
There are two possible explanations for thisresult. The first is that label may have leaked fromthe path originating in the injected eye to the non-injected path. The geniculates would be the mostlikely site of spillover. Some leakage of this sortmay indeed occur in the normal adult, as is shownin Figures 12 and 13 by the above-background lev-els in the gaps between labelled columns. It may bethat any such leakage is more serious in the new-
born. The second possibility is that the columns areindeed not fully formed at birth, the full extent oflayer IV being occupied by terminals from the twoeyes, with only minor but regular variations indensity representing the precursors of the columns.
MONKEYS Nos. 10 AND 4: PHYSIOLOGY One obviousmethod for resolving this impasse was to recordfrom a newborn monkey. No. 9, unfortunately,
Fig. 23. Normal newborn monkey(no. 9). Autoradiographs of lateralgeniculate bodies. The left eye wasinjected at 1 day of age and the brainexamined at 1 weet^. Upper part,light field, lower, darl^ field. Thelabel in the layers corresponding tothe right, non-injected eye is denserthan the background but is in fibresrather than terminals. Several layersother than the six classical ones can beidentified; these are indicated in Fig-ure 24. (Continued)

530 PART IV DEPRIVATION AND DEVELOPMENT
died before recordings could be made. No. 10 wasnot injected, but was recorded from at 8 days ofage, having been in a normally lit nursery up tothat time.
Four penetrations were made in monkey no.10, in area 17 of the left hemisphere. They weremade very obliquely so as to explore as great a spanof layer IVC as possible. The reconstruction ofthese penetrations is shown in Figure 26, Plate 12,with the ocular dominance of the cells indicated
below. Points to the left of the gap in the diagramindicate units or unit clusters in layer IVC. Thesmaller dots, to the right of the gap, indicate cells inthe upper layers. Our main concern was of courseto learn whether single cells or local groups of cellsin IVC were fed from one eye or from both.
The first penetration was normal by adultstandards: in the layers above IVC most cells hadsharp orientation specificity and most were drivenfrom both eyes, one or other being preferred. The
Fig. 23. (Continued)
Plate 11

Plasticity of Ocular Dominance Columns 531
Plate 11
Fig. 24. Monkey no. 9; same as light-field part of Figure 23. Nine regionsof input have been identified. Inaddition to the two classical magno-cellular layers, 1 and 2, and the fourparvocellular (dorsal) layers, 3, 4, 5,and 6, one can see two thin leaflets aand c, both contralaterally supplied,the one dorsal to 1 and the other ven-tral to it', a thin leaflet d, sandwichedbetween the dorsal four and the ven-tral two classical layers, and probablyreceiving input from both eyes', andfinally a clump of label b (ipsdater-atty supplied) between a and I,which shows up as a labelled regionon the left, and a label-free space onthe right.
contralateral eye dominated at first, then came aspan of about 1 mm in which the ipsilateral eyedominated, and finally, in IVC, all cells had unori-ented fields and were activated from the contralat-eral eye only. In the other three penetrations,binocular cells similarly prevailed in the upper lay-ers, but in IVC a variable amount of binocularinput was also found. Thus in penetrations 2 and 3the ipsilateral eye dominated but the contralateralcontributed weakly or moderately throughout the
traverse through IVC, while in penetration 4 thetwo eyes were almost equal. These observationsrefer mostly to the unresolved multiunit activity,since single units are hard to resolve in IVC. Nev-ertheless, there were in layer IVC several clearexamples of binocularly driven cells with no pre-ferred orientation. In this monkey, then, layer IVCshowed the usual variation in eye emphasis, butmuch more binocular mixing than we have everfound in juvenile or adult monkeys.

Plate 12
Fig. 25. Newborn monkey, no. 9, Autoradiographs in darkjield. (a) Transverse section through calcarine fissureand operculum on the right side, contralateral to the injected eye. Label is virtually continuous, both in the fis-sure and over the convexity, though there is some suggestion of fluctuations in density over the dorsal calcarinestem. (The part of this stem furthest to the left is probably the temporal crescent representation, where one expectscontinuous label; compare Figure 21&.) Anterior is up and to the left, (b) Tangential section through operculumof left occipital lobe (ipsilateral to the injected eye). Section passes deep to the outer convexity, and cuts the buriedmushroom-li^e calcarine convexity, grazing layer IV C which appears as an oval near the centre. Throughoutthis area levels of label are well above background, but there is nevertheless a definite regular banding with aperiodicity of about 0.7 mm. 1-2 mm outside of the oval is a ring of label formed by the optic radiations. Stillfurther out is a continuous double ring of label in layers IV C a and ft of the outer exposed convexity.
532

Plasticity of Ocular Dominance Columns
Fig. 26. Reconstructions of four penetrations made in striate cortex of an 8-day-old monkey (left hemisphere).The object was to explore as long an extent of layer IV C as possible, determining how much binocular mixingwas present. Circles indicate points at which electrolytic lesions were made. The lower diagram indicates, on theleft, the ocular dominance of the multiunit activity in layer IV C. The right hand portion, with smaller dots,indicates ocular dominance of the cells in the upper layers, in the early parts of the penetrations. The points arepooled from all four penetrations, preserving the cortical position of each recording site. In the region explored,obviously the contralateral (right) eye dominated in the portions to the left and right and the ipsilateral eye dom-inated in the middle. For the left hand region the input was almost exclusively contralateral; in the middleregion, however, there was considerable mixing of inputs from the two eyes. In adult monkeys virtually no mix-ing is found in layer IV C.
A recording was also made in monkey no. 4 at3 weeks of age, up to which time both eyes hadbeen normally exposed. (After the recording themonkey was resurrected and the right eye wassutured closed.) In this animal the results were verysimilar to those previously obtained in the adult,and are illustrated in Figure 27. In both penetra-tions (each at about 45°) binocularly driven cellswere present in abundance above and below layerIVC, with the normal swings in dominance fromeye to eye. The short passage through layer IVC inpenetration 1 (between arrows) showed monocularinfluence only, but a subsequent experiment in a 3-week-old monkey has indicated a lack of completesegregation in this layer; another at 6 weeks sug-gests that by then segregation is virtually complete.(These experiments are part of a separate study onthe time course of columnar development.)
Thus early in life layer IVC probably containsa mixture of inputs from the two eyes, perhaps at
most points along its length; by 3 weeks, on theother hand, segregation seems to be fairly welladvanced but probably still not complete.
DISCUSSION
The chief finding of the present study concerns theeffects of early eye removal or monocular lid clo-sure on the ocular dominance stripes in layer IVC.Deprivation in the first few weeks of life resultedin a change in the relative sizes of the two sets ofstripes, with a shrinkage of stripes receiving inputfrom the deprived eye and a correponding expan-sion of those with input from the normal eye.
In discussing the nature of these changes anumber of possibilities can be quickly dispensedwith. The first of these is the notion that in theshrunken columns the reduction is only apparent:that in the areas invaded by the normal-eye termi-nals, the terminals from the deprived eye remain
Plate 12
533

534 PART IV DEPRIVATION AND DEVELOPMENT
Fig. 27. Ocular dominance in two penetrations made at 45°through right striate cortex of a normal 3-weet^-old monkey(no. 4, first recording, compare figure 19). Penetration 1passed through layer IV C in the region indicated by thearrows; this activity was strictly monocular. There are clearregular fluctuations in ocular dominance, just as is found inadult monkeys.
but are non-functional. The concept of non-func-tional synapses in the nervous system is notunheard of, the best established example probablybeing botulinum poisoning at the nerve-musclejunction. In the present experiments, given thevariety of techniques we have used to demonstratethe abnormalities, one would have to suppose inthis model not only that the synapses were physio-logically non-functional, but that the fibres did notdegenerate after geniculate lesions in such a way asto show up with Nauta-Fink-Heimer methods,did not transport materials normally, and were notrevealed with reduced silver stains. Such an inter-pretation thus seems most improbable.
Secondly, we must consider the idea thatthere is not only an abnormal distribution of termi-nals in layer IV, but also a change in the territory
occupied by each entire band, cells and all. Thiscould only happen if the cell packing density devi-ated markedly from normal, increasing in theshrunken columns and decreasing in the expandedones, or if cells died in large numbers in one set andproliferated in the other. But a fluctuation in pack-ing density of the magnitude necessary to fit thechanges in width that we see can be ruled out bydirect counts (Table 4), while cell proliferationceases altogether in the cortex 2 months beforeterm (Rakic 1974), and a cell death sufficient toequalize the cell counts would produce a radicaldrop in cell numbers which in fact does not occur.
Thirdly, there is a possibility that the brain ofthe newborn monkey is much smaller than that ofthe adult, and that the columns in area 17 are pres-ent at birth and also correspondingly smaller. Thedisparity in column size would then arise if thecolumns connected to the deprived eye simplyfailed to grow. It appears, however, that in overallsize the striate cortex increases very roughly 20%after birth—it certainly does not double or triple inarea as would be required to explain the discrepan-cies in column width. Consistent with this, thecolumns in the newborn show a periodicity notvery different from that of the adult, to judge fromdirect anatomical (Figure 25b) and physiological(Figures 26 and 27) observations. Finally, there isthe finding that in the deprived animals thecolumns associated with the open eye are largerthan normal, and the combined width of a left eye-right eye pair is unchanged. None of this would beconsistent with an explanation based on failure togrow.
With these possibilities out of the way, a dis-cussion of the pathogenesis of the changes due todeprivation hinges strongly on a knowledge of thestate of the columns at birth. If one assumes that inthe newborn monkey (or within a few days ofbirth) the geniculocortical fibres have alreadytaken up their final positions in the form of clearlydefined parallel I Vth-layer stripes, then it is hard toavoid the conclusion that in the final state one set ofterminals has extended its territory, possibly bysprouting, while the other set has retracted. Ifsprouting were involved here it would be of someinterest. Although a number of examples ofsprouting have been reported, all of them werebrought about by a destructive deafferentation ofone source of input to a structure. In the present

Plasticity of Ocular Dominance Columns 535
series even eye enucleation amounts to a lesion onesynapse away from the site of the changes, and theeye closures involve no direct destruction of anyneural tissue. If the changes in layer IV are indeedproduced by sprouting and retraction the result isin marked contrast to what is seen in the geniculateor colliculus, for there we have no hint of invasionof terminals from the normal eye into the deprivedor deafferented territory. This may simply be amatter of timing with respect to normal develop-mental events, since it is known that in enucleatedcats there is no invasion of afferents into a deprivedgeniculate layer unless the enucleation is done inthe first week after birth (Kalil 1972; Guillery1972£). Even then the invasion is modest andoccurs only near the laminar borders; that it occursat all is probably related to the immaturity of thecat visual system at birth, compared with that ofthe monkey.
Up to the time when we saw the results ofautoradiography in the newborn, described in PartIII, we regarded a sprouting of terminals as thestrongest contender in explaining the corticalchanges. Our previous physiological recordings inyoung monkeys (Hubel & Wiesel 1974) had actu-ally tended to support the idea that ocular domi-nance columns were present at birth. By the secondday, for example, there was a clear grouping ofupper-layer, mostly binocular, cells according toocular dominance, and in an animal with both eyesclosed up to 3 weeks there was an almost completesegregation of eye inputs even in the upper andlower layers, reminiscent of the picture obtainedwith artificial strabismus. Tangential penetrationswere not used in either of these animals, however,so that no clear idea was obtained of the state ofaffairs in layer IVC.
In the present paper both the physiologicalrecordings and the anatomy in monkeys in the firstweek or so of life strongly suggest that the sets ofterminals associated with the two eyes have arrivedat layer IVC but have not yet separated themselvesout completely into distinct bands. There is, to besure, a clear banding visible in the autoradiographsin tangential sections (monkey no. 9, Figure 25£),but these are produced by mild fluctuations in lev-els of label, rather than a series of abrupt rises andfalls from maximum to minimum and back. Thephysiology in monkey no. 10 confirmed this mix-ing of inputs, though there was perhaps more seg-
regation than would have been expected from theautoradiographic picture.
The notion that the columns are not fullyformed at birth in this species can at present be onlyrather tentative; what is still needed is a set of injec-tions and recordings at various ages in the first 6weeks. But our results so far receive support fromthe findings of Rakic (19760, £), in foetal monkeysin which one eye was injected with radioactivelabel at different times during gestation. At 6weeks before term label was present in IV C butappeared uniform, with no hint of columns. Threeweeks before term there were fluctuations in labeldensity that were only barely discernable on visualinspection of transverse sections, but were clearlyconfirmed by grain counts. As with our eye-injec-tion results, one must keep in mind the possibilityof leakage of label in the geniculate.
If the columns do, as it were, crystallize outonly in the few weeks before and after term, theprocess presumably occurs by a retraction of thetwo sets of terminals. One may imagine that in anyareas occupied by both sets of terminals there is acompetitive mechanism in which the weaker set atany point tends to regress. Given such an unstableequilibrium, the normal end result of any initialinequalities would be a complete segregation ofterminals. Such a model for the normal develop-ment, based on competition, is illustrated schemat-ically in the left half of Figure 28. In this figure theterminals dominated by one eye in layer IV C areblackened, and the other set is represented by openareas. (Obviously the two sets should be superim-posed, but are shown one under the other for clar-ity.) The thickness of these representations suggeststhe relative density of label at each point along IVC. If we suppose that at birth there exist some mildperiodic out-of-phase fluctuations (which may beless than portrayed here) the density of the weakerinputs at any point will decline, with consequentproduction of a series of ever widening gaps untilall overlap is eliminated.
On this model for the normal development,the deprivation results in layer IV can be predicted.One has only to assume that lack of use of a set ofterminals puts them at a competitive disadvantagewhich transcends that related to mere numbers, sothat at any point along IV C the terminals from theopposing normal-eye set take over, provided theyhave not already retracted. This is illustrated in the

536
Fig. 28. Scheme that might explain the effects of eye closures on columns in layer IV C, on the assumption thatthe segregation of the eyes is not complete until some wee\s after birth. The thicf( dart^ lines represent the termi-nations ofgeniculate ajferents in layer IV C corresponding to one eye; the open lines, the terminations from theother eye. In each, the width is intended to represent the presumed density of the terminals. At birth there is someperiodic and regular variation in density (Figure 25b): it is unlikely that the minimum is zero, as the drawingsuggests, and in any case the fluctuations are probably different in different parts of the striate cortex. In thisscheme we suppose that competition normally occurs between the eyes, with the weaker input at any given pointdeclining and the stronger being fortified. The result is a progressive retraction as the sparse terminals die outentirely. For purposes of the drawing we assume that the retraction process has the time course illustrated andthat it tal^es about 6 weeJ^s; again, the exact time course is far from clear.
right half of Figure 28. Where no competition ispossible, because the other set has already disap-peared (or in the case of the temporal crescent rep-resentation, where only one set was present fromthe beginning—see Figure 2\a) the deprived selsurvives and is apparently intact. The end result ofthe deprivation thus depends on the amount ofoverlap that still existed at the time of eye closure orremoval.
It should be emphasized that the details ofFigure 28, such as the ages assigned to the fourillustrated stages of development or the amount offluctuation of label density at birth, should not betaken literally. We do not know, for example, thatclosure of an eye from birth produces a completetakeover by the open eye. The illustration merelyprovides, at present, the best fit with the resultsfrom the few deprivation and control monkeysavailable (nos. 1—5, and 9 and 10). We are stilluncertain of the variation to be expected from oneanimal to the next, even under experimental con-ditions that are as similar as possible.
One advantage of the scheme of Figure 28 isthat it removes some of the mystery connected withthe 'critical period'—the period of susceptibility tomonocular deprivation. At least as far as layer IV isconcerned the flexible state would, by this model,involve not some kind of ill-defined vulnerabilityto insult, or capacity for nerve-terminal prolifera-tion, but merely the period of development frombirth to the final consolidation of the columns.
If the idea of a post-natal retraction of inputsis correct, it would be interesting to know whetherthere are consistent differences in the timing of theprocess, in different parts of area 17 (for example,foveal vs. more peripheral representations) and, ina given hemisphere, between terminals belongingto the ipsilateral and contralateral eyes. As far aslaterality is concerned, deprivation effects haveconsistently been more severe in the hemisphereipsilateral to the eye that was closed; this has beentrue both for the shrinkage of cortical columns andthe attendant geniculate atrophy (see also Headon& Powell 1973). On the model of Figure 28 this
NORMAL DEPRIVED
PART IV DEPRIVATION AND DEVELOPMENT
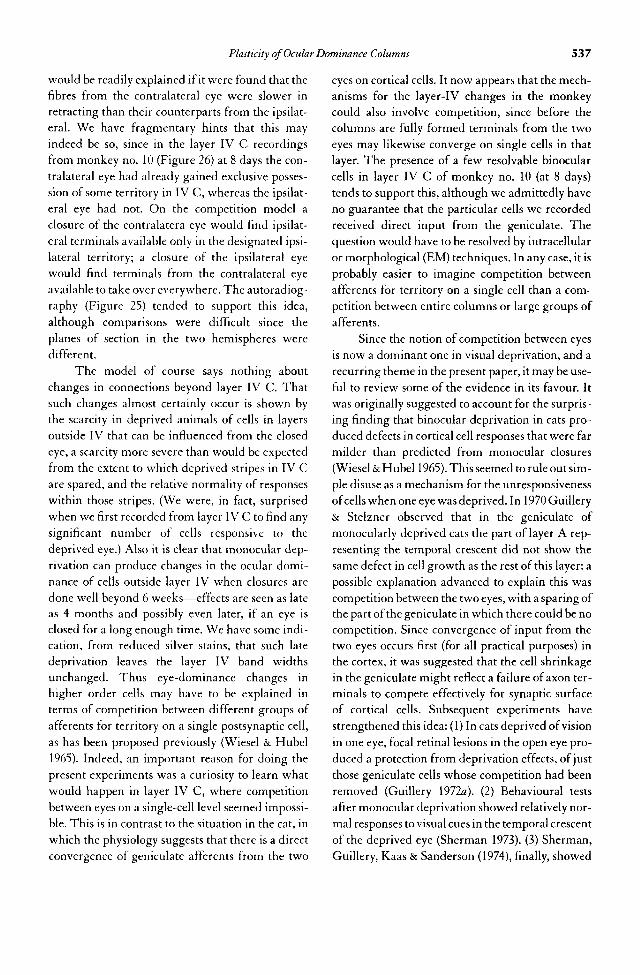
Plasticity of Ocular Dominance Columns 537
would be readily explained if it were found that thefibres from the contralateral eye were slower inretracting than their counterparts from the ipsilat-eral. We have fragmentary hints that this mayindeed be so, since in the layer IV C recordingsfrom monkey no. 10 (Figure 26) at 8 days the con-tralateral eye had already gained exclusive posses-sion of some territory in IV C, whereas the ipsilat-eral eye had not. On the competition model aclosure of the contralatera eye would find ipsilat-eral terminals available only in the designated ipsi-lateral territory; a closure of the ipsilateral eyewould find terminals from the contralateral eyeavailable to take over everywhere. The autoradiog-raphy (Figure 25) tended to support this idea,although comparisons were difficult since theplanes of section in the two hemispheres weredifferent.
The model of course says nothing aboutchanges in connections beyond layer IV C. Thatsuch changes almost certainly occur is shown bythe scarcity in deprived animals of cells in layersoutside IV that can be influenced from the closedeye, a scarcity more severe than would be expectedfrom the extent to which deprived stripes in IV Care spared, and the relative normality of responseswithin those stripes. (We were, in fact, surprisedwhen we first recorded from layer IV C to find anysignificant number of cells responsive to thedeprived eye.) Also it is clear that monocular dep-rivation can produce changes in the ocular domi-nance of cells outside layer IV when closures aredone well beyond 6 weeks—effects are seen as lateas 4 months and possibly even later, if an eye isclosed for a long enough time. We have some indi-cation, from reduced silver stains, that such latedeprivation leaves the layer IV band widthsunchanged. Thus eye-dominance changes inhigher order cells may have to be explained interms of competition between different groups ofafferents for territory on a single postsynaptic cell,as has been proposed previously (Wiesel & Hubel1965). Indeed, an important reason for doing thepresent experiments was a curiosity to learn whatwould happen in layer IV C, where competitionbetween eyes on a single-cell level seemed impossi-ble. This is in contrast to the situation in the cat, inwhich the physiology suggests that there is a directconvergence of geniculate afferents from the two
eyes on cortical cells. It now appears that the mech-anisms for the layer-IV changes in the monkeycould also involve competition, since before thecolumns are fully formed terminals from the twoeyes may likewise converge on single cells in thatlayer. The presence of a few resolvable binocularcells in layer IV C of monkey no. 10 (at 8 days)tends to support this, although we admittedly haveno guarantee that the particular cells we recordedreceived direct input from the geniculate. Thequestion would have to be resolved by intracellularor morphological (EM) techniques. In any case, it isprobably easier to imagine competition betweenafferents for territory on a single cell than a com-petition between entire columns or large groups ofafferents.
Since the notion of competition between eyesis now a dominant one in visual deprivation, and arecurring theme in the present paper, it may be use-ful to review some of the evidence in its favour. Itwas originally suggested to account for the surpris-ing finding that binocular deprivation in cats pro-duced defects in cortical cell responses that were farmilder than predicted from monocular closures(Wiesel & Hubel 1965). This seemed to rule out sim-ple disuse as a mechanism for the unresponsivenessof cells when one eye was deprived. In 1970 Guillery& Stelzner observed that in the geniculate ofmonocularly deprived cats the part of layer A rep-resenting the temporal crescent did not show thesame defect in cell growth as the rest of this layer: apossible explanation advanced to explain this wascompetition between the two eyes, with a sparing ofthe part of the geniculate in which there could be nocompetition. Since convergence of input from thetwo eyes occurs first (for all practical purposes) inthe cortex, it was suggested that the cell shrinkagein the geniculate might reflect a failure of axon ter-minals to compete effectively for synaptic surfaceof cortical cells. Subsequent experiments havestrengthened this idea: (1) In cats deprived of visionin one eye, focal retinal lesions in the open eye pro-duced a protection from deprivation effects, of justthose geniculate cells whose competition had beenremoved (Guillery \972a). (2) Behavioural testsafter monocular deprivation showed relatively nor-mal responses to visual cues in the temporal crescentof the deprived eye (Sherman 1973). (3) Sherman,Guillery, Kaas & Sanderson (1974), finally, showed
538 PART IV DEPRIVATION AND DEVELOPMENT
that focal retinal lesions in the eye that remainedopen protected the closed eye from defects in behav-ioural and cortical-cell responses in the correspon-ding part of the visual field.
To this accumulated evidence the presentpaper has added the anatomical observation thatthe temporal-crescent input to the monkey cortexis largely spared on the side opposite to the closedeye, compared to the severe effects on corticalcolumns in the binocular part of area 17. Onewould expect also to see a sparing of the correspon-ding geniculate cells, as is found in the cat, but forthis problem parasagittal sections would probablybe necessary. In a study of the geniculate in monoc-ularly deprived monkeys, von Noorden, Middle-ditch & Crawford (1975) saw no sparing in themonocular segment representation.
It is worth noting, in this context, that in thefoetal eye-injection experiments of Rakic (I976a, b]the optic afferents both to the geniculates and to thesuperior colliculi occupied their entire targets foran extended period between their first arrival andtheir eventual segregation into layers (geniculates)or clumps (colliculi). In both targets segregationoccurred during the middle period of gestation andwas apparently complete by birth. A similarprocess, then, may well take place in geniculate,colliculus and cortex, though in the cortex it seemsto occur later, and to be still incomplete at birth.This would suggest that the apparent reluctance ofoptic terminals in geniculate and tectum to extendtheir territory in monocular deprivation is a reflec-tion of the complete segregation of the terminals atbirth: the deprivation simply comes too late to pro-duce an effect.
Though direct proof is still lacking, there arestrong indications that the formation of oculardominance columns does not require visual experi-ence, even though some of the formation takesplace postnatally and can be rendered abnormal bybinocular closure. At present there are two kinds ofevidence for this: (1) the autoradiographs at andbefore birth, i.e. the bands seen on tangential sec-tions (Figure 26b) or the fluctuations in graincounts 21 days before term (Rakic 1976£); and (2)physiological recordings at 4 weeks in monkeyswith both eyes closed at birth (Wiesel & Hubel1974), where layer IV was not examined carefully,but extreme eye segregation was present in the lay-ers outside IV, and therefore, a fortiori, in IV. We
have examined one macaque dark raised to an ageof 6 weeks, and found the responses in layer IV Cto be strictly monocular. What is still needed isautoradiography after eye injection in a monkeydark reared, or with both eyes sutured, for the firstsix weeks or more.
The model involving mutual competition toexplain the normal process of post-natal IVth layersegregation presupposes some initial inequalitythat starts the process. It would be most interestingto know what causes this, and what forces lead to apattern of parallel lines roughly 0.4 mm apart. Ifthe model is correct it must explain the obliterationof the deprived columns at irregular intervalsalong the bands, seen in cases of early eye closure(see Figure 15), and hinted at in the eye-removalreconstructions (Figure 6). Perhaps the processbegins at multiple foci along the future bands andspreads in two directions forming line segmentswhich then join similar segments, while simultane-ously widening. (On a sprouting model one istempted to conclude that the obliteration ofcolumns here and there reflects an instability in thecolumns when they shrink beyond some limitingwidth.)
An intriguing problem arises from a consid-eration of the topographic representation of thevisual field upon layer IV C (Hubel, Wiesel &LeVay 1974). This topography is detailed enoughso that in crossing a single eye-dominance columnone can observe a precisely corresponding displace-ment of receptive fields through the visual field. Adisplacement of equal magnitude, but in the visualfield as seen by the other eye, takes place when thenext column is crossed. The representations seemto be interlaced, so that on crossing a boundarybetween columns the receptive fields in the secondeye jump back to about the midpoint of the terri-tory just traversed in the first eye. All of this meansthat the magnification (mm/deg) across a columnmust be one-half that along its length. What hap-pens, then, when two neighbouring columns aredistorted, one compressed and the other ex-panded? How do the magnifications change dur-ing development? Answers to these questions maylead to a deeper understanding of the developmen-tal mechanisms by which topographic representa-tions arise.
Finally, one may ask again whether there isany benefit to the animal in having a critical period
Plasticity of Ocular Dominance Columns 539
of postnatal flexibility. Does a virtual doubling ofthe IVth layer territory devoted to one of the eyesin any way improve the capabilities of that eye?Until behavioural tests can be made this questionmust be left open, but one would hardly expect tofind an improvement in acuity, which is presum-ably limited by such things as the optics of the eye,the inter-receptor spacing, and the number of bipo-lar and ganglion cells. If an eye is lost early in life anumber of cortical cells are clearly kept in userather than being allowed to lie fallow, but howthis helps the animal, if it does at all, is a completemystery.
We wish to thank Claire Wang, Gail Grogan and Sharon Matesfor histological assistance, and Carolyn Scott for help with pho-tography.
Supported by National Institutes of Health GrantsEY00605 and EY00606, The Esther A. and Joseph KlingensteinFoundation, Inc. and The Rowland Foundation, Inc.
References
Baker, F. H., Grigg, P. & von Noorden, G. K. 1974 Effects ofvisual deprivation and strabismus on the response of neu-rons in the visual cortex of the monkey, including studies onthe striate and prestriate cortex in the normal animal. BrainRes. 66,185-208.
Campos-Ortega, J. A. & Hayhow, W. R. 1970 A new laminationpattern in the lateral geniculate nucleus of primates. BrainRes. 20,335-339.
Guillery, R. W. \972a Binocular competition in the control ofgeniculate cell growth./. Comp. New. 144, 117-130.
Guillery, R. W. \972b Experiments to determine whetherretinogeniculate axons can form translaminar collateralsprouts in the dorsal lateral geniculate nucleus of the cat./.Comp. New: 146,407-420.
Guillery, R. W. & Stelzner, D. J. 1970 The differential effects ofunilateral lid closure upon the monocular and binocularsegments of the dorsal lateral geniculate nucleus in the cat./. Comp. New: 139,413-422.
Headon, M. P. & Powell, T. P. S. 1973 Cellular changes in the lat-eral geniculate nucleus of infant monkeys after suture of theeyelids./. Anat. (Lond.} 116, 135-145.
Hubel, D. H., LeVay, S. & Wiesel, T. N. 1975 Mode of termina-tion of retinotectal fibers in macaque monkey: an autoradio-graphic study. Brain Res. 96, 25—40.
Hubel, D. H. & Wiesel, T. N. 1968 Receptive fields and func-tional architecture of monkey striate cortex. /. Physiol.,Lond. 195,215-243.
Hubel, D. H. & Wiesel, T. N. 1972 Laminar and columnar dis-tribution of geniculo-cortical fibers in the macaque monkey./. Comp. New: 146,421-450.
Hubel, D. H., Wiesel, T. N. & LeVay, S. 1974 Visual field repre-sentation in layer IVC of monkey striate cortex. Soc. Neu-rosci., 4th Annual Meeting (Abstracts) 264.
Kalil, R. E. 1972 Formation of new retino-geniculate connec-tions in kittens after removal of one eye. Anat. Rec. 172,339-340.
LeVay, S., Hubel, D. H. & Wiesel, T. N. 1975 The pattern of ocu-lar dominance columns in macaque visual cortex revealed bya reduced silver stain./. Comp. Neur. 159,559—576.
Lund, J. S. & Boothe, R. G. 1975 Interlaminar connections andpyramidal neuron organisation in the visual cortex, area 17,of the macaque monkey./. Comp. Neur. 159,305—334.
Matthews, M. R., Cowan, W. M. & Powell, T. P. S. 1960Transneuronal cell degeneration in the lateral geniculatenucleus of the macaque monkey./. Anat. 94,145—169.
Minkowski, M. 1920 Uber den Verlauf, die Endigung und diezentrale Representation von gekreuzten und ungekreuztenSehnervenfasern bei einigen Saugetieren und bei Men-schen. Schweiz. Arch. Neur. u. Psychiat. 6,201-257.
Rakic, P. 1974 Neurons in rhesus monkey visual cortex: system-atic relation between time of origin and eventual disposi-tion. Science, N.Y. 183,425-427.
Rakic, P. 1976a Prenatal genesis of connections subserving ocu-lar dominance in the rhesus monkey. Nature, Lond. (in thepress).
Rakic, P. 1976£ Prenatal development of the visual system in therhesus monkey. Phil. Trans. R. Soc. Lond. B 278, 245-260(this volume).
Sherman, S. M. 1973 Visual field defects in monocularly andbinocularly deprived cats. Brain Res. 49,25-45.
Sherman, S. M., Guillery, R. W., Kaas, J. H. & Sanderson, K. R.1974 Behavioral, electrophysiological and morphologicalstudies of binocular competition in the development of thegeniculo-cortical pathways of cats./. Comp. Neur. 158,1-18.
Spatz, W. B., Tigges, J. & Tigges, M. 1970 Subcortical projec-tions, cortical associations and some intrinsic interlaminarconnections of the striate cortex in the squirrel monkey(Saimiri).J. Comp. Neur. 140,155-174.
von Noorden, G. K., Middleditch, P. R. & Crawford, M. L. J.1975 Disuse or abnormal binocular interaction in the etiol-ogy of amblyopia. Proc. A.R.V.O. p. 79.
Wiesel, T. N. & Hubel, D. H. 1963 Single-cell responses in stri-ate cortex of kittens deprived of vision in one eye./. Neuro-physiol. 26,1003-1017.
Wiesel, T. N. & Hubel, D. H. 1965 Comparison of the effects ofunilateral and bilateral eye closure on cortical unit responsesin kittens./. Neurophysiol. 28,1029-1040.
Wiesel, T. N. & Hubel, D. H. 1971 Long-term changes in thecortex after visual deprivation. Proceedings of the Interna-tional Union of Physiological Sciences.
Wiesel, T. N. & Hubel, D. H. 1974 Ordered arrangement of ori-entation columns in monkeys lacking visual experience. /.Comp. Neur. 158,307-318.
Wiesel, T. N, Hubel, D. H. & Lam, D. N. K. 1974 Autoradi-ographic demonstration of ocular-dominance columns inthe monkey striate cortex by means of transneuronal trans-port. Brain Res. 79, 273-279.
Wiitanen, J. T. 1969 Selective silver impregnation of degenerat-ing axons and axon terminals in the central nervous systemof the monkey (Macaco mulatto). Brain Res. 14, 546—548.

540 PART IV DEPRIVATION AND DEVELOPMENT
The Development of Ocular Dominance Columns in Normal andVisually Deprived Monkeys
SIMON LEVAX TORSTEN N. WIESEL AND DAVID H. HUBEL • Department of Neurobiology, Harvard
Medical School, 25 Shattuck Street, Boston, Massachusetts 027 75
ABSTRACT
The main purpose of this study was to examine the normal postnatal development of ocular domi-nance columns in the striate cortex of the macaque monkey and to determine how this developmen-tal process is influenced by monocular lid-suture. The physiological pattern of ocular dominance wasstudied in long, tangential electrode penetrations. For anatomical demonstration of the distributionof afferents we relied principally on the transneuronal transport of [3H]proline injected into one eye,and to a lesser extent on the Liesegang silver method. The effects of deprivation on cell size in thelateral geniculate nucleus (LGN) were also studied. Twenty-six monkeys, divided into 5 groups(A—E), were used.
A) The process of normal columnar development was examined in four monkeys aged from1 to 6 weeks. At one week, there was both an anatomical and a physiological mixing of left- andright-eye inputs to layer IVC, but the basic columnar pattern was evident, and some small regionswere already monocular. At three weeks the columnar pattern resembled that seen in the adult,except for a suggestion that the borders between columns were not so sharply demarcated. By sixweeks an adult degree of columnar segregation was established.
B) A series often monkeys had monocular suture performed at successively later ages, rangingfrom 2 days to adult, and they were allowed to survive for a long period. It was found that depriva-tion begun at any age from birth to about 6 weeks had approximately the same effect: the afferentsfor the open eye formed greatly expanded columns in layer IVC, and the columns for the closed eyewere shrunken and fragmented. In the layers above and below IVC the open eye dominated almostcompletely. At 10 weeks, closure had only a mild effect on columnar size in layer IVC. With closuresat 7—14 months there was no change in the size of columns in layer IVC, but when stained with theLiesegang silver method the deprived-eye columns were paler than those for the open eye, suggest-ing a lower density of fibers. These late deprivations still caused a shift of ocular dominance in theupper cortical layers but not such an extreme change as with earlier closures. Lid suture in an adulthad no detectable anatomical or physiological effects. Even monocular enucleation, in an adult, failedto induce sprouting of the geniculocortical afferents for the remaining eye.
C) In order to investigate the rate at which monocular deprivation produces its effects, six mon-keys were examined after short periods of deprivation in infancy. Eye-closure from birth to 3 weekswas sufficient to produce the full anatomical and physiological effects. A nine-day closure at 3 weeks,followed by reopening of the eye, also produced the full effects. A two-week period of deprivationbegun at five weeks of age, however, caused relatively mild columnar expansion in layer IVC, sug-gesting that late closures may require more time to produce anatomical changes than early closures.
D) The effects of reopening the deprived eye and closing the experienced eye (reverse suture)were studied in three monkeys. The initial lid sutures were performed in the first few days of life.With reverse suture at 3 weeks the relative sizes of the two sets of columns were reversed. Thisanatomical reversal was, however, limited to the afferents from the parvocellular laminae of theLGN; the magnocellular afferents remained in the pattern induced by the early deprivation. The lay-ers outside of IVC were strongly dominated by the initially deprived eye. Reverse suture at 6 weeksallowed an anatomical recovery of the parvocellular afferents to a normal columnar size, but not a
From Journal of Comparative Neurology 191:1—51 (1980)
Plasticity of Ocular Dominance Columns 541
complete reversal. Again, the magnocellular afferents for the initially deprived eye were not inducedto enlarge their territory. Reverse suture at 1 year of age did not lead to any recovery.
E) One monkey was reared in complete darkness from 3 days of age until 7 weeks of age. Thisanimal, studied autoradiographically, showed a normal columnar pattern in layer IVC.
We draw four conclusions from these experiments, i) Ocular dominance columns are only par-tially formed at birth but develop rapidly in the first few weeks of postnatal life. The process of seg-regation of the left- and right-eye afferents in layer IV occurs in the presence or absence of visualexperience, ii) This developmental process may be redirected by early monocular deprivation, caus-ing the segregation of the two sets of afferents into columns of unequal width, iii) A rearrangementof the afferents can be induced for a short period after their segregation is complete. This is true ofboth normal and deprived animals, iv) The eye preference of neurons in the upper and lower layersmay be changed even after plasticity in layer-IVC is no longer detectable.
Visual experience seems not to play a major role inthe development of the mammalian visual system,at least up to the level of the striate cortex. This ismost obvious for animals that are visually compe-tent at birth: neurons in the visual cortex of new-born macaque monkeys (Wiesel and Hubel, 74)and lambs (Ramachandran et al., '77) have recep-tive field properties hardly distinguishable fromthose of mature animals. In cats, born with closedeyes and immature brains, cortical receptive fieldproperties are not adult-like at birth, but continueto develop normally for several weeks postnatally,whether or not the eyes are permitted to open(Sherk and Stryker, '76).
In spite of this innate tendency towards a nor-mal functional organization, certain forms ofvisual deprivation in early life lead to alterations ordeficits in cortical structure and function. Binocu-lar deprivation, if continued for several months,causes a secondary deterioration in the responsive-ness and selectivity of cortical neurons. Monoculardeprivation—the main subject of the presentstudy—causes a loss of responsiveness to stimula-tion of the deprived eye and a correspondingincrease in the influence of the experienced eye(Wiesel and Hubel, '63). An anatomical basis forthis effect has been demonstrated (Hubel et al., '77)by the use of techniques that permit the visualiza-tion of ocular dominance columns, the corticaldomains innervated by geniculo-cortical afferentsserving the left and right eyes (Hubel and Wiesel,72; Wiesel et al., '74; LeVay et al., 75; Shatz et al.,77). In normal monkeys the columns for the leftand right eyes are, in surface view, bands of equalwidth (about 400 |J,m) that alternate with eachother to form a rather constant overall pattern inarea 17. In animals reared with one eye closed the
overall pattern of columns is normal but thecolumns for the experienced eye are abnormallywide (about 550 (Im), whereas those for the de-prived eye are shrunken and interrupted (Hubel etal., 77; Shatz and Stryker, 78).
Such plasticity is certainly related to develop-ment since it is limited to a relatively short periodin the animal's early life (Hubel and Wiesel, 70),yet the nature of the developmental processes thatpermit it, and later terminate it, is obscure. A clueto the problem, at least as it relates to the effects ofmonocular deprivation, is offered by recent obser-vations on early stages in the growth of geniculo-cortical afferents. In 1-week-old monkeys (Hubelet al., 77) we found by use of the autoradiographicmethod that the afferents for the two eyes are par-tially intermixed in layer IVC, and recordingsshowed a mixing of left- and right-eye responses,although the basic columnar pattern was alreadyevident. Rakic (76) has extended the autora-diographic observations to fetal monkeys: initiallythe two sets of afferents are completely intermin-gled, but traces of a columnar organization aredetectable by about 3 weeks before birth. A similarsequence of events has been observed in the cat(LeVay et al., 78). In this species complete overlapof left- and right-eye afferents persists until 2weeks postnatally. Segregation into columnsbegins at about 3 weeks and is completed by about7 weeks of age. Before segregation begins mostfourth-layer neurons are about equally responsiveto stimulation of either eye, suggesting that affer-ents establish functional connections in the early,overlapping pattern. In adult cats many fourth-layer neurons are monocular. Columnar develop-ment therefore seems likely to involve the break-age and re-formation of functional synapses.
542 PART IV DEPRIVATION AND DEVELOPMENT
In an attempt to link the plastic and develop-mental processes, it was suggested (Hubel et al.,'77) that geniculocortical afferents connected to aseeing eye could hold on to an abnormally largeamount of cortical territory, at the expense of theclosed eye, but could not sprout back into regionsthat they had already vacated. This would meanthat monocular deprivation can affect the course ofcolumnar segregation but cannot alter an estab-lished pattern. According to this hypothesis theeffects of monocular deprivation on the fourthlayer of the cortex would depend on the anatomi-cal distribution of the afferents at the time that lidsuture is performed, and the event that terminatesthe plasticity of the afferents would be the comple-tion of their segregation into ocular dominancecolumns. Of course, on the evidence then available,it was not possible to choose between this and anumber of other possibilities.
In the present study we have further exploredthe relationship between developmental processesand plasticity. First, we have studied the timecourse of postnatal columnar development andcompared this with the effects of monocular lidsuture performed at successively later ages. Second,we have examined whether, once the afferents fora deprived eye have settled out into their narrow,fragmented columns, they can be induced to sproutback into the territory that they have relinquished.We attempted to do this by opening the deprivedeye and closing the experienced eye (reversesuture). This procedure is known to permit arecovery of the physiological influence of the ini-tially deprived eye, if done early enough (Blake-more and Van Sluyters, '74).
Of the several techniques now available forthe study of ocular dominance columns, we haverelied primarily on two. We have used thetransneuronal autoradiographic method (Spechtand Grafstein, '73; Wiesel et al., '74) to demonstratethe anatomical distribution of the afferents servingone eye, and microelectrode recording, usually inlong tangential penetrations, to determine the eyepreference of the target neurons in the fourth layer,as well as that of higher-order neurons in the upperand lower cortical layers. We have also made use,in the more mature animals, of the Liesegangreduced-silver method (LeVay et al., '75). In addi-tion to the study of cortical columns, we have
examined the effects of visual deprivation on cellsize in the lateral geniculate nucleus.
METHODS
The experimental animals were 26 macaque monkeys,bred at the New England Regional Primate Center. Allwere rhesus monkeys (Macaca mulatta) except for onepigtailed macaque (M. nemestrina). They fall into fivegroups, as detailed in Table 1. Group a consisted of fournormal animals, ranging in age from 6 days to 6 weeks.The main purpose of studying these animals was todetermine the time course of the development of oculardominance columns. Group B consisted of 12 monkeysthat were monocularly deprived, starting at successivelylater ages, ranging from 2 days to adult. In ten of these,deprivation was produced by lid suture, and in two (bothadults), by monocular enucleation. The period of depri-vation ranged from 7 weeks to 4 years and was followedin a few cases by the reopening of the deprived eye and afurther survival period of 4 to 12 months. The intentionwith this group was to follow the decline in susceptibil-ity to the effects of lid suture with increasing age, and tocompare the time course of the decline with that of nor-mal columnar development. The third group (C—fivemonkeys) underwent short periods of monocular depri-vation in the first few weeks of life. The object here wasto determine how fast the anatomical effects of monocu-lar deprivation developed. The animals in group D(three monkeys) were also monocularly deprived fromthe first week of life, but at varying times thereafter thedeprived eye was reopened and the experienced eyesutured shut. The animals were then allowed to surviveuntil 9 months to 3.5 years of age. It was intended, bycomparing results in this group with those from thethird group, to determine whether reverse suture couldcause a reexpansion of shrunken columns. Finally, onemonkey (E) was raised in complete darkness from 3 daysto 7 weeks of age.
Most of the animals were studied both autora-diographically and physiologically. In a typical case, themonkey received an injection of 3H-proline (2 mCi of 2,3-[3H]L-proline, specific activity 20-40 Ci/mmole, in 50 |ilof normal saline) into the vitreous of one eye, 1-2 weeksbefore a terminal physiological experiment. The eyeinjection was done under combined ketamine/pentobar-bital anesthesia, and the labeled compound was deliveredover 5-10 minutes through a 27-gauge needle, which wasinserted through the sclera just behind the ora serrata atthe lateral margin of the eye. In some experiments, a mix-ture of tritiated proline and fucose was injected. Whenlid-sutured eyes were injected, the lids were notreopened: The injection was made through a skin inci-

Table 1. Summary of Experimental Protocols and Key to Figures
543
No.
A 230243256257
B 201206157202282365198185286280150
269
C 164308316307195213
D 240194203
E 266
Age atclosure
——_
2 days1 1 days2 weeks3 weeks5.5 weeks10 weeks7 months1 year14 months6 yearsadult(enucl.)adult(enucl.)8 days2 days2 days4 days21 days5 weeks2 days3 days7 days3 days(darkness)
Age at Age at Age atreopening reversal death
— — 6 days— — 8 days— — 3 weeks— — 6 weeks7 weeks — 7 months— — 6 months— — 18 months— — 6 months16 months — 20 months— — 6 months4 years — 5 years— — 2 years28 months — 33 months— — 7.5 years— — 6 months
post-op.— — 4 months
post-op._ _ 20 days— — 24 days— — 23 days— — 47 days30 days — 4 years7 weeks — 10 weeks— 3 weeks 9 months— 6 weeks 6 months— 1 year 3.5 years— — 7 weeks
Eyeinjected
L—RRRRLRLLR—LL—
L
LRLR—LRRRR
Side ofrecording
RRL—LLL,RRR—L—RL
—
RL—RL—RLR—
Figures
123,45-789,1011-1314,1516-1819-21222523,2426,27—
28
3031,32—33,3435,363738-4041-4344,4546
sion lateral to the lateral canthus. Methods for physiolog-ical recording were as described previously (Hubel andWiesel, '68). Usually an attempt was made to aim the elec-trode penetrations so that they ran for some distance tan-gentially in the fourth layer of the exposed, opercularregion of area 17 (LeVay et al., '75; Hubel et al., '77).Points of transition in ocular dominance were markedwith small electrolytic lesions (1 [lA for 1 second).
The animals were perfused with 10% formol-saline.Blocks taken from area 17 and from the lateral genicu-late nucleus were left in the same fixative for a week,sunk in 30% sucrose in formol-saline, and frozen-sectioned at 20 |J,m. The cortical blocks were usuallytaken in such a way as to permit sectioning in a planetangential to the exposed opercular region of area 17.The sections were processed for autoradiography, usingKodak NTB2 emulsion and Kodak D19 developer.Exposure times were from 1 to 6 months. Development
conditions were adjusted so as to maximize labeling den-sity while keeping background at acceptable levels. A 3-minute development at 23°C was often found best. Inter-spersed with the autoradiographs, sections were stainedwith thionin and sometimes with the Liesegangreduced-silver method (LeVay et al., '75).
Low-power, dark-field micrographs were obtainedfrom the tangential autoradiographs with a high inten-sity light source (Sage Instruments model 281) and acamera equipped with a macro lens and bellows exten-sion. Prints were made of every fourth section (i.e., every80 Jim). Reconstructions of the columnar labeling pat-tern were made by carefully tearing the region out ofeach print that included layer IVC and gluing the seriestogether to make a montage, which was rephotographedwithout retouching.
For the measurement of columnar area, the labelingpattern was traced from the original montages onto
Plasticity of Ocular Dominance Columns

544 PART IV DEPRIVATION AND DEVELOPMENT
heavy acetate film of uniform thickness, cut into left- andright-eye columns, and weighed. The area measuredwas generally the same as that shown in the figures—about 50 mm2 in most cases.
For the reconstruction of electrode tracks a separateseries of micrographs was taken at higher magnification,from both the autoradiographs and the interspersedNissl sections. It was generally necessary to photographevery section that included a portion of the track. Inthese micrographs, large, transversely sectioned bloodvessels were visible, and these were used as fiducialmarks for the subsequent tracing of the track, the elec-trolytic lesions, and the autoradiographic labeling pat-tern. Finally, the position of all recording sites was calcu-lated from the readings on the electrode advancer andfrom the positions of the lesions, and the ocular domi-nance of the activity recorded at each site (while the elec-trode was traveling tangentially in layer IVC) was addedto the reconstruction.
The eye preference of neurons recorded in layersabove and below layer IVC was tabulated in the form ofocular dominance histograms. From each histogram wasderived a figure (ocular dominance index) representingthe overall balance between the two eyes in that animal.The ocular dominance index is simply the mean oculardominance value for all neurons recorded outside oflayer IVC. The index is somewhat artificial, based as it ison a nonquantitative estimate of ocular dominance foreach cell, but it is a useful means of comparison betweendifferent animals.
For the measurement of cell size in the LGN, coro-nal sections from the middle of the anteroposteriorextent of the nucleus were stained with cresyl violet. Theoutlines of 100 cells in the middle of lamina 6 weredrawn at a magnification of 2,000 X, using a microscopewith a camera lucida attachment, and the same numberwere drawn in the adjacent region of lamina 5. Thus formost animals a total of 400 cells were measured. In a fewanimals the measurements were extended to the otherlaminae, making a total of 1,200 cells per animal. Themean cross-sectional area for cells in each lamina wasthen determined with the help of a PDP-11 computerequipped with a graphic tablet. It should be stressed thatpreparative techniques varied considerably (for example,celloidin rather than frozen sections were occasionallyused), and absolute differences in cell size between ani-mals probably reflect these variations.
RESULTS
A. Normal DevelopmentIn order to establish the time course of normaldevelopment of ocular dominance columns, five
monkeys, extending in age from 6 days to 6 weeks,were examined.
Six DAYS (No. 230). Results for the two youngestmonkeys, examined at 6 and 8 days of age, havebeen described in detail previously (Hubel et al.,'77) and will only be summarized here. The 6-day-old monkey (No. 230) had received an eye injectionof [3H]fucose on the day after birth, and it died 5days later. Autoradiography of tangential sectionsof area 17, ipsilateral to the injected eye, showed abanding pattern suggestive of ocular dominancecolumns (Fig. 1), but it was an extremely blurredpattern compared with that seen in the adult. Thedensity of grains in layer IVC waxed and wanedgently without ever dropping towards backgroundlevels. On the contralateral side only parasagittalsections were taken. In these sections layer IVCappeared uniformly labeled throughout its extent,with no hint of any columnar pattern of labeling(not illustrated; see Fig. 25 A of Hubel et al., 77).
EIGHT DAYS (No. 243). This monkey was studiedphysiologically at 8 days of age, but no eye injectionwas made. A reconstruction of the four electrodepenetrations, along with the ocular dominance ofunits or unresolved background activity recorded,is shown in Figure 2. Just as one might have imag-ined from the autoradiographic results in the pre-vious animal, there was much more mixing ofright- and left-eye activity in the fourth layer thanthere is in the adult, and at some of the recordingsites binocularly activated single cells wererecorded. These cells, like those recorded in layerIVC in the adult monkey, lacked orientationspecificity. Nevertheless, there was on the whole aclear grouping of cells according to eye preference,and for one stretch of about 300 flm the contralat-eral eye dominated completely. It should beemphasized that, with the electrodes used in thepresent study, single units were not often isolatedin layer IVC. The ocular dominance values givenin the figures refer mostly to the overall eye prefer-ence of the multi-unit activity recorded at eachsite.
THREE WEEKS (No. 256). The right eye of thismonkey was injected with [3H]proline when it was13 days old, and recordings were made 8 days laterwhen it was 3 weeks old. In this and subsequent

Plasticity of Ocular Dominance Columns 545
Fig. 1. Dart^-field micrograph of autoradiographic labeling pattern in the striate cortex of a normal 6-day-oldmonkey, ipsilateral to the eye that had been injected with [3H]fucose 5 days earlier. This is a single section thatgrazes layer IVC tangentially in the central oval region. Silver grains are distributed continuously over layerWC, but there are bands of alternating higher and lower grain density, indicating that afferentsfor the two eyesare already in the process of columnar segregation. In this and subsequent figures, the number and letter give theanimal's identification number and the side of the brain illustrated. The unlabeled bar is 1 mm in all figures.From Hubel et al. (77).
monkeys the autoradiographic results will be pre-sented first, because the findings from the tangen-tial electrode penetrations can be best understoodin terms of the distribution of left- and right-eyeafferents existing in that animal.
Ocular dominance columns were clearly visi-ble in layer IVC on both sides of the brain (Fig. 3).On the right side (ipsilateral to the injection) thecolumnar pattern was almost as clear as it is inadults, while on the left (contralateral) side the pat-tern was still rather blurred.
Two tangential electrode penetrations weremade into the right hemisphere. During the pas-sages through layer IVC eye preference swungbetween complete contralateral (O.D. group 1) andcomplete ipsilateral (group 7) eye dominance. Thisis illustrated for penetration No. 2 in Figure 4,which shows a Nissl preparation with two mark-ing lesions, autoradiographs of two neighboringsections, and a reconstruction of the same region ofthe electrode track, with the ocular dominance ofthe neuronal activity recorded at each site. The
transitions in eye preference were slightly lessabrupt than is seen in adult monkeys. At onerecording site a binocular single unit was recorded(O.D. group 5), but most of the recordings were ofthe massed background activity ('hash') that ischaracteristic of layer IVC.
THREE WEEKS (No. 202). Another monkey (No.202) was studied physiologically at the same age. Itdid not receive an eye injection and after therecording session it was resuscitated to be used aspart of the deprivation series (see section B). A sin-gle short pass-through layer IVC yielded strictlymonocular responses (see Fig. 27 of Hubel et al.,'77), and in other layers an adult-like pattern ofocular dominance was also evident. The resultsfrom this animal were useful, not only in confirm-ing that the development of ocular dominancecolumns is complete, or nearly so, by 3 weeks ofage, but also in demonstrating that the eye injec-tions do not themselves cause any obvious alter-ation in the rate of columnar development.

546 PART IV DEPRIVATION AND DEVELOPMENT
Fig. 2. Reconstruction of four electrode penetrations into the striate cortex of a normal 8-day-old monkey. Thefour penetrations were made in the same parasagittal plane. The circles indicate the positions of marking lesions.The ocular dominance of all activity recorded in layer 1VC has been plotted as a function of cortical position,below left. Unlike the situation in adults, binocular multi-unit activity could be recorded at many sites, althougha columnar organization was already evident, and the region at the extreme left was already influenced only byone eye (the contralateral eye). The smaller right-hand portion of the graph shows the ocular dominance of unitsrecorded in the upper cortical layers during the same penetrations. A columnar organization is suggested here
too. From Hubel et al. ('77).
Six WEEKS (No. 257). The final monkey of this
group, No. 257, received an injection of [3H]pro-
line into the right eye at 30 days of age, and record-
ings were made 12 days later when it was 6 weeks
old. The autoradiographic labeling pattern in the
visual cortex (Figs. 5 and 6) was very similar to that
seen in the adult. The pattern was slightly less
sharp in the left hemisphere than in the right hemi-
sphere: this was due to the presence of more label
in the gaps between the labeled columns.
One penetration was made into the left hemi-
sphere (Fig. 7). The electrode traveled 2.26 mm
tangentially in layer IVC, recording only non-
oriented responses. For the first 1.50 mm of this
pass, activity was completely dominated by the left
eye (group 7). Then (lesion No. 1) there was a rapid
shift to the right eye, which dominated completely
for 600 |Im, after which there was another reversal,
shortly before the electrode entered the fifth layer.
The marking lesions, accompanying autora-
diographs and track reconstruction are shown in
Figure 7. It may be noted that the changeover
between the two eyes occurred over a distance of
not more than 100 Jim. Such very narrow zones of
Fig. 3. Autoradiographic labeling pattern in the right and left hemisphere of a normal 3-wee\-old monkey. Theupper half of the figure is a montage of tangential sections from the right hemisphere (ipsilateral to the injectedeye); the lower half is a single section from the left hemisphere. The autoradiographs show a columnar patternthat is much advanced over that seen at 1 wee\ (Fig. 1). The only difference from the normal adult pattern is aslight blurring of the margins of the labeled bands, suggesting a modest intermixing of left- and right-eye affer-ents at the borders of ocular dominance columns. The boxed area indicates the region of an electrode penetra-
tion, reconstructed in Figure 4.

547
Fig- *

Figure 4
Fig. 4. Reconstruction of a tangential electrode penetration in a normal 3-wee1{-old monkey (see boxed area inFig. 3). In this and all subsequent tract{ reconstructions the following conventions are adopted. The tracf( isshown as a straight line except for the region where it traverses layer IVC, where it is shown as a string of num-bers. Each of these numbers indicates the ocular dominance of a unit or (more commonly) the multi-unit activ-ity recorded at that position on the trac\. The circles indicate the positions of electrolytic lesions. Often (as withlesion 4 in this figure) the lesions were placed to mar^ the transition in ocular dominance from one eye to theother. Lesions were also often placed at the ends of penetrations (as with lesion 5 in this figure). The pattern ofautoradiographic labeling in the region of the tract^ is also reconstructed. The labeled regions are closed off at theedges of the figure; the unlabeled regions are left open. The micrographs (A-C) are part of the series on whichthe reconstruction is based. B is a c resylv iolet-stained section showing the positions of lesions 4 and 5. A and Care autoradiographs of neighboring sections. Registration between sections was achieved by lining up large, ver-tically oriented blood vessels.
548

Plasticity of Ocular Dominance Columns 549
Fig. 5. Autoradiographic montage from a 6-wee\-old normal monkey, ipsilateral to the injected eye. The labeledbands are as sharply defined as in adults.
overlap are seen in normal adults and may repre-sent an actual mixing ofleft- and right-eye activityat the border or, more likely, may mainly reflect thesize of the uninsulated electrode tip.
CommentThese findings indicate that geniculocortical affer-ents for the left and right eyes show substantialoverlap at birth, are nearly completely segregatedat 3 weeks of age, and have reached the maturecolumnar organization at 6 weeks of age. Thereare some reasons to think that the process of segre-gation occurs rather more rapidly than is suggestedby the autoradiographs. First, there is evidence
from work on the cat that the leakage of labelbetween laminae of the lateral geniculate nucleusdegrades the cortical labeling pattern in young ani-mals, especially on the side contralateral to theinjected eye (LeVay et al., 78). Second, the physio-logical results, while generally in good agreementwith the anatomy, gave no hint of a residual pres-ence of contralateral eye afferents in ipsilateral eyecolumns at 6 weeks of age (see Fig. 7). These issueswill be taken up more fully in the Discussion.
B. Effects of Monocular Deprivationbegun at Successively Later AgesThis section describes the results of experiments onmonkeys that had one eye closed at ages ranging

550 PART IV DEPRIVATION AND DEVELOPMENT
Fig. 6. Autoradiographic montage for the same 6-weel{-old monkey, contmlateral to the injected eye. The labeledbands are slightly less well defined than ipsilaterally, owing to the presence of a certain amount of label in thegaps between them. This may be attributable to spillover of radioactivity between laminae of the LGN (see text).An electrode penetration was made in the boxed area (see Fig. 7).
from 2 days to adult, and that were allowed to sur-vive for a substantial period thereafter. The righteye was closed in every case. The intent was todetermine whether there was a clear relationshipbetween the effects of eye closure and the state ofcolumnar segregation existing at the time of oper-ation, as predicted by our hypothesis (see introduc-tion). Although the exact length of the survivalperiod varied from animal to animal, and was evenin some cases followed by a surgical reopening ofthe deprived eye, for the purpose of behavioral test-
ing (see Table 1 for details) we believe that the ageat which the initial operation was performed wasthe most important variable and was responsiblefor most if not all of the differences observed in thedifferent experiments (see Discussion). The majorquantitative results from these monkeys—the ocu-lar dominance index derived from recordings(excluding layer IVC), the ratio of column areasderived from the autoradiographic montages, andthe mean size of cells in laminae 5 and 6 of theLGN—are summarized in Table 2.

551
Fig. 7.

552 PART IV DEPRIVATION AND DEVELOPMENT
OCULAR DOMINANCE RATIO OF COLUMN
INDEX
No. L R
201 — —206 1.42 —157 2.05 —202 1.80 2.03282 — 1.10365 — 1.80198 — —185 2.75 —286 — —280 — 3.95150 — —269 — —
AREAS
L R L6 (dep.)
LGN CELL SIZE
(|1M2)
L5 R6 R5 (dep.)
— — (unavailable)3.8:13.2:11.6:13.2:11.0:1——1.0:10.9:1
3.3:1—2.2:13.8:11.6:1——1.0:11.1:1
140128156171172144165198192
204184197250191182172202194
198150184213210175172183199
140108154151177137*173168204
— — (unavailable)1.0:1 1.0:1 128 186 177 103
The headings L and R refer to the side of the brain studied, not the left and right eyes. The ocular dominance index is a measure of averageocular dominance of all cells recorded in each hemisphere with the exception of those in layer IVC. Figures from recordings in the left hemi-sphere have been reversed, so that in all cases an index of 1.0 would represent complete dominance of the left (experienced) eye and an indexof 7.0 would represent complete dominance of the right (deprived eye). The ratio of column areas is the ratio of left-eye to right-eye areas inthe autoradiographic reconstruction (usually the same reconstructions that are reproduced in the illustrations). The ratio was obtained bytracing the original photomontage onto acetate film, and cutting and weighing the labeled and unlabeled areas. The LGN cell sizes wereobtained tracing 100 cells from the middle of each lamina onto a graphic tablet connected to a PDP-11 computer. The laminae innervatedby the deprived eye are indicated (dep.)
* The apparent deprivation effect on cell size in monkey No. 198 is probably an artifact reflecting damage to the retina of the right eye dur-ing the injection of isotope (see text).
Two DAYS (No. 201). The first monkey in thisseries underwent lid suture of the right eye at 2days of age, that is, at an age when there exists apronounced overlap of the left- and right-eye affer-ents in layer IVC. The eye was reopened at 7 weeksof age, and at 7 months of age the same eye wasinjected with tritiated proline and fucose. Themonkey was perfused 15 days later, withoutrecordings being made. (From our previous expe-rience we would expect the left eye to be strongly
dominant in the cortex of this animal; the laterreopening of the right eye was not likely to have
affected the physiological balance between theeyes.)
The eye injection was only partially success-ful: a small part of the ipsilateral LGN, and a cor-responding region of cortex in the ipsilateral cal-carine fissure, were labeled. Nevertheless thelabeling in this region of cortex was excellent (Fig.8). The labeled patches were about 200 |Llm acrossand separated by gaps about 600 |lm in width(uncorrected for shrinkage). In addition, the
labeled patches seemed mostly to be confined to thelower part of layer IVC, called IVCJ3, which
Fig. 7. Electrode penetration in the cortex of a normal 6-weef^-old monkey (enlargement of boxed area in Fig.6). B is a cresylviolet-stained section showing two lesions. A and C are neighboring sections processed for autora-diography. D is a reconstruction of the tracf^ (conventions the same as for Fig. 4). For the first part of the traversethrough layer IVC the electrode was moving lengthwise along the middle of an unlabeled band (column for theipsilateral eye), and responses were completely dominated by that eye (O.D. group 7). At the point marked bylesion 1 equal activity from both eyes was recorded (O.D. group 4). The lesion lay exactly on the border of alabeled band. Group 1 activity was recorded as the electrode crossed that band, followed by another reversal togroup 7 (not marked by a lesion) as it moved into a second unlabeled band. Shortly thereafter (lesion 2) the elec-trode entered layer V.
Table 2. Quantitative Physiological and Anatomical Results for the Animals in Section B

Plasticity of Ocular Dominance Columns 553
Fig. 8. Autoradiograph from the right cortex of a monkey (No. 201) whose right eye was closed from 2 days ofage to 7 weet^s of age. The eye was then reopened, and at 7 months it was injected with [*H]proline. This is asingle section, cut perpendicular to the layers in the cortex of the calcarine fissure, i.e., in the representation ofthe far periphery of the visual field. The columns for the deprived eye are markedly reduced in width in layerWC but appear comparatively intact in the upper tier, layer IVA. From Hubel et al. ('77).
receives afferents from the parvocellular laminae(3-6) of the LGN (Hubel and Wiesel, 72). Many ofthe patches did not extend up into IVCOC, whichreceives input from the magnocellular laminae (1and 2) of the LGN. This picture suggested that thedeprived magnocellular afferents had been evenmore severely affected than the parvocellular affer-ents. It should however be borne in mind that innormal animals layer IVCa is more lightly labeledthan is IVCP, so that the residual input from thedeprived magnocellular lamina may have beensomewhat more extensive than is suggested by Fig-ure 8. The input to layer IVA (whose innervation isfrom the parvocellular laminae of the LGN)seemed relatively less affected by the closure. Wehave, however, observed changes in column widthin this layer in other monocularly deprived mon-keys.
ELEVEN DAYS (No. 206). This monkey's right eyewas closed at 11 days of age. At 6 months an injec-tion of tritiated proline and fucose was made intothe same eye, and recordings were made 14 dayslater.
The autoradiography showed markedshrinkage of the right-eye columns on both sides ofthe brain (Fig. 9, Table 2). The shrinkage was per-haps not quite so severe as in the previous monkey:In particular, the labeled columns were clearly vis-ible in both sublaminae of layer IVC.
Two penetrations were made into the lefthemisphere. In both penetrations the experienced(left) eye dominated almost completely in the layersoutside of layer IVC, as shown in histogram formin Figure 10. The few cells responsive to the righteye were encountered in the upper part of layer IV.In layer IVC a combined traverse of 5 mm yieldedonly four short regions (50—150 |Im long) in whichresponse to stimulation of the right eye could beobtained, and even within these regions the influ-ence of the left eye never entirely disappeared. It isnot clear whether this overlap of activity wascaused by a true extension of the left-eye afferentsthrough the right-eye regions, or whether it wasdue to limited electrophysiological resolutionwithin the diminutive right eye columns.
Two WEEKS (No. 157). Monkey No. 157 has beendescribed in detail previously (Hubel et al., '77—monkey No. 3). The right eye was closed from 2weeks to 18 months of age. The left eye wasinjected with tritiated proline and fucose, andlesions were made in single laminae of the LGN(for the purpose of demonstrating cortical columnsfor both eyes with the Nauta method). Recordingswere made from the right hemisphere.
The autoradiographic labeling pattern isshown for the left hemisphere in Figure 11. Thelabeled bands—corresponding to ocular domi-nance columns for the open eye—were about 2.5

554 PART IV DEPRIVATION AND DEVELOPMENT
Fig. 9. Autoradiographs of single tangential sections from the left and right opercular cortex of a monkey (No.206) whose right eye was closed at 11 days of age. The same eye was injected with [^HJproline at 6 months ofage. There is clear shrinkage of the right-eye columns. The shrinkage appears somewhat less than in monkey No.201 (Fig. 8), but this may be due to the difference in the region of cortex studied and the plane of section, ratherthan to the difference in the age at suture.
Fig. 10. Ocular dominance histogram for cells recorded inmonkey No. 206. In the compilation of this and subsequentO.D. histograms, cells recorded in layer IVC have beenexcluded. The letter D indicates the side of the histogram cor-responding to dominance by the deprived eye. Of the 67 neu-rons recorded only 10 were influenced by the deprived eye,and these were situated in the upper part of layer TV.
times wider than the unlabeled bands, and the lat-ter were not only shrunken but also markedly frag-mented. The overall ratio of labeled to unlabeledareas (open-eye to deprived-eye columns) in thereconstruction was 3.23, compared with a figure of1.05 obtained from a normal adult. In the right
hemisphere only parasagittal sections were taken.These showed a deprivation effect that was if any-thing even more marked, but in the absence of tan-gential sections the ratio of the areas could not bemeasured. On this side it was possible to traceafferents for the deprived eye also, by making useof the single-lamina lesions in the LGN. Theseprojected exactly to the narrow gaps in the band ofautoradiographic label (not illustrated—see Fig. 18ofHubeletal.,77).
The physiological results for this animal havealso been described previously. To summarize:most cells in the upper layers were driven exclu-sively from the left eye (Fig. 12). In layer IVC therewere alternations between complete right-eye andcomplete left-eye dominance. The stretches inwhich the right eye dominated were very short,and lesions showed them to correspond exactly tothe gaps in the autoradiographic labeling pattern(Fig. 13).
THREE WEEKS (No. 202). The next monkey wasalso described in our previous paper (Hubel et al.,77—monkey No. 4). Its right eye was closed at 3weeks of age, i.e., at a time when the columnar sys-tem has very nearly reached its mature state of

Plasticity of Ocular Dominance Columns 555
Fig. 11. Autoradiographic montage from a monkey (No. 157) whose right eye was closed at 2 weef^s of age. Theleft eye was injected 18 months later. The reconstruction shows expansion of the labeled columns for the openeye and shrinkage of the unlabeled columns for the deprived eye, with preservation of the normal columnar peri-odicity (about 750 jumfor a left-right pair). The overall pattern is also normal: the columns are oriented orthog-onal to the 17—18 border, which runs along the top of the figure. The boxed area indicates the region of an elec-trode penetration that is reconstructed in Figure 13.
development (compare normal monkey No. 256,Figs. 3 and 4). This is the animal, mentioned in sec-tion A, from which we recorded twice: once at 3weeks, immediately before the lid suture, and oncein a terminal experiment when it was 6 months old.
Before the final experiment the right(deprived) eye was injected with tritiated prolineand fucose. The labeling pattern in the right cortexis shown in Figure 14. There was again a markeddeprivation effect, although it was less pronouncedthan in the previous animals, particularly on theleft side. The ratio of unlabeled to labeled areas(columns for experienced and deprived eyes) was2.16:1 on the right side and 1.6:1 on the left side.
Long tangential penetration was made inboth hemispheres. As with the previous monkey,the experienced (left) eye dominated very stronglyin the upper layers (Fig. 15), and in layer IVC therewere alternations in eye preference that could bematched to the autoradiography (not illustrated).
FIVE AND ONE-HALF WEEKS (No. 282). Since mon-key No. 202 showed a marked effect of depriva-tion, even though columnar segregation was prob-ably all but complete at the time of lid suture, wewent on to study animals deprived at even laterages. Monkey No. 282 had its right eye closed at 5.5weeks of age, i.e., at a time when we are confident

556 PART IV DEPRIVATION AND DEVELOPMENT
Fig. 12. Ocular dominance histogram for 100 cells recordedon four penetrations in monkey No. 157 (cells in layer IVCexcluded).
that columnar segregation is complete (comparenormal monkey No. 257, section A). This eye wasreopened at 16 months of age and recordings weremade 4 months later. The left eye was injected with[3H]proline 18 days before the experiment.
The autoradiography showed a very markedexpansion of the left-eye columns on both sides ofthe brain (Fig. 16, Table 2). The unlabeled areaswere not only narrow but also very fragmented,especially on the right side of the brain where thecolumnar pattern was all but obliterated. The ratioof labeled to unlabeled areas (experienced- todeprived-eye columns) was 3.2:1 on the left sideand 3.8:1 on the right side.
This markedly abnormal picture was fullysupported by the physiology. Two penetrationswere made into the right hemisphere. In both,activity in the upper layers was driven almostexclusively by the left eye (Fig. 17), and in layerIVC there were regular alternations between left-eye and right-eye dominance, with the left-eyestretches about 3 times longer than those for theright eye. Figure 18 illustrates one of these pene-trations. All in all, the results from this monkeywere almost identical to those obtained from mon-keys deprived at earlier ages.
TEN WEEKS (No. 365). This animal's right eye wasclosed at 10 weeks of age. Its left eye was injectedwith [3H]proline at 6 months of age, and record-ings were made 10 days later.
Figure 19 shows the labeling pattern in thecortex. On the left side the labeling pattern wasnormal (ratio of labeled to unlabeled areas: 1.04:1).On the right side there was a slight but definiteexpansion of the labeled (open-eye) columns. Theratio of labeled to unlabeled areas in the recon-struction shown in Figure 19 was 1.55:1. This fig-ure was confirmed for a second reconstruction ofanother region of cortex, also on the right side.
In the recording session 4 penetrations weremade into the right hemisphere. In the layers out-side of layer IVC there was a strong dominance ofthe open eye, with 99 out of the 118 recorded cellsbelonging to O.D. groups 1 or 2 (Fig. 20). The fourtraverses through layer IVC were all rather short;one of them, which passed through a left-eye col-umn, is reconstructed in Figure 21.
The mild anatomical effects in layer IVC aresupported by the measurement of cell size in theLGN (Table 2). On the right side (ipsilateral to theclosure) cells in the deprived lamina 5 were 16%smaller than cells in lamina 6. On the left side cellsin lamina 6 were 10% smaller than those in lamina5. In addition, cells in the deprived laminae werenoticeably paler than those in laminae innervatedby the open eye.
SEVEN MONTHS (No. 198). This monkey's right eyewas closed at 7 months of age. It was reopened at 4years, and 1 year later the same eye was injectedwith [3H]proline and [3H]fucose. The monkey wasperfused 15 days later; no recordings were made.
The eye injection successfully labeled only asmall part of the cortex, in the calcarine fissure onthe left side. In this region the labeling patternappeared completely normal (Fig. 22).
ONE YEAR (Nos. 185 AND 286). Two monkeys hadlid sutures at about 1 year of age (Table 1). One ofthese (No. 286) was studied autoradiographicallyafter an injection of [3H]proline into the left (non-deprived) eye. Reconstruction from these autora-diographs (Fig. 23) showed a completely normalcortical labeling pattern. This was confirmed byarea measurements: the ratio of labeled to unla-beled areas was 1.00:1 on the left side and 1.05:1 onthe right (Table 2).
In spite of the normal autoradiographic pat-tern in monkey No. 286, the application of the

Fig. 13. Reconstruction of a tangential electrode penetration in monkey No. 157. The region illustrated corre-sponds to the boxed area in Figure 11. A to D are selected sections stained with the Liesegang silver method toshow lesions (A and C) or processed for autoradiography (B and D). The Liesegang sections do not show thecolumnar pattern because the section plane is insufficiently tangential to the layers in this region. E is a recon-struction of the trac\ and the columnar pattern in the area. The electrode advanced from right to left; the fourlesions are numbered m reverse order because they were made during withdrawal of the electrode (a proceduresometimes used to permit the physiological observations to be repeated before the lesions were placed).
557

558 PART IV DEPRIVATION AND DEVELOPMENT
Fig. 14. Autoradiographic montage from the right hemisphere of monkey No. 202, whose right eye was closed at3 wee^s of age. The same eye was injected with [3H]proline at 6 months of age. The montage shows markedshrinkage of columns for the deprived eye. The picture is roughly complementary to that seen in monkey No. 157(Fig. 11). The overall pattern of columns is different from Figure 11 because the specimen was fallen from a dif-
ferent region ofopercular cortex (well removed from the 17-18 border), where the bands are more confluent andirregular (LeVay et al., '75). From Hubel et al. ('77).
Liesegang silver method (LeVay et al., '75)revealed a clear abnormality in the fourth layer,both in monkeys No. 286 and 185. The bands forthe deprived eye, as revealed with the fibermethod, were distinctly lighter in color than thebands for the normal eye. This effect is illustratedin Figure 24 for monkey No. 286. In normal ani-mals the border zones between left- and right-eyecolumns show up in Liesegang preparations asthin, pale bands about 50—100 |Im wide, and thecolumns themselves appear as darker bands about300 |Im wide. In these late-deprived monkeys thepaleness of the deprived columns caused them tomerge visually with the thin 'borderline' bandsadjacent to them, making them appear wider thannormal. Thus the main impression sustained oninspection of these sections at low power (Fig. 24B)is of the remaining dark bands, corresponding (as
shown by autoradiography and recording) to thecolumns for the non-deprived eye. Whatever thebasis for this effect (see Discussion), it does notseem to be reflected in any abnormality in genicu-late cell size (Table 2).
Recordings made from monkey No. 185 alsoindicated a physiological effect of late deprivation,but it was restricted to the layers outside of layerIVC. In these layers the left (open) eye dominatedstrongly, as may be seen in the histogram (Fig. 25).In layer IVC there was alternation in eye prefer-ence at what seemed to be normal intervals, andthese corresponded to the columnar boundaries asdetermined anatomically.
Six YEARS (No. 280). Monkey No. 280 had its righteye closed when it was 6 years old, i.e., fully adult.After a survival period of 17 months the left eye

Plasticity of Ocular Dominance Columns 559
was injected, and recordings were made 21 dayslater.
As expected, the autoradiographic labelingpattern was entirely normal on both sides of thebrain; Figure 26 shows a reconstruction from theleft hemisphere. In Liesegang silver preparations,the columnar pattern was also normal.
Recordings were made from the right hemi-sphere. They showed a normal balance of the eyesin the layers outside of layer IVC (Fig. 27), and inlayer IVC there were recorded the usual monocu-lar responses with sharp transitions from one eye tothe other.
ADULT ENUCLEATION (Nos. 150 AND 269). Al-though lid suture is clearly ineffective in causingcolumnar reorganization in the adult, we thoughtthat the more drastic operation of monocular eyeenucleation might produce an effect. This was
because, unlike lid suture, eye nucleation leads torapid transneuronal atrophy in the LGN, even inadult monkeys (Minkowski, '20; Matthews et al.,'60; LeVay, '71). We therefore removed the righteye from two adults (Nos. 150 and 269) andallowed them to survive for 4 months (No. 269) and6 months (No. 150).
Monkey No. 150 did not receive an eye injec-tion, but we made recordings from the left hemi-sphere (contralateral to the enucleation) 6 monthsafter the operation. In the upper layers there werecontinuous responses to stimulation of the remain-ing eye, with some waxing and waning in the levelof responsiveness. There were orderly shifts in ori-entation preference as found in normal monkeys.
There were four traverses through layer IVC,the longest being about 5 mm in length. The levelof responsiveness to visual stimulation waxed andwaned periodically, as the electrode advanced, butthere were only two short stretches, about 50 |Imlong, where absolutely no visual responses could beelicited. This pattern suggested that the enucle-ation had permitted a definite expansion, even inlayer IVC, of the physiological columns for theremaining eye.
The other enucleated monkey (No. 269) wasstudied autoradiographically 4 months after theoperation. The remaining eye was injected with[3H]proline 12 days prior to perfusion. No record-ings were made.
Somewhat to our surprise the labeling patternin this animal was entirely normal in both hemi-spheres. A reconstruction of the labeling pattern inthe left hemisphere is shown in Figure 28. Thisreconstruction is made from an area of cortex inthe roof of the calcarine fissure, and it includes partof the representation of the optic disc in the con-tralateral (enucleated) eye. In this area (just as innormal animals) the afferents for the ipsilateral eyeform a uniform, roughly circular patch withoutany gaps. This figure points up the differencebetween the labeling pattern produced when opticnerve fibers for one eye are missing during fetaldevelopment (complete filling-in by the other eye)and the pattern produced when one set is removedin the adult, after all development is complete (lackof reinvasion by fibers for the other eye).
We do not understand the reason for theapparent discrepancy between the results fromthese two monkeys. Clearly one needs to do the
Fig. 15. Ocular dominance histograms for penetration in theleft and right hemispheres of monkey No. 202. There is astrong dominance of the open eye in both hemispheres,although the samples are rather small. As before, the letter Dindicates the side of the histogram corresponding to domi-nance of the deprived eye.

560 PART IV DEPRIVATION AND DEVELOPMENT
Fig. 16. Autoradiographic montages from the right and left hemispheres of monkey No. 282, whose right eye wasclosed at 5.5 weeks of age. The left eye was injected. The autoradiographs show an expansion of the left-eyecolumns on both sides of the brain; the effect is rather more marked on the right than on the left side. An elec-trode penetration m the right hemisphere (boxed area) is reconstructed in Figure 18.
physiological and autoradiographic experiments inthe same animal. In addition, we need to examinethe distribution of geniculo-cortical afferents forthe enucleated eye. In the deafferented laminae ofthe LGN there was marked cell shrinkage (Table2) as well as an intense gliosis. This atrophy maywell be reflected in a shrinkage of cortical columnsfor the missing eye, or at least a thinning-out of thesynapses in those columns, but further experi-ments—for example, an injection of [3H]prolineinto a single denervated lamina of the LGN, or theuse of the Nauta method, as was applied to the
neonatally enucleated monkeys (Hubel et al.,'77)—will be needed to resolve this point.
CommentIt has long been known from experiments on catsthat the end of the critical period is not an abruptcessation but rather a gradual decline in suscepti-bility (Hubel and Wiesel, '70). The present resultsdemonstrate this to be true for the monkey, andalso show that different aspects of the deprivationeffect have different time courses. Three sucheffects have been quantified and plotted as a func-

Plasticity of Ocular Dominance Columns 561
tion of age in Figure 29. These are 1) changes in cellsize in the LGN, expressed as the ratio of the meancell area for the non-deprived lamina 6 to the sumof the means for laminae 6 and 5, on the side ipsi-lateral to the lid suture; 2) changes in the size ofocular dominance columns in layer IV of area 17,expressed as the fraction of the total cortical areaoccupied by afferents for the non-deprived eye;and 3) the changes in eye preference in the layersabove and below layer IVC, expressed as the meanocular dominance group for all recording sites(excluding IVC) for each animal.
As far as the anatomical effects of deprivationin layer IVC are concerned, susceptibility tomonocular deprivation begins to decline between 6and 10 weeks of age. Ocular dominance in theupper layers, however, is still subject to alterationby deprivation begun at 1 year of age, and in factwe have not pinned down the termination of thiskind of susceptibility other than to show that it isnot present in fully mature animals.
Comparison of the results from this serieswith those from the normal animals described inpart A suggests that anatomical changes in thefourth layer can be produced by lid suture at an agewhen the segregation of the left- and right-eyeafferents is already complete. Nevertheless, plastic-ity of these afferents probably outlasts the period ofoverlap by a relatively short time. This conclusion
Fig. 18. Reconstruction of an electrode penetration in mon-kfy No. 282 (corresponds to boxed area in Fig. 16). The pic-ture is very similar to that obtained in monkey No. 157(compare Fig. 13), even though the right eye was closed at5.5 wee^s rather than at 2 weet^s of age. In the first deprived-
eye column traversed by the electrode (between lesions 6 and7), the deprived eye dominated completely at one recordingsite (O.D. group 7). During the traverse of the seconddeprived-eye column (between lesions 8 and 9), the influenceof the open eye was never completely lost. Note that lesions 8
and 9 were placed at the last group 1 recording sites beforeand after the deprived-eye column. They are therefore far-ther apart from each other than are lesions 6 and 7, whichwere placed at recording sites where the two eyes were bal-
anced (O.D. group 4).
is subject to a number of qualifications which willbe considered in the Discussion.
C. Short-Term DeprivationSo far we have described experiments in which oneeye was closed for a long period of time, in orderthat the maximum effect of lid suture performed at
Fig. 17. Ocular dominance histogram for 97 neurons
recorded on two tangential penetrations into the right striatecortex of monkey No. 282. The three cells that were slightlyinfluenced by the deprived eye (group 2) were groupedtogether in a small region at the bottom of layer III. The onegroup 7 cell was found in layer VI, close to the white matter.Layer IVC cells are excluded.

Fig. 19. Autoradiographic montages from the right and left opercular cortex of a monkey (No. 365) whose righteye was closed at 10 wee^s of age. The left eye was injected at 6 months. On the right side the labeled columnsshow a modest expansion. On the left side the labeled and unlabeled columns are of the same size. The anatom-ical effects of deprivation in this animal are thus restricted to the hemisphere ipsilateral to the sutured eye.
562

Plasticity of Ocular Dominance Columns 563
Fig. 20. Ocular dominance histogram for 118 cells recordedon four penetrations into the right striate cortex of monkeyNo. 365.
a given age might be revealed. We also wished toknow how fast the observed effects develop, whenlid suture is performed in early life. In particularwe were interested by the question of whether theprocess of normal segregation is itself modified, orwhether, even in deprived animals, the columnsfirst develop normally and are later reorganized. Asecond reason for studying the effects of short-termdeprivation has to do with the reverse-sutured ani-mals to be described in part D. In order to under-stand those results it will be necessary to know thestate of the ocular dominance columns at the timewhen the reverse suture was performed.
There were six monkeys in this series. Four ofthem (Nos. 164, 308, 316, and 307) had lid sutureperformed within the first 8 days of life and wereallowed to survive until 20—47 days of age. Twohad short periods of deprivation a little later in life(Nos. 195 and 213, Table 1).
EIGHT TO 20 DAYS (No. 164). Monkey No. 164 hadits right eye closed at 8 days, and it was studiedphysiologically at 20 days. An eye injection of[3H]lysine was made but it did not label the cortexsatisfactorily. The physiological results were, how-ever, very clear. In all three penetrations made intothe right hemisphere the left eye dominated verystrongly. The ocular dominance histogram for cellsrecorded above and below layer IVC is shown inFigure 30. In layer IVC responses alternatedbetween complete left-eye and complete right-eye
dominance, with the regions responding to the left(experienced) eye being twice as long as those forthe right eye. The physiology in this animal, whichwas deprived for only twelve days, already resem-bled that seen after long-term deprivation.
Two TO 24 DAYS (No. 308). Wishing to obtain theanatomical picture for a case of short-term depri-vation, we closed the right eye of another animal(No. 308) at 2 days of age, injected the same eyewith [3H]proline at 16 days, and recorded from thecortex at 24 days of age.
The autoradiographic labeling pattern for theleft hemisphere is shown in Figure 31. The labeledareas were very shrunken and fragmented, withfew elongated, band-like structures remaining.There was considerable label above backgroundbetween the patches of grains, which gave thereconstruction a rather blurred appearance. Thismay well be due to spillover of label in the LGN(see Discussion). Shrunken columns were also visi-ble in the right cortex, but the labeling was too faintto illustrate satisfactorily. The abnormality of theautoradiographic picture was matched by cell-sizechanges in the LGN; cells in the deprived laminaewere already obviously shrunken and pale-staining(Table 3).
The physiological results were very similar tothose obtained in the previous animal. A singlepenetration was made in the left hemisphere (con-tralateral to the deprived eye). In the layers outsideof IVC, the left eye dominated strongly (Fig. 32),although not quite so completely as was seen insome long-term deprived animals such as No. 157(compare Fig. 32 and Fig. 12). In one 1-mm tra-verse through layer IVC, responses to both eyeswere obtained for the first 200 )J,m, and for theremaining 800 |Im responses were obtained only tostimulation of the left (experienced) eye. Because ofthe rather poor quality of the autoradiographs (Fig.31) it proved impossible to match the physiologicalresponses to the autoradiographic labeling pattern,but it appeared that the electrode had been travel-ing obliquely to the columns.
Two TO 23 DAYS (No. 316). The deprivation sched-ule in the next animal (No. 316) was very similar tothat for No. 308. The right eye was closed from 2 to23 days. The difference was that the left, ratherthan the right, eye was injected. No recordings

Fig. 21. Reconstruction of part of an electrode penetration in monkey No. 365. The reconstructed area is in theroof of the calcarine fissure and is not included in the montage of Figure 19. The electrode remained within asingle labeled band (column for the nondeprived eye) during its traverse of layer IVC, and responses were exclu-sively to stimulation of that eye. The labeled columns are wider than the gaps in this area of calcarine cortex, justas they are in the opercular cortex. The unlabeledgap to the left of the central labeled column in A appears largerthan it really is, because the section passes out of layer IVC in this region. Compare with the Nissl-stained adja-cent section (B) and the next autoradiograph (C) which shows the gap at its correct size.
564

Plasticity of Ocular Dominance Columns 565
Fig. 22. Autoradiograph of a single section from the calcarine fissure of a monkey (No. 198) whose right eye wasclosed at 7 months of age. The same eye was injected at 5 years of age. The labeled patches and gaps are of aboutthe same width, indicating that the late eye closure did not affect column size in layer IVC.
were made. The labeling pattern in the right hemi-sphere was the converse of that seen in monkey No.308, with wide labeled columns separated byshrunken, rather indistinct gaps (not illustrated).Again, we suspect that the clarity of the columnarpattern was degraded to some extent by spillover oflabel in the LGN. The labeling in the left hemi-sphere was too faint for the columnar pattern to bediscerned. (This was probably due to damage tothe temporal retina of the left eye during injectionof isotope, since there was poor labeling of the leftLGN as well as a shrinkage of cells in the left-eyelaminae on that side.)
FOUR TO 47 DAYS (No. 307). This monkey had itsright eye closed at 4 days of age. The same eye wasinjected with pH]proline at 33 days of age andrecordings were made from the right hemisphereat 47 days of age. This is an age at which, in normalanimals, the process of columnar segregation iscomplete (compare animal No. 257, section A).
In the autoradiography (Fig. 33) both hemi-spheres showed marked shrinkage of the labeledcolumns. The ratio of unlabeled to labeled areas(open-eye to deprived-eye columns) was 3.18:1 onthe right side and 2.3:1 on the left. There weremany fewer silver grains between labeled columnsin this animal than in the animals deprived until 3weeks (308 and 316). This clearing of the labelingpattern parallels what is seen in normal animalsbetween 3 and 6 weeks of age, and, as in normalanimals, we are inclined to attribute it to a progres-sive reduction in spillover in the LGN (see Discus-sion).
In the recording session, a complete domi-nance of the left eye was found in the layers outsideof IVC (Fig. 34). On both of the first two penetra-tions, 500-(Im-long traverses through layer IVCyielded exclusively left-eye activity. The third pen-etration was aimed too superficially to enter layerIVC, but a 2.2-mm traverse through IVB againonly gave left-eye responses. Finally on the fourthattempt we encountered a right-eye column inIVC: the 680-JJ,m-long traverse began in the lefteye, then right-eye responses were obtained overabout 120 |Im (but without ever entirely losing theleft eye), and finally there was another stretch ofpure left-eye activity before the electrode passedout of the layer.
The LGN also showed marked cell-sizechanges (Table 3). Thus in all respects the results inthis animal resembled those obtained in monkeysdeprived for much longer periods of time.
TWENTY-ONE TO 30 DAYS (No. 195). We went onto study two monkeys that had a few days ofmonocular deprivation after some period of nor-mal vision. The first of these, No. 195, was allowednormal vision up to 21 days of age. At this time theright eye was closed, and it was reopened 9 dayslater. The animal was then permitted to survivewith both eyes open for 4 years. The intent herewas to determine whether the short period of dep-rivation had long-lasting effects or whether thereopening would permit a functional or morpho-logical recovery. A strabismus developed as a resultof the monocular deprivation. As part of a separatestudy, visual acuity was measured repeatedly dur-

Fig. 23. Autoradiographic montages from the right and left hemispheres of monkey No. 286, whose right eye wasdosed at 14 months of age. The left eye was injected 19 months later. The labeling pattern is normal in bothhemispheres.
566

Plasticity of Ocular Dominance Columns 567
Fig. 24. Two adjacent sections from the left striate cortex of monkey No. 286, to illustrate an anatomical abnor-mality revealed only by the Liesegang silver method. A is an autoradiograph, and B is a Liesegangpreparation.The labeled areas in A (columns for the nondeprived eye) are in register with dar/( bands in B, while the unla-beled areas in A (columns for the deprived eye) are in register with lighter bands in B. The correspondence is seenmost clearly for the chromosome-shaped labeled area in the center of the micrograph. The banding in B is quitesubtle: it is best appreciated when the page is held at some distance from the observer. The prominent dar\ zonesat the top left and bottom right of Rare portions of the stria ofGennari (corresponding roughly to layer WE).See text for further interpretation.
ing the recovery period. Acuity in the deprived eyewas poor when measured soon after reopening, butgradually improved to a near-normal level.
Recordings were made from the left hemi-sphere. In spite of the brevity of the deprivationand the long period allowed for possible recovery,the left eye dominated the upper layers; there werejust a few patches in which right-eye activity wasrecorded (Fig. 35). In layer IVC we encounteredone stretch, about 500 Jim long, in which cells weredriven from the deprived eye.
An eye injection was not done, so the colum-nar pattern could not be studied autoradiographi-cally. It was, however, well shown with theLiesegang silver method (Fig. 36). These prepara-tions showed a clear shrinkage of one set ofcolumns, identified by the lesions made during therecording session as belonging to the right(deprived) eye. The electrode had passed very
Fig. 25. Ocular dominance histogram for 142 cells recordedon two tangential penetrations in monkey No. 185. The clo-sure of the right eye at 1 year has caused quite a pronouncedshewing of the histogram towards the open eye. Most of therecording sites were in layers II-IVB; there was some sugges-tion of a relatively greater preservation of deprived-eye activ-ity in layers V and VI.

568 PART IV DEPRIVATION AND DEVELOPMENT
Fig. 26. Autoradiographic montage from a monkey (No. 280) whose right eye was closed when it was adult. Theleft eye was injected 17 months later. The labeled bands and gaps are of normal size. The rather irregular layoutof the columns is also normal: the region reconstructed is well away from the 17-18 border, where the bands aremost orderly.
obliquely to the direction of the columns, thusexplaining why such a long traverse through aright-eye column was obtained. The actual widthsof the two sets of columns, as measured in the sil-ver preparations, were 500 |Llm (left eye) and 200Jim (right eye). An unusual feature of the silverpreparations, compared with what was seen inlong-term deprived monkeys, was that thecolumns for the deprived eye were darker, notpaler, than those for the open eye (Fig. 36). It is notclear whether this effect was related to the strabis-mus that developed subsequent to the deprivationor to the apparent functional recovery suggested bythe gradual improvement of visual acuity in theright eye.
THIRTY-FIVE TO 47 DAYS (No. 213). The last animalin this group had its right eye closed at 5 weeks of
Fig. 27. Ocular dominance histogram for monkey No. 280.Among the 43 cells recorded (admittedly rather a small sam-ple) the influence of the two eyes was about equal.

Fig. 28. Autoradiographic montage for a monkey (No. 269) whose right eye was removed when it was adult.The left eye was injected 4 months later. The reconstructed area comprises the lateral part of the roof of the cal-canne fissure (medial is to the left, anterior is above). The montage shows a normal pattern, with bands and gapsof equal width. The uniformly labeled zone (right center) is the representation of the optic disc of the enucleatedcontralateral eye. As in normal animals the zone is completely filled in by afferents serving the ipsilateral eye.(The faint striations in parts of the disc region result from uneven illumination of successive layers of the mon-tage.) The labeling pattern in the opercular cortex was also normal.]
569

570 PART IV DEPRIVATION AND DEVELOPMENT
Fig. 29. Effects of monocular deprivation on three parameters related to ocular dominance as a function of ageat suture. Note the interruptions in the abscissa.
Upper curve: the ocular dominance index. This index is simply the average of the ocular dominance groupsof all the cells recorded outside of layer IVC in a given animal. In the case of recordings from the left hemispherethe ocular dominance values have been reversed. Thus an index value of 1 would indicate that every cellresponded exclusively to stimulation of the nondeprived eye, and a value of 4 (bottom of graph) indicates that theoverall influence of the two eyes was equal. Each point is derived from a single animal, whose identificationnumber is given at the corresponding position at the top of the graph. The individual histograms from whichthese points are derived have all been illustrated in previous figures.
Middle curve: This shows the effect of deprivation on the relative areas of the two sets of columns in layerIVC, as measured on the autoradiographs. Each point gives, for a single animal, the area occupied by the open-eye afferents as a fraction of the total area of the reconstruction. Thus a value ofl. 0 would indicate that the open -eye afferents had ta^en over the entire cortex, and a value of 0.5 (bottom of graph) represents the normal situa-tion where both eyes' afferents occupy equal areas. Measurements from the cortex ipsilateral to the deprived eye(right hemisphere) were used.
Lower curve: This shows the effect of deprivation on cell size in the LGN. Each point gives the mean cross-sectional area of cells in the nondeprived parvocellular lamina 6 as a fraction of the sum of the mean areas ofcells in laminae 6 and 5. Thus a value of 1.0 would correspond to total elimination of neurons in the deprivedlamina 5, and a value of 0.5 corresponds to equal sizes of cells in the two laminae, the normal situation.
age. The eye was reopened at 7 weeks and the ani-
mal was perfused at 10 weeks of age. The left eye
was injected with [3H]proline 16 days before death.
The autoradiographic picture in this animal
is shown in Figure 37. There was a definite expan-
sion of the labeled columns: the ratio of labeled to
unlabeled areas was 1.76:1 on the left side and
1.19:1 on the right. As usual in young animals, the
picture on the side contralateral to the injected eye
was partially blurred by label in the inappropriate
columns, and again we are inclined to attribute this
to spillover of label in the LGN.
CommentThe results from this group of animals show that
very early lid suture causes a redirection of the
normal process of columnar development. The
afferents segregate from each other at something
close to their normal rate (being segregated, or very
nearly so, by 3 weeks, and definitely mature by 6
weeks), but they segregate into an abnormal pat-
tern. A short period of deprivation at 3-4 weeks
can also produce marked effects, however, and a
short period of deprivation at 5-7 weeks can still
produce a mild effect. Comparing the results

Plasticity of Ocular Dominance Columns 571
obtained in monkeys No. 307, 282, and 213, itappears that monocular suture performed afterfive weeks of age requires a longer time to produceits anatomical effects in layer IVC than does clo-sure soon after birth.
D. Effects of reverse sutureHaving obtained some idea of the time course ofthe deprivation effects, we went on to study theeffects of reopening the deprived eye and closingthe experienced one. Besides a natural interest inthe reversibility of the deprivation effects, we par-ticularly wished to seek further evidence for oragainst the hypothesis stated in the introduction. Ifthat hypothesis is correct, reverse suture performedat 3 weeks of age should produce little if any effecton the size of ocular dominance columns in layerIVC, since the afferents for the deprived eye havealready retracted into their narrow, fragmented
Fig. 31. Autoradiographic montage from monkey No. 308, studied at 24 days of age. The deprived right eye wasinjected, and the reconstruction shows shrinkage and fragmentation of the right-eye bands. As with normal mon-keys at this age (cf. monkey No. 256, Fig. 3) the bands are less sharply defined than in adults, suggesting a cer-tain amount of overlap of the two sets of afferents at columnar borders. There is also label above background inthe gaps between the deprived-eye columns. This may be due to leakage of label between laminae of the LGNduring transneuronal transport (see Discussion).
Fig. 30. Ocular dominance histogram for 47 neuronsrecorded in a 20-day-old monkey (No. 164) whose right eyehad been closed since 8 days of age. The physiological pictureis similar to that seen after months of deprivation (comparefor example the histogram from monkey No. 206, Fig. 10).

572 PART IV DEPRIVATION AND DEVELOPMENT
Table 3. Quantitative Physiological and Anatomical Results for the Animals in Section C
No.
164308316307195213
OCULAR DOMINANCE RATIO OF
INDEX COLUMN AREAS
L R L R
— 1.40 — —1.90 — 3.8:1 —— — — —— 1.00 2.3:1 3.2:11.73 — — —— — 1.8:1 1.2:1
LGN CELL
L6
234318285204141300
SIZE
L5
217*366256*250183345
(LlM2)
R6
265356291254189345
R5
217252254166166341
For explanation of the indices, see Table 1.
* Cell sizes in the left LGN of monkeys No. 164 and 316 probably reflect damage to the temporal retina of the left eye during injectionof isotope, rather than a deprivation effect (see text).
columns (section C, animals No. 164 and 308).Reverse suture at 6 weeks or later should definitelynot lead to any recovery in layer IVC, whatevermight occur in the layers above or below it. Therewere three monkeys in this series, and the quanti-tative results are presented in Table 4.
REVERSAL AT 3 WEEKS (No. 240). The first animalhad its right eye closed at 2 days, and reverse suturewas performed at 3 weeks of age. At 9 months[3H]proline was injected into the right eye, andrecordings were made 9 days later.
The autoradiographic labeling patternobserved in this animal (Figs. 38 and 39) was mostunusual in that it showed completely oppositeeffects in the two sublaminae of layer IVC. In the
Fig. 32. Ocular dominance histogram for monkey No. 308.The shewing of the histogram towards the experienced eye,though quite clear, is for some reason less extreme than inmonkey No. 164 (Fig. 30) or No. 307 (Fig. 34).
lower part, IVC(3, which receives the afferentsfrom the parvocellular LGN (laminae 3—6—Hubel and Wiesel, '72), the labeled columns weregreatly expanded, producing a picture similar to along-term mon-ocular deprivation with injectionof the open eye (compare section B, monkey No.157). In the upper part, layer IVCOC, which is inner-vated by the magnocellular laminae (1 and 2) of theLGN, very shrunken labeled bands were seen,with wide gaps between them. In this layer the pic-ture resembled a long-term monocular deprivationwith an injection of the deprived eye (e.g., sectionB, monkey No. 202). The shrunken labeledcolumns in IVCdC lay in exact register with the cen-ters of the expanded labeled columns in IVCp.This could be seen in single sections simply by fol-lowing a labeled band as it passed from one sub-lamina to the other (Fig. 38A and B). It was alsoobvious when sections at different levels were com-pared. In the right hemisphere, a reconstructionwas made of the labeling pattern in layer IVC|3(this is the sublamina that we have generally usedfor preparing reconstructions, because it is thickerand more heavily labeled than IVCot). In thisreconstruction (Fig. 38C) the ratio of labeled tounlabeled areas was 2.54:1. On the left side separatereconstructions were made of the labeling patternin layer IVCp (Fig. 39A) and in IVCoc (Fig. 39B),working from the same set of micrographs. Thesereconstructions clearly illustrated the oppositeresults produced by the reverse-suture experimentin the two sublaminae. In layer IVCP the ratio oflabeled to unlabeled (right- to left-eye) areas was

Fig. 33. Autoradiographs of single sections from the right and left hemispheres of amonkey (No. 307) that was studied at 47 days of age. The deprived right eye wasinjected, and the labeling pattern is similar to that seen in long-term deprivation
(compare monkey No. 202, Fig. 14). Note the difference in magnification betweenthe two micrographs.

574 PART IV DEPRIVATION AND DEVELOPMENT
Fig. 34. Ocular dominance histogram for cells recorded inmonkey No. 307. None of the 43 cells recorded outside oflayer IVC responded to stimulation of the deprived right eye.
3.09:1, while in IVCOC the ratio of unlabeled tolabeled (left- to right-eye) areas was 2.96:1. Thus inlayer IVCP reverse-suture appeared to have per-mitted not merely a recovery of the deprived-eyecolumns but an actual reinvasion of the territorybelonging to the initially open eye. In layer IVCOC,however, it seems that reverse suture came too lateto effect any change in the distribution of afferents.
Because of this strange labeling pattern inarea 17 we made a more than usually (for us) thor-ough study of cell sizes in the LGN. The results arepresented in Table 5 with the corresponding mea-surements from monkey No. 308. (Numbers frommonkey No. 308 are included to give an indicationof the situation existing in the LGN of the reverse-sutured monkey at the time reversal was per-formed.)
The results were only partially in accordancewith what one might have predicted on the suppo-
Fig. 35. Ocular dominance histogram of 99 cells recorded ina monkey (No. 195) whose right eye was closed from 21 to 30days of age. In spite of a subsequent 4 years of binocularvision, most cortical neurons were unresponsive to stimula-tion of the right eye.
sition of a strict relationship between column areaand LGN cell size. The parvocellular laminae inthe right hemisphere (R3-R6) did show a reversal:cells in the laminae innervated by the initiallydeprived right eye were about 25% larger thanthose in layers innervated by the left eye. Cells inthe two magnocellular laminae in the right hemi-sphere were about the same size, however, suggest-ing a partial recovery that was not reflected in thecortical autoradiographs. In the left hemispherecells in all four parvocellular laminae were aboutthe same size, as were those in the two magnocel-lular laminae. Thus the LGN showed a greaterreversal effect in the right hemisphere, whereas thecortical autoradiographs showed a very similar pic-ture on the two sides. This appears to be aninstance in which the degree of spread of terminalarbors in the cortex was not completely reflected inthe size of cell bodies in the LGN (see Discussion).
Recordings were made in the right hemi-sphere of monkey No. 240. In all three penetra-tions, the right eye dominated almost completely inthe upper layers (Fig. 40). When one considers thatat the time of reverse suture, the left eye must havedominated almost completely—see histogram formonkey No. 164 (Fig. 30) and No. 308 (Fig. 32)—it appears that most of the upper-layer cells wereinduced by the reverse suture to change their eyepreference from one extreme (group 1) to the other(group 7). Of course, a large part of these changesmay have been a passive reflection of events occur-ring in the fourth layer. If so, it is of some interestthat the physiology was apparently so stronglydominated by layer IVCf} as opposed to IVCOC.
REVERSAL AT 6 WEEKS (No. 194). In monkey No.194 the right eye was closed from 3 days to 6 weeksof age. Reverse suture was performed at this ageand when the animal was 6 months old the righteye was injected with [3H]proline and [3H]fucose.Recordings were made 13 days later. The resultsfrom monkey No. 307 (Fig. 33) assure us that at thetime of the reverse suture the right-eye afferentshad already settled out into shrunken columns.
In the autoradiographs (Fig. 41) the labelingpattern was at first glance normal, suggesting thata full recovery had occurred. Closer examination,however, showed that the labeled bands had theirnormal width only in layer IVCP, the parvocellu-lar receiving lamina. In IVCOC they were definitely

Plasticity of Ocular Dominance Columns 575
Fig. 36. Anatomical abnormality of ocular dominance columns in monkey No. 195, revealed by the Liesegangsilver method. This is a single tangential section ofopercular cortex, contralateral to the deprived eye. Layer JVCis the central area traversed by bands that lies within the dar\-staining stria ofGennari. To the left of the figurethe section grazes the white matter, which is stained blacl^.
The banding pattern in layer IVC is grossly abnormal. The thin pale bands, which correspond to the bor-ders between adjacent ocular dominance columns (LeVay et al., '75), are not evenly spaced but grouped intopairs. Each pair encloses a 200-j^m-wide, dart^-staining band. These dar\ bands were shown by recording to cor-respond to shrunken ocular dominance columns for the right eye. Alternating with these are 500-jJm-widebands, somewhat lighter in color, that are the columns for the left eye. The blac\ arrows indicate two thin palebands enclosing a right-eye column; the white arrow, two bands enclosing a left-eye column. The picture in thisanimal thus differs from that seen in most deprived animals, in which the columns for the deprived eye stain lessstrongly with the silver method than the columns for the open eye. (Compare with Fig. 17 ofHubel et al. ('77)and Fig. 24 of this paper.)
shrunken, although the relative weakness of label-ing and other technical problems made this lessobvious than in monkey No. 240.
Two penetrations were made into the lefthemisphere. In the upper layers, the right (initiallydeprived) eye dominated (Fig. 42). As with the pre-vious animal, then, there must have occurred analmost complete reversal of eye preference in theselayers. The two passages through layer IVC gavealternations between exclusively left-eye andexclusively right-eye responses, at what seemed to
be normal intervals. One of these passages is recon-structed in Figure 43.
Although the autoradiography showed only arecovery of the right-eye afferents to a normalcolumnar size (in layer IVCJ3) and not an expan-sion beyond this, the sections stained with theLiesegang silver method (Fig. 43B) were not nor-mal. They showed a relative paleness of thecolumns belonging to the left eye, reminiscent ofthe pattern seen in late monocular deprivation(e.g., monkey No. 286, section B, Fig. 24). It may

576 PART IV DEPRIVATION AND DEVELOPMENT
Fig. 37. Automdiogmphic montage from the left cortex of monkey No. 213, whose right eye was closed from 5to 7 weefys of age. The left eye was injected, and the labeled left-eye columns have expanded. The expansion isnot, however, as great as in monkey No. 282 (Fig. 16), whose right eye was closed from 5.5 weeks to 16 months.It appears therefore that later closures require more time to produce changes in column size than do closures soonafter birth.
therefore be that the afferents for the later-deprived left eye had suffered in some way beyondwhat was suggested by the autoradiographs.
REVERSAL AT i YEAR (No. 203). The last animal inthis series had its right eye closed at 7 days of age
and reverse suture was not performed until 1 yearof age. After a further year the left eye was openedand a further 18 months of binocular vision wereallowed. The right eye was injected with pH]pro-line and [3H]fucose, and recordings were made 12days later.
Table 4. Quantitative Physiological and Anatomical Results for the Animals in Section D
No.
240
194203
OCULAR DOMINANCE RATIO OF
INDEX COLUMN AREAS
L R L R L6
— 6.82 0.32:l(IVCp) 0.39:l(IVCfJ) 253
3.0:1 (IVCcc)6.09 — 1.1:1 —— 1.34 1.4:1 2.2:1 140
LGN CELL
SIZE (|lM2)
L5
241
R6
185
R5
229
(unavailable)181 180 158
For explanation of the indices, see Table 1. Note that a high O.D. index means a dominance of the initially deprived right eye, and a low index adominance of the later deprived left eye. The column area ratios are expressed as left eye:right eye. The headings L and R refer to the side of thebrain studied, not the left and right eyes.

Fig. 38. Effect of reverse suture at 3
wee^s of age on the labeling patternin the right cortex of monkey No.240. The right (initially deprived)eye was injected with pHJproline.
A: A single tangential section.In the central region the labeledbands are expanded. In a surround-
ing belt they are contracted. Thesetwo regions correspond to the ft and OCsublaminae of layer IVC.
B: Key to A, showing the distri-
bution of label (in blacty and theboundaries of the sublaminae IVC ftand WCOL, traced from an adjacentsection stained with cresylviolet. Thereverse-suture protocol has led toopposite anatomical effects in the twosublaminae. Note that the thinlabeled bands in IVCOC run into thecenters of the enlarged bands inIVC ft, meaning that the two sets ofbands, though of very different
widths, are still in register with each
other just as they are in normal ani-
mals.C: Autoradiographic montage
of the same area. Only the regions of
each micrograph that include layerIVC ft have been used in the recon-
struction. Thus the montage showsexpanded labeled columns through-
out
577

578 PART IV DEPRIVATION AND DEVELOPMENT
Fig. 39. Autoradiographic montages from the left cortex of monkey No. 240. The upper and lower montageswere prepared from the same set of micrographs, the difference being that in one case (above) the labeling pat-
tern in layer IVCft was reconstructed, and in the other (below) the pattern in 1VCOL Just as in the right hemi-sphere (Fig. 38) the shrunken labeled bands in IVCdlie in register with the enlarged bands in IVCfl,
The autoradiographs (Fig. 44) showed astrong deprivation effect, with the labeled columns(for the initially deprived eye) being about asshrunken as would be produced by a simple long-term monocular deprivation. The ratio of left- toright-eye column areas was 2.2:1 in the right hemi-sphere and 1.4:1 in the left hemisphere. These fig-
ures are not quite as high as in some of the cases ofsimple monocular deprivation (see Tables 2 and 3).We therefore cannot exclude the possibility thatsome recovery had occurred, although if so it wasvery modest in extent.
Recordings were made in the right hemi-sphere. The left eye dominated strongly in the

Plasticity of Ocular Dominance Columns 579
Table 5. Cell Sizes in all Laminae of the LGN for the Reverse -Sutured Monkey, No.240, and for a Short-Term Deprived Monkey, No. 308 (See Section C)
MONKEY NO. 240 MONKEY NO. 308
L6L5L4L3L2LI
253241243254407386
R6R5R4R3R2Rl
185229190238366355
L6L5L4L3L2LI
318366274351531384
R6R5R4R3R2Rl
356252348238385517
Monkey No. 308 was examined at 3 weeks, the same age at which the reverse suture was performed in No.240. The laminae innervated by the right eye are shown in italics.
performed at 3 weeks the reversal is virtually com-plete for the parvocellular afferents in layer IVCJ3,but the magnocellular afferents in layer IVCttseem no longer capable of recovery. Performed at 6weeks, reverse suture allowed a recovery of thenormal pattern in IVCp (i.e., equal widths for thetwo sets of columns) but not a complete reversal.Performed at 1 year, the reverse suture had noobvious effect.
We have already shown in section C thatmonocular deprivation produces its full effect by 3weeks of age. The present results therefore indicatethat reverse suture can induce changes in an estab-lished columnar pattern, and not merely a redirec-tion of their development. Just as with simplemonocular deprivation (section B) the period ofsusceptibility to reverse suture probably outlaststhe developmental period by only a relatively shorttime.
E. Binocular DeprivationIt has been shown previously by physiological tech-niques (Wiesel and Hubel, 74) that ocular domi-nance columns will develop in monkeys deprivedby binocular lid suture from birth. Indeed thebreakdown of binocularity, which occurs as a nor-mal process in layer IVC, extends in these animalsto the upper and lower cortical layers, leading to acortex almost devoid of binocular convergence,and possessing sharp columnar boundaries in alllayers. Nevertheless, we wished to confirm withthe autoradiographic technique that the segrega-tion of afferents in layer IVC can occur indepen-dently of visual experience. We therefore rearedone monkey (No. 266) in complete darkness from 3days until 5 weeks of age, and then injected one eye
Fig. 40. Ocular dominance histogram for 77 neuronsrecorded in the right cortex of monkey No. 240. As with all
other O.D. histograms in this paper, neurons recorded inlayer IVC have been excluded. Dl and D2 marf^ the sides ofthe histogram corresponding to dominance by the initiallyclosed eye, and the eye closed later, respectively. Nearly allneurons responded only to the initially deprived right eye.
upper layers (Fig. 45), and in layer IVC there werealternations between the two eyes, with the left eyeregions about three times longer than those for theright eye. Lesions made in regions of left-eye dom-inance were found to coincide with the narrowbands of label in the autoradiographs. Thus thephysiology supported the anatomical findings inlayer IVC and indicated further that the reversesuture at 1 year had not caused any significantreversal in eye preference in the upper layers.
CommentThe results for these animals indicate that openingthe deprived eye and suturing closed the other eyecan cause a reversal of the anatomical and physio-logical effects of monocular deprivation. When

580 PART IV DEPRIVATION AND DEVELOPMENT
Fig. 41. Autoradiographic montage of the labeling pattern in a monkey that underwent reverse suture at 6 weeksof age (No. 194). Again, the initially deprived right eye was injected. The labeled bands are of about normalwidth, indicating a recovery from the effects of the early deprivation but not a complete reversal. Most of themontage shows layer IVCfi, but a small region oflVCa is visible, lower left. In this area the labeled columnshave remained shrunken. An electrode penetration was made in the boxed area (Fig. 43).
with [3H]proline. The animal was allowed to sur-vive a further 2 weeks in darkness, and perfused,without recording, at 7 weeks of age.
The injection successfully labeled only a partof the LGN on each side, so that the geniculocorti-cal afferents were labeled only in the correspon-ding regions, which were in the calcarine fissure.Nevertheless in these regions a completely normalpattern of labeled patches and gaps was evident(Fig. 46). We conclude that complete darkness doesnot prevent columnar development. Since we haveonly one binocularly deprived animal, we cannot
say whether the rate of segregation is accelerated,retarded, or normal.
DISCUSSION
This study extends previous work (Hubel et al.,77) on the development and plasticity of oculardominance columns in the macaque monkey. Fourmain conclusions may be drawn from it. The firstis that ocular dominance columns, although onlypartially formed at birth, develop rapidly in thefirst few postnatal weeks by segregation of the left-
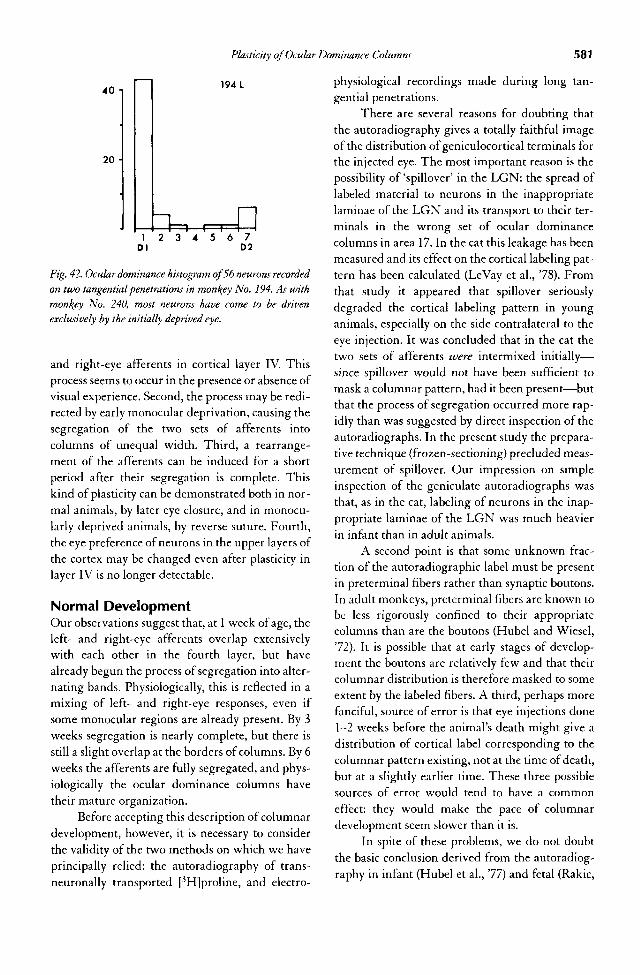
Plasticity of Ocular Dominance Columns 581
Fig. 42. Ocular dominance histogram of 56 neurons recordedon two tangential penetrations in monkey No. 194. As withmonkey No. 240, most neurons have come to be drivenexclusively by the initially deprived eye.
and right-eye afferents in cortical layer IV. Thisprocess seems to occur in the presence or absence ofvisual experience. Second, the process may be redi-rected by early monocular deprivation, causing thesegregation of the two sets of afferents intocolumns of unequal width. Third, a rearrange-ment of the afferents can be induced for a shortperiod after their segregation is complete. Thiskind of plasticity can be demonstrated both in nor-mal animals, by later eye closure, and in monocu-larly deprived animals, by reverse suture. Fourth,the eye preference of neurons in the upper layers ofthe cortex may be changed even after plasticity inlayer IV is no longer detectable.
Normal DevelopmentOur observations suggest that, at 1 week of age, theleft- and right-eye afferents overlap extensivelywith each other in the fourth layer, but havealready begun the process of segregation into alter-nating bands. Physiologically, this is reflected in amixing of left- and right-eye responses, even ifsome monocular regions are already present. By 3weeks segregation is nearly complete, but there isstill a slight overlap at the borders of columns. By 6weeks the afferents are fully segregated, and phys-iologically the ocular dominance columns havetheir mature organization.
Before accepting this description of columnardevelopment, however, it is necessary to considerthe validity of the two methods on which we haveprincipally relied: the autoradiography of trans-neuronally transported [3H]proline, and electro-
physiological recordings made during long tan-gential penetrations.
There are several reasons for doubting thatthe autoradiography gives a totally faithful imageof the distribution of geniculocortical terminals forthe injected eye. The most important reason is thepossibility of 'spillover' in the LGN: the spread oflabeled material to neurons in the inappropriatelaminae of the LGN and its transport to their ter-minals in the wrong set of ocular dominancecolumns in area 17. In the cat this leakage has beenmeasured and its effect on the cortical labeling pat-tern has been calculated (LeVay et al., '78). Fromthat study it appeared that spillover seriouslydegraded the cortical labeling pattern in younganimals, especially on the side contralateral to theeye injection. It was concluded that in the cat thetwo sets of afferents were intermixed initially—since spillover would not have been sufficient tomask a columnar pattern, had it been present—butthat the process of segregation occurred more rap-idly than was suggested by direct inspection of theautoradiographs. In the present study the prepara-tive technique (frozen-sectioning) precluded meas-urement of spillover. Our impression on simpleinspection of the geniculate autoradiographs wasthat, as in the cat, labeling of neurons in the inap-propriate laminae of the LGN was much heavierin infant than in adult animals.
A second point is that some unknown frac-tion of the autoradiographic label must be presentin preterminal fibers rather than synaptic boutons.In adult monkeys, preterminal fibers are known tobe less rigorously confined to their appropriatecolumns than are the boutons (Hubel and Wiesel,'72). It is possible that at early stages of develop-ment the boutons are relatively few and that theircolumnar distribution is therefore masked to someextent by the labeled fibers. A third, perhaps morefanciful, source of error is that eye injections done1-2 weeks before the animal's death might give adistribution of cortical label corresponding to thecolumnar pattern existing, not at the time of death,but at a slightly earlier time. These three possiblesources of error would tend to have a commoneffect: they would make the pace of columnardevelopment seem slower than it is.
In spite of these problems, we do not doubtthe basic conclusion derived from the autoradiog-raphy in infant (Hubel et al., 77) and fetal (Rakic,

Fig. 43. Reconstruction of an electrode pass-through layer IVC in monkey No. 194 (see Fig. 41). A and C areautoradiographs, and B is an intervening section stained with the Liesegang silver method. Besides showing theposition of a lesion, this section illustrates that the columns for the initially deprived right eye stain more darklywith the silver method than do the columns for the left eye (the oblique darf{ bands in B are in register with thelabeled bands in A). D is the tract^ reconstruction, showing a sequence of left-eye responses, an abrupt transitionat the column border (lesion 2), and another sequence of right-eye responses. This is the normal physiologicalpicture in layer IVC. Only the first two or three recording sites were in IVCa, the rest in IVC/3.
582

Plasticity of Ocular Dominance Columns 583
Fig. 44. Autoradiographic montage from monkey No. 203, which was reverse-sutured at 1 year of age. The
labeled columns (for the initially deprived right eye) show a marked deprivation effect, indicating that the late
reversal did not permit any anatomical recovery.
Fig. 45. Ocular dominance histogram of 74 neurons recordedon two tangential penetrations in monkey No. 203. Mostcells responded only to stimulation of the eye that had ini-
tially been open.
'76) monkeys, namely that ocular dominancecolumns do develop by a process of segregation ofthe afferents out of an initially intermixed state.This conclusion is supported by a second and inde-pendent line of anatomical evidence. In cats, it hasproved possible to reconstruct the entire terminalarborizations of single geniculocortical afferents,both in young kittens, by the use of the Golgi
method (LeVay and Stryker, 79), and in adults, bybulk-filling with horseradish peroxidase (Fersterand LeVay, '78). In two-week-old kittens, at an agewhen transneuronal autoradiography still showscompletely uniform and continuous labeling(LeVay et al., '78), single afferents have arboriza-tions that span a large cortical territory—regions aslarge as 2 mm in diameter in surface view. Withinthis area, which would be large enough to houseseveral ocular dominance columns in an adult cat,the arborization is uniform and shows no localclumping or gaps (LeVay and Stryker, '79). Inadult cats, by contrast, these large arborizations arebroken up into clumps of terminal-bearingbranches, about 0.5 mm across, separated by termi-nal-free gaps of about the same size (Ferster andLeVay, '78). These clumps correspond in all proba-bility to a number of ocular dominance columnsfor the same eye, and the gaps to the interveningcolumns for the other eye. Thus the uniform dis-tribution of the axonal arborizations in young kit-tens agrees well with the autoradiography and sug-gests that left- and right-eye afferents overlapextensively with each other at this age.
The physiological recording technique is im-mune to the problems just mentioned, but it has

584 PART IV DEPRIVATION AND DEVELOPMENT
Fig. 46. Autoradiographs of single transverse sections from the left and right cortex of monkey No. 266, whichwas reared in complete darkness from 3 to 49 days of age. In spite of the monkey's lact( of vision, the columnshave a normal autoradiographic appearance. For physiological evidence for normal development of ocular dom-inance columns in darl^-reared monkeys, see Wiesel and Hubel ('74).
others of its own. First, we are not entirely surewhether the activity recorded in layer IVC arisespredominantly from cortical neurons or geniculateafferents, although we believe the former to be themore likely source. Certainly the recording of evenoccasional binocular single units in this layer inyoung animals supports this assumption. Anotherproblem concerns the spatial resolution of the tech-nique. When an electrode crosses a column borderin layer IVC of an adult monkey's cortex, the eye-preference of the multi-unit activity shifts fromgroup 1 to group 7 (or vice versa) over a distance ofabout 50 (J,m, depending partially on the anglebetween the electrode track and the column tra-versed. At least some of this apparent mixing ofleft- and right-eye cells at the borders betweencolumns must be due to technical factors, in partic-ular to the recording of neuronal activity at somedistance from the electrode tip and to the actualuninsulated tip length of the electrode. It is con-ceivable that the recording situation in infant mon-keys differs from that in adults in such a way as toincrease the artifactual mixing of left- or right-eyeactivity—perhaps because of the lack of myelin.Since we cannot eliminate this possibility we mustlay particular emphasis on the finding, in the 8-day-old monkey, of binocular single units in layerIVC. Such units, with a center-surround receptivefield organization and no orientation preference,are never binocularly activated in the adult (Hubeland Wiesel, '68). Although other explanations fortheir binocularity are possible, the simplest is that itarises from an overlap of the left- and right-eyeafferents as suggested by the autoradiography.
Further insight into the physiology of oculardominance columns in infant monkeys has beenprovided by the use of the [14C]deoxyglucosemethod. Sokoloff and his collaborators (DesRosiers et al., '78; Sokoloff, personal communica-tion) have studied the uptake of [14C]deoxyglucosein 1-day-old monkeys during monocular vision. Inthese animals, just as in adults, autoradiographyshowed alternating columns of high and lowuptake, but the columns were somewhat lesssharply defined than in adults, particularly in layerIV. Within the binocular region of area 17, therewas no difference between the labeling patterns inthe hemispheres ipsilateral and contralateral to thestimulated eye. This result is in agreement withour physiological observations; but contrastswith the transneuronal autoradiography in ouryoungest monkey, which showed forming columnson the side ipsilateral to the injected eye but noneon the contralateral side. Thus it strengthens ourbelief that the failure to see any columns bytransneuronal transport of [3H]proline, in thehemisphere contralateral to the injected eye, wascaused by leakage of label between laminae of theLGN.
By 3 weeks of age segregation is very nearlycomplete, as judged both from the autoradi-ographic and the physiological results. There is adiscrepancy, however, between the results obtainedby the two methods. While both methods indicatea slight blurring of the borders of columns, theautoradiography also showed some label abovebackground in the gaps between labeled columns,particularly on the side contralateral to the injected
Plasticity of Ocular Dominance Columns 585
eye, as if the afferents for the contralateral eye hadnot yet completely cleared from the ipsilateral eye'scolumns. Indeed, even at 6 weeks of age there wasa noticeably higher grain density in the gapsbetween labeled bands on the contralateral sidethan on the ipsilateral side or in either hemisphereof adults. The physiology, however, gave no hint ofsuch an asymmetry: in the two animals recordedfrom at 3 weeks (Nos. 256 and 202) as well as in the6-week-old animal (No. 257) neuronal activity inlayer IVC swung between complete ipsilateral-eyeand complete contralateral-eye dominance. In oneof the 3-week-old monkeys (No. 256) there was asuggestion in the physiology that the column bor-ders were less sharply denned than in the adult(Fig. 4), and this observation was strengthened bythe finding, in layer IVC, of one binocular singleunit at a column border. In the 6-week-old monkeythe physiological picture in layer IVC suggestedcomplete segregation as in the adult. In view of theevidence, discussed above, that the autoradiogra-phy can give a false impression of the rate ofcolumnar development, we believe that the actualtimetable of segregation is that suggested by thephysiology: that both sets of afferents segregate outat the same pace, are largely separate from eachother at 3 weeks, and are completely so by 6 weeks.
The alternative possibility is that changes inthe eye preference of cortical neurons (from binoc-ular to monocular responses) precede the anatomi-cal segregation of the afferents. In a very limitedand local sense this may well be so: a particularaxon terminal that is destined for withdrawal maylose its physiological effectiveness while it is still incontact with the postsynaptic cell, and certainlywill do so once it is separated by a few microns. Butthe overall process of columnar development occu-pies several weeks, and there is more than enoughtime for normal growth processes to bring about aredistribution of terminals as the physiologicalcolumns mature. We think, it unnecessary to pos-tulate any detectable mismatch between the distri-bution of the afferents and the ocular dominance ofthe cortical cells at any given time.
Columnar Development in BinocularDeprivationThe process of columnar development, in the mon-key at least, does not seem to require visual experi-ence. Segregation of left- and right-eye afferents
begins in utero (Rakic, '76). As mentioned above,the presence of functional columns, although lesswell defined than in adults, was demonstrated in1-day-old monkeys by the [14C]deoxyglucosemethod (Des Rosiers et al., '78) and in a 1-week-oldmonkey by microelectrode recording (see above).That postnatal columnar maturation also occursindependently of visual experience is indicated bythe result from the dark-reared monkey, No. 266(Results, section E). This monkey was put in thedark at 3 days of age and at 7 weeks showed anautoradiographic labeling pattern similar to that ofa normal adult. Physiologically, binocularlydeprived monkeys show an even more pronouncedsegregation according to eye preference than isseen in normal animals (Wiesel and Hubel, '74).Most cells are monocularly activated, both withinand outside of layer IVC, and columnar bordersare very sharp (see especially Figs. 2B and 3B ofWiesel and Hubel, '74). The picture thus resemblesthat obtained by raising animals with artificial stra-bismus (Hubel and Wiesel, '65; Baker et al., '74).Normal binocular experience, far from promotingcolumnar segregation, therefore seems necessaryfor the maintenance of connections (outside oflayer IVC) that mediate binocular convergence.
Misrouting of Development by EarlyMonocular DeprivationAccording to the working hypothesis stated earlier,the critical period for the production of anatomicalchanges in the fourth layer would be the period ofoverlap of the left- and right-eye afferents. Thisidea was partially borne out, to the extent thatanatomical changes could be produced during thisperiod. The results of short-term deprivation (partC) show that if one eye is closed soon after birthsegregation of the afferents continues, with the dif-ference that most of the retraction is done by theafferents for the closed eye. Patterned visual inputto one eye, with the other eye closed, does thereforeseem to allow that eye's geniculocortical afferentsto hold on to synaptic targets that they would nor-mally abandon, and conversely, the afferents forthe deprived eye relinquish more territory thanthey normally would.
Just as with the young normal animals, theshort-term deprived monkeys showed a slight dis-crepancy between the autoradiography and thephysiology. In the monkey deprived until 3 weeks

586 PART IV DEPRIVATION AND DEVELOPMENT
of age (No. 308) injection of the deprived eye led tolabeling of shrunken, fragmented bands in layerIVC, but the large gaps between these bands alsocontained some label above background levels. Inthe recording, however (monkeys No. 308 and164), responses to stimulation of the deprived eyewere recorded only for short segments in layerIVC: the greater part of the passages through thelayer was taken up by neurons that respondedexclusively to the experienced eye. We believe thatthe physiology gives a more truthful picture of thestate of columnar development, and that the pres-ence of label above background throughout layerIVC results from spillover in the LGN. As with thenormal animals at the same age, however, we havenot fully excluded the alternative possibility, thatthe deprived eye's afferents maintain some (non-functional) terminals in the open eye's columns.This possibility could be investigated with theNauta method after single-lamina lesions in theLGN (Hubel and Wiesel, 72). Whether the labelin the gaps between columns is artifactual or not, ithad largely disappeared by 27 days of age (monkeyNo. 307): the picture in this animal was very simi-lar to that seen in long-term deprivation.
Rearrangement of Columnsafter SegregationA more decisive test of our ideas about the rela-tionship between plasticity and development wasoffered by the series of experiments in which mon-keys had one eye closed at successively later ages(part B). Given the information now availableabout normal development, we would have pre-dicted that lid suture at 3 weeks would produce atmost quite a modest effect on the relative size ofleft- and right-eye columns in layer IVC, and at 6weeks it would produce no effect in this layer. Infact, lid suture at 5.5 weeks of age produced amarked effect—just as great as at 2 weeks of age.Even when begun at 10 weeks, monocular depri-vation still produced a measurable effect in layerIVC, although it was a mild one and was restrictedto the side ipsilateral to the lid suture. The periodof anatomical plasticity therefore seems to outlastthe period of overlap, even if only by a few weeks.
Although the evidence is fragmentary, wesuspect that changes in column width inducedafter completion of segregation take longer todevelop than do the effects of early closure. Thus a
2-week closure begun at 5 weeks had a mildereffect than a similar period of deprivation begun at1 week (compare monkeys No. 213 and 164, sectionC), while a 15-month closure begun at 5.5 weekshad an effect as great as a 3-week closure begun at1 week (monkeys No. 282, section B, and No. 308,section C). The greater time required for reexpan-sion may reflect a reduced opportunity for compe-tition between left- and right-eye afferents forsynaptic targets, once they have segregated intocolumns. Clearly, though, segregation is not a com-plete barrier to effective competition.
The Liesegang reduced-silver method (LeVayet al., '75) revealed an additional effect of monocu-lar deprivation even when begun as late as 1 year ofage. This was the relative paleness (reduced argy-rophilia) of the fourth-layer bands representing thedeprived eye in the absence of any abnormality ofcolumn width (see Fig. 24). We do not know thebasis for this curious effect; it could be due to a low-ered density of deprived-eye afferents, a reductionin their caliber, or some weakening of intracorticalconnections within the deprived-eye columns. Itshould be mentioned that the silver method wasused primarily on tissue from older animals, since itdid not satisfactorily stain sections from animalsunder about 7 months of age.
We have concentrated our attention on thefourth layer of the cortex—in fact on one sublam-ina, IVC, which receives most of the geniculocorti-cal afferents. Our motivation for this was, ofcourse, the availability of the anatomical methodsfor studying the columnar pattern in this layer. It isvery clear, however, that susceptibility to monocu-lar deprivation is also exhibited in the upper andlower cortical layers, and that in these regions itpersists for a longer time, perhaps for well over ayear after birth. Thus the projections from layerIVC to the upper layers are probably also capableof modification by visual deprivation, even thoughwe have not as yet examined the question anatom-ically.
Reverse SutureThe conclusion that a reorganization of the colum-nar pattern can be induced after segregation iscomplete is strengthened by the results of theexperiments involving reverse suture (part D).Reverse suture done at 3 weeks—an age at whichthe initial deprivation had already caused the seg-

Plasticity of Ocular Dominance Columns 587
regation of the afferents into bands of unequalwidth—caused reversal of the autoradiographicand physiological picture in layer IVC, althoughthe effect was limited to the zone of termination ofthe parvocellular geniculate afferents (layer IVCfi).Reverse suture at 6 weeks, while not permitting areversal of the autoradiographic picture, did allowa re-expansion of the deprived eye's afferents (inIVCP) to their normal width. Here too wasdemonstrated an ability of geniculocortical affer-ents to regain cortical territory that they had previ-ously relinquished. Only the third animal in thisgroup, which was reverse-sutured at one year ofage, failed to show any recovery.
Why the magnocellular afferents (to laminaIVCtt) were not induced to re-expand by reversesuture is something of a puzzle. The differentialeffect may be related to the observation that veryearly closure seems to cause a more dramatic loss ofterritory by the deprived eye in layer IVCOC than inIVC{3 (monkey No. 201, section B). Alternatively,whatever process terminates anatomical plasticityin layer IV may simply exert its effects earlier onthe magnocellular than on the parvocellular affer-ents. If this explanation is correct, one wouldexpect to be able to find an age at which simplemonocular closure also would affect selectively theparvocellular afferents. We do not have a clearexample of such a result among the series of ani-mals in section B, having on the whole paid lessattention to lamina IVCOC than IVC(3 (the recon-structions illustrated in this paper—except for Fig-ure 39B—are all from IVCJ3, principally because ofits greater labeling density).
Our physiological observations on the effectsof reverse suture are in general agreement withthose of Blakemore et al. ('78) in showing areversibility of eye preference after the effects ofthe initial deprivation have taken place. Theautoradiography suggests that this process involvesa contraction and later re-expansion of the affer-ents for the deprived eye in layer IVC. The alter-native model, by which deprived-eye synapses are'suppressed' and later 'de-repressed' (Blakemore etal., '78) seems less likely (one would have to invokea failure of axonal transport in the suppressedafferents), but more precise anatomical methodswill be required to resolve the issue.
We believe, then, that the geniculocorticalafferents can re-expand into territory they have
previously relinquished. A definitive experimentto verify this conclusion would involve examiningthe columnar pattern in the same animal twice:before and after a period of monocular depriva-tion, or before and after a reverse suture. This wasactually done physiologically in monkey No. 202,and the results from this animal certainly supportthe idea that established columns can berearranged. Nevertheless, it would be most con-vincing to have autoradiographic evidence of thecolumnar structure at the two ages. Although wehave not done such an experiment, it would prob-ably be feasible to biopsy the cortex of a youngmonkey before closing one of its eyes and then toexamine it again after a long period of deprivation.In the absence of this kind of evidence our presentconclusion remains strong but perhaps falls shortof certainty.
In considering how such a re-expansion ofafferents could occur, it may be significant that thepreterminal portions of the axonal arborizations,even in adults, are not entirely restricted to columnsfor the appropriate eye. This was shown initially bydegeneration methods (Hubel and Wiesel, '72).Since then, as mentioned above, it has been possibleto bulk-fill entire arborizations (in the cat) withhorseradish peroxidase by extracellular (Fersterand Le Vay, '78) or intracellular (Gilbert and Wiesel,'79) injections. Some of these arborizations spannedseveral ocular dominance columns. Their terminal-bearing portions were arranged in clumps, andthese clumps were joined by myelinated pretermi-nal segments that ran tangentially in the fourthlayer, apparently traversing columns for the othereye. For axons of this type, re-expansion mightinvolve nothing more than local sprouting of bou-tons from preterminal segments. The application ofthe HRP bulk-filling method to normal anddeprived monkeys might well throw more light onthe exact nature of the rearrangement that isinduced by eye-closure.
Cell Size in the LGNOur previously published results (Hubel et al., '77)suggested that the relative size of cells in left- andright-eye laminae of the lateral geniculate nucleuswas related to the relative size of left- and right-eyeocular dominance columns in area 17. The largernumber of animals in the present study allows us toexamine the relationship quantitatively (Fig. 47).

588 PART IV DEPRIVATION AND DEVELOPMENT
Fig. 47. Relationship between LGNcell size and cortical column size.The ordinate is the fraction of totalcortical area occupied by afferentsforthe ipsilateral eye (derived frommeasurement of the autoradi-ographic montages). The abscissa isthe ratio of the mean cell size inLGN lamina 5—a lamina supplyingipsilateral eye columns in area 17—to the sum of the means for laminae 5and 6. Each point is derived from onehemisphere in one animal. The solidline is the calculated regression line.The point lying farthest from theregression line (left hemisphere ofmonkey No. 240—see text) has beenlabeled.
There is indeed a good correlation between the twovariables (r = 0.91). This result supports Guillery's('72) hypothesis that the size of neurons in theLGN is a reflection of the size of the axonalarborizations they must sustain in the visual cortex.It is important, though, to point out the existence ofexceptions. The most glaring of these was the lefthemisphere of monkey No. 240, the animalreverse-sutured at 3 weeks of age (see Results, sec-tion D). In the left visual cortex the parvocellularafferents for the initially deprived right eye had re-expanded to occupy most of the area of their targetlamina, but the neurons in all the parvocellularlaminae of the left LGN were about the same size.An exception of the opposite kind was provided bythe monkey subjected to monocular enucleation asan adult (No. 269, not plotted in Fig. 47). This ani-mal showed dramatic cell shrinkage in the de-afferented laminae of the LGN, but the columnarpattern in the cortex appeared normal. There maywell be relatively simple explanations for theseexceptions (perhap the density of synapses, as wellas the overall column area, needs to be taken intoaccount) but they are a reminder that one should becautious about predicting conditions in the cortexfrom geniculate cell size alone.
Columnar Development and theCritical PeriodIt seems from our results that the completion ofcolumnar segregation is not responsible for the endof susceptibility to monocular deprivation in layerIVC. A similar conclusion has been reached for thecat's cortex (LeVay et al., '78), but for a different rea-son. In that species segregation stops short of com-pletion: the edges of columns in the adult cat aremore blurred than in the monkey, and plenty ofbinocular cells are found in the regions of overlap.If our hypothesis were to be the complete explana-tion for the critical period and its termination, thereshould be a substantial anatomical effect of lidsuture even in the adult cat. This there is not; evenmonocular enucleation fails to induce re-expansionof columns for the other eye in adult cats (LeVay,unpublished observations). There are other speciesin which ocular dominance columns are even lessclearly defined, such as the squirrel monkey (LeVayet al., '76; Hubel and Wiesel, '78), or not present atall, such as the mouse (Drager, '74, 75). The effectsof lid suture in adults of these species have not beendescribed, but we doubt that they would show anymore plasticity than do adult cats or monkeys. Wetherefore suspect that some other developmental

Plasticity of Ocular Dominance Columns 589
process acts to terminate the critical period. Thereare a number of possible candidates for this. Onemight cite, as an example, the myelination of theterminal arborizations of the geniculocortical affer-ents. Myelination occurs after columnar segrega-tion is completed, and it is quite a gradual process.In their fully mature state, the arborizations areclad with myelin throughout their extent, and onlythe boutons and the very short and fine preterminalsegments are free of it (Ferster and LeVay, '78). Therelocation of an axon, thus ensheathed, might wellbe more difficult than if it were bare. Still, the imageof a myelin sheath as a straitjacket is probably sim-plistic: there are reports of sprouting from nodes ofRanvier (Speidel, '42, Barker and Ip, '66), anddemyelination might also occur.
It should also be kept in mind that the postsy-naptic cortical neurons, as well as the afferents,undergo morphological changes during postnataldevelopment. Boothe et al. ('79) have examined, inthe monkey, the development of dendritic spineson the spiny stellate cells of layer IVC. Theyreported an increase in spine density during thefirst two postnatal months, followed by a moregradual decline. These spines are the main synap-tic target for the geniculocortical afferents (Gareyand Powell, '71). The continued generation of newsynaptic sites during the first two months mighttherefore be the process which permits re-expan-sion of afferent arborizations in response to lidsuture, and the cessation of synaptogenesis mightterminate the period of plasticity. It should bepointed out, though, that the synapses formed bygeniculate afferents constitute only a minority ofthe total axospinous synapses, even within layer IV(Garey and Powell, '71; LeVay and Gilbert, '76).More information is needed on the numbers anddistribution of the synapses formed by geniculateafferents during postnatal development. Furtherstudy of the morphological development of the lay-ers above and below layer IVC might also be help-ful for an understanding of why sensitivity to dep-rivation, in these layers, extends so much longerinto postnatal life.
ACKNOWLEDGMENTS
We are grateful to the staff of the New England Regional Pri-mate Center for care of the animals. We also thank Neil Segil,
Birthe Storai, Karen Larson, and Edward Coughlin for the his-tology, autoradiography, and cell measurements; Marc Pelo-quin for assistance with photography; David Freeman for com-puter programming; and Olivia Brum for assistance with themanuscript.
This study was supported by NIH grants EY00605,EY00606, and EY01960, and NIH Core grant EY01995. S.L. isthe recipient of an NIH Research Career Development Award.
Literature Cited
Baker, F.H., P. Grigg, and G.K. von Noorden (1974) Effects ofvisual deprivation and strabismus on the response of neu-rons in the visual cortex of the monkey, including studies onthe striate and prestriate cortex in the normal animal. BrainRes., 66:185-208.
Barker, D., and M.C. Ip (1966) Sprouting and regeneration ofmammalian motor axons in normal and deafferented skele-tal muscle. Proc. R. Soc. Lond. B, 163:538-554.
Blakemore, C, L.J. Garey, and F. Vital-Durand (1978) Thephysiological effects of monocular deprivation and theirreversal in the monkey's cortex. J. Physiol., 267:423-444.
Blakemore, C., and R.C. Van Sluyters (1974) Reversal of thephysiological effects of monocular deprivation in kittens:Further evidence for a sensitive period. J. Physiol.2^7:195-216.
Boothe, R.G., W.T. Greenough, J.S. Lund, and K. Wrege (1979)A quantitative investigation of spine and dendrite develop-ment of neurons in visual cortex (area 17) ofMacaca nemest-rina monkeys. J. Comp. Neurol., 756:473-489.
Des Rosiers, M.H., O. Sakurada, J. Jehle, M. Shinohara, C.Kennedy, and L. Sokoloff (1978) Functional plasticity in theimmature striate cortex of the monkey shown by the[HC]deoxyglucose method. Science, 200:447-449.
Drager, U.C. (1974) Autoradiography of tritiated proline andfucose transported transneuronally from the eye to thevisual cortex in pigmented and albino mice. Brain Res.,52:284-292.
Drager, U.C. (1975) Receptive fields of single cells and topogra-phy in mouse visual cortex. J. Comp. Neurol., 760:269—290.
Ferster, D., and S. LeVay (1978) The axonal arborizations of lat-eral geniculate neurons in the striate cortex of the cat. J.Comp. Neurol., 752:925-944.
Garey, L.J., and T.P.S. Powell (1971) An experimental study ofthe termination of the lateral geniculo-cortical pathway inthe cat and monkey. Proc. R. Soc. Lond. B, 779:1-63.
Gilbert, C.D, and T.N. Wiesel (1979) Morphology and intra-cortical projections of functionally characterised neuronesin the cat visual cortex. Nature, 250:120-125.
Guillery, R.W. (1972) Binocular competition in the control ofgeniculate cell growth. J. Comp. Neurol., 744:117-130.
Hubel, D.H., and T.N. Wiesel (1965) Binocular interaction instriate cortex of kittens reared with artificial squint. }. Neu-rophysiol, 25:1041-1059.
Hubel, D.H., and T.N. Wiesel (1968) Receptive fields and func-tional architecture of monkey striate cortex. J. Physiol.,795:215-243.
Hubel, D.H., and T.N. Wiesel (1970) The period of susceptibil-ity to the physiological effects of unilateral eye closure in kit-tens. J. Physiol., 206:419-436.
Hubel, D.H., and T.N. Wiesel (1972) Laminar and columnardistribution of geniculo-cortical fibers in the macaque mon-key. J. Comp. Neurol., 746:421-450.

590 PART IV DEPRIVATION AND DEVELOPMENT
Hubel, D.H., and T.N. Wiesel (1978) Distribution of inputsfrom the two eyes in striate cortex of squirrel monkeys. Soc.Neurosci. Abstr., 4:632.
Hubel, D.H., T.N. Wiesel, and S. LeVay (1975) Functionalarchitecture of area 17 in normal and monocularly deprivedmacaque monkeys. Cold Spring Harbor Symposia, 40:581—589.
Hubel, D.H., T.N. Wiesel, and S. LeVay (1977) Plasticity ofocular dominance columns in monkey striate cortex. Phil.Trans. R. Soc. Lond. B., 275:377-409.
LeVay, S. (1971) On the neurons and synapses of the lateralgeniculate nucleus of the monkey, and the effects of eye enu-cleation. Z. Zellforsch., 77J:396-419.
LeVay, S., and C.D. Gilbert (1976) Laminar patterns of genicu-locortical projection in the cat. Brain Res., 113:1—19.
LeVay, S., D.H. Hubel, and T.N. Wiesel (1975) The pattern ofocular dominance columns in macaque visual cortex re-vealed by a reduced silver stain. J. Comp. Neurol., 759:559-576.
LeVay, S., and M.P. Stryker (1979) The development of oculardominance columns in the cat. Soc. Neurosci. Symp.,4:83-98.
LeVay, S., M.P. Stryker, and C.J. Shatz (1978) Ocular domi-nance columns and their development in layer IV of thecat's visual cortex: A quantitative study. J. Comp. Neurol.,779:223-244.
Matthews, M.R., W.M. Cowan, and T.P.S. Powell (1960)Transneuronal cell degeneration in the lateral geniculatenucleus of the macaque monkey. J. Anat., 94:145—169.
Minkowski, M. (1920) Uber den Verlauf, die Endigung und diezentrale Representation von gekreutzten und unge-kreutzten Sehnervenfasern bei einigen Saugetieren und bei
Menschen. Schweiz. Arch. Neurol. Neurochir. Psychiatr.,6:201-257.
Rakic, P. (1976) Prenatal genesis of connections subserving ocu-lar dominance in the rhesus monkey. Nature (London),267:467-471.
Ramachandran, VS., P.G.H. Clarke, and D. Whitteridge (1977)Cells selective to binocular disparity in the cortex of new-born lambs. Nature (London), 265:333-335.
Shatz, C.J., S.H. Lindstrom, and T.N. Wiesel (1977) The distri-bution of afferents representing the right and left eyes in thecat's visual cortex. Brain Res., 7^7:103—116.
Shatz, C.J., and M.P. Stryker (1978) Ocular dominance in layerIV of the cat's visual cortex and the effects of monoculardeprivation. J. Physiol., 257:267-283.
Sherk, H., and M.P. Stryker (1976) Quantitative study of corti-cal orientation selectivity in visually inexperienced kitten. J.Neurophysiol., 39:63-70.
Specht, S.C., and B. Grafstein (1973) Accumulation of radioac-tive protein in mouse cerebral cortex after injection of 3H-fucose into the eye. Exp. Neurol., 47:705-722.
Speidel, C.C. (1942) Studies of living nerves. VII. Growthadjustments of cutaneous terminal arborizations. J. Comp.Neurol., 76:57-69.
Wiesel, T.N., and D.H. Hubel (1963) Single-cell responses instriate cortex of kittens deprived of vision in one eye. J. Neu-rophysiol., 26:1003-1017.
Wiesel, T.N., and D.H. Hubel (1974) Ordered arrangement oforientation columns in monkeys lacking visual experience.J. Comp. Neurol., 755:307-318.
Wiesel, T.H., D.H. Hubel, and D.M.K. Lam (1974) Autoradio-graphic demonstration of ocular-dominance columns in themonkey striate cortex by means of transneuronal transport.Brain Res., 79:273-279.
AFTERWORD
There seems to be little to add to these papers. A missing aspect of this workis knowledge of the time course of the strabismus animals, cats or monkeys,and in monkeys the possibilities of recovery—but that would have requiredmany more monkeys, and one cannot do everything. To repair an artificialstrabismus would probably exceed the limitations of our ophthalmologicsurgery, unfortunately, considering how useful that type of knowledgewould be to clinical ophthalmology.
Our showing that at birth the monkey ocular dominance columns havebegun to form but are still not fully formed was entirely compatible with theresults of Pasco Rakic (Phil Trans R Soc Lond B, 1977,278:245-260), who hadseen no hint of columns six weeks before the expected date of birth, but mildfluctuations in grain counts three weeks before. Subsequent work by CarlaShatz (J Neurosci 1983, 3:482—499) has shown that during development incats, optic nerve fibers from the two eyes invade the entire geniculate, show-ing no the respect for the alternating layers, which comes about only late inthe prenatal period with the shedding of connections from the inappropriateeye and the further development of connections from the appropriate one.
Our delay in writing up our strabismus results in monkeys seemsstrange. We must simply have forgotten, and it was not until it came time to

Plasticity of Ocular Dominance Columns 591
prepare the Nobel papers that we became aware of the oversight andrepaired it in Torsten's final Nobel report. Since the results were so similarin cats and monkeys, it must have seemed to us a bore to have to set pen topaper yet again. There was one major item to add to the monkey study;namely, that we at last succeeded in producing an animal with amblyopia,which was the original object of the strabismus work.

This page intentionally left blank

PARTY
THREE REVIEWS

This page intentionally left blank

Chapter 26 • Ferrier Lecture, 1977 •
FOREWORD
This paper must hold a record for the greatest lapse of time between thedelivery of a lecture (London, March 2, 1972), and the submission of themanuscript (November 1976). Much work went into its preparation, to besure, but perhaps not three and a half years of uninterrupted labor! Of all thereprints in the present collection, except for the Nobel lectures, this is theonly one that is a summing up of other papers, and the result is doubtlesssome duplication of figures and text. But we felt it might be useful as a sum-mary of much of the work, and as a chance to express the thoughts of someof the main papers in a different, more relaxed way.
Ferrier LectureFunctional Architecture of Macaque Monkey Visual Cortex
D. H. HUBEL AND T. N. WIESEL • Harvard Medical School, Boston, Massachusetts
CONTENTS
INTRODUCTION 596The geniculo-cortical pathway 597Receptive field orientation 595Binocular convergence 601
FUNCTIONAL ARCHITECTURE 6051. Anatomy 6052. Position in the visual field 6073. Complexity and binocularity according
to laminae 6114. Ocular dominance columns 613
From Proc. R. Soc. Lond. B. 198,1-59 (1977)Lecture delivered 2 March 1972—typescript received 10 November 1976
595
5. Orientation columns 6146. Geometry of ocular dominance columns 6207. Representation of visual fields in layer IVc 6258. The cortical machinery 632
STUDIES IN NEWBORN MONKEYS 636DEPRIVATION STUDIES 637DOMINANCE COLUMNS IN NEWBORN
MONKEYS 644COMPARATIVE STUDIES OF ARCHITECTURE 647CONCLUSION 653REFERENCES 653

596 PARTY THREE REVIEWS
Of the many possible functions of the macaquemonkey primary visual cortex (striate cortex, area17) two are now fairly well understood. First, theincoming information from the lateral geniculatebodies is rearranged so that most cells in the striatecortex respond to specifically oriented line seg-ments, and, second, information originating fromthe two eyes converges upon single cells. Therearrangement and convergence do not take placeimmediately, however: in layer IVc, where thebulk of the afferents terminate, virtually all cellshave fields with circular symmetry and are strictlymonocular, driven from the left eye or from theright, but not both; at subsequent stages, in layersabove and below IVc, most cells show orientationspecificity, and about half are binocular. In a binoc-ular cell the receptive fields in the two eyes are oncorresponding regions in the two retinas and areidentical in structure, but one eye is usually moreeffective than the other in influencing the cell; allshades of ocular dominance are seen.
These two functions are strongly reflected inthe architecture of the cortex, in that cells withcommon physiological properties are grouped to-gether in vertically organized systems of columns.In an ocular dominance column all cells respondpreferentially to the same eye. By four independentanatomical methods it has been shown that thesecolumns have the form of vertically disposed alter-nating left-eye and right-eye slabs, which in hori-zontal section form alternating stripes about 400\lm thick, with occasional bifurcations and blindendings. Cells of like orientation specificity areknown from physiological recordings to be simi-larly grouped in much narrower vertical sheeet-like aggregations, stacked in orderly sequences sothat on traversing the cortex tangentially one nor-mally encounters a succession of small shifts in ori-entation, clockwise or counterclockwise; a 1 mmtraverse is usually accompanied by one or severalfull rotations through 180°, broken at times byreversals in direction of rotation and occasionallyby large abrupt shifts. A full complement ofcolumns, of either type, left-plus-right eye or acomplete 180° sequence, is termed a hypercolumn.Columns (and hence hypercolumns) have roughlythe same width throughout the binocular part ofthe cortex.
The two independent systems of hyper-columns are engrafted upon the well known topo-
graphic representation of the visual field. Thereceptive fields mapped in a vertical penetrationthrough cortex show a scatter in position roughlyequal to the average size of the fields themselves,and the area thus covered, the aggregate receptivefield, increases with distance from the fovea. A par-allel increase is seen in reciprocal magnification(the number of degrees of visual field correspon-ding to 1 mm of cortex). Over most or all of the stri-ate cortex a movement of 1—2 mm, traversing sev-eral hypercolumns, is accompanied by a movementthrough the visual field about equal in size to thelocal aggregate receptive field. Thus any 1—2 mmblock of cortex contains roughly the machineryneeded to subserve an aggregate receptive field. Inthe cortex the fall-off in detail with which thevisual field is analysed, as one moves out from thefoveal area, is accompanied not by a reduction inthickness of layers, as is found in the retina, but bya reduction in the area of cortex (and hence thenumber of columnar units) devoted to a givenamount of visual field: unlike the retina, the striatecortex is virtually uniform morphologically butvaries in magnification.
In most respects the above description fits thenewborn monkey just as well as the adult, suggest-ing that area 17 is largely genetically programmed.The ocular dominance columns, however, are notfully developed at birth, since the geniculate ter-minals belonging to one eye occupy layer IVcthroughout its length, segregating out into separatecolumns only after about the first 6 weeks, whetheror not the animal has visual experience. If one eyeis sutured closed during this early period thecolumns belonging to that eye become shrunkenand their companions correspondingly expanded.This would seem to be at least in part the result ofinterference with normal maturation, thoughsprouting and retraction of axon terminals are notexcluded.
INTRODUCTION
Anyone who glances at a human brain can hardlyfail to be impressed by the degree to which it isdominated by the cerebral cortex. This structurealmost completely envelopes the rest of the brain,tending to obscure the other parts. Though only2 mm thick it has a surface area, when spread out,of about 2000 cm2. Even more impressive is the

Ferrier Lecture 597
number of elements it contains. Under everysquare millimetre there are some 105 nerve cells,making a total of around 1010 cells. The number ofsynaptic connections in the cortex is certainly sev-eral orders of magnitude greater than this. Forsheer complexity the cortex probably exceeds anyother known structure.
To reveal this complexity special methods arenecessary. Certain stains such as the Nissl make itpossible to count and classify the cells, but help lit-tle in unravelling the wiring diagram, to say noth-ing of revealing what the cells are doing in the dailylife of the animal. For these problems one needs acombination of approaches such as the Golgimethod, autoradiography and the electron micro-scope, in anatomy, and single-cell recordings inphysiology. Since many of these methods have beendeveloped only recently, it is not surprising thatbeginnings have been made in understanding onlya few areas of cortex.
Much of the work on cortex in the past 20years has concentrated on sensory areas, which aremore accessible to the neurophysiologist since theyare close to the input end of the nervous system.For these few cortical regions some understandingof function in terms of structure seems to be evolv-ing. An interesting and certainly a surprising resultof this work is the discovery of structural patternsthat were not apparent at all with the standardmorphological techniques. One particular type oforder, which we term 'functional architecture',seems only to be revealed by a combination of phys-iological and morphological approaches. What wemean by functional architecture will, we hope,become evident in the course of this paper, whichpresents a description of the known functionalarchitecture of the primary visual cortex of themacaque monkey.
The Geniculo-Cortical PathwayCells in the visual cortex tend to be groupedtogether according to their physiological proper-ties. On the crudest level, all of the cells in this partof the cortex are obviously concerned primarilywith vision. But within the visual cortex finer func-tional groupings of several kinds also occur, andthe functional architecture is a description of thesegroupings. To understand the architecture onemust therefore have some knowledge of the physi-ological properties of the individual cells. We
accordingly begin with a summary of the single-cell physiology of the striate cortex, as it is presentlyunderstood. We propose to give only a roughsketch of the subject: those who wish to read fur-ther may consult the original papers (Kuffler 1953;Hubel & Wiesel 1959, 1962, 1968).
The position occupied by the striate cortex inthe visual pathway is illustrated in Figure 1, a dia-gram taken from Polyak (1957). The brain in thisfigure is seen from below. It is from a human ratherthan a macaque, but the pathways are very similarin the two species. The main components of thevisual pathway are the retinas, the lateral genicu-late bodies, and the striate cortex. About a millionoptic nerve fibres (axons of retinal ganglion cells)issue from each eye and pass uninterruptedthrough the optic chiasm to the lateral geniculatebodies. (Some of the fibres end in the brain stem,especially in the superior colliculus.) At the chiasma little over half of the optic fibres cross, and theother half (or slightly less) remain uncrossed. Theredistribution takes place in such a way that the leftlateral geniculate body receives axons from retinalganglion cells in the two left half retinas, and henceis concerned with the right visual field; the rightgeniculate is similarly concerned with the leftvisual field. The lateral geniculate is in somerespects quite complex; anatomically there are sev-eral cell types, and a variety of synaptic categoriesare seen (Guillery & Colonnier 1970). But com-pared with many other structures in the brain, andin particular with the cortex, the lateral geniculatebody is simple: most geniculate cells receive synap-tic input directly from optic nerve fibres, and mostof these cells in turn send their axons directly to thecortex. Thus it is not unfair to say that it is basicallya one-synapse station.
The axons that form the output of the genic-ulates pass back in the white matter of the cerebralhemispheres to the striate cortex. The striate cortexis clearly more complicated, with at least 3 or 4synapses interposed between the input and the out-put. The organization of this structure will be thesubject of most of this paper. Finally, the axons thatleave the cortex make their way to a number of dif-ferent destinations: to other nearby cortical regionssuch as area 18, to the optic tectum, and, in a recur-rent path, to the lateral geniculate bodies. The stri-ate cortex should thus not be regarded in any senseas the end of the visual path—in fact it is probably

598 PARTY THREE REVIEWS
Fig. 1. Diagram of the retino-geniculo-cortical pathway in ahigher mammal. The brain is viewedfrom below; by skilful dissection theeyes and optic nerves have beenremoved from the orbits, and kept intheir normal relationship to thebrain. Up, in the diagram, is anterior.The right halves of each retina,shown in blackj project to the righthemisphere (to the left, in the figure,since it is viewed from below): thusthe right hemisphere receives inputfrom both eyes and is concerned withthe left half-field of vision, e, eye; on,optic nerve; oc, optic chiasm; ot, optictract; Igb, lateral geniculate body; sc,superior colliculus; or, optic radia-tions; str, striate cortex. (Figure from
Polyak, 1957.)
very close to the beginning, and, as we will see, thebehaviour of the cells, though it tells us the out-come of the first five or six steps in the processing ofvisual information, does not take us very fartoward solving the ultimate problem of visualperception.
In studying the physiology of the visual path-way we have made use of methods developed byHartline (1940), Kuffler (1953), Talbot & Marshall(1941), and others. Our general strategy has been tostimulate the retina in a natural way (i.e. with pat-terns of light) and to record the responses of singlecells at one stage after the next, starting with retina,going on to the geniculate, and finally to the cortex.In this type of work we record with extracellularmicroelectrodes because our main interest is in theall-or-none impulses of the cells, and because firingpatterns tend to be seriously distorted if a cell ispenetrated by an electrode; to make such extracel-lular records from single cells for periods of manyhours is today relatively easy. At any given stageone studies cell after cell, observing how each reactsto spots and patterns of light, gradually forming anoverall idea of the behaviour of the cells in that
structure. The procedure is then repeated at thenext stage, and by comparing the two sets of resultsone may learn what kinds of analysis the secondstage has made upon the input that it received fromthe first.
The primary visual cortex (also called 'striatecortex' and 'area 17'—the three terms are synony-mous) can be said to have two main functions—there are certainly others, some known and perhapsmany still to be discovered, but the two to bedescribed here are very important. First, the visualinput from the lateral geniculate body is rearrangedin such a way as to make the cortical cells responsiveto specifically oriented short line segments. Second,the cortex is the first point in the retino-geniculo-cortical path at which fibres carrying informationfrom the two eyes converge upon single cells. Let usdiscuss each of these functions in turn.
Receptive Field OrientationA retinal ganglion cell or a geniculate cell respondsbest to a roughly circular spot of light, the optimalsize of spot varying from cell to cell, and for any onecell the spot must be presented in a particular part

Ferrier Lecture 599
of the visual field (i.e. of the retina). The responsemay consist of a speeding up of the resting train ofimpulses, or a slowing down. Because of the con-centric, mutually antagonistic centre-surroundreceptive field arrangement (Kuffler 1953), a spotoccupying exactly the centre of the receptive field isalways more effective than one of larger size, andconsequently more effective than diffuse light. Theresponses to various shapes of stationary stimuli areto a large extent predictable from the receptive-fieldmaps; for example a slit whose width is the same asthe diameter of the receptive field centre will excitean on-centre cell (Figure 2) even though some of thesurround is illuminated. Apparently the centre andsurround interact in such a way that a stimulus cov-ering all the centre but only a fraction of the sur-round produces a strong centre-type response.
Fig. 2. Centre-surround receptive field of a typical on-centreretinal ganglion cell. The diagram represents a small portionof the retina, or, what is equivalent, a small portion of thevisual field. In the case of the retina, the retinal ganglion cellbody is situated close to the centre of the region, and theregion itself is the territory of retina containing receptors thatma^efunctionally effective connections (via other interposedretinal cells) with the ganglion cell. In a monkey the entirereceptive field occupies a region a degree or so in diameter(about 0.3 mm, on the retina). The field centre varies from a
few minutes of arc, for cells near thefovea, up to a degree orso, for peripheral cells. Shining light anywhere within thecentre region (x) causes the cell to increase its firing rate,whereas shining light in the annular surround (—) producesa slowing in firing rate, with a transient discharge when thelight is turned off (the off-response). Because of this antago-nism between the two regions, a light shining over the entirefield gives a much weaker response than light confined to thecentre; the centre usually dominates, so that the response is'on' in type. The slit-shaped stimulus illustrated gives astrong on-response, since it covers all of the centre region andonly a fraction of the opposing surround. Cells in the lateralgeniculate body have similar receptive fields. Many cells inretina and geniculate have just the reverse configuration,with inhibition from the centre of the receptive field andexcitation from the surround.
These cells have fields with circular symmetry, andconsequently respond roughly equally to all orien-tations of a line stimulus.
In the cortex we first find cells with orienta-tion specificity. By this we mean that a cell respondsto a specifically oriented stationary or movingstraight line segment presented within a restrictedreceptive field. An example of the behaviour ofsuch a cell is shown in Figure 3. This cell, recorded,say, from the right hemisphere, responds only tostimuli within a roughly rectangular area in the lefthalf field of vision. To evoke consistent strongresponses it is not enough to use a circular spot oflight, however: the region must be crossed by a slitof light in Olh30—07h30 orientation. The slit maybe kept stationary and presented anywhere withinthe rectangle, or it may be swept across the recep-tive field in the direction of the arrow. Changing
Fig. 3. Receptive field of a complex cell in the striate cortex.Axes represent the vertical (V) and horizontal (H) meridianof the visual field, crossing at the centre of gaze F (the pro-jection of the fovea). The cell is recorded from the righthemisphere, so that the receptive field, represented by the rec-tangle, is in the left field of vision. No responses are observedwhen this region is illuminated diffusely, and small circularspots produce at most only weaf^ or inconstant responses. Anappropriate line, however, gives strong reproducibleresponses. The cell in this example gives optimal responses toa long narrow slit oriented in a 01 h30—07 h30 manner;responses are especially strong if the line is swept over thearea in the direction indicated by the arrow.

600 PARTY THREE REVIEWS
the orientation so that the slit is misoriented bymore than 10°—20° usually results in a markeddecline in the response. The sensitivity to varia-tions in orientation differs to some extent from cellto cell, but almost all cells fail to respond longbefore the misorientation reaches 90°. A movingstimulus is generally very powerful in evoking adischarge (i.e. in raising the impulse frequency ofthe cell above the resting level). In many cellsmovement of a slit, or even a small spot, in onedirection (here, up-and-left) evokes a much morevigorous response than movement in the reversedirection (down-and-right), and often movementin one of the two directions will evoke no responseat all. The mechanism for this directional selectiv-ity for movement is still unknown, but mustdepend on connections within the cortex, since incat and monkey such selectivity has not beendescribed at the geniculate level (see, for example,Wiesel & Hubel 1966). In lower vertebrates such asfrog (Lettvin, Maturana, McCulloch & Pitts 1959),and even in some mammals such as the rabbit (Bar-low, Hill & Levick 1964) and cat (Cleland & Levick1974; Stone & Fukuda 1974), some retinal ganglioncells show directional selectivity, but these cellsprobably project mainly to the superior colliculus.The ideas proposed by Barlow et al. to explaindirectional selectivity in the rabbit retina may alsoapply to the cat and monkey cortex, but there areimportant differences which make it unlikely thatexactly the same mechanisms are used. While reti-nal cells in frog and rabbit may be directionallyselective, they show no selective responses to specif-ically oriented line segments. In cat and monkeycortex, directional selectivity is intimately boundup with orientation specificity, since the optimumorientation of a slit is always 90° to the optimumdirection of movement.
The optimal orientation of the line variesfrom cell to cell, some cells preferring vertical, oth-ers horizontal, and still others oblique. All possibleorientations are represented roughly equally—there being no obvious preponderance of cellstuned, for example, to vertical or horizontal stim-uli. The line stimulus may be produced in any oneof three ways: most cells respond best to a light lineon a dark background; many others, however,respond selectively to dark lines on a light back-ground, and some prefer borders between lightand dark.
Cells in the primary visual cortex are not allspecifically sensitive to particular orientations.Roughly four classes of cells can be distinguished,in a series of ascending complexity (Hubel &Wiesel 1959, 1962, 1965, 1968). These are termed'circularly symmetric', 'simple', 'complex' and'hypercomplex'. We assume that cells at each stagereceive their major input from cells at the previousstage, with the circularly symmetric cells receivingtheir inputs predominantly from geniculate cells.Circularly symmetric cells, as their name implies,show no preference to any particular orientation oflines, and, indeed, seem similar in their propertiesto geniculate cells. Simple cells are the first in thehierarchy to show orientation specificity, so that therearrangements responsible for orientation speci-ficity are presumed to take place between the cir-cularly symmetric and the simple cells. A simplecell responds to an optimally oriented line in somenarrowly defined position: even a slight displace-ment of the line to a new position, without changein orientation, renders the line ineffective. A com-plex cell, on the contrary, is probably just as specificin its orientation requirements as the simple cell,but is far less particular about the exact positioningof the line. Such a cell will respond wherever a lineis projected within a rectangle such as that of Fig-ure 3; if the cell responds to a dark or light line(rather than to an edge), increasing the line's thick-ness beyond some value that is far less than thewidth of the receptive field renders it ineffective.Thus a patch of light as large as the entire receptivefield evokes no response at all. This is equivalent tosaying that diffuse light is ineffective. As men-tioned above, sweeping the line over the receptivefield usually evokes a sustained discharge from thecell. Hypercomplex cells, finally, resemble complexcells in all respects but one: extending a line beyondthe region from which responses are evoked pro-duces a marked reduction or complete abolition ofthe response. A few years ago Bishop & Henry(1972) described in cat cortex a type of cell whoseproperties resembled those of simple cells, exceptthat extending the line led to a drop in theresponse. Schiller, Finlay & Volman (1976) and wehave seen such cells in monkey cortex, and Gilbert(1977) has confirmed their presence in the cat stri-ate cortex. It is thus clear that there are two cate-gories of hypercomplex cells. Different cells showdifferent degrees of suppression when a line is

Ferrier Lecture 601
made very long, suggesting that the distinctionbetween hypercomplex cells on the one hand andsimple and complex on the other may not be verysharp; rather there seems to be a continuum, fromcells that respond very well to cells that do notrespond at all, to long lines.
In this paper no attempt will be made todescribe these different cell types in detail. It isenough to point out that a complex cell can mosteasily be understood by supposing that it receivesinputs from many simple cells, all with the sameorientation preference. Similarly a hypercomplexcell's properties can be explained by assuming thatit receives inputs from complex cells (or, for the lesscommon type, from simple cells) all with the samepreferred orientation. One would therefore predictthat cells whose fields are in a particular part of thevisual field and which prefer the same stimulus ori-entation would be highly interconnected, whereascells of different orientation preference would notbe expected to be interconnected except possibly byinhibitory synapses. These predictions will bereferred to again in interpreting the significance ofthe orientation columns described below.
One may add, parenthetically, that the orga-nization suggested here, while hierarchical in arough sense, is certainly not rigidly so. For exam-ple, complex cells probably do not all project tohypercomplex cells; many of those situated in layerV, for example, project to tectal cells (Palmer &Rosenquist 1974; Toyama, Matsunami, Ohno &Takashiki 1974), while many Vlth layer cells pro-ject back to the lateral geniculate body (Gilbert &Kelly 1975; Lund et al. 1975). Despite a certaindegree of dissension over the idea of an underlyinghierarchy, there is considerable evidence to supportit (Kelly & Van Essen 1974; Gilbert (1977).
Binocular ConvergenceTo understand the second main function of thestriate cortex, the combining of influences from thetwo eyes, we must return for a moment to the lat-eral geniculate body, for this, as already mentioned,is the first structure in the path to receive inputfrom both eyes. The geniculate nevertheless seemsto go well out of its way to avoid any significantmixing of the inputs from the two eyes. Figure 4«,Plate 1, shows a coronal section through the rightlateral geniculate of a macaque monkey, in whichcell bodies are stained by the Nissl method. The
geniculate consists of six layers stacked one abovethe other rather like a club sandwich, each platebeing many cells thick. The terminals coming infrom the two eyes distribute themselves to these sixlayers in such a way as to produce six topographicmaps of the contralateral half field of vision; all sixmaps are in register so that in a radial pathway tra-versing the six layers, as indicated by the arrow, allthe receptive fields of the cells encountered willhave virtually identical positions in the visual fields(Brouwer & Zeeman 1926; Bishop, Kozak, Levick& Vakkur 1962; Hubel & Wiesel 1961).
In the geniculate of many primates includingman the distribution of the terminals from the twoeyes takes a very special form. Each of the six layersreceives input from one eye only. For the right lat-eral geniculate the most dorsal layer has input fromthe left eye, and beginning with this layer thesequence proceeds left-right, left-right, right-left.Why a reversal should occur between the dorsalfour and the ventral two layers is a mystery, but, forthat matter, why there is any sequence at all is stillan unsolved riddle. The important point for ourpresent purposes is that each layer, and conse-quently each individual cell in each layer, receivesinput from only one eye. The geniculate in the mon-key, then, consists almost entirely of monocularcells. Layer VI of the visual cortex sends a strongprojection to the geniculate (Lund et al. 1975), andmany cells in that layer are binocular. There istherefore some reason to expect an indirect influ-ence of some kind on a geniculate cell from botheyes, by way of the cortex. Such an influence hasbeen demonstrated in the cat geniculate, wherethere are also opportunities for direct interchangeof information across the layers (Sanderson,Darian-Smith & Bishop 1969; Guillery 1966), butnot, so far, in the monkey. The original evidencethat the different layers correspond to single eyeswas based on the degeneration of cells that occurson eye removal, as shown by Minkowski in 1920.An example of a result similar to Minkowski's isshown in Figure 4£. There is now very much addi-tional evidence to support Minkowski's finding,both physiological and anatomical (see Figure 21).
The fibres carrying information to the cortexare thus for all practical purposes strictly monocu-lar. The process of convergence of informationfrom the two eyes occurs first in the primary visualcortex. It is, however, delayed to a point beyond the

602 PARTY THREE REVIEWS
Fig. 4. (a) Coronal section through the right lateral geniculate body of a normal adult macaque monkey, cresylviolet stain. Cells are divided into six layers: Nos. 1, 4, and 6 receive input from contralateral (left) eye; 2, 3, and5from the ipsilateral. Each layer contains a detailed and orderly representation of the contralateral field of vision;moving along one layer thus implies a movement through the visual field dictated by this representational map.The six maps of the visual field are in precise register, so that corresponding to movement along a radial line, suchas the arrow, there is no movement in the visual field, (b) One form of evidence that certain geniculate layersreceive input from the contralateral eye, and others from the ipsilateral. The right eye of this rhesus monkey was
removed at the age of 2 weeks, and the brain examined at 19 months. Coronal sections, Nissl stain (cresyl vio-
let). On each side cells in layers with input from the right eye are markedly atrophic and appear pale. CompareFigure 4a. (From Hubel, Wiesel &• LeVay 1977.)
first two cortical stages, for the circularly symmet-ric cells and the simple cells are almost all monocu-lar, whereas among the complex and hypercomplexcells binocular input is very common. Neverthelesseven at these stages binocular cells make up only alittle more than half of the population.
Now we can ask a very specific questiondesigned to reveal more about the way in which the
inputs from the two eyes combine. If we recordfrom a binocular cortical cell, a complex cell forexample, we may map its receptive field in one eye,meanwhile keeping the animal's other eye closed.Suppose the result is a map like that of Figure 3.We then transfer the mask to the other eye andrepeat the procedure. If the cell is a binocular cell,how similar will the receptive fields be in the two
Plate 1

Fig. 4 (Continued)

604
Fig. 5. Receptive fields of a binocular cell in area 17. Each diagram shows the visual field as seen by one eye; nor-mally the two would be superimposed, but they are drawn separately here for clarity. The fields in the two eyesare, as closely as one can measure, similar in size, shape, position and orientation, and respond to the same formof stimulus, in this case a moving slit.
eyes? The answer is that they are practically iden-tical (Hubel & Wiesel 1959; 1968). This is illus-trated in Figure 5. The positions of the receptivefields in the two retinas match as perfectly as onecan measure: the fields are the same distance fromthe fovea and in the same direction, and thus in thevisual fields the two receptive fields are superim-posed. The receptive-field complexity is the same,the orientations are identical, the direction prefer-ences, if any, are the same. In short, everything onelearns about the cell through one eye matches pre-cisely what one learns through the other. It is there-fore no surprise to find that when both eyes areused together and properly lined up, a stimulususually evokes a much more vigorous responsethan when either eye is used alone.
We can say, then, that the cell receives inputsfrom the two eyes and that these inputs are quali-tatively virtually identical—which means that thewiring in the two paths, up to their point of con-vergence, must be very similar. Only in one respectare there differences: the responses that areobtained on comparing identical stimuli in the twoeyes may not be equal. For many cells the responsesfrom one of the two eyes are consistently greaterthan those from the other; some cells, the monocu-lar ones, receive input only from one of the eyes;
some receive equal inputs. There are, in fact, allshades of relative ocular dominance in the popula-tion, from complete dominance by one eye,through equality, to complete dominance by theother. We can sum this up by saying that corticalcells receive qualitatively similar inputs from thetwo eyes but that for any given cell the densities ofthe two inputs are not necessarily the same.
Everything we have said up to now appliesnot only to the normal adult macaque monkey, but,with one minor exception to be discussed below,also to the newborn monkey, lacking any visualexperience (Wiesel & Hubel 1974). It is hard toescape the conclusion that the connections respon-sible for the findings so far outlined, and indeedalso for the architecture to be described, are genet-ically determined. At least their formation is notdependent on visual experience. This will be dis-cussed in more detail later in the paper.
To sum up this abbreviated account of thephysiology, we may think of a cell in area 17 of themonkey as responding optimally when a numberof stimulus variables are correctly specified. Thecell may be described, then, by its degree of com-plexity, the x—y coordinates of the position of thereceptive field, the receptive field orientation, theocular dominance, and the degree to which there is
left eye right eye

Ferrier Lecture 605
directional preference to movement. Such a list ofspecifications is analogous to the tag showing theprice, sleeve length, percentage of wool, and so on,attached to a suit in a department store.
The drawing up of such a list allows us to posea key question that leads to new information on thearchitecture of the cortex. Are cells with similarqualities—similar orientations or similar field posi-tions—aggregated together in the cortex, (as suitsoften are in a store), or are they scattered at randomthrough the cortex with respect to these variables?The answer to this question provides some stronghints as to how the cortex carries out its functions.
FUNCTIONAL ARCHITECTURE
1. AnatomyBefore addressing directly the subject of functionalarchitecture we must look briefly at the anatomy ofthe striate cortex. The entire cortex is a plate of cellsabout 2 mm thick and in the macaque monkeyabout 13 cm2 in surface area. Figure 6a, Plate 3,shows a view of the macaque brain from behind.The visual cortex is partly buried, and partlyexposed on the outer surface of the occipital lobeand visible in the picture. The exposed part extendsforward to the dotted line (the 17-18 border),
Plate 3
Fig. 6. (a) Brain of a macaque monkey, perfused with formalin, viewed from above and behind. The occipitallobe is demarcated in front by the lunate sulcus (L) and consists mainly of the striate cortex, which occupies mostof the smooth surface, extending forward to the dotted line (the 17—18 border). If followed medially area 17curves around the medial surface of the brain and continues in a complex buried fold, a part of which lies under-neath the convexity and parallel to it. X mart^s the projection ofthefovea; movement in the direction of the arrowcorresponds to movement out along the horizon; movement along the dotted line, to movement down along thevertical midline of the visual field. The groove in the right hemisphere was made in removing a parasagittal blocf(of tissue to produce the cross section of Figure 6b. (b) Low power Nissl-stained section from a parasagittal bloc/^such as that of Figure 6a. // is what would be seen if one could stand in the groove of6a and loo/^ to the left. AmarJ^s the outer convexity; B the buried fold, and arrows indicate the 17-18 borders, the upper right one of whichis indicated by the dotted line in Figure 6a.

Fig. 6b.
Plate 4
606
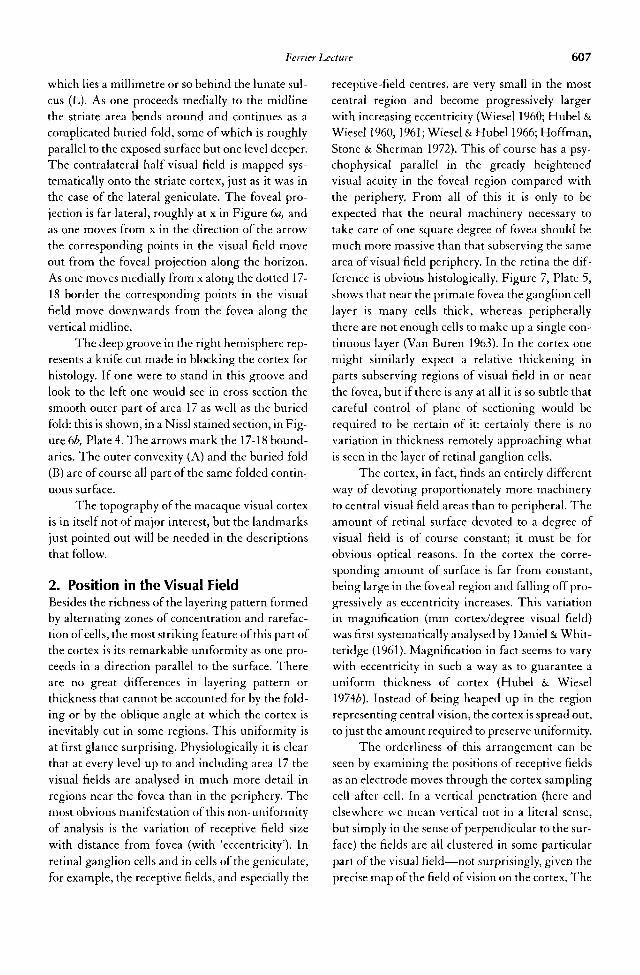
Ferrier Lecture 607
which lies a millimetre or so behind the lunate sul-cus (L). As one proceeds medially to the midlinethe striate area bends around and continues as acomplicated buried fold, some of which is roughlyparallel to the exposed surface but one level deeper.The contralateral half visual field is mapped sys-tematically onto the striate cortex, just as it was inthe case of the lateral geniculate. The foveal pro-jection is far lateral, roughly at x in Figure 6a, andas one moves from x in the direction of the arrowthe corresponding points in the visual field moveout from the foveal projection along the horizon.As one moves medially from x along the dotted 17-18 border the corresponding points in the visualfield move downwards from the fovea along thevertical midline.
The deep groove in the right hemisphere rep-resents a knife cut made in blocking the cortex forhistology. If one were to stand in this groove andlook to the left one would see in cross section thesmooth outer part of area 17 as well as the buriedfold: this is shown, in a Nissl stained section, in Fig-ure 6b, Plate 4. The arrows mark the 17-18 bound-aries. The outer convexity (A) and the buried fold(B) are of course all part of the same folded contin-uous surface.
The topography of the macaque visual cortexis in itself not of major interest, but the landmarksjust pointed out will be needed in the descriptionsthat follow.
2. Position in the Visual FieldBesides the richness of the layering pattern formedby alternating zones of concentration and rarefac-tion of cells, the most striking feature of this part ofthe cortex is its remarkable uniformity as one pro-ceeds in a direction parallel to the surface. Thereare no great differences in layering pattern orthickness that cannot be accounted for by the fold-ing or by the oblique angle at which the cortex isinevitably cut in some regions. This uniformity isat first glance surprising. Physiologically it is clearthat at every level up to and including area 17 thevisual fields are analysed in much more detail inregions near the fovea than in the periphery. Themost obvious manifestation of this non-uniformityof analysis is the variation of receptive field sizewith distance from fovea (with 'eccentricity'). Inretinal ganglion cells and in cells of the geniculate,for example, the receptive fields, and especially the
receptive-field centres, are very small in the mostcentral region and become progressively largerwith increasing eccentricity (Wiesel 1960; Hubel &Wiesel 1960,1961; Wiesel & Hubel 1966; Hoffman,Stone & Sherman 1972). This of course has a psy-chophysical parallel in the greatly heightenedvisual acuity in the foveal region compared withthe periphery. From all of this it is only to beexpected that the neural machinery necessary totake care of one square degree of fovea should bemuch more massive than that subserving the samearea of visual field periphery. In the retina the dif-ference is obvious histologically. Figure 7, Plate 5,shows that near the primate fovea the ganglion celllayer is many cells thick, whereas peripherallythere are not enough cells to make up a single con-tinuous layer (Van Buren 1963). In the cortex onemight similarly expect a relative thickening inparts subserving regions of visual field in or nearthe fovea, but if there is any at all it is so subtle thatcareful control of plane of sectioning would berequired to be certain of it: certainly there is novariation in thickness remotely approaching whatis seen in the layer of retinal ganglion cells.
The cortex, in fact, finds an entirely differentway of devoting proportionately more machineryto central visual field areas than to peripheral. Theamount of retinal surface devoted to a degree ofvisual field is of course constant; it must be forobvious optical reasons. In the cortex the corre-sponding amount of surface is far from constant,being large in the foveal region and falling off pro-gressively as eccentricity increases. This variationin magnification (mm cortex/degree visual field)was first systematically analysed by Daniel & Whit-teridge (1961). Magnification in fact seems to varywith eccentricity in such a way as to guarantee auniform thickness of cortex (Hubel & Wiesel1974£). Instead of being heaped up in the regionrepresenting central vision, the cortex is spread out,to just the amount required to preserve uniformity.
The orderliness of this arrangement can beseen by examining the positions of receptive fieldsas an electrode moves through the cortex samplingcell after cell. In a vertical penetration (here andelsewhere we mean vertical not in a literal sense,but simply in the sense of perpendicular to the sur-face) the fields are all clustered in some particularpart of the visual field—not surprisingly, given theprecise map of the field of vision on the cortex. The

Plate 5
Fig. 7. Comparison of ganglion cell layer of monkey retina nearfovea and in the periphery. Cross sections of amacaque monkey retina, stained with hematoxylin-eosin, from the parafoveal region and the far periphery, on,outer nuclear layer; in, inner nuclear layer; g, ganglion cell layer. Note how retinal ganglion cells form a layerabout five cells deep in the parafoveal region, but constitute only a thinly populated layer in the periphery.
608

Ferrier Lecture 609
receptive fields recorded in a vertical penetration infact show considerable overlap. They are not pre-cisely superimposed, however: there is not onlysome variation in size, but also a certain amount ofapparently random scatter in position. In any onepenetration the fields collectively cover an area sev-eral times the size of an average receptive field, asillustrated in Figure 8a. For convenience we canrefer to this areas as the aggregate field of any pointon the cortical surface.
Both field size and the amount of scatter varyfrom layer to layer, being smallest in layer IVc,largest in layer V and intermediate in the others.Thus for any point on the cortex we can obviouslyspeak of the aggregate field for an individual layer.(The aggregate field for the full cortical thicknesswill then be about the same as the aggregate fieldfor layer V.)
Now consider what happens as an electrode ismoved not vertically, but horizontally through thecortex, sampling cell after cell in a given layer.Over a short distance one will again find a randomscattering of receptive fields, again over a territoryseveral times the size of any one field; the exact size,as just mentioned, will vary with the layer one istraversing. Let us suppose, to be specific, that theelectrode is recording from layer III, where thefield sizes and scatter are not huge, as in layer V,nor tiny as in IVc, but somewhere in between. Asthe penetration progresses one begins to detect anoverall drift in field position, superimposed on therandom scatter, in a direction dictated by the topo-graphic map of the visual field upon the cortex. Itrequires a traverse of about 1—2 mm through thecortex to produce a drift equal to the size of theaggregate field, that is, a drift sufficient to producea displacement of the receptive fields into territorycompletely distinct from the original one (Figure8£). The interesting thing is that 1—2 mm is what isrequired for such a displacement regardless ofwhere in area 17 the penetration is made (Figure 9).For a more peripheral part of the visual field,receptive-field sizes and scatter are both larger andconsequently the aggregate field is larger; a 1—2mm traverse along the cortex gives a drift in fieldsthat is likewise larger, in exact proportion. At aneccentricity of 45° the aggregate field is about 3°and a 1-2 mm displacement shifts this territory byabout 3°. At 22° the figure is 11A°, at 7° it is about0.5°, and in the fovea about 0.1°. The overall law is
that for this layer a 1—2 mm displacement along thecortex is about enough, on the average, to displacethe aggregate field into an entirely new terrain.The figure of 1—2 mm will be somewhat greater ifone studies the deep part of layer III or layer V, andmuch less for layer IVc or layer II. This suggeststhat over the entire visual field a region whose sizeis that of the aggregate field is subserved by themachinery contained in a block of cortex with asurface area of about 2 mm X 2 mm. The blockeverywhere subserves the same function—the fieldsizes and scatter for the incoming geniculate fibresvary, but the number of fibres is probably constant(Clark 1941), and what is done with the input bythe cortical machine is probably the same every-where. Thus diagrams such as those of Figure 8will be similar wherever the penetration is made inthe striate cortex, except that the scale will differ.
The dimension of 1-2 mm is an interestingone, for studies of the cortex by silver degenerationmethods (Fisken, Garey & Powell 1973) show thatthe longest intracortical connections extend onlyfor a few millimetres, and most are under 1—2 mm.(The longest connections probably involve cells oflayer V and deep III, and the shortest, cells in IV c.)This means that there is little or no opportunity forsignals entering the cortex in one place to makethemselves felt at points more than 1—2 mm away.As a corollary to this it may be added that the stri-ate cortex must be analysing the visual world inpiecemeal fashion: information about some regionin the visual field is brought to the cortex, digested,and the result transmitted on with no regard towhat is going on elsewhere. Visual perception,then, can in no sense be said to be enshrined in area17—the apparatus is simply not made to analyse apercept that occupies more than a small region ofvisual field. All of the single cell physiology in factsuggests that area 17 is concerned simply with whatmay be thought of as building blocks for percep-tion.
To sum up, a 1—2 mm square of cortex sub-serves an area of visual field roughly equal to theaggregate field in that part of the cortex. In thisway magnification is adjusted to receptive field sizeso that the cortex can be everywhere uniform. Inthe paragraphs that follow it will be shown thateach 1—2 mm block of cortex contains just enoughmachinery to analyse its region of visual field, forall line orientations and for both eyes.

Fig. 8. (a) Receptive-field scatter: Receptive-field boundaries of 17 cells recorded in a penetration through mon-fey striate cortex, in a direction perpendicular to the surface. Note the variation in size, and the more or less ran-dom scatter in the precise positions of the fields. The penetration was made in apart of the cortex correspondingto a visual field location 10"from the centre of gaze, just above the horizontal meridian. Fields are shown for oneeye only. Numbers indicate the order in which the cells were recorded. (From Hubel & Wiesel 1974b.) (b)Receptive-field drift: Receptive fields mapped during an oblique, almost tangential penetration through striatecortex, in roughly the same region as in a. A few fields were mapped along each of four 100 jJim segments, spacedat 1 mm intervals. These four groups of fields were labelled 0,1, 2 and 3. Each new set of fields was slightly abovethe other, as predicted from the direction of movement of the electrode. Roughly a 2 mm movement through cor-tex was required to displace the fields from one region to an entirely new region. (From Hubel & Wiesel 1974b.)
610

Ferner Lecture 611
Fig. 9. Variation of receptive-field drift with eccentricity: The diagram represents one quadrant of the field ofvision, and the circles represent aggregate receptive fields, the territory collectively occupied by receptive fields ofcells encountered in a micro-electrode penetration perpendicular to the cortical surface. Each pair of circles illus-trates the movement in aggregate receptive field accompanying a movement along the cortex of 1-2 mm. Boththe displacement and the aggregate field size vary with distance from thefovea (eccentricity), but they do so inparallel fashion. Close to thefovea the fields are tiny, but so is the displacement accompanying a 1-2 mm move-ment along the cortex. The greater the distance from thefovea, the greater the two become, but they continue toremain roughly equal. (From Hubel & Wiesel 1974b.)
3. Complexity and BinocularityAccording to LaminaeWe turn now to the layering of area 17, which isshown at higher power in Figure 10, Plate 6. Theafferents coming from the lateral geniculate termi-nate at several levels—layers IVa, IVc and VI, andperhaps also layer I (Hubel & Wiesel 1972). Thegreat majority of terminations are, however, inIVc. The subsequent wiring is not fully known,but several synapses are required before the infor-mation reaches cells whose axons project out of thecortex (Lund 1973). If we examine the properties ofcells layer by layer, two salient findings emerge.First, there is a correlation between complexity and
layering, at least to the extent that the least compli-cated cells, the circularly symmetric geniculate-likecells, are located mainly in layer IVc. Simple cellsseem to be located mainly in IVb; they are perhapsalso present in VI—at least they have been foundthere in the cat (Hubel & Wiesel 1962; Gilbert1977). Complex and hypercomplex cells are found,in our experience, only in II, III, V, and VI. It is arelief, at any rate, to find the simplest cells at theinput end of the cortex.
The second fact about lamination involvesbinocular convergence. Cells in layer IVc arealmost exclusively monocular. This of course isconsistent with our previous statement that the
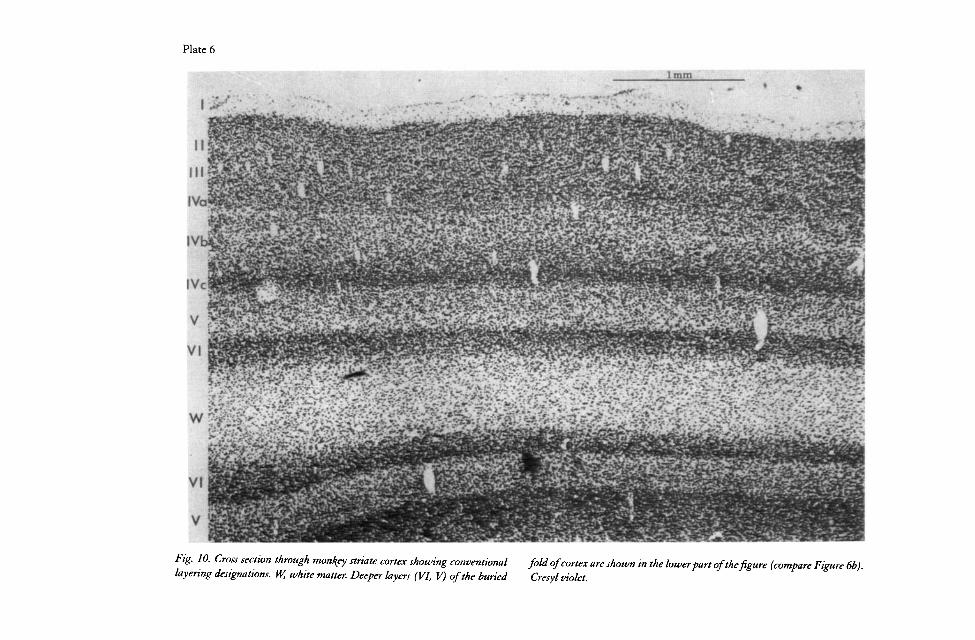
Plate 6
Fig. 10. Cross section through monkey striate cortex showing conventionallayering designations. W, white matter. Deeper layers (VI, V) of the buried
fold of cortex are shown in the lower part of the figure (compare Figure 6b).Cresyl violet.

Ferrier Lecture 613
concentric cells are almost all monocular. Cells inIVb, including the simple cells found there, arepredominantly monocular, whereas over half ofthose in II, III, V, and VI are binocular.
4. Ocular Dominance ColumnsWe next consider the distribution of cells in thecortex according to ocular dominance. We begin byasking whether two cells sitting side by side in thecortex are likely to have the same ocular domi-nance. The answer is that they almost always do.Either both prefer the left eye or both prefer theright. Furthermore, if an electrode penetration ismade perpendicular to the cortical surface all of thecells encountered, from the surface to the whitematter, will with high probability respond prefer-entially to the same eye (Figure 11). If we pull outthe electrode and reinsert it at a point a millimetreor so away, the same eye may again be dominant allthe way down, or the other eye may now dominate.In a horizontal or oblique penetration there is analternation of eye dominance: first one eye prevails,then the other. By making a large number of pene-trations in various directions one reaches the con-clusion that the striate cortex is subdivided intoregions whose cross-sectional width is in the order
of 0.4 mm and whose walls are perpendicular tothe cortical surface and to the layers. We term thesesubdivisions ocular dominance columns. The word'column' as applied to vertically organized corticalsubdivisions was coined by Mountcastle (1957) fora system of aggregations in the somatosensory cor-tex, corresponding to cutaneous versus deep sen-sory sub-modalities. The cross-sectional appear-ance of the ocular dominance columns does indeedsuggest a pillar-like three-dimensional shape, butas we will see the actual shape in area 17 is not at allpillar-like. In retrospect, for the visual system, theterm 'column' may be somewhat misleading, but tochange the term seems undesirable, since whateverthe exact geometric shape there is no doubt that thesubdivisions in the visual and somatosensory sys-tems are to a large extent analogous. In both sys-tems, one may add, the discovery of the subdivi-sions came as a complete surprise, since the classicalneurophysiological procedures, Golgi, Nissl andfibre stains, had given no hint of their presence.
Given these ocular dominance columns, wemay imagine that a binocular cell results fromwiring of the sort shown, very schematically, inFigure 12. Suppose a cell X in layer II or III liesabove the centre of a right-eye ocular-dominance
Fig. 11. Illustration of ocular dominance columns in macaque monkey. The diagram represents a cross sectionthrough striate cortex, with surface at top and border between layer VI and white matter below. Two verticalpenetrations and one oblique are illustrated. Letters refer to expected eye dominance at various stages in eachpenetration. RL stands for a region in which there is a mixture of binocular cells preferring the right eye, andmonocular cells responding to the right eye. R stands for a region containing only cells driven exclusively fromthe right eye. Layer IVc contains only monocular cells, grouped separately in patches according to eye affiliation.Layers above and below IVc contain binocular cells, grouped in columns according to eye preference. When avertical penetration reaches IVc the eye that has been preferred all along comes to monopolize. In an oblique orhorizontal penetration there is a regular alternation of eye preference as the electrode goes from column to col-

614 PARTY THREE REVIEWS
Fig. 12. Scheme to illustrate the wiring of a binocular cell ina layer above (or below) layer IVc. The bul\ of the afferentsto the striate cortex from the lateral geniculate body, them-selves monocular, are strictly segregated by eye affiliation inlayer IVc, and thus the cells in this layer are strictly monoc-ular. A cell outside of IVc, labelled X in the diagram, receivesits input connections, directly or indirectly, by one or moresynapses from cells in IVc (to some extent also, perhaps, fromlayers IVa and VI). Cells in IVc will be more lively to feedinto X the closer they are to if, consequently X is lively to bebinocular, dominated by the eye corresponding to the nearestpatch in IVc. The degree of dominance by that eye is greater,the closer X is to being centered in its ocular dominance col-umn, and cells near a boundary may be roughly equallyinfluenced by the two eyes (see also Figure 13).
patch. We know from the Golgi anatomy that thiscell receives its input, either directly or over a fewsynapses, from a region of layer IV having a hori-zontal extent of 1 or a few millimetres. The cellwill be most richly connected to cells in IVc lyingdirectly below it. It can therefore be predicted thatcell X will have stronger links with the eye thatfeeds the IVc patch directly beneath it, than withthe other eye. The nearer X is to being centeredover (or under) a particular patch the stronger willbe its domination by the corresponding eye; thecloser to a columnar border, the more nearly equalwill be the influence of the two eyes. This expecta-tion is borne out experimentally, for in a horizontalpenetration through the upper or lower layers (i.e.the layers above or below layer IV) there is a strongtendency to systematic fluctuation in dominanceback and forth, from one extreme through equalityto the other extreme. This is illustrated in the leftpart of Figure 13, which shows the variations inocular dominance with electrode distance for apenetration passing horizontally along layer III. Itshould be stressed that the ocular-dominance col-
umn, as we define it, refers to the full thickness ofcortex and is defined by eye preference. The part ofthe column in layer IVc contains monocular cellsonly; at the borders of the columns in IVc there islittle intermixing of the two cell populations, andthe borders themselves are consequently verysharp, more so than in the other layers. This isillustrated in the right half of Figure 13. Even out-side of IVc, however, the boundaries are far fromnebulous, and can generally be specified to within50-100 (Im.
Just why the two eyes should be broughttogether in this elaborate but incomplete way is notyet clear. What the ocular dominance columnsappear to achieve is a partial mixing of influencesfrom the two eyes, with all shades of ocular domi-nance throughout the entire binocular field ofvision. The columns may represent a way of mak-ing sure that this special kind of mixing occurs inthe same way everywhere. That monocular com-plex cells are kept aside in all parts of the visualfields is perhaps related to stereoscopy. It seemsthat cells whose fields in the two eyes show posi-tional disparity in a horizontal direction are absentor rare in area 17 but rather common in 18 (Hubel& Wiesel 1970; 1973). Area 17 projects in a topo-graphically faithful way to 18. To build up suchdepth cells in 18, with all the degrees of disparityrequired for stereopsis, probably requires keepingaside monocular cells in area 17 which can later becombined in various ways, producing a completerange of field disparities: to commit all cells in area17 by combining them with zero disparity wouldpreclude this procedure later. Presumably themachinery required to produce all degrees of dis-parity is too ponderous for it to be included in area17, which perhaps has enough to worry about as itis. While stereopsis provides a plausible explana-tion for the existence of monocular cells at the out-put end of area 17, the question of why binocularcells should exist in all shades of eye preferenceremains an open one.
5. Orientation ColumnsLet us now turn to the final variable on our list,receptive-field orientation. Here again we first askwhether neighbouring cells tend to favour thesame stimulus orientation. Again, the answer isthat they almost invariably do. And as with oculardominance, a penetration exactly perpendicular to

Fig. 13. Variation of ocular dominance with distance in two penetrations made at a very oblique angle to area17, in the parasagittal plane in macaque monkey striate cortex. The part of the penetration illustrated on the leftside is entirely in layers II and III. The portion of the penetration illustrated on the right begins in IVb, but entersIVc at the arrow and remains in IVc to the end. The two penetrations were about 1 mm apart. In layers II andIII (and also in V and VI) most cells are binocular but show some eye preference. As the electrode passes through8 or 9 dominance columns, the cells first show marked preference for one eye, then are more nearly equally drivenby the two eyes, and finally the other eye gains the ascendancy; the dominance thus swings bac\ and forth in asmooth fashion. In We, on the other hand, the transitions are more abrupt and complete, from regions dominatedexclusively by one eye to regions monopolized by the other.
615
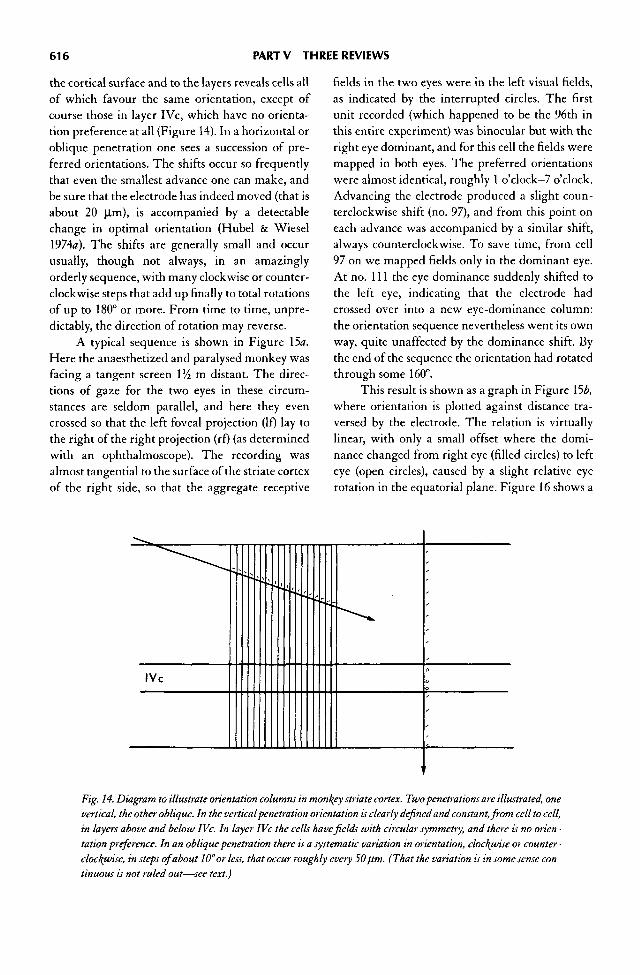
616 PARTY THREE REVIEWS
the cortical surface and to the layers reveals cells allof which favour the same orientation, except ofcourse those in layer IVc, which have no orienta-tion preference at all (Figure 14). In a horizontal oroblique penetration one sees a succession of pre-ferred orientations. The shifts occur so frequentlythat even the smallest advance one can make, andbe sure that the electrode has indeed moved (that isabout 20 |ilm), is accompanied by a detectablechange in optimal orientation (Hubel & Wiesel1974«). The shifts are generally small and occurusually, though not always, in an amazinglyorderly sequence, with many clockwise or counter-clockwise steps that add up finally to total rotationsof up to 180° or more. From time to time, unpre-dictably, the direction of rotation may reverse.
A typical sequence is shown in Figure 15«.Here the anaesthetized and paralysed monkey wasfacing a tangent screen \l/z m distant. The direc-tions of gaze for the two eyes in these circum-stances are seldom parallel, and here they evencrossed so that the left foveal projection (If) lay tothe right of the right projection (rf) (as determinedwith an ophthalmoscope). The recording wasalmost tangential to the surface of the striate cortexof the right side, so that the aggregate receptive
fields in the two eyes were in the left visual fields,as indicated by the interrupted circles. The firstunit recorded (which happened to be the 96th inthis entire experiment) was binocular but with theright eye dominant, and for this cell the fields weremapped in both eyes. The preferred orientationswere almost identical, roughly 1 o'clock—7 o'clock.Advancing the electrode produced a slight coun-terclockwise shift (no. 97), and from this point oneach advance was accompanied by a similar shift,always counterclockwise. To save time, from cell97 on we mapped fields only in the dominant eye.At no. I l l the eye dominance suddenly shifted tothe left eye, indicating that the electrode hadcrossed over into a new eye-dominance column:the orientation sequence nevertheless went its ownway, quite unaffected by the dominance shift. Bythe end of the sequence the orientation had rotatedthrough some 160°.
This result is shown as a graph in Figure 15b,where orientation is plotted against distance tra-versed by the electrode. The relation is virtuallylinear, with only a small offset where the domi-nance changed from right eye (filled circles) to lefteye (open circles), caused by a slight relative eyerotation in the equatorial plane. Figure 16 shows a
Fig. 14. Diagram to illustrate orientation columns in monkey striate cortex. Two penetrations are illustrated, onevertical, the other oblique. In the vertical penetration orientation is clearly defined and constant, from cell to cell,in layers above and below IVc. In layer IVc the cells have fields with circular symmetry, and there is no orien-tation preference. In an oblique penetration there is a systematic variation in orientation, clockwise or counter-clockwise, in steps of about W or less, that occur roughly every 50 [im. (That the variation is in some sense con-tinuous is not ruled out—see text.)

Ferrier Lecture 617
Fig. 15. (a) Illustration of results obtained in a typical experiment during part of an almost tangential penetra-tion through area 17 in the right hemisphere. The figure represents the tangent screen on which fields weremapped, rfand If represent projections of the twofoveas—the paralysed eyes had their axes crossed at a point infront of the screen. Receptive fields, collectively occupying the regions outlined in dashed circles, were about 4°below and to the left of the centre of gaze. At the beginning of the sequence shown here (cell no. 96) the orien-tation was about 1 o'cloc^—7 o'clocJ^, and responses were evoked from both eyes, the right better than the left. Asthe electrode was advanced the orientation shifted in a counterclockwise direction in small steps at a rate of about280°/mm. The right eye continued to dominate, and fields were therefore mapped only in that eye, up to cell no.111. Here eye dominance abruptly changed to favour the left eye, and fields were mapped in that eye up to no.118, when the penetration was terminated. Note that when eye dominance changed there was no interruptionof the orientation sequence.
second graph from a different experiment. Thepenetration was long and very oblique, almost tan-gential, as shown in the reconstruction at the upperright. Several reversals were seen, with the largestuninterrupted sequence totalling 267°.
The conclusion from these results is that thecortex is subdivided by a second set of vertical par-titions into columns which are very slender. Fortechnical reasons (see Hubel & Wiesel 1974<z) onecannot be sure that orientation does not vary insome sense continuously with horizontal position
(see also Albus 1975). If the steps are discrete theyoccur every 20—50 (Im and correspond to orienta-tion shifts of about 10°. Whether or not they arediscrete, one can say that roughly 180° rotation cor-responds to a 1 mm displacement along the cortex.To judge from a number of penetrations made indifferent parts of area 17, this law probably holdstrue throughout the cortex. Thus the columnsprobably have the same thickness everywhere.
It is hard to imagine that such an elaborateand highly patterned organization as this would

618 PARTY THREE REVIEWS
Fig. 15(b). Graph of orientation in degrees plotted against electrode tracl^ distance in millimetres, for thesequence illustrated in 15a. •, cells dominated by right eye; O, left eye.
have evolved if orientation were not important.The significance of the organization is suggestedby the physiology. Within each column are housedcells with concentric fields together with simple,complex, and hypercomplex cells, having the sameorientation preference and all having more or lessthe same receptive-field position. These are thevery cells which the physiology tells us are proba-bly interconnected—certainly there is no sugges-tion that cells with very different receptive fieldpositions or very different orientations have majorexcitatory interconnections. One may thus lookupon a column as a functional unit of cortex, ameans of bringing into one place the cells that areto be interconnected, and of separating them fromcells with which they have few or no connections.The alternative, of having cells mixed at random
without regard to preferred orientation, wouldsurely be less efficient in terms of length of connec-tions and specificity, for any cell could then notsimply reach out to its nearest neighbour or to cellsdirectly above or below, but would instead have tosearch out the axons or dendrites of other cells hav-ing just the correct orientation, while ignoring allthe others. It is indeed hard to contemplate thenightmare of interconnections that would have toexist if the cells were distributed at random withrespect to orientation.
Probably there is functional importance notonly in the orientation columns themselves, butalso in the regularity of their arrangement. Havingsuch a regularity presumably guarantees that allorientations are represented everywhere in thefield of vision, with no omissions or redundancies.

Ferrier Lecture 619
Fig. 16. Graph similar to that of Figure 15b, but from a different experiment. Again, the penetration was almosthorizontal and was restricted to layers II and III (see inset). Several reversals in the direction of rotation occur,with two very long, almost linear, sequences followed by two short ones. The right eye was dominant until amostthe end of the sequence.
There is probably also an improved economy in theconnections that are required to manufacture sim-ple cells from circularly symmetric ones (Hubel &Wiesel 1974#). Finally, orientation specificity maybe enhanced by mutual inhibition between cellswhose orientations differ by a small angle (Blake-more & Tobin 1972); having such cells close to-gether in neighbouring columns would shorten theconnections responsible for this inhibition.
In a cross section such as that represented inFigure 14 the orientation columns appear as pillar-like structures, just as the ocular dominancecolumns do, but several lines of evidence indicatethat they are not columns at all, in the usual senseof that word. Direct observation by means of mul-
tiple parallel electrode tracks, which can be recon-structed in three dimensions (Hubel & Wiesel1974<z), indicate that the shape is actually that ofnarrow parallel slabs lined up vertically (perpen-dicular to the surface) like slices of bread. Crosssections of such arrays would then give the appear-ance of Figure 14 unless the plane of section hap-pened to be parallel to the slabs. Only rarely, in fact,does orientation remain constant in a horizontalpenetration (resulting in a zero slope in graphs ofthe type shown in Figures \5b and 16), and suchconstancy would indeed be expected only rarely,given the unlikelihood of an electrode's threadingits way along such narrow slabs. Moreover, theslabs may be swirls rather than parallel planes, and

620 PARTY THREE REVIEWS
a swirling pattern would easily explain the rever-sals in direction of rotation seen in Figure 16.
An entirely different argument that thecolumns are actually slabs comes from considera-tions of continuity. If we suppose that throughout aparticular region of cortex there is order every-where—that for all directions of penetrations theorientation changes in small steps, or does notchange at all—then the regions of constant orien-tation must be slabs. The argument runs as follows:When we say there is order everywhere, geometri-cally we mean that if orientation in degrees is plot-ted on the 0-axis against the two-dimensional x — ycortical surface position, the graph forms somekind of surface. The surface is smooth if orienta-tion is a continuous function of position along thecortex, as discussed above, and finely terraced iforientation changes in small steps. Such a surfacein a three-dimensional graph yields the curves ofFigures \5b and 16, when cut by any plane perpen-dicular to the cortex. On the other hand if the sur-face in the three-dimensional graph is cut by aplane parallel to the cortical surface, correspondingto a particular z-value of orientation, the intersec-tion between surface and plane yields a contourline of constant orientation. Sets of such contourlines correspond to the tops of the slabs, as seenwhen one looks down on the cortex from above.The shape of the surface would of course be fasci-nating to know. The reversals seen in Figure 16could be produced by mountains and valleys, cor-responding to the swirling columns mentionedabove, or by a surface with ridges like a washboardor a camera bellows or a series of mountain ranges.
These two lines of evidence, from parallelpenetrations and from the argument based on theorderliness of the shifts, are obviously less directthan an actual anatomical visualization of the slabs,but so far no such anatomical method has beenfound. This is in part because the orientationcolumns (or slabs, as we may now term them) areproduced not by any special distribution of theafferent terminals, but by interconnections withinthe cortex. What the precise connections are thatlead to orientation specificity is not known, and asmentioned already none of the common methodsfor examining nervous tissue, such as Nissl orGolgi or fibre stains, or the use of the electronmicroscope, has yet shown anything that could beconvincingly construed as representing the orien-
tation columns. The ocular dominance columns,on the other hand, actually result from the specificpatchy terminal distribution of afferents from thegeniculate to layer IV. In this respect they differprofoundly from the orientation columns, and aremore akin to the superficial vs. joint columnsdescribed for the somatosensory cortex by Mount-castle. This dependence on afferent distributionhas made it possible to visualize the dominancecolumns anatomically, as we shall describe in thenext section.
6. Geometry of OcularDominance ColumnsHere again our problem was to determine thethree-dimensional shape of columns when thephysiological recordings told us only that the wallsseparating the columns were perpendicular to thesurface. A cross-sectional appearance of the sortindicated in Figure 11 might result from severalvery different geometries. The columns seen fromabove could, for example, consist of alternatingsquares of right and left eye affiliation, forming asort of checker board (Figure I7a). They could con-sist of islands of right-eye dominance in a sea ofleft-eye dominance, or the reverse, or of some com-bination of these two (Figure \7b). Or, finally, theycould consist of a set of alternating left-eye andright-eye stripes (Figure I7c). Cut in cross sectionany of these topologies would result in the alternat-ing sequence of Figure 11. To distinguish amongthe three possibilities (or any others that one mightconjure up) with a microelectrode is possible inprinciple, for example with reconstructions of mul-tiple parallel penetrations, but to attack such athree-dimensional problem with a one-dimen-sional weapon is a dismaying exercise in tedium,like trying to cut the back lawn with a pair of nailscissors. And so it turned out—after one or twoattempts we decided that it would be more reward-ing to turn to farming (with modern implements)as a career.
Fortunately (for American agriculture) overthe last few years four entirely independentanatomical methods have become available, and ithas been possible to approach the problem of dom-inance-column geometry directly and answer itunequivocally. The first of these was the Nautasilver-degeneration method, which relies on thepossibility of staining selectively axons that degen-

Ferrier Lecture 621
Fig. 17. Three possible ways in which a plane surface might be partitioned into two types of region; here, left eye(L) and right eye (R).
erate when they are cut proximally or when theparent cell bodies are injured. A subsequent modi-fication of this method, by Fink & Heimer (1967)and later by Wiitanen (1969), made possible theselective staining of degenerating axon terminals.With this method a large lesion in the lateral genic-ulate body would be expected to produce a forest ofstained terminals, appearing as dense 5—10 (J,mbrown dots, precisely in layer IV. In 1965 (Hubel &Wiesel) we had begun to adapt the Nauta methodto microelectrodes, making minute lesions in sin-gle cortical layers or single subdivisions of deepnuclei, recording from the electrode to help guideits precise placement prior to making the lesion. Itoccurred to us that if we were to place a small lesionin a single geniculate layer (corresponding to a sin-gle eye) the degeneration of terminals in IVc of thecortex should be in discrete regular patches withgaps between, unless our deductions from thephysiology were completely faulty.
The results of one of our first attempts at thisare shown in Figure 18, Plate 7 (Hubel & Wiesel1972). The geniculate penetration was luckilyalmost tangential to the most dorsal of the genicu-late layers, which allowed us to make a long cigar-shaped lesion entirely within this layer. This pro-duced a rather wide region ( 4 x 8 mm) of corticaldegeneration in the mushroom-like buried fold ofcortex, shown diagrammatically in the upper rightof Figure l&z. A photomicrograph of a typicalsection is shown in Figure 18£ in dark field;here regions rich in degenerating terminals glowbrightly. The existence of regular alternations ofpatches of terminals and terminal-free gaps was
thus confirmed. Now to get at the three-dimen-sional shape of these patches it was only necessaryto prepare a few hundred serial sections and stackthem next to each other at the correct spacing. Thiswas done graphically as shown below in Figure18<r. Each horizontal broken line in the diagramrepresents the patches and gaps from a single sec-tion, artificially (graphically) straightened out intoa line. The entire reconstruction thus represents aface-on view of the cortex, or, to be more specific, ofthe degenerating terminals in layer IVc.
From this reconstruction and a number ofothers it was clear that to a first approximation theIVth layer terminals have the distribution of paral-lel stripes. The stripes have a width of about 0.4mm and are in most regions remarkably regular.There is, to be sure, a certain degree of irregularity,especially a tendency for two stripes correspondingto one eye to join, leaving the intervening stripefrom the other eye to end blindly. Near the foveathe anastomoses are very frequent and form alattice-like series of cross Unkings (Figure 19). Per-haps the most striking feature of the stripes is theregularity of their spacing; it is difficult to find apoint in layer IVc that is more than about 0.2 mmfrom the nearest stripe border.
As a by-product of these experiments it wasshown that geniculate terminals do not occur inlayer IVb (Line of Gennari), confirming an oldobservation of Clark & Sunderland (1939), and thatthe parvocellular layers (the four dorsal layers)project to layer IVa and to the deeper half of IVc,whereas the magnocellular (ventral two) layersproject to the superficial half of IVc. This was the

Plate 7
Fig. 18.
622

Ferrier Lecture 623
Fig. 18. (a) Distribution of degenerating terminals in macaque monkey striate cortex following a focal lesion confined to themost dorsal layer (no. 6) of the left lateral geniculate body. At the upper left the position of the lesion is shown (stippled) on atracing of a coronal section through the geniculate. At the top right the shaded region indicates the part of area 17 in whichdegenerating terminals were found, in layers IVa and c; this drawing is traced from a parasagittal section through the occipitallobe (compare Figure 6). Within the shaded region the degenerating terminals occurred in patches about 0.5 mm wide, sepa-rated by terminal free gaps of about the same size; each section contained about 5—6 patches and gaps, (b) Darl^field photomi-crograph through region of cortex to which degenerating fibres projected. Bands of densely packed degenerating endings can beseen as light patches in the highly curved portion of the buried part of area 17. (c) Reconstruction drawn from 118 sections par-allel to the one in b, and including it. Each horizontal interrupted line is obtained from a photograph like that shown in b, bygraphically flattening the part of layer IVc containing degenerated terminals and tracing the patches of degeneration. Theresulting pattern represents the view one would get looking at layer IVc face on. The columns are thus for the most part paral-lel stripes. The vertical lines indicate the position of the crease in the cortex. (Hubel & Wiesel 1972, Figures 8-10.
first evidence that the ventral and dorsal layershave different projections. The significance of thispattern of projection is still quite obscure.
The Nauta method as applied to this problemhad one severe limitation. For a lesion to be con-fined strictly to a single geniculate layer it had to besmall, so that the consequent overall size of the cor-
responding region of striate cortical degenerationwas only a few mm in diameter. To visualize awider area, to say nothing of the entire striate cor-tex, a new method was needed. One day SimonLeVay, who had recently joined our laboratory,was examining tangentially sectioned striate cortexof macaque using a reduced silver stain, in the hope
Fig. 19. Reconstruction similar to that of Figure 18c, but here the geniculate lesion was made a few degrees fromthefoveal representation in the most ventral geniculate layer (no. 1). The lattice-like appearance, with a largenumber of blind endings and cross Unkings, seems to be a characteristic of the foveal and parafoveal region.(Hubel &- Wiesel, 1972, Fig. 17.)

624 PARTY THREE REVIEWS
of seeing something that might correlate with ori-entation columns. He noticed high in layer IVc aseries of dark parallel stripes about 400 (Urn wide,separated by narrow paler interbands about 50 |Imwide (Figure 20, Plate 8). Clearly these dark bandscould not be orientation columns—they weremuch too wide. Could they represent the eye dom-inance columns? Close examination showed thatoccasionally two dark stripes joined, but never twoadjacent ones; there was always a dark stripebetween the two, which ended blindly. LeVay rec-ognized that this was just what was to be expectedin a twofold system, since by definition if twocolumns joined they must correspond to the sameeye. To establish that the stripes were, in fact, thedominance columns we made very oblique pene-trations down to layer IVc, cutting it tangentiallyor nearly so, and then made lesions each time theelectrode tip crossed from a region dominated byone eye to a region dominated by the other. Whenthe brain was later sectioned tangentially andstained by the reduced silver method the lesionsmatched precisely the narrow pale regions separat-ing the dark bands. This established beyond anydoubt that the dark bands do indeed represent theeye dominance columns. The bands are producedby large and medium sized horizontally runningfibres in upper IVc; they are somewhat more con-centrated in the dark bands than in the narrowlighter interbands. Exactly what these fibres are isnot known; some of them are probably geniculateafferents, since some of the afferents run in thisregion and are more numerous within columnsthan between them (LeVay, Hubel & Wiesel 1975).
At the same time as LeVay's method wasdeveloped a third method for demonstrating thecolumns became available, this one based on auto-radiography and axonal transport. The method ofmapping pathways by injecting radioactive aminoacids or other compounds in the vicinity of nervecell bodies, and identifying the axon terminalsautoradiographically, was already well known(Goldberg & Kotani 1967; Lasek, Joseph & Whit-lock 1968; Cowan et al. 1972). In applying it to themonkey visual system one simply injected the labelinto the vitreous humour of the eye, whereuponthe retinal cells took it up and in the case of retinalganglion cells transported it (probably in the formof proteins) down their axons. An accumulation
of radioactive compounds in the axon terminalsled to the dense accumulation of silver grains onautoradiographs in the layers receiving inputfrom the injected eye. A typical result for macaquemonkey is shown in Figure 21, Plate 9, confirmingonce again the original deduction of Minkowski.(The power of the autoradiographic method isshown by its ability to reveal four aggregations ofoptic nerve terminals besides the six classical layers.These are described in Figure 21 (Hubel et al.1976). The targets to which these aggregationsproject are unknown, and their significance isquite obscure.)
A few years before our studies, Grafstein &Laureno (1973) had observed that in a mouse whoseeye had been injected with a mixture of radioactiveproline and fucose, some of the label was trans-ported all the way to the striate cortex of the oppo-site hemisphere. Since in the mouse the visual path-way is predominantly crossed, they concluded thatsome of the radioactive compounds had passed outof the optic nerve terminals in the geniculate, hadbeen taken up by the cell bodies there and trans-ported by the geniculate-cell axons to the striate cor-tex. We reasoned that if the same thing could bemade to happen by using autoradiography in themonkey we should be able to see the distribution, inlayer IV, of the geniculate-cell terminals correspon-ding to the injected eye. These should then appearin cross section as patches of silver grains, about 0.4mm wide, separated by gaps corresponding to theeye that had not been injected.
The result of such an experiment is shown inFigure 22, Plate 10 (Hubel et al 1976). Dark-fieldtechniques had to be used since the grains were toosparse to be obvious on cursory inspection by lightfield illumination. The layer IVc columns standout clearly everywhere, and this section by itselfshows some 56 pairs of columns.
Though requiring an eye injection and theuse of large amounts of radioactive substances,which are expensive and not free of danger, thismethod has several advantages over LeVay'sreduced silver technique, for the latter only revealsstripes in sections that are tangential or almost tan-gential to layer IV, and does not seem to work at allin monkeys under about 6 months old.
To reconstruct the pattern of columns over awide area and to visualize them en face, one can

Fig. 20. Pattern of ocular dominance columns seen in a tangential section through layer We of normal macaquestriate cortex, stained by the reduced-silver method ofLiesegang. The cortical surface is seen on the upper left ofthe figure. The very dart{ ring is layer IVb, the line ofGennari. Within this is layer IVc with the alternating dari^and light bands, except for a small area marked by the asterisk^, which grazes layer V. The dar\ bands representthe columns. These contain relatively fewer horizontally running fibres near their borders, resulting in the lightbands. The actual column boundaries are thus the centre lines of these light bands (LeVay et al. 1975, Fig. 2).
625
Plate 8

Plate 9
Fig. 21. Autoradiographs of left and right lateral geniculate bodies of a 1-week^-old monkey whose left eye wasinjected at birth withtritiatedfucose. Lightfield: labelled regions are blac/(. 1-6 are the classical six layers, num-bered from ventral dorsally. a-d represent four additional regions of input: a and c are supplied from the con-tralateral eye, bfrom ipsilateral, and d is apparently supplied by both eyes, possibly as alternating band-likemonocular regions.
626

Fig. 22. Dar^-field autoradiograph of striate cortex in an adultmacaque in which the ipsilateral eye had been injected with tritiatedproline-fucose 2 wee\s before. Labelled areas show as white. Sectionpasses for the most part in a plane perpendicular to the surface. Photo-
graph shows pan of the exposed surface of the striate cortex and theburied part immediately beneath; some of the buried part has fallenaway during sectioning. In all, some 56 columns can be counted inlayer IVc.

628 PARTV THREE REVIEWS
stack many serial sections such as that of Figure 22one above the other just as was done in preparingFigures 18c and 19. A more direct alternative is tosection the cortex tangentially—something thatwas impractical in the Nauta studies because onenever knew exactly where in the cortex the smallpatch of degenerating terminals would be found. Ifthe microtome knife cuts the dome-shapedexposed part of area 17 so as to graze layer IVc, thislayer appears as an oval. A slightly deeper sectioncuts layer V in an oval, and layer IVc then appearsas an annulus. Such a section, showing layer IVc asan annulus, is shown in Figure 23a, Plate 11, fromthe same monkey as that of Figure 20, but theopposite hemisphere. By taking deeper and deepersections a series of larger and larger annuli results.These can then be cut and superimposed, givingthe reconstruction shown in Figure 23>b. Again thegeneral arrangement of the layer IVc patches asparallel stripes is very clear, as are the occasionalbifurcations and blind endings.
By using LeVay's reduced-silver technique(the autoradiographic technique could have beenused equally well) it has been possible to recon-struct the columns over the entire exposed part ofthe occipital lobe (the operculum), and, with smallgaps where curvature is extreme, their continua-tion in the calcarine fissure. The reconstruction ofthe operculum is shown in Figure 24a (LeVay et al.1975). This diagram represents the same part ofarea 17 as is shown in the right side of Figure 6a,with the foveal representation to the extreme rightand the left boundary representing roughly a semi-circle 9° distant from the fovea. To visualize moreeasily the actual size of the stripes in Figure 24, afingerprint of one of us (D.H.) is reproduced inFigure 24£, to the same scale.
Several conclusions can be drawn from thisreconstruction and from results using the othertwo anatomical methods. First, the stripes areroughly of equal width in all parts of 17, except fora few stripes at the extreme peripheral binocularregion and, of course, the monocular region. Thusit seems that for both systems of columns thewidths are constant throughout most of the cortex.For the monocular part of the cortex, i.e. the repre-sentation of the outlying temporal parts of thevisual field, which can be seen by one eye but notthe other (the temporal crescents), there is in theautoradiographs the expected continuous band of
label in the hemisphere opposite the injected eye,and nothing on the ipsilateral side. We have notsectioned this part of the cortex tangentially andstained with the reduced silver method becausetangential sections here are difficult to obtain. Wewill refer again to the temporal crescent represen-tation in discussing effects of deprivation.
Secondly, from hemisphere to hemisphere,even on the two sides in the same monkey, the pat-terns of stripes differ in their details. Identical pat-terns would indeed not be expected, any more thanone would expect the stripes of all zebras to beidentical. Nevertheless, as with zebras' stripes(Portmann 1948) certain general rules seem to beobeyed in all the monkeys we have so far looked at.For example, the stripes seem always to interest the17-18 border at approximately 90°. At least in themid-periphery and periphery of the visual fieldsthe stripes when projected into the visual fieldsturn out to be approximately semi-circles (Figure25); see also Hubel & Freeman (1977). This figurealso shows strikingly the distortion in size thatoccurs as a consequence of the variation in magni-fication with eccentricity. The number of domi-nance columns in each hemisphere is about 150.
A final demonstration of ocular dominancecolumns comes from the 2-deoxyglucose methoddeveloped in recent years by Sokoloffs group(Sokoloff 1975, 1977) The method is based on theincrease in uptake of glucose or deoxyglucose byactive cells, and the inability of the metabolic endproduct of deoxyglucose to pass out of a cell. In ani-mals injected intravenously with radioactive glu-cose, previously active cells thus show on autora-diography a surfeit of silver grains. Macaquemonkeys in which one eye has been removed orclosed show in area 17 a beautiful pattern of oculardominance columns (Sokoloff 1975; Kennedy et al.1975). In contrast to the eye injection technique,this method reveals the entire column from layer Idown to layer VI, rather than just the part in layersIVa and c.
7. Representation of Visual Fields inLayer IVcIn one important respect Figure 25 may be mis-leading, since taken literally it could give theimpression that only half of the visual field is rep-resented in each eye. If black stripes represent righteye, for example, one could infer that the right eye

Plate 11
Fig. 23. Autoradiograph from the same (normal) animal as Figure 22, but hemisphere contralateral to theinjected eye (darkjield). (a) shows a section tangential to the exposed dome-like surface of the occipital lobe, justgrazing layer V, which appears as an oval, surrounded by layer IVc, which appears as a ring containing thelabelled parallel bands; these appear as light against the dar\ background, (b) a composite made by cutting outlayer IVc from a number of parallel sections such as the one shown in (a), and pasting them together to show thebands over an area some millimetres in extent.
629

Fig. 24. (a) Reconstruction of layer IVc ocular dominance columns over the entire exposed part of area 17 in theright occipital lobe, made from a series of reduced-silver sections (LeVay et al. 1975). Dotted line on the left rep-resents the midsagittal plane where the cortex bends around. Dashed c-shaped curve is the 17-18 border, whoseapex, to the extreme right, represents thefovea. Every other column has been blackened in, so as to exhibit thetwofold nature of the set of subdivisions. Note the relative constancy of column widths, (b) Fingerprint of humanindex finger, to scale, for comparison.
630

Ferrier Lecture 631
Fig. 25. Translation of the recon-struction of Figure 24a into thevisual field. Since this is the righthemisphere, the translation is into theleft visual field. With the aid of acomputer each point along the dia-gram in Figure 24a has been pro-jected into the visual field. Note thatprojected stripes are narrowestaround the point of fixation andbecome progressively broader withincreasing eccentricity. The projec-tion is shown out to 9°. (Hubel &Freeman 1977.)
sees the black regions but is blind to the white,which are seen only by the left eye. Intuitively, thiswould seem most unlikely. To resolve the problemthe most direct procedure is to ask what happens tothe positions of receptive fields as an electrodemoves horizontally through the cortex from oneeye dominance column to the next.
In the layers above and below IVc, in crossingthrough the 0.4 mm occupied by a single column, itis very difficult to make out any appreciable drift inreceptive field position against the random scatter;one records a number of binocular cells all domi-nated by one eye, intermixed with some monocularcells especially near the column borders, all of these
cells varying slightly and rather unpredictably inreceptive-field position. As described above, a dis-placement in the cortex several times this size isrequired to detect any clear overall movement inthe visual field. In the upper and lower layers, atleast, there is no doubt that any given part of thevisual field is represented in both eyes.
In layer IV, however, the receptive field cen-tres are very much smaller than the fields in theupper and lower layers. The positions of the indi-vidual fields can therefore be specified far moreaccurately. The scatter in field positions is also verymuch less—the cells seem to obey the rule that wehave found to apply wherever we have recorded in

632 PART V THREE REVIEWS
the visual system, namely that receptive-field scat-ter is of the same order of magnitude as the size ofthe fields that are scattered, so that the aggregatefield for any one layer is several times the size of anaverage field. It occurred to us that in crossingfrom one side of an ocular dominance slab to theother, within layer IVc, the precision of representa-tion might be sufficient to permit the detection of acorresponding movement through the visual field.Experimentally this is, in fact, possible (Hubel,Wiesel & LeVay 1974) and there turns out to be avery special and highly ordered topography withinlayer IVc. As an electrode crosses from one side tothe other of a single column there is a clear pro-gression through the visual field in a direction pre-dicted by the topographic map of the visual fields.All of this movement of course takes place in oneeye only; as long as the electrode tip is within alayer IVc column no responses are detected fromthe other eye. When the border of the column isreached the eyes switch, and one now looks to seethe positions of the receptive fields of the first cellsrecorded in the newly dominant eye. If the recep-tive fields were to continue their march throughthe visual field uninterrupted by the change ofeyes, and if this were to occur at every column bor-der crossing, then the visual field would obviouslyend up being shared by the two eyes in the mannersuggested by Figure 25. This is not at all what hap-pens. As the border is crossed there is an abruptdiscontinuity in the visual-field representation.The position of the receptive fields suddenly jumpsback in the visual field through a distance equal toabout half of that crossed in the preceding column,when the other eye was used. As the electrode isadvanced the fields resume their march forward,recovering the lost territory and then going on foran equal distance into new ground. This is illus-trated in Figure 26. The visual field is traversedcompletely in each eye, but in an intermittent 'twosteps forward and one step back' fashion, in whicheach eye must take its turn. The corollary of this isthat within a single column the magnification—the number of degrees traversed for each millime-tre of cortex—must be double the overall local cor-tical magnification: in crossing column aftercolumn each eye is heard from only half the time,and if the fields are to keep up with the movementof the receptive fields in the other layers the move-ment must occur at twice the overall rate. Across a
given column magnification (mm cortex/degreevisual field) must be half that along the length.
The main point, however, is that the field ofvision in layer IV is represented completely in eacheye. The peculiar interlaced way in which this isaccomplished is necessitated by the very specialside-by-side manner in which the cortex is sharedby the two eyes.
8. The Cortical MachineryIf we now step back and survey the different com-ponents of area-17 architecture just reviewed, wefind that they fit together rather like the pieces of aChinese puzzle. The orientation columns, if dis-crete, are some 50 |Im in width, and each repre-sents a shift in angle of about 10°. To cover the full180° therefore requires a movement across the cor-tex of the order of 1 mm. Similarly each oculardominance column is about 0.4 mm in width, andto take care of both eyes requires two suchcolumns—again roughly 1 mm. In each case wedesignate one complete set of columns, subservingall orientations on the one hand or both eyes on theother, as a hypercolumn (Hubel & Wiesel 1974£).We now ask what happens to the position of recep-tive fields in the visual field as an electrode movinghorizontally through the cortex traverses onehypercolumn, of either type. Obviously, it wouldmake no sense at all if movement through one ori-entation hypercolumn were associated with amovement through the visual field that was largecompared to aggregate field size, for that wouldmean that some regions of visual field must be spe-cialized to handle certain orientations and othersother orientations. There is certainly no hint, frompsychophysics, of any such specialization in ourown visual fields. Similarly crossing a single eye-dominance column outside of layer IVc produces adisplacement of aggregate field considerably lessthan the local aggregate field size. In fact, as wehave seen, it takes a 1-2 mm traverse through thecortex to produce a movement in the visual fieldthat is comparable to the aggregate field size. Whatthis means is that contained in a 2 mm X 2 mmblock there is more than enough machinery todigest such a region of visual field (the aggregatesize), examining it for light-dark contours in allorientations and with both eyes.
A block of cortex containing a hypercolumnof each type is illustrated schematically in Figure

cortex
visual field
Fig. 26. Diagram to illustrate topographic representation in layer We. An electrode passes through cortexobliquely, almost parallel to the layers; it enters layer IVc, crosses five ocular dominance stripes, and then leavesthat layer. During this traverse there is a progressive movement of receptive-field centres through the visual field:the fields in this layer are small enough, and the topography precise enough, to ma^e this movement obvious.Suppose arrow 1, in the lower part of the figure, represents the movement as measured in the eye that feeds intocolumn 1—say the left eye. On crossing over to column 2, the right eye becomes the one that evokes responses.The receptive-field position jumps bac\ in the visual field by half the distance just traversed, moves forward soas to retrace the lost ground and then an equal distance further (arrow 2). The left eye then takes over again,with a jump bac\ to its previous position and a similar progression (arrow 3)—and so on. The overall rate ofmovement is the same as that measured in the upper and lower layers (Figure 8b). Thus layer IVc has a com-plete representation of the visual fields.
633

634 PARTY THREE REVIEWS
Fig. 27. Model of the striate cortex, to show roughly thedimensions of the ocular dominance slabs (L, R) in relationto the orientation slabs and the cortical thickness. Thinnerlines separate individual columns; thicker lines demarcatehypercolumns, two pairs of ocular dominance columns andtwo sets of orientation columns. The placing of these hyper-column boundaries is of course arbitrary; one could as wellbegin at horizontal or any of the obliques. The decision toshow the two sets of columns as intersecting at right angles isalso arbitrary, since there is at present no evidence as to therelationship between the two sets. Finally, for conveniencethe slabs are shown as plane surfaces, but whereas the domi-nance columns are indeed more or less flat, the orientationcolumns are not kriown to be so, and may when viewed fromabove have the form of swirls.
27. For purposes of illustration we have drawn thetwo sets of columns orthogonal to each other, but itshould be stressed that there is at the moment nodirect evidence to suggest how the two sets arerelated, if indeed there is any consistent relation.There would seem to be advantages, however, forthem to intersect at some angle, and preferably at90°. There is good reason to expect cells that areinterconnected to have the same orientation prefer-ence, at least if the connections are excitatory, andour notion of the significance of the orientationcolumn is that it houses together groups of cellswith like orientation preference in the interests ofefficiency of connections. At the same time we
imagine that a binocular cell in the cortex, complexor hypercomplex, receives its input directly or oth-erwise from two sets of simple monocular cells, oneset for each eye (Figure 12). The connections sub-serving this binocular convergence must by defini-tion extend beyond the borders of a single oculardominance column. If the two column systemswere parallel these connections would at the sametime have to link up at least two orientationcolumns with the same orientation affiliation, sep-arated by all the intervening orientation columns.This cumbersome wiring could largely be obviatedif the two sets of columns were to intersect, sincethen the fibres could cross ocular dominancecolumns while remaining within the same orienta-tion column.
The probable pattern of activity of cells inarea 17 in response to a contour in the visual field isillustrated in Figure 28. We suppose that the con-tour is a short horizontal line segment, and isviewed by the left eye only: this is shown to theright in Figure 28. For the sake of specificity weplace the line in the upper left visual quadrant. Thegeneral region of cortex affected is predictablefrom the topographic map of the visual field; let ussuppose the line projects to the elongated region inthe right striate cortex shown by the broken lines inthe left part of the figure. Within this area the dis-positons of the boundaries of the two types ofcolumns will, given the limitations of our presentknowledge, be unpredictable; let us assume thatthe boundaries are more or less orthogonal andhave the shape shown—for the present discussionthe precise shape and relationship to the corticaltopography are immaterial. The regions of cortexmaximally affected will be those areas within thebroken-line boundary that represent horizontallines and also represent the left eye. The patternproduced by the active cells should therefore besomething like that shown in heavy lines. Ofcourse, a truer representation would show fuzzi-ness both at the edges, since orientation specificityis for most cells relaxed enough so that neighbour-ing columns will be weakly stimulated, and at theends, since many cells in the right-eye columns willbe influenced from the left eye, though againrather weakly. (In layer I Vc, of course, the oculardominance column boundaries are rigidly re-spected, but the orientation columns are irrelevant,so here all of the left-eye territory within the bro-

Fig. 28. Diagram illustrating the pattern of cortical activity that might followfrom stimulation of the left eye with a short line in the visual field, say a horizon-tal line in the left visual field, as shown in the diagram on the right. To the left isdrawn an area of cortex including the activated region as it might appear if onestood above and looked down at it. Let V and H represent the vertical and hori-zontal directions—their position will of course be determined by the topographicmap of the visual fields on the cortex. Let the region outlined by dashes be the area
receiving input from the illuminated part of the visual field (i.e. the sum of aggre-gate fields of all the points along the line stimulus). Suppose, finally, that the eye-dominance and orientation columns are as shown; for the argument, any otherdirections would do just as well; as in Figure 27, the decision to mat^e the bound-aries of the two sets of columns orthogonal is arbitrary. Then the regions of acti-vation will be those marked by heavy lines—the areas corresponding to horizon-tal stimuli and left eye. See text for additional comments.

636 PARTY THREE REVIEWS
ken lines will be active, instead of only the territorybelonging to one specific orientation, and no right-eye territory will be affected.) Such a diagram can,in principle, be prepared for any line or curve in thevisual scene: one first draws the swath of activatedterritory on the cortex, as determined from thetopographic map, and then fills in the squaresaccording to the local orientation and the eye thatis being used. The interesting conclusion is that acontinuous line in the visual field produces a verydiscontinuous activity pattern in area 17.
Parenthetically we may emphasize here howabsurd it is to think of a simple or complex cell as a'straight-line detector'. What is detected is the ori-entation of a short line-segment. A straight linelong enough to be seen as straight (or for that mat-ter a curved line) would have to be 'detected' bysome cell receiving input from populations ofarea-17 cells, presumably scattered in regions such asthose shown in Figure 28. Whether such cells existis not known.
It is perhaps worth stressing once more thatthe cortical machinery is highly uniform, as far asis known, at least throughout the binocular part ofthe cortex. Both sets of columns have roughly con-stant width. In the temporal crescent representa-tion, where only the contralateral eye has input,there are obviously no ocular dominance columns.It is also likely that certain kinds of analysis, forexample those involving colour, are selectivelyemphasized in the fovea, while others, like move-ment, are best developed in the periphery. Thus theuniformity may not be absolute. Aside from theseprobable differences, what seem to be the mainpreoccupations of area 17, orientation selectivityand binocular convergence, probably depend onthe same apparatus throughout. This is supported,as mentioned earlier, by the similarity of the histol-ogy everywhere, and the tailoring of aggregatefield size to magnification.
The cortex, then, seems to solve the problemof analysing the visual field in great detail centrallyand in much less detail peripherally, in a very spe-cial way. The same basic units of cortical function(Figure 27) seem to be used throughout, but moreof them are used per degree of visual field thegreater the detail of analysis. The alternative to thiswould be to vary the machinery, for example byhaving a thicker cortex in the region subserving thefovea, with more cells and more connections in a
unit area. Intuitively one suspects that that wouldbe a far more difficult and cumbersome solution.The disparity in magnification between fovea andperiphery is very large, so that if magnificationwere uniform the corresponding regions of cortexwould presumably have to be very different inthickness.
The development of the cortex, finally, mustpose a much easier problem if the structure is uni-form, since the instructions need only be specifiedonce, for a block roughly 2 mm X 2 mm; and thenrepeated again and again—perhaps about 300—400times, since the surface area of the macaque striatecortex is probably in the neighbourhood of1300-1400 mm2 (Clark 1941; Daniel & Whitteridge1961).
STUDIES IN NEWBORN MONKEYS
In addressing the problem of the development ofarea 17, it seemed to us that the first question to askwas whether the system as we know it in the adult,with its hierarchy of cells, its topographic map andits intricate architecture, is all present at birthand thus presumably determined genetically, orwhether some or all of the specificity depends onthe details of postnatal experience. Our previouswork in cats (Hubel & Wiesel 1963) had led us toconclude that in that species genetics was the main,if not the sole determinant in the formation of area17, but the problem was complicated by the imma-turity of the cat's visual system at birth and a diffi-culty in knowing whether binocular deprivationeffects were a result of holding back postnatal mat-uration or of withholding specific experience. Bynow almost everyone seems to agree that one canfind cells with strict orientation specificity in visu-ally naive cats (Blakemore & Van Sluyters 1975),but it is still difficult to interpret the large numberof non-oriented cells in these animals. Any slightdeterioration in an animal's condition duringrecording can lead to a disappearance of orienta-tion specificity, and very young animals are espe-cially hard to keep in good condition during acuteexperiments.
The newborn macaque monkey is visuallymuch more advanced than the cat. The eyes areopen, and by the day after birth the baby monkeyfixes visually and follows objects with its eyes. Onewould expect, then, that for interpretations of dep-

Ferrier Lecture 637
rivation effects the problems of postnatal matura-tion might be less troublesome in the monkey thanin the cat.
Recordings from newborn monkey cortex arein fact very similar to those obtained in the adult(Wiesel & Hubel 1974). Cells in layers outside IVcoccur in simple, complex and hypercomplex types,with orientation and directional specificity thatappear to be about as well developed as in the adult.To be certain that there are no differences betweennewborn and adult would require a statistical sur-vey, with automated stimuli and averaged re-sponses. This has not yet been done. Histologicallythe cortex of the newborn macaque is indeed notfully mature (though it is far advanced by compar-ison with the cortex of the newborn cat), so thatsome differences between it and adult cortex mightwell be expected. Receptive field size, for example,may be larger. But what strikes one most forcibly inthese records is the similarity to the adult, not thedifferences. One exception to this, in the case ofocular dominance columns, is taken up below.
To record in area 17 from a monkey on theday of its birth is technically difficult and risky. Inmost cases we have therefore sutured the eyesclosed at birth, to avoid visual experience, andrecorded after about 2-4 weeks. The eye closuresallow some diffuse light to reach the retinas butalmost certainly exclude any light-dark contours.Records from area 17 in these animals were virtu-ally indistinguishable from those of adults. Oneproblem posed by this procedure was the delaybetween the birth of the monkey and our notifica-tion of the birth, during which time the animalusually received a few hours of visual exposure. Itseemed hardly likely that a few hours' experiencein dim light would by itself produce an adult-likecortex, but it seemed important to avoid all possi-bilities of this. We accordingly did a Caesarean sec-tion in a mother monkey near term, immediatelysutured the eyes of the baby, and waited 2 weeksbefore recording. This animal's primary visual cor-tex showed just as high a degree of specificity aswas seen in the cortex of other less stringently con-trolled monkeys. A graph of optima orientationagainst track distance in this monkey is shown inFigure 29. The graph points up another aspect ofthe recordings: in addition to the regular small ori-entation shifts indicated by the graph, there wereperiodic alternations in ocular dominance. This
indicates that both the orientation and ocular dom-inance columns are present, though, as we will see,the development of the dominance columns is notquite complete at birth. That area 17 is in so manyrespects wired up and ready to go when the animalis born is perhaps not so surprising if one remem-bers that the machinery of area 17 represents build-ing blocks of vision, used in a piecemeal analysis ofthe visual fields and required whatever the detailedenvironment of the animal is to be. One would notexpect experience to be important in the develop-ment of area 17 any more than it is in the develop-ment of retinal connections: the striate cortexextends the kinds of analysis already begun in theretina, and what takes place there is not muchmore sophisticated, relative to the tasks that stillremain to be solved in perception. Nevertheless,our original finding that specificity of varioustypes, particularly orientation specificity, was al-ready present in the newborn was greeted withsurprise and some considerable scepticism. Thereason for this is a partly justified conviction thatthe cerebral cortex of all parts of the brain is thestructure most important for perception, memory,and in fact for mentation in general. A structurethat is involved in learning must change in someway with experience. Hence to find some part ofthe cortex for all intents and purposes formed atbirth seems to fly in the face of all one's preconcep-tions about that structure. Too little is known aboutother cortical areas to permit guesses as to theimportance of experience in forming and organiz-ing them, but, to take an extreme case, one wouldcertainly expect regions such as the speech areas ofman to be modified by the details of postnatal expe-rience. The striate cortex seems to represent anextreme in the other direction, and the lesson, ifany, is that very different rules may apply in thedevelopment of different regions of the cerebralcortex.
DEPRIVATION STUDIES
A detailed account of the studies we and othershave made on the effects of early deprivation on thevisual system is beyond the scope of this article.Some recent results, nevertheless, bear strongly onthe problem of the origin of the ocular dominancecolumns, and illustrate the possibility of deformingthe columns. To describe these results it will be

638 PARTY THREE REVIEWS
Fig. 29. Graph of orientation plotted against electrode position similar to those of Figures 15b and 16, but for a30-day-old monkey that was delivered at term by Caesarean section and both eyes immediately sewn shut. Theanimal thus had no patterned visual experience. Orientation specificity in this animal showed no obvious lac\ ofprecision, compared with what is seen in the adult.
necessary to review at least some of the deprivationwork. Some years ago we observed that if one eyeof a kitten was sewn closed for the first few monthsof life a marked change occurred in the corticalphysiology (Wiesel & Hubel 1963). Instead of mostcells' responding to both eyes, the great majority ofcells lost all ability to respond to the eye that hadbeen closed, while remaining normally responsiveto the eye that had been open. Recordings fromretina and geniculate were relatively normal, sothat the major defect was clearly in the cortex. We
found that to obtain the changes the eye had to beclosed some time during the first few months, andthe most marked changes were produced by clo-sures between about the fourth and eighth week oflife. Closures in adults produced no obviousdefects. Our first guess was that the defects resultedsimply from disuse of the closed eye. This guesswas incorrect, as we found on examining cats inwhich both eyes had been sewn shut from birth, forhere there were far less severe defects than wouldhave been predicted on any naive expectation that

Ferrier Lecture 639
the separate lid-closure effects add in a simple way(Wiesel & Hubel 1965). Evidently monocular clo-sures produced such striking results because ofsome kind of binocular competition; if the right eyewas closed the pathway belonging to the left eyecould presumably take over the right eye's territoryat some point along the pathway. The idea of acompetitive interaction between the two paths wassubsequently reinforced by anatomical findings atthe geniculate level by others (Guillery & Stelzner1970; Guillery 1972; Sherman 1973; Sherman,Guillery, Kaas & Sanderson 1974).
Similar experiments in monkeys have givenalmost the same results. The critical period formonocular-closure effects is probably the first 6weeks or so, though eye closure produces defectsfor a period of up to a year or more if the closure issufficiently prolonged.
The macaque monkey provides an opportu-nity to test the idea of binocular competition, sincein area 17, as described in the first part of this paper,convergence of inputs from the two eyes does notoccur until after the first two stages of integration.There is thus little or no convergence in layer IV,and one might not expect to see a profound distur-bance of responses in this layer following monocu-lar deprivation. For the layers above and below IVcour early studies in monkeys had shown a takeoverby the normal eye that was just as impressive asthat which occurs in the cat, but until a few yearsago we had not looked specifically at layer IV itself.Obviously the time was ripe to study layer IV indeprived monkeys, using the same tools we hademployed in the normal physiological recordings,i.e. tangential penetrations, the Nauta method, thereduced silver method and transneuronal autora-diography (Hubel, Wiesel & LeVay 1977).
We began with the rather radical procedureof removing one eye in each of two 2-week-oldmonkeys and waiting \l/2 years before experiment-ing. We felt that if this did not produce a change inlayer IV nothing would! We were not disap-pointed, for when we made long tangential pene-trations through the cortex we found that therewas in layer IVc almost continuous activity evokedfrom the normal eye as the electrode moved for-ward, instead of responses for about 0.4 mm alter-nating with silence for 0.4 mm, as would beexpected if no change had occurred. This sug-
gested that there had been a rearrangement in layerIVc, with the retinogeniculate fibres belonging tothe normal eye occupying space normally allottedto the deprived eye.
This was confirmed anatomically. In one ofthe animals, for example, we made several genicu-late lesions 5 days before the recording; some weremade in layers fed by the normal eye, some in thedeafferented layers, which were electrically silent.On examining the cortex with Nauta stain we wereable to find the projections from two of the normal-layer lesions and from one of the deprived-layerlesions. The reconstruction of two of these projec-tions is shown in Figures 30 and 31; they are analo-gous to the reconstructions from a normal monkeyshown in Figure 18. What the diagrams show isthat the terminals from the geniculate layers fed bythe normal eye have occupied virtually the entireextent of layer IVc, instead of exactly half of it,while the bands representing the removed eye areless than one-third normal size. This anatomicalresult was obtained in both monkeys, and confirmsthe physiological findings.
We have done similar experiments over thepast few years in monkeys with monocular eyesuture from an early age. The results have beengenerally similar to those obtained after eyeremoval. For example, one monkey had its righteye sutured closed at 2 weeks of age and wasallowed to live for 18 months. Two weeks beforethe records were made, the left (normal) eye wasinjected with radioactive ammo acids, and a weekbefore recording, geniculate lesions were made forNauta studies. The results of making several tan-gential penetrations were similar to what we hadfound after eye removal, but not so extreme; ratherto our surprise there were regions in layer IVc inwhich brisk responses were obtained only from theright (closed) eye. The spans over which theseresponses were recorded were clearly short com-pared with the normal 0.4 mm. In striking con-trast, the regions dominated by the normal eyewere much wider than normal. At each pointwhere a shift of eyes occurred a small electrolyticlesion was made in order to correlate the points oftransition, in the recordings, with the autoradio-graphic results.
Transneuronal autoradiography fully con-firmed this impression of an extreme departure

640 PARTY THREE REVIEWS
Fig. 30. Distribution of degenerating terminals in layer IVc of a macaque monkey whose right eye was removedat 2 weeks of age and the experiment carried out at an age of 18 months. At that age lesions were made in twolayers of the left lateral geniculate body, and the brain sectioned 5 days later and stained by the Fin/(-Heimermethod (compare Figure 18). Here the lesion was made in layer 3, whose input was from the surviving eye.Bands of terminal degeneration are wider than normal, whereas gaps between the bands, corresponding to theeye that was removed, are markedly shrunken.
from the normal balance in the distribution ofgeniculate terminals. Figure 32a, Plate 12, shows aphotograph of a section made tangential to layerIVc, analogous to the normal section of Figure 23a.The picture is again taken under dark-field illumi-nation, so that the bright regions produced by sil-ver grains represent terminals of afferent genicu-
late fibres belonging to the injected, normal eye. Amontage from a number of sections parallel to thisone is shown in Figure 32b. The deprived columnsnot only show marked shrinkage, but seem inplaces to be pinched off entirely. Actual measure-ments of area in this montage indicate a shrinkageof about 50%. To the right in (b) the lesions made

Ferrier Lecture 641
Fig. 31. Same monkey as in Figure 30. Lesion in layer 6, the most dorsal layer, deafferented. Bands of degener-ation in IVc are markedly shrunken, and the gaps between widened. This is thus the complement of Figure 30.(Figures 30 and 31 are from Hubel et al. (1977).)
during the recording are indicated, traced fromneighbouring fibre-stained sections. Each lesion isjust where the recordings had predicted it shouldbe, on the border separating two bands. The agree-ment between the physiologic and anatomic resultstends to strengthen one's confidence in bothapproaches.
Finally, another monkey had its right eyesutured at 2 days of age, for a period of only 7 weeks;the eye was then reopened and the animal kept to an
age of 7 months, at which time the right (deprived)eye was injected with a tritiated proline-and-fucosemixture and the brain examined two weeks later. Atransverse section through the left striate cortex isshown in Figure 33, Plate 13. Here the labelled por-tions of layer IVc, corresponding to the deprivedeye, are markedly shrunken. This experiment thusforms the complement of the previous one. In addi-tion, in agreement with other anatomical and phys-iological studies, it shows that even a very brief clo-

Fig. 32. Transneuronal automdiography of left occipital lobe of macaque monkey whose right eye was suturedclosed at 2 weeks, and studied at 18 months. Left (normal) eye injected with tritiated proline-fucose mixture 2weeks before brain was sectioned, (a) Section tangential to layer IVc, dar\field, as in Figure 23. Note expansionof labelled columns and shrinkage of the gaps. The serial reconstruction, (b), was made from a number of sec-tions parallel to a and including a. The positions of six lesions, determined from neighbouring sections, are shownnear the right border. These lesions were made during the electrical recordings, in two penetrations (arrows), atpoints of eye transition. Note how each lesion falls on a column border. (From Hubel et al. 1977.)
642

Plate 13
Fig. 33. Autoradiograph of transverse sections through striate cortex of a 7-month-oldmacaque monkey whose right eye was closed at 2 days of age, for a period of 7 weeks; theeye was then reopened and kept open till an age of 7 months, when the right (deprived)eye was injected with radioactive proline-fucose mixture and the brain examined 2 weeks
later. The labelled columns in layer We are shrunken, and the gaps between enlarged.(Label is seen at two distinct horizontal levels, thin in layer IVa above and thicker in IVcbelow.) This figure forms the complement of Figure 32, in which the normal eye wasinjected. (From Hubel et al. 1977.)

644 PARTY THREE REVIEWS
sure is enough to disturb the columns, and furtherthat the recovery resulting from simply reopeningthe eye is very disappointing.
DOMINANCE COLUMNS INNEWBORN MONKEYS
On first seeing the results described in the preced-ing section our natural tendency was to assume thatmonocular closures had led to an invasion of thedeprived columns by geniculate terminals belong-ing to the eye that had been open. A process of pro-liferation of terminals and spread beyond their nor-mal territory when a competing set of terminals isput at a disadvantage has been observed in many sit-uations, and is usually termed 'sprouting', thoughthat term has normally been used in cases where thecompetition has been destroyed by a lesion, surgicalor electrolytic. The notion that sprouting can occurby an insult as mild as merely covering one eyewould in itself be of considerable interest. If thiswere indeed a matter of sprouting one would haveto modify the idea of competition, for here one canobviously only talk about competition betweencolumns, i.e. sets of terminals in layer IVc, and notabout competition between two inputs for territoryon a single cell. How one set of terminals wouldknow that it should extend its domain, whether bya chemical signal or some other action at a distance,is a matter for speculation.
A recent set of findings (Hubel etal. 1977) hasmade us reconsider the whole question of sprout-ing. In accounting for the IVth layer changes fol-lowing deprivation we had assumed that the oculardominance columns were present at birth, or atleast at 2 weeks, when the closures were made.There was some reason for this assumption, sincerecordings from layers outside IVc in newborn ani-mals had shown regular fluctuations in ocular dom-inance. What we needed, however, was autoradio-graphic proof that in the newborn monkey thegeniculate terminals were sharply segregated inlayer IVc. Accordingly, we injected the eye of amonkey the day after birth and examined the visualpathway autoradiographically at one week. Thelateral geniculate bodies were well labelled, andshowed a layering as distinct as in the adult. Thisresult has already been illustrated in Figure 21. Thecortical picture was, on the contrary, not at all what
we had expected. Layer IVc, as seen in transversesection, was virtually continuously labelled, withonly the vaguest of fluctuations in density here andthere (Figure 34a, Plate 14). Tangential sections did,however, show periodic stripe-like variations indensity, but with levels of label that were well abovebackground throughout (Figure 34£), suggestingthat at that age terminals belonging to one eye werenot restricted in any clear-cut way to one set ofstripes. This would mean that a particular genicu-locortical fibre, which in the adult would enter thecortex, subdivide, and have its branches run selec-tively to several stripes of its own set, over an area ofperhaps 1—2 mm, would in the newborn distributeits branches over the entire area, perhaps favouringits own set of stripes but not confining itself to them.
In a series of eye injections of foetal monkeysRakic (1977) has extended these observations byshowing that when the geniculate afferents fromone eye grow into the cortex they occupy layer IVccontinuously, whereas a week or so before termthere are periodic fluctuations in density too subtleto see by naked eye, but obvious from grain counts.
Interpretation of these eye-injection experi-ments is complicated by the likelihood that asmearing of input to the cortex from one eye resultsfrom leakage of label at the geniculate level by dif-fusion from one set of layers to the other. We havetherefore felt it necessary to crosscheck the resultsin the newborn in as many ways as possible. Forexample, physiological recordings in the first daysafter birth support the anatomical results in show-ing a binocular input to layer IVc at most pointsalong its extent. By 6 weeks, however, this binocu-larity has disappeared, and the distribution ofinput from the two eyes seems to be identical tothat found in the adult. (This postnatal change,incidentally, takes place even if both eyes aresutured closed, and hence is not dependent onvisual experience.) The physiological findings thusappear to support the autoradiography.
In the normal development of ocular domi-nance columns, then, what seems to happen first isa complete occupation of layer IVc all along itslength by fibres from both eyes and, with time, agradual retraction and segregation until theprocess is complete, at about 6 weeks. What pro-duces the orderly retraction is not known, but onemight imagine a competition between terminals

Plate 14
Fig. 34.
645

646 PARTY THREE REVIEWS
NORMAL DEPRIVED
Fig. 35. Scheme that might explain the effects of eye closures on columns in layer IVc, on the assumption thatthe segregation of the eyes is not complete until some weeks after birth. The solid lines represent the terminationsofgemculate afferents in layer IVc corresponding to one eye; the open lines, the terminations from the other eye.In each, the width is intended to represent the presumed density of the terminals. The left half of the diagramillustrates the course of normal development suggested by our results. At birth there is some periodic variation indensity (see Figure 34): it is unlikely that the minimum is zero, as suggested here, and the fluctuations may bedifferent in different parts of the striate cortex. In this scheme we suppose that competition normally occursbetween the eyes, with the weaker input declining progressively and the stronger becoming fortified. The resultis a progressive retraction as the sparse terminals die out entirely. For purposes of the drawing we assume that theretraction process takes about 6 weeks, but the exact times are not known. On the right, the illustration showswhat happens if at any stage in this process one eye (here, the eye corresponding to open lines) is sutured closed.We suppose that this inflicts a competitive disadvantage on the terminals from the closed eye so that they die outat those places where terminals from the normal eye are still present. Where normal-eye terminals have alreadyretracted, their adversaries meet no competition and survive. The final outcome thus depends on when the dep-rivation was inflicted. (From Hubel et al. 1977.)
from the two eyes, in which the rules are that thedenser of the two sets proliferates and the lessdense regresses. In such an unstable equilibriumthe final result would be complete segregation.This is schematized in the left half of Figure 35.
To explain the deprivation effects, then, oneneed only suppose that closing one eye puts the cor-responding IVc terminals at a competitive disad-vantage, so that they retract completely from anypoint provided their adversaries have not them-selves already retracted. The later the closure in thefirst 6 weeks the less would be the final apparent
shrinkage. This process is shown in Figure 35 onthe right.
Thus there seems to be a good possibility thatthe monocular deprivation results involve not somuch a pathological proliferation of terminals as apersistence and perhaps strengthening of inputsthat are present at birth and normally regress in thefirst 6 weeks. If this proved to be true it wouldneatly explain two otherwise puzzling problems.First, the 'sensitive period' would become simplythe time of normal consolidation of columns, theperiod between birth and the final maturation of
Fig. 34. Autoradiographs through striate cortex of a baby monkey whose right eye was injected with radioactive fucose the dayafter birth, and the brain examined at 1 wee\ of age. (From Hubel et al. 1977.) (a) Transverse section through hemisphere con-tralateral to injected eye, shows virtually no hint of fluctuation in label density along layer IVc. (The extreme lower left tail oflabel, deep in the calcarine fissure, is temporal crescent representation; here no fluctuations are expected.) (b) Tangential sec-tion through top of mushroom-like part of calcarine fissure, intersecting layer We in an oval. A strong suggestion of stripes isseen, but the entire region is labelled, rather than having virtually label-free gaps between dense stripes, as was seen in the nor-mal adult (Figure 23)

Ferrier Lecture 647
this part of the visual system. Second, if at andshortly after birth layer IVc were supplied all alongits length by fibres from both eyes, it would be pos-sible to explain the effects of monocular depriva-tion on a model that presupposes competition forspace on the postsynaptic cell. Such a model wouldassume that a large number of afferent fibres maketransitory synaptic contacts in IVc. One shouldemphasize, however, that the existence of tempo-rary synapses in IVc is not established. Competi-tion is in any case easier to imagine among fibresthat are interwoven than between groups that areseparated by a sizeable fraction of a millimetre.
Meanwhile, we do not exclude sprouting as acontributing mechanism in the process of colum-nar shrinkage and expansion. Eye closures after thesixth week seem not to affect the columns in layerIVc, but whether sprouting can be produced byremovals or reversing the suturing—opening theclosed eye and closing the open one—remains to betested.
COMPARATIVE STUDIES OFARCHITECTURE
Obviously an important motive for investigatingthe brains of mammals is the possibility of under-standing the brain of man. It is partly for this rea-son that one seeks to learn as much as possibleabout the brains of higher mammals, especially ofprimates. To avoid making false generalizations itis important to survey as broad a range of mam-mals as possible. We were therefore interested inlooking at physiology and architecture in striatecortex of a number of other species.
Our experiments in cats preceded the work inmonkeys, but since about 1962 the two sets of stud-ies have gone in parallel. In striate cortex of adultcats orientation specificity is just as common as inmonkeys, and indeed it is likely that some cells inlayer IVc have simple receptive fields (with orien-tation specificity) rather than circularly symmetricones. Orientation columns are well developed.Ocular dominance columns, on the other hand,while present, are more subtle, and it was only afterseeing accentuated versions of them in cats broughtup from an early age with artificial squint that wewere fully convinced of their presence. Eye injec-tion studies (Shatz, Lindstrom & Wiesel 1977) havesince revealed their presence clearly (Figure 36,
Plate 15). They are well defined on the ipsilateralside, but less well on the contralateral, where theinput is stronger but also more diffuse. In tangen-tial section they are less stripe-like, more chaotic,than those of the macaque. The cat is uniqueamong known mammals in having a strong pro-jection to area 18 from the geniculate. Eye domi-nance columns are seen also in 18 where they arewell defined and probably coarser than in 17.
In the mouse (Drager 1975) cells with orienta-tion specificity are common but in contrast to thecat and monkey form only about 50% of the popu-lation. There may be some kind of grouping ofcells with like orientation preference, but no clearcolumns have been observed. Compared with catand monkey, the mouse has a much higher propor-tion of fibres crossing in the optic chiasm. Eyeinjection studies (Drager 1974) show the expecteddisparity on the two sides, with the contralateralhemisphere far more strongly labelled (Figure 37,Plate 16). There is no hint, from physiology orautoradiography, of dominance columns. Resultsin the rat (Drager, unpublished) are similar to thosein mouse except that the ipsilateral input seemseven weaker (Figure 38, Plate 17).
The tree shrew shows no hint of ocular-dominance columns (Hubel 1975; Casagrande &Harting 1975). The main difference in labelling onthe two sides is an absence of label in the narrowcell-sparse cleft which subdivides layer IVc intothree sublaminae (Figure 39, Plate 18).
In the prosimian, Galago, orientation speci-ficity is as common as in macaque, and orientationcolumns are well developed and orderly (Hubel &Ginzler, unpublished). Both studies with Nautadegeneration (Glendenning & Kofron 1974) andeye injection (Hubel, unpublished) reveal clear eyedominance columns, again better defined ipsilater-ally (Figure 40, Plate 19). Finally in the squirrelmonkey, a New World species, one animal whoseeye was injected showed no hint at all of eye-dominance columns, both hemispheres showinguniform label in layer IVc (Hubel et al. 1976). If thisresult is confirmed physiologically it will form anamazing departure from what otherwise seemedlike a tendency for columns to be better defined thehigher one looked in phylogeny. One is reluctant toaccept this result without physiological confirma-tion, however, since the lamination of the lateralgeniculate in this animal is not so well defined as in
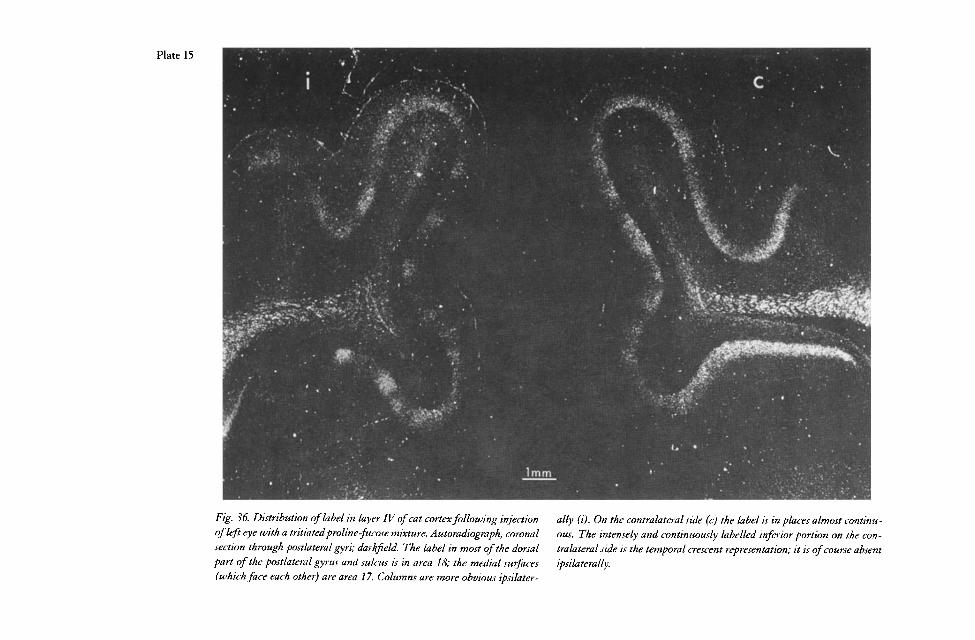
Plate 15
Fig. 36. Distribution of label in layer IV of cat cortex following injectionof left eye with a tritiatedproline-fucose mixture. Autoradiograph, coronalsection through postlateral gyri; darkfield. The label in most of the dorsalpart of the postlateral gyrus and sulcus is in area 18; the medial surfaces(which face each other) are area 17. Columns are more obvious ipsilater-
ally (i). On the contralateral side (c) the label is in places almost continu-ous. The intensely and continuously labelled inferior portion on the con-tralateral side is the temporal crescent representation; it is of course absentipsilaterally.
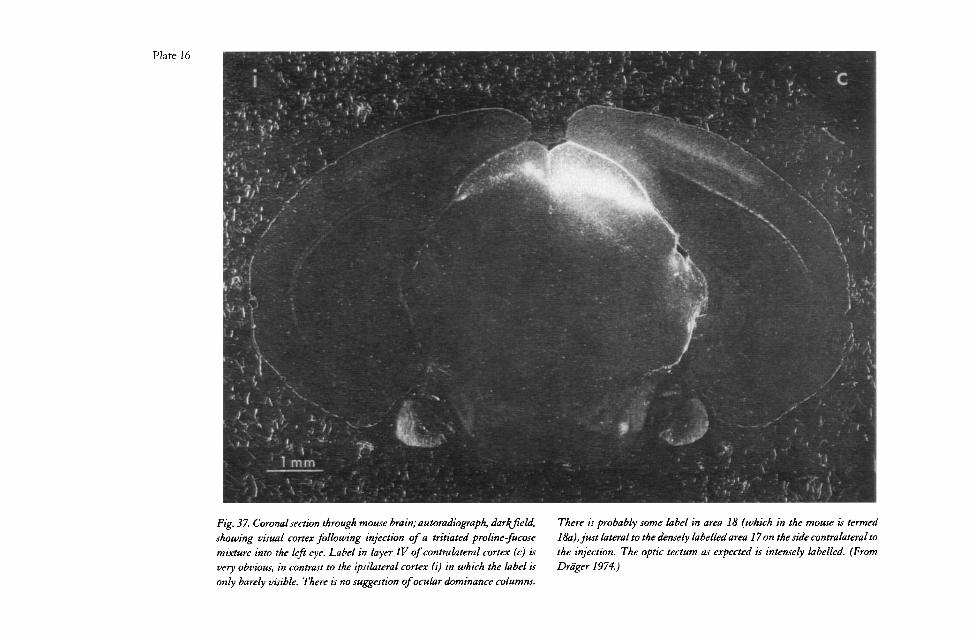
Plate 16
Fig. 37. Coronal section through mouse brain; autoradiograph, darfyjield,showing visual cortex following injection of a tritiated proline-fucosemixture into the left eye. Label in layer IV of contralateral cortex (c) isvery obvious, in contrast to the ipsilateral cortex (i) in which the label isonly barely visible. There is no suggestion of ocular dominance columns.
There is probably some label in area 18 (which in the mouse is termed18a),just lateral to the densely labelled area 17 on the side contralateral tothe injection. The optic tectum as expected is intensely labelled. (FromDrdger 1974.)

Plate 17
Fig. 38. Autoradiograph of rat brain; right eye was injected with a tritiatedproline-fucose mixture; coronal section, darkjield. As in the mouse the cor-tical label is much heavier in the contralateral cortex (c), and no columnsare present. (Indeed, in this section there is virtually no label in the ipsilat-eral cortex (i).) Label in contralateral area 17 is concentrated mainly in
layer IV, but some faint label may be seen in layers I and VI (Riba\ &Peters 1975). Lateral to area 17 two fainter areas of label can be made out.Again, the contralateral optic tectum is intensely labelled. (Drager, unpub-lished.)

Plate 18
Fig. 39. Autoradiograph of the brain of a tree shrew whose righteye was injected with a tritiated proline-fucose mixture; darl^field, coronal section (Hubel 1975). On the contralateral side (c)layer IVc is labelled throughout its entire thickness; an upper tierof label can be seen in layer IVa (to use a terminology analogous
to that employed in the macaque). Ipsilaterally (i) there is a nar-row label free cleft dividing layer IVc, and IVa is not labelled. Inthe optic tectum label is almost confined to the contralateral side;only a few tiny clusters of label are seen ipsilaterally

Plate 19
Fig. 40. Autoradiograph of the brain of an old world prosimian, Galago crassicaudatus,whose right eye was injected with a tritiated proline-fucose mixture. Ocular dominance
columns are obvious in both hemispheres, but, as in the cat, are better defined ipsilater-ally (i)

Ferrier Lecture 653
the old world monkey, and opportunity for label toleak from one set of layers to the other is greater.
In man the methods of physiology andautoradiography are of course unavailable and willremain so. We had hoped that LeVay's reduced sil-ver technique might be used to demonstrate bands,but so far the method has failed to show any. Theapparent difference between squirrel monkey andmacaque should, however, make one cautious inassuming that all higher primates have oculardominance columns.
CONCLUSION
We end up, then, with a view of the cortex as con-taining a thousand small machines of more or lessidentical structure. Each machine contains twotypes of hypercolumns, whose functions are dove-tailed with each other and with the topographicalmap. This dicing up into subdivisions is the waythe cortex handles or represents two variables (ori-entation and ocular dominance) besides the twoobvious visual-field positional variables. Undoubt-edly the picture is incomplete and, given the indi-rectness of much of the evidence, perhaps in placesalso incorrect. Colour information is not taken intoaccount at all, for example, nor is black vs. white.Both of these may be associated with columns.What makes the architecture encouraging andattractive to us, however, has nothing to do withthe relative completeness of the picture but thereinforcement it gives to much of the physiologicalfindings. Orientation specificity, for example,might be just a curious property of cortical cells,shown, to be sure, by the majority of cells, butmerely one among twenty or thirty competingproperties. The existence of such an intricate edi-fice of orderly columns subserving this variablesuggests, on the contrary, that it is of very greatimportance in area 17.
Another interesting aspect is the very orderli-ness of the architecture. It would be surprising ifother regions of cortex did not use some similarorderly principles. If area 18 is largely devoted tomechanisms related to stereopsis (Hubel & Wiesel1970), one might expect to see the eyes broughttogether in a whole range of different horizontaldisparities in all parts of the visual field, and itwould seem reasonable to find this done again in
repetitive units. At the moment there is no conclu-sive evidence for such an arrangement but it wouldsurely be reasonable to look for one. What orderlyarrangements one should expect in a structure likeauditory cortex, where time sequences might con-ceivably be expected to form some vague counter-part to orientation, is difficult to imagine; on theother hand, our ideas about frontal lobes or speechareas are so vague as to make the auditory cortexseem like home territory. At least it can be said thatwith some years of work a few regions of cortex arecapable of being understood, even if incompletely.
We wish to thank all those who have been so helpful over thepast few years: Jane Chen, Janet Wiitanen, David Freeman,Claire Wang, Carolyn Scott, and many others. Supported byNational Institutes of Health Grants EY 00605 and EY 00606,The Esther A. and Joseph Klingenstein Foundation, Inc. andThe Rowland Foundation, Inc.
References
Albus, K. 1975 A quantitative study of the projection area of thecentral and paracentral visual field in area 17 of the cat. II.The spatial organization of the orientation domain. Exp.Brain Res. 24,181-202.
Barlow, H. B., Hill, R. M. & Levick, W. R. 1964 Retinal ganglioncells responding selectively to direction and speed of imagemotion in the rabbit./. Physiol., Land. 173,377-407.
Bishop, P. O., Kozak, W, Levick, W. R. & Vakkur, G. J. 1962The determination of the projection of the visual field on tothe lateral geniculate nucleus in the cat./. Physiol. Land. 163,503-539.
Bishop, P. O. & Henry, G. H. 1972 Striate neurons: receptivefield concepts. Investigative Ophthalmol. 11,346—354.
Blakemore, C. & Tobin, E. A. 1972 Lateral inhibition betweenorientation detectors in the cat's visual cortex. Exp. BrainRes. 15,439-440.
Blakemore, C. & Van Sluyters, R. C. 1975 Innate and environ-mental factors in the development of the kitten's visual cor-tex./. Physiol., Land. 248,663-716.
Brouwer, B. & Zeeman, W. P. C. 1926 The projection of theretina in the primary optic neuron in monkeys. Brain 49,1-35.
Casagrande, V. A. & Harting, J. K. 1975 Transneuronal trans-port of tritiated fucose and proline in the visual pathways oftree shrew Tupaia glis. Brain Res. 96,367-372.
Clark, W. E. LeGros 1941 The laminar organization and cellcontent of the lateral geniculate body in the monkey./. Anat.(Land) 75,419-433.
Clark, W. E. LeGros & Sunderland, S. 1939 Structural changesin the isolated visual cortex./. Anat. (Land) 73,563—574.
Cleland, B. G. & Levick, W. R. 1974 Properties of rarely encoun-tered types of ganglion cells in the cat's retina and an over-all classification./. Physiol., Land. 240,457-492.
Cowan, W. M., Gottlieb, D. I., Hendrickson, A. E., Price, J. L.& Woolsey, T. A. 1972 The autoradiographic demonstrationof axonal connections in the central nervous system. BrainRes. 37,21-51.

654 PARTY THREE REVIEWS
Daniel, P. M. & Whitteridge, D. 1961 The representation of thevisual field on the cerebral cortex in monkeys. /. Physiol.,Lond. 159,203-221.
Drager, U. C. 1974 Autoradiography of tritiated proline andfucose transported transneuronally from the eye to thevisual cortex in pigmented and albino mice. Brain Res. 82,284-292.
Dra'ger, U. C. 1975 Receptive fields of single cells and topogra-phy in mouse visual cortex./. Comp. Neural. 160, 269—290.
Fink, R. P. & Heimer, L. 1967 Two methods for selective silverimpregnation of degenerating axons and their synaptic end-ings in the central nervous system. Brain Res. 4, 369—374.
Fiskin, R. A., Garey, L. J. & Powell, T. P. S. 1973 Patterns ofdegeneration after intrinsic lesions of the visual cortex (area17) of the monkey. Brain Res. 53, 208-213.
Gilbert, C. D. & Kelly, J. P. 1975 The projections of cells in dif-ferent layers of the cat's visual cortex./. Comp. Neural. 163,81-106.
Gilbert, C. D. 1977 Laminar differences in receptive field prop-erties of cells in cat primary visual cortex./. Physiol., Lond.(In the press.)
Glendenning, K. K. & Kofron, E. A. 1974 Projections of indi-vidual laminae of the lateral geniculate nucleus in theprosimian. 4th ann. meet. Soc. Neurosci. (St Louis) Abstr.p. 229.
Goldberg, S. & Kotani, M. 1967 The projection of optic nervefibers in the frog, Rana catesbeiana, as studied by autora-diography.^lna?. Rec. 158,325-332.
Grafstein, B. & Laureno, R. 1973 Transport of radioactivityfrom eye to visual cortex in the mouse. Exp. Neural. 39,44-57.
Guillery, R. W. 1966 A study of Golgi preparations from thedorsal lateral geniculate nucleus of the adult cat. /. Comp.Neurol. 128,21-50.
Guillery, R. W. 1972 Binocular competition in the control ofgeniculate cell growth./. Comp. Neurol. 144,117-130.
Guillery, R. W. & Colonnier, M. 1970 Synaptic patterns in thedorsal lateral geniculate nucleus of the monkey. Z. Zell-
forsch. 103,90-108.Guillery, R. W. & Stelzner, D. J. 1970 The differential effects of
unilateral lid closure upon the monocular and binocularsegments of the dorsal lateral geniculate nucleus in the cat./. Comp. Neurol. 139,413-422.
Hartline, H. K. 1940 The receptive fields of optic nerve fibers.Amer. J. Physiol. 130,690-699.
Hoffman, K.-R, Stone, J. & Sherman, S. M. 1972 Relay of recep-tive-field properties in dorsal lateral geniculate nucleus ofthe cat./. Neurophysiol. 35, 518-531.
Hubel, D. H. 1975 An autoradiographic study of the retino-cortical projections in the tree shrew (Tupaia glis). Brain Res.96,41-50.
Hubel, D. H. & Freeman, D. C. 1977 Projection into the visualfield of ocular dominance columns in macaque monkey.Brain Res. 122,336-343.
Hubel, D. H. & Wiesel, T. N. 1959 Receptive fields of singleneurones in the cat's striate cortex. /. Physiol., Lond. 148,574-591.
Hubel, D. H. & Wiesel, T. N. 1960 Receptive fields of opticnerve fibres in the spider monkey. /. Physiol., Lond. 154,572-580.
Hubel, D. H. & Wiesel, T. N. 1961 Integrative action in the cat'slateral geniculate body./. Physiol., Lond. 155, 385-398.
Hubel, D. H. & Wiesel, T. N. 1962 Receptive fields, binocularinteraction and functional architecture in the cat's visualcortex./. Physiol., Lond. 160,106-154.
Hubel, D. H. & Wiesel, T. N. 1963 Receptive fields of cells instriate cortex of very young, visually inexperienced kittens./. Neurophysiol. 26, 994-1002.
Hubel, D. H. & Wiesel, T. N. 1965 Receptive fields and func-tional architecture in two nonstriate visual areas (18 and 19)of the cat./. Neurophysiol. 28,229-289.
Hubel, D. H. & Wiesel, T. N. 1968 Receptive fields and func-tional architecture of monkey striate cortex. /. Physiol.,Lond. 195,215-243.
Hubel, D. H. & Wiesel, T. N. 1970 Cells sensitive to binoculardepth in area 18 of the macaque monkey cortex. Nature,Lond. 225,41-42.
Hubel, D. H. & Wiesel, T. N. 1972 Laminar and columnar dis-tribution of geniculo-cortical fibers in the macaque monkey./. Comp. Neurol. 146,421-450.
Hubel, D. H. & Wiesel, T. N. 1973 A re-examination of stereo-scopic mechanisms in area 17 of the cat./. Physiol., Lond.232,29-30 P.
Hubel, D. H. & Wiesel, T. N. 1974a Sequence regularity andgeometry of orientation columns in the monkey striate cor-tex./. Comp. Neurol. 158,267-294.
Hubel, D. H. & Wiesel, T. N. 1974£ Uniformity of monkey stri-ate cortex: a parallel relationship between field size, scatter,and magnification factor. /. Comp. Neurol. 158, 295—306.
Hubel, D. H., Wiesel, T. N. & LeVay, S. 1974 Visual-field rep-resentation in layer IV C of monkey striate cortex. 4th ann.meet. Soc. Neurosci. (St. Louis) Abstr. p. 264.
Hubel, D. H., Wiesel, T. N. & LeVay, S. 1976 Functional archi-tecture of area 17 in normal and monocularly deprivedmacaque monkeys. Cold Spr. Harbor Symp. Quant. Biol. 40,581-589.
Hubel, D. H., Wiesel, T. N. & LeVay, S. 1977 Plasticity of ocu-lar dominance columns in monkey striate cortex. Phil.Trans. R. Soc. Lond. B 278,131-163.
Kelly, J. P. & Van Essen, D. C. 1974 Cell structure and functionin the visual cortex of the cat./ Physiol., Lond. 238,515-547.
Kennedy, C., Des Rosiers, M., Sokoloff, L., Reivich, M. & Jehle,J. 1975 The ocular dominance columns of the striate cortexas studied by the deoxyglucose method for measurement oflocal cerebral glucose utilization. Trans. Am. Neurol. Ass.100, 74-77.
Kuffler, S. W. 1953 Discharge patterns and functional organiza-tion of mammalian retina./. Neurophysiol. 16, 37—68.
Lasek, R., Joseph, B. S. & Whitlock, D. G. 1968 Evaluation of aradioautographic neuro-anatomic tracing method. BrainRes. 8,319-336.
LeVay, S., Hubel, D. H. & Wiesel, T. N. 1975 The pattern ofocular dominance columns in macaque visual cortexrevealed by a reduced silver stain. /. Comp. Neurol. 159,559-576.
Lettvin, J. Y., Maturana, H. R., McCulloch, W. S. & Pitts, W. H.1959 What the frog's eye tells the frog's brain. Proc. Inst.Radio Engrs. N.Y. 47,1940-1951.
Lund, J. S. 1973 Organization of neurons in the visual cortex,area 17, of the monkey (Macaca mulatto).]. Comp. Neurol.147,455-496.
Lund, J. S., Lund, R. D., Hendrickson, A. E., Bunt, A. H. &Fuchs, A. F. 1975 The origin of efferent pathways from pri-mary visual cortex, area 17, of the macaque monkey asshown by retrograde transport of horseradish peroxidase./.Comp. Neurol. 164,287-304.
Minkowski, M. 1920 2. Uber den Verlauf, die Endigung und diezentrale Representation von gekreuzten und ungekreuztenSehnervenfasern bei einigen Saugetieren und beim Men-schen. Schweiz Arch. Neurol. Psychiat. 6,201—252.

Ferrier Lecture 655
Mountcastle, V. B. 1957 Modality and topographic properties ofsingle neurons of cat's somatic sensory cortex./. Neurophys-iol. 20,408-434.
Palmer, L. A. & Rosenquist, A. C. 1974 Visual receptive fields ofsingle striate cortical units projecting to the superior col-liculus in the cat. Brain Res. 67, 27—42.
Polyak, S. 1957 The vertebrate visual system (ed. H. Kliiver),Chicago, 111.: University of Chicago Press.
Portmann, A. 1948 Tiergestalt—Studien iiber die Bedeutung dertierischen Erscheinung. Basel: Reinhardt.
Rakic, P. 1977 Prenatal development of the visual system in therhesus monkey. Phil. Trans. R. Soc. Land. B. 278, 245-260.
Ribak, C. E. & Peters, A. 1975 An autoradiographic study of theprojections from the lateral geniculate body of the rat. BrainRes. 92,341-368.
Sanderson, K. J., Darian-Smith, I. & Bishop, P. O. 1969 Binocu-lar corresponding receptive fields of single units in the catdorsal lateral geniculate nucleus. Vision Res. 9,1297—1303.
Schiller, P. H., Finlay, B. L. & Volman, S. F. 1976 Quantitativestudies of single cell properties in monkey striate cortex. I.Spatiotemporal organization of receptive fields. /. Neuro-physiol. 39,1288-1319.
Shatz, C. J., Lindstrom, S. H. & Wiesel, T. N. 1977 The distri-bution of afferents representing the right and left eyes in thecat's visual cortex. Brain Res. (In the press.)
Sherman, S. M. 1973 Visual field defects in monocularly andbinocularly deprived cats Brain Res. 49, 25—45.
Sherman, S. M., Guillery, R. W., Kaas, J. H. & Sanderson, K. J.1974 Behavioral, electro-physiological and morphologicalstudies of binocular competition in the development of thegeniculo-cortical pathways of cats. /. Comp. Neural. 158,1-18.
Sokoloff, L. 1975 Influence of functional activity on local cere-bral glucose utilization. In Brain work,. The coupling of func-
tion, metabolism and blood flow in the brain (ed. D. H. Ingvarand N. A. Lassen), pp. 385-388. New York: Academic Press.
Sokoloff, L. 1977 Measurement of local glucose utilization andits use in mapping local functional activity in the centralnervous system. Proc. ^th World Congress of PsychiatricSurgery, Madrid, Sept. 7-10, 1975, pp. 111-121.
Stone, }. & Fukuda, Y. 1974 Properties of cat retinal ganglioncells: a comparison of W-cells with X- and Y-cells./. Neuro-physiol. 37,722-748.
Talbot, S. A. & Marshall, W. H. 1941 Physiological studies onneural mechanisms of visual localization and discrimina-tion. Am.]. Ophthal. 24,1255-1263.
Toyama, K., Matsunami, K., Ohno, T. & Takashiki, S. 1974 Anintracellular study of neuronal organization in the visualcortex. Exp. Brain Res. 21,45-66.
Van Buren, J. M. 1963 The retinal ganglion cell layer. Springfield,111.: Charles C. Thomas.
Wiesel, T. N. 1960 Receptive fields of ganglion cells in the cat'sretina./. Physiol., Land. 153, 583-594.
Wiesel, T. N. & Hubel, D. H. 1963 Single-cell responses in stri-ate cortex of kittens deprived of vision in one eye./. Neuro-physiol. 26,1003-1017.
Wiesel, T. N. & Hubel, D. H. 1965 Comparison of the effects ofunilateral and bilateral eye closure on cortical unit responsesin kittens./. Neurophysiol. 28,1029-1040.
Wiesel, T. N. & Hubel, D. H. 1966 Spatial and chromatic inter-actions in the lateral geniculate body of the Rhesus monkey./. Neurophysiol. 29,1115-1156.
Wiesel, T. N. & Hubel, D. H. 1974 Ordered arrangement of ori-entation columns in monkeys lacking visual experience. /.Comp. Neural. 158,307-318.
Wiitanen, J. T. 1969 Selective silver impregnation of degenerat-ing axons and axon terminals in the central nervous systemof the monkey (Macaca mulatto). Brain Res. 14, 546—548.
AFTERWORD
We seize this opportunity to make a few minor amendments and correc-tions. As discussed in our comments on papers on deprivation and develop-ment, we may have used the word genetic too freely in dealing with theinnate quality of the specificity of cortical responses. Today we would simplysay "innate" and leave it at that. One amusing error occurs in Fig. 24 of theFerrier lecture, in which the ocular dominance columns and the fingerprintare presented supposedly at the same scale, whereas they obviously cannotbe, unless the human had an exceptionally large index finger, or the monkeyan exceptionally small brain.
This account comes many years before one knew of the existence ofblobs, and when double-opponent cells had only been briefly mentioned inour 1968 monkey cortex paper. The machinery contained in a few square mil-limeters of cortex would have to include the blobs and a description of dou-ble-opponent cells, and our ice-cube model in Fig. 27 would have to show theblobs (as was done in Fig. 34 of Livingstone and Hubel (/ Neurosd 1984, 4,309-356). Luckily, perhaps, we did not yet know of the complex swirling ofthe orientation columns that the optical mapping later revealed—as perfectly

656 PARTY THREE REVIEWS
parallel stripes they were hard enough to portray even with a ruler and draft-ing machine. Close scrutiny of the ice-cube model will show a difference, inthe orientations of successive lines, of one degree, without which the cubeseemed severely distorted. We did realize at the time that orientation columnscould hardly be perfectly parallel stripes, given the reversals and fractures, butwe had to draw them some way, and chose the simplest possible.
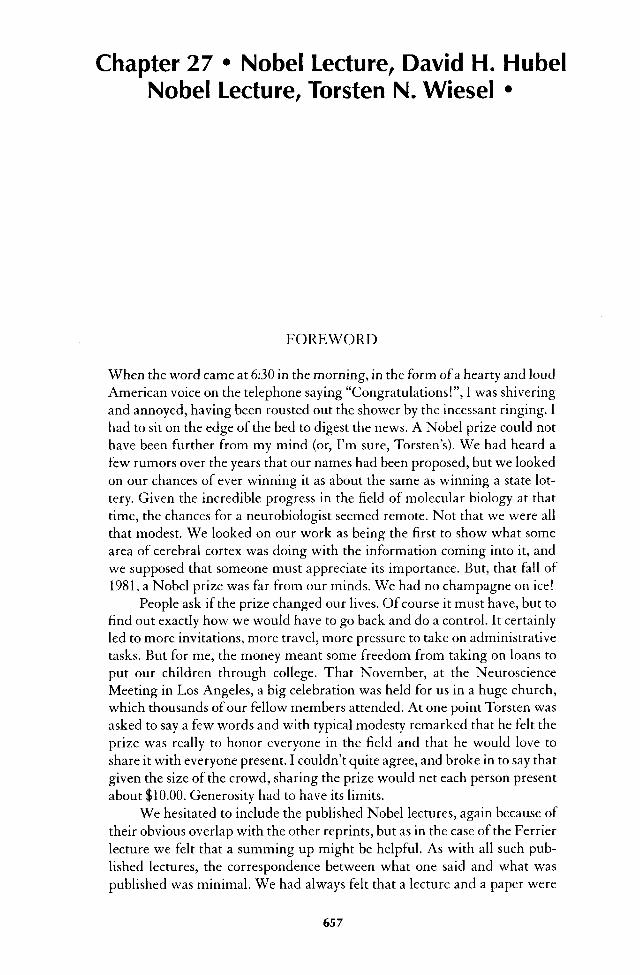
Chapter 27 • Nobel Lecture, David H. Hubel
Nobel Lecture, Torsten N. Wiesel •
FOREWORD
When the word came at 6:30 in the morning, in the form of a hearty and loudAmerican voice on the telephone saying "Congratulations!", I was shiveringand annoyed, having been rousted out the shower by the incessant ringing. Ihad to sit on the edge of the bed to digest the news. A Nobel prize could nothave been further from my mind (or, I'm sure, Torsten's). We had heard afew rumors over the years that our names had been proposed, but we lookedon our chances of ever winning it as about the same as winning a state lot-tery. Given the incredible progress in the field of molecular biology at thattime, the chances for a neurobiologist seemed remote. Not that we were allthat modest. We looked on our work as being the first to show what somearea of cerebral cortex was doing with the information coming into it, andwe supposed that someone must appreciate its importance. But, that fall of1981, a Nobel prize was far from our minds. We had no champagne on ice!
People ask if the prize changed our lives. Of course it must have, but tofind out exactly how we would have to go back and do a control. It certainlyled to more invitations, more travel, more pressure to take on administrativetasks. But for me, the money meant some freedom from taking on loans toput our children through college. That November, at the NeuroscienceMeeting in Los Angeles, a big celebration was held for us in a huge church,which thousands of our fellow members attended. At one point Torsten wasasked to say a few words and with typical modesty remarked that he felt theprize was really to honor everyone in the field and that he would love toshare it with everyone present. I couldn't quite agree, and broke in to say thatgiven the size of the crowd, sharing the prize would net each person presentabout $10.00. Generosity had to have its limits.
We hesitated to include the published Nobel lectures, again because oftheir obvious overlap with the other reprints, but as in the case of the Ferrierlecture we felt that a summing up might be helpful. As with all such pub-lished lectures, the correspondence between what one said and what waspublished was minimal. We had always felt that a lecture and a paper were
657
658 PARTY THREE REVIEWS
Fig. 27A.1: Torsten Wiesel, Roger Sperry, and David Hubel in Stockholm, 1981.
two entirely different art forms: to tape-record a lecture, transcribe it andpublish just as it was spoken, full of "aws" and "urns", hesitations, repeti-tions, and backtracking, makes for terrible reading; and to prepare a manu-script for publication and then read it was, if anything, worse. We had got-ten into the habit of winging our lectures and saw no reason to change whenwe gave our talks at the Karolinska in Stockholm.
We worked hard over the final versions of the lectures and sent them into Science, where Nobel lectures are traditionally published. Word cameback one day from the chief editor, that the essays were unfortunately toolong, and should be shortened, mine by 30% and Torsten's by 50%. I imme-diately lifted the phone and called Torsten, and found that his reaction, oneof fury, was the same as mine, and that our solutions to the problem wereidentical. We called Nature in England and told them our story. Theyanswered that of course they could not guarantee to publish our lecturessight unseen but would be happy to look at them. I suggested that we call Sci-ence and ask them to send the manuscripts over to the Nature office in Wash-ington—but the Nature editor quickly said "Oh that would be a bit harsh;please just send us a new printout"—which we did. That is how our lecturescame to be published in Nature, in all their great length.

Nobel Lectures 659
Evolution of Ideas on the Primary Visual Cortex, 1955-1978:
A Biased Historical Account
DAVID H. HUBEL • Harvard Medical School, Department of Neurobiology, Boston, Massachusetts
INTRODUCTION
In the early spring of 1958 I drove over to Balti-more from Washington, D.C. and in a cafeteria atJohns Hopkins Hospital met Stephen Kuffler andTorsten Wiesel, for a discussion that was moremomentous for Torsten's and my future thaneither of us could have possibly imagined.
I had been at Walter Reed Army Institute ofResearch for three years, in the NeuropsychiatrySection headed by David Rioch, working underthe supervision of M.G.F. Fuortes. I began at Wal-ter Reed by developing a tungsten microelectrodeand a technique for using it to record from chroni-cally implanted cats, and I had been comparing thefiring of cells in the visual pathways of sleeping andwaking animals.
It was time for a change in my research tac-tics. In sleeping cats only diffuse light could reachthe retina through the closed eyelids. Whether thecat was asleep or awake with eyes open, diffuselight failed to stimulate the cells in the striate cor-tex. In waking animals I had succeeded in activat-ing many cells with moving spots on a screen, andhad found that some cells were very selective inthat they responded when a spot moved in onedirection across the screen (e.g. from left to right)but not when it moved in the opposite direction (1)(Fig. 1). There were many cells that I could notinfluence at all. Obviously there was a gold mine inthe visual cortex, but methods were needed thatwould permit the recording of single cells for manyhours, and with the eyes immobilized, if the minewere ever to begin producing.
I had planned to do a postdoctoral fellowshipat Johns Hopkins Medical School with VernonMountcastle, but the timing was awkward for himbecause he was remodeling his laboratories. Oneday Kuffler called and asked if I would like to
work in his laboratory at the Wilmer Institute ofOphthalmology at the Johns Hopkins Hospitalwith Torsten Wiesel, until the remodeling wascompleted. That was expected to take about a year.I didn't have to be persuaded; some rigorous train-ing in vision was just what I needed, and thoughKuffler himself was no longer working in visionthe tradition had been maintained in his labora-tory. Torsten and I had visited each other's labora-tories and it was clear that we had common inter-ests and similar outlooks. Kuffler suggested that Icome over to discuss plans, and that was what ledto the meeting in the cafeteria.
It was not hard to decide what to do. Kufflerhad described two types of retinal ganglion cells,which he called "on-center" and "off-center". Thereceptive field of each type was made up of twomutually antagonistic regions, a center and a sur-round, one excitatory and the other inhibitory. In1957 Barlow, FitzHugh and Kuffler had gone on toshow that as a consequence retinal ganglion cells areless sensitive to diffuse light than to a spot just fill-ing the receptive-field center (2). It took me sometime to realize what this meant: that the way a cellresponds to any visual scene will change very littlewhen, for example, the sun goes behind a cloud andthe light reflected from black and white objectsdecreases by a large factor. The cell virtually ignoresthis change, and our subjective assessment of theobjects as black or white is likewise practically unaf-fected. Kuffler's center-surround receptive fieldsthus began to explain why the appearance of objectsdepends so little on the intensity of the light source.Some years later Edwin Land showed that theappearance of a scene is similarly relatively inde-pendent of the exact color composition of the lightsource. The physiological basis of this color inde-pendence has yet to be worked out.
From Les Prix Nobel en 1981, pp. 221-256 and Nature, 1982,299: 515-524.Nobel lecture, 8 December 1981

660 PARTY THREE REVIEWS
Fig. 1. Continues recording from striate cortex of an unrestrained cat. In each dual trace the lower membershows the microelectrode oscilloscope recording from two cells, one with large impulses, the other smaller ones.The stimulus was small to-and-fro hand movements in front of the cat. Each movement interrupted a light beam
falling on a photoelectric cell, producing the notches in the upper beam. The upper two pairs of records repre-sent fast movements, the lower ones slower movements. Each line represents 4 seconds. (1)
The strategy (to return to our cafeteria)seemed obvious. Torsten and I would simplyextend Stephen Kuffler's work to the brain; wewould record from geniculate cells and corticalcells, map receptive fields with small spots, andlook for any further processing of the visual infor-mation.
My reception in Kuffler's office the first daywas memorable. I was nervous and out of breath.Steve at his desk, rotated around on his chair andsaid "Hi, David! Take off your coat. Hang up yourhat. Do up your fly." His laboratory was informal!But it took me a month, given my Canadianupbringing, to force myself to call him Steve. Forthe first three months no paycheck arrived andfinally I screwed up the courage to go in and tellhim. He laughed and laughed, and then said "I for-got!"
Torsten and I didn't waste much time. Withina week of my coming to Hopkins (to a dark anddingy inner windowless room of the Wilmer Insti-tute basement, deemed ideal for visual studies) wedid our first experiment. For the time being wefinessed the geniculate (at Walter Reed I had con-vinced myself that geniculate cells were center-surround) and began right away with cortex. Thegoing was rough. We had only the equipment forretinal stimulation and recording that had beendesigned a few years before by Talbot and Kuffler
(3). A piece of apparatus resembling a smallcyclotron held the anesthetized and paralyzed catwith its head facing almost directly upwards. Amodified ophthalmoscope projected a backgroundlight and a spot stimulus onto the retina. Theexperimenter could look in, see the retina with itsoptic disc, area centralis and blood vessels, andobserve the background light and the stimulusspots. Small spots of light were produced by sliding2 cm X 5 cm metal rectangles containing varioussizes of holes into a slot in the apparatus, just as oneputs a slide into a slide projector. To obtain a blackspot on a light background one used a piece of glasslike a microscope slide, onto which a black dot hadbeen glued. All this was ideal for stimulating theretina and recording directly from retinal ganglioncells, since one could see the electrode tip and knowwhere to stimulate, but for cortical recording it washorrible. Finding a receptive field on the retina wasdifficult, and we could never remember what partof the retina we had stimulated. After a month orso we decided to have the cat face a projectionscreen, as I had at Walter Reed and as Talbot andMarshall had in 1941 (4). Having no other headholder, we continued for a while to use the oph-thalmoscope's head holder, which posed a problemsince the cat was facing directly up. To solve this webrought in some bed sheets which we slungbetween the pipes and cobwebs that graced the

Nobel Lectures 661
ceiling of the Wilmer basement, giving the setupthe aura of a circus tent. On the sheets we projectedour spots and slits. One day Vernon Mountcastlewalked in on this scene, and was horror struck atthe spectacle. The method was certainly inconven-ient since we had to stare at the ceiling for theentire experiment. Then I remembered havingseen in Mountcastle's laboratory a Horsley-Clarkehead holder that was not only no longer being usedbut also had the name of the Wilmer Instituteengraved on it. It was no other than the instrumentthat Talbot had designed for visual work when heand Marshall mapped out visual areas I and II inthe cat, in 1941 (4). For years Vernon had used it inhis somatosensory work, but he had recentlyobtained a fancier one. Torsten and I decided toreclaim the Wilmer instrument, not without sometrepidation. To give ourselves confidence we bothput on lab coats, for the first and last times in ourlives, and looking very professional walked over toPhysiology. Though Mountcastle was his usualfriendly and generous self, I suspect he was loath topart with this treasure, but the inscription on thestainless steel was not to be denied and we walkedoff with it triumphantly. It is still in use (now atHarvard: we literally stole it from the Wilmer),and has probably the longest history of uninter-rupted service of any Horsley-Clarke in the world.
A short while before this adventure we hadgone to a lecture by Vernon (this was a few yearsafter his discovery of cortical columns) (5) in whichhe had amazed us by reporting on the results ofrecording from some 900 somatosensory corticalcells, for those days an astronomic number. Weknew we could never catch up, so we catapultedourselves to respectability by calling our first cellNo. 3000 and numbering subsequent ones fromthere. When Vernon visited our circus tent we werein the middle of a 3-unit recording, cell Nos. 3007,3008, and 3009. We made sure that we mentionedtheir identification numbers. All three cells had thesame receptive-field orientation but neither Vernonnor we realized, then, what that implied.
At times we were peculiarly inept. Our firstperfusion of a cat was typical. One morning at about2:00 a.m. we had arranged two huge bottles on anoverhead shelf, for saline and formalin, and wereswitching over from saline to formalin when therubber tubing came off the outlet of the formalinbottle and gave us an acrid early morning cold
shower. We did not relish being preserved at soyoung an age! The reference to 2:00 a.m. perhapsdeserves some comment, because neurophysiolo-gists, at least those who study animals, have the rep-utation of doing experiments that last for days with-out respite. We soon found that such schedules werenot for us. I knew we were losing traction in anexperiment when Torsten began to talk to me inSwedish; usually this was around 3:00 a.m. Thelongest experiment we ever did was one in which Iarrived home just as my family was sitting down forbreakfast. I had almost driven off the road on theway back. At the risk of becoming what Mountcas-tle termed "part-time scientists" we decided to bemore lenient with ourselves, giving the deteriorat-ing condition of the animal as the official reason forstopping early.
Our first real discovery came about as a sur-prise. We had been doing experiments for about amonth. We were still using the Talbot-Kuffler oph-thalmoscope and were not getting very far; the cellssimply would not respond to our spots and annuli.One day we made an especially stable recording.(We had adapted my chronic recording system,which made use of Davies' idea of a closed chamber(6), to the acute experimental animals, and no vibra-tions short of an earthquake were likely to dislodgethings.) The cell in question lasted 9 hours, and bythe end we had a very different feeling about whatthe cortex might be doing. For 3 or 4 hours we gotabsolutely nowhere. Then gradually we began toelicit some vague and inconsistent responses bystimulating somewhere in the midperiphery of theretina. We were inserting the glass slide with itsblack spot into the slot of the ophthalmoscope whensuddenly over the audiomonitor the cell went offlike a machine gun. After some fussing and fiddlingwe found out what was happening. The responsehad nothing to do with the black dot. As the glassslide was inserted its edge was casting onto theretina a faint but sharp shadow, a straight dark lineon a light background. That was what the cellwanted, and it wanted it, moreover, in just one nar-row range of orientations.
This was unheard of. It is hard, now, to thinkback and realize just how free we were from anyidea of what cortical cells might be doing in an ani-mal's daily life. That the retinas mapped onto thevisual cortex in a systematic way was of course wellknown, but it was far from clear what this appar-

662 PARTY THREE REVIEWS
ently unimaginative remapping was good for. Itseemed inconceivable that the information wouldenter the cortex and leave it unmodified, especiallywhen Kuffler's work in the retina had made it soclear that interesting transformations took placethere between input and output. One heard theword "analysis" used to describe what the cortexmight be doing, but what one was to understand bythat vague term was never spelled out. In thesomatosensory cortex, the only other cortical areabeing closely scrutinized, Mountcastle had foundthat the cells had properties not dramatically dif-ferent from those of neurons at earlier stages.
Many of the ideas about cortical function thenin circulation seem in retrospect almost outra-geous. One has only to remember the talk of "sup-pressor strips", reverberating circuits, or electricalfield effects. This last notion was taken so seriouslythat no less a figure than our laureate-colleagueRoger Sperry had had to put it to rest, in 1955, bydicing up the cortex with mica plates to insulate thesubdivisions, and by skewering it with tantalumwire to short out the fields, neither of which proce-dures seriously impaired cortical function (7, 8).Nevertheless the idea of ephaptic interactions wasslow to die out. There were even doubts as to theexistence of topographic representation, which wasviewed by some as a kind of artifact. One study, inwhich a spot of light projected anywhere in theretina evoked potentials all over the visual cortex,was interpreted as a refutation of topographic rep-resentation, but the result almost certainly camefrom working with a dark-adapted cat and a spotso bright that it scattered light all over the retina. Itis surprising, in retrospect, that ideas of non-localization could survive in the face of the mas-terly mapping of visual fields onto the cortex inrabbit, cat and monkey done by Talbot and Mar-shall far back in 1941 (4).
It took us months to convince ourselves thatwe weren't at the mercy of some optical artifact,such as anyone can produce by squinting one's eyesand making vertical rays emanate from streetlights. We didn't want to make fools of ourselvesquite so early in our careers. But recording insequence in the same penetration several cells withseveral different optimal orientations would, Ithink, have convinced anyone. By January we wereready to take the cells we thought we could under-stand (we later called them "simple cells") and
write them up. Then as always what guided andsustained us was the attitude of Stephen Kuffler,who never lectured or preached but simply reactedwith buoyant enthusiasm whenever he thought wehad found something interesting, and acted vagueand noncommittal when he found something dull.Neither of us will ever forget writing our firstabstract, for the International Congress of Physiol-ogy in 1959 (9). We labored over it, and finally gavea draft to Kuffler. The following day when I camein Torsten was looking more glum than usual, andsaid "I don't think Steve much liked our abstract".It was clear enough that Kuffler wasn't quite satis-fied: his comments and suggestions containedmore words than our original (Fig 2)! Writing, itmay be added, did not come easy to either of us atthe beginning, and our first paper, in 1959, (10)went through eleven complete reworkings.
HIERARCHY OF VISUAL CELLS
During the years 1959—62, first at the Wilmer Insti-tute and then at Harvard Medical School, we weremainly concerned with comparing responses ofcells in the lateral geniculate body and primaryvisual cortex of the cat. In the lateral geniculate wequickly confirmed my Walter Reed finding thatthe receptive fields are like those of retinal gan-glion cells in having an antagonistic concentriccenter-surround organization. But now we couldcompare directly the responses of a geniculate cellwith those of a fiber from an afferent retinal gan-glion cell, and we found that in geniculate cells thepower of the receptive-field surround to cancel theinput from the center was increased. This findingwas subsequently confirmed and extended in abeautiful set of experiments by Cleland, Dubin andLevick (11), and for many years remained the onlyknown function of the lateral geniculate body.
In the cat striate cortex it soon became evidentthat cells were more complex than geniculate cells,and came in several degrees of complexity (12).One set of cells could be described by techniquessimilar to those used in the retina by Kuffler; wecalled these "simple". Their receptive fields, likethe fields of retinal ganglion cells and of lateralgeniculate cells, were subdivided into antagonisticregions illumination of any one of which tended toincrease or decrease the rate of firing. But simplecells differed from retinal ganglion cells and lateral

Nobel Lectures 663
geniculate cells in the striking departure of theirreceptive fields from circular symmetry; instead ofa single circular boundary between center and sur-round the antagonistic subdivisions were separatedby parallel straight lines whose orientation (verti-cal, horizontal or oblique) soon emerged as a fun-damental property (Fig. 3a). The optimal stimulus,either a slit, dark bar or edge, was easily predictablefrom the geometry of the receptive field, so that astationary line stimulus worked optimally when itsboundaries coincided with the boundaries of the
subdivisions (Fig. 3c), and displacing the line to anew position parallel to the old one generallyresulted in a sharp decline in the response. Perhapsmost remarkable of all was the precise nature of thespatial distribution of excitatory and inhibitoryeffects: not only did diffuse light produce noresponse (as though the excitatory and inhibitoryeffects were mutually cancelling with the precisionof an acid-base titration), but any line oriented at90° to the optimal was also without effect, regard-less of its position along the field, suggesting that
Fig. 2. First draft our first abstract (8), showing comments by Kuffler.

Fig. 3. a) Common arrangement of lateral geniculate (A and B) and simple cortical (C-G) receptive fields. X,areas giving excitatory responses ('on' responses); A, areas giving inhibitory responses ('off responses). Receptive-filed orientations are shown by continuous lines through field centers; in the figure these are all oblique, but eacharrangement occurs in all orientations (Figure 2 (12)).
b) Possible scheme for explaining the organization of simple receptive fields. A large number of lateralgeniculate cells, of which four are illustrated in the right in the figure, have receptive fields with 'on' centersarranged along a straight line on the retina. All of these project upon a single cortical cell, and the synapses aresupposed to be excitatory. The receptive field of the cortical cell will then have an elongated 'on' center indicatedby the interrupted lines in the receptive-field diagram to the left of the figure (Figure 19 (12)).
c) Responses to shining a rectangular slit of light 1 X 8°, so that center of slit is super-imposed on center ofreceptive field, in various orientations, as shown. Receptive field is of type C (see part (a) of this figure), with axisvertically oriented (Figure 3 (10)).
664

Nobel Lectures 665
Fig. 3c
the subpopulations of receptors so stimulated alsohad precisely mutually cancelling effects.
In the cat, simple cells are mostly found inlayer IV, which is the site of termination of the bulkof the afferents from the lateral geniculate body.The exact connections that lead to orientationspecificity are still not known, but it is easy to thinkof plausible circuits. For example, the behavior ofone of the commonest kinds of simple cells may beexplained by supposing that the cell receives con-vergent excitatory input from a set of geniculatecells whose on-centers are distributed in overlap-ping fashion over a straight line (Fig. 3b). In themonkey, the cells of Layer IVc (where most genic-ulate fibers terminate) seem all to be concentric
center-surround, and the simple cells are probablymainly in the layers immediately superficial to IVc.No one knows why this extra stage of center-sur-round cells is intercalated in the monkey's visualpathway.
The next set of cells we called "complex"because their properties cannot be derived in a sin-gle logical step from those of lateral geniculate cells(or, in the monkey, from the concentric cells oflayer IVc). For the complex cell, compared to thesimple cell, the position of an optimally orientedline need not be so carefully specified: the lineworks anywhere in the receptive field, evokingabout the same response wherever it is placed (Fig.4a). This can most easily be explained by supposing
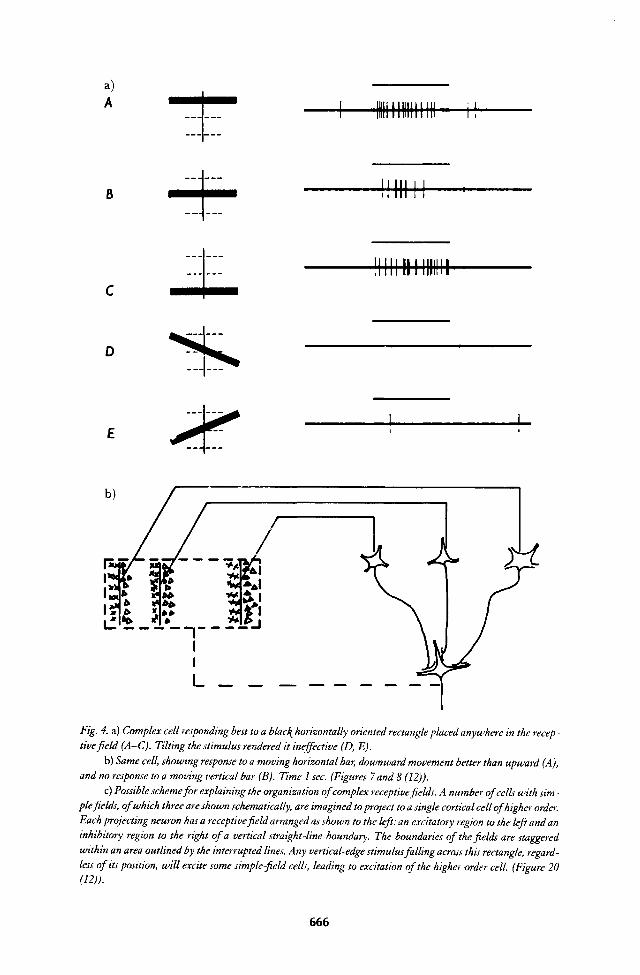
Fig. 4. a) Complex cell responding best to a blac\ horizontally oriented rectangle placed anywhere in the recep-tive field (A-C). Tilting the stimulus rendered it ineffective (D, E).
b) Same cell, showing response to a moving horizontal bar, downward movement better than upward (A),and no response to a moving vertical bar (B). Time 1 sec. (Figures 7 and 8 (12)).
c) Possible scheme for explaining the organization of complex receptive fields. A number of cells with sim-ple fields, of which three are shown schematically, are imagined to project to a single cortical cell of higher order.Each projecting neuron has a receptive field arranged as shown to the left: an excitatory region to the left and aninhibitory region to the right of a vertical straight-line boundary. The boundaries of the fields are staggeredwithin an area outlined by the interrupted lines. Any vertical-edge stimulus falling across this rectangle, regard-less of its position, will excite some simple-field cells, leading to excitation of the higher-order cell. (Figure 20(12)).
666

Nobel Lectures 667
Fig. 4c
that the complex cell receives inputs from manysimple cells, all of whose receptive fields have thesame orientation but differ slightly in position (Fig.4b). Sharpness of tuning for orientation varies fromcell to cell, but the optimal orientation of a typicalcomplex cell in layer II or III in the monkey can beeasily determined to the nearest 5—10°, with nomore equipment than a slide projector.
For a complex cell, a properly oriented lineproduces especially powerful responses when it isswept across the receptive field (Fig. 4c). The dis-charge is generally well sustained as long as the linekeeps moving, but falls off quickly if the stimulusis stationary. About half of the complex cells firemuch better to one direction of movement than tothe opposite direction, a quality, called "directionalselectivity", which probably cannot be explained byany simple projection of simple cells onto complexcells, but seems to require inhibitory connectionswith time delays of the sort proposed by Barlowand Levick for rabbit retinal ganglion cells (13).
HYPERCOMPLEX CELLS
Many cells, perhaps 10—20% in area 17 of cat ormonkey, respond best to a line (a slit, edge or darkbar) of limited length; when the line is prolongedin one direction or both, the response falls off. Thisis called "end stopping". In some cells the responseto a very long line fails completely (Fig. 5) (14). Weoriginally called these cells "hypercomplex" be-cause we looked upon them as next in an orderedhierarchical series, after simple and complex. Wesaw hypercomplex cells first in areas 18 and 19 ofthe cat, and only later in area 17. Dreher subse-
quently found cells, in all other ways resemblingsimple cells, that showed a similar fall-off inresponse as the length of the stimulus exceededsome optimum (15). It seems awkward to call thesecells hypercomplex; they are probably bettertermed "simple end-stopped" in contrast to "com-plex end-stopped".
Complex cells come in a wide variety of sub-types. Typical cells of layer II and III have rela-tively small receptive fields, low spontaneous activ-ity, and in the monkey may not only be highlyorientation selective but also fussy about wavelength, perhaps responding to red lines but notwhite. They may or may not be end-stopped. Cellsin layers V and VI have larger fields. Those in Vhave high spontaneous activity and many respondjust as well to a very short moving line as to longone. Many cells in layer VI respond best to verylong lines (16). These differences are doubtlessrelated to the important fact, first shown withphysiologic techniques by Toyama, Matsunamiand Ohno (17) and confirmed and extended byanatomical techniques, that different layers projectto different destinations—the upper layers mainlyto other cortical regions, the fifth layer to the supe-rior colliculus, pons and pulvinar, and VI back tothe lateral geniculate body and to the claustrum.
In the last 10 or 15 years the subject of corticalreceptive-field types has become rather a jungle,partly because the terms 'simple' and 'complex' areused differently by different people, and undoubt-edly partly because the categories themselves arenot cleanly separated. Our idea originally was toemphasize the tendency toward increased com-plexity as one moves centrally along the visual

Fig. 5. Hypercomplex cell, responding to a blacf( bar oriented 2:30-8:30, moving downward. Optimum responseoccurred when stimulus swept over area outlined (C); stimulating more than this region (D-H) or less (A, B)resulted in a weaker response. Sweep duration 2.5 sec. (Figure 19 (14)).
668

Nobel Lectures 669
path, and the possibility of accounting for a cell'sbehavior in terms of its inputs. The circuit dia-grams we proposed were just a few examples froma number of plausible possibilities. Even today theactual circuit by which orientation specificity isderived from center-surround cells is not known,and indeed the techniques necessary for solvingthis may still not be available. One can neverthelesssay that cells of different complexities, whosereceptive fields are in the same part of the visualfield and which have the same optimal orientation,are likely to be interconnected, whereas cells withdifferent optimal orientations are far less likely tobe interconnected. In the monkey a major diffi-culty with the hierarchical scheme as outlined hereis the relative scarcity of simple cells, comparedwith the huge numbers of cells with concentricfields in IVc, or compared with the large numberof complex cells above and below layer IV. The factthat the simple cells have been found mainly inlayer IVb also agrees badly with Jennifer Lund'sfinding that layer IVcp projects not to layer IVbbut to layer III. One has to consider the possibilitythat in the monkey the simple-cell step may beskipped, perhaps by summing the inputs from cellsin layer IV on dendrites of complex cells. In such ascheme each main dendritic branch of a complexcell would perform the function of a simple cell.All such speculation serves only to emphasize ourignorance of the exact way in which the propertiesof complex cells are built up.
Knowing how cortical cells respond to somevisual stimuli and ignore others allows us to predicthow a cell will react to any given visual scene. Mostcortical cells respond poorly to diffuse light, so thatwhen I gaze at a white object on a dark back-ground, say an egg, I know that those cells in myarea 17 whose receptive fields fall entirely withinthe boundaries of the object will be unaffected.Only the fields that are cut by the borders of the eggwill be influenced, and then only if the local orien-tation of a border is about the same as the orienta-tion of the receptive field. A slight change in posi-tion of the egg without changing its orientationwill produce a dramatic change in the populationof activated simple cells, but a much smallerchange in the activated complex cells.
Orientation-specific simple or complex cells"detect" or are specific for the direction of a shortline segment. The cells are thus best not thought of
as "line detectors": they are no more line detectorsthan they are curve detectors. If our perception of acertain line or curve depends on simple or complexcells it presumably depends on a whole set of them,and how the information from such sets of cells isassembled at subsequent stages in the path, to buildup what we call "percepts" of lines or curves (ifindeed anything like that happens at all), is still acomplete mystery.
ARCHITECTURE
When I began my training in neurophysiology atWalter Reed I was lucky enough to be influencedby new and vigorous traditions of experimentalneuroanatomy, represented by Walle Nauta, andby a new blend of neuroanatomy and neurophysi-ology represented at Walter Reed, Johns Hopkins,and the National Institutes of Health by (amongothers) Jerzy Rose, Vernon Mountcastle, andRobert Galambos. One day very near the begin-ning of my term at Walter Reed, Jerzy Rose, on thesteps of the Research Institute, very sternly told methat I had better make it my business to knowexactly where my recording electrode was. I subse-quently began to use the Hopkins—Walter Reedtechnique of making one electrode track or severalparallel tracks through cortex, recording as manycells as possible in each track and then reconstruct-ing the tracks from the histology. This made it pos-sible to work out the response properties of singlecells and also to learn how they were grouped. Itwas put to use most dramatically by VernonMountcastle, whose discovery of columns in thesomatosensory cortex was surely the single mostimportant contribution to the understanding ofcerebral cortex since Cajal. Our addition to thereconstruction technique was the strategy of mak-ing multiple small (roughly 100 )J,m diameter) elec-trolytic lesions along each track by passing smallcurrents through the tungsten electrodes. I workedout this method at Walter Reed by watching thecoagulation produced at the electrode tip on pass-ing currents through egg white. The lesions madeit possible to be sure of the positions of at least sev-eral points along a track; other positions weredetermined by interpolating depth readings of themicroelectrode advancer.
By the early 1960s our research had extendedinto four different but overlapping areas. Closest to

670 PARTY THREE REVIEWS
conventional neurophysiology was the workingout of response properties (i.e. receptive fields) ofsingle cells. We became increasingly involved witharchitecture, the grouping of cells according tofunction into layers and columns, studied by trackreconstructions. This led in turn to experiments inwhich single-cell recording was combined withexperimental anatomy. It began when one dayJames Sprague called to tell us that his chief histo-logical technician, Jane Chen, was moving toBoston and needed a job: could we take her? Luck-ily we did, and so, despite our not possessinganatomical union cards, we acquired an expert inthe Nauta method of making lesions in nervous tis-sue and selectively staining the degenerating axons.It seemed a terrible waste not to use this methodand we soon got the idea of working out detailedpathways by making microelectrode lesions thatwere far smaller than conventional lesions andcould be precisely placed by recording with thesame electrodes. It became possible to make lesionsin single layers of the lateral geniculate body, withresults to be discussed shortly. Finally, still anotherphase of our work involved studies of newbornanimals' postnatal development, and the effectsof distorting normal sensory experience in younganimals. This began in 1962 and grew steadily.Torsten Wiesel will discuss these experiments.
Having mentioned Jane Chen, this is perhapsas good a place as any to acknowledge our tremen-dous debt to many research assistants who havehelped us over the past 22 years, especially to Janeand to Janet Wiitanen and Bea Storai, and also toJaye Robinson, Martha Egan, Joan Weisenbeck,Karen Larson, Sharon Mates, Debra Hamburger,Yu-Wen Wu, Sue Fenstemaker, Stella Chow,Sarah Kennedy, Maureen Packard and Mary Nas-tuk. For photographic assistance I am grateful toSandra Spinks, Carolyn Yoshikami and MarcPeloquin. In electronics and computers DavidFreeman has continued to amaze us with his wiz-ardry for 12 years. And for secretarial help andpreservation of morale and sanity I want to thankSheila Barton, Pat Schubert and Olivia Brum.
ORIENTATION COLUMNS
What our three simultaneously recorded cells,Nos. 3009,3010 and 3011, mapped out on the over-head sheet in September 1958, with their parallel
orientation axes and separate but overlapping fieldpositions, were telling us was that neighboring cellshave similar orientations but slightly differentreceptive-field positions. We of course knew aboutour visitor Mountcastle's somatosensory columns,and we began to suspect that cells might begrouped in striate cortex according to orientation;but to prove it was not easy.
Our first indication of the beauty of thearrangements of cell groupings came in 1961 in oneof our first recordings from striate cortex of mon-key, a spider monkey named George. In one pene-tration, which went into the cortex at an angle ofabout 45° and was 2.5 mm long, we were struckright away by something we had only seen hints ofbefore: as the electrode advanced the orientationsof successively recorded cells progressed in smallsteps, of about 10° for every advance of 50 (4,m. Webegan the penetration around 8:00 p.m.; five hourslater we had recorded 53 successive orientationswithout a single large jump in orientation (Fig. 7).During the entire time, in which I wielded the slideprojector and Torsten mapped the fields, neither ofus moved from our seats. Fortunately our fluidintake that day had not been excessive! I haveshown this illustration many times. So far only oneperson, Francis Crick, has asked why there was nointerruption in layer IVc, where according todogma the cells are not orientation-specific. Theanswer is that I don't know.
In the cat we had had occasional suggestionsof similar orderliness, and so we decided to addressdirectly the problem of the shape and arrangementof the groupings (18). By making several closely-spaced oblique parallel penetrations we convincedourselves that the groupings were really columnsin that they extended from surface to white matterand had walls that were perpendicular to the layers(Fig. 8). We next made multiple close-spaced pen-etrations, advancing the electrode just far enoughin each penetration to record one cell or a group ofcells. To map a few square mm of cortex this wayrequired 50-100 penetrations, each of which tookabout 10-15 minutes. We decided it might be bet-ter to change careers, perhaps to chicken farming.But although the experiments were by our stan-dards exhausting they did succeed in showing thatorientation columns in the cat are not generally pil-lars but parallel slabs that intersect the surfaceeither as straight parallel stripes or swirls (Fig. 9).

Nobel Lectures 671
Fig. 6. a) Brain of a macaque monkey, perfused with formalin, viewed from above and behind. The occipitallobe is demarcated in front by the lunate sulcus (L) and consists mainly of the striate cortex, area 17, which occu -pies most of the smooth surface, extending forward to the dotted line (the 17—18 border). If followed mediallyarea 17 curves around the medial surface of the brain and continues in a complex buried fold, a part of whichlies underneath the convexity and parallel to it. X mart^s the projection ofthefovea; movement in the directionof the arrow corresponds to movement along the horizon; movement along the dotted line, to movement downalong the vertical midline of the visual field. The brain on removal from the sf^ull does not, of course, loof( exactlyli^e this: the groove in the right hemisphere was made by removing a parasagittal bloct( of tissue to produce thecross section of Figure 6b. (Figure 6a (29)).
6b) Low power Nissl-stained section from a parasagittal bloct{ such as that of Figure 6a. It is what wouldbe seen if one could stand in the groove of6a and loof( to the left. A marl^s the outer convexity; B the buried fold,and arrows indicate the 17—18 borders, the upper right one of which is indicated by the dotted line in Figure 6a.(Figure 6b (29)).
6c) Cross section through monkey striate cortex showing conventional layering designations. W, white mat-ter. Deeper layers (VI, V) of the buried fold of cortex are shown in the lower part of the figure (compare Figure6b). Cresyl violet. (Figure 10 (29)).
Reversals in direction of orientation shift, likethose shown in Fig. 7, are found in most penetra-tions. They occur irregularly, on the average aboutonce every millimeter, and not at any particularorientation such as vertical or horizontal. We stilldo not know how to interpret them. Betweenreversals the plots of orientation vs. electrode posi-tion are remarkably linear (19). I once, to exercise anew programmable calculator, actually deter-mined the coefficient of linear correlation of such a
graph. It was 0.998, which I took to mean that theline must be very straight indeed.
For some years we had the impression thatregular sequences like the one shown in Fig. 7 arerare—that most sequences are either more or lessrandom or else the orientation hovers around oneangle for some distance and then goes to a newangle and hovers there. Chaos and hovering dooccur but they are exceptional, as are major jumpsof 45-90°. It took us a long time to realize that reg-

672 PARTY THREE REVIEWS
Fig. 6b
ularity is the rule, not the exception, probablybecause only around the mid-1970s did we beginmaking very oblique or tangential penetrations.Also for these experiments to be successful requireselectrodes coarse enough to record activitythroughout a penetration, and not simply every 100|lm or so. Such electrodes look less aestheticallypleasing, a fact that I think has happily tended tokeep down competition.
Our attempts to learn more about the geome-try of orientation columns in the monkey by usingthe 2-deoxyglucose technique (20) suggest that iso-orientation lines form a periodic pattern but are farfrom straight, being full of swirls and interrup-tions. Experiments done since then (21) suggestthat the deoxyglucose is possibly also labelling thecytochrome blobs (see below). Similar work in thetree shrew by Humphrey (22) has shown a much

Nobel Lectures 673
Fig. 6c
more regular pattern and Stryker, Wiesel and Ihave seen more regularity in the cat (unpublished).Both tree shrew and cat lack the cytochrome blobs.
OCULAR DOMINANCE COLUMNS
A major finding in our 1959 and 1962 papers (10,12), besides the orientation selectivity, was the pres-ence in the striate cortex of a high proportion ofbinocular cells. Since recordings from the lateralgeniculate body had made it clear that cells at thatstage are for all practical purposes monocular, thisanswered the question of where, in the retino-geniculocortical pathway, cells first received con-vergent input from the two eyes. More interestingto us than the mere binocularity was the similarityof a given cell's receptive fields in the two eyes, insize, complexity, orientation and position. Presum-ably this forms the basis of the fusion of the imagesin the two eyes. It still seems remarkable that a cellshould not only be wired with the precision neces-sary to produce complex or hypercomplex proper-ties, but should have a duplicate set of such connec-tions, one from each eye. (That this is hard wired atbirth will form some of the material for TorstenWiesel's lecture.) Though the optimum stimulus is
the same for the two eyes, the responses evoked arenot necessarily equal; for a given cell one eye isoften better than the other. It is as if the two sets ofconnections were qualitatively similar but, formany cells, different in density. We termed this rel-ative effectiveness of the two eyes "eye preference"or "relative ocular dominance".
In the macaque it was evident from the earli-est experiments that neighboring cells have similareye preferences. In vertical penetrations the prefer-ence remains the same all the way through the cor-tex. Layer IVc, in which cells are monocular, is anexception; here the eye that above and below layerIV merely dominates the cells actually monopo-lizes them. In penetrations that run parallel to thelayers there is an alternation of eye preference, withshifts roughly every 0.5 mm. The conclusion is thatthe terminals from cells of the lateral geniculatedistribute themselves in layer IVc according to eyeof origin, in alternating patches about 0.5 mmwide. In the layers above and below layer IV hori-zontal and diagonal connections lead to a mixingthat is incomplete, so that a cell above a given patchis dominated by the eye supplying that patch butreceives subsidiary input from neighboring patches(Fig. 10).

Fig. 7. a) Reconstruction of a penetration through striate cortex about 1 mm from 17—18 border, near occipitalpole of a spider monkey called George. To the left of the figure the lines indicate receptive-field orientations ofcells in the columns traversed; each line represents one or several units recorded against a rich unresolved bac\-ground activity. Arrows indicate reversal of directions of shifts in orientation (32).
b) Graph of stimulus orientation in degrees vs. distance along electrode tracf( in mm, in the experimentshown in (a). Vertical is ta^en as 0°, clockwise is positive, anticlockwise negative.
674

Nobel Lectures 675
Fig. 8. Coronal section through cat visual cortex showing reconstructions of 6 parallel microelectrode penetra-tions. (Nos. 1, 2, 4 and 5 end with lesions shown as circles.) Short lines perpendicular to traces indicate recep-tive-field orientation; lines perpendicular to traces represent horizontal orientation. (The longer of these linesrepresent single cells, the shorter ones, multiple unit recordings). Most of the territory traversed by penetrations2—5 is in one orientation column, whose left hand border lies at the ends of traces 2-4. Scale 1 mm. (Figure 2(18)).
The geometry of these layer-IV patches inter-ested us greatly, and was finally determined by sev-eral independent anatomical methods, the first ofwhich involved the Nauta method and modifica-tions of the Nauta method for staining terminalsworked out first by Fink and Heimer and then bya most able and energetic research assistant, JanetWiitanen (23). By making small lesions in singlegeniculate layers we were able to see the patchy dis-tribution of degenerating terminals in layer IV,which in a face-on view takes the form not of cir-cumscribed patches but of parallel stripes. We alsoshowed that the ventral (magnocellular) pair oflayers projects to the upper half of IVc, (subse-quently called IVc OC by Jennifer Lund), whereasthe dorsal 4 layers project to the lower half (IVc (3),and that the line of Gennari (IVb), once thought to
receive the strongest projection, is actually almostbereft of geniculate terminals.
While the Nauta studies were still in progresswe read a paper in which Bernice Grafstein re-ported that after injecting a radioactive aminoacidinto the eye of a rat, radioactive label could bedetected in the contralateral visual cortex, as thoughtransneuronal transport had taken place in thegeniculate (24). (The rat retinogeniculocorticalpathway is mainly crossed.) It occurred to us that ifwe injected the eye of a monkey we might be able tosee label autoradiographically in area 17. We triedit, but could see nothing. Soon after, whilevisiting Ray Guillery in Wisconsin, I saw some am-inoacid transport autoradiographs which showednothing in light field but in which label was per-fectly obvious in dark field. I rushed back, we got

Fig. 9. Surface map of a small region of cat visual cortex. Receptive field orientations are shown for 32 superfi-cial penetrations. Regions of relatively constant orientation run more or less right-to-left in thefigure,or media-lateral on the brain (see inset). Going from above down, in the figure,or from posterior to anterior of the brain,is associated with anticlockwise rotation. Scale 1 mm; inset scale 1 cm. (Plate 2 (18)).
676

Nobel Lectures 677
Fig. 10. Scheme to illustrate thewiring of a binocular cell in a layerabove (or below) layer IVc. The bul\of the ajferents to the striate cortexfrom the lateral geniculate body,themselves monocular, are in themacaque monkey strictly segregatedby eye affiliation in layer IVc, andthus the cells in this layer are strictlymonocular. A cell outside of IVc,labelled X in the diagram, receives itsinput connections, directly or indi-rectly by one or more synapses, fromcells in IVc (to some extent also, per-haps, from layers IVa and VI). Cellsin IVc will be more lively to feed intoX the closer they are to it; conse-quently X is lively to be binocular,dominated by the eye correspondingto the nearest patch in IVc. Thedegree of dominance by that eye isgreater, the closer X is to being cen-tered in its ocular dominance col-umn, and cells near a boundary maybe roughly equally influenced by thetwo eyes. (Figure 12 (29)).
out our slides, borrowed a dark-field condenser,and found beautiful alternating patches through-out all the binocular part of area 17 (25) (Fig. 11).This method allowed us to reconstruct ocular dom-inance columns over much wider expanses thancould be mapped with the Nauta method (Fig. 12).It led to a study of the pre- and postnatal visualdevelopment of ocular dominance columns, andthe effects of visual deprivation on the columns,which Torsten will describe.
RELATIONSHIP BETWEEN COLUMNS,MAGNIFICATION AND FIELD SIZE
To me the main pleasures of doing science are ingetting ideas for experiments, doing surgery,designing and making equipment, and above allthe rare moments in which some apparently iso-lated facts click into place like a Chinese puzzle.When a collaboration works, as ours has, the ideasand the clicking into place often occur simultane-ously or collaboratively; usually neither of us hasknown (or cared) exactly where or from whom
ideas came from, and sometimes one idea hasoccurred to one of us, only to be forgotten and laterresurrected by the other. One of the most excitingmoments was the realization that our orientationcolumns, extending through the full thickness ofthe cat cortex, contain just those simple and com-plex cells (later we could add the hypercomplex)that our hierarchical schemes had proposed wereinterconnected (12). This gave the column a mean-ing: a little machine that takes care of contours in acertain orientation in a certain part of the visualfield. If the cells of one set are to be interconnected,and to some extent isolated from neighboring sets,it makes obvious sense to gather them together. AsLorente de No showed (26), most of the connec-tions in the cortex run in an up-and-down direc-tion; lateral or oblique connections tend to be short(mostly limited to 1 to 2 mm) and less rich. Theseideas were not entirely new, since Mountcastle hadclearly enunciated the principle of the column as anindependent unit of function. What was new in thevisual cortex was a clear function, the transforma-tion of information from circularly symmetric

678 PARTY THREE REVIEWS
Fig. 11. Dar1{-field autoradiograph ofstriate cortex in an adult macaque in which the ipsilateral eye had beeninjected with tritiated proline-fucose 2 wee^s before. Labelled areas show as white. Section passes in a planeroughly perpendicular to the exposed surface of the occipital lobe, and to the buried part immediately beneath(roughly, through the arrow of Figure 6a). In all, about 56 labelled patches can be seen. (Figure 22 (29)).
form to orientation-specific form, and the stepwiseincrease in complexity.
A similar argument applies to the oculardominance columns, a pair of which constitutes amachine for combining inputs from the two eyes—combining, but not completely combining, in apeculiar grudging way and for reasons still not atall clear, but probably related in some way to stere-opsis. (Whatever the explanation of the systemati-cally incomplete blending, it will have to take intoaccount the virtual but not complete absence ofdominance columns in squirrel monkeys.) If theeyes are to be kept functionally to some extent sep-arate, it is economical of connections to packtogether cells of a given eye preference.
To my mind our most aesthetically attractiveand exciting formulation has been the hypercol-umn (not, I admit, a very attractive term!) and itsrelation to magnification. The idea grew up gradu-ally, but took an initial spurt as a result of a question
asked by Werner Reichardt during a seminar that Igave in Tubingen. I had been describing theordered orientation sequences found in monkeyslike George, when Werner asked how one avoidedthe difficulty arising from the fact that as you moveacross the cortex visual field position is changing, inaddition to orientation. Could this mean that if youlooked closely you would find, in one small part ofthe visual field, only a small select group of orienta-tions represented? The answer seemed obvious: Iexplained that in any one part of the visual field allorientations are represented, in fact probably sev-eral times over. Afterwards the question naggedme. There must be more to it than that. We beganto put some seemingly isolated facts together. Thevisual fields map systematically onto the cortex butthe map is distorted: the fovea is disproportionatelyrepresented, with 1 mm about equivalent to 1/6° ofvisual field. As one goes out in the visual field therepresentation falls off, logarithmically, as Daniel

Nobel Lectures 679
Fig. 12. Autoradioagraphs from the same (normal) animal as Figure 11, but hemisphere contralateral to theinjected eye (darl^field).
a) A section tangential to the exposed dome-li^e surface of the occipital lobe, just grazing layer V, whichappears as an oval, surrounded by layer IVc, which appears as a ring containing the labelled parallel bands; theseappear as light against the darf( background.
b) A composite made by cutting out layer IVc from a number of parallel sections such as the one shown in(a), and pasting them together to show the bands over an area some millimeters in extent.
c) Reconstruction of layer IVc ocular dominance columns over the entire exposed part of area 17 in theright occipital lobe, made from a series of reduced-silver sections (33). The region represented is the same as thepart of the right occipital lobe shown in Figure 6a. Dotted line on the left represents the midsagittal plane wherethe cortex bends around. Dashed c-shaped curve is the 17-18 border, whose apex, to the extreme right, representsthe fovea. Every other column has been blackened in, so as to exhibit the twofold nature of the set of subdivi-sions. Note the relative constancy of column widths.
and Whitteridge had shown (27), so that in the farperiphery the relationship is more like 1 mm = 6°.Meanwhile the average size of receptive fieldsgrows from center of gaze to periphery. This is notunexpected when one considers that in the foveaour acuity is very much higher than in the periph-ery. To do the job in more detail takes more cells,each looking after a smaller region; to accommo-date the cells takes more cortical surface area. I hadalways been surprised that the part of the cortexrepresenting the fovea is not obviously thicker thanthat representing the periphery: the surprise, I sup-pose, comes from the fact that in the retina near thefovea the ganglion cell layer is many times thickerthan in the periphery. The cortex must be goingout of its way to keep its uniformity by devotingto the detailed tasks more area rather than morethickness.
We decided to look more carefully at the rela-
tionship between receptive-field size and area ofcortex per unit area of visual field (28). When anelectrode is pushed vertically through the cortexand encounters a hundred or so cells in traversingthe full thickness, the receptive fields vary to someextent in size, and in a rather random way in posi-tion, so that the hundred maps when superimposedcover an area several times that of an averagereceptive field (Fig. 13a). We call this the "aggre-gate receptive field" for a particular point on thecortex. On making a penetration parallel to thesurface there is a gradual drift in field position,superimposed on the random staggering, in adirection dictated by the topographic map (Fig.13b). We began to wonder whether there was anylaw connecting the rate of this drift in aggregateposition and the size of the fields. It was easy to geta direct answer. It turned out that a movement ofabout 2 mm across the cortex is just sufficient to

Fig. 12 b &• c
680

Nobel Lectures 681
Fig. 13. a) Receptive-field scatter: Receptive-field boundaries ofl 7 cells recorded in a penetration through mon-key striate cortex in a direction perpendicular to the surface. Note the variation in size, and the more or less ran-dom scatter in the precise positions of the fields. The penetration was made in a part of the cortex correspondingto a visual field location 10°from the center of gaze, just above the horizontal meridian. Fields are shown for oneeye only. Numbers indicate the order in which the cells were recorded. (Figure 1 (28)).
b) See p. 682. Receptive-field drift: Receptive fields mapped during one oblique, almost tangential pene-tration through striate cortex, in roughly the same region as in (a). A few fields were mapped along each of four100 [im segments, spaced at 1 mm intervals. These four groups of fields are labelled 0, 1, 2 and 3. Each new setof fields was slightly above the other, in the visual field, as predicted from the direction of movement of the elec-trode and from the topographic map of visual fields onto cortex. Roughly a 2 mm movement through cortex wasrequired to displace the fields from one region to an entirely new region. (Figure 2 (28)).
produce a displacement, in the visual field, out ofthe region where one started and into an entirelynew region. This held everywhere across the striatecortex (and consequently in the visual field). In thefovea the displacement was tiny and so were thefields. As one went out, both increased in size, inparallel fashion (Fig. 14). Now things indeedseemed to mesh. George and other monkeys hadtaught us that a 1-2 mm movement across cortex isaccompanied by an angular shift in receptive-fieldorientation of 180—360°, more than one full com-plement of orientations. We have termed such a setof orientation columns (180°) a "hypercolumn".Meanwhile, the ocular dominance shifts back andforth so as to take care of both eyes every millime-ter—a hypercolumn for ocular dominance. Thus
in one or two square millimeters there seems toexist all the machinery necessary to look aftereverything the visual cortex is responsible for, in acertain small part of the visual world. Themachines are the same everywhere; in some partsthe information on which they do their job is lessdetailed, but covers more visual field (Fig. 15).
Uniformity is surely a huge advantage indevelopment, for genetic specifications need onlybe laid down for a 1-2 mm block of neural tissue,together with the instruction to make a thousandor so.
We could, incidentally, have called the entiremachine a hypercolumn, but we did not. The termas we define it refers to a complete set of columnsof one type. I mention this because uniformity has

Fig. 13b
Fig. 14. Variation of receptive-field drift with eccentricity: The diagram represents one quadrant of the field ofvision, and the circles represent aggregate receptive fields, the territory collectively occupied by respective fieldsof cells encountered in a microelectrode penetration perpendicular to the cortical surface. Each pair of circlesillustrates the movement in aggregate receptive field accompanying a movement along the cortex of 1-2 mm.Both the displacement and the aggregate field size vary with distance from thefovea (eccentricity), but they doso in parallel fashion. Close to thefovea the fields are tiny, but so is the displacement accompanying a 1-2 mmmovement along the cortex. The greater the distance from thefovea, the greater the two become, but they con-tinue to remain roughly equal (28).
682

Nobel Lectures 683
Fig. 15. Model of the striate cortex, toshow roughly the dimensions of theocular dominance slabs (L,R) inrelation to the orientation slabs andthe cortical thickness. Thinner linesseparate individual columns; thickerlines demarcate the two types ofhypercolumn: two pairs of oculardominance columns and two sets oforientation columns. The placingof these hypercolumn boundaries is ofcourse arbitrary; one could as wellbegin the orientation hypercolumn athorizontal or any of the obliques.The decision to show the two sets ofcolumns as intersecting at rightangles is also arbitrary, since there isat present no evidence as to the rela-tionship between the two sets.Finally, for convenience the slabs areshown as plane surfaces, but whereasthe dominance columns are indeedmore or less flat, the orientationcolumns are not known to be so, andmay when viewed from above havethe form of swirls. (Figure 27 (29)).
obvious advantages, not just for the cortex but alsofor terminology. Perhaps one could use "module"to refer to the complete machine.
There are two qualifications to all of this. I donot mean to imply that there need really be 2,000separate definable entities. It need not matterwhether one begins a set of orientation columns atvertical, horizontal or any one of the obliques; thedecision is arbitrary. One requires two dominancecolumns, a left and a right, and it makes no differ-ence which one begins with. (In fact, as I will soonpoint out, it now looks as though the blocks of tis-sue may really be discrete, to a degree that we couldnot have imagined two years ago.) Second, theremay well be some differences in cortical machinerybetween the center and periphery of the visualfield. Color vision and stereopsis, for example,probably decline in importance far out in the visualfields. I say this not to be obsessively complete butbecause in the next few years someone will proba-bly find some difference and pronounce the con-
cept wrong. It may of course be wrong, but I hopeit will be for interesting reasons.
I should perhaps point out that the retina mustbe nonuniform if it is to do a more detailed job inthe center. To have more area devoted to the centerthan to the periphery is not an option open to it,because it is a globe. Were it anything else theoptics would be awkward and the eye could notrotate in its socket.
A few years ago, in a Ferrier Lecture (29),Torsten and I ended by saying that the striate cor-tex is probably now (was, then) in broad outline,understood. This was done deliberately: one didnot want the well to dry up. When one wants rainthe best strategy is to leave raincoat and umbrella athome. So the best way to guarantee future employ-ment was to declare the job finished. It certainlyworked. Two years ago Anita Hendrickson andher coworkers and our laboratory independentlydiscovered that monkey striate cortex, when sec-tioned parallel to the surface and through layers II

Fig. 16. Tangential sections through the visual cortex of the squirrel monkey; cytochrome oxidase stain. The sec-tions pass through the 17-18 border, which runs obliquely in the figure with area 17 below and to the right and18 above and left. (Hubel and Livingstone, unpublished) The left-hand section passes through layer HI, and theblobs can be seen easily in area 17. The right-hand section is tangential to layer V where blobs can be again seen,though faintly; these lie in register with the upper-layer blobs. The coarse pattern in area 18 is now understudyand promises to be interesting.
684
Nobel Lectures 685
and III and stained for the enzyme cytochromeoxidase, shows a polka-dot pattern of dark blobsquasi-regularly spaced 1/2—1 mm apart (Fig. 16)(30,21). It is as if the animal's brain had the measles.The pattern has been seen with several other enzy-matic stains, suggesting that either the activity orthe machinery is different in the blob regions. Thepattern has been found in all primates examined,including man, but not in any nonprimates. Inmacaque the blobs are clearly lined up along oculardominance columns (19). Over the past year Mar-garet Livingstone and I have shown that the cells inthe blobs lack orientation selectivity, resembling, atleast superficially, cells of layer IVc (31). They areselectively labeled after large injections of radioac-tive proline into the lateral geniculate body, so it isclear that their inputs are not identical to the inputsto the rest of layers II and III. Thus an entire sys-tem has opened up whose existence we were previ-ously quite unaware of and whose anatomy andfunctions we do not yet understand. We are espe-cially anxious to learn what, if any, the relationshipis between the cytochrome blobs and the orienta-tion columns.
Things are at an exciting stage. There is nopoint leaving the umbrella home; it is raining, andraining hard.
References
1. Hubel, D. H., (1958) Cortical unit responses to visual stim-uli in nonanesthetized cats. Amer. J. Ophthal. 46: 110-122.
2. Barlow, H. B., FitzHugh, R. and Kuffler, S. W., (1957)Dark adaptation, absolute threshold and Purkinje shift insingle units of the cat's retina. J. Physiol. 137: 327—337.
3. Talbot, S. A. and Kuffler, S. W., (1952) A multibeam oph-thalmoscope for the study of retinal physiology. }. Opt. Soc.Am. 42: 931-936.
4. Talbot, S. A. and Marshall, W. H., (1941) Physiologicalstudies on neural mechanisms of visual localization and dis-crimination. Am. J. Ophthal. 24: 1255-1263.
5. Mountcastle, V. B., (1957) Modality and topographic prop-erties of single neurons of cat's somatic sensory cortex. J.Neurophysiol. 20: 408-434.
6. Davies, P. W., (1956) Chamber for microelectrode studies inthe cerebral cortex. Science 124: 179-180.
7. Sperry, R. W., Miner, N., and Meyers, R. E., (1955) Visualpattern perception following subpial slicing and tantalumwire implantations in the visual cortex. J. Comp. Physiol.Psych. 48: 50-58.
8. Sperry, R. W. and Miner, N., (1955) Pattern perception fol-lowing insertion of mica plates into visual cortex. J. Comp.Physiol. Psych. 48: 463-469.
9. Hubel, D. H. and Wiesel, T. N., (1959) Respective fieldorganization of single units in the striate cortex of cat. XXIInt. Congr. Physiol. Sci., Buenos Aires, p. 131.
10. Hubel, D. H. and Wiesel, T. N., (1959) Receptive fields ofsingle neurones in the cat's striate cortex. }. Physiol. 148:574-591.
11. Cleland, B. G., Dubin, M. W., and Levick, W. R., (1971)Simultaneous recording of input and output of lateralgeniculate neurones. Nature New Biol. 231: 191—192.
12. Hubel, D. H. and Wiesel, T. N., (1962) Receptive fields,binocular interaction and functional architecture in the cat'svisual cortex. J. Physiol. 160: 106-154.
13. Barlow, H. B. and Levick, W. R., (1965) The mechanism ofdirectionally selective units in rabbit's retina. J. Physiol. 178:477-504.
14. Hubel, D. H. and Wiesel, T. N., (1965) Receptive fields andfunctional architecture in two non-striate visual areas (18and 19) of the cat. J. Neurophysiol. 28: 229-289.
15. Dreher, B. (1972) Hypercomplex cells in the cat's striate cor-tex. Invest. Ophth. 11: 355-356.
16. Gilbert, C. D. (1977) Laminar differences in receptive fieldproperties of cells in cat visual cortex. J. Physiol. 268:391-421.
17. Toyama, K., Matsunami, K., and Ohno, T, (1969)Antidromic identification of association, commissural andcorticofugal efferent cells in cat visual cortex. Brain Res. 14:513-517.
18. Hubel, D. H. and Wiesel, T. N., (1963) Shape and arrange-ment of columns in cat's striate cortex. J. Physiol. 165:559-568.
19. Hubel, D. H. and Wiesel, T. N., (1974) Sequence regularityand geometry of orientation columns in the monkey striatecortex. J. Comp. Neur. 158: 267-294.
20. Sokoloff, L., Reivich, M., Kennedy, C., DesRosiers, M. H.,Patlak, C. S., Pettigrew, K. D., Sakurada, O. and Shino-hara, M., (1977) The [14C] deoxyglucose method for themeasurement of local cerebral glucose utilization: theory,procedure, and normal values in the conscious and anes-thetized albino rat. J. Neurochem. 28: 897-916.
21. Horton, J. C. and Hubel, D. H., (1981) Regular patchy dis-tribution of cytochrome oxidase staining in primary visualcortex of macaque monkey. Nature 292: 762—764.
22. Humphrey, A. L., Skeen, L. C., and Norton, T. T, (1980)Topographic organization of the orientation column systemin the striate cortex of the tree shrew (Tupaia glis). II.Deoxyglucose mapping. }. Comp. Neur. 192: 549-566.
23. Hubel, D. H. and Wiesel, T. N., (1972) Laminar and colum-nar distribution of geniculocortical fibers in the macaquemonkey. J. Comp. Neur. 146: 421-450.
24. Grafstein, B. (1971) Transneuronal transfer of radioactivityin the central nervous system. Science 172: 177—179.
25. Wiesel, T. N., Hubel, D. H., and Lam, D. M. K., (1974)Autoradiographic demonstration of ocular-dominancecolumns in the monkey striate cortex by means of transneu-ronal transport. Brain Res. 79: 273-279.
26. Lorente de No, R. (1949) Cerebral cortex: architecture,intracortical connections, motor projections. Chapt. 15 inFulton, J. F.: Physiology of the Nervous System, 3rd edition,Oxford University Press, New York and London.
27. Daniel, P. M. and Whitteridge, D., (1961) The representa-tion of the visual field on the cerebral cortex in monkeys. }.Physiol., Lond. 159:203-221.
28. Hubel, D. H. and Wiesel, T. N., (1974) Uniformity of mon-key striate cortex: a parallel relationship between field size,scatter, and magnification factor. J. Comp. Neur. 158:295-306.
29. Hubel, D. H. and Wiesel, T. N., (1977) Ferrier Lecture.Functional architecture of macaque monkey visual cortex.Proc. R. Soc. Lond. B. 198: 1-59.

686 PARTY THREE REVIEWS
30. Hendrickson, A. E., Hunt, S. P., and Wu, J.-Y., (1981)Immunocytochemical localization of glutamic acid decar-boxylase in monkey striate cortex. Nature 292: 605-607.
31. Hubel, D. H. and Livingstone, M. S., (1981) Regions of poororientation tuning coincide with patches of cytochrome oxi-dase staining in monkey striate cortex. Neurosci. Abst. 11thAnn. Meeting, Los Angeles, 118.12.
32. Hubel, D. H. and Wiesel, T. N., (1968) Receptive fields andfunctional architecture of monkey striate cortex. J. Physiol.195: 215-243.
33. LeVay, S., Hubel, D. H., and Wiesel, T. N., (1975) The pat-tern of ocular dominance columns in macaque visual cortexrevealed by a reduced silver stain. J. Comp. Neur. 159:559-576.
The Postnatal Development of the Visual Cortex and the Influence
of Environment
TORSTEN N. WIESEL • Harvard Medical School, Department of Neurobiology, Boston, Massachusetts
INTRODUCTION
In the early sixties, having begun to describe thephysiology of cells in the adult cat visual cortex,1
David Hubel and I decided to investigate how thehighly specific response properties of cortical cellsemerged during postnatal development. We werealso interested in examining the role of visual expe-rience in normal development, a question raisedand discussed by philosophers since the time ofDescartes. The design of these experiments wasundoubtedly influenced by the observation thatchildren with congenital cataracts still have sub-stantial and often permanent visual deficits afterremoval of the cataract and proper refraction.2
Also, behavioral studies had shown that animalsraised in the dark or in an environment devoid ofcontours have a similar impairment of their visualfunctions,3'4
Because of the difficulties associated withraising kittens in total darkness, we decided to fusethe lids by suture. This procedure prevented anyform vision without completely light depriving theanimal. We expected this to be an effective proce-dure because cortical cells respond to contours andare insensitive to changes in levels of diffuse light.5
Initially we raised kittens with only one eye closed,using the other eye as a control. This design turnedout to be fortunate, because—as shown below—
the effects of single eye closure on the visual cortexare more dramatic than the results obtained fromanimals raised with both eyes occluded or kept inthe dark.
Our initial findings were that kittens with aneye occluded by lid suture during the first threemonths of life were blind in the deprived eye, andthat in the striate cortex the majority of the cellsresponded only to stimulation of the normal eye.6
This defect appeared to be localized to the visualcortex, perhaps at the site of interaction betweengeniculate afferents and cortical cells.7 Fromanother series of experiments, we found that theproperties of orientation specificity and binocular-ity developed through innate mechanisms.8 Thisresult, taken together with the monocular depriva-tion experiment, indicated that neural connectionspresent early in life can be modified by visual expe-rience. Such neural plasticity was not observed inthe adult cat, but existed only during the first threepostnatal months.9
The early experiments were done in the cat,but we soon turned our attention to the rhesusmacaque monkey. After having demonstrated thatcells in the monkey visual cortex also respond selec-tively to lines of different orientations and often arebinocular10 we showed that the monkey was alsosusceptible to visual deprivation,11 a finding subse-
From Les Prix Nobel en 1981, pp. 261-283 and Nature, 1982, 299: 583-591.Nobel lecture, 8 December 1981
Nobel Lectures 687
quently confirmed and extended.12'13'14'15 Furtheradvances in our understanding of the nature of andmechanism underlying the deprivation phenom-ena depended on working out some of the func-tional architecture of the visual cortex. This wasdone through further physiological experiments inthe normal animal and by using newly developedanatomical methods.16'17'18'19'20 Over the years wehave pursued the normal and developmental stud-ies in parallel, and this has accelerated our progressin both areas. For example, while the deprivationexperiments depended on the understanding of thefunctional architecture of the normal adult animal,we were alerted to the existence of ocular domi-nance columns in the cat by experiments we haddone in strabismic animals.21
In this lecture I will present our currentunderstanding of the development of the monkeyvisual cortex and the role of visual experience ininfluencing neural connections. Rather than at-tempting to discuss in any detail the now veryextensive literature in the field, my emphasis willbe on the work carried out in our laboratory (forreviews see references 22,23 and 24). David Hubeland I did much of this work in collaboration withSimon LeVay.
MONOCULAR DEPRIVATION
The procedure of suturing a monkey's eyelid shutcreates a condition similar to a cataract, sincethough the light reaching the retina through theclosed lid is only slightly attenuated (by factor of 3),the forms of objects are no longer visible. As men-tioned above, when the deprived eye is openedafter months of deprivation, the animal is unable tosee with it; there are no obvious changes in ocularmedia, the retina or the LGN that can explain thisdeficit; instead marked changes have occurred atthe level of the primary visual cortex (striate cor-tex). Even if the ocular media are clear, theoccluded eye develops with time a marked axiallength myopia (5—12 D over a 1 year period).25
One way of seeing the change is to recordfrom cells in the striate cortex and determine theirocular preference.7 In the monkey there is nor-mally a fairly even balance between cells drivenpreferentially by one eye and cells driven preferen-tially by the other.10 In layer IV most cells arestrictly monocular, and outside of layer IV they are
usually binocular, though they still tend to respondmore strongly to stimulation of one eye than to theother. There are about as many cells preferringstimulation of the left eye as cells preferring stimu-lation of the right (Fig. 1, left). Under conditions ofmonocular deprivation, however, the great major-ity of cortical cells are driven exclusively by thenondeprived eye (Fig. 1, right).11'12'13 One couldask whether this can be accounted for in terms ofchanges occurring at the level of the lateral genicu-late nucleus. Although the cells lying in the genic-ulate layers that receive input from the deprivedeye are smaller than those in the non-deprived lay-ers (Fig. 2), they are present in normal numbers,respond briskly to stimulation of the deprived eyeand have normal receptive fields. Since geniculatecells are functionally normal and the cortical cellsare altered in their properties there must be somechange in the effectiveness of the geniculocorticalconnections. We were interested in investigatingwhether there were any structural changes associ-ated with this abnormality.
The first aspect of cortical organization to beexamined is the pattern of input of the geniculateafferents to the cortex. This can be done using theautoradiographic technique for tracing neuronalconnections, transynaptically from the eye18'20 orby a fiber stain19 (see also lecture of David Hubel).When in the normal monkey the input from thelateral geniculate nucleus reaches layer IV of thecortex, the information from the two eyes is stillsegregated. The input from each eye is distributedinto a series of branching and anastomosing bands,which are about 0.5 millimeter wide, and alternatewith similar bands serving the other eye (Fig. 3A).This pattern of innervation forms the anatomicalbasis for ocular dominance columns. Cells in thesuperficial and deep layers, while tending to bemore binocular than cells in layer IV, still are morestrongly influenced by the eye that provides inputto the column in which they reside. The relativeinfluence of the two eyes is shown by making tan-gential electrode penetrations through differentcortical layers. Such penetrations in the normalmonkey show regular changes in eye preference asexpected from the columnar arrangements (Fig.3A; Fig. 4, top).
In an animal that has undergone monoculardeprivation, the geniculate terminals with inputfrom the non-deprived eye take over much of the

688 PARTY THREE REVIEWS
Fig. 1. Ocular dominance histograms in normal and monocularly deprived rhesus macaque monkeys.Left histogram: 7256 cells recorded from area 17 in normal adult or juvenile rhesus monkeys.13
Right histogram: obtained from a monkey in which the right eye was closed at 2 weefysfor 18 months.15
It shows the relative eye preference of 100 cells recorded from the left hemisphere. The letter D indicates the sideof the histogram corresponding to dominance by the deprived eye.
Cells in layer IVC are excluded in this figure and in histograms of all other figures. Cells in group 1 aredriven exclusively from the contralateral eye, those in group 7from the ipsilateral eye, group 4 cells are equallyinfluenced, and the remaining group are intermediate.
space that would normally have been occupied byterminals from the deprived eye (Fig. 3B).13'15 Thedeprived eye input has shrunken down to occupythe small strips lying between the terminals of thenon-deprived eye input. Tangential electrode pen-etrations through cortical layers reveal long ex-panses of cells driven by the non-deprived eyeinterrupted by small patches of cells that are eitherunresponsive or driven by the deprived eye (Fig. 4,middle). As will be shown later in this paper, thisexpansion of the input from the non-deprived eyeoccurs at the level of single geniculate afferents.Cells in the deprived layers of the geniculate aresmaller than normal. One reason for this is thattheir shrunken cortical arbors may require asmaller soma to maintain them, as originally pro-posed by Guillery and Stelzner (1970).26
Morphological examination of the lateralgeniculate nucleus in these animals showed that
there is a good relationship (r = 0.91) between therelative size of normal and deprived cells and therelative size of normal and deprived ocular domi-nance columns in layer IVC.15 Thus measuringgeniculate cell sizes is yet another means of evalu-ating the effects of monocular closure.
From the histogram shown in Figure 1 onecannot tell whether many cells have changed alle-giance from the deprived to the non-deprived eyeor have simply become unresponsive. The autora-diographic labelling of the afferents in layer IV(Fig. 3B) shows that a greater proportion of thecells in layer IV receive direct input from the non-deprived eye. The consequence of this change isthat cells at later stages have shifted their allegiencefrom the deprived to the nondeprived eye, ratherthan becoming unresponsive. This conclusion issupported by the physiological findings that thelarge majority of cells in superficial and deep layers

Nobel Lectures 689
Fig. 2. Coronal section through the right lateral geniculate nucleus of the monkey with right eye closed at2 wee^sfor 18 months (fig. 1, right). Note the atrophy in the layers receiving input from the deprived eye (indi-cated by arrows). Stained with cresyl violet; frozen section.13
respond only to the stimulation of the normal eye(Fig. 4 middle).
THE CRITICAL PERIOD
Having observed these dramatic effects of monoc-ular suture early in an animal's life, we wanted todetermine if there was a period over which the cor-tex retained its plasticity.
Our experiments in adult cats and mon-keys6'15 showed that long periods of monocular lidsuture did not result in the sort of changes in thevisual cortex described above. Instead, we foundthat there is a definite period of time, early in life,during which the visual system shows this lability.We termed this the "critical period." The perma-
nent visual deficits observed in children with con-genital cataracts are therefore most likely a resultof changes in the visual cortex that occurred duringthe critical period. Adult humans suffering fromcataracts for many years will have normal visionwhen the cataracts have been removed presumablybecause they are well past their critical period at theonset of the disease.
The critical period in the monkey was esti-mated by closing one eye at different ages andkeeping it closed for several months or longer.15
The deprivation effect was gauged by the relativeinfluence of the two eyes on single cortical cells(ocular dominance distribution), by the distribu-tion of the input from the two eyes in layer IV(using the autoradiographic technique shown in

Fig. 3. Darl^field autoradiographs of monkey striate cortex following injection of^H-Proline in the vitreous ofone eye 2 weefy before.
A: Normal monkey, a montage of a series of tangential sections through layer IVC. The light stripes, rep-resenting the labelled eye columns, are separated by gaps of the same width representing the other eye. B: Monoc-ularly deprived monkey, again a montage from a series of tangential sections through layer IVC. Same monkeyas in Fig. 1, right, and Fig. 2, which had the right eye closed at 2 weefysfor 18 months. The input from the nor-mal eye is inform of expanded bands which in places coalesce, obliterating the narrow gaps which represent thecolumns connected to the closed eye.
690

Nobel Lectures 691
Monocular Closure
Strabismus
cortex distance—mm
Fig. 4. Eye preference of cells recorded in oblique penetrations through the cortex in a normal monkey, a monoc-ularly deprived monkey, and a monkey raised with strabismus. Ocular dominance categories (1-7) are shownrelative to the distance the electrode penetrated through the cortex.
Top: Penetration in a normal monkey which shows the sinusoidal shift in eye preference with distance. Thearrowhead indicates that the electrode entered layer IVC, in which cells are monocular, and there are abruptshifts of dominance from one eye to the other.
Middle: Oblique penetration in a monkey raised with monocular closure (same monkey as in Figs. 1-3).Note that outside layer IVall cells are driven only by normal eye (7), and in layer IVC (see arrow) there are onlyshort stretches of cells with input from the deprived eye. The observed overlap of input from left and right eye isnot present in the normal monkey.
Bottom: A monkey with a 10° convergent squint produced by sectioning of the lateral rectus at three weeks.(Same animal as in Fig. 11, left histogram). The illustration shows the result of oblique penetration through thestriate cortex made when the animal was 31/2 years old. Even outside of layer IV cells were monocular, withequal stretches of cortex dominated by either eye.
Fig. 3), and by comparing the cell sizes in deprivedand non-deprived layers of the LGN. The physio-logical results in monkeys with one eye closed at 2weeks, 10 weeks, 1 year of age, and in the adult areillustrated in terms of ocular dominance his-tograms in Figure 5. The earliest closure producedthe most severe shift of preference toward the nor-mal eye. The same degree of shift could be seen upto an age of 6 weeks. At that age the animal's sus-
ceptibility to monocular deprivation began todecline, but as is shown in the figure, it was stillpronounced at 10 weeks and was detectable at oneyear. As indicated above, there were no corticalchanges when the closure was done in the adult.
The changes occurring in the geniculo-corti-cal innervation were in general agreement with thephysiology, though the time course was somewhatdifferent (Fig. 6). Animals with a closure at 2 and
Normal

692 PARTY THREE REVIEWS
Fig. 5. Ocular dominance histograms of monkeys with one eye occluded by lid suture at different ages and exam -ined after relatively long periods of closure.15
Upper left: Same monkey as in figs 1-4. Right eye closed at 2 weeks for 18 months (cf. Fig. 1, right).Upper right: A monkey with right eye closed at 10 wee^sfor 4 months. Strong dominance of normal eye
but not as pronounced as at earlier closure. Duration of deprivation relatively short, but our experience is thatat this age the main changes in eye preference occur within the first few months of closure.
Lower left: A monkey with right eye closed at 1 year for a period ofl year. A moderate shift in preferencetoward the non-deprived eye. This was particularly true for cells in layers II and III.
Lower right: Adult monkey (6 years old) with one eye occluded for 1 '/2 years. There was no obvious dif-ference in eye preference from that observed in the normal monkey.
5'/z weeks showed the expected expansion of thenon-deprived geniculate terminals; closure at 10weeks showed a more moderate expansion, and atone year the pattern was indistinguishable fromthat in the adult. Geniculate cell sizes in thedeprived layers changed in a parallel fashion,showing marked shrinkage at early closures, mod-erate reduction in closure at 10 weeks and nochange when closed at one year. Since in the clo-
sure at one year we observed physiological changesin the absence of a change in the pattern of genicu-late innervation, there must presumably bechanges occurring at subsequent levels in the corti-cal circuit.13'14 At any rate, in the adult even this"higher level" of plasticity disappears.
The high degree of susceptibility to depriva-tion at early ages is also apparent from experimentsin which one eye in monkeys was closed for short

Nobel Lectures 693
Fig. 6. Autoradiographic labelling patterns from the striate cortex of four monocularly deprived monkeys illus-trating the distribution ofgeniculate terminals in layer IVC after closures at different ages. In all cases the nor-mal (left) eye was injected with 3H Proline thereby labelling the nondeprived geniculate terminals.15
A: Right eye closed at 2 weefysfor 18 months. Same animal as in Fig. 1 (right), Fig. 4 (middle) and Fig. 5(upper left).
B: Right eye closed at 5'A weefyfor 16 months.C: Right eye closed at 10 tvee\sfor 4 months. Same animal as in Fig. 5 (upper right).D: Right eye closed at 14 months for 14 months. The unlabetted bar is 1 mm.
periods. Before 6 weeks of age, it was sufficient toclose an eye for a few days to obtain substantialchange in eye preference. The ocular dominancehistogram from a monkey with one eye closed for12 days is shown in Fig. 7 (left). During the subse-quent several months a marked change requiredseveral weeks of closure, and during the secondyear any change required months of closure.
From these and similar experiments by us13'15
and others14'27 we conclude that the macaque mon-key is highly susceptible to monocular deprivationduring the first six weeks of life, at which age thesensitivity declines progressively, so that at VAto2years the monkey loses this type of neural plasticity.The length of the critical period varies between
species. In cats it is 3 to 4 months,9'28 and from clin-ical observations in humans it may extend up to5—10 years, though the susceptibility to deprivationappears to be most pronounced during the firstyear and declines with age.29'30'31
RECOVERY FROM DEPRIVATION
Monocular closure during the entire critical periodin cats and monkeys leads to permanent blind-ness.32'33'34 Presumably there is no recovery ofvision after the eye is opened because the patternofgeniculate innervation and the eye preference ofcortical cells can no longer be modified. Duringthe period of high susceptibility partial recovery of

694 PARTY THREE REVIEWS
Fig. 7. Left: Ocular dominance his-togram for 47 neurons recorded in a20-day-old monkey whose right eyehad been closed since 8 days of age.The physiological picture is similarto that seen after months of depriva-tion.15
Right: Ocular dominance his-togram of 99 cells recorded in a mon-key whose right eye was closed from21 to 30 days of age. In spite of a sub-sequent 4 years of binocular vision,most cortical neurons were still unre-sponsive to stimulation of the righteye.15
vision in the deprived eye is possible after briefperiods of monocular closure.15'34'35'36 This wasshown in a monkey with one eye closed betweendays 21-30, after which the monkey lived withboth eyes open for a period of 4 years. Initially theanimal appeared blind in the deprived eye but,with time, it slowly regained the use of the eye andthe final acuity was 20/80-100 as compared to 20/40in the non-deprived eye. The recordings from thestriate cortex showed a marked dominance of thenon-deprived eye (Fig. 4, right). If there was anincrease in the number of cells driven by the oncedeprived eye, it was not very obvious. There was amarked narrowing of the deprived columns and acorresponding widening of the non-deprived ones.Thus even if there had been some behavioral re-covery, these results demonstrate that a few days ofmonocular closure had caused clear physiologicaland anatomical changes in the striate cortex.
These results are relevant to observations inchildren who have been monocularly deprived forshort periods of time. When tested later, some chil-dren were found to have reduced acuity in the oncepatched eye and the degree of deficit depended onhow young the child was at the time of patch-ing.38'39 The experience in children with cataractremoval indicates that surgery must be performedvery early in the critical period in order to preventthe appearance of any deficit.40'41
A procedure commonly used in children withstrabismic amblyopia is to place a patch over thegood eye to improve vision in a weak eye. In
monocularly deprived animals it was possible toopen the sutured eye and close the normal eye, 9here termed "reverse suture." Both in the cat andmonkey, reverse suture led to a complete switch ineye preference if it was done within the early partof the critical period.15'27'28'37 The geniculate inner-vation of layer IVC also reversed so that theshrunken regions controlled by the initially closedeye expanded at the expense of the other eye, andconsequently the cortical cells switched eye prefer-ence in favor of the eye closed first.15'37'42 An exam-ple is shown in Figure 8 (top) in which the eyereversal was done at 3 weeks, and the recordingsdone 8 months later. The ocular dominance his-togram shows that the initially closed eye, which atthe time of eye reversal would have influenced veryfew cortical cells, now became strongly dominant.The autoradiography (Fig. 9A) shows a markedexpansion in layer IVCP of the initially deprivedgeniculate terminals. When reversal was done at 6weeks the physiology indicated a complete rever-sal, with a strong dominance of the initiallydeprived eye. (Fig. 8, lower left) Such a markedshift was not reflected in the innervation of layerIV, in which the initially deprived eye had suc-ceeded only in regaining its normal territory (Fig.9C). This indicates that a significant part of thechanges were occurring at the level of intrinsic cor-tical connections. Finally, reversing at one yearfailed to produce any restoration of the function ofthe initially deprived eye (Fig. 8, lower right; Fig.9D). Though it is possible to cause changes by

Nobel Lectures 695
Fig. 8. Ocular dominance histogramsof cortical cells recorded in threemonkeys in which reversed suturewas done at various ages.15
Upper histogram: 77 cells re-corded from the right striate cortex ofa monkey with the right eye (D;)closed at 2 days for 3 weefe and theleft eye (D^ closed at 3 weefys forabout 8 months. Nearly all neuronsresponded only to the initiallydeprived right eye (Dj).
Lower left: 56 neurons re-corded from the left striate cortex.Right eye (DJ closed at 3 days for 6weeks; left eye (D^ closed at 6 wee^sfor 4'/2 months. Again nearly all neu-rons were driven exclusively by theinitially deprived right eye (D/).
Lower right: 74 neurons re-corded from the left striate cortex.Right eye (D}) was closed at 7 daysfor 1 year; left eye (D^ was closed at1 year for 2 'A years. In this case therewas no effect of the reversal; nearlyall the calls responded only to the ini-tially open eye.
monocular deprivation at one year (Fig. 5, lowerleft), it appears to be more difficult to repair con-nections that have already been changed once.
Looking more closely at the autoradiographyof the geniculate input to layer IVC in the monkeywith the reversal at 3 weeks (Fig. 9 A and B), onesees a surprising result. The initially deprived eyetook over much of the area of innervation of thelower part of layer IVC (IVCp), but failed toreverse the dominance of the other eye in the upperpart of layer IVC (IVC(X). Apparently, the eye pref-erence of the majority of cortical cells is deter-mined primarily by the cells in IVC(3 (Fig. 8 top,9A and B). Layer IVCJ3 is innervated by cells in thedorsal part of the lateral geniculate nucleus (parvo-cellular layers) and IVCdC by cells in the ventralpart of the same nucleus (magnocellular layers).The result of the eye reversal experiment indicatesthat the critical period is different for the two celltypes. Whereas the critical period is over for themagnocellular input at 3 weeks, the parvocellularinput apparently begins to lose its ability to expand
at 6 weeks (Fig. 9C), a time when intracortical con-nections still show considerable plasticity. Thissuggests that throughout the brain each functionalunit has a unique program of development.
MECHANISM: DISUSE VERSUSCOMPETITION
These experiments demonstrate that when abinocular cortical cell is not stimulated by a giveneye, then the input from that eye drops out. Otherforms of visual deprivation have shed some lighton the mechanism of the effect of monocular dep-rivation. For example, if disuse were an importantfactor, one might expect that with both eyes closed,cortical cells would not be driven by either eye.Experiments in cats and monkeys raised underconditions of binocular deprivation showed, how-ever, that cells were readily driven by the twoeyes.28'43'44 The cortex in the monkey was nonethe-less altered in a very substantial way, in that veryfew cells were binocularly responsive.44 This is

696 PARTY THREE REVIEWS
Fig. 9. Effect of reversed suture at various ages on the labelling pattern ofgeniculate terminals in layer JVC.A: Same monkey as in the upper part of Fig. 8, in which reversed suture was done at 3 weeks of age. The
initially deprived (right) eye was injected with 3H Proline. A single tangential section. In the central region thelabelled bands are expanded. In the surrounding belt the bands are contracted. These two regions correspond tothe ft and a sublaminae of layer IVC. Unlabelled bar is 1 mm.
B: Key to A, showing the distribution of label (in blacty and the boundaries of the sublaminae IVCa andIVC ft, traced from an adjacent section stained with cresyl violet. Note that the thin labelled bands in IVCOL runinto the centers of the enlarged bands in IVC ft, meaning that the two sets of bands, though of very different width,are still in register with each other just as they are in normal animals.
C: The autoradiographic montage of the labelling pattern in monkey with reversed suture at 6 weefys (cf.lower left, Fig. 8). The initially deprived right eye was injected. The labelled bands are of about normal widthindicating a recovery from the effects of the early deprivation, but not a complete reversal. Most of the montageshows layer IVC ft. In layer IVCa the labelled columns remained shrunken (not illustrated).
D: Autoradiographic montage from the monkey with reverse suture at 1 year of age (Fig. 8, lower right).The labelled columns (for the initially deprived right eye) remain shrunken, indicating that the late reversal didnot permit any anatomical recovery. Scalemar^er = I mm.
illustrated in figure 10, in which a monkey hadboth eyes sutured from birth to 4 weeks of age.Except for the obvious lack of binocular cells, thecortex seemed quite normal. The cells were brisklyresponsive, showed a high degree of orientationselectivity, and had regular sequences of shifts inorientation preference. From tangential electrodepenetrations we were also able to see a clear segre-gation of the cells into unusually distinct oculardominance columns, even outside of layer IV.When monkeys are kept in the binocularly de-prived condition for many months a considerablefraction of the cells are unresponsive or respondonly sluggishly, and often show lack of orientation
preference. Binocular closures in kittens had a sim-ilar effect except that neither short nor long termdeprivation led to an obvious loss of binocularcells.28'43
Evidence for competitive mechanisms hasalso been found by measurements ofgeniculate cellsizes in an ingenious set of experiments.26'45'46 Firstit was demonstrated in monocularly occluded kit-tens that deprived cells in the monocular segmentof the nucleus were of normal size, whereas thosein the binocular segment showed marked shrink-age.26 Next Guillery produced a monocular regionin the zone of binocular overlap by making a localretinal lesion in the normal eye of monocularly

Nobel Lectures 697
Fig. 10. Ocular dominance histogram of a monkey withbinocular lid suture from birth to 30 days of age. Note thelow number of binocular cells.44
occluded kittens.45 Again the deprived geniculatecells with no competitive input from the other eyewere of normal size, and those outside the topo-graphical area corresponding to the retinal lesionshowed the usual shrinkage. Finally, it could bedemonstrated that binocular closure in kittensapparently did not lead to a reduction in geniculatecell size46 as originally reported by us.45 Theseexperiments lend strong support to the hypothesisthat competitive mechanisms rather than disuseare prime factors in producing the changesobserved under conditions of monocular depriva-tion.
Because many cortical cells are binocularfrom birth, the loss in the monkey of binocular cellsat early times after closure suggests that in orderfor cortical cells to sustain a binocular input the twoeyes must work together. Another situation thatinterrupts coordinated activity from the two eyes isstrabismus.47 One way of producing experimentalstrabismus is to section an extraocular muscle. Sec-tioning the lateral rectus causes the eye to deviateinward (convergent strabismus), whereas section-ing the medial rectus produces an outward devia-tion of the eye (divergent strabismus). After sur-gery the sectioned muscle usually reattachesbehind the original site, so that except for the mis-alignment, normal eye movements are restored. In
four monkeys with convergent strabismus theoperation was performed between 3—5 weeks.48
When the animals were examined after a year ormore, three of them had normal acuity in both eyesbut lacked the ability to fuse the images in the twoeyes. The striate cortex of these animals had nor-mal single unit activity, but there was a strikingabsence of binocular cells (Fig. 11, left). Tangentialpenetrations showed that the monocular cells weregrouped in the usual regular columnar pattern(Fig. 4, bottom), suggesting that binocular cells hadlost the input from the nondominant eye. Thefourth monkey had low acuity in one eye and fewercortical cells were driven from that eye than fromthe normal eye (Fig. 11, right). When in five addi-tional monkeys a strabismus was produced at latertimes during the critical period, there was anincrease in the proportion of binocularly drivencells. From these results and experiments in catsand monkeys reported ear lier49'50'51 it seems thatthe period during which the cortex can be influ-enced by the artificially induced strabismus is com-parable in duration and sensitivity to that observedwith monocular deprivation.
The binocular deprivation and strabismusexperiments support the notion that competition,rather than disuse, is the main cause of theobserved changes.43 The right circumstances mustexist, however, for the competition to occur, sincecells in the normal monkey tend to be dominatedby one eye or the other,10 and the dominant eyedoes not take over the cell completely. The differ-ence between normal and deprived animals is thatunder normal conditions a cell receives input syn-chronously from the two eyes, whereas in monocu-larly deprived, strabismic, or binocularly deprivedanimals the two eyes do not act together. Themaintenance of a given input may depend on therate of firing of the postsynaptic cell while thatinput is active3 so that in normal animals the non-dominant input is maintained by the activity of thedominant input. Carefully designed experimentsby Singer et al52 and Wilson et al53 have providedsupport for the notion that it is crucial to activatethe postsynaptic cell in order to change oculardominance (for a more general discussion ofsynapse formation and stabilization see references54 and 55).
In addition to providing insight into themechanisms of development and plasticity in the

698
Fig. 11. Ocular dominance histograms of cells recorded in the striate cortex of two strabismic rhesus monkeys.48
Left: Histogram shows the eye preference of cells recorded in a 3 year old monkey in which the lateral rec-tus of the right eye was sectioned at 3 weeks of age. There is a nearly complete absence of binocular cells; the cellsare driven exclusively either by the right or the left eye. As shown in Fig. 4 (lower) cells are clustered in a colum-narfashion. The monkey had a 10° convergent strabismus, normal acuity in both eyes, but could not fuse imagespresented separately to the two eyes.
Right: A monkey with lateral rectus muscle of the right eye sectioned at 3 weeks. The animal had a con-vergent strabismus. Behavioral testing showed normal acuity in the left eye (20/30) and lower acuity in right eye(20/60 to 20/120). There was no difference in refraction between the two eyes. The histogram shows that theamblyopic eye influenced fewer neurons in the superficial and deep layers of the striate cortex. The ocular dom-inance columns in layer IVC had normal appearance when examined in tangential sections stained with areduced silver method (Liesegant).19
visual cortex, the strabismus experiments may be ofdirect clinical relevance. A common situation inchildren with strabismus is that they have goodvision in both eyes, but cannot fuse the images inthe two eyes. These children often use the two eyesalternately, fixating and attending first with oneeye and then with the other. The lack of binocularcells in strabismic animals is perhaps the physio-logical basis of this condition.47'12 Another com-mon consequence of strabismus in children is a lossof acuity in one eye (strabismic amblyopia). Thephysiological mechanism of this condition is lesswell understood, even if our experiments (Fig. 11,right) and those of others12'56 indicate that one eyehas been weakened in its ability to drive corticalcells, as is seen in monocular deprivation.
As mentioned above, late monocular depriva-tion in the monkey (see Fig. 5, lower left) andreversal experiments (Fig. 8, lower left, and Fig.9C) caused alterations in the cortical circuit at
stages subsequent to the input from the lateralgeniculate nucleus. Another series of experimentsillustrated this point quite dramatically. The ap-proach is a variation of the original experiments byHirsch and Spinelli57 and by Blakemore andCooper58 in which kittens were raised viewing onlystripes of one orientation. In our experiments weallowed a monkey to see vertical stripes throughone eye only.59 The other eye was deprived by lidsuture. This effectively produced a different condi-tion of deprivation for different populations of cor-tical cells: those with vertical orientation prefer-ence were monocularly deprived, and those withhorizontal orientation preference were binocularlydeprived. We recorded from the striate cortex after57 hours of exposure (between days 12—54 afterbirth) and found normal levels of activity and cellsof all orientations with their usual regular colum-nar arrangement.17 There was an overall domi-nance of the open eye, but when we produced sep-
PARTV THREE REVIEWS

Nobel Lectures 699
Fig. 12. Ocular dominance histograms of cells recorded from a monkey with the right eye closed at 12 days ofage, then dept in the darf^ except for 57 hours of self-exposure to vertical stripes during the subsequent 42 days.
Left histogram: 48 cells recorded in the right striate cortex with preferred orientation within ±45° of thehorizontal axis. There were few binocular cells and a good number of monocular cells responding to stimula-tion of either the left or the right eye. Similar distribution of eye preference to that seen in binocularly deprivedanimals (cf. Fig. 10).
Right histogram: 27 celts with preferred orientation within ±45° of the vertical axis. Majority of therecorded cells responded to the open eye producing a histogram similar to that seen after monocular depriva-tion.59
arate ocular dominance histograms for verticallyand horizontally oriented cells (Fig. 12), it becameclear that horizontally oriented cells tended to bedriven monocularly by either eye (a picture typicalof binocular deprivation), and vertically orientedcells tended to be driven monocularly by theexposed eye only (a picture typical of monoculardeprivation). Thus these findings again demon-strate that in addition to influencing the thalamo-cortical input, deprivation can alter the connec-tions in the cortex without causing changes in thatinput. This question has also been addressed in thekitten by somewhat different approaches but withessentially the same results.60-61
In looking at the effects of various forms ofdeprivation one gets certain insights into theprocesses that govern the balance between differ-ent inputs, enabling the visual cortex to integrateinformation in the appropriate manner. We havelearned that competition and synchronization ofinputs are important factors in forming and main-
taining this balance. If these processes are dis-turbed early in life, the system can be permanentlyaltered.
NORMAL DEVELOPMENT
We cannot properly evaluate the experiments onvisual deprivation without having detailed knowl-edge about the normal development of the visualsystem. To assess the relative importance of thegenetic program and the visual environment, it isnecessary to evaluate the capabilities of the visualcortex at birth. The monkey is visually alert at orvery soon after birth and cells in the visual cortexshow orientation preference and binocularity, as inthe adult monkey. This was shown by single cellrecordings in neonatal monkeys with no experi-ence of contours or forms.44
Compared to the monkey, the kitten is far lesswell developed at birth; the eyes do not open untilthe second week and kittens tend to spend their

700 PARTY THREE REVIEWS
first three weeks mainly eating and sleeping. In thevisual cortex cells tend to give weak or erraticresponses during the early postnatal period andcome to respond like adult cells at about 3—4 weeksof age.9'28'62 During the same time period corticalcells differentiate and active synapse formationtakes place.63'64 Whether cells in the cat visual cor-tex develop normally without visual experience, aswas originally reported for binocularly sutured kit-tens,8 was questioned at first65 but subsequentlyconfirmed in several studies.62'66'67'68 Whether inthe kitten all cortical cells can develop fullythrough innate mechanisms is not entirely clear,since animals raised in the dark or with binocularlid closures seem to have a certain fraction of unre-sponsive or unoriented cortical cells.62'66'68
The newborn animal does differ from theadult in one significant respect, relating to the seg-regation of the afferents from the two eyes in layerIVC. In the newborn monkey we were able toshow by eye injection of 3H-proline that the inputsfrom the two eyes are strongly overlapping withonly a mild fluctuation in eye dominance in a band-like pattern.13 Sokoloff and his colleagues69 con-firmed this observation using the 2-deoxyglucosemethod. In the monkey foetus Rakic showed thatinitially the left and right-eye afferents overlapcompletely, and not until a few days before birth dothey begin to sort out into ocular dominancecolumns.70 We followed this process of segregationpostnatally; it was completed by 4—6 weeks of age(Fig. 13).13 Recordings also indicated an initialoverlap, followed by separation of the inputs fromthe two eyes in layer IVC and the time course of theevents were similar. The process of segregation didnot require visual experience, since it also occurredin an animal raised in the dark.15 In kittens oculardominance columns are formed much as they arein monkeys, showing a sequence of initial overlapand segregation during the first few months oflife,71 even though in this species visual experienceappears necessary for their normal development.72
In the kitten it has been possible to examine thesegregation of ocular dominance columns at a singlecell level. In the early postnatal period, a singlegeniculate afferent gives off numerous branchesinnervating without interruption an area coveringseveral future ocular dominance columns withoutinterruption (Fig. 14, top).73 As the axon matures,
there appears to be a selective loss of branches, so thatultimately it innervates ocular dominance columnsserving one eye and leaves gaps for the columns serv-ing the opposite eye (Fig. 14, middle).74'76 In a catmonocularly deprived during its critical period, ageniculocortical afferent with input from the nor-mal eye is shown in the bottom of Fig. 14.77 Itappears to have innervated an area that normallywould have been occupied by the other eye.
Both the autoradiography (Fig. 3) and the sin-gle cell reconstructions (Fig. 14) suggest a mecha-nism for the expansion and contraction of oculardominance columns in monocular closure. Theterminals with input from the normal eye continueto occupy the territory which normally they wouldhave relinquished, while the deprived terminalsare trimmed to an abnormal extent. Anothermechanism appears to operate at slightly laterstages: when the ocular dominance columns arefully segregated (at six weeks of age in the mon-key), monocular closure still causes an expansionand a contraction of the columns similar to thatseen after earlier closure (Fig. 6B). This argues fora mechanism of sprouting by one axon into the ter-ritory originally occupied exclusively by the de-prived eye. Perhaps sprouting occurs from theaxon branches that traverse the ocular dominancecolumns for the other eye (see Fig. 14, middle).Reverse suture experiments also indicate that bothtrimming and sprouting are involved in plasticchanges of the geniculocortical pathway (Fig. 9A,B, C). We know little of the biochemical mecha-nisms underlying these changes, except for theintriguing observation of the possible role of nor-epinephrine in neural plasticity.78 Since the criticalperiod seems to vary in onset and duration betweendifferent brain regions and even between layers ofan individual cortical area (cf. IVCtt and IVC(3 inmonkey striate cortex,15 Fig. 9A and B) the controlof plasticity appears to be specific and localized, nota phenomenon controlled by diffuse processes.
CONCLUSIONS
Innate mechanisms endow the visual system withhighly specific connections, but visual experienceearly in life is necessary for their maintenance andfull development. Deprivation experiments dem-onstrate that neural connections can be modulated

Nobel Lectures 701
Fig. 13. Darkfield autoradiographs ofgeniculate afferent terminals in thestriate cortex of normal neonatalmonkeys in which the right eye hadbeen injected with a radioactivetracer 1-2 weeks earlier.15
A: A normal 6-day-old mon-key; single section from the left hemi-sphere that graces IVC tangentiallyin the central oval region. Silvergrains are distributed continuouslyover layer WC, but there are bands ofalternating higher and lower graindensity, indicating that ajferents forthe two eyes are in the process ofcolumnar segregation.
B: A normal 3-weef{-old mon-^ey; a single section through layerIVC of the left hemisphere whichshows a clear columnar pattern butwith a slight blurring of the marginof labelled bands, suggesting a mod-est intermixing of left and rigth eyeajferents at the borders of oculardominance columns.
C: A 6-wee\-old normal mon-key, autoradiographic montage of thegeniculate labelling pattern in layerIVC of the right striate cortex. Theocular dominance columns appear assharply defined as in the adult mon-key. The unlabelled bar is 1 mm.Adapted from Reference 15.
by environmental influences during a criticalperiod of postnatal development. We have studiedthis process in detail in one set of functional proper-ties of the nervous system, but it may well be thatother aspects of brain function, such as language,complex perceptual tasks, learning, memory and
personality, have different programs of develop-ment. Such sensitivity of the nervous system to theeffects of experience may represent the fundamen-tal mechanism by which the organism adapts to itsenvironment during the period of growth anddevelopment.

Fig. 14. Patterns of aborization of single geniculate axons in layer 4 of cat visual cortex.Upper: A 17-day-old fatten; the arborization of a single afferent is shown at an age prior to the columnar seg-regation. 71 The axon, impregnated in its entirety with the Rapid Golgi method, arborizes profusely and uni-
formly over a disc-shaped area that is more than 2 mm in diameter. The use of this illustration is gratefullyacknowledged (LeVay, S. and Stryfyer, M.P.).73
Middle: Normal adult cat; off-center geniculate afferent (Y-type)75 injected intra-axonally with horseradish peroxidase (HRP) in the striate cortex. The arborization is entirely within layer 4 ab and forms twopatches separated by a terminal-free gap. Presumably this pattern corresponds to the segregation of the inputfrom the two eyes in a columnar fashion.76
Lower: Monocularly deprived cat (2 wee^s—more than 1 year); a non-deprived Y-type afferent with anon-center receptive field injected intra-axonally with HRP. The arborization is primarily within layer 4 ab butdoes not have the normal patchy distribution of terminals. The absence of a terminal free region indicates thatnon-deprived geniculate branches are present in the territory that normally belongs only to the other eye.77
702

Nobel Lectures 703
ACKNOWLEDGMENTS
I wish to express my gratitude and affection to the staff, facultyand students in the Department of Neurobiology. For over twodecades this has been a unique place because of its blend of sci-entific excellence and compassion. The late Stephen Kufflerplayed a very special role in the creation of this environment andhis spirit and attitude will always serve as an inspiration. My sci-entific career began in a serious way at Johns Hopkins MedicalSchool and developed further during the past twenty years atHarvard Medical School. I am indebted to both of these institu-tions for providing me with invaluable opportunities for scien-tific training and research. I want also to recognize RobertWinthrop who generously provided the resources for myendowed professorship. It is obvious that our work could nothave been carried out all these years without federal support; itis a pleasure to acknowledge the steady and generous supportfrom the National Eye Institute. Finally I wish to thank Drs.Anne Houdek and Charles Gilbert for their help in preparingthe manuscript.
References
1. Hubel, D. H. and Wiesel, T. N., J. Physiol. 160: 106-154(1982).
2. von Senden, M., Space and Sight. The Free Press, Glencoe,1960.
3. Hebb, D. O., The Organization of Behavior. Wiley, NewYork, 1949.
4. McCleary, R. A., Genetic and Experiential Factors in Per-ception. Scott Foresman and Company, Glenview, 1970.
5. Hubel, D. H. and Wiesel, T. N., J. Physiol. 148: 574-591(1959).
6. Wiesel, T. N. and Hubel, D. H., T. N., J. Neurophysiol. 26:1003-1017(1963).
7. Wiesel, T. N. and Hubel, D. H., J. Neurophysiol. 26:978-993(1963).
8. Hubel, D. H. and Wiesel, T. N., J. Neurophysiol. 26:994-1002 (1963).
9. Hubel, D. H. and Wiesel, T. N., J. Physiol. 206: 419-436(1970).
10. Hubel, D. H. and Wiesel, T. N., J. Physiol. 195: 215-243(1968).
11. Wiesel, T. N. and Hubel, D. H., Int. Union of Physiol. Sci-ences (I.U.P.S.) ABSTRACTS P. 118-119 (1971).
12. Baker, F. H., Grigg, P. and von Noorden, G. K., Brain Res.66:185-208(1974).
13. Hubel, D. H., Wiesel, T. N. and LeVay, S., Phil. Trans. Soc.London B. 278: 377-409 (1977).
14. Blakemore, C., Garey, L. J. and Vital-Durand, F, J. Physiol.283: 223-262 (1978).
15. LeVay, S., Wiesel, T. N. and Hubel, D. H., J. Comp. Neu-rol. 191: 1-51 (1980).
16. Hubel, D. H. and Wiesel, T. N., J. Comp. Neurol. 146:421-450(1972).
17. Hubel, D. H. and Wiesel, T. N., J. Comp. Neurol. 158:267-294 (1974).
18. Wiesel, T. N., Hubel, D. H. and Lam, D., Brain Res. 79:273-279 (1974).
19. LeVay, S., Hubel, D. H. and Wiesel, T. N., J. Comp. Neu-rol. 159: 559-576 (1975).
20. Hubel, D. H. and Wiesel, T. N., Proc. R. Soc. Lond. B. 198:1-59 (1977).
21. Hubel, D. H. and Wiesel, T. N., J. Neurophysiol. 28:229-289(1965).
22. Barlow, H. B., Nature 258: 199-204 (1975).23. Pettigrew, J. D. In: Neuronal Plasticity, ed. C. Cotman. pp.
311-330, New York, Raven (1978). Symposium presenta-tion, Berlin.
24. Movshon, J. A. and van Sluyters, R. C., Ann. Rev. Psychol.32: 477-552 (1981).
25. Wiesel, T. N. and Raviola, E., Nature 266:66-68 (1977).26. Guillery, R. W. and Stelzner, D. J., J. Comp. Neurol. 139:
413-422 (1970).27. Crawford, M. L. J., Blake, R., Cool, S. J. and von Noorden,
G. K., Brain Res. 84:150-154 (1975).28. Blakemore, C. and van Sluyters, R. C., J. Physiol. (London)
237:195-216(1974).29. Arden, G. B. and Barnard, W. M., Trans. Ophthalmol. Soc.
U.K. 99:419-431(1979).30. Vaegan, and Taylor, D., Trans. Ophthalmol. Soc. U. K. 99:
432-439(1979).31. von Noorden, G. K., Am. J. Ophthalmol. 92:416-421 (1981).32. Dews, P. B. and Wiesel, T. N., J. Physiol. 206:437-455 (1970).33. Ganz, L., Hirsch, H. V. B. and Tieman, S. B., Brain Res. 44:
547-568 (1972).34. Wiesel, T. N., Unpublished results.35. Mitchell, D. E., Cynader, M. and Movshon, J. A., J. Comp.
Neurol. 176:53-64(1977).36. Olson, C. R. and Freeman, R. D., J. Neurophysiol. 41:65-74
(1978).37. Blakemore, C., Vital-Durand, F. and Garey, L. J., Proc. R.
Soc. Lond. B 213: 399-423 (1981).38. Awaya, S., Sugawara, M. and Miyake, S., Trans. Ophthal-
mol. Soc. U. K. 99: 447-454 (1979).39. Odom, J. V, Hoyt, C. S. and Marg, E, Arch. Ophthalmol.
99:1412-1416(1981).40. Beller, R., Hoyt, C. S., Marg, E. and Odom, J. V, Amer. J.
Ophthal. 91(5): 559-565 (1981).41. Jacobson, S. G., Mohindra, J. and Held, R., Brit. J. Oph-
thalmol. 65: 727-735 (1981).42. Swindale, N. V., Vital-Durand, F. and Blakemore, C., Proc.
R. Soc. Lond. B 213: 435-450 (1981).43. Wiesel, T. N. and Hubel, D. H., J. Neurophysiol. 28:
1029-1040 (1965).44. Wiesel, T. N. and Hubel, D. H., J. Comp. Neurol. 158:
307-318(1974).45. Guillery, R. W., J. Comp. Neurol. 144: 117-130 (1972).46. Guillery, R. W., J. Comp. Neurol. 148: 417-422 (1973).47. Hubel, D. H. and Wiesel, T. N., J. Neurophysiol. 28:
1041-1059(1965).48. Wiesel, T. N. and Hubel, D. H., Unpublished results.49. Yinon, U., Exp. Brain Res. 26:151-157 (1976).50. Crawford, M. L. }. and von Noorden, G. K., Invest. Oph-
thalmol. 18: 496-505 (1979).51. Jacobson, S. G. and Ikeda, H., Exp. Brain Res. 34: 11—26
(1979).52. Singer, W., Rauschecker, J. and Werth, R., Brain Res. 134:
568-572 (1977).53. Wilson, J. R., Webb, S. V, Sherman, S. M., Brain Res. 136:
277-287(1977).54. Stent, G. S., Proc. Nad. Acad. Sci. U.S.A. 70: 997-1001
(1973).55. Changeux, J.-P. and Danchin, A., Nature 264: 705-712
(1976).56. Ikeda, H. and Wright, M. J., Exp. Brain Res. 25: 63-77
(1976).57. Hirsch, H. V. B. and Spinelli, D. N., Science 168: 869-871
(1970).

704 PARTY THREE REVIEWS
58. Blakemore, C. and Cooper, G. E, Nature 228: 477-478(1970).
59. Wiesel, T. N., Carlson, M. and Hubel, D. H., In preparation.60. Cynader, M. and Mitchell, D. E., Nature 270: 177-178
(1977).61. Rauschecker, J. P. and Singer, W, Nature 280: 58-80 (1979).62. Buiserret, P. and Imbert, M., J. Physiol. 255: 511-525 (1976).63. Marty, R., Archiv. D'Anatomic Microscopique et de Mor-
phologic Experimentale 52: 129-264 (1962).64. Cragg, B. G., J. Comp. Neurol. 160: 147-166 (1975).65. Pettigrew, J. D., J. Physiol. 237: 49-74 (1974).66. Blakemore, C. and von Sluyter, R. C., J. Physiol. 248:
663-716 (1975).67. Sherk, H. and Stryker, M. P., J. Neurophysiol. 39:63-70
(1976).68. Singer, W. and Tretter, E, }. Neurophysiol. 39: 613-630
(1976).
69. Des Rosiers, M. H., Sakurada, O., Jehle, J., Shinohara, M.,Kennedy, C. and Sokoloff, L., Science 200: 447-449 (1978).
70. Rakic, P., Philos. Trans. R. Soc. London, Sen B. 278:245-260 (1977).
71. LeVay, S., Stryker, M. P. and Shatz, C. J., J. Comp. Neurol.179: 223-244 (1978).
72. Swindale, N. V., Nature 290: 332-333 (1981).73. LeVay, S. and Stryker, M. P., Soc. Neurosci. Symp. 4: 83-98
(1979).74. Ferster, D. and LeVay, S., J. Comp. Neurol. 182: 923-944
(1978).75. Enroth-Cugell, C. and Robson, J. G., J. Physiol. 182:
923-944 (1966).76. Gilbert, C. and Wiesel, T. N., Nature 280: 120-125 (1979).77. Gilbert, C. and Wiesel, T. N., Unpublished observations.78. Kasamatsu, T. and Pettigrew, J. D., J. Comp. Neurol. 185:
139-162 (1979).

Chapter 28 • Epilogue: Summing Up •
Perhaps the most remarkable thing about our collaboration is the fact thatit continued for 25 years, much longer than most collaborations. Ours
had the special quality that it was between equals, in age and in seniority.Our two abilities were not identical but were complementary. An analogymight be Gilbert and Sullivan (Steve Kuffler once jokingly compared us toHuntley and Brinkley). Rosencrantz and Guildenstern also come to mind.As we look back, what stands out is the almost total absence of disagree-ments. When, late at night, should we finally quit and go home? Whomamong fellow scientists did we revere or otherwise? What should we donext? We never quite knew or even discussed where our ideas came from:they presumably arose in the long discussions that went on during our inter-minable experiments, and once an idea was hatched by one of us it was oftenforgotten, only to be resurrected months later by the other.
Almost absent from our way of working and thinking were hypothe-ses, at least explicit ones. We regarded our work as mainly exploratory, andalthough some experiments were done to answer specific questions, mostwere done in the spirit of Columbus crossing the Atlantic to see what hewould find. Today our grant proposals would surely be criticized as notbeing "hypothesis driven", as not following the rules of Science as taught inhigh school and as exemplified especially in physics. We believe that suchrules as to how Science (with a capital S) is done, or should be done, arelargely fiction, an attempt to retrospectively codify a process that oftenamounts to groping. There simply are no rules as to how to do science. Look-ing back, we can recognize times when we must have had something vaguelyresembling a "hypothesis". Probably we could have dressed up our thoughtprocesses in those terms, but we would have found it dishonest to do so, evenfor grant-application purposes. Similarly, the way scientific papers are writ-ten usually represents a kind of fiction in rearranging the order in whichideas occur and the work is done, to form a logical sequence that may havelittle basis in reality. Papers written in the 1800s are often more open andhonest (if that is the right word) in saying how ideas developed. In our paperswe tried to preserve some of that and even succeeded in inserting a few jokes,
705

706 EPILOGUE
if only to prove that the reviewers had occasional lapses of attention. Aboveall we tried to make our papers easy to read. With almost religious determi-nation we avoided abbreviations, with the sole exceptions of LGB and EPSP.That avoidance probably cost the publishers all of three extra lines at the endof some of our papers, but it must have saved our readers many minutes ofsearching back to find what the letters stood for. We tried to make our illus-trations easy to read by resisting the temptation to combine eighteen smallfigures into one large one, a custom perhaps started by Eccles and perpetu-ated by Eric Kandel. We tried to avoid figure-legends in which the a's, b'sand c's are buried in text instead of being separated by paragraphs, so that thepoor reader has to search for the tiny letters with a dissecting microscope. Wewere often unsuccessful because of the puzzling resistance of editors. All thiswas in attempts to make our papers less tiring and tiresome to read: we hopewe succeeded.
How do we find our field today, in comparison with its state when weset out on this adventure in 1958? We set out at a perfect time. Virtually noth-ing had been done with microelectrodes in the visual cortex—or in the cortexin general, except for Mountcastle's marvelous beginning in the somatosen-sory cortex. We had the necessary techniques—or we had the leisure todevelop them ourselves. A little earlier and we might have ended up study-ing impulses and synapses, or possibly the spinal cord, which was very popu-lar in the 1950s. In the visual cortex we had little competition for about tenyears, perhaps because it was generally felt that our type of work was tooarduous, or perhaps because it was assumed that you had to understand theretina perfectly before going more centrally. Something like that certainlyhappened in the auditory system, in which the research got hung up on theend organ, and the auditory cortex was, and still is, relatively neglected.
Today we have some concerns about the present state of our field. Oneunfortunate development is the fading of neuroanatomy. Our work, at leastmuch of it, involved a close coupling of physiology and neuroanatomy, andin the 1970s we were doing about as much of one as of the other. We certainlywere lucky in inheriting techniques like the Nauta method and autoradiog-raphy—or one might say we were good at ignoring those who said that onlythe experts should attempt them. Typically we used a monkey each week,often doing separate physiological and anatomical studies in the same mon-key. That allowed us to work out much of the structural and physiologicalrelationships that are so important in understanding the cortex. We werealso lucky in working at a time before the animal rights groups had made itso much harder to do research involving animals—harder in the sense ofexpenses and the hoops to be jumped through to get past all the layers of redtape that exist today. Monkeys are now many times more expensive, and thehoops are more numerous. To use monkeys today at the rate we used themin the 1970s and 1980s would be almost impossible.
We were lucky in having youth on our side. Today we certainly wouldnot have the stamina to stay up all night, even once a week. For all these rea-sons the field has turned increasingly to the use of awake-behaving chroni-cally implanted monkeys, in which one monkey can be recorded from for

Epilogue 707
months or years, and one can work for four hours each day and then go hometo dinner. The catch is that parallel anatomical studies are practically impos-sible because the brain becomes available only after many months, and hasbeen recorded from so many times that it resembles a pincushion.
A second, in some ways unfortunate, trend in visual-cortex physiologyis its increasing popularity, with hundreds of labs working in dozens of theknown visual cortical areas. So the competition is greater, by orders of mag-nitude. We do not fully understand why, in the realm of systems physiology,vision should have become so dominant, relative to other systems. To someextent it probably is a bandwagon effect: when a field becomes trendy, peo-ple stream in from all sides, as happened many years ago in the case of thebolo-bat and the hula hoop. When we started out, the most dynamic branchof sensory neurophysiology was somatosensory, thanks to Clinton Woolseyand especially Vernon Mountcastle. The switch over to vision, while hard toexplain, could have been related to the high information content of vision,relative to touch and joint position. If that is the reason, then it is hard to seewhy the central auditory path is so neglected.
A third problem represents to us an example of illnesses that scientificfields can be subject to. In neurophysiology this is the increasing popularityof theory, sometimes called computation. No one familiar with developmentsin physics in the past century or so could possibly deny the importance of the-ory in that branch of science. But it seems to us that the chances of theoryever assuming a comparable importance in biology (and in particular, neu-robiology) may be slim. One indeed has the impression that the main propo-nents of theory in neurophysiology may be scientists who have trained inmathematics and, having gone into biology, are reluctant to give up themathematics. I can understand that, having had some training in mathe-matics and once having expected to use it in neurophysiology. In the besthands (and one thinks of people such as David Marr, Horace Barlow,Werner Reichardt, Terry Sejnowski, Christof Koch and Francis Crick), ourfield has certainly benefited. But in the case of such subjects as "linear sys-tems analysis," the emphasis seems either puzzling or wrong. No one withmuch experience with cortical cells could think of them in any real sense aslinear. Our feelings concerning the use of sine-wave gratings, alreadyreferred to here and there in this book, always in a pejorative way, will comeas no surprise to readers who have put up with our dogmatism thus far.Another hot topic in recent years has been "multiplexing", the notion that acell's responses can reflect its involvement with a multitude of variables, andthat few if any cells are highly specialized. Visual scientists who are in anyway burdened with a familiarity with cells in the visual cortex of highermammals will be astonished at the idea that all cells carry information aboutall variables (such as orientation, movement direction, color, spatial fre-quency, and stereopsis). What has struck us from the very first was theincreasing degree of specialization of cells as one goes from level to level inthe central nervous system, and the specialization already apparent in mostcells in V-l. We have double-opponent cells with their color and center-surround selectivity and their lack of orientation selectivity; the sharp orien-

708 EPILOGUE
tation selectivity of most other cells in V-l (outside layer 4) along with theirfrequent movement-direction selectivity, but with an almost total lack ofconcern with color; cells that respond to black slits but not to white, or thereverse; or those that respond to both black and white; or those that respondto red slits, but neither black nor white. Multiplexing seems to imply a smallamount of specialization for many variables, with the sorting out presum-ably being left to later stages in the nervous system, if it occurs at all. The ideais ingenious but seems not to be used very much by the brain. Of course wehave many examples of a cell's encoding more than one variable: cellsinvolved with stereopsis seem always to be orientation selective; most V-lcolor-coded cells have center-surround fields, but to lack orientation selec-tivity. Most cells indeed seem to encode an assortment of variables, but a verylimited assortment. What we do not see is a small degree of specialization formany or all possible variables.
The field of molecular biology, which we regard as more successful asa science than our field, seems largely to have avoided being beset with com-putation. In The Molecular Biology of the Gene I look in vain for equations.No one has tried to fit a protein molecule to a Gabor function, as far as Iknow. One could be terribly wrong about such things, and it will be inter-esting to see how our field develops. I do sense that fields of science, like bio-logical organisms, can become sick, and I hope that does not happen to neu-rophysiology.
Why did we at last stop collaborating, around 1980? The prize came in1981, so that event must have been unrelated. Forces promoting our separa-tion had been present from an early time—even our staunchest supporter,Steve Kuffler, repeatedly and gently suggested we might be wise to split andeach take on postdoctoral collaborators and different projects. But always inthe end we had complete support from Steve to go on stubbornly workingtogether. As time went on, the main force towards separation was increasingpressure to do administration and teaching that we could not entirely avoid.I had had a dose of being a department head, and stood it for a year, givingup when it became clear that the installation of a pencil-sharpener in thephysiology department secretary's office required me to discuss the matterover coffee with each of the other tenure department members. In 1973 SteveKuffler, having been leader of our group since its inception at Johns Hopkinsand chairman since the neurobiology department's founding in 1966,decided to step down. A successor had to be found; I had learned my lesson,but Torsten was a sitting duck and too conscientious to refuse. While thedepartment was still young and small, the administration was relativelylight, but as it got bigger, with more faculty and graduate students, the drainon his time increased. It got so that our customary Tuesday experimentswere being done without prior planning and with little subsequent discus-sion. In the end we felt like two horses continuing to drag the same ploughover the same terrain year after year, with constant guilt feelings that wewere neglecting one or another committee or were getting behind in lettersof recommendation.

Epilogue 709
We are nevertheless grateful at having had so many years of uninter-rupted research. We were wise enough, perhaps, to avoid the usual trap oftaking on many dependent postdocs and graduate students, gradually lettingthem do more and more of the research we enjoyed, while we spent moreand more time at the desk writing papers, grant requests and letters of rec-ommendation, and losing our feel for the research. We did have small num-bers of postdocs and graduate students, but made them independent, givingadvice gently and rarely, as Steve had done with us. That way, we felt, we didnot deprive them of the main thing a beginning scientist needs to learn: to getone's own ideas and try them out. The strategy worked, for our trainees (ifthat is the right word!) have done well.
From 1980 to 1990 I collaborated with Margaret Livingstone, who hadbegun as a graduate student in our department, in a study of color and stere-opsis in V-2. We carried on a regular dialogue with Edwin Land, whomTorsten and I had gotten to know in the 1970s and 1980s. I greatly admiredhis inventiveness, and his death, in 1991, came as a severe blow.
I then collaborated with Stephen Macknik and Susana Martinez-Conde on a study of microsaccadic eye movements and the bursts of firingthey produce in cells in the primary visual cortex. Finally, with a fellowCanadian, Kevin Duffy, I have been looking at receptive fields in the striatecortex of dark-adapted monkeys.
Today I run a class for 12 freshman Harvard College undergraduates,with weekly discussions and a lab. In their first semester at college theirenthusiasm over starting college has not yet worn off, and these seminarshave been my best teaching experience in 45 years of university life. The pro-gram was founded years ago by Edwin Land, motivated by his disaffectionover having had so little contact with his professors when he was a student atHarvard.
We must end by saying words of thanks to the society that supportedus. We were most fortunate that the National Institutes of Health existedand that the Eye Institute came into being at just about the time we started.And especially that the members of the NIH Eye Institute were so support-ive and such a pleasure to work with. The other piece of luck was everythingabout the university system of the United States, especially the relative free-dom from domination by department heads, particularly in handling one'sfinances; the freedom to move to some other place if not satisfied, and per-haps above all the wonderful enthusiasm and overall quality of the students.These are all things that explain the success of biological research in thiscountry, and to a large extent explain its lack of success in other countries,even wealthy ones. We have, and do, complain loudly about many problemsthis country has had and still has—the swings in politics such as theMcCarthy and Nixon eras, Vietnam, and prevailing attitudes to the KyotoAccord, the World Court, Iraq, the gun lobby, and so on. But about thehandsome way our research and our fellow biologists' research has been sup-ported we have only gratitude.

This page intentionally left blank

LIST OF PAPERS INCLUDED
Normal Physiology and Anatomy
1. Hubel DH and Wiesel TN (1959) Receptive fields of singleneurones in the cat's striate cortex. J Physiol 148:574—591.
2. Hubel DH and Wiesel TN (1960) Receptive Fields of OpticNerve Fibres in the Spider Monkey. / Physiol 154:572-580.
3. Hubel DH and Wiesel TN (1961) Integrative action in thecat's lateral geniculate body. J Physiol 155:385-398.
4. Hubel DH and Wiesel TN (1962) Receptive fields, binocularinteraction and functional architecture in the cat's visualcortex.} Physiol 160:106-154.
5. Hubel DH and Wiesel TN (1965) Receptive fields and func-tional architecture in two nonstriate visual areas (18 and 19)of the cat./ Neurophysiol 28:229-289.
6. Wiesel TN and Hubel DH (1966) Spatial and chromaticinteractions in the lateral geniculate body of the Rhesusmonkey. / Neurophysiol 29:1115-1156.
7. Hubel DH and Wiesel TN (1967) Cortical and callosal con-nections concerned with the vertical meridian of visualfields in the cat./Neurophysiol 30:1561-1573.
8. Hubel DH and Wiesel TN (1968) Receptive fields and func-tional architecture of monkey striate cortex. / Physiol195:215-243.
9. Hubel DH and Wiesel TN (1969) Visual area of the lateralsuprasylvian gyrus (Clare-Bishop area) of the cat. / Physiol202:251-260.
10. Hubel DH and Wiesel TN (1970) Cells sensitive to binocu-lar depth in area 18 of the macaque monkey cortex. Nature225:41-42.
11. Hubel DH and Wiesel TN (1972) Laminar and columnardistribution of geniculo-cortical fibers in the macaque mon-key./ Comp Neural 146:421-450.
12. Wiesel TN, Hubel DH, and Lam D. (1974) Autoradio-graphic demonstration of ocular-dominance columns in themonkey striate cortex by means of transneuronal transport.Brain Res 79:273-279.
13. Hubel DH and Wiesel TN (19742) Sequence regularity andgeometry or orientation columns in the monkey striate cor-tex. / Comp Neurol 158:267-293.
14. Hubel DH and Wiesel TN (1974b) Of monkey striate cor-tex: a parallel relationship between field size, scatter, andmagnification factor./ Comp Neurol 158:295-306.
Deprivation and Development
15. Wiesel TN and Hubel DH (1963) Effects of visual depriva-
tion on morphology and physiology of cells in the cat's lat-eral geniculate body./Neurophysiol 26:978-993.
16. Hubel DH and Wiesel TN (1963) Receptive fields of cells instriate cortex of very young, visually inexperienced kittens./ Neurophysiol 26:994-1002.
17. Wiesel TN and Hubel DH (1963) Single-cell responses instriate cortex of kittens deprived of vision in one eye. J Neu-rophysiol 26:1003-1017.
18. Wiesel TN and Hubel DH (1965) Comparison of the effectsof unilateral and bilateral eye closure on cortical unitresponses in kittens./Neurophysiol 28:1029-1040.
19. Hubel DH and Wiesel TN (1965) Binocular interaction instriate cortex of kittens reared with artificial squint. J Neu-rophysiol 28:1041-1059.
20. Wiesel TN and Hubel DH (1965) Extent of recovery fromthe effects of visual deprivation in kittens. /. Neurophysiol28:1060-1072.
21. Hubel DH and Wiesel TN (1970) The period of susceptibil-ity to the physiological effects of unilateral eye closure in kit-tens./ Physiol 206:419-436.
22. Hubel DH and Wiesel TN (1971) Aberrant visual projec-tions in the Siamese cut. J Physiol 218:33—62.
23. Wiesel TN and Hubel DH (1974) Ordered arrangement oforientation columns in monkeys lacking visual experience.J Comp Neurol 158:307-318.
24. Hubel DH, Wiesel TN, and LeVay S (1977) Plasticity ofocular dominance columns in monkey striate cortex. PhilTrans R Soc LandB 278:377-409.(?)
25. LeVay S, Wiesel TN, and Hubel DH (1980) The develop-ment of ocular dominance columns in normal and visuallydeprived monkeys. J Comp Neurol 191:1—51.
Three Reviews
26. Hubel DH and Wiesel TN (1977) Functional architecture ofmacaque monkey visual cortex. Proc R Soc Land B 198:1—59,Ferrier Lecture.
27. Hubel, D.H. (1982) Evolution of Ideas on the PrimaryVisual Cortex, 1955-1978. A Biased Historical Account. In:Les Prix Nobel en 1981, pp. 221-256.(x).
28. Wiesel, Torsten N. The Postnatal Development of theVisual Cortex and the Influence of Environment. In: LesPnx Nobel en 1981, pp. 261-283. (x)
711

This page intentionally left blank

GLOSSARY
ABSTRACT Short summary of a paper or poster to be presented at a scientific meeting, usually published in advanceof the meeting. Usually only one or several paragraphs in length.
ADRIAN, LORD (E. D.) (1889-1977) Neurophysiologist at Trinity College, Cambridge, England, famous for workin the central nervous system, especially cortical encephalography, sleep mechanisms, vision, and motor system. Nobelprize [1932], shared with C. S. Sherrington "for their discoveries regarding the functions of neurons".
ADVANCER, MICROELECTRODE The apparatus that moves a microelectrode forward through the brain orother tissue in small controlled steps, by means of a piston-cylinder arrangement, a stepping motor, or a screw.
AFFERENT Of nerve fibers, input, etc., carrying impulses to a structure (cf. efferent}.
ANESTHESIA In the animal experiments described here, the anesthetics most used were barbiturates, either Pen-tothal (sodium thiopental) or Nembutal (sodium pentobarbital), administered in intermittent intramuscular injectionsor by continuous intravenous injection. Towards the end of the 1970s we began to use inhalation anesthetics, especiallyhalothane.
ARTERIOVENOUS SHUNT Abnormality in which an artery is directly connected to a vein, bypassing a capillarybed. Can occur as a congenital abnormality, in certain tumors, or as a result of surgical joining of an artery to a vein forhemodialysis.
AUTORADIOGRAPHY See p. 317 for description.
BARLOW, HORACE (born 1921). Neurophysiologist and psychophysicist, noted for studies of frog retinal ganglioncell physiology (originated the idea of "trigger features"); studies of dark adaptation and spontaneous firing of retinalganglion cells in cats (with Stephen Kuffler); responses to movement in rabbit retinal ganglion cells; responses of catcortical cells to binocular (stereoscopic) cues; and for psychophysical studies in vision.BAUMGARTNER, GUNTER (1924-1991) Neurologist and neurophysiologist. Collaborated with Richard Jung inearly recordings from visual cortex. Later head of neurology in Zurich.
BEKESY [1899-1972] Auditory neurophysiologist, noted for work on hair cells. Nobel prize physiology or medicine,1961.
BLAKEMORE, COLIN (born 1944) Professor of Physiology, Oxford University. Research in visual neurophysiologyincludes visual cortex, especially binocular depth mechanisms, studies of postnatal development, and many psy-chophysical topics. Main research has been in cats and monkeys.
BLASDEL, GARY (born 1949) Neurophysiologist, best known for studies of neuroanatomy and neurophysiology ofmammalian visual system, and for developing optical methods for surface mapping of cerebral cortex, especially stri-ate cortex of macaque monkeys, using voltage-sensitive dyes.
BLOBS A term causing some annoyance to colleagues in neuroanatomy and neurophysiology, referring to groups ofcells in visual cortex (V-l) of primates and perhaps cats, visible on tangential and transverse sections stained for theenzyme cytochrome oxidase (and other enzymatic stains). In macaques they are centered on ocular dominancecolumns, about Vz mm apart and about 0.2 mm in diameter. First noted in cross-sections by Margaret Wong Riley.
713

714 GLOSSARY
Shown by Jonathan Horton, Margaret Livingstone and Hubel to contain center-surround cells (lacking orientationselectivity), frequently double-opponent. Also called dots, puffs, spots, etc.BOWDITCH, HENRY P. First chairman of physiology, Harvard Medical School, from 1883 to 1893.
CANNON, WALTER B. (1871-1945) Celebrated for work in general physiology, especially regulatory mechanismsand homeostasis. Second chairman of physiology at Harvard Medical School.
CHIASM, OPTIC Site of crossing of optic nerve fibers in mammals. On arriving at the chiasm, somewhat more thanhalf (in primates) of the fibers from each eye cross and proceed to the lateral geniculate body on the other (contralat-eral) side; the rest stay on the same (ipsilateral) side. The fibers that cross are those that come from the nasal (inner) halfof each retina, corresponding to the temporal halves of the visual fields.
COLOR CONSTANCY The stability of the color (or hue) of an object despite variations in the spectral content of thelight source. The neural circuits responsible for this are not clear, but our guess is that double-opponent cells areinvolved.COLUMN Term coined by Vernon Mountcastle, who was the first to describe cortical columns in the somatosensorycortex. It refers to a group of cells extending from the cortical surface to the white matter, more or less cylindrical, witha cross-sectional area of up to several square millimeters. In the primary visual cortex, columns are of two types, sub-serving ocular dominance and orientation (the system of blobs might also be considered columnar), and they take theform of sheets rather than pillars, as the term column might seem to suggest.COMPOUND ACTION POTENTIAL Response recorded from a whole nerve containing many fibers, initiatedusually by electrical stimulation, and usually seen as a deflection or set of deflections on an oscilloscope. The shape ofthe response is determined by the shapes of the impulse deflections of the individual nerve fibers, and by the conduc-tion velocities of the fibers that make up the nerve.
CONWAY, BEVIL (born 1974) Postdoctoral fellow, neurobiology, Harvard Medical School from 2003. First to con-firm the presence of cortical double-opponent cells in macaque cortex through the combined use of cone-isolation tech-niques and reverse-correlation receptive-field mapping.
CORPUS CALLOSUM Large band of myelinated fibers crossing from one cerebral hemisphere to the other. Anexample of a commissure (the anterior commissure and posterior commissure being two others).
DAW, NIGEL W. (born 1933) Postdoctoral student in our lab with Alan Pearlman (1967-1969). The first to describedouble-opponent cells, in retinas of goldfish.DILATION AND CURETTAGE Procedure in gynecology consisting of dilating the cervix and scraping the innerwall of the uterus, for treating incomplete miscarriage or bleeding.
DOUBLE-OPPONENT CELLS Cells with opponent center-surround receptive fields in which centers are fed bytwo sets of opponent cones and the surrounds by two sets. For example, a cell's receptive field center might receive exci-tation from long wavelength cones, and inhibition from middle wavelength cones, and its surround receive excitationfrom middle wavelength cones and inhibition from long wavelength cones. First described in goldfish retina by NigelDaw (1968), and subsequently observed in striate cortex of macaques by Hubel and Wiesel (1968) and shown to be pres-ent in blobs by Margaret Livingstone and Hubel (1984). Double-opponent cells were studied with cone isolating stim-uli by Conway (2001).
ECCENTRICITY Distance, usually expressed in degrees, between some retinal point and the fovea.
ECCLES, SIR JOHN CAREW (1903-1997) Neurophysiologist, Australian, Rhodes Scholar from Melbourne,worked with Sherrington in England, then moved to Sydney Australia, then to Otago University in New Zealand(1944-1951). He returned to Australia in 1952 (the National University, Canberra, where he remained until 1966, whenhe came to the United States of America (Chicago and Buffalo). He worked on synaptic mechanisms, especially in thespinal cord of cats, where he established the importance of inhibitory synaptic transmission (and originated the termsEPSP and IPSP). In the cerebellum, he worked out the main circuit and its physiology. Nobel prize in Medicine orPhysiology, 1963, shared with Alan Hodgkin and Andrew Huxley.
EEG (ELECTROENCEPHALOGRAM) Record of cortical slow waves made by gross (1 mm or larger) electrodesplaced on scalp. Used in research and clinical diagnosis.
EFFERENT Of nerve fibers, carrying impulses away from a structure (cf. afferent).
ELECTROCORTICOGRAM. (ECG). Record of cortical slow waves made by gross (1 mm or larger) electrodesplaced on cortical surface. Used clinically and in research.

Glossary 715
ELECTRODE (see also microelectrode). For recording neural activity: usually a metal wire placed in or on the tissuebeing studied. Also used to stimulate neural structures by injecting current, or to destroy (coagulate) neural tissue inorder to identify recording sites, to trace pathways by observing the course of degenerating fibers, or to study the effects(behavioral or physiological) of the destruction.ELECTROLYTIC LESION Means of destroying neurological tissue by passing electric current through an elec-trode. Small electrolytic lesions can be used to identify microelectrode recording sites in the brain on histological exam-ination, or to produce degeneration of axons for tracing pathways.
EPSP: EXCITATORY POST-SYNAPTIC POTENTIAL Transient change in membrane potential, usually depo-larizing, in response to an impulse or impulses arriving over an excitatory presynaptic fiber or fibers.
EXCITATION In neurophysiology, a process leading to impulse generation, or increase in frequency of impulses, ora depolarization of the membrane of a nerve cell—and consequent increase in the release of transmitter by the cell.
EXTRACELLULAR RECORDING The recording of electrical activity of a cell, usually a nerve cell, in which theelectrode remains in close proximity to, but outside the cell. Often used to record action potentials, with signals that aregenerally many times smaller than those recorded intracellularly. The most commonly used electrodes are metallic,because of their low impedance.FIXATION, VISUAL The act of positioning the eyes so that a visual target is made to fall on the fovea.FOVEA Usually defined as a region of retina subtending about 1 degree of visual field, where acuity is highest, androds are absent.
FOWLER, H.G. Author of Modern English Usage (Oxford, 1926).FUORTES, M.G.F. Italian, worked mainly at Walter Reed Army Institute of Research, Washington, D.C., collabo-rated with Karl Frank on mammalian spinal cord, and worked independently on mammalian vision.
GALAMBOS, ROBERT (born 1914) Auditory neurophysiologist, worked at Harvard on sonar system in bats. Thenat Walter Reed Army Institute of Research, in the 1950s and 1960s, and later at Madison, Wisconsin, studied responsesof cochlear nuclei and other brain stem nuclei, in cats.GOLGI METHOD OR STAIN Methods of staining nervous tissue, in which a very small number of nerve cells (orglia cells) are stained, often in their entirety.
GRANDMOTHER CELL Jocular term conveying the idea of a single cell that fires impulses only in response to one'sgrandmother, presumably the sight of her, the recollection of her, or the idea of her.GRANIT, RAGNAR (1900-1991) Swedish neurophysiologist known for research on mammalian visual system andcerebellum. Nobel prize, in medicine or physiology 1967.GRAY MATTER Regions of brain and spinal cord that contain nerve cell bodies, together with their axons, dendrites,and synapses. "Gray" refers to the appearance of freshly cut sections.GUILLERY, RAYNOR (born 1929) Madison, Wisconsin, and Oxford, England. Neuroanatomist, contributedmainly to mammalian visual system anatomy, especially lateral geniculate body and cortex.HEBB, DONALD (1904-1985) Canadian Psychologist, born in Nova Scotia, head of Psychology Dept, McGill Uni-versity, noted especially for proposing a synaptic mechanism for learning, in what became known as the Hebb Synapse.
HEMIPARESIS Weakness of face, arm, and leg on one side, generally caused by damage to the motor cortex or thefiber tracts descending from cortex to spinal cord. It is associated with brisk deep tendon reflexes and increased mus-cle tone on the side contralateral to a brain lesion.HODGKIN, ALAN (1914-1998) Neurophysiologist best known for his work, with Andrew Huxley, on the ionicbasis of the nerve impulse, for which they shared the Nobel prize in 1963 with Sir John Eccles. Worked in Cambridge,England.
HUDSPETH, JAMES ALBERT Graduate student at Harvard Medical School with Wiesel and Hubel, 1967-1973.Noted for his work on auditory hair cells.HUXLEY, SIR ANDREW (born 1917) Neurophysiologist best known for his work, with Alan Hodgkin, on the ionicbasis of the nerve impulse, for which they shared the Nobel prize in 1963 with Sir John Eccles.
IMPULSE (NERVE) Term signifying an all-or-nothing propagated event, the main means by which most nerve cellscommunicate. Consists of a reversal of the potential between the inside and outside of the nerve cell that lasts about

716 GLOSSARY
1 millisecond and is propagated along the fiber at rates up to many meters/second. When an impulse reaches the ter-minals of the nerve fiber, it generally causes the release of a neurotransmitter and subsequent depolarization, hyperpo-larization, or lowering of the impedance, of the postsynaptic membrane.INHIBITION In neurophysiology, suppression of impulse activity of a neurone, or lessening of the neurotransmitterthat the neurone releases. Usually associated with hyperpolarization, or a lowering of membrane impedance, either ofwhich will tend to counteract any excitatory influences.INTEGRATION Term used by Sherrington. In this book we use it to refer to the summing up, by a single cell, of allits excitatory and inhibitory inputs.
INTRACELLULAR RECORDING Electrical recording from a nerve or muscle cell, of resting potentials, impulses,or excitatory or inhibitory synaptic events; made by inserting a microelectrode (usually a micropipette filled with a con-ducting solution—KC1, NaCl, etc.) through the cell membrane into the cytoplasm.
IPSP Inhibitory post-synaptic potential. Transient change, usually hyperpolarization, in membrane potential inresponse to an impulse arriving in an inhibitory presynaptic fiber.
JASPER, HERBERT H. (1906-1999) Neurophysiologist, contributed to developing the electroencephalogram (EEC)as a diagnostic tool in neurology. Close collaborator of the neurosurgeon Wilder Penfield. Worked at the MontrealNeurological Institute 1938-65, and the University of Montreal (1965-1999).JOHNS HOPKINS HOSPITAL Baltimore, Maryland. Opened in 1889, situated close to Johns Hopkins MedicalSchool (founded 1893), and associated with Johns Hopkins University.
JOURNAL OF PHYSIOLOGY Founded 1878 by the Physiological Society, London. The first journal devotedentirely to physiology. A leading journal publishing research articles in all areas of physiology, with headquarters inCambridge, England.JUNG, RICHARD (1911—1986) Neurologist and neurophysiologist, head of neurology in Freiberg, Germany; one ofthe first to record single cells from the cortex in cats. Many of Germany's leading post-World War II neurophysiolo-gists trace their research ancestry to Jung.
KANDEL, ERIC R (born 1929) Neurobiologist. Contributed to the synaptic basis of learning. Nobel Prize for Med-icine or Physiology, with Paul Greengard, "for their discoveries concerning signal transduction in the nervous system".KATZ, SIR BERNARD (1911-2003) Neurophysiologist best known for his work, with Sir John Eccles and StephenKuffler, on synaptic transmission. Was the first to describe, with Ricardo Miledi, quantal mechanisms of synapticrelease. Worked in Sydney, Australia, and at University College, London. Nobel prize in 1970, shared with Ulf VonEuler and Julius Axelrod, "for their discoveries concerning the humoral transmitters in the nerve terminals and themechanism of their storage, release and inactivation."KUFFLER, STEPHEN (1913-1980) Neurophysiologist with an immense range that included synaptic transmission,mammalian vision, spinal cord in cats, studies of glia, and chemical synaptic modulators. Born in Austria-Hungary, heworked in Sydney, Australia (1940-1945, with Katz and Eccles), Chicago (1945-1947), the Wilmer Institute of Oph-thalmology at Johns Hopkins Hospital in Baltimore (1947—1959), and at Harvard Medical School in Boston, where hefounded the Department of Neurobiology in 1966 and was chairman from 1966 to 1973.LATERAL GENICULATE NUCLEUS Peanut-size collection of cells that forms part of the thalamus. Receives itsmain input from the optic tract, and hence from retinal ganglion cells. Like other thalamic nuclei, it sends its axons tothe cerebral cortex and receives projections back from the cortex. In primates it projects to the primary visual (striate)cortex.
LESION In the context of neurology, the destruction of neural tissue—a fiber pathway or part or all of a group of cells.In research, the purpose of producing a lesion can be to study the effects of destruction by using physiological or behav-ioral techniques, or to trace neuronal pathways by staining the degenerating fibers or terminals, or to determine theposition of an electrode tip.
LETTVIN, JEROME Y. Neurophysiologist, at MIT. Noted especially for work with Humberto Maturana on opticnerve fibers of the frog, and among the first to describe their complex response properties.
LIVINGSTONE, MARGARET (born 1950) Graduate student in laboratory of Edward Kravitz, Harvard MedicalSchool. Now Professor of Neurobiology, Harvard Medical School. Noted for research on lobster nervous system, stud-ies of neurochemistry of the brain of drosophila (fruit fly), and monkey visual neurophysiology. Collaborated withHubel (1980 to 2000).

Glossary 717
LUND, JENNIFER Neuroanatomist, noted for studies of the visual cortex, especially striate cortex, of monkeys. Theleading authority on visual cortex anatomy studied by the Golgi method.MAGNIFICATION Relation between distance along a structure such as the visual cortex and distance in the visualfield, usually expressed as millimeters/degree. In the cortex, it varies as a function of eccentricity, being maximal in thefovea and falling off with eccentricity.MAGNOCELLULAR LAYERS In macaque and human lateral geniculate bodies, the two ventral (lower) large-celllayers, separated from each other and from the dorsal layers by interlaminar leaflets. Cells have center-surround recep-tive fields, mainly type 4 (see pp. 215-216).
MARSHALL, WADE Head of neurophysiology at NIH in Bethesda, Maryland, in the 1950s. Known for work onvision (with Samuel Talbot) and for his studies of spreading depression.
MATURANA, HUMBERTO Neurophysiologist, at MIT in the 1950s and. Noted especially for work with JeromeY. Lettvin on optic nerve fibers and the tectum of the frog, and among the first to describe their complex response prop-erties.
MICROELECTRODE In neurophysiology, usually a micropipette filled with a conducting solution (KC1, NaCl,etc.), or a wire tapered to a fine tip and coated with insulating material such as glass or a lacquer. Used to record elec-trical activity, from outside a cell or small group of cells (extracellular recording), or from inside a single cell (intracel-lular recording).MODULE see pp. 364-365.
MONTREAL GENERAL HOSPITAL One of the two leading English hospitals in Montreal.
MONTREAL NEUROLOGICAL INSTITUTE Institute devoted to neurology, neurosurgery, and neurologicalresearch, associated with the Royal Victoria Hospital and McGill University, founded by the Rockefeller Institute in1934.
MOUNTCASTLE, VERNON (born 1918) Pioneer in recording from a variety of brain structures in cats and mon-keys. Worked at Johns Hopkins Medical School. Best known for studies of somatosensory cortex, and for his discov-ery of cortical columns in 1957.
MT (Middle temporal) A visual area in occipital lobes of monkeys, first described in New World monkeys, calledV-5 in macaques by Zeki, probably homologous with the Clare-Bishop area (PMLS) of cats. The cells have large recep-tive fields and show striking direction selectivity to movement.
MYELIN Wrapping, like a jelly-roll, of nerve axons by many layers of lipid-containing glial membranes that serve toincrease resistance and lower capacitance between outside and inside of an axon, resulting in increased speed of con-duction.
NATIONAL EYE INSTITUTE (NEI) One of the institutes of the National Institutes of Health centered inBethesda, Maryland. The NEI was founded in 1968. Like other institutes of the NIH, it supports research through anintramural component, located in Bethesda, and an extramural program that awards grants to individual investigatorsor groups, mainly at universities in the United States of America.
NAUTA, WALLE J. H. (1916-1994) Neuroanatomist, who introduced a new era by developing methods for tracingneural pathways by making lesions and staining the degenerating fibers with silver stains.NEUROPHYSIOLOGY The study of the function of the nervous system, in contradistinction to neuroanatomy (thestudy of the morphology of the nervous system) and neurochemistry (the study of its chemistry). It is a branch of phys-iology (which also includes studies of the function of cells, or organs such as heart, kidney and so on) or, depending onhow one cuts the cake, a branch of neurobiology, which includes neuroanatomy and neurochemistry. The term elec-trophysiology implies a type of neurophysiology in which the tools are electrical stimulators and recording devices.
NISSL SUBSTANCE Basophilic organelles contained in cytoplasm of neuronal cell bodies and dendrites. Stained bycresyl violet, methylene blue, and toluidine blue.
OFF-RESPONSE In vision, an increase in impulse rate produced when light is turned off or made dimmer. Whenan off-response occurs, one often sees a suppression of impulse activity (or a hyperpolarization of the cell membrane)during the time the light was on. Thus an off-response is often an indication of an inhibitory process.
OLFACTORY BULB A collection of cells at the base of the brain that receives input from olfactory receptors in thenose, which mediate the sense of smell.
ON-RESPONSE In vision, an increase in impulse rate produced when light is turned on or made brighter.

718 GLOSSARY
OPHTHALMOSCOPE Instrument for viewing the retina. Direct ophthalmoscope (the common type) consists of alight to illuminate the retina and a set of lenses to bring the retina to a focus in the eye of the viewer. Used in clinicalexaminations (the retina being the only part of the central nervous system visible from the outside), and in our experi-ments for fitting contact lenses to the animal, in order to bring the projection screen to a focus, and to determine thepositions of the optic disc and fovea by training a light spot on them, locking the position of the instrument and pro-jecting a second small spot back onto the projection screen.
OPTIC DISC Region of vertebrate retina where the optic nerve originates. In cats, macaque monkeys, and humans,it is located just below the horizontal meridian about 18 degrees medial, on the retina, to the fovea.
PARVOCELLULAR LAYERS In macaque and human lateral geniculate bodies, the four dorsal (upper) small-celllayers, separated by interlaminar leaflets. Most cells have center-surround receptive fields, mostly color coded (type 1),but some are broad-band (type 3). Some have receptive fields with two overlapping opponent-color components (type2).PENFIELD, WILDER (1891-1976) Neurosurgeon, director of Montreal Neurological Institute from the time of itsfounding (1934) until his retirement (1960). Important in developing neurosurgical approaches to treatment of epilepsy,and for his contributions to the mapping of the human cerebral cortex.PIGMENT EPITHELIUM Layer of cells containing the dark pigment, melanin, lying just behind the retinal pho-toreceptors. It serves to mop up the light that has passed by the receptors, and is the site of reconstitution of the visualpurple that has been bleached by light. The pigment is lacking in albinos and Siamese cats.
PREPOTENTIAL See pp. 92, 96-98 for our use of this term.
PRIMARY VISUAL CORTEX See visual cortex. Also called striate cortex and V-l.
QUEEN SQUARE Nickname for Institute of Neurology of University College, London. A leading hospital and cen-ter for neurology in England.
RAKIC, PASCO (born 1933) Neurobiologist noted for emphasizing the importance of Bergmann glial fibers in deter-mining growth pathways of neurones in the cerebral cortex, and for his studies of prenatal development of ocular dom-inance columns in monkeys.
RAMON Y CAJAL (1852-1934) Spanish, the most eminent of neuroanatomists, who used mainly the Golgi methodto establish the neurone doctrine (that neurones are separate entities and do not form a syncytium), and to describe thewealth of neuronal cell types and interconnections in a variety of species, especially mammals. His most famous workwas the Histologie du Systeme Nerveux, in two volumes, translated into French from the original Spanish. Nobel Prize(1906), shared with Camillo Golgi "in recognition of their work on the structure of the nervous system".RECEPTIVE FIELD The area of a sensory surface from which sensory receptors converge on a single nerve cell,directly or by way of intermediate nerves. The cell may be any neuron in the central nervous system that is connectedto the receptors, perhaps over many synapses. A receptive field is thus defined in terms of a sensory surface (skin, retinaetc.), and in terms of a single cell in the nervous system. In the case of vision, it consists of the population of rods andcones, and consequently the area on the retina that connects to any given cell in the retina or to some more centralstructure, such as the lateral geniculate body or the visual cortex. The term can also be defined physiologically, as theregion of retina (or visual field) over which a cell can be influenced by visual stimuli. Given the richness of intercon-nections in the central nervous system, the extent of a cell's receptive field may be hard to define precisely, and willoften depend on the stimuli employed. (The term was first used for somatic sensation by Sherrington, and for visionby Hartline.)
RECEPTOR Used in neurophysiology in two entirely different ways. (1) The term can refer to a cell or part of a cellthat reacts to sensory information, such as light, mechanical deformation, or a chemical. Examples are rods and conesof the retina; skin mechanoreceptors or hair cells of the inner ear; and olfactory receptors in the nose. (2) The term isalso used to refer to a protein molecule contained in the membrane of a cell, which reacts to specific chemicals in theextracellular fluid, such as neurotransmitters.
RESPIRATOR An "iron lung" used to provide artificial respiration to animals during physiological experiments andto humans whose respiration is paralyzed. In many of the experiments described in this book, animals received sys-temic curare-like drug injections to paralyze the eye muscles, and artificial respiration had to be used because thediaphragm and intercostals muscles were paralyzed along with most other voluntary muscles.
RETINA Neural apparatus in the eye, responsible for converting light into electrical signals. It is located on the insideof the eyeball, covering its posterior half, about % mm thick, and consists of three layers of cell bodies separated by two

Glossary 719
layers of axons and dendrites and synapses. The outermost layer, closest to the sclera, consists of the light-sensitivereceptors, the rods and cones. The retina is, strictly speaking, part of the central nervous system.RETINAL GANGLION CELLS Cells lodged in the innermost layer of the retina, which receive their input fromrods and cones with one or more cell types intervening, and which send their axons to the brain. There are about onemillion in each eye, in humans and monkeys. In the brain, they end in the lateral geniculate nucleus of the thalamus,the superior colliculus (optic tectum), and several other small nuclei in the brainstem.
RUSHTON, WILLIAM (1901-1980) Trinity College, Cambridge. Known for his work on the nerve impulse, andfor contributions to visual psychophysics, especially dark adaptation and color vision. Originated the terms dar/( lightand chlorolabe, erythrolabe, and cyanolabe for the three cone pigments whose spectral sensitivities he was the first todetermine.
SALK INSTITUTE Biomedical laboratories located in La Jolla, California, founded in 1963 by Jonas Salk, whodeveloped the first vaccine against the polio virus in 1955.
SHATZ, CARLA J. (born 1947) Graduate student with us from 1971 to 1976, noted especially for her work on theneurodevelopment of the mammalian visual system. Chairperson of the neurobiology department at Harvard MedicalSchool, 2000 to present.
SHERRINGTON, SIR CHARLES SCOTT (1857-1952) Neurophysiologist who worked at the Universities of Lon-don, Liverpool, and Oxford. Most famous for studies of spinal reflexes and sensory and motor systems. Author of Inte-grative Action of the Nervous System (1906) and Reflex Activity of the Spinal Cord (1932). Originator of the terms neu-ron, synapse and receptive field (in the context of the skin surface from which a single sensory nerve fiber could beinfluenced). Nobel prize (1932), shared with E. D. Adrian "for their discoveries regarding the functions of neurons".
SINEWAVE GRATING Parallel stripes whose intensities vary as a sinusoidal function of distance perpendicular tothe orientation of the stripes. When used as a visual stimulus, the stripes are often moving. Frequency of firing mayvary with phase of stripes and as a function of their spatial frequency.
SOCIETY FOR NEUROSCIENCE Founded in [1970] with a membership now (2003) numbering over 25,000, withmembership not confined to the United States of America. Annual meetings, usually in November, are held in the fewAmerican or Canadian cities with facilities large enough to accommodate the members who wish to attend.
SOMATOSENSORY CORTEX Part of the cerebral cortex devoted to somatic sensation, especially touch and jointposition. Located in the parietal lobes of primates.
SPIKE Term loosely used in neurophysiology to refer to the record of an impulse or action potential.STEREOPSIS The process of combining the slightly different images in the two eyes to achieve depth perception.
STEREOTAXIC APPARATUS (also called Horsley-Clarke apparatus) A means of locating any part of the brain (forelectrode placement, for example), using a Cartesian coordinate system in which (0, 0, 0) is usually arbitrarily chosen tobe 10 mm above a plane passing through the inferior orbital margins and the two bony external ear canals. Stereotaxicatlases have been prepared for brains of many species, such as cats, mice, and macaque monkeys, usually with one pagedevoted to a given plane, such as the frontal, sagittal, or horizontal planes.STRABISMUS; SQUINT As used here, the terms are synonymous. Faulty alignment of the two eyes, frequently,resulting in double vision or suppression of vision and possibly blindness in one eye. Termed divergent, when the twoeyes look outwards, convergent, when they look inwards. May be congenital, or acquired through injury to an eye mus-cle or nerve supplying it.STRIATE CORTEX See visual cortex. Also called V-l, area 17, and primary visual cortex.
STRUNK, WILLIAM, AND WHITE, E. B. Authors of The Elements of Style (New York: Macmillan Co., 1959).
SUPERIOR CERVICAL GANGLION Groups of cells in the cervical (neck) region of mammals, serving autonomicfunctions.
SYNAPSE Junction between two neurones, comprising a presynaptic portion from which neurotransmitter isreleased (in the case of a chemical synapse), and a postsynaptic portion with receptors that react to the transmitter in away that leads to excitation or inhibition of the postsynaptic cell. Any given synapse is either excitatory or inhibitory,depending on the neurotransmitter and the postsynaptic receptors. An electrical synapse is one in which the currentsassociated with the presynaptic ending are sufficient to influence the postsynaptic cell.TALBOT, SAMUEL Neurophysiologist at Johns Hopkins Medical School. Worked in vision, with Kuffler and WadeMarshall.


![From Photons to Faces: An Overview of the Primate Visual ...€¦ · Fields (first step in stimulus generalization) ... [Talbot & Marshall; Hubel and Wiesel] •By the 70’s a multiplicity](https://static.fdocuments.net/doc/165x107/605adb020f78ea61344a73d4/from-photons-to-faces-an-overview-of-the-primate-visual-fields-first-step.jpg)