Bradesco - 2nd Annual Brazil Investment Forum Presentation... · Bradesco - 2nd Annual Brazil...
48
FIBRIA APP WITH THIS PRESENTATION IS AVAILABLE FOR DOWNLOAD AT APPLE STORE AND GOOGLE PLAY. Bradesco - 2nd Annual Brazil Investment Forum April, 2015
Transcript of Bradesco - 2nd Annual Brazil Investment Forum Presentation... · Bradesco - 2nd Annual Brazil...
FIBRIA APP WITH THIS PRESENTATION IS AVAILABLE FOR DOWNLOAD AT APPLE STORE AND GOOGLE PLAY.
Bradesco - 2nd Annual Brazil Investment ForumApril, 2015
2
The information contained in this presentation may include statements whichconstitute forward-looking statements, within the meaning of Section 27A of the U.S.Securities Act of 1933, as amended, and Section 21E of the U.S. Securities ExchangeAct of 1934, as amended. Such forward-looking statements involve a certain degree ofrisk and uncertainty with respect to business, financial, trend, strategy and otherforecasts, and are based on assumptions, data or methods that, although consideredreasonable by the company at the time, may turn out to be incorrect or imprecise, ormay not be possible to realize. The company gives no assurance that expectationsdisclosed in this presentation will be confirmed. Prospective investors are cautionedthat any such forward-looking statements are not guarantees of future performanceand involve risks and uncertainties, and that actual results may differ materially fromthose in the forward-looking statements, due to a variety of factors, including, but notlimited to, the risks of international business and other risks referred to in thecompany’s filings with the CVM and SEC. The company does not undertake, andspecifically disclaims any obligation to update any forward-looking statements, whichspeak only for the date on which they are made.
Disclaimer
3
Company Overview1Pulp and Paper Market2Financial and Operational Highlights3
Agenda
Final Remarks4

4
Company Overview
5
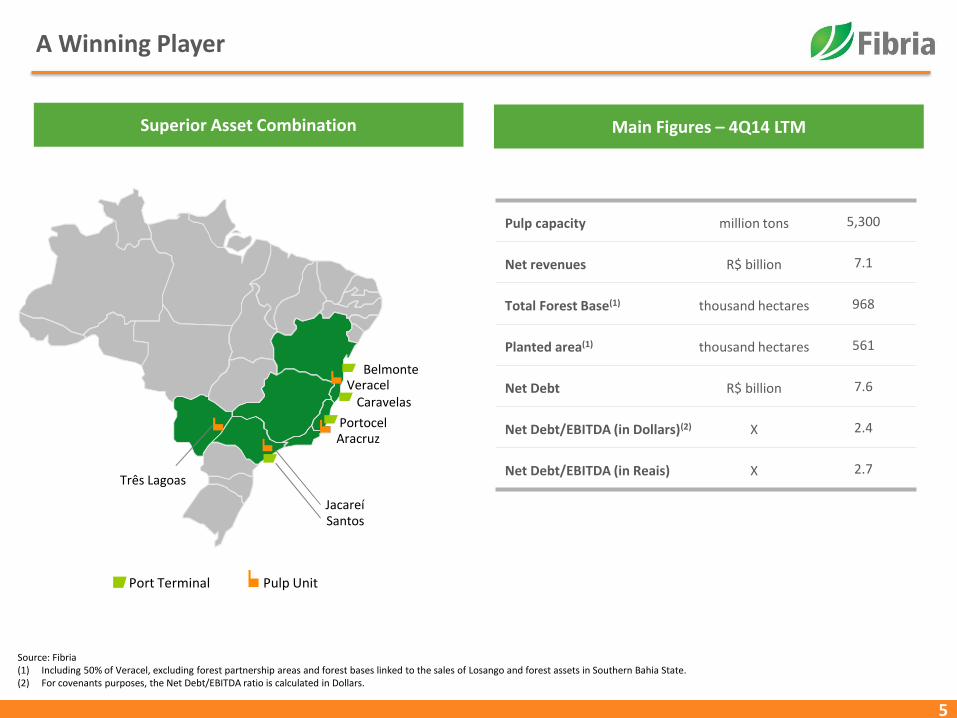
A Winning Player
Port Terminal Pulp Unit
Três Lagoas
Santos
AracruzPortocel
Caravelas
BelmonteVeracel
Jacareí
Superior Asset Combination Main Figures – 4Q14 LTM
Pulp capacity million tons 5,300
Net revenues R$ billion 7.1
Total Forest Base(1) thousand hectares 968
Planted area(1) thousand hectares 561
Net Debt R$ billion 7.6
Net Debt/EBITDA (in Dollars)(2) X 2.4
Net Debt/EBITDA (in Reais) X 2.7
Source: Fibria(1) Including 50% of Veracel, excluding forest partnership areas and forest bases linked to the sales of Losango and forest assets in Southern Bahia State. (2) For covenants purposes, the Net Debt/EBITDA ratio is calculated in Dollars.
6
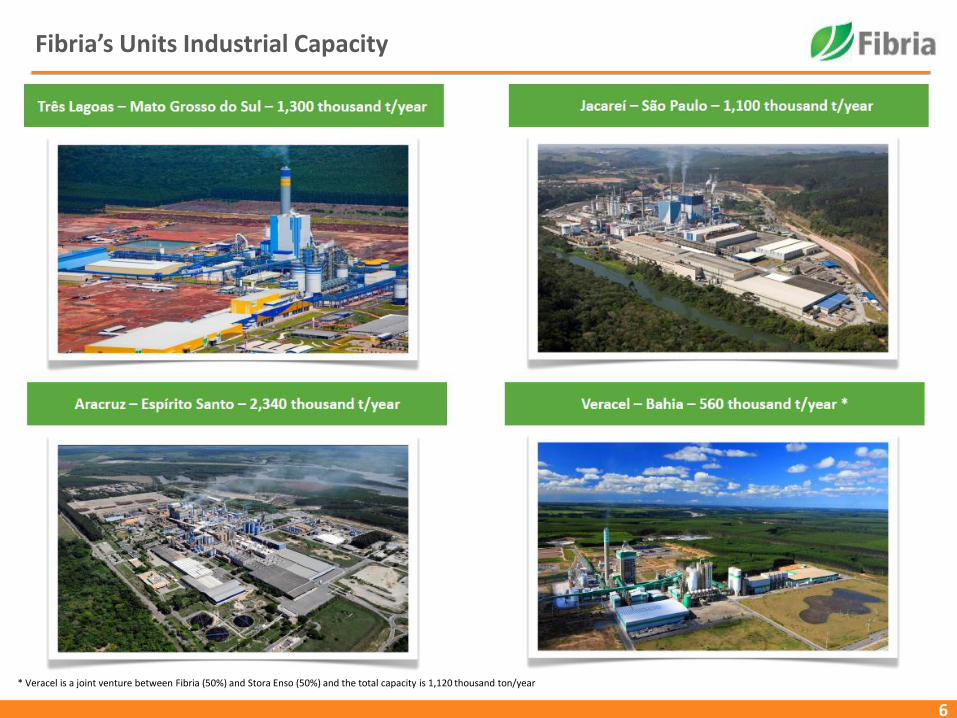
Fibria’s Units Industrial Capacity
* Veracel is a joint venture between Fibria (50%) and Stora Enso (50%) and the total capacity is 1,120 thousand ton/year
7
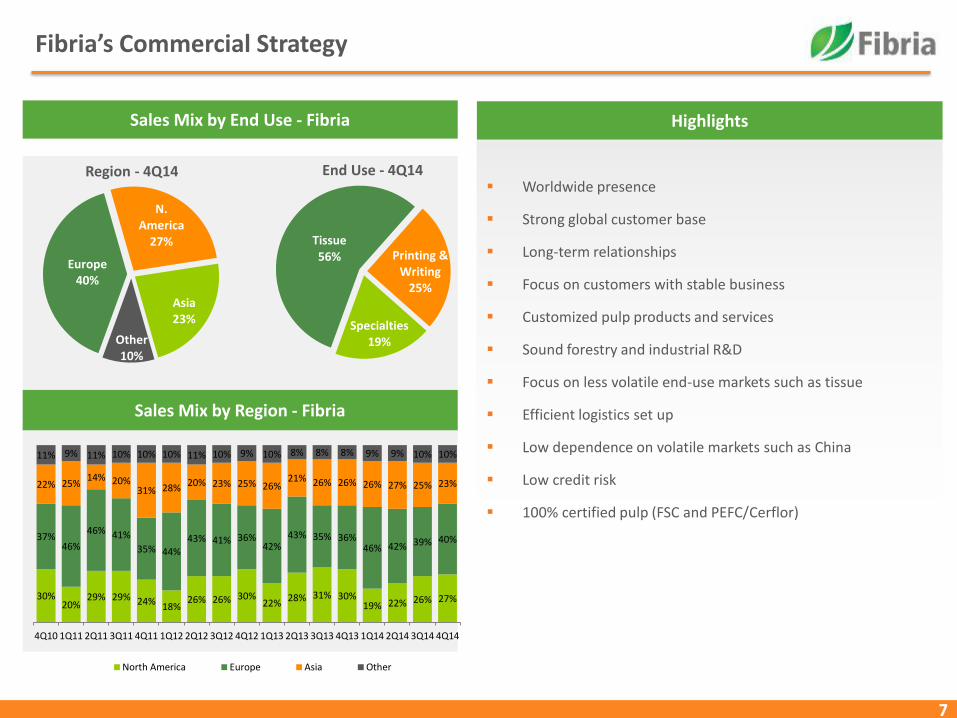
Worldwide presence
Strong global customer base
Long-term relationships
Focus on customers with stable business
Customized pulp products and services
Sound forestry and industrial R&D
Focus on less volatile end-use markets such as tissue
Efficient logistics set up
Low dependence on volatile markets such as China
Low credit risk
100% certified pulp (FSC and PEFC/Cerflor)
Sales Mix by End Use - Fibria
Sales Mix by Region - Fibria
Europe40%
N. America
27%
Asia23%
Other10%
Region - 4Q14
Tissue56% Printing &
Writing25%
Specialties19%
End Use - 4Q14
Highlights
30%20%
29% 29% 24% 18%26% 26% 30%
22% 28% 31% 30%19% 22% 26% 27%
37%46%
46% 41%
35% 44%43% 41% 36%
42%43% 35% 36%
46% 42% 39% 40%
22% 25%14% 20%
31% 28% 20% 23% 25% 26%21% 26% 26% 26% 27% 25% 23%
11% 9% 11% 10% 10% 10% 11% 10% 9% 10% 8% 8% 8% 9% 9% 10% 10%
4Q10 1Q11 2Q11 3Q11 4Q11 1Q12 2Q12 3Q12 4Q12 1Q13 2Q13 3Q13 4Q13 1Q14 2Q14 3Q14 4Q14
North America Europe Asia Other
Fibria’s Commercial Strategy
8
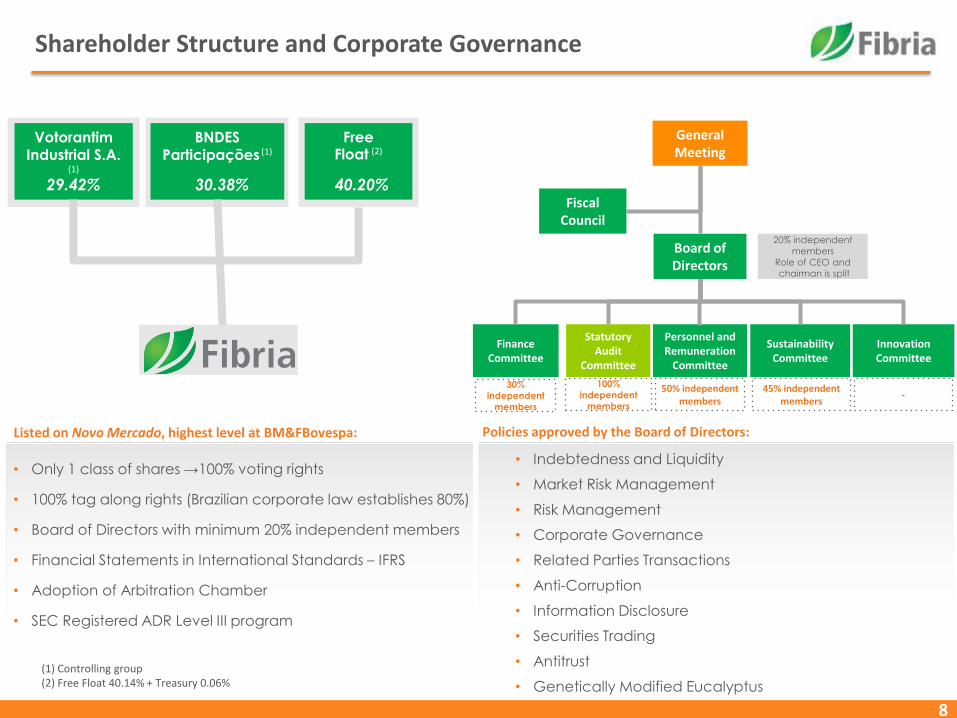
(1) Controlling group(2) Free Float 40.14% + Treasury 0.06%
Votorantim Industrial S.A.
(1)
29.42%
BNDESParticipações (1)
30.38%
FreeFloat (2)
40.20%
• Only 1 class of shares →100% voting rights
• 100% tag along rights (Brazilian corporate law establishes 80%)
• Board of Directors with minimum 20% independent members
• Financial Statements in International Standards – IFRS
• Adoption of Arbitration Chamber
• SEC Registered ADR Level III program
• Indebtedness and Liquidity
• Market Risk Management
• Risk Management
• Corporate Governance
• Related Parties Transactions
• Anti-Corruption
• Information Disclosure
• Securities Trading
• Antitrust
• Genetically Modified Eucalyptus
Fiscal Council
Board of Directors
20% independent
members
Role of CEO and
chairman is split
Personnel and Remuneration
Committee
Statutory Audit
Committee
Finance Committee
Sustainability Committee
Innovation Committee
General Meeting
Listed on Novo Mercado, highest level at BM&FBovespa: Policies approved by the Board of Directors:
Shareholder Structure and Corporate Governance
30%
independent
members
100%
independent
members
50% independent members
45% independent members
-
9
Pulp and Paper Market
10
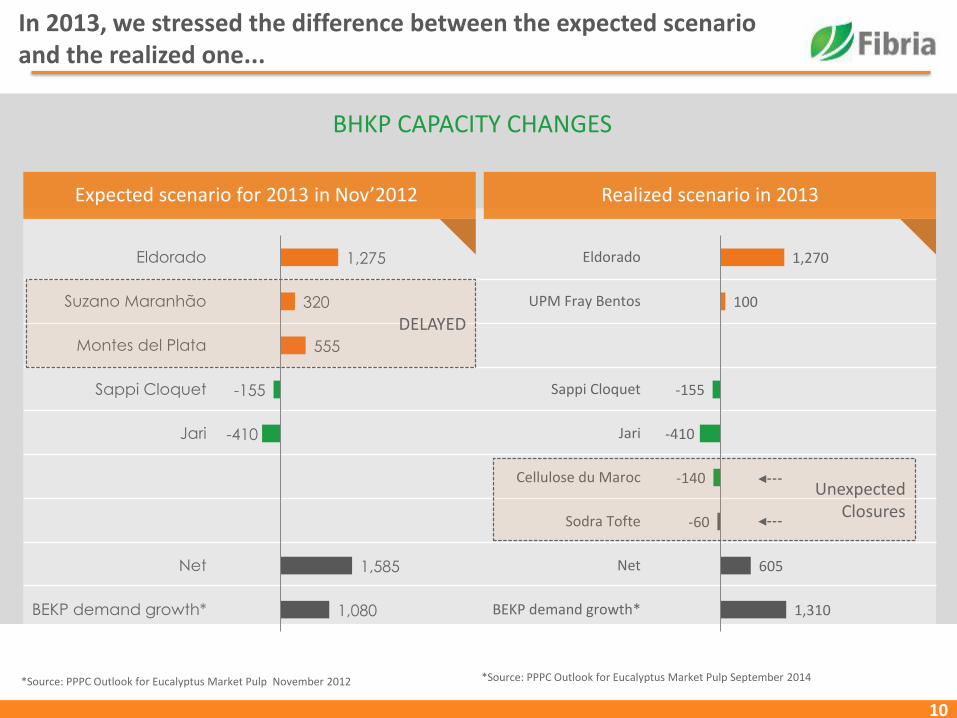
Expected scenario for 2013 in Nov’2012
BHKP CAPACITY CHANGES
Realized scenario in 2013
1,270
100
-155
-410
-140
-60
605
1,310
Eldorado
UPM Fray Bentos
Sappi Cloquet
Jari
Cellulose du Maroc
Sodra Tofte
Net
BEKP demand growth*
1,275
320
555
-155
-410
1,585
1,080
Eldorado
Suzano Maranhão
Montes del Plata
Sappi Cloquet
Jari
Net
BEKP demand growth*
DELAYED
UnexpectedClosures
In 2013, we stressed the difference between the expected scenarioand the realized one...
*Source: PPPC Outlook for Eucalyptus Market Pulp November 2012 *Source: PPPC Outlook for Eucalyptus Market Pulp September 2014
11
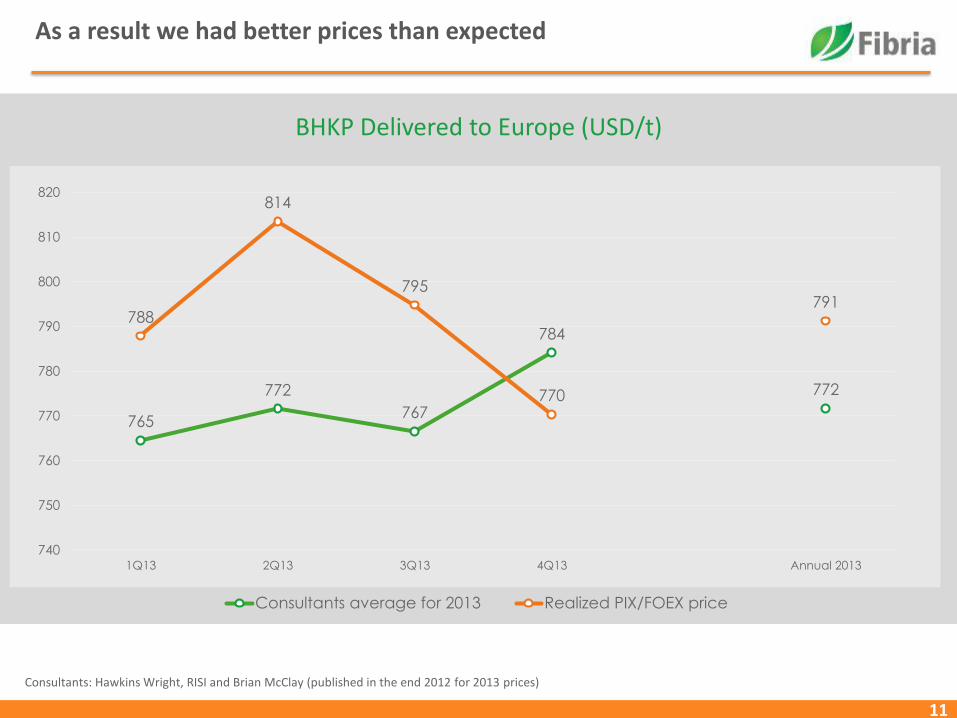
As a result we had better prices than expected
Consultants: Hawkins Wright, RISI and Brian McClay (published in the end 2012 for 2013 prices)
BHKP Delivered to Europe (USD/t)
765
772
767
784
772
788
814
795
770
791
740
750
760
770
780
790
800
810
820
1Q13 2Q13 3Q13 4Q13 Annual 2013
Consultants average for 2013 Realized PIX/FOEX price
12
BHKP CAPACITY CHANGES
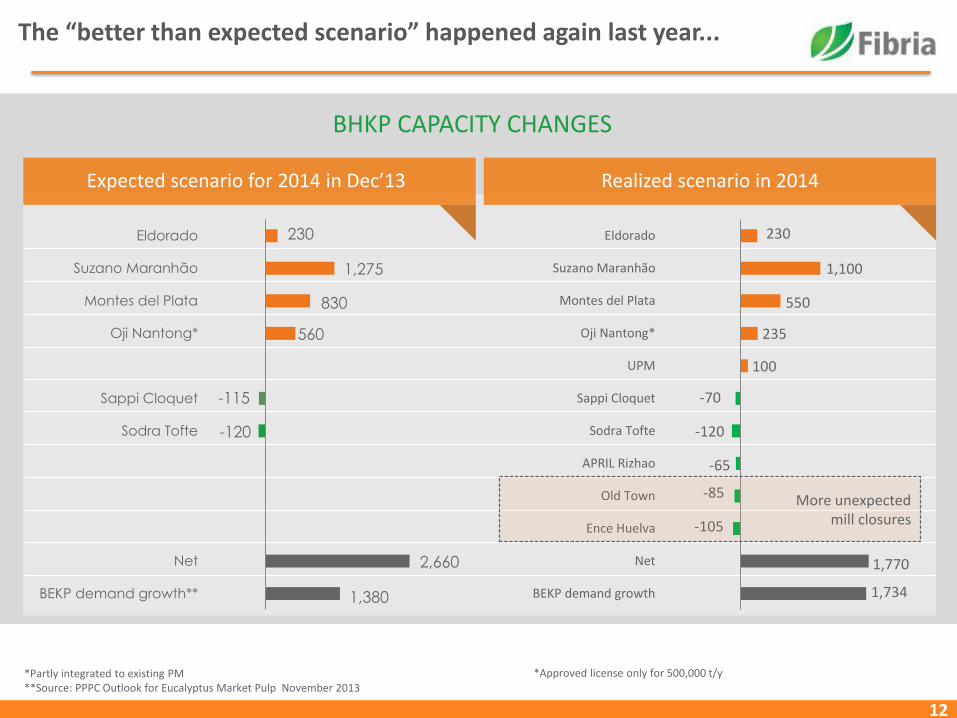
The “better than expected scenario” happened again last year...
Realized scenario in 2014
1,770
-105
-85
-65
-120
-70
100
235
550
1,100
230
BEKP demand growth
Net
Ence Huelva
Old Town
APRIL Rizhao
Sodra Tofte
Sappi Cloquet
UPM
Oji Nantong*
Montes del Plata
Suzano Maranhão
Eldorado
1,7341,380
2,660
-120
-115
560
830
1,275
230
BEKP demand growth**
Net
Sodra Tofte
Sappi Cloquet
Oji Nantong*
Montes del Plata
Suzano Maranhão
Eldorado
Expected scenario for 2014 in Dec’13
More unexpected mill closures
*Partly integrated to existing PM**Source: PPPC Outlook for Eucalyptus Market Pulp November 2013
*Approved license only for 500,000 t/y
13
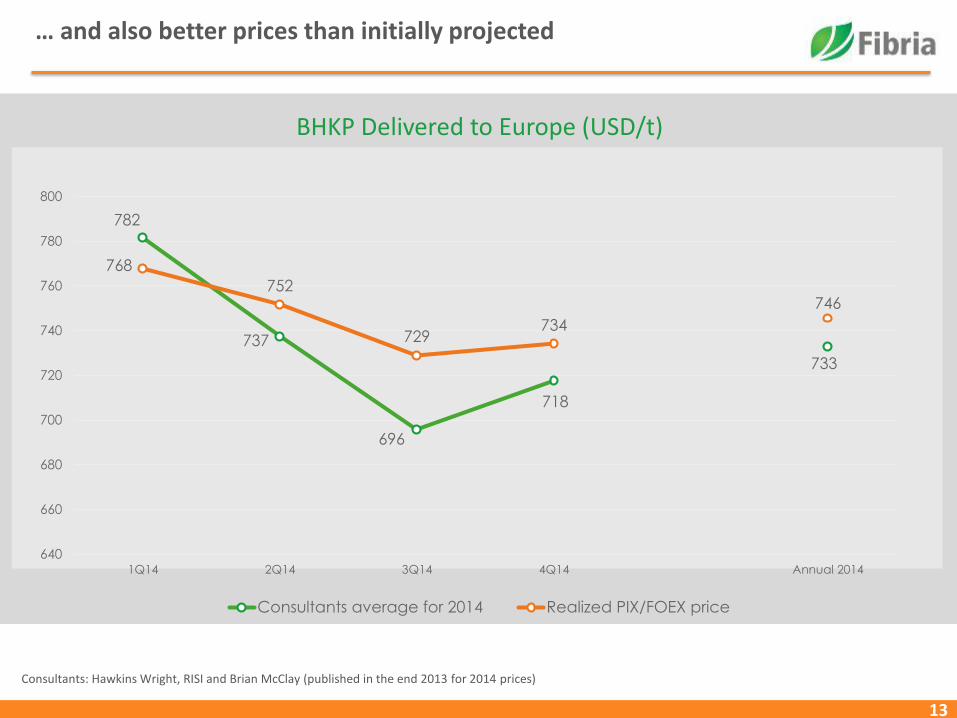
… and also better prices than initially projected
BHKP Delivered to Europe (USD/t)
782
737
696
718
733
768
752
729734
746
640
660
680
700
720
740
760
780
800
1Q14 2Q14 3Q14 4Q14 Annual 2014
Consultants average for 2014 Realized PIX/FOEX price
Consultants: Hawkins Wright, RISI and Brian McClay (published in the end 2013 for 2014 prices)
14
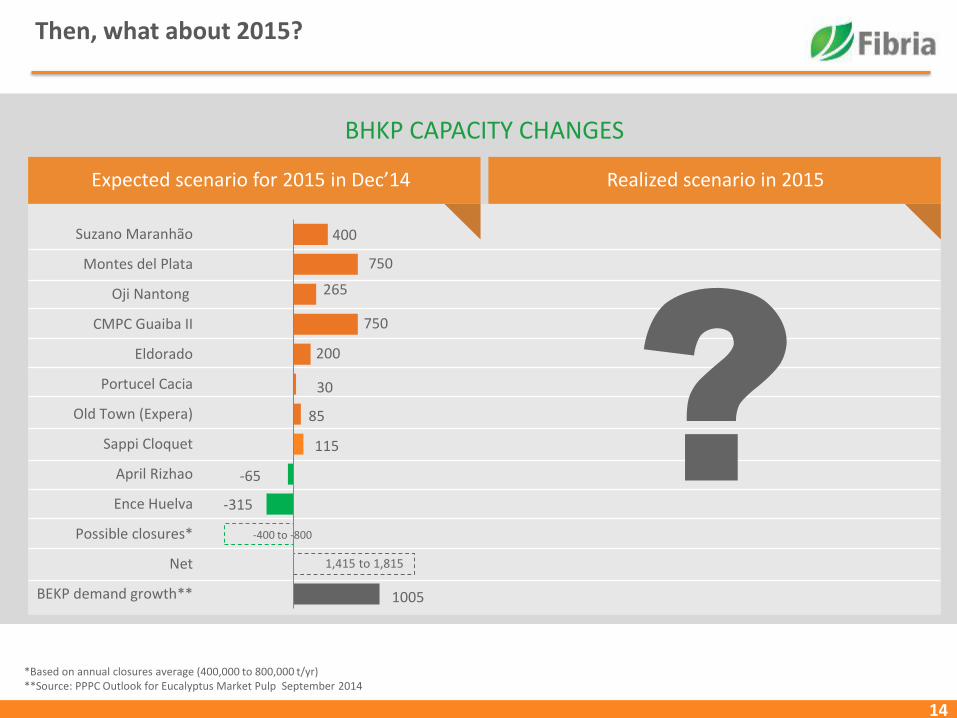
Then, what about 2015?
1005
-315
-65
115
85
30
200
750
265
750
400
BEKP demand growth**
Net
Possible closures*
Ence Huelva
April Rizhao
Sappi Cloquet
Old Town (Expera)
Portucel Cacia
Eldorado
CMPC Guaiba II
Oji Nantong
Montes del Plata
Suzano Maranhão
-400 to -800
1,415 to 1,815
Expected scenario for 2015 in Dec’14 Realized scenario in 2015
?
BHKP CAPACITY CHANGES
*Based on annual closures average (400,000 to 800,000 t/yr)**Source: PPPC Outlook for Eucalyptus Market Pulp September 2014
15
Shipments of Eucalyptus Pulp
(1) Source: PPPC World 20 – January/2015
Global Market BEKP Demand
Paper Capacity increase in China
2013 2014 2015 Total
FORECAST REALIZEDPREVIOUS FORECAST
LATEST FORECAST
PREVIOUS FORECAST
LATEST FORECAST
PREVIOUS LATEST
Woodfree -25 199 - 256 550 760 525 1,215
Tissue 1,184 833 1,518 1,390 903 727 3,605 2,950
Cartonboard 2,428 2,128 1,300 2,100 300 380 4,028 4,608
Total 3,587 3,160 2,818 3,746 1,753 1,867 8,158 8,773
Source: Fibria and Independent Consultants
378kt
58kt 21kt
214kt
83kt
16%
29% 2%
44%
13%
Total NorthAmerica
WesternEurope
China Others
2M2015 vs. 2M2014(2)
(1) Source: PPPC World 20 – December/2014
2014 vs. 2013(1)
1,734 kt
92 kt
386kt717 kt
537 kt
11%
5%
6%
20%13%
Total NorthAmerica
WesternEurope
China Others
(2) Source: PPPC World 20 – February/2015
16
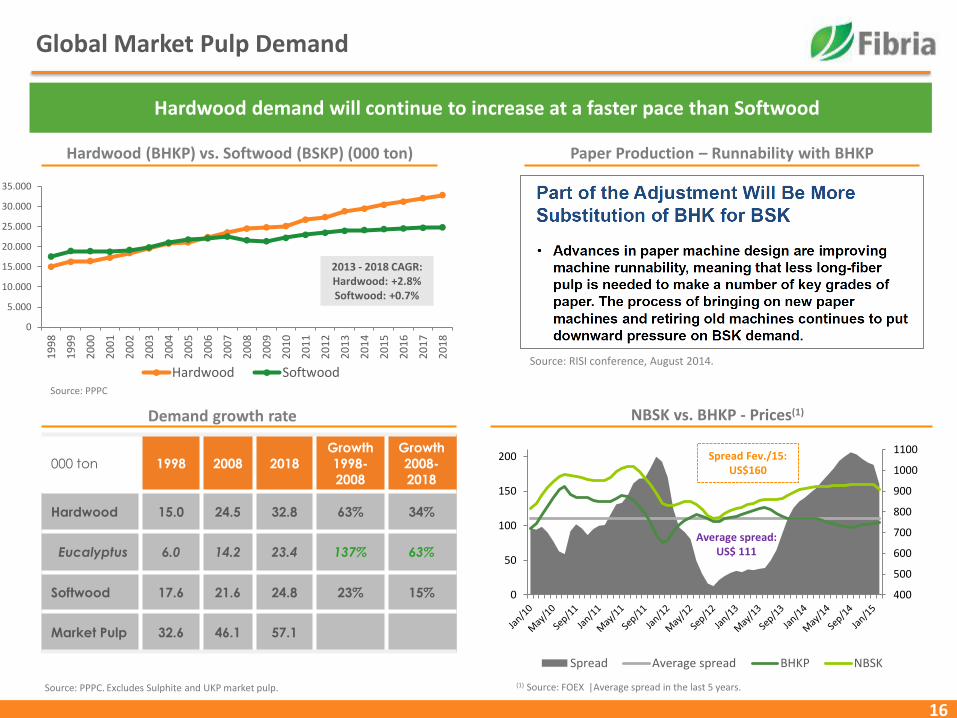
Global Market Pulp Demand
Demand growth rate
Hardwood (BHKP) vs. Softwood (BSKP) (000 ton)
Hardwood demand will continue to increase at a faster pace than Softwood
Source: PPPC
Source: PPPC. Excludes Sulphite and UKP market pulp.
NBSK vs. BHKP - Prices(1)
(1) Source: FOEX |Average spread in the last 5 years.
0
5.000
10.000
15.000
20.000
25.000
30.000
35.000
19
98
19
99
20
00
20
01
20
02
20
03
20
04
20
05
20
06
20
07
20
08
20
09
20
10
20
11
20
12
20
13
20
14
20
15
20
16
20
17
20
18
Hardwood Softwood
2013 - 2018 CAGR:Hardwood: +2.8%Softwood: +0.7%
000 ton 1998 2008 2018
Growth
1998-
2008
Growth
2008-
2018
Hardwood 15.0 24.5 32.8 63% 34%
Eucalyptus 6.0 14.2 23.4 137% 63%
Softwood 17.6 21.6 24.8 23% 15%
Market Pulp 32.6 46.1 57.1
Paper Production – Runnability with BHKP
Source: RISI conference, August 2014.
400
500
600
700
800
900
1000
1100
0
50
100
150
200
Spread Average spread BHKP NBSK
Average spread: US$ 111
Spread Fev./15: US$160
17
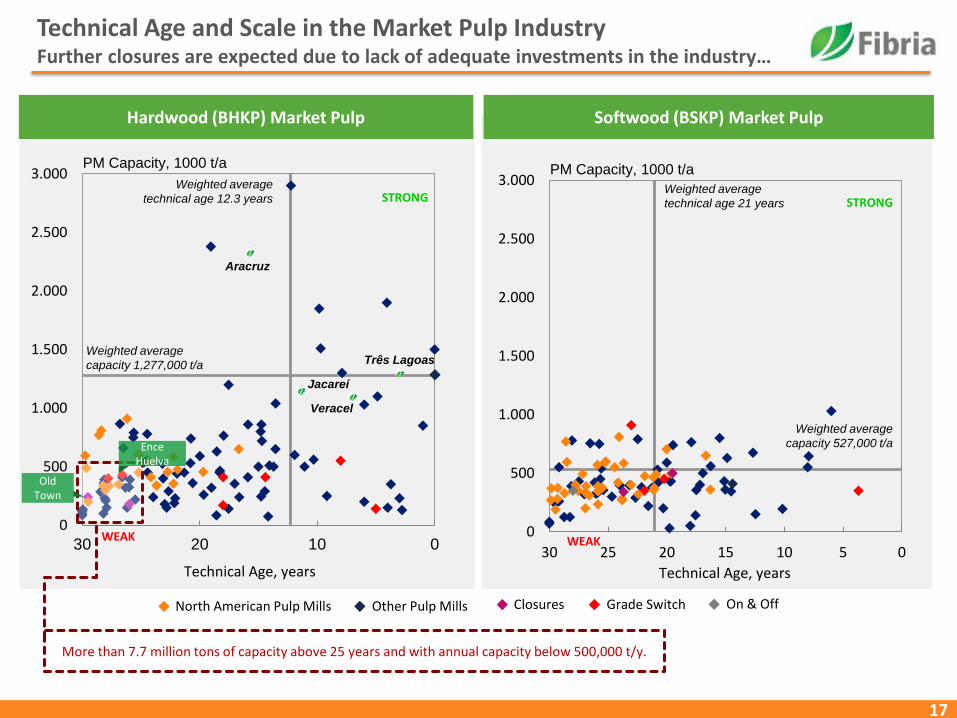
Technical Age and Scale in the Market Pulp IndustryFurther closures are expected due to lack of adequate investments in the industry…
Hardwood (BHKP) Market Pulp Softwood (BSKP) Market Pulp
STRONGWeighted average
technical age 12.3 years
Weighted average
capacity 1,277,000 t/a
Aracruz
Três Lagoas
Veracel
Jacareí
0
500
1.000
1.500
2.000
2.500
3.000
051015202530
PM Capacity, 1000 t/a
Technical Age, years
WEAK
STRONGWeighted average
technical age 21 years
Weighted average
capacity 527,000 t/a
North American Pulp Mills Other Pulp Mills Closures Grade Switch On & Off
WEAK0
500
1.000
1.500
2.000
2.500
3.000
0102030
PM Capacity, 1000 t/a
Technical Age, years
More than 7.7 million tons of capacity above 25 years and with annual capacity below 500,000 t/y.
Old Town
EnceHuelva
18
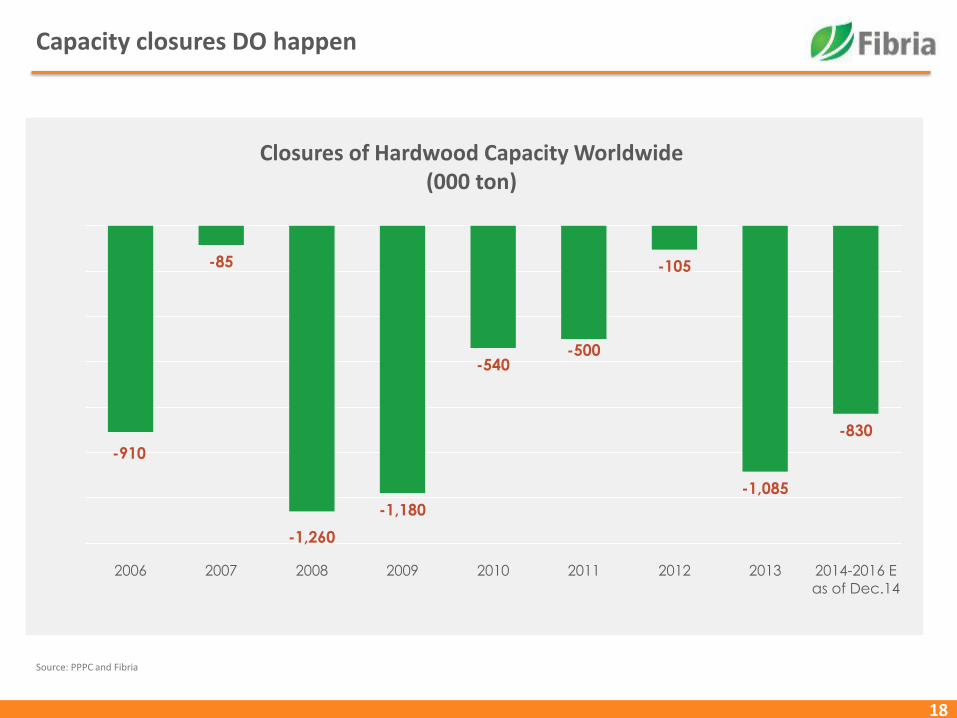
Source: PPPC and Fibria
Closures of Hardwood Capacity Worldwide(000 ton)
Capacity closures DO happen
-910
-85
-1,260
-1,180
-540-500
-105
-1,085
-830
2006 2007 2008 2009 2010 2011 2012 2013 2014-2016 E
as of Dec.14
19
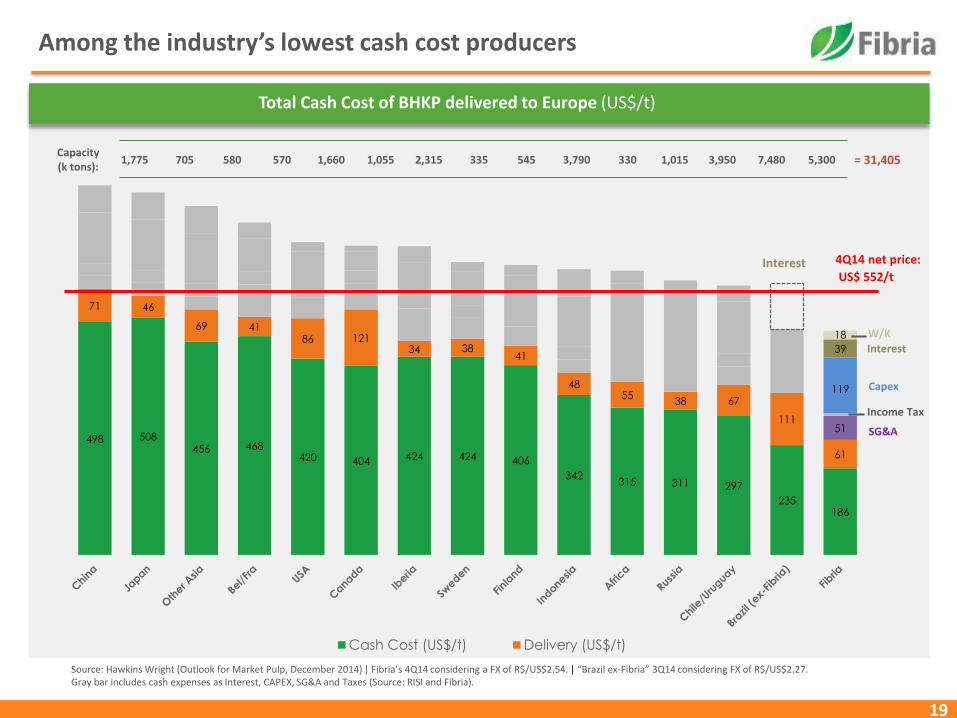
Total Cash Cost of BHKP delivered to Europe (US$/t)
Source: Hawkins Wright (Outlook for Market Pulp, December 2014) | Fibria’s 4Q14 considering a FX of R$/US$2.54. | “Brazil ex-Fibria” 3Q14 considering FX of R$/US$2.27.Gray bar includes cash expenses as Interest, CAPEX, SG&A and Taxes (Source: RISI and Fibria).
4Q14 net price:
US$ 552/t
W/K
Among the industry’s lowest cash cost producers
498 508456 468
420 404 424 424 406
342315 311 297
235186
71 46
69 4186 121
34 3841
4855
38 67
111
61
51
119
39
18
Cash Cost (US$/t) Delivery (US$/t)
SG&A
Capex
Interest
Income Tax
Interest
Capacity(k tons):
1,775 705 580 570 1,660 1,055 2,315 335 545 330 7,480 = 31,4053,790 1,015 3,950 5,300

20
Gross capacity addition should not be counted as the only factorinfluencing pulp price volatility….(1)
List Price bottoming at US$650/t in 2011 and US$724/t in 2014
Cap
acit
y (0
00
to
n)
0,0
0,2
0,4
0,6
0,8
1,0
1,2
1,4
1,6
1,8
2,0
0
100
200
300
400
500
600
700
800
900
1.000
2002 2003 2004 2005 2006 2007 2008 2009 2010 2011 2012 2013 2014 2015 2016 2017 2018
Valdivia
APP Hainan
Veracel Nueva Aldea
Santa Fé
Mucuri
FrayBentos
KerinciPL3
Três Lagoas
Rizhao
APP Guangxi
ChenmingZhanjiang
EldoradoMontes del Plata
Maranhão
Guaíba II
APP South Sumatra(2)
Klabin
OjiNantong
BH
KP
pri
ces
-C
IF E
uro
pe
(US$
/to
n)
(1) Source: Hawkins Wright , Poyry and Fibria Analysis. Pulp price estimates according to Hawkins Wright (Dec/14), Brian McClay (Jan/14) and RISI (Dec/14)(2) Partially integrated production
21
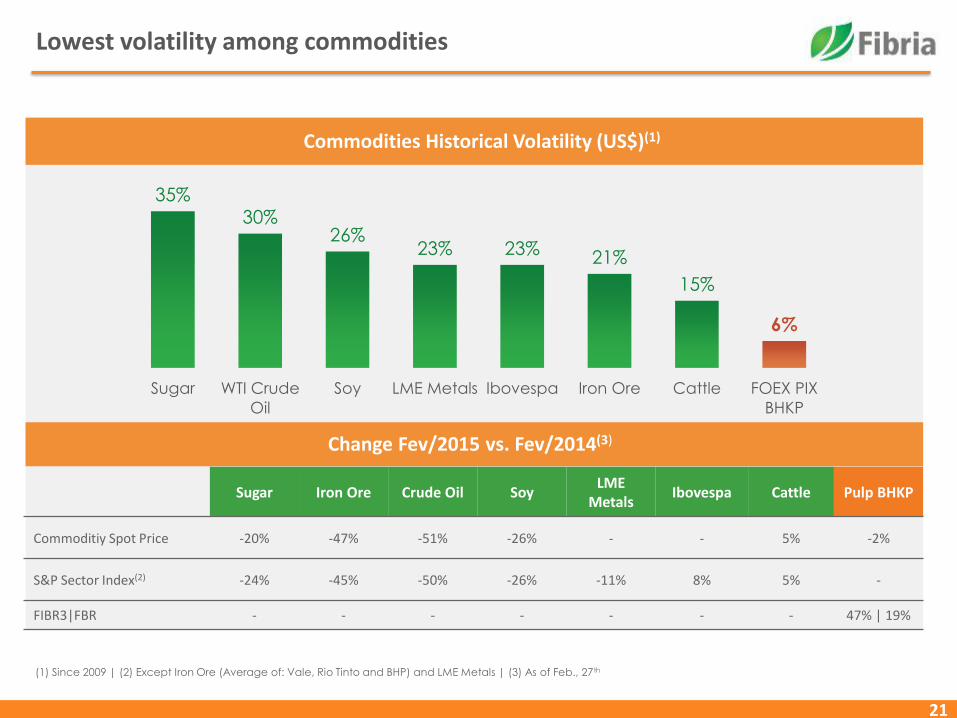
Lowest volatility among commodities
Change Fev/2015 vs. Fev/2014(3)
Commodities Historical Volatility (US$)(1)
(1) Since 2009 | (2) Except Iron Ore (Average of: Vale, Rio Tinto and BHP) and LME Metals | (3) As of Feb., 27th
Sugar Iron Ore Crude Oil SoyLME
Metals Ibovespa Cattle Pulp BHKP
Commoditiy Spot Price -20% -47% -51% -26% - - 5% -2%
S&P Sector Index(2) -24% -45% -50% -26% -11% 8% 5% -
FIBR3|FBR - - - - - - - 47% | 19%
35%
30%26%
23% 23% 21%
15%
6%
Sugar WTI Crude
Oil
Soy LME Metals Ibovespa Iron Ore Cattle FOEX PIX
BHKP

22
Financial and Operational Highlights
23
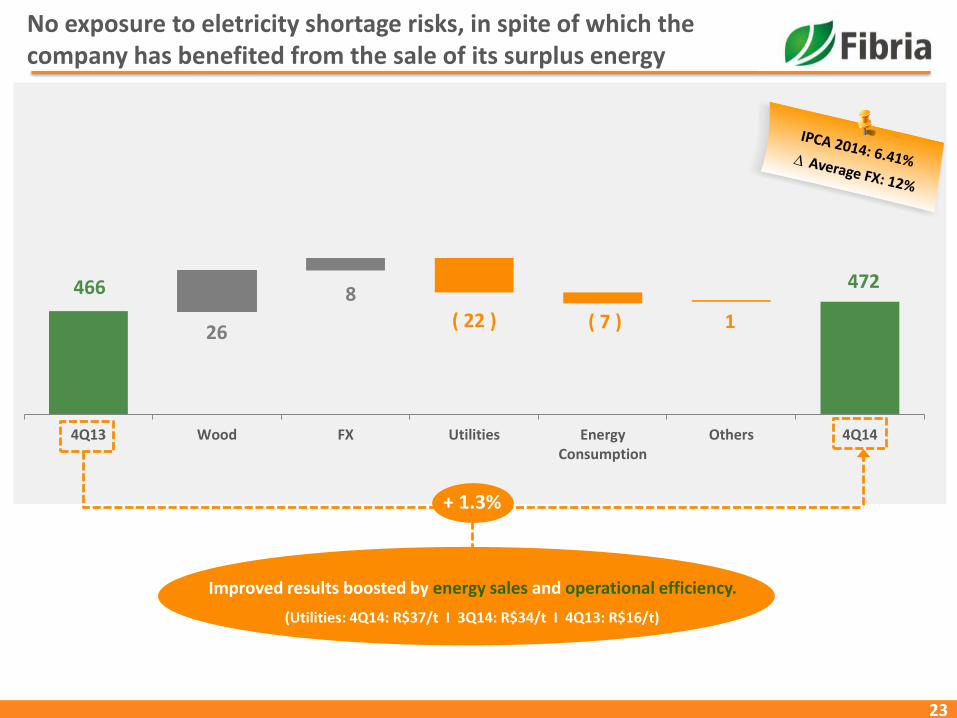
No exposure to eletricity shortage risks, in spite of which thecompany has benefited from the sale of its surplus energy
466 472
26
8 ( 22 ) ( 7 ) 1
4Q13 Wood FX Utilities EnergyConsumption
Others 4Q14
+ 1.3%
Improved results boosted by energy sales and operational efficiency.
(Utilities: 4Q14: R$37/t I 3Q14: R$34/t I 4Q13: R$16/t)
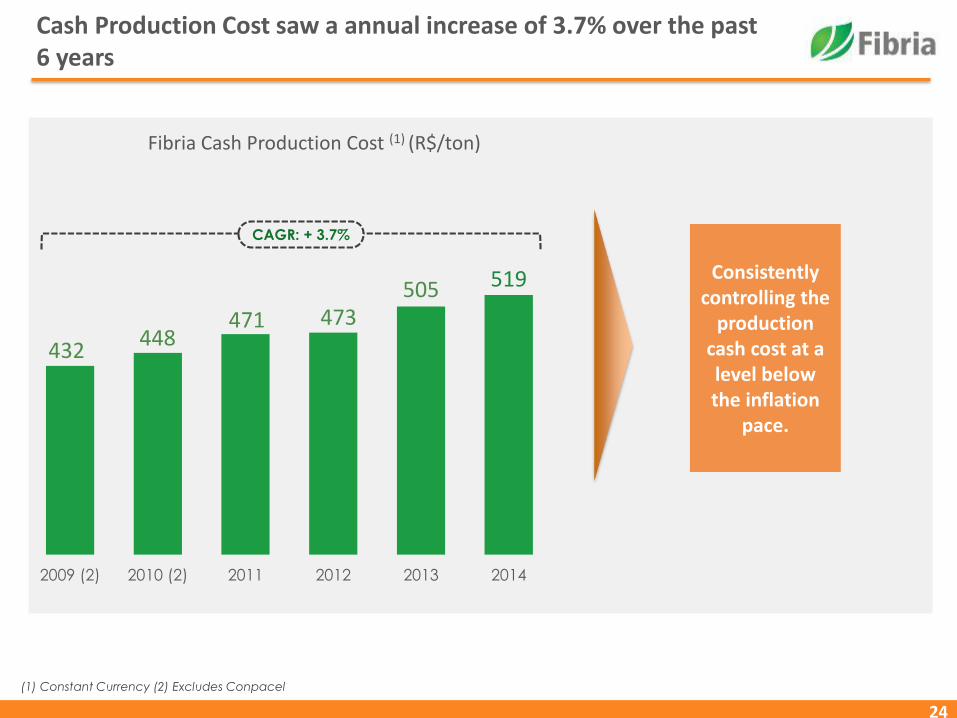
Fibria Cash Production Cost (1) (R$/ton)
Consistently controlling the
production cash cost at a level below the inflation
pace.
24
Cash Production Cost saw a annual increase of 3.7% over the past 6 years
432448
471 473505 519
2009 (2) 2010 (2) 2011 2012 2013 2014
CAGR: + 3.7%
(1) Constant Currency (2) Excludes Conpacel
25
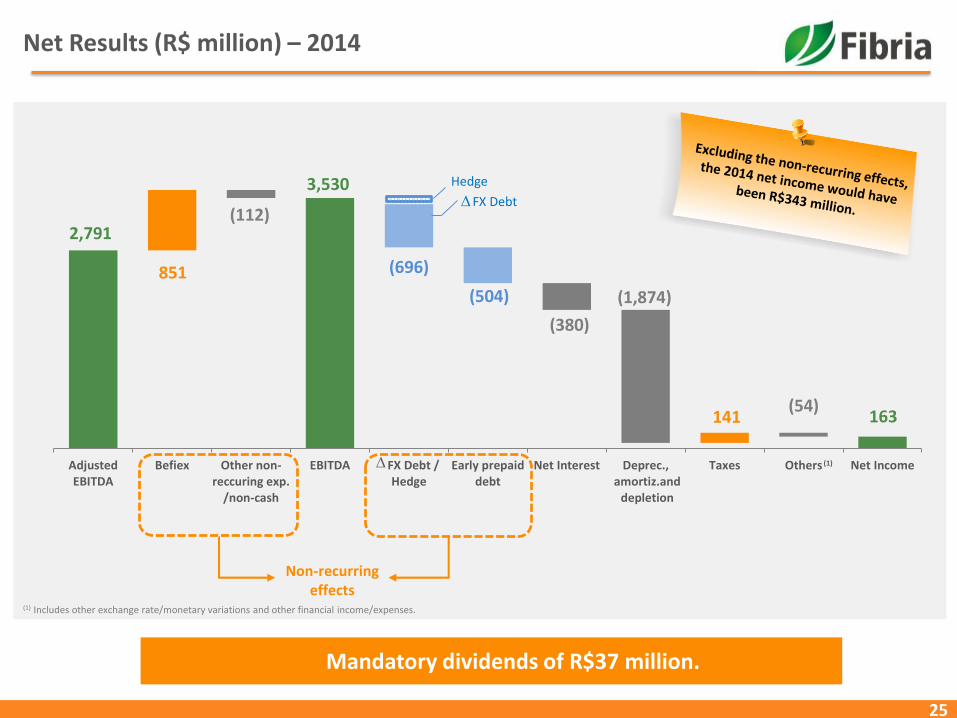
2,791
3,530
163
851
(112)
(696)
(504)
(380)
(1,874)
141 (54)
AdjustedEBITDA
Befiex Other non-reccuring exp.
/non-cash
EBITDA FX Debt /Hedge
Early prepaiddebt
Net Interest Deprec., amortiz.and
depletion
Taxes Others Net Income
Hedge
∆
FX Debt∆
Non-recurringeffects
(1) Includes other exchange rate/monetary variations and other financial income/expenses.
Net Results (R$ million) – 2014
(1)
Mandatory dividends of R$37 million.
26
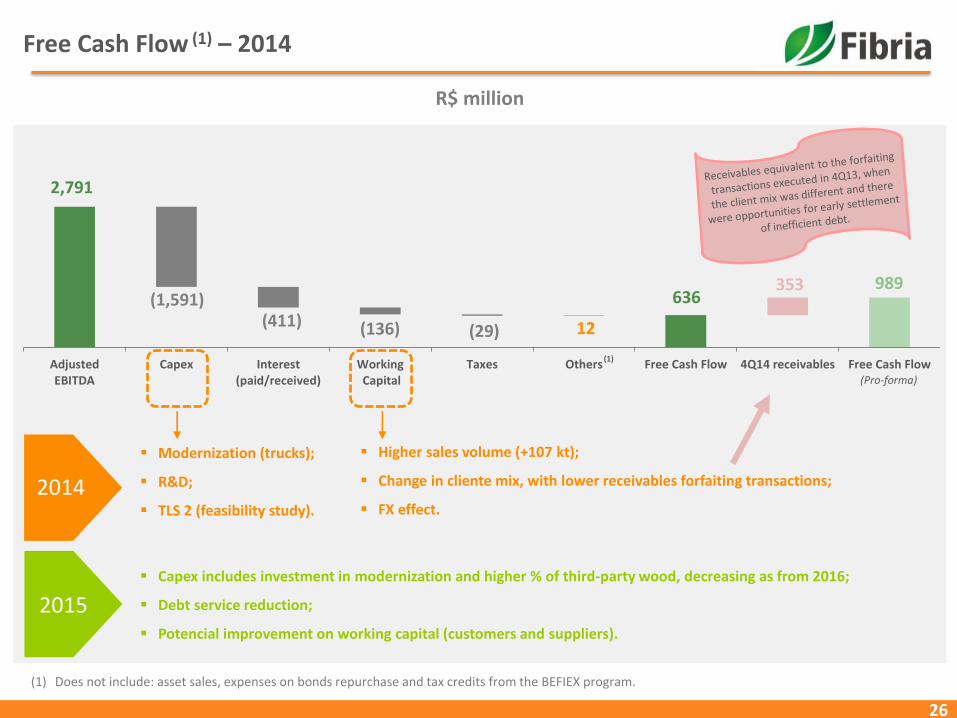
Free Cash Flow (1) – 2014
R$ million
(1)
2,791
636 989
(1,591) (411) (136) (29) 12
353
AdjustedEBITDA
Capex Interest(paid/received)
Working Capital
Taxes Others Free Cash Flow 4Q14 receivables Free Cash Flow(Pro-forma)
Higher sales volume (+107 kt);
Change in cliente mix, with lower receivables forfaiting transactions;
FX effect.
Modernization (trucks);
R&D;
TLS 2 (feasibility study).
2014
Capex includes investment in modernization and higher % of third-party wood, decreasing as from 2016;
Debt service reduction;
Potencial improvement on working capital (customers and suppliers).
2015
(1) Does not include: asset sales, expenses on bonds repurchase and tax credits from the BEFIEX program.
27
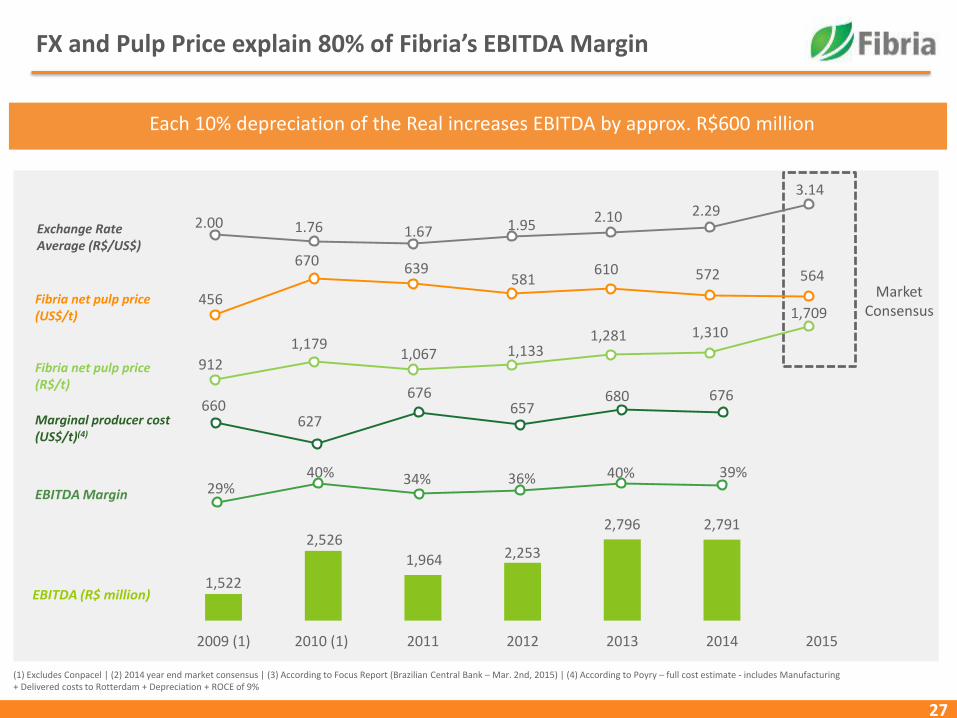
FX and Pulp Price explain 80% of Fibria’s EBITDA Margin
(1) Excludes Conpacel | (2) 2014 year end market consensus | (3) According to Focus Report (Brazilian Central Bank – Mar. 2nd, 2015) | (4) According to Poyry – full cost estimate - includes Manufacturing + Delivered costs to Rotterdam + Depreciation + ROCE of 9%
Each 10% depreciation of the Real increases EBITDA by approx. R$600 million
1,522
2,526
1,964 2,253
2,796 2,791
2009 (1) 2010 (1) 2011 2012 2013 2014 2015
Exchange Rate Average (R$/US$)
EBITDA Margin
EBITDA (R$ million)
29%40% 34% 36% 40% 39%
Marginal producer cost(US$/t)(4)
Fibria net pulp price(US$/t)
Market Consensus
456
670 639 581
610 572 564
660 627
676 657
680 676
912
1,1791,067 1,133
1,281 1,3101,709
Fibria net pulp price(R$/t)
2.00 1.76 1.67 1.95 2.10 2.29
3.14
28
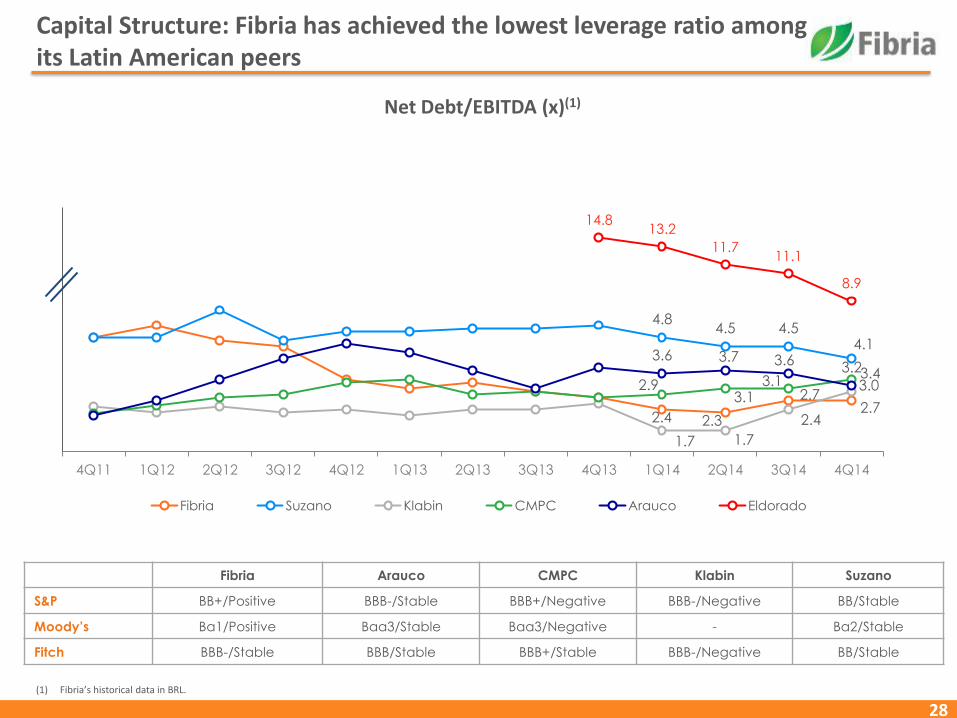
Net Debt/EBITDA (x)(1)
Fibria Arauco CMPC Klabin Suzano
S&P BB+/Positive BBB-/Stable BBB+/Negative BBB-/Negative BB/Stable
Moody’s Ba1/Positive Baa3/Stable Baa3/Negative - Ba2/Stable
Fitch BBB-/Stable BBB/Stable BBB+/Stable BBB-/Negative BB/Stable
(1) Fibria’s historical data in BRL.
Capital Structure: Fibria has achieved the lowest leverage ratio among its Latin American peers
2.4 2.3
2.72.7
4.84.5 4.5
4.1
1.7 1.7
2.4
3.02.93.1
3.13.4
3.6 3.7 3.63.2
14.813.2
11.711.1
8.9
4Q11 1Q12 2Q12 3Q12 4Q12 1Q13 2Q13 3Q13 4Q13 1Q14 2Q14 3Q14 4Q14
Fibria Suzano Klabin CMPC Arauco Eldorado
29
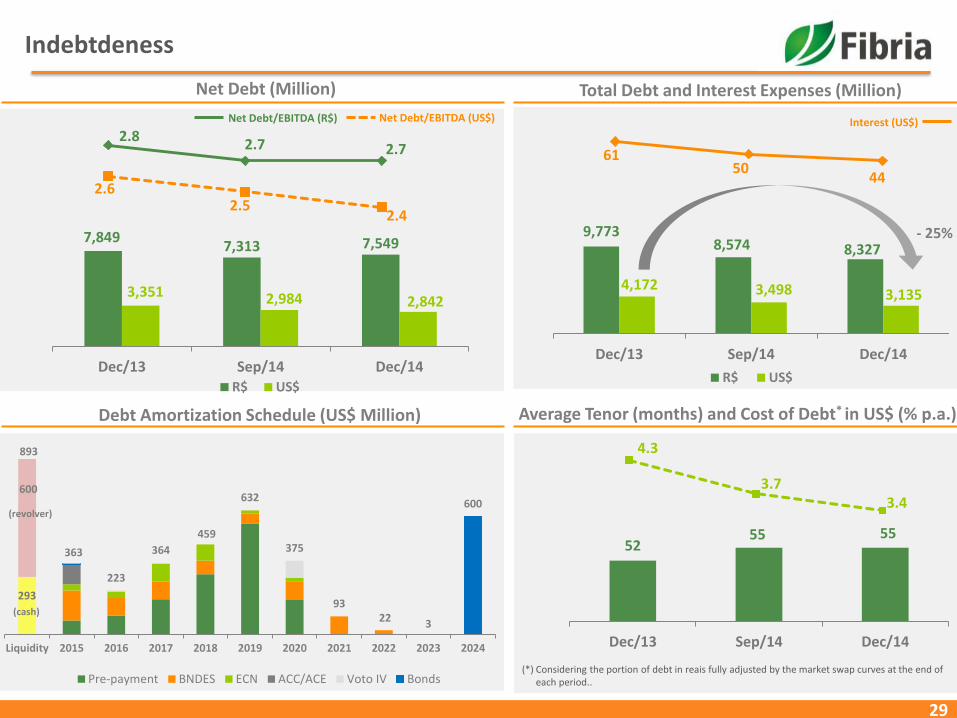
Indebtdeness
2.82.7 2.7
2.62.5
2.49,773
8,574 8,327
4,172 3,498 3,135
Dec/13 Sep/14 Dec/14
R$ US$
7,8497,313 7,549
3,351 2,984 2,842
Dec/13 Sep/14 Dec/14R$ US$
Net Debt/EBITDA (US$)
Debt Amortization Schedule (US$ Million) Average Tenor (months) and Cost of Debt* in US$ (% p.a.)
293
600
893
363
223
364
459
632
375
9322 3
600
Liquidity 2015 2016 2017 2018 2019 2020 2021 2022 2023 2024
Pre-payment BNDES ECN ACC/ACE Voto IV Bonds
(cash)
(revolver)
5255 55
Dec/13 Sep/14 Dec/14
Interest (US$)
- 25%
Net Debt/EBITDA (R$)
(*) Considering the portion of debt in reais fully adjusted by the market swap curves at the end ofeach period..
4.3
3.73.4
Net Debt (Million)
6150
44
Total Debt and Interest Expenses (Million)
30
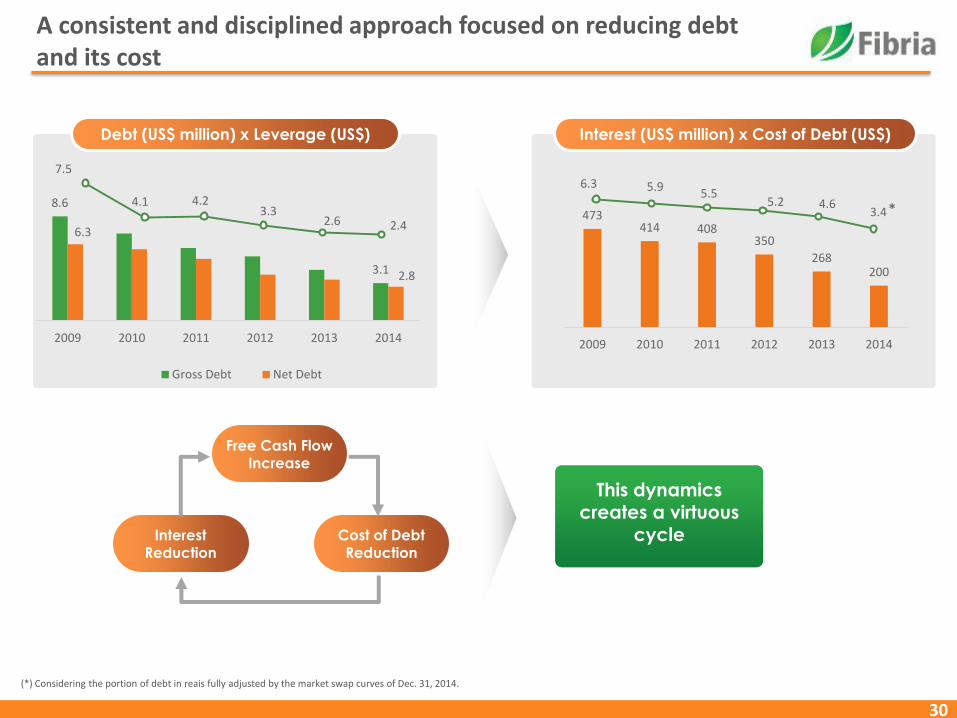
A consistent and disciplined approach focused on reducing debt and its cost
Debt (US$ million) x Leverage (US$) Interest (US$ million) x Cost of Debt (US$)
Free Cash Flow Increase
Interest Reduction
Cost of Debt Reduction
This dynamics creates a virtuous
cycle
8.6
3.1
6.3
2.8
2009 2010 2011 2012 2013 2014
Gross Debt Net Debt
7.5
4.1 4.23.3
2.6 2.4473
414 408350
268200
2009 2010 2011 2012 2013 2014
6.3 5.95.5
5.2 4.63.4*
(*) Considering the portion of debt in reais fully adjusted by the market swap curves of Dec. 31, 2014.
31
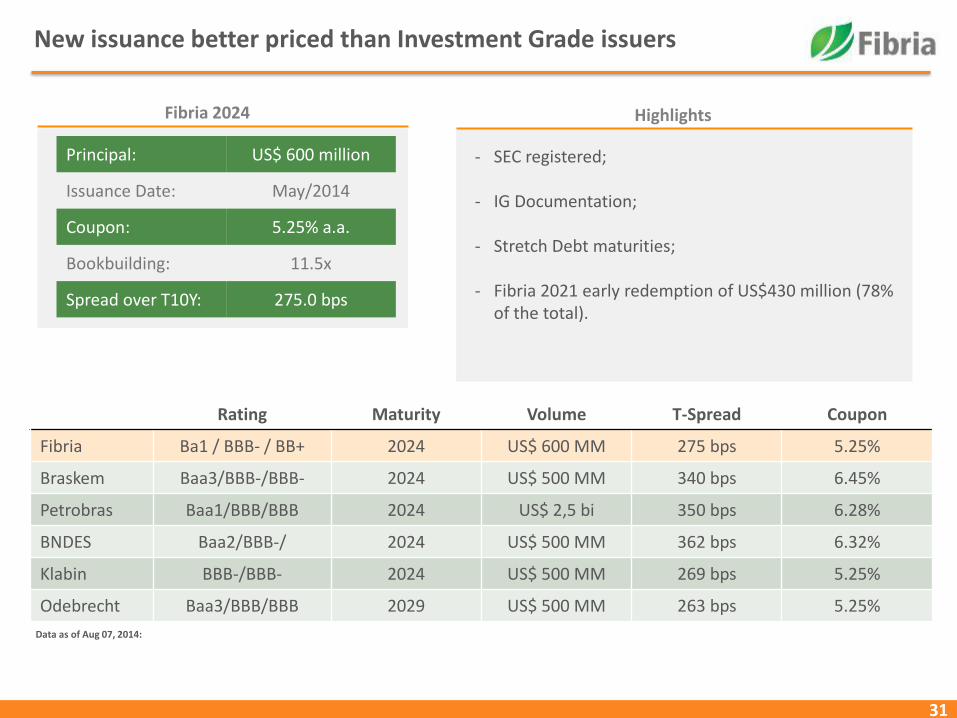
Principal: US$ 600 million
Issuance Date: May/2014
Coupon: 5.25% a.a.
Bookbuilding: 11.5x
Spread over T10Y: 275.0 bps
Highlights
- SEC registered;
- IG Documentation;
- Stretch Debt maturities;
- Fibria 2021 early redemption of US$430 million (78% of the total).
Fibria 2024
Data as of Aug 07, 2014:
Rating Maturity Volume T-Spread Coupon
Fibria Ba1 / BBB- / BB+ 2024 US$ 600 MM 275 bps 5.25%
Braskem Baa3/BBB-/BBB- 2024 US$ 500 MM 340 bps 6.45%
Petrobras Baa1/BBB/BBB 2024 US$ 2,5 bi 350 bps 6.28%
BNDES Baa2/BBB-/ 2024 US$ 500 MM 362 bps 6.32%
Klabin BBB-/BBB- 2024 US$ 500 MM 269 bps 5.25%
Odebrecht Baa3/BBB/BBB 2029 US$ 500 MM 263 bps 5.25%
New issuance better priced than Investment Grade issuers
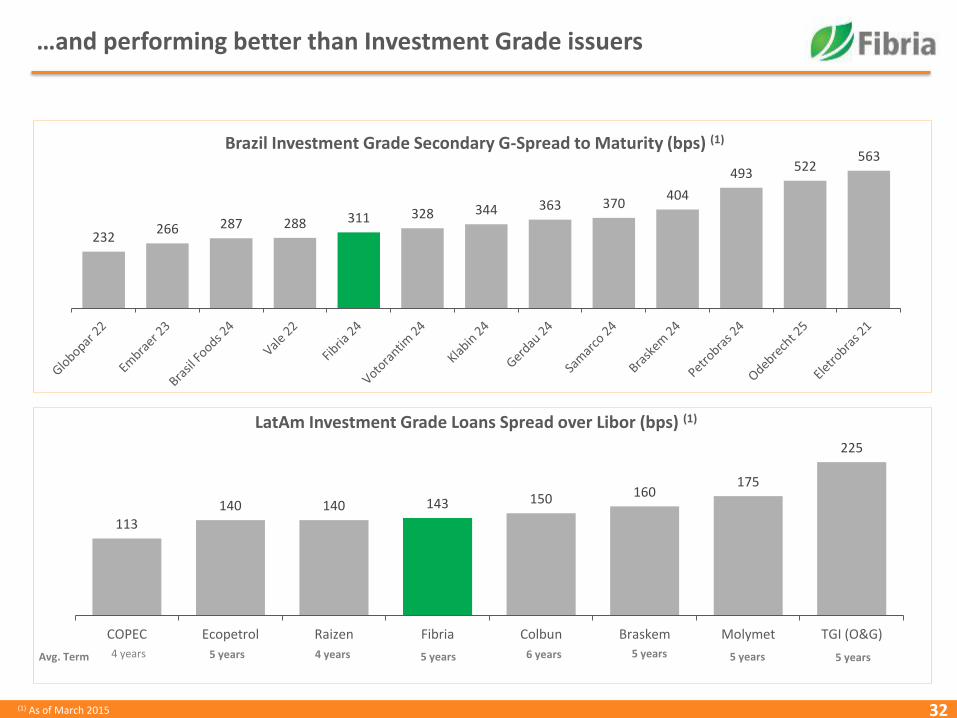
32
232266 287 288 311 328 344 363 370
404
493 522563
Brazil Investment Grade Secondary G-Spread to Maturity (bps) (1)
113
140 140 143 150 160175
225
COPEC Ecopetrol Raizen Fibria Colbun Braskem Molymet TGI (O&G)
LatAm Investment Grade Loans Spread over Libor (bps) (1)
Avg. Term 4 years 5 years 4 years 5 years 6 years 5 years 5 years 5 years
(1) As of March 2015
…and performing better than Investment Grade issuers
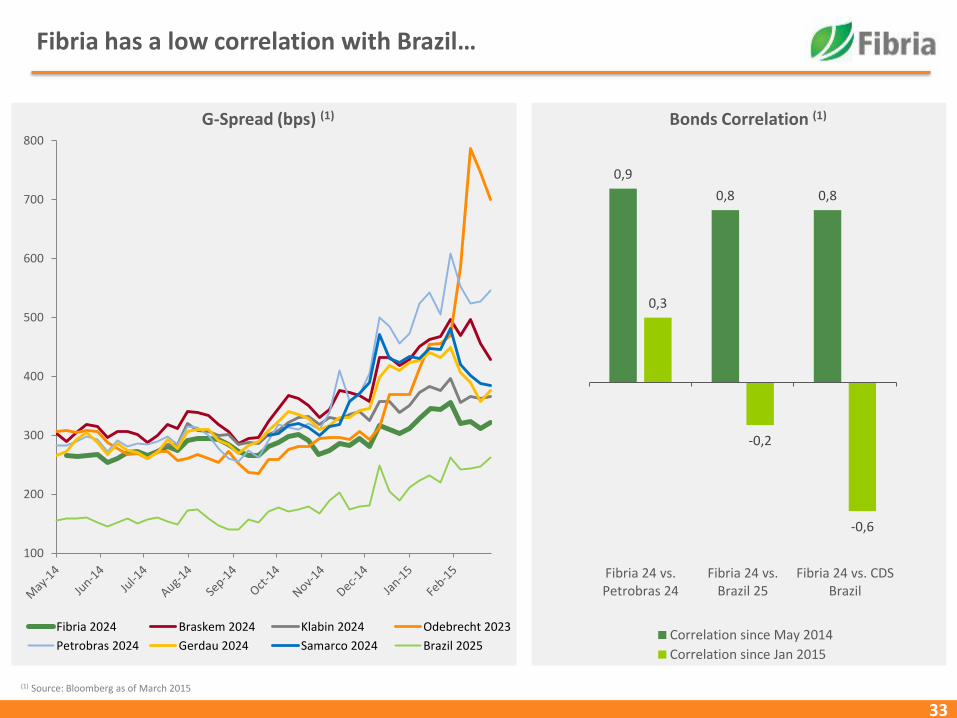
33
100
200
300
400
500
600
700
800
Fibria 2024 Braskem 2024 Klabin 2024 Odebrecht 2023
Petrobras 2024 Gerdau 2024 Samarco 2024 Brazil 2025
Fibria has a low correlation with Brazil…
(1) Source: Bloomberg as of March 2015
0,9
0,8 0,8
0,3
-0,2
-0,6
Fibria 24 vs.Petrobras 24
Fibria 24 vs.Brazil 25
Fibria 24 vs. CDSBrazil
Correlation since May 2014
Correlation since Jan 2015
Bonds Correlation (1)G-Spread (bps) (1)
34
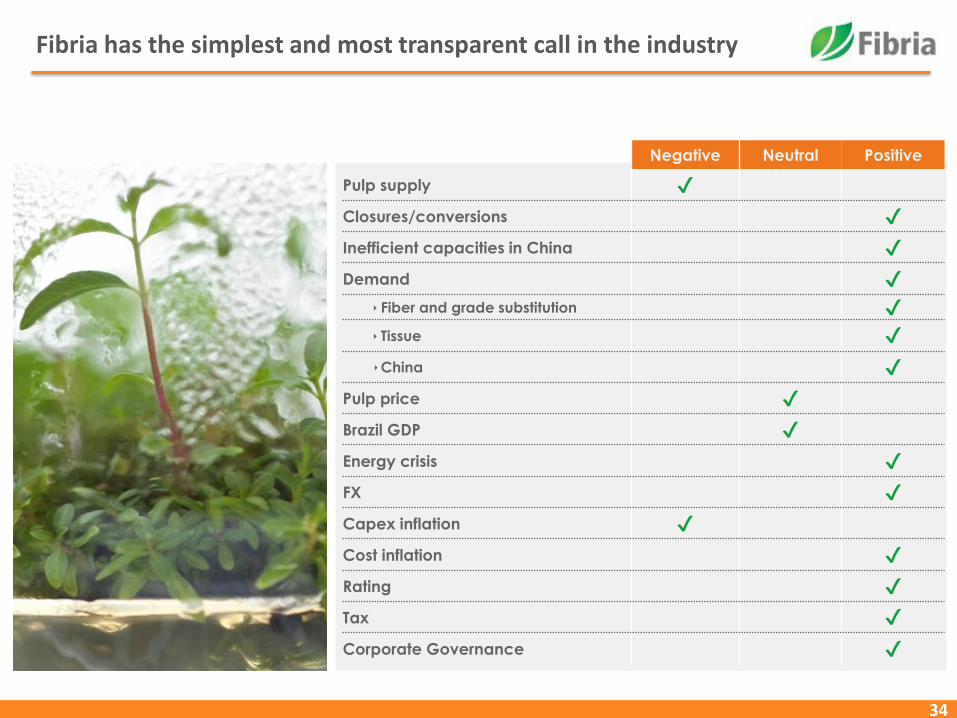
Fibria has the simplest and most transparent call in the industry
Negative Neutral Positive
Pulp supply ✔
Closures/conversions ✔
Inefficient capacities in China ✔
Demand ✔
‣ Fiber and grade substitution ✔
‣ Tissue ✔
‣China ✔
Pulp price ✔
Brazil GDP ✔
Energy crisis ✔
FX ✔
Capex inflation ✔
Cost inflation ✔
Rating ✔
Tax ✔
Corporate Governance ✔

35
Final Remarks
36
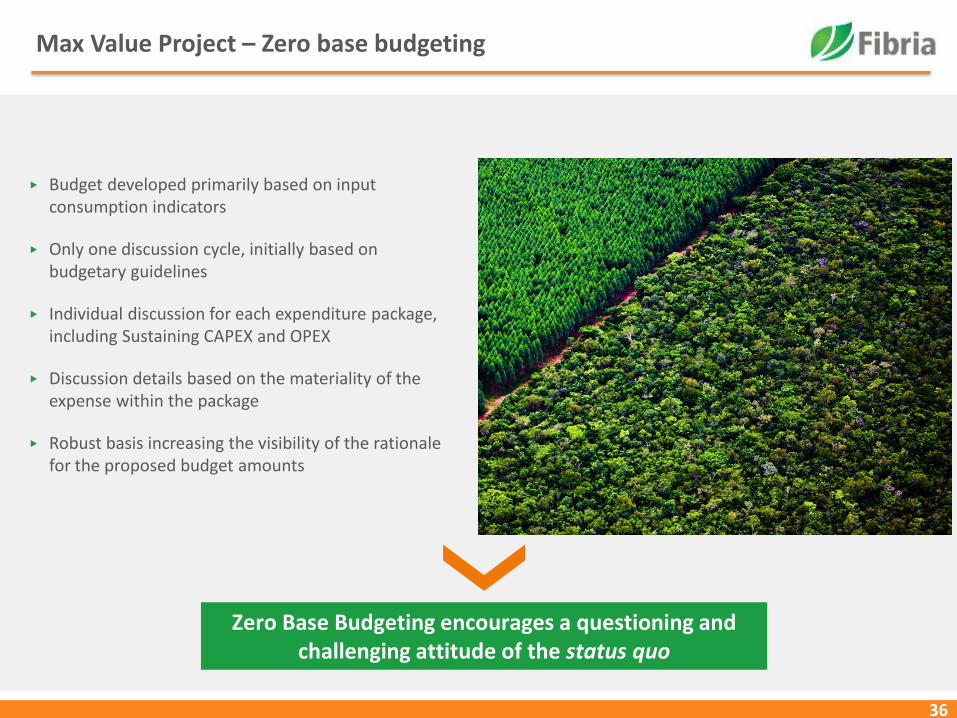
Max Value Project – Zero base budgeting
▶ Budget developed primarily based on input consumption indicators
▶ Only one discussion cycle, initially based onbudgetary guidelines
▶ Individual discussion for each expenditure package, including Sustaining CAPEX and OPEX
▶ Discussion details based on the materiality of theexpense within the package
▶ Robust basis increasing the visibility of the rationale for the proposed budget amounts
Zero Base Budgeting encourages a questioning andchallenging attitude of the status quo
37
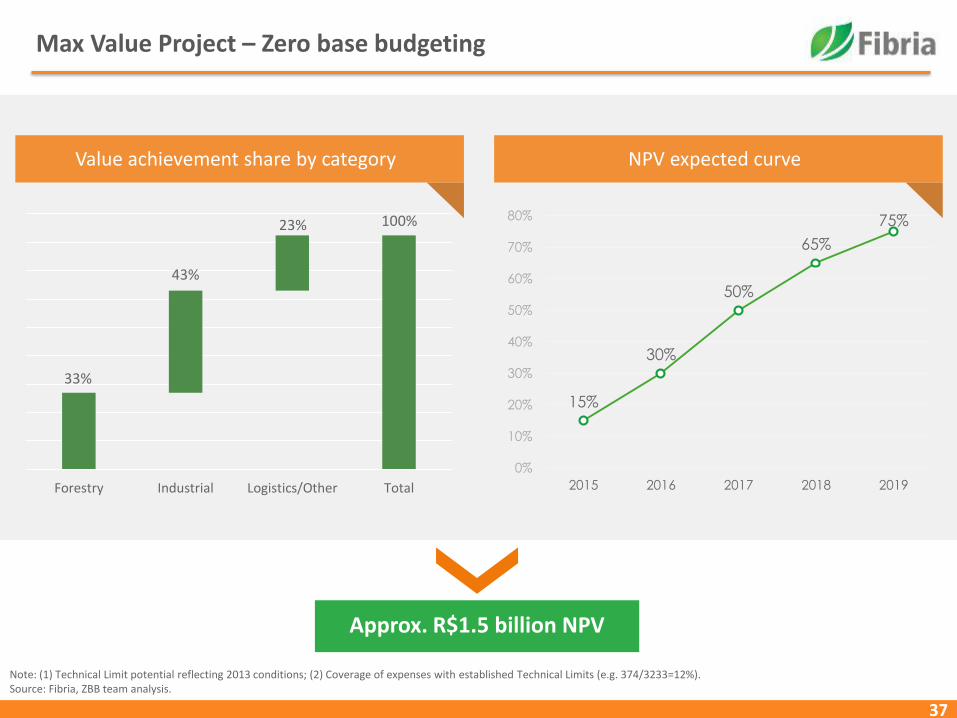
Max Value Project – Zero base budgeting
33%
100%
43%
23%
Forestry Industrial Logistics/Other Total
15%
30%
50%
65%
75%
0%
10%
20%
30%
40%
50%
60%
70%
80%
2015 2016 2017 2018 2019
Note: (1) Technical Limit potential reflecting 2013 conditions; (2) Coverage of expenses with established Technical Limits (e.g. 374/3233=12%).Source: Fibria, ZBB team analysis.
Value achievement share by category NPV expected curve
Approx. R$1.5 billion NPV
38
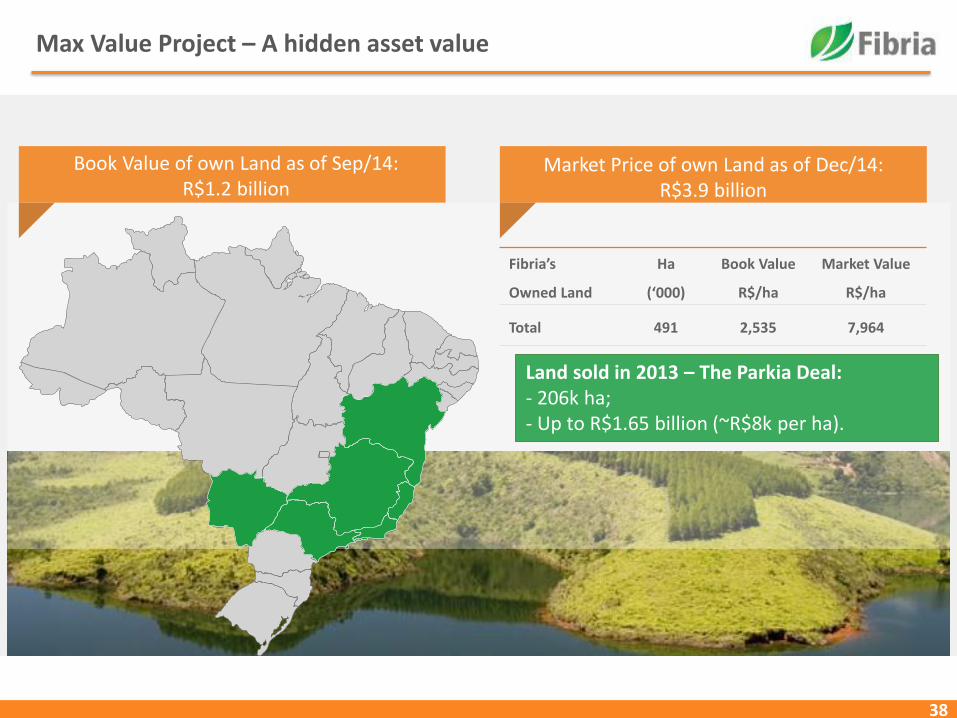
Max Value Project – A hidden asset value
Market Price of own Land as of Sep/14:R$3.9 billion
Fibria’s
Owned Land
Ha
(‘000)
Book Value
R$/ha
Market Value
R$/ha
Total 491 2,535 7,964
Land sold in 2013 – The Parkia Deal:- 206k ha;- Up to R$1.65 billion (~R$8k per ha).
Book Value of own Land as of Sep/14: R$1.2 billion
Market Price of own Land as of Dec/14:R$3.9 billion
39
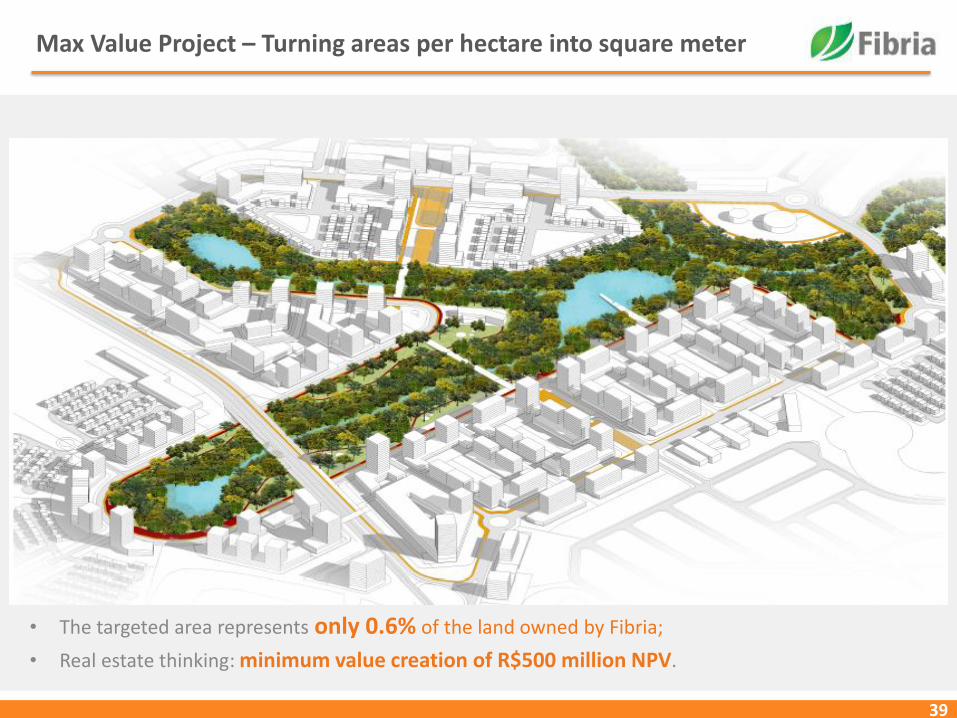
Max Value Project – Turning areas per hectare into square meter
• The targeted area represents only 0.6% of the land owned by Fibria;
• Real estate thinking: minimum value creation of R$500 million NPV.
40
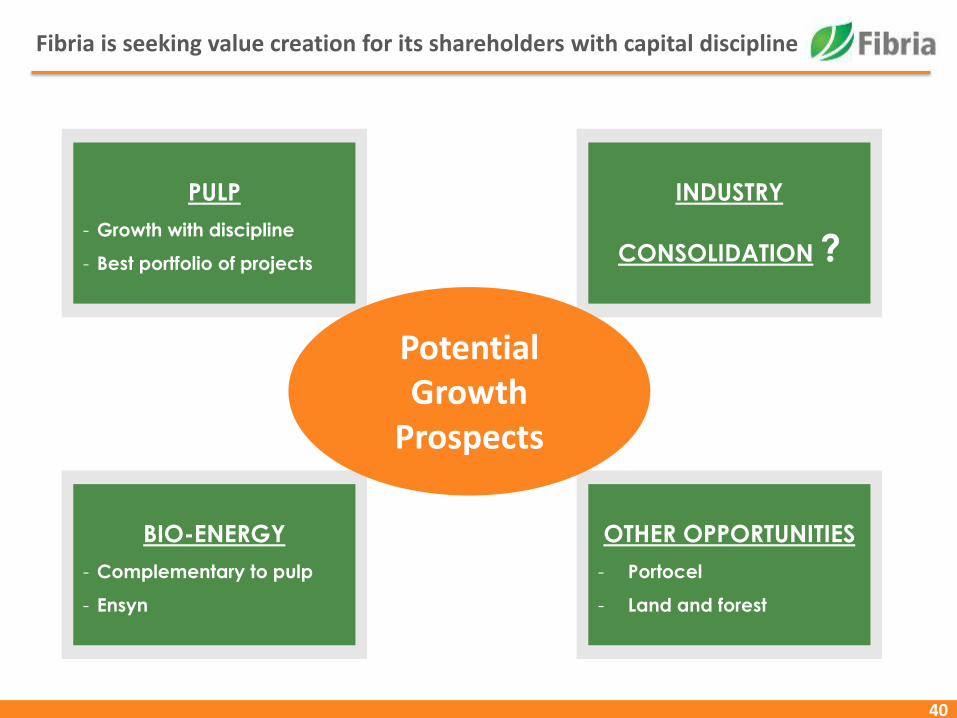
PULP
- Growth with discipline
- Best portfolio of projects
BIO-ENERGY
- Complementary to pulp
- Ensyn
INDUSTRY
CONSOLIDATION ?
OTHER OPPORTUNITIES
- Portocel
- Land and forest
Potential Growth
Prospects
Fibria is seeking value creation for its shareholders with capital discipline
41
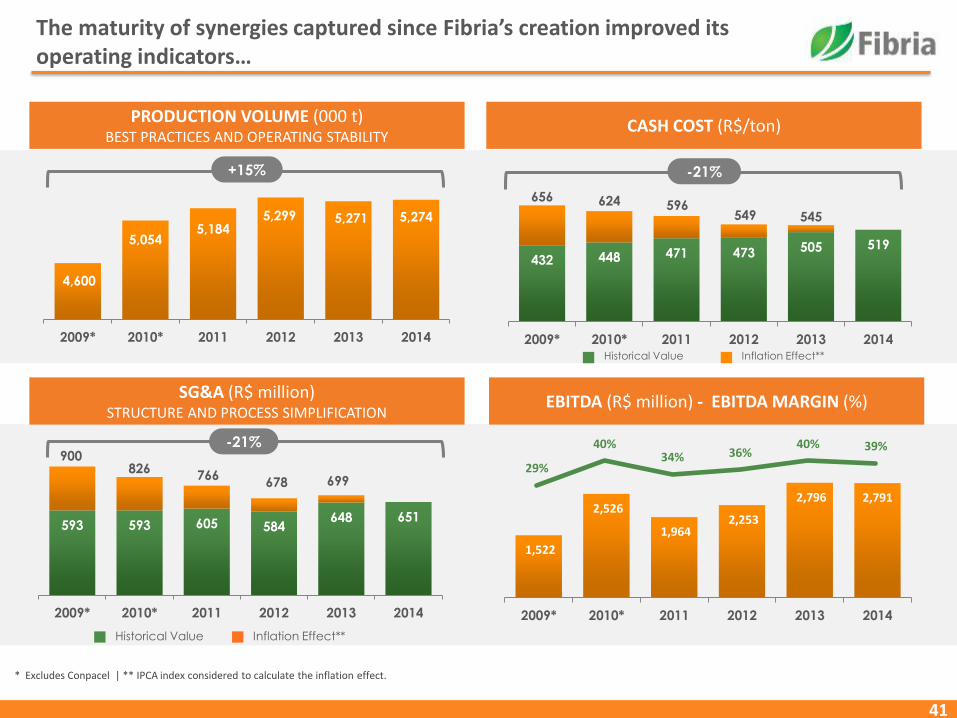
593 593 605 584648 651
900826
766678 699
2009* 2010* 2011 2012 2013 2014
4,600
5,0545,184
5,299 5,271 5,274
2009* 2010* 2011 2012 2013 2014
The maturity of synergies captured since Fibria’s creation improved its operating indicators…
+15%
PRODUCTION VOLUME (000 t)BEST PRACTICES AND OPERATING STABILITY
Historical Value Inflation Effect**
-21%
CASH COST (R$/ton)
Historical Value Inflation Effect**
-21%
SG&A (R$ million)STRUCTURE AND PROCESS SIMPLIFICATION
1,522
2,526
1,964 2,253
2,796 2,791
2009* 2010* 2011 2012 2013 2014
29%
40%34% 36%
40% 39%
EBITDA (R$ million) - EBITDA MARGIN (%)
* Excludes Conpacel | ** IPCA index considered to calculate the inflation effect.
432 448 471 473 505 519
656 624 596549 545
2009* 2010* 2011 2012 2013 2014
42
Back up

43
Fibria’s tax structure
Tax benefits (R$)
Fiscal - annual adjustment
Benefit Amount Maturity
Goodwill
(Aracruz
acquisition)
Annual tax deduction:
R$89 million (tax)
Remaining Balance Dec/14:
R$1.1 billion (base)
2018
Forestry Capex in
Mato Grosso do
Sul state
2014 tax deduction related to
depletion: R$37 millionUndefined
Tax loss carry forward and tax credits
Benefit Amount
Tax loss
carryforward
Balance up to Dec. 14: R$451
million (base)
Accumulated tax
credits
Balance Dec./2014:
- PIS/COFINS: R$570 million
- Withholding tax (IR and CSLL):
R$681 million
- Befiex: R$455 million
- Reintegra: R$37 million
Tax payment (cash basis)
2009 2010 2011 2012 2013 2014
R$ 7 million R$ 16 million R$ 4 million R$ 15 million R$ 31 million R$ 29 million
44
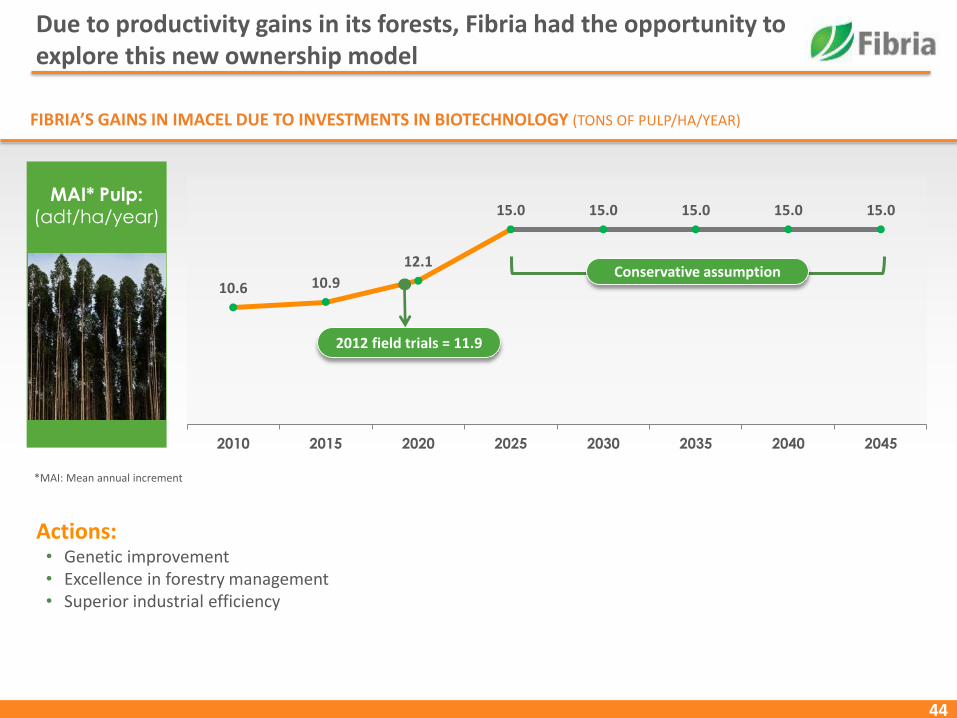
Due to productivity gains in its forests, Fibria had the opportunity to explore this new ownership model
MAI* Pulp: (adt/ha/year)
10.6 10.9
12.1
15.0 15.0 15.0 15.0 15.0
2010 2015 2020 2025 2030 2035 2040 2045
FIBRIA’S GAINS IN IMACEL DUE TO INVESTMENTS IN BIOTECHNOLOGY (TONS OF PULP/HA/YEAR)
2012 field trials = 11.9
Conservative assumption
*MAI: Mean annual increment
Actions: • Genetic improvement• Excellence in forestry management• Superior industrial efficiency
45
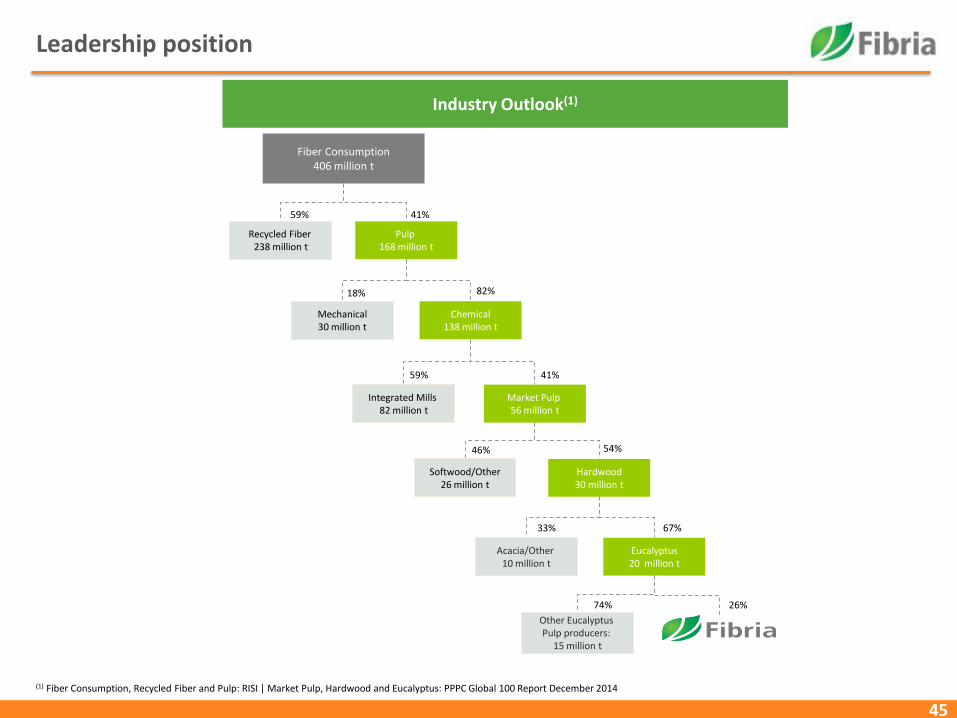
Leadership position
(1) Fiber Consumption, Recycled Fiber and Pulp: RISI | Market Pulp, Hardwood and Eucalyptus: PPPC Global 100 Report December 2014
Recycled Fiber 238 million t
46% 54%
59%
18% 82%
59% 41%
41%
33% 67%
26%74%
Fiber Consumption406 million t
Pulp 168 million t
Chemical138 million t
Mechanical30 million t
Integrated Mills 82 million t
Market Pulp 56 million t
Hardwood30 million t
Other Eucalyptus Pulp producers:
15 million t
Softwood/Other 26 million t
Acacia/Other 10 million t
Eucalyptus20 million t
Industry Outlook(1)
46
Supply structural changes puts pressure on the industry
MARKET PULP CAPACITY RANKING 2014 (000T) MAIN PROJECTS
Project Country Capacity Timing Fiber Status
CMPC Guaíba II Brazil 1.3 Mt 2Q2015 BEKP Confirmed
Klabin Paraná Brazil 1.5 Mt 2Q2016BEKP/
BSKP/FluffConfirmed
APP South Sumatra Indonesia 2.0 Mt 1Q2017 BHKP Confirmed
Fibria Três Lagoas II Brazil 1.75 Mt - BEKP Unconfirmed
COST CURVE EVOLUTION
USD
/Ad
t, 2
01
3 c
ost
leve
l
Cumulative Capacity Million t/a
Cost position of marginal
producer
Source: Hawkins Wright , Poyry and Fibria Analysis (as of Dec. 2014).
0 2000 4000 6000
ENCE
Canfor
Resolute Forest
Sodra
IP
Domtar
Mercer
Eldorado
Ilim
Weyerhaeuser
Stora Enso
Metsa Group
Paper Excellence
Georgia Pacific
UPM-Kymmene
CMPC
Suzano
Arauco
APRIL
Fibria
Bleached Softwood Kraft Pulp (BSKP)
Bleached Hardwood Kraft Pulp (BHKP)
Unbleached Kraft Pulp (UKP)
Mechanical Pulp (MP)
47
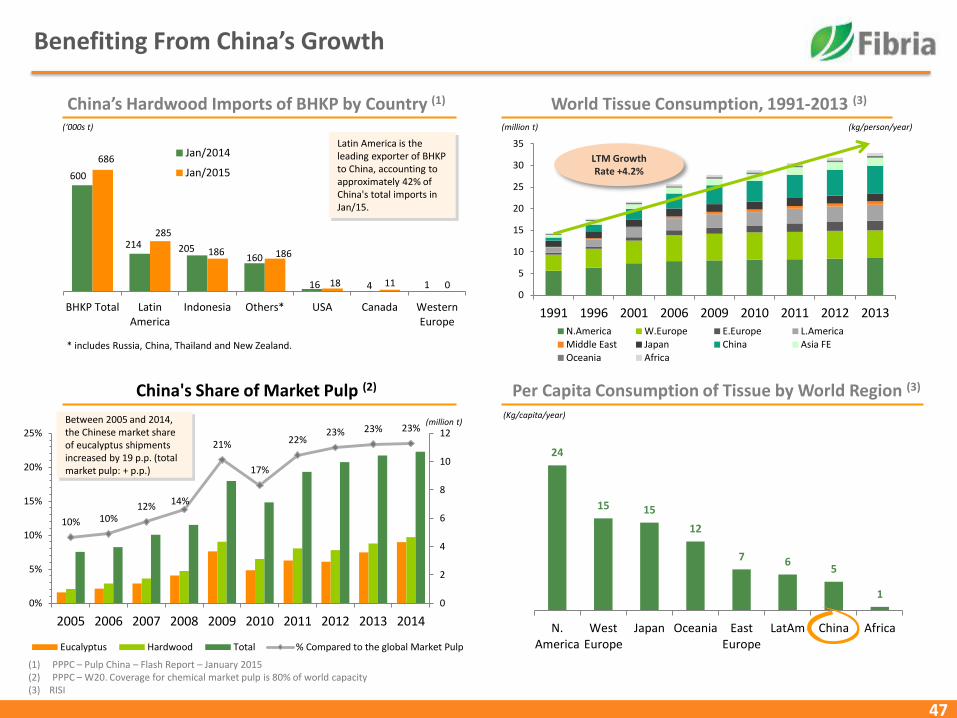
World Tissue Consumption, 1991-2013 (3)
Per Capita Consumption of Tissue by World Region (3)China's Share of Market Pulp (2)
24
15 15
12
7 65
1
N.America
WestEurope
Japan Oceania EastEurope
LatAm China Africa
10% 10%12% 14%
21%
17%
22%23% 23% 23%
0
2
4
6
8
10
12
0%
5%
10%
15%
20%
25%
2005 2006 2007 2008 2009 2010 2011 2012 2013 2014
Eucalyptus Hardwood Total % Compared to the global Market Pulp
(Kg/capita/year)
(million t)(‘000s t) (kg/person/year)
Between 2005 and 2014, the Chinese market share of eucalyptus shipments increased by 19 p.p. (total market pulp: + p.p.)
* includes Russia, China, Thailand and New Zealand.
0
5
10
15
20
25
30
35
1991 1996 2001 2006 2009 2010 2011 2012 2013N.America W.Europe E.Europe L.AmericaMiddle East Japan China Asia FEOceania Africa
LTM Growth Rate +4.2%
Benefiting From China’s Growth
China’s Hardwood Imports of BHKP by Country (1)
(1) PPPC – Pulp China – Flash Report – January 2015(2) PPPC – W20. Coverage for chemical market pulp is 80% of world capacity (3) RISI
(million t)
600
214 205160
16 4 1
686
285
186 186
18 11 0
BHKP Total LatinAmerica
Indonesia Others* USA Canada WesternEurope
Jan/2014
Jan/2015
Latin America is the leading exporter of BHKP to China, accounting to approximately 42% of China's total imports in Jan/15.
48
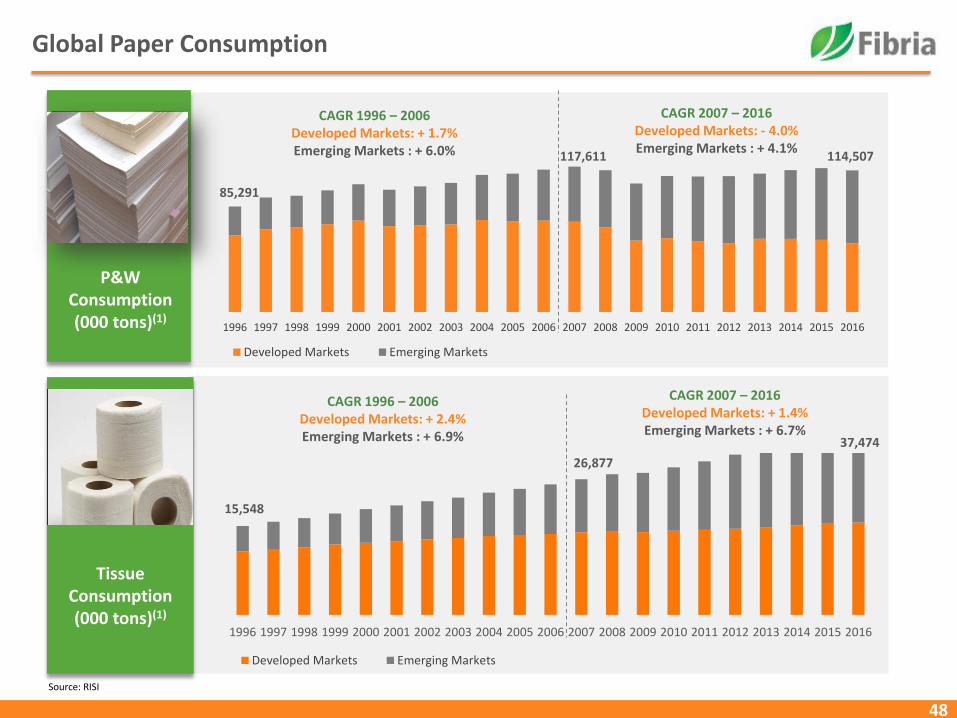
Global Paper Consumption
1996 1997 1998 1999 2000 2001 2002 2003 2004 2005 2006 2007 2008 2009 2010 2011 2012 2013 2014 2015 2016
Developed Markets Emerging Markets
1996 1997 1998 1999 2000 2001 2002 2003 2004 2005 2006 2007 2008 2009 2010 2011 2012 2013 2014 2015 2016
Developed Markets Emerging Markets
CAGR 1996 – 2006Developed Markets: + 1.7%Emerging Markets : + 6.0%
85,291
117,611
15,548
37,474
P&W Consumption (000 tons)(1)
Tissue Consumption (000 tons)(1)
114,507
CAGR 2007 – 2016Developed Markets: - 4.0%Emerging Markets : + 4.1%
CAGR 1996 – 2006Developed Markets: + 2.4%Emerging Markets : + 6.9%
CAGR 2007 – 2016Developed Markets: + 1.4%Emerging Markets : + 6.7%
26,877
Source: RISI