BP second quarter 2016 results presentation slides
32
Cherry Point refinery, Washington 2Q 2016 Results 26 July 2016
-
Upload
bp -
Category
Economy & Finance
-
view
154 -
download
0
Transcript of BP second quarter 2016 results presentation slides
Cherry Point refinery, Washington
2Q 2016 Results
26 July 2016
ATA fabrication yard, Azerbaijan
Jess Mitchell
Head of Group Investor Relations
Cautionary statement
Forward-looking statements - cautionary statement
In order to utilize the ‘safe harbor’ provisions of the United States Private Securities Litigation Reform Act of 1995 (the ‘PSLRA’), BP is providing the following cautionary statement. This
presentation and the associated slides and discussion contain forward-looking statements – that is, statements related to future, not past events – with respect to the financial condition, results of
operations and business of BP and certain of the expectations, intentions, plans and objectives of BP with respect to these items, in particular statements regarding BP’s medium-term goal of
balancing organic sources and uses of cash by 2017 at $50–55/bbl; expectations regarding future oil and gas prices and market trends, including volatility and levelling out of supply; expectations
regarding BP’s growth in the near term and to 2030, including future construction and the timing thereof and future production levels and capacity; plans and expectations regarding BP’s goal of
growing sustainable free cash flow and distributions; BP’s plans and expectations regarding the sanctioning of future projects; expectations regarding BP’s share of Rosneft’s production and net
income and the amount of dividend payable by Rosneft to BP and BP’s organic capital expenditures and cash cost savings through 2017; expectations with respect to the total amounts that will
ultimately be paid by BP in relation to the Gulf of Mexico incident and the timing thereof; plans and expectations regarding Upstream growth to 2030, including increasing capacity, production and
contribution to free cash flow; plans and expectations regarding Downstream contribution to free cash flow and refining margins and growth opportunities; expectations regarding Upstream third-
quarter 2016 reported production, Downstream third-quarter 2016 turnaround activity and Other business and corporate 2016 quarterly charges; expectations regarding rebalancing of sources and
uses of cash including the effect of rebalancing on free cash flow, cash flows expected from Upstream project start-ups and from Downstream and expectations regarding future investment and
distributions to shareholders; expectations regarding the value of divestments in 2016 and thereafter, non-operating restructuring charges in 2016 and the impact on cash flow through 2017,
Upstream activities in Indonesia, Egypt and the Gulf of Mexico and Upstream base decline and production costs; and expectations regarding Downstream cost efficiencies, performance
improvement, programmes and headcount reduction and expectations regarding the fuels marketing and lubricants businesses. By their nature, forward-looking statements involve risk and
uncertainty because they relate to events and depend on circumstances that will or may occur in the future and are outside the control of BP. Actual results may differ materially from those
expressed in such statements, depending on a variety of factors, including: the specific factors identified in the discussions accompanying such forward-looking statements; the receipt of relevant
third party and/or regulatory approvals; the timing and level of maintenance and/or turnaround activity; the timing and volume of refinery additions and outages; the timing of bringing new fields
onstream; the timing, quantum and nature of certain divestments; future levels of industry product supply, demand and pricing, including supply growth in North America; OPEC quota restrictions;
PSA effects; operational and safety problems; potential lapses in product quality; economic and financial market conditions generally or in various countries and regions; political stability and
economic growth in relevant areas of the world; changes in laws and governmental regulations; regulatory or legal actions including the types of enforcement action pursued and the nature of
remedies sought or imposed; the actions of prosecutors, regulatory authorities and courts; exchange rate fluctuations; development and use of new technology; recruitment and retention of a
skilled workforce; the success or otherwise of partnering; the actions of competitors, trading partners, contractors, subcontractors, creditors, rating agencies and others; our access to future credit
resources; business disruption and crisis management; the impact on our reputation of ethical misconduct and non-compliance with regulatory obligations; trading losses; major uninsured losses;
decisions by Rosneft’s management and board of directors; the actions of contractors; natural disasters and adverse weather conditions; changes in public expectations and other changes to
business conditions; wars and acts of terrorism; cyber-attacks or sabotage; and other factors discussed under “Risk factors” in BP Annual Report and Form 20-F 2015 as filed with the US
Securities and Exchange Commission.
This document contains references to non-proved resources and production outlooks based on non-proved resources that the SEC's rules prohibit us from including in our filings with the SEC. U.S.
investors are urged to consider closely the disclosures in our Form 20-F, SEC File No. 1-06262. This form is available on our website at www.bp.com. You can also obtain this form from the SEC
by calling 1-800-SEC-0330 or by logging on to their website at www.sec.gov
Reconciliations to GAAP - This presentation also contains financial information which is not presented in accordance with generally accepted accounting principles (GAAP). A quantitative
reconciliation of this information to the most directly comparable financial measure calculated and presented in accordance with GAAP can be found on our website at www.bp.com.
Tables and projections in this presentation are BP projections unless otherwise stated.
July 2016
Deepsea Aberdeen drilling rig, North Sea
Bob Dudley
Group Chief Executive

5
Agenda
Environment
Overview
2Q 2016 results
Financial frame
Business update
Q&A
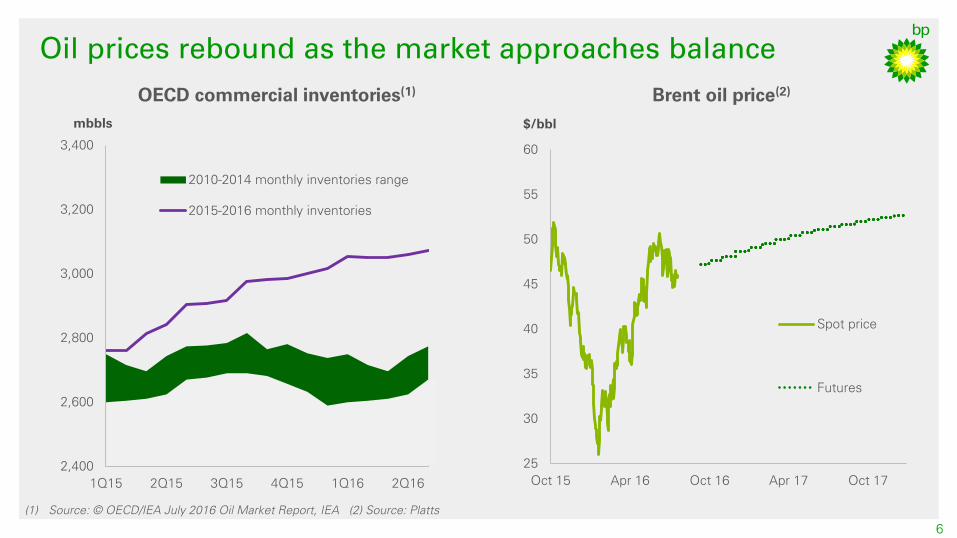
25
30
35
40
45
50
55
60
Oct 15 Apr 16 Oct 16 Apr 17 Oct 17
Spot price
Futures
Oil prices rebound as the market approaches balance
$/bbl
OECD commercial inventories(1)
(1) Source: © OECD/IEA July 2016 Oil Market Report, IEA (2) Source: Platts
Brent oil price(2)
6
mbbls
2,400
2,600
2,800
3,000
3,200
3,400
1Q15 2Q15 3Q15 4Q15 1Q16 2Q16
2010-2014 monthly inventories range
2015-2016 monthly inventories
7
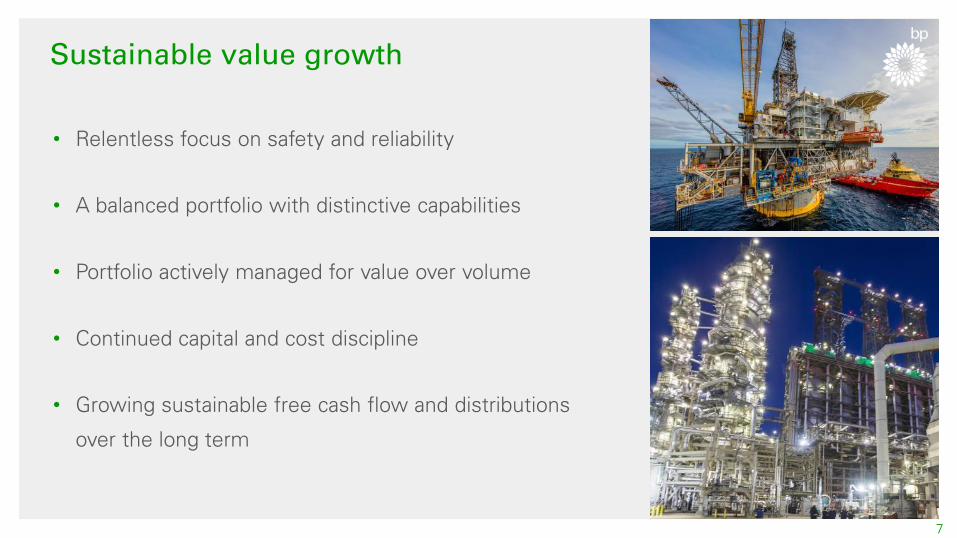
• Relentless focus on safety and reliability
• A balanced portfolio with distinctive capabilities
• Portfolio actively managed for value over volume
• Continued capital and cost discipline
• Growing sustainable free cash flow and distributions
over the long term
Sustainable value growth
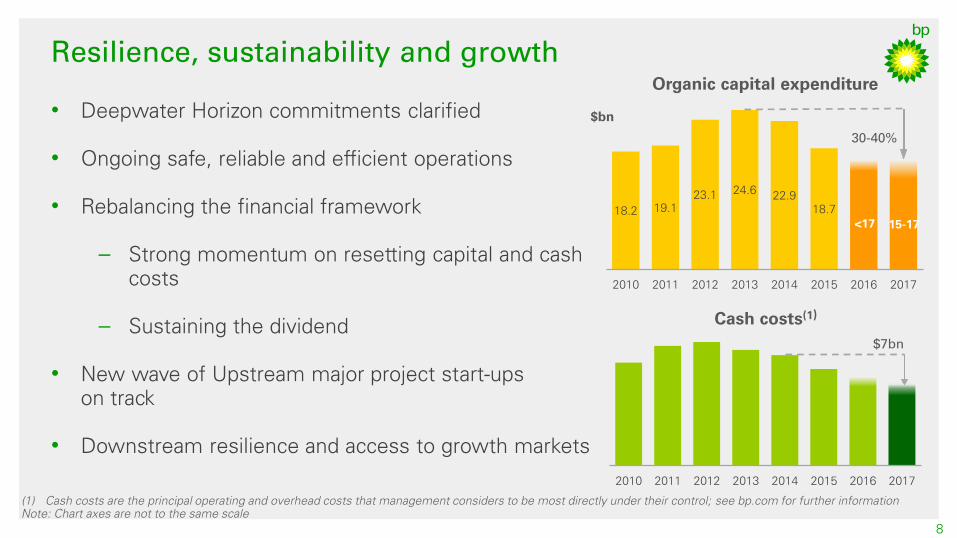
• Deepwater Horizon commitments clarified
• Ongoing safe, reliable and efficient operations
• Rebalancing the financial framework
– Strong momentum on resetting capital and cash
costs
– Sustaining the dividend
• New wave of Upstream major project start-ups
on track
• Downstream resilience and access to growth markets
18.2 19.1
23.1 24.6
22.9
18.7
2010 2011 2012 2013 2014 2015 2016 2017
Organic capital expenditure
$bn
15-17 <17
Resilience, sustainability and growth
8
30-40%
2010 2011 2012 2013 2014 2015 2016 2017
Cash costs(1)
$7bn
(1) Cash costs are the principal operating and overhead costs that management considers to be most directly under their control; see bp.com for further information
Note: Chart axes are not to the same scale
Brian Gilvary
Chief Financial Officer
Whiting refinery, Indiana
8
9
10
11
12
13
14
15
16
17
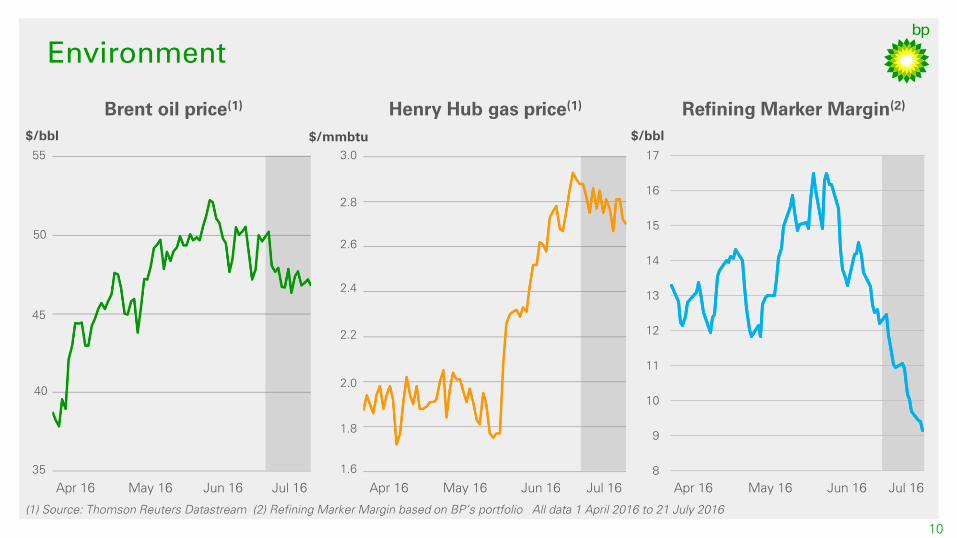
Environment
Brent oil price(1)
Henry Hub gas price(1)
Refining Marker Margin(2)
(1) Source: Thomson Reuters Datastream (2) Refining Marker Margin based on BP’s portfolio All data 1 April 2016 to 21 July 2016
10
Apr 16 May 16 Jun 16
$/bbl
Apr 16 May 16 Jun 16
40
45
50
35
Apr 16 May 16 Jun 16
2.6
2.2
2.0
1.8
1.6
2.4
$/mmbtu
55
$/bbl
2.8
3.0
Jul 16 Jul 16 Jul 16
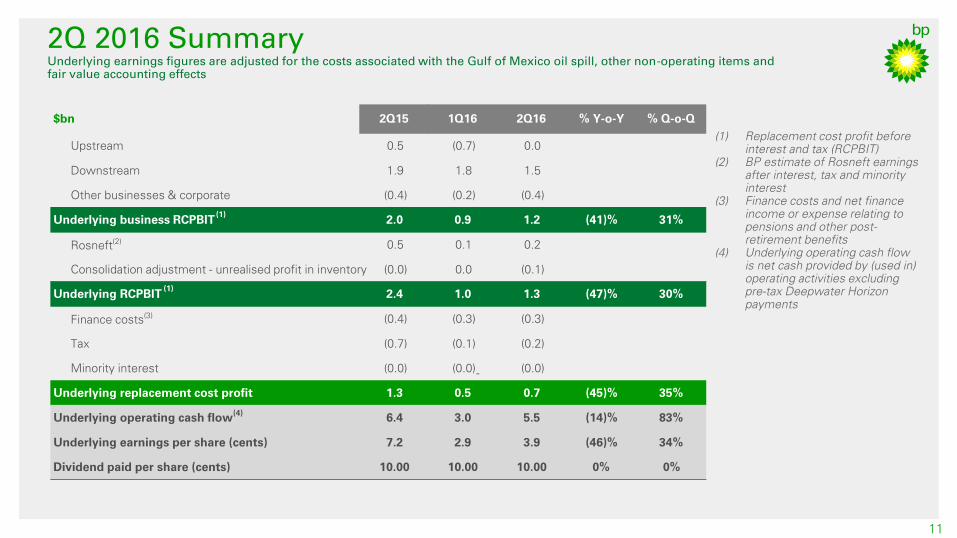
2Q 2016 Summary Underlying earnings figures are adjusted for the costs associated with the Gulf of Mexico oil spill, other non-operating items and
fair value accounting effects
11
(1) Replacement cost profit before
interest and tax (RCPBIT)
(2) BP estimate of Rosneft earnings
after interest, tax and minority
interest
(3) Finance costs and net finance
income or expense relating to
pensions and other post-
retirement benefits
(4) Underlying operating cash flow
is net cash provided by (used in)
operating activities excluding
pre-tax Deepwater Horizon
payments
-
$bn 2Q15 1Q16 2Q16 % Y-o-Y % Q-o-Q
Upstream 0.5 (0.7) 0.0
Downstream 1.9 1.8 1.5
Other businesses & corporate (0.4) (0.2) (0.4)
Underlying business RCPBIT (1)
2.0 0.9 1.2 (41)% 31%
Rosneft (2) 0.5 0.1 0.2
Consolidation adjustment - unrealised profit in inventory (0.0) 0.0 (0.1)
Underlying RCPBIT (1)
2.4 1.0 1.3 (47)% 30%
Finance costs (3) (0.4) (0.3) (0.3)
Tax (0.7) (0.1) (0.2)
Minority interest (0.0) (0.0) (0.0)
Underlying replacement cost profit 1.3 0.5 0.7 (45)% 35%
Underlying operating cash flow (4)
6.4 3.0 5.5 (14)% 83%
Underlying earnings per share (cents) 7.2 2.9 3.9 (46)% 34%
Dividend paid per share (cents) 10.00 10.00 10.00 0% 0%
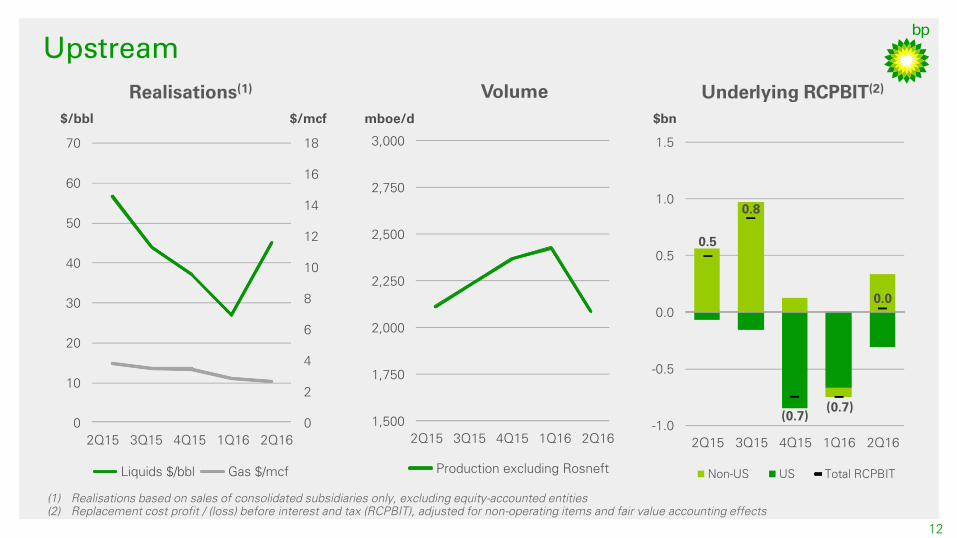
Upstream
12
Realisations(1)
Volume Underlying RCPBIT(2)
(1) Realisations based on sales of consolidated subsidiaries only, excluding equity-accounted entities
(2) Replacement cost profit / (loss) before interest and tax (RCPBIT), adjusted for non-operating items and fair value accounting effects
0
2
4
6
8
10
12
14
16
18
0
10
20
30
40
50
60
70
2Q15 3Q15 4Q15 1Q16 2Q16
$/mcf $/bbl
Liquids $/bbl Gas $/mcf
1,500
1,750
2,000
2,250
2,500
2,750
3,000
2Q15 3Q15 4Q15 1Q16 2Q16
Production excluding Rosneft
mboe/d
0.5
0.8
(0.7) (0.7)
0.0
- 1.0
- 0.5
0.0
0.5
1.0
1.5
2Q15 3Q15 4Q15 1Q16 2Q16
Non - US US Total RCPBIT
$bn
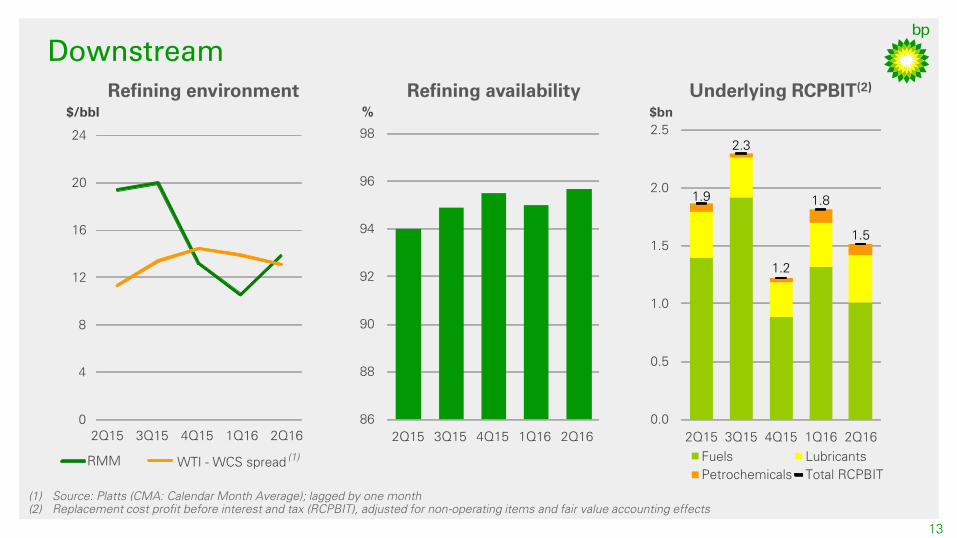
Downstream
13
Refining environment Refining availability Underlying RCPBIT(2)
(1) Source: Platts (CMA: Calendar Month Average); lagged by one month
(2) Replacement cost profit before interest and tax (RCPBIT), adjusted for non-operating items and fair value accounting effects
(1) WTI - WCS spread
0
4
8
12
16
20
24
2Q15 3Q15 4Q15 1Q16 2Q16
$/bbl
RMM
1.9
2.3
1.2
1.8
1.5
0.0
0.5
1.0
1.5
2.0
2.5
2Q15 3Q15 4Q15 1Q16 2Q16
$bn
Fuels Lubricants
Petrochemicals Total RCPBIT
86
88
90
92
94
96
98
2Q15 3Q15 4Q15 1Q16 2Q16
%
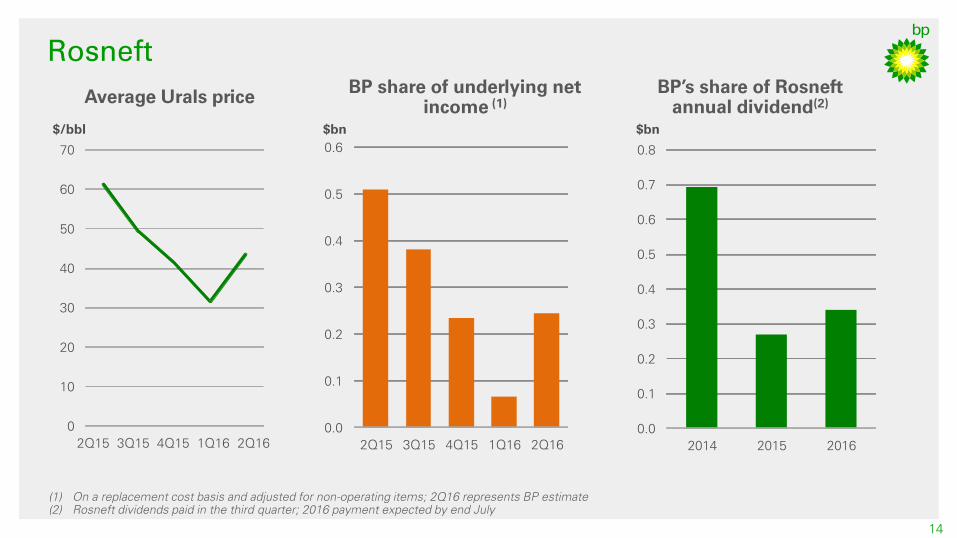
Rosneft
14
Average Urals price BP’s share of Rosneft
annual dividend(2)
BP share of underlying net
income (1)
(1) On a replacement cost basis and adjusted for non-operating items; 2Q16 represents BP estimate
(2) Rosneft dividends paid in the third quarter; 2016 payment expected by end July
0
10
20
30
40
50
60
70
2Q15 3Q15 4Q15 1Q16 2Q16
$/bbl
0.0
0.1
0.2
0.3
0.4
0.5
0.6
2Q15 3Q15 4Q15 1Q16 2Q16
$bn
0.0
0.1
0.2
0.3
0.4
0.5
0.6
0.7
0.8
2014 2015 2016
$bn
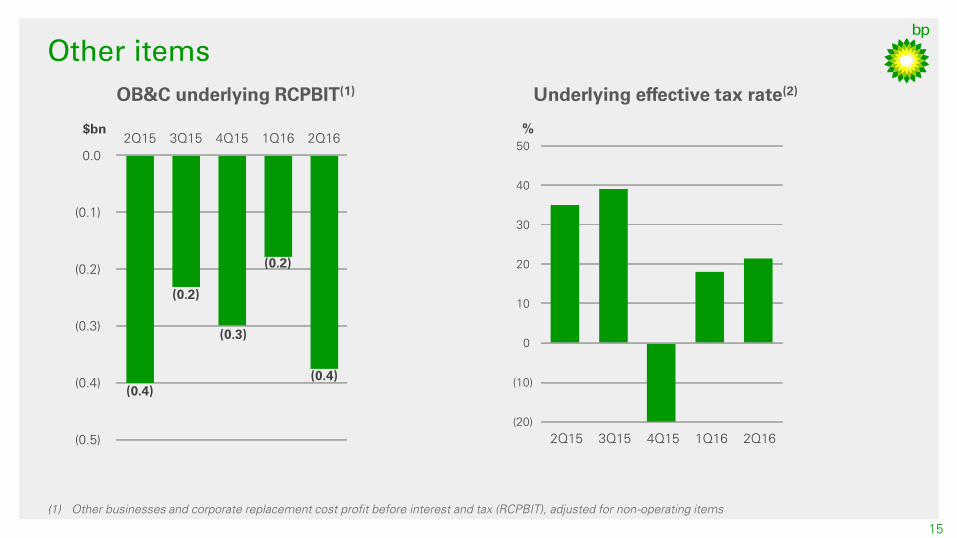
Other items
15
(1) Other businesses and corporate replacement cost profit before interest and tax (RCPBIT), adjusted for non-operating items
OB&C underlying RCPBIT(1)
Underlying effective tax rate(2)
(0.4)
(0.2)
(0.3)
(0.2)
(0.4)
(0.5)
(0.4)
(0.3)
(0.2)
(0.1)
0.0
2Q15 3Q15 4Q15 1Q16 2Q16 $bn
(20)
(10)
0
10
20
30
40
50
2Q15 3Q15 4Q15 1Q16 2Q16
%
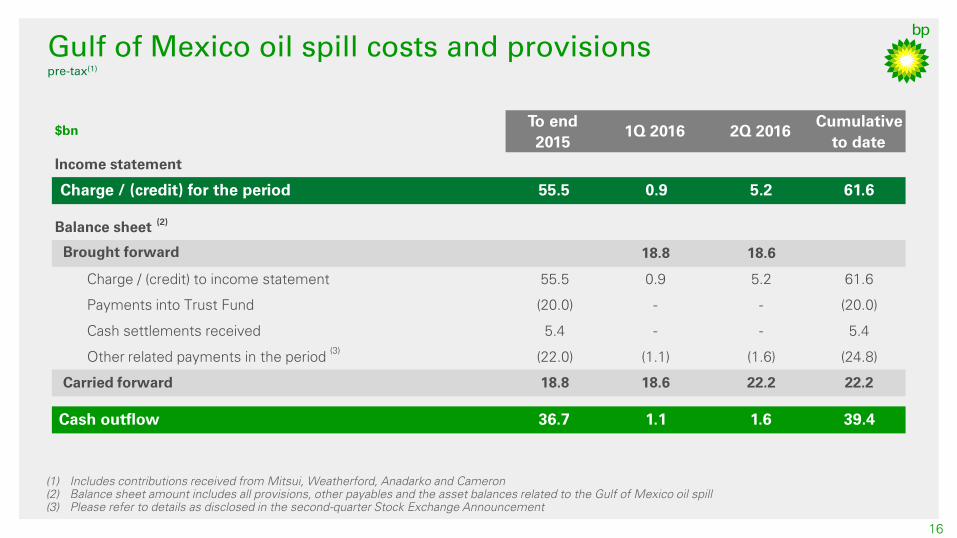
Gulf of Mexico oil spill costs and provisions
pre-tax(1)
16
(1) Includes contributions received from Mitsui, Weatherford, Anadarko and Cameron
(2) Balance sheet amount includes all provisions, other payables and the asset balances related to the Gulf of Mexico oil spill
(3) Please refer to details as disclosed in the second-quarter Stock Exchange Announcement
$bn To end
2015 1Q 2016 2Q 2016
Cumulative
to date
Income statement
Charge / (credit) for the period 55.5 0.9 5.2 61.6
Balance sheet (2)
18.8 18.6
Charge / (credit) to income statement 55.5 0.9 5.2 61.6
Payments into Trust Fund (20.0) - - (20.0)
Cash settlements received 5.4 - - 5.4
Other related payments in the period (3)
(22.0) (1.1) (1.6) (24.8)
Carried forward 18.8 18.6 22.2 22.2
Cash outflow 36.7 1.1 1.6 39.4
Brought forward
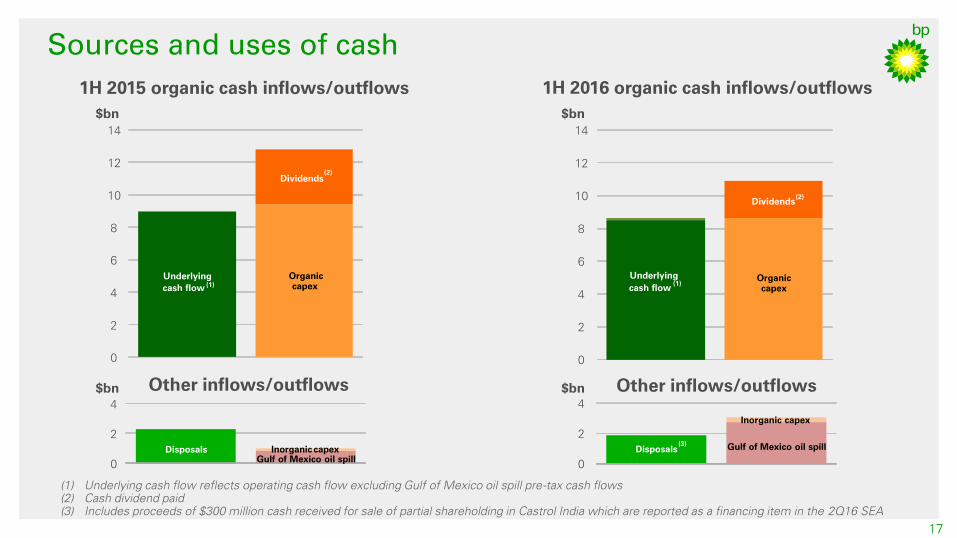
Sources and uses of cash
17
1H 2015 organic cash inflows/outflows
1H 2016 organic cash inflows/outflows
(1) Underlying cash flow reflects operating cash flow excluding Gulf of Mexico oil spill pre-tax cash flows
(2) Cash dividend paid
(3) Includes proceeds of $300 million cash received for sale of partial shareholding in Castrol India which are reported as a financing item in the 2Q16 SEA
Other inflows/outflows
Other inflows/outflows
$bn $bn
$bn $bn
Organic capex
Dividends
0
2
4
6
8
10
12
14
Underlying
cash flow (1)
0
2
4
Gulf of Mexico oil spill Disposals Inorganic capex
(2)
Organic capex
Dividends
0
2
4
6
8
10
12
14
Underlying
cash flow (1)
0
2
4
Gulf of Mexico oil spill Disposals
Inorganic capex
(2)
(3)
2014 2015 2016 2017 2020
18
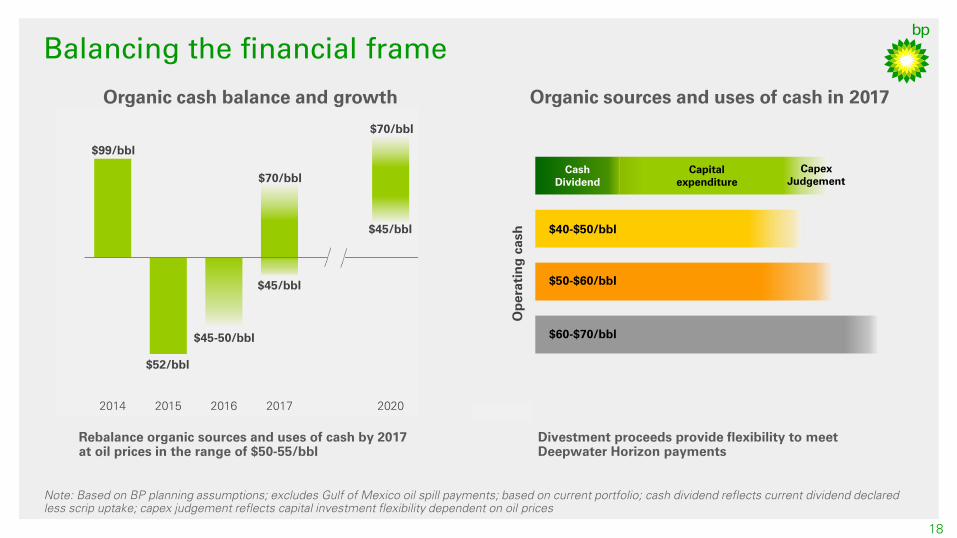
Balancing the financial frame
Note: Based on BP planning assumptions; excludes Gulf of Mexico oil spill payments; based on current portfolio; cash dividend reflects current dividend declared
less scrip uptake; capex judgement reflects capital investment flexibility dependent on oil prices
$99/bbl
$52/bbl
$45/bbl
$70/bbl
Organic cash balance and growth Organic sources and uses of cash in 2017
Rebalance organic sources and uses of cash by 2017
at oil prices in the range of $50-55/bbl
Cash
Dividend
Capex
Judgement
Capital
expenditure
0 5 10 15 20 25 30
Op
eratin
g cash
Divestment proceeds provide flexibility to meet
Deepwater Horizon payments
$40-$50/bbl
$50-$60/bbl
$60-$70/bbl
$45/bbl
$70/bbl
$45-50/bbl
0
10
20
30
40
20-30%
10-20%
20-30%
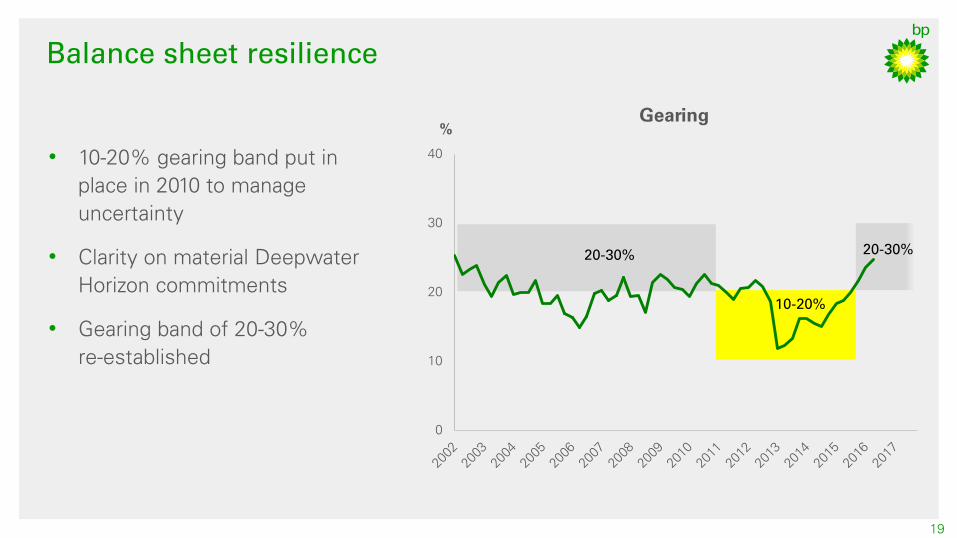
19
Balance sheet resilience
• 10-20% gearing band put in
place in 2010 to manage
uncertainty
• Clarity on material Deepwater
Horizon commitments
• Gearing band of 20-30%
re-established
%
Gearing

Bob Dudley
Group Chief Executive
Ocean Victory drilling rig, Trinidad and Tobago
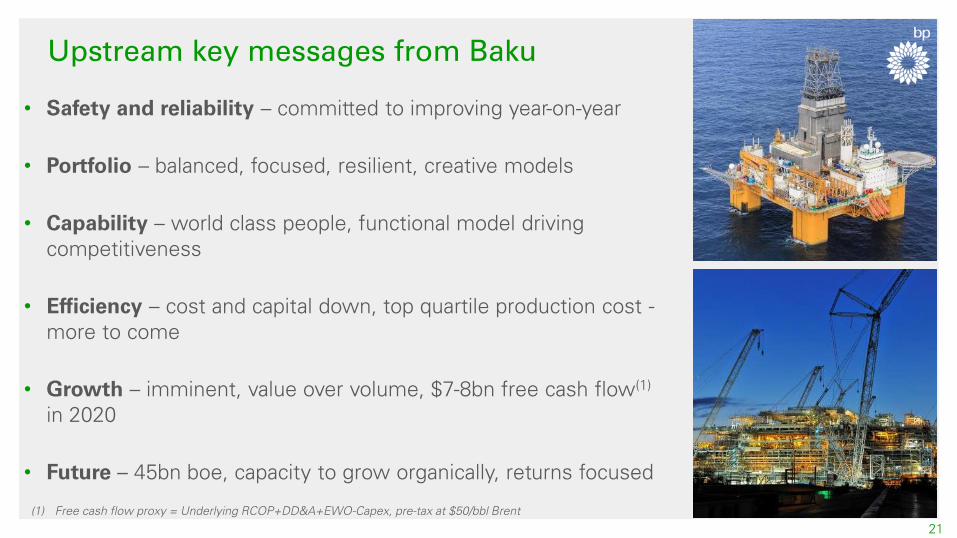
Upstream key messages from Baku
21
• Safety and reliability – committed to improving year-on-year
• Portfolio – balanced, focused, resilient, creative models
• Capability – world class people, functional model driving
competitiveness
• Efficiency – cost and capital down, top quartile production cost -
more to come
• Growth – imminent, value over volume, $7-8bn free cash flow(1)
in 2020
• Future – 45bn boe, capacity to grow organically, returns focused
(1) Free cash flow proxy = Underlying RCOP+DD&A+EWO-Capex, pre-tax at $50/bbl Brent
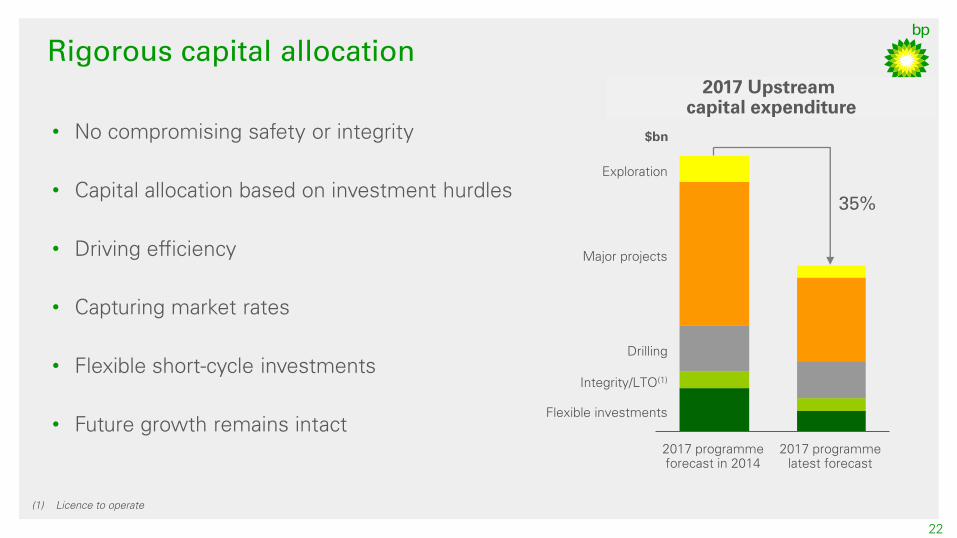
Rigorous capital allocation
22
Integrity/LTO(1)
Drilling
Flexible investments
2017 programme
latest forecast
2017 programme
forecast in 2014
Major projects
Exploration
35%
• No compromising safety or integrity
• Capital allocation based on investment hurdles
• Driving efficiency
• Capturing market rates
• Flexible short-cycle investments
• Future growth remains intact
2017 Upstream
capital expenditure
(1) Licence to operate
$bn
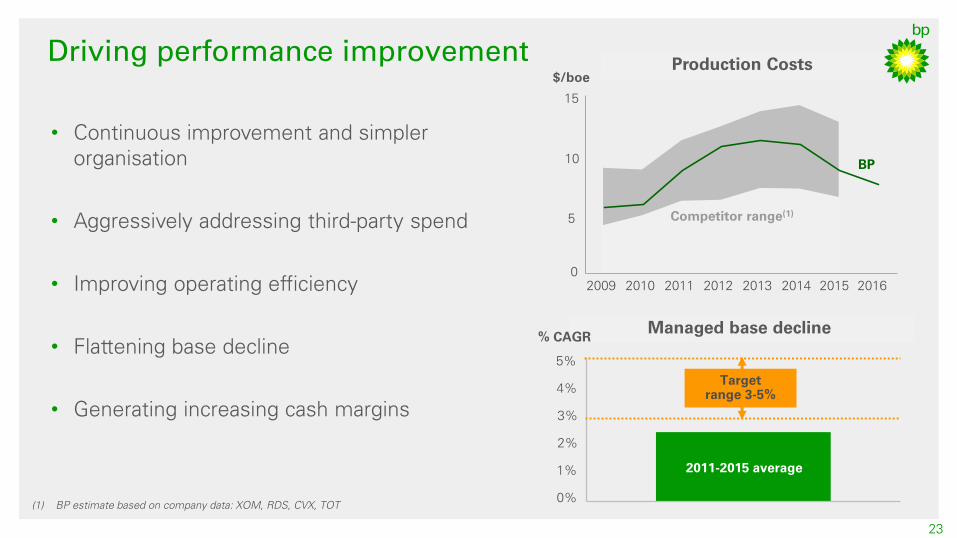
Driving performance improvement
• Continuous improvement and simpler
organisation
• Aggressively addressing third-party spend
• Improving operating efficiency
• Flattening base decline
• Generating increasing cash margins
Competitor range(1)
0
2016 2015 2014 2009 2010 2011 2012 2013
10
15
5
Production Costs
BP
$/boe
5%
4%
3%
2%
1%
0%
2011-2015 average
Managed base decline
Target
range 3-5%
% CAGR
23
(1) BP estimate based on company data: XOM, RDS, CVX, TOT
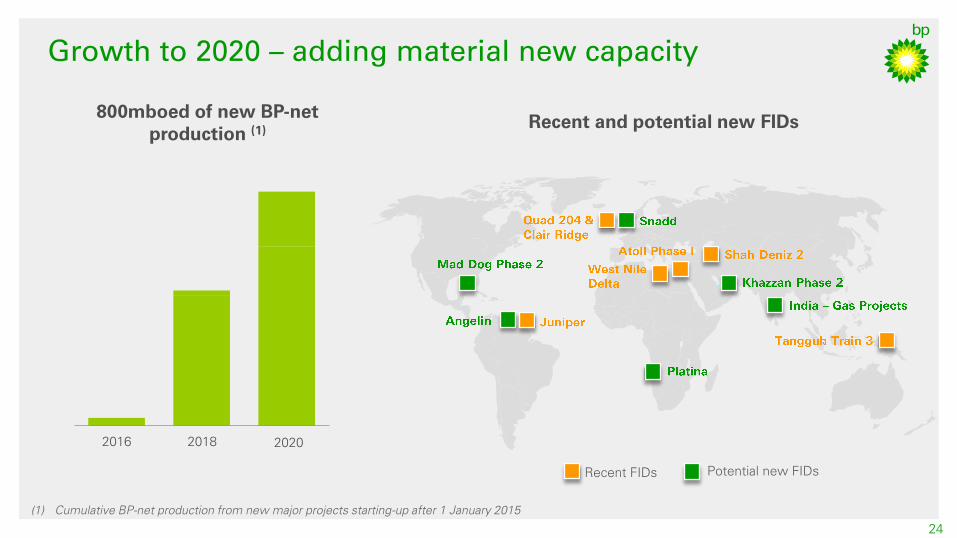
Growth to 2020 – adding material new capacity
24
2020 2018 2016
800mboed of new BP-net
production (1)
Recent and potential new FIDs
Potential new FIDs Recent FIDs
(1) Cumulative BP-net production from new major projects starting-up after 1 January 2015
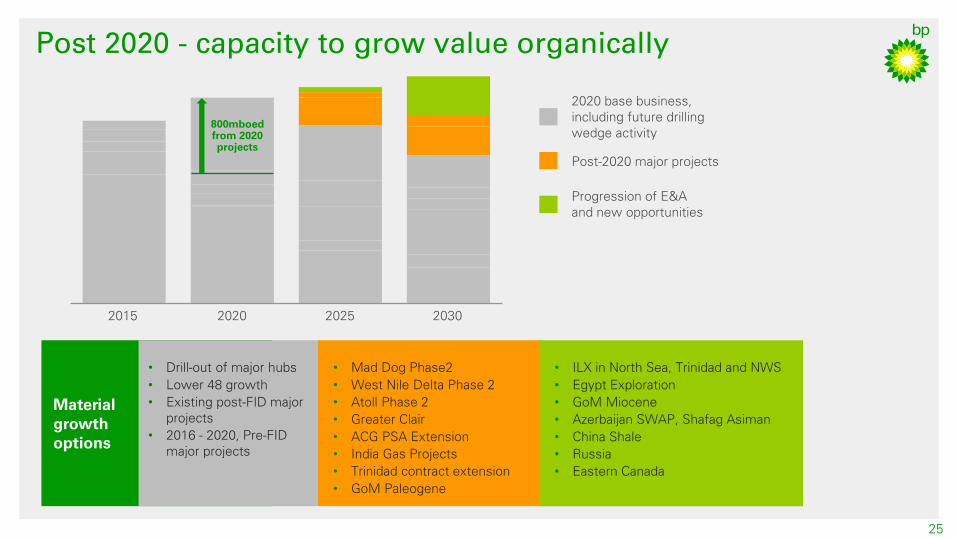
Post 2020 - capacity to grow value organically
25
2020 2030 2025 2015
Progression of E&A
and new opportunities
Post-2020 major projects
2020 base business,
including future drilling
wedge activity
Material
growth
options
• Mad Dog Phase2
• West Nile Delta Phase 2
• Atoll Phase 2
• Greater Clair
• ACG PSA Extension
• India Gas Projects
• Trinidad contract extension
• GoM Paleogene
• Drill-out of major hubs
• Lower 48 growth
• Existing post-FID major
projects
• 2016 - 2020, Pre-FID
major projects
• ILX in North Sea, Trinidad and NWS
• Egypt Exploration
• GoM Miocene
• Azerbaijan SWAP, Shafag Asiman
• China Shale
• Russia
• Eastern Canada
800mboed
from 2020
projects
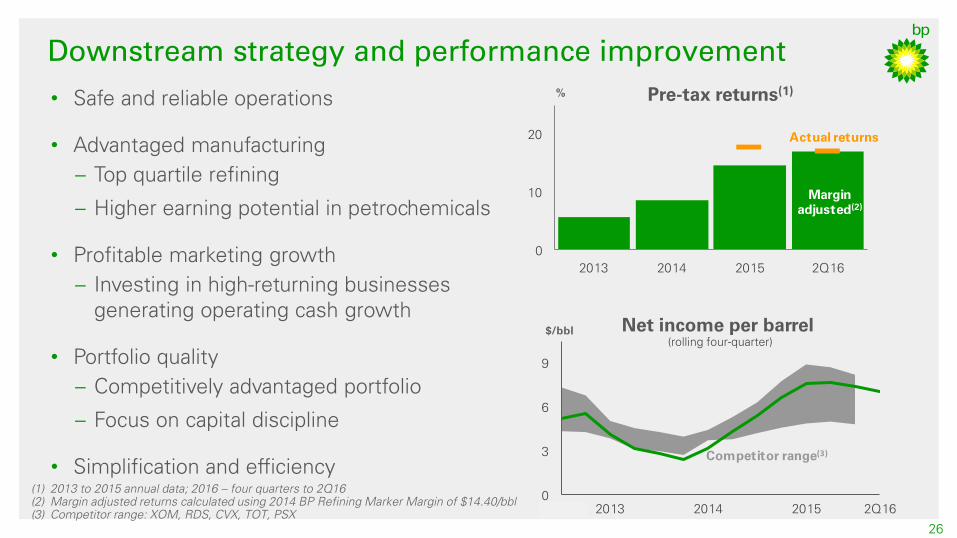
0
3
6
9
2013 2014 2015 2Q16
$/bbl
Competitor range(3)
0
10
20
2013 2014 2015 2Q16
%
Actual returns
Margin
adjusted(2)
Downstream strategy and performance improvement
26
Net income per barrel
(rolling four-quarter)
(1) 2013 to 2015 annual data; 2016 – four quarters to 2Q16
(2) Margin adjusted returns calculated using 2014 BP Refining Marker Margin of $14.40/bbl
(3) Competitor range: XOM, RDS, CVX, TOT, PSX
• Safe and reliable operations
• Advantaged manufacturing
– Top quartile refining
– Higher earning potential in petrochemicals
• Profitable marketing growth
– Investing in high-returning businesses
generating operating cash growth
• Portfolio quality
– Competitively advantaged portfolio
– Focus on capital discipline
• Simplification and efficiency
Pre-tax returns(1)
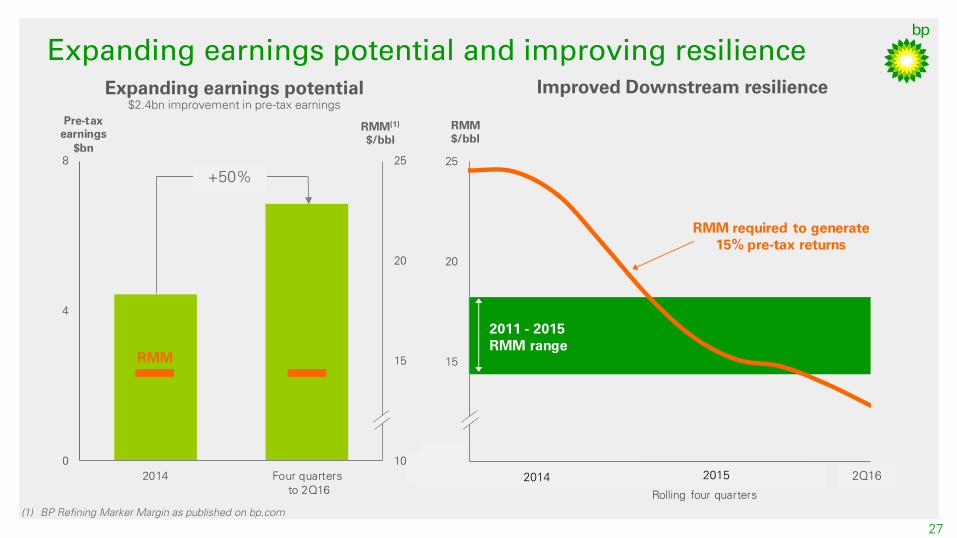
10
15
20
25
Rolling four quarters
RMM required to generate
15% pre-tax returns
2014 2015
2011 - 2015
RMM range
RMM
$/bbl
10
15
20
25
0
4
8
2014 Four quarters
to 2Q16
RMM
RMM(1)
$/bbl
Pre-tax
earnings
$bn
Expanding earnings potential and improving resilience
27
Improved Downstream resilience
(1) BP Refining Marker Margin as published on bp.com
Expanding earnings potential
$2.4bn improvement in pre-tax earnings
2014 2015 2Q16
+50%
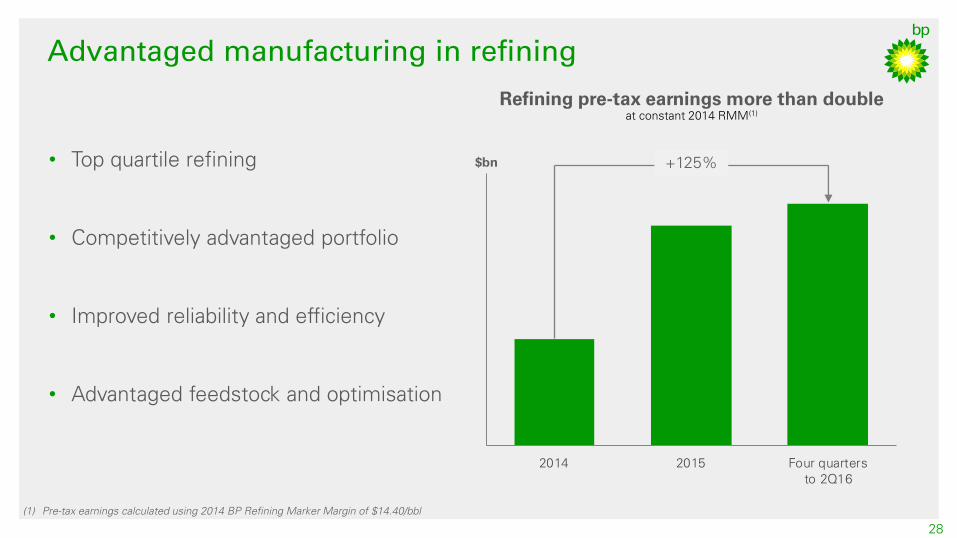
Advantaged manufacturing in refining
28
• Top quartile refining
• Competitively advantaged portfolio
• Improved reliability and efficiency
• Advantaged feedstock and optimisation
(1) Pre-tax earnings calculated using 2014 BP Refining Marker Margin of $14.40/bbl
Refining pre-tax earnings more than double
at constant 2014 RMM(1)
2014 2015 Four quarters
to 2Q16
$bn +125%
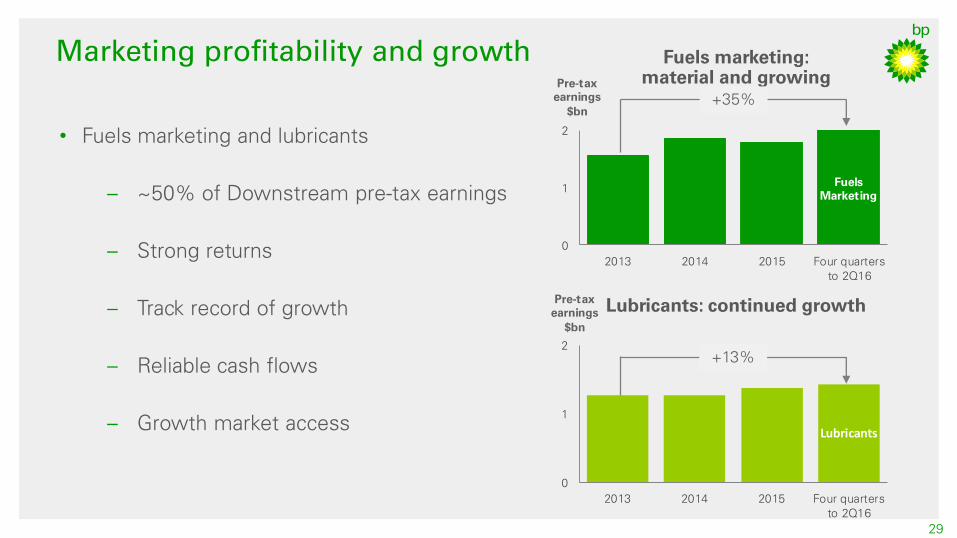
0
1
2
2013 2014 2015 Four quarters
to 2Q16
Lubricants
Pre-tax
earnings
$bn
Marketing profitability and growth
29
(1) Primarily markets excluding North America and Western Europe
(2) Pre tax underlying replacement cost profit re-stated to constant foreign exchange rates
• Fuels marketing and lubricants
– ~50% of Downstream pre-tax earnings
– Strong returns
– Track record of growth
– Reliable cash flows
– Growth market access
Fuels marketing:
material and growing
Lubricants: continued growth
0
1
2
2013 2014 2015 Four quarters
to 2Q16
Fuels
Marketing
Pre-tax
earnings
$bn
+35%
+13%
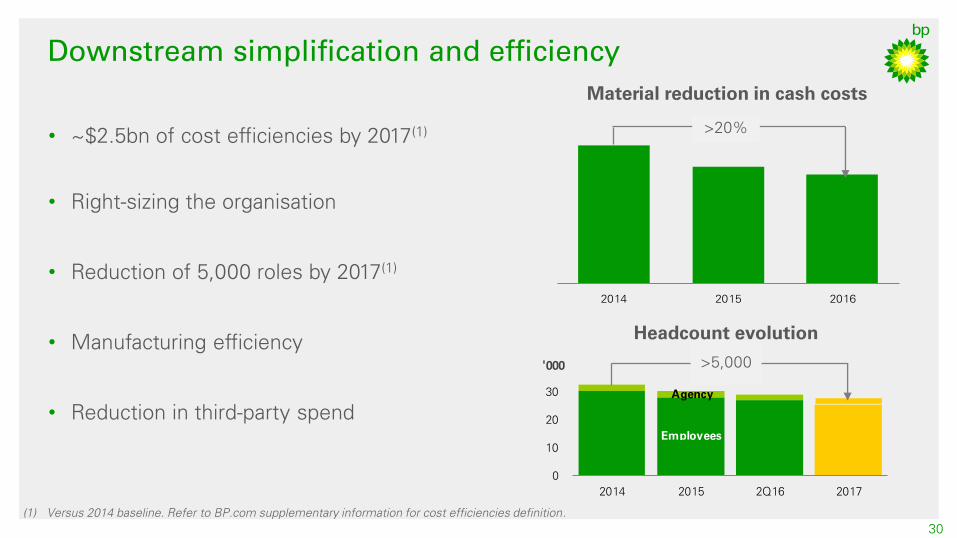
0
10
20
30
40
2014 2015 2Q16 2017
'000
Employees
Agency
2014 2015 2016
Downstream simplification and efficiency
30
• ~$2.5bn of cost efficiencies by 2017(1)
• Right-sizing the organisation
• Reduction of 5,000 roles by 2017(1)
• Manufacturing efficiency
• Reduction in third-party spend
(1) Versus 2014 baseline. Refer to BP.com supplementary information for cost efficiencies definition.
Material reduction in cash costs
>20%
Headcount evolution
>5,000
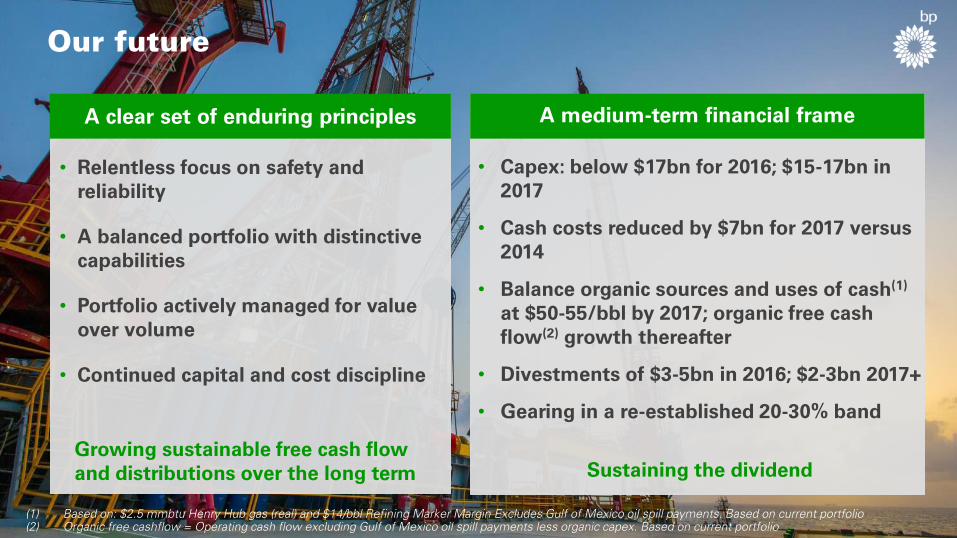
• Relentless focus on safety and
reliability
• A balanced portfolio with distinctive
capabilities
• Portfolio actively managed for value
over volume
• Continued capital and cost discipline
Growing sustainable free cash flow
and distributions over the long term
• Capex: below $17bn for 2016; $15-17bn in
2017
• Cash costs reduced by $7bn for 2017 versus
2014
• Balance organic sources and uses of cash(1)
at $50-55/bbl by 2017; organic free cash
flow(2)
growth thereafter
• Divestments of $3-5bn in 2016; $2-3bn 2017+
• Gearing in a re-established 20-30% band
Sustaining the dividend
Our future
A clear set of enduring principles A medium-term financial frame
(1) Based on: $2.5 mmbtu Henry Hub gas (real) and $14/bbl Refining Marker Margin Excludes Gulf of Mexico oil spill payments. Based on current portfolio
(2) Organic free cashflow = Operating cash flow excluding Gulf of Mexico oil spill payments less organic capex. Based on current portfolio
Q&A
32
Tufan Erginbilgic
Chief Executive, Downstream
Jess Mitchell
Head of Group Investor Relations
Bob Dudley
Group Chief Executive
Bernard Looney
Chief Executive, Upstream