Cattle diseases in dairy herds in Tanzania: Farmers’ view and laboratory confirmation

Bovine tuberculosis breakdown duration in cattle herds: aninvestigation of herd, host, pathogen and wildlife risk factors
Milne, G., Allen, A. R., Graham, J., Lahuerta-Marin, A., McCormick, C., Presho, E. L., ... Byrne, A. (2020).Bovine tuberculosis breakdown duration in cattle herds: an investigation of herd, host, pathogen and wildlife riskfactors. PeerJ.
Published in:PeerJ
Document Version:Publisher's PDF, also known as Version of record
Queen's University Belfast - Research Portal:Link to publication record in Queen's University Belfast Research Portal
Publisher rights© 2019 The Authors.This is an open access article published under a Creative Commons Attribution License (https://creativecommons.org/licenses/by/4.0/),which permits unrestricted use, distribution and reproduction in any medium, provided the author and source are cited.
General rightsCopyright for the publications made accessible via the Queen's University Belfast Research Portal is retained by the author(s) and / or othercopyright owners and it is a condition of accessing these publications that users recognise and abide by the legal requirements associatedwith these rights.
Take down policyThe Research Portal is Queen's institutional repository that provides access to Queen's research output. Every effort has been made toensure that content in the Research Portal does not infringe any person's rights, or applicable UK laws. If you discover content in theResearch Portal that you believe breaches copyright or violates any law, please contact [email protected].
Download date:29. Apr. 2020

Submitted 11 September 2019Accepted 29 November 2019Published 3 February 2020
Corresponding authorsGeorgina Milne,[email protected] W. Byrne,[email protected]
Academic editorJavier Alvarez-Rodriguez
Additional Information andDeclarations can be found onpage 19
DOI 10.7717/peerj.8319
Copyright2020 Milne et al.
Distributed underCreative Commons CC-BY 4.0
OPEN ACCESS
Bovine tuberculosis breakdown durationin cattle herds: an investigation of herd,host, pathogen and wildlife risk factorsGeorgina Milne1, Adrian Allen1, Jordon Graham1, Angela Lahuerta-Marin1,Carl McCormick1,2, Eleanor Presho1, Neil Reid3, Robin Skuce1 andAndrew W. Byrne1,3,4
1Veterinary Sciences Division, Agri-food and Biosciences Institute, Belfast, United Kingdom2Department of Agriculture, Environment, and Rural Affairs, Coleraine, United Kingdom3 School of Biological Sciences, Queen’s University Belfast, Belfast, United Kingdom4One-Health Scientific Support Unit, Department of Agriculture, Food and the Marine, Dublin, Ireland
ABSTRACTBackground. Despite rigorous controls placed on herds which disclose ante-mortemtest positive cattle to bovine tuberculosis, caused by the infection of Mycobacteriumbovis, many herds in Northern Ireland (NI) experience prolonged breakdowns. Theseherds represent a considerable administrative and financial burden to the State andfarming community.Methods. A retrospective observational study was conducted to better understand thefactors associated with breakdown duration, which was modelled using both negativebinomial and ordinal regression approaches.Results. Six explanatory variables were important predictors of breakdown length inboth models; herd size, the number of reactors testing positive in the initial SICCTtest, the presence of a lesioned animal at routine slaughter (LRS), the count of M.bovis genotypes during the breakdown (MLVA richness), the local herd-level bTBprevalence, and the presence of herds linked viamanagement factors (associated herds).We report that between 2008 and 2014, mean breakdown duration in NI was 226days (approx. seven months; median: 188 days). In the same period, however, morethan 6% of herds in the region remained under movement restriction for more than420 days (13 months); almost twice as long as the mean. The MLVA richness variablewas a particularly important predictor of breakdown duration. We contend that thisvariable primarily represents a proxy for beef fattening herds, which can operate bypurchasing cattle and selling animals straight to slaughter, despite prolonged tradingrestrictions. For other herd types, the model supports the hypothesis that prolongedbreakdowns are a function of both residual infection within the herd, and infectionfrom the environment (e.g. infected wildlife, contiguous herds and/or a contaminatedenvironment). The impact of badger density on breakdown duration was assessed byincluding data onmain sett (burrow) density.Whilst a positive associationwas observedin the univariate analysis, confoundingwith other variablesmeans that the contributionof badgers to prolonged breakdowns was not clear from our study. We do not fullyreject the hypothesis that badgers are implicated in prolonging bTB breakdowns viaspillback infection, but given our results, we posit that increased disease risk frombadgers is unlikely to simply be a function of increasing badger density measured usingsett metrics.
How to cite this article Milne G, Allen A, Graham J, Lahuerta-Marin A, McCormick C, Presho E, Reid N, Skuce R, Byrne AW. 2020.Bovine tuberculosis breakdown duration in cattle herds: an investigation of herd, host, pathogen and wildlife risk factors. PeerJ 8:e8319http://doi.org/10.7717/peerj.8319

Subjects Agricultural Science, Ecology, Veterinary MedicineKeywords Bovine TB, Badger, Cows, Northern Ireland, UK, Veterinary epidemiology
INTRODUCTIONBovine tuberculosis (bTB), caused by Mycobacterium bovis bacterial infection, presentsan ongoing epidemic in many countries (Humblet, Boschiroli & Saegerman, 2009). InBritain and Ireland, bTB remains stubbornly persistent despite long-term and intensiveprograms focusing primarily on controlling bTB breakdowns in cattle herds (Allen, Skuce& Byrne, 2018). In Northern Ireland (NI) infection levels remain high, with an annualherd level incidence of over 8% (DAERA, 2018). Current bTB controls are compliantwith EU Directive 64/432/EEC (as amended) and consist of a ‘‘test-and-slaughter policy’’,alongside active routine slaughterhouse surveillance (Abernethy et al., 2006; Abernethy etal., 2013). Herds undergo annual testing using the single intradermal comparative cervicaltuberculin (SICCT) test, with infected herds subsequently placed under trading restrictions(a herd breakdown) until two clear herd level tests are obtained, each not less than 60 daysapart (DAERA, 2017). The shortest length of time a herd usually remains under tradingrestrictions is therefore 120 days. All animals which test positive to the SICCT test are culled.To aid in the detection and eradication of bTB, additional testing can be undertaken inproblematic herds using the interferon gamma test (Lahuerta-Marin et al., 2015). Despitethese efforts, some herds fail to clear infection upon retest and remain persistently infected,resulting in prolonged or recurrent breakdowns (Doyle et al., 2016; Milne et al., 2019a).As herd-keepers are compensated for culled cattle, the remuneration costs of persistentbreakdowns contribute disproportionally to the total program costs, which have exceeded£30 million per annum in recent years (NIAO, 2018). Additionally, the trading restrictionsand production losses associated with persistent breakdowns also present considerableeconomic and emotional burdens to the farming community (Robinson, 2017).
Previous studies from Great Britain (GB) and the Republic of Ireland (ROI) havedefined these persistently infected (i.e., ‘‘chronic’’) herds using a number of non-mutually exclusive criteria. These include recurrence of bTB in a herd (Doyle et al., 2016;Gallagher et al., 2013; Karolemeas et al., 2012; Karolemeas et al., 2011; Wolfe et al., 2010),the prolongation of trading restrictions (Doyle et al., 2016; Griffin et al., 1993; Karolemeaset al., 2012; Karolemeas et al., 2010) and outbreak size (Clegg et al., 2018). Here, we focusspecifically on bTB persistence as defined by breakdown length and measured via theduration of movement restriction periods. Indeed, extended periods of trading restrictionshave been observed in herds across these islands (More et al., 2018). For example, in theROI in 2012, 16.8% of herds were restricted for over 255 days (seven and a half months)(Houtsma et al., 2018). In England, 5.8% of breakdowns lasted longer than 550 days (18months), in contrast to the mean breakdown length of 192 days (AHVLA, 2016). In NI,a previous study found that the median breakdown duration was 184 days (approx. sixmonths) (Doyle et al., 2016); however, between 2003 and 2015, 4.3% of bTB breakdownsin NI were classified as prolonged (>550 days) (More et al., 2018).
Milne et al. (2020), PeerJ, DOI 10.7717/peerj.8319 2/24
Earlier work has enabled better understanding of the factors associated with breakdownduration. A previous study from NI between 2005 and 2010 showed that bTB breakdownslasting longer than 365 days were associated with local area bTB prevalence, the presenceof associated herds (i.e., herds linked via geography, family or some other managementfactor), the number of years previously restricted, the number of cattle reactors at thedisclosing test, the total number of reactors over the outbreak, and the identification ofa lesion consistent with bTB at routine slaughter (Doyle et al., 2016). In Great Britain(GB) prolonged breakdowns were particularly associated with the confirmation status ofthe breakdown and herd size (Karolemeas et al., 2010). Comparisons between transientbTB breakdowns (≤6 months) and breakdowns lasting >6 months (i.e., ‘‘persistent’’)in GB found that herd size, herd management, and the presence of active badger settswere important explanatory variables associated with bTB persistence (Reilly & Courtenay,2007). Whilst breakdown prolongation is either a feature of failure to clear infectionfrom the herd (i.e., within herd recrudescence), and/or re-infection from local sources(e.g., contagious herds or a local wildlife reservoir), it is not yet possible to disentanglethese various routes of infection.
The European badger (Meles meles) is a well-documented infection reservoir forM. bovis(Byrne et al., 2014b; Gallagher & Clifton-Hadley, 2000) and a number of other studies havealso explored the association between bTB breakdown duration and wildlife. In the ROI,the presence of badgers was associated with bTB breakdowns lasting greater than oneyear (Griffin et al., 1993), and reactive badger culling was related to the prolongation ofbTB breakdowns in GB (Karolemeas et al., 2012). However, the contribution that badgersmake towards protracted bTB breakdowns is not well understood to date. Furthermore,previous work largely consists of case-control studies, and does not model breakdownlength explicitly. The aim of this work, therefore, was to model the factors associated withbreakdown duration, including variables associated withM. bovismolecular genotype data(Skuce et al., 2010), badger density data (Reid et al., 2012), alongside herd characteristics.For the first time, breakdown length was modelled as both a continuous and ordinalvariable, which we believe improves our understanding of within-herd bTB dynamics andcould be applied to bTB management in many endemic regions globally.
MATERIALS & METHODSStudy areaNorthern Ireland is approximately 14,000 km2. The official bTB control programme isadministered over tenDivisional VeterinaryOffice DVO areas, comprised of 123 ‘‘patches’’;mean size 110 km2 (SD ± 53); Fig. 1.
Study designTwo retrospective analyses were undertaken, firstly (i) quantifying the risk factorsassociated with bTB breakdown duration, using negative binomial (count) regressionwith the outcome measured in days, and (ii) quantifying the risk associated with bTBbreakdown duration using ordinal regression, with the outcome modelled as a categoricalordered variable. This approach was considered necessary to account for bTB breakdown
Milne et al. (2020), PeerJ, DOI 10.7717/peerj.8319 3/24

Figure 1 The distribution of continuous variables across each DVO area within Northern Ireland.(A) Breakdown Length; (B) Herd size; (C) Total Reactors; (D) Yearly Patch Prevalence; (E) Total PatchPrevalence; (F) Main Sett Density; (G) Out-moves Before Breakdown; (H) In-moves Before Breakdown.A number of variables exhibited little variation in the median values per-DVO and are therefore not dis-played (outbreak reactors, median= 1 for all DVOs; MLVA Richness, median= 1 for all DVOs).
Full-size DOI: 10.7717/peerj.8319/fig-1
Milne et al. (2020), PeerJ, DOI 10.7717/peerj.8319 4/24

administration in NI. Herd breakdown duration measures arise as a result of a diseasemanagement process, and are not a wholly natural phenomenon. Generally, once bTB hasbeen confirmed, the herd Officially Tuberculosis free status is Withdrawn (OTW). Usually,two clear herd tests are required to restore Officially Tuberculosis Free (OTF) status. Eachherd-level test is scheduled to occur a minimum of 60 days apart (DAERA, 2018). For theordinal regression therefore, breakdown duration was classified into four distinct categoriesbased on multiples of 60 days (it should be noted, however, that breakdown length maynot always correlate exactly with the number of tests done, as herds may delay testing). Thefirst category contained breakdowns≤180 days (approx. 6 months; 3 tests until OTF statusrestored), the second category included breakdowns which ended up to 120 days later;≤300 days (approx. 9 months; 5 tests until OTF status restored), and the third categoryincluded breakdowns which ended up to 120 days after this;≤420 days (approx. 13months;7 tests until OTF status restored). The final category included breakdowns which lastedlonger than 421 days (8 or more tests until OTF status restored). Breakdown start datesare denoted by the date at which the first SICCT reactor or lesioned animal identified atslaughter was disclosed, and the breakdown end date was the test at which the last clearherd test was achieved.
Dataset creationBTB breakdown data spanning January 2003 to December 2015 inclusive (n breakdowns= 27,718) were made available from the NI Department of Agriculture, Environmentand Rural Affairs (DAERA) database, the Animal and Public Health Information System(APHIS) (Houston, 2001). This dataset was restricted to only include OTW breakdowns(n= 19,084; 8,634 breakdowns removed), which were defined by policy guidance at thetime of study as the presence of more than five SICCT reactors, or two positive results to thefour possible bTB tests; confirmation via histopathology, culture or spoligotyping, or theidentification of a lesion at routine slaughter. Breakdowns with incomplete or erroneousinformation were also excluded (e.g., missing GIS information, MLVA information, orbreakdowns lacking end dates (n= 17,114; 1,970 breakdowns removed). The dataset wasfurther restricted to include breakdowns which started and ended between 01/01/2009and 31/12/2014 (n= 7,478; 9,636 breakdowns removed). These dates were chosen becausesurveillance usingM. bovisMLVA genotyping data occurred at the herd level between 2003and 2008, but from 2009 onwards, all culture confirmed animal-level M. bovis isolateswere genotyped. Finally, breakdowns which were recorded as lasting less than 60 days wereexcluded from the final dataset (n= 5 breakdowns removed), as 60 days is the minimumrestriction period which may be permitted under some circumstances e.g., less than fivepositive SICCT animals with no post-mortem or laboratory confirmation (DAERA, 2019).The final dataset contained information on 7,473 breakdowns. All data were assembledand analysed using Microsoft Access 2007 (12.0.6735.5000) SP3 MSO and R Version 3.2.5(R Core Team, 2013).
The fixed-effect variables considered in the analysis are shown in Table 1. They werederived and defined as follows; herd size (number of animals in the herd at the time ofbreakdown); outbreak reactors (the number of SICCT reactors present in the disclosing
Milne et al. (2020), PeerJ, DOI 10.7717/peerj.8319 5/24

Table 1 Summary statistics of the fixed effect explanatory variables.
Variable Count Median Mean IQR (1st-3rd)
breakdown_length 188 225.6 140–260herd_size 93 141.2 42–190outbreak_reactors 1 2.84 1–2total_reactors 3 7.66 2–8year_patch_prev 8.85 9.89 6.01–12.55mean_patch_prev 10.18 10.73 7.83–13.24MLVA_richness 1 1.25 1–1main_sett 0.74 0.77 0.56–0.92
outwards_moves_year_before 52 98.22 23–106
inwards_moves_year_before 9 59.78 1–42LRS 2,209milk_licence 2,360associated_herds 1,501previous_breakdown 2,061
herd_type beef 3,617herd_type dairy 2,275herd_type other 98
test); total reactors (the total number of SICCT reactors during a breakdown); yearlypatch prevalence (herd level bTB prevalence for the year); mean patch prevalence (meanherd level bTB prevalence), outward moves year before (the number of outward cattlemoves in the year prior to breakdown), and inward moves year before (the number ofinward cattle moves in the year prior to breakdown). A categorical herd type variable wasincluded (beef, dairy, other, or unknown). Binary variables were the presence or absence ofa milk license, whether lesions consistent with tuberculosis were identified during routineslaughter (LRS), the presence or absence of associated herds (herds are ‘‘associated’’ viae.g., shared management, shared grazing, or shared family responsibilities), and whetherthe herd had any previous breakdowns during the study period. The herd DVO, the year ofbreakdown, and the herd unique identifier were included as random effect variables. Thedistribution of explanatory variables across each DVO in NI is illustrated in Fig. 1.
M. bovis MLVA genotype dataM. bovis MLVA genotype data were derived from isolates obtained from skin-testreactors, and from lesioned animals identified at routine slaughter. These animal-leveldata were then associated with bTB breakdown-level data. From this, breakdown-level metrics of MLVA genotype richness (number of different MLVA types) werecalculated. The process of genotyping M. bovis isolates has been described more fullyelsewhere (Kamerbeek et al., 1997; Skuce et al., 2010; Skuce et al., 2005). Briefly, all culture-confirmed bTB cases were sub-cultured to single colonies and heat-killed to createPCR-ready bacterial cell lysates. These were then used as PCR templates for molecularcharacterisation of pathogen variation. Eight VNTR loci across the M. bovis genome weregenotyped; MV2163B/QUB11B, MV4052/QUB26A, MV2461/ETRB, MV1955/Mtub21,
Milne et al. (2020), PeerJ, DOI 10.7717/peerj.8319 6/24

MV1895/QUB1895, MV2165/ETRA, MV2163/QUB11A and MV3232/QUB3232 (Durr,Hewinson & Clifton-Hadley, 2000).
Badger densityBadger main sett density was incorporated into models by using a data from the NorthernIreland Badger Survey 2007-08 (Reid et al., 2012). This enumerated and mapped badgermain setts within 212 regularly spaced 1 km2 squares throughout Northern Ireland, andsubsequently spatially interpolated using the Kriging function of the ArcMap 10.5 (ESRI,California, USA) Spatial Analyst toolbox, providing a heat-map proxy of badger densitythroughout the region (Reid et al., 2012).
Data modellingDuring the univariable stage of model fitting for both the count and ordinal models,predictor variables were explored using summary statistics and cross–tabulations withthe outcome variable. The relationship between each predictor and the outcome wasalso visually scrutinised using ggplot2 (Wickham, 2009). Predictor variables were thenconsidered individually for association with the outcome. Correlation coefficients betweenvariables were determined. Variables with moderate or strong correlation ≥ 0.5 or ≤−0.5were identified, and from these, only those variables with the strongest association with theoutcome were retained, based on log-likelihood values. Following univariable assessment,generalised linear mixed models (GLMMs) were fitted. The count model was constructedusing the package lme4 (Bates et al., 2015), and the ordinal model was constructed usingthe package ordinal (Christensen, 2019). Initial modelling of the count data using Poissonregression indicated the presence of over-dispersion (the variance was greater than themean); a negative binomial model was instead found to be more suitable for these data(Zuur, Hilbe & Ieno, 2015; Zuur et al., 2009).
In both count and ordinal models, the DVO, breakdown year, and herd identifierwere included as nested random effects (Zuur et al., 2009). Continuous variables werelog-transformed in the final models for computational efficiency, and to improve themodel fit (i.e., ensure all explanatory variables were on the same scale, to approximate amore linear relationship, reducing skew and to limit the influence of outliers). All predictorswere initially included in the model, including biologically plausible two-way interactions.Final models were assembled using backwards stepwise selection routines; better fittingmodels were selected on the basis of likelihood ratio tests (Christensen, 2019; Zuur et al.,2009). At each stage, however, model coefficients were manually assessed for confounding(Dohoo, Martin & Stryhn, 2009). Once final models were constructed, excluded predictorvariables were again offered to the model and the impact assessed using likelihood ratiotests. Final models were screened for correlations between fixed effects and random effectsand were assessed by visual examination of residuals. Plots of residual versus fitted valueswere firstly explored; residuals were then plotted against all covariates included in themodel, and also against the covariates which had been excluded during model fitting.Residuals were used to identify influential data-points, and models were re-run with thesedata removed for comparative purposes.
Milne et al. (2020), PeerJ, DOI 10.7717/peerj.8319 7/24

Ordinal regression assumes that the effects of explanatory variables are consistent acrossall outcome categories (i.e., the assumption of proportional odds). We firstly attemptedto test this using the nominal_test function of the Ordinal package (Christensen, 2019).However, at the time of analysis, this function was not available for models with multiplerandom effects. Furthermore, it is presently not feasible to construct an ordered regressionmodel with multiple random effects for which the assumption of proportional odds is alsorelaxed (Christensen, 2019). To overcome this, we constructed an initial ordered regressionmodel including only fixed effects (via the clm function) and tested the assumption ofproportional odds on this model (the nominal_test function). Explanatory variables whichviolated the assumption of proportional odds were identified and the model was re-ran,wherein the proportional odds assumption was relaxed for these variables. However,the final clmm model was further validated by comparing the model coefficients againstthose derived from three binary logistic GLMMs (Armstrong & Sloan, 1989; Ananth &Kleinbaum, 1997), with the binary outcome variable dichotomised at the same levels asin the ordinal regression. In these three models, the outcome (breakdown length) wasdichotomised as follows: Model 1; ≤180 days (breakdowns 180 days or less classified as 0,all others classified as 1); Model 2 ≤300 days; (breakdowns 300 days or less classified as 0,all others classified as 1); and Model 3 ≤420 days (breakdowns 420 days or less classifiedas 0, all others classified as 1).
RESULTSSummary dataThe final dataset contained 7,473 breakdowns associated with 5,378 herds. The meanbreakdown length was 226 days (SD ± 140 days; approx. seven months) and medianbreakdown length was 188 days (Inter Quartile Range (IQR): 140–260 days; approx. sixmonths). The longest breakdown was recorded at 2,288 days (6 years). When classifiedinto categories, almost half of all breakdowns (47.18%, n= 3,526) lasted less than 180days. 34.86% (n= 2,605) of breakdowns were between 181 and 300 days in duration,11.33% (n= 847) lasted between 301 and 420 days, whilst 6.62% of all bTB breakdowns(n= 495) lasted 421 days or longer (13 months; i.e., 8 or more tests were required torestore OTF status). The distribution of the breakdown length outcome variable is shownin Figs. 2A–2B. Mean breakdown duration varied across NI, from a minimum of 192 daysin Derry/Londonderry DVO to a maximum of 266 days in Newry DVO (Fig. 1).
Count model resultsThe results of the count model of breakdown duration is shown in Table 2 (Table S1). Thefinal model contained seven explanatory variables. The exponentiated results are reportedhere as Incidence Rate Ratios (IRR) with associated 95% upper and lower confidenceintervals (CI). The variables log herd size (IRR: 1.05, 95%CI [1.04–1.06]), log outbreakreactors (IRR: 1.05, 95%CI [1.04–1.06]), log mean patch prevalence (IRR: 1.04, 95%CI[1.01–1.07]) and log MLVA richness (IRR: 1.62, 95%CI [1.58–1.67]) were positivelyassociated with breakdown duration. The binary variables for presence of an LRS (IRR:
Milne et al. (2020), PeerJ, DOI 10.7717/peerj.8319 8/24

Figure 2 Distribution of breakdown length. The (A) frequency distribution and (B) cumulative distri-bution of the breakdown length variable. The three different cut-offs (180 days, 300 days and 420 days) areshown as vertical lines.
Full-size DOI: 10.7717/peerj.8319/fig-2
1.12, 95%CI [1.09–1.14]), presence of associated herds (IRR: 1.10, 95%CI [1.07–1.13])and a previous breakdown (IRR: 1.04, 95%CI [1.02–1.07]) were positively associatedwith breakdown duration. Re-running the model with influential data removed resultedin only minimal change in parameter estimates when compared to the original model(<15% change). The addition of a quadratic term for log MLVA richness was also foundto significantly lower log-likelihood; this model is shown in Table S2.
Ordinal model resultsSix variables were identified as important predictors in the ordinal model. The parameterestimates of the final model are shown in Table 2 (Table S3). All six variables in the finalmodel were found to be positively associated with the increasing breakdown duration; logherd size (OR: 1.26, 95%CI [1.20–1.32]), log outbreak reactors (OR: 1.34, 95%CI [1.26–1.43]), log mean patch prevalence (OR: 1.20, 95%CI [1.04–1.37]), log MLVA richness (OR:
Milne et al. (2020), PeerJ, DOI 10.7717/peerj.8319 9/24

Table 2 Parameter estimates of the fixed effectexplanatory variables in the final model for both thecount model (negative binomial) and ordinal model.
Variable IRR 95%CI Lower
95%CI Upper
OR 95%CI Lower
95%CI Upper
log(herd_size) 1.05 1.04 1.06 1.26 1.20 1.32log(outbreak_reactors) 1.05 1.04 1.06 1.34 1.26 1.43log(mean_patch_prev) 1.04 1.01 1.07 1.20 1.04 1.37log(MLVA_Richness) 1.62 1.58 1.67 7.06 6.04 8.24LRS_binary1 1.12 1.09 1.14 1.79 1.59 2.01associated_herds_binary1 1.10 1.07 1.13 1.49 1.32 1.69previous_breakdown 1.04 1.02 1.07 – – –
7.06, 95%CI [6.04–8.24]), the presence of an LRS (OR: 1.79, 95%CI [1.59–2.01]) and thepresence of associated herds (OR: 1.49, 95%CI [1.32–1.69]). The coefficients derived fromthis model were similar to a fixed-effect ordinal regression model, however the variableslog herd size, log MLVA richness and log outbreak reactors violated the proportionalodds assumption (p< 0.05), suggesting that the effect size is not the same across all threebreakdown duration categories. As the assumption of proportional odds was not met forall variables, the coefficients from ordinal model were also compared to those derivedfrom three binomial logistic GLMMs (Fig. 3). There was only limited evidence of theparameter estimates differing between ordinal and binomial models. The binomial modelof breakdowns lasting 420 days or less returned a higher odds ratio associated with herdsize (OR: 1.49, 95%CI [1.32–1.67]) than the ordinal model (OR: 1.26, 95%CI [1.20–1.32]).The parameter estimate for the number of outbreak reactors was elevated in the binomialmodel of breakdowns lasting less than 180 days (OR: 1.56, 95%CI [1.45–1.49]) comparedto the ordinal model (OR: 1.34, 95%CI [1.26–1.43]), and was also diminished in the modelof breakdowns lasting 301 days or more (OR: 1.23, 95%CI [1.03–1.23]) and 421 days ormore (OR: 1.08, 95%CI [0.94–1.24]).
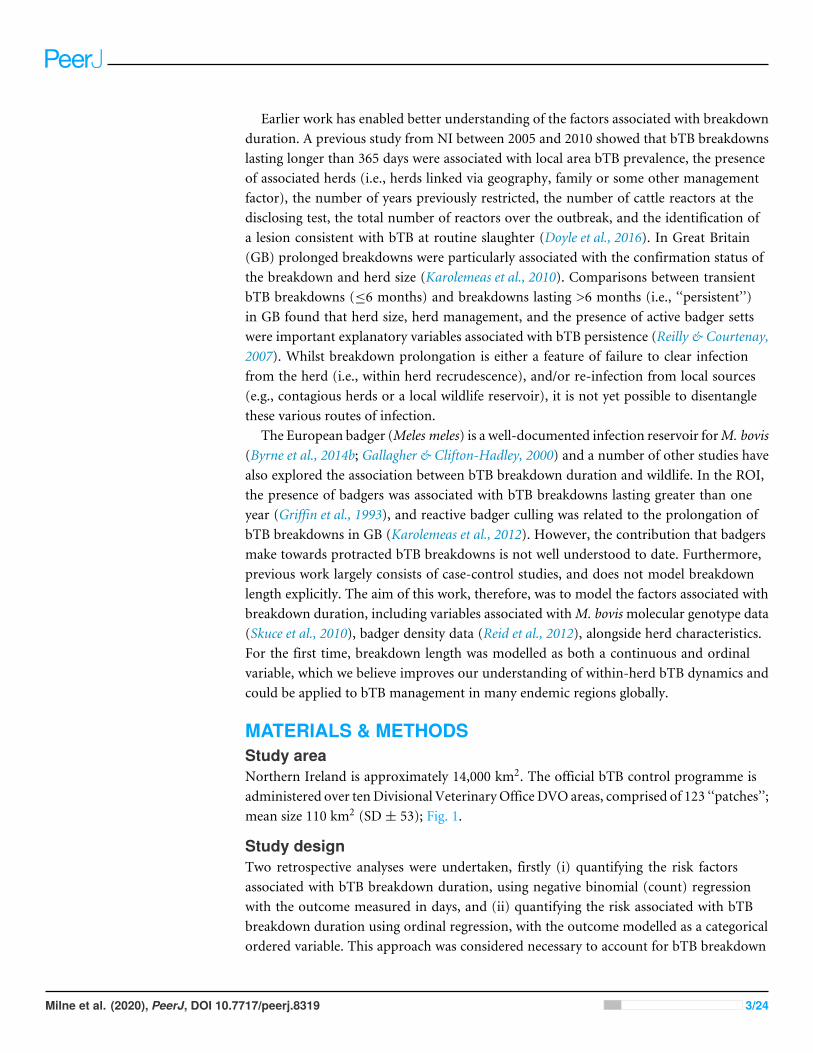
MLVA Genotype richnessMLVA genotype richness was the most important variable in both count and ordinalmodels, in terms of both effect size and decrease in model deviance. This was particularlyobservable in the ordinal regression model (Fig. 4A). The MLVA genotype richnessvariable was moderately correlated with the number of inwards moves in the year priorto breakdown (r = 0.33), outwards moves in the year prior to breakdown (r = 0.34) andthe number of total reactors over the breakdown (r = 0.39). Further investigation into this‘‘total reactors’’ variable revealed significantly more reactors in herds with a milk license(mean= 11) than herds without a milk license (mean= 6; Univariable Negative BinomialRegression, IRR: 1.70; 95%CI [1.62–1.79]; Fig. 4B). However, the presence of a milk licensewas only ‘marginally significant’ in a univariable analysis of breakdown length in bothcount (IRR: 1.02, 95%CI [1.00–1.05]) and ordinal models (OR: 1.16, 95%CI [1.01–1.27]),and was not retained as a predictor of breakdown length in the finals GLMMs after modelbuilding. Further analysis showed that whilst mean breakdown length in herds with a
Milne et al. (2020), PeerJ, DOI 10.7717/peerj.8319 10/24

Figure 3 Comparison of parameter estimates across models. Comparison of parameter estimates forthe six explanatory variables obtained from the ordinal regression model with four categories (full model),compared to parameter estimates obtained from three binary logistic regression models (model type).
Full-size DOI: 10.7717/peerj.8319/fig-3
milk license was indeed marginally longer (230 days ± 141) than in herds without a milklicense (224 days ± 140), some of the longest breakdowns were found in herds withoutmilk licenses. For example, there were 27 breakdowns lasting over 1000 days; 10 were inherds with milk licenses, and 17 were in herds without; Fig. 4C. It would therefore appearthat whilst production type per-se is not a useful predictor of breakdown length, the resultsshow that some variables which vary between production types—the number of reactorsover a breakdown for example (here, confounded with MLVA genotype richness, Fig. 4D),are indeed important predictors of breakdown length.
Badger density resultsWhen modelled using a univariate negative binomial GLM, badger main sett density wasa significant predictor of breakdown length (IRR: 1.13, 95%CI [1.13–1.14]). However,this variable was not retained in the final GLMM. Further investigation found that main
Milne et al. (2020), PeerJ, DOI 10.7717/peerj.8319 11/24
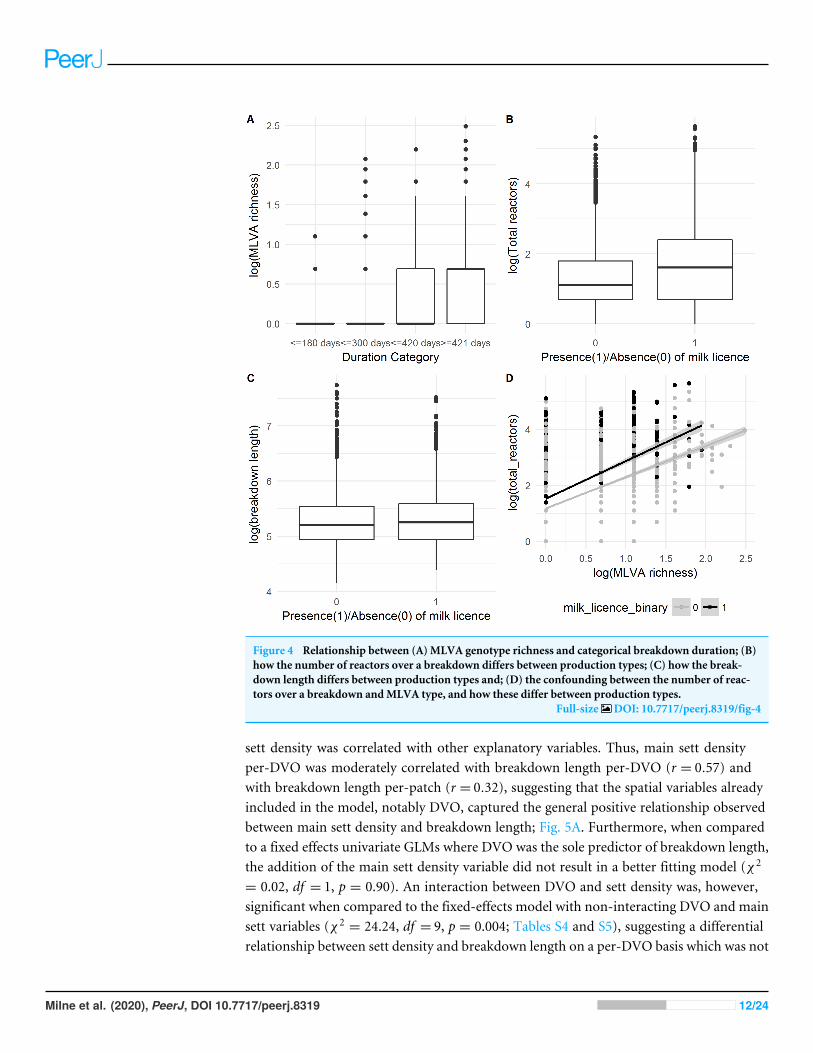
Figure 4 Relationship between (A) MLVA genotype richness and categorical breakdown duration; (B)how the number of reactors over a breakdown differs between production types; (C) how the break-down length differs between production types and; (D) the confounding between the number of reac-tors over a breakdown andMLVA type, and how these differ between production types.
Full-size DOI: 10.7717/peerj.8319/fig-4
sett density was correlated with other explanatory variables. Thus, main sett densityper-DVO was moderately correlated with breakdown length per-DVO (r = 0.57) andwith breakdown length per-patch (r = 0.32), suggesting that the spatial variables alreadyincluded in the model, notably DVO, captured the general positive relationship observedbetween main sett density and breakdown length; Fig. 5A. Furthermore, when comparedto a fixed effects univariate GLMs where DVO was the sole predictor of breakdown length,the addition of the main sett density variable did not result in a better fitting model (χ2
= 0.02, df = 1, p = 0.90). An interaction between DVO and sett density was, however,significant when compared to the fixed-effects model with non-interacting DVO and mainsett variables (χ2
= 24.24, df = 9, p = 0.004; Tables S4 and S5), suggesting a differentialrelationship between sett density and breakdown length on a per-DVO basis which was not
Milne et al. (2020), PeerJ, DOI 10.7717/peerj.8319 12/24

Figure 5 Correlations between (A) mean breakdown length per DVO andmain sett density and (B)mean patch-level bTB prevalence andmain sett density. (C) shows the relationship betweenmain settand breakdown duration on a per-DVO basis, including only data available for each DVO, and (D) isthe same as with (C), but without confidence intervals and predicted against the full range of values forall DVOs.
Full-size DOI: 10.7717/peerj.8319/fig-5
immediately observable when data were not stratified by DVO. Figures 5C–5D illustratesthis observation. Whilst a positive association was found between main sett density andbreakdown length in Ballymena, Coleraine, Dungannon, Larne and Derry/LondonderryDVOs, a negative relationship between sett density and breakdown length was observedin Armagh, Enniskillen, Newry, Newtownards and Omagh DVOs (Table S6). To explorethis further, we therefore present a second GLMM, (Table 3) in which main sett densitywas permitted to differ on a per-DVO basis (i.e., a random slopes and random interceptsmodel). It should be noted, however, that the inclusion of the random slopes term for mainsett resulted in only marginally improvements, compared to the original GLMM (Table 2)which did not include a random slope for main sett density per-DVO (χ2
= 4.61, df = 2,p = 0.099)
Further analysis also indicated that that themain sett density variable exhibitedmoderatecorrelation with mean patch prevalence (r = 0.40; Fig. 3C). To better understand the effectof main sett density on breakdown duration in the absence of spatial confounders, twofurther alternative models were constructed, both omitting DVO from the random effectscomponent and including log main sett in the fixed effects component. These models alsoincorporated the other fixed-effect variables reported in Table 2, however, one of these
Milne et al. (2020), PeerJ, DOI 10.7717/peerj.8319 13/24

Table 3 Parameter estimates of the explanatory variablesin an alternative count model, allowing mainsett to vary on a per DVO basis.
DVO main_sett slope Intercept
Armagh −0.030 5.031Ballymena 0.039 4.874Coleraine −0.004 4.971Dungannon −0.031 5.033Enniskillen 0.047 4.856Larne 0.017 4.923Londonderry 0.031 4.892Newry −0.107 5.204Newtownards −0.010 4.986Omagh 0.022 4.913
Variable Est Std. Error z IRR 95%CI Lower 95%CI Upper
Intercept 4.96 0.04 120.1 143 131.89 155.04log(herd_size) 0.05 0.00 9.80 1.05 1.04 1.06log(outbreak_reactors) 0.05 0.01 7.57 1.05 1.04 1.06log(main_sett) 0.01 0.02 0.39 1.01 0.97 1.05log(MLVA_Richness) 0.48 0.01 34.51 1.62 1.58 1.67LRS_binary1 0.11 0.01 9.68 1.12 1.09 1.14associated_herds_binary1 0.09 0.01 7.21 1.10 1.07 1.12previous_breakdown 0.04 0.01 3.57 1.04 1.02 1.07
models included patch prevalence in the fixed component, and the other did not. In themodel which omitted both DVO and log patch prevalence, log main sett was a significantpredictor of breakdown length (OR: 1.08, 95%CI [1.05–1.11]; Table S7). Log main sett wasalso found to be an important predictor of breakdown length when log patch prevalencewas included (OR: 1.08, 95%CI [1.05–1.11]; Table S8), however in this model, log patchprevalence was no longer an important predictor of breakdown duration (OR: 1.01, 95%CI[0.99–1.11]; χ2
= 1.02, df = 1, p = 0.31). Confounding between main sett density andDVO was also observed in the ordinal regression. Thus, main sett density was positivelyassociated with increasing breakdown duration categories in a univariable GLM (OR: 1.59,95%CI [1.42–1.78]), but the main sett variable was not recovered as an important predictorof breakdown length in the mixed model context. We constructed a univariable ordinalGLM with DVO as the sole predictor of breakdown duration category. The coefficientsfrom this model (i.e., the ‘‘risk’’ associated with each DVO) was positively associated withmean sett density per DVO (r = 0.59). Additionally, the inclusion of the main sett variablein this model did not improve model fit (χ2
= 0.04, df = 1, p = 0.84).
DISCUSSIONThe heterogeneity in transmission of infections across populations is a well-knownphenomenon in many systems (Woolhouse et al., 1997), where a small proportion of thepopulation can contribute disproportionately to disease maintenance. Our work highlights
Milne et al. (2020), PeerJ, DOI 10.7717/peerj.8319 14/24

this issue in the context of prolonged bTB breakdowns. The results show that meanbreakdown length was 226 days (seven and a halfmonths), and themedianwas 188 days (sixmonths). However, over 6% of breakdowns in this study lasted over 420 days (13 months,representative of 7 herd-level tests, each 60 days apart, before OTF status was restored). Sixvariables associated with increasing breakdown length in cattle herds in NI were identifiedin both models. These can be grouped into three main categories; (1) variables related toherd characteristics, namely herd size and herd type; (2) variables related to undetectedresidual infection (i.e., infection within-herd), and (3) variables relating to local factors(i.e., infected wildlife, infected contiguous herds and a contaminated environment).
The MLVA genotype richness variable exhibited the strongest association withbreakdown duration, both regarding effect size and in contribution to model fit. Previouswork found that in a small number of herds, likely to be beef fattening enterprises, MLVAgenotype accumulation was associated with the inwards purchase of cattle from overa wide geographical extent (Milne et al., 2019b). Despite this, we did not find that thenumber of inwards movements prior to breakdown was a particularly important predictorof breakdown length, e.g., (Reilly & Courtenay, 2007). However, we did not considerinwards cattle movements during a bTB breakdown, as businesses can be required tolimit purchasing of cattle whilst bTB restricted, or where testing delays occur, bannedfrom purchasing (a consequence of the bTB control program). Nevertheless, some beeffattening herds may indeed continue to purchase cattle despite the presence of bTB, assuch enterprises operate by selling animals straight to slaughter (as opposed to onwardsto other herds) and are only minimally impacted by movement restrictions. It is thereforelikely that both the elevated MLVA richness and prolonged breakdown periods observedin beef fattening herds are associated with cattle purchases during breakdowns. However,in other herd types, the accumulation of MLVA genotypes may result in the absence ofinwards cattle movements if herds are also exposed to infection from contiguous farms,infectious wildlife, or a contaminated environment. Given the spatial structuring of theM.bovis population (Skuce et al., 2010), we contend that it is more likely that re-infection fromlocal sources would present with sameM. bovis strains that are already present in the herdand local geographic area. Increasing MLVA richness would therefore have to involve theintroduction of MLVA types from over a larger geographical extent. Whilst there is someevidence that badgers can occasionally travel long distances at scales of 7-20 km (Byrne et al.,2014a), it may be less likely that long-distance badger movements are an important sourceof MLVA richness relative to cattle movements, which can traverse national scales (Brownet al., 2019). The increased resolution provided by pathogen whole-genome sequencing(WGS), especially when more fully integrated with epidemiological data and modelling,may help to better understand transmission dynamics and the relative role of hosts in amulti-host system (Trewby et al., 2016).
Previous work from NI (Doyle et al., 2016), GB and the ROI (Clegg et al., 2018;Karolemeas et al., 2010; Karolemeas et al., 2011; Olea-Popelka et al., 2008;Wolfe et al., 2010)found that increasing herd size was positively associated with breakdowns lasting longerthan 365 days. This may be related to the inability to detect all bTB-positive animals usingthe non-gold–standard ante-mortem SICCT test (Nuñez-Garcia et al., 2017). In NI, the
Milne et al. (2020), PeerJ, DOI 10.7717/peerj.8319 15/24
relative sensitivity of the SICCT test may be as low as ∼40% in chronically infected herds(Lahuerta-Marin et al., 2018). Undetected animals, where present, represent an ongoingreservoir of residual infection which can lead to recrudescence of infection. The riskassociated with herd size, however, may also be confounded with production type. Here,we found that herds with a milk license (i.e., dairy herds) were larger than herds withouta milk license. Dairy farms may be associated with particularly intensive production,potentially increasing within-herd transmission (i.e., amplification) of infection (Alvarezet al., 2012; Menzies & Neill, 2000). Furthermore, there is some evidence that the SICCTtest performs poorly in dairy in NI settings compared to beef (Lahuerta-Marin et al.,2018) which could exacerbate the problem presented by of residual infection. In the finalmultivariable models presented here, however, the presence of a milk license was not foundto be an important predictor of breakdown duration. We hypothesize that other variableswhich differ between production types (e.g., herd size) have captured some importantdifferences between animal husbandry practices which may be related to breakdownduration.
The number of reactors in the disclosing test was also positively associated withbreakdown duration. We speculate that the presence of a large number of reactors atthe disclosing test may indicate severity of infection, possibly arising from an environmentwhich facilitates rapid within-herd transmission e.g., intensive farming units, or sharedhousing (Alvarez et al., 2012). Unless all animals infected with M. bovis are identifiedand removed from the herd as soon as possible, the rapid dissemination of infectionwill continue, thereby prolonging the outbreak duration (i.e., residual infection leading towithin-herd recrudescence). Alternatively, many reactors at the disclosing test may indicatethat infection has been either present or introduced since the preceding SICCT test, therebyproviding a time period during which dissemination of infection to susceptible hosts withinthe herd could occur. We found that herd bTB history, measured by the presence of at leastone previous breakdown in the study, was also associated with breakdown duration in thecount model. Taken together, we hypothesise that a high number of disclosing reactors anda history of bTB indicates the presence of local infection (e.g., a contaminated environment,contiguous herds or infected wildlife), whichmay lead to increasingly prolonged outbreaks.
The presence of a lesioned animal at slaughter (LRS) was indicative of longer breakdownsin our models, which is in line with previous findings (Doyle et al., 2016). We argue thatthe presence of a tuberculosis lesion is often evidence of undetected bTB infection withinthe herd (Olea-Popelka et al., 2008). Indeed, previous work from NI confirmed that 97% oflesions from LRS animals were confirmed as bTB with histopathology or culture (Byrne etal., 2017). The relationship between bTB breakdown length and the presence of associatedherds and elevated patch prevalence (Clegg et al., 2018; Doyle et al., 2016) illustrate therisk of infection from the local sources. Here, infection may originate from a sharedcontaminated environment (e.g., housing or grazing), which could lead to prolongedbreakdowns if associated herds also contained infected animals. It may also point to shareduse of equipment, or the spreading of contaminated slurry across multiple farms (O’Haganet al., 2016). The positive relationship between local geography and prolonged breakdownsidentified here has been observed previously in GB and the ROI (Olea-Popelka et al.,
Milne et al. (2020), PeerJ, DOI 10.7717/peerj.8319 16/24

2008; Reilly & Courtenay, 2007). We suggest that geographical location variables (DVOand patch) are also a proxy for highly localised factors which could potentially influencebreakdown length via exposure to other infected hosts in the area. These include degree offarm fragmentation, conacre use (shared grazing practice), and opportunities for contactwith neighboring cattle (O’Hagan et al., 2016;White et al., 2013).
Wildlife and breakdown durationIn the univariable context, we identified a general positive relationship between breakdownduration and main sett density. Unsurprisingly, in the multivariate context, main settdensity was confoundedwith other spatial and local variables (i.e., DVO and patch),makinginferences on the contribution of badger density to infection prolongation less clear. It isnot yet possible to conclusively distinguish between local sources of infection (which mayinclude wildlife, contiguous herds and environmental contamination), but given our data,we cannot reject the hypothesis that badgers may be involved in the maintenance of localpatch bTB prevalence via spillback infection to cattle. Whether infected badger presencehas a greater risk of sporadic introduction of infection into herds (singular badger-cattlespillover), than longer-termmaintenance within herds (explosive introduction of infectionelevated with cattle-cattle transmission), remains to be determined. Whilst this study wasunable to conclusively clarify the relationship between badger density and breakdownduration, our data nevertheless reveal important features that warrant further investigationin future studies.
Thus, despite DVO capturing the risk associated with main sett density and thegeneral positive association between breakdown length and main sett density, there wassome evidence of within-DVO effects. Within five DVO areas (Ballymena, Coleraine,Dungannon, Larne and Derry/Londonderry), increasing sett density was generallyassociated with longer breakdowns. In the other five DVO areas (Armagh, Enniskillen,Newry, Newtownards and Omagh), increasing sett density was generally associated withshorter breakdowns. The five DVOs with a positive association between sett density andbreakdown duration were areas of generally lower badger sett densities (Reid et al., 2012).The DVOs with a negative association between sett density and breakdown duration weregenerally associated with higher badger sett densities. Whilst the interpretation of this is notstraightforward, differences in farming practice (e.g., farm fragmentation) or differencesin badger ecology (e.g., population context dependent badger dispersal; (Byrne et al., 2019)across the region could partially explain this observation. However, this does not precludethat the relationship between herd bTB risk from badgers may not be simply be dependenton wildlife density; the sett density data provides no insight regarding disease prevalencewithin the badger population. A spatially explicit model of disease prevalence in badgersmay resolve this in future. Indeed, future research could investigate variation in wildlifeTB transmission risk (LaHue et al., 2016) as a function of infection prevalence as well asdensity, and investigate how that could help to partially explain patterns within cattle data.
Conversely, infection risk in cattle may not be linked to badger disease prevalence orpopulation density, butmay instead related to the relative frequency of interactions betweeninfected badgers and susceptible cattle (Böhm, Hutchings & White, 2009). Alternatively, it
Milne et al. (2020), PeerJ, DOI 10.7717/peerj.8319 17/24

may be that indirect transmission of bTB via, for example, cattle accessing badger latrines, ismore critically associated with chronic bTB breakdowns as opposed to wildlife populationdensity per se (Campbell et al., 2019; Drewe et al., 2013). Furthermore, despite sett densitybeing a convenient metric, we must be careful when inferring the relationship between settdensity and population density, as the magnitude of the association can change dependingon the local dynamics. For example, population density can increase without necessarilyincreasing the number of setts, via an increase in the mean group size (Judge et al., 2014).Alternatively, where badger population densities are depressed (e.g., though hunting,culling, or illegal disturbance), sett density metrics can overestimate true local density. InIreland, sett density was found to be good predictor of increased herd breakdown risk earlyin a six-year study, but progressively became a weaker predictor as a program of targetedbadger culling reduced population density (Byrne et al., 2014b). Therefore, investigatingintricate relationships between wildlife and domestic hosts may well require even moredetailed information around population abundance at large scales, in the Northern Irelandcontext this could include mark-recapture and/or the use of remote camera trappingtechnologies (Campbell et al., 2019).
CONCLUSIONSThe most important predictor of breakdown duration in our models was elevated MLVAgenotype richness, which is often a feature of beef fattening herds and linked to the practiceof purchasing cattle from over a wide geographic extent. We conclude that in at leastsome specific herds, prolonged restriction periods may primarily be a product of inwardscattle movements during a breakdown. For all other herd types, our results support thehypothesis that breakdown duration is principally a function of the inability to eradicateresidual infection already present within the herd, and/or repeated infection from thelocal environment. In many instances, failure to clear residual infection may be relatedto the poor performance of the ante-mortem diagnostic SICCT test, which permits theretention of infected animals. Our data suggest that infected wildlife (captured by settdensity), contiguous herds (captured by patch prevalence and associated herds) and acontaminated environment (also captured by patch prevalence) all likely contribute tovarying extents to protracted breakdowns. However, given that it is not yet possible topositively distinguish between these various infection routes, determining the relativecontribution each potential source was beyond the scope of this study. We posit thatbadgers may be involved in prolonging bTB breakdowns via spillback infection into thecattle population, supplemented with cattle-to-cattle transmission (amplification) onceinfection is introduced to the herd. However, the general positive association betweenbadger sett density and breakdown duration may not simply be a function of badgerpopulation density, and could also be product of density-dependent badger behaviorwhich may possibly influence contact rates between badgers and cattle.
Milne et al. (2020), PeerJ, DOI 10.7717/peerj.8319 18/24

ACKNOWLEDGEMENTSWe would like to thank the staff in the Agri–Food and Biosciences Institute VeterinarySciences Division (VSD) who contributed to the bTB strain–typing work.
ADDITIONAL INFORMATION AND DECLARATIONS
FundingThis work was supported by Department of Agriculture, Environment and Rural Affairs(DAERA) (Grant: 48005 (122035): 15/3/10 ‘‘The evaluation of the role of multiple reactorand chronic breakdown herds in the epidemiology of bovine tuberculosis in NorthernIreland’’). The funders had no role in study design, data collection and analysis, decisionto publish, or preparation of the manuscript.
Grant DisclosuresThe following grant information was disclosed by the authors:Department of Agriculture, Environment and Rural Affairs (DAERA): 48005 (122035):15/3/10.
Competing InterestsAndrew W. Byrne is an Academic Editor for PeerJ.
Author Contributions• Georgina Milne conceived and designed the experiments, analyzed the data, preparedfigures and/or tables, authored or reviewed drafts of the paper, and approved the finaldraft.• Adrian Allen, Carl McCormick, Eleanor Presho and Robin Skuce authored or revieweddrafts of the paper, generated molecular data, and approved the final draft.• Jordon Graham authored or reviewed drafts of the paper, managed and administereddatabases, and approved the final draft.• Angela Lahuerta-Marin authored or reviewed drafts of the paper, and approved the finaldraft.• Neil Reid authored or reviewed drafts of the paper, supplied wildlife data, and approvedthe final draft.• Andrew W. Byrne conceived and designed the experiments, authored or reviewed draftsof the paper, project management (PI), and approved the final draft.
Animal EthicsThe following information was supplied relating to ethical approvals (i.e., approving bodyand any reference numbers):
Data were generated as part of routine state lead animal health policy; no data weregenerated specifically for this project.
Milne et al. (2020), PeerJ, DOI 10.7717/peerj.8319 19/24

Data AvailabilityThe following information was supplied regarding data availability:
The raw data is available in the Supplementary File and at Figshare: Milne, Georgina(2019): breakdown_length_anonymised_data. figshare. Dataset. https://doi.org/10.6084/m9.figshare.9777641.v2.
Supplemental InformationSupplemental information for this article can be found online at http://dx.doi.org/10.7717/peerj.8319#supplemental-information.
REFERENCESAbernethy DA, Denny GO,Menzies FD, McGuckian P, Honhold N, Roberts AR. 2006.
The Northern Ireland programme for the control and eradication of Mycobacteriumbovis. Veterinary Microbiology 112:231–237 DOI 10.1016/j.vetmic.2005.11.023.
Abernethy DA, Upton P, Higgins IM, McGrath G, Goodchild AV, Rolfe SJ, BroughanJM, Downs SH, Clifton-Hadley R, Menzies FD, De la Rua-Domenech R, BlissittMJ, Duignan A, More SJ. 2013. Bovine tuberculosis trends in the UK and the Repub-lic of Ireland, 1995–2010. Veterinary Record 172:312–312 DOI 10.1136/vr.100969.
AHVLA. 2016. Bovine tuberculosis: infection status in cattle in GB. Annual surveillancereport for the period January to 2015.
Allen AR, Skuce RA, Byrne AW. 2018. Bovine Tuberculosis in Britain and Ireland—aperfect storm? the confluence of potential ecological and epidemiological imped-iments to controlling a chronic infectious disease. Frontiers in Veterinary Science5:Article 109 DOI 10.3389/fvets.2018.00109.
Alvarez J, Perez AM, Bezos J, Casal C, Romero B, Rodriguez-Campos S, Saez-LlorenteJL, Diaz R, Carpintero J, de Juan L, Domínguez L. 2012. Eradication of bovinetuberculosis at a herd-level in Madrid, Spain: study of within-herd transmissiondynamics over a 12 year period. BMC Veterinary Research 8:100.
Ananth CV, KleinbaumDG. 1997. Regression models for ordinal responses: a review ofmethods and applications. International Journal of Epidemiology 26:1323–1333.
Armstrong BG, SloanM. 1989. Ordinal regression models for epidemiologic data.American Journal of Epidemiology 129:191–204.
Bates D, Mächler M, Bolker B,Walker S. 2015. Fitting linear mixed-effects models usinglme4. Journal of Statistical Software 67(1):1–48.
BöhmM, Hutchings MR,White PCL. 2009. Contact networks in a wildlife-livestockhost community: identifying high-risk individuals in the transmission of bovine TBamong badgers and cattle. PLOS ONE 4(4):e5016 DOI 10.1371/journal.pone.0005016.
Brown E, Marshall AH, Mitchell HJ, Byrne AW. 2019. Cattle movements in NorthernIreland form a robust network: implications for disease management. PreventiveVeterinary Medicine 170:Article 104740 DOI 10.1016/j.prevetmed.2019.104740.
Byrne AW, Graham J, Brown C, Donaghy A, Guelbenzu-Gonzalo M, McNair J, SkuceR, Allen A, McDowell S. 2017. Bovine tuberculosis visible lesions in cattle culled
Milne et al. (2020), PeerJ, DOI 10.7717/peerj.8319 20/24

during herd breakdowns: the effects of individual characteristics, trade movementand co-infection. BMC Veterinary Research 13:400 DOI 10.1186/s12917-017-1321-z.
Byrne AW, O’Keeffe J, Buesching CD, Newman C. 2019. Push and pull factors drivingmovement in a social mammal: context dependent behavioural plasticity at thelandscape scale. Current Zoology 65(5):517–525 DOI 10.1093/cz/zoy081.
Byrne AW, Quinn JL, O’Keeffe JJ, Green S, Paddy Sleeman D,WayneMartin S,Davenport J. 2014a. Large-scale movements in E uropean badgers: has the tail of themovement kernel been underestimated? Journal of Animal Ecology 83(4):991–1001DOI 10.1111/1365-2656.12197.
Byrne AW,White PW,McGrath G, James O, Martin SW. 2014b. Risk of tubercu-losis cattle herd breakdowns in Ireland: effects of badger culling effort, densityand historic large-scale interventions. Veterinary Research 45(1):Article 109DOI 10.1186/s13567-014-0109-4.
Campbell EL, Byrne AW,Menzies FD, McBride KR, McCormick CM, ScantleburyM, Reid N. 2019. Interspecific visitation of cattle and badgers to fomites: a trans-mission risk for bovine tuberculosis? Ecology and Evolution 9(15):8479–8489DOI 10.1002/ece3.5282.
Christensen RHB. 2019. Ordinal—regression models for ordinal data. R package version2019.4-25.
Clegg TA, GoodM, Hayes M, Duignan A, McGrath G, More SJ. 2018. Trends andpredictors of large tuberculosis episodes in cattle herds in Ireland. Frontiers inVeterinary Science 5:Article 86 DOI 10.3389/fvets.2018.00086.
DAERA. 2017. In: Department of Agriculture EARAVS, ed. Tuberculosis staff instructions.Belfast: Department of Agriculture, Environment and Rural Affairs VeterinaryService.
DAERA. 2018. Tuberculosis disease statistics in Northern Ireland 2018. Available athttps://www.daera-ni.gov.uk/publications/ tuberculosis-disease-statistics-northern-ireland-2018.
DAERA. 2019. Bovine Tuberculosis (TB) testing. Available at https://www.daera-ni.gov.uk/articles/ bovine-tuberculosis-tb-testing .
Dohoo IR, Martin SW, Stryhn H. 2009. Veterinary epidemiologic research. Charlotte-town: VER Inc.
Drewe JA, O’Connor HM,Weber N, McDonald RA, Delahay RJ. 2013. Patterns of directand indirect contact between cattle and badgers naturally infected with tuberculosis.Epidemiology and Infection 141:1467–1475.
Doyle LP, Courcier EA, Gordon AW, O’HaganMJH, Menzies FD. 2016. Bovinetuberculosis in Northern Ireland: risk factors associated with duration and re-currence of chronic herd breakdowns. Preventative Veterinary Medicine 131:1–7DOI 10.1016/j.prevetmed.2016.06.016.
Durr PA, Hewinson RG, Clifton-Hadley RS. 2000.Molecular epidemiology of bovinetuberculosis. I. Mycobacterium bovis genotyping. Scientific and Technical Review ofthe Office International des Epizooties 19(3):675–688.
Milne et al. (2020), PeerJ, DOI 10.7717/peerj.8319 21/24

Gallagher J, Clifton-Hadley RS. 2000. Tuberculosis in badgers; a review of the diseaseand its significance for other animals. Research in Veterinary Science 69:203–217DOI 10.1053/rvsc.2000.0422.
Gallagher MJ, Higgins IM, Clegg TA,Williams DH,More SJ. 2013. Comparison ofbovine tuberculosis recurrence in Irish herds between 1998 and 2008. PreventativeVeterinary Medicine 111:237–244 DOI 10.1016/j.prevetmed.2013.05.004.
Griffin JM, Hahesy T, Lynch K, SalmanMD,McCarthy J, Hurley T. 1993. Theassociation of cattle husbandry practices, environmental factors and farmercharacteristics with the occurence of chronic bovine tuberculosis in dairyherds in the Republic of Ireland. Preventative Veterinary Medicine 17:145–160DOI 10.1016/0167-5877(93)90025-O.
Houtsma E, Clegg TA, GoodM,More SJ. 2018. Further improvement in the controlof bovine tuberculosis recurrence in Ireland. Veterinary Record 183:622–622DOI 10.1136/vr.104642.
Houston R. 2001. A computerised database system for bovine traceability. RevueScientifique et Technique-Office International des Epizooties 20:652.
Humblet M-F, Boschiroli ML, Saegerman C. 2009. Classification of worldwide bovinetuberculosis risk factors in cattle: a stratified approach. Veterinary Research 40:Article50 DOI 10.1051/vetres/2009033.
Judge J, Wilson GJ, Macarthur R, Delahay RJ, McDonald RA. 2014. Density andabundance of badger social groups in England and Wales in 2011–2013. ScientificReports 4:3809.
Kamerbeek J, Schouls L, Kolk A, Agterveld MV, Soolingen DV, Kuijper S, BunschotenA, Molhuizen H, Shaw R, Goyal M, Embden JV. 1997. Simultaneous detection andstrain differentiation of Mycobacterium tuberculosis for diagnosis and epidemiology.Journal of Clinical Microbiology 35:907.
Karolemeas K, Donnelly CA, Conlan AJK, Mitchell AP, Clifton-Hadley RS, UptonP,Wood JLN, McKinley TJ. 2012. The effect of badger culling on breakdownprolongation and recurrence of bovine tuberculosis in cattle herds in Great Britain.PLOS ONE 7:e51342 DOI 10.1371/journal.pone.0051342.
Karolemeas K, Mckinley TJ, Clifton-Hadley RS, Goodchild AV, Mitchell A, JohnstonWT, Conlan AJK, Donnelly CA,Wood JLN. 2010. Predicting prolonged bovinetuberculosis breakdowns in Great Britain as an aid to control. Preventative VeterinaryMedicine 97:183–190 DOI 10.1016/j.prevetmed.2010.09.007.
Karolemeas K, Mckinley TJ, Clifton-Hadley RS, Goodchild AV, Mitchell A, JohnstonWT, Conlan AJK, Donnelly CA,Wood JLN. 2011. Recurrence of bovine tuberculo-sis breakdowns in Great Britain: risk factors and prediction. Preventative VeterinaryMedicine 102:22–29 DOI 10.1016/j.prevetmed.2011.06.004.
LaHue NP, Baños JV, Acevedo P, Gortázar C, Martínez-López B. 2016. Spatially explicitmodeling of animal tuberculosis at the wildlife-livestock interface in Ciudad Realprovince, Spain. Preventive Veterinary Medicine 128:101–111.
Lahuerta-Marin A, Gallagher M, McBride S, Skuce R, Menzies F, McNair J, McDowellSWJ, Byrne AW. 2015. Should they stay, or should they go? Relative future risk
Milne et al. (2020), PeerJ, DOI 10.7717/peerj.8319 22/24

of bovine tuberculosis for interferon-gamma test-positive cattle left on farms.Veterinary Research 46:Article 90 DOI 10.1186/s13567-015-0242-8.
Lahuerta-Marin A, Milne MG,McNair J, Skuce RA, McBride SH, Menzies FD, McDow-ell SJW, Byrne AW, Handel IG, de C Bronsvoort BM. 2018. Bayesian latent classestimation of sensitivity and specificity parameters of diagnostic tests for bovinetuberculosis in chronically infected herds in Northern Ireland. The Veterinary Journal238:15–21.
Menzies FD, Neill SD. 2000. Cattle-to-Cattle transmission of bovine tuberculosis. TheVeterinary Journal 160:92–106.
Milne GM, Graham J, Allen A, Lahuerta-Marin A, McCormick C, Presho E, Skuce R,Byrne AW. 2019a. Spatiotemporal analysis of prolonged and recurrent bovine tu-berculosis breakdowns in Northern Irish cattle herds reveals a new infection hotspot.Spatial and Spatio-temporal Epidemiology 28:33–42 DOI 10.1016/j.sste.2018.11.002.
MilneMG, Graham J, Allen A, McCormick C, Presho E, Skuce R, Byrne AW. 2019b.Variation in Mycobacterium bovis genetic richness suggests that inwards cattlemovements are a more important source of infection in beef herds than in dairyherds. BMCMicrobiology 19:154.
More SJ, Houtsma E, Doyle L, McGrath G, Clegg TA, De la Rua-Domenech R, DuignanA, Blissitt MJ, DunlopM, Schroeder PG, Pike R, Upton P. 2018. Further descriptionof bovine tuberculosis trends in the United Kingdom and the Republic of Ireland,2003–2015. The Veterinary Record 183:717–717 DOI 10.1136/vr.104718.
NIAO. 2018. The control of Bovine Tuberculosis in Northern Ireland. Belfast: NorthernIreland Audit Office.
Nuñez-Garcia J, Downs SH, Parry JE, Abernethy DA, Broughan JM, Cameron AR,Cook AJ, de la Rua-Domenech R, Goodchild AV, Gunn J, More SJ, Rhodes S,Rolfe S, SharpM, Upton PA, Vordermeier HM,Watson E,WelshM,Whelan AO,Woolliams JA, Clifton-Hadley RS, Greiner M. 2017.Meta-analyses of the sensitivityand specificity of ante-mortem and post-mortem diagnostic tests for bovinetuberculosis in the UK and Ireland. Preventive Veterinary Medicine 153:94–107DOI 10.1016/j.prevetmed.2017.02.017.
O’HaganMJH, Matthews DI, Laird C, McDowell SWJ. 2016.Herd-level risk factorsfor bovine tuberculosis and adoption of related biosecurity measures in NorthernIreland: a case-control study. The Veterinary Journal 213:26–32.
Olea-Popelka FJ, Costello E, White P, McGrath G, Collins JD, O’Keeffe J, KeltonDF, Berke O, More S, Martin SW. 2008. Risk factors for disclosure of additionaltuberculous cattle in attested-clear herds that had one animal with a confirmedlesion of tuberculosis at slaughter during 2003 in Ireland. Preventive VeterinaryMedicine 85:81–91.
R Core Team. 2013. R: a language and environment for statistical computing. Vienna: RFoundation for Statistical Computing.
Reid N, Etherington TR,Wilson GJ, MontgomeryWI, McDonald RA. 2012.Monitoringand population estimation of the European badger Meles meles in Northern Ireland.Wildlife Biology 18:46–57 DOI 10.2981/11-016.
Milne et al. (2020), PeerJ, DOI 10.7717/peerj.8319 23/24

Reilly LA, Courtenay O. 2007.Husbandry practices, badger sett density and habi-tat composition as risk factors for transient and persistent bovine tuber-culosis on UK cattle farms. Preventative Veterinary Medicine 80:129–142DOI 10.1016/j.prevetmed.2007.02.002.
Robinson PA. 2017. Farmers and bovine tuberculosis: contextualising statutory dis-ease control within everyday farming lives. Journal of Rural Studies 55:168–180DOI 10.1016/j.jrurstud.2017.08.009.
Skuce RA, Mallon TR, McCormick CM,McBride SH, Clarke G, Thompson A, CouzensC, Gordon AW,McDowell SWJ. 2010.Mycobacterium bovis genotypes in NorthernIreland: herd-level surveillance (2003 to 2008). Veterinary Record 167:684–689DOI 10.1136/vr.c5108.
Skuce RA, McDowell SW,Mallon TR, Luke B, Breadon EL, Lagan PL, McCormick CM,McBride SH, Pollock JM. 2005. Discrimination of isolates of Mycobacterium bovisin Northern Ireland on the basis of variable numbers of tandem repeats (VNTRs).Veterinary Record 157:501–504.
Trewby H,Wright D, Breadon EL, Lycett SJ, Mallon TR, McCormick C, Johnson P,Orton RJ, Allen AR, Galbraith J, Herzyk P, Skuce RA, Biek R, Kao RR. 2016. Useof bacterial whole-genome sequencing to investigate local persistence and spread inbovine tuberculosis. Epidemics 14:26–35.
White PW,Martin SW, De JongMCM, O’Keeffe JJ, More SJ, Frankena K. 2013. Theimportance of ‘neighbourhood’ in the persistence of bovine tuberculosis in Irishcattle herds. Preventive Veterinary Medicine 110:346–355.
WickhamH. 2009. ggplot2: elegant graphics for data analysis. New York: Springer-Verlag.Wolfe DM, Berke O, Kelton DF,White PW,More SJ, O’Keeffe J, Martin SW.
2010. From explanation to prediction: a model for recurrent bovine tuber-culosis in Irish cattle herds. Preventative Veterinary Medicine 94:170–177DOI 10.1016/j.prevetmed.2010.02.010.
Woolhouse MEJ, Dye C, Etard JF, Smith T, Charlwood JD, Garnett GP, Hagan P, HiiJLK, Ndhlovu PD, Quinnell RJ, Watts CH, Chandiwana SK, Anderson RM. 1997.Heterogeneities in the transmission of infectious agents: Implications for the designof control programs. Proceedings of the National Academy of Sciences of the UnitedStates of America 94:338.
Zuur AF, Hilbe JM, Ieno EN. 2015. A beginners guide to GLM and GLMM with R.Newburgh: Highland Statistics Ltd.
Zuur AI, Ieno EN,Walker N, Saveliev AA, Smith GM. 2009.Mixed effects models andextensions in ecology with R. New York: Springer-Verlag.
Milne et al. (2020), PeerJ, DOI 10.7717/peerj.8319 24/24